UNITED STATES
SECURITIES AND EXCHANGE COMMISSION
Washington, D.C. 20549
FORM N-CSR
CERTIFIED SHAREHOLDER REPORT OF REGISTERED
MANAGEMENT INVESTMENT COMPANIES
Investment Company Act file number 811-22310
ETF Managers Trust
(Exact name of registrant as specified in charter)
350 Springfield Ave., Suite 200
Summit, NJ 07901
(Address of principal executive offices)
U.S. Bank Global Fund Services
811 E Wisconsin Ave
Milwaukee, WI 53202
(Name and address of agent for service)
(908)-897-0518
Registrant's telephone number, including area code
Date of fiscal year end: September 30, 2023
Date of reporting period: September 30, 2023
Item 1. Reports to Stockholders.

Annual Report
September 30, 2023
AI Powered Equity ETF
Ticker: AIEQ

The fund is a series of ETF Managers Trust.
AI Powered Equity ETF
TABLE OF CONTENTS
September 30, 2023
AI Powered Equity ETF
Dear Shareholder,
On behalf of the entire team, we want to express our appreciation for the confidence you have placed in the AI Powered Equity ETF (the “Fund”). The following information pertains to the fiscal period from October 1, 2022 to September 30, 2023 (the “Annual Period”).
Market Overview
The U.S. economy performed better than expected despite persistent inflationary pressure, rising interest rates and geo-political conflict during the Annual Period.
Early in the Annual Period, inflation had risen sharply because of supply chain disruptions, high food and energy prices and the Russia-Ukraine war, reaching its peak level, just prior to the Annual Period, in September 2022. In the first quarter of 2023, U.S. equities managed to deliver gains, despite the significant volatility. The January rally, however, gave way to a February sell off as higher-than-expected inflation, a tight labor market and solid economic growth indicated that the U.S. Federal Reserve’s (Fed) monetary policy would remain tight for the foreseeable future. One of the most significant impacts occurred in the banking sector in March 2023, when Silicon Valley Bank, Signature Bank, and First Republic Bank, among others, failed. In the same month, Swiss bank UBS agreed to buy Credit Suisse, considered vulnerable in the then current environment.
In the second quarter of 2023, the economy grew at an annualized rate of 2.1%, according to the third estimate from the U.S. Bureau of Economic Analysis, compared to 2.2% in the first quarter and in line with 2.1% in 2022 overall. Since then, price pressures have eased given normalization in supply chains, falling energy prices and aggressive measures by the Fed and other global central banks to tighten financial conditions and slow demand in their economies. Nevertheless, during the Annual Period inflation levels remained much higher than central banks’ target levels, with the Fed raising its target fed funds rate six times during the Annual Period, bringing it to a range of 5.25% to 5.50% as of July 2023. As of August 2023, the unemployment rate was 3.8%, near its pre-pandemic low, although monthly job growth continued to be moderate. In September 2023, the Fed’s policy committee voted to hold the rate steady.
As the U.S. Congress neared its September 30, 2023, deadline to approve federal funding, investor concerns about a potential government shutdown and the impact this could have on the U.S. economy increased. The shutdown, however, was averted because of a Continuing Resolution which temporarily kept the government open for forty-five more days. Despite higher rates and increased market volatility, U.S. stocks for the Annual Period had strong returns of 21.62%, as measured by the S&P 500 Index.
These conditions have impacted the performance of the Fund during the Annual Period, among other factors, and the value of an investment in the Fund. We encourage you to talk with your financial advisor and visit etfmg.com for further insight into investing in today’s markets.
Performance Overview
The AI Powered Equity ETF (AIEQ) is actively managed and seeks capital appreciation. Over the Annual Period, the total return for the Fund was 4.2%, while the total return for its broad market benchmark, the S&P 500 Index, was 21.62%. The best performers in the Fund, on the basis of contribution to return were Applovin Corp., Maxar Technologies Inc., Gamestop Corp., Onto Innovation Inc. and Microstrategy Inc, while the worst performers were Pacwest Bancorp., Cassava Sciences Inc., Novavax Inc., Clearfield Inc., and Fubotv Inc.
At the end of the Annual Period, the Fund saw an approximate allocation of 16.05% to Financials, 15.82% to Consumer Discretionary, and 14.96% to the Information Technology sector. The portfolio holdings of the Fund are solely exposed to the United States. During periods of market volatility, such as during the reporting period, the Fund will buy and sell securities (or “turns over” its portfolio). A higher portfolio turnover rate may indicate higher transaction costs and may result in higher taxes when the Fund shares are held in a taxable account. These costs, which are not reflected in annual fund operating expenses or in the example, affect the Fund’s performance.
The Fund invests primarily in equity securities listed on a U.S. exchange based on the results of a proprietary, quantitative model developed by EquBot LLC that runs on the Watson™ platform. Each day, the EquBot Model ranks each company based on the probability of the company benefiting from current economic conditions, trends, and world events and identifies approximately 30 to 200 companies with the greatest potential over the next twelve months for appreciation and weights those companies to seek a level of volatility comparable to that of the broader U.S. equity market. EquBot, the Fund’s sub-adviser, is a technology-based company focused on applying artificial intelligence (AI) based solutions to investment analyses.
You can find further details about the Fund by visiting www.etfmg.com, or by calling 1-844-ETF-MGRS (1-844-383-6477).
Sincerely

John A. Flanagan
Principal Financial Officer
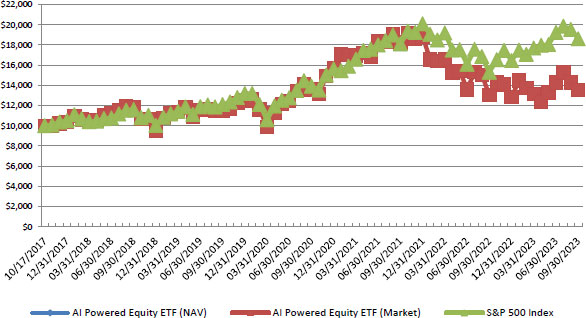
AI Powered Equity ETF
Growth of $10,000 (Unaudited)
Average Annual Returns
Year Ended September 30, 2023 | | 1 Year
Return | | | 5 Year
Return | | | Since
Inception
(10/17/17) | | | Value of
$10,000
(9/30/2023) | |
| AI Powered Equity ETF (NAV) | | | 4.20 | % | | | 2.85 | % | | | 5.35 | % | | $ | 13,641 | |
| AI Powered Equity ETF (Market) | | | 4.10 | % | | | 2.72 | % | | | 5.26 | % | | $ | 13,572 | |
| S&P 500 Index | | | 21.62 | % | | | 9.92 | % | | | 10.99 | % | | $ | 18,607 | |
Performance data quoted represents past performance and does not guarantee future results. The investment return and principal value of an investment will fluctuate so that an investor’s shares, when redeemed, may be worth more or less than their original cost. Current performance of the Fund may be lower or higher than the performance quoted. All performance is historical and includes reinvestment of dividends and capital gains. Performance data current to the most recent month end may be obtained by calling 1-844-ETF-MGRS (1-844-383-6477).
The chart illustrates the performance of a hypothetical $10,000 investment made on October 17, 2017, and is not intended to imply any future performance. The returns shown do not reflect the deduction of taxes that a shareholder would pay on fund distributions from the sales of Fund shares. The chart assumes reinvestment of capital gains and dividends. The chart assumes reinvestment of capital gains and dividends, if any. The index returns do not reflect fees or expenses and are not available for direct investment.
AI Powered Equity ETF
Top Ten Holdings as of September 30, 2023 (Unaudited)*
| | | | % of Total | |
| | Security | | Investments | |
| 1 | AT&T, Inc. | | | 6.86 | % |
| 2 | The Cigna Group | | | 5.10 | % |
| 3 | Wells Fargo & Co. | | | 4.50 | % |
| 4 | Parker-Hannifin Corp. | | | 4.23 | % |
| 5 | United Rentals, Inc. | | | 3.50 | % |
| 6 | KeyCorp | | | 3.13 | % |
| 7 | Exelixis, Inc. | | | 2.96 | % |
| 8 | NVIDIA Corp. | | | 2.49 | % |
| 9 | AbbVie, Inc. | | | 2.21 | % |
| 10 | Invitation Homes, Inc. | | | 1.69 | % |
Top Ten Holdings = 36.67% of Total Investments
* Current Fund holdings may not be indicative of future Fund holdings.
AI Powered Equity ETF
Important Disclosures and Key Risks Factors
Past performance is not indicative of future return. A fund’s performance for very short time periods may not be indicative of future performance.
AIEQ
The AI Powered Equity ETF (the “Fund”) seeks long-term capital appreciation within risk constraints commensurate with broad market U.S. equity indices.
Investing involves risk, including the possible loss of principal. Shares of any ETF are bought and sold at market price (not NAV), may trade at a discount premium to NAV and are not individually redeemed from the Fund. Brokerage commissions will reduce returns. Narrowly focused investments typically exhibit higher volatility. The equity securities held in the Fund’s portfolio may experience sudden, unpredictable drops in value or long periods of decline in value. This may occur because of factors that affect securities markets generally or factors affecting specific issuers, industries, or sectors in which the Fund invests such as political, market and economic developments, as well as events that impact specific issuers.
The Fund is actively-managed and may not meet its investment objective based on the success or failure of the EquBot Model to identify investment opportunities. Fund holdings are subject to change. For full holdings information, please visit www.etfmg.com.
The portfolio managers may actively and frequently trade securities or other instruments in the Fund’s portfolio to carry out its investment strategies. A high portfolio turnover rate increases transaction costs, which may increase the Fund’s expenses.
Some of the models used by the Adviser for the Fund are predictive in nature. The use of predictive models has inherent risks. When Models and Data prove to be incorrect or incomplete, any decisions made in reliance thereon expose the Fund to potential risks. For example, by relying on Models and Data, the Adviser may be induced to buy certain investments at prices that are too high, to sell certain other investments at prices that are too low, or to miss favorable opportunities altogether. Similarly, any hedging based on faulty Models and Data may prove to be unsuccessful.
Natural or environmental disasters, such as earthquakes, fires, floods, hurricanes, tsunamis and other severe weather-related phenomena generally, and widespread disease, including pandemics and epidemics, have been and may be highly disruptive to economies and markets, adversely impacting individual companies, sectors, industries, markets, currencies, interest and inflation rates, credit ratings, investor sentiment, and other factors affecting the value of the Fund’s investments. Given the increasing interdependence among global economies and markets, conditions in one country, market, or region are increasingly likely to adversely affect markets, issuers, and/or foreign exchange rates in other countries, including the U.S. Any such events could have a significant adverse impact on the value of the Fund’s investments.
ETF Managers Group LLC is the investment adviser to the fund. EquBot LLC serves as the sub-advisor to the Fund.
Effective, August 14, 2023, the Fund is distributed by Foreside Fund Services LLC. ETF Managers Group LLC is a wholly owned subsidiary of Exchange Traded Managers Group LLC (collectively, “ETFMG”).
AI Powered Equity ETF
PORTFOLIO ALLOCATIONS
As of September 30, 2023 (Unaudited)
| | | AI Powered | |
| | | Equity ETF | |
| As a percent of Net Assets: | | | |
| Bermuda | | | 0.2 | % |
| Guernsey | | | 0.2 | |
| United States | | | 99.4 | |
| Short-Term and other Net Assets (Liabilities) | | | 0.2 | |
| | | | 100.0 | % |
AI Powered Equity ETF
Schedule of Investments
September 30, 2023
| | | Shares | | | Value | |
| | | | | | | |
| COMMON STOCKS - 99.8% | | | | | | | | |
| Bermuda - 0.2% | | | | | | | | |
| Chemicals - 0.2% | | | | | | | | |
| Axalta Coating Systems, Ltd. (a) | | | 6,601 | | | $ | 177,567 | |
| | | | | | | | | |
| Guernsey - 0.2% | | | | | | | | |
| IT Services - 0.2% | | | | | | | | |
| Amdocs, Ltd. | | | 2,199 | | | | 185,794 | |
| | | | | | | | | |
| United States - 99.4% | | | | | | | | |
| Aerospace & Defense - 0.5% | | | | | | | | |
| TransDigm Group, Inc. (a)(b) | | | 592 | | | | 499,133 | |
| Air Freight & Logistics - 1.4% | | | | | | | | |
| FedEx Corp. | | | 5,225 | | | | 1,384,207 | |
| Auto Components - 1.8% | | | | | | | | |
| BorgWarner, Inc. | | | 42,309 | | | | 1,708,014 | |
| Gentex Corp. | | | 3,588 | | | | 116,754 | |
| Total Auto Components | | | | | | | 1,824,768 | |
| Automobiles - 2.5% | | | | | | | | |
| Ford Motor Co. | | | 102,978 | | | | 1,278,986 | |
| General Motors Co. | | | 38,273 | | | | 1,261,861 | |
| Total Automobiles | | | | | | | 2,540,847 | |
| Banks - 11.5% | | | | | | | | |
| Bank of America Corp. | | | 44,814 | | | | 1,227,007 | |
| Fifth Third Bancorp | | | 27,615 | | | | 699,488 | |
| First Citizens BancShares, Inc. - Class A | | | 129 | | | | 178,033 | |
| KeyCorp | | | 305,902 | | | | 3,291,506 | |
| Prosperity Bancshares, Inc. | | | 2,252 | | | | 122,914 | |
| Truist Financial Corp. | | | 44,170 | | | | 1,263,704 | |
| Wells Fargo & Co. | | | 115,751 | | | | 4,729,586 | |
| Zions Bancorp NA | | | 7,537 | | | | 262,966 | |
| Total Banks | | | | | | | 11,775,204 | |
| Biotechnology - 6.8% | | | | | | | | |
| AbbVie, Inc. | | | 15,565 | | | | 2,320,119 | |
| Exelixis, Inc. (a) | | | 142,010 | | | | 3,102,918 | |
| Natera, Inc. (a)(b) | | | 5,351 | | | | 236,782 | |
| Vertex Pharmaceuticals, Inc. (a) | | | 3,574 | | | | 1,242,823 | |
| Total Biotechnology | | | | | | | 6,902,642 | |
| Capital Markets - 1.6% | | | | | | | | |
| Franklin Resources, Inc. | | | 12,517 | | | | 307,668 | |
| SEI Investments Co. | | | 9,496 | | | | 571,944 | |
| The Bank of New York Mellon Corp. | | | 17,962 | | | | 766,079 | |
| Total Capital Markets | | | | | | | 1,645,691 | |
| Chemicals - 1.0% | | | | | | | | |
| Corteva, Inc. | | | 11,927 | | | | 610,185 | |
| International Flavors & Fragrances, Inc. | | | 6,091 | | | | 415,223 | |
| Total Chemicals | | | | | | | 1,025,408 | |
| Commercial Services & Supplies - 0.1% | | | | | | | | |
| Tetra Tech, Inc. | | | 866 | | | | 131,658 | |
| Communications Equipment - 0.8% | | | | | | | | |
| Juniper Networks, Inc. | | | 11,076 | | | | 307,802 | |
| Motorola Solutions, Inc. | | | 1,759 | | | | 478,870 | |
| Total Communications Equipment | | | | | | | 786,672 | |
The accompanying notes are an integral part of these financial statements.
AI Powered Equity ETF
Schedule of Investments
September 30, 2023 (Continued)
| | | Shares | | | Value | |
| | | | | | | |
| Construction & Engineering - 0.4% | | | | | | | | |
| AECOM | | | 4,978 | | | $ | 413,373 | |
| Consumer Finance - 2.5% | | | | | | | | |
| Ally Financial, Inc. | | | 17,963 | | | | 479,253 | |
| American Express Co. | | | 8,126 | | | | 1,212,318 | |
| Synchrony Financial | | | 28,737 | | | | 878,490 | |
| Total Consumer Finance | | | | | | | 2,570,061 | |
| Diversified Telecommunication Services - 8.2% | | | | | | | | |
| AT&T, Inc. | | | 479,288 | | | | 7,198,906 | |
| Verizon Communications, Inc. | | | 37,563 | | | | 1,217,417 | |
| Total Diversified Telecommunication Services | | | | | | | 8,416,323 | |
| Electric Utilities - 6.7% | | | | | | | | |
| Alliant Energy Corp. | | | 4,277 | | | | 207,221 | |
| American Electric Power Co., Inc. | | | 11,045 | | | | 830,805 | |
| Duke Energy Corp. (b) | | | 11,834 | | | | 1,044,469 | |
| Entergy Corp. | | | 16,918 | | | | 1,564,916 | |
| Exelon Corp. | | | 22,109 | | | | 835,499 | |
| FirstEnergy Corp. (b) | | | 8,705 | | | | 297,537 | |
| IDACORP, Inc. (b) | | | 4,093 | | | | 383,309 | |
| NRG Energy, Inc. | | | 12,114 | | | | 466,631 | |
| The Southern Co. | | | 17,950 | | | | 1,161,724 | |
| Total Electric Utilities | | | | | | | 6,792,111 | |
| Electrical Equipment - 0.2% | | | | | | | | |
| Acuity Brands, Inc. | | | 967 | | | | 164,690 | |
| Energy Equipment & Services - 0.3% | | | | | | | | |
| NOV, Inc. | | | 15,092 | | | | 315,423 | |
| Entertainment - 2.0% | | | | | | | | |
| ROBLOX Corp. - Class A (a) | | | 49,780 | | | | 1,441,628 | |
| Take-Two Interactive Software, Inc. (a) | | | 4,553 | | | | 639,196 | |
| Total Entertainment | | | | | | | 2,080,824 | |
| Financial Services - 2.3% | | | | | | | | |
| Equitable Holdings, Inc. | | | 36,983 | | | | 1,049,947 | |
| PayPal Holdings, Inc. (a)(b) | | | 21,417 | | | | 1,252,037 | |
| Total Financial Services | | | | | | | 2,301,984 | |
| Food Products - 0.4% | | | | | | | | |
| Lamb Weston Holdings, Inc. | | | 3,511 | | | | 324,627 | |
| Post Holdings, Inc. (a) | | | 1,250 | | | | 107,175 | |
| Total Food Products | | | | | | | 431,802 | |
| Health Care Equipment & Supplies - 0.7% | | | | | | | | |
| Align Technology, Inc. (a) | | | 1,779 | | | | 543,164 | |
| Penumbra, Inc. (a) | | | 743 | | | | 179,739 | |
| Total Health Care Equipment & Supplies | | | | | | | 722,903 | |
| Health Care Providers & Services - 6.3% | | | | | | | | |
| DaVita, Inc. (a) | | | 11,364 | | | | 1,074,239 | |
| The Cigna Group | | | 18,713 | | | | 5,353,228 | |
| Total Health Care Providers & Services | | | | | | | 6,427,467 | |
| Health Care REITs - 0.7% | | | | | | | | |
| Welltower, Inc. | | | 8,422 | | | | 689,930 | |
| Hotels, Restaurants & Leisure - 2.0% | | | | | | | | |
| Booking Holdings, Inc. (a) | | | 415 | | | | 1,279,839 | |
| Domino’s Pizza, Inc. | | | 1,710 | | | | 647,731 | |
| Wyndham Hotels & Resorts, Inc. | | | 1,907 | | | | 132,613 | |
| Total Hotels, Restaurants & Leisure | | | | | | | 2,060,183 | |
| Household Durables - 0.4% | | | | | | | | |
The accompanying notes are an integral part of these financial statements.
AI Powered Equity ETF
Schedule of Investments
September 30, 2023 (Continued)
| | | Shares | | | Value | |
| | | | | | | |
| Skyline Champion Corp. (a) | | | 5,741 | | | $ | 365,817 | |
| Independent Power and Renewable Electricity Producers - 0.4% | | | | | | | | |
| Vistra Corp. | | | 12,108 | | | | 401,743 | |
| Industrial (REITs) - 1.1% | | | | | | | | |
| Americold Realty Trust, Inc. (b) | | | 26,083 | | | | 793,184 | |
| EastGroup Properties, Inc. | | | 741 | | | | 123,399 | |
| STAG Industrial, Inc. | | | 4,780 | | | | 164,958 | |
| Total Industrial REITs | | | | | | | 1,081,541 | |
| Insurance - 3.5% | | | | | | | | |
| Allstate Corp. (b) | | | 10,302 | | | | 1,147,746 | |
| Loews Corp. | | | 3,199 | | | | 202,529 | |
| Selective Insurance Group, Inc. | | | 9,634 | | | | 993,940 | |
| The Progressive Corp. | | | 8,721 | | | | 1,214,835 | |
| Total Insurance | | | | | | | 3,559,050 | |
| Interactive Media & Services - 1.2% | | | | | | | | |
| Meta Platforms, Inc. - Class A (a) | | | 4,236 | | | | 1,271,690 | |
| Life Sciences Tools & Services - 2.1% | | | | | | | | |
| 10X Genomics, Inc. - Class A (a) | | | 7,111 | | | | 293,329 | |
| Bruker Corp. | | | 3,119 | | | | 194,314 | |
| Charles River Laboratories International, Inc. (a)(b) | | | 1,868 | | | | 366,091 | |
| Medpace Holdings, Inc. (a) | | | 3,565 | | | | 863,193 | |
| West Pharmaceutical Services, Inc. | | | 1,119 | | | | 419,860 | |
| Total Life Sciences Tools & Services | | | | | | | 2,136,787 | |
| Machinery - 4.6% | | | | | | | | |
| Oshkosh Corp. | | | 1,771 | | | | 169,006 | |
| Parker-Hannifin Corp. | | | 11,407 | | | | 4,443,254 | |
| Watts Water Technologies, Inc. - Class A | | | 629 | | | | 108,704 | |
| Total Machinery | | | | | | | 4,720,964 | |
| Media - 0.2% | | | | | | | | |
| Nexstar Media Group, Inc. | | | 1,358 | | | | 194,696 | |
| Metals & Mining - 0.2% | | | | | | | | |
| Royal Gold, Inc. | | | 1,823 | | | | 193,840 | |
| Mortgage Real Estate Investment Trusts (REITs) - 1.6% | | | | | | | | |
| AGNC Investment Corp. (b) | | | 171,240 | | | | 1,616,506 | |
| Multi-Utilities - 2.9% | | | | | | | | |
| Ameren Corp. (b) | | | 4,344 | | | | 325,062 | |
| CenterPoint Energy, Inc. | | | 14,207 | | | | 381,458 | |
| CMS Energy Corp. | | | 6,546 | | | | 347,658 | |
| Dominion Energy, Inc. | | | 17,984 | | | | 803,344 | |
| NiSource, Inc. | | | 14,664 | | | | 361,908 | |
| Public Service Enterprise Group, Inc. | | | 13,070 | | | | 743,814 | |
| Total Multi-Utilities | | | | | | | 2,963,244 | |
| Oil, Gas & Consumable Fuels - 1.3% | | | | | | | | |
| Cheniere Energy, Inc. | | | 7,887 | | | | 1,308,926 | |
| Professional Services - 1.2% | | | | | | | | |
| ASGN, Inc. (a) | | | 5,627 | | | | 459,614 | |
| Ceridian HCM Holding, Inc. (a)(b) | | | 2,546 | | | | 172,746 | |
| Robert Half International, Inc. (b) | | | 3,636 | | | | 266,446 | |
| SS&C Technologies Holdings, Inc. | | | 5,763 | | | | 302,788 | |
| Total Professional Services | | | | | | | 1,201,594 | |
| Residential REITs - 2.0% | | | | | | | | |
| Equity Residential | | | 5,476 | | | | 321,496 | |
| Invitation Homes, Inc. (b) | | | 55,837 | | | | 1,769,474 | |
| Total Residential REITs | | | | | | | 2,090,970 | |
The accompanying notes are an integral part of these financial statements.
AI Powered Equity ETF
Schedule of Investments
September 30, 2023 (Continued)
| | | Shares | | | Value | |
| | | | | | | |
| Retail REITs - 0.9% | | | | | | | | |
| NNN REIT, Inc. | | | 26,454 | | | $ | 934,884 | |
| Semiconductors & Semiconductor Equipment - 3.7% | | | | | | | | |
| Lattice Semiconductor Corp. (a)(b) | | | 3,490 | | | | 299,896 | |
| NVIDIA Corp. | | | 6,013 | | | | 2,615,595 | |
| Power Integrations, Inc. (b) | | | 1,547 | | | | 118,052 | |
| Universal Display Corp. | | | 4,974 | | | | 780,868 | |
| Total Semiconductors & Semiconductor Equipment | | | | | | | 3,814,411 | |
| Software - 1.6% | | | | | | | | |
| Dynatrace, Inc. (a) | | | 5,425 | | | | 253,510 | |
| Salesforce, Inc. (a) | | | 6,032 | | | | 1,223,169 | |
| Smartsheet, Inc. - Class A (a) | | | 3,535 | | | | 143,026 | |
| Total Software | | | | | | | 1,619,705 | |
| Specialized REITs - 1.4% | | | | | | | | |
| Equinix, Inc. | | | 1,430 | | | | 1,038,552 | |
| Gaming and Leisure Properties, Inc. | | | 7,398 | | | | 336,979 | |
| Total Specialized REITs | | | | | | | 1,375,531 | |
| Specialty Retail - 3.7% | | | | | | | | |
| Lowe’s Cos., Inc. | | | 5,967 | | | | 1,240,181 | |
| The Home Depot, Inc. | | | 4,100 | | | | 1,238,856 | |
| TJX Cos., Inc. | | | 14,081 | | | | 1,251,519 | |
| Total Specialty Retail | | | | | | | 3,730,556 | |
| Tobacco - 1.2% | | | | | | | | |
| Altria Group, Inc. | | | 29,278 | | | | 1,231,140 | |
| Trading Companies & Distributors - 3.6% | | | | | | | | |
| United Rentals, Inc. | | | 8,256 | | | | 3,670,370 | |
| Total United States | | | | | | | 101,387,269 | |
| TOTAL COMMON STOCKS (Cost $102,620,156) | | | | | | | 101,750,630 | |
| | | | | | | | | |
| INVESTMENTS PURCHASED WITH PROCEEDS FROM SECURITIES LENDING COLLATERAL - 3.0% | | | | | | | | |
| Mount Vernon Liquid Assets Portfolio, LLC, 5.50% (c) | | | 3,098,889 | | | | 3,098,889 | |
| TOTAL INVESTMENTS PURCHASED WITH PROCEEDS FROM SECURITIES LENDING COLLATERAL (Cost $3,098,889) | | | | | | | 3,098,889 | |
| | | | | | | | | |
| SHORT-TERM INVESTMENTS - 0.1% | | | | | | | | |
| Money Market Funds - 0.2% | | | | | | | | |
| First American Government Obligations Fund - Class X, 5.26% (c) | | | 144,331 | | | | 144,331 | |
| TOTAL SHORT-TERM INVESTMENTS (Cost $144,331) | | | | | | | 144,331 | |
| | | | | | | | | |
| Total Investments (Cost $105,863,376) - 103.0% | | | | | | | 104,993,850 | |
| Liabilities in Excess of Other Assets - (3.0)% | | | | | | | (3,044,033 | ) |
| TOTAL NET ASSETS - 100.0% | | | | | | $ | 101,949,817 | |
Percentages are stated as a percent of net assets.
| (a) | Non-income producing security. |
| (b) | All or portion of this security was out on loan at September 30, 2023. |
| (c) | The rate shown is the annualized seven-day yield at period end. |
The Global Industry Classification Standard (GICS®) was developed by and/or is the exclusive property of MSCI, Inc. and Standard & Poor’s Financial Services LLC (“S&P”). GICS is a service mark of MSCI and S&P and has been licensed for use by U.S. Bancorp Fund Services, LLC, doing business as U.S. Bank Global Fund Services (“Fund Services”).
The accompanying notes are an integral part of these financial statements.
AI Powered Equity ETF
STATEMENT OF ASSETS AND LIABILITIES
As of September 30, 2023
| | | AI Powered | |
| | | Equity ETF | |
| ASSETS | | | |
| Investments in securities, at value* | | $ | 104,993,850 | |
| Receivables: | | | | |
| Dividends and interest receivable | | | 119,861 | |
| Securities lending income receivable | | | 585 | |
| Total Assets | | | 105,114,296 | |
| | | | | |
| LIABILITIES | | | | |
| Collateral received for securities loaned (Note 7) | | | 3,098,889 | |
| Payables: | | | | |
| Unitary fees payable | | | 65,590 | |
| Total Liabilities | | | 3,164,479 | |
| Net Assets | | $ | 101,949,817 | |
| | | | | |
| NET ASSETS CONSIST OF: | | | | |
| Paid-in Capital | | $ | 159,009,673 | |
| Total distributable earnings (accumulated losses) | | | (57,059,856 | ) |
| Net Assets | | $ | 101,949,817 | |
| | | | | |
| *Identified Cost: | | | | |
| Investments in securities | | $ | 105,863,376 | |
| | | | | |
| Shares Outstanding^ | | | 3,425,000 | |
| Net Asset Value, Offering and Redemption Price per Share | | $ | 29.77 | |
| ^ | No par value, unlimited number of shares authorized |
The accompanying notes are an integral part of these financial statements.
AI Powered Equity ETF
STATEMENT OF OPERATIONS
For the Year Ended September 30, 2023
| | | AI Powered | |
| | | Equity ETF | |
| INVESTMENT INCOME | | | |
| Income: | | | |
| Dividends from investments (net of foreign withholdings tax of $4,785) | | $ | 1,371,348 | |
| Interest | | | 19,218 | |
| Securities lending income | | | 673,119 | |
| Total Investment Income | | | 2,063,685 | |
| | | | | |
| Expenses: | | | | |
| Unitary fees | | | 807,307 | |
| Total Expenses | | | 807,307 | |
| Net Investment Income | | | 1,256,378 | |
| | | | | |
| REALIZED & UNREALIZED GAIN (LOSS) ON INVESTMENTS | | | | |
| Net Realized Gain (Loss) on: | | | | |
| Investments | | | (10,681,833 | ) |
| In-Kind Redemptions | | | 343,113 | |
| Net Realized Loss on Investments and In-Kind Redemptions | | | (10,338,720 | ) |
| Net Change in Unrealized Appreciation/Depreciation of: | | | | |
| Investments | | | 11,416,406 | |
| Net Change in Unrealized Appreciation/Depreciation of Investments | | | 11,416,406 | |
| Net Realized and Unrealized Gain on Investments | | | 1,077,686 | |
| NET INCREASE IN NET ASSETS RESULTING FROM OPERATIONS | | $ | 2,334,064 | |
The accompanying notes are an integral part of these financial statements.
AI Powered Equity ETF
STATEMENTS OF CHANGES IN NET ASSETS
| | | Year Ended
September 30,
2023 | | | Year Ended
September 30,
2022 | |
| OPERATIONS | | | | | | |
| Net investment income | | $ | 1,256,378 | | | $ | 337,785 | |
| Net realized loss on investments and in-kind redemptions | | | (10,338,720 | ) | | | (27,977,960 | ) |
| Net change in unrealized appreciation/depreciation of investments | | | 11,416,406 | | | | (14,563,258 | ) |
| Net increase (decrease) in net assets resulting from operations | | | 2,334,064 | | | | (42,203,433 | ) |
| | | | | | | | | |
| DISTRIBUTIONS TO SHAREHOLDERS | | | | | | | | |
| Total distributions from distributable earnings | | | (1,342,664 | ) | | | (2,903,688 | ) |
| | | | | | | | | |
| CAPITAL SHARE TRANSACTIONS | | | | | | | | |
| Net increase (decrease) in net assets derived from net change in outstanding shares | | | 1,898,127 | | | | (23,394,942 | ) |
| Net increase (decrease) in net assets | | | 2,889,527 | | | | (68,502,063 | ) |
| | | | | | | | | |
| NET ASSETS | | | | | | | | |
| Beginning of Year | | | 99,060,290 | | | | 167,562,353 | |
| End of Year | | $ | 101,949,817 | | | | 99,060,290 | |
Summary of share transactions is as follows:
| | | Year Ended
September 30, 2023 | | | Year Ended
September 30, 2022 | |
| | | Shares | | | Amount | | | Shares | | | Amount | |
| Shares Sold | | | 775,000 | | | $ | 25,157,710 | | | | 4,550,000 | | | $ | 187,547,448 | |
| Shares Redeemed | | | (775,000 | ) | | | (23,259,583 | ) | | | (5,200,000 | ) | | | (210,942,390 | ) |
| Net Transactions in Fund Shares | | | — | | | $ | 1,898,127 | | | | (650,000 | ) | | $ | (23,394,942 | ) |
| | | | | | | | | | | | | | | | | |
| Beginning Shares | | | 3,425,000 | | | | | | | | 4,075,000 | | | | | |
| Ending Shares | | | 3,425,000 | | | | | | | | 3,425,000 | | | | | |
The accompanying notes are an integral part of these financial statements.
AI Powered Equity ETF
FINANCIAL HIGHLIGHTS
For capital share outstanding throughout each year
| | | Year Ended September 30, 2023 | | | Year Ended September 30, 2022 | | | Year Ended September 30, 2021 | | | Year Ended September 30, 2020 | | | Year Ended September 30,
2019 | |
| Net Asset Value, Beginning of Year | | $ | 28.92 | | | $ | 41.12 | | | $ | 30.72 | | | $ | 26.19 | | | $ | 29.50 | |
| Income (Loss) from Investment Operations: | | | | | | | | | | | | | | | | | | | | |
| Net investment income (loss) 1 | | | 0.35 | | | | 0.09 | | | | (0.03 | ) | | | 0.14 | | | | 0.16 | |
| Net realized and unrealized gain (loss) on Investments | | | 0.87 | | | | (11.57 | ) | | | 10.47 | | | | 4.52 | | | | (1.41 | ) |
| Total from investment operations | | | 1.22 | | | | (11.48 | ) | | | 10.44 | | | | 4.66 | | | | (1.25 | ) |
| Less Distributions: | | | | | | | | | | | | | | | | | | | | |
| Distributions from net investment income | | | (0.37 | ) | | | — | | | | (0.04 | ) | | | (0.13 | ) | | | (0.17 | ) |
| Net realized gains | | | — | | | | (0.72 | ) | | | — | | | | — | | | | (1.89 | ) |
| Total distributions | | | (0.37 | ) | | | (0.72 | ) | | | (0.04 | ) | | | (0.13 | ) | | | (2.06 | ) |
| Net asset value, end of year | | $ | 29.77 | | | $ | 28.92 | | | $ | 41.12 | | | $ | 30.72 | | | $ | 26.19 | |
| Total Return | | | 4.20 | % | | | (28.45 | )% | | | 34.00 | % | | | 17.94 | % | | | (2.32 | )% |
| | | | | | | | | | | | | | | | | | | | | |
| Ratios/Supplemental Data: | | | | | | | | | | | | | | | | | | | | |
| Net Assets at end of year (000’s) | | $ | 101,950 | | | $ | 99,060 | | | $ | 167,562 | | | $ | 92,933 | | | $ | 114,573 | |
| | | | | | | | | | | | | | | | | | | | | |
| Expenses to Average Net Assets | | | 0.75 | % | | | 0.75 | % | | | 0.75 | % | | | 0.75 | % | | | 0.75 | % |
| Net Investment Income (Loss) to Average Net Assets | | | 1.17 | % | | | 0.24 | % | | | (0.09 | )% | | | 0.49 | % | | | 0.64 | % |
| Portfolio Turnover Rate | | | 2719 | % | | | 1708 | % | | | 540 | % | | | 239 | % | | | 129 | % |
| 1 | Calculated based on average shares outstanding during the year. |
The accompanying notes are an integral part of these financial statements.
AI Powered Equity ETF
NOTES TO FINANCIAL STATEMENTS
September 30, 2023
NOTE 1 – ORGANIZATION
The AI Powered Equity ETF (the “Fund”) is a series of ETF Managers Trust (the “Trust”), an open-end management investment company consisting of multiple investment series, organized as a Delaware statutory trust on July 1, 2009. The Trust is registered with the SEC under the Investment Company Act of 1940, as amended (the “1940 Act”), as an open-end management investment company and the offering of the Fund’s shares (“Shares”) is registered under the Securities Act of 1933, as amended (the “Securities Act”). The investment objective of the Fund is capital appreciation. The Fund commenced operations on October 17, 2017.
The Fund currently offers one class of shares, which has no front end sales load, no deferred sales charges, and no redemption fees. The Fund may issue an unlimited number of shares of beneficial interest, with no par value. All shares of the Fund have equal rights and privileges.
Shares of the Fund are listed and traded on the NYSE Arca, Inc. Market prices for the Shares may be different from their net asset value (“NAV”). The Fund issues and redeems Shares on a continuous basis at NAV only in blocks of 25,000 shares, called “Creation Units.” Creation Units are issued and redeemed principally in-kind for securities included in a specified Index. Once created, Shares generally trade in the secondary market at market prices that change throughout the day in quantities less than a Creation Unit. Except when aggregated in Creation Units, Shares are not redeemable securities of the Fund. Shares of the Fund may only be purchased or redeemed by certain financial institutions (“Authorized Participant”). An Authorized Participant is either (i) a broker-dealer or other participant in the clearing process through the Continuous Net Settlement System of the National Securities Clearing Corporation or (ii) a DTC participant and, in each case, must have executed a Participant Agreement with the Distributor. Most retail investors do not qualify as Authorized Participants nor have the resources to buy and sell whole Creation Units. Therefore, they are unable to purchase or redeem the Shares directly from the Fund. Rather, most retail investors may purchase Shares in the secondary market with the assistance of a broker and are subject to customary brokerage commissions or fees.
Authorized Participants transacting in Creation Units for cash may pay an additional variable charge to compensate the relevant Fund for certain transaction costs (i.e., brokerage costs) and market impact expenses relating to investing in portfolio securities. Such variable charges, if any, are included in “Transaction Fees” in the Statements of Changes in Net Assets.
NOTE 2 – SIGNIFICANT ACCOUNTING POLICIES
The following is a summary of significant accounting policies consistently followed by the Fund. These policies are in conformity with accounting principles generally accepted in the United States of America (“U.S. GAAP”).
The Fund follows the investment company accounting and reporting guidance of the Financial Accounting Standards Board Accounting Standard Codification Topic 946 Financial Services – Investment Companies.
The Fund may invest in certain other investment companies (underlying funds). For more information about the underlying Fund’s operations and policies, please refer to those fund’s semiannual and annual reports, which are filed with the SEC.
| A. | Security Valuation. Securities listed on a securities exchange, market or automated quotation system for which quotations are readily available (except for securities traded on NASDAQ), including securities traded over the counter, are valued at the last quoted sale price on the primary exchange or market (foreign or domestic) on which they are traded on the valuation date (or at approximately 4:00 pm Eastern Time if a security’s primary exchange is normally open at that time), or, if there is no such reported sale on the valuation date, at the most recent quoted bid price. For securities traded on NASDAQ, the NASDAQ Official Closing Price will be used. |
AI Powered Equity ETF
NOTES TO FINANCIAL STATEMENTS
September 30, 2023 (Continued)
Securities for which quotations are not readily available are valued at their respective fair values as determined in good faith by ETF Managers Group, LLC (the “Adviser”), using procedures adopted by the Board of Trustees (the “Board”). When a security is “fair valued,” consideration is given to the facts and circumstances relevant to the particular situation, including a review of various factors set forth in the pricing procedures adopted by the Fund’s Board. The use of fair value pricing by a fund may cause the net asset value of its shares to differ significantly from the net asset value that would be calculated without regard to such considerations. As of September 30, 2023, the Fund did not hold any securities fair valued by the Adviser.
As described above, the Fund utilizes various methods to measure the fair value of its investments on a recurring basis. U.S. GAAP establishes a hierarchy that prioritizes inputs to valuation methods. The three levels of inputs are:
| | Level | 1 Unadjusted quoted prices in active markets for identical assets or liabilities that the Fund has the ability to access. |
| | | |
| | Level | 2 Observable inputs other than quoted prices included in Level 1 that are observable for the asset or liability, either directly or indirectly. These inputs may include quoted prices for the identical instrument on an inactive market, prices for similar instruments, interest rates, prepayment speeds, credit risk, yield curves, default rates and similar data. |
| | | |
| | Level | 3 Unobservable inputs for the asset or liability, to the extent relevant observable inputs are not available; representing the Fund’s own assumptions about the assumptions a market participant would use in valuing the asset or liability, and would be based on the best information available. |
The availability of observable inputs can vary from security to security and is affected by a wide variety of factors, including, for example, the type of security, whether the security is new and not yet established in the marketplace, the liquidity of markets, and other characteristics particular to the security. To the extent that valuation is based on models or inputs that are less observable or unobservable in the market, the determination of fair value requires more judgment. Accordingly, the degree of judgment exercised in determining fair value is greatest for instruments categorized in Level 3.
The inputs used to measure fair value may fall into different levels of the fair value hierarchy. In such cases, for disclosure purposes, the level in the fair value hierarchy within which the fair value measurement falls in its entirety, is determined based on the lowest level input that is significant to the fair value measurement in its entirety.
The following table presents a summary of the Fund’s investments in securities, at fair value, as of September 30, 2023:
AI Powered Equity ETF
| Assets^ | | Level 1 | | | Level 2 | | | Level 3 | | | Total | |
| Common Stocks | | $ | 101,750,630 | | | $ | — | | | $ | — | | | $ | 101,750,630 | |
| Short-Term Investments | | | 144,331 | | | | — | | | | — | | | | 144,331 | |
| Investments Purchased with Securities Lending Collateral* | | | — | | | | — | | | | — | | | | 3,098,889 | |
| Total Investments in Securities | | $ | 101,894,961 | | | $ | — | | | $ | — | | | $ | 104,993,850 | |
| ^ | For further information regarding security characteristics, see the Schedule of Investments. |
| | | |
| * | Certain investments that are measured at fair value using the net asset value per share (or its equivalent) practical expedient have not been categorized in the fair value hierarchy. The fair value amounts presented in the table are intended to permit reconciliation of the fair value hierarchy to the amounts presented in the Schedule of Investments. |
AI Powered Equity ETF
NOTES TO FINANCIAL STATEMENTS
September 30, 2023 (Continued)
| B. | Federal Income Taxes. The Fund has elected to be taxed as a “regulated investment company” and intends to distribute substantially all taxable income to its shareholders and otherwise comply with the provisions of the Internal Revenue Code applicable to regulated investment companies. Therefore, no provisions for federal income taxes or excise taxes have been made. |
To avoid imposition of the excise tax applicable to regulated investment companies, the Fund intends to declare each year as dividends, in each calendar year, at least 98.0% of its net investment income (earned during the calendar year) and 98.2% of its net realized capital gains (earned during the twelve months ended October 31) plus undistributed amounts, if any, from prior years.
Net capital losses incurred after October 31, within the taxable year are deemed to arise on the first business day of the Fund’s next taxable year.
The Fund recognizes the tax benefits of uncertain tax positions only where the position is “more likely than not” to be sustained assuming examination by tax authorities. The Fund has analyzed its tax position and has concluded that no liability for unrecognized tax benefits should be recorded related to uncertain tax positions expected to be taken in the Fund’s 2023 tax returns. The Fund identifies its major tax jurisdictions as U.S. Federal, the State of New Jersey, and the State of Delaware; however, the Fund is not aware of any tax positions for which it is reasonably possible that the total amounts of unrecognized tax benefits will change materially in the next twelve months.
As of September 30, 2023, management has reviewed the tax positions for open periods (for Federal purposes, three years from the date of filing and for state purposes, generally a range of three to four years from the date of filing), as applicable to the Fund, and has determined that no provision for income tax is required in the Fund’s financial statements.
| C. | Security Transactions and Investment Income. Investment securities transactions are accounted for on the trade date. Gains and losses realized on sales of securities are determined on a specific identification basis. Discounts/premiums on debt securities purchased are accreted/amortized over the life of the respective securities using the effective interest method. Dividend income is recorded on the ex-dividend date. Interest income is recorded on an accrual basis. Income, including gains, from investments in foreign securities received by the Fund may be subject to income, withholding or other taxes imposed by foreign countries. |
| D. | Foreign Currency Translations and Transactions. The Fund may engage in foreign currency transactions. Foreign currency transactions are translated into U.S. dollars on the following basis: (i) market value of investment securities, assets and liabilities at the daily rates of exchange, and (ii) purchases and sales of investment securities, dividend and interest income and certain expenses at the rates of exchange prevailing on the respective dates of such transactions. For financial reporting purposes, the Fund does not isolate changes in the exchange rate of investment securities from the fluctuations arising from changes in the market prices of securities for unrealized gains and losses. However, for federal income tax purposes, the Fund does isolate and treat as ordinary income the effect of changes in foreign exchange rates on realized gains or losses from the sale of investment securities and payables and receivables arising from trade-date and settlement-date differences. |
| E. | Distributions to Shareholders. Distributions to shareholders from net investment income are declared and paid for the Fund on a quarterly basis. Net realized gains on securities for the Fund normally are declared and paid on an annual basis. Distributions are recorded on the ex-dividend date. |
AI Powered Equity ETF
NOTES TO FINANCIAL STATEMENTS
September 30, 2023 (Continued)
| F. | Use of Estimates. The preparation of financial statements in conformity with U.S. GAAP requires management to make estimates and assumptions that affect the reported amounts of assets and liabilities at the date of the financial statements, as well as the reported amounts of revenues and expenses during the period. Actual results could differ from those estimates. |
| G. | Share Valuation. The NAV per share of the Fund is calculated by dividing the sum of the value of the securities held by the Fund, plus cash and other assets, minus all liabilities (including estimated accrued expenses) by the total number of shares outstanding for the Fund, rounded to the nearest cent. The Fund’s shares will not be priced on the days on which the NYSE is closed for trading. The offering and redemption price per share for the Fund is equal to the Fund’s NAV per share. |
| H. | Guarantees and Indemnifications. In the normal course of business, the Fund enters into contracts with service providers that contain general indemnification clauses. The Fund’s maximum exposure under these arrangements is unknown as this would involve future claims that may be made against the Fund that have not yet occurred. However, based on experience, the Fund expects the risk of loss to be remote. |
NOTE 3 – RISK FACTORS
Investing in the AI Powered Equity ETF may involve certain risks, as discussed in the Fund’s prospectus, including, but not limited to, those described below. Any of these risks could cause an investor to lose money.
Equity Market Risk. The equity securities held in the Fund’s portfolio may experience sudden, unpredictable drops in value or long periods of decline in value. This may occur because of factors that affect securities markets generally or factors affecting specific issuers, industries, or sectors in which the Fund invests such as political, market and economic developments, as well as events that impact specific issuers.
Management Risk. The Fund is subject to management risk as an actively-managed investment portfolio. The Adviser’s investment approach may fail to produce the intended results. If the Adviser’s implementation of the EquBot Model is inaccurate or incomplete, the Fund may not perform as expected and your investment could lose value over short or long-term periods. Additionally, the Adviser has not previously managed a Fund whose strategy relies on the use of AI, which may create additional risks for the Fund.
Market Trading Risk. An investment in the Fund faces numerous market trading risks, including the potential lack of an active market for Fund shares, losses from trading in secondary markets, periods of high volatility and disruption in the creation/redemption process of the Fund. Any of these factors, among others, may lead to the Fund’s shares trading at a premium or discount to NAV.
Models and Data Risk. The Fund relies heavily on proprietary quantitative models as well as information and data supplied by third parties (“Models and Data”). When Models and Data prove to be incorrect or incomplete, any decisions made in reliance thereon expose the Fund to potential risks.
Portfolio Turnover Risk. The portfolio managers may actively and frequently trade securities or other instruments in the Fund’s portfolio to carry out its investment strategies. A high portfolio turnover rate increases transaction costs, which may increase the Fund’s expenses.
Real Estate Investment Trust (“REIT”) Investment Risk. Investments in REITs involve unique risks. REITs may have limited financial resources, may trade less frequently and in limited volume, and may be more volatile than other securities. REITs may be affected by changes in the value of their underlying properties or mortgages or by defaults by their borrowers or tenants. Furthermore, these entities depend upon specialized management skills, have limited diversification and are, therefore, subject to risks inherent in financing a limited number of projects. In addition, the performance of a REIT may be affected by changes in the tax laws or by its failure to qualify for tax-free pass-through of income.
AI Powered Equity ETF
NOTES TO FINANCIAL STATEMENTS
September 30, 2023 (Continued)
Sector Risk. To the extent the Fund invests more heavily in particular sectors of the economy, its performance will be especially sensitive to developments that significantly affect those sectors.
Smaller Companies Risk. Smaller companies in which the Fund may invest may be more vulnerable to adverse business or economic events than larger, more established companies, and may underperform other segments of the market or the equity market as a whole. The securities of smaller companies also tend to be bought and sold less frequently and at significantly lower trading volumes than the securities of larger companies. As a result, it may be more difficult for the Fund to buy or sell a significant amount of the securities of a smaller company without an adverse impact on the price of the company’s securities, or the Fund may have to sell such securities in smaller quantities over a longer period of time, which may increase the Fund’s tracking error.
Natural Disaster/Epidemic Risk. Natural or environmental disasters, such as earthquakes, fires, floods, hurricanes, tsunamis and other severe weather related phenomena generally, and widespread disease, including pandemics and epidemics (for example, the novel coronavirus COVID -19), have been and can be highly disruptive to economies and markets and have recently led, and may continue to lead, to increased market volatility and significant market losses. Such natural disaster and health crises could exacerbate political, social, and economic risks previously mentioned, and result in significant breakdowns, delays, shutdowns, social isolation, and other disruptions to important global, local and regional supply chains affected, with potential corresponding results on the operating performance of the Fund and its investments. A climate of uncertainty and panic, including the contagion of infectious viruses or diseases, may adversely affect global, regional, and local economies and reduce the availability of potential investment opportunities, and increases the difficulty of performing due diligence and modeling market conditions, potentially reducing the accuracy of financial projections. Under these circumstances, the Fund may have difficulty achieving its investment objective which may adversely impact performance. Further, such events can be highly disruptive to economies and markets, significantly disrupt the operations of individual companies (including, but not limited to, the Fund’s third party service providers), sectors, industries, markets, securities and commodity exchanges, currencies, interest and inflation rates, credit ratings, investor sentiment, and other factors affecting the value of the Fund’s investments. These factors can cause substantial market volatility, exchange trading suspensions and closures and can impact the ability of the Fund to complete redemptions and otherwise affect Fund performance and Fund trading in the secondary market. A widespread crisis may also affect the global economy in ways that cannot necessarily be foreseen at the current time. How long such events will last and whether they will continue or recur cannot be predicted. Impacts from these events could have significant impact on the Fund’s performance, resulting in losses to the Fund.
On February 24, 2022, Russia commenced a military attack on Ukraine. The outbreak of hostilities between the two countries could result in more widespread conflict and could have a severe adverse effect on the region and the markets. In addition, sanctions imposed on Russia by the United States and other countries, and any sanctions imposed in the future could have a significant adverse impact on the Russian economy and related markets.
On October 7, 2023, Hamas launched a significant attack on Israel from the Gaza Strip. The extent and duration of the Israel-Hamas war and any related economic and market impacts are impossible to predict but may be significant and may negatively impact Israel’s economy. The price and liquidity of investments may fluctuate widely as a result of these conflicts and related events. How long such conflicts and related events will last, and whether either may escalate further, cannot be predicted, however such conflicts may negatively impact issuers of securities in which the Fund(s) invests.
A complete description of the principal risks is included in the Fund’s prospectus under the heading “Principal Investment Risks.”
AI Powered Equity ETF
NOTES TO FINANCIAL STATEMENTS
September 30, 2023 (Continued)
NOTE 4 – MANAGEMENT AND OTHER CONTRACTS
The Adviser serves as the investment Adviser to the Fund. Pursuant to an Investment Advisory Agreement (“Advisory Agreement”) between the Trust, on behalf of the Fund, and the Adviser, the Adviser provides investment advice to the Fund and oversees the day-to-day operations of the Fund, subject to the direction and control of the Board and the officers of the Trust. Under the Advisory Agreement, the Adviser is also responsible for arranging transfer agency, custody, fund administration and accounting, and other non-distribution related services necessary for the Fund to operate.
Under the Investment Advisory Agreement with the Fund, the Adviser has overall responsibility for the general management and administration of the Fund and arranges for sub-Advisory, transfer agency, custody, fund administration, securities lending, and all other non-distribution related services necessary for the Fund to operate. The Adviser bears the costs of all Advisory and non-Advisory services required to operate the Fund, in exchange for a single unitary fee. For services provided the Fund pays the Adviser at an annual rate of 0.75% of the Fund’s average daily net assets. The Adviser has an agreement with, and is dependent on, a third party to pay the Fund’s expenses in excess of 0.75% of the Fund’s average daily net assets. Additionally, under the Investment Advisory Agreement, the Adviser has agreed to pay all expenses of the Fund, except for: the fee paid to the Adviser pursuant to the Investment Advisory Agreement, interest charges on any borrowings, taxes, brokerage commissions and other expenses incurred in placing orders for the purchase and sale of securities and other investment instruments, acquired fund fees and expenses, accrued deferred tax liability, extraordinary expenses, and distribution (12b-1) fees and expenses (collectively, “Excluded Expenses”). The Adviser has entered into an Agreement with Foreside Fund Services LLC to serve as distributor the Fund (the “Distributor”). The Distributor provides marketing support for the Fund, including distributing marketing materials related to the Fund.
EquBot, LLC serves as the sub-adviser to the Fund (the “Sub-Adviser”) and provides investment advice using the EquBot Model to the Adviser and the Fund. The Adviser is responsible for paying the entire amount of the Sub-Adviser’s fee for the Fund. The Sub-Adviser also provides marketing support for the Fund.
U.S. Bancorp Fund Services, LLC doing business as U.S. Bank Global Fund Services (the “Administrator”) provides fund accounting, fund administration, and transfer agency services to the Fund. The Adviser compensates the Administrator for these services under an administration agreement between the two entities.
The Adviser pays each independent Trustee a quarterly fee for service to the Fund. Each Trustee is also reimbursed by the Adviser for all reasonable out-of-pocket expenses incurred in connection with their duties as Trustee, including travel and related expenses incurred in attending Board meetings.
NOTE 5 – DISTRIBUTION PLAN
The Fund has adopted a Plan of Distribution pursuant to Rule 12b-1 under the 1940 Act. Under the Plan, the Fund may pay compensation to the Distributor or any other distributor or financial institution with which the Trust has an agreement with respect to the Fund, with the amount of such compensation not to exceed an annual rate of 0.25% of the Fund’s daily average net assets. For the year ended September 30, 2023, the Fund did not incur any 12b-1 expenses.
AI Powered Equity ETF
NOTES TO FINANCIAL STATEMENTS
September 30, 2023 (Continued)
NOTE 6 - PURCHASES AND SALES OF SECURITIES
The costs of purchases and sales of securities, excluding short-term securities and in-kind transactions, for the year ended September 30, 2023:
| | | Purchases | | | Sales | |
| AI Powered Equity ETF | | $ | 2,903,490,860 | | | $ | 2,901,542,861 | |
The costs of purchases and sales of in-kind transactions associated with creations and redemptions for the year ended September 30, 2023:
| | | Purchases In- Kind | | | Sales In- Kind | |
| AI Powered Equity ETF | | $ | 24,912,529 | | | $ | 22,858,931 | |
Purchases in-kind are the aggregate of all in-kind purchases and sales in-kind are the aggregate of all in-kind sales. Net capital gains or losses resulting from in-kind redemptions are excluded from the Fund’s taxable gains and are not distributed to shareholders.
There were no purchases or sales of U.S. Government obligations for the year ended September 30, 2023.
NOTE 7 — SECURITIES LENDING
The Fund may lend up to 33 1∕3% of the value of the securities in its portfolio to brokers, dealers and financial institutions (but not individuals) under terms of participation in a securities lending program administered by U.S. Bank N.A. (“the Custodian”). The securities lending agreement requires that loans are collateralized at all times in an amount equal to at least 102% of the value of any loaned securities at the time of the loan, plus accrued interest. The Fund receives compensation in the form of fees and earn interest on the cash collateral. The amount of fees depends on a number of factors including the type of security and length of the loan. The Fund continues to receive interest payments or dividends on the securities loaned during the borrowing period. Gain or loss in the fair value of securities loaned that may occur during the term of the loan will be for the account of the Fund. The Fund has the right under the terms of the securities lending agreement to recall the securities from the borrower on demand. The cash collateral is invested by the Custodian in accordance with approved investment guidelines. Those guidelines require the cash collateral to be invested in readily marketable, high quality, short-term obligations either directly on behalf of the Fund or through one or more joint accounts, money market funds, or short-term bond funds, including those advised by or affiliated with the Adviser; however, such investments are subject to risk of payment delays or default on the part of the issuer or counterparty or otherwise may not generate sufficient interest to support the costs associated with securities lending. Other investment companies, in which the Fund may invest cash collateral, can be expected to incur fees and expenses for operations, such as investment Advisory and administration fees, which would be in addition to those incurred by the Fund, and which may be received in full or in part by the Adviser. Pursuant to guidance issued by the SEC staff, fees and expenses of money market funds used for cash collateral received in connection with loans of securities are not treated as Acquired Fund Fees and Expenses, which reflect a fund’s pro rata share of the fees and expenses incurred by other investment companies in which the Fund invests (as disclosed in the Prospectus, as applicable). The Fund could also experience delays in recovering its securities and possible loss of income or value if the borrower fails to return the borrowed securities, although the Fund is indemnified from this risk by contract with the securities lending agent.
AI Powered Equity ETF
NOTES TO FINANCIAL STATEMENTS
September 30, 2023 (Continued)
As of September 30, 2023, the value of the securities on loan and payable for collateral due to broker were as follows:
Value of Securities on Loan Collateral Received
| Fund | | Values of
Securities on
Loan | | | Fund
Collateral
Received* | |
| AI Powered Equity ETF | | $ | 3,018,753 | | | $ | 3,098,889 | |
| * | The cash collateral received was invested in the Mount Vernon Liquid Assets Portfolio, LLC, an investment with an overnight and continuous maturity, as shown on the Schedule of Investments. |
NOTE 8 – FEDERAL INCOME TAXES
The components of distributable earnings (losses) and cost basis of investments for federal income tax purposes at September 30, 2023, were as follows:
| | | Cost | | | Gross
Unrealized
Appreciation | | | Gross
Unrealized
Depreciation | | | Net Unrealized
Appreciation
(Depreciation) | |
| AI Powered Equity ETF | | $ | 107,084,233 | | | $ | 1,046,655 | | | $ | (3,137,038 | ) | | $ | (2,090,393 | ) |
| | | Undistributed
Ordinary
Income | | | Undistributed
Long-Term
Gain | | | Total
Distributable
Earnings | | | Other
Accumulated
(Loss) | | | Total
Accumulated
Gain | |
| AI Powered Equity ETF | | $ | 19,629 | | | $ | — | | | $ | 19,629 | | | $ | (54,989,103 | ) | | $ | (57,056,164 | ) |
As of September 30, 2023, the Fund had accumulated capital loss carryovers of:
| | | Capital Loss
Carryover ST | | | Capital Loss
Carryover LT | | Expires | |
| AI Powered Equity ETF | | $ | (54,989,103 | ) | | None | | | Indefinite | |
Under current tax law, capital and currency losses realized after October 31 of a fund’s fiscal year may be deferred and treated as occurring on the first business day of the following fiscal year for tax purposes. The Fund had deferred post -October capital and currency losses, which will be treated as arising on the first business day of the year ended September 30, 2023.
| | | Later Year
Ordinary Loss | | Post-October
Loss |
| AI Powered Equity ETF | | None | | None |
U.S. GAAP requires that certain components of net assets relating to permanent differences be reclassified between financial and tax reporting. These reclassifications have no effect on net assets or net asset value per share. For the fiscal year ended September 30, 2023, the following table shows the reclassifications made:
| | | Total Distributable Earnings/(Loss) | | | Paid-In Capital | |
| AI Powered Equity ETF | | $ | 303,014 | | | $ | (303,014 | ) |
The tax character of distributions paid by the Fund during the fiscal year ended September 30, 2023 and fiscal year ended September 30, 2022 are as follows:
| | | Year Ended
September 30, 2023 | | | Year Ended
September 30, 2022 | |
| | | From
Ordinary
Income | | | From
Capital
Gains | | | From
Ordinary
Income | | | From
Capital
Gains | |
| AI Powered Equity ETF | | $ | 1,342,664 | | | $ | — | | | $ | — | | | $ | 2,903,688 | |
AI Powered Equity ETF
NOTES TO FINANCIAL STATEMENTS
September 30, 2023 (Continued)
NOTE 9 – LEGAL MATTERS
The Trust, the Adviser, and certain officers and affiliated persons of the Adviser (together with the Adviser, the “Adviser Defendants”) were named as defendants in an action filed December 21, 2021, in the Superior Court of New Jersey, Union County, captioned PureShares, LLC, d/b/a PureFunds et al. v. ETF Managers Group, LLC et al., Docket No. UNN-C-152-21 (the “NJ Action”). The NJ Action asserted breach of contract and other tort claims and sought damages in unspecified amounts and injunctive relief. On May 25, 2022, the court in the NJ Action dismissed with prejudice all claims asserted against the Trust, as well as all contract claims and all except one tort claim asserted against the Adviser Defendants. With respect to the tort claim asserted against the Adviser Defendants, the parties stipulated and agreed to dismiss that claim without prejudice in May, 2023.
The Adviser and certain of its affiliates have entered into a settlement agreement with the Securities and Exchange Commission (“SEC”) regarding certain alleged conflicts of interest arising in connection with ETFMG Alternative Harvest ETF’s (MJ) participation in the securities lending program administered by its prior custodian. Without admitting or denying the SEC’s findings, the Adviser and its parent company agreed to censures, to a cease-and-desist order, and to pay, jointly and severally, a civil penalty of $4 million. The settlement resolves the SEC’s investigation of the Adviser and its affiliates.
As of September 30, 2023, there were no adjustments made to the accompanying financial statements based on the above legal matters.
NOTE 10 – SUBSEQUENT EVENTS
In preparing these financial statements, the Fund has evaluated events and transactions for potential recognition or disclosure through the date the financial statements were issued.
The Board of the Trust has approved an Agreement and Plan of Reorganization (the “Agreement”) providing for the reorganization of the Target Fund into corresponding new fund (the “Acquiring Fund”), which is a newly created series of Amplify ETF Trust with similar investment objectives and the same fees and expenses as the corresponding Target Fund. The Reorganization is subject to certain conditions including approval by shareholders of the Target Fund. The following table shows shares of the Acquiring Fund that will be issued to shareholders of the corresponding Target Fund.
| Target Fund | Acquiring Fund |
| ETFMG AI Powered Equity ETF | Amplify AI Powered Equity ETF |
The proxy solicitation materials were filed with the SEC on October 13, 2023. The Joint Special Meeting of Shareholders is to be held on December 28, 2023.
Other than as disclosed, there were no other subsequent events requiring recognition or disclosure through the date the financial statements were issued.
Report of Independent Registered Public Accounting Firm
To the Board of Trustees of ETF Managers Trust
and the Shareholders of AI Powered Equity ETF:
Opinion on the Financial Statements
We have audited the accompanying statement of assets and liabilities, including the schedule of investments, of AI Powered Equity ETF (the “Fund”) (a series of ETF Managers Trust) as of September 30, 2023, the related statement of operations for the year then ended, the statements of changes in net assets for each of the two years in the period then ended, the financial highlights for each of the periods indicated therein, and the related notes (collectively referred to as the “financial statements”). In our opinion, the financial statements present fairly, in all material respects, the financial position of the Fund as of September 30, 2023, and the results of its operations for the year then ended, the changes in net assets for each of the two years in the period then ended, and the financial highlights for each of the periods indicated therein, in conformity with accounting principles generally accepted in the United States of America.
Basis for Opinion
These financial statements and financial highlights are the responsibility of the Fund’s management. Our responsibility is to express an opinion on these financial statements based on our audits. We are a public accounting firm registered with the Public Company Accounting Oversight Board (United States) (“PCAOB”) and are required to be independent with respect to the Fund in accordance with the U.S. federal securities laws and the applicable rules and regulations of the Securities and Exchange Commission and the PCAOB.
We conducted our audits in accordance with the standards of the PCAOB. Those standards require that we plan and perform the audits to obtain reasonable assurance about whether the financial statements and financial highlights are free of material misstatement, whether due to error or fraud. The Fund is not required to have, nor were we engaged to perform, an audit of its internal control over financial reporting. As part of our audits we are required to obtain an understanding of internal control over financial reporting but not for the purpose of expressing an opinion on the effectiveness of the Fund’s internal control over financial reporting. Accordingly, we express no such opinion.
Our audits included performing procedures to assess the risks of material misstatement of the financial statements and financial highlights, whether due to error or fraud, and performing procedures that respond to those risks. Such procedures included examining, on a test basis, evidence regarding the amounts and disclosures in the financial statements and financial highlights. Our audits also included evaluating the accounting principles used and significant estimates made by management, as well as evaluating the overall presentation of the financial statements and financial highlights. Our procedures included confirmation of securities owned as of September 30, 2023 by correspondence with the custodian. We believe that our audits provide a reasonable basis for our opinion.
/s/WithumSmith+Brown, PC
We have served as the auditor of one or more series of the Trust since 2013.
New York, New York
November 29, 2023
AI Powered Equity ETF
Expense Example
Six Months Ended September 30, 2023 (Unaudited)
As a shareholder of AI Powered Equity ETF (the “Fund”) you incur two types of costs: (1) transaction costs, including brokerage commissions on purchases and sales of Fund shares, and (2) ongoing costs, including management fees and other Fund expenses. These examples are intended to help you understand your ongoing costs (in dollars) of investing in the Fund and to compare these costs with the ongoing costs of investing in other funds. The example is based on an investment of $1,000 invested at the beginning of the period and held for the entire period (April 1, 2023 to September 30, 2023).
Actual Expenses
The first line of the table provides information about actual account values based on actual returns and actual expenses. You may use the information in this line, together with the amount you invested, to estimate the expenses that you paid over the period. Simply divide your account value by $1,000 (for example, an $8,600 account value divided by $1,000 = 8.6), then, multiply the result by the number in the first line under the heading entitled “Expenses Paid During Period’’ to estimate the expenses you paid on your account during this period.
Hypothetical Example for Comparison Purposes
The second line of the table provides information about hypothetical account values based on a hypothetical return and hypothetical expenses based on the Fund’s actual expense ratio and an assumed rate of return of 5% per year before expenses, which is not the Fund’s actual return. The hypothetical account values and expenses may not be used to estimate the actual ending account balance or expenses you paid for the period. You may use this information to compare the ongoing costs of investing in the Fund and other funds. To do so, compare this 5% hypothetical example with the 5% hypothetical examples that appear in the shareholder reports of the other funds. Please note that the expenses shown in the table are meant to highlight your ongoing costs only and do not reflect any transactional costs, such as brokerage commissions paid on purchases and sales of Fund shares. Therefore, the second line of the table is useful in comparing ongoing costs only and will not help you determine the relative total costs of owning different funds. If these transactional costs were included, your costs would have been higher.
| Fund Name | | Beginning
Account
Value
April 1, 2023 | | | Ending
Account Value
September 30,
2023 | | | Expenses
Paid During
the Period^ | | | Annualized
Expense Ratio
During the
Period April
1, 2023 to
September 30,
2023 | |
| AI Powered Equity ETF | | | | | | | | | | | | | | | | |
| Actual | | $ | 1,000.00 | | | $ | 1,028.80 | | | $ | 3.81 | | | | 0.75 | % |
| Hypothetical (5% annual) | | | 1,000.00 | | | | 1,021.31 | | | | 3.80 | | | | 0.75 | % |
| ^ | The dollar amounts shown as expenses paid during the period are equal to the annualized six-month expense ratio multiplied by the average account value during the period, multiplied by 183/365 (to reflect the one-half year period). |
AI Powered Equity ETF
SUPPLEMENTARY INFORMATION
September 30, 2023 (Unaudited)
NOTE 1 – FREQUENCY DISTRIBUTION OF PREMIUMS AND DISCOUNTS
Information regarding how often shares of the Fund traded on the Exchange at a price above (i.e., at a premium) or below (i.e., at a discount) the NAV is available on the Fund’s website at www.etfmgfunds.com.
NOTE 2 – FEDERAL TAX INFORMATION
Qualified Dividend Income/Dividends Received Deduction
For the fiscal year ended September 30, 2023, certain dividends paid by the Fund may be subject to a maximum tax rate of 15%, as provided for by the Jobs and Growth Tax Reconciliation Act of 2003. The percentage of dividends declared from ordinary income designated as qualified dividend income was as follows:
| Fund Name | | Qualified
Dividend Income | |
| AI Powered Equity ETF | | | 26.30 | % |
For corporate shareholders, the percent of ordinary income distributions qualifying for the corporate dividends received deduction for the fiscal year ended September 30, 2023 was as follows:
| Fund Name | | Dividends
Received Deduction | |
| AI Powered Equity ETF | | | 25.85 | % |
Short Term Capital Gain
The percentage of taxable ordinary income distributions that are designated as short-term capital gain distributions under Internal Revenue Section 871 (k)(2)(C) for the Fund were as follows:
| Fund Name | | Short-Term
Capital Gain | |
| AI Powered Equity ETF | | | 0.00 | % |
NOTE 3 – INFORMATION ABOUT PORTFOLIO HOLDINGS
The Fund files a complete schedule of portfolio holdings with the SEC for its first and third fiscal quarters on Part F of Form N-PORT. Once filed, the Fund’s Part F of Form N-PORT is available, without charge, upon request on the SEC’s website (www.sec.gov), the Fund’s website (www.etfmgfunds.com) and is available by calling (877) 756-7873. The Fund’s portfolio holdings are posted on its website at www.etfmgfunds.com daily.
NOTE 4 – INFORMATION ABOUT PROXY VOTING
A description of the policies and procedures the Fund uses to determine how to vote proxies relating to portfolio securities is provided in the Statement of Additional Information (“SAI”). The SAI is available without charge upon request by calling toll-free at 1 -844-ETF-MGRS (1-844-383-6477), by accessing the SEC’s website at www.sec.gov, or by accessing the Fund’s website at www.etfmgfunds.com.
Information regarding how the Fund voted proxies relating to portfolio securities during the period ending June 30 is available by calling toll -free at 1-844-ETF-MGRS (1-844-383-6477) or by accessing the SEC’s website at www.sec.gov.
Carefully consider the Fund’s investment objectives, risk factors, charges, and expenses before investing. This and additional information can be found in the Fund’s prospectus, which may be obtained by calling 1-844-ETF-MGRS (1-844-383-6477) or by visiting www.etfmgfunds.com. This report must be preceded or accompanied by a prospectus.
AI Powered Equity ETF
Board of Trustees
Set forth below are the names, birth years, positions with the Trust, length of term of office, and the principal occupations and other directorships held during at least the last five years of each of the persons currently serving as a Trustee of the Trust, as well as information about each officer. The business address of each Trustee and officer is 30 Maple Street, 2nd Floor, Summit, New Jersey 07901. The SAI includes additional information about Fund directors and is available, without charge, upon request by calling 1-844-ETF-MGRS (1-844-383-6477).
Name and Year of Birth | Position(s)
Held with the
Trust, Term of
Office and
Length of Time Served | Principal Occupation(s) During Past 5 Years | Number of
Portfolios in
Fund
Complex
Overseen By Trustee | Other
Directorships
Held by
Trustee
During Past 5 Years |
| Interested Trustee and Officers |
Michael Minella
(1971) | President (since 2023) | Senior Principal Consultant, ACA Group (since 2022); Vice President and Director, Fidelity Investments (2009-2022). | n/a | n/a |
John A. Flanagan
(1946) | Treasurer (since 2015) | President, John A. Flanagan CPA, LLC (accounting services) (since 2010); Treasurer, ETF Managers Trust (since 2015); Chief Financial Officer, ETF Managers Capital, LLC (commodity pool operator) (since 2015). | n/a | Independent Trustee - Absolute Shares Trust (since 2014) (6 portfolios) |
Kevin Hourihan
(1978) | Chief Compliance Officer (since 2022) | Senior Principal Consultant, Fund Chief Compliance Officer, ACA Global, LLC (since 2022); Chief Compliance Officer, Ashmore Funds (2017-2022); Chief Compliance Officer, Ashmore Investment Management (US) Corp (2014-2022); Chief Compliance Officer, Ashmore Equities Investment Management (2015-2019). | n/a | n/a |
Matthew J. Bromberg
(1973) | Secretary (since 2023) | Chief Compliance Officer and Chief Compliance Officer of ETF Managers Group, LLC (since 2022); General Counsel and Secretary of Exchange Traded Managers Group LLC (since 2020); ETF Managers Group LLC (since 2020); ETFMG Financial LLC (since 2020); ETF Managers Capital LLC (since 2020); Partner of Dorsey & Whitney LLP (law firm) (2019-2020); General Counsel of WBI Investments, Inc. (2016-2019); Millington Securities, Inc. (2016-2019). | n/a | n/a |
AI Powered Equity ETF
Board of Trustees (Continued)
Name and Year of Birth | Position(s)
Held with the
Trust, Term of
Office and
Length of Time Served | Principal Occupation(s)
During Past 5 Years | Number of
Portfolios in
Fund
Complex
Overseen By Trustee | Other
Directorships
Held by
Trustee
During Past 5 Years |
Terry Loebs
(1963) | Chairman of the Board (since 2023); Trustee (since 2014); Lead Independent Trustee (since 2020) | Founder and Managing Member, Pulsenomics LLC (index product development and consulting firm) (since 2011); Managing Director, MacroMarkets, LLC (exchange-traded products firm) (2006-2011). | 12 | None |
Eric Wiegel
(1960) | Trustee (since 2020) | Managing Partner, Global Focus Capital LLC (since 2013); Senior Portfolio Manager, Little House Capital (2019-2021); Chief Investment Officer, Insight Financial Strategist LLC (2017-2018). | 12 | None |
AI Powered Equity ETF
ETF MANAGERS TRUST
Privacy Policy and Procedures
ETF Managers Trust, (the “Trust”) has adopted the following privacy policies in order to safeguard the personal information of the Trust’s customers and consumers in accordance with Regulation S-P as promulgated by the U.S. Securities and Exchange Commission.
Trust officers are responsible for ensuring that the following policies and procedures are implemented:
1) The Trust is committed to protecting the confidentiality and security of the information they collect and will handle personal customer and consumer information only in accordance with Regulation S-P and any other applicable laws, rules and regulations1. The Trust will ensure: (a) the security and confidentiality of customer records and information; (b) that customer records and information are protected from any anticipated threats and hazards; and (c) that customer records and information are protected from unauthorized access or use.
2) The Trust conducts its business affairs through its trustees, officers and third parties that provide services pursuant to agreements with the Trust. The Trust has no employees. It is anticipated that the trustees and officers of the Trust who are not employees of service providers of the Trust will not have access to customer records and information in the performance of their normal responsibilities for the Trust.
3) The Trust may share customer information with its affiliates, subject to the customers’ right to prohibit such sharing.
4) The Trust may share customer information with unaffiliated third parties only in accordance with the requirements of Regulation S-P. Pursuant to this policy, the Trust will not share customer information with unaffiliated third parties other than as permitted by law, unless authorized to do so by the customer.
Consistent with these policies, the Trust has adopted the following procedures:
1) The Trust will determine that the policies and procedures of its affiliates and Service Providers are reasonably designed to safeguard customer information and only permit appropriate and authorized access to and use of customer information through the application of appropriate administrative, technical and physical protections.
2) The Trust will direct each of its Service Providers to adhere to the privacy policy of the Trust and to its privacy policies with respect to all customer information of the Trust and to take all actions reasonably necessary so that the Trust is in compliance with the provisions of Regulation S-P, including, as applicable, the development and delivery of privacy notices and the maintenance of appropriate and adequate records.
3) The Trust requires its Service Providers to provide periodic reports to the Trust’s Board of Trustees outlining their privacy policies and the implementation of such policies. Each Service Provider is required to promptly report to the Trust’s Board any material changes to its privacy policy before, or promptly after, the adoption of such changes.
| (1) | Generally, the Funds have institutional clients which are not considered “customers” for purposes of regulation S-P. |
Advisor
ETF Managers Group, LLC
350 Springfield Ave., Suite 200, Summit, NJ 07901
Distributor
Foreside Fund Services LLC
Three Canal Plaza, Suite 100, Portland, Maine 04101
Custodian
U.S. Bank National Association
Custody Operations
1555 North River Center Drive, Suite 302, Milwaukee, Wisconsin 53212
Transfer Agent
U.S. Bancorp Fund Services, LLC doing business as U.S. Bank Global Fund Services
615 East Michigan Street, Milwaukee, Wisconsin 53202
Securities Lending Agent
U.S. Bank, National Association
Securities Lending
800 Nicolet Mall
Minneapolis, MN 55402-7020
Independent Registered Public Accounting Firm
WithumSmith + Brown, PC
1411 Broadway, 9th Floor, New York, NY 10018
Legal Counsel
Sullivan & Worcester LLP
1666 K Street NW, Washington, DC 20006
ETFMG Travel Tech ETF
AWAY
Annual Report
September 30, 2023

The fund is a series of ETF Managers Trust.
ETFMG TM ETFs
TABLE OF CONTENTS
September 30, 2023
ETFMG TM ETFs
Dear Shareholder,
On behalf of the entire team, we want to express our appreciation for the confidence you have placed in the ETFMG Travel Tech ETF (the “Fund”). The following information pertains to the fiscal period from October 1, 2022 to September 30, 2023 (the “Annual Period”).
Market Overview
The U.S. economy performed better than expected despite persistent inflationary pressure, rising interest rates and geo-political conflict during the Annual Period.
Early in the Annual Period, inflation had risen sharply because of supply chain disruptions, high food and energy prices and the Russia-Ukraine war, reaching its peak level, just prior to the Annual Period, in September 2022. In the first quarter of 2023, U.S. equities managed to deliver gains, despite the significant volatility. The January rally, however, gave way to a February sell off as higher-than-expected inflation, a tight labor market and solid economic growth indicated that the U.S. Federal Reserve’s (Fed) monetary policy would remain tight for the foreseeable future. One of the most significant impacts occurred in the banking sector in March 2023, when Silicon Valley Bank, Signature Bank, and First Republic Bank, among others, failed. In the same month, Swiss bank UBS agreed to buy Credit Suisse, considered vulnerable in the then current environment.
In the second quarter of 2023, the economy grew at an annualized rate of 2.1%, according to the third estimate from the U.S. Bureau of Economic Analysis, compared to 2.2% in the first quarter and in line with 2.1% in 2022 overall. Since then, price pressures have eased given normalization in supply chains, falling energy prices and aggressive measures by the Fed and other global central banks to tighten financial conditions and slow demand in their economies. Nevertheless, during the Annual Period inflation levels remained much higher than central banks’ target levels, with the Fed raising its target fed funds rate six times during the Annual Period, bringing it to a range of 5.25% to 5.50% as of July 2023. As of August 2023, the unemployment rate was 3.8%, near its pre-pandemic low, although monthly job growth continued to be moderate. In September 2023, the Fed’s policy committee voted to hold the rate steady.
As the U.S. Congress neared its September 30, 2023, deadline to approve federal funding, investor concerns about a potential government shutdown and the impact this could have on the U.S. economy increased. The shutdown, however, was averted because of a Continuing Resolution which temporarily kept the government open for forty-five more days. Despite higher rates and increased market volatility, U.S. stocks for the Annual Period had strong returns of 21.62%, as measured by the S&P 500 Index.
These conditions have impacted the performance of the Fund during the Annual Period, among other factors, and the value of an investment in the Fund. We encourage you to talk with your financial advisor and visit etfmg.com for further insight into investing in today’s markets.
Performance Overview
During the Annual Period, the S&P 500 Information Technology Sector Index, a broad measure of US listed technology companies, returned 41.24%. During the same period, the S&P Global 1200 Information Technology Sector Index, a broad measure of global technology companies, returned 39.60%.
The ETFMG Travel Tech ETF (AWAY) seeks to provide investment results that, before fees and expenses, correspond generally to the total return performance of the Prime Travel Technology Index NTR (the “Index”).
Over the Annual Period, the total return for the Fund was 6.54%, while the total return for the Index was 5.65%. The best performers in the Fund. on the basis of contribution to return, were Temairazu Inc., Cvc Brasil Operadora E Agenc., Expedia Group Inc., Sabre Corp., and Lyft Inc., while the worst performers were Tuniu Corp., Trivago Nv., Mondee Holdings Inc., Trip.com Group Ltd., and Serko Ltd.
At the end of the Annual Period, the Fund saw an approximate allocation of 76.13% to Consumer Discretionary, 9.92% to Industrials and 8.66% to Information Technology. The Fund was exposed predominately to the United States at 35.83%, 12.82% to China and 11.87% to Australia.
You can find further details about the Fund by visiting www.etfmg.com, or by calling 1-844-ETF-MGRS (1-844-383-6477).
Sincerely

John A. Flanagan
Principal Financial Officer
ETFMG TM ETFs
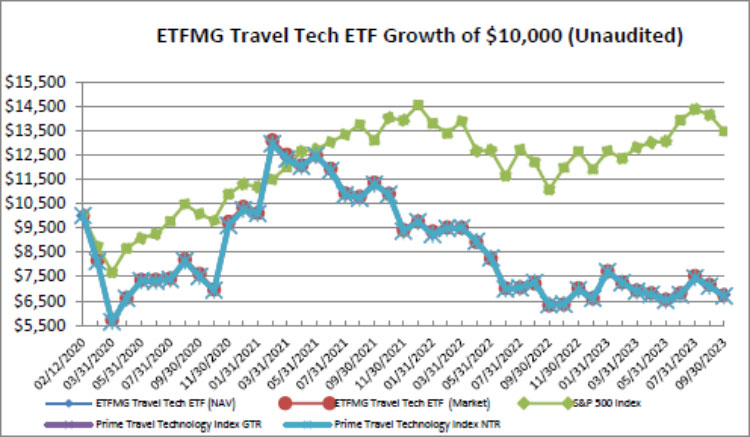
Average Annual Returns
Year Ended September 30, 2023 | | 1 Year
Return | | | Since
Inception
(2/12/2020) | | | Value of
$10,000
(9/30/2023) | |
| ETFMG Travel Tech ETF (NAV) | | | 6.54 | % | | | -10.21 | % | | $ | 6,762 | |
| ETFMG Travel Tech ETF (Market) | | | 6.72 | % | | | -10.30 | % | | $ | 6,739 | |
| S&P 500 Index | | | 21.62 | % | | | 8.53 | % | | $ | 13,464 | |
| Prime Travel Technology Index GTR | | | 5.67 | % | | | -10.43 | % | | $ | 6,702 | |
| Prime Travel Technology Index NTR | | | 5.65 | % | | | -10.45 | % | | $ | 6,698 | |
Performance data quoted represents past performance and does not guarantee future results. The investment return and principal value of an investment will fluctuate so that an investor’s shares, when redeemed, may be worth more or less than their original cost. Current performance of the Fund may be lower or higher than the performance quoted. All performance is historical and includes reinvestment of dividends and capital gains. Performance data current to the most recent month end may be obtained by calling 1-844-ETF-MGRS (1-844-383-6477).
The chart illustrates the performance of a hypothetical $10,000 investment made on February 12, 2020, and is not intended to imply any future performance. The returns shown do not reflect the deduction of taxes that a shareholder would pay on fund distributions from the sales of Fund shares. The chart assumes reinvestment of capital gains and dividends, if any. The Index Returns do not reflect fees or expenses and are not available for direct investment.
ETFMG TM ETFs
ETFMG Travel Tech ETF
Top Ten Holdings as of September 30, 2023 (Unaudited)*
| | | Security | | % of Total
Investments | |
| 1 | | Airbnb, Inc. - Class A | | | 4.60 | % |
| 2 | | Trainline PLC | | | 4.53 | % |
| 3 | | Booking Holdings, Inc. | | | 4.38 | % |
| 4 | | TripAdvisor, Inc. | | | 4.30 | % |
| 5 | | Uber Technologies, Inc. | | | 4.29 | % |
| 6 | | Expedia Group, Inc. | | | 4.19 | % |
| 7 | | MakeMyTrip, Ltd. | | | 4.01 | % |
| 8 | | Tongcheng Travel Holdings, Ltd. | | | 3.84 | % |
| 9 | | TravelSky Technology, Ltd. - Class H | | | 3.79 | % |
| 10 | | Webjet, Ltd. | | | 3.75 | % |
| | | | | | | |
| | | Top Ten Holdings = 41.68% of Total Investments | | | | |
| * | Current Fund holdings may not be indicative of future Fund holdings. |
ETFMG TM ETFs
Important Disclosures and Key Risk Factors
Investing involves risk, including the possible loss of principal. Shares of any ETF are bought and sold at market price (not NAV), may trade at a discount or premium to NAV and are not individually redeemed from the Fund. Brokerage commissions will reduce returns. Narrowly focused investments typically exhibit higher volatility.
Past performance is not indicative of future return. A fund’s performance for very short time periods may not be indicative of future performance.
AWAY
The ETFMG Travel Tech ETF (the “Fund” or the “Travel Tech ETF”) seeks investment results that correspond generally to the price and yield, before fund fees and expenses, of the Prime Travel Technology Index (the “Index”).
Companies in the technology field, including companies in the computers, telecommunications and electronics industries, face intense competition, which may have an adverse effect on profit margins.Technology companies may have limited product lines, markets, financial resources or personnel. The products of technology companies may face obsolescence due to rapid technological developments and frequent new product introduction, and such companies may face unpredictable changes in growth rates, competition for the services of qualified personnel and competition from foreign competitors with lower production costs. Companies in the technology sector are heavily dependent on patent and intellectual property rights. The loss or impairment of these rights may adversely affect the profitability of these companies.
Unlike with an actively managed fund, the Fund’s adviser does not use techniques or defensive strategies designed to lessen the effects of market volatility or to reduce the impact of periods of market decline. This means that, based on market and economic conditions, the Fund’s performance could be lower than other types of funds that may actively shift their portfolio assets to take advantage of market opportunities or to lessen the impact of a market decline.
Natural or environmental disasters, such as earthquakes, fires, floods, hurricanes, tsunamis and other severe weather-related phenomena generally, and widespread disease, including pandemics and epidemics, have been and may be highly disruptive to economies and markets, adversely impacting individual companies, sectors, industries, markets, currencies, interest and inflation rates, credit ratings, investor sentiment, and other factors affecting the value of the Fund’s investments. Given the increasing interdependence among global economies and markets, conditions in one country, market, or region are increasingly likely to adversely affect markets, issuers, and/or foreign exchange rates in other countries, including the U.S. Any such events could have a significant adverse impact on the value of the Fund’s investments.
Additionally, natural or environmental disasters, widespread disease or other public health issues, war, acts of terrorism or other events could result in increased premiums or discounts to the Fund’s NAV.
Effective, August 14, 2023, the Fund is distributed by Foreside Fund Services LLC. ETF Managers Group LLC is a wholly owned subsidiary of Exchange Traded Managers Group LLC (collectively, “ETFMG”).
The Fund is intended to be made available only to U.S. residents. Under no circumstances is any information provided on this website intended for distribution to or use by, or to be an offer to sell to or solicitation of an offer to buy the Fund or any investment product or service of, any person or entity in any jurisdiction or country, other than the United States, where such distribution, use, offer or solicitation would subject the Fund or its affiliates to any registration requirement or be unlawful under the securities laws of that jurisdiction or country.
ETFMG TM ETFs
PORTFOLIO ALLOCATIONS
As of September 30, 2023 (Unaudited)
| | | ETFMG
Travel Tech
ETF | |
| As a percent of Net Assets: | | | | |
| Australia | | | 11.8 | % |
| Brazil | | | 2.0 | |
| Cayman Islands | | | 9.2 | |
| China | | | 4.1 | |
| Japan | | | 2.3 | |
| Mauritius | | | 4.3 | |
| Netherlands | | | 2.0 | |
| New Zealand | | | 2.2 | |
| Republic of Korea | | | 3.4 | |
| Spain | | | 7.7 | |
| United Kingdom | | | 10.6 | |
| United States | | | 36.6 | |
| Virgin Islands (UK) | | | 3.7 | |
| Short-Term and other Net Assets (Liabilities) | | | 0.1 | |
| | | | 100.0 | % |
ETFMG TM ETFs
ETFMG Travel Tech ETF
Schedule of Investments
September 30, 2023
| | | Shares | | | Value | |
| COMMON STOCKS - 99.9% | | | | | | | | |
| Australia - 11.8% | | | | | | | | |
| Hotels, Restaurants & Leisure - 7.8% (d) | | | | | | | | |
| Corporate Travel Management, Ltd. | | | 362,807 | | | $ | 3,930,547 | |
| Webjet, Ltd. (a) | | | 966,653 | | | | 4,195,192 | |
| Total Hotels, Restaurants & Leisure | | | | | | | 8,125,739 | |
| Software - 4.0% | | | | | | | | |
| SiteMinder, Ltd. (a) | | | 1,403,646 | | | | 4,178,457 | |
| Total Australia | | | | | | | 12,304,196 | |
| | | | | | | | | |
| Brazil - 2.0% | | | | | | | | |
| Hotels, Restaurants & Leisure - 2.0% (d) | | | | | | | | |
| CVC Brasil Operadora e Agencia de Viagens SA (a) | | | 4,112,231 | | | | 2,102,522 | |
| | | | | | | | | |
| Cayman Islands - 9.2% | | | | | | | | |
| Hotels, Restaurants & Leisure - 9.2% (d) | | | | | | | | |
| Tongcheng Travel Holdings, Ltd. (a) | | | 1,953,825 | | | | 4,291,407 | |
| Trip.com Group, Ltd. - ADR (a) | | | 111,426 | | | | 3,896,567 | |
| Tuniu Corp. - ADR (a)(f) | | | 1,130,273 | | | | 1,356,328 | |
| Total Hotels, Restaurants & Leisure | | | | | | | 9,544,302 | |
| | | | | | | | | |
| China - 4.1% | | | | | | | | |
| Hotels, Restaurants & Leisure - 4.1% (d) | | | | | | | | |
| TravelSky Technology, Ltd. - Class H | | | 2,442,977 | | | | 4,236,475 | |
| | | | | | | | | |
| Japan - 2.3% | | | | | | | | |
| Hotels, Restaurants & Leisure - 2.3% (d) | | | | | | | | |
| Adventure, Inc. (b) | | | 14,238 | | | | 493,528 | |
| Airtrip Corp. | | | 95,234 | | | | 1,354,204 | |
| Open Door, Inc. (a)(b) | | | 88,731 | | | | 512,412 | |
| Temairazu, Inc. | | | 100 | | | | 1,687 | |
| Veltra Corp. (a) | | | 100 | | | | 307 | |
| Total Hotels, Restaurants & Leisure | | | | | | | 2,362,138 | |
| | | | | | | | | |
| Mauritius - 4.3% | | | | | | | | |
| Hotels, Restaurants & Leisure - 4.3% (d) | | | | | | | | |
| MakeMyTrip, Ltd. (a) | | | 110,444 | | | | 4,475,191 | |
| Netherlands - 2.0% | | | | | | | | |
| Hotels, Restaurants & Leisure - 1.3% (d) | | | | | | | | |
| Lastminute.com NV (a) | | | 52,133 | | | | 1,335,575 | |
| Interactive Media & Services - 0.7% | | | | | | | | |
| Trivago NV - ADR (a) | | | 688,890 | | | | 723,335 | |
| Total Netherlands | | | | | | | 2,058,910 | |
| | | | | | | | | |
| New Zealand - 2.2% | | | | | | | | |
| Software - 2.2% | | | | | | | | |
| Serko, Ltd. (a)(f) | | | 868,113 | | | | 2,237,311 | |
The accompanying notes are an integral part of these financial statements.
ETFMG TM ETFs
ETFMG Travel Tech ETF
Schedule of Investments
September 30, 2023 (Continued)
| | | Shares | | | Value | |
| Republic of Korea - 3.4% | | | | | | | | |
| Hotels, Restaurants & Leisure - 3.4% (d) | | | | | | | | |
| Hana Tour Service, Inc. (a) | | | 103,898 | | | $ | 3,584,150 | |
| | | | | | | | | |
| Spain - 7.7% | | | | | | | | |
| Hotels, Restaurants & Leisure - 7.7% (d) | | | | | | | | |
| Amadeus IT Group SA | | | 63,756 | | | | 3,861,018 | |
| eDreams ODIGEO SA (a) | | | 611,473 | | | | 4,169,795 | |
| | | | | | | | 8,030,813 | |
| United Kingdom - 10.6% | | | | | | | | |
| Hotels, Restaurants & Leisure - 8.1% (d) | | | | | | | | |
| Hostelworld Group PLC (a)(e)(f) | | | 925,851 | | | | 1,434,640 | |
| On the Beach Group PLC (a)(e) | | | 1,457,979 | | | | 1,882,067 | |
| Trainline PLC (a)(e) | | | 1,486,120 | | | | 5,062,527 | |
| Total Hotels, Restaurants & Leisure | | | | | | | 8,379,234 | |
| Software - 2.5% | | | | | | | | |
| accesso Technology Group PLC (a) | | | 350,297 | | | | 2,654,154 | |
| Total United Kingdom | | | | | | | 11,033,388 | |
| | | | | | | | | |
| United States - 36.6% | | | | | | | | |
| Ground Transportation - 8.4% | | | | | | | | |
| Lyft, Inc. - Class A (a) | | | 371,832 | | | | 3,919,109 | |
| Uber Technologies, Inc. (a) | | | 104,334 | | | | 4,798,321 | |
| Total Ground Transportation | | | | | | | 8,717,430 | |
| Hotels, Restaurants & Leisure - 22.1% (d) | | | | | | | | |
| Airbnb, Inc. - Class A (a)(b) | | | 37,459 | | | | 5,139,749 | |
| Booking Holdings, Inc. (a) | | | 1,587 | | | | 4,894,229 | |
| Expedia Group, Inc. (a)(b) | | | 45,463 | | | | 4,685,871 | |
| Global Business Travel Group I (a)(b) | | | 581,573 | | | | 3,198,652 | |
| Mondee Holdings, Inc. (a)(b) | | | 311,226 | | | | 1,111,077 | |
| Sabre Corp. (a) | | | 876,036 | | | | 3,933,402 | |
| Total Hotels, Restaurants & Leisure | | | | | | | 22,962,980 | |
| Interactive Media & Services - 4.6% | | | | | | | | |
| TripAdvisor, Inc. (a) | | | 289,886 | | | | 4,806,309 | |
| Passenger Airlines - 1.5% | | | | | | | | |
| Blade Air Mobility, Inc. (a)(b) | | | 603,953 | | | | 1,564,238 | |
| Total United States | | | | | | | 38,050,957 | |
| | | | | | | | | |
| Virgin Islands (UK) - 3.7% | | | | | | | | |
| Hotels, Restaurants & Leisure - 3.7% (d) | | | | | | | | |
| Despegar.com Corp. (a)(b) | | | 524,870 | | | | 3,805,308 | |
| TOTAL COMMON STOCKS (Cost $144,416,591) | | | | | | | 103,825,661 | |
The accompanying notes are an integral part of these financial statements.
ETFMG TM ETFs
ETFMG Travel Tech ETF
Schedule of Investments
September 30, 2023 (Continued)
| | | Shares | | | Value | |
| | | | | | | | | |
| INVESTMENTS PURCHASED WITH PROCEEDS FROM SECURITIES LENDING COLLATERAL - 7.5% | | | | | | | | |
| Mount Vernon Liquid Assets Portfolio, LLC, 5.50% (c) | | | 7,828,377 | | | $ | 7,828,377 | |
| TOTAL INVESTMENTS PURCHASED WITH PROCEEDS FROM SECURITIES LENDING COLLATERAL (Cost $7,828,377) | | | | | | | 7,828,377 | |
| | | | | | | | | |
| SHORT-TERM INVESTMENTS - 0.1% | | | | | | | | |
| Money Market Funds - 0.1% | | | | | | | | |
| First American Government Obligations Fund - Class X, 5.26% (c) | | | 83,577 | | | | 83,577 | |
| TOTAL SHORT-TERM INVESTMENTS (Cost $83,577) | | | | | | | 83,577 | |
| | | | | | | | | |
| Total Investments (Cost $152,328,545) - 107.5% | | | | | | | 111,737,615 | |
| Liabilities in Excess of Other Assets - (7.5)% | | | | | | | (7,808,859 | ) |
| TOTAL NET ASSETS - 100.0% | | | | | | $ | 103,928,756 | |
Percentages are stated as a percent of net assets.
| ADR | American Depositary Receipt |
| PLC | Public Limited Company |
| (a) | Non-income producing security. |
| (b) | This security or a portion of this security was out on loan at September 30, 2023. |
| (c) | The rate shown is the annualized seven-day yield at period end. |
| (d) | As of September 30, 2023, the Fund had a significant portion of its assets in the Hotels, Restaurants & Leisure Industry. |
| (e) | Security exempt from registration pursuant to Rule 144A under the Securities Act of 1933, as amended. This security may be resold in transitions exempt from registration to qualified institutional investors. At September 30, 2023, the market value of these securities total $8,379,234, which represents 8.06% of total net assets. |
| (f) | This security has been deemed illiquid according to the Fund’s liquidity guidelines. The value of these securities total $5,028,279, which represents 4.84% of total net assets. |
The Global Industry Classification Standard (GICS®) was developed by and/or is the exclusive property of MSCI, Inc. and Standard & Poor’s Financial Services LLC (“S&P”). GICS is a service mark of MSCI and S&P and has been licensed for use by U.S. Bancorp Fund Services, LLC, doing business as U.S. Bank Global Fund Services (“Fund Services”).
The accompanying notes are an integral part of these financial statements.
ETFMG TM ETFs
STATEMENTS OF ASSETS AND LIABILITIES
As of September 30, 2023
| | | ETFMG
Travel Tech
ETF | |
| ASSETS | | | | |
| Investments in securities, at value* | | $ | 111,737,615 | |
| Foreign currency, at value* | | | 275 | |
| Receivables: | | | | |
| Dividends and interest receivable | | | 73,852 | |
| Securities lending income receivable | | | 11,351 | |
| Total assets | | | 111,823,093 | |
| | | | | |
| LIABILITIES | | | | |
| Collateral received for securities loaned (Note 7) | | | 7,828,377 | |
| Payables: | | | | |
| Management fees payable | | | 65,960 | |
| Total liabilities | | | 7,894,337 | |
| Net Assets | | $ | 103,928,756 | |
| | | | | |
| NET ASSETS CONSIST OF: | | | | |
| Paid-in Capital | | $ | 266,299,121 | |
| Total Distributable Earnings (Accumulated Losses) | | | (162,370,365 | ) |
| Net Assets | | $ | 103,928,756 | |
| * Identified Cost: | | | | |
| Investments in securities | | $ | 152,328,545 | |
| Foreign currency | | | 279 | |
| | | | | |
| Shares Outstanding^ | | | 6,150,000 | |
| | | | | |
| Net Asset Value, Offering and Redemption Price per Share | | $ | 16.90 | |
| ^ | No par value, unlimited number of shares authorized |
The accompanying notes are an integral part of these financial statements.
ETFMG TM ETFs
STATEMENTS OF OPERATIONS
For the Year Ended September 30, 2023
| | | ETFMG
Travel Tech
ETF | |
| INVESTMENT INCOME | | | | |
| Income: | | | | |
| Dividends from unaffiliated securities (net of foreign withholdings tax & issuance fees of $98,463) | | $ | 3,418 | |
| Dividends from affiliated securities | | | 46,136 | |
| Interest | | | 74,735 | |
| Securities lending income | | | 224,503 | |
| Total Investment Income | | | 348,792 | |
| | | | | |
| Expenses: | | | | |
| Management fees | | | 1,004,223 | |
| Total Expenses | | | 1,004,223 | |
| Net Investment Loss | | | (655,431 | ) |
| | | | | |
| REALIZED & UNREALIZED GAIN (LOSS) ON INVESTMENTS | | | | |
| Net Realized Gain (Loss) on: | | | | |
| Unaffiliated Investments | | | (54,081,286 | ) |
| Affiliated Investments | | | (30,773 | ) |
| In-Kind redemptions | | | (2,241,788 | ) |
| Foreign currency and foreign currency translation | | | (62,916 | ) |
| Net Realized Loss on Investments and In-Kind redemptions | | | (56,416,763 | ) |
| Net Change in Unrealized Appreciation (Depreciation) of: | | | | |
| Unaffiliated Investments | | | 67,349,675 | |
| Affiliated Investments | | | 41,588 | |
| Foreign currency and foreign currency translation | | | 708 | |
| Net Change in Unrealized Appreciation (Depreciation) of Investments | | | 67,391,971 | |
| Net Realized and Unrealized Gain on Investments | | | 10,975,208 | |
| NET INCREASE IN NET ASSETS RESULTING FROM OPERATIONS | | $ | 10,319,777 | |
The accompanying notes are an integral part of these financial statements.
ETFMG TM ETFs
ETFMG Travel Tech ETF
STATEMENTS OF CHANGES IN NET ASSETS
| | | Year Ended
September 30,
2023 | | | Year Ended
September 30,
2022 | |
| OPERATIONS | | | | | | | | |
| Net investment loss | | $ | (655,431 | ) | | $ | (1,193,922 | ) |
| Net realized loss on investments and in-kind redemptions | | | (56,416,763 | ) | | | (66,361,866 | ) |
| Net change in unrealized appreciation (depreciation) of investments and foreign currency and foreign currency translation | | | 67,391,971 | | | | (84,948,016 | ) |
| Net increase (decrease) in net assets resulting from operations | | | 10,319,777 | | | | (152,503,804 | ) |
| | | | | | | | | |
| CAPITAL SHARE TRANSACTIONS | | | | | | | | |
| Net decrease in net assets derived from net change in outstanding shares | | | (53,125,815 | ) | | | (22,901,445 | ) |
| Transaction Fees (See Note 1) | | | 16,484 | | | | 166,376 | |
| Net decrease in net assets from capital share transactions | | | (53,109,331 | ) | | | (22,735,069 | ) |
| Total decrease in net assets | | | (42,789,554 | ) | | | (175,238,873 | ) |
| | | | | | | | | |
| NET ASSETS | | | | | | | | |
| Beginning of Year | | | 146,718,310 | | | | 321,957,183 | |
| End of Year | | $ | 103,928,756 | | | $ | 146,718,310 | |
Summary of share transactions is as follows:
| | | Year Ended
September 30, 2023 | | | Year Ended
September 30, 2022 | |
| | | Shares | | | Amount | | | Shares | | | Amount | |
| Shares Sold | | | — | | | $ | — | | | | 4,800,000 | | | $ | 123,600,780 | |
| Transaction Fees (See Note 1) | | | — | | | | 16,484 | | | | — | | | | 166,376 | |
| Shares Redeemed | | | (3,100,000 | ) | | | (53,125,815 | ) | | | (6,900,000 | ) | | | (146,502,225 | ) |
| Net Transactions in Fund Shares | | | (3,100,000 | ) | | $ | (53,109,331 | ) | | | (2,100,000 | ) | | $ | (22,735,069 | ) |
| Beginning Shares | | | 9,250,000 | | | | | | | | 11,350,000 | | | | | |
| Ending Shares | | | 6,150,000 | | | | | | | | 9,250,000 | | | | | |
The accompanying notes are an integral part of these financial statements.
ETFMG TM ETFs
ETFMG Travel Tech ETF
FINANCIAL HIGHLIGHTS
For a capital share outstanding throughout each year/period
| | | Year Ended
September 30,
2023 | | | Year Ended
September 30,
2022 | | | Year Ended
September 30,
2021 | | | Period Ended
September 30,
20201 | |
| | | | | | | | | | | | | | | | | |
| Net Asset Value, Beginning Year/Period | | $ | 15.86 | | | $ | 28.37 | | | $ | 18.88 | | | $ | 25.00 | |
| Income (Loss) from Investment | | | | | | | | | | | | | | | | |
| Operations: | | | | | | | | | | | | | | | | |
| Net investment loss2 | | | (0.08 | ) | | | (0.10 | ) | | | (0.13 | ) | | | (0.02 | ) |
| Net realized and unrealized gain (loss) on investments | | | 1.12 | | | | (12.42 | ) | | | 9.60 | | | | (6.12 | ) |
| Total from investment operations | | | 1.04 | | | | (12.52 | ) | | | 9.47 | | | | (6.14 | ) |
| Less Distributions: | | | | | | | | | | | | | | | | |
| Distributions from net investment income | | | — | | | | — | | | | (0.01 | ) | | | — | |
| Total distributions | | | — | | | | — | | | | (0.01 | ) | | | — | |
| Capital Shares Transactions: | | | | | | | | | | | | | | | | |
| Transaction fees added to paid-in capital | | | 0.00 | 6 | | | 0.01 | | | | 0.03 | | | | 0.02 | |
| Net asset value, end year/period | | $ | 16.90 | | | $ | 15.86 | | | $ | 28.37 | | | $ | 18.88 | |
| Total Return | | | 6.54 | % | | | (44.08 | )% | | | 50.35 | % | | | (24.50 | )%3 |
| | | | | | | | | | | | | | | | | |
| Ratios/Supplemental Data: | | | | | | | | | | | | | | | | |
| Net assets at end year/period (000’s) | | $ | 103,929 | | | $ | 146,718 | | | $ | 321,957 | | | $ | 15,100 | |
| | | | | | | | | | | | | | | | | |
| Expenses to Average Net Assets | | | 0.75 | % | | | 0.76 | %5 | | | 0.75 | % | | | 0.75 | %4 |
| Net Investment Income (Loss) to Average | | | | | | | | | | | | | | | | |
| Net Assets | | | (0.49 | )% | | | (0.47 | )% | | | (0.43 | )% | | | 0.30 | %4 |
| Portfolio Turnover Rate | | | 48 | % | | | 40 | % | | | 57 | % | | | 49 | %3 |
| 1 | Commencement of operations on February 12, 2020. |
| 2 | Calculated based on average shares outstanding during the year/period. |
| 5 | Includes 0.01% of dividend and interest expense. |
| 6 | Amount is less than $0.005 per share. |
The accompanying notes are an integral part of these financial statements.
ETFMG TM ETFs
NOTES TO FINANCIAL STATEMENTS
September 30, 2023
NOTE 1 – ORGANIZATION
ETFMG Travel Tech ETF (“AWAY”) (the “Fund”) is a series of ETF Managers Trust (the “Trust”), an open-end management investment company consisting of multiple investment series, organized as a Delaware statutory trust on July 1, 2009. The Trust is registered with the SEC under the Investment Company Act of 1940, as amended (the “1940 Act”), as an open-end management investment company and the offering of the Fund’s shares (“Shares”) is registered under the Securities Act of 1933, as amended (the “Securities Act”).
The following table is a summary of the Strategy Commencement Date and Strategy of the Fund:
| Fund Ticker | | Strategy
Commencement
Date | | Strategy |
| ETFMG Travel Tech ETF | | 2/12/2020 | | Seeks to provide investment results that, before fees and expenses, correspond generally to the total return performance of the Prime Travel Technology Index NTR (the “Index”). |
The Fund currently offers one class of shares, which have no front end sales load, no deferred sales charges, and no redemption fees. The Fund may issue an unlimited number of shares of beneficial interest, with no par value. All shares of the Fund have equal rights and privileges.
Shares of the Fund are listed and traded on the NYSE Arca, Inc. Market prices for the shares may be different from their net asset value (“NAV”). The Fund issues and redeems shares on a continuous basis at NAV only in blocks of 50,000 shares, called “Creation Units.” Creation Units are issued and redeemed principally in-kind for securities included in a specified Index. Once created, shares generally trade in the secondary market at market prices that change throughout the day in quantities less than a Creation Unit. Except when aggregated in Creation Units, shares are not redeemable securities of the Fund. Shares of the Fund may only be purchased or redeemed by certain financial institutions (“Authorized Participants”). An Authorized Participant is either (i) a broker-dealer or other participant in the clearing process through the Continuous Net Settlement System of the National Securities Clearing Corporation or (ii) a DTC participant and, in each case, must have executed a Participant Agreement with the Distributor. Most retail investors do not qualify as Authorized Participants nor have the resources to buy and sell whole Creation Units. Therefore, they are unable to purchase or redeem the shares directly from the Fund. Rather, most retail investors may purchase Shares in the secondary market with the assistance of a broker and may be subject to customary brokerage commissions or fees.
Authorized Participants transacting in Creation Units for cash may pay an additional variable charge to compensate the relevant Fund for certain transaction costs (i.e., brokerage costs) and market impact expenses relating to investing in portfolio securities. Such variable charges, if any, are included in Transaction Fees” in the Statements of Changes in Net Assets.
NOTE 2 – SIGNIFICANT ACCOUNTING POLICIES
The following is a summary of significant accounting policies consistently followed by the Fund. These policies are in conformity with accounting principles generally accepted in the United States of America (“U.S. GAAP”).
ETFMG TM ETFs
NOTES TO FINANCIAL STATEMENTS
September 30, 2023 (Continued)
The Fund follows the investment company accounting and reporting guidance of the Financial Accounting Standards Board Accounting Standard Codification Topic 946 Financial Services – Investment Companies.
The Fund may invest in certain other investment companies (underlying funds). For more information about the underlying Fund’s operations and policies, please refer to those Fund’s semiannual and annual reports, which are filed with the SEC.
| A. | Security Valuation. Securities listed on a securities exchange, market or automated quotation system for which quotations are readily available (except for securities traded on NASDAQ), including securities traded over the counter, are valued at the last quoted sale price on the primary exchange or market (foreign or domestic) on which they are traded on the valuation date (or at approximately 4:00 pm Eastern Time if a security’s primary exchange is normally open at that time), or, if there is no such reported sale on the valuation date, at the most recent quoted bid price. For securities traded on NASDAQ, the NASDAQ Official Closing Price will be used. |
Securities for which quotations are not readily available are valued at their respective fair values as determined in good faith by ETF Managers Group, LLC (the “Adviser”), using procedures adopted by the Board of Trustees (the “Board”). When a security is “fair valued,” consideration is given to the facts and circumstances relevant to the particular situation, including a review of various factors set forth in the pricing procedures adopted by the Fund’s Board. The use of fair value pricing by the Fund may cause the net asset value of its shares to differ significantly from the net asset value that would be calculated without regard to such considerations. As of September 30, 2023, the Fund did not hold any securities that were fair valued.
As described above, the Fund utilizes various methods to measure the fair value of its investments on a recurring basis. U.S. GAAP establishes a hierarchy that prioritizes inputs to valuation methods. The three levels of inputs are:
| Level 1 | Unadjusted quoted prices in active markets for identical assets or liabilities that the Fund has the ability to access. |
| Level 2 | Observable inputs other than quoted prices included in Level 1 that are observable for the asset or liability, either directly or indirectly. These inputs may include quoted prices for the identical instrument on an inactive market, prices for similar instruments, interest rates, prepayment speeds, credit risk, yield curves, default rates and similar data. |
| Level 3 | Unobservable inputs for the asset or liability, to the extent relevant observable inputs are not available; representing the Fund’s own assumptions about the assumptions a market participant would use in valuing the asset or liability, and would be based on the best information available. |
The availability of observable inputs can vary from security to security and is affected by a wide variety of factors, including, for example, the type of security, whether the security is new and not yet established in the marketplace, the liquidity of markets, and other characteristics particular to the security. To the extent that valuation is based on models or inputs that are less observable or unobservable in the market, the determination of fair value requires more judgment. Accordingly, the degree of judgment exercised in determining fair value is greatest for instruments categorized in Level 3.
ETFMG TM ETFs
NOTES TO FINANCIAL STATEMENTS
September 30, 2023 (Continued)
The inputs used to measure fair value may fall into different levels of the fair value hierarchy. In such cases, for disclosure purposes, the level in the fair value hierarchy within which the fair value measurement falls in its entirety, is determined based on the lowest level input that is significant to the fair value measurement in its entirety.
The following is a summary of the inputs used to value the Fund’s net assets as of September 30, 2023:
ETFMG Travel Tech ETF
| Assets^ | | Level 1 | | | Level 2 | | | Level 3 | | | Total | |
| Common Stocks | | $ | 103,825,661 | | | $ | — | | | $ | — | | | $ | 103,825,661 | |
| Short-Term Investments | | | 83,577 | | | | — | | | | — | | | | 83,577 | |
| Investments Purchased with Securities Lending Collateral* | | | — | | | | — | | | | — | | | | 7,828,377 | |
| Total Investments in Securities | | $ | 103,909,238 | | | $ | — | | | $ | — | | | $ | 111,737,615 | |
| ^ | See Schedule of Investments for classifications by country and industry. |
| * | Certain investments that are measured at fair value used the net asset value per share (or its equivalent) practical expedient have not been categorized in the fair value hierarchy. The fair value amounts presented in the table are intended to permit reconciliation of the fair value hierarchy to the amounts presented in the Schedules of Investments. |
| B. | Federal Income Taxes. The Fund has elected to be taxed as a “regulated investment company” and intends to distribute substantially all taxable income to shareholders and otherwise comply with the provisions of the Internal Revenue Code applicable to regulated investment companies. Therefore, no provisions for federal income taxes or excise taxes have been made. |
To avoid imposition of the excise tax applicable to regulated investment companies, the Fund intends to declare each year as dividends, in each calendar year, at least 98.0% of its net investment income (earned during the calendar year) and 98.2% of its net realized capital gains (earned during the twelve months ended October 31) plus undistributed amounts, if any, from prior years.
Net capital losses incurred after October 31, within the taxable year are deemed to arise on the first business day of the Fund’s next taxable year.
The Fund recognizes the tax benefits of uncertain tax positions only where the position is “more likely than not” to be sustained assuming examination by tax authorities. The Fund has analyzed its tax position and has concluded that no liability for unrecognized tax benefits should be recorded related to uncertain tax positions expected to be taken in the Fund’s 2023 tax returns. The Fund identifies its major tax jurisdictions as U.S. Federal, the State of New Jersey, and the State of Delaware; however the Fund is not aware of any tax positions for which it is reasonably possible that the total amounts of unrecognized tax benefits will change materially in the next twelve months.
As of September 30, 2023, management has reviewed the tax positions for open periods (for Federal purposes, three years from the date of filing and for state purposes, generally a range of three to four years from the date of filing), as applicable to the Fund, and has determined that no provision for income tax is required in the Fund’s financial statements.
| C. | Security Transactions and Investment Income. Investment securities transactions are accounted for on the trade date. Gains and losses realized on sales of securities are determined on a specific identification basis. Discounts/premiums on debt securities purchased are accreted/amortized over the life of the respective securities using the effective interest method. Dividend income is recorded on the ex-dividend date. Interest income is recorded on an accrual basis. Income, including gains, from investments in foreign securities received by the Fund may be subject to income, withholding or other taxes imposed by foreign countries. |
ETFMG TM ETFs
NOTES TO FINANCIAL STATEMENTS
September 30, 2023 (Continued)
| D. | Foreign Currency Translations and Transactions. The Fund may engage in foreign currency transactions. Foreign currency transactions are translated into U.S. dollars on the following basis: (i) market value of investment securities, assets and liabilities at the daily rates of exchange, and (ii) purchases and sales of investment securities, dividend and interest income and certain expenses at the rates of exchange prevailing on the respective dates of such transactions. For financial reporting purposes, the Fund does not isolate changes in the exchange rate of investment securities from the fluctuations arising from changes in the market prices of securities for unrealized gains and losses. However, for federal income tax purposes, the Fund does isolate and treat as ordinary income the effect of changes in foreign exchange rates on realized gains or losses from the sale of investment securities and payables and receivables arising from trade-date and settlement-date differences. |
| E. | Distributions to Shareholders. Distributions to shareholders from net investment income are generally declared and paid by the Fund on a quarterly basis. Distributions to shareholders from realized gains on securities for the Fund normally are declared and paid on an annual basis. Distributions are recorded on the ex-dividend date. |
| F. | Use of Estimates. The preparation of financial statements in conformity with U.S. GAAP requires management to make estimates and assumptions that affect the reported amounts of assets and liabilities at the date of the financial statements, as well as the reported amounts of revenues and expenses during the reporting period. Actual results could differ from those estimates. |
| G. | Share Valuation. The net asset value (“NAV”) per share of the Fund is calculated by dividing the sum of the value of the securities held by the Fund, plus cash and other assets, minus all liabilities (including estimated accrued expenses) by the total number of shares outstanding for the Fund, rounded to the nearest cent. The Fund’s shares will not be priced on the days on which the NYSE is closed for trading. For Authorized Participants, the offering and redemption price per share for the Fund are equal to the Fund’s respective net asset value per share. |
| H. | Guarantees and Indemnifications. In the normal course of business, the Fund enters into contracts with service providers that contain general indemnification clauses. The Fund’s maximum exposure under these arrangements is unknown as this would involve future claims that may be made against the Fund that have not yet occurred. However, based on experience, the Fund expects the risk of loss to be remote. |
NOTE 3 – RISK FACTORS
Investing in the Fund may involve certain risks, as discussed in the Fund’s prospectus, including, but not limited to, those described below. Any of these risks could cause an investor to lose money.
Market Risk. Financial markets rise and fall in response to a variety of factors, sometimes rapidly and unpredictably. As with any investment whose performance is tied to these markets, the value of an investment in the Fund will fluctuate, which means that an investor could lose money over short or long periods.
Investment Style Risk. The Fund is not actively managed (“Index Fund”). Therefore, the Fund follows the securities included in its index during upturns as well as downturns. Because of the indexing strategies, the Index Fund does not take steps to reduce market exposure or to lessen the effects of a declining market. In addition, because of the Index Fund’s expenses, the Index Fund’s performance may be below that of its respective index.
Equity Risk. The prices of equity securities rise and fall daily. These price movements may result from factors affecting individual companies, industries or the securities market as a whole. In addition, equity markets tend to move in cycles which may cause stock prices to fall over short or extended periods of time.
Securities Lending Risk. Securities lending involves the risk of loss of rights in, or delay in recovery of, the loaned securities if the borrower fails to return the security loaned or becomes insolvent.
ETFMG TM ETFs
NOTES TO FINANCIAL STATEMENTS
September 30, 2023 (Continued)
Concentration Risk. To the extent that the Fund’s or an index’s portfolio is concentrated in the securities of issuers in a particular market, industry, group of industries, sector or asset class, the Fund may be adversely affected by the performance of those securities, may be subject to increased price volatility and may be more vulnerable to adverse economic, market, political or regulatory occurrences affecting that market, industry, group of industries, sector or asset class.
Natural Disaster/Epidemic Risk. Natural or environmental disasters, such as earthquakes, fires, floods, hurricanes, tsunamis and other severe weather-related phenomena generally, and widespread disease, including pandemics and epidemics (for example, the novel coronavirus COVID-19), have been and can be highly disruptive to economies and markets and have recently led, and may continue to lead, to increased market volatility and significant market losses. Such natural disaster and health crises could exacerbate political, social, and economic risks previously mentioned, and result in significant breakdowns, delays, shutdowns, social isolation, and other disruptions to important global, local and regional supply chains affected, with potential corresponding results on the operating performance of the Fund and its investments. A climate of uncertainty and panic, including the contagion of infectious viruses or diseases, may adversely affect lobal, regional, and local economies and reduce the availability of potential investment opportunities, and increases the difficulty of performing due diligence and modeling market conditions, potentially reducing the accuracy of financial projections. Under the circumstances, the Fund may have difficulty achieving its investment objectives which may adversely impact performance. Further, such events can be highly disruptive to economies and markets, significantly disrupt the operations of individual companies (including, but not limited to, the Fund’s Sponsor and third party service providers), sectors, industries, markets, securities and commodity exchanges, currencies, interest and inflation rates, credit ratings, investor sentiment, and other factors affecting the value of the Fund’s investments. These factors can cause substantial market volatility. exchange trading suspensions and closures and can impact the ability of the Fund to complete redemptions and otherwise affect Fund performance and Fund trading in the secondary market. A widespread crisis may also affect the global economy in ways that cannot necessarily be foreseen at the current time. How long such events will last and whether they will continue or recur cannot be predicted. Impacts from these events could have significant impact on the Fund’s performance, resulting in losses to the Fund.
Daily Index Correlation/Tracking Risk. There is no guarantee that the Fund will achieve a high degree of correlation to the Index and therefore achieve its daily leveraged investment objective. To achieve a high degree of correlation with the Index, the Fund seeks to rebalance its portfolio daily to keep leverage consistent with its daily leveraged investment objective. In addition, the Fund’s exposure to the Index is impacted by the Index’s movement. Because of this, it is unlikely that the Fund will be perfectly exposed to the Index at the end of each day. The possibility of the Fund being materially over- or under -exposed to the Index increases on days when the Index is volatile near the close of the trading day. Market disruptions, regulatory restrictions and extreme volatility will also adversely affect the Fund’s ability to adjust exposure to the required levels.
On February 24, 2022, Russia commenced a military attack on Ukraine. The outbreak of hostilities between the two countries could result in more widespread conflict and could have a severe adverse effect on the region and the markets. In addition, sanctions imposed on Russia by the United States and other countries, and any sanctions imposed in the future could have a significant adverse impact on the Russian economy and related markets.
On October 7, 2023, Hamas launched a significant attack on Israel from the Gaza Strip. The extent and duration of the Israel-Hamas war and any related economic and market impacts are impossible to predict but may be significant and may negatively impact Israel’s economy. The price and liquidity of investments may fluctuate widely as a result of these conflicts and related events. How long such conflicts and related events will last, and whether either may escalate further, cannot be predicted, however such conflicts may negatively impact issuers of securities in which the Fund invests.
ETFMG TM ETFs
NOTES TO FINANCIAL STATEMENTS
September 30, 2023 (Continued)
A complete description of the principal risks is included in the Fund’s prospectus under the heading “Principal Investment Risks.”
NOTE 4 – MANAGEMENT AND OTHER CONTRACTS
The Adviser serves as the investment advisor to the Fund. Pursuant to an Investment Advisory Agreement (“Advisory Agreement”) between the Trust, on behalf of the Fund, and the Adviser, the Adviser provides investment advice to the Fund and oversees the day-to-day operations of the Fund, subject to the direction and control of the Board and the officers of the Trust. Under the Advisory Agreement, the Adviser is also responsible for arranging transfer agency, custody, fund administration and accounting, and other non-distribution related services necessary for the Fund to operate.
Under the Investment Advisory Agreement, the Adviser has overall responsibility for the general management and administration of the Fund and arranges for sub-advisory, transfer agency, custody, fund administration, securities lending, and all other non-distribution related services necessary for the Fund to operate. The Fund’s unitary fees are accrued daily and paid monthly. The Adviser bears the costs of all advisory and non-advisory services required to operate the Fund, in exchange for a single unitary fee at the following annual rate:
| ETFMG Travel Tech ETF | | | 0.75 | % |
Under the Investment Advisory Agreement, the Adviser has agreed to pay all expenses of the Fund, except for: the fee paid to the Adviser pursuant to the Investment Advisory Agreement, interest charges on any borrowings, taxes, brokerage commissions and other expenses incurred in placing orders for the purchase and sale of securities and other investment instruments, acquired fund fees and expenses, accrued deferred tax liability, extraordinary expenses, and distribution (12b-1) fees and expenses (collectively, “Excluded Expenses”). The Adviser has entered into an agreement with Foreside Fund Services LLC to serve as distributor to the Fund (the “Distributor”). The Distributor provides marketing support for the Fund, including distributing marketing materials related to the Fund. Level ETF Ventures, LLC (“Level”) serves as the index provider for the Fund. Level is not affiliated with the Trust or the Adviser.
U.S. Bancorp Fund Services, LLC doing business as U.S. Bank Global Fund Services (the “Administrator”) provides fund accounting, fund administration, and transfer agency services to the Fund. The Adviser compensates the Administrator for these services under an administration agreement between the two parties.
The Adviser pays each independent Trustee a quarterly fee for service to the Fund. Each Trustee is also reimbursed by the Adviser for all reasonable out-of-pocket expenses incurred in connection with his duties as Trustee, including travel and related expenses incurred in attending Board meetings.
NOTE 5 – DISTRIBUTION PLAN
The Fund has adopted a Plan of Distribution pursuant to Rule 12b-1 under the 1940 Act. Under the Plan, the Fund may pay compensation to the Distributor or any other distributor or financial institution with which the Trust has an agreement with respect to the Fund, with the amount of such compensation not to exceed an annual rate of 0.25% of the Fund’s average daily net assets. During the year ended September 30, 2023, the Fund did not incur any 12b-1 expenses.
ETFMG TM ETFs
NOTES TO FINANCIAL STATEMENTS
September 30, 2023 (Continued)
NOTE 6 - PURCHASES AND SALES OF SECURITIES
The costs of purchases and sales of securities, excluding short-term securities and in-kind transactions, during the year ended September 30, 2023:
| | | Purchases | | | Sales | |
| ETFMG Travel Tech ETF | | $ | 63,360,183 | | | $ | 68,766,321 | |
The costs of purchases and sales of in-kind transactions associated with creations and redemptions during the year ended September 30, 2023:
| | | Purchases In-Kind | | | Sales In-Kind | |
| ETFMG Travel Tech ETF | | $ | — | | | $ | 48,384,168 | |
Purchases in-kind are the aggregate of all in-kind purchases and sales in-kind are the aggregate of all in-kind sales. Net capital gains or losses resulting from in-kind redemptions are excluded from the Fund’s determination of taxable gains and are not distributed to shareholders.
There were no purchases or sales of U.S. Government obligations during the year ended September 30, 2023.
NOTE 7 — SECURITIES LENDING
The Fund may lend up to 33 1⁄3% of the value of the securities in its portfolio to brokers, dealers and financial institutions (but not individuals) under terms of participation in a securities lending program administered by U.S. Bank N.A. (the “Custodian”). The securities lending agreement requires that loans are collateralized at all times in an amount equal to at least 102% of the value of any loaned securities at the time of the loan, plus accrued interest. The Fund receives compensation in the form of fees and earn interest on the cash collateral. The amount of fees depends on a number of factors including the type of security and length of the loan. The Fund continues to receive interest payments or dividends on the securities loaned during the borrowing period. Gain or loss on the fair value of securities loaned that may occur during the term of the loan will be for the account of the Fund. The Fund has the right under the terms of the securities lending agreement to recall the securities from the borrower on demand. The cash collateral is invested by the Custodian in accordance with approved investment guidelines. Those guidelines require the cash collateral to be invested in readily marketable, high quality, short-term obligations, either directly on behalf of the Fund or through one or more joint accounts, money market funds, or short-term bond funds, including those advised by or affiliated with the Adviser; however, all such investments are subject to risk of payment delays or default on the part of the issuer or counterparty or otherwise may not generate sufficient interest to support the costs associated with securities lending. Other investment companies in which the Fund may invest cash collateral can be expected to incur fees and expenses for operations, such as investment advisory and administration fees, which would be in addition to those incurred by the Fund, and which may be received in full or in part by the Adviser. Pursuant to guidance issued by the SEC staff, fees and expenses of money market funds used for cash collateral received in connection with loans of securities are not treated as Acquired Fund Fees and Expenses, which reflect the Fund’s pro rata share of the fees and expenses incurred by other investment companies in which the Fund invests (as disclosed in the Prospectus, as applicable). The Fund could also experience delays in recovering its securities and possible loss of income or value if the borrower fails to return the borrowed securities, although the Fund is indemnified from this risk by contract with the securities lending agent.
ETFMG TM ETFs
NOTES TO FINANCIAL STATEMENTS
September 30, 2023 (Continued)
As of September 30, 2023 the value of the securities on loan and payable for collateral due to broker were as follows:
Value of Securities on Loan Collateral Received
| Fund | | Values of
Securities on
Loan | | | Fund
Collateral
Received* | |
| ETFMG Travel Tech ETF | | $ | 7,662,544 | | | $ | 7,828,377 | |
| * | The cash collateral received was invested in the Mount Vernon Liquid Assets Portfolio, a money market fund with an overnight and continuous maturity, as shown on the Schedule of Investments. |
NOTE 8 – FEDERAL INCOME TAXES
The components of distributable earnings (losses) and cost basis of investments for federal income tax purposes at September 30, 2023 were as follows:
| | | Cost | | | Gross
Unrealized
Appreciation | | | Gross
Unrealized
Depreciation | | | Net
Unrealized
Appreciation
(Depreciation) | |
| ETFMG Travel Tech ETF | | $ | 155,549,981 | | | $ | 4,109,815 | | | $ | (47,922,181 | ) | | $ | (43,812,366 | ) |
The components of distributable earnings (losses) and cost basis of investments for federal income tax purposes at September 30, 2023 were as follows:
The difference between the tax cost of investments and the cost of investments for GAAP purposes is primarily due to the tax treatment of wash sale losses.
As of September 30, 2023, the components of distributable earnings (loss) on a tax basis were as follows:
| | | Undistributed
Ordinary
Income | | | Undistributed
Long-Term
Gain | | | Total
Distributable
Earnings | | | Other
Accumulated
Loss | | | Total
Accumulated
Gain (Loss) | |
| ETFMG Travel Tech ETF | | $ | — | | | $ | — | | | $ | — | | | $ | (118,557,999 | ) | | $ | (162,370,365 | ) |
The difference between the tax cost of investments and the cost of investments for GAAP purposes is primarily due to the tax treatment of wash sale losses.
As of September 30, 2023, the Funds had accumulated capital loss carryovers of:
| | | | Capital Loss
Carryforward
ST | | | Capital Loss
Carryforward
LT | | | Expires | |
| ETFMG Travel Tech ETF | | | $ | (55,624,141 | ) | | $ | (62,932,988 | ) | | | Indefinite | |
Under current tax law, capital and currency losses realized after October 31 of a Fund’s fiscal year may be deferred and treated as occurring on the first business day of the following fiscal year for tax purposes. The following Funds had deferred post-October capital and currency losses, which will be treated as arising on the first business day of the year ending September 30, 2023.
| | | Late Year
Ordinary Loss | | | Post-October
Capital Loss | |
| ETFMG Travel Tech ETF | | $ | — | | | $ | — | |
ETFMG TM ETFs
NOTES TO FINANCIAL STATEMENTS
September 30, 2023 (Continued)
U.S. GAAP requires that certain components of net assets relating to permanent differences be reclassified between financial and tax reporting. These reclassifications have no effect on net assets or net asset value per share. For the fiscal year ended September 30, 2023, the following table shows the reclassifications made:
| | | Total
Distributable
Earnings/(Loss) | | | Paid-In
Capital | |
| ETFMG Travel Tech ETF | | $ | 8,681,836 |
| | $ | (8,681,836 | ) |
The tax charter of distributions paid during the year ended September 30, 2023, and the year ended September 30, 2022 were as follows:
| | | Year Ended September 30, 2023 | | | Year Ended September 30, 2022 | |
| | | From
Ordinary
Income | | | From
Capital
Gains | | | From
Ordinary
Income | | | From
Capital
Gains | |
| ETFMG Travel Tech ETF | | $ | — | | | | — | | | $ | — | | | | — | |
NOTE 9 – INVESTMENTS IN AFFILIATES
ETFMG Travel Tech ETF
ETFMG Travel Tech ETF owned the following company during the year ended September 30, 2023. ETFMG Sit Ultra Short ETF was deemed to be an affiliate of the Fund as defined by the 1940 Act during the year ended September 30, 2023. Transactions during the year in this security was as follows:
| Security Name | | Value at September 30, 2022 | | | Purchases | | | Sales | | | Realized
Gain
(Loss)(1) | | | Change in Unrealized Appreciation (Depreciation) | | | Dividend
Income | | | Value at September 30, 2023 | | | Ending
Shares | |
| ETFMG Sit Ultra Short ETF * | | $ | 1,201,875 | | | $ | 14,159 | | | $ | 1,226,849 | | | $ | (30,773 | ) | | $ | 41,588 | | | $ | — | | | $ | — | | | | — | |
| * | No longer an affiliate as of September 30, 2023. |
| 1 | Realized Losses include transactions in affiliated investments and affiliated in-kind redemptions. |
NOTE 10 – LEGAL MATTERS
The Trust, the Adviser, and certain officers and affiliated persons of the Adviser (together with the Adviser, the “Adviser Defendants”) were named as defendants in an action filed December 21, 2021, in the Superior Court of New Jersey, Union County, captioned PureShares, LLC, d/b/a PureFunds et al. v. ETF Managers Group, LLC et al., Docket No. UNN-C-152-21 (the “NJ Action”). The NJ Action asserted breach of contract and other tort claims and sought damages in unspecified amounts and injunctive relief. On May 25, 2022, the court in the NJ Action dismissed with prejudice all claims asserted against the Trust, as well as all contract claims and all except one tort claim asserted against the Adviser Defendants. With respect to the tort claim asserted against the Adviser Defendants, the parties stipulated and agreed to dismiss that claim without prejudice in May 2023.
The Adviser and certain of its affiliates have entered into a settlement agreement with the Securities and Exchange Commission (“SEC”) regarding certain alleged conflicts of interest arising in connection with ETFMG Alternative Harvest ETF’s (MJ) participation in the securities lending program administered by its prior custodian. Without admitting or denying the SEC’s findings, the Adviser and its parent company agreed to censures, to a cease-and-desist order, and to pay, jointly and severally, a civil penalty of $4 million. The settlement resolves the SEC’s investigation of the Adviser and its affiliates.
ETFMG TM ETFs
NOTES TO FINANCIAL STATEMENTS
September 30, 2023 (Continued)
NOTE 11 – SUBSEQUENT EVENTS
In preparing these financial statements, the Fund has evaluated events and transactions for potential recognition or disclosure through the date the financial statements were issued.
The Board of the Trust has approved an Agreement and Plan of Reorganization (the “Agreement”) providing for the reorganization of the Target Fund into corresponding new fund (the “Acquiring Fund”), which is a newly created series of Amplify ETF Trust with similar investment objectives and the same fees and expenses as the corresponding Target Fund. The Reorganization is subject to certain conditions including approval by shareholders of the Target Fund. The following table shows shares of the Acquiring Fund that will be issued to shareholders of the corresponding Target Fund.
| Target Fund | Acquiring Fund |
| ETFMG Travel Tech ETF | Amplify Travel Tech ETF |
The proxy solicitation materials were filed with the SEC on October 13, 2023. The Joint Special Meeting of Shareholders is to be held on December 28, 2023.
Other than as disclosed, there were no other subsequent events requiring recognition or disclosure through the date the financial statements were issued.
ETFMG TM ETFs
Report of Independent Registered Public Accounting Firm
To the Board of Trustees of ETF Managers Trust
and the Shareholders of ETFMG Travel Tech ETF:
Opinion on the Financial Statements
We have audited the accompanying statement of assets and liabilities, including the schedule of investments of ETFMG Travel Tech ETF (the “Fund”) as of September 30, 2023, the related statement of operations for the year then ended, the statements of changes in net assets for each of the two years in the period then ended, the financial highlights for each of the periods indicated therein and the related notes (collectively referred to as the “financial statements”). In our opinion, the financial statements present fairly, in all material respects, the financial position of the Fund as of September 30, 2023, and the results of their operations for the year then ended, the changes in net assets for each of the two years in the period then ended, and the financial highlights for each of the periods indicated therein, in conformity with accounting principles generally accepted in the United States of America.
Basis for Opinion
These financial statements and financial highlights are the responsibility of the Fund’s management. Our responsibility is to express an opinion on these financial statements and financial highlights based on our audits. We are a public accounting firm registered with the Public Company Accounting Oversight Board (United States) (“PCAOB”) and are required to be independent with respect to the Fund in accordance with the U.S. federal securities laws and the applicable rules and regulations of the Securities and Exchange Commission and the PCAOB.
We conducted our audits in accordance with the standards of the PCAOB. Those standards require that we plan and perform the audits to obtain reasonable assurance about whether the financial statements and financial highlights are free of material misstatement, whether due to error or fraud. The Fund is not required to have, nor were we engaged to perform, an audit of their internal control over financial reporting. As part of our audits we are required to obtain an understanding of internal control over financial reporting but not for the purpose of expressing an opinion on the effectiveness of the Fund’s internal control over financial reporting. Accordingly, we express no such opinion.
Our audits included performing procedures to assess the risks of material misstatement of the financial statements and financial highlights, whether due to error or fraud, and performing procedures that respond to those risks. Such procedures included examining, on a test basis, evidence regarding the amounts and disclosures in the financial statements and financial highlights. Our audits also included evaluating the accounting principles used and significant estimates made by management, as well as evaluating the overall presentation of the financial statements and financial highlights. Our procedures included confirmation of securities owned as of September 30, 2023 by correspondence with the custodian. We believe that our audits provide a reasonable basis for our opinion.
/s/WithumSmith+Brown, PC
We have served as the auditor of one or more series of the Trust since 2013.
New York, New York
November 29, 2023
ETFMG TM ETFs
Expense Example
Period Ended September 30, 2023 (Unaudited)
As a shareholder of the Funds you incur two types of costs: (1) transaction costs, including brokerage commissions on purchases and sales of Fund shares, and (2) ongoing costs, including management fees and other Fund expenses. These examples are intended to help you understand your ongoing costs (in dollars) of investing in the Funds and to compare these costs with the ongoing costs of investing in other funds. The examples are based on an investment of $1,000 invested for the period of time as indicated in the table below.
Actual Expenses
The first line of the table provides information about actual account values based on actual returns and actual expenses. You may use the information in this line, together with the amount you invested, to estimate the expenses that you paid over the period. Simply divide your account value by $1,000 (for example, an $8,600 account value divided by $1,000 = 8.6), then, multiply the result by the number in the first line under the heading entitled “Expenses Paid During Period’’ to estimate the expenses you paid on your account during this period.
Hypothetical Example for Comparison Purposes
The second line of the table provides information about hypothetical account values based on a hypothetical return and hypothetical expenses based on the Fund’s actual expense ratio and an assumed rate of return of 5% per year before expenses, which is not the Fund’s actual return. The hypothetical account values and expenses may not be used to estimate the actual ending account balance or expenses you paid for the period. You may use this information to compare the ongoing costs of investing in the Fund and other funds. To do so, compare this 5% hypothetical example with the 5% hypothetical examples that appear in the shareholder reports of the other funds. Please note that the expenses shown in the table are meant to highlight your ongoing costs only and do not reflect any transactional costs, such as brokerage commissions paid on purchases and sales of Fund shares. Therefore, the second line of the table is useful in comparing ongoing costs only and will not help you determine the relative total costs of owning different funds. If these transactional costs were included, your costs would have been higher.
| Fund Name | | Beginning
Account Value
April 1, 2023 | | | Ending
Account Value
September 30, 2023 | | | Expenses Paid
During the
Period^ | | | Annualized
Expense Ratio
During the
Period April 1,
2023 to
September 30,
2023 | |
| ETFMG Travel Tech ETF | | | | | | | | | | | | | | | | |
| Actual | | $ | 1,000.00 | | | $ | 974.30 | | | $ | 3.71 | | | | 0.75 | % |
| Hypothetical (5% annual) | | | 1,000.00 | | | | 1,021.31 | | | | 3.80 | | | | 0.75 | % |
| ^ | The dollar amounts shown as expenses paid during the period are equal to the annualized six-month expense ratio multiplied by the average account value during the period, multiplied by 183/365 (to reflect the one-half year period). |
ETFMG TM ETFs
SUPPLEMENTARY INFORMATION
September 30, 2023 (Unaudited)
NOTE 1 – FREQUENCY DISTRIBUTION OF PREMIUMS AND DISCOUNTS
Information regarding how often shares of the Fund traded on the Exchange at a price above (i.e., at a premium) or below (i.e., at a discount) the NAV is available on the Fund’s website at www.etfmgfunds.com.
NOTE 2 – FEDERAL TAX INFORMATION
Qualified Dividend Income/Dividends Received Deduction
For the fiscal year ended September 30, 2023, certain dividends paid by the Fund may be subject to a maximum tax rate of 15%, as provided for by the Jobs and Growth Tax Reconciliation Act of 2003. The percentage of dividends declared from ordinary income designated as qualified dividend income was as follows:
| Fund Name | | Qualified Dividend Income | |
| ETFMG Travel Tech ETF | | | 0.00 | % |
For corporate shareholders, the percent of ordinary income distributions qualifying for the corporate dividends received deduction for the fiscal year ended September 30, 2023, was as follows:
| Fund Name | | Dividends Received Deduction | |
| ETFMG Travel Tech ETF | | | 0.00 | % |
Short Term Capital Gain
The percentage of taxable ordinary income distributions that are designated as short-term capital gain distributions under Internal Revenue Section 871 (k)(2)(C) for the Fund was as follows:
| Fund Name | | Short-Term Capital Gain | |
| ETFMG Travel Tech ETF | | | 0.00 | % |
During the year ended September 30, 2023, the Fund did not declare any long-term realized gains distributions.
NOTE 3 – INFORMATION ABOUT PORTFOLIO HOLDINGS
The Fund files its complete schedule of portfolio holdings for its first and third fiscal quarters with the Securities and Exchange Commission (“SEC”) on Part F of Form N-PORT. The Fund’s Part F of Form N-PORT is available on the website of the SEC at www.sec.gov and the Fund’s website at www.etfmgfunds.com. The Fund’s portfolio holdings are posted on its website at www.etfmgfunds.com daily.
NOTE 4 – INFORMATION ABOUT PROXY VOTING
A description of the policies and procedures the Fund uses to determine how to vote proxies relating to portfolio securities is provided in the Statement of Additional Information (“SAI”). The SAI is available without charge upon request by calling toll -free at (877) 756-7873, by accessing the SEC’s website at www.sec.gov, or by accessing the Fund’s website at www.etfmgfunds.com.
Information regarding how the Fund voted proxies relating to portfolio securities during the period ending June 30 is available by calling toll-free at (877) 756-7873 or by accessing the SEC’s website at www.sec.gov.
Carefully consider the Fund’s investment objectives, risk factors, charges, and expenses before investing. This and additional information can be found in the Fund’s prospectus, which may be obtained by calling 1-844-ETF-MGRS (1-844-383-6477) or by visiting www.etfmgfunds.com. This report must be preceded or accompanied by a prospectus.
ETFMG TM ETFs
Board of Trustees
Set forth below are the names, birth years, positions with the Trust, length of term of office, and the principal occupations and other directorships held during at least the last five years of each of the persons currently serving as a Trustee of the Trust, as well as information about each officer. The business address of each Trustee and officer is 30 Maple Street, 2nd Floor, Summit, New Jersey 07901. The SAI includes additional information about Fund directors and is available, without charge, upon request by calling 1-844-ETF-MGRS (1-844-383-6477).
Name and Year of Birth | Position(s)
Held with the
Trust, Term of
Office and
Length of
Time Served | Principal Occupation(s)
During Past 5 Years | Number of
Portfolios in
Fund
Complex
Overseen By
Trustee | Other
Directorships
Held by
Trustee
During Past 5
Years |
| Interested Trustee and Officers |
Michael Minella
(1971) | President (since 2023) | Senior Principal Consultant, ACA Group (since 2022); Vice President and Director, Fidelity Investments (2009-2022). | n/a | n/a |
John A. Flanagan
(1946) | Treasurer (since 2015) | President, John A. Flanagan CPA, LLC (accounting services) (since 2010); Treasurer, ETF Managers Trust (since 2015); Chief Financial Officer, ETF Managers Capital, LLC (commodity pool operator) (since 2015). | n/a | Independent Trustee - Absolute Shares Trust (since 2014) (6 portfolios) |
Kevin Hourihan
(1978) | Chief Compliance Officer (since 2022) | Senior Principal Consultant, Fund Chief Compliance Officer, ACA Global, LLC (since 2022); Chief Compliance Officer, Ashmore Funds (2017-2022); Chief Compliance Officer, Ashmore Investment Management (US) Corp (2014-2022); Chief Compliance Officer, Ashmore Equities Investment Management (2015-2019). | n/a | n/a |
Matthew J. Bromberg
(1973) | Secretary (since 2023) | Chief Compliance Officer and Chief Compliance Officer of ETF Managers Group, LLC (since 2022); General Counsel and Secretary of Exchange Traded Managers Group LLC (since 2020); ETF Managers Group LLC (since 2020); ETFMG Financial LLC (since 2020); ETF Managers Capital LLC (since 2020); Partner of Dorsey & Whitney LLP (law firm) (2019-2020); General Counsel of WBI Investments, Inc. (2016-2019); Millington Securities, Inc. (2016-2019). | n/a | n/a |
ETFMG TM ETFs
Board of Trustees (Continued)
Name and Year of Birth | Position(s)
Held with the
Trust, Term of
Office and
Length of
Time Served | Principal Occupation(s) During Past 5 Years | Number of
Portfolios in
Fund
Complex
Overseen By
Trustee | Other
Directorships
Held by
Trustee
During Past 5
Years |
Terry Loebs
(1963) | Chairman of the Board (since 2023); Trustee (since 2014); Lead Independent Trustee (since 2020) | Founder and Managing Member, Pulsenomics LLC (index product development and consulting firm) (since 2011); Managing Director, MacroMarkets, LLC (exchange-traded products firm) (2006-2011). | 12 | None |
Eric Wiegel
(1960) | Trustee (since 2020) | Managing Partner, Global Focus Capital LLC (since 2013); Senior Portfolio Manager, Little House Capital (2019-2021); Chief Investment Officer, Insight Financial Strategist LLC (2017-2018). | 12 | None |
ETFMG TM ETFs
ETF MANAGERS TRUST
Privacy Policy and Procedures
ETF Managers Trust, (the “Trust”) has adopted the following privacy policies in order to safeguard the personal information of the Trust’s customers and consumers in accordance with Regulation S-P as promulgated by the U.S. Securities and Exchange Commission.
Trust officers are responsible for ensuring that the following policies and procedures are implemented:
1) The Trust is committed to protecting the confidentiality and security of the information they collect and will handle personal customer and consumer information only in accordance with Regulation S-P and any other applicable laws, rules and regulations1. The Trust will ensure: (a) the security and confidentiality of customer records and information; (b) that customer records and information are protected from any anticipated threats and hazards; and (c) that customer records and information are protected from unauthorized access or use.
2) The Trust conducts its business affairs through its trustees, officers and third parties that provide services pursuant to agreements with the Trust. The Trust has no employees. It is anticipated that the trustees and officers of the Trust who are not employees of service providers of the Trust will not have access to customer records and information in the performance of their normal responsibilities for the Trust.
3) The Trust may share customer information with its affiliates, subject to the customers’ right to prohibit such sharing.
4) The Trust may share customer information with unaffiliated third parties only in accordance with the requirements of Regulation S-P. Pursuant to this policy, the Trust will not share customer information with unaffiliated third parties other than as permitted by law, unless authorized to do so by the customer.
Consistent with these policies, the Trust has adopted the following procedures:
1) The Trust will determine that the policies and procedures of its affiliates and Service Providers are reasonably designed to safeguard customer information and only permit appropriate and authorized access to and use of customer information through the application of appropriate administrative, technical and physical protections.
2) The Trust will direct each of its Service Providers to adhere to the privacy policy of the Trust and to its privacy policies with respect to all customer information of the Trust and to take all actions reasonably necessary so that the Trust is in compliance with the provisions of Regulation S-P, including, as applicable, the development and delivery of privacy notices and the maintenance of appropriate and adequate records.
3) The Trust requires its Service Providers to provide periodic reports to the Trust’s Board of Trustees outlining their privacy policies and the implementation of such policies. Each Service Provider is required to promptly report to the Trust’s Board any material changes to its privacy policy before, or promptly after, the adoption of such changes.
| (1) | Generally, the Funds have institutional clients which are not considered “customers” for purposes of regulation S-P. |
Advisor
ETF Managers Group, LLC
350 Springfield Ave., Suite 200, Summit, NJ 07901
Distributor
Foreside Fund Services LLC
Three Canal Plaza, Suite 100, Portland, Maine 04101
Custodian
U.S. Bank National Association
Custody Operations
1555 North River Center Drive, Suite 302, Milwaukee, Wisconsin 53212
Transfer Agent
U.S. Bancorp Fund Services, LLC doing business as U.S. Bank Global Fund Services
615 East Michigan Street, Milwaukee, Wisconsin 53202
Securities Lending Agent
U.S. Bank, National Association
Securities Lending
800 Nicolet Mall
Minneapolis, MN 55402-7020
Independent Registered Public Accounting Firm
WithumSmith + Brown, PC
1411 Broadway, 9th Floor, New York, NY 10018
Legal Counsel
Sullivan & Worcester LLP
1666 K Street NW, Washington, DC 20006

Annual Report
September 30, 2023
Etho Climate Leadership U.S. ETF
Ticker: ETHO

The fund is a series of ETF Managers Trust.
Etho Climate Leadership U.S. ETF
TABLE OF CONTENTS
September 30, 2023
Etho Climate Leadership U.S. ETF
Dear Shareholder,
On behalf of the entire team, we want to express our appreciation for the confidence you have placed in the Etho Climate Leadership US ETF (the “Fund”). The following information pertains to the fiscal period from October 1, 2022 to September 30, 2023 (the “Annual Period”).
Market Overview
The U.S. economy performed better than expected despite persistent inflationary pressure, rising interest rates and geo-political conflict during the Annual Period.
Early in the Annual Period, inflation had risen sharply because of supply chain disruptions, high food and energy prices and the Russia-Ukraine war, reaching its peak level, just prior to the Annual Period, in September 2022. In the first quarter of 2023, U.S. equities managed to deliver gains, despite the significant volatility. The January rally, however, gave way to a February sell off as higher-than-expected inflation, a tight labor market and solid economic growth indicated that the U.S. Federal Reserve’s (Fed) monetary policy would remain tight for the foreseeable future. One of the most significant impacts occurred in the banking sector in March 2023, when Silicon Valley Bank, Signature Bank, and First Republic Bank, among others, failed. In the same month, Swiss bank UBS agreed to buy Credit Suisse, considered vulnerable in the then current environment.
In the second quarter of 2023, the economy grew at an annualized rate of 2.1%, according to the third estimate from the U.S. Bureau of Economic Analysis, compared to 2.2% in the first quarter and in line with 2.1% in 2022 overall. Since then, price pressures have eased given normalization in supply chains, falling energy prices and aggressive measures by the Fed and other global central banks to tighten financial conditions and slow demand in their economies. Nevertheless, during the Annual Period inflation levels remained much higher than central banks’ target levels, with the Fed raising its target fed funds rate six times during the Annual Period, bringing it to a range of 5.25% to 5.50% as of July 2023. As of August 2023, the unemployment rate was 3.8%, near its pre-pandemic low, although monthly job growth continued to be moderate. In September 2023, the Fed’s policy committee voted to hold the rate steady.
As the U.S. Congress neared its September 30, 2023, deadline to approve federal funding, investor concerns about a potential government shutdown and the impact this could have on the U.S. economy increased. The shutdown, however, was averted because of a Continuing Resolution which temporarily kept the government open for forty-five more days. Despite higher rates and increased market volatility, U.S. stocks for the Annual Period had strong returns of 21.62%, as measured by the S&P 500 Index.
These conditions have impacted the performance of the Fund during the period, among other factors, and the value of an investment in the Fund. We encourage you to talk with your financial advisor and visit etfmg.com for further insight into investing in today’s markets.
Performance Overview
The Fund seeks to provide investment results that, before fees and expenses, correspond generally to the price and yield performance of the Etho Climate Leadership Index – U.S. (the “Index”).
For the Annual Period, the total return for the Fund was 9.74% while the total return for the Index was 9.19%. The best performers in the Fund, on the basis of contribution to its return, were Nvidia Corp., Rambus Inc., Booking Holdings Inc., Eos Energy Enterprises Inc., and Adobe Inc., while the worst performers were SVB Financial Group., Arcimoto Inc., Blink Charging Co., Lightning Emotors Inc., and TPI Companies Inc.
At the end of the Annual Period, the Fund saw an approximate allocation of 21.11% to the Information Technology sector, 17.52% to Industrials and 16.61% to Financials. The Fund invests in the United States.
As you may know, the Fund offers broad diversification across companies that have demonstrated efficiency and leadership with their use of resources and their supply chains when compared to industry peers. The Fund holds roughly 259 equities equally weighted (at the time of rebalance) and results in a carbon emissions profile that is, on average, 60-80% lower per dollar invested than conventional U.S. benchmark indices. The Fund avoids investment in any direct fossil fuel companies, as well as enablers of that industry, along with a series of other unsustainable industries such as, Tobacco, Weapons, and Gambling. Equal weighting of the Fund allows for the elimination of equities that do not meet the standards of the Fund, without there being a significant impact on the diversification or performance of the Fund. It also creates broad exposure to both the sectors and factors that potentially make for greater stability and higher performance.
There is much ahead for environmentally sustainable and socially responsible investing. We are thankful you have joined us by investing in the Etho Climate Leadership US ETF. You can find further details about the Fund by visiting www.etfmg.com, or by calling 1-844-ETF-MGRS (1-844-383-6477).
Sincerely,

John A. Flanagan
Principal Financial Officer
Etho Climate Leadership U.S. ETF
Growth of $10,000 (Unaudited)

Average Annual Returns Year Ended September 30, 2023 | | 1 Year Return | | | 5 Year Return | | | Since Inception (11/18/2015) | | | Value of $10,000 (9/30/2023) | |
| Etho Climate Leadership U.S. ETF (NAV) | | | 9.74 | % | | | 6.94 | % | | | 10.23 | % | | $ | 21,524 | |
| Etho Climate Leadership U.S. ETF (Market) | | | 9.79 | % | | | 6.92 | % | | | 10.24 | % | | $ | 21,535 | |
| S&P 500 Index | | | 21.62 | % | | | 9.92 | % | | | 11.65 | % | | $ | 23,793 | |
| Etho Climate Leadership Index - U.S. | | | 9.19 | % | | | 6.48 | % | | | 9.69 | % | | $ | 20,703 | |
Performance data quoted represents past performance and does not guarantee future results. The investment return and principal value of an investment will fluctuate so that an investor’s shares, when redeemed, may be worth more of less than their original cost. Current performance of the Fund may be lower or higher than the performance quoted. All performance is historical and includes reinvestment of dividends and capital gains. Performance data current to the most recent month end may be obtained by calling 1-844-ETF-MGRS (1-844-383-6477).
The chart illustrates the performance of a hypothetical $10,000 investment made on November 18, 2015, and is not intended to imply any future performance. The returns shown do not reflect the deduction of taxes that a shareholder would pay on fund distributions from the sales of Fund shares. The chart assumes reinvestment of capital gains and dividends. The chart assumes reinvestment of capital gains and dividends, if any. The Index Returns do not reflect fees or expenses and are not available for direct investment.
Etho Climate Leadership U.S. ETF
Top Ten Holdings as of September 30, 2023 (Unaudited)*
| | | | | % of Total | |
| | | Security | | Investments | |
| 1 | | Telephone and Data Systems, Inc. | | | 0.61 | % |
| 2 | | NVIDIA Corp. | | | 0.54 | % |
| 3 | | Splunk, Inc. | | | 0.52 | % |
| 4 | | Lennox International, Inc. | | | 0.51 | % |
| 5 | | Akamai Technologies, Inc. | | | 0.47 | % |
| 6 | | Chico’s FAS, Inc. | | | 0.47 | % |
| 7 | | Advanced Drainage Systems, Inc. | | | 0.46 | % |
| 8 | | VMware, Inc. - Class A | | | 0.46 | % |
| 9 | | Veeco Instruments, Inc. | | | 0.46 | % |
| 10 | | Adobe Systems, Inc. | | | 0.45 | % |
Top Ten Holdings 4.95% of Total Investments
| * | Current Fund holdings may not be indicative of future Fund holdings. |
Etho Climate Leadership U.S. ETF
Important Disclosures and Key Risk Factors
Investing involves risk, including the possible loss of principal. Shares of any ETF are bought and sold at market price (not NAV), may trade at a discount or premium to NAV and are not individually redeemed from the Fund. Brokerage commissions will reduce returns. Narrowly focused investments typically exhibit higher volatility.
Past performance is not indicative of future return. A fund’s performance for very short time periods may not be indicative of future performance.
ETHO
The ETHO Climate Leadership US ETF (the “Fund”) seeks to provide investment results that, before fees and expenses, correspond generally to the price and yield performance of the Etho Climate Leadership Index (the “Index”).
The Fund’s return may not match or achieve a high degree of correlation with the return of the Etho Climate Leadership Index — US.
To the extent the Fund utilizes a sampling approach, it may experience tracking error to a greater extent than if the Fund had sought to replicate the Index.
Unlike with an actively managed fund, the Fund’s adviser does not use techniques or defensive strategies designed to lessen the effects of market volatility or to reduce the impact of periods of market decline. This means that, based on market and economic conditions, the Fund’s performance could be lower than other types of funds that may actively shift their portfolio assets to take advantage of market opportunities or to lessen the impact of a market decline.
Natural or environmental disasters, such as earthquakes, fires, floods, hurricanes, tsunamis and other severe weather-related phenomena generally, and widespread disease, including pandemics and epidemics, have been and may be highly disruptive to economies and markets, adversely impacting individual companies, sectors, industries, markets, currencies, interest and inflation rates, credit ratings, investor sentiment, and other factors affecting the value of the Fund’s investments. Given the increasing interdependence among global economies and markets, conditions in one country, market, or region are increasingly likely to adversely affect markets, issuers, and/or foreign exchange rates in other countries, including the U.S. Any such events could have a significant adverse impact on the value of the Fund’s investments.
Additionally, natural or environmental disasters, widespread disease or other public health issues, war, acts of terrorism or other events could result in increased premiums or discounts to the Fund’s NAV.
ETF Managers Group LLC serves as the investment adviser to the Fund.
Effective, August 14, 2023, the Fund is distributed by Foreside Fund Services LLC. ETF Managers Group LLC is a wholly owned subsidiary of Exchange Traded Managers Group LLC (collectively, “ETFMG”).
The Fund is intended to be made available only to U.S. residents. Under no circumstances is any information provided on this website intended for distribution to or use by, or to be an offer to sell to or solicitation of an offer to buy the Fund or any investment product or service of, any person or entity in any jurisdiction or country, other than the United States, where such distribution, use, offer or solicitation would subject the Fund or its affiliates to any registration requirement or be unlawful under the securities laws of that jurisdiction or country.
Etho Climate Leadership U.S. ETF
PORTFOLIO ALLOCATIONS
As of September 30, 2023 (Unaudited)
| | | Etho Climate |
| | | Leadership |
| | | U.S. |
| | | ETF |
| As a percent of Net Assets: | | | |
| Bermuda | | 1.2 | % |
| Canada | | 0.2 | |
| Guernsey | | 0.4 | |
| Ireland | | 0.5 | |
| Singapore | | 0.5 | |
| United States | | 97.1 | |
| Short-Term and other Net Assets (Liabilities) | | 0.1 | |
| | | 100.0 | % |
Etho Climate Leadership U.S. ETF
Schedule of Investments
September 30, 2023
| | | Shares | | | Value | |
| COMMON STOCKS - 99.8% | | | | | | | | |
| Bermuda - 1.2% | | | | | | | | |
| Capital Markets - 0.8% | | | | | | | | |
| Invesco, Ltd. | | | 43,194 | | | $ | 627,177 | |
| Lazard, Ltd. - Class A | | | 21,561 | | | | 668,607 | |
| Total Capital Markets | | | | | | | 1,295,784 | |
| Insurance - 0.4% | | | | | | | | |
| White Mountains Insurance Group, Ltd. | | | 501 | | | | 749,341 | |
| Total Bermuda | | | | | | | 2,045,125 | |
| Canada - 0.2% | | | | | | | | |
| Food Products - 0.2% | | | | | | | | |
| SunOpta, Inc. (a)(b) | | | 90,239 | | | | 304,105 | |
| Guernsey - 0.4% | | | | | | | | |
| IT Services - 0.4% | | | | | �� | | | |
| Amdocs, Ltd. | | | 7,231 | | | | 610,947 | |
| Ireland - 0.5% | | | | | | | | |
| Health Care Equipment & Supplies - 0.5% | | | | | | | | |
| STERIS PLC | | | 3,620 | | | | 794,301 | |
| Singapore - 0.5% | | | | | | | | |
| Electronic Equipment, Instruments & Components - 0.5% | | | | | | | | |
| Flex, Ltd. (a) | | | 30,050 | | | | 810,749 | |
| United States - 97.1% | | | | | | | | |
| Air Freight & Logistics - 0.3% | | | | | | | | |
| United Parcel Service, Inc. - Class B | | | 3,610 | | | | 562,691 | |
| Auto Components - 0.3% | | | | | | | | |
| QuantumScape Corp. (a)(b) | | | 84,531 | | | | 565,512 | |
| Automobiles - 0.5% | | | | | | | | |
| Tesla, Inc. (a) | | | 3,332 | | | | 833,733 | |
| Banks - 2.2% | | | | | | | | |
| Amalgamated Financial Corp. | | | 39,410 | | | | 678,640 | |
| Associated Banc-Corp. | | | 38,826 | | | | 664,313 | |
| Bank of Hawaii Corp. (b) | | | 13,443 | | | | 667,983 | |
| Capitol Federal Financial, Inc. (b) | | | 104,792 | | | | 499,858 | |
| Fulton Financial Corp. (b) | | | 50,490 | | | | 611,434 | |
| WaFd, Inc. | | | 23,104 | | | | 591,924 | |
| Total Banks | | | | | | | 3,714,152 | |
| Biotechnology - 2.0% | | | | | | | | |
| Agios Pharmaceuticals, Inc. (a) | | | 30,102 | | | | 745,025 | |
| Alnylam Pharmaceuticals, Inc. (a) | | | 3,452 | | | | 611,349 | |
| Ionis Pharmaceuticals, Inc. (a)(b) | | | 19,346 | | | | 877,534 | |
| Myriad Genetics, Inc. (a) | | | 29,765 | | | | 477,431 | |
| Vertex Pharmaceuticals, Inc. (a) | | | 2,193 | | | | 762,594 | |
| Total Biotechnology | | | | | | | 3,473,933 | |
| Broadline Retail - 0.4% | | | | | | | | |
| eBay, Inc. | | | 15,645 | | | | 689,788 | |
| Building Products - 1.9% | | | | | | | | |
| A.O. Smith Corp. | | | 10,058 | | | | 665,136 | |
| AAON, Inc. | | | 10,735 | | | | 610,499 | |
The accompanying notes are an integral part of these financial statements.
Etho Climate Leadership U.S. ETF
Schedule of Investments
September 30, 2023 (Continued)
| | | Shares | | | Value | |
| | | | | | | | | |
| Advanced Drainage Systems, Inc. (b) | | | 8,219 | | | $ | 935,569 | |
| Lennox International, Inc. | | | 2,756 | | | | 1,031,956 | |
| Total Building Products | | | | | | | 3,243,160 | |
| Capital Markets - 5.2% | | | | | | | | |
| Affiliated Managers Group, Inc. | | | 4,855 | | | | 632,801 | |
| Ares Management Corp. - Class A | | | 8,333 | | | | 857,215 | |
| Cboe Global Markets, Inc. | | | 5,163 | | | | 806,511 | |
| Charles Schwab Corp. | | | 13,284 | | | | 729,292 | |
| CME Group, Inc. | | | 3,625 | | | | 725,798 | |
| FactSet Research Systems, Inc. | | | 1,668 | | | | 729,350 | |
| Franklin Resources, Inc. (b) | | | 25,869 | | | | 635,860 | |
| Intercontinental Exchange, Inc. | | | 6,647 | | | | 731,303 | |
| MarketAxess Holdings, Inc. | | | 1,772 | | | | 378,570 | |
| Morningstar, Inc. (b) | | | 3,409 | | | | 798,523 | |
| Nasdaq, Inc. | | | 12,684 | | | | 616,316 | |
| Northern Trust Corp. (b) | | | 7,900 | | | | 548,892 | |
| S&P Global, Inc. | | | 2,009 | | | | 734,109 | |
| Total Capital Markets | | | | | | | 8,924,540 | |
| Chemicals - 1.1% | | | | | | | | |
| Cabot Corp. | | | 9,058 | | | | 627,448 | |
| Ecolab, Inc. | | | 4,184 | | | | 708,770 | |
| Livent Corp. (a)(b) | | | 31,835 | | | | 586,082 | |
| Total Chemicals | | | | | | | 1,922,300 | |
| Commercial Services & Supplies - 1.6% | | | | | | | | |
| Brink’s Co. | | | 10,397 | | | | 755,238 | |
| Cintas Corp. | | | 1,498 | | | | 720,553 | |
| Copart, Inc. (a) | | | 18,386 | | | | 792,253 | |
| Pitney Bowes, Inc. (b) | | | 179,689 | | | | 542,661 | |
| Total Commercial Services & Supplies | | | | | | | 2,810,705 | |
| Communications Equipment - 2.0% | | | | | | | | |
| Arista Networks, Inc. (a) | | | 4,118 | | | | 757,424 | |
| Cisco Systems, Inc. | | | 13,296 | | | | 714,793 | |
| F5 Networks, Inc. (a) | | | 4,745 | | | | 764,610 | |
| Juniper Networks, Inc. | | | 20,189 | | | | 561,052 | |
| Viavi Solutions, Inc. (a) | | | 63,846 | | | | 583,552 | |
| Total Communications Equipment | | | | | | | 3,381,431 | |
| Construction & Engineering - 0.3% | | | | | | | | |
| Ameresco, Inc. - Class A (a)(b) | | | 14,047 | | | | 541,652 | |
| Consumer Finance - 1.1% | | | | | | | | |
| Ally Financial, Inc. | | | 27,541 | | | | 734,794 | |
| American Express Co. | | | 4,200 | | | | 626,598 | |
| Discover Financial Services | | | 7,028 | | | | 608,836 | |
| Total Consumer Finance | | | | | | | 1,970,228 | |
| Consumer Staples Distribution & Retail - 1.2% | | | | | | | | |
| Grocery Outlet Holding Corp. (a) | | | 24,467 | | | | 705,873 | |
| The Kroger Co. | | | 14,115 | | | | 631,646 | |
| PriceSmart, Inc. | | | 9,712 | | | | 722,864 | |
| Total Consumer Staples Distribution & Retail | | | | | | | 2,060,383 | |
| Containers & Packaging - 0.4% | | | | | | | | |
| Packaging Corp. of America | | | 5,013 | | | | 769,746 | |
| Distributors - 0.7% | | | | | | | | |
The accompanying notes are an integral part of these financial statements.
Etho Climate Leadership U.S. ETF
Schedule of Investments
September 30, 2023 (Continued)
| | | Shares | | | Value | |
| | | | | | | | | |
| Genuine Parts Co. | | | 4,151 | | | $ | 599,321 | |
| LKQ Corp. | | | 12,267 | | | | 607,340 | |
| Total Distributors | | | | | | | 1,206,661 | |
| Diversified Consumer Services - 0.7% | | | | | | | | |
| Graham Holdings Co. - Class B | | | 1,163 | | | | 678,029 | |
| Service Corp International | | | 10,082 | | | | 576,085 | |
| Total Diversified Consumer Services | | | | | | | 1,254,114 | |
| Diversified Telecommunication Services - 1.0% | | | | | | | | |
| ATN International, Inc. | | | 16,965 | | | | 535,415 | |
| EchoStar Corp. - Class A (a)(b) | | | 37,804 | | | | 633,217 | |
| Verizon Communications, Inc. | | | 18,000 | | | | 583,380 | |
| Total Diversified Telecommunication Services | | | | | | | 1,752,012 | |
| Electrical Equipment - 3.6% | | | | | | | | |
| Array Technologies, Inc. (a)(b) | | | 31,602 | | | | 701,248 | |
| Babcock & Wilcox Enterprises, Inc. (a) | | | 114,101 | | | | 480,365 | |
| Beam Global (a)(b) | | | 43,459 | | | | 320,727 | |
| Blink Charging Co. (a)(b) | | | 79,937 | | | | 244,607 | |
| Bloom Energy Corp. - Class A (a)(b) | | | 34,693 | | | | 460,029 | |
| ChargePoint Holdings, Inc. (a)(b) | | | 66,042 | | | | 328,229 | |
| FuelCell Energy, Inc. (a)(b) | | | 242,618 | | | | 310,551 | |
| Hubbell, Inc. | | | 2,849 | | | | 892,906 | |
| Plug Power, Inc. (a)(b) | | | 58,998 | | | | 448,385 | |
| Shoals Technologies Group, Inc. - Class A (a)(b) | | | 30,339 | | | | 553,687 | |
| Stem, Inc. (a)(b) | | | 121,950 | | | | 517,068 | |
| SunPower Corp. (a)(b) | | | 49,961 | | | | 308,259 | |
| Sunrun, Inc. (a)(b) | | | 34,315 | | | | 430,996 | |
| TPI Composites, Inc. (a)(b) | | | 52,984 | | | | 140,408 | |
| Total Electrical Equipment | | | | | | | 6,137,465 | |
| Electronic Equipment, Instruments & Components - 4.6% | | | | | | | | |
| Arrow Electronics, Inc. (a) | | | 5,537 | | | | 693,454 | |
| Avnet, Inc. | | | 15,368 | | | | 740,584 | |
| Badger Meter, Inc. | | | 5,682 | | | | 817,470 | |
| Belden, Inc. | | | 7,971 | | | | 769,600 | |
| Corning, Inc. | | | 19,720 | | | | 600,868 | |
| Itron, Inc. (a) | | | 12,469 | | | | 755,372 | |
| National Instruments Corp. | | | 13,281 | | | | 791,813 | |
| OSI Systems, Inc. (a) | | | 6,753 | | | | 797,124 | |
| Trimble, Inc. (a) | | | 13,190 | | | | 710,413 | |
| Vishay Intertechnology, Inc. | | | 30,645 | | | | 757,544 | |
| Zebra Technologies Corp. - Class A (a) | | | 2,173 | | | | 513,980 | |
| Total Electronic Equipment, Instruments & Components | | | | | | | 7,948,222 | |
| Entertainment - 1.7% | | | | | | | | |
| Atlanta Braves Holdings, Inc. - Class C (a) | | | 266 | | | | 9,504 | |
| Electronic Arts, Inc. | | | 5,746 | | | | 691,818 | |
| Liberty Media Corp-Liberty Formula One - Class C (a) | | | 9,239 | | | | 575,590 | |
| Liberty Media Corp-Liberty Live - Class C (a) | | | 394 | | | | 12,647 | |
| Netflix, Inc. (a) | | | 2,001 | | | | 755,578 | |
| Take-Two Interactive Software, Inc. (a) | | | 5,796 | | | | 813,701 | |
| Total Entertainment | | | | | | | 2,858,838 | |
| Financial Services - 1.6% | | | | | | | | |
| Fiserv, Inc. (a) | | | 6,116 | | | | 690,863 | |
| MasterCard, Inc. - Class A | | | 1,903 | | | | 753,417 | |
The accompanying notes are an integral part of these financial statements.
Etho Climate Leadership U.S. ETF
Schedule of Investments
September 30, 2023 (Continued)
| | | Shares | | | Value | |
| | | | | | | | | |
| PayPal Holdings, Inc. (a) | | | 9,103 | | | $ | 532,161 | |
| Visa, Inc. - Class A (b) | | | 3,074 | | | | 707,051 | |
| Total Financial Services | | | | | | | 2,683,492 | |
| Food Products - 0.4% | | | | | | | | |
| Ingredion, Inc. | | | 6,827 | | | | 671,777 | |
| Road & Rail - 1.3% | | | | | | | | |
| JB Hunt Transport Services, Inc. | | | 3,953 | | | | 745,220 | |
| Landstar System, Inc. | | | 3,866 | | | | 684,050 | |
| Old Dominion Freight Line, Inc. | | | 2,030 | | | | 830,554 | |
| Total Road & Rail | | | | | | | 2,259,824 | |
| Health Care Equipment & Supplies - 3.7% | | | | | | | | |
| Align Technology, Inc. (a) | | | 2,067 | | | | 631,097 | |
| Avanos Medical, Inc. (a) | | | 23,248 | | | | 470,075 | |
| Baxter International, Inc. | | | 17,133 | | | | 646,600 | |
| Becton Dickinson & Co. | | | 2,799 | | | | 723,626 | |
| DENTSPLY SIRONA, Inc. | | | 17,646 | | | | 602,787 | |
| DexCom, Inc. (a) | | | 5,951 | | | | 555,228 | |
| Edwards Lifesciences Corp. (a) | | | 8,358 | | | | 579,042 | |
| Hologic, Inc. (a) | | | 8,568 | | | | 594,619 | |
| IDEXX Laboratories, Inc. (a)(b) | | | 1,383 | | | | 604,744 | |
| ResMed, Inc. | | | 3,166 | | | | 468,156 | |
| Teleflex, Inc. | | | 2,734 | | | | 536,985 | |
| Total Health Care Equipment & Supplies | | | | | | | 6,412,959 | |
| Health Care Providers & Services - 2.1% | | | | | | | | |
| AMN Healthcare Services, Inc. (a)(b) | | | 8,333 | | | | 709,805 | |
| Humana, Inc. | | | 1,425 | | | | 693,291 | |
| Pediatrix Medical Group, Inc. (a) | | | 46,376 | | | | 589,439 | |
| Patterson Cos, Inc. | | | 26,154 | | | | 775,205 | |
| The Cigna Group | | | 2,714 | | | | 776,393 | |
| Total Health Care Providers & Services | | | | | | | 3,544,133 | |
| Health Care REITs - 0.9% | | | | | | | | |
| Ventas, Inc. | | | 16,056 | | | | 676,439 | |
| Welltower, Inc. (b) | | | 9,746 | | | | 798,392 | |
| Total Health Care REITs | | | | | | | 1,474,831 | |
| Hotels, Restaurants & Leisure - 2.9% | | | | | | | | |
| Booking Holdings, Inc. (a) | | | 259 | | | | 798,743 | |
| Chipotle Mexican Grill, Inc. (a)(b) | | | 403 | | | | 738,227 | |
| Darden Restaurants, Inc. (b) | | | 4,480 | | | | 641,626 | |
| Expedia Group, Inc. (a) | | | 7,126 | | | | 734,477 | |
| Hilton Worldwide Holdings, Inc. | | | 4,912 | | | | 737,684 | |
| Hyatt Hotels Corp. - Class A | | | 6,190 | | | | 656,635 | |
| Sabre Corp. (a) | | | 161,178 | | | | 723,689 | |
| Total Hotels, Restaurants & Leisure | | | | | | | 5,031,081 | |
| Household Durables - 1.8% | | | | | | | | |
| KB Home | | | 17,293 | | | | 800,320 | |
| Lennar Corporation - Class A | | | 6,606 | | | | 741,391 | |
| Tempur Sealy International, Inc. | | | 17,574 | | | | 761,657 | |
| Toll Brothers, Inc. | | | 11,540 | | | | 853,499 | |
| Total Household Durables | | | | | | | 3,156,867 | |
| Household Products - 1.6% | | | | | | | | |
| Church & Dwight Co., Inc. | | | 7,851 | | | | 719,387 | |
The accompanying notes are an integral part of these financial statements.
Etho Climate Leadership U.S. ETF
Schedule of Investments
September 30, 2023 (Continued)
| | | Shares | | | Value | |
| | | | | | | | | |
| Energizer Holdings, Inc. (b) | | | 20,046 | | | $ | 642,274 | |
| Kimberly-Clark Corp. | | | 5,183 | | | | 626,366 | |
| Spectrum Brands Holdings, Inc. (b) | | | 10,482 | | | | 821,265 | |
| Total Household Products | | | | | | | 2,809,292 | |
| Independent Power and Renewable Electricity Producers - 1.1% | | | | | | | | |
| Montauk Renewables, Inc. (a) | | | 87,860 | | | | 800,406 | |
| Ormat Technologies, Inc. (b) | | | 8,173 | | | | 571,456 | |
| Sunnova Energy International, Inc. (a)(b) | | | 44,267 | | | | 463,475 | |
| Total Independent Power and Renewable Electricity Producers | | | | | | | 1,835,337 | |
| Industrial (REITs) - 0.4% | | | | | | | | |
| Prologis, Inc. | | | 5,568 | | | | 624,785 | |
| Insurance - 6.8% | | | | | | | | |
| Allstate Corp. | | | 6,274 | | | | 698,986 | |
| Arthur J Gallagher & Co. | | | 3,620 | | | | 825,107 | |
| CNA Financial Corp. | | | 17,974 | | | | 707,277 | |
| Erie Indemnity Co. - Class A (b) | | | 2,996 | | | | 880,194 | |
| Fidelity National Financial, Inc. (b) | | | 19,976 | | | | 825,009 | |
| First American Financial Corp. | | | 12,503 | | | | 706,294 | |
| Hartford Financial Services Group, Inc. | | | 9,964 | | | | 706,547 | |
| Marsh & McLennan Cos., Inc. | | | 4,162 | | | | 792,029 | |
| MBIA, Inc. (a) | | | 74,672 | | | | 538,385 | |
| Old Republic International Corp. | | | 27,888 | | | | 751,303 | |
| Principal Financial Group, Inc. | | | 9,364 | | | | 674,863 | |
| Prudential Financial, Inc. | | | 8,446 | | | | 801,441 | |
| Reinsurance Group of America, Inc. | | | 5,250 | | | | 762,248 | |
| The Hanover Insurance Group, Inc. | | | 5,407 | | | | 600,069 | |
| The Progressive Corp. | | | 4,836 | | | | 673,655 | |
| Unum Group | | | 17,672 | | | | 869,286 | |
| Total Insurance | | | | | | | 11,812,693 | |
| Interactive Media & Services - 0.3% | | | | | | | | |
| TripAdvisor, Inc. (a) | | | 34,816 | | | | 577,249 | |
| IT Services - 2.1% | | | | | | | | |
| Akamai Technologies, Inc. (a) | | | 8,829 | | | | 940,641 | |
| DXC Technology Co. (a) | | | 27,052 | | | | 563,493 | |
| Gartner, Inc. (a) | | | 2,121 | | | | 728,797 | |
| International Business Machines Corp. | | | 5,366 | | | | 752,850 | |
| VeriSign, Inc. (a) | | | 3,271 | | | | 662,476 | |
| Total IT Services | | | | | | | 3,648,257 | |
| Leisure Products - 1.4% | | | | | | | | |
| Brunswick Corp. (b) | | | 8,462 | | | | 668,498 | |
| Hasbro, Inc. | | | 13,088 | | | | 865,640 | |
| Mattel, Inc. (a) | | | 37,558 | | | | 827,403 | |
| Total Leisure Products | | | | | | | 2,361,541 | |
| Life Sciences Tools & Services - 2.6% | | | | | | | | |
| Agilent Technologies, Inc. | | | 5,004 | | | | 559,547 | |
| Bio-Rad Laboratories, Inc. - Class A (a) | | | 1,442 | | | | 516,885 | |
| Bio-Techne Corp. | | | 9,326 | | | | 634,821 | |
| Illumina, Inc. (a) | | | 2,973 | | | | 408,133 | |
| IQVIA Holdings, Inc. (a) | | | 3,476 | | | | 683,902 | |
| Mettler-Toledo International, Inc. (a) | | | 451 | | | | 499,740 | |
| PerkinElmer, Inc. | | | 5,171 | | | | 572,430 | |
The accompanying notes are an integral part of these financial statements.
Etho Climate Leadership U.S. ETF
Schedule of Investments
September 30, 2023 (Continued)
| | | Shares | | | Value | |
| | | | | | | |
| Waters Corp. (a) | | | 2,232 | | | $ | 612,037 | |
| Total Life Sciences Tools & Services | | | | | | | 4,487,495 | |
| Machinery - 1.0% | | | | | | | | |
| 3D Systems Corp. (a)(b) | | | 64,501 | | | | 316,700 | |
| Deere & Co. | | | 1,678 | | | | 633,244 | |
| Westinghouse Air Brake Technologies Corp. | | | 6,857 | | | | 728,693 | |
| Total Machinery | | | | | | | 1,678,637 | |
| Media - 2.7% | | | | | | | | |
| DISH Network Corporation - Class A (a)(b) | | | 74,112 | | | | 434,296 | |
| Interpublic Group of Cos, Inc. | | | 18,671 | | | | 535,111 | |
| John Wiley & Sons, Inc. - Class A | | | 17,963 | | | | 667,685 | |
| New York Times Co. - Class A | | | 17,818 | | | | 734,102 | |
| Omnicom Group, Inc. | | | 7,366 | | | | 548,620 | |
| Paramount Global - Class B (b) | | | 31,059 | | | | 400,661 | |
| Sirius XM Holdings, Inc. (b) | | | 175,590 | | | | 793,667 | |
| TEGNA, Inc. | | | 41,056 | | | | 598,186 | |
| Total Media | | | | | | | 4,712,328 | |
| Mortgage Real Estate Investment Trusts (REITs) - 0.3% | | | | | | | | |
| Hannon Armstrong Sustainable Infrastructure Capital, Inc. (b) | | | 24,447 | | | | 518,276 | |
| Personal Care Products - 0.9% | | | | | | | | |
| Coty, Inc. - Class A (a) | | | 57,333 | | | | 628,943 | |
| Edgewell Personal Care Co. (b) | | | 16,341 | | | | 603,963 | |
| Estee Lauder Cos., Inc. - Class A | | | 2,811 | | | | 406,330 | |
| Total Personal Care Products | | | | | | | 1,639,236 | |
| Pharmaceuticals - 0.7% | | | | | | | | |
| Merck & Co, Inc. | | | 6,528 | | | | 672,058 | |
| Pfizer, Inc. | | | 17,208 | | | | 570,789 | |
| Total Pharmaceuticals | | | | | | | 1,242,847 | |
| Professional Services - 1.9% | | | | | | | | |
| Broadridge Financial Solutions, Inc. | | | 4,732 | | | | 847,265 | |
| ManpowerGroup, Inc. | | | 8,499 | | | | 623,147 | |
| Verisk Analytics, Inc. | | | 3,607 | | | | 852,118 | |
| Willdan Group, Inc. (a) | | | 44,267 | | | | 904,374 | |
| Total Professional Services | | | | | | | 3,226,904 | |
| Real Estate Investment Trusts (REITs) - 1.6% | | | | | | | | |
| AvalonBay Communities, Inc. | | | 4,140 | | | | 711,004 | |
| Camden Property Trust | | | 6,638 | | | | 627,822 | |
| UDR, Inc. (b) | | | 16,954 | | | | 604,749 | |
| Veris Residential, Inc. | | | 47,230 | | | | 779,295 | |
| Total Real Estate Investment Trusts (REITs) | | | | | | | 2,722,870 | |
| Retail (REITs) - 0.4% | | | | | | | | |
| Regency Centers Corp. | | | 11,387 | | | | 676,843 | |
| Semiconductors & Semiconductor Equipment - 6.5% | | | | | | | | |
| Advanced Micro Devices, Inc. (a) | | | 7,055 | | | | 725,395 | |
| Amtech Systems, Inc. (a) | | | 72,480 | | | | 552,298 | |
| Analog Devices, Inc. | | | 3,516 | | | | 615,616 | |
| Applied Materials, Inc. | | | 5,638 | | | | 780,581 | |
| Enphase Energy, Inc. (a) | | | 3,287 | | | | 394,933 | |
| First Solar, Inc. (a) | | | 3,179 | | | | 513,695 | |
| Intel Corp. | | | 21,278 | | | | 756,433 | |
| Micron Technology, Inc. | | | 11,474 | | | | 780,576 | |
The accompanying notes are an integral part of these financial statements.
Etho Climate Leadership U.S. ETF
Schedule of Investments
September 30, 2023 (Continued)
| | | Shares | | | Value | |
| | | | | | | |
| NVIDIA Corp. | | | 2,489 | | | $ | 1,082,689 | |
| ON Semiconductor Corp. (a)(b) | | | 8,398 | | | | 780,594 | |
| Qorvo, Inc. (a) | | | 6,806 | | | | 649,769 | |
| Qualcomm, Inc. | | | 5,444 | | | | 604,611 | |
| Rambus, Inc. (a) | | | 13,488 | | | | 752,496 | |
| Teradyne, Inc. (b) | | | 6,436 | | | | 646,561 | |
| Universal Display Corp. | | | 4,463 | | | | 700,646 | |
| Veeco Instruments, Inc. (a) | | | 32,724 | | | | 919,872 | |
| Total Semiconductors & Semiconductor Equipment | | | | | | | 11,256,765 | |
| Software - 5.5% | | | | | | | | |
| Adobe Systems, Inc. (a) | | | 1,794 | | | | 914,761 | |
| Autodesk, Inc. (a) | | | 3,322 | | | | 687,355 | |
| Cadence Design System, Inc. (a) | | | 3,290 | | | | 770,847 | |
| Dolby Laboratories, Inc. - Class A | | | 8,131 | | | | 644,463 | |
| Gen Digital, Inc. | | | 40,515 | | | | 716,305 | |
| Intuit, Inc. | | | 1,552 | | | | 792,979 | |
| Salesforce, Inc. (a) | | | 3,461 | | | | 701,822 | |
| ServiceNow, Inc. (a) | | | 1,487 | | | | 831,174 | |
| Splunk, Inc. (a) | | | 7,211 | | | | 1,054,608 | |
| Teradata Corp. (a) | | | 17,165 | | | | 772,768 | |
| VMware, Inc. - Class A (a) | | | 5,538 | | | | 921,966 | |
| Zoom Video Communications, Inc. - Class A (a) | | | 9,363 | | | | 654,848 | |
| Total Software | | | | | | | 9,463,896 | |
| Specialized REITs - 2.7% | | | | | | | | |
| American Tower Corp. | | | 3,420 | | | | 562,419 | |
| Digital Realty Trust, Inc. | | | 7,090 | | | | 858,032 | |
| Equinix, Inc. | | | 960 | | | | 697,210 | |
| Gladstone Land Corp. (b) | | | 41,854 | | | | 595,582 | |
| Iron Mountain, Inc. | | | 13,168 | | | | 782,838 | |
| Public Storage, Inc. | | | 2,305 | | | | 607,414 | |
| SBA Communications Corp. | | | 2,655 | | | | 531,451 | |
| Total Specialized REITs | | | | | | | 4,634,946 | |
| Specialty Retail - 3.3% | | | | | | | | |
| Advance Auto Parts, Inc. | | | 5,749 | | | | 321,542 | |
| Chico’s FAS, Inc. (a)(b) | | | 125,720 | | | | 940,385 | |
| EVgo, Inc. (a)(b) | | | 88,762 | | | | 300,016 | |
| Foot Locker, Inc. (b) | | | 17,736 | | | | 307,720 | |
| Lowe’s Cos., Inc. | | | 3,480 | | | | 723,283 | |
| Penske Automotive Group, Inc. (b) | | | 4,907 | | | | 819,763 | |
| Ross Stores, Inc. | | | 6,529 | | | | 737,451 | |
| Tractor Supply Co. (b) | | | 2,950 | | | | 598,998 | |
| Williams-Sonoma, Inc. (b) | | | 5,740 | | | | 891,996 | |
| Total Specialty Retail | | | | | | | 5,641,154 | |
| Technology Hardware, Storage & Peripherals - 1.2% | | | | | | | | |
| Apple, Inc. | | | 4,199 | | | | 718,910 | |
| HP, Inc. | | | 23,701 | | | | 609,116 | |
| Xerox Holdings Corp. | | | 45,456 | | | | 713,205 | |
| Total Technology Hardware, Storage & Peripherals | | | | | | | 2,041,231 | |
| Textiles, Apparel & Luxury Goods - 1.3% | | | | | | | | |
| PVH Corp. | | | 7,757 | | | | 593,488 | |
| Ralph Lauren Corp. (b) | | | 5,952 | | | | 690,968 | |
| Tapestry, Inc. | | | 16,116 | | | | 463,335 | |
The accompanying notes are an integral part of these financial statements.
Etho Climate Leadership U.S. ETF
Schedule of Investments
September 30, 2023 (Continued)
| | | Shares | | | Value | |
| | | | | | | | | |
| VF Corp. (b) | | | 30,508 | | | $ | 539,076 | |
| Total Textiles, Apparel & Luxury Goods | | | | | | | 2,286,867 | |
| Trading Companies & Distributors - 1.3% | | | | | | | | |
| Herc Holdings, Inc. | | | 6,096 | | | | 725,058 | |
| MSC Industrial Direct Co., Inc. - Class A | | | 8,280 | | | | 812,682 | |
| WESCO International, Inc. | | | 4,480 | | | | 644,314 | |
| Total Trading Companies & Distributors | | | | | | | 2,182,054 | |
| Water Utilities - 1.0% | | | | | | | | |
| American States Water Co. | | | 7,828 | | | | 615,907 | |
| American Water Works Co., Inc. | | | 4,751 | | | | 588,316 | |
| California Water Service Group | | | 11,961 | | | | 565,875 | |
| Total Water Utilities | | | | | | | 1,770,098 | |
| Wireless Telecommunication Services - 1.1% | | | | | | | | |
| Telephone and Data Systems, Inc. | | | 66,934 | | | | 1,225,561 | |
| T-Mobile US, Inc. (a) | | | 4,774 | | | | 668,599 | |
| Total Wireless Telecommunication Services | | | | | | | 1,894,160 | |
| Total United States | | | | | | | 167,601,991 | |
| TOTAL COMMON STOCKS (Cost $176,873,603) | | | | | | | 172,167,218 | |
| | | | | | | | | |
| INVESTMENTS PURCHASED WITH PROCEEDS FROM SECURITIES LENDING COLLATERAL - 16.8% | | | | | | | | |
| Mount Vernon Liquid Assets Portfolio, LLC, 5.50% (c) | | | 29,054,398 | | | | 29,054,398 | |
| TOTAL INVESTMENTS PURCHASED WITH PROCEEDS FROM SECURITIES LENDING COLLATERAL (Cost $29,054,398) | | | | | | | 29,054,398 | |
| | | | | | | | | |
| SHORT-TERM INVESTMENTS - 0.1% | | | | | | | | |
| Money Market Funds - 0.1% | | | | | | | | |
| First American Government Obligations Fund - Class X, 5.26% (c) | | | 243,553 | | | | 243,553 | |
| TOTAL SHORT-TERM INVESTMENTS (Cost $243,553) | | | | | | | 243,553 | |
| | | | | | | | | |
| Total Investments (Cost $206,171,554) - 116.8% | | | | | | | 201,465,169 | |
| Liabilities in Excess of Other Assets - (16.8)% | | | | | | | (28,943,839 | ) |
| TOTAL NET ASSETS - 100.0% | | | | | | $ | 172,521,330 | |
Percentages are stated as a percent of net assets.
| (a) | Non-income producing security. |
| (b) | This security or a portion of this security was out on loan at September 30, 2023. |
| (c) | The rate shown is the annualized seven-day yield at period end. |
The Global Industry Classification Standard (GICS®) was developed by and/or is the exclusive property of MSCI, Inc. and Standard & Poor’s Financial Services LLC (“S&P”). GICS is a service mark of MSCI and S&P and has been licensed for use by U.S. Bancorp Fund Services, LLC, doing business as U.S. Bank Global Fund Services (“Fund Services”).
The accompanying notes are an integral part of these financial statements.
Etho Climate Leadership U.S. ETF
STATEMENT OF ASSETS AND LIABILITIES
As of September 30, 2023
| | | Etho Climate | |
| | | Leadership | |
| | | U.S. ETF | |
| ASSETS | | | |
| Investments in securities, at value* | | $ | 201,465,169 | |
| Receivables: | | | | |
| Dividends and interest receivable | | | 156,436 | |
| Securities lending income receivable | | | 18,560 | |
| Total Assets | | | 201,640,165 | |
| | | | | |
| LIABILITIES | | | | |
| Collateral received for securities loaned (Note 7) | | | 29,054,398 | |
| Payables: | | | | |
| Management fees payable | | | 64,437 | |
| Total Liabilities | | | 29,118,835 | |
| Net Assets | | $ | 172,521,330 | |
| | | | | |
| NET ASSETS CONSIST OF: | | | | |
| Paid-in capital | | $ | 196,572,637 | |
| Total Distributable Earnings (Accumulated Losses) | | | (24,051,307 | ) |
| Net Assets | | $ | 172,521,330 | |
| | | | | |
| *Identified Cost: | | | | |
| Investments in securities | | $ | 206,171,554 | |
| | | | | |
| Shares Outstanding^ | | | 3,450,000 | |
| Net Asset Value, Offering and Redemption Price per Share | | $ | 50.01 | |
| ^ | No par value, unlimited number of shares authorized |
The accompanying notes are an integral part of these financial statements.
Etho Climate Leadership U.S. ETF
STATEMENT OF OPERATIONS
For the Year Ended September 30, 2023
| | | Etho Climate | |
| | | Leadership | |
| | | U.S. ETF | |
| INVESTMENT INCOME | | | | |
| Income: | | | | |
| Dividends from unaffiliated securities (net of foreign withholding tax of $644) | | $ | 2,414,417 | |
| Interest | | | 37,149 | |
| Securities lending income | | | 404,316 | |
| Total Investment Income | | | 2,855,882 | |
| | | | | |
| Expenses: | | | | |
| Unitary fees | | | 769,202 | |
| Total Expenses | | | 769,202 | |
| Net Investment Income | | | 2,086,680 | |
| | | | | |
| REALIZED & UNREALIZED GAIN (LOSS) ON INVESTMENTS | | | | |
| Net Realized Gain (Loss) on: | | | | |
| Unaffiliated investments | | | (9,235,205 | ) |
| In-Kind redemptions | | | 940,436 | |
| Net Realized Loss on Investments and In-Kind Redemptions | | | (8,294,769 | ) |
| Net Change in Unrealized Appreciation/Depreciation of: | | | | |
| Unaffiliated investments | | | 20,608,883 | |
| Net Change in Unrealized Appreciation/Depreciation of Investments | | | 20,608,883 | |
| Net Realized and Unrealized Gain on Investments | | | 12,314,114 | |
| NET INCREASE IN NET ASSETS RESULTING FROM OPERATIONS | | $ | 14,400,794 | |
The accompanying notes are an integral part of these financial statements.
Etho Climate Leadership U.S. ETF
STATEMENTS OF CHANGES IN NET ASSETS
| | | Year Ended | | | Year Ended | |
| | | September 30, | | | September 30, | |
| | | 2023 | | | 2022 | |
| OPERATIONS | | | | | | | | |
| Net investment income | | $ | 2,086,680 | | | $ | 1,623,659 | |
| Net realized (loss) gain on investments and In-Kind Redemptions | | | (8,294,769 | ) | | | 9,048,708 | |
| Net change in unrealized appreciation (depreciation) of investments | | | 20,608,883 | | | | (52,481,644 | ) |
| Net increase (decrease) in net assets resulting from operations | | | 14,400,794 | | | | (41,809,277 | ) |
| | | | | | | | | |
| DISTRIBUTIONS TO SHAREHOLDERS | | | | | | | | |
| Total Distributions to Shareholders | | | (2,120,978 | ) | | | (1,482,849 | ) |
| | | | | | | | | |
| CAPITAL SHARE TRANSACTIONS | | | | | | | | |
| Net increase in net assets derived from net change in outstanding shares | | | 12,571,350 | | | | 12,892,115 | |
| Net increase (decrease) in net assets | | | 24,851,166 | | | | (30,400,011 | ) |
| | | | | | | | | |
| NET ASSETS | | | | | | | | |
| Beginning of Year | | | 147,670,164 | | | | 178,070,175 | |
| End of Year | | $ | 172,521,330 | | | $ | 147,670,164 | |
Summary of share transactions is as follows:
| | | | Year Ended | | | Year Ended | |
| | | | September 30, 2023 | | | September 30, 2022 | |
| | | | Shares | | | Amount | | | Shares | | | Amount | |
| Shares Sold | | | | 350,000 | | | $ | 17,582,385 | | | | 1,000,000 | | | $ | 57,868,130 | |
| Shares Redeemed | | | | (100,000 | ) | | | (5,011,035 | ) | | | (800,000 | ) | | | (44,976,015 | ) |
| Net Transactions in Fund Shares | | | | 250,000 | | | $ | 12,571,350 | | | | 200,000 | | | $ | 12,892,115 | |
| | | | | | | | | | | | | | | | | | |
| Beginning Shares | | | | 3,200,000 | | | | | | | | 3,000,000 | | | | | |
| Ending Shares | | | | 3,450,000 | | | | | | | | 3,200,000 | | | | | |
The accompanying notes are an integral part of these financial statements.
Etho Climate Leadership U.S. ETF
FINANCIAL HIGHLIGHTS
For a capital share outstanding throughout the year
| | | Year Ended | | | Year Ended | | | Year Ended | | | Year Ended | | | Year Ended | |
| | | September 30, | | | September 30, | | | September 30, | | | September 30, | | | September 30, | |
| | | 2023 | | | 2022 | | | 2021 | | | 2020 | | | 2019 | |
| Net Asset Value, Beginning of Year | | $ | 46.15 | | | $ | 59.36 | | | $ | 44.18 | | | $ | 39.58 | | | $ | 37.50 | |
| Income from Investment Operations: | | | | | | | | | | | | | | | | | | | | |
| Net Investment Income 1 | | | 0.63 | | | | 0.52 | | | | 0.47 | | | | 0.41 | | | | 0.33 | |
| Net realized and unrealized gain (loss) on investments | | | 3.87 | | | | (13.26 | ) | | | 15.17 | | | | 4.54 | | | | 2.08 | |
| Total from investment operations | | | 4.50 | | | | (12.74 | ) | | | 15.64 | | | | 4.95 | | | | 2.41 | |
| Less Distributions: | | | | | | | | | | | | | | | | | | | | |
| Distributions from net investment income | | | (0.64 | ) | | | (0.47 | ) | | | (0.46 | ) | | | (0.35 | ) | | | (0.33 | ) |
| Net realized gains | | | — | | | | — | | | | — | | | | — | | | | — | |
| Total distributions | | | (0.64 | ) | | | (0.47 | ) | | | (0.46 | ) | | | (0.35 | ) | | | (0.33 | ) |
| Net assets value, end of year | | $ | 50.01 | | | $ | 46.15 | | | $ | 59.36 | | | $ | 44.18 | | | $ | 39.58 | |
| Total Return | | | 9.74 | % | | | (21.58 | )% | | | 35.48 | % | | | 12.59 | % | | | 6.53 | % |
| | | | | | | | | | | | | | | | | | | | | |
| Ratios/Supplemental Data: | | | | | | | | | | | | | | | | | | | | |
| Net assets at end of year (000’s) | | $ | 172,521 | | | $ | 147,670 | | | $ | 178,070 | | | $ | 90,561 | | | $ | 53,431 | |
| Expenses to Average Net Assets | | | 0.45 | % | | | 0.45 | % | | | 0.45 | % | | | 0.45 | % | | | 0.45 | % |
| Net Investment Income to Average Net Assets | | | 1.22 | % | | | 0.92 | % | | | 0.83 | % | | | 1.00 | % | | | 0.88 | % |
| Portfolio Turnover Rate | | | 50 | % | | | 30 | % | | | 45 | % | | | 37 | % | | | 41 | % |
| 1 | Calculated based on average shares outstanding during the year. |
The accompanying notes are an integral part of these financial statements.
Etho Climate Leadership U.S. ETF
NOTES TO FINANCIAL STATEMENTS
September 30, 2023
NOTE 1 – ORGANIZATION
Etho Climate Leadership U.S. ETF (the “Fund”) is a series of ETF Managers Trust (the “Trust”), an open-end management investment company consisting of multiple investment series, organized as a Delaware statutory trust on July 1, 2009. The Trust is registered with the SEC under the Investment Company Act of 1940, as amended (the “1940 Act”), as an open-end management investment company and the offering of the Fund’s shares (“Shares”) is registered under the Securities Act of 1933, as amended (the “Securities Act”). The Fund seeks to provide investment results that, before fees and expenses, correspond generally to the price and yield performance of the Etho Climate Leadership Index – U.S. (“the Index”). The Fund commenced operations on November 18, 2015.
The Fund currently offers one class of shares, which has no front end sales load, no deferred sales charges, and no redemption fees. The Fund may issue an unlimited number of shares of beneficial interest, with no par value. All shares of the Fund have equal rights and privileges.
Shares of the Fund are listed and traded on the NYSE Arca, Inc. Market prices for the Shares may be different from their net asset value (“NAV”). The Fund issues and redeems Shares on a continuous basis at NAV only in blocks of 50,000 shares, called “Creation Units.” Creation Units are issued and redeemed principally in-kind for securities included in the Index. Once created, Shares generally trade in the secondary market at market prices that change throughout the day in quantities less than a Creation Unit. Except when aggregated in Creation Units, Shares are not redeemable securities of the Fund. Shares of the Fund may only be purchased or redeemed by certain financial institutions (“Authorized Participants”). An Authorized Participant is either (i) a broker-dealer or other participant in the clearing process through the Continuous Net Settlement System of the National Securities Clearing Corporation or (ii) a DTC participant and, in each case, must have executed a Participant Agreement with the Distributor. Most retail investors do not qualify as Authorized Participants nor have the resources to buy and sell whole Creation Units. Therefore, they are unable to purchase or redeem the Shares directly from the Fund. Rather, most retail investors may purchase Shares in the secondary market with the assistance of a broker and may be subject to customary brokerage commissions or fees.
Authorized Participants transacting in Creation Units for cash may pay an additional variable charge to compensate the relevant Fund for certain transaction costs (i.e., brokerage costs) and market impact expenses relating to investing in portfolio securities. Such variable charges, if any, are included in “Transaction Fees” in the Statements of Changes in Net Assets.
NOTE 2 – SIGNIFICANT ACCOUNTING POLICIES
The following is a summary of significant accounting policies consistently followed by the Fund. These policies are in conformity with accounting principles generally accepted in the United States of America (“U.S. GAAP”).
The Fund follows the investment company accounting and reporting guidance of the Financial Accounting Standards Board Accounting Standard Codification Topic 946 Financial Services – Investment Companies.
The Fund may invest in certain other investment companies (underlying funds). For more information about the underlying fund’s operations and policies, please refer to those funds’ semiannual and annual reports, which are filed with the SEC.
| A. | Security Valuation. Securities listed on a securities exchange, market or automated quotation system for which quotations are readily available (except for securities traded on NASDAQ), including securities traded over the counter, are valued at the last quoted sale price on the primary exchange or market (foreign or domestic) on which they are traded on the valuation date (or at approximately 4:00 pm Eastern Time if a security’s primary exchange is normally open at that time), or, if there is no such reported sale on the valuation date, at the most recent quoted bid price. For securities traded on NASDAQ, the NASDAQ Official Closing Price will be used. |
Etho Climate Leadership U.S. ETF
NOTES TO FINANCIAL STATEMENTS
September 30, 2023 (Continued)
Securities for which quotations are not readily available are valued at their respective fair values as determined in good faith by ETF Managers Group, LLC (the “Adviser”), using procedures adopted by the Board of Trustees (the “Board”). When a security is “fair valued,” consideration is given to the facts and circumstances relevant to the particular situation, including a review of various factors set forth in the pricing procedures adopted by the Fund’s Board. The use of fair value pricing by the Fund may cause the net asset value of its shares to differ significantly from the net asset value that would be calculated without regard to such considerations. As of September 30, 2023, the Fund did not hold any securities fair valued by the Adviser.
As described above, the Fund utilizes various methods to measure the fair value of its investments on a recurring basis. U.S. GAAP establishes a hierarchy that prioritizes inputs to valuation methods. The three levels of inputs are:
| Level 1 | Unadjusted quoted prices in active markets for identical assets or liabilities that the Fund has the ability to access. |
| Level 2 | Observable inputs other than quoted prices included in Level 1 that are observable for the asset or liability, either directly or indirectly. These inputs may include quoted prices for the identical instrument on an inactive market, prices for similar instruments, interest rates, prepayment speeds, credit risk, yield curves, default rates and similar data. |
| Level 3 | Unobservable inputs for the asset or liability, to the extent relevant observable inputs are not available; representing the Fund’s own assumptions about the assumptions a market participant would use in valuing the asset or liability, and would be based on the best information available. |
The availability of observable inputs can vary from security to security and is affected by a wide variety of factors, including, for example, the type of security, whether the security is new and not yet established in the marketplace, the liquidity of markets, and other characteristics particular to the security. To the extent that valuation is based on models or inputs that are less observable or unobservable in the market, the determination of fair value requires more judgment. Accordingly, the degree of judgment exercised in determining fair value is greatest for instruments categorized in Level 3.
The inputs used to measure fair value may fall into different levels of the fair value hierarchy. In such cases, for disclosure purposes, the level in the fair value hierarchy within which the fair value measurement falls in its entirety, is determined based on the lowest level input that is significant to the fair value measurement in its entirety.
The following table presents a summary of the inputs used to value the Fund’s net assets as of September 30, 2023:
Etho Climate Leadership U.S. ETF
| Assets^ | | Level 1 | | | Level 2 | | | Level 3 | | | Total | |
| Common Stocks | | $ | 172,167,218 | | | $ | — | | | $ | — | | | $ | 172,167,218 | |
| Short-Term Investments | | | 243,553 | | | | — | | | | — | | | | 243,553 | |
| Investments Purchased with Securities Lending | | | | | | | | | | | | | | | | |
| Collateral* | | | — | | | | — | | | | — | | | | 29,054,398 | |
| Total Investments in Securities | | $ | 172,410,771 | | | $ | — | | | $ | — | | | $ | 201,465,169 | |
| ^ | See Schedule of Investments for classifications by sector or country. |
| * | Certain investments that are measured at fair value using the net asset value per share (or its equivalent) practical expedient have not been categorized in the fair value hierarchy. The fair value amounts presented in the table are intended to permit reconciliation of the fair value hierarchy to the amounts presented in the Schedule of Investments. |
| B. | Federal Income Taxes. The Fund has elected to be taxed as a “regulated investment company” and intends to distribute substantially all taxable income to its shareholders and otherwise comply with the provisions of the Internal Revenue Code applicable to regulated investment companies. Therefore, no provisions for federal income taxes or excise taxes have been made. |
Etho Climate Leadership U.S. ETF
NOTES TO FINANCIAL STATEMENTS
September 30, 2023 (Continued)
To avoid imposition of the excise tax applicable to regulated investment companies, the Fund intends to declare each year as dividends, in each calendar year, at least 98.0% of its net investment income (earned during the calendar year) and 98.2% of its net realized capital gains (earned during the twelve months ended October 31) plus undistributed amounts, if any, from prior years.
Net capital losses incurred after October 31, within the taxable year are deemed to arise on the first business day of the Fund’s next taxable year.
The Fund recognizes the tax benefits of uncertain tax positions only where the position is “more likely than not” to be sustained assuming examination by tax authorities. The Fund has analyzed its tax position and has concluded that no liability for unrecognized tax benefits should be recorded related to uncertain tax positions expected to be taken in the Fund’s 2023 tax returns. The Fund identifies its major tax jurisdictions as U.S. Federal, the State of New Jersey, and the State of Delaware; however the Fund is not aware of any tax positions for which it is reasonably possible that the total amounts of unrecognized tax benefits will change materially in the next twelve months.
As of September 30, 2023, management has reviewed the tax positions for open periods (for federal purposes, three years from the date of filing and for state purposes, generally a range of three to four years from the date of filing) as applicable to the Fund, and has determined that no provision for income tax is required in the Fund’s financial statements.
| C. | Security Transactions and Investment Income. Investment securities transactions are accounted for on the trade date. Gains and losses realized on sales of securities are determined on a specific identification basis. Discounts/premiums on debt securities purchased are accreted/amortized over the life of the respective securities using the effective interest method. Dividend income is recorded on the ex-dividend date. Interest income is recorded on an accrual basis. Income, including gains, from investments in foreign securities received by the Fund may be subject to income, withholding or other taxes imposed by foreign countries. |
| D. | Foreign Currency Translations and Transactions. The Fund may engage in foreign currency transactions. Foreign currency transactions are translated into U.S. dollars on the following basis: (i) market value of investment securities, assets and liabilities at the daily rates of exchange, and (ii) purchases and sales of investment securities, dividend and interest income and certain expenses at the rates of exchange prevailing on the respective dates of such transactions. For financial reporting purposes, the Fund does not isolate changes in the exchange rate of investment securities from the fluctuations arising from changes in the market prices of securities for unrealized gains and losses. However, for federal income tax purposes, the Fund does isolate and treat as ordinary income the effect of changes in foreign exchange rates on realized gains or losses from the sale of investment securities and payables and receivables arising from trade-date and settlement-date differences. |
| E. | Distributions to Shareholders. Distributions to shareholders from net investment income, if any, are declared and paid by the Fund on a quarterly basis. Distributions to shareholders from net realized gains on securities of the Fund normally are declared and paid on an annual basis. Distributions are recorded on the ex-dividend date. |
| F. | Use of Estimates. The preparation of financial statements in conformity with U.S. GAAP requires management to make estimates and assumptions that affect the reported amounts of assets and liabilities at the date of the financial statements, as well as the reported amounts of revenues and expenses during the period. Actual results could differ from those estimates. |
| G. | Share Valuation. The net asset value (“NAV”) per share of the Fund is calculated by dividing the sum of the value of the securities held by the Fund, plus cash and other assets, minus all liabilities (including estimated accrued expenses) by the total number of shares outstanding by the Fund, rounded to the nearest cent. The Fund’s shares will not be priced on the days on which the NYSE is closed for trading. The offering and redemption price per share for the Fund is equal to the Fund’s net asset value per share. |
Etho Climate Leadership U.S. ETF
NOTES TO FINANCIAL STATEMENTS
September 30, 2023 (Continued)
| H. | Guarantees and Indemnifications. In the normal course of business, the Fund enters into contracts with service providers that contain general indemnification clauses. The Fund’s maximum exposure under these arrangements is unknown as this would involve future claims that may be made against the Fund that have not yet occurred. However, based on experience, the Fund expects the risk of loss to be remote. |
NOTE 3 – RISK FACTORS
Investing in the Etho Climate Leadership U.S. ETF may involve certain risks, as discussed in the Fund’s prospectus, including, but not limited to, those described below. Any of these risks could cause an investor to lose money.
Market Risk. Financial markets rise and fall in response to a variety of factors, sometimes rapidly and unpredictably. As with any investment whose performance is tied to these markets, the value of an investment in a fund will fluctuate, which means that an investor could lose money over short or long periods.
Investment Style Risk. The Fund is not actively managed. Therefore, the Fund follows the securities included in its respective index during upturns as well as downturns. Because of its indexing strategy, the Fund does not take steps to reduce market exposure or to lessen the effects of a declining market. In addition, because of the Fund’s expenses, the Fund’s performance may be below that of its index.
Equity Risk. The prices of equity securities rise and fall daily. These price movements may result from factors affecting individual companies, industries or the securities market as a whole. In addition, equity markets tend to move in cycles which may cause stock prices to fall over short or extended periods of time.
Securities Lending Risk. Securities lending involves the risk of loss of rights in, or delay in recovery of, the loaned securities if the borrower fails to return the security loaned or becomes insolvent.
Concentration Risk. To the extent that the Fund’s or its underlying index’s portfolio is concentrated in the securities of issuers in a particular market, industry, group of industries, sector or asset class, the Fund may be adversely affected by the performance of those securities, may be subject to increased price volatility and may be more vulnerable to adverse economic, market, political or regulatory occurrences affecting that market, industry, group of industries, sector or asset class.
Natural Disaster/Epidemic Risk. Natural or environmental disasters, such as earthquakes, fires, floods, hurricanes, tsunamis and other severe weather related phenomena generally, and widespread disease, including pandemics and epidemics (for example, the novel coronavirus COVID -19), have been and can be highly disruptive to economies and markets and have recently led, and may continue to lead, to increased market volatility and significant market losses. Such natural disaster and health crises could exacerbate political, social, and economic risks previously mentioned, and result in significant breakdowns, delays, shutdowns, social isolation, and other disruptions to important global, local and regional supply chains affected, with potential corresponding results on the operating performance of the Fund and its investments. A climate of uncertainty and panic, including the contagion of infectious viruses or diseases, may adversely affect global, regional, and local economies and reduce the availability of potential investment opportunities, and increases the difficulty of performing due diligence and modeling market conditions, potentially reducing the accuracy of financial projections. Under these circumstances, the Fund may have difficulty achieving its investment objective which may adversely impact performance. Further, such events can be highly disruptive to economies and markets, significantly disrupt the operations of individual companies (including, but not limited to, the Fund’s third party service providers), sectors, industries, markets, securities and commodity exchanges, currencies, interest and inflation rates, credit ratings, investor sentiment, and other factors affecting the value of the Fund’s investments. These factors can cause substantial market volatility, exchange trading suspensions and closures and can impact the ability of the Fund to complete redemptions and otherwise affect Fund performance and Fund trading in the secondary market. A widespread crisis may also affect the global economy in ways that cannot necessarily be foreseen at the current time. How long such events will last and whether they will continue or recur cannot be predicted. Impacts from these events could have significant impact on the Fund’s performance, resulting in losses to the Fund.
Etho Climate Leadership U.S. ETF
NOTES TO FINANCIAL STATEMENTS
September 30, 2023 (Continued)
On February 24, 2022, Russia commenced a military attack on Ukraine. The outbreak of hostilities between the two countries could result in more widespread conflict and could have a severe adverse effect on the region and the markets. In addition, sanctions imposed on Russia by the United States and other countries, and any sanctions imposed in the future could have a significant adverse impact on the Russian economy and related markets.
On October 7, 2023, Hamas launched a significant attack on Israel from the Gaza Strip. The extent and duration of the Israel-Hamas war and any related economic and market impacts are impossible to predict but may be significant and may negatively impact Israel’s economy. The price and liquidity of investments may fluctuate widely as a result of these conflicts and related events. How long such conflicts and related events will last, and whether either may escalate further, cannot be predicted, however such conflicts may negatively impact issuers of securities in which the Fund(s) invests.
A complete description of the principal risks is included in the Fund’s prospectus under the heading “Principal Investment Risks.”
NOTE 4 – MANAGEMENT AND CONTRACTS
The Adviser serves as the investment advisor to the Fund. Pursuant to an Investment Advisory Agreement (“Advisory Agreement”) between the Trust, on behalf of the Fund, and the Adviser, the Adviser provides investment advice to the Fund and oversees the day-today operations of the Fund, subject to the direction and control of the Board and the officers of the Trust. Under the Advisory Agreement, the Adviser is also responsible for arranging transfer agency, custody, fund administration and accounting, and other non-distribution related services necessary for the Fund to operate.
Under the Investment Advisory Agreement with the Fund, the Adviser has overall responsibility for the general management and administration of the Fund and arranges for sub-advisory, transfer agency, custody, fund administration, securities lending, and all other non-distribution related services necessary for the Fund to operate. The Adviser bears the costs of all advisory and non-advisory services required to operate the Fund, in exchange for a single unitary fee. For services provided the Fund pays the Adviser at an annual rate of 0.45% of the Fund’s average daily net assets. Under the Investment Advisory Agreement, the Adviser has agreed to pay all expenses of the Fund, except for: the fee paid to the Adviser pursuant to the Investment Advisory Agreement, interest charges on any borrowings, taxes, brokerage commissions and other expenses incurred in placing orders for the purchase and sale of securities and other investment instruments, acquired fund fees and expenses, accrued deferred tax liability, extraordinary expenses, and distribution (12b-1) fees and expenses (collectively, ” Excluded Expenses”). The Adviser has entered into an agreement with Foreside Fund Services LLC, to serve as distributor to the Fund (the “Distributor”). The Distributor provides marketing support for the Fund, including distributing marketing materials related to the Fund.
The Adviser has entered into an Agreement with Etho Capital, LLC ( “Etho”), under which Etho agrees to sublicense the use of the Underlying Index to the Adviser. Etho also provides marketing support for the Fund. Etho does not make investment decisions, provide investment advice, or otherwise act in the capacity of an investment Adviser to the Fund.
U.S. Bancorp Fund Services, LLC doing business as U.S. Bank Global Fund Services (the “Administrator”) provides fund accounting, fund administration, and transfer agency services to the Fund. The Adviser compensates the Administrator for these services under an administration agreement between the two parties.
The Adviser pays each independent Trustee a quarterly fee for service to the Fund. Each Trustee is also reimbursed by the Adviser for all reasonable out-of-pocket expenses incurred in connection with his duties as Trustee, including travel and related expenses incurred in attending Board meetings.
Etho Climate Leadership U.S. ETF
NOTES TO FINANCIAL STATEMENTS
September 30, 2023 (Continued)
NOTE 5 - DISTRIBUTION PLAN
The Fund has adopted a Plan of Distribution pursuant to Rule 12b-1 under the 1940 Act. Under the Plan, the Fund may pay compensation to the Distributor or any other distributor or financial institution with which the Trust has an agreement with respect to the Fund, with the amount of such compensation not to exceed an annual rate of 0.25% of each Fund’s average daily net assets. For the year ended September 30, 2023, the Fund did not incur any 12b-1 expenses.
NOTE 6 - PURCHASES AND SALES OF SECURITIES
The costs of purchases and sales of securities, excluding short-term securities and in-kind transactions, for the year ended September 30, 2023:
| | | Purchases | | | Sales | |
| Etho Climate Leadership U.S. ETF | | $ | 86,641,210 | | | $ | 86,219,651 | |
The costs of purchases and sales of in-kind transactions associated with creations and redemptions for the year ended September 30, 2023:
| | | Purchases In-
Kind | | | Sales In-
Kind | |
| Etho Climate Leadership U.S. ETF | | $ | 17,345,542 | | | $ | 4,940,424 | |
Purchases in-kind are the aggregate of all in-kind purchases and sales in-kind are the aggregate of all proceeds from in-kind sales. Net capital gains or losses resulting from in-kind redemptions are excluded from the determination of the Fund’s taxable gains and are not distributed to shareholders.
There were no purchases or sales of U.S. Government obligations for the year ended September 30, 2023.
NOTE 7 - SECURITIES LENDING
The Fund may lend up to 33 1∕3% of the value of the securities in its portfolio to brokers, dealers and financial institutions (but not individuals) under terms of participation in a securities lending program administered by U.S. Bank N.A. (“the Custodian”). The securities lending agreement requires that loans are collateralized at all times in an amount equal to at least 102% of the value of any loaned securities at the time of the loan, plus accrued interest. The Fund receives compensation in the form of fees and earn interest on the cash collateral. The amount of fees depends on a number of factors including the type of security and length of the loan. The Fund continues to receive interest payments or dividends on the securities loaned during the borrowing period. Gain or loss in the fair value of securities loaned that may occur during the term of the loan will be for the account of the Fund. The Fund has the right under the terms of the securities lending agreement to recall the securities from the borrower on demand. The cash collateral is invested by the Custodian in accordance with approved investment guidelines. Those guidelines require the cash collateral to be invested in readily marketable, high quality, short-term obligations either directly on behalf of the Fund or through one or more joint accounts, money market funds, or short-term bond funds, including those advised by or affiliated with the Adviser; however, such investments are subject to risk of payment delays or default on the part of the issuer or counterparty or otherwise may not generate sufficient interest to support the costs associated with securities lending. Other investment companies, in which the Fund may invest cash collateral, can be expected to incur fees and expenses for operations, such as investment advisory and administration fees, which would be in addition to those incurred by the Fund, and which may be received in full or in part by the Adviser. Pursuant to guidance issued by the SEC staff, fees and expenses of money market funds used for cash collateral received in connection with loans of securities are not treated as Acquired Fund Fees and Expenses, which reflect a fund’s pro rata share of the fees and expenses incurred by other investment companies in which the Fund invests (as disclosed in the Prospectus, as applicable). The Fund could also experience delays in recovering its securities and possible loss of income or value if the borrower fails to return the borrowed securities, although the Fund is indemnified from this risk by contract with the securities lending agent.
Etho Climate Leadership U.S. ETF
NOTES TO FINANCIAL STATEMENTS
September 30, 2023 (Continued)
As of September 30, 2023, the value of the securities on loan and payable for collateral due to broker were as follows:
Value of Securities on Loan Collateral Received
| Fund | | Values of Securities
on Loan | | | Fund Collateral
Received* | |
| Etho Climate Leadership U.S. ETF | | $ | 28,201,156 | | | $ | 29,054,398 | |
| * | The cash collateral received was invested in the Mount Vernon Liquid Assets Portfolio as shown on the Schedule of Investments, an investment with an overnight and continuous maturity. |
NOTE 8 – FEDERAL INCOME TAXES
The components of distributable earnings (losses) and cost basis of investments for federal income tax purposes at September 30, 2023, were as follows:
| | | Cost | | | Gross
Unrealized
Appreciation | | | Gross
Unrealized
Depreciation | | | Net
Unrealized
Appreciation
(Depreciation) | |
| Etho Climate Leadership U.S. ETF | | $ | 208,987,279 | | | $ | 20,674,739 | | | $ | (28,240,008 | ) | | $ | (7,565,269 | ) |
| | | | | | | | | | | | | | | | | |
| | | Undistributed
Ordinary
Income | | | Undistributed
Long-
Term Gain | | | Total
Distributable
Earnings | | | Other
Accumulated
(Loss) | | Total
Accumulated
Gain |
| Etho Climate Leadership U.S. ETF | | $ | 138,427 | | | $ | — | | | $ | 138,427 | | | $ | (16,624,465 | ) | $ | (24,051,307 | ) |
|
As of September 30, 2023, the Fund had accumulated capital loss carryovers of:
| | | Capital Loss | | | Capital Loss | | | | |
| | | Carryover | | | Carryover | | | | |
| | | ST | | | LT | | | Expires | |
| Etho Climate Leadership U.S. ETF | | $ | (8,557,418 | ) | | $ | (8,067,047 | ) | | Indefinite | |
Under current tax law, capital and currency losses realized after October 31 of a fund’s fiscal year may be deferred and treated as occurring on the first business day of the following fiscal year for tax purposes. The Fund had deferred post -October capital and currency losses, which will be treated as arising on the first business day of the year ended September 30, 2023.
| | | Later Year | | | Post- | |
| | | Ordinary Loss | | | October Loss | |
| Etho Climate Leadership U.S. ETF | | None | | | None | |
U.S. GAAP requires that certain components of net assets relating to permanent differences be reclassified between financial and tax reporting. These reclassifications have no effect on net assets or net asset value per share. For the fiscal year ended September 30, 2023, the following table shows the reclassifications made:
| | | Total | | | | |
| | | Distributable | | | Paid-In | |
| | | Earnings/(Loss) | | | Capital | |
| Etho Climate Leadership U.S. ETF | | $ | (916,464 | ) | | $ | 916,464 | |
The tax character of distributions paid by the Fund during the fiscal year ended September 30, 2023 and fiscal year ended September 30, 2022 are as follows:
| | | Year Ended | | | Year Ended | |
| | | September 30, 2023 | | | September 30, 2022 | |
| | | From | | | From | | | From | | | From | |
| | | Ordinary | | | Capital | | | Ordinary | | | Capital | |
| | | Income | | | Gains | | | Income | | | Gains | |
| Etho Climate Leadership U.S. ETF | | $ | 2,120,978 | | | $ | — | | | $ | 1,482,849 | | | $ | — | |
Etho Climate Leadership U.S. ETF
NOTES TO FINANCIAL STATEMENTS
September 30, 2023 (Continued)
NOTE 9 – LEGAL MATTERS
The Trust, the Adviser, and certain officers and affiliated persons of the Adviser (together with the Adviser, the “Adviser Defendants”) were named as defendants in an action filed December 21, 2021, in the Superior Court of New Jersey, Union County, captioned PureShares, LLC, d/b/a PureFunds et al. v. ETF Managers Group, LLC et al., Docket No. UNN-C-152-21 (the “NJ Action”). The NJ Action asserted breach of contract and other tort claims and sought damages in unspecified amounts and injunctive relief. On May 25, 2022, the court in the NJ Action dismissed with prejudice all claims asserted against the Trust, as well as all contract claims and all except one tort claim asserted against the Adviser Defendants. With respect to the tort claim asserted against the Adviser Defendants, the parties stipulated and agreed to dismiss that claim without prejudice in May 2023.
The Adviser and certain of its affiliates have entered into a settlement agreement with the Securities and Exchange Commission (“SEC”) regarding certain alleged conflicts of interest arising in connection with ETFMG Alternative Harvest ETF’s (MJ) participation in the securities lending program administered by its prior custodian. Without admitting or denying the SEC’s findings, the Adviser and its parent company agreed to censures, to a cease-and-desist order, and to pay, jointly and severally, a civil penalty of $4 million. The settlement resolves the SEC’s investigation of the Adviser and its affiliates.
NOTE 10 – SUBSEQUENT EVENTS
In preparing these financial statements, the Fund has evaluated events and transactions for potential recognition or disclosure through the date the financial statements were issued.
The Board of the Trust has approved an Agreement and Plan of Reorganization (the “Agreement”) providing for the reorganization of the Target Fund into a corresponding new fund (the “Acquiring Fund”), which is a newly created series of Amplify ETF Trust with similar investment objectives and the same fees and expenses as the corresponding Target Fund. The Reorganization is subject to certain conditions including approval by shareholders of the Target Fund. The following table shows shares of the Acquiring Fund that will be issued to shareholders of the corresponding Target Fund.
| Target Fund | Acquiring Fund |
| Etho Climate Leadership U.S. ETF | Amplify Etho Climate Leadership U.S. ETF |
The proxy solicitation materials were filed with the SEC on October 13, 2023. The Joint Special Meeting of Shareholders is to be held on December 28, 2023.
Other than as disclosed, there were no other subsequent events requiring recognition or disclosure through the date the financial statements were issued.
Report of Independent Registered Public Accounting Firm
To the Board of Trustees of ETF Managers Trust
and the Shareholders of Etho Climate Leadership U.S. ETF:
Opinion on the Financial Statements
We have audited the accompanying statement of assets and liabilities, including the schedule of investments, of Etho Climate Leadership U.S. ETF (the “Fund”) (a series of ETF Managers Trust) as of September 30, 2023, the related statement of operations for the year then ended, the statements of changes in net assets for each of the two years in the period then ended, and the financial highlights for each of the periods indicated therein, and the related notes (collectively referred to as the “financial statements”). In our opinion, the financial statements present fairly, in all material respects, the financial position of the Fund as of September 30, 2023, and the results of its operations for the year then ended, the changes in its net assets for each of the two years in the period then ended, and the financial highlights for each of the periods indicated therein, in conformity with accounting principles generally accepted in the United States of America.
Basis for Opinion
These financial statements and financial highlights are the responsibility of the Fund’s management. Our responsibility is to express an opinion on these financial statements and financial highlights based on our audits. We are a public accounting firm registered with the Public Company Accounting Oversight Board (United States) (“PCAOB”) and are required to be independent with respect to the Fund in accordance with the U.S. federal securities laws and the applicable rules and regulations of the Securities and Exchange Commission and the PCAOB.
We conducted our audits in accordance with the standards of the PCAOB. Those standards require that we plan and perform the audits to obtain reasonable assurance about whether the financial statements and financial highlights are free of material misstatement, whether due to error or fraud. The Fund is not required to have, nor were we engaged to perform, an audit of its internal control over financial reporting. As part of our audits we are required to obtain an understanding of internal control over financial reporting but not for the purpose of expressing an opinion on the effectiveness of the Fund’s internal control over financial reporting. Accordingly, we express no such opinion.
Our audits included performing procedures to assess the risks of material misstatement of the financial statements and financial highlights, whether due to error or fraud, and performing procedures that respond to those risks. Such procedures included examining, on a test basis, evidence regarding the amounts and disclosures in the financial statements and financial highlights. Our audits also included evaluating the accounting principles used and significant estimates made by management, as well as evaluating the overall presentation of the financial statements and financial highlights. Our procedures included confirmation of securities owned as of September 30, 2023 by correspondence with the custodian. We believe that our audits provide a reasonable basis for our opinion.
/s/WithumSmith+Brown, PC
We have served as the auditor for one or more series of the Trust since 2013.
New York, New York
November 29, 2023
Expense Example
Six Months Ended September 30, 2023 (Unaudited)
As a shareholder of Etho Climate Leadership U.S. ETF (the “Fund”) you incur two types of costs:
| (1) | transaction costs, including brokerage commissions on purchases and sales of Fund shares, and |
(2) ongoing costs, including management fees and other Fund expenses. These examples are intended to help you understand your ongoing costs (in dollars) of investing in the Fund and to compare these costs with the ongoing costs of investing in other funds. The example is based on an investment of $1,000 invested at the beginning of the period and held for the entire period (April 1, 2023 to September 30, 2023).
Actual Expenses
The first line of the table provides information about actual account values based on actual returns and actual expenses. You may use the information in this line, together with the amount you invested, to estimate the expenses that you paid over the period. Simply divide your account value by $1,000 (for example, an $8,600 account value divided by $1,000 = 8.6), then, multiply the result by the number in the first line under the heading entitled “Expenses Paid During Period” to estimate the expenses you paid on your account during this period.
Hypothetical Example for Comparison Purposes
The second line of the table provides information about hypothetical account values based on a hypothetical return and hypothetical expenses based on the Fund’s actual expense ratio and an assumed rate of return of 5% per year before expenses, which is not the Fund’s actual return. The hypothetical account values and expenses may not be used to estimate the actual ending account balance or expenses you paid for the period. You may use this information to compare the ongoing costs of investing in the Fund and other funds. To do so, compare this 5% hypothetical example with the 5% hypothetical examples that appear in the shareholder reports of the other funds. Please note that the expenses shown in the table are meant to highlight your ongoing costs only and do not reflect any transactional costs, such as brokerage commissions paid on purchases and sales of Fund shares. Therefore, the second line of the table is useful in comparing ongoing costs only and will not help you determine the relative total costs of owning different funds. If these transactional costs were included, your costs would have been higher.
| Fund Name | | Beginning
Account Value
April 1, 2023 | | | Ending
Account Value
September 30,
2023 | | | Expenses
Paid During
the Period^ | | | Annualized
Expense Ratio
During the
Period April
1, 2023 to
September 30,
2023 | |
| Etho Climate Leadership U.S. ETF | | | | | | | | | | | | | | | | |
| Actual | | $ | 1,000.00 | | | $ | 965.40 | | | $ | 2.22 | | | | 0.45 | % |
| Hypothetical (5% annual) | | | 1,000.00 | | | | 1,022.81 | | | | 2.28 | | | | 0.45 | % |
| ^ | The dollar amounts shown as expenses paid during the period are equal to the annualized six-month expense ratio multiplied by the average account value during the period, multiplied by 183/365 (to reflect the one-half year period). |
SUPPLEMENTARY INFORMATION
September 30, 2023 (Unaudited)
NOTE 1 – FREQUENCY DISTRIBUTION OF PREMIUMS AND DISCOUNTS
Information regarding how often shares of the Fund traded on the Exchange at a price above (i.e., at a premium) or below (i.e., at a discount) the NAV is available on the Fund’s website at www.etfmgfunds.com.
NOTE 2 – FEDERAL TAX INFORMATION
Qualified Dividend Income/Dividends Received Deduction
For the fiscal year ended September 30, 2023, certain dividends paid by the Fund may be subject to a maximum tax rate of 15%, as provided for by the Jobs and Growth Tax Reconciliation Act of 2003. The percentage of dividends declared from ordinary income designated as qualified dividend income was as follows:
| Fund Name | | Qualified
Dividend Income | |
| Etho Climate Leadership U.S. ETF | | | 100 | % |
For corporate shareholders, the percent of ordinary income distributions qualifying for the corporate dividends received deduction for the fiscal year ended September 30, 2023 was as follows:
| Fund Name | | Dividends
Received Deduction | |
| Etho Climate Leadership U.S. ETF | | | 100 | % |
Short Term Capital Gain
The percentage of taxable ordinary income distributions that are designated as short-term capital gain distributions under Internal Revenue Section 871 (k)(2)(C) for the Fund were as follows:
| Fund Name | | Short-Term
Capital Gain | |
| Etho Climate Leadership U.S. ETF | | | 0 | % |
NOTE 3 – INFORMATION ABOUT PORTFOLIO HOLDINGS
The Fund files a complete schedule of portfolio holdings with the SEC for its first and third fiscal quarters on Part F of Form N-PORT. Once filed, the Fund’s Part F of Form N-PORT is available without charge, upon request on the SEC’s website (www.sec.gov), the Fund’s website (www.etfmgfunds.com) and is available by calling (877) 756-7873. The Fund’s portfolio holdings are posted on the Fund’s website at www.etfmgfunds.com daily.
NOTE 4 – INFORMATION ABOUT PROXY VOTING
A description of the policies and procedures the Fund uses to determine how to vote proxies relating to portfolio securities is provided in the Statement of Additional Information (“SAI”). The SAI is available without charge upon request by calling toll-free at 1 -844-ETF-MGRS (1-844-383-6477), by accessing the SEC’s website at www.sec.gov, or by accessing the Fund’s website at www.etfmgfunds.com.
Information regarding how the Fund voted proxies relating to portfolio securities during the period ending June 30 is available by calling toll -free at 1-844-ETF-MGRS (1-844-383-6477) or by accessing the SEC’s website at www.sec.gov.
Carefully consider the Fund’s investment objectives, risk factors, charges, and expenses before investing. This and additional information can be found in the Fund’s prospectus, which may be obtained by calling 1-844-ETF-MGRS (1-844-383-6477) or by visiting www.etfmgfunds.com. This report must be preceded or accompanied by a prospectus.
Board of Trustees
Set forth below are the names, birth years, positions with the Trust, length of term of office, and the principal occupations and other directorships held during at least the last five years of each of the persons currently serving as a Trustee of the Trust, as well as information about each officer. The business address of each Trustee and officer is 30 Maple Street, 2nd Floor, Summit, New Jersey 07901. The SAI includes additional information about Fund directors and is available, without charge, upon request by calling 1-844-ETF-MGRS (1-844-383-6477).
| Name and Year of Birth | Position(s)
Held with the
Trust, Term
of Office and
Length of
Time Served | Principal Occupation(s)
During Past 5 Years | Number of
Portfolios in
Fund
Complex
Overseen By
Trustee | Other
Directorships
Held by
Trustee
During Past 5
Years |
| Interested Trustee and Officers | | | |
Michael Minella (1971) | President (since 2023) | Senior Principal Consultant, ACA Group (since 2022); Vice President and Director, Fidelity Investments (2009-2022). | n/a | n/a |
John A. Flanagan (1946) | Treasurer (since 2015) | President, John A. Flanagan CPA, LLC (accounting services) (since 2010); Treasurer, ETF Managers Trust (since 2015); Chief Financial Officer, ETF Managers Capital, LLC (commodity pool operator) (since 2015). | n/a | Independent Trustee - Absolute Shares Trust (since 2014) (6 portfolios) |
Kevin Hourihan (1978) | Chief Compliance Officer (since 2022) | Senior Principal Consultant, Fund Chief Compliance Officer, ACA Global, LLC (since 2022); Chief Compliance Officer, Ashmore Funds (2017 -2022); Chief Compliance Officer, Ashmore Investment Management (US) Corp (2014-2022); Chief Compliance Officer, Ashmore Equities Investment Management (2015- 2019). | n/a | n/a |
Matthew J. Bromberg (1973) | Secretary (since 2023) | Chief Compliance Officer and Chief Compliance Officer of ETF Managers Group, LLC (since 2022); General Counsel and Secretary of Exchange Traded Managers Group LLC (since 2020); ETF Managers Group LLC (since 2020); ETFMG Financial LLC (since 2020); ETF Managers Capital LLC (since 2020); Partner of Dorsey & Whitney LLP (law firm) (2019-2020); General Counsel of WBI Investments, Inc. (2016-2019); Millington Securities, Inc. (2016-2019). | n/a | n/a |
Board of Trustees (Continued)
| Name and Year of Birth | Position(s)
Held with the
Trust, Term
of Office and
Length of
Time Served | Principal Occupation(s)
During Past 5 Years | Number of
Portfolios in
Fund
Complex
Overseen By
Trustee | Other
Directorships
Held by
Trustee
During Past 5
Years |
Terry Loebs (1963) | Chairman of the Board (since 2023); Trustee (since 2014); Lead Independent Trustee (since 2020) | Founder and Managing Member, Pulsenomics LLC (index product development and consulting firm) (since 2011); Managing Director, MacroMarkets, LLC (exchange-traded products firm) (2006- 2011). | 12 | None |
Eric Wiegel (1960) | Trustee (since 2020) | Managing Partner, Global Focus Capital LLC (since 2013); Senior Portfolio Manager, Little House Capital (2019-2021); Chief Investment Officer, Insight Financial Strategist LLC (2017- 2018). | 12 | None |
ETF MANAGERS TRUST
Privacy Policy and Procedures
ETF Managers Trust, (the “Trust”) has adopted the following privacy policies in order to safeguard the personal information of the Trust’s customers and consumers in accordance with Regulation S-P as promulgated by the U.S. Securities and Exchange Commission.
Trust officers are responsible for ensuring that the following policies and procedures are implemented:
1) The Trust is committed to protecting the confidentiality and security of the information they collect and will handle personal customer and consumer information only in accordance with Regulation S-P and any other applicable laws, rules and regulations1. The Trust will ensure: (a) the security and confidentiality of customer records and information; (b) that customer records and information are protected from any anticipated threats and hazards; and (c) that customer records and information are protected from unauthorized access or use.
2) The Trust conducts its business affairs through its trustees, officers and third parties that provide services pursuant to agreements with the Trust. The Trust has no employees. It is anticipated that the trustees and officers of the Trust who are not employees of service providers of the Trust will not have access to customer records and information in the performance of their normal responsibilities for the Trust.
3) The Trust may share customer information with its affiliates, subject to the customers’ right to prohibit such sharing.
4) The Trust may share customer information with unaffiliated third parties only in accordance with the requirements of Regulation S-P. Pursuant to this policy, the Trust will not share customer information with unaffiliated third parties other than as permitted by law, unless authorized to do so by the customer.
Consistent with these policies, the Trust has adopted the following procedures:
1) The Trust will determine that the policies and procedures of its affiliates and Service Providers are reasonably designed to safeguard customer information and only permit appropriate and authorized access to and use of customer information through the application of appropriate administrative, technical and physical protections.
2) The Trust will direct each of its Service Providers to adhere to the privacy policy of the Trust and to its privacy policies with respect to all customer information of the Trust and to take all actions reasonably necessary so that the Trust is in compliance with the provisions of Regulation S-P, including, as applicable, the development and delivery of privacy notices and the maintenance of appropriate and adequate records.
3) The Trust requires its Service Providers to provide periodic reports to the Trust’s Board of Trustees outlining their privacy policies and the implementation of such policies. Each Service Provider is required to promptly report to the Trust’s Board any material changes to its privacy policy before, or promptly after, the adoption of such changes.
(1) Generally, the Funds have institutional clients which are not considered “customers” for purposes of regulation S-P.
Advisor
ETF Managers Group, LLC
350 Springfield Ave., Suite 200, Summit, NJ 07901
Distributor
Foreside Fund Services LLC
Three Canal Plaza, Suite 100, Portland, Maine 04101
Custodian
U.S. Bank National Association
Custody Operations
1555 North River Center Drive, Suite 302, Milwaukee, Wisconsin 53212
Transfer Agent
U.S. Bancorp Fund Services, LLC doing business as U.S. Bank Global Fund Services
615 East Michigan Street, Milwaukee, Wisconsin 53202
Securities Lending Agent
U.S. Bank, National Association
Securities Lending
800 Nicolet Mall
Minneapolis, MN 55402-7020
Independent Registered Public Accounting Firm
WithumSmith + Brown, PC
1411 Broadway, 9th Floor, New York, NY 10018
Legal Counsel
Sullivan & Worcester LLP
1666 K Street NW, Washington, DC 20006

Annual Report
September 30, 2023
Wedbush ETFMG Video Game Tech ETF

Wedbush ETFMG Global Cloud Technology ETF


The funds are series of ETF Managers Trust.
Wedbush ETFMG TM ETF
TABLE OF CONTENTS
September 30, 2023
Wedbush ETFMG TM ETF
Dear Shareholder,
On behalf of the entire team, we want to express our appreciation for the confidence you have placed in these ETFs. The following information pertains to the fiscal period from October 1, 2022 to September 30, 2023 (the “Annual Period”).
Market Overview
The U.S. economy performed better than expected despite persistent inflationary pressure, rising interest rates and geo-political conflict during the Annual Period.
Early in the Annual Period, inflation had risen sharply because of supply chain disruptions, high food and energy prices and the Russia-Ukraine war, reaching its peak level, just prior to the Annual Period, in September 2022. In the first quarter of 2023, U.S. equities managed to deliver gains, despite the significant volatility. The January rally, however, gave way to a February sell off as higher-than-expected inflation, a tight labor market and solid economic growth indicated that the U.S. Federal Reserve’s (Fed) monetary policy would remain tight for the foreseeable future. One of the most significant impacts occurred in the banking sector in March 2023, when Silicon Valley Bank, Signature Bank, and First Republic Bank, among others, failed. In the same month, Swiss bank UBS agreed to buy Credit Suisse, considered vulnerable in the then current environment.
In the second quarter of 2023, the economy grew at an annualized rate of 2.1%, according to the third estimate from the U.S. Bureau of Economic Analysis, compared to 2.2% in the first quarter and in line with 2.1% in 2022 overall. Since then, price pressures have eased given normalization in supply chains, falling energy prices and aggressive measures by the Fed and other global central banks to tighten financial conditions and slow demand in their economies. Nevertheless, during the Annual Period inflation levels remained much higher than central banks’ target levels, with the Fed raising its target fed funds rate six times during the Annual Period, bringing it to a range of 5.25% to 5.50% as of July 2023. As of August 2023, the unemployment rate was 3.8%, near its pre-pandemic low, although monthly job growth continued to be moderate. In September 2023, the Fed’s policy committee voted to hold the rate steady.
As the U.S. Congress neared its September 30, 2023, deadline to approve federal funding, investor concerns about a potential government shutdown and the impact this could have on the U.S. economy increased. The shutdown, however, was averted because of a Continuing Resolution which temporarily kept the government open for forty-five more days. Despite higher rates and increased market volatility, U.S. stocks for the Annual Period had strong returns of 21.62%, as measured by the S&P 500 Index.
These conditions have impacted the performance of the ETFs during the Annual Period, among other factors, and the value of an investment in the ETFs. We encourage you to talk with your financial advisor and visit etfmg.com for further insight into investing in today’s markets.
Performance Overview
During the Annual Period, the S&P 500 Information Technology Sector Index, a broad measure of US listed technology companies, returned 41.24%. During the same period, the S&P Global 1200 Information Technology Sector Index, a broad measure of global technology companies, returned 39.60%. Below is a performance overview for each ETF, for the Annual Period, except as noted otherwise.
Wedbush ETFMG Global Cloud Technology ETF (IVES)*
The Wedbush ETFMG Global Cloud Technology ETF (“IVES”) seeks to provide investment results that, before fees and expenses, correspond generally to the total return performance of the Dan Ives Global Cloud Technology Prime Index (the “Cloud Index”).
Wedbush ETFMG TM ETF
Over the Annual Period, the total return for IVES was 22.92%, while the total return for the Cloud Index was 23.08%. The best performers in IVES, on the basis of contribution to return, were Super Micro Computer Inc., Kingsoft Cloud Holdings, Fastly Inc., Samsara Inc., and Kyndryl Holdings Inc., while the worst performers were Edgio Inc., Inseego Corp., Unisys Corp., Como Inc., and Vnet Group Inc.
At the end of the Annual Period, IVES saw an allocation of 89.23% to the Information Technology sector, 2.74% to Real Estate and 0.11% in the Communication Services sector. IVES was exposed predominately to the United States, with 59.61% of its portfolio holdings exposed to the U.S., 12.18% to Japan and 8.60% to China.
Wedbush ETFMG Video Game Tech ETF (GAMR)**
The Wedbush ETFMG Video Game Tech ETF (“GAMR”) seeks to provide investment results that, before fees and expenses, correspond generally to the total return performance of the EE Fund Video Game Tech Index (the “Index”).
Over the Annual Period, the total return for GAMR was 5.01%, while the total return for the Index was 5.92%. The best performers in GAMR on the basis of contribution to return were Nvidia Corp., Meta Platforms Inc., Applovin Corp., Sciplay Corp., and International Games System, while the worst performers were Frontier Developments Plc., Embracer Group., Flowing Cloud Technology Ltd., Digital Bros Spa., and Skillz Inc.
At the end of the Annual Period, GAMR saw an allocation of 73.01% to the Communication Services sector, 15.49% to Information Technology and 6.07% to Consumer Discretionary. GAMR was exposed predominately to the United States, with 36.61% of its portfolio holdings exposed to the U.S., 18.94% to Japan and 16.13% to South Korea.
You can find further details about IVES and GAMR by visiting www.etfmg.com, or by calling 1-844-383-6477.
Sincerely,
John A. Flanagan
Principal Financial Officer
| * | As of Tuesday, April 7, 2020 the following changes went into effect for the ETFMG Drone Economy Strategy ETF (IFLY): |
| 1. | The Fund’s name was changed to the Wedbush ETFMG Global Cloud Technology ETF; |
| 2. | The Fund’s previous underlying index, the Reality Shares Drone Index (the “Previous Index”), was replaced with the Dan Ives Global Cloud Technology Prime Index; and |
| 3. | The Fund’s investment objective was changed to the following: “The Wedbush ETFMG Global Cloud Technology ETF seeks to provide investment results that, before fees and expenses, correspond generally to the total return performance of the Dan Ives Global Cloud Technology Prime Index” (the “Index”). |
| 4. | The Fund’s ticker was changed to “IVES”. |
| ** | As of Friday, April 17, 2020, the name of the ETFMG Video Game Tech ETF changed to the “Wedbush ETFMG Video Game Tech ETF”. |
Wedbush ETFMG TM ETF
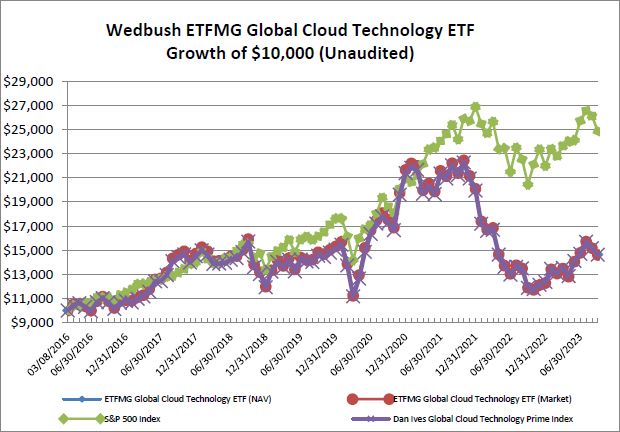
| | | | | | | | | Since | | | Value of | |
| Average Annual Returns | | | 1 Year | | | | 5 Year | | | | Inception | | | $10,000 | |
| Year Ended September 30, 2023 | | | Return | | | | Return | | | | (3/8/2016) |
| | (9/30/2023) |
|
| Wedbush ETFMG Global Cloud Technology ETF (NAV) | | | 22.92 | % | | | -1.68 | % | | | 5.16 | % | | $ | 14,635 | |
| Wedbush ETFMG Global Cloud Technology ETF (Market) | | | 22.80 | % | | | -1.72 | % | | | 5.13 | % | | $ | 14,598 | |
| S&P 500 Index | | | 21.62 | % | | | 9.92 | % | | | 12.80 | % | | $ | 24,874 | |
| Dan Ives Global Cloud Technology Prime Index* | | | 23.08 | % | | | -1.43 | % | | | 5.15 | % | | $ | 14,624 | |
| * | On April 7, 2020, the Fund’s investment objective and principal investment strategy were substantially revised; therefore, the performance and average annual total returns shown for periods prior to April 7, 2020 is likely to have differed had the Fund’s current investment strategy been in effect during those periods. The Fund’s prior investment objective sought to provide investment results that corresponded to the performance of the Reality Shares Drone Index. The Fund began tracking the Dan Ives Global Cloud Technology Prime Index on April 7, 2020. |
Performance data quoted represents past performance and does not guarantee future results. The investment return and principal value of an investment will fluctuate so that an investor’s shares, when redeemed, may be worth more or less than their original cost. Current performance of the Fund may be lower or higher than the performance quoted. All performance is historical and includes reinvestment of dividends and capital gains. Performance data current to the most recent month end may be obtained by calling 1-844-ETF-MGRS (1-844-383-6477).
The chart illustrates the performance of a hypothetical $10,000 investment made on March 8, 2016, and is not intended to imply any future performance. The returns shown do not reflect the deduction of taxes that a shareholder would pay on fund distributions from the sales of Fund shares. The chart assumes reinvestment of capital gains and dividends, if any. The Index Returns do not reflect fees or expenses and are not available for direct investment.
Wedbush ETFMG TM ETF
Wedbush ETFMG Global Cloud Technology ETF
| Top Ten Holdings as of September 30, 2023 (Unaudited)* | |
| | | | | % of Total | |
| | | Security | | Investments | |
| 1 | | Elastic NV | | | 4.91 | % |
| 2 | | SCSK Corp. | | | 3.75 | % |
| 3 | | Itochu Techno-Solutions Corp. | | | 3.62 | % |
| 4 | | Open Text Corp. | | | 3.25 | % |
| 5 | | NEXTDC, Ltd. | | | 3.18 | % |
| 6 | | Nice, Ltd. | | | 3.17 | % |
| 7 | | NetApp, Inc. | | | 2.41 | % |
| 8 | | Super Micro Computer, Inc. | | | 2.41 | % |
| 9 | | Chindata Group Holdings, Ltd. - ADR | | | 2.36 | % |
| 10 | | Okta, Inc. | | | 2.36 | % |
Top Ten Holdings = 31.42% of Total Investments
| * | Current Fund holdings may not be indicative of future Fund holdings. |
Wedbush ETFMG TM ETF
Wedbush ETFMG Video Game Tech ETF
Growth of $10,000 (Unaudited)
| | | | | | | | | Since | | | Value of | |
| Average Annual Returns | | 1 Year | | | 5 Year | | | Inception | | | $10,000 | |
| Year Ended September 30, 2023 | | Return | | | Return | | | (3/8/2016) |
| | (9/30/2023) |
|
| Wedbush ETFMG Video Game Tech ETF (NAV) | | | 5.01 | % | | | 3.58 | % | | | 11.91 | % | | $ | 23,418 | |
| Wedbush ETFMG Video Game Tech ETF (Market) | | | 5.42 | % | | | 3.59 | % | | | 11.89 | % | | $ | 23,388 | |
| S&P 500 Index | | | 21.62 | % | | | 9.92 | % | | | 12.80 | % | | $ | 24,874 | |
| EEFund Video Game Tech Index | | | 5.92 | % | | | 4.18 | % | | | 12.28 | % | | $ | 24,018 | |
Performance data quoted represents past performance and does not guarantee future results. The investment return and principal value of an investment will fluctuate so that an investor’s shares, when redeemed, may be worth more or less than their original cost. Current performance of the Fund may be lower or higher than the performance quoted. All performance is historical and includes reinvestment of dividends and capital gains. Performance data current to the most recent month end may be obtained by calling 1-844-ETF-MGRS (1-844-383-6477).
The chart illustrates the performance of a hypothetical $10,000 investment made on March 8, 2016, and is not intended to imply any future performance. The returns shown do not reflect the deduction of taxes that a shareholder would pay on fund distributions from the sales of Fund shares. The chart assumes reinvestment of capital gains and dividends, if any. The Index Returns do not reflect fees or expenses and are not available for direct investment.
Wedbush ETFMG TM ETF
Wedbush ETFMG Video Game Tech ETF
| Top Ten Holdings as of September 30, 2023 (Unaudited)* | |
| | | | | % of Total | |
| | | Security | | Investments | |
| 1 | | International Games System Co., Ltd. | | | 2.68 | % |
| 2 | | Ubisoft Entertainment SA | | | 2.57 | % |
| 3 | | ROBLOX Corp. - Class A | | | 2.45 | % |
| 4 | | Activision Blizzard, Inc. | | | 2.43 | % |
| 5 | | Electronic Arts, Inc. | | | 2.40 | % |
| 6 | | Sciplay Corp. - Class A | | | 2.40 | % |
| 7 | | Take-Two Interactive Software, Inc. | | | 2.36 | % |
| 8 | | Playtika Holding Corp. | | | 2.36 | % |
| 9 | | Keywords Studios PLC | | | 2.34 | % |
| 10 | | Nintendo Co., Ltd. | | | 2.32 | % |
Top Ten Holdings = 24.31% of Total Investments
* Current Fund holdings may not be indicative of future Fund holdings.
Wedbush ETFMG TM ETF
Important Disclosures and Key Risk Factors
Investing involves risk, including the possible loss of principal. Shares of any ETF are bought and sold at market price (not NAV), may trade at a discount or premium to NAV and are not individually redeemed from the Fund. Brokerage commissions will reduce returns. Narrowly focused investments typically exhibit higher volatility.
Past performance is not indicative of future return. A fund’s performance for very short time periods may not be indicative of future performance.
IVES
The Wedbush ETFMG Global Cloud Technology ETF (the “Fund”) seeks to provide investment results that, before fees and expenses, correspond generally to the price and yield performance of the Dan Ives Global Cloud Technology Prime Index (the “Index”).
Cloud Technology Companies may have limited product lines, markets, financial resources or personnel. These companies typically face intense competition and potentially rapid product obsolescence. In addition, many Cloud Technology Companies store sensitive consumer information and could be the target of cybersecurity attacks and other types of theft, which could have a negative impact on these companies. As a result, Cloud Technology Companies may be adversely impacted by government regulations and may be subject to additional regulatory oversight with regard to privacy concerns and cybersecurity risk. These companies are also heavily dependent on intellectual property rights and may be adversely affected by loss or impairment of those rights. Cloud computing companies could be negatively impacted by disruptions in service caused by hardware or software failure, or by interruptions or delays in service by third-party data center hosting facilities and maintenance providers. Cloud Technology Companies, especially smaller companies, tend to be more volatile than companies that do not rely heavily on technology. Companies in the technology field, including companies in the computers, telecommunications and electronics industries, face intense competition, which may have an adverse effect on profit margins.
Unlike with an actively managed fund, the Fund’s adviser does not use techniques or defensive strategies designed to lessen the effects of market volatility or to reduce the impact of periods of market decline. This means that, based on market and economic conditions, the Fund’s performance could be lower than other types of funds that may actively shift their portfolio assets to take advantage of market opportunities or to lessen the impact of a market decline.
Natural or environmental disasters, such as earthquakes, fires, floods, hurricanes, tsunamis and other severe weather-related phenomena generally, and widespread disease, including pandemics and epidemics, have been and may be highly disruptive to economies and markets, adversely impacting individual companies, sectors, industries, markets, currencies, interest and inflation rates, credit ratings, investor sentiment, and other factors affecting the value of the Fund’s investments. Given the increasing interdependence among global economies and markets, conditions in one country, market, or region are increasingly likely to adversely affect markets, issuers, and/or foreign exchange rates in other countries, including the U.S. Any such events could have a significant adverse impact on the value of the Fund’s investments.
Additionally, natural or environmental disasters, widespread disease or other public health issues, war, acts of terrorism or other events could result in increased premiums or discounts to the Fund’s NAV.
Effective, August 14, 2023, the Fund is distributed by Foreside Fund Services LLC. ETF Managers Group LLC is a wholly owned subsidiary of Exchange Traded Managers Group LLC (collectively, “ETFMG”).
GAMR
The Wedbush ETFMG Video Game Tech ETF (the “Fund” or the “Video Game Tech ETF”) seeks to provide investment results that, before fees and expenses, correspond generally to the price and yield performance of the EEFund Video Game Tech Index™ (the “Index”).
Video Game Tech Companies face intense competition, both domestically and internationally, may have limited product lines, markets, financial resources or personnel, may have products that face rapid obsolescence, and are heavily dependent on the protection of patent and intellectual property rights. Video Game Tech Companies are also subject to increasing regulatory constraints, particularly with respect to cybersecurity and privacy. Such factors may adversely affect the profitability and value of such companies. Investments in foreign securities involve political, economic and currency risks, greater volatility and differences in accounting methods. The Fund is non-diversified, meaning it may concentrate its assets in fewer individual holdings than a diversified fund. Investments in smaller companies tend to have limited liquidity and greater price volatility than large-capitalization companies. The Fund’s return may not match or achieve a high degree of correlation with the return of the EEFund Video Game Tech Index™. To the extent the Fund utilizes a sampling approach, it may experience tracking error to a greater extent than if the Fund had sought to replicate the Index. Diversification does not guarantee a profit, nor does it protect against a loss in a declining market.
The EEFund Video Game Tech™ Index provides a benchmark for investors interested in tracking companies actively involved in the electronic gaming industry including the entertainment, education and simulation segments. The Index uses a market capitalization weighted allocation across the pure play and non-pure play sectors and a set weight for the conglomerate sector as well as an equal weighted allocation methodology for all components within each sector allocation. The index was created and is maintained by EEFund Management. You cannot invest directly in an index.
Unlike with an actively managed fund, the Fund’s adviser does not use techniques or defensive strategies designed to lessen the effects of market volatility or to reduce the impact of periods of market decline. This means that, based on market and economic conditions, the Fund’s performance could be lower than other types of funds that may actively shift their portfolio assets to take advantage of market opportunities or to lessen the impact of a market decline.
Natural or environmental disasters, such as earthquakes, fires, floods, hurricanes, tsunamis and other severe weather-related phenomena generally, and widespread disease, including pandemics and epidemics, have been and may be highly disruptive to economies and markets, adversely impacting individual companies, sectors, industries, markets, currencies, interest and inflation rates, credit ratings, investor sentiment, and other factors affecting the value of the Fund’s investments. Given the increasing interdependence among global economies and markets, conditions in one country, market, or region are increasingly likely to adversely affect markets, issuers, and/or foreign exchange rates in other countries, including the U.S. Any such events could have a significant adverse impact on the value of the Fund’s investments.
Additionally, natural or environmental disasters, widespread disease or other public health issues, war, acts of terrorism or other events could result in increased premiums or discounts to the Fund’s NAV.
Effective, August 14, 2023, the Fund is distributed by Foreside Fund Services LLC. ETF Managers Group LLC is a wholly owned subsidiary of Exchange Traded Managers Group LLC (collectively, “ETFMG”).
Wedbush ETFMG TM ETF
PORTFOLIO ALLOCATIONS
As of September 30, 2023 (Unaudited)
| | | Wedbush | | | | |
| | | ETFMG | | | Wedbush | |
| | | Global Cloud | | | ETFMG Video | |
| | | Technology ETF | | | Game Tech ETF | |
| As a percent of Net Assets: | | | | | | |
| Australia | | 5.8 | % | | — | % |
| Canada | | 4.0 | | | — | |
| Cayman Islands | | 8.5 | | | 10.1 | |
| France | | — | | | 3.8 | |
| Germany | | 2.4 | | | — | |
| Israel | | 4.5 | | | 2.7 | |
| Italy | | — | | | 0.3 | |
| Japan | | 13.2 | | | 18.9 | |
| Netherlands | | 6.1 | | | — | |
| Poland | | — | | | 2.2 | |
| Republic of Korea | | 0.3 | | | 16.0 | |
| Singapore | | 3.1 | | | — | |
| Sweden | | 1.4 | | | 4.1 | |
| Switzerland | | — | | | 0.7 | |
| Taiwan, Province of China | | — | | | 4.4 | |
| United Kingdom | | 1.4 | | | 2.9 | |
| United States | | 48.5 | | | 33.2 | |
| Virgin Islands (UK) | | — | | | 0.0 | * |
| Short-Term and other Net Assets (Liabilities) | | 0.8 | | | 0.7 | |
| | | 100.0 | % | | 100.0 | % |
| * | Amount is less than 0.05%. |
Wedbush ETFMG TM ETF
Wedbush ETFMG Global Cloud Technology ETF
Schedule of Investments
September 30, 2023
| | | Shares | | | Value | |
| COMMON STOCKS - 99.2% | | | | | | | | |
| Australia - 5.8% | | | | | | | | |
| IT Services - 5.8% (d) | | | | | | | | |
| Data#3, Ltd. | | | 36,807 | | | $ | 167,549 | |
| Megaport, Ltd. (a) | | | 37,873 | | | | 286,605 | |
| NEXTDC, Ltd. (a) | | | 122,328 | | | | 974,484 | |
| Total IT Services | | | | | | | 1,428,638 | |
| | | | | | | | | |
| Canada - 4.0% | | | | | | | | |
| Software - 4.0% (d) | | | | | | | | |
| Open Text Corp. | | | 28,322 | | | | 994,006 | |
| | | | | | | | | |
| Cayman Islands - 8.5% | | | | | | | | |
| IT Services - 8.5% (d) | | | | | | | | |
| Chinasoft International, Ltd. | | | 707,269 | | | | 503,970 | |
| Chindata Group Holdings, Ltd. - ADR (a)(b) | | | 87,151 | | | | 723,353 | |
| GDS Holdings, Ltd. - ADR (a)(b) | | | 43,761 | | | | 479,183 | |
| Kingsoft Cloud Holdings, Ltd. - ADR (a)(b) | | | 56,139 | | | | 276,765 | |
| Vnet Group, Inc. - ADR (a)(b) | | | 35,308 | | | | 110,514 | |
| Total IT Services | | | | | | | 2,093,785 | |
| | | | | | | | | |
| Germany - 2.4% | | | | | | | | |
| Software - 2.4% (d) | | | | | | | | |
| Software AG | | | 17,664 | | | | 588,644 | |
| | | | | | | | | |
| Israel - 4.5% | | | | | | | | |
| Software - 4.5% (d) | | | | | | | | |
| JFrog, Ltd. (a)(b) | | | 5,607 | | | | 142,194 | |
| Nice, Ltd. (a) | | | 5,741 | | | | 970,955 | |
| Total Software | | | | | | | 1,113,149 | |
| | | | | | | | | |
| Japan - 13.2% | | | | | | | | |
| IT Services - 12.4% (d) | | | | | | | | |
| Hennge KK (a) | | | 7,730 | | | | 57,261 | |
| Itochu Techno-Solutions Corp. | | | 38,397 | | | | 1,108,178 | |
| NS Solutions Corp. | | | 21,681 | | | | 617,322 | |
| SCSK Corp. | | | 65,729 | | | | 1,147,530 | |
| TechMatrix Corp. | | | 10,551 | | | | 111,977 | |
| Total IT Services | | | | | | | 3,042,268 | |
| Software - 0.8% (d) | | | | | | | | |
| Cybozu, Inc. | | | 12,485 | | | | 169,430 | |
| Fixer, Inc. (a)(b) | | | 3,464 | | | | 37,088 | |
| Total Software | | | | | | | 206,518 | |
| Total Japan | | | | | | | 3,248,786 | |
| | | | | | | | | |
| Netherlands - 6.1% | | | | | | | | |
| Software - 6.1% (d) | | | | | | | | |
| Elastic NV (a)(b) | | | 18,490 | | | | 1,502,127 | |
The accompanying notes are an integral part of these financial statements.
Wedbush ETFMG TM ETF
Wedbush ETFMG Global Cloud Technology ETF
Schedule of Investments
September 30, 2023 (Continued)
| | | Shares | | | Value | |
| Republic of Korea - 0.3% | | | | | | | | |
| Diversified Telecommunication Services - 0.3% | | | | | | | | |
| KINX, Inc. | | | 1,149 | | | $ | 66,246 | |
| | | | | | | | | |
| Singapore - 3.1% | | | | | | | | |
| Real Estate Investment Trusts (REITs) - 3.1% | | | | | | | | |
| Digital Core REIT Management Pte, Ltd. (a) | | | 267,753 | | | | 141,909 | |
| Keppel DC REIT | | | 409,566 | | | | 623,188 | |
| Total Real Estate Investment Trusts (REITs) | | | | | | | 765,097 | |
| | | | | | | | | |
| Sweden - 1.4% | | | | | | | | |
| Software - 1.4% (d) | | | | | | | | |
| Sinch AB (a)(e) | | | 202,553 | | | | 356,105 | |
| | | | | | | | | |
| United Kingdom - 1.4% | | | | | | | | |
| Software - 1.4% (d) | | | | | | | | |
| Bytes Technology Group PLC | | | 57,181 | | | | 347,998 | |
| | | | | | | | | |
| United States - 48.5% | | | | | | | | |
| IT Services - 10.7% (d) | | | | | | | | |
| Cloudflare, Inc. - Class A (a) | | | 11,468 | | | | 722,943 | |
| DigitalOcean Holdings, Inc. (a)(b) | | | 4,800 | | | | 115,344 | |
| Fastly, Inc. - Class A (a)(b) | | | 7,079 | | | | 135,704 | |
| Grid Dynamics Holdings, Inc. (a) | | | 4,070 | | | | 49,573 | |
| Kyndryl Holdings, Inc. (a) | | | 12,465 | | | | 188,222 | |
| MongoDB, Inc. (a)(b) | | | 1,939 | | | | 670,623 | |
| Okta, Inc. (a) | | | 8,871 | | | | 723,075 | |
| Rackspace Technology, Inc. (a) | | | 11,762 | | | | 27,641 | |
| Unisys Corp. (a) | | | 3,690 | | | | 12,731 | |
| Total IT Services | | | | | | | 2,645,856 | |
| Software - 29.4% (d) | | | | | | | | |
| 8x8, Inc. (a)(b) | | | 6,579 | | | | 16,579 | |
| Alteryx, Inc. - Class A (a) | | | 3,838 | | | | 144,654 | |
| Appfolio, Inc. - Class A (a) | | | 1,925 | | | | 351,563 | |
| Appian Corp. - Class A (a)(b) | | | 3,950 | | | | 180,160 | |
| Blackbaud, Inc. (a) | | | 2,909 | | | | 204,561 | |
| Box, Inc. - Class A (a)(b) | | | 7,925 | | | | 191,864 | |
| CommVault Systems, Inc. (a) | | | 2,370 | | | | 160,236 | |
| Confluent, Inc. - Class A (a)(b) | | | 16,437 | | | | 486,700 | |
| Datadog, Inc. - Class A (a) | | | 7,762 | | | | 707,040 | |
| Domo, Inc. - Class B (a) | | | 1,929 | | | | 18,923 | |
| Dropbox, Inc. - Class A (a)(b) | | | 18,988 | | | | 517,043 | |
| Everbridge, Inc. (a) | | | 2,202 | | | | 49,369 | |
| Gitlab, Inc. - Class A (a) | | | 8,354 | | | | 377,768 | |
| HashiCorp, Inc. - Class A (a) | | | 10,465 | | | | 238,916 | |
| Informatica, Inc. - Class A (a) | | | 15,658 | | | | 329,914 | |
| Intapp, Inc. (a) | | | 3,631 | | | | 121,711 | |
| Jamf Holding Corp. (a) | | | 6,875 | | | | 121,413 | |
| MicroStrategy, Inc. - Class A (a)(b) | | | 761 | | | | 249,821 | |
| N-able, Inc. (a) | | | 9,960 | | | | 128,484 | |
| nCino, Inc. (a)(b) | | | 6,199 | | | | 197,128 | |
| New Relic, Inc. (a) | | | 3,798 | | | | 325,185 | |
The accompanying notes are an integral part of these financial statements.
Wedbush ETFMG TM ETF
Wedbush ETFMG Global Cloud Technology ETF
Schedule of Investments
September 30, 2023 (Continued)
| | | Shares | | | Value | |
| Nutanix, Inc. - Class A (a)(b) | | | 12,836 | | | $ | 447,720 | |
| PagerDuty, Inc. (a) | | | 4,981 | | | | 112,023 | |
| RingCentral, Inc. - Class A (a) | | | 5,115 | | | | 151,557 | |
| Samsara, Inc. - Class A (a)(b) | | | 27,219 | | | | 686,191 | |
| Smartsheet, Inc. - Class A (a) | | | 7,318 | | | | 296,086 | |
| SolarWinds Corp. (a) | | | 8,999 | | | | 84,951 | |
| Teradata Corp. (a) | | | 5,397 | | | | 242,973 | |
| Zeta Global Holdings Corp. - Class A (a) | | | 11,669 | | | | 97,436 | |
| Total Software | | | | | | | 7,237,969 | |
| Technology Hardware, Storage & Peripherals - 8.4% | | | | | | | | |
| NetApp, Inc. | | | 9,738 | | | | 738,920 | |
| Pure Storage, Inc. - Class A (a)(b) | | | 16,713 | | | | 595,317 | |
| Super Micro Computer, Inc. (a)(b) | | | 2,687 | | | | 736,829 | |
| Total Technology Hardware, Storage & Peripherals | | | | | | | 2,071,066 | |
| Total United States | | | | | | | 11,954,891 | |
| TOTAL COMMON STOCKS (Cost $27,316,565) | | | | | | | 24,459,472 | |
| | | | | | | | | |
| INVESTMENTS PURCHASED WITH PROCEEDS FROM | | | | | | | | |
| SECURITIES LENDING COLLATERAL - 24.3% | | | | | | | | |
| Mount Vernon Liquid Assets Portfolio, LLC, 5.50% (c) | | | 5,986,611 | | | | 5,986,611 | |
| TOTAL INVESTMENTS PURCHASED WITH PROCEEDS | | | | | | | | |
| FROM SECURITIES LENDING COLLATERAL (Cost $5,986,611) | | | | | | | 5,986,611 | |
| | | | | | | | | |
| SHORT-TERM INVESTMENTS - 0.7% | | | | | | | | |
| Money Market Funds - 0.7% | | | | | | | | |
| First American Government Obligations | | | | | | | | |
| Fund - Class X, 5.26% (c) | | | 172,136 | | | | 172,136 | |
| TOTAL SHORT-TERM INVESTMENTS (Cost $172,136) | | | | | | | 172,136 | |
| Total Investments (Cost $33,475,312) - 124.2% | | | | | | | 30,618,219 | |
| Liabilities in Excess of Other Assets - (24.2)% | | | | | | | (5,962,153 | ) |
| TOTAL NET ASSETS - 100.0% | | | | | | $ | 24,656,066 | |
Percentages are stated as a percent of net assets.
| ADR | American Depositary Receipt |
| PLC | Public Limited Company |
| (a) | Non-income producing security. |
| (b) | All or a portion of this security was out on loan at September 30, 2023. |
| (c) | The rate shown is the annualized seven-day yield at period end. |
| (d) | As of September 30, 2023, the Fund had a significant portion of its assets invested in the Software & IT Services Industries. |
| (e) | Security exempt from registration pursuant to Rule 144A under the Securities Act of 1933, as amended. This security may be resold in transactions exempt from registration to qualified institutional investors. At September 30, 2023, the market value of these securities total $356,105, which represents 1.4% of total net assets. |
The Global Industry Classification Standard (GICS®) was developed by and/or is the exclusive property of MSCI, Inc. and Standard & Poor’s Financial Services LLC (“S&P”). GICS is a service mark of MSCI and S&P and has been licensed for use by U.S. Bancorp Fund Services, LLC, doing business as U.S. Bank Global Fund Services (“Fund Services”).
The accompanying notes are an integral part of these financial statements.
Wedbush ETFMG TM ETF
Wedbush ETFMG Video Game Tech ETF
Schedule of Investments
September 30, 2023
| | | Shares | | | Value | |
| COMMON STOCKS - 99.3% | | | | | | | | |
| Cayman Islands - 10.1% | | | | | | | | |
| Entertainment - 8.1% (d) | | | | | | | | |
| Archosaur Games, Inc. (a)(e) | | | 349,254 | | | $ | 118,634 | |
| Bilibili, Inc. - ADR (a)(b) | | | 77,185 | | | | 1,062,837 | |
| CMGE Technology Group, Ltd. (a) | | | 880,410 | | | | 150,652 | |
| HUYA, Inc. - ADR (a) | | | 60,327 | | | | 171,329 | |
| iDreamSky Technology Holdings, Ltd. (a)(e) | | | 385,347 | | | | 150,577 | |
| IGG, Inc. (a) | | | 344,508 | | | | 142,098 | |
| NetDragon Websoft Holdings, Ltd. | | | 109,551 | | | | 202,568 | |
| NetEase, Inc. - ADR (b) | | | 3,714 | | | | 371,994 | |
| Sea, Ltd. - ADR (a)(b) | | | 7,642 | | | | 335,866 | |
| XD, Inc. (a) | | | 346,636 | | | | 628,561 | |
| Zengame Technology Holding, Ltd. | | | 418,413 | | | | 154,415 | |
| Total Entertainment | | | | | | | 3,489,531 | |
| Interactive Media & Services - 1.6% | | | | | | | | |
| JOYY, Inc. - ADR | | | 8,379 | | | | 319,324 | |
| Tencent Holdings, Ltd. | | | 9,272 | | | | 362,547 | |
| Total Interactive Media & Services | | | | | | | 681,871 | |
| Media - 0.4% | | | | | | | | |
| Flowing Cloud Technology, Ltd. (a) | | | 834,073 | | | | 175,741 | |
| Total Cayman Islands | | | | | | | 4,347,143 | |
| | | | | | | | | |
| France - 3.8% | | | | | | | | |
| Entertainment - 2.9% (d) | | | | | | | | |
| Ubisoft Entertainment SA (a) | | | 38,520 | | | | 1,252,709 | |
| Media - 0.9% | | | | | | | | |
| Vivendi SE | | | 42,143 | | | | 369,634 | |
| Total France | | | | | | | 1,622,343 | |
| | | | | | | | | |
| Italy - 0.3% | | | | | | | | |
| Entertainment - 0.3% (d) | | | | | | | | |
| Digital Bros SpA | | | 8,961 | | | | 114,067 | |
| | | | | | | | | |
| Israel - 2.7% | | | | | | | | |
| Entertainment - 2.7% (d) | | | | | | | | |
| Playtika Holding Corp. (a)(b) | | | 119,652 | | | | 1,152,249 | |
| | | | | | | | | |
| Japan - 18.9% | | | | | | | | |
| Entertainment - 15.9% (d) | | | | | | | | |
| Akatsuki, Inc. | | | 11,202 | | | | 160,489 | |
| Capcom Co., Ltd. | | | 27,661 | | | | 996,751 | |
| COLOPL, Inc. | | | 36,873 | | | | 145,577 | |
| DeNa Co., Ltd. | | | 27,711 | | | | 278,612 | |
| Gree, Inc. | | | 37,943 | | | | 151,071 | |
| GungHo Online Entertainment, Inc. | | | 17,438 | | | | 275,444 | |
| Koei Tecmo Holdings Co., Ltd. | | | 18,494 | | | | 263,042 | |
| Konami Holdings Corp. | | | 20,095 | | | | 1,060,555 | |
| Mixi, Inc. | | | 17,212 | | | | 273,084 | |
| Nexon Co., Ltd. | | | 57,465 | | | | 1,028,056 | |
| Nintendo Co., Ltd. | | | 27,114 | | | | 1,130,355 | |
| Square Enix Holdings Co., Ltd. | | | 30,728 | | | | 1,053,808 | |
| Total Entertainment | | | | | | | 6,816,844 | |
The accompanying notes are an integral part of these financial statements.
Wedbush ETFMG TM ETF
Wedbush ETFMG Video Game Tech ETF
Schedule of Investments
September 30, 2023 (Continued)
| | | Shares | | | Value | |
| Household Durables - 0.9% | | | | | | | | |
| Sony Group Corp. - ADR | | | 4,604 | | | $ | 379,416 | |
| Leisure Products - 1.5% | | | | | | | | |
| Bandai Namco Holdings, Inc. | | | 12,372 | | | | 251,844 | |
| Furyu Corp. | | | 13,879 | | | | 143,489 | |
| Sega Sammy Holdings, Inc. | | | 14,386 | | | | 265,598 | |
| Total Leisure Products | | | | | | | 660,931 | |
| Media - 0.6% | | | | | | | | |
| CyberAgent, Inc. | | | 45,090 | | | | 243,282 | |
| Total Japan | | | | | | | 8,100,473 | |
| | | | | | | | | |
| Poland - 2.2% | | | | | | | | |
| Entertainment - 2.2% (d) | | | | | | | | |
| CD Projekt SA | | | 32,644 | | | | 935,536 | |
| | | | | | | | | |
| Republic of Korea - 16.0% | | | | | | | | |
| Entertainment - 14.9% (d) | | | | | | | | |
| Com2uS Corp. | | | 4,521 | | | | 149,762 | |
| Devsisters Co., Ltd. (a) | | | 4,648 | | | | 155,002 | |
| Kakao Games Corp. (a) | | | 54,405 | | | | 1,026,091 | |
| Krafton, Inc. (a) | | | 9,986 | | | | 1,114,489 | |
| NCSoft Corp. | | | 6,154 | | | | 1,014,721 | |
| Neowiz (a) | | | 6,079 | | | | 115,102 | |
| Netmarble Corp. (a)(e) | | | 36,122 | | | | 1,126,972 | |
| Nexon Games Co., Ltd. (a) | | | 12,176 | | | | 136,793 | |
| NHN Corp. (a) | | | 8,242 | | | | 138,955 | |
| Pearl Abyss Corp. (a) | | | 32,046 | | | | 1,106,672 | |
| Webzen, Inc. | | | 15,069 | | | | 149,194 | |
| WeMade Entertainment Co., Ltd. | | | 5,936 | | | | 162,323 | |
| Total Entertainment | | | | | | | 6,396,076 | |
| Hotels, Restaurants & Leisure - 0.3% | | | | | | | | |
| DoubleUGames Co., Ltd. | | | 5,018 | | | | 148,748 | |
| Interactive Media & Services - 0.4% | | | | | | | | |
| AfreecaTV Co., Ltd. | | | 2,623 | | | | 163,476 | |
| Leisure Products - 0.4% | | | | | | | | |
| GOLFZON Co., Ltd. | | | 2,342 | | | | 163,145 | |
| Total Republic of Korea | | | | | | | 6,871,445 | |
| | | | | | | | | |
| Sweden - 4.1% | | | | | | | | |
| Entertainment - 3.7% (d) | | | | | | | | |
| Embracer Group AB (a) | | | 481,837 | | | | 966,272 | |
| Modern Times Group MTG AB - Class B (a) | | | 23,789 | | | | 160,908 | |
| Paradox Interactive AB | | | 15,628 | | | | 328,422 | |
| Stillfront Group AB (a) | | | 98,394 | | | | 144,049 | |
| Total Entertainment | | | | | | | 1,599,651 | |
| Health Care Equipment & Supplies - 0.4% | | | | | | | | |
| Surgical Science Sweden AB (a) | | | 10,852 | | | | 149,288 | |
| Total Sweden | | | | | | | 1,748,939 | |
| | | | | | | | | |
| Switzerland - 0.7% | | | | | | | | |
| Technology Hardware, Storage & Peripherals - 0.7% | | | | | | | | |
| Logitech International SA | | | 4,146 | | | | 285,825 | |
The accompanying notes are an integral part of these financial statements.
Wedbush ETFMG TM ETF
Wedbush ETFMG Video Game Tech ETF
Schedule of Investments
September 30, 2023 (Continued)
| | | Shares | | | Value | |
| Taiwan, Province of China - 4.4% | | | | | | | | |
| Entertainment - 3.8% (d) | | | | | | | | |
| Gamania Digital Entertainment Co., Ltd. | | | 75,967 | | | $ | 155,556 | |
| International Games System Co., Ltd. | | | 64,702 | | | | 1,306,847 | |
| Soft-World International Corp. | | | 53,374 | | | | 159,061 | |
| Total Entertainment | | | | | | | 1,621,464 | |
| Semiconductors & Semiconductor Equipment - 0.6% | | | | | | | | |
| Taiwan Semiconductor Manufacturing Co., Ltd. - ADR | | | 3,073 | | | | 267,044 | |
| Total Taiwan, Province of China | | | | | | | 1,888,508 | |
| | | | | | | | | |
| United Kingdom - 2.9% | | | | | | | | |
| Entertainment - 0.3% (d) | | | | | | | | |
| Team17 Group PLC (a) | | | 37,523 | | | | 121,323 | |
| IT Services - 2.6% | | | | | | | | |
| Keywords Studios PLC | | | 60,428 | | | | 1,140,582 | |
| Total United Kingdom | | | | | | | 1,261,905 | |
| | | | | | | | | |
| United States - 33.2% | | | | | | | | |
| Broadline Retail - 0.9% | | | | | | | | |
| Amazon.com, Inc. (a) | | | 2,785 | | | | 354,029 | |
| Entertainment - 16.4% (d) | | | | | | | | |
| Activision Blizzard, Inc. | | | 12,695 | | | | 1,188,633 | |
| Electronic Arts, Inc. | | | 9,733 | | | | 1,171,853 | |
| ROBLOX Corp. - Class A (a)(b) | | | 41,280 | | | | 1,195,469 | |
| Sciplay Corp. - Class A (a) | | | 51,445 | | | | 1,171,403 | |
| Take-Two Interactive Software, Inc. (a) | | | 8,212 | | | | 1,152,883 | |
| Total Entertainment | | | | | | | 5,880,241 | |
| Hotels, Restaurants & Leisure - 0.6% | | | | | | | | |
| Light & Wonder, Inc. (a)(b) | | | 3,751 | | | | 267,558 | |
| Interactive Media & Services - 2.4% | | | | | | | | |
| Alphabet, Inc. - Class C (a) | | | 2,822 | | | | 372,081 | |
| Meta Platforms, Inc. - Class A (a) | | | 1,299 | | | | 389,973 | |
| Ziff Davis, Inc. (a)(b) | | | 4,315 | | | | 274,822 | |
| Total Interactive Media & Services | | | | | | | 1,036,876 | |
| Leisure Products - 0.7% | | | | | | | | |
| Mattel, Inc. (a) | | | 12,977 | | | | 285,884 | |
| Semiconductors & Semiconductor Equipment - 3.4% | | | | | | | | |
| Advanced Micro Devices, Inc. (a) | | | 3,635 | | | | 373,751 | |
| Intel Corp. | | | 10,936 | | | | 388,775 | |
| NVIDIA Corp. | | | 779 | | | | 338,857 | |
| Qualcomm, Inc. | | | 3,355 | | | | 372,606 | |
| Total Semiconductors & Semiconductor Equipment | | | | | | | 1,473,989 | |
| Software - 5.1% | | | | | | | | |
| AppLovin Corp. - Class A (a)(b) | | | 6,653 | | | | 265,854 | |
| Dolby Laboratories, Inc. - Class A (b) | | | 3,404 | | | | 269,801 | |
| Microsoft Corp. | | | 1,172 | | | | 370,059 | |
| PTC, Inc. (a)(b) | | | 1,954 | | | | 276,843 | |
| Unity Software, Inc. (a)(b) | | | 31,503 | | | | 988,878 | |
| Total Software | | | | | | | 2,171,435 | |
| Specialty Retail - 2.4% | | | | | | | | |
| GameStop Corp. - Class A (a)(b) | | | 62,954 | | | | 1,036,223 | |
Technology Hardware, Storage & Peripherals - 4.0% | | | | | | | | |
The accompanying notes are an integral part of these financial statements.
Wedbush ETFMG TM ETF
Wedbush ETFMG Video Game Tech ETF
Schedule of Investments
September 30, 2023 (Continued)
| | | Shares | | | Value | |
| Apple, Inc. | | | 2,045 | | | $ | 350,124 | |
| Corsair Gaming, Inc. (a) | | | 74,288 | | | | 1,079,406 | |
| Western Digital Corp. (a) | | | 6,391 | | | | 291,621 | |
| Total Technology Hardware, Storage & Peripherals | | | | | | | 1,721,151 | |
| Total United States | | | | | | | 14,227,386 | |
| | | | | | | | | |
| Virgin Islands (UK) - 0.0% (h) | | | | | | | | |
| Interactive Media & Services - 0.0% (h) | | | | | | | | |
| VK Co., Ltd. - ADR (a)(f)(g) | | | 21,975 | | | | — | |
| TOTAL COMMON STOCKS (Cost $53,729,617) | | | | | | | 42,555,818 | |
| | | | | | | | | |
| INVESTMENTS PURCHASED WITH PROCEEDS FROM | | | | | | | | |
| SECURITIES LENDING COLLATERAL - 14.1% | | | | | | | | |
| Mount Vernon Liquid Assets Portfolio, LLC, 5.50% (c) | | | 6,026,869 | | | | 6,026,869 | |
| TOTAL INVESTMENTS PURCHASED WITH PROCEEDS | | | | | | | | |
| FROM SECURITIES LENDING COLLATERAL (Cost $6,026,869) | | | | | | | 6,026,869 | |
| | | | | | | | | |
| SHORT-TERM INVESTMENTS - 0.5% | | | | | | | | |
| Money Market Funds - 0.5% | | | | | | | | |
| First American Government Obligations Fund - Class X, 5.26% (c) | | | 232,107 | | | | 232,107 | |
| TOTAL SHORT-TERM INVESTMENTS (Cost $232,107) | | | | | | | 232,107 | |
| | | | | | | | | |
| Total Investments (Cost $59,988,593) - 113.9% | | | | | | | 48,814,794 | |
| Liabilities in Excess of Other Assets - (13.9)% | | | | | | | (5,970,440 | ) |
| TOTAL NET ASSETS - 100.0% | | | | | | $ | 42,844,354 | |
Percentages are stated as a percent of net assets.
| ADR | American Depositary Receipt |
| PLC | Public Limited Company |
| (a) | Non-income producing security. |
| (b) | All or a portion of this security was out on loan at September 30, 2023. |
| (c) | The rate shown is the annualized seven-day yield at period end. |
| (d) | As of September 30, 2023, the Fund had a significant portion of its assets in the Entertainment Industry. |
| (e) | Security exempt from registration pursuant to Rule 144A under the Securities Act of 1933, as amended. This security may be resold in transactions exempt from registration to qualified institutional investors. At September 30, 2023, the market value of these securities total $1,396,183, which represents 3.3% of total net assets. |
| (f) | Value determined using significant unobservable inputs. The value of this security totals $0, which represents 0.0% of total net assets. Classified as Level 3 in the fair value hierarchy. |
| (g) | This security has been deemed illiquid according to the Fund’s liquidity guidelines. The value of this security totals $0, which represents 0.0% of total net assets. |
| (h) | Amount is less than 0.05%. |
The Global Industry Classification Standard (GICS®) was developed by and/or is the exclusive property of MSCI, Inc. and Standard & Poor’s Financial Services LLC (“S&P”). GICS is a service mark of MSCI and S&P and has been licensed for use by U.S. Bancorp Fund Services, LLC, doing business as U.S. Bank Global Fund Services (“Fund Services”).
The accompanying notes are an integral part of these financial statements.
Wedbush ETFMG TM ETF
STATEMENTS OF ASSETS AND LIABILITIES
As of September 30, 2023
| | | Wedbush ETFMG Global Cloud Technology ETF | | | Wedbush ETFMG Video Game Tech ETF | |
| ASSETS | | | | | | | | |
| Investments in securities, at value* | | $ | 30,618,219 | | | $ | 48,814,794 | |
| Foreign currency, at value* | | | 2,764 | | | | — | |
| Receivables: | | | | | | | | |
| Dividends and interest receivable | | | 33,962 | | | | 81,824 | |
| Securities lending income receivable | | | 2,058 | | | | 2,117 | |
| Total Assets | | | 30,657,003 | | | | 48,898,735 | |
| | | | | | | | | |
| LIABILITIES | | | | | | | | |
| Collateral received for securities loaned (Note 7) | | | 5,986,611 | | | | 6,026,869 | |
| Foreign currency payable to custodian, at value* | | | — | | | | 120 | |
| Payables: | | | | | | | | |
| Management fees payable | | | 14,326 | | | | 27,392 | |
| Total Liabilities | | | 6,000,937 | | | | 6,054,381 | |
| Net Assets | | $ | 24,656,066 | | | $ | 42,844,354 | |
| | | | | | | | | |
| NET ASSETS CONSIST OF: | | | | | | | | |
| Paid-in Capital | | $ | 39,180,299 | | | $ | 99,584,569 | |
| Total Distributable Earnings (Accumulated Losses) | | | (14,524,233 | ) | | | (56,740,215 | ) |
| Net Assets | | $ | 24,656,066 | | | $ | 42,844,354 | |
| | | | | | | | | |
| *Identified Cost: | | | | | | | | |
| | | | | | | | | |
| Investments | | $ | 33,475,312 | | | $ | 59,988,593 | |
| Foreign currency | | | 2,768 | | | | 118 | |
| | | | | | | | | |
| Shares Outstanding^ | | | 700,000 | | | | 800,000 | |
| | | | | | | | | |
| Net Asset Value, Offering and Redemption Price per Share | | $ | 35.22 | | | $ | 53.56 | |
^ No par value, unlimited number of shares authorized
The accompanying notes are an integral part of these financial statements.
Wedbush ETFMG TM ETF
STATEMENTS OF OPERATIONS
For the Year Ended September 30, 2023
| | | Wedbush ETFMG Global Cloud Technology ETF | | | Wedbush ETFMG Video Game Tech ETF | |
| INVESTMENT INCOME | | | | | | | | |
| Income: | | | | | | | | |
| Dividends from unaffiliated securities (net of foreign | | | | | | | | |
| withholdings tax and issuance fees of $17,512 and $63,138, respectively) | | $ | 44,447 | | | $ | 313,244 | |
| Dividends from affiliated securities | | | 79,407 | | | | 112,678 | |
| Interest | | | 12,706 | | | | 8,549 | |
| Securities lending income | | | 23,533 | | | | 90,377 | |
| Total Investment Income | | | 160,093 | | | | 524,848 | |
| | | | | | | | | |
| Expenses: | | | | | | | | |
| Management fees | | | 156,369 | | | | 378,661 | |
| Total Expenses | | | 156,369 | | | | 378,661 | |
| Net Investment Income | | | 3,724 | | | | 146,187 | |
| | | | | | | | | |
| REALIZED & UNREALIZED GAIN (LOSS) ON INVESTMENTS | | | | | | | | |
| Net Realized Gain (Loss) on: | | | | | | | | |
| Unaffiliated Investments | | | (2,352,357 | ) | | | (14,098,187 | ) |
| Affiliated Investments | | | (67,511 | ) | | | (119,598 | ) |
| In-Kind redemptions | | | 1,192,225 | | | | 557,270 | |
| Foreign currency and foreign currency translation | | | (10,028 | ) | | | (33,613 | ) |
| Net Realized Loss on Investments | | | (1,237,671 | ) | | | (13,694,128 | ) |
| Net Change in Unrealized Appreciation/Depreciation of: | | | | | | | | |
| Unaffiliated Investments | | | 5,827,342 | | | | 16,537,154 | |
| Affiliated Investments | | | 84,199 | | | | 142,223 | |
| Foreign currency and foreign currency translation | | | 1,956 | | | | 749 | |
| Net Change in Unrealized Appreciation/Depreciation of Investments | | | 5,913,497 | | | | 16,680,126 | |
| Net Realized and Unrealized Gain on Investments | | | 4,675,826 | | | | 2,985,998 | |
| NET INCREASE IN NET ASSETS RESULTING FROM OPERATIONS | | $ | 4,679,550 | | | $ | 3,132,185 | |
The accompanying notes are an integral part of these financial statements.
Wedbush ETFMG TM ETF
Wedbush ETFMG Global Cloud Technology ETF
STATEMENTS OF CHANGES IN NET ASSETS
| | | Year Ended September 30, 2023 | | | Year Ended September 30, 2022 | |
| OPERATIONS | | | | | | | | |
| Net investment income (loss) | | $ | 3,724 | | | $ | (32,005 | ) |
| Net realized gain (loss) on investments and In-Kind Redemptions | | | (1,237,671 | ) | | | 3,739,077 | |
| Net change in unrealized appreciation/depreciation of investments and foreign currency and foreign currency translation | | | 5,913,497 | | | | (24,627,273 | ) |
| Net increase (decrease) in net assets resulting from operations | | | 4,679,550 | | | | (20,920,201 | ) |
| | | | | | | | | |
| CAPITAL SHARE TRANSACTIONS | | | | | | | | |
| Net decrease in net assets derived from net change in outstanding shares | | | (2,948,170 | ) | | | (10,310,485 | ) |
| Transaction Fees (See Note 1) | | | 136 | | | | 21 | |
| Net decrease in net assets from capital share transactions | | | (2,948,034 | ) | | | (10,310,464 | ) |
| Total increase (decrease) in net assets | | | 1,731,516 | | | | (31,230,665 | ) |
| | | | | | | | | |
| NET ASSETS | | | | | | | | |
| Beginning of Year | | | 22,924,550 | | | | 54,155,215 | |
| End of Year | | $ | 24,656,066 | | | $ | 22,924,550 | |
Summary of share transactions is as follows:
| | | Year Ended | | | Year Ended | |
| | | September 30, 2023 | | | September 30, 2022 | |
| | | Shares | | | Amount | | | Shares | | | Amount | |
| Shares Sold | | 100,000 | | | $ | 3,532,080 | | | 150,000 | | | $ | 6,614,280 | |
| Transaction Fees (See Note 1) | | — | | | | 136 | | | — | | | | 21 | |
| Shares Redeemed | | (200,000 | ) | | | (6,480,250 | ) | | (400,000 | ) | | | (16,924,765 | ) |
| Net Transactions in Fund Shares | | (100,000 | ) | | $ | (2,948,034 | ) | | (250,000 | ) | | $ | (10,310,464 | ) |
| Beginning Shares | | 800,000 | | | | | | | 1,050,000 | | | | | |
| Ending Shares | | 700,000 | | | | | | | 800,000 | | | | | |
The accompanying notes are an integral part of these financial statements.
Wedbush ETFMG TM ETF
Wedbush ETFMG Video Game Tech ETF
STATEMENTS OF CHANGES IN NET ASSETS
| | | Year Ended | | | Year Ended | |
| | | September 30, | | | September 30, | |
| | | 2023 | | | 2022 | |
| OPERATIONS | | | | | | | | |
| Net investment income | | $ | 146,187 | | | $ | 270,337 | |
| Net realized loss on investments and In-Kind Redemptions | | | (13,694,128 | ) | | | (12,535,657 | ) |
| Net change in unrealized appreciation/depreciation of investments and foreign currency and foreign currency translation | | | 16,680,126 | | | | (19,860,385 | ) |
| Net increase (decrease) in net assets resulting from operations | | | 3,132,185 | | | | (32,125,705 | ) |
| | | | | | | | | |
| DISTRIBUTIONS TO SHAREHOLDERS | | | | | | | | |
| Total distributions from distributable earnings | | | — | | | | (2,457,762 | ) |
| | | | | | | | | |
| CAPITAL SHARE TRANSACTIONS | | | | | | | | |
| Net decrease in net assets derived from net change in outstanding shares | | | (11,294,385 | ) | | | (14,860,700 | ) |
| Transaction Fees (See Note 1) | | | 5,825 | | | | 17,554 | |
| Net decrease in net assets from capital share transactions | | | (11,288,560 | ) | | | (14,843,146 | ) |
| Total decrease in net assets | | | (8,156,375 | ) | | | (49,426,613 | ) |
| | | | | | | | | |
| NET ASSETS | | | | | | | | |
| Beginning of Year | | | 51,000,729 | | | | 100,427,342 | |
| End of Year | | $ | 42,844,354 | | | $ | 51,000,729 | |
Summary of share transactions is as follows:
| | | Year Ended | | | Year Ended | |
| | | September 30, 2023 | | | September 30, 2022 | |
| | | Shares | | | Amount | | | Shares | | | Amount | |
| Shares Sold | | — | | | $ | — | | | 50,000 | | | $ | 4,398,985 | |
| Transaction Fees (See Note 1) | | — | | | | 5,825 | | | — | | | | 17,554 | |
| Shares Redeemed | | (200,000 | ) | | | (11,294,385 | ) | | (250,000 | ) | | | (19,259,685 | ) |
| Net Transactions in Fund Shares | | (200,000 | ) | | $ | (11,288,560 | ) | | (200,000 | ) | | $ | (14,843,146 | ) |
| Beginning Shares | | 1,000,000 | | | | | | | 1,200,000 | | | | | |
| Ending Shares | | 800,000 | | | | | | | 1,000,000 | | | | | |
The accompanying notes are an integral part of these financial statements.
Wedbush ETFMG TM ETF
Wedbush ETFMG Video Game Tech ETF
FINANCIAL HIGHLIGHTS
For a capital share outstanding throughout the year
| | | Year Ended September 30, 2023 | | | Year Ended September 30, 2022 | | | Year Ended September 30, 2021 | | | Year Ended September 30, 2020 | | | Year Ended September 30, 2019 | |
| Net Asset Value, Beginning of Year | | $ | 28.66 | | | $ | 51.58 | | | $ | 42.29 | | | $ | 35.92 | | | $ | 39.05 | |
| Income (Loss) from Investment | | | | | | | | | | | | | | | | | | | | |
| Operations: | | | | | | | | | | | | | | | | | | | | |
| Net investment income (loss) 1 | | | 0.01 | | | | (0.03 | ) | | | (0.03 | ) | | | 0.26 | | | | 0.28 | |
| Net realized and unrealized gain (loss) on investments | | | 6.55 | | | | (22.89 | ) | | | 9.45 | | | | 6.34 | | | | (3.11 | ) |
| Total from investment operations | | | 6.56 | | | | (22.92 | ) | | | 9.42 | | | | 6.60 | | | | (2.83 | ) |
| Less Distributions: | | | | | | | | | | | | | | | | | | | | |
| Distributions from net investment income | | | — | | | | — | | | | (0.13 | ) | | | (0.23 | ) | | | (0.30 | ) |
| Total distributions | | | — | | | | — | | | | (0.13 | ) | | | (0.23 | ) | | | (0.30 | ) |
| Capital Share Transactions: | | | | | | | | | | | | | | | | | | | | |
| Transaction fees added to paid-in capital | | | 0.00 | 3 | | | 0.00 | 3 | | | — | | | | — | | | | — | |
| Net asset value, end of year | | $ | 35.22 | | | $ | 28.66 | | | $ | 51.58 | | | $ | 42.29 | | | $ | 35.92 | |
| Total Return | | | 22.92 | % | | | (44.44 | )% | | | 22.28 | % | | | 18.58 | % | | | (7.23 | )% |
| | | | | | | | | | | | | | | | | | | | | |
| Ratios/Supplemental Data: | | | | | | | | | | | | | | | | | | | | |
| Net assets at end of year (000’s) | | $ | 24,656 | | | $ | 22,925 | | | $ | 54,155 | | | $ | 46,515 | | | $ | 37,720 | |
| | | | | | | | | | | | | | | | | | | | | |
| Gross Expenses to Average Net Assets | | | 0.68 | % | | | 0.68 | % | | | 0.68 | % | | | 0.71 | %2 | | | 0.75 | % |
| Net Investment Income (Loss) to | | | | | | | | | | | | | | | | | | | | |
| Average Net Assets | | | 0.02 | % | | | (0.09 | )% | | | (0.06 | )% | | | 0.70 | % | | | 0.83 | % |
| Portfolio Turnover Rate | | | 29 | % | | | 28 | % | | | 14 | % | | | 104 | % | | | 38 | % |
| 1 | Calculated based on average shares outstanding during the year. |
| 2 | Effective April 7, 2020, the Fund’s expense ratio was reduced to 0.68%. |
| 3 | Amount is less than $0.005 per share. |
The accompanying notes are an integral part of these financial statements.
Wedbush ETFMG TM ETF
Wedbush ETFMG Video Game Tech ETF
FINANCIAL HIGHLIGHTS
For a capital share outstanding throughout each year
| | | Year Ended September 30, 2023 | | | Year Ended September 30, 2022 | | | Year Ended September 30, 2021 | | | Year Ended September 30, 2020 | | | Year Ended September 30, 2019 | |
| Net Asset Value, Beginning of Year | | $ | 51.00 | | | $ | 83.69 | | | $ | 67.61 | | | $ | 41.50 | | | $ | 47.49 | |
| Income (Loss) from Investment | | | | | | | | | | | | | | | | | | | | |
| Operations: | | | | | | | | | | | | | | | | | | | | |
| Net investment income 1 | | | 0.17 | | | | 0.25 | | | | 0.74 | | | | 0.25 | | | | 0.52 | |
| Net realized and unrealized gain (loss) on investments | | | 2.39 | | | | (30.82 | ) | | | 15.96 | | | | 26.26 | | | | (5.87 | ) |
| Total from investment operations | | | 2.56 | | | | (30.57 | ) | | | 16.70 | | | | 26.51 | | | | (5.35 | ) |
| Less Distributions: | | | | | | | | | | | | | | | | | | | | |
| Distributions from net investment income | | | — | | | | (2.14 | ) | | | (0.72 | ) | | | (0.41 | ) | | | (0.65 | ) |
| Total distributions | | | — | | | | (2.14 | ) | | | (0.72 | ) | | | (0.41 | ) | | | (0.65 | ) |
| Capital Share Transactions: | | | | | | | | | | | | | | | | | | | | |
| Transaction fees added to paid-in capital | | | 0.01 | | | | 0.02 | | | | 0.10 | | | | 0.01 | | | | 0.01 | |
| Net asset at end of year | | $ | 53.56 | | | $ | 51.00 | | | $ | 83.69 | | | $ | 67.61 | | | $ | 41.50 | |
| Total Return | | | 5.01 | % | | | (37.58 | )% | | | 24.91 | % | | | 64.12 | % | | | (11.26 | )% |
| | | | | | | | | | | | | | | | | | | | | |
| Ratios/Supplemental Data: | | | | | | | | | | | | | | | | | | | | |
| Net assets at end of year (000’s) | | $ | 42,844 | | | $ | 51,001 | | | $ | 100,427 | | | $ | 121,699 | | | $ | 83,000 | |
| | | | | | | | | | | | | | | | | | | | | |
| Gross Expenses to Average Net Assets | | | 0.75 | % | | | 0.75 | % | | | 0.75 | % | | | 0.75 | % | | | 0.75 | % |
| Net Investment Income to Average Net Assets | | | 0.29 | % | | | 0.33 | % | | | 0.87 | % | | | 0.51 | % | | | 1.22 | % |
| Portfolio Turnover Rate | | | 44 | % | | | 53 | % | | | 89 | % | | | 53 | % | | | 38 | % |
| 1 | Calculated based on average shares outstanding during the year. |
The accompanying notes are an integral part of these financial statements.
Wedbush ETFMG TM ETF
NOTES TO FINANCIAL STATEMENTS
September 30, 2023
NOTE 1 – ORGANIZATION
Wedbush ETFMG Global Cloud Technology ETF (“IVES”) and Wedbush ETFMG Video Game Tech ETF (“GAMR”) (each a “Fund”, or collectively the “Funds”) are a series of ETF Managers Trust (the “Trust”), an open-end management investment company consisting of multiple investment series, organized as a Delaware statutory trust on July 1, 2009. The Trust is registered with the U.S. Securities and Exchange Commission (“SEC”) under the Investment Company Act of 1940, as amended (the “1940 Act”), as an open-end management investment company and the offering of the Fund’s shares (“Shares”) is registered under the Securities Act of 1933, as amended (the “Securities Act”).
Effective April 17, 2020, the name ETFMG Video Game Tech ETF has changed to the Wedbush ETFMG Video Game Tech ETF.
The following table is a summary of the Strategy Commencement Date and Strategy of the Funds:
| Fund Ticker | | Strategy Commencement Date | | Strategy |
Wedbush ETFMG Global Cloud Technology ETF | | 4/7/2020 | | Seeks to provide investment results that, before fees and expenses, correspond generally to the price and yield performance of the Dan Ives Global Cloud Technology Prime™ Index NTR. |
Wedbush ETFMG Video Game Tech ETF | | 3/8/2016 | | Seeks to provide investment results that, before fees and expenses, correspond generally to the price and yield performance of the EEFund Video Game Tech™ Index. |
The Funds currently offer one class of shares, which has no front end sales load, no deferred sales charges, and no redemption fees. The Funds may issue an unlimited number of shares of beneficial interest, with no par value. All shares of the Funds have equal rights and privileges.
Shares of the Funds are listed and traded on the NASDAQ Stock Market, LLC. Market prices for the Shares may be different from their net asset value (“NAV”). The Funds issue and redeem Shares on a continuous basis at NAV only in blocks of 50,000 shares, called “Creation Units.” Creation Units are issued and redeemed principally in-kind for securities included in the Index. Once created, Shares generally trade in the secondary market at market prices that change throughout the day in quantities less than a Creation Unit. Except when aggregated in Creation Units, Shares are not redeemable securities of the Funds. Shares of the Funds may only be purchased or redeemed by certain financial institutions (“Authorized Participants”). An Authorized Participant is either (i) a broker-dealer or other participant in the clearing process through the Continuous Net Settlement System of the National Securities Clearing Corporation or (ii) a DTC participant and, in each case, must have executed a Participant Agreement with the Distributor. Most retail investors do not qualify as Authorized Participants nor have the resources to buy and sell whole Creation Units. Therefore, they are unable to purchase or redeem the Shares directly from the Funds. Rather, most retail investors may purchase Shares in the secondary market with the assistance of a broker and may be subject to customary brokerage commissions or fees.
Wedbush ETFMG TM ETF
NOTES TO FINANCIAL STATEMENTS
September 30, 2023 (Continued)
Authorized Participants transacting in Creation Units for cash may pay an additional variable charge to compensate the relevant Fund for certain transaction costs (i.e., brokerage costs) and market impact expenses relating to investing in portfolio securities. Such variable charges, if any, are included in “Transaction Fees” in the Statements of Changes in Net Assets.
NOTE 2 – SIGNIFICANT ACCOUNTING POLICIES
The following is a summary of significant accounting policies consistently followed by the Funds. These policies are in conformity with accounting principles generally accepted in the United States of America (“U.S. GAAP”).
The Funds follow the investment company accounting and reporting guidance of the Financial Accounting Standards Board Accounting Standard Codification Topic 946 Financial Services – Investment Companies.
The Funds may invest in certain other investment companies (underlying funds). For more information about the underlying fund’s operations and policies, please refer to those funds’ semiannual and annual reports, which are filed with the SEC.
| A. | Security Valuation. Securities listed on a securities exchange, market or automated quotation system for which quotations are readily available (except for securities traded on NASDAQ), including securities traded over the counter, are valued at the last quoted sale price on the primary exchange or market (foreign or domestic) on which they are traded on the valuation date (or at approximately 4:00 pm Eastern Time if a security’s primary exchange is normally open at that time), or, if there is no such reported sale on the valuation date, at the most recent quoted bid price. For securities traded on NASDAQ, the NASDAQ Official Closing Price will be used. |
Securities for which quotations are not readily available are valued at their respective fair values as determined in good faith by ETF Managers Group, LLC (the “Adviser”), using procedures adopted by the Board of Trustees (the “Board”). When a security is “fair valued,” consideration is given to the facts and circumstances relevant to the particular situation, including a review of various factors set forth in the pricing procedures adopted by the Funds’ Board. The use of fair value pricing by the Funds may cause the NAV of its shares to differ significantly from the NAV that would be calculated without regard to such considerations. As of September 30, 2023, the Wedbush ETFMG Video Game Tech ETF held one security that was fair valued by the Adviser.
As described above, the Funds utilize various methods to measure the fair value of its investments on a recurring basis. U.S. GAAP establishes a hierarchy that prioritizes inputs to valuation methods. The three levels of inputs are:
Level 1 Unadjusted quoted prices in active markets for identical assets or liabilities that the Funds have the ability to access.
Level 2 Observable inputs other than quoted prices included in Level 1 that are observable for the asset or liability, either directly or indirectly. These inputs may include quoted prices for the identical instrument on an inactive market, prices for similar instruments, interest rates, prepayment speeds, credit risk, yield curves, default rates and similar data.
Level 3 Unobservable inputs for the asset or liability, to the extent relevant observable inputs are not available; representing the Funds’ own assumptions about the assumptions a market participant would use in valuing the asset or liability, and would be based on the best information available.
The availability of observable inputs can vary from security to security and is affected by a wide variety of factors, including, for example, the type of security, whether the security is new and not yet established in the marketplace, the liquidity of markets, and other characteristics particular to the security. To the extent that valuation is based on models or inputs that are less observable or unobservable in the market, the determination of fair value requires more judgment. Accordingly, the degree of judgment exercised in determining fair value is greatest for instruments categorized in Level 3.
Wedbush ETFMG TM ETF
NOTES TO FINANCIAL STATEMENTS
September 30, 2023 (Continued)
The inputs used to measure fair value may fall into different levels of the fair value hierarchy. In such cases, for disclosure purposes, the level in the fair value hierarchy within which the fair value measurement falls in its entirety, is determined based on the lowest level input that is significant to the fair value measurement in its entirety.
The following is a summary of the inputs used to value the Funds’ net assets as of September 30, 2023:
| | | | | | | | | | | | | |
| Wedbush ETFMG Global Cloud Technology ETF | | | | | | | | | | | | |
| Assets^ | | Level 1 | | | Level 2 | | | Level 3 | | | Total | |
| Common Stocks | | $ | 24,459,472 | | | $ | — | | | $ | — | | | $ | 24,459,472 | |
| Short Term Investments | | | 172,136 | | | | — | | | | — | | | | 172,136 | |
| Investments Purchased with Securities | | | | | | | | | | | | | | | | |
| Lending Collateral* | | | — | �� | | | — | | | | — | | | | 5,986,611 | |
| Total Investments in Securities | | $ | 24,631,608 | | | $ | — | | | $ | — | | | $ | 30,618,219 | |
| | | | | | | | | | | | | |
| Wedbush ETFMG Video Game Tech ETF | | | | | | | | | | | | |
| Assets^ | | Level 1 | | | Level 2 | | | Level 3 | | | Total | |
| Common Stocks | | $ | 42,555,818 | | | $ | — | | | $ | — | (1) | | $ | 42,555,818 | |
| Short Term Investments | | | 232,107 | | | | — | | | | — | | | | 232,107 | |
| Investments Purchased with Securities | | | | | | | | | | | | | | | | |
| Lending Collateral* | | | — | | | | — | | | | — | | | | 6,026,869 | |
| Total Investments in Securities | | $ | 42,787,925 | | | $ | — | | | $ | — | | | $ | 48,814,794 | |
| (1) | Includes a security valued at $0 with a cost of $463,445. |
| ^ | See Schedule of Investments for classifications by country and industry |
| * | Certain investments that are measured at fair value used the net asset value per share (or its equivalent) practical expediant have not been categorized in the fair value hierarchy. The fair value amounts presented in the table are intended to permit reconciliation of the fair value hierarchy to the amounts presented in the Schedules of Investments. |
| B. | Federal Income Taxes. The Funds have elected to be taxed as a “regulated investment company” and intend to distribute substantially all taxable income to their shareholders and otherwise comply with the provisions of the Internal Revenue Code applicable to regulated investment companies. Therefore, no provisions for federal income taxes or excise taxes have been made. |
To avoid imposition of the excise tax applicable to regulated investment companies, the Funds intend to declare each year as dividends, in each calendar year, at least 98.0% of its net investment income (earned during the calendar year) and 98.2% of its net realized capital gains (earned during the twelve months ended October 31) plus undistributed amounts, if any, from prior years.
Net capital losses incurred after October 31, within the taxable year are deemed to arise on the first business day of the Funds’ next taxable year.
The Funds recognize the tax benefits of uncertain tax positions only where the position is “more likely than not” to be sustained assuming examination by tax authorities. The Funds have analyzed their tax position and have concluded that no liability for unrecognized tax benefits should be recorded related to uncertain tax positions expected to be taken in the Funds’ 2023 tax returns. The Funds identify its major tax jurisdictions as U.S. Federal, the State of New Jersey, and the State of Delaware; however the Funds are not aware of any tax positions for which it is reasonably possible that the total amounts of unrecognized tax benefits will change materially in the next twelve months.
As of September 30, 2023, management has reviewed the tax positions for open periods (for federal purposes, three years from the date of filing and for state purposes, generally a range of three to four years from the date of filing) as applicable to the Funds, and has determined that no provision for income tax is required in the Funds’ financial statements.
Wedbush ETFMG TM ETF
NOTES TO FINANCIAL STATEMENTS
September 30, 2023 (Continued)
| C. | Security Transactions and Investment Income. Investment securities transactions are accounted for on the trade date. Gains and losses realized on sales of securities are determined on a specific identification basis. Discounts/premiums on debt securities purchased are accreted/amortized over the life of the respective securities using the effective interest method. Dividend income is recorded on the ex-dividend date. Interest income is recorded on an accrual basis. Income, including gains, from investments in foreign securities received by the Funds may be subject to income, withholding or other taxes imposed by foreign countries. |
| D. | Foreign Currency Translations and Transactions. The Funds may engage in foreign currency transactions. Foreign currency transactions are translated into U.S. dollars on the following basis: (i) market value of investment securities, assets and liabilities at the daily rates of exchange, and (ii) purchases and sales of investment securities, dividend and interest income and certain expenses at the rates of exchange prevailing on the respective dates of such transactions. For financial reporting purposes, the Funds do not isolate changes in the exchange rate of investment securities from the fluctuations arising from changes in the market prices of securities for unrealized gains and losses. However, for federal income tax purposes, the Funds do isolate and treat as ordinary income the effect of changes in foreign exchange rates on realized gains or losses from the sale of investment securities and payables and receivables arising from trade-date and settlement-date differences. |
| E. | Distributions to Shareholders. Distributions to shareholders from net investment income, if any are generally declared and paid by the Funds on a quarterly basis. Net realized gains on securities of the Funds normally are declared and paid on an annual basis. Distributions are recorded on the ex-dividend date. |
| F. | Use of Estimates. The preparation of financial statements in conformity with U.S. GAAP requires management to make estimates and assumptions that affect the reported amounts of assets and liabilities at the date of the financial statements, as well as the reported amounts of revenues and expenses during the period. Actual results could differ from those estimates. |
| G. | Share Valuation. The NAV per share of each Fund is calculated by dividing the sum of the value of the securities held by each Fund, plus cash and other assets, minus all liabilities (including estimated accrued expenses) by the total number of shares outstanding of each Fund, rounded to the nearest cent. Each Fund’s shares will not be priced on the days on which the NYSE is closed for trading. The offering and redemption price per share for each Fund is equal to each Fund’s NAV per share. |
| H. | Guarantees and Indemnifications. In the normal course of business, the Funds enter into contracts with service providers that contain general indemnification clauses. The Funds’ maximum exposure under these arrangements is unknown as this would involve future claims that may be made against the Funds that have not yet occurred. However, based on experience, the Funds expect the risk of loss to be remote. |
NOTE 3 – RISK FACTORS
Investing in Wedbush ETFMG Global Cloud Technology ETF and the Wedbush ETFMG Video Game Tech ETF may involve certain risks, as discussed in each Fund’s prospectus, including, but not limited to, those described below. Any of these risks could cause an investor to lose money.
Market Risk. Financial markets rise and fall in response to a variety of factors, sometimes rapidly and unpredictably. As with any investment whose performance is tied to these markets, the value of an investment in a fund will fluctuate, which means that an investor could lose money over short or long periods.
Investment Style Risk. The Funds are not actively managed. Therefore, the Funds follow the securities included in its respective index during upturns as well as downturns. Because of its indexing strategy, the Funds do not take steps to reduce market exposure or to lessen the effects of a declining market. In addition, because of the Funds’ expenses, the Funds’ performance may be below that of its index.
Wedbush ETFMG TM ETF
NOTES TO FINANCIAL STATEMENTS
September 30, 2023 (Continued)
Equity Risk. The prices of equity securities rise and fall daily. These price movements may result from factors affecting individual companies, industries or the securities market as a whole. In addition, equity markets tend to move in cycles which may cause stock prices to fall over short or extended periods of time.
Securities Lending Risk. Securities lending involves the risk of loss of rights in, or delay in recovery of, the loaned securities if the borrower fails to return the security loaned or becomes insolvent.
Concentration Risk. To the extent that the Funds’ or its underlying index’s portfolio is concentrated in the securities of issuers in a particular market, industry, group of industries, sector or asset class, the Funds may be adversely affected by the performance of those securities, may be subject to increased price volatility and may be more vulnerable to adverse economic, market, political or regulatory occurrences affecting that market, industry, group of industries, sector or asset class.
Natural Disaster/Epidemic Risk. Natural or environmental disasters, such as earthquakes, fires, floods, hurricanes, tsunamis and other severe weather-related phenomena generally, and widespread disease, including pandemics and epidemics (for example, the novel coronavirus COVID -19), have been and can be highly disruptive to economies and markets and have recently led, and may continue to lead, to increased market volatility and significant market losses. Such natural disaster and health crises could exacerbate political, social, and economic risks previously mentioned, and result in significant breakdowns, delays, shutdowns, social isolation, and other disruptions to important global, local and regional supply chains affected, with potential corresponding results on the operating performance of the Funds and their investments. A climate of uncertainty and panic, including the contagion of infectious viruses or diseases, may adversely affect lobal, regional, and local economies and reduce the availability of potential investment opportunities, and increases the difficulty of performing due diligence and modeling market conditions, potentially reducing the accuracy of financial projections. Under the circumstances, the Funds may have difficulty achieving their investment objectives which may adversely impact performance. Further, such events can be highly disruptive to economies and markets, significantly disrupt the operations of individual companies (including, but not limited to, the Funds’ Sponsor and third party service providers), sectors, industries, markets, securities and commodity exchanges, currencies, interest and inflation rates, credit ratings, investor sentiment, and other factors affecting the value of the Funds’ investments. These factors can cause substantial market volatility, exchange trading suspensions and closures and can impact the ability of the Funds to complete redemptions and otherwise affect Fund performance and Fund trading in the secondary market. A wide spread crisis may also affect the global economy in ways that cannot necessarily be foreseen at the current time. How long such events will last and whether they will continue or recur cannot be predicted. Impacts from these events could have significant impact on a Fund’s performance, resulting in losses to the Funds.
On February 24, 2022, Russia commenced a military attack on Ukraine. The outbreak of hostilities between the two countries could result in more widespread conflict and could have a severe adverse effect on the region and the markets. In addition, sanctions imposed on Russia by the United States and other countries, and any sanctions imposed in the future could have a significant adverse impact on the Russian economy and related markets.
On October 7, 2023, Hamas launched a significant attack on Israel from the Gaza Strip. The extent and duration of the Israel-Hamas war and any related economic and market impacts are impossible to predict but may be significant and may negatively impact Israel’s economy. The price and liquidity of investments may fluctuate widely as a result of these conflicts and related events. How long such conflicts and related events will last, and whether either may escalate further, cannot be predicted, however such conflicts may negatively impact issuers of securities in which the Fund(s) invests.
A complete description of the principal risks is included in each Fund’s prospectus under the heading “Principal Investment Risks.”
Wedbush ETFMG TM ETF
NOTES TO FINANCIAL STATEMENTS
September 30, 2023 (Continued)
NOTE 4 – MANAGEMENT AND OTHER CONTRACTS
Under the Investment Advisory Agreement, the Adviser has agreed to pay all expenses of the Funds, except for: the fee paid to the Adviser pursuant to the Investment Advisory Agreement, interest charges on any borrowings, taxes, brokerage commissions and other expenses incurred in placing orders for the purchase and sale of securities and other investment instruments, acquired fund fees and expenses, accrued deferred tax liability, extraordinary expenses, and distribution (12b-1) fees and expenses (collectively, “Excluded Expenses”).
Wedbush Securities, Inc. (“Wedbush”) has entered into a licensing and marketing support agreement with Exchange Traded Managers Group LLC (“Parent”), the parent company of the Adviser (the “Wedbush Agreement”). Pursuant to the Wedbush Agreement, Wedbush has agreed to (i) license the name Wedbush for the use of the Adviser; (ii) consult with the Adviser and prepare educational materials, research materials, and updates on regulation of the global video gaming technology and global cloud computing ecosystem; and (iii) provide support in connection with phone calls, appearances, and written content relating to the marketing of IVES and GAMR. Wedbush will also assumes the obligation of the Adviser to pay certain expenses of IVES and GAMR. Although Wedbush has agreed to be responsible for the payment of certain expenses of IVES and GAMR, the Adviser retains the ultimate obligation to the Funds to pay such expenses.
Advisory Fees:
Wedbush ETFMG Global Cloud Technology ETF 0.68%
Wedbush ETFMG Video Game Tech ETF 0.75%
The Adviser has entered into an agreement with Foreside Fund Services LLC to serve as distributor to the Funds (the “Distributor”). The Distributor provides marketing support for the Funds, including distributing marketing materials related to the Funds.
In May, 2020, Wedbush acquired a minority, non-voting, equity interest in Parent. Wedbush is not however, an affiliate of the Funds, the Adviser, the Funds’ distributor or any of their respective affiliates. Wedbush does not make investment decisions, provide investment advice, or otherwise act in the capacity of an investment adviser to the Funds. Additionally, Wedbush is not involved in the maintenance of the Index and does not otherwise act in the capacity of an index provider.
Level ETF Ventures, LLC serves as the index provider for GAMR and IVES.
U.S. Bancorp Fund Services, LLC doing business as U.S. Bank Global Fund Services (the “Administrator”) provides fund accounting, fund administration, and transfer agency services to the Funds. The Adviser compensates the Administrator for these services under an administration agreement between the two parties.
The Adviser pays each independent Trustee a quarterly fee for service to the Funds. Each Trustee is also reimbursed by the Adviser for all reasonable out-of-pocket expenses incurred in connection with his duties as Trustee, including travel and related expenses incurred in attending Board meetings.
NOTE 5 – DISTRIBUTION PLAN
Each Fund has adopted a Plan of Distribution pursuant to Rule 12b-1 under the 1940 Act. Under the Plan, the Funds may pay compensation to the Distributor or any other distributor or financial institution with which the Trust has an agreement with respect to the Funds, with the amount of such compensation not to exceed an annual rate of 0.25% of each Fund’s average daily net assets. For the year ended September 30, 2023, the Funds did not incur any 12b-1 expenses.
Wedbush ETFMG TM ETF
NOTES TO FINANCIAL STATEMENTS
September 30, 2023 (Continued)
NOTE 6 - PURCHASES AND SALES OF SECURITIES
The costs of purchases and sales of securities, excluding short-term securities and in-kind transactions, during the year ended September 30, 2023:
| | | Purchases | | | Sales | |
| Wedbush ETFMG Global Cloud Technology ETF | | $ | 7,132,098 | | | $ | 7,318,752 | |
| Wedbush ETFMG Video Game Tech ETF | | $ | 23,172,285 | | | $ | 29,044,827 | |
The costs of purchases and sales of in-kind transactions associated with creations and redemptions during the year ended September 30, 2023:
| | | Purchases In- | | | Sales In- | |
| | | Kind | | | Kind | |
| Wedbush ETFMG Global Cloud Technology ETF | | $ | 3,429,634 | | | $ | 6,362,043 | |
| Wedbush ETFMG Video Game Tech ETF | | $ | 0 | | | $ | 8,696,208 | |
Purchases in-kind are the aggregate of all in-kind purchases and sales in-kind are the aggregate of all in-kind sales. Net capital gains or losses resulting from in-kind redemptions are excluded from the Funds’ determination of taxable gains and are not distributed to shareholders.
There were no purchases or sales of U.S. Government obligations during the year ended September 30, 2023.
NOTE 7 — SECURITIES LENDING
The Funds may lend up to 33 1/3% of the value of the securities in their portfolio to brokers, dealers and financial institutions (but not individuals) under terms of participation in a securities lending program administered by U.S. Bank N.A. (“the Custodian”). The securities lending agreement requires that loans are collateralized at all times in an amount equal to at least 102% of the value of any loaned securities at the time of the loan, plus accrued interest. The Funds receive compensation in the form of fees and earns interest on the cash collateral. The amount of fees depends on a number of factors including the type of security and length of the loan. The Funds continue to receive interest payments or dividends on the securities loaned during the borrowing period. Gain or loss in the fair value of securities loaned that may occur during the term of the loan will be for the account of the Funds. The Funds have the right under the terms of the securities lending agreement to recall the securities from the borrower on demand. The cash collateral is invested by the Custodian in accordance with approved investment guidelines. Those guidelines require the cash collateral to be invested in readily marketable, high quality, short-term obligations, either directly on behalf of each Fund or through one or more joint accounts, money market funds, or short-term bond funds, including those advised by or affiliated with the Adviser; however, all such investments are subject to risk of payment delays or default on the part of the issuer or counterparty or otherwise may not generate sufficient interest to support the costs associated with securities lending. Other investment companies in which a Fund may invest cash collateral can be expected to incur fees and expenses for operations, such as investment advisory and administration fees, which would be in addition to those incurred by the Fund, and which may be received in full or in part by the Adviser. Pursuant to guidance issued by the SEC staff, fees and expenses of money market funds used for cash collateral received in connection with loans of securities are not treated as Acquired Fund Fees and Expenses, which reflect a Fund’s pro rata share of the fees and expenses incurred by other investment companies in which the Fund invests (as disclosed in the Prospectus, as applicable). The Fund could also experience delays in recovering its securities and possible loss of income or value if the borrower fails to return the borrowed securities, although the Fund is indemnified from this risk by contract with the securities lending agent.
Wedbush ETFMG TM ETF
NOTES TO FINANCIAL STATEMENTS
September 30, 2023 (Continued)
As of September 30, 2023, the value of the securities on loan and payable for collateral due to broker were as follows:
| Value of Securities on Loan Collateral Received | | | | | | |
| Fund | | Values of Securities on Loan | | | Fund Collateral Received* | |
| Wedbush ETFMG Global Cloud Technology ETF | | $ | 5,904,858 | | | $ | 5,986,611 | |
| Wedbush ETFMG Video Game Tech ETF | | | 5,923,662 | | | | 6,026,869 | |
| * | The cash collateral received was invested in the Mount Vernon Liquid Assets Portfolio, an investment with an overnight and continuous maturity, as shown on the Schedule of Investments. |
NOTE 8 – FEDERAL INCOME TAXES
The components of distributable earnings (losses) and cost basis of investments for federal income tax purposes at September 30, 2023, the Funds’ most recent fiscal year end, were as follows:
| | | Cost | | | Gross Unrealized Appreciation | | | Gross Unrealized Depreciation | | | Net Unrealized Appreciation (Depreciation) | |
| Wedbush ETFMG Global Cloud Technology ETF | | $ | 34,066,153 | | | $ | 3,669,298 | | | $ | (7,117,232 | ) | | $ | (3,447,934 | ) |
| Wedbush ETFMG Video Game Tech ETF | | | 63,052,945 | | | | 3,282,333 | | | | (17,520,484 | ) | | | (14,238,151 | ) |
The difference between the tax cost of investments and the cost of investments for GAAP purposes is primarily due to the tax treatment of wash sale losses.
As of September 30, 2023, the Funds’ most recent fiscal year end, the components of distributable earnings (loss) on a tax basis were as follows:
| | | Undistributed Ordinary Income | | | Undistributed Long-Term Gain | | | Total Distributable Earnings | | | Other Accumulated Loss | | | Total Accumulated Gain (Loss) | |
| | | | | | | | | | | | | | | | |
| Wedbush ETFMG Global Cloud Technology ETF | | $ | — | | | $ | — | | | $ | — | | | $ | (12,862,537 | ) | | $ | (16,310,471 | ) |
| Wedbush ETFMG Video Game Tech ETF | | | 11,336 | | | | — | | | | 11,336 | | | | (42,513,400 | ) | | | (56,740,215 | ) |
The difference between the tax cost of investments and the cost of investments for GAAP purposes is primarily due to the tax treatment of wash sale losses.
As of September 30, 2023, the Funds’ most recent fiscal year end, the Funds had accumulated capital loss carryovers of:
| | | Capital Loss Carryforward ST | | | Capital Loss Carryforward LT | | | Expires | |
| Wedbush ETFMG Global Cloud Technology ETF | | $ | (2,648,434 | ) | | $ | (10,107,033 | ) | | | Indefinite | |
| Wedbush ETFMG Video Game Tech ETF | | | (16,633,167 | ) | | | (25,878,915 | ) | | | Indefinite | |
Wedbush ETFMG TM ETF
NOTES TO FINANCIAL STATEMENTS
September 30, 2023 (Continued)
Under current tax law, capital and currency losses realized after October 31 of a Fund’s fiscal year may be deferred and treated as occurring on the first business day of the following fiscal year for tax purposes. The following Funds had deferred post -October capital and currency losses, which will be treated as arising on the first business day of the year ending September 30, 2023, the Funds’ most recent fiscal year end.
| | | Late Year Ordinary Loss | | | Post-October Capital Loss | |
| Wedbush ETFMG Global Cloud Technology ETF | | $ | (90,700 | ) | | $ | — | |
| Wedbush ETFMG Video Game Tech ETF | | | — | | | | — | |
U.S. GAAP requires that certain components of net assets relating to permanent differences be reclassified between financial and tax reporting. These reclassifications have no effect on net assets or net asset value per share. For the fiscal year ended September 30, 2023, the following table shows the reclassifications made:
| | | Total Distributable Earnings/(Loss) | | | Paid-In Capital | |
| Wedbush ETFMG Global Cloud Technology ETF | | $ | (690,629 | ) | | $ | 690,629 | |
| Wedbush ETFMG Video Game Tech ETF | | | (374,992 | ) | | | 374,992 | |
The tax charter of distributions paid during the year ended September 30, 2023, and the year ended September 30, 2022 were as follows:
| | | Year Ended | | | Year Ended | |
| | | September 30, 2023 | | | September 30, 2022 | |
| | | From Ordinary Income | | | From Capital Gains | | | From Ordinary Income | | | From Capital Gains | |
| Wedbush ETFMG Global Cloud Technology ETF | | $ | — | | | | — | | | $ | — | | | | — | |
| Wedbush ETFMG Video Game Tech ETF | | | — | | | | — | | | | 2,457,762 | | | | — | |
NOTE 9 – INVESTMENTS IN AFFILIATES
Wedbush ETFMG Global Cloud Technology ETF
Wedbush ETFMG Global Cloud Technology ETF owned the following company during the year ended September 30, 2023. ETFMG Sit Ultra Short ETF was deemed to be an affiliate of the Fund as defined by the 1940 Act during the year ended September 30, 2023. Transactions during the year in the security were as follows:
| Security Name | | Value, at September 30, 2022 | | | Purchases | | | Sales | | | Realized Gain (Loss) | | | Change in Unrealized Appreciation (Depreciation) | | | Dividend Income | | | Value, at September 30, 2023 | | | Ending Shares | |
| ETFMG Sit Ultra Short ETF | | $ | 2,403,750 | | | $ | — | | | $ | (2,420,438 | ) | | ($ | 67,511 | ) | | $ | 84,199 | | | $ | — | | | $ | — | | | | — | |
Wedbush ETFMG Video Game Tech ETF
Wedbush ETFMG Video Game Tech ETF owned the following company during the year ended September 30, 2023. ETFMG Sit Ultra Short ETF is deemed to be an affiliate of the Fund as defined by the 1940 Act during the year ended September 30, 2023. Transactions during the year in the security were as follows:
Security Name | | Value, at September 30, 2022 | | | Purchases | | | Sales | | | Realized Gain (Loss) | | | Change in Unrealized Appreciation (Depreciation) | | | Dividend Income | | | Value, at September 30, 2023 | | | Ending Shares | |
| ETFMG Sit Ultra Short ETF | | $ | 3,605,625 | | | $ | — | | | $ | (3,628,250 | ) | | ($ | 119,598 | ) | | $ | 142,222 | | | $ | — | | | $ | — | | | | — | |
Wedbush ETFMG TM ETF
NOTES TO FINANCIAL STATEMENTS
September 30, 2023 (Continued)
NOTE 10 – LEGAL MATTERS
The Trust, the Adviser, and certain officers and affiliated persons of the Adviser (together with the Adviser, the “Adviser Defendants”) were named as defendants in an action filed December 21, 2021, in the Superior Court of New Jersey, Union County, captioned PureShares, LLC, d/b/a PureFunds et al. v. ETF Managers Group, LLC et al., Docket No. UNN-C-152-21 (the “NJ Action”). The NJ Action asserted breach of contract and other tort claims and sought damages in unspecified amounts and injunctive relief. On May 25, 2022, the court in the NJ Action dismissed with prejudice all claims asserted against the Trust, as well as all contract claims and all except one tort claim asserted against the Adviser Defendants. With respect to the tort claim asserted against the Adviser Defendants, the parties stipulated and agreed to dismiss that claim without prejudice in May, 2023.
The Adviser and certain of its affiliates have entered into a settlement agreement with the Securities and Exchange Commission (“SEC”) regarding certain alleged conflicts of interest arising in connection with ETFMG Alternative Harvest ETF’s (MJ) participation in the securities lending program administered by its prior custodian. Without admitting or denying the SEC’s findings, the Adviser and its parent company agreed to censures, to a cease-and-desist order, and to pay, jointly and severally, a civil penalty of $4 million. The settlement resolves the SEC’s investigation of the Adviser and its affiliates.
As of September 30, 2023, there were no adjustments made to the accompanying financial statements based on the above legal matters.
NOTE 11 – SUBSEQUENT EVENTS
In preparing these financial statements, the Funds have evaluated events and transactions for potential recognition or disclosure through the date the financial statements were issued. This evaluation did not result in any subsequent events that necessitated disclosures and/or adjustments to the financial statements.
The Board of the Trust has approved an Agreement and Plan of Reorganization (the “Agreement”) providing for the reorganization of the Target Fund into corresponding new fund (the “Acquiring Fund”), which is a newly created series of Amplify ETF Trust with similar investment objectives and the same fees and expenses as the corresponding Target Fund. The Reorganization is subject to certain conditions including approval by shareholders of the Target Fund. The following table shows shares of the Acquiring Fund that will be issued to shareholders of the corresponding Target Fund.
| Target Fund | Acquiring Fund |
| Wedbush ETFMG Global Cloud Technology ETF | Amplify Global Cloud Technology ETF |
| Wedbush ETFMG Video Game Tech ETF | Amplify Video Game Tech ETF |
The proxy solicitation materials were filed with the SEC on October 13, 2023. The Joint Special Meeting of Shareholders is to be held on December 28, 2023.
Other than as disclosed, there were no other subsequent events requiring recognition or disclosure through the date the financial statements were issued.
Report of Independent Registered Public Accounting Firm
To the Board of Trustees of ETF Managers Trust
and the Shareholders of Wedbush ETFMG Video Game Tech ETF and Wedbush ETFMG Global Cloud Technology ETF:
Opinion on the Financial Statements
We have audited the accompanying statements of assets and liabilities, including the schedules of investments, of Wedbush ETFMG Video Game Tech ETF and Wedbush ETFMG Global Cloud
Technology ETF (the “Funds”) (certain of the Funds comprising ETF Managers Trust), as of September 30, 2023, the related statements of operations for the year then ended, the statements of changes in net assets for each of the two years in the period then ended, the financial highlights for each of the periods indicated therein, and the related notes (collectively referred to as the “financial statements”). In our opinion, the financial statements present fairly, in all material respects, the financial position of the Funds as of September 30, 2023, and the results of their operations for the year then ended, the changes in net assets for each of the two years in the period then ended, and the financial highlights for each of the periods indicated therein, in conformity with accounting principles generally accepted in the United States of America.
Basis for Opinion
These financial statements and financial highlights are the responsibility of the Funds’ management. Our responsibility is to express an opinion on these financial statements and financial highlights based on our audits. We are a public accounting firm registered with the Public Company Accounting Oversight Board (United States) (“PCAOB”) and are required to be independent with respect to the Funds in accordance with the U.S. federal securities laws and the applicable rules and regulations of the Securities and Exchange Commission and the PCAOB.
We conducted our audits in accordance with the standards of the PCAOB. Those standards require that we plan and perform the audits to obtain reasonable assurance about whether the financial statements and financial highlights are free of material misstatement, whether due to error or fraud. The Funds are not required to have, nor were we engaged to perform, an audit of their internal control over financial reporting. As part of our audits we are required to obtain an understanding of internal control over financial reporting but not for the purpose of expressing an opinion on the effectiveness of the Funds’ internal control over financial reporting. Accordingly, we express no such opinion.
Our audits included performing procedures to assess the risks of material misstatement of the financial statements and financial highlights, whether due to error or fraud, and performing procedures that respond to those risks. Such procedures included examining, on a test basis, evidence regarding the amounts and disclosures in the financial statements and financial highlights. Our audits also included evaluating the accounting principles used and significant estimates made by management, as well as evaluating the overall presentation of the financial statements and financial highlights. Our procedures included confirmation of securities owned as of September 30, 2023 by correspondence with the custodian. We believe that our audits provide a reasonable basis for our opinion.
/s/WithumSmith+Brown, PC
We have served as the auditor for one or more series of the Trust since 2013.
New York, New York
November 29, 2023
Wedbush ETFMG TM ETF
Expense Example
Period Ended September 30, 2023 (Unaudited)
As a shareholder of the Funds you incur two types of costs: (1) transaction costs, including brokerage commissions on purchases and sales of Fund shares, and (2) ongoing costs, including management fees and other Fund expenses. These examples are intended to help you understand your ongoing costs (in dollars) of investing in the Funds and to compare these costs with the ongoing costs of investing in other funds. The examples are based on an investment of $1,000 for the period of time as indicated in the table below.
Actual Expenses
The first line of the table provides information about actual account values based on actual returns and actual expenses. You may use the information in this line, together with the amount you invested, to estimate the expenses that you paid over the period. Simply divide your account value by $1,000 (for example, an $8,600 account value divided by $1,000 = 8.6), then, multiply the result by the number in the first line under the heading entitled “Expenses Paid During Period’’ to estimate the expenses you paid on your account during this period.
Hypothetical Example for Comparison Purposes
The second line of the table provides information about hypothetical account values based on a hypothetical return and hypothetical expenses based on the Fund’s actual expense ratio and an assumed rate of return of 5% per year before expenses, which is not the Fund’s actual return. The hypothetical account values and expenses may not be used to estimate the actual ending account balance or expenses you paid for the period. You may use this information to compare the ongoing costs of investing in the Fund and other funds. To do so, compare this 5% hypothetical example with the 5% hypothetical examples that appear in the shareholder reports of the other funds. Please note that the expenses shown in the table are meant to highlight your ongoing costs only and do not reflect any transactional costs, such as brokerage commissions paid on purchases and sales of Fund shares. Therefore, the second line of the table is useful in comparing ongoing costs only and will not help you determine the relative total costs of owning different funds. If these transactional costs were included, your costs would have been higher.
| | | Beginning Account Value April 1, | | | Ending Account Value September 30, | | | Expenses Paid During | | | Annualized Expense Ratio During the Period April 1, 2023 to September 30, | |
| Fund Name | | 2023 | | | 2023 | | | the Period^ | | | 2023 | |
| Wedbush ETFMG Global Cloud Technology ETF | | | | | | | | | | | | | | | | |
| Actual | | $ | 1,000.00 | | | $ | 1,085.10 | | | $ | 3.55 | | | | 0.68 | % |
| Hypothetical (5% annual) | | | 1,000.00 | | | | 1,021.66 | | | | 3.45 | | | | 0.68 | % |
| Wedbush ETFMG Video Game Tech ETF | | | | | | | | | | | | | | | | |
| Actual | | | 1,000.00 | | | | 874.70 | | | | 3.52 | | | | 0.75 | % |
| Hypothetical (5% annual) | | | 1,000.00 | | | | 1,021.31 | | | | 3.80 | | | | 0.75 | % |
| ^ | The dollar amounts shown as expenses paid during the period are equal to the annualized six-month expense ratio multiplied by the average account value during the period, multiplied by 183/365 (to reflect the one-half year period). |
Wedbush ETFMG TM ETF
SUPPLEMENTARY INFORMATION
September 30, 2023 (Unaudited)
NOTE 1 – FREQUENCY DISTRIBUTION OF PREMIUMS AND DISCOUNTS
Information regarding how often shares of each Fund traded on the Exchange at a price above (i.e., at a premium) or below (i.e., at a discount) the NAV is available on the Fund’s website at www.etfmgfunds.com.
NOTE 2 – FEDERAL TAX INFORMATION
Qualified Dividend Income/Dividends Received Deduction
For the fiscal year ended September 30, 2023, certain dividends paid by the Funds may be subject to a maximum tax rate of 15%, as provided for by the Jobs and Growth Tax Reconciliation Act of 2003. The percentage of dividends declared from ordinary income designated as qualified dividend income was as follows:
| | | Qualified | |
| Fund Name | | Dividend Income | |
| | | | | |
| Wedbush ETFMG Global Cloud Technology ETF | | | 0.00 | % |
| Wedbush ETFMG Video Game Tech ETF | | | 0.00 | % |
For corporate shareholders, the percent of ordinary income distributions qualifying for the corporate dividends received deduction for the fiscal year ended September 30, 2023 was as follows:
| | | Dividends Received | |
| Fund Name | | Deduction | |
| | | | | |
| Wedbush ETFMG Global Cloud Technology ETF | | | 0.00 | % |
| Wedbush ETFMG Video Game Tech ETF | | | 0.00 | % |
Short Term Capital Gain
The percentage of taxable ordinary income distributions that are designated as short-term capital gain distributions under Internal Revenue Section 871 (k)(2)(C) for each Fund were as follows:
| | | Short-Term | |
| Fund Name | | Capital Gain | |
| | | | | |
| Wedbush ETFMG Global Cloud Technology ETF | | | 0.00 | % |
| Wedbush ETFMG Video Game Tech ETF | | | 0.00 | % |
During the year ended September 30, 2023, the Funds did not declare any long-term realized gains distributions. Pursuant to Section 853 of the Internal Revenue Code the Fund designated the following amounts as foreign taxes paid for the year ended September 30, 2023. Foreign taxes paid for purposes of Section 853 may be less than actual foreign taxes paid for financial statement purposes.
| | | | | | | | | Per Share | | | | |
| Fund | | Gross Foreign Source Income | | | Foreign Taxes Passthrough | | | Gross Foreign Source Income | | | Foreign Taxes Passthrough | | | Shares Outstanding at 9/30/23 | |
| Wedbush ETFMG Video Game Tech ETF | | | 431,353 | | | | 58,376 | | | | 0.53919125 | | | | 0.07297000 | | | | 800,000 | |
Wedbush ETFMG TM ETF
SUPPLEMENTARY INFORMATION
September 30, 2023 (Unaudited) (Continued)
Foreign taxes paid or withheld should be included to taxable income with an offsetting deduction from gross income or as a credit for taxes paid to foreign governments. Above figures may differ from those cited elsewhere in this report due to difference in the calculation of income and gains under GAAP purposes and Internal Revenue Service purposes. Shareholders are strongly advised to consult their own tax advisors with respect to their investments in the Funds.
NOTE 3 – INFORMATION ABOUT PORTFOLIO HOLDINGS
The Funds file their complete schedule of portfolio holdings for their first and third fiscal quarters with the Securities and Exchange Commission (“SEC”) on Part F of Form N-PORT. The Funds’ Part F of Form N-PORT is available on the website of the SEC at www.sec.gov and the Funds’ website at www.etfmgfunds.com. Each Fund’s portfolio holdings are posted on their website at www.etfmgfunds.com daily.
NOTE 4 – INFORMATION ABOUT PROXY VOTING
A description of the policies and procedures the Funds use to determine how to vote proxies relating to portfolio securities is provided in the Statement of Additional Information (“SAI”). The SAI is available without charge upon request by calling toll-free at (877) 756-7873, by accessing the SEC’s website at www.sec.gov, or by accessing the Funds’ website at www.etfmgfunds.com.
Information regarding how the Funds voted proxies relating to portfolio securities during the period ending June 30 is available by calling toll-free at (877) 756-7873 or by accessing the SEC’s website at www.sec.gov.
Carefully consider the Fund’s investment objectives, risk factors, charges, and expenses before investing. This and additional information can be found in the Fund’s prospectus, which may be obtained by calling 1-844-ETF-MGRS (1-844-383-6477) or by visiting www.etfmgfunds.com. This report must be preceded or accompanied by a prospectus.
Wedbush ETFMG TM ETF
Board of Trustees
Set forth below are the names, birth years, positions with the Trust, length of term of office, and the principal occupations and other directorships held during at least the last five years of each of the persons currently serving as a Trustee of the Trust, as well as information about each officer. The business address of each Trustee and officer is 30 Maple Street, 2nd Floor, Summit, New Jersey 07901. The SAI includes additional information about Fund directors and is available, without charge, upon request by calling 1-844-ETF-MGRS (1-844-383-6477).
Name and Year of Birth | Position(s) Held with the Trust, Term of Office and Length of Time Served | Principal Occupation(s) During Past 5 Years | Number of Portfolios in Fund Complex Overseen By Trustee | Other Directorships Held by Trustee During Past 5 Years |
| Interested Trustee and Officers | | | |
Michael Minella (1971) | President (since 2023) | Senior Principal Consultant, ACA Group (since 2022); Vice President and Director, Fidelity Investments (2009-2022). | n/a | n/a |
John A. Flanagan (1946) | Treasurer (since 2015) | President, John A. Flanagan CPA, LLC (accounting services) (since 2010); Treasurer, ETF Managers Trust (since 2015); Chief Financial Officer, ETF Managers Capital, LLC (commodity pool operator) (since 2015). | n/a | Independent Trustee - Absolute Shares Trust (since 2014) (6 portfolios) |
Kevin Hourihan (1978) | Chief Compliance Officer (since 2022) | Senior Principal Consultant, Fund Chief Compliance Officer, ACA Global, LLC (since 2022); Chief Compliance Officer, Ashmore Funds (2017-2022); Chief Compliance Officer, Ashmore Investment Management (US) Corp (2014-2022); Chief Compliance Officer, Ashmore Equities Investment Management (2015- 2019). | n/a | n/a |
Matthew J. Bromberg (1973) | Secretary (since 2023) | Chief Compliance Officer of ETF Managers Group, LLC (since 2022); General Counsel and Secretary of Exchange Traded Managers Group LLC (since 2020); ETF Managers Group LLC (since 2020); ETFMG Financial LLC (since 2020); ETF Managers Capital LLC (since 2020); Partner of Dorsey & Whitney LLP (law firm) (2019-2020); General Counsel of WBI Investments, Inc. (2016-2019); Millington Securities, Inc. (2016-2019). | n/a | n/a |
Wedbush ETFMG TM ETF
Board of Trustees (Continued)
Terry Loebs (1963) | Chairman of the Board (since 2023); Trustee (since 2014); Lead Independent Trustee (since 2020) | Founder and Managing Member, Pulsenomics LLC (index product development and consulting firm) (since 2011); Managing Director, MacroMarkets, LLC (exchange-traded products firm) (2006- 2011). | 12 | None |
Eric Wiegel (1960) | Trustee (since 2020) | Managing Partner, Global Focus Capital LLC (since 2013); Senior Portfolio Manager, Little House Capital (2019-2021); Chief Investment Officer, Insight Financial Strategist LLC (2017- 2018). | 12 | None |
Wedbush ETFMG TM ETF
ETF MANAGERS TRUST
Privacy Policy and Procedures
ETF Managers Trust, (the “Trust”) has adopted the following privacy policies in order to safeguard the personal information of the Trust’s customers and consumers in accordance with Regulation S-P as promulgated by the U.S. Securities and Exchange Commission.
Trust officers are responsible for ensuring that the following policies and procedures are implemented:
1) The Trust is committed to protecting the confidentiality and security of the information they collect and will handle personal customer and consumer information only in accordance with Regulation S-P and any other applicable laws, rules and regulations1. The Trust will ensure: (a) the security and confidentiality of customer records and information; (b) that customer records and information are protected from any anticipated threats and hazards; and (c) that customer records and information are protected from unauthorized access or use.
2) The Trust conducts its business affairs through its trustees, officers and third parties that provide services pursuant to agreements with the Trust. The Trust has no employees. It is anticipated that the trustees and officers of the Trust who are not employees of service providers of the Trust will not have access to customer records and information in the performance of their normal responsibilities for the Trust.
3) The Trust may share customer information with its affiliates, subject to the customers’ right to prohibit such sharing.
4) The Trust may share customer information with unaffiliated third parties only in accordance with the requirements of Regulation S-P. Pursuant to this policy, the Trust will not share customer information with unaffiliated third parties other than as permitted by law, unless authorized to do so by the customer.
Consistent with these policies, the Trust has adopted the following procedures:
1) The Trust will determine that the policies and procedures of its affiliates and Service Providers are reasonably designed to safeguard customer information and only permit appropriate and authorized access to and use of customer information through the application of appropriate administrative, technical and physical protections.
2) The Trust will direct each of its Service Providers to adhere to the privacy policy of the Trust and to its privacy policies with respect to all customer information of the Trust and to take all actions reasonably necessary so that the Trust is in compliance with the provisions of Regulation S-P, including, as applicable, the development and delivery of privacy notices and the maintenance of appropriate and adequate records.
3) The Trust requires its Service Providers to provide periodic reports to the Trust’s Board of Trustees outlining their privacy policies and the implementation of such policies. Each Service Provider is required to promptly report to the Trust’s Board any material changes to its privacy policy before, or promptly after, the adoption of such changes.
| (1) | Generally, the Funds have institutional clients which are not considered “customers” for purposes of regulation S-P. |
Advisor
ETF Managers Group, LLC
350 Springfield Ave., Suite 200, Summit, NJ 07901
Distributor
Foreside Fund Services LLC
Three Canal Plaza, Suite 100, Portland, Maine 04101
Custodian
U.S. Bank National Association
Custody Operations
1555 North River Center Drive, Suite 302, Milwaukee, Wisconsin 53212
Transfer Agent
U.S. Bancorp Fund Services, LLC doing business as U.S. Bank Global Fund Services
615 East Michigan Street, Milwaukee, Wisconsin 53202
Securities Lending Agent
U.S. Bank, National Association
Securities Lending
800 Nicolet Mall
Minneapolis, MN 55402-7020
Independent Registered Public Accounting Firm
WithumSmith + Brown, PC
1411 Broadway, 9th Floor, New York, NY 10018
Legal Counsel
Sullivan & Worcester LLP
1666 K Street NW, Washington, DC 20006
ETFMG Prime Cyber Security ETF
HACK
ETFMG Prime Mobile Payments ETF
IPAY
ETFMG Treatments, Testing and
Advancements ETF
GERM
Annual Report
September 30, 2023

The funds are series of ETF Managers Trust.
ETFMG™ ETFs
TABLE OF CONTENTS
September 30, 2023
ETFMG™ ETFs
Dear Shareholder,
On behalf of the entire team, we want to express our appreciation for the confidence you have placed in these ETFs. The following information pertains to the fiscal period from October 1, 2022 to September 30, 2023 (the “Annual Period”).
Market Overview
The U.S. economy performed better than expected despite persistent inflationary pressure, rising interest rates and geo-political conflict during the Annual Period.
Early in the Annual Period, inflation had risen sharply because of supply chain disruptions, high food and energy prices and the Russia-Ukraine war, reaching its peak level, just prior to the Annual Period, in September 2022. In the first quarter of 2023, U.S. equities managed to deliver gains, despite the significant volatility. The January rally, however, gave way to a February sell off as higher-than-expected inflation, a tight labor market and solid economic growth indicated that the U.S. Federal Reserve’s (Fed) monetary policy would remain tight for the foreseeable future. One of the most significant impacts occurred in the banking sector in March 2023, when Silicon Valley Bank, Signature Bank, and First Republic Bank, among others, failed. In the same month, Swiss bank UBS agreed to buy Credit Suisse, considered vulnerable in the then current environment.
In the second quarter of 2023, the economy grew at an annualized rate of 2.1%, according to the third estimate from the U.S. Bureau of Economic Analysis, compared to 2.2% in the first quarter and in line with 2.1% in 2022 overall. Since then, price pressures have eased given normalization in supply chains, falling energy prices and aggressive measures by the Fed and other global central banks to tighten financial conditions and slow demand in their economies. Nevertheless, during the Annual Period inflation levels remained much higher than central banks’ target levels, with the Fed raising its target fed funds rate six times during the Annual Period, bringing it to a range of 5.25% to 5.50% as of July 2023. As of August 2023, the unemployment rate was 3.8%, near its pre-pandemic low, although monthly job growth continued to be moderate. In September 2023, the Fed’s policy committee voted to hold the rate steady.
As the U.S. Congress neared its September 30, 2023, deadline to approve federal funding, investor concerns about a potential government shutdown and the impact this could have on the U.S. economy increased. The shutdown, however, was averted because of a Continuing Resolution which temporarily kept the government open for forty-five more days. Despite higher rates and increased market volatility, U.S. stocks for the Annual Period had strong returns of 21.62%, as measured by the S&P 500 Index.
These conditions have impacted the performance of the ETFs during the period, among other factors, and the value of an investment in the ETFs. We encourage you to talk with your financial advisor and visit etfmg.com for further insight into investing in today’s markets.
Performance Overview
During the Annual Period, the S&P 500 Information Technology Sector Index, a broad measure of US listed technology companies, returned 41.24%. During the same period, the S&P Global 1200 Information Technology Sector Index, a broad measure of global technology companies, returned 39.60%. Below is a performance overview for each of the ETFs for the Annual Period.
ETFMG Prime Cyber Security ETF (HACK)
The ETFMG Prime Cyber Security ETF (“HACK”) seeks to provide investment results that, before fees and expenses, correspond generally to the price and yield performance of the Prime Cyber Defense Index (the “PCD Index”).
Over the Annual Period, the total return for HACK was 19.18%, while the total return for the PCD Index was 19.71%. The best performers in HACK, on the basis of contribution to return were, Telos Corporation, Solarwinds Corp., Cloudflare Inc., Qualys Inc., and Rapid7 Inc., while the worst performers were Tenable Holdings Inc., Fortinet Inc., Zerofox Holdings Inc., Netscout Systems Inc., and Splunk Inc.
At the end of the Annual Period, HACK saw an approximate allocation of 76.77% to the Information Technology sector and 22.66% to Industrials. The portfolio securities held by HACK were exposed predominately to the United States at 86.76%, 6.29% to the United Kingdom, and 4.97% to Israel.
ETFMG Prime Mobile Payments ETF (IPAY)
The ETFMG Prime Mobile Payments ETF (“IPAY”) seeks to provide investment results that, before fees and expenses, correspond generally to the price and yield performance of the Prime Mobile Payments Index (the “PMP Index”).
Over the Annual Period, the total return for IPAY was 3.64%, while the total return for the PMP Index was 4.47%. The best performers in IPAY, on the basis of contribution to return were, Affirm Holdings Inc., Block Inc., Kakaopay Corp., Aci Worldwide Inc., and Worldline Sa., while the worst performers were Remitly Global Inc., Payoneer Global Inc., First Am Gov Obligation., Jaccs Co. Ltd., and Boku Inc.
At the end of the Annual Period, IPAY saw an approximate allocation of 96.13% to the Financials sector and 2.97% to Information technology. The portfolio securities held by IPAY were exposed predominately to the United States at 72.95%, followed by Brazil at 4.45% and South Korea at 3.47%.
ETFMG Treatments, Testing and Advancements ETF (GERM)
The ETFMG Treatments, Testing and Advancements ETF (“GERM”) seeks to provide investment results that, before fees and expenses, correspond generally to the price and yield performance of the Prime Treatments, Testing and Advancements Index (the “PTT Index”).
During the Annual Period, the total return for GERM was -12.53%, while the total return for the PTT Index was -12.13%. The best performers in GERM, on the basis of contribution to return were, Cel-Sci Corp., ImmunityBio Inc., Cue BioPharma Inc., Hillevax Inc., and Emergent BioSolutions Inc., while the worst performers were Inflarx Nv., Scilex Holding Co., Invivyd Inc., GSK Plc., and Gritstone Bio Inc.
At the end of the Annual Period, GERM saw an approximate allocation of 99.28% of its portfolio holdings to the Health Care sector. The portfolio securities held by GERM were exposed predominately to the United States at 77.96% followed by Germany at 8.48%, and the United Kingdom at 4.68%.
You can find further details about HACK, IPAY, and GERM by visiting www.etfmg.com, or by calling 1-844-383-6477.
| Sincerely, | |
| | |
 | |
| John A. Flanagan | |
Principal Financial Officer | |
ETFMG Prime Cyber Security ETF
Growth of $10,000 (Unaudited)
Average Annual Returns
Year Ended September 30, 2023 | | 1 Year
Return | | | 5 Year
Return | | | Since
Inception
(11/11/14) | | | Value of
$10,000
(9/30/2023) | |
| ETFMG Prime Cyber Security ETF (NAV) | | | 19.18 | % | | | 5.75 | % | | | 8.98 | % | | $ | 21,474 | |
| ETFMG Prime Cyber Security ETF (Market) | | | 19.23 | % | | | 5.74 | % | | | 8.99 | % | | $ | 21,482 | |
| S&P 500 Index | | | 21.62 | % | | | 9.92 | % | | | 10.78 | % | | $ | 24,838 | |
| Prime Cyber Defense Index* | | | 19.71 | % | | | 6.16 | % | | | 9.42 | % | | $ | 22,261 | |
| * | The Fund’s benchmark before 8/1/17 was the ISE Cyber Security Index. On 8/1/17, the Fund’s benchmark became the Prime Cyber Defense Index. |
Performance data quoted represents past performance and does not guarantee future results. The investment return and principal value of an investment will fluctuate so that an investor’s shares, when redeemed, may be worth more or less than their original cost. Current performance of the Fund may be lower or higher than the performance quoted. All performance is historical and includes reinvestment of dividends and capital gains. Performance data current to the most recent month end may be obtained by calling 1-844-ETF-MGRS (1-844-383-6477).
The chart illustrates the performance of a hypothetical $10,000 investment made on November 11, 2014, and is not intended to imply any future performance. The returns shown do not reflect the deduction of taxes that a shareholder would pay on fund distributions from the sales of Fund shares. The chart assumes reinvestment of capital gains and dividends, if any. The Index Returns do not reflect fees or expenses and are not available for direct investment.
ETFMG Prime Cyber Security ETF
Top Ten Holdings as of September 30, 2023 (Unaudited)*
| | | Security | | % of Total
Investments | |
| 1 | | Splunk, Inc. | | | 5.47 | % |
| 2 | | Crowdstrike Holdings, Inc. - Class A | | | 4.66 | % |
| 3 | | Akamai Technologies, Inc. | | | 4.60 | % |
| 4 | | Zscaler, Inc. | | | 4.52 | % |
| 5 | | Check Point Software Technologies, Ltd. | | | 4.50 | % |
| 6 | | Okta, Inc. | | | 4.43 | % |
| 7 | | Fortinet, Inc. | | | 4.43 | % |
| 8 | | VeriSign, Inc. | | | 4.43 | % |
| 9 | | Cloudflare, Inc. - Class A | | | 4.40 | % |
| 10 | | Booz Allen Hamilton Holdings Corp. | | | 4.38 | % |
Top Ten Holdings = 45.82% of Total Investments
| * | Current Fund holdings may not be indicative of future Fund holdings. |
ETFMG Prime Mobile Payments ETF
Growth of $10,000 (Unaudited)
Average Annual Returns
Year Ended September 30, 2023 | | 1 Year
Return | | | 5 Year
Return | | | Since
Inception
(7/15/15) | | | Value of
$10,000
(9/30/2023) | |
| ETFMG Prime Mobile Payments ETF (NAV) | | | 3.64 | % | | | -1.61 | % | | | 5.80 | % | | $ | 15,893 | |
| ETFMG Prime Mobile Payments ETF (Market) | | | 3.58 | % | | | -1.71 | % | | | 5.76 | % | | $ | 15,833 | |
| S&P 500 Index | | | 21.62 | % | | | 9.92 | % | | | 11.08 | % | | $ | 23,707 | |
| Prime Mobile Payments Index* | | | 4.47 | % | | | -1.10 | % | | | 6.38 | % | | $ | 16,618 | |
| * | The Fund’s benchmark before 8/1/17 was the ISE Mobile Payments Index. On 8/1/17, the Fund’s benchmark became the Prime Mobile Payments Index. |
Performance data quoted represents past performance and does not guarantee future results. The investment return and principal value of an investment will fluctuate so that an investor’s shares, when redeemed, may be worth more or less than their original cost. Current performance of the Fund may be lower or higher than the performance quoted. All performance is historical and includes reinvestment of dividends and capital gains. Performance data current to the most recent month end may be obtained by calling 1-844-ETF-MGRS (1-844-383-6477).
The chart illustrates the performance of a hypothetical $10,000 investment made on July 15, 2015, and is not intended to imply any future performance. The returns shown do not reflect the deduction of taxes that a shareholder would pay on fund distributions from the sales of Fund shares. The chart assumes reinvestment of capital gains and dividends, if any. The Index Returns do not reflect fees or expenses and are not available for direct investment.
ETFMG Prime Mobile Payments ETF
Top Ten Holdings as of September 30, 2023 (Unaudited)*
| | | Security | | % of Total
Investments | |
| 1 | | MasterCard, Inc. - Class A | | | 5.45 | % |
| 2 | | American Express Co. | | | 5.36 | % |
| 3 | | Visa, Inc. - Class A | | | 5.32 | % |
| 4 | | PayPal Holdings, Inc. | | | 5.31 | % |
| 5 | | Fiserv, Inc. | | | 5.28 | % |
| 6 | | Fidelity National Information Services, Inc. | | | 3.37 | % |
| 7 | | Global Payments, Inc. | | | 3.10 | % |
| 8 | | Block, Inc. | | | 2.72 | % |
| 9 | | Adyen NV | | | 2.64 | % |
| 10 | | Discover Financial Services | | | 2.62 | % |
Top Ten Holdings= 41.17% of Total Investments
| * | Current Fund holdings may not be indicative of future Fund holdings. |
ETFMG Treatments, Testing and Advancements ETF
Growth of $10,000 (Unaudited)

Average Annual Returns
Year Ended September 30, 2023 | | | 1 Year
Return | | | |
Since
Inception
(6/17/2020) |
| | | Value of
$10,000
(9/30/2023) |
|
| ETFMG Treatments, Testing and Advancements ETF (NAV) | | | -12.53 | % | | | -8.87 | % | | $ | 7,367 | |
| ETFMG Treatments, Testing and Advancements ETF (Market) | | | -12.73 | % | | | -8.92 | % | | $ | 7,354 | |
| S&P 500 Index | | | 21.62 | % | | | 11.97 | % | | $ | 14,503 | |
| Prime Treatments, Testing and Advancements Index NTR | | | -12.13 | % | | | -9.01 | % | | $ | 7,358 | |
Performance data quoted represents past performance and does not guarantee future results. The investment return and principal value of an investment will fluctuate so that an investor’s shares, when redeemed, may be worth more or less than their original cost. Current performance of the Fund may be lower or higher than the performance quoted. All performance is historical and includes reinvestment of dividends and capital gains. Performance data current to the most recent month end may be obtained by calling 1-844-ETF-MGRS (1-844-383-6477).
The chart illustrates the performance of a hypothetical $10,000 investment made on October 8, 2019, and is not intended to imply any future performance. The returns shown do not reflect the deduction of taxes that a shareholder would pay on fund distributions from the sales of Fund shares. The chart assumes reinvestment of capital gains and dividends, if any. The Index Returns do not reflect fees or expenses and are not available for direct investment.
ETFMG Treatments, Testing and Advancements ETF
Top Ten Holdings as of September 30, 2023 (Unaudited)*
| | | Security | | % of Total
Investments | |
| 1 | | Laboratory Corp. of America Holdings | | | 4.96 | % |
| 2 | | Quest Diagnostics, Inc. | | | 4.76 | % |
| 3 | | Moderna, Inc. | | | 4.69 | % |
| 4 | | BioNTech SE – ADR | | | 4.62 | % |
| 5 | | Alnylam Pharmaceuticals, Inc. | | | 4.60 | % |
| 6 | | Vaxcyte, Inc. | | | 3.36 | % |
| 7 | | Dynavax Technologies Corp. | | | 3.29 | % |
| 8 | | Zai Lab, Ltd. – ADR | | | 3.27 | % |
| 9 | | Immunocore Holdings PLC – ADR | | | 3.16 | % |
| 10 | | Bio-Rad Laboratories, Inc. - Class A | | | 3.07 | % |
Top Ten Holdings = 39.78% of Total Investments
| * | Current Fund holdings may not be indicative of future Fund holdings. |
ETFMG™ ETFs
Important Disclosures and Key Risk Factors
Investing involves risk, including the possible loss of principal. Shares of any ETF are bought and sold at market price (not NAV), may trade at a discount or premium to NAV and are not individually redeemed from the Fund. Brokerage commissions will reduce returns. Narrowly focused investments typically exhibit higher volatility.
Past performance is not indicative of future return. A fund’s performance for very short time periods may not be indicative of future performance.
HACK
The Fund seeks to provide investment results that, before fees and expenses, correspond generally to the price and yield performance of the Prime Cyber Defense Index (the “Index”).
The fund is concentrated in technology-related companies face intense competition, both domestically and internationally, which may have an adverse effect on profit margins. Such companies may have limited product lines, markets, financial resources or personnel. The products of such companies may face obsolescence due to rapid technological developments, frequent new product introduction, unpredictable changes in growth rates, competition for the services of qualified personnel, and competition from foreign competitors with lower production costs. Technology companies are heavily dependent on patent and intellectual property rights. The loss or impairment of these rights may adversely affect the profitability of these companies. Investments in foreign securities involve political, economic and currency risks, greater volatility and differences in accounting methods. The Funds are non-diversified, meaning they may concentrate its assets in fewer individual holdings than a diversified fund. Investments in smaller companies tend to have limited liquidity and greater price volatility than large-capitalization companies. Diversification does not assure a profit or protect against a loss in a declining market. The Fund’s return may not match or achieve a high degree of correlation with the return of the Prime Cyber Defense Index. To the extent the Fund utilizes a sampling approach, it may experience tracking error to a greater extent than if the Fund had sought to replicate the Prime Cyber Defense Index. The Prime Cyber Defense Index provides a benchmark for investors interested in tracking companies actively involved in providing cyber security technology and services. The Index uses a market capitalization weighted allocation across the infrastructure provider and service provider categorizations as well as an equal weighted allocation methodology for all components within each sector allocation. Index components are reviewed semi-annually for eligibility, and the weights are re-set accordingly. An investment cannot be made directly in an index.
Unlike with an actively managed fund, the Fund’s adviser does not use techniques or defensive strategies designed to lessen the effects of market volatility or to reduce the impact of periods of market decline. This means that, based on market and economic conditions, the Fund’s performance could be lower than other types of funds that may actively shift their portfolio assets to take advantage of market opportunities or to lessen the impact of a market decline.
Natural or environmental disasters, such as earthquakes, fires, floods, hurricanes, tsunamis and other severe weather-related phenomena generally, and widespread disease, including pandemics and epidemics, have been and may be highly disruptive to economies and markets, adversely impacting individual companies, sectors, industries, markets, currencies, interest and inflation rates, credit ratings, investor sentiment, and other factors affecting the value of the Fund’s investments. Given the increasing interdependence among global economies and markets, conditions in one country, market, or region are increasingly likely to adversely affect markets, issuers, and/or foreign exchange rates in other countries, including the U.S. Any such events could have a significant adverse impact on the value of the Fund’s investments.
ETFMG™ ETFs
Additionally, natural or environmental disasters, widespread disease or other public health issues, war, acts of terrorism or other events could result in increased premiums or discounts to the Fund’s NAV.
ETF Managers Group LLC is the investment adviser to the Fund.
Effective, August 14, 2023, the Fund is distributed by Foreside Fund Services LLC. ETF Managers Group LLC is a wholly owned subsidiary of Exchange Traded Managers Group LLC (collectively, “ETFMG”).
IPAY
The ETFMG Prime Mobile Payments ETF (the “Fund” or the “Mobile Payments ETF”) seeks to provide investment results that, before fees and expenses, correspond generally to the price and yield performance of the Prime Mobile Payments Index (the “Index”).
Mobile Payment Companies face intense competition, both domestically and internationally, and are subject to increasing regulatory constraints, particularly with respect to fees, competition and antitrust matters, cybersecurity and privacy. Mobile Payment Companies may be highly dependent on their ability to enter into agreements with merchants and other third parties to utilize a particular payment method, system, software or service, and such agreements may be subject to increased regulatory scrutiny. Additionally, certain Mobile Payment Companies have recently faced increased costs related to class-action litigation challenging such agreements. Such factors may adversely affect the profitability and value of such companies. The Fund is non-diversified, meaning it may concentrate its assets in fewer individual holdings than a diversified fund. Investments in smaller companies tend to have limited liquidity and greater price volatility than large-capitalization companies. The Fund’s return may not match or achieve a high degree of correlation with the return of the Prime Mobile Payments Index. To the extent the Fund utilizes a sampling approach, it may experience tracking error to a greater extent than if the Fund had sought to replicate the Index. Diversification does not guarantee a profit, nor does it protect against a loss in a declining market.
The Prime Mobile Payments Index is designed to provide a benchmark for investors interested in tracking the mobile and electronic payments industry. The stocks are screened for liquidity and weighted according to a modified linear-based capitalization-weighted methodology. The Index generally is comprised of 25-40 securities. An investment cannot be made directly in an index.
Unlike with an actively managed fund, the Fund’s adviser does not use techniques or defensive strategies designed to lessen the effects of market volatility or to reduce the impact of periods of market decline. This means that, based on market and economic conditions, the Fund’s performance could be lower than other types of funds that may actively shift their portfolio assets to take advantage of market opportunities or to lessen the impact of a market decline.
Natural or environmental disasters, such as earthquakes, fires, floods, hurricanes, tsunamis and other severe weather-related phenomena generally, and widespread disease, including pandemics and epidemics, have been and may be highly disruptive to economies and markets, adversely impacting individual companies, sectors, industries, markets, currencies, interest and inflation rates, credit ratings, investor sentiment, and other factors affecting the value of the Fund’s investments. Given the increasing interdependence among global economies and markets, conditions in one country, market, or region are increasingly likely to adversely affect markets, issuers, and/or foreign exchange rates in other countries, including the U.S. Any such events could have a significant adverse impact on the value of the Fund’s investments.
ETFMG™ ETFs
Additionally, natural or environmental disasters, widespread disease or other public health issues, war, acts of terrorism or other events could result in increased premiums or discounts to the Fund’s NAV.
ETF Managers Group LLC is the investment adviser to the Fund.
Effective, August 14, 2023, the Fund is distributed by Foreside Fund Services LLC. ETF Managers Group LLC is a wholly owned subsidiary of Exchange Traded Managers Group LLC (collectively, “ETFMG”).
GERM
The ETFMG Treatments, Testing and Advancements ETF (the “Fund”) seeks to provide investment results that, before fees and expenses, correspond generally to the total return performance of the Prime Treatments, Testing and Advancements Index (the “Index”). Vaccine development companies are involved in discovering, developing and commercializing novel drugs with significant market potential. These companies face challenges including preclinical testing and clinical trial stages of development. Clinical trials may be delayed, and certain programs may never advance in the clinic or may be more costly to conduct than anticipated.
Vaccine development requires companies to seek and secure significant funding. If there are delays in obtaining required regulatory and marketing approvals the ability of vaccine development companies to generate revenue will be materially impaired. If regulatory approval is obtained, products will still remain subject to regulatory scrutiny with regulatory authorities having the ability impose significant restrictions on the indicated uses or marketing. Lastly, even if a licensed product is achieved, vaccine development companies may encounter difficulties in manufacturing, product release, shelf life, testing, storage, supply chain management, or shipping.
Unlike with an actively managed fund, the Fund’s adviser does not use techniques or defensive strategies designed to lessen the effects of market volatility or to reduce the impact of periods of market decline. This means that, based on market and economic conditions, the Fund’s performance could be lower than other types of funds that may actively shift their portfolio assets to take advantage of market opportunities or to lessen the impact of a market decline.
Natural or environmental disasters, such as earthquakes, fires, floods, hurricanes, tsunamis and other severe weather-related phenomena generally, and widespread disease, including pandemics and epidemics, have been and may be highly disruptive to economies and markets, adversely impacting individual companies, sectors, industries, markets, currencies, interest and inflation rates, credit ratings, investor sentiment, and other factors affecting the value of the Fund’s investments. Given the increasing interdependence among global economies and markets, conditions in one country, market, or region are increasingly likely to adversely affect markets, issuers, and/or foreign exchange rates in other countries, including the U.S. Any such events could have a significant adverse impact on the value of the Fund’s investments.
Additionally, natural or environmental disasters, widespread disease or other public health issues, war, acts of terrorism or other events could result in increased premiums or discounts to the Fund’s NAV.
Effective, August 14, 2023, the Fund is distributed by Foreside Fund Services LLC. ETF Managers Group LLC is a wholly owned subsidiary of Exchange Traded Managers Group LLC (collectively, “ETFMG”).
ETFMG™ ETFs
PORTFOLIO ALLOCATIONS
As of September 30, 2023 (Unaudited)
| | | ETFMG
Prime
Cyber
Security
ETF | | | ETFMG
Prime
Mobile
Payments
ETF | | | ETFMG
Treatments,
Testing and
Advancements
ETF | |
| As a percent of Net Assets: | | | | | | | | | | | | |
| Australia | | | — | % | | | 0.3 | % | | | — | % |
| Bermuda | | | — | | | | 1.0 | | | | — | |
| Brazil | | | — | | | | 1.5 | | | | — | |
| Canada | | | 1.0 | | | | 1.3 | | | | 4.0 | |
| Cayman Islands | | | 0.0 | * | | | 5.2 | | | | 4.2 | |
| Cyprus | | | — | | | | 0.0 | * | | | — | |
| Finland | | | 0.1 | | | | — | | | | — | |
| France | | | — | | | | 1.8 | | | | 0.8 | |
| Germany | | | 0.1 | | | | — | | | | 5.9 | |
| Israel | | | 7.4 | | | | — | | | | — | |
| Italy | | | — | | | | 1.8 | | | | — | |
| Japan | | | 1.0 | | | | 3.4 | | | | 0.8 | |
| Netherlands | | | — | | | | 3.0 | | | | 3.7 | |
| Puerto Rico | | | — | | | | 1.5 | | | | — | |
| Republic of Korea | | | — | | | | 3.4 | | | | — | |
| United Kingdom | | | 5.8 | | | | 3.9 | | | | 5.7 | |
| United States | | | 83.8 | | | | 71.0 | | | | 74.2 | |
| Short-Term and other Net Assets (Liabilities) | | | 0.8 | | | | 0.9 | | | | 0.7 | |
| | | | 100.0 | % | | | 100.0 | % | | | 100.0 | % |
| * | Amount is less than 0.05% |
The accompanying notes are an integral part of these financial statements.
ETFMG™ ETFs
ETFMG Prime Cyber Security ETF
Schedule of Investments
September 30, 2023
| | | Shares | | | Value | |
| COMMON STOCKS - 99.3% | | | | | | | | |
| Canada - 1.0% | | | | | | | | |
| Software - 1.0% (d) | | | | | | | | |
| BlackBerry, Ltd. (a) | | | 3,038,250 | | | $ | 14,383,175 | |
| | | | | | | | | |
| Cayman Islands - 0.0% (e) | | | | | | | | |
| Software - 0.0% (d)(e) | | | | | | | | |
| Arqit Quantum, Inc. (a)(b) | | | 285,317 | | | | 169,764 | |
| | | | | | | | | |
| Finland - 0.1% | | | | | | | | |
| Software - 0.1% (d) | | | | | | | | |
| F-Secure Oyj | | | 602,046 | | | | 1,111,352 | |
| WithSecure Oyj (a) | | | 597,785 | | | | 649,704 | |
| Total Software | | | | | | | 1,761,056 | |
| | | | | | | | | |
| Germany - 0.1% | | | | | | | | |
| IT Services - 0.1% | | | | | | | | |
| Secunet Security Networks AG | | | 8,478 | | | | 1,801,637 | |
| | | | | | | | | |
| Israel - 7.4% | | | | | | | | |
| Communications Equipment - 0.2% | | | | | | | | |
| Radware, Ltd. (a) | | | 198,032 | | | | 3,350,701 | |
| Software - 7.2% (d) | | | | | | | | |
| Check Point Software Technologies, Ltd. (a) | | | 484,765 | | | | 64,609,479 | |
| Cognyte Software, Ltd. (a) | | | 364,107 | | | | 1,751,355 | |
| CyberArk Software, Ltd. (a) | | | 216,677 | | | | 35,485,192 | |
| Total Software | | | | | | | 101,846,026 | |
| Total Israel | | | | | | | 105,196,727 | |
| | | | | | | | | |
| Japan - 1.0% | | | | | | | | |
| Software - 1.0% (d) | | | | | | | | |
| Cyber Security Cloud, Inc. (a) | | | 29,568 | | | | 451,118 | |
| Digital Arts, Inc. | | | 44,575 | | | | 1,379,546 | |
| Trend Micro, Inc. | | | 333,976 | | | | 12,667,130 | |
| Total Software | | | | | | | 14,497,794 | |
| | | | | | | | | |
| United Kingdom - 5.8% | | | | | | | | |
| Aerospace & Defense - 5.1% | | | | | | | | |
| BAE Systems PLC | | | 5,110,413 | | | | 62,215,350 | |
| QinetiQ Group PLC | | | 2,729,659 | | | | 10,617,561 | |
| Total Aerospace & Defense | | | | | | | 72,832,911 | |
| IT Services - 0.2% | | | | | | | | |
| NCC Group PLC | | | 1,627,561 | | | | 2,343,243 | |
| Software - 0.5% (d) | | | | | | | | |
| Darktrace PLC (a) | | | 1,573,942 | | | | 7,746,806 | |
| Total United Kingdom | | | | | | | 82,922,960 | |
The accompanying notes are an integral part of these financial statements.
ETFMG™ ETFs
ETFMG Prime Cyber Security ETF
Schedule of Investments
September 30, 2023 (Continued)
| | | Shares | | | Value | |
| United States - 83.8% | | | | | | | | |
| Aerospace & Defense - 2.1% | | | | | | | | |
| Parsons Corp. (a) | | | 550,482 | | | $ | 29,918,697 | |
| Communications Equipment - 11.8% | | | | | | | | |
| Cisco Systems, Inc. | | | 1,137,315 | | | | 61,142,054 | |
| F5 Networks, Inc. (a) | | | 312,317 | | | | 50,326,761 | |
| Juniper Networks, Inc. | | | 1,680,830 | | | | 46,710,266 | |
| NetScout Systems, Inc. (a) | | | 368,818 | | | | 10,334,280 | |
| Total Communications Equipment | | | | | | | 168,513,361 | |
| IT Services - 18.0% | | | | | | | | |
| Akamai Technologies, Inc. (a) | | | 620,671 | | | | 66,126,288 | |
| Cloudflare, Inc. - Class A (a)(b) | | | 1,003,732 | | | | 63,275,265 | |
| Okta, Inc. (a) | | | 781,168 | | | | 63,673,004 | |
| VeriSign, Inc. (a) | | | 314,134 | | | | 63,621,559 | |
| Total IT Services | | | | | | | 256,696,116 | |
| Professional Services - 13.5% | | | | | | | | |
| Booz Allen Hamilton Holding Corp. | | | 575,696 | | | | 62,906,302 | |
| CACI International, Inc. - Class A (a) | | | 118,822 | | | | 37,301,791 | |
| Leidos Holdings, Inc. | | | 668,931 | | | | 61,648,681 | |
| Science Applications International Corp. | | | 282,567 | | | | 29,822,121 | |
| Total Professional Services | | | | | | | 191,678,895 | |
| Software - 38.4% (d) | | | | | | | | |
| A10 Networks, Inc. | | | 368,946 | | | | 5,545,258 | |
| CommVault Systems, Inc. (a) | | | 230,574 | | | | 15,589,108 | |
| Crowdstrike Holdings, Inc. - Class A (a) | | | 400,242 | | | | 66,992,506 | |
| Everbridge, Inc. (a) | | | 212,253 | | | | 4,758,712 | |
| Fortinet, Inc. (a) | | | 1,084,294 | | | | 63,626,372 | |
| Gen Digital, Inc. | | | 3,090,002 | | | | 54,631,235 | |
| LiveRamp Holdings, Inc. (a) | | | 341,197 | | | | 9,840,122 | |
| N-able, Inc. (a) | | | 327,792 | | | | 4,228,517 | |
| OneSpan, Inc. (a) | | | 191,289 | | | | 2,056,357 | |
| Palo Alto Networks, Inc. (a)(b) | | | 268,120 | | | | 62,858,053 | |
| Qualys, Inc. (a)(b) | | | 190,542 | | | | 29,067,182 | |
| Rapid7, Inc. (a)(b) | | | 317,759 | | | | 14,547,007 | |
| SecureWorks Corp. - Class A (a) | | | 56,806 | | | | 352,765 | |
| SentinelOne, Inc. - Class A (a)(b) | | | 1,243,536 | | | | 20,966,017 | |
| SolarWinds Corp. (a) | | | 228,106 | | | | 2,153,321 | |
| Splunk, Inc. (a) | | | 537,851 | | | | 78,660,709 | |
| Telos Corp. (a) | | | 270,147 | | | | 645,651 | |
| Tenable Holdings, Inc. (a) | | | 602,694 | | | | 27,000,691 | |
| Varonis Systems, Inc. (a)(b) | | | 568,898 | | | | 17,374,145 | |
| ZeroFox Holdings, Inc. (a) | | | 419,266 | | | | 368,619 | |
| Zscaler, Inc. (a) | | | 417,976 | | | | 65,032,886 | |
| Total Software | | | | | | | 546,295,233 | |
The accompanying notes are an integral part of these financial statements.
ETFMG™ ETFs
ETFMG Prime Cyber Security ETF
Schedule of Investments
September 30, 2023 (Continued)
| | | Shares | | | Value | |
| | | | | | | | | |
| Total United States | | | | | | $ | 1,193,102,302 | |
| TOTAL COMMON STOCKS (Cost $1,446,759,891) | | | | | | | 1,413,835,415 | |
| | | | | | | | | |
| INVESTMENTS PURCHASED WITH PROCEEDS FROM SECURITIES LENDING COLLATERAL - 1.1% | | | | | | | | |
| Mount Vernon Liquid Assets Portfolio, LLC, 5.50% (c) | | | 15,230,863 | | | | 15,230,863 | |
| TOTAL INVESTMENTS PURCHASED WITH PROCEEDS FROM SECURITIES LENDING COLLATERAL (Cost $15,230,863) | | | | | | | 15,230,863 | |
| SHORT-TERM INVESTMENTS - 0.6% | | | | | | | | |
| Money Market Funds - 0.6% | | | | | | | | |
| First American Government Obligations Fund - Class X, 5.26% (c) | | | 8,244,540 | | | | 8,244,540 | |
| TOTAL SHORT-TERM INVESTMENTS | | | | | | | | |
| (Cost $8,244,540) | | | | | | | 8,244,540 | |
| | | | | | | | | |
| Total Investments (Cost $1,470,235,294) - 100.9% | | | | | | | 1,437,310,818 | |
| Liabilities in Excess of Other Assets - (0.9)% | | | | | | | (13,518,367 | ) |
| TOTAL NET ASSETS - 100.0% | | | | | | $ | 1,423,792,451 | |
Percentages are stated as a percent of net assets.
| PLC | Public Limited Company |
| (a) | Non-income producing security. |
| (b) | All or a portion of this security was out on loan at September 30, 2023. |
| (c) | The rate shown is the annualized seven-day yield at period end. |
| (d) | As of September 30, 2023 the Fund had a significant portion of its assets in the Software Industry. |
| (e) | Amount is less than 0.05% |
The Global Industry Classification Standard (GICS®) was developed by and/or is the exclusive property of MSCI, Inc. and Standard & Poor’s Financial Services LLC (“S&P”). GICS is a service mark of MSCI and S&P and has been licensed for use by U.S. Bancorp Fund Services, LLC, doing business as U.S. Bank Global Fund Services (“Fund Services”).
The accompanying notes are an integral part of these financial statements.
ETFMG™ ETFs
ETFMG Prime Mobile Payments ETF
Schedule of Investments
September 30, 2023
| | | Shares | | | Value | |
| COMMON STOCKS - 99.1% | | | | | | | | |
| Australia - 0.3% | | | | | | | | |
| Financial Services - 0.3% (d) | | | | | | | | |
| EML Payments, Ltd. (a) | | | 1,424,610 | | | $ | 1,076,245 | |
| | | | | | | | | |
| Bermuda - 1.0% | | | | | | | | |
| Electronic Equipment, Instruments & Components - 0.5% | | | | | | | | |
| PAX Global Technology, Ltd. | | | 2,588,816 | | | | 1,828,150 | |
| Financial Services - 0.5% (d) | | | | | | | | |
| Paysafe Ltd. (a) | | | 149,622 | | | | 1,793,968 | |
| Total Bermuda | | | | | | | 3,622,118 | |
| | | | | | | | | |
| Brazil - 1.5% | | | | | | | | |
| Financial Services - 1.5% (d) | | | | | | | | |
| Cielo SA | | | 7,384,469 | | | | 5,185,898 | |
| | | | | | | | | |
| Canada - 1.3% | | | | | | | | |
| Financial Services - 1.3% (d) | | | | | | | | |
| Nuvei Corp. (a)(e) | | | 314,289 | | | | 4,713,467 | |
| | | | | | | | | |
| Cayman Islands - 5.2% | | | | | | | | |
| Financial Services - 1.7% (d) | | | | | | | | |
| Dlocal, Ltd. (a) | | | 310,687 | | | | 5,955,870 | |
| Pagseguro Digital, Ltd. - Class A (a) | | | 644,727 | | | | 5,551,099 | |
| Stone Co., Ltd. - Class A (a) | | | 490,956 | | | | 5,238,501 | |
| Yeahka, Ltd. (a) | | | 990,021 | | | | 1,871,077 | |
| Total Financial Services | | | | | | | 18,616,547 | |
| | | | | | | | | |
| Cyprus - 0.0% (h) | | | | | | | | |
| Financial Services - 0.0% (d)(h) | | | | | | | | |
| QIWI PLC - ADR (a)(b)(f)(g) | | | 235,051 | | | | — | |
| | | | | | | | | |
| France - 1.8% | | | | | | | | |
| Financial Services - 1.8% (d) | | | | | | | | |
| Worldline SA (a)(e) | | | 228,215 | | | | 6,430,121 | |
| | | | | | | | | |
| Italy - 1.8% | | | | | | | | |
| Financial Services - 1.8% (d) | | | | | | | | |
| Nexi SpA (a)(e) | | | 1,042,808 | | | | 6,381,321 | |
| | | | | | | | | |
| Japan - 3.4% | | | | | | | | |
| Consumer Finance - 1.5% | | | | | | | | |
| Jaccs Co., Ltd. | | | 153,163 | | | | 5,288,551 | |
| Financial Services - 1.9% (d) | | | | | | | | |
| GMO Financial Gate, Inc. | | | 20,637 | | | | 1,470,718 | |
The accompanying notes are an integral part of these financial statements.
ETFMG™ ETFs
ETFMG Prime Mobile Payments ETF
Schedule of Investments
September 30, 2023 (Continued)
| | | Shares | | | Value | |
| | | | | | | | | |
| GMO Payment Gateway, Inc. | | | 99,066 | | | $ | 5,420,655 | |
| Total Financial Services | | | | | | | 6,891,373 | |
| Total Japan | | | | | | | 12,179,924 | |
| | | | | | | | | |
| Netherlands - 3.0% | | | | | | | | |
| Financial Services - 3.0% (d) | | | | | | | | |
| Adyen NV (a)(e) | | | 14,146 | | | | 10,554,350 | |
| | | | | | | | | |
| Puerto Rico - 1.5% | | | | | | | | |
| Financial Services - 1.5% (d) | | | | | | | | |
| EVERTEC, Inc. | | | 143,660 | | | | 5,341,279 | |
| | | | | | | | | |
| Republic of Korea - 3.4% | | | | | | | | |
| Consumer Finance - 1.6% | | | | | | | | |
| Samsung Card Co., Ltd. | | | 252,327 | | | | 5,693,906 | |
| Financial Services - 1.8% (d) | | | | | | | | |
| Danal Co., Ltd. (a) | | | 361,734 | | | | 888,653 | |
| Kakaopay Corp. (a) | | | 182,015 | | | | 5,496,599 | |
| Total Financial Services | | | | | | | 6,385,252 | |
| Total Republic of Korea | | | | | | | 12,079,158 | |
| | | | | | | | | |
| United Kingdom - 3.9% | | | | | | | | |
| Financial Services - 3.9% (d) | | | | | | | | |
| Network International Holdings PLC (a)(e) | | | 1,159,525 | | | | 5,520,335 | |
| PayPoint PLC | | | 153,180 | | | | 977,466 | |
| Wise PLC - Class A (a) | | | 885,953 | | | | 7,411,047 | |
| Total Financial Services | | | | | | | 13,908,848 | |
| | | | | | | | | |
| United States - 71.0% | | | | | | | | |
| Consumer Finance - 12.3% | | | | | | | | |
| American Express Co. | | | 143,946 | | | | 21,475,304 | |
| Bread Financial Holdings, Inc. (b) | | | 146,616 | | | | 5,014,267 | |
| Discover Financial Services | | | 120,936 | | | | 10,476,686 | |
| Green Dot Corp. - Class A (a) | | | 131,842 | | | | 1,836,559 | |
| PROG Holdings, Inc. (a)(b) | | | 158,202 | | | | 5,253,888 | |
| Total Consumer Finance | | | | | | | 44,056,704 | |
| Financial Services - 55.7% (d) | | | | | | | | |
| Affirm Holdings, Inc. (a)(b) | | | 319,206 | | | | 6,789,512 | |
| Block, Inc. (a) | | | 246,250 | | | | 10,899,025 | |
| Boku, Inc. (a)(e) | | | 100 | | | | 178 | |
| Cantaloupe, Inc. (a) | | | 135,577 | | | | 847,356 | |
| Euronet Worldwide, Inc. (a) | | | 70,393 | | | | 5,587,796 | |
| Fidelity National Information Services, Inc. | | | 244,443 | | | | 13,510,365 | |
| Fiserv, Inc. (a) | | | 187,344 | | | | 21,162,378 | |
| FleetCor Technologies, Inc. (a) | | | 37,766 | | | | 9,643,170 | |
| Flywire Corp. (a)(b) | | | 177,154 | | | | 5,649,441 | |
The accompanying notes are an integral part of these financial statements.
ETFMG™ ETFs
ETFMG Prime Mobile Payments ETF
Schedule of Investments
September 30, 2023 (Continued)
| | | Shares | | | Value | |
| | | | | | | | | |
| Global Payments, Inc. | | | 107,459 | | | $ | 12,399,694 | |
| I3 Verticals, Inc. - Class A (a)(b) | | | 82,789 | | | | 1,750,159 | |
| International Money Express, Inc. (a) | | | 87,097 | | | | 1,474,552 | |
| Jack Henry & Associates, Inc. | | | 51,037 | | | | 7,713,732 | |
| Marqeta, Inc. - Class A (a) | | | 954,278 | | | | 5,706,582 | |
| MasterCard, Inc. - Class A | | | 55,113 | | | | 21,819,788 | |
| Payoneer Global, Inc. (a) | | | 904,264 | | | | 5,534,096 | |
| PayPal Holdings, Inc. (a) | | | 363,810 | | | | 21,268,333 | |
| Remitly Global, Inc. (a) | | | 246,781 | | | | 6,223,817 | |
| Shift4 Payments, Inc. - Class A (a)(b) | | | 109,761 | | | | 6,077,467 | |
| Visa, Inc. - Class A (b) | | | 92,567 | | | | 21,291,336 | |
| Western Union Co. | | | 503,995 | | | | 6,642,654 | |
| WEX, Inc. (a) | | | 36,784 | | | | 6,918,703 | |
| Total Financial Services | | | | | | | 198,910,134 | |
| Software - 3.0% | | | | | | | | |
| ACI Worldwide, Inc. (a) | | | 234,980 | | | | 5,301,149 | |
| NCR Corp. (a) | | | 199,880 | | | | 5,390,763 | |
| Total Software | | | | | | | 10,691,912 | |
| Total United States | | | | | | | 253,658,750 | |
| TOTAL COMMON STOCKS (Cost $510,778,554) | | | | | | | 353,748,026 | |
| | | | | | | | | |
| INVESTMENTS PURCHASED WITH PROCEEDS FROM SECURITIES LENDING COLLATERAL - 12.2% | | | | | | | | |
| Mount Vernon Liquid Assets Portfolio, LLC, 5.50% (c) | | | 43,492,213 | | | | 43,492,213 | |
| TOTAL INVESTMENTS PURCHASED WITH PROCEEDS FROM SECURITIES LENDING COLLATERAL (Cost $43,492,213) | | | | | | | 43,492,213 | |
| | | | | | | | | |
| SHORT-TERM INVESTMENTS - 0.9% | | | | | | | | |
| Money Market Funds - 0.9% | | | | | | | | |
| First American Government Obligations Fund - Class X 5.26% (c) | | | 3,291,240 | | | | 3,291,240 | |
| TOTAL SHORT-TERM INVESTMENTS (Cost $3,291,240) | | | | | | | 3,291,240 | |
| | | | | | | | | |
| Total Investments (Cost $557,562,007) - 112.2% | | | | | | | 400,531,479 | |
| Liabilities in Excess of Other Assets - (12.2)% | | | | | | | (43,516,591 | ) |
| TOTAL NET ASSETS - 100.0% | | | | | | $ | 357,014,888 | |
| Percentages are stated as a percent of net assets. | | | | | | | | |
| ADR | American Depositary Receipt |
| PLC | Public Limited Company |
| (a) | Non-income producing security. |
| (b) | All or a portion of this security was out on loan at September 30, 2023. |
| (c) | The rate shown is the annualized seven-day yield at period end. |
The accompanying notes are an integral part of these financial statements.
ETFMG™ ETFs
ETFMG Prime Mobile Payments ETF
Schedule of Investments
September 30, 2023 (Continued)
| (d) | As of September 30, 2023 the Fund had a significant portion of its assets in the Financial Services Industry. |
| (e) | Restricted security as defined in Rule 144(a) under the Securities Act of 1933. Resale to the public may require registration or may extend only to qualified institutional buyers. At September 30, 2023, the market value of these securities total $33,599,772, which represents 9.4% of total net assets. |
| (f) | Value determined using significant unobservable inputs. The value of this security totals $0, which represents 0.0% of total net assets. Classified as Level 3 in the fair value hierarchy. |
| (g) | This security has been deemed illiquid according to the Fund’s liquidity guidelines. The value of this security totals $0, which represents 0.0% of total net assets. |
| (h) | Amount is less than 0.05%. |
The Global Industry Classification Standard (GICS®) was developed by and/or is the exclusive property of MSCI, Inc. and Standard & Poor’s Financial Services LLC (“S&P”). GICS is a service mark of MSCI and S&P and has been licensed for use by U.S. Bancorp Fund Services, LLC, doing business as U.S. Bank Global Fund Services (“Fund Services”).
The accompanying notes are an integral part of these financial statements.
ETFMG™ ETFs
ETFMG Treatments, Testing and Advancements ETF
Schedule of Investments
September 30, 2023
| | | Shares | | | Value | |
| COMMON STOCKS - 99.3% | | | | | | | | |
| Canada - 4.0% | | | | | | | | |
| Biotechnology - 1.0% (d) | | | | | | | | |
| Arbutus Biopharma Corp. (a) | | | 48,158 | | | $ | 97,761 | |
| XBiotech, Inc. (a) | | | 8,898 | | | | 36,660 | |
| Total Biotechnology | | | | | | | 134,421 | |
| Life Sciences Tools & Services - 3.0% | | | | | | | | |
| AbCellera Biologics, Inc. (a)(b) | | | 88,944 | | | | 409,142 | |
| Total Canada | | | | | | | 543,563 | |
| | | | | | | | | |
| Cayman Islands - 4.2% | | | | | | | | |
| Biotechnology - 4.2% (d) | | | | | | | | |
| Zai Lab, Ltd. - ADR (a)(b) | | | 22,924 | | | | 557,282 | |
| | | | | | | | | |
| France - 0.8% | | | | | | | | |
| Pharmaceuticals - 0.8% | | | | | | | | |
| Sanofi - ADR | | | 2,111 | | | | 113,234 | |
| | | | | | | | | |
| Germany - 5.9% | | | | | | | | |
| Biotechnology - 5.9% (d) | | | | | | | | |
| BioNTech SE - ADR (a)(b) | | | 7,242 | | | | 786,771 | |
| | | | | | | | | |
| Japan - 0.8% | | | | | | | | |
| Pharmaceuticals - 0.8% | | | | | | | | |
| Takeda Pharmaceutical Co., Ltd. - ADR (b) | | | 7,291 | | | | 112,792 | |
| | | | | | | | | |
| Netherlands - 3.7% | | | | | | | | |
| Biotechnology - 3.7% (d) | | | | | | | | |
| CureVac NV (a)(b) | | | 64,666 | | | | 441,669 | |
| InflaRx NV (a)(b) | | | 17,697 | | | | 52,737 | |
| Total Biotechnology | | | | | | | 494,406 | |
| | | | | | | | | |
| United Kingdom - 5.7% | | | | | | | | |
| Biotechnology - 4.0% (d) | | | | | | | | |
| Immunocore Holdings PLC - ADR (a)(b) | | | 10,376 | | | | 538,514 | |
| Pharmaceuticals - 1.7% | | | | | | | | |
| AstraZeneca PLC - ADR | | | 1,656 | | | | 112,144 | |
| GSK PLC - ADR | | | 3,196 | | | | 115,855 | |
| Total Pharmaceuticals | | | | | | | 227,999 | |
| Total United Kingdom | | | | | | | 766,513 | |
The accompanying notes are an integral part of these financial statements.
ETFMG™ ETFs
ETFMG Treatments, Testing and Advancements ETF
Schedule of Investments
September 30, 2023 (Continued)
| | | Shares | | | Value | |
| United States - 74.2% | | | | | | | | |
| Biotechnology - 39.0% (d) | | | | | | | | |
| AbbVie, Inc. | | | 764 | | | $ | 113,882 | |
| Alnylam Pharmaceuticals, Inc. (a) | | | 4,427 | | | | 784,022 | |
| Altimmune, Inc. (a) | | | 15,218 | | | | 39,567 | |
| Arcturus Therapeutics Holdings, Inc. (a)(b) | | | 7,683 | | | | 196,301 | |
| BioCryst Pharmaceuticals, Inc. (a)(b) | | | 53,424 | | | | 378,242 | |
| CEL-SCI Corp. (a)(b) | | | 13,651 | | | | 17,064 | |
| Chimerix, Inc. (a) | | | 25,586 | | | | 24,557 | |
| Cue Biopharma, Inc. (a) | | | 13,561 | | | | 31,190 | |
| Dynavax Technologies Corp. (a)(b) | | | 38,005 | | | | 561,334 | |
| Emergent BioSolutions, Inc. (a) | | | 14,964 | | | | 50,878 | |
| Enanta Pharmaceuticals, Inc. (a) | | | 6,299 | | | | 70,360 | |
| Gilead Sciences, Inc. | | | 1,468 | | | | 110,012 | |
| Gritstone bio, Inc. (a) | | | 27,622 | | | | 47,510 | |
| HilleVax, Inc. (a) | | | 11,531 | | | | 155,092 | |
| Icosavax, Inc. (a) | | | 14,549 | | | | 112,755 | |
| ImmunityBio, Inc. (a)(b) | | | 135,056 | | | | 228,245 | |
| Inovio Pharmaceuticals, Inc. (a)(b) | | | 77,447 | | | | 30,127 | |
| Invivyd, Inc. (a) | | | 31,702 | | | | 53,893 | |
| Moderna, Inc. (a) | | | 7,746 | | | | 800,083 | |
| Novavax, Inc. (a)(b) | | | 28,495 | | | | 206,304 | |
| Ocugen, Inc. (a) | | | 77,641 | | | | 31,056 | |
| Regeneron Pharmaceuticals, Inc. (a) | | | 136 | | | | 111,923 | |
| Renovaro Biosciences, Inc. (a) | | | 15,813 | | | | 70,684 | |
| Vaxart, Inc. (a)(b) | | | 42,955 | | | | 32,388 | |
| Vaxcyte, Inc. (a) | | | 11,246 | | | | 573,321 | |
| Vaxxinity, Inc. - Class A (a)(b) | | | 36,609 | | | | 50,154 | |
| Vir Biotechnology, Inc. (a) | | | 39,512 | | | | 370,227 | |
| Total Biotechnology | | | | | | | 5,251,171 | |
| Health Care Equipment & Supplies - 6.5% | | | | | | | | |
| Abbott Laboratories | | | 1,091 | | | | 105,663 | |
| Cue Health, Inc. (a) | | | 36,227 | | | | 16,023 | |
| Hologic, Inc. (a) | | | 1,502 | | | | 104,239 | |
| OraSure Technologies, Inc. (a) | | | 22,551 | | | | 133,727 | |
| QuidelOrtho Corp. (a)(b) | | | 7,089 | | | | 517,781 | |
| Total Health Care Equipment & Supplies | | | | | | | 877,433 | |
| Health Care Providers & Services - 16.9% | | | | | | | | |
| Enzo Biochem, Inc. (a) | | | 14,363 | | | | 20,108 | |
| Fulgent Genetics, Inc. (a) | | | 8,644 | | | | 231,141 | |
| Laboratory Corp. of America Holdings | | | 4,209 | | | | 846,219 | |
| OPKO Health, Inc. (a) | | | 226,949 | | | | 363,118 | |
| Quest Diagnostics, Inc. | | | 6,660 | | | | 811,588 | |
| Total Health Care Providers & Services | | | | | | | 2,272,174 | |
| Life Sciences Tools & Services - 5.6% | | | | | | | | |
| Adaptive Biotechnologies Corp. (a)(b) | | | 42,149 | | | | 229,712 | |
| Bio-Rad Laboratories, Inc. - Class A (a) | | | 1,459 | | | | 522,979 | |
| Gurnet Point Capital, LLC (e)(f) | | | 16,557 | | | | 1,325 | |
| Total Life Sciences Tools & Services | | | | | | | 754,016 | |
The accompanying notes are an integral part of these financial statements.
ETFMG™ ETFs
ETFMG Treatments, Testing and Advancements ETF
Schedule of Investments
September 30, 2023 (Continued)
| | | Shares | | | Value | |
| Pharmaceuticals - 6.2% | | | | | | | | |
| AN2 Therapeutics, Inc. (a)(b) | | | 8,266 | | | $ | 132,916 | |
| Atea Pharmaceuticals, Inc. (a) | | | 23,802 | | | | 71,406 | |
| CorMedix, Inc. (a) | | | 15,830 | | | | 58,571 | |
| Eli Lilly and Co. | | | 203 | | | | 109,037 | |
| Johnson & Johnson | | | 694 | | | | 108,091 | |
| Merck & Co., Inc. | | | 1,030 | | | | 106,039 | |
| Pfizer, Inc. | | | 3,174 | | | | 105,282 | |
| Scilex Holding Co. (a)(b) | | | 22,277 | | | | 31,187 | |
| SIGA Technologies, Inc. | | | 20,531 | | | | 107,788 | |
| Total Pharmaceuticals | | | | | | | 830,317 | |
| Total United States | | | | | | | 9,985,111 | |
| TOTAL COMMON STOCKS (Cost $27,859,120) | | | | | | | 13,359,672 | |
| INVESTMENTS PURCHASED WITH PROCEEDS FROM SECURITIES LENDING COLLATERAL - 26.8% | | | | | | | | |
| Mount Vernon Liquid Assets Portfolio, LLC, 5.50% (c) | | | 3,603,306 | | | | 3,603,306 | |
| TOTAL INVESTMENTS PURCHASED WITH PROCEEDS FROM SECURITIES LENDING COLLATERAL (Cost $3,603,306) | | | | | | | 3,603,306 | |
| | | | | | | | | |
| SHORT-TERM INVESTMENTS - 0.6% | | | | | | | | |
| Money Market Funds - 0.6% | | | | | | | | |
| First American Government Obligations Fund - Class X, 5.26% | | | 81,859 | | | | 81,859 | |
| TOTAL SHORT-TERM INVESTMENTS (Cost $81,859) | | | | | | | 81,859 | |
| | | | | | | | | |
| Total Investments (Cost $31,544,285) - 126.7% | | | | | | | 17,044,837 | |
| Liabilities in Excess of Other Assets - (26.7)% | | | | | | | (3,593,502 | ) |
| TOTAL NET ASSETS - 100.0% | | | | | | $ | 13,451,335 | |
Percentages are stated as a percent of net assets.
| ADR | American Depositary Receipt |
| PLC | Public Limited Company |
| (a) | Non-income producing security. |
| (b) | All or a portion of this security was out on loan at September 30, 2023. |
| (c) | The rate shown is the annualized seven-day yield at period end. |
| (d) | As of September 30, 2023 the Fund had a significant portion of its assets in the Biotechnology Industry. |
| (e) | This security has been deemed illiquid according to the Fund’s liquidity guidelines. The value of this security totals $1,325, which represents 0.01% of total net assets. |
| (f) | Value determined using significant unobservable inputs. The value of this security totals $1,325, which represents 0.01% of total net assets. Classified as Level 3 in the fair value hierarchy. |
The Global Industry Classification Standard (GICS®) was developed by and/or is the exclusive property of MSCI, Inc. and Standard & Poor’s Financial Services LLC (“S&P”). GICS is a service mark of MSCI and S&P and has been licensed for use by U.S. Bancorp Fund Services, LLC, doing business as U.S. Bank Global Fund Services (“Fund Services”).
The accompanying notes are an integral part of these financial statements.
ETFMG™ ETFs
STATEMENTS OF ASSETS AND LIABILITIES
September 30, 2023
| | | ETFMG Prime
Cyber Security
ETF | | | ETFMG Prime
Mobile Payments
ETF | | | ETFMG
Treatments,
Testing and
Advancements
ETF | |
| ASSETS | | | | | | | | | | | | |
| Investments in securities, at value* | | $ | 1,437,310,818 | | | $ | 400,531,479 | | | $ | 17,044,837 | |
| Foreign currency* | | | — | | | | 3,234 | | | | — | |
| Receivables: | | | | | | | | | | | | |
| Dividends and interest receivable | | | — | | | | 195,927 | | | | 9,352 | |
| Securities lending income receivable | | | 12,509 | | | | 10,761 | | | | 8,289 | |
| Receivable for investments sold | | | 2,462,558 | | | | — | | | | — | |
| Total Assets | | | 1,439,785,885 | | | | 400,741,401 | | | | 17,062,478 | |
| | | | | | | | | | | | | |
| LIABILITIES | | | | | | | | | | | | |
| Collateral received for securities loaned (Note 7) | | | 15,230,863 | | | | 43,492,213 | | | | 3,603,306 | |
| Payables: | | | | | | | | | | | | |
| Dividends and interest payable | | | 42,124 | | | | — | | | | — | |
| Management fees payable | | | 720,447 | | | | 234,300 | | | | 7,837 | |
| Total Liabilities | | | 15,993,434 | | | | 43,726,513 | | | | 3,611,143 | |
| Net Assets | | $ | 1,423,792,451 | | | $ | 357,014,888 | | | $ | 13,451,335 | |
| | | | | | | | | | | | | |
| NET ASSETS CONSIST OF: | | | | | | | | | | | | |
| Paid-in Capital | | $ | 1,812,077,679 | | | $ | 787,343,873 | | | $ | 44,299,175 | |
| Total Distributable Earnings (Accumulated Losses) | | | (388,285,228 | ) | | | (430,328,985 | ) | | | (30,847,840 | ) |
| Net Assets | | $ | 1,423,792,451 | | | $ | 357,014,888 | | | $ | 13,451,335 | |
| | | | | | | | | | | | | |
| *Identified Cost: | | | | | | | | | | | | |
| | | | | | | | | | | | | |
| Investments in securities | | $ | 1,470,235,294 | | | $ | 557,562,007 | | | $ | 31,544,285 | |
| Foreign currency | | | — | | | | 3,257 | | | | — | |
| | | | | | | | | | | | | |
| Shares Outstanding^ | | | 27,600,000 | | | | 9,100,000 | | | | 750,000 | |
| | | | | | | | | | | | | |
| Net Asset Value, Offering and Redemption Price per Share | | $ | 51.59 | | | $ | 39.23 | | | $ | 17.94 | |
| ^ | No par value, unlimited number of shares authorized |
The accompanying notes are an integral part of these financial statements.
ETFMG™ ETFs
STATEMENTS OF OPERATIONS
For the Year Ended September 30, 2023
| | | ETFMG
Prime
Cyber
Security
ETF | | | ETFMG
Prime
Mobile
Payments
ETF | | | ETFMG
Treatments,
Testing and
Advancements
ETF | |
| INVESTMENT INCOME | | | | | | | | | | | | |
| Income: | | | | | | | | | | | | |
| Dividends from unaffiliated securities (net of foreign withholdings tax of $190,582, $101,769, $1,359) | | $ | 9,276,905 | | | $ | 2,082,295 | | | $ | 146,867 | |
| Dividends from affiliated securities | | | 1,337,053 | | | | 1,470,422 | | | | 46,136 | |
| Interest | | | 421,722 | | | | 132,053 | | | | 4,519 | |
| Securities lending income | | | 362,448 | | | | 41,594 | | | | 111,585 | |
| Total Investment Income | | | 11,398,128 | | | | 3,726,364 | | | | 309,107 | |
| | | | | | | | | | | | | |
| Expenses: | | | | | | | | | | | | |
| Unitary fees | | | 8,556,475 | | | | 3,457,711 | | | | 134,884 | |
| Total Expenses | | | 8,556,475 | | | | 3,457,711 | | | | 134,884 | |
| Net Investment Income | | | 2,841,653 | | | | 268,653 | | | | 174,223 | |
| | | | | | | | | | | | | |
| REALIZED & UNREALIZED GAIN (LOSS) ON INVESTMENTS | | | | | | | | | | | | |
| Net Realized Gain (Loss) on: | | | | | | | | | | | | |
| Unaffiliated Investments | | | (53,817,848 | ) | | | (68,388,402 | ) | | | (8,605,632 | ) |
| Affiliated Investments | | | (1,164,772 | ) | | | (1,403,005 | ) | | | (31,349 | ) |
| In-Kind redemptions | | | 50,528,039 | | | | 8,090,599 | | | | 632,010 | |
| Foreign currency and foreign currency translation | | | 50,455 | | | | (141,908 | ) | | | — | |
| Net Realized Loss on Investments and In-Kind redemptions | | | (4,404,126 | ) | | | (61,842,716 | ) | | | (8,004,971 | ) |
| Net Change in Unrealized Appreciation (Depreciation) of: | | | | | | | | | | | | |
| Unaffiliated Investments | | | 249,216,001 | | | | 87,746,824 | | | | 6,268,669 | |
| Affiliated Investments | | | 1,470,402 | | | | 1,739,017 | | | | 42,100 | |
| Foreign currency and foreign currency translation | | | (3,805 | ) | | | (179 | ) | | | — | |
| Net change in Unrealized Appreciation (Depreciation) of Investments | | | 250,682,598 | | | | 89,485,662 | | | | 6,310,769 | |
| Net Realized and Unrealized Gain (Loss) on Investments | | | 246,278,472 | | | | 27,642,946 | | | | (1,694,202 | ) |
| NET INCREASE (DECREASE) IN NET ASSETS RESULTING FROM OPERATIONS | | $ | 249,120,125 | | | $ | 27,911,599 | | | $ | (1,519,979 | ) |
The accompanying notes are an integral part of these financial statements.
ETFMG Prime Cyber Security ETF
STATEMENTS OF CHANGES IN NET ASSETS
| | Year Ended
September 30,
2023 | | | Year Ended
September 30, 2022 | |
| OPERATIONS | | | | | | | | |
| Net investment income | | $ | 2,841,653 | | | $ | 2,217,325 | |
| Net realized (loss) gain on investments and In-Kind Redemptions | | | (4,404,126 | ) | | | 11,269,378 | |
| Net change in unrealized appreciation (depreciation) of investments and foreign currency and foreign currency translation | | | 250,682,598 | | | | (627,655,319 | ) |
| Net increase (decrease) in net assets resulting from operations | | | 249,120,125 | | | | (614,168,616 | ) |
| | | | | | | | | |
| DISTRIBUTIONS TO SHAREHOLDERS | | | | | | | | |
| Total distributions from distributable earnings | | | (3,006,286 | ) | | | (2,222,505 | ) |
| | | | | | | | | |
| CAPITAL SHARE TRANSACTIONS | | | | | | | | |
| Net decrease in net assets derived from net change in outstanding shares | | | (253,836,840 | ) | | | (259,776,610 | ) |
| Transaction Fees (See Note 1) | | | — | | | | 35,598 | |
| Net decrease in net assets from capital share transactions | | | (253,836,840 | ) | | | (259,741,012 | ) |
| Total decrease in net assets | | | (7,723,001 | ) | | | (876,132,133 | ) |
| | | | | | | | | |
| NET ASSETS | | | | | | | | |
| Beginning of Year | | | 1,431,515,452 | | | | 2,307,647,585 | |
| End of Year | | $ | 1,423,792,451 | | | $ | 1,431,515,452 | |
Summary of share transactions is as follows:
| | | Year Ended
September 30, 2023 | | | Year Ended
September 30, 2022 | |
| | | Shares | | | Amount | | | Shares | | | Amount | |
| Shares Sold | | | — | | | $ | — | | | | 15,400,000 | | | $ | 864,143,480 | |
| Transaction Fees (See Note 1) | | | — | | | | — | | | | — | | | | 35,598 | |
| Shares Redeemed | | | (5,400,000 | ) | | | (253,836,840 | ) | | | (20,250,000 | ) | | | (1,123,920,090 | ) |
| Net Transactions in Fund Shares | | | (5,400,000 | ) | | $ | (253,836,840 | ) | | | (4,850,000 | ) | | $ | (259,741,012 | ) |
| Beginning Shares | | | 33,000,000 | | | | | | | | 37,850,000 | | | | | |
| Ending Shares | | | 27,600,000 | | | | | | | | 33,000,000 | | | | | |
The accompanying notes are an integral part of these financial statements.
ETFMG Prime Mobile Payments ETF
STATEMENTS OF CHANGES IN NET ASSETS
| | Year Ended
September 30,
2023 | | | Year Ended
September 30, 2022 | |
| OPERATIONS | | | | | | | | |
| Net investment income (loss) | | $ | 268,653 | | | $ | (719,090 | ) |
| Net realized loss on investments and In-Kind Redemptions | | | (61,842,716 | ) | | | (120,294,623 | ) |
| Net change in unrealized appreciation (depreciation) of investments and foreign currency and foreign currency translation | | | 89,485,662 | | | | (379,332,326 | ) |
| Net increase (decrease) in net assets resulting from operations | | | 27,911,599 | | | | (500,346,039 | ) |
| | | | | | | | | |
| CAPITAL SHARE TRANSACTIONS | | | | | | | | |
| Net decrease in net assets derived from net change in outstanding shares | | | (178,135,315 | ) | | | (186,127,525 | ) |
| Transaction Fees (See Note 1) | | | 30,615 | | | | 44,420 | |
| Net decrease in net assets from capital share transactions | | | (178,104,700 | ) | | | (186,083,105 | ) |
| Total decrease in net assets | | | (150,193,101 | ) | | | (686,429,144 | ) |
| | | | | | | | | |
| NET ASSETS | | | | | | | | |
| Beginning of Year | | | 507,207,989 | | | | 1,193,637,133 | |
| End of Year | | $ | 357,014,888 | | | $ | 507,207,989 | |
Summary of share transactions is as follows:
| | | Year Ended
September 30, 2023 | | | Year Ended
September 30, 2022 | |
| | | Shares | | | Amount | | | Shares | | | Amount | |
| Shares Sold | | | 100,000 | | | $ | 4,069,200 | | | | 2,100,000 | | | $ | 114,795,455 | |
| Transaction Fees (See Note 1) | | | — | | | | 30,615 | | | | — | | | | 44,420 | |
| Shares Redeemed | | | (4,400,000 | ) | | | (182,204,515 | ) | | | (6,300,000 | ) | | | (300,922,980 | ) |
| Net Transactions in Fund Shares | | | (4,300,000 | ) | | $ | (178,104,700 | ) | | | (4,200,000 | ) | | $ | (186,083,105 | ) |
| Beginning Shares | | | 13,400,000 | | | | | | | | 17,600,000 | | | | | |
| Ending Shares | | | 9,100,000 | | | | | | | | 13,400,000 | | | | | |
The accompanying notes are an integral part of these financial statements.
ETFMG Treatments, Testing and Advancements ETF
STATEMENTS OF CHANGES IN NET ASSETS
| | Year Ended
September 30,
2023 | | | Year Ended
September 30, 2022 | |
| OPERATIONS | | | | | | | | |
| Net investment income | | $ | 174,223 | | | $ | 137,898 | |
| Net realized loss on investments and In-Kind Redemptions | | | (8,004,971 | ) | | | (5,036,064 | ) |
| Net change in unrealized appreciation (depreciation) of investments and foreign currency and foreign currency translation | | | 6,310,769 | | | | (22,089,191 | ) |
| Net decrease in net assets resulting from operations | | | (1,519,979 | ) | | | (26,987,357 | ) |
| | | | | | | | | |
| DISTRIBUTIONS TO SHAREHOLDERS | | | | | | | | |
| Total distributions from distributable earnings | | | (192,053 | ) | | | (119,444 | ) |
| | | | | | | | | |
| CAPITAL SHARE TRANSACTIONS | | | | | | | | |
| Net decrease in net assets derived from net change in outstanding shares | | | (6,599,865 | ) | | | (14,610,560 | ) |
| Net decrease in net assets | | | (8,311,897 | ) | | | (41,717,361 | ) |
| | | | | | | | | |
| NET ASSETS | | | | | | | | |
| Beginning of Year | | | 21,763,232 | | | | 63,480,593 | |
| End of Year$ | | $ | 13,451,335 | | | $ | 21,763,232 | |
Summary of share transactions is as follows:
| | | Year Ended
September 30, 2023 | | | Year Ended
September 30, 2022 | |
| | | Shares | | | Amount | | | Shares | | | Amount | |
| Shares Sold | | | — | | | $ | — | | | | 100,000 | | | $ | 2,739,590 | |
| Shares Redeemed | | | (300,000 | ) | | | (6,599,865 | ) | | | (600,000 | ) | | | (17,350,150 | ) |
| Net Transactions in Fund Shares | | | (300,000 | ) | | $ | (6,599,865 | ) | | | (500,000 | ) | | $ | (14,610,560 | ) |
| Beginning Shares | | | 1,050,000 | | | | | | | | 1,550,000 | | | | | |
| Ending Shares | | | 750,000 | | | | | | | | 1,050,000 | | | | | |
The accompanying notes are an integral part of these financial statements.
ETFMG Prime Cyber Security ETF
FINANCIAL HIGHLIGHTS
For a capital share outstanding throughout the year
| | | Year Ended
September 30,
2023 | | | Year Ended
September 30,
2022 | | | Year Ended
September 30,
2021 | | | Year Ended
September 30,
2020 | | | Year Ended
September 30,
2019 | |
| Net Asset Value, Beginning Year | | $ | 43.38 | | | $ | 60.97 | | | $ | 46.56 | | | $ | 37.46 | | | $ | 40.08 | |
| Income (Loss) from Investment Operations: | | | | | | | | | | | | | | | | | | | | |
| Net investment income 1 | | | 0.09 | | | | 0.06 | | | | 0.20 | | | | 0.64 | | | | 0.07 | |
| Net realized and unrealized gain (loss) on investments | | | 8.22 | | | | (17.59 | ) | | | 14.39 | | | | 9.10 | | | | (2.64 | ) |
| Total from investment operations | | | 8.31 | | | | (17.53 | ) | | | 14.59 | | | | 9.74 | | | | (2.57 | ) |
| Less Distributions: | | | | | | | | | | | | | | | | | | | | |
| Distributions from net investment income | | | (0.10 | ) | | | (0.06 | ) | | | (0.18 | ) | | | (0.64 | ) | | | (0.05 | ) |
| Total distributions | | | (0.10 | ) | | | (0.06 | ) | | | (0.18 | ) | | | (0.64 | ) | | | (0.05 | ) |
| Net asset value, end year | | $ | 51.59 | | | $ | 43.38 | | | $ | 60.97 | | | $ | 46.56 | | | $ | 37.46 | |
| Total Return | | | 19.18 | % | | | (28.77 | )% | | | 31.34 | % | | | 26.75 | % | | | (6.42 | )% |
| | | | | | | | | | | | | | | | | | | | | |
| Ratios/Supplemental Data: | | | | | | | | | | | | | | | | | | | | |
| Net assets at end of year (000’s) | | $ | 1,423,792 | | | $ | 1,431,515 | | | $ | 2,307,648 | | | $ | 1,503,814 | | | $ | 1,427,200 | |
| | | | | | | | | | | | | | | | | | | | | |
| Gross Expenses to Average Net Assets | | | 0.60 | % | | | 0.60 | % | | | 0.60 | % | | | 0.60 | % | | | 0.60 | % |
| Net Investment Income to Average Net Assets | | | 0.20 | % | | | 0.11 | % | | | 0.35 | % | | | 1.50 | % | | | 0.19 | % |
| Portfolio Turnover Rate | | | 16 | % | | | 51 | % | | | 34 | % | | | 33 | % | | | 36 | % |
| 1 | Calculated based on average shares outstanding during the year. |
The accompanying notes are an integral part of these financial statements.
ETFMG Prime Mobile Payments ETF
FINANCIAL HIGHLIGHTS
For a capital share outstanding throughout the year
| | | Year Ended
September 30,
2023 | | | Year Ended
September 30,
2022 | | | Year Ended
September 30,
2021 | | | Year Ended
September 30,
2020 | | | Year Ended
September 30,
2019 | |
| Net Asset Value, Beginning Year | | $ | 37.85 | | | $ | 67.82 | | | $ | 54.30 | | | $ | 46.60 | | | $ | 42.86 | |
| Income (Loss) from Investment Operations: | | | | | | | | | | | | | | | | | | | | |
| Net investment income (loss) 1 | | | 0.02 | | | | (0.04 | ) | | | (0.13 | ) | | | (0.04 | ) | | | 0.03 | |
| Net realized and unrealized gain (loss) on investments | | | 1.36 | | | | (29.93 | ) | | | 13.65 | | | | 7.75 | | | | 3.93 | |
| Total from investment operations | | | 1.38 | | | | (29.97 | ) | | | 13.52 | | | | 7.71 | | | | 3.96 | |
| Less Distributions: | | | | | | | | | | | | | | | | | | | | |
| Distributions from net investment income | | | — | | | | — | | | | — | | | | (0.02 | ) | | | (0.05 | ) |
| Net realized gains | | | — | | | | — | | | | — | | | | — | | | | (0.18 | ) |
| Total distributions | | | — | | | | — | | | | — | | | | (0.02 | ) | | | (0.23 | ) |
| Capital Share Transactions: | | | | | | | | | | | | | | | | | | | | |
| Transaction fees added to paid-in capital | | | 0.00 | 2 | | | — | | | | — | | | | 0.01 | | | | 0.01 | |
| Net asset value, end year | | $ | 39.23 | | | $ | 37.85 | | | $ | 67.82 | | | $ | 54.30 | | | $ | 46.60 | |
| Total Return | | | 3.64 | % | | | (44.18 | )% | | | 24.91 | % | | | 16.56 | % | | | 9.49 | % |
| | | | | | | | | | | | | | | | | | | | | |
| Ratios/Supplemental Data: | | | | | | | | | | | | | | | | | | | | |
| Net assets at end year (000’s) | | $ | 357,015 | | | $ | 507,208 | | | $ | 1,193,637 | | | $ | 798,142 | | | $ | 743,198 | |
| | | | | | | | | | | | | | | | | | | | | |
| Gross Expenses to Average Net Assets | | | 0.75 | % | | | 0.75 | % | | | 0.75 | % | | | 0.75 | % | | | 0.75 | % |
| Net Investment Income (Loss) to Average Net Assets | | | 0.06 | % | | | (0.09 | )% | | | (0.20 | )% | | | (0.08 | )% | | | 0.06 | % |
| Portfolio Turnover Rate | | | 23 | % | | | 35 | % | | | 27 | % | | | 19 | % | | | 28 | % |
| 1 | Calculated based on average shares outstanding during the year. |
| 2 | Amount is less than $0.005 |
The accompanying notes are an integral part of these financial statements.
ETFMG Treatments, Testing and Advancements ETF
FINANCIAL HIGHLIGHTS
For a capital share outstanding throughout each year/period
| | | | Year Ended
September 30,
2023 | | | | Year Ended
September 30,
2022 | | | | Year Ended
September 30,
2021 | | | | Period Ended
September 30,
20201 | |
| Net Asset Value, Beginning Year/Period | | $ | 20.73 | | | $ | 40.96 | | | $ | 27.71 | | | $ | 25.00 | |
| Income from Investment Operations: | | | | | | | | | | | | | | | | |
| Net investment income 2 | | | 0.19 | | | | 0.11 | | | | 0.36 | | | | 0.02 | |
| Net realized and unrealized gain (loss) on investments | | | (2.76 | ) | | | (20.23 | ) | | | 13.28 | | | | 2.69 | |
| Total from investment operations | | | (2.57 | ) | | | (20.12 | ) | | | 13.64 | | | | 2.71 | |
| Less Distributions: | | | | | | | | | | | | | | | | |
| Distributions from net investment income | | | (0.22 | ) | | | (0.11 | ) | | | (0.39 | ) | | | — | |
| Total distributions | | | (0.22 | ) | | | (0.11 | ) | | | (0.39 | ) | | | — | |
| Net asset at end of year/period | | $ | 17.94 | | | $ | 20.73 | | | $ | 40.96 | | | $ | 27.71 | |
| Total Return | | | (12.53 | )% | | | (49.14 | )% | | | 49.43 | %5 | | | 10.82 | %3 |
| | | | | | | | | | | | | | | | | |
| Ratios/Supplemental Data: | | | | | | | | | | | | | | | | |
| Net assets at end of year/period (000’s) | | $ | 13,451 | | | $ | 21,763 | | | $ | 63,481 | | | $ | 54,030 | |
| | | | | | | | | | | | | | | | | |
| Gross Expenses to Average Net Assets | | | 0.68 | % | | | 0.68 | % | | | 0.68 | % | | | 0.68 | %4 |
| Net Investment Income to Average Net Assets | | | | | | | | | | | | | | | | |
| | | | 0.88 | % | | | 0.37 | % | | | 0.98 | % | | | 0.25 | %4 |
| Portfolio Turnover Rate | | | 55 | % | | | 30 | % | | | 39 | % | | | 41 | %3 |
| 1 | Commencement of operations on June 17, 2020. |
| 2 | Calculated based on average shares outstanding during the year/period. |
| 5 | The returns reflect the actual performance for the period and do not include the impact of trades executed on the last business day of the period that were recorded on the first business day of the next period. |
The accompanying notes are an integral part of these financial statements.
ETFMG TM ETFs
NOTES TO FINANCIAL STATEMENTS
September 30, 2023
NOTE 1 – ORGANIZATION
ETFMG Prime Cyber Security ETF (“HACK”), ETFMG Prime Mobile Payments ETF (“IPAY”), and ETFMG Treatments, Testing and Advancements ETF (“GERM”) (each a “Fund”, or collectively the “Funds”) are series of ETF Managers Trust (the “Trust”), an open-end management investment company consisting of multiple investment series, organized as a Delaware statutory trust on July 1, 2009. The Trust is registered with the SEC under the Investment Company Act of 1940, as amended (the “1940 Act”), as an open-end management investment company and the offering of the Funds’ shares (“Shares”) is registered under the Securities Act of 1933, as amended (the “Securities Act”).
The following table is a summary of the Strategy Commencement Date and Strategy of the Funds:
| Fund Ticker | | Strategy
Commencement
Date | | Strategy |
| ETFMG Prime Cyber Security ETF | | 8/1/2017 | | Seeks to provide investment results that, before fees and expenses, correspond generally to the price and yield of the Prime Cyber Defense Index (“Prime Cyber Index”). |
| ETFMG Prime Mobile Payments ETF | | 8/1/2017 | | Seeks to provide investment results that, before fees and expenses, correspond generally to the price and yield performance of the Prime Mobile Payments Index (“Prime Mobile Index”). |
| ETFMG Treatments, Testing and Advancements ETF | | 6/17/2020 | | Seeks to provide investment results that, before fees and expenses, correspond generally to the price and yield performance of the Prime Treatments, Testing and Advancements Index. |
The Funds each currently offer one class of shares, which have no front end sales load, no deferred sales charges, and no redemption fees. The Funds may issue an unlimited number of shares of beneficial interest, with no par value. All shares of each Fund have equal rights and privileges.
Shares of the Funds are listed and traded on the NYSE Arca, Inc. Market prices for the shares may be different from their net asset value (“NAV”) . Each Fund issues and redeems shares on a continuous basis at NAV only in blocks of 50,000 shares, called “Creation Units.” Creation Units are issued and redeemed principally in-kind for securities included in a specified Index. Once created, shares generally trade in the secondary market at market prices that change throughout the day in quantities less than a Creation Unit. Except when aggregated in Creation Units, shares are not redeemable securities of a Fund. Shares of a Fund may only be purchased or redeemed by certain financial institutions (“Authorized Participants”). An Authorized Participant is either (i) a broker-dealer or other participant in the clearing process through the Continuous Net Settlement System of the National Securities Clearing Corporation or (ii) a DTC participant and, in each case, must have executed a Participant Agreement with the Distributor. Most retail investors do not qualify as Authorized Participants nor have the resources to buy and sell whole Creation Units. Therefore, they are unable to purchase or redeem the shares directly from a Fund. Rather, most retail investors may purchase Shares in the secondary market with the assistance of a broker and may be subject to customary brokerage commissions or fees.
Authorized Participants transacting in Creation Units for cash may pay an additional variable charge to compensate the relevant Fund for certain transaction costs (i.e., brokerage costs) and market impact expenses relating to investing in portfolio securities. Such variable charges, if any, are included in Transaction Fees” in the Statements of Changes in Net Assets.
NOTES TO FINANCIAL STATEMENTS
September 30, 2023
NOTE 2 – SIGNIFICANT ACCOUNTING POLICIES
The following is a summary of significant accounting policies consistently followed by the Funds. These policies are in conformity with accounting principles generally accepted in the United States of America (“U.S. GAAP”).
The Funds follow the investment company accounting and reporting guidance of the Financial Accounting Standards Board Accounting Standard Codification Topic 946 Financial Services – Investment Companies.
The Funds may invest in certain other investment companies (underlying funds). For more information about the underlying Fund’s operations and policies, please refer to those Fund’s semiannual and annual reports, which are filed with the SEC.
| A. | Security Valuation. Securities listed on a securities exchange, market or automated quotation system for which quotations are readily available (except for securities traded on NASDAQ), including securities traded over the counter, are valued at the last quoted sale price on the primary exchange or market (foreign or domestic) on which they are traded on the valuation date (or at approximately 4:00 pm Eastern Time if a security’s primary exchange is normally open at that time), or, if there is no such reported sale on the valuation date, at the most recent quoted bid price. For securities traded on NASDAQ, the NASDAQ Official Closing Price will be used. |
Debt obligations are generally valued on the basis of valuations provided by third party pricing services, as derived from such services’ pricing models. Inputs to the models may include, but are not limited to, reported trades, executable bid and ask prices, broker/dealer quotations, prices or yields of securities with similar characteristics, interest rates, anticipated prepayments, benchmark curves or information pertaining to the issuer, as well as industry and economic events. The pricing services may use a matrix approach, which considers information regarding securities with similar characteristics to determine the valuation for a security.
Securities for which quotations are not readily available are valued at their respective fair values as determined in good faith by ETF Managers Group, LLC (the “Adviser”), using procedures adopted by the Board of Trustees (the “Board”). When a security is “fair valued,” consideration is given to the facts and circumstances relevant to the particular situation, including a review of various factors set forth in the pricing procedures adopted by the Funds’ Board. The use of fair value pricing by a Fund may cause the net asset value of its shares to differ significantly from the net asset value that would be calculated without regard to such considerations. As of September 30, 2023, the ETFMG Prime Mobile Payments ETF and ETFMG Treatments, Testing and Advancements ETF each held one security that was fair valued by the Adviser.
As described above, the Funds utilize various methods to measure the fair value of their investments on a recurring basis. U.S. GAAP establishes a hierarchy that prioritizes inputs to valuation methods. The three levels of inputs are:
| Level 1 | Unadjusted quoted prices in active markets for identical assets or liabilities that the Funds have the ability to access. |
| Level 2 | Observable inputs other than quoted prices included in Level 1 that are observable for the asset or liability, either directly or indirectly. These inputs may include quoted prices for the identical instrument on an inactive market, prices for similar instruments, interest rates, prepayment speeds, credit risk, yield curves, default rates and similar data. |
| Level 3 | Unobservable inputs for the asset or liability, to the extent relevant observable inputs are not available; representing the Funds’ own assumptions about the assumptions a market participant would use in valuing the asset or liability and would be based on the best information available. |
NOTES TO FINANCIAL STATEMENTS
September 30, 2023
The availability of observable inputs can vary from security to security and is affected by a wide variety of factors, including, for example, the type of security, whether the security is new and not yet established in the marketplace, the liquidity of markets, and other characteristics particular to the security. To the extent that valuation is based on models or inputs that are less observable or unobservable in the market, the determination of fair value requires more judgment. Accordingly, the degree of judgment exercised in determining fair value is greatest for instruments categorized in Level 3.
The inputs used to measure fair value may fall into different levels of the fair value hierarchy. In such cases, for disclosure purposes, the level in the fair value hierarchy within which the fair value measurement falls in its entirety, is determined based on the lowest level input that is significant to the fair value measurement in its entirety.
The following is a summary of the inputs used to value the Funds’ net assets as of September 30, 2023:
ETFMG Prime Cyber Security ETF
| Assets^ | | Level 1 | | | Level 2 | | | Level 3 | | | Total | |
| Common Stocks | | $ | 1,413,835,415 | | | $ | — | | | $ | — | | | $ | 1,413,835,415 | |
| Short-Term Investments | | | 8,244,540 | | | | — | | | | — | | | | 8,244,540 | |
| | | | | | | | | | | | | | | | |
| Investments Purchased with Securities Lending Collateral* | | | — | | | | — | | | | — | | | | 15,230,863 | |
| Total Investments in Securities | | $ | 1,422,079,955 | | | $ | — | | | $ | — | | | $ | 1,437,310,818 | |
ETFMG Prime Mobile Payments ETF
| Assets^ | | Level 1 | | | Level 2 | | | Level 3 | | | Total | |
| Common Stocks | | $ | 353,748,026 | | | $ | — | | | $ | — | (1) | | $ | 353,748,026 | |
| Short-Term Investments | | | 3,291,240 | | | | — | | | | — | | | | 3,291,240 | |
| | | | | | | | | | | | | | | | |
| Investments Purchased with Securities Lending Collateral* | | | — | | | | — | | | | — | | | | 43,492,213 | |
| Total Investments in Securities | | $ | 357,039,266 | | | $ | — | | | $ | — | | | $ | 400,531,479 | |
ETFMG Treatments, Testing and Advancements ETF
| Assets^ | | Level 1 | | | Level 2 | | | Level 3 | | | Total | |
| Common Stocks | | $ | 13,358,347 | | | $ | — | | | $ | 1,325 | (2) | | $ | 13,359,672 | |
| Short-Term Investments | | | 81,859 | | | | — | | | | — | | | | 81,859 | |
| Investments Purchased with Securities Lending Collateral* | | | — | | | | — | | | | — | | | | 3,603,306 | |
| Total Investments in Securities | | $ | 13,440,206 | | | $ | — | | | | 1,325 | | | $ | 17,044,837 | |
| (1) | Includes security valued at $0 with a cost of $2,636,627. |
| (2) | Includes security valued at $1,325 with a cost of $0. |
| ^ | See Schedule of Investments for classifications by country and industry. |
| * | Certain investments that are measured at fair value used the net asset value per share (or its equivalent) practical expedient have not been categorized in the fair value hierarchy. The fair value amounts presented in the table are intended to permit reconciliation of the fair value hierarchy to the amounts presented in the Schedules of Investments. |
NOTES TO FINANCIAL STATEMENTS
September 30, 2023
| B. | Federal Income Taxes. The Funds have each elected to be taxed as a “regulated investment company” and intend to distribute substantially all taxable income to their shareholders and otherwise comply with the provisions of the Internal Revenue Code applicable to regulated investment companies. Therefore, no provisions for federal income taxes or excise taxes have been made. |
To avoid imposition of the excise tax applicable to regulated investment companies, each Fund intends to declare each year as dividends, in each calendar year, at least 98.0% of its net investment income (earned during the calendar year) and 98.2% of its net realized capital gains (earned during the twelve months ended October 31) plus undistributed amounts, if any, from prior years.
Net capital losses incurred after October 31, within the taxable year are deemed to arise on the first business day of each Fund’s next taxable year.
Each Fund recognizes the tax benefits of uncertain tax positions only where the position is “more likely than not” to be sustained assuming examination by tax authorities. Each Fund has analyzed its tax position and has concluded that no liability for unrecognized tax benefits should be recorded related to uncertain tax positions expected to be taken in the Funds’ 2023 tax returns. The Funds identify their major tax jurisdictions as U.S. Federal, the State of New Jersey, and the State of Delaware; however the Funds are not aware of any tax positions for which it is reasonably possible that the total amounts of unrecognized tax benefits will change materially in the next twelve months.
As of September 30, 2023, management has reviewed the tax positions for open periods (for Federal purposes, three years from the date of filing and for state purposes, generally a range of three to four years from the date of filing), as applicable to the Funds, and has determined that no provision for income tax is required in the Funds’ financial statements.
| C. | Security Transactions and Investment Income. Investment securities transactions are accounted for on the trade date. Gains and losses realized on sales of securities are determined on a specific identification basis. Discounts/premiums on debt securities purchased are accreted/amortized over the life of the respective securities using the effective interest method. Dividend income is recorded on the ex-dividend date. Interest income is recorded on an accrual basis. Income, including gains, from investments in foreign securities received by the Funds may be subject to income, withholding or other taxes imposed by foreign countries. |
| D. | Foreign Currency Translations and Transactions. The Funds may engage in foreign currency transactions. Foreign currency transactions are translated into U.S. dollars on the following basis: (i) market value of investment securities, assets and liabilities at the daily rates of exchange, and (ii) purchases and sales of investment securities, dividend and interest income and certain expenses at the rates of exchange prevailing on the respective dates of such transactions. For financial reporting purposes, the Funds do not isolate changes in the exchange rate of investment securities from the fluctuations arising from changes in the market prices of securities for unrealized gains and losses. However, for federal income tax purposes, the Funds do isolate and treat as ordinary income the effect of changes in foreign exchange rates on realized gains or losses from the sale of investment securities and payables and receivables arising from trade-date and settlement-date differences. |
| E. | Distributions to Shareholders. Distributions to shareholders from net investment income are generally declared and paid by each of the Funds on a quarterly basis. Distributions to shareholders from realized gains on securities for each Fund normally are declared and paid on an annual basis. Distributions are recorded on the ex-dividend date. |
NOTES TO FINANCIAL STATEMENTS
September 30, 2023
| F. | Use of Estimates. The preparation of financial statements in conformity with U.S. GAAP requires management to make estimates and assumptions that affect the reported amounts of assets and liabilities at the date of the financial statements, as well as the reported amounts of revenues and expenses during the reporting period. Actual results could differ from those estimates. |
| G. | Share Valuation. The net asset value (“NAV”) per share of each Fund is calculated by dividing the sum of the value of the securities held by the Fund, plus cash and other assets, minus all liabilities (including estimated accrued expenses) by the total number of shares outstanding for the Fund, rounded to the nearest cent. The Funds’ shares will not be priced on the days on which the NYSE is closed for trading. For Authorized Participants, the offering and redemption price per share for the Funds are equal to the Funds’ respective net asset value per share. |
| H. | Guarantees and Indemnifications. In the normal course of business, the Funds enter into contracts with service providers that contain general indemnification clauses. The Funds’ maximum exposure under these arrangements is unknown as this would involve future claims that may be made against the Funds that have not yet occurred. However, based on experience, the Funds expect the risk of loss to be remote. |
NOTE 3 – RISK FACTORS
Investing in the Funds may involve certain risks, as discussed in the Funds’ prospectus, including, but not limited to, those described below. Any of these risks could cause an investor to lose money.
Market Risk. Financial markets rise and fall in response to a variety of factors, sometimes rapidly and unpredictably. As with any investment whose performance is tied to these markets, the value of an investment in a Fund will fluctuate, which means that an investor could lose money over short or long periods.
Investment Style Risk. The Funds are not actively managed (“Index Funds”). Therefore, those Funds follow the securities included in its respective index during upturns as well as downturns. Because of their indexing strategies, the Index Funds do not take steps to reduce market exposure or to lessen the effects of a declining market. In addition, because of the Index Funds’ expenses, the Index Funds’ performance may be below that of their respective index.
Equity Risk. The prices of equity securities rise and fall daily. These price movements may result from factors affecting individual companies, industries or the securities market as a whole. In addition, equity markets tend to move in cycles which may cause stock prices to fall over short or extended periods of time.
Securities Lending Risk. Securities lending involves the risk of loss of rights in, or delay in recovery of, the loaned securities if the borrower fails to return the security loaned or becomes insolvent.
Concentration Risk. To the extent that a Fund’s or an index’s portfolio is concentrated in the securities of issuers in a particular market, industry, group of industries, sector or asset class, the fund may be adversely affected by the performance of those securities, may be subject to increased price volatility and may be more vulnerable to adverse economic, market, political or regulatory occurrences affecting that market, industry, group of industries, sector or asset class.
NOTES TO FINANCIAL STATEMENTS
September 30, 2023
Natural Disaster/Epidemic Risk. Natural or environmental disasters, such as earthquakes, fires, floods, hurricanes, tsunamis and other severe weather-related phenomena generally, and widespread disease, including pandemics and epidemics (for example, the novel coronavirus COVID -19), have been and can be highly disruptive to economies and markets and have recently led, and may continue to lead, to increased market volatility and significant market losses. Such natural disaster and health crises could exacerbate political, social, and economic risks previously mentioned, and result in significant breakdowns, delays, shutdowns, social isolation, and other disruptions to important global, local and regional supply chains affected, with potential corresponding results on the operating performance of the Funds and their investments. A climate of uncertainty and panic, including the contagion of infectious viruses or diseases, may adversely affect lobal, regional, and local economies and reduce the availability of potential investment opportunities, and increases the difficulty of performing due diligence and modeling market conditions, potentially reducing the accuracy of financial projections. Under the circumstances, the Funds may have difficulty achieving their investment objectives which may adversely impact performance. Further, such events can be highly disruptive to economies and markets, significantly disrupt the operations of individual companies (including, but not limited to, the Funds’ Sponsor and third party service providers), sectors, industries, markets, securities and commodity exchanges, currencies, interest and inflation rates, credit ratings, investor sentiment, and other factors affecting the value of the Funds’ investments. These factors can cause substantial market volatility. exchange trading suspensions and closures and can impact the ability of the Funds to complete redemptions and otherwise affect Fund performance and Fund trading in the secondary market. A widespread crisis may also affect the global economy in ways that cannot necessarily be foreseen at the current time. How long such events will last and whether they will continue or recur cannot be predicted. Impacts from these events could have significant impact on a Fund’s performance, resulting in losses to the Funds.
On February 24, 2022, Russia commenced a military attack on Ukraine. The outbreak of hostilities between the two countries could result in more widespread conflict and could have a severe adverse effect on the region and the markets. In addition, sanctions imposed on Russia by the United States and other countries, and any sanctions imposed in the future could have a significant adverse impact on the Russian economy and related markets.
On October 7, 2023, Hamas launched a significant attack on Israel from the Gaza Strip. The extent and duration of the Israel-Hamas war and any related economic and market impacts are impossible to predict but may be significant and may negatively impact Israel’s economy. The price and liquidity of investments may fluctuate widely as a result of these conflicts and related events. How long such conflicts and related events will last, and whether either may escalate further, cannot be predicted, however such conflicts may negatively impact issuers of securities in which the Fund(s) invests.
A complete description of the principal risks is included in each Fund’s prospectus under the heading “Principal Investment Risks.”
NOTE 4 – MANAGEMENT AND OTHER CONTRACTS
The Adviser serves as the investment advisor to the Funds. Pursuant to an Investment Advisory Agreement (“Advisory Agreement”) between the Trust, on behalf of the Funds, and the Adviser, the Adviser provides investment advice to the Funds and oversees the day-to-day operations of the Funds, subject to the direction and control of the Board and the officers of the Trust. Under the Advisory Agreement, the Adviser is also responsible for arranging transfer agency, custody, fund administration and accounting, and other non-distribution related services necessary for the Funds to operate.
Under the Investment Advisory Agreement, the Adviser has overall responsibility for the general management and administration of the Funds and arranges for sub-advisory, transfer agency, custody, fund administration, securities lending, and all other non-distribution related services necessary for the Funds to operate. The Funds unitary fees are accrued daily and paid monthly. The Adviser bears the costs of all advisory and non-advisory services required to operate the Funds, in exchange for a single unitary fee at the following annual rates:
| ETFMG Prime Cyber Security ETF | | | 0.60 | % |
| ETFMG Prime Mobile Payments ETF | | | 0.75 | % |
| ETFMG Treatments, Testing and Advancements ETF | | | 0.68 | % |
NOTES TO FINANCIAL STATEMENTS
September 30, 2023
Under the Investment Advisory Agreement, the Adviser has agreed to pay all expenses of the Funds, except for: the fee paid to the Adviser pursuant to the Investment Advisory Agreement, interest charges on any borrowings, taxes, brokerage commissions and other expenses incurred in placing orders for the purchase and sale of securities and other investment instruments, acquired fund fees and expenses, accrued deferred tax liability, extraordinary expenses, and distribution (12b-1) fees and expenses (collectively, “Excluded Expenses”). The Adviser has entered into an agreement with Foreside Fund Services LLC to serve as distributor to the Funds (the “Distributor”). The Distributor provides marketing support for the Funds, including distributing marketing materials related to the Funds. Level ETF Ventures, LLC (“Level”) serves as the index provider for HACK, IPAY, and GERM. Level is not affiliated with the Trust or the Adviser.
U.S. Bancorp Fund Services, LLC doing business as U.S. Bank Global Fund Services (the “Administrator”) provides fund accounting, fund administration, and transfer agency services to the Funds. The Adviser compensates the Administrator for these services under an administration agreement between the two parties.
The Adviser pays each independent Trustee a quarterly fee for service to the Funds. Each Trustee is also reimbursed by the Adviser for all reasonable out-of-pocket expenses incurred in connection with his duties as Trustee, including travel and related expenses incurred in attending Board meetings.
NOTE 5 – DISTRIBUTION PLAN
The Funds have each adopted a Plan of Distribution pursuant to Rule 12b-1 under the 1940 Act. Under the Plan, each Fund may pay compensation to the Distributor or any other distributor or financial institution with which the Trust has an agreement with respect to each Fund, with the amount of such compensation not to exceed an annual rate of 0.25% of each Fund’s average daily net assets. During the year ended September 30, 2023, the Funds did not incur any 12b-1 expenses.
NOTE 6 - PURCHASES AND SALES OF SECURITIES
The costs of purchases and sales of securities, excluding short-term securities and in-kind transactions, during the year ended September 30, 2023:
| | | Purchases | | | Sales | |
| ETFMG Prime Cyber Security ETF | | $ | 240,485,622 | | | $ | 282,405,429 | |
| ETFMG Prime Mobile Payments ETF | | | 114,447,829 | | | | 164,340,457 | |
| ETFMG Treatments, Testing and Advancements ETF | | | 11,291,447 | | | | 12,534,115 | |
The costs of purchases and sales of in-kind transactions associated with creations and redemptions during the year ended September 30, 2023:
| | | Purchases In- Kind | | | Sales In- Kind | |
| ETFMG Prime Cyber Security ETF | | $ | — | | | $ | 251,820,376 | |
| ETFMG Prime Mobile Payments ETF | | | 3,853,079 | | | | 171,580,520 | |
| ETFMG Treatments, Testing and Advancements ETF | | | — | | | | 6,556,770 | |
Purchases in-kind are the aggregate of all in-kind purchases and sales in-kind are the aggregate of all in-kind sales. Net capital gains or losses resulting from in-kind redemptions are excluded from the Funds’ determination of taxable gains and are not distributed to shareholders.
There were no purchases or sales of U.S. Government obligations during the year ended September 30, 2023.
NOTES TO FINANCIAL STATEMENTS
September 30, 2023
NOTE 7 — SECURITIES LENDING
The Funds may lend up to 33 1⁄3% of the value of the securities in their portfolios to brokers, dealers and financial institutions (but not individuals) under terms of participation in a securities lending program administered by U.S. Bank N.A. (the “Custodian”). The securities lending agreement requires that loans are collateralized at all times in an amount equal to at least 102% of the value of any loaned securities at the time of the loan, plus accrued interest. The Funds receive compensation in the form of fees and earn interest on the cash collateral. The amount of fees depends on a number of factors including the type of security and length of the loan. The Funds continue to receive interest payments or dividends on the securities loaned during the borrowing period. Gain or loss on the fair value of securities loaned that may occur during the term of the loan will be for the account of the Funds. The Funds have the right under the terms of the securities lending agreement to recall the securities from the borrower on demand. The cash collateral is invested by the Custodian in accordance with approved investment guidelines. Those guidelines require the cash collateral to be invested in readily marketable, high quality, short-term obligations, either directly on behalf of each Fund or through one or more joint accounts, money market funds, or short-term bond funds, including those advised by or affiliated with the Adviser; however, all such investments are subject to risk of payment delays or default on the part of the issuer or counterparty or otherwise may not generate sufficient interest to support the costs associated with securities lending. Other investment companies in which a Fund may invest cash collateral can be expected to incur fees and expenses for operations, such as investment advisory and administration fees, which would be in addition to those incurred by the Fund, and which may be received in full or in part by the Adviser. Pursuant to guidance issued by the SEC staff, fees and expenses of money market funds used for cash collateral received in connection with loans of securities are not treated as Acquired Fund Fees and Expenses, which reflect a Fund’s pro rata share of the fees and expenses incurred by other investment companies in which the Fund invests (as disclosed in the Prospectus, as applicable). The Funds could also experience delays in recovering their securities and possible loss of income or value if the borrower fails to return the borrowed securities, although the Fund is indemnified from this risk by contract with the securities lending agent.
As of the year ended September 30, 2023, the value of the securities on loan and payable for collateral due to broker were as follows:
Value of Securities on Loan Collateral Received
| Fund | | Values of
Securities on
Loan | | | Fund
Collateral
Received* | |
| ETFMG Prime Cyber Security ETF | | $ | 14,816,823 | | | $ | 15,230,863 | |
| ETFMG Prime Mobile Payments ETF | | | 42,484,453 | | | | 43,492,213 | |
| ETFMG Treatments, Testing and Advancements ETF | | | 3,525,295 | | | | 3,603,306 | |
| * | The cash collateral received was invested in the Mount Vernon Liquid Assets Portfolio, a money market fund with an overnight and continuous maturity. |
NOTES TO FINANCIAL STATEMENTS
September 30, 2023
NOTE 8 – FEDERAL INCOME TAXES
The components of distributable earnings (losses) and cost basis of investments for federal income tax purposes at September 30, 2023 were as follows:
| | | Cost | | | Gross
Unrealized
Appreciation | | | Gross
Unrealized
Depreciation | | | Net Unrealized
Appreciation
(Depreciation) | |
| ETFMG Prime Cyber Security ETF | | $ | 1,515,386,270 | | | $ | 165,686,349 | | | $ | (243,761,801 | ) | | $ | (78,075,452 | ) |
| ETFMG Prime Mobile Payments ETF | | | 577,294,087 | | | | 22,689,432 | | | | (199,452,040 | ) | | | (176,762,608 | ) |
| ETFMG Treatments, Testing and Advancements ETF | | | 31,788,428 | | | | 816,363 | | | | (15,559,954 | ) | | | (14,743,591 | ) |
The difference between the tax cost of investments and the cost of investments for GAAP purposes is primarily due to the tax treatment of wash sale losses.
As of September 30, 2023, the components of distributable earnings (loss) on a tax basis were as follows:
| | | Undistributed
Ordinary
Income | | | Undistributed
Long-Term
Gain | | | Total
Distributable
Earnings | | | Other
Accumulated
Loss | | | Total
Accumulated
Gain (Loss) | |
| ETFMG Prime Cyber Security ETF | | $ | 51,555 | | | $ | — |
| | $ | 51,555 |
| | $ | (310,261,331 | ) | | $ | (388,285,228) | |
| ETFMG Prime Mobile Payments ETF | | | 345,328 | | | | — | | | | 345,328 | | | | (253,911,705 | ) | | | (430,328,985 | ) |
| ETFMG Treatments, Testing and Advancements ETF | | | 3,587 | | | | — | | | | 3,587 | | | | (16,107,836 | ) | | | (30,847,840 | ) |
The difference between the tax cost of investments and the cost of investments for GAAP purposes is primarily due to the tax treatment of wash sale losses.
As of September 30, 2023, the Funds had accumulated capital loss carryovers of:
| | | Capital Loss
Carryforward
ST | | | Capital Loss
Carryforward
LT | | | Expires | |
| ETFMG Prime Cyber Security ETF | | $ | (173,594,335 | ) | | $ | (136,666,850 | ) | | Indefinite | |
| ETFMG Prime Mobile Payments ETF | | | (82,730,261 | ) | | | (171,177,318 | ) | | Indefinite | |
| ETFMG Treatments, Testing and Advancements ETF | | | (5,093,526 | ) | | | (11,014,310 | ) | | Indefinite | |
Under current tax law, capital and currency losses realized after October 31 of a Fund’s fiscal year may be deferred and treated as occurring on the first business day of the following fiscal year for tax purposes. The following Funds had deferred post-October capital and currency losses, which will be treated as arising on the first business day of the year ending September 30, 2023.
| | | | Late Year
Ordinary Loss | | | | Post- October
Capital Loss | |
| ETFMG Prime Cyber Security ETF | | $ | — | | | $ | — | |
| ETFMG Prime Mobile Payments ETF | | | — | | | | — | |
| ETFMG Treatments, Testing and Advancements ETF | | | — | | | | — | |
U.S. GAAP requires that certain components of net assets relating to permanent differences be reclassified between financial and tax reporting. These reclassifications have no effect on net assets or net asset value per share. For the fiscal year ended September 30, 2023, the following table shows the reclassifications made:
| | | Total
Distributable
Earnings/(Loss) | | | Paid-In
Capital | |
| ETFMG Prime Cyber Security ETF | | $ | (45,048,100 | ) | | $ | 45,048,100 | |
| ETFMG Prime Mobile Payments ETF | | | (1,774,347 | ) | | | 1,774,347 | |
| ETFMG Treatments, Testing and Advancements ETF | | | (482,132 | ) | | | 482,132 | |
NOTES TO FINANCIAL STATEMENTS
September 30, 2023
The tax charter of distributions paid during the year ended September 30, 2023, and the year ended September 30, 2022, were as follows:
| | | Year Ended
September 30, 2023 | | | Year Ended
September 30, 2022 | |
| | | From
Ordinary
Income | | | From
Capital
Gains | | | From
Ordinary
Income | | | From
Capital
Gains | |
| ETFMG Prime Cyber Security ETF | | $ | 3,006,286 | | | $ | — |
| | $ | 2,222,505 | | | $ | — | |
| ETFMG Prime Mobile Payments ETF | | | — | | | | — | | | | — | | | | — | |
| ETFMG Treatments, Testing and Advancements ETF | | | 192,053 | | | | — | | | | 119,444 | | | | — | |
NOTE 9 – INVESTMENTS IN AFFILIATES
ETFMG Prime Cyber Security ETF
ETFMG Prime Cyber Security ETF owned the following company during the year ended September 30, 2023. ETFMG Sit Ultra Short ETF was deemed to be an affiliate of the Fund as defined by the 1940 Act during the year ended September 30, 2023. Transactions during the year in this security was as follows:
| Security Name | | Value at
September 30,
2022 | | | Purchases | | | Sales | | | Realized
Gain
(Loss)(1) | | | Change in
Unrealized
Appreciation
(Depreciation) | | | Dividend
Income | | | Value at
September 30, 2023 | | | Ending
Shares | |
| ETFMG Sit Ultra Short ETF * . | | $ | 40,863,750 | | | | — | | | $ | 41,169,380 | | | $ | (1,164,772 | ) | | | 1,470,402 | | | | — | | | | — | | | | — | |
ETFMG Prime Mobile Payments ETF
ETFMG Prime Mobile Payments ETF owned the following company during the year ended September 30, 2023. ETFMG Sit Ultra Short ETF was deemed to be an affiliate of the Fund as defined by the 1940 Act during the year ended September 30, 2023. Transactions during the year in this security was as follows:
| Security Name | | Value at
September 30,
2022 | | | Purchases | | | Sales | | | Realized
Gain
(Loss)(1) | | | Change in
Unrealized
Appreciation
(Depreciation) | | | Dividend
Income | | | Value at
September 30, 2023 | | | Ending
Shares | |
| ETFMG Sit Ultra Short ETF * | | $ | 43,267,500 | | | $ | — | | | $ | 43,603,512 | | | $ | (1,403,005 | ) | | $ | 1,739,017 | | | $ | — | | | $ | — | | | | — | |
ETFMG Treatments, Testing and Advancements ETF
ETFMG Treatments, Testing and Advancements ETF owned the following company during the year ended September 30, 2023. ETFMG Sit Ultra Short ETF was deemed to be an affiliate of the Fund as defined by the 1940 Act during the year ended September 30, 2023. Transactions during the year in this security was as follows:
| Security Name | | Value at
September 30,
2022 | | Purchases | | | Sales | | | Realized
Gain
(Loss)(1) | | | Change in
Unrealized
Appreciation
(Depreciation) | | | Dividend
Income | | | Value at
September 30, 2023 | | | Ending
Shares | |
| ETFMG Sit Ultra Short ETF * | | $ | 1,201,875 | | $ | — | | | $ | 1,212,626 | | | $ | (31,349 | ) | | $ | 42,100 | | | $ | — | | | $ | — | | | | — | |
| * | No longer an affiliate as of September 30, 2023. |
| | 1 | Realized Losses include transactions in affiliated investments and affiliated in-kind redemptions |
NOTES TO FINANCIAL STATEMENTS
September 30, 2023
NOTE 10 – LEGAL MATTERS
The Trust, the Adviser, and certain officers and affiliated persons of the Adviser (together with the Adviser, the “Adviser Defendants”) were named as defendants in an action filed December 21, 2021, in the Superior Court of New Jersey, Union County, captioned PureShares, LLC, d/b/a PureFunds et al. v. ETF Managers Group, LLC et al., Docket No. UNN-C-152-21 (the “NJ Action”). The NJ Action asserted breach of contract and other tort claims and sought damages in unspecified amounts and injunctive relief. On May 25, 2022, the court in the NJ Action dismissed with prejudice all claims asserted against the Trust, as well as all contract claims and all except one tort claim asserted against the Adviser Defendants. With respect to the tort claim asserted against the Adviser Defendants, the parties stipulated and agreed to dismiss that claim without prejudice in May 2023.
The Adviser and certain of its affiliates have entered into a settlement agreement with the Securities and Exchange Commission (“SEC”) regarding certain alleged conflicts of interest arising in connection with ETFMG Alternative Harvest ETF’s (MJ) participation in the securities lending program administered by its prior custodian. Without admitting or denying the SEC’s findings, the Adviser and its parent company agreed to censures, to a cease-and-desist order, and to pay, jointly and severally, a civil penalty of $4 million. The settlement resolves the SEC’s investigation of the Adviser and its affiliates.
As of September 30, 2023, there were no adjustments made to the accompanying financial statements based on the above legal matters.
NOTE 11 – SUBSEQUENT EVENTS
In preparing these financial statements, the Funds have evaluated events and transactions for potential recognition or disclosure through the date the financial statements were issued.
The Board of the Trust has approved an Agreement and Plan of Reorganization (the “Agreement”) providing for the reorganization of the Target Funds into corresponding new funds (the “Acquiring Funds”), which is a newly created series of Amplify ETF Trust with similar investment objectives and the same fees and expenses as the corresponding Target Funds. The Reorganization is subject to certain conditions including approval by shareholders of the Target Funds. The following table shows shares of the Acquiring Funds that will be issued to shareholders of the corresponding Target Funds.
| Target Fund | Acquiring Fund |
| | ETFMG Prime Cyber Security ETF | Amplify Cybersecurity ETF |
| | ETFMG Prime Mobile Payments ETF | Amplify Mobile Payments ETF |
| | ETFMG Treatments, Testing and Advancements ETF | Amplify Treatments, Testing and |
| | | Advancements |
The proxy solicitation materials were filed with the SEC on October 13, 2023. The Joint Special Meeting of Shareholders is to be held on December 28, 2023.
Other than as disclosed, there were no other subsequent events requiring recognition or disclosure through the date the financial statements were issued.
Report of Independent Registered Public Accounting Firm
To the Board of Trustees of ETF Managers Trust
and the Shareholders of ETFMG Prime Cyber Security ETF, ETFMG Prime Mobile Payments ETF,
and ETFMG Treatments, Testing and Advancements ETF:
Opinion on the Financial Statements
We have audited the accompanying statements of assets and liabilities, including the schedules of investments of ETFMG Prime Cyber Security ETF, ETFMG Prime Mobile Payments ETF, and
ETFMG Treatments, Testing and Advancements ETF (collectively the “Funds”) (certain of the
Funds comprising ETF Managers Trust) as of September 30, 2023, the related statements of operations for the year then ended, the statements of changes in net assets for each of the two years in the period then ended, the financial highlights for each of the periods indicated therein, and the related notes (collectively referred to as the “financial statements”). In our opinion, the financial statements present fairly, in all material respects, the financial position of the Funds as of September 30, 2023, and the results of their operations for the year then ended, the changes in net assets for each of the two years in the period then ended, and the financial highlights for each of the periods indicated therein, in conformity with accounting principles generally accepted in the United States of America.
Basis for Opinion
These financial statements and financial highlights are the responsibility of the Funds’ management. Our responsibility is to express an opinion on these financial statements and financial highlights based on our audits. We are a public accounting firm registered with the Public Company Accounting Oversight Board (United States) (“PCAOB”) and are required to be independent with respect to the Funds in accordance with the U.S. federal securities laws and the applicable rules and regulations of the Securities and Exchange Commission and the PCAOB.
We conducted our audits in accordance with the standards of the PCAOB. Those standards require that we plan and perform the audits to obtain reasonable assurance about whether the financial statements and financial highlights are free of material misstatement, whether due to error or fraud. The Funds are not required to have, nor were we engaged to perform, an audit of their internal control over financial reporting. As part of our audits we are required to obtain an understanding of internal control over financial reporting but not for the purpose of expressing an opinion on the effectiveness of the Funds’ internal control over financial reporting. Accordingly, we express no such opinion.
Our audits included performing procedures to assess the risks of material misstatement of the financial statements and financial highlights, whether due to error or fraud, and performing procedures that respond to those risks. Such procedures included examining, on a test basis, evidence regarding the amounts and disclosures in the financial statements and financial highlights. Our audits also included evaluating the accounting principles used and significant estimates made by management, as well as evaluating the overall presentation of the financial statements and financial highlights. Our procedures included confirmation of securities owned as of September 30, 2023 by correspondence with the custodian. We believe that our audits provide a reasonable basis for our opinion.
/s/WithumSmith+Brown, PC
We have served as the auditor of one or more series of the Trust since 2013.
New York, New York
November 29, 2023
ETFMG™ ETFs
EXPENSE EXAMPLES
Six Months Ended September 30, 2023 (Unaudited)
As a shareholder of the Funds you incur two types of costs: (1) transaction costs, including brokerage commissions on purchases and sales of Fund shares, and (2) ongoing costs, including management fees and other Fund expenses. These examples are intended to help you understand your ongoing costs (in dollars) of investing in the Funds and to compare these costs with the ongoing costs of investing in other funds. The examples are based on an investment of $1,000 invested for the period of time as indicated in the table below.
Actual Expenses
The first line of the table provides information about actual account values based on actual returns and actual expenses. You may use the information in this line, together with the amount you invested, to estimate the expenses that you paid over the period. Simply divide your account value by $1,000 (for example, an $8,600 account value divided by $1,000 = 8.6), then, multiply the result by the number in the first line under the heading entitled “Expenses Paid During Period” to estimate the expenses you paid on your account during this period.
Hypothetical Example for Comparison Purposes
The second line of the table provides information about hypothetical account values based on a hypothetical return and hypothetical expenses based on the Fund’s actual expense ratio and an assumed rate of return of 5% per year before expenses, which is not the Fund’s actual return. The hypothetical account values and expenses may not be used to estimate the actual ending account balance or expenses you paid for the period. You may use this information to compare the ongoing costs of investing in the Fund and other funds. To do so, compare this 5% hypothetical example with the 5% hypothetical examples that appear in the shareholder reports of the other funds. Please note that the expenses shown in the table are meant to highlight your ongoing costs only and do not reflect any transactional costs, such as brokerage commissions paid on purchases and sales of Fund shares. Therefore, the second line of the table is useful in comparing ongoing costs only and will not help you determine the relative total costs of owning different funds. If these transactional costs were included, your costs would have been higher.
| Fund Name | | Beginning
Account
Value
April 1,
2023 | | | Ending
Account
Value
September 30, 2023 | | | Expenses
Paid
During
the
Period^ | | | Annualized
Expense
Ratio
During the
Period
April 1,
2023 to
September 30, 2023 | |
| ETFMG Prime Cyber Security ETF | | | | | | | | | | | | | | | | |
| Actual | | $ | 1,000.00 | | | $ | 1,078.50 | | | $ | 3.13 | | | | 0.60 | % |
| Hypothetical (5% annual) | | | 1,000.00 | | | | 1,022.06 | | | | 3.04 | | | | 0.60 | % |
| ETFMG Prime Mobile Payments ETF | | | | | | | | | | | | | | | | |
| Actual | | | 1,000.00 | | | | 939.50 | | | | 3.65 | | | | 0.75 | % |
| Hypothetical (5% annual) | | | 1,000.00 | | | | 1,021.31 | | | | 3.80 | | | | 0.75 | % |
| ETFMG Treatments, Testing and Advancements ETF | | | | | | | | | | | | | | | | |
| Actual | | | 1,000.00 | | | | 857.30 | | | | 3.17 | | | | 0.68 | % |
| Hypothetical (5% annual) | | | 1,000.00 | | | | 1,021.66 | | | | 3.45 | | | | 0.68 | % |
| ^ | The dollar amounts shown as expenses paid during the period are equal to the annualized six-month expense ratio multiplied by the average account value during the period, multiplied by 183/365 (to reflect the one-half year period). |
ETFMG™ ETFs
Board of Trustees
Set forth below are the names, birth years, positions with the Trust, length of term of office, and the principal occupations and other directorships held during at least the last five years of each of the persons currently serving as a Trustee of the Trust, as well as information about each officer. The business address of each Trustee and officer is 30 Maple Street, 2nd Floor, Summit, New Jersey 07901. The SAI includes additional information about Fund directors and is available, without charge, upon request by calling 1-844-ETF-MGRS (1-844-383-6477).
| Name and Year of Birth | Position(s)
Held with the
Trust, Term of
Office and
Length of
Time Served | Principal Occupation(s)
During Past 5 Years | Number of
Portfolios in
Fund
Complex
Overseen By
Trustee | Other
Directorships
Held by
Trustee
During Past 5
Years |
| Interested Trustee and Officers | | | |
Michael Minella
(1971) | President (since 2023) | Senior Principal Consultant, ACA Group (since 2022); Vice President and Director, Fidelity Investments (2009-2022). | n/a | n/a |
John A. Flanagan
(1946) | Treasurer (since 2015) | President, John A. Flanagan CPA, LLC (accounting services) (since 2010); Treasurer, ETF Managers Trust (since 2015); Chief Financial Officer, ETF Managers Capital, LLC (commodity pool operator) (since 2015). | n/a | Independent Trustee - Absolute Shares Trust (since 2014) (4 portfolios) |
Kevin Hourihan
(1978) | Chief Compliance Officer (since 2022) | Senior Principal Consultant, Fund Chief Compliance Officer, ACA Global, LLC (since 2022); Chief Compliance Officer, Ashmore Funds (2017 -2022); Chief Compliance Officer, Ashmore Investment Management (US) Corp (2014-2022); Chief Compliance Officer, Ashmore Equities Investment Management (2015- 2019). | n/a | n/a |
Matthew J. Bromberg
(1973) | Secretary (since 2023) | Chief Compliance Officer and Chief Compliance Officer of ETF Managers Group, LLC (since 2022); General Counsel and Secretary of Exchange Traded Managers Group LLC (since 2020); ETF Managers Group LLC (since 2020); ETFMG Financial LLC (since 2020); ETF Managers Capital LLC (since 2020); Partner of Dorsey & Whitney LLP (law firm) (2019-2020); General Counsel of WBI Investments, Inc. (2016-2019); Millington Securities, Inc. (2016-2019). | n/a | n/a |
ETFMG™ ETFs
Board of Trustees (Continued)
| Name and Year of Birth | Position(s)
Held with the
Trust, Term of
Office and
Length of
Time Served | Principal Occupation(s)
During Past 5 Years | Number of
Portfolios in
Fund
Complex
Overseen By
Trustee | Other
Directorships
Held by
Trustee
During Past 5
Years |
Terry Loebs
(1963) | Chairman of the Board (since 2023)- Trustee (since 2014); Lead Independent Trustee (since 2020) | Founder and Managing Member, Pulsenomics LLC (index product development and consulting firm) (since 2011); Managing Director, MacroMarkets, LLC (exchange- traded products firm) (2006- 2011). | 12 | None |
Eric Wiegel
(1960) | Trustee (since 2020) | Managing Partner, Global Focus Capital LLC (since 2013); Senior Portfolio Manager, Little Hourse Capital (2019-2021); Chief Investment Officer, Insight Financial Strategist LLC (2017- 2018). | 12 | None |
ETFMG™ ETFs
SUPPLEMENTARY INFORMATION
September 30, 2023 (Unaudited)
NOTE 1 – FREQUENCY DISTRIBUTION OF PREMIUMS AND DISCOUNTS
Information regarding how often shares of each Fund traded on the Exchange at a price above (i.e., at a premium) or below (i.e., at a discount) the NAV is available on the Fund’s website at www.etfmgfunds.com.
NOTE 2 – FEDERAL TAX INFORMATION
Qualified Dividend Income/Dividends Received Deduction
For the fiscal year ended September 30, 2023, certain dividends paid by the Funds may be subject to a maximum tax rate of 15%, as provided for by the Jobs and Growth Tax Reconciliation Act of 2003. The percentage of dividends declared from ordinary income designated as qualified dividend income was as follows:
| Fund Name | | Qualified
Dividend Income | |
| | | | | |
| ETFMG Prime Cyber Security ETF | | | 100.00 | % |
| ETFMG Prime Mobile Payments ETF | | | 0.00 | % |
| ETFMG Treatments, Testing and Advancements ETF | | | 100.00 | % |
For corporate shareholders, the percent of ordinary income distributions qualifying for the corporate dividends received deduction for the fiscal year ended September 30, 2023 was as follows:
| Fund Name | | Dividends
Received Deduction | |
| | | | | |
| ETFMG Prime Cyber Security ETF | | | 100.00 | % |
| ETFMG Prime Mobile Payments ETF | | | 0.00 | % |
| ETFMG Treatments, Testing and Advancements ETF | | | 99.10 | % |
Short Term Capital Gain
The percentage of taxable ordinary income distributions that are designated as short-term capital gain distributions under Internal Revenue Section 871 (k)(2)(C) for each Fund were as follows:
| Fund Name | | Short-Term Capital
Gain | |
| | | | | |
| ETFMG Prime Cyber Security ETF | | | 0.00 | % |
| ETFMG Prime Mobile Payments ETF | | | 0.00 | % |
| ETFMG Treatments, Testing and Advancements ETF | | | 0.00 | % |
NOTE 3 – INFORMATION ABOUT PORTFOLIO HOLDINGS
The Funds file their complete schedule of portfolio holdings for their first and third fiscal quarters with the Securities and Exchange Commission (“SEC”) on Part F of Form N-PORT. The Funds’ Part F of Form N-PORT is available on the website of the SEC at www.sec.gov and the Funds’ website at www.etfmgfunds.com. Each Fund’s portfolio holdings are posted on their website at www.etfmgfunds.com daily.
ETFMG™ ETFs
ETF MANAGERS TRUST
Privacy Policy and Procedures
NOTE 4 – INFORMATION ABOUT PROXY VOTING
A description of the policies and procedures the Funds use to determine how to vote proxies relating to portfolio securities is provided in the Statement of Additional Information (“SAI”). The SAI is available without charge upon request by calling toll-free at (877) 756-7873, by accessing the SEC’s website at www.sec.gov, or by accessing the Funds’ website at www.etfmgfunds.com.
Information regarding how the Funds voted proxies relating to portfolio securities during the period ending June 30 is available by calling toll-free at (877) 756-7873 or by accessing the SEC’s website at www.sec.gov.
Carefully consider the Fund’s investment objectives, risk factors, charges, and expenses before investing. This and additional information can be found in the Fund’s prospectus, which may be obtained by calling 1-844-ETF-MGRS (1-844-383-6477) or by visiting www.etfmgfunds.com. This report must be preceded or accompanied by a prospectus.
ETFMG™ ETFs
ETF MANAGERS TRUST
Privacy Policy and Procedures
ETF Managers Trust, (the “Trust”) has adopted the following privacy policies in order to safeguard the personal information of the Trust’s customers and consumers in accordance with Regulation S-P as promulgated by the U.S. Securities and Exchange Commission.
Trust officers are responsible or ensuring that the following policies and procedures are implemented:
1) The Trust is committed to protecting the confidentiality and security of the information they collect and will handle personal customer and consumer information only in accordance with Regulation S-P and any other applicable laws, rules and regulations1. The Trust will ensure: (a) the security and confidentiality of customer records and information; (b) that customer records and information are protected from any anticipated threats and hazards; and (c) that customer records and information are protected from unauthorized access or use.
2) The Trust conducts its business affairs through its trustees, officers and third parties that provide services pursuant to agreements with the Trust. The Trust has no employees. It is anticipated that the trustees and officers of the Trust who are not employees of service providers of the Trust will not have access to customer records and information in the performance of their normal responsibilities for the Trust.
3) The Trust may share customer information with its affiliates, subject to the customers’ right to prohibit such sharing.
4) The Trust may share customer information with unaffiliated third parties only in accordance with the requirements of Regulation S-P. Pursuant to this policy, the Trust will not share customer information with unaffiliated third parties other than as permitted by law, unless authorized to do so by the customer.
Consistent with these policies, the Trust has adopted the following procedures:
1) The Trust will determine that the policies and procedures of its affiliates and Service Providers are reasonably designed to safeguard customer information and only permit appropriate and authorized access to and use of customer information through the application of appropriate administrative, technical and physical protections.
2) The Trust will direct each of its Service Providers to adhere to the privacy policy of the Trust and to its privacy policies with respect to all customer information of the Trust and to take all actions reasonably necessary so that the Trust is in compliance with the provisions of Regulation S-P, including, as applicable, the development and delivery of privacy notices and the maintenance of appropriate and adequate records.
3) The Trust requires its Service Providers to provide periodic reports to the Trust’s Board of Trustees outlining their privacy policies and the implementation of such policies. Each Service Provider is required to promptly report to the Trust’s Board any material changes to its privacy policy before, or promptly after, the adoption of such changes.
| (1) | Generally, the Funds have institutional clients which are not considered “customers” for purposes of regulation S-P. |
Advisor
ETF Managers Group, LLC
350 Springfield Ave., Suite 200, Summit, NJ 07901
Distributor
Foreside Fund Services LLC
Three Canal Plaza, Suite 100, Portland, Maine 04101
Custodian
U.S. Bank National Association
Custody Operations
1555 North River Center Drive, Suite 302, Milwaukee, Wisconsin 53212
Transfer Agent
U.S. Bancorp Fund Services, LLC doing business as U.S. Bank Global Fund Services
615 East Michigan Street, Milwaukee, Wisconsin 53202
Securities Lending Agent
U.S. Bank, National Association
Securities Lending
800 Nicolet Mall
Minneapolis, MN 55402-7020
Independent Registered Public Accounting Firm
WithumSmith + Brown, PC
1411 Broadway, 9th Floor, New York, NY 10018
Legal Counsel
Sullivan & Worcester LLP
1666 K Street NW, Washington, DC 20006

Annual Report
September 30, 2023
BlueStar Israel Technology ETF
Ticker: ITEQ

The fund is a series of ETF Managers Trust.
BlueStar Israel Technology ETF
TABLE OF CONTENTS
September 30, 2023
BlueStar Israel Technology ETF
Dear Shareholder,
On behalf of the entire team, we want to express our appreciation for the confidence you have placed in the BlueStar Israel Technology ETF (the “Fund”). The following information pertains to the fiscal period from October 1, 2022 to September 30, 2023 (the “Annual Period”).
Market Overview
General Overview
The U.S. economy performed better than expected despite persistent inflationary pressure, rising interest rates and geo-political conflict during the Annual Period.
Early in the Annual Period, inflation had risen sharply because of supply chain disruptions, high food and energy prices and the Russia-Ukraine war, reaching its peak level, just prior to the Annual Period, in September 2022. In the first quarter of 2023, U.S. equities managed to deliver gains, despite the significant volatility. The January rally, however, gave way to a February sell off as higher-than-expected inflation, a tight labor market and solid economic growth indicated that the U.S. Federal Reserve’s (Fed) monetary policy would remain tight for the foreseeable future. One of the most significant impacts occurred in the banking sector in March 2023, when Silicon Valley Bank, Signature Bank, and First Republic Bank, among others, failed. In the same month, Swiss bank UBS agreed to buy Credit Suisse, considered vulnerable in the then current environment.
In the second quarter of 2023, the economy grew at an annualized rate of 2.1%, according to the third estimate from the U.S. Bureau of Economic Analysis, compared to 2.2% in the first quarter and in line with 2.1% in 2022 overall. Since then, price pressures have eased given normalization in supply chains, falling energy prices and aggressive measures by the Fed and other global central banks to tighten financial conditions and slow demand in their economies. Nevertheless, during the Annual Period inflation levels remained much higher than central banks’ target levels, with the Fed raising its target fed funds rate six times during the Annual Period, bringing it to a range of 5.25% to 5.50% as of July 2023. As of August 2023, the unemployment rate was 3.8%, near its pre-pandemic low, although monthly job growth continued to be moderate. In September 2023, the Fed’s policy committee voted to hold the rate steady.
As the U.S. Congress neared its September 30, 2023, deadline to approve federal funding, investor concerns about a potential government shutdown and the impact this could have on the U.S. economy increased. The shutdown, however, was averted because of a Continuing Resolution which temporarily kept the government open for forty-five more days. Despite higher rates and increased market volatility, U.S. stocks for the Annual Period had strong returns of 21.62%, as measured by the S&P 500 Index.
Israel-Hamas War
After the end of the Annual Period, on October 7, 2023, Hamas, a U.S. designated Foreign Terrorist Organization, attacked Israel, with Israel then declaring war on Hamas in the Gaza Strip. This conflict has stoked fears of instability in the Middle East and globally. Escalation or expansion of hostilities, interventions by other groups or nations could lead to increased instability and market volatility. The conflict may also have a material negative impact on, and creates meaningful risk of potential future impacts, on companies that have direct or indirect business operations, interests or investments in the Israel and the Middle East, or business relationships with companies that do, including Israeli technology companies, the stocks of which are held by the Fund.
These conditions have impacted the performance of the Fund during the Annual Period, among other factors, and the value of an investment in the Fund. We encourage you to talk with your financial advisor and visit etfmg.com for further insight into investing in today’s markets.
Performance Overview
The Fund seeks to provide investment results that, before fees and expenses, correspond generally to the price and yield performance of the BlueStar Israel Global Technology Index (the “Index”).
Over the Annual Period, the total return for the Fund was -6.12% while the total return for the Index was -5.68%. The difference was primarily attributable to Fund expenses that are not borne by the Index. The best performers in the Fund, on the basis of contribution to its return, were Camtek Ltd., Pagaya Technologies Ltd., Taboola.com Ltd., Cellebrite Di Ltd., and Perion Network Ltd., while the worst performers were Novocure Ltd., Innoviz Technologies Ltd., Oramed Pharmaceuticals Inc., Liveperson Inc., and Audiocodes Ltd.
At the end of the Annual Period, the Fund saw an approximate allocation of 67.57% to the Information Technology sector, 8.01% to Health Care and 7.94% to Industrials. The portfolio holdings of the Fund were exposed predominately to Israel at 52.51% and the United States at 46.46%, followed by the United Kingdom at 0.57%.
We continue to believe that Israeli companies play an essential role in the global high technology value chain. Most technology users, from online shoppers to Fortune 500 companies, use Israeli technology applications and solutions every day without ever being aware of it. From cybersecurity and defense to clean energy and agriculture, Israeli innovations power some of the biggest names in the technology industry today.
There is much ahead for Israeli Technology companies, and we are thankful you have joined us. You can find further details about ITEQ by visiting www.etfmg.com, or by calling 1-844-ETF-MGRS. (1-844-383-6477).
Sincerely,

John A. Flanagan
Principal Financial Officer
Average Annual Returns
Year Ended September 30, 2023 | |
1 Year
Return | | |
5 Year
Return | | | Since
Inception
(11/2/2015) | | | Value of
$10,000
(9/30/2023) | |
| BlueStar Israel Technology ETF (NAV) | | | -6.12 | % | | | 2.95 | % | | | 6.79 | % | | $ | 16,822 | |
| BlueStar Israel Technology ETF (Market) | | | -5.78 | % | | | 2.92 | % | | | 6.78 | % | | $ | 16,805 | |
| S&P 500 Index | | | 21.62 | % | | | 9.92 | % | | | 11.47 | % | | $ | 23,605 | |
| BlueStar Israel Global Technology IndexTM | | | -5.68 | % | | | 3.54 | % | | | 7.48 | % | | $ | 17,694 | |
Performance data quoted represents past performance and does not guarantee future results. The investment return and principal value of an investment will fluctuate so that an investor’s shares, when redeemed, may be worth more or less than their original cost. Current performance of the Fund may be lower or higher than the performance quoted. All performance is historical and includes reinvestment of dividends and capital gains. Performance data current to the most recent month end may be obtained by calling 1-844-ETF-MGRS (1-844-383-6477).
The chart illustrates the performance of a hypothetical $10,000 investment made on November 2, 2015, and is not intended to imply any future performance. The returns shown do not reflect the deduction of taxes that a shareholder would pay on fund distributions from the sales of Fund shares. The chart assumes reinvestment of capital gains and dividends, if any. The Index Returns do not reflect fees or expenses and are not available for direct investment.
BlueStar Israel Technology ETF
Top Ten Holdings as of September 30, 2023 (Unaudited)*
| | | | | % of Total | |
| | | Security | | Investments | |
| 1 | | Check Point Software Technologies, Ltd. | | | 7.58% | % |
| 2 | | Amdocs, Ltd. | | | 6.37% | % |
| 3 | | CyberArk Software, Ltd. | | | 6.02% | % |
| 4 | | Nice, Ltd. – ADR | | | 5.62% | % |
| 5 | | Elbit Systems, Ltd. | | | 4.24% | % |
| 6 | | Wix.com, Ltd. | | | 3.66% | % |
| 7 | | Monday.com, Ltd. | | | 3.63% | % |
| 8 | | SolarEdge Technologies, Inc. | | | 3.15% | % |
| 9 | | SentinelOne, Inc. - Class A | | | 3.03% | % |
| 10 | | Ormat Technologies, Inc. | | | 2.50% | % |
Top Ten Holdings = 45.80% of Total Investments
* Current Fund holdings may not be indicative of future Fund holdings.
BlueStar Israel Technology ETF
Important Disclosures and Key Risk Factors
Investing involves risk, including the possible loss of principal. Shares of any ETF are bought and sold at market price (not NAV), may trade at a discount or premium to NAV and are not individually redeemed from the Fund. Brokerage commissions will reduce returns. Narrowly focused investments typically exhibit higher volatility.
Past performance is not indicative of future return. A fund’s performance for very short time periods may not be indicative of future performance.
ITEQ
The BlueStar Israel Technology ETF (the “Fund”) seeks to provide investment results that, before fees and expenses, correspond generally to the price and yield performance of the BlueStar Israel Global Technology Index (the “Index”).
The Fund invests in Israeli companies. Foreign investing involves special risks such as currency fluctuations and political uncertainty. Funds that invest in smaller companies may experience greater volatility. Funds that emphasize investments in technology generally will experience greater price volatility. The Fund is non-diversified, meaning it may concentrate its assets in fewer individual holdings than a diversified fund.
ETF shares are not individually redeemable, and owners of the shares may acquire those shares from the Fund and tender those shares for redemption to the Fund in Creation Units only, in blocks of 50,000 shares.
Unlike with an actively managed fund, the Fund’s adviser does not use techniques or defensive strategies designed to lessen the effects of market volatility or to reduce the impact of periods of market decline. This means that, based on market and economic conditions, the Fund’s performance could be lower than other types of funds that may actively shift their portfolio assets to take advantage of market opportunities or to lessen the impact of a market decline.
Natural or environmental disasters, such as earthquakes, fires, floods, hurricanes, tsunamis and other severe weather-related phenomena generally, and widespread disease, including pandemics and epidemics, have been and may be highly disruptive to economies and markets, adversely impacting individual companies, sectors, industries, markets, currencies, interest and inflation rates, credit ratings, investor sentiment, and other factors affecting the value of the Fund’s investments. Given the increasing interdependence among global economies and markets, conditions in one country, market, or region are increasingly likely to adversely affect markets, issuers, and/or foreign exchange rates in other countries, including the U.S. Any such events could have a significant adverse impact on the value of the Fund’s investments.
Additionally, natural or environmental disasters, widespread disease or other public health issues, war, acts of terrorism or other events could result in increased premiums or discounts to the Fund’s NAV.
Effective, August 14, 2023, the Fund is distributed by Foreside Fund Services LLC. ETF Managers Group LLC is a wholly owned subsidiary of Exchange Traded Managers Group LLC (collectively, “ETFMG”).
BlueStar Israel Technology ETF
PORTFOLIO ALLOCATIONS
As of September 30, 2023 (Unaudited)
| | | BlueStar Israel Technology ETF | |
| As a percent of Net Assets: | | | | |
| Cayman Islands | | | 1.1 | % |
| Gibraltar | | | 0.7 | |
| Guernsey | | | 7.5 | |
| Israel | | | 69.2 | |
| Jersey | | | 0.8 | |
| Luxembourg | | | 0.7 | |
| United States | | | 19.5 | |
| Short-Term and other Net Assets (Liabilities) | | | 0.5 | |
| | | | 100.0 | % |
BlueStar Israel Technology ETF
Schedule of Investments
September 30, 2023
| | | Shares | | | Value | |
| COMMON STOCKS - 99.5% | | | | | | | | |
| Cayman Islands - 1.1% | | | | | | | | |
| Software - 1.1% (d) | | | | | | | | |
| Sapiens International Corp. NV | | | 35,343 | | | $ | 1,004,801 | |
| | | | | | | | | |
| Gibraltar - 0.7% | | | | | | | | |
| Hotels, Restaurants & Leisure - 0.7% | | | | | | | | |
| 888 Holdings PLC (a) | | | 538,337 | | | | 658,143 | |
| | | | | | | | | |
| Guernsey - 7.5% | | | | | | | | |
| IT Services - 7.5% | | | | | | | | |
| Amdocs, Ltd. | | | 78,977 | | | | 6,672,766 | |
| | | | | | | | | |
| Israel - 69.2% | | | | | | | | |
| Aerospace & Defense - 5.0% | | | | | | | | |
| Elbit Systems, Ltd. (b) | | | 22,440 | | | | 4,442,671 | |
| Communications Equipment - 1.7% | | | | | | | | |
| Gilat Satellite Networks, Ltd. (a) | | | 86,476 | | | | 556,041 | |
| Radware, Ltd. (a) | | | 39,042 | | | | 660,590 | |
| Silicom, Ltd. (a) | | | 11,315 | | | | 295,322 | |
| Total Communications Equipment | | | | | | | 1,511,953 | |
| Electronic Equipment, Instruments & Components - 0.4% | | | | | | | | |
| Innoviz Technologies, Ltd. (a)(b) | | | 180,512 | | | | 351,998 | |
| Financial Services - 1.5% | | | | | | | | |
| Plus500, Ltd. | | | 80,209 | | | | 1,347,581 | |
| Health Care Equipment & Supplies - 3.6% | | | | | | | | |
| Alpha Tau Medical, Ltd. (a)(b) | | | 35,577 | | | | 134,837 | |
| Inmode, Ltd. (a) | | | 77,444 | | | | 2,358,945 | |
| Nano-X Imaging, Ltd. (a)(b) | | | 61,170 | | | | 401,275 | |
| Sisram Medical, Ltd. (e) | | | 338,222 | | | | 271,236 | |
| Total Health Care Equipment & Supplies | | | | | | | 3,166,293 | |
| Household Durables - 0.6% | | | | | | | | |
| Maytronics, Ltd. | | | 55,060 | | | | 577,843 | |
| Independent Power and Renewable Electricity Producers - 2.5% | | | | | | | | |
| Energix-Renewable Energies, Ltd. | | | 260,730 | | | | 768,321 | |
| Enlight Renewable Energy, Ltd. (a) | | | 90,254 | | | | 1,421,607 | |
| Total Independent Power and Renewable Electricity Producers | | | | | | | 2,189,928 | |
| Interactive Media & Services - 1.1% | | | | | | | | |
| Taboola.com, Ltd. (a) | | | 266,958 | | | | 1,011,771 | |
| IT Services - 6.4% | | | | | | | | |
| Formula Systems 1985, Ltd. | | | 8,524 | | | | 627,964 | |
| Matrix IT, Ltd. | | | 33,827 | | | | 691,741 | |
| One Software Technologies, Ltd. | | | 40,097 | | | | 504,695 | |
| Wix.com, Ltd. (a) | | | 41,716 | | | | 3,829,529 | |
| Total IT Services | | | | | | | 5,653,929 | |
| Machinery - 0.9% | | | | | | | | |
| Kornit Digital, Ltd. (a) | | | 39,997 | | | | 756,343 | |
| Media - 2.0% | | | | | | | | |
| Perion Network, Ltd. (a) | | | 49,672 | | | | 1,521,453 | |
| Tremor International, Ltd. (a) | | | 135,947 | | | | 239,350 | |
| Total Media | | | | | | | 1,760,803 | |
| Professional Services - 1.8% | | | | | | | | |
| Fiverr International, Ltd. (a) | | | 36,289 | | | | 887,992 | |
| Hilan, Ltd. | | | 13,963 | | | | 722,988 | |
| Total Professional Services | | | | | | | 1,610,980 | |
The accompanying notes are an integral part of these financial statements.
BlueStar Israel Technology ETF
Schedule of Investments
September 30, 2023 (Continued)
| | | Shares | | | Value | |
| Semiconductors & Semiconductor Equipment - 7.3% | | | | | | | | |
| Camtek, Ltd. (a) | | | 30,129 | | | $ | 1,875,832 | |
| Nova, Ltd. (a) | | | 18,327 | | | | 2,060,688 | |
| Tower Semiconductor, Ltd. (a) | | | 104,576 | | | | 2,568,386 | |
| Total Semiconductors & Semiconductor Equipment | | | | | | | 6,504,906 | |
| Software - 32.4% (d) | | | | | | | | |
| Cellebrite DI, Ltd. (a)(b) | | | 70,415 | | | | 538,675 | |
| Check Point Software Technologies, Ltd. (a) | | | 59,594 | | | | 7,942,688 | |
| Cognyte Software, Ltd. (a) | | | 93,301 | | | | 448,778 | |
| CyberArk Software, Ltd. (a) | | | 38,501 | | | | 6,305,309 | |
| JFrog, Ltd. (a) | | | 76,964 | | | | 1,951,807 | |
| Magic Software Enterprises, Ltd. | | | 28,861 | | | | 326,647 | |
| Monday.com, Ltd. (a)(b) | | | 23,883 | | | | 3,802,651 | |
| Nice, Ltd. - ADR (a)(b) | | | 34,608 | | | | 5,883,360 | |
| Pagaya Technologies, Ltd. - Class A (a)(b) | | | 355,238 | | | | 561,276 | |
| Riskified, Ltd. (a) | | | 112,751 | | | | 505,124 | |
| WalkMe, Ltd. (a) | | | 49,645 | | | | 470,635 | |
| Total Software | | | | | | | 28,736,950 | |
| Technology Hardware, Storage & Peripherals - 2.0% | | | | | | | | |
| Nano Dimension, Ltd. - ADR (a)(b) | | | 317,298 | | | | 863,051 | |
| Stratasys, Ltd. (a)(b) | | | 65,891 | | | | 896,776 | |
| Total Technology Hardware, Storage & Peripherals | | | | | | | 1,759,827 | |
| Total Israel | | | | | | | 61,383,776 | |
| | | | | | | | | |
| Jersey - 0.8% | | | | | | | | |
| Health Care Equipment & Supplies - 0.8% | | | | | | | | |
| Novocure, Ltd. (a) | | | 44,961 | | | | 726,120 | |
| | | | | | | | | |
| Luxembourg - 0.7% | | | | | | | | |
| Hotels, Restaurants & Leisure - 0.7% | | | | | | | | |
| NEOGAMES SA (a) | | | 22,335 | | | | 603,045 | |
| | | | | | | | | |
| United States - 19.5% | | | | | | | | |
| Aerospace & Defense - 1.2% | | | | | | | | |
| Leonardo DRS, Inc. (a)(b) | | | 61,937 | | | | 1,034,348 | |
| Auto Components - 2.5% | | | | | | | | |
| Mobileye Global, Inc. - Class A (a)(b) | | | 52,489 | | | | 2,180,918 | |
| Biotechnology - 0.4% | | | | | | | | |
| Lineage Cell Therapeutics, Inc. (a) | | | 307,593 | | | | 362,959 | |
| Pluri, Inc. (a) | | | 1 | | | | 1 | |
| Total Biotechnology | | | | | | | 362,960 | |
| Electronic Equipment, Instruments & Components - 0.6% | | | | | | | | |
| Vishay Precision Group, Inc. (a) | | | 15,459 | | | | 519,114 | |
| Entertainment - 0.9% | | | | | | | | |
| Playtika Holding Corp. (a) | | | 86,117 | | | | 829,307 | |
| Financial Services - 1.4% | | | | | | | | |
| Payoneer Global, Inc. (a) | | | 206,258 | | | | 1,262,299 | |
| Independent Power and Renewable - 2.9% | | | | | | | | |
| Ormat Technologies, Inc. | | | 37,016 | | | | 2,614,401 | |
| Insurance - 0.9% | | | | | | | | |
| Lemonade, Inc. (a)(b) | | | 68,951 | | | | 801,211 | |
The accompanying notes are an integral part of these financial statements.
BlueStar Israel Technology ETF
Schedule of Investments
September 30, 2023 (Continued)
| | | Shares | | | Value | |
| Pharmaceuticals - 0.3% | | | | | | | | |
| Oramed Pharmaceuticals, Inc. (a)(b) | | | 98,571 | | | $ | 257,270 | |
| Semiconductors & Semiconductor Equipment - 4.3% | | | | | | | | |
| CEVA, Inc. (a) | | | 24,630 | | | | 477,576 | |
| SolarEdge Technologies, Inc. (a)(b) | | | 25,456 | | | | 3,296,806 | |
| Total Semiconductors & Semiconductor Equipment | | | | | | | 3,774,382 | |
| Software - 4.1% (d) | | | | | | | | |
| LivePerson, Inc. (a) | | | 115,898 | | | | 450,843 | |
| SentinelOne, Inc. - Class A (a)(b) | | | 188,224 | | | | 3,173,457 | |
| Total Software | | | | | | | 3,624,300 | |
| Total United States | | | | | | | 17,260,510 | |
| TOTAL COMMON STOCKS (Cost $123,678,667) | | | | | | | 88,309,161 | |
| | | | | | | | | |
| INVESTMENTS PURCHASED WITH PROCEEDS FROM SECURITIES LENDING COLLATERAL - 18.2% | | | | | | | | |
| Mount Vernon Liquid Assets Portfolio, LLC, 5.50% (c) | | | 16,123,144 | | | | 16,123,144 | |
| TOTAL INVESTMENTS PURCHASED WITH PROCEEDS FROM SECURITIES LENDING COLLATERAL (Cost $16,123,144) | | | | | | | 16,123,144 | |
| | | | | | | | | |
| SHORT-TERM INVESTMENTS - 0.4% | | | | | | | | |
| Money Market Funds - 0.4% | | | | | | | | |
| First American Government Obligations Fund - Class X, 5.26% (c) | | | 337,184 | | | | 337,184 | |
| TOTAL SHORT-TERM INVESTMENTS (Cost $337,184) | | | | | | | 337,184 | |
| | | | | | | | | |
| Total Investments (Cost $140,138,995) - 118.1% | | | | | | | 104,769,489 | |
| Liabilities in Excess of Other Assets - (18.1)% | | | | | | | (16,079,971 | ) |
| TOTAL NET ASSETS - 100.0% | | | | | | $ | 88,689,518 | |
Percentages are stated as a percent of net assets.
ADR American Depositary Receipt
PLC Public Limited Company
| (a) | Non-income producing security. |
| (b) | All or a portion of this security was out on loan at September 30, 2023. |
| (c) | The rate shown is the annualized seven-day yield at period end. |
| (d) | As of September 30, 2023 the Fund had a significant portion of its assets in the Software Industry. |
| (e) | Security exempt from registration pursuant to Rule 144A under the Securities Act of 1933, as amended. This security may be resold in transactions exempt from registration to qualified institutional investors. At September 30, 2023, the market value of these securities total $16,123,144, which represents 0.3% of total net assets. |
The Global Industry Classification Standard (GICS®) was developed by and/or is the exclusive property of MSCI, Inc. and Standard & Poor’s Financial Services LLC (“S&P”). GICS is a service mark of MSCI and S&P and has been licensed for use by U.S. Bancorp Fund Services, LLC, doing business as U.S. Bank Global Fund Services (“Fund Services”).
The accompanying notes are an integral part of these financial statements.
BlueStar Israel Technology ETF
STATEMENT OF ASSETS AND LIABILITIES
As of September 30, 2023
| | | BlueStar | |
| | | Israel | |
| | | Technology | |
| | | ETF | |
| ASSETS | | | | |
| Investments in securities, at value* | | $ | 104,769,489 | |
| Foreign currency* | | | 5,311 | |
| Receivables: | | | | |
| Dividends and interest receivable | | | 79,932 | |
| Securities lending income receivable | | | 14,674 | |
| Total Assets | | | 104,869,406 | |
| | | | | |
| LIABILITIES | | | | |
| Collateral received for securities loaned (Note 7) | | | 16,123,144 | |
| Payables: | | | | |
| Unitary fees payable | | | 56,744 | |
| Total Liabilities | | | 16,179,888 | |
| Net Assets | | $ | 88,689,518 | |
| | | | | |
| NET ASSETS CONSIST OF: | | | | |
| Paid-in capital | | $ | 156,312,646 | |
| Total distributable earnings (accumulated losses) | | | (67,623,128 | ) |
| Net Assets | | $ | 88,689,518 | |
| | | | | |
| *Identified Cost: | | | | |
| Investments in securities | | $ | 140,138,995 | |
| Foreign currency | | | 5,307 | |
| | | | | |
| Shares Outstanding^ | | | 2,150,000 | |
| Net Asset Value, Offering and Redemption Price per Share | | $ | 41.25 | |
| ^ | No par value, unlimited number of shares authorized |
The accompanying notes are an integral part of these financial statements.
BlueStar Israel Technology ETF
STATEMENT OF OPERATIONS
For the Year Ended September 30, 2023
| | | BlueStar | |
| | | Israel | |
| | | Technology | |
| | | ETF | |
| INVESTMENT INCOME | | | | |
| Income: | | | | |
| Dividends from securities (net of foreign withholdings tax and issuance fees of $71,272) | | $ | 382,789 | |
| Interest | | | 22,904 | |
| Securities lending income | | | 393,777 | |
| Total Investment Income | | | 799,470 | |
| | | | | |
| Expenses: | | | | |
| Unitary Fees | | | 794,780 | |
| Total Expenses | | | 794,780 | |
| Net Investment Income | | | 4,690 | |
| | | | | |
| REALIZED & UNREALIZED GAIN (LOSS) ON INVESTMENTS | | | | |
| Net Realized Gain (Loss) on: | | | | |
| Investments | | | (11,773,638 | ) |
| In-Kind redemptions | | | 4,241,240 | |
| Foreign currency and foreign currency translation | | | (5,998 | ) |
| Net Realized Loss on Investments and In-Kind Redemptions | | | (7,538,396 | ) |
| Net Change in Unrealized Appreciation/Depreciation of: | | | | |
| Investments | | | 2,306,167 | |
| Foreign currency and foreign currency translation | | | 407 | |
| Net Change in Unrealized Appreciation/Depreciation of Investments | | | 2,306,574 | |
| Net Realized and Unrealized Loss on Investments | | | (5,231,822 | ) |
| NET DECREASE IN NET ASSETS RESULTING FROM OPERATIONS | | $ | (5,227,132 | ) |
The accompanying notes are an integral part of these financial statements.
BlueStar Israel Technology ETF
STATEMENTS OF CHANGES IN NET ASSETS
| | | Year Ended | | | Year Ended | |
| | | September 30, | | | September 30, | |
| | | 2023 | | | 2022 | |
| OPERATIONS | | | | | | |
| Net investment income (loss) | | $ | 4,690 | | | $ | (144,422 | ) |
| Net realized gain (loss) on investments and in-kind redemptions | | | (7,538,396 | ) | | | 8,803,413 | |
| Net change in unrealized appreciation/depreciation of investments | | | 2,306,574 | | | | (69,063,455 | ) |
| Net decrease in net assets resulting from operations | | | (5,227,132 | ) | | | (60,404,464 | ) |
| | | | | | | | | |
| CAPITAL SHARE TRANSACTIONS | | | | | | | | |
| Net decrease in net assets derived from net change in outstanding shares | | | (22,526,210 | ) | | | (14,825,280 | ) |
| Net decrease in net assets | | | (27,753,342 | ) | | | (75,229,744 | ) |
| | | | | | | | | |
| NET ASSETS | | | | | | | | |
| Beginning of Year | | | 116,442,860 | | | | 191,672,604 | |
| End of Year | | $ | 88,689,518 | | | $ | 116,442,860 | |
Summary of share transactions is as follows:
| | | | Year Ended
September 30, 2023 | | | Year Ended
September 30, 2022 | |
| | | | Shares | | | Amount | | | Shares | | | Amount | |
| Shares Sold | | | | 50,000 | | | $ | 2,257,030 | | | | 700,000 | | | $ | 42,311,335 | |
| Shares Redeemed | | | | (550,000 | ) | | | (24,783,240 | ) | | | (950,000 | ) | | | (57,136,615 | ) |
| Net Transactions in Fund Shares | | | | (500,000 | ) | | $ | (22,526,210 | ) | | | (250,000 | ) | | $ | (14,825,280 | ) |
| | | | | | | | | | | | | | | | | | |
| Beginning Shares | | | | 2,650,000 | | | | | | | | | | | | 2,900,000 | |
| Ending Shares | | | | 2,150,000 | | | | | | | | | | | | 2,650,000 | |
The accompanying notes are an integral part of these financial statements.
BlueStar Israel Technology ETF
FINANCIAL HIGHLIGHTS
For a capital share outstanding throughout the year
| | | Year Ended | | | Year Ended | | | Year Ended | | | Year Ended | | | Year Ended | |
| | | September 30, | | | September 30, | | | September 30, | | | September 30, | | | September 30, | |
| | | 2023 | | | 2022 | | | 2021 | | | 2020 | | | 2019 | |
| Net Asset Value, Beginning of Year | | $ | 43.94 | | | $ | 66.09 | | | $ | 55.57 | | | $ | 39.92 | | | $ | 36.03 | |
| Income (Loss) from Investment Operations: | | | | | | | | | | | | | | | | | | | | |
| Net investment income (loss)1 | | | 0.00 | 2 | | | (0.05 | ) | | | (0.01 | ) | | | (0.06 | ) | | | (0.04 | ) |
| Net realized and unrealized gain (loss) on investments | | | (2.69 | ) | | | (22.10 | ) | | | 10.97 | | | | 15.71 | | | | 4.03 | |
| Total from investment operations | | | (2.69 | ) | | | (22.15 | ) | | | 10.96 | | | | 15.65 | | | | 3.99 | |
| Less Distributions: | | | | | | | | | | | | | | | | | | | | |
| Distributions from net investment income | | | — | | | | — | | | | (0.44 | ) | | | — | | | | (0.09 | ) |
| Return of Capital | | | — | | | | — | | | | — | | | | — | | | | (0.01 | ) |
| Total Distributions | | | — | | | | — | | | | (0.44 | ) | | | — | | | | (0.10 | ) |
| Net asset value, end of year | | $ | 41.25 | | | $ | 43.94 | | | $ | 66.09 | | | $ | 55.57 | | | $ | 39.92 | |
| Total Return | | | (6.12 | )% | | | (33.52 | )% | | | 19.76 | % | | | 39.20 | % | | | 11.17 | % |
| | | | | | | | | | | | | | | | | | | | | |
| Ratios/Supplemental Data: | | | | | | | | | | | | | | | | | | | | |
| Net Assets at end of year (000’s) | | $ | 88,690 | | | $ | 116,443 | | | $ | 191,673 | | | $ | 127,802 | | | $ | 73,847 | |
| Expenses to Average Net Assets | | | 0.75 | % | | | 0.75 | % | | | 0.75 | % | | | 0.75 | % | | | 0.75 | % |
| Net Investment Income (Loss) to Average Net Assets | | | 0.00 | %3 | | | (0.10 | )% | | | (0.02 | )% | | | (0.12 | )% | | | (0.12 | )% |
| Portfolio Turnover Rate | | | 17 | % | | | 25 | % | | | 21 | % | | | 19 | % | | | 24 | % |
| 1 | Calculated based on average shares outstanding during the year. Amount is less than $0.005 per share. |
| 2 | Amount is less than 0.005%. |
| 3 | The accompanying notes are an integral part of these financial statements. |
The accompanying notes are an integral part of these financial statements.
BlueStar Israel Technology ETF
NOTES TO FINANCIAL STATEMENTS
September 30, 2023
NOTE 1 – ORGANIZATION
BlueStar Israel Technology ETF (the “Fund”) is a series of ETF Managers Trust (the “Trust”), an open-end management investment company consisting of multiple investment series, organized as a Delaware statutory trust on July 1, 2009. The Trust is registered with the SEC under the Investment Company Act of 1940, as amended (the “1940 Act”), as an open-end management investment company and the offering of the Fund’s shares (“Shares”) is registered under the Securities Act of 1933, as amended (the “Securities Act”). The Fund seeks to provide investment results that, before fees and expenses, correspond generally to the total return performance of the BlueStar Israel Global Technology IndexTM (BIGITechTM‖ or the “Index”). The Fund commenced operations on November 2, 2015.
The Fund currently offers one class of shares, which has no front end sales load, no deferred sales charges, and no redemption fees. The Fund may issue an unlimited number of shares of beneficial interest, with no par value. All shares of the Fund have equal rights and privileges.
Shares of the Fund are listed and traded on the NYSE Arca, Inc. Market prices for the Shares may be different from their net asset value (“NAV”). The Fund issues and redeems Shares on a continuous basis at NAV only in blocks of 50,000 shares, called “Creation Units.” Creation Units are issued and redeemed principally in-kind for securities included in the Index. Once created, Shares generally trade in the secondary market at market prices that change throughout the day in quantities less than a Creation Unit. Except when aggregated in Creation Units, Shares are not redeemable securities of the Fund. Shares of the Fund may only be purchased or redeemed by certain financial institutions (“Authorized Participants”). An Authorized Participant is either (i) a broker-dealer or other participant in the clearing process through the Continuous Net Settlement System of the National Securities Clearing Corporation or (ii) a DTC participant and, in each case, must have executed a Participant Agreement with the Distributor. Most retail investors do not qualify as Authorized Participants nor have the resources to buy and sell whole Creation Units. Therefore, they are unable to purchase or redeem the Shares directly from the Fund. Rather, most retail investors may purchase Shares in the secondary market with the assistance of a broker and may be subject to customary brokerage commissions or fees.
Authorized Participants transacting in Creation Units for cash may pay an additional variable charge to compensate the relevant Fund for certain transaction costs (i.e., brokerage costs) and market impact expenses relating to investing in portfolio securities. Such variable charges, if any, are included in “Transaction Fees” in the Statements of Changes in Net Assets.
NOTE 2 – SIGNIFICANT ACCOUNTING POLICIES
The following is a summary of significant accounting policies consistently followed by the Fund. These policies are in conformity with accounting principles generally accepted in the United States of America (“U.S. GAAP”).
The Fund follows the investment company accounting and reporting guidance of the Financial Accounting Standards Board Accounting Standard Codification Topic 946 Financial Services – Investment Companies.
The Fund may invest in certain other investment companies (underlying funds). For more information about the underlying fund’s operations and policies, please refer to those funds’ semiannual and annual reports, which are filed with the SEC.
BlueStar Israel Technology ETF
NOTES TO FINANCIAL STATEMENTS
September 30, 2023 (Continued)
| A. | Security Valuation. Securities listed on a securities exchange, market or automated quotation system for which quotations are readily available (except for securities traded on NASDAQ), including securities traded over the counter, are valued at the last quoted sale price on the primary exchange or market (foreign or domestic) on which they are traded on the valuation date (or at approximately 4:00 pm Eastern Time if a security’s primary exchange is normally open at that time), or, if there is no such reported sale on the valuation date, at the most recent quoted bid price. For securities traded on NASDAQ, the NASDAQ Official Closing Price will be used. |
Securities for which quotations are not readily available are valued at their respective fair values as determined in good faith by ETF Managers Group, LLC (the “Adviser”), using procedures adopted by the Board of Trustees (the “Board”). When a security is “fair valued,” consideration is given to the facts and circumstances relevant to the particular situation, including a review of various factors set forth in the pricing procedures adopted by the Fund’s Board. The use of fair value pricing by the Fund may cause the NAV of its shares to differ significantly from the NAV that would be calculated without regard to such considerations. As of September 30, 2023, the Fund did not hold any fair valued securities.
As described above, the Fund utilizes various methods to measure the fair value of its investments on a recurring basis. U.S. GAAP establishes a hierarchy that prioritizes inputs to valuation methods. The three levels of inputs are:
| Level 1 | Unadjusted quoted prices in active markets for identical assets or liabilities that the Fund has the ability to access. |
| Level 2 | Observable inputs other than quoted prices included in Level 1 that are observable for the asset or liability, either directly or indirectly. These inputs may include quoted prices for the identical instrument on an inactive market, prices for similar instruments, interest rates, prepayment speeds, credit risk, yield curves, default rates and similar data. |
| Level 3 | Unobservable inputs for the asset or liability, to the extent relevant observable inputs are not available; representing the Fund’s own assumptions about the assumptions a market participant would use in valuing the asset or liability, and would be based on the best information available. |
The availability of observable inputs can vary from security to security and is affected by a wide variety of factors, including, for example, the type of security, whether the security is new and not yet established in the marketplace, the liquidity of markets, and other characteristics particular to the security. To the extent that valuation is based on models or inputs that are less observable or unobservable in the market, the determination of fair value requires more judgment. Accordingly, the degree of judgment exercised in determining fair value is greatest for instruments categorized in Level 3.
The inputs used to measure fair value may fall into different levels of the fair value hierarchy. In such cases, for disclosure purposes, the level in the fair value hierarchy within which the fair value measurement falls in its entirety, is determined based on the lowest level input that is significant to the fair value measurement in its entirety.
BlueStar Israel Technology ETF
NOTES TO FINANCIAL STATEMENTS
September 30, 2023 (Continued)
The following is a summary of the inputs used to value the Fund’s net assets as of September 30, 2023:
BlueStar Israel Technology ETF
| Assets^ | | Level 1 | | | Level 2 | | | Level 3 | | | Total | |
| Common Stocks | | $ | 88,309,161 | | | $ | — | | | $ | — | | | $ | 88,309,161 | |
| Short-Term Investments | | | 337,184 | | | | — | | | | — | | | | 337,184 | |
| Investments Purchased with Securities Lending Collateral* | | | — | | | | — | | | | — | | | | 16,123,144 | |
| Total Investments in Securities | | $ | 88,646,345 | | | $ | — | | | $ | — | | | $ | 104,769,489 | |
| ^ | See Schedule of Investments for classifications by country and industry. |
| * | Certain investments that are measured at fair value using the NAV per share (or its equivalent) practical expedient have not been categorized in the fair value hierarchy. The fair value amounts presented in the table are intended to permit reconciliation of the fair value hierarchy to the amounts presented in the Schedule of Investments. |
| B. | Federal Income Taxes. The Fund has elected to be taxed as a ―regulated investment company‖ and intends to distribute substantially all taxable income to its shareholders and otherwise comply with the provisions of the Internal Revenue Code applicable to regulated investment companies. Therefore, no provisions for federal income taxes or excise taxes have been made. |
To avoid imposition of the excise tax applicable to regulated investment companies, the Fund intends to declare each year as dividends, in each calendar year, at least 98.0% of its net investment income (earned during the calendar year) and 98.2% of its net realized capital gains (earned during the twelve months ended October 31) plus undistributed amounts, if any, from prior years.
Net capital losses incurred after October 31, within the taxable year are deemed to arise on the first business day of the Fund’s next taxable year.
The Fund recognizes the tax benefits of uncertain tax positions only where the position is ―more likely than not‖ to be sustained assuming examination by tax authorities. The Fund has analyzed its tax position and has concluded that no liability for unrecognized tax benefits should be recorded related to uncertain tax positions expected to be taken in the Fund’s 2023 tax returns. The Fund identifies its major tax jurisdictions as U.S. Federal, the State of New Jersey, and the State of Delaware; however the Fund is not aware of any tax positions for which it is reasonably possible that the total amounts of unrecognized tax benefits will change materially in the next twelve months.
As of September 30, 2023, management has reviewed the tax positions for open periods (for federal purposes, three years from the date of filing and for state purposes, generally a range of three to four years from the date of filing) as applicable to the Fund, and has determined that no provision for income tax is required in the Fund’s financial statements.
| C. | Security Transactions and Investment Income. Investment securities transactions are accounted for on the trade date. Gains and losses realized on sales of securities are determined on a specific identification basis. Discounts/premiums on debt securities purchased are accreted/amortized over the life of the respective securities using the effective interest method. Dividend income is recorded on the ex-dividend date. Interest income is recorded on an accrual basis. Income, including gains, from investments in foreign securities received by the Fund may be subject to income, withholding or other taxes imposed by foreign countries. |
BlueStar Israel Technology ETF
NOTES TO FINANCIAL STATEMENTS
September 30, 2023 (Continued)
| D. | Foreign Currency Translations and Transactions. The Fund may engage in foreign currency transactions. Foreign currency transactions are translated into U.S. dollars on the following basis: (i) market value of investment securities, assets and liabilities at the daily rates of exchange, and (ii) purchases and sales of investment securities, dividend and interest income and certain expenses at the rates of exchange prevailing on the respective dates of such transactions. For financial reporting purposes, the Fund does not isolate changes in the exchange rate of investment securities from the fluctuations arising from changes in the market prices of securities for unrealized gains and losses. However, for federal income tax purposes, the Fund does isolate and treat as ordinary income the effect of changes in foreign exchange rates on realized gains or losses from the sale of investment securities and payables and receivables arising from trade-date and settlement-date differences. |
| E. | Distributions to Shareholders. Distributions to shareholders from net investment income, if any are generally declared and paid by the Fund on a quarterly basis. Net realized gains on securities of the Fund normally are declared and paid on an annual basis. Distributions are recorded on the ex-dividend date. |
| F. | Use of Estimates. The preparation of financial statements in conformity with U.S. GAAP requires management to make estimates and assumptions that affect the reported amounts of assets and liabilities at the date of the financial statements, as well as the reported amounts of revenues and expenses during the period. Actual results could differ from those estimates. |
| G. | Share Valuation. The NAV per share of the Fund is calculated by dividing the sum of the value of the securities held by the Fund, plus cash and other assets, minus all liabilities (including estimated accrued expenses) by the total number of shares outstanding of the Fund, rounded to the nearest cent. The Fund’s shares will not be priced on the days on which the NYSE is closed for trading. The offering and redemption price per share for the Fund is equal to the Fund’s NAV share. |
| H. | Guarantees and Indemnifications. In the normal course of business, the Fund enters into contracts with service providers that contain general indemnification clauses. The Fund’s maximum exposure under these arrangements is unknown as this would involve future claims that may be made against the Fund that have not yet occurred. However, based on experience, the Fund expects the risk of loss to be remote. |
NOTE 3 – RISK FACTORS
Investing in the BlueStar Israel Technology ETF may involve certain risks, as discussed in the Fund’s prospectus, including, but not limited to, those described below. Any of these risks could cause an investor to lose money.
Market Risk. Financial markets rise and fall in response to a variety of factors, sometimes rapidly and unpredictably. As with any investment whose performance is tied to these markets, the value of an investment in a fund will fluctuate, which means that an investor could lose money over short or long periods.
Investment Style Risk. The Fund is not actively managed. Therefore, the Fund follows the securities included in its respective index during upturns as well as downturns. Because of its indexing strategy, the Fund does not take steps to reduce market exposure or to lessen the effects of a declining market. In addition, because of the Fund’s expenses, the Fund’s performance may be below that of its index.
Equity Risk. The prices of equity securities rise and fall daily. These price movements may result from factors affecting individual companies, industries or the securities market as a whole. In addition, equity markets tend to move in cycles which may cause stock prices to fall over short or extended periods of time.
BlueStar Israel Technology ETF
NOTES TO FINANCIAL STATEMENTS
September 30, 2023 (Continued)
Securities Lending Risk. Securities lending involves the risk of loss of rights in, or delay in recovery of, the loaned securities if the borrower fails to return the security loaned or becomes insolvent.
Concentration Risk. To the extent that the Fund’s or its underlying index’s portfolio is concentrated in the securities of issuers in a particular market, industry, group of industries, sector or asset class, the Fund may be adversely affected by the performance of those securities, may be subject to increased price volatility and may be more vulnerable to adverse economic, market, political or regulatory occurrences affecting that market, industry, group of industries, sector or asset class.
Natural Disaster/Epidemic Risk. Natural or environmental disasters, such as earthquakes, fires, floods, hurricanes, tsunamis and other severe weather related phenomena generally, and widespread disease, including pandemics and epidemics (for example, the novel coronavirus COVID -19), have been and can be highly disruptive to economies and markets and have recently led, and may continue to lead, to increased market volatility and significant market losses. Such natural disaster and health crises could exacerbate political, social, and economic risks previously mentioned, and result in significant breakdowns, delays, shutdowns, social isolation, and other disruptions to important global, local and regional supply chains affected, with potential corresponding results on the operating performance of the Fund and its investments. A climate of uncertainty and panic, including the contagion of infectious viruses or diseases, may adversely affect global, regional, and local economies and reduce the availability of potential investment opportunities, and increases the difficulty of performing due diligence and modeling market conditions, potentially reducing the accuracy of financial projections. Under these circumstances, the Fund may have difficulty achieving its investment objective which may adversely impact performance. Further, such events can be highly disruptive to economies and markets, significantly disrupt the operations of individual companies (including, but not limited to, the Fund’s third party service providers), sectors, industries, markets, securities and commodity exchanges, currencies, interest and inflation rates, credit ratings, investor sentiment, and other factors affecting the value of the Fund’s investments. These factors can cause substantial market volatility, exchange trading suspensions and closures and can impact the ability of the Fund to complete redemptions and otherwise affect Fund performance and Fund trading in the secondary market. A widespread crisis may also affect the global economy in ways that cannot necessarily be foreseen at the current time. How long such events will last and whether they will continue or recur cannot be predicted. Impacts from these events could have significant impact on the Fund’s performance, resulting in losses to the Fund.
On February 24, 2022, Russia commenced a military attack on Ukraine. The outbreak of hostilities between the two countries could result in more widespread conflict and could have a severe adverse effect on the region and the markets. In addition, sanctions imposed on Russia by the United States and other countries, and any sanctions imposed in the future could have a significant adverse impact on the Russian economy and related markets.
On October 7, 2023, Hamas launched a significant attack on Israel from the Gaza Strip. The extent and duration of the Israel-Hamas war and any related economic and market impacts are impossible to predict but may be significant and may negatively impact Israel’s economy. The price and liquidity of investments may fluctuate widely as a result of these conflicts and related events. How long such conflicts and related events will last, and whether either may escalate further, cannot be predicted, however such conflicts may negatively impact issuers of securities in which the Fund(s) invests.
A complete description of the principal risks is included in the Fund’s prospectus under the heading “Principal Investment Risks.”
BlueStar Israel Technology ETF
NOTES TO FINANCIAL STATEMENTS
September 30, 2023 (Continued)
NOTE 4 – MANAGEMENT AND OTHER CONTRACTS
The Adviser serves as the investment advisor to the Fund. Pursuant to an Investment Advisory Agreement (“Advisory Agreement”) between the Trust, on behalf of the Fund, and the Adviser, the Adviser provides investment advice to the Fund and oversees the day-today operations of the Fund, subject to the direction and control of the Board and the officers of the Trust.
Under the Investment Advisory Agreement with the Fund, the Adviser has overall responsibility for the general management and administration of the Fund and arranges for sub-advisory, transfer agency, custody, fund administration, securities lending, and all other non-distribution related services necessary for the Fund to operate. The Adviser bears the costs of all advisory and non-advisory services required to operate the Fund, in exchange for a single unitary fee. For services provided the Fund pays the Adviser at an annual rate of 0.75% of the Fund’s average daily net assets. Under the Investment Advisory Agreement, the Adviser has agreed to pay all expenses of the Fund, except for: the fee paid to the Adviser pursuant to the Investment Advisory Agreement, interest charges on any borrowings, taxes, brokerage commissions and other expenses incurred in placing orders for the purchase and sale of securities and other investment instruments, acquired fund fees and expenses, accrued deferred tax liability, extraordinary expenses, and distribution (12b-1) fees and expenses (collectively, “Excluded Expenses”). The Adviser has entered into an agreement with Foreside Fund Services LLC, to serve as distributor to the Fund (the “Distributor”). The Distributor provides marketing support for the Fund, including distributing marketing materials related to the Fund.
The Adviser has entered into an Agreement with BlueStar Global Investors LLC (“BlueStar”), under which BlueStar agrees to sublicense the use of the Underlying Index from BlueStar Indexes for use by the Adviser and the Fund. BlueStar also provides marketing support for the Fund, including distributing marketing materials related to the Fund. BlueStar does not make investment decisions, provide investment advice, or otherwise act in the capacity of an investment adviser to the Fund. Additionally, BlueStar is not involved in the maintenance of the Underlying Index and does not otherwise act in the capacity of an index provider.
U.S. Bancorp Fund Services, LLC, doing business as U.S. Bank Global Fund Services (the “Administrator”), provides fund accounting, fund administration, and transfer agency services to the Fund. The Adviser compensates the Administrator for these services under an administration agreement between the two parties.
The Adviser pays each independent Trustee a quarterly fee for service to the Fund. Each Trustee is also reimbursed by the Adviser for all reasonable out-of-pocket expenses incurred in connection with his duties as Trustee, including travel and related expenses incurred in attending Board meetings.
NOTE 5 – DISTRIBUTION PLAN
The Fund has adopted a Plan of Distribution pursuant to Rule 12b-1 under the 1940 Act. Under the Plan, the Fund may pay compensation to the Distributor or any other distributor or financial institution with which the Trust has an agreement with respect to the Fund, with the amount of such compensation not to exceed an annual rate of 0.25% of each Fund’s average daily net assets. For the year ended September 30, 2023, the Fund did not incur any 12b-1 expenses.
BlueStar Israel Technology ETF
NOTES TO FINANCIAL STATEMENTS
September 30, 2023 (Continued)
NOTE 6 - PURCHASES AND SALES OF SECURITIES
The costs of purchases and sales of securities, excluding short-term securities and in-kind transactions, for the year ended September 30, 2023:
| | | Purchases | | | Sales | |
| BlueStar Israel Technology ETF | | $ | 19,673,873 | | | $ | 18,316,065 | |
The costs of purchases and sales of in-kind transactions associated with creations and redemptions for the year ended September 30, 2023:
| | | Purchases In- | | | Sales In- | |
| | | Kind | | | Kind | �� |
| BlueStar Israel Technology ETF | | $ | 2,241,381 | | | $ | 24,537,748 | |
Purchases in-kind are the aggregate of all in-kind purchases and sales in-kind are the aggregate of all proceeds from in-kind sales. Net capital gains or losses resulting from in-kind redemptions are excluded from the determination of the Fund’s taxable gains and are not distributed to shareholders.
There were no purchases or sales of U.S. Government obligations for the year ended September 30, 2023.
NOTE 7 — SECURITIES LENDING
The Fund may lend up to 33 1/3% of the value of the securities in its portfolio to brokers, dealers and financial institutions (but not individuals) under terms of participation in a securities lending program administered by U.S. Bank N.A. (“the Custodian”). The securities lending agreement requires that loans are collateralized at all times in an amount equal to at least 102% of the value of any loaned securities at the time of the loan, plus accrued interest. The Fund receives compensation in the form of fees and earns interest on the cash collateral. The amount of fees depends on a number of factors including the type of security and length of the loan. The Fund continues to receive interest payments or dividends on the securities loaned during the borrowing period. Gain or loss in the fair value of securities loaned that may occur during the term of the loan will be for the account of the Fund. The Fund has the right under the terms of the securities lending agreement to recall the securities from the borrower on demand. The cash collateral is invested by the Custodian in accordance with approved investment guidelines. Those guidelines require the cash collateral to be invested in readily marketable, high quality, short-term obligations, either directly on behalf of the Fund or through one or more joint accounts, money market funds, or short-term bond funds, including those advised by or affiliated with the Adviser; however, all such investments are subject to risk of payment delays or default on the part of the issuer or counterparty or otherwise may not generate sufficient interest to support the costs associated with securities lending. Other investment companies in which the Fund may invest cash collateral can be expected to incur fees and expenses for operations, such as investment advisory and administration fees, which would be in addition to those incurred by the Fund, and which may be received in full or in part by the Adviser. Pursuant to guidance issued by the SEC staff, fees and expenses of money market funds used for cash collateral received in connection with loans of securities are not treated as Acquired Fund Fees and Expenses, which reflect a fund’s pro rata share of the fees and expenses incurred by other investment companies in which the Fund invests (as disclosed in the Prospectus, as applicable). The Fund could also experience delays in recovering its securities and possible loss of income or value if the borrower fails to return the borrowed securities, although the Fund is indemnified from this risk by contract with the securities lending agent.
BlueStar Israel Technology ETF
NOTES TO FINANCIAL STATEMENTS
September 30, 2023 (Continued)
As of September 30, 2023, the value of the securities on loan and payable for collateral due to broker were as follows:
Value of Securities on Loan Collateral Received
| Fund | | Values of
Securities on
Loan | | | Fund
Collateral
Received* | |
| BlueStar Israel Technology ETF | | $ | 15,842,979 | | | $ | 16,123,144 | |
| * | The cash collateral received was invested in the Mount Vernon Liquid Assets Portfolio, an investment with an overnight and continuous maturity, as shown on the Schedule of Investments. |
NOTE 8 – FEDERAL INCOME TAXES
The components of distributable earnings (losses) and cost basis of investments for federal income tax purposes at September 30, 2023, the Fund’s most recent fiscal year end, were as follows:
| | | Cost | | | Gross
Unrealized
Appreciation | | | Gross
Unrealized
Depreciation | | | Net
Unrealized
Appreciation
(Depreciation) | |
| BlueStar Israel Technology ETF | | $ | 145,037,652 | | | $ | 8,777,049 | | | $ | (49,045,212 | ) | | $ | (40,268,163 | ) |
| | | | | | | | | | | | | | | | | |
| | | Undistributed
Ordinary
Income | | | Undistributed
Long-Term
Gain | | | Total
Distributable
Earnings | | | Other
Accumulated
(Loss) | | | Total
Accumulated
Gain | |
| BlueStar Israel Technology ETF | | $ | — | | | $ | — | | | $ | — | | | $ | (27,354,965 | ) | | $ | (67,623,128 | ) |
As of September 30, 2023, the Fund’s most recent fiscal year end, the Fund had accumulated capital loss carryovers of:
| | | Capital Loss
Carryover ST | | | Capital Loss
Carryover LT | | | Expires |
| BlueStar Israel Technology ETF | | $ | (12,110,864 | ) | | $ | (15,244,105 | ) | | Indefinite |
Under current tax law, capital and currency losses realized after October 31 of a fund’s fiscal year may be deferred and treated as occurring on the first business day of the following fiscal year for tax purposes. The Fund had deferred post-October capital and currency losses, which will be treated as arising on the first business day of the year ended September 30, 2023, the Fund’s most recent fiscal year end, as follows:
| | | Later Year Ordinary Loss | | Post-October Loss |
| BlueStar Israel Technology ETF | | None | | None |
U.S. GAAP requires that certain components of net assets relating to permanent differences be reclassified between financial and tax reporting. These reclassifications have no effect on net assets or net asset value per share. For the fiscal year ended September 30, 2023, the following table shows the reclassifications made:
| | | Total
Distributable
Earnings/(Loss) | | | Paid-In
Capital | |
| BlueStar Israel Technology ETF | | $ | (3,534,977 | ) | | $ | 3,534,977 | |
BlueStar Israel Technology ETF
NOTES TO FINANCIAL STATEMENTS
September 30, 2023 (Continued)
The tax character of distributions paid by the Fund during the fiscal year ended September 30, 2023 and fiscal year ended September 30, 2022 are as follows:
| | | Year Ended September 30, 2023 | | | Year Ended September 30, 2022 | |
| | | From Ordinary
Income | | | From Capital
Gains | | | From Ordinary
Income | | | From Capital
Gains | |
| BlueStar Israel Technology ETF | | $ | — | | | $ | — | | | $ | — | | | $ | — | |
NOTE 9 – LEGAL MATTERS
The Trust, the Adviser, and certain officers and affiliated persons of the Adviser (together with the Adviser, the “Adviser Defendants”) were named as defendants in an action filed December 21, 2021, in the Superior Court of New Jersey, Union County, captioned PureShares, LLC, d/b/a PureFunds et al. v. ETF Managers Group, LLC et al., Docket No. UNN-C-152-21 (the “NJ Action”). The NJ Action asserted breach of contract and other tort claims and sought damages in unspecified amounts and injunctive relief. On May 25, 2022, the court in the NJ Action dismissed with prejudice all claims asserted against the Trust, as well as all contract claims and all except one tort claim asserted against the Adviser Defendants. With respect to the tort claim asserted against the Adviser Defendants, the parties stipulated and agreed to dismiss that claim without prejudice in May 2023.
The Adviser and certain of its affiliates have entered into a settlement agreement with the Securities and Exchange Commission (“SEC”) regarding certain alleged conflicts of interest arising in connection with ETFMG Alternative Harvest ETF’s (MJ) participation in the securities lending program administered by its prior custodian. Without admitting or denying the SEC’s findings, the Adviser and its parent company agreed to censures, to a cease-and-desist order, and to pay, jointly and severally, a civil penalty of $4 million. The settlement resolves the SEC’s investigation of the Adviser and its affiliates.
As of September 30, 2023, there were no adjustments made to the accompanying financial statements based on the above legal matters.
NOTE 10 – SUBSEQUENT EVENTS
In preparing these financial statements, the Fund has evaluated events and transactions for potential recognition or disclosure through the date the financial statements were issued.
The Board of the Trust has approved an Agreement and Plan of Reorganization (the ���Agreement”) providing for the reorganization of the Target Fund into corresponding new fund (the “Acquiring Fund”), which is a newly created series of Amplify ETF Trust with similar investment objectives and the same fees and expenses as the corresponding Target Fund. The Reorganization is subject to certain conditions including approval by shareholders of the Target Fund. The following table shows shares of the Acquiring Fund that will be issued to shareholders of the corresponding Target Fund.
| Target Fund | Acquiring Fund |
| BlueStar Israel Technology ETF | Amplify BlueStar Israel Technology ETF |
The proxy solicitation materials were filed with the SEC on October 13, 2023. The Joint Special Meeting of Shareholders is to be held on December 28, 2023.
Other than as disclosed, there were no other subsequent events requiring recognition or disclosure through the date the financial statements were issued.
Report of Independent Registered Public Accounting Firm
To the Board of Trustees of ETF Managers Trust
and the Shareholders of BlueStar Israel Technology ETF:
Opinion on the Financial Statements
We have audited the accompanying statement of assets and liabilities, including the schedule of investments, of BlueStar Israel Technology ETF (the “Fund”) (a series of ETF Managers Trust) as of September 30, 2023, the related statement of operations for the year then ended, the statements of changes in net assets for each of the two years in the period then ended, the financial highlights for each of the periods indicated therein, and the related notes (collectively referred to as the “financial statements”). In our opinion, the financial statements present fairly, in all material respects, the financial position of the Fund as of September 30, 2023, and the results of its operations for the year then ended, the changes in net assets for each of the two years in the period then ended, and the financial highlights for each of the periods indicated therein, in conformity with accounting principles generally accepted in the United States of America.
Basis for Opinion
These financial statements and financial highlights are the responsibility of the Fund’s management. Our responsibility is to express an opinion on these financial statements based on our audits. We are a public accounting firm registered with the Public Company Accounting Oversight Board (United States) (“PCAOB”) and are required to be independent with respect to the Fund in accordance with the U.S. federal securities laws and the applicable rules and regulations of the Securities and Exchange Commission and the PCAOB.
We conducted our audits in accordance with the standards of the PCAOB. Those standards require that we plan and perform the audits to obtain reasonable assurance about whether the financial statements and financial highlights are free of material misstatement, whether due to error or fraud. The Fund is not required to have, nor were we engaged to perform, an audit of its internal control over financial reporting. As part of our audits we are required to obtain an understanding of internal control over financial reporting but not for the purpose of expressing an opinion on the effectiveness of the Fund’s internal control over financial reporting. Accordingly, we express no such opinion.
Our audits included performing procedures to assess the risks of material misstatement of the financial statements and financial highlights, whether due to error or fraud, and performing procedures that respond to those risks. Such procedures included examining, on a test basis, evidence regarding the amounts and disclosures in the financial statements and financial highlights. Our audits also included evaluating the accounting principles used and significant estimates made by management, as well as evaluating the overall presentation of the financial statements and financial highlights. Our procedures included confirmation of securities owned as of September 30, 2023 by correspondence with the custodian. We believe that our audits provide a reasonable basis for our opinion.
/s/WithumSmith+Brown, PC
We have served as the auditor of one or more series of the Trust since 2013.
New York, New York
November 29, 2023
BlueStar Israel Technology ETF
EXPENSE EXAMPLE
Period Ended September 30, 2023 (Unaudited)
As a shareholder of BlueStar Israel Technology ETF (the “Fund”) you incur two types of costs: (1) transaction costs, including brokerage commissions on purchases and sales of Fund shares, and (2) ongoing costs, including management fees and other Fund expenses. These examples are intended to help you understand your ongoing costs (in dollars) of investing in the Fund and to compare these costs with the ongoing costs of investing in other funds. The example is based on an investment of $1,000 invested at the beginning of the period and held for the entire period (April 1, 2023 to September 30, 2023).
Actual Expenses
The first line of the table provides information about actual account values based on actual returns and actual expenses. You may use the information in this line, together with the amount you invested, to estimate the expenses that you paid over the period. Simply divide your account value by $1,000 (for example, an $8,600 account value divided by $1,000 = 8.6), then, multiply the result by the number in the first line under the heading entitled ―Expenses Paid During Period’’ to estimate the expenses you paid on your account during this period.
Hypothetical Example for Comparison Purposes
The second line of the table provides information about hypothetical account values based on a hypothetical return and hypothetical expenses based on the Fund’s actual expense ratio and an assumed rate of return of 5% per year before expenses, which is not the Fund’s actual return. The hypothetical account values and expenses may not be used to estimate the actual ending account balance or expenses you paid for the period. You may use this information to compare the ongoing costs of investing in the Fund and other funds. To do so, compare this 5% hypothetical example with the 5% hypothetical examples that appear in the shareholder reports of the other funds. Please note that the expenses shown in the table are meant to highlight your ongoing costs only and do not reflect any transactional costs, such as brokerage commissions paid on purchases and sales of Fund shares. Therefore, the second line of the table is useful in comparing ongoing costs only and will not help you determine the relative total costs of owning different funds. If these transactional costs were included, your costs would have been higher.
| Fund Name | | Beginning
Account Value
April 1, 2023 | | | Ending
Account Value
September 30,
2023 | | | Expenses
Paid During
the Period^ | | | Annualized
Expense Ratio
During the
Period April 1,
2023 to
September 30,
2023 | |
| BlueStar Israel Technology ETF | | | | | | | | | | | | | | | | |
| Actual | | $ | 1,000.00 | | | $ | 892.90 | | | $ | 3.56 | | | | 0.75 | % |
| Hypothetical (5% annual) | | | 1,000.00 | | | | 1,021.31 | | | | 3.80 | | | | 0.75 | % |
| ^ | The dollar amounts shown as expenses paid during the period are equal to the annualized six-month expense ratio multiplied by the average account value during the period, multiplied by 183/365 (to reflect the one-half year period). |
BlueStar Israel Technology ETF
SUPPLEMENTARY INFORMATION
September 30, 2023 (Unaudited)
NOTE 1 – FREQUENCY DISTRIBUTION OF PREMIUMS AND DISCOUNTS
Information regarding how often shares of the Fund traded on the Exchange at a price above (i.e., at a premium) or below (i.e., at a discount) the NAV is available on the Fund’s website at www.etfmgfunds.com.
NOTE 2 – FEDERAL TAX INFORMATION
Qualified Dividend Income/Dividends Received Deduction
For the fiscal year ended September 30, 2023, certain dividends paid by the Fund may be subject to a maximum tax rate of 15%, as provided for by the Jobs and Growth Tax Reconciliation Act of 2003. The percentage of dividends declared from ordinary income designated as qualified dividend income was as follows:
| Fund Name | | Qualified
Dividend Income | |
| Bluestar Israel Technology ETF | | | 0.00 | % |
For corporate shareholders, the percent of ordinary income distributions qualifying for the corporate dividends received deduction for the fiscal year ended September 30, 2023 was as follows:
| Fund Name | | Dividends
Received
Deduction | |
| Bluestar Israel Technology ETF | | | 0.00 | % |
Short Term Capital Gain
The percentage of taxable ordinary income distributions that are designated as short-term capital gain distributions under Internal Revenue Section 871 (k)(2)(C) for the Fund was as follows:
| Fund Name | | Short-Term
Capital Gain | |
| Bluestar Israel Technology ETF | | | 0.00 | % |
NOTE 3 – INFORMATION ABOUT PORTFOLIO HOLDINGS
The Fund files a complete schedule of portfolio holdings with the SEC for its first and third fiscal quarters on Part F of Form N-PORT. Once filed, the Fund ’s Part F of Form N-PORT is available without charge, upon request on the SEC’s website (www.sec.gov), the Fund’s website (www.etfmgfunds.com) and is available by calling (877) 756-7873. The Fund’s portfolio holdings are posted on the Fund’s website www.etfmgfunds.com daily.
NOTE 4 – INFORMATION ABOUT PROXY VOTING
A description of the policies and procedures the Fund uses to determine how to vote proxies relating to portfolio securities is provided in the Statement of Additional Information (“SAI”). The SAI is available without charge upon request by calling toll-free at 1 -844-ETF-MGRS (1-844-383-6477), by accessing the SEC’s website at www.sec.gov, or by accessing the Fund’s website at www.etfmgfunds.com.
Information regarding how the Fund voted proxies relating to portfolio securities during the period ending June 30 is available by calling toll-free at 1-844-ETF-MGRS (1-844-383-6477) or by accessing the SEC’s website at www.sec.gov.
Carefully consider the Fund’s investment objectives, risk factors, charges, and expenses before investing. This and additional information can be found in the Fund’s prospectus, which may be obtained by calling 1-844-ETF-MGRS (1-844-383-6477) or by visiting www.etfmgfunds.com. This report must be preceded or accompanied by a prospectus.
BlueStar Israel Technology ETF
Board of Trustees
Board of Trustees
Set forth below are the names, birth years, positions with the Trust, length of term of office, and the principal occupations and other directorships held during at least the last five years of each of the persons currently serving as a Trustee of the Trust, as well as information about each officer. The business address of each Trustee and officer is 30 Maple Street, 2nd Floor, Summit, New Jersey 07901. The SAI includes additional information about Fund directors and is available, without charge, upon request by calling 1-844-ETF-MGRS (1-844-383-6477).
| Name and Year of Birth | Position(s)
Held with the
Trust, Term of
Office and
Length of
Time Served | Principal Occupation (s) During Past 5 Years | Number of
Portfolios in
Fund
Complex
Overseen By
Trustee | Other
Directorships
Held by
Trustee
During Past 5
Years |
| Interested Trustee and Officers |
Michael Minella
(1971) | President (since 2023) | Senior Principal Consultant, ACA Group (since 2022); Vice President and Director, Fidelity Investments (2009-2022). | n/a | n/a |
John A. Flanagan
(1946) | Treasurer (since 2015) | President, John A. Flanagan CPA, LLC (accounting services) (since 2010); Treasurer, ETF Managers Trust (since 2015); Chief Financial Officer, ETF Managers Capital, LLC (commodity pool operator) (since 2015). | n/a | Independent Trustee - Absolute Shares Trust (since 2014) (6 portfolios) |
Kevin Hourihan
(1978) | Chief Compliance Officer (since 2022) | Senior Principal Consultant, Fund Chief Compliance Officer, ACA Global, LLC (since 2022); Chief Compliance Officer, Ashmore Funds (2017 -2022); Chief Compliance Officer, Ashmore Investment Management (US) Corp (2014-2022); Chief Compliance Officer, Ashmore Equities Investment Management (2015- 2019). | n/a | n/a |
Matthew J. Bromberg
(1973) | Secretary (since 2023) | Chief Compliance Officer and Chief Compliance Officer of ETF Managers Group, LLC (since 2022); General Counsel and Secretary of Exchange Traded Managers Group LLC (since 2020); ETF Managers Group LLC (since 2020); ETFMG Financial LLC (since 2020); ETF Managers Capital LLC (since 2020); Partner of Dorsey & Whitney LLP (law firm) (2019-2020); General Counsel of WBI Investments, Inc. (2016-2019); Millington Securities, Inc. (2016-2019). | n/a | n/a |
BlueStar Israel Technology ETF
Board of Trustees (Continued)
| Name and Year of Birth | Position(s)
Held with the
Trust, Term of
Office and
Length of
Time Served | Principal Occupation(s)
During Past 5 Years | Number of
Portfolios in
Fund
Complex
Overseen By
Trustee | Other
Directorships
Held by
Trustee
During Past 5
Years |
Terry Loebs
(1963) | Chairman of the Board (since 2023); Trustee (since 2014); Lead Independent Trustee (since 2020) | Founder and Managing Member, Pulsenomics LLC (index product development and consulting firm) (since 2011); Managing Director, MacroMarkets, LLC (exchange-traded products firm) (2006- 2011). | 12 | None |
Eric Wiegel
(1960) | Trustee (since 2020) | Managing Partner, Global Focus Capital LLC (since 2013); Senior Portfolio Manager, Little House Capital (2019-2021); Chief Investment Officer, Insight Financial Strategist LLC (2017- 2018). | 12 | None |
BlueStar Israel Technology ETF
ETF MANAGERS TRUST
Privacy Policy and Procedures
ETF Managers Trust, (the “Trust”) has adopted the following privacy policies in order to safeguard the personal information of the Trust’s customers and consumers in accordance with Regulation S-P as promulgated by the U.S. Securities and Exchange Commission.
Trust officers are responsible for ensuring that the following policies and procedures are implemented:
1) The Trust is committed to protecting the confidentiality and security of the information they collect and will handle personal customer and consumer information only in accordance with Regulation S-P and any other applicable laws, rules and regulations1. The Trust will ensure: (a) the security and confidentiality of customer records and information; (b) that customer records and information are protected from any anticipated threats and hazards; and (c) that customer records and information are protected from unauthorized access or use.
2) The Trust conducts its business affairs through its trustees, officers and third parties that provide services pursuant to agreements with the Trust. The Trust has no employees. It is anticipated that the trustees and officers of the Trust who are not employees of service providers of the Trust will not have access to customer records and information in the performance of their normal responsibilities for the Trust.
3) The Trust may share customer information with its affiliates, subject to the customers’ right to prohibit such sharing.
4) The Trust may share customer information with unaffiliated third parties only in accordance with the requirements of Regulation S-P. Pursuant to this policy, the Trust will not share customer information with unaffiliated third parties other than as permitted by law, unless authorized to do so by the customer.
Consistent with these policies, the Trust has adopted the following procedures:
1) The Trust will determine that the policies and procedures of its affiliates and Service Providers are reasonably designed to safeguard customer information and only permit appropriate and authorized access to and use of customer information through the application of appropriate administrative, technical and physical protections.
2) The Trust will direct each of its Service Providers to adhere to the privacy policy of the Trust and to its privacy policies with respect to all customer information of the Trust and to take all actions reasonably necessary so that the Trust is in compliance with the provisions of Regulation S-P, including, as applicable, the development and delivery of privacy notices and the maintenance of appropriate and adequate records.
3) The Trust requires its Service Providers to provide periodic reports to the Trust’s Board of Trustees outlining their privacy policies and the implementation of such policies. Each Service Provider is required to promptly report to the Trust’s Board any material changes to its privacy policy before, or promptly after, the adoption of such changes.
| (1) | Generally, the Funds have institutional clients which are not considered “customers” for purposes of regulation S-P. |
Advisor
ETF Managers Group, LLC
350 Springfield Ave., Suite 200, Summit, NJ 07901
Distributor
Foreside Fund Services LLC
Three Canal Plaza, Suite 100, Portland, Maine 04101
Custodian
U.S. Bank National Association
Custody Operations
1555 North River Center Drive, Suite 302, Milwaukee, Wisconsin 53212
Transfer Agent
U.S. Bancorp Fund Services, LLC doing business as U.S. Bank Global Fund Services
615 East Michigan Street, Milwaukee, Wisconsin 53202
Securities Lending Agent
U.S. Bank, National Association
Securities Lending
800 Nicolet Mall
Minneapolis, MN 55402-7020
Independent Registered Public Accounting Firm
WithumSmith + Brown, PC
1411 Broadway, 9th Floor, New York, NY 10018
Legal Counsel
Sullivan & Worcester LLP
1666 K Street NW, Washington, DC 20006
ETFMG Alternative Harvest ETF
MJ
ETFMG U.S. Alternative Harvest ETF
MJUS
Annual Report
September 30, 2023

The funds are series of ETF Managers Trust.
ETFMG TM ETFs
TABLE OF CONTENTS
September 30, 2023
ETFMG TM ETFs
Dear Shareholder,
On behalf of the entire team, we want to express our appreciation for the confidence you have placed in these ETFs. The following information pertains to the fiscal period from October 1, 2022 to September 30, 2023 (the “Annual Period”).
Market Overview
General Overview
The U.S. economy performed better than expected despite persistent inflationary pressure, rising interest rates and geo-political conflict during the Annual Period.
Early in the Annual Period, inflation had risen sharply because of supply chain disruptions, high food and energy prices and the Russia-Ukraine war, reaching its peak level, just prior to the Annual Period, in September 2022. In the first quarter of 2023, U.S. equities managed to deliver gains, despite the significant volatility. The January rally, however, gave way to a February sell off as higher-than-expected inflation, a tight labor market and solid economic growth indicated that the U.S. Federal Reserve’s (Fed) monetary policy would remain tight for the foreseeable future. One of the most significant impacts occurred in the banking sector in March 2023, when Silicon Valley Bank, Signature Bank, and First Republic Bank, among others, failed. In the same month, Swiss bank UBS agreed to buy Credit Suisse, considered vulnerable in the then current environment.
In the second quarter of 2023, the economy grew at an annualized rate of 2.1%, according to the third estimate from the U.S. Bureau of Economic Analysis, compared to 2.2% in the first quarter and in line with 2.1% in 2022 overall. Since then, price pressures have eased given normalization in supply chains, falling energy prices and aggressive measures by the Fed and other global central banks to tighten financial conditions and slow demand in their economies. Nevertheless, during the Annual Period inflation levels remained much higher than central banks’ target levels, with the Fed raising its target fed funds rate six times during the Annual Period, bringing it to a range of 5.25% to 5.50% as of July 2023. As of August 2023, the unemployment rate was 3.8%, near its pre-pandemic low, although monthly job growth continued to be moderate. In September 2023, the Fed’s policy committee voted to hold the rate steady.
As the U.S. Congress neared its September 30, 2023, deadline to approve federal funding, investor concerns about a potential government shutdown and the impact this could have on the U.S. economy increased. The shutdown, however, was averted because of a Continuing Resolution which temporarily kept the government open for forty-five more days. Despite higher rates and increased market volatility, U.S. stocks for the Annual Period had strong returns of 21.62%, as measured by the S&P 500 Index.
Cannabis Related Business Overview
During the Annual Period stock prices of cannabis related businesses (CRBs), in particular, have been under significant pressure. Significant progress with respect to federal reform of cannabis laws has however, recently been made. Pursuant to the federal review that was commenced by President Biden in late 2022, both the Department of Health and Human Services and the Food and Drug Administration have recommended that cannabis be moved from Schedule I to Schedule III under the Controlled Substances Act. While rescheduling cannabis to Schedule III would not result in legalization at the federal level, there would be several potentially positive impacts relating to rescheduling, including allowing CRBs to take deductions under Internal Revenue Code Section which should materially improve the after-tax earnings of CRBs. Additionally, a bipartisan group of senators introduced the Secure and Fair Enforcement Regulation (“SAFER”) Banking Act. If passed by Congress, the bill would provide legal protection to banks and other financial institutions that offer services to state-legal CRBs. The bill was approved by the Senate Banking Committee in September 2023 and will now make its way to the Senate floor. Several previous versions of the SAFER Banking Act have been presented over the last several years; however, this is the first time the bill has received a yes vote by the Senate Banking Committee and made its way to the Senate floor. Although several hurdles remain, historical progress has been made with respect to federal reform which, if continued and successful, could provide a significant lift to the cannabis industry in 2024.
General market conditions together with conditions related to CRBs, have impacted the performance of the ETFs during the Annual Period, among other factors, and the value of an investment in the ETFs. We encourage you to talk with your financial advisor and visit etfmg.com for further insight into investing in today’s markets.
Performance Overview
During the Annual Period, the S&P 500, a broad measure of US listed companies, returned 21.62%. Below is a performance overview for each Fund for the same Annual Period.
ETFMG Alternative Harvest ETF (MJ)
Over the Annual Period, the total return for the ETFMG Alternative Harvest ETF (“MJ”), was - 18.67%, while the total return for the Prime Alternative Harvest Index (the “Index”) was -19.58%. The best performers in MJ, on the basis of contribution to return, were Glass House Brands Inc., Medicine Man Technologies Inc., High Tide Inc., Vector Group Ltd., and Scotts Miracle-Gro Co., while the worst performers were Incannex Healthcare Ltd., 22nd Century Group Inc., Canopy Growth Corp., Auxly Cannabis Group Inc., and Intercure Ltd.
At the end of the Annual Period, MJ saw an approximate allocation of 65.7% to the Health Care sector, 9.28% to Real Estate and 7.98% to Financials. The portfolio holdings of MJ were exposed predominately to the United States at 58.08%, Canada at 36.23% and 1.75% to the Australia.
ETFMG U.S. Alternative Harvest ETF (MJUS)
The ETFMG U.S. Alternative Harvest ETF (“MJUS”), seeks to provide investment results that, before fees and expenses, correspond generally to the price and yield performance of the Prime U.S. Alternative Harvest Index (the “MJUS Index”).
Over the Annual Period, the total return for MJUS was -14.14%, while the total return for the MJUS Index was -15.68%. The best performers in MJUS, on the basis of contribution to return were, Glass House Brands Inc., Medicine Man Technologies Inc., Charlottes Web Holdings Inc., Terrascend Corp., and Green Thumb Industries Inc., while the worst performers were Bright Green Corp., 4Front Ventures Corp., Flora Growth Corp., Power REIT., and Ascend Wellness Holdings.
At the end of the Annual Period, MJUS saw an approximate allocation of 66.58% to Health Care, 20.32% to the Real Estate sector, 5.21% to Financials. The portfolio holdings of MJUS were primarily exposed to the United States at 93.31%, while 6.69% were exposed to Canada.
Swap Agreements:
During the Annual Period, MJUS invested in swap agreements in order to gain the desired exposure to the Index. These derivatives generally negatively impacted MJUS as a result of the financing rates associated with their use. MJUS entered into swap agreements with counterparties that the Adviser determined to be significant global financial institutions.
If a counterparty becomes insolvent or otherwise fails to perform on its obligations, the value of investments in MJUS may decline. MJUS has sought to mitigate this risk by generally requiring counterparties to post collateral for its benefit, marked to market daily, in an amount approximately equal to the amount the counterparty owed MJUS, subject to certain minimum thresholds.
We thank you for your interest in the ETFs. You can find further details about MJ and MJUS by visiting www.etfmg.com, or by calling 1-844-ETF-MGRS (1-844-383-6477).
Sincerely,

John A. Flanagan
Principal Financial Officer
ETFMG Alternative Harvest ETF
Growth of $10,000 (Unaudited)
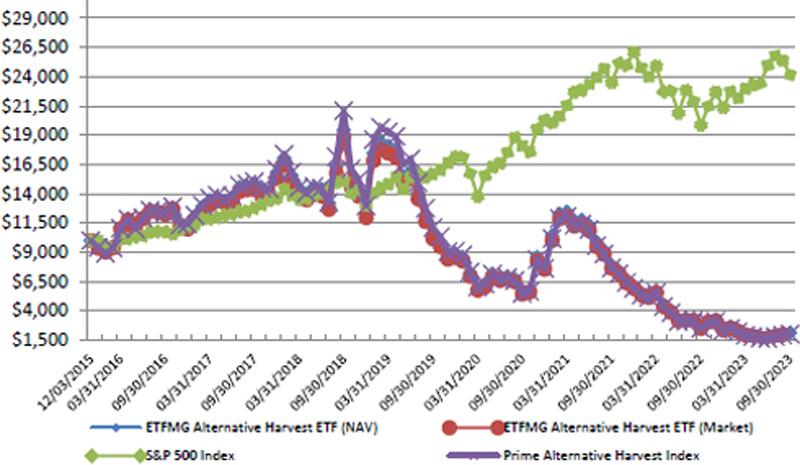
Average Annual Returns
Year Ended September 30, 2023 | | 1 Year
Return | | | 5 Year
Return | | | Inception
(12/03/15) | | | Value of
$10,000
(9/30/2023) | |
| ETFMG Alternative Harvest ETF (NAV) | | | -18.67 | % | | | -35.77 | % | | | -17.96 | % | | $ | 2,123 | |
| ETFMG Alternative Harvest ETF(Market) | | | -17.79 | % | | | -35.83 | % | | | -18.32 | % | | $ | 2,051 | |
| S&P 500 Index | | | 21.62 | % | | | 9.92 | % | | | 11.93 | % | | $ | 24,164 | |
| Prime Alternative Harvest Index* | | | -19.58 | % | | | -37.55 | % | | | -18.57 | % | | $ | 2,003 | |
| * | On December 26, 2017, the Fund’s investment objective and principal investment strategy were substantially revised; therefore, the performance and average annual total returns shown for periods prior to December 26, 2017 is likely to have differed had the Fund’s current investment strategy been in effect during those periods. The Fund’s prior investment objective sought to provide investment results that corresponded to the performance of the Solactive Latin America Real Estate Index, which tracked equities with primary listings in the Latin America region that derived most of their income from real estate and real estate services. The Fund began tracking the Prime Alternative Harvest Index on December 26, 2017. |
Performance data quoted represents past performance and does not guarantee future results. The investment return and principal value of an investment will fluctuate so that an investor’s shares, when redeemed, may be worth more or less than their original cost. Current performance of the Fund may be lower or higher than the performance quoted. All performance is historical and includes reinvestment of dividends and capital gains. Performance data current to the most recent month end may be obtained by calling 1-844-ETF-MGRS (1-844-383-6477).
The chart illustrates the performance of a hypothetical $10,000 investment made on December 3, 2015, and is not intended to imply any future performance. The returns shown do not reflect the deduction of taxes that a shareholder would pay on fund distributions from the sales of Fund shares. The chart assumes reinvestment of capital gains and dividends, if any. The Index Returns do not reflect fees or expenses and are not available for direct investment.
ETFMG Alternative Harvest ETF
Top Ten Holdings as of September 30, 2023 (Unaudited)*
| | Security | | % of Total
Investments | |
| 1 | ETFMG U.S. Alternative Harvest ETF** | | | 37.39 | % |
| 2 | SNDL, Inc. | | | 6.00 | % |
| 3 | Canopy Growth Corp. | | | 5.23 | % |
| 4 | Tilray Brands, Inc. | | | 5.00 | % |
| 5 | Cronos Group, Inc. | | | 4.89 | % |
| 6 | Aurora Cannabis, Inc. | | | 2.50 | % |
| 7 | Chicago Atlantic Real Estate Finance, Inc. | | | 2.44 | % |
| 8 | High Tide, Inc. | | | 1.53 | % |
| 9 | WM Technology, Inc. | | | 1.29 | % |
| 10 | Organigram Holdings, Inc. | | | 1.04 | % |
Top Ten Holdings= 67.31% of Total Investments
| * | Current Fund holdings may not be indicative of future Fund holdings. |
| ** | Affiliated security. Please refer to Note 9 of the Notes to Financial Statements. |
ETFMG U.S. Alternative Harvest ETF
Growth of $10,000 (Unaudited)
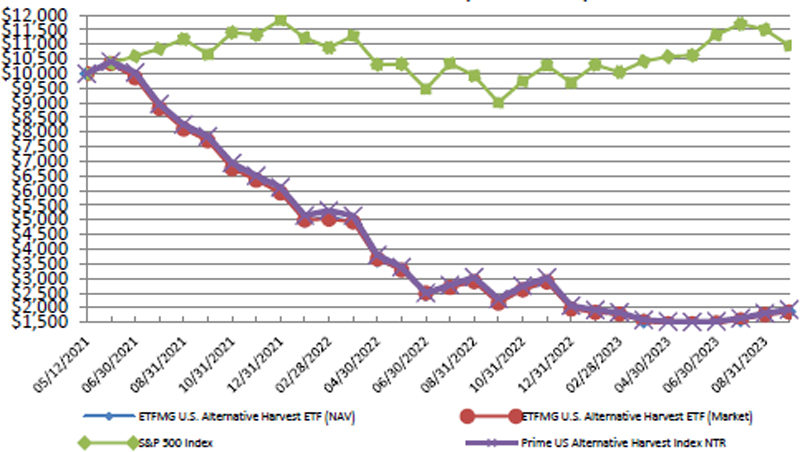
Average Annual Returns
Year Ended September 30, 2023 | | 1 Year
Return | | | Since
Inception
(5/12/2021) | | | Value of
$10,000
(9/30/2023) | |
| ETFMG U.S. Alternative Harvest ETF (NAV) | | | -14.14 | % | | | -50.61 | % | | $ | 1,857 | |
| ETFMG U.S. Alternative Harvest ETF (Market) | | | -14.23 | % | | | -50.70 | % | | $ | 1,850 | |
| S&P 500 Index | | | 21.62 | % | | | 3.91 | % | | $ | 10,959 | |
| Prime US Alternative Harvest Index NTR | | | -15.68 | % | | | -49.76 | % | | $ | 1,934 | |
Performance data quoted represents past performance and does not guarantee future results. The investment return and principal value of an investment will fluctuate so that an investor’s shares, when redeemed, may be worth more or less than their original cost. Current performance of the Fund may be lower or higher than the performance quoted. All performance is historical and includes reinvestment of dividends and capital gains. Performance data current to the most recent month end may be obtained by calling 1-844-ETF-MGRS (1-844-383-6477).
The chart illustrates the performance of a hypothetical $10,000 investment made on May 12, 2021, and is not intended to imply any future performance. The returns shown do not reflect the deduction of taxes that a shareholder would pay on fund distributions from the sales of Fund shares. The chart assumes reinvestment of capital gains and dividends, if any. The Index Returns do not reflect fees or expenses and are not available for direct investment.
ETFMG U.S. Alternative Harvest ETF
Top Holdings as of September 30, 2023 (Unaudited)*
| | Security | | % of Total
Investments | |
| 1 | Innovative Industrial Properties, Inc. | | | 10.96 | % |
| 2 | AFC Gamma, Inc. | | | 6.00 | % |
| 3 | GrowGeneration Corp. | | | 5.49 | % |
| 4 | WM Technology, Inc. | | | 1.93 | % |
| 5 | Bright Green Corp. | | | 0.64 | % |
Top Holdings = 25.02% of Total Investments
| * | Current Fund holdings may not be indicative of future Fund holdings. |
ETFMG TM ETFs
Important Disclosures and Key Risk Factors
Investing involves risk, including the possible loss of principal. Shares of any ETF are bought and sold at market price (not NAV), may trade at a discount or premium to NAV and are not individually redeemed from the Fund. Brokerage commissions will reduce returns. Narrowly focused investments typically exhibit higher volatility.
Past performance is not indicative of future return. A fund’s performance for very short time periods may not be indicative of future performance.
MJ
The possession and use of marijuana, even for medical purposes, is illegal under federal and certain states’ laws, which may negatively impact the value of the Fund’s investments. Use of marijuana is regulated by both the federal government and state governments, and state and federal laws regarding marijuana often conflict. Even in those states in which the use of marijuana has been legalized, its possession and use remains a violation of federal law. Federal law criminalizing the use of marijuana pre-empts state laws that legalizes its use for medicinal and recreational purposes. Cannabis companies and pharmaceutical companies may never be able to legally produce and sell products in the United States or other national or local jurisdictions.
The Fund’s investments will be concentrated in an industry or group of industries to the extent that the Index is so concentrated. In such event, the value of the Fund’s shares may rise and fall more than the value of shares of a fund that invests in securities of companies in a broader range of industries. The consumer staples sector may be affected by the permissibility of using various product components and production methods, marketing campaigns and other factors affecting consumer demand. Tobacco companies, in particular, may be adversely affected by new laws, regulations and litigation. The consumer staples sector may also be adversely affected by changes or trends in commodity prices, which may be influenced or characterized by unpredictable factors.
Unlike with an actively managed fund, the Fund’s adviser does not use techniques or defensive strategies designed to lessen the effects of market volatility or to reduce the impact of periods of market decline. This means that, based on market and economic conditions, the Fund’s performance could be lower than other types of funds that may actively shift their portfolio assets to take advantage of market opportunities or to lessen the impact of a market decline.
Natural or environmental disasters, such as earthquakes, fires, floods, hurricanes, tsunamis and other severe weather-related phenomena generally, and widespread disease, including pandemics and epidemics, have been and may be highly disruptive to economies and markets, adversely impacting individual companies, sectors, industries, markets, currencies, interest and inflation rates, credit ratings, investor sentiment, and other factors affecting the value of the Fund’s investments. Given the increasing interdependence among global economies and markets, conditions in one country, market, or region are increasingly likely to adversely affect markets, issuers, and/or foreign exchange rates in other countries, including the U.S. Any such events could have a significant adverse impact on the value of the Fund’s investments.
Additionally, natural or environmental disasters, widespread disease or other public health issues, war, acts of terrorism or other events could result in increased premiums or discounts to the Fund’s NAV.
ETF Managers Group LLC is the investment adviser to the Fund.
Effective, August 14, 2023, the Fund is distributed by Foreside Fund Services LLC. ETF Managers Group LLC is a wholly owned subsidiary of Exchange Traded Managers Group LLC (collectively, “ETFMG”).
ETFMG TM ETFs
The Fund is intended to be made available only to U.S. residents. Under no circumstances is any information provided on this website intended for distribution to or use by, or to be an offer to sell to or solicitation of an offer to buy the Fund or any investment product or service of, any person or entity in any jurisdiction or country, other than the United States, where such distribution, use, offer or solicitation would subject the Fund or its affiliates to any registration requirement or be unlawful under the securities laws of that jurisdiction or country.
MJUS
The possession and use of marijuana, even for medical purposes, is illegal under federal and certain states’ laws, which may negatively impact the value of the Fund’s investments. Use of marijuana is regulated by both the federal government and state governments, and state and federal laws regarding marijuana often conflict. Even in those states in which the use of marijuana has been legalized, its possession and use remains a violation of federal law. Federal law criminalizing the use of marijuana pre-empts state laws that legalizes its use for medicinal and recreational purposes. Cannabis companies and pharmaceutical companies may never be able to legally produce and sell products in the United States or other national or local jurisdictions.
The Fund’s investments will be concentrated in an industry or group of industries to the extent that the Index is so concentrated. In such event, the value of the Fund’s shares may rise and fall more than the value of shares of a fund that invests in securities of companies in a broader range of industries. The consumer staples sector may be affected by the permissibility of using various product components and production methods, marketing campaigns and other factors affecting consumer demand. Tobacco companies, in particular, may be adversely affected by new laws, regulations and litigation. The consumer staples sector may also be adversely affected by changes or trends in commodity prices, which may be influenced or characterized by unpredictable factors.
Unlike with an actively managed fund, the Fund’s adviser does not use techniques or defensive strategies designed to lessen the effects of market volatility or to reduce the impact of periods of market decline. This means that, based on market and economic conditions, the Fund’s performance could be lower than other types of funds that may actively shift their portfolio assets to take advantage of market opportunities or to lessen the impact of a market decline.
Natural or environmental disasters, such as earthquakes, fires, floods, hurricanes, tsunamis and other severe weather- related phenomena generally, and widespread disease, including pandemics and epidemics, have been and may be highly disruptive to economies and markets, adversely impacting individual companies, sectors, industries, markets, currencies, interest and inflation rates, credit ratings, investor sentiment, and other factors affecting the value of the Fund’s investments. Given the increasing interdependence among global economies and markets, conditions in one country, market, or region are increasingly likely to adversely affect markets, issuers, and/or foreign exchange rates in other countries, including the U.S. Any such events could have a significant adverse impact on the value of the Fund’s investments.
Additionally, natural or environmental disasters, widespread disease or other public health issues, war, acts of terrorism or other events could result in increased premiums or discounts to the Fund’s NAV.
The Fund is a recently organized, diversified management investment company with limited operating history. ETF Managers Group LLC is the investment adviser to the Fund. Effective, August 14, 2023, the Fund is distributed by Foreside Fund Services LLC. ETF Managers Group LLC is a wholly owned subsidiary of Exchange Traded Managers Group LLC (collectively, “ETFMG”).
The Fund is intended to be made available only to U.S. residents. Under no circumstances is any information provided on this website intended for distribution to or use by, or to be an offer to sell to or solicitation of an offer to buy the Fund or any investment product or service of, any person or entity in any jurisdiction or country, other than the United States, where such distribution, use, offer or solicitation would subject the Fund or its affiliates to any registration requirement or be unlawful under the securities laws of that jurisdiction or country.
ETFMG TM ETFs
PORTFOLIO ALLOCATIONS
As of September 30, 2023 (Unaudited)
| | | ETFMG
Alternative
Harvest ETF | | | ETFMG U.S.
Alternative
Harvest ETF | |
| As a percent of Net Assets: | | | | | | |
| Australia | | | 0.8 | % | | | — | % |
| Canada | | | 30.2 | | | | — | |
| Denmark | | | 0.4 | | | | — | |
| Ireland | | | 0.4 | | | | — | |
| Israel | | | 0.4 | | | | — | |
| Mexico | | | 0.0 | * | | | — | |
| United Kingdom | | | 0.7 | | | | — | |
| United States | | | 15.4 | | | | 25.7 | |
| Exchange Traded Funds | | | 51.2 | | | | — | |
| Short-Term and other Net Assets (Liabilities) | | | 0.5 | | | | 74.3 | |
| | | | 100.0 | % | | | 100.0 | % |
| * | Amount is less than 0.05%. |
ETFMG Alternative Harvest ETF
Schedule of Investments
September 30, 2023
| | | Shares | | | Value | |
| COMMON STOCKS - 48.3% | | | | | | | | |
| Australia - 0.8% | | | | | | | | |
| Pharmaceuticals - 0.8% (f) | | | | | | | | |
| Incannex Healthcare, Ltd. (a) | | | 50,278,688 | | | $ | 2,198,216 | |
| | | | | | | | | |
| Canada - 30.2% | | | | | | | | |
| Food Products - 1.0% | | | | | | | | |
| Village Farms International, Inc. (a)(b) | | | 3,254,293 | | | | 2,595,299 | |
| Pharmaceuticals - 29.2% (f) | | | | | | | | |
| Aurora Cannabis, Inc. (a)(b) | | | 15,194,101 | | | | 8,888,549 | |
| Canopy Growth Corp. (a)(b) | | | 23,742,313 | | | | 18,585,483 | |
| Charlottes Web Holdings, Inc. (a)(b) | | | 1,438,144 | | | | 518,822 | |
| Cronos Group, Inc. (a)(b) | | | 8,699,810 | | | | 17,399,620 | |
| High Tide, Inc. (a)(b)(h) | | | 2,962,828 | | | | 5,453,392 | |
| Organigram Holdings, Inc. (a)(b) | | | 2,804,716 | | | | 3,702,225 | |
| SNDL, Inc. (a)(b) | | | 11,231,825 | | | | 21,340,469 | |
| Total Pharmaceuticals | | | | | | | 75,888,560 | |
| Total Canada | | | | | | | 78,483,859 | |
| | | | | | | | | |
| Denmark - 0.4% | | | | | | | | |
| Tobacco - 0.4% | | | | | | | | |
| Scandinavian Tobacco Group AS (g) | | | 58,993 | | | | 898,971 | |
| | | | | | | | | |
| Ireland - 0.4% | | | | | | | | |
| Pharmaceuticals - 0.4% (f) | | | | | | | | |
| Jazz Pharmaceuticals PLC (a) | | | 7,866 | | | | 1,018,175 | |
| | | | | | | | | |
| Israel - 0.4% | | | | | | | | |
| Pharmaceuticals - 0.4% (f) | | | | | | | | |
| Intercure, Ltd. (a)(b)(h) | | | 634,957 | | | | 1,003,232 | |
| | | | | | | | | |
| Mexico - 0.0% (d) | | | | | | | | |
| Construction & Engineering - 0.0% (d) | | | | | | | | |
| Empresas ICA SAB de CV (a)(c)(h) | | | 155,893 | | | | — | |
| | | | | | | | | |
| United Kingdom - 0.7% | | | | | | | | |
| Tobacco - 0.7% | | | | | | | | |
| British American Tobacco PLC | | | 31,117 | | | | 978,387 | |
| Imperial Brands PLC | | | 43,937 | | | | 893,643 | |
| Total Tobacco | | | | | | | 1,872,030 | |
| | | | | | | | | |
| United States - 15.4% | | | | | | | | |
| Chemicals - 0.7% | | | | | | | | |
| Mativ Holdings, Inc. | | | 56,897 | | | | 811,351 | |
| Scotts Miracle-Gro Co. (b) | | | 18,053 | | | | 932,979 | |
| Total Chemicals | | | | | | | 1,744,330 | |
| Machinery - 0.8% | | | | | | | | |
| Hydrofarm Holdings Group, Inc. (a)(b) | | | 1,696,482 | | | | 2,069,708 | |
| Pharmaceuticals - 6.8% (f) | | | | | | | | |
| Tilray Brands, Inc. (a)(b) | | | 7,443,357 | | | | 17,789,623 | |
| Real Estate Investment Trusts (REITs) - 3.8% | | | | | | | | |
| Chicago Atlantic Real Estate Finance, Inc. (b) | | | 590,085 | | | | 8,686,051 | |
| Innovative Industrial Properties, Inc. (b) | | | 14,415 | | | | 1,090,639 | |
| Total Real Estate Investment Trusts (REITs) | | | | | | | 9,776,690 | |
The accompanying notes are an integral part of these financial statements
ETFMG Alternative Harvest ETF
Schedule of Investments
September 30, 2023 (Continued)
| | | Shares | | | Value | |
| Software - 1.8% | | | | | | | | |
| WM Technology, Inc. (a)(b) | | | 3,470,998 | | | $ | 4,581,717 | |
| Tobacco - 1.5% | | | | | | | | |
| 22nd Century Group, Inc. (a)(b) | | | 326,151 | | | | 318,910 | |
| Altria Group, Inc. | | | 23,008 | | | | 967,486 | |
| Philip Morris International, Inc. | | | 10,465 | | | | 968,850 | |
| Turning Point Brands, Inc. | | | 40,091 | | | | 925,701 | |
| Vector Group, Ltd. | | | 77,860 | | | | 828,430 | |
| Total Tobacco | | | | | | | 4,009,377 | |
| Total United States | | | | | | | 39,971,445 | |
| TOTAL COMMON STOCKS (Cost $303,125,651) | | | | | | | 125,445,928 | |
| | | | | | | | | |
| EXCHANGE TRADED FUNDS - 51.2% | | | | | | | | |
| ETFMG U.S. Alternative Harvest ETF (b)(f) | | | 71,870,029 | | | | 132,937,993 | |
| TOTAL EXCHANGE TRADED FUNDS (Cost $144,643,733) | | | | | | | 132,937,993 | |
| | | | | | | | | |
| INVESTMENTS PURCHASED WITH PROCEEDS FROM | | | | | | | | |
| SECURITIES LENDING COLLATERAL - 37.3% | | | | | | | | |
| Mount Vernon Liquid Assets Portfolio, LLC, 5.50% (e) | | | 96,949,571 | | | | 96,949,571 | |
| TOTAL INVESTMENTS PURCHASED WITH PROCEEDS FROM SECURITIES LENDING COLLATERAL (Cost $96,949,571) | | | | | | | 96,949,571 | |
| | | | | | | | | |
| SHORT-TERM INVESTMENTS - 0.1% | | | | | | | | |
| Money Market Funds - 0.1% | | | | | | | | |
| First American Government Obligations Fund - Class X, 5.26% (e) | | | 233,833 | | | | 233,833 | |
| TOTAL SHORT-TERM INVESTMENTS (Cost $233,833) | | | | | | | 233,833 | |
| | | | | | | | | |
| Total Investments (Cost $544,952,788) - 136.9% | | | | | | | 355,567,325 | |
| Liabilities in Excess of Other Assets - (36.9)% | | | | | | | (95,887,301 | ) |
| TOTAL NET ASSETS - 100.0% | | | | | | $ | 259,680,024 | |
Percentages are stated as a percent of net assets.
PLC Public Limited Company
| (a) | Non-income producing security. |
| (b) | This security or a portion of this security was out on loan at September 30, 2023. |
| (c) | Value determined using significant unobservable inputs. The value of these securities total $0, which represents 0.0% of total net assets. Classified as Level 3 in the fair value hierarchy. |
| (d) | Amount is less than 0.05%. |
| (e) | The rate shown is the annualized seven-day yield at period end. |
| (f) | As of September 30, 2023, the Fund had a significant portion of its assets in the Pharmaceutical industry. |
| (g) | Security exempt from registration pursuant to Rule 144A under the Securities Act of 1933, as amended. This security may be resold in transitions exempt from registration to qualified institutional investors. At September 30, 2023, the market value of this security totals $898,971; which represents 0.4% of total net assets. |
| (h) | This security has been deemed illiquid according to the Fund’s liquidity guidelines. The value of these securities total $6,456,624, which represents 2.49% of total net assets. |
The Global Industry Classification Standard (GICS®) was developed by and/or is the exclusive property of MSCI, Inc. and Standard & Poor’s Financial Services LLC (“S&P”). GICS is a service mark of MSCI and S&P and has been licensed for use by U.S. Bancorp Fund Services, LLC, doing business as U.S. Bank Global Fund Services (“Fund Services”).
The accompanying notes are an integral part of these financial statements.
ETFMG U.S. Alternative Harvest ETF
Schedule of Investments
September 30, 2023
| | | Shares | | | Value | |
| COMMON STOCKS - 25.7% | | | | | | | | |
| United States - 25.7% | | | | | | | | |
| Pharmaceuticals - 0.7% | | | | | | | | |
| Bright Green Corp. (a) | | | 2,266,223 | | | $ | 897,198 | |
| Real Estate Investment Trusts (REITs) - 17.4% | | | | | | | | |
| AFC Gamma, Inc. (b) | | | 718,574 | | | | 8,436,059 | |
| Innovative Industrial Properties, Inc. (b) | | | 203,593 | | | | 15,403,846 | |
| Total Real Estate Investment Trusts (REITs) | | | | | | | 23,839,905 | |
| Software - 2.0% | | | | | | | | |
| WM Technology, Inc. (a) | | | 2,057,606 | | | | 2,716,040 | |
| Specialty Retail - 5.6% | | | | | | | | |
| GrowGeneration Corp. (a) | | | 2,640,585 | | | | 7,710,508 | |
| Total United States | | | | | | | 35,163,651 | |
| TOTAL COMMON STOCKS (Cost $44,216,937) | | | | | | | 35,163,651 | |
| | | | | | | | | |
| INVESTMENTS PURCHASED WITH PROCEEDS FROM | | | | | | | | |
| SECURITIES LENDING COLLATERAL - 3.4% | | | | | | | | |
| Mount Vernon Liquid Assets Portfolio, LLC, 5.50% (c) | | | 4,735,800 | | | | 4,735,800 | |
| TOTAL INVESTMENTS PURCHASED WITH PROCEEDS FROM SECURITIES LENDING COLLATERAL (Cost $4,735,800) | | | | | | | 4,735,800 | |
| | | | | | | | | |
| SHORT-TERM INVESTMENTS - 73.4% | | | | | | | | |
| Money Market Funds - 10.2% | | | | | | | | |
| First American Government Obligations Fund - Class X, 5.26% (c) | | | 13,977,274 | | | | 13,977,274 | |
| U.S. Treasury Bills - 63.2% (d) | | | | | | | | |
| 5.28%, 10/03/2023 | | | 2,722,000 | | | | 2,721,223 | |
| 5.35%, 11/02/2023 | | | 7,377,000 | | | | 7,342,902 | |
| 5.37%, 11/09/2023 | | | 5,767,000 | | | | 5,734,388 | |
| 5.36%, 11/24/2023 | | | 6,558,000 | | | | 6,506,847 | |
| 5.40%, 11/28/2023 | | | 2,796,000 | | | | 2,772,395 | |
| 5.39%, 11/30/2023 | | | 1,100,000 | | | | 1,090,409 | |
| 5.39%, 12/05/2023 | | | 15,619,000 | | | | 15,471,772 | |
| 5.39%, 12/07/2023 | | | 21,174,000 | | | | 20,967,968 | |
| 5.40%, 12/14/2023 | | | 5,992,000 | | | | 5,927,550 | |
| 5.42%, 12/28/2023 | | | 18,398,000 | | | | 18,162,130 | |
| Total U.S. Treasury Bills | | | | | | | 86,697,584 | |
| TOTAL SHORT-TERM INVESTMENTS (Cost $100,672,699) | | | | | | | 100,674,858 | |
| | | | | | | | | |
| Total Investments (Cost $149,625,436) - 102.5% | | | | | | | 140,574,309 | |
| Liabilities in Excess of Other Assets - (2.5)% | | | | | | | (3,450,247 | ) |
| TOTAL NET ASSETS - 100.0% | | | | | | $ | 137,124,062 | |
Percentages are stated as a percent of net assets.
| (a) | Non-income producing security. |
| (b) | This security or a portion of this security was out on loan at September 30, 2023. |
| (c) | The rate shown is the seven-day yield at September 30, 2023. |
| (d) | The rate shown is the effective yield at September 30, 2023. |
The Global Industry Classification Standard (GICS®) was developed by and/or is the exclusive property of MSCI, Inc. and Standard & Poor’s Financial Services LLC (“S&P”). GICS is a service mark of MSCI and S&P and has been licensed for use by U.S. Bancorp Fund Services, LLC, doing business as U.S. Bank Global Fund Services (“Fund Services”).
The accompanying notes are an integral part of these financial statements.
ETFMG U.S. Alternative Harvest ETF
Schedule of Total Return Swaps
September 30,2023
Long Total Return
Equity Swaps* | | Counterparty | | Payment
Frequency | | Financing
Rate | | Expiration
Date | | Notional
Amount | | | Unrealized
Appreciation
(Depreciation) | |
| Cannabist Co. Holdings | | National Bank of Canada | | Monthly | | SOFRRATE Index + 1.50% | | November 4, 2024 | | $ | 7,160,342 | | | $ | — | |
| Cresco Labs | | National Bank of Canada | | Monthly | | SOFRRATE Index + 1.50% | | November 4, 2024 | | | 6,045,334 | | | | — | |
| Curaleaf Holdings | | National Bank of Canada | | Monthly | | SOFRRATE Index + 1.50% | | November 4, 2024 | | | 16,391,794 | | | | — | |
| Glass House Brands | | National Bank of Canada | | Monthly | | SOFRRATE Index + 1.50% | | November 4, 2024 | | | 1,777,412 | | | | — | |
| Green Thumb Industries | | National Bank of Canada | | Monthly | | SOFRRATE Index + 1.50% | | November 4, 2024 | | | 25,115,476 | | | | — | |
| Marimed | | National Bank of Canada | | Monthly | | SOFRRATE Index + 1.50% | | November 4, 2024 | | | 785,081 | | | | — | |
| Planet 13 Holdings | | National Bank of Canada | | Monthly | | SOFRRATE Index + 1.50% | | November 4, 2024 | | | 1,346,342 | | | | — | |
| Terrascend | | National Bank of Canada | | Monthly | | SOFRRATE Index + 1.50% | | November 4, 2024 | | | 12,838,455 | | | | — | |
| Trulieve Cannabis | | National Bank of Canada | | Monthly | | SOFRRATE Index + 1.50% | | November 4, 2024 | | | 18,601,728 | | | | — | |
| Verano Holdings - Class A | | National Bank of Canada | | Monthly | | SOFRRATE Index + 1.50% | | November 4, 2024 | | | 8,621,636 | | | | — | |
| | | | | | | | | | | $ | 98,683,600 | | | $ | — | |
| * | Total return swaps are in a basket swap agreement. |
The accompanying notes are an integral part of these financial statements.
ETFMG TM ETFs
STATEMENTS OF ASSETS AND LIABILITIES
As of September 30, 2023
| | | ETFMG
Alternative
Harvest ETF | | | ETFMG U.S.
Alternative
Harvest ETF | |
| ASSETS | | | | | | |
| Investments in unaffiliated securities, at value* | | $ | 222,629,332 | | | $ | 140,574,309 | |
| Investments in affiliated securities, at value* | | | 132,937,993 | | | | — | |
| Foreign currency* | | | 955 | | | | 591 | |
| Receivables: | | | | | | | | |
| Dividends and interest receivable | | | 428,398 | | | | 756,649 | |
| Securities lending income receivable | | | 653,106 | | | | 569 | |
| Receivable for open swap contracts | | | — | | | | 615,627 | |
| Total assets | | | 356,649,784 | | | | 141,947,745 | |
| | | | | | | | | |
| LIABILITIES | | | | | | | | |
| Collateral received for securities loaned (Note 7) payables: | | $ | 96,949,571 | | | $ | 4,735,800 | |
| Management fees payable | | | 85,438 | | | | 87,883 | |
| Total liabilities | | | 97,035,009 | | | | 4,823,683 | |
| Net Assets | | $ | 259,614,775 | | | $ | 137,124,062 | |
| | | | | | | | | |
| NET ASSETS CONSIST OF: | | | | | | | | |
| Paid-in Capital | | $ | 2,118,341,870 | | | $ | 163,972,082 | |
| Total Distributable Earnings (Accumulated Losses) | | | (1,858,727,095 | ) | | | (26,848,020 | ) |
| Net Assets | | $ | 259,614,775 | | | $ | 137,124,062 | |
| | | | | | | | | |
| *Identified Cost: | | | | | | | | |
| | | | | | | | | |
| Investments in unaffiliated securities | | $ | 400,309,055 | | | $ | 149,625,436 | |
| Investments in affiliated securities | | | 144,643,733 | | | | — | |
| Foreign currency | | | 953 | | | | 580 | |
| | | | | | | | | |
| Shares Outstanding^ | | | 71,400,000 | | | | 73,830,000 | |
| | | | | | | | | |
| Net Asset Value, Offering and Redemption | | | | | | | | |
| Price per Share | | $ | 3.64 | | | $ | 1.86 | |
| ^ | No par value, unlimited number of shares authorized |
The accompanying notes are an integral part of these financial statements.
ETFMG TM ETFs
STATEMENTS OF OPERATIONS
For the Year Ended September 30, 2023
| | | ETFMG
Alternative
Harvest ETF | | | ETFMG U.S.
Alternative
Harvest ETF | |
| INVESTMENT INCOME | | | | | | |
| Income: | | | | | | |
| Dividends from unaffiliated securities (net of foreign withholdings tax & issuance fees of $17,193 and $-) | | $ | 2,344,074 | | | $ | 2,939,406 | |
| Dividends from affiliated securities | | | 1,017,209 | | | | — | |
| Interest | | | 176,778 | | | | 3,230,241 | |
| Securities lending income | | | 5,881,042 | | | | 32,681 | |
| Total Investment Income | | | 8,118,418 | | | | 6,202,328 | |
| | | | | | | | | |
| Expenses: | | | | | | | | |
| Unitary fees | | | 2,106,003 | | | | 827,565 | |
| Interest Expense | | | — | | | | 8,585 | |
| Total Expenses | | | 2,106,003 | | | | 836,150 | |
| Less waivers | | | (805,318 | ) | | | — | |
| Net Expenses | | | 1,300,685 | | | | 836,150 | |
| Net Investment Income | | | 8,118,418 | | | | 5,366,178 | |
| | | | | | | | | |
| REALIZED & UNREALIZED GAIN (LOSS) ON INVESTMENTS AND SWAP CONTRACTS | | | | | | | | |
| Net Realized Gain (Loss) on: | | | | | | | | |
| Unaffiliated Investments | | | (451,234,065 | ) | | | (9,715,878 | ) |
| Affiliated Investments | | | (27,006,742 | ) | | | — | |
| In-Kind redemptions | | | (108,000 | ) | | | — | |
| Foreign currency and foreign currency translation | | | (11,527 | ) | | | (1,524 | ) |
| Swap contracts | | | — | | | | (5,854,648 | ) |
| Net Realized Loss on Investments, Swap Contracts and In-Kind redemptions | | | (478,360,334 | ) | | | (15,572,050 | ) |
| Net Change in Unrealized Appreciation (Depreciation) of: | | | | | | | | |
| Unaffiliated Investments | | | 395,831,561 | | | | (2,096,630 | ) |
| Affiliated Investments | | | 15,320,528 | | | | — | |
| Foreign currency and foreign currency translation | | | 1,902 | | | | 11 | |
| Net change in Unrealized Appreciation (Depreciation) on Investments and Swap Contracts | | | 411,153,991 | | | | (2,096,619 | ) |
| Net Realized and Unrealized Loss on Investments and Swap Contracts | | | (67,206,343 | ) | | | (17,668,669 | ) |
| NET DECREASE IN NET ASSETS RESULTING FROM OPERATIONS | | $ | (59,087,925 | ) | | $ | (12,302,491 | ) |
The accompanying notes are an integral part of these financial statements.
ETFMG Alternative Harvest ETF
STATEMENTS OF CHANGES IN NET ASSETS
| | | Year Ended
September 30,
2023 | | | Year Ended
September 30,
2022 | |
| OPERATIONS | | | | | | |
| Net investment income | | $ | 8,118,418 | | | $ | 12,750,826 | |
| Net realized loss on investments and n-Kind redemptions | | | (478,360,334 | ) | | | (422,246,484 | ) |
| Net change in unrealized appreciation (depreciation) of investments and foreign currency and foreign currency translation | | | 411,153,991 | | | | (276,724,561 | ) |
| Net decrease in net assets resulting from operations | | | (59,087,925 | ) | | | (686,220,219 | ) |
| | | | | | | | | |
| DISTRIBUTIONS TO SHAREHOLDERS | | | | | | | | |
| Total distributions from distributable earnings | | | (8,926,095 | ) | | | (12,808,889 | ) |
| | | | | | | | | |
| CAPITAL SHARE TRANSACTIONS | | | | | | | | |
| Net increase (decrease) in net assets derived from net change in outstanding shares | | | 2,899,060 | | | | (43,884,655 | ) |
| Transaction Fees (See Note 1) | | | — | | | | 34,194 | |
| Net increase (decrease) in net assets from capital share transactions | | | 2,899,060 | | | | (43,850,461 | ) |
| Total decrease in net assets | | | (65,114,960 | ) | | | (742,879,569 | ) |
| | | | | | | | | |
| NET ASSETS | | | | | | | | |
| Beginning of Year | | | 324,729,735 | | | | 1,067,609,304 | |
| End of Year | | $ | 259,614,775 |
| | $ | 324,729,735 | |
Summary of share transactions is as follows:
| | | Year Ended
September 30, 2023 | | | Year Ended
September 30, 2022 | |
| | | Shares | | | Amount | | | Shares | | | Amount | |
| Shares Sold | | | 3,400,000 | | | $ | 13,603,540 | | | | 10,700,000 | | | $ | 91,358,945 | |
| Transaction Fees (See Note 1) | | | — | | | | — | | | | — | | | | 34,194 | |
| Shares Redeemed | | | (2,250,000 | ) | | | (10,704,480 | ) | | | (14,600,000 | ) | | | (135,243,600 | ) |
| Net Transactions in Fund Shares | | | 1,150,000 | | | $ | 2,899,060 | | | | (3,900,000 | ) | | $ | (43,850,461 | ) |
| Beginning Shares | | | 70,250,000 | | | | | | | | 74,150,000 | | | | | |
| Ending Shares | | | 71,400,000 | | | | | | | | 70,250,000 | | | | | |
The accompanying notes are an integral part of these financial statements.
ETFMG U.S. Alternative Harvest ETF
STATEMENTS OF CHANGES IN NET ASSETS
| | | Year Ended
September 30,
2023 | | | Year Ended
September 30,
2022 | |
| OPERATIONS | | | | | | |
| Net investment income | | $ | 5,366,178 | | | $ | 582,391 | |
| Net realized loss on investments, swap contracts and In-Kind redemptions | | | (15,572,050 | ) | | | (23,603,615 | ) |
| Net change in unrealized depreciation of investments and swap contracts | | | (2,096,619 | ) | | | (6,749,745 | ) |
| Net decrease in net assets resulting from operations | | | (12,302,491 | ) | | | (29,770,969 | ) |
| | | | | | | | | |
| CAPITAL SHARE TRANSACTIONS | | | | | | | | |
| Net increase in net assets derived from net change in outstanding shares | | | 64,459,957 | | | | 108,640,243 | |
| Total increase in net assets | | | 52,157,466 | | | | 78,869,274 | |
| | | | | | | | | |
| NET ASSETS | | | | | | | | |
| Beginning of Year | | | 84,966,596 | | | | 6,097,322 | |
| End of Year | | $ | 137,124,062 | | | $ | 84,966,596 | |
Summary of share transactions is as follows:
| | | | Year Ended
September 30, 2023 | | | Year Ended
September 30, 2022 | |
| | | | Shares | | | Amount | | | Shares | | | Amount | |
| Shares Sold | | | | 56,940,000 | | | $ | 100,679,726 | | | | 38,920,000 | | | $ | 110,968,118 | |
| Shares Redeemed | | | | (22,390,000 | ) | | | (36,219,769 | ) | | | (430,000 | ) | | | (2,327,875 | ) |
| Net Transactions in Fund Shares | | | | 34,550,000 | | | $ | 64,459,957 | | | | 38,490,000 | | | $ | 108,640,243 | |
| Beginning Shares | | | | 39,280,000 | | | | | | | | 790,000 | | | | | |
| Ending Shares | | | | 73,830,000 | | | | | | | | 39,280,000 | | | | | |
The accompanying notes are an integral part of these financial statements.
ETFMG Alternative Harvest ETF
FINANCIAL HIGHLIGHTS
For a capital share outstanding throughout each year
| | | Year Ended
September 30,
2023 | | | Year Ended
September 30,
2022 | | | Year Ended
September 30,
2021 | | | Year Ended
September 30,
2020 | | | Year Ended
September 30,
2019 | |
| Net Asset Value, Beginning Year | | $ | 4.62 | | | $ | 14.40 | | | $ | 10.37 | | | $ | 20.83 | | | $ | 39.74 | |
| Income (Loss) from Investment Operations: | | | | | | | | | | | | | | | | | | | | |
| Net investment income1 | | | 0.12 | | | | 0.18 | | | | 0.26 | | | | 0.91 | | | | 1.02 | |
| Net realized and unrealized gain (loss) on investments | | | (0.98 | ) | | | (9.78 | ) | | | 4.01 | | | | (10.49 | ) | | | (18.96 | ) |
| Total from investment operations | | | (0.86 | ) | | | (9.60 | ) | | | 4.27 | | | | (9.58 | ) | | | (17.94 | ) |
| Less Distributions: | | | | | | | | | | | | | | | | | | | | |
| Distributions from net investment income | | | (0.12 | ) | | | (0.18 | ) | | | (0.24 | ) | | | (0.88 | ) | | | (0.97 | ) |
| Net realized gains | | | — | | | | — | | | | — | | | | — | | | | — | |
| Total distributions | | | (0.12 | ) | | | (0.18 | ) | | | (0.24 | ) | | | (0.88 | ) | | | (0.97 | ) |
| Net asset value, end year | | $ | 3.64 | | | $ | 4.62 | | | $ | 14.40 | | | $ | 10.37 | | | $ | 20.83 | |
| Total Return | | | (18.67 | )% | | | (67.06 | )% | | | 40.90 | % | | | (46.83 | )% | | | (45.60 | )% |
| | | | | | | | | | | | | | | | | | | | | |
| Ratios/Supplemental Data: | | | | | | | | | | �� | | | | | | | | | | |
| Net assets at end year (000’s) | | $ | 259,615 | | | $ | 324,730 | | | $ | 1,067,609 | | | $ | 495,971 | | | $ | 800,957 | |
| |
|
| | |
|
| | | | | | | | | | | | | |
| Expenses to Average Net Assets before waiver | | | 0.75 | % | | | 0.75 | % | | | 0.75 | % | | | 0.75 | % | | | 0.75 | % |
| Expenses to Average Net Assets after waiver | | | 0.46 | % | | | 0.75 | % | | | 0.75 | % | | | 0.75 | % | | | 0.75 | % |
| Net Investment Income to Average Net Assets | | | 2.89 | % | | | 1.95 | % | | | 1.39 | % | | | 6.27 | % | | | 3.26 | % |
| Portfolio Turnover Rate | | | 60 | % | | | 74 | % | | | 75 | % | | | 46 | % | | | 71 | % |
| 1 | Calculated based on average shares outstanding during the year. |
The accompanying notes are an integral part of these financial statements.
ETFMG U.S. Alternative Harvest ETF
FINANCIAL HIGHLIGHTS
For a capital share outstanding throughout each year/period
| | | Year Ended
September 30,
2023 | | | Year Ended
September 30,
2022 | | | Period Ended
September 30,
20211 | |
| Net Asset Value, Beginning Year/Period | | $ | 2.16 | | | $ | 7.72 | | | $ | 10.00 | |
| Income (Loss) from Investment Operations: | | | | | | | | | | | | |
| Net investment income (loss) 2 | | | 0.08 | | | | 0.13 | | | | (0.01 | ) |
| Net realized and unrealized gain (loss) on investments | | | (0.38 | ) | | | (5.69 | ) | | | (2.27 | ) |
| Total from investment operations | | | (0.30 | ) | | | (5.56 | ) | | | (2.28 | ) |
| Net asset value, end year/period | | $ | 1.86 | | | $ | 2.16 | | | $ | 7.72 | |
| Total Return | | | (14.14 | )% | | | (71.97 | )% | | | (22.82 | )%3 |
| | | | | | | | | | | | | |
| Ratios/Supplemental Data: | | | | | | | | | | | | |
| Net assets at end of year/period (000’s) | | $ | 137,124 | | | $ | 84,967 | | | $ | 6,097 | |
| | | | | | | | | | | | | |
| Gross Expenses to Average Net Assets | | | 0.76 | %5 | | | 0.75 | % | | | 0.75 | %4 |
| Net Investment Income (Loss) to Average Net Assets | | | 4.86 | % | | | 4.45 | % | | | (0.38 | )%4 |
| Portfolio Turnover Rate | | | 55 | % | | | 12 | % | | | 16 | %3 |
| 1 | The Fund commenced operations on May 12, 2021. |
| 2 | Calculated based on average shares outstanding during the year/period. |
| 3 | Not annualized. |
| 4 | Annualized. |
| 5 | Includes 0.01% of interest expense at September 30, 2023. |
The accompanying notes are an integral part of these financial statements.
ETFMG TM ETFs
NOTES TO FINANCIAL STATEMENTS
September 30, 2023
NOTE 1 – ORGANIZATION
ETFMG Alternative Harvest ETF (“MJ”) and ETFMG U.S. Alternative Harvest ETF (“MJUS”) (each a “Fund”, or collectively the “Funds”) are series of ETF Managers Trust (the “Trust”), an open-end management investment company consisting of multiple investment series, organized as a Delaware statutory trust on July 1, 2009. The Trust is registered with the SEC under the Investment Company Act of 1940, as amended (the “1940 Act”), as an open-end management investment company and the offering of the Funds’ shares (“Shares”) is registered under the Securities Act of 1933, as amended (the “Securities Act”).
The following table is a summary of the Strategy Commencement Date and Strategy of the Funds:
| Fund Ticker | | Strategy
Commencement
Date | | Strategy |
| ETFMG Alternative Harvest ETF | | 12/3/2015 | | Seeks to provide investment results that, before fees and expenses, correspond generally to the total return performance of the Prime Alternative Harvest Index (the “Index”). |
| ETFMG U.S. Alternative Harvest ETF | | 5/12/2021 | | Seeks to achieve its investment objective by investing, under normal circumstances, at least 80% of its net assets (plus any borrowings for investment purposes) in securities of companies that derive at least 50% of their net revenue from the “Cannabis Business” in the United States, and in derivatives that have economic characteristics similar to such securities. |
The Funds may use a combination of swaps on the Index and swaps on an ETF whose investment objective is to track the performance of the same, or a substantially similar index to achieve their investment objective.
The Funds each currently offer one class of shares, which have no front end sales load, no deferred sales charges, and no redemption fees. The Funds may issue an unlimited number of shares of beneficial interest, with no par value. All shares of each Fund have equal rights and privileges.
Shares of the Funds are listed and traded on the NYSE Arca, Inc. Market prices for the shares may be different from their net asset value (“NAV”). Each Fund issues and redeems shares on a continuous basis at NAV only in blocks of 50,000 shares, called “Creation Units.” Creation Units are issued and redeemed principally in-kind for securities included in a specified Index. Once created, shares generally trade in the secondary market at market prices that change throughout the day in quantities less than a Creation Unit. Except when aggregated in Creation Units, shares are not redeemable securities of a Fund. Shares of a Fund may only be purchased or redeemed by certain financial institutions (“Authorized Participants”). An Authorized Participant is either (i) a broker-dealer or other participant in the clearing process through the Continuous Net Settlement System of the National Securities Clearing Corporation or (ii) a DTC participant and, in each case, must have executed a Participant Agreement with the Distributor. Most retail investors do not qualify as Authorized Participants nor have the resources to buy and sell whole Creation Units. Therefore, they are unable to purchase or redeem the shares directly from a Fund. Rather, most retail investors may purchase Shares in the secondary market with the assistance of a broker and may be subject to customary brokerage commissions or fees.
NOTES TO FINANCIAL STATEMENTS
September 30, 2023
Authorized Participants transacting in Creation Units for cash may pay an additional variable charge to compensate the relevant Fund for certain transaction costs (i.e., brokerage costs) and market impact expenses relating to investing in portfolio securities. Such variable charges, if any, are included in Transaction Fees” in the Statements of Changes in Net Assets.
NOTE 2 – SIGNIFICANT ACCOUNTING POLICIES
The following is a summary of significant accounting policies consistently followed by the Funds. These policies are in conformity with accounting principles generally accepted in the United States of America (“U.S. GAAP”).
The Funds follow the investment company accounting and reporting guidance of the Financial Accounting Standards Board Accounting Standard Codification Topic 946 Financial Services – Investment Companies.
The Funds may invest in certain other investment companies (underlying funds). For more information about each underlying Fund’s operations and policies, please refer to those Fund’s semiannual and annual reports, which are filed with the SEC.
| A. | Security Valuation. Securities listed on a securities exchange, market or automated quotation system for which quotations are readily available (except for securities traded on NASDAQ), including securities traded over the counter, are valued at the last quoted sale price on the primary exchange or market (foreign or domestic) on which they are traded on the valuation date (or at approximately 4:00 pm Eastern Time if a security’s primary exchange is normally open at that time), or, if there is no such reported sale on the valuation date, at the most recent quoted bid price. For securities traded on NASDAQ, the NASDAQ Official Closing Price will be used. |
Securities for which quotations are not readily available are valued at their respective fair values as determined in good faith by ETF Managers Group, LLC (the “Adviser”), using procedures adopted by the Board of Trustees (the “Board”). When a security is “fair valued,” consideration is given to the facts and circumstances relevant to the particular situation, including a review of various factors set forth in the pricing procedures adopted by the Funds’ Board. The use of fair value pricing by a Fund may cause the net asset value of its shares to differ significantly from the net asset value that would be calculated without regard to such considerations. As of September 30, 2023, the ETFMG Alternative Harvest ETF held one security that was fair valued by the Adviser.
As described above, the Funds utilize various methods to measure the fair value of their investments on a recurring basis. U.S. GAAP establishes a hierarchy that prioritizes inputs to valuation methods. The three levels of inputs are:
| | Level 1 | Unadjusted quoted prices in active markets for identical assets or liabilities that the Funds have the ability to access. |
| | | |
| | Level 2 | Observable inputs other than quoted prices included in Level 1 that are observable for the asset or liability, either directly or indirectly. These inputs may include quoted prices for the identical instrument on an inactive market, prices for similar instruments, interest rates, prepayment speeds, credit risk, yield curves, default rates and similar data. |
| | | |
| | Level 3 | Unobservable inputs for the asset or liability, to the extent relevant observable inputs are not available; representing the Funds’ own assumptions about the assumptions a market participant would use in valuing the asset or liability, and would be based on the best information available. |
NOTES TO FINANCIAL STATEMENTS
September 30, 2023
|
| The availability of observable inputs can vary from security to security and is affected by a wide variety of factors, including, for example, the type of security, whether the security is new and not yet established in the marketplace, the liquidity of markets, and other characteristics particular to the security. To the extent that valuation is based on models or inputs that are less observable or unobservable in the market, the determination of fair value requires more judgment. Accordingly, the degree of judgment exercised in determining fair value is greatest for instruments categorized in Level 3. |
|
| The inputs used to measure fair value may fall into different levels of the fair value hierarchy. In such cases, for disclosure purposes, the level in the fair value hierarchy within which the fair value measurement falls in its entirety, is determined based on the lowest level input that is significant to the fair value measurement in its entirety. |
|
| The following table presents a summary of the Funds’ investments in securities and swap contracts at fair value, as of September 30, 2023: |
ETFMG Alternative Harvest ETF
Assets^ | | Level 1 | | | Level 2 | | | Level 3 | | | Total | |
| Common Stocks | | $ | 125,445,928 | | | $ | — | | | $ | — | (1) | | $ | 125,445,928 | |
| Short-Term Investments | | | 233,833 | | | | — | | | | — | | | | 233,833 | |
| ETFMG U.S. Alternative Harvest ETF | | | 132,937,993 | | | | — | | | | — | | | | 132,937,993 | |
| Investments Purchased with Securities Lending Collateral* | | | — | | | | — | | | | — | | | | 96,949,571 | |
| Total Investments in Securities | | $ | 258,617,754 | | | $ | — | | | $ | — | | | $ | 355,567,325 |
|
ETFMG U.S. Alternative Harvest ETF
Assets^ | | Level 1 | | | Level 2 | | | Level 3 | | | Total | |
| Common Stocks | | $ | 35,163,651 | | | $ | — | | | $ | — |
| | $ | 35,163,651 | |
| Short-Term Investments | | | 13,977,274 | | | | 86,697,584 | | | | — | | | | 100,674,858 | |
| Investments Purchased with Securities Lending Collateral* | | | — | | | | — | | | | — | | | | 4,735,800 | |
| Total Investments in Securities | | $ | 49,140,925 | | | $ | 86,697,584 | | | $ | — | | | $ | 140,574,309 | |
| Swap Contracts** | | Level 1 | | | | Level 2 | | | | Level 3 | | | | Total | |
| Long Total Return Equity Swap Contracts | | $ | — | | | $ | — | | | $ | — | | | $ | — | |
| Total Swap Contracts | | $ | — | | | $ | — | | | $ | — | | | $ | — | |
| (1) | Includes a security valued at $0 with a cost of $0. |
| | ^ | See Schedule of Investments for classifications by country and industry. |
| | * | Certain investments that are measured at fair value used the net asset value per share (or its equivalent) practical expedient have not been categorized in the fair value hierarchy. The fair value amounts presented in the table are intended to permit reconciliation of the fair value hierarchy to the amounts presented in the Schedules of Investments. |
| | ** | Swap contracts are derivative instruments, which are presented at the unrealized appreciation/depreciation on the instrument. |
NOTES TO FINANCIAL STATEMENTS
September 30, 2023
| B. | Federal Income Taxes. The Funds have each elected to be taxed as a “regulated investment company” and intend to distribute substantially all taxable income to their shareholders and otherwise comply with the provisions of the Internal Revenue Code applicable to regulated investment companies. Therefore, no provisions for federal income taxes or excise taxes have been made. |
| | | |
| | | To avoid imposition of the excise tax applicable to regulated investment companies, each Fund intends to declare each year as dividends, in each calendar year, at least 98.0% of its net investment income (earned during the calendar year) and 98.2% of its net realized capital gains (earned during the twelve months ended October 31) plus undistributed amounts, if any, from prior years. |
| | | |
| | | Net capital losses incurred after October 31, within the taxable year are deemed to arise on the first business day of each Fund’s next taxable year. |
| | | |
| | | Each Fund recognizes the tax benefits of uncertain tax positions only where the position is “more likely than not” to be sustained assuming examination by tax authorities. Each Fund has analyzed its tax position and has concluded that no liability for unrecognized tax benefits should be recorded related to uncertain tax positions expected to be taken in the Funds’ 2023 tax returns. The Funds identify their major tax jurisdictions as U.S. Federal, the State of New Jersey, and the State of Delaware; however the Funds are not aware of any tax positions for which it is reasonably possible that the total amounts of unrecognized tax benefits will change materially in the next twelve months. |
| | | |
| | | As of September 30, 2023, the Funds’ most recent fiscal year end, management has reviewed the tax positions for open periods (for Federal purposes, three years from the date of filing and for state purposes, generally a range of three to four years from the date of filing), as applicable to the Funds, and has determined that no provision for income tax is required in the Funds’ financial statements. |
| | | |
| | C. | Security Transactions and Investment Income. Investment securities transactions are accounted for on the trade date. Gains and losses realized on sales of securities are determined on a specific identification basis. Discounts/premiums on debt securities purchased are accreted/amortized over the life of the respective securities using the effective interest method. Dividend income is recorded on the ex-dividend date. Interest income is recorded on an accrual basis. Income, including gains, from investments in foreign securities received by the Funds may be subject to income, withholding or other taxes imposed by foreign countries. |
| | | |
| | D. | Foreign Currency Translations and Transactions. The Funds may engage in foreign currency transactions. Foreign currency transactions are translated into U.S. dollars on the following basis: (i) market value of investment securities, assets and liabilities at the daily rates of exchange, and (ii) purchases and sales of investment securities, dividend and interest income and certain expenses at the rates of exchange prevailing on the respective dates of such transactions. For financial reporting purposes, the Funds do not isolate changes in the exchange rate of investment securities from the fluctuations arising from changes in the market prices of securities for unrealized gains and losses. However, for federal income tax purposes, the Funds do isolate and treat as ordinary income the effect of changes in foreign exchange rates on realized gains or losses from the sale of investment securities and payables and receivables arising from trade-date and settlement-date differences. |
NOTES TO FINANCIAL STATEMENTS
September 30, 2023
| E. | Distributions to Shareholders. Distributions to shareholders from net investment income are generally declared and paid by each of the Funds on a quarterly basis. Distributions to shareholders from realized gains on securities for each Fund normally are declared and paid on an annual basis. Distributions are recorded on the ex-dividend date. |
| F. | Use of Estimates. The preparation of financial statements in conformity with U.S. GAAP requires management to make estimates and assumptions that affect the reported amounts of assets and liabilities at the date of the financial statements, as well as the reported amounts of revenues and expenses during the reporting period. Actual results could differ from those estimates. |
| G. | Share Valuation. The net asset value (“NAV”) per share of each Fund is calculated by dividing the sum of the value of the securities held by the Fund, plus cash and other assets, minus all liabilities (including estimated accrued expenses) by the total number of shares outstanding for the Fund, rounded to the nearest cent. The Funds’ shares will not be priced on the days on which the NYSE is closed for trading. For Authorized Participants, the offering and redemption price per share for the Funds are equal to the Funds’ respective net asset value per share. |
| H. | Guarantees and Indemnifications. In the normal course of business, the Funds enter into contracts with service providers that contain general indemnification clauses. The Funds’ maximum exposure under these arrangements is unknown as this would involve future claims that may be made against the Funds that have not yet occurred. However, based on experience, the Funds expect the risk of loss to be remote. |
Derivatives
The Funds may enter into swap agreements; including interest rate, index, and total return swap agreements. Swap agreements are contracts between parties in which one party agrees to make periodic payments to the other party based on the change in market value or level of a specified rate, index or asset. In return, the other party agrees to make payments to the first party based on the return of a different specified rate, index or asset. Swap agreements will usually be done on a net basis, i.e., where the two parties make net payments with a Fund receiving or paying, as the case may be, only the net amount of the two payments. The net amount of the excess, if any, of a Fund’s obligations over its entitlements with respect to each swap is accrued on a daily basis and an amount of cash or equivalents having an aggregate value at least equal to the accrued excess is maintained by the Fund.
The total return swap contracts are subject to master netting agreements, which are agreements between a Fund and its counterparties that provide for the net settlement of all transactions and collateral with the Fund through a single payment, in the event of default or termination. Amounts presented on the schedule of total return swaps are gross settlement amounts.
The following table presents the Funds’ gross derivative assets and liabilities by counterparty and contract type, net of amounts available for offset under a master netting agreement and the related collateral received or pledged by the Funds as of September 30, 2023.
NOTES TO FINANCIAL STATEMENTS
September 30, 2023
ETFMG U.S. Alternative Harvest ETF
| | | | | Gross | | | | | | | | | | | | | | | | |
| | | | | Amounts | | | | | | | | | | | | | | | | |
| | | | | of | | | | | | | | | | | | | | | | |
| | | | | Recognized | | | | | | | | | | | | | | | | |
| | | | | Assets | | | | | | | | | | | | | | | | |
| | | | | Presented | | | | | | | | | Gross Amounts not | | | | |
| | | | | in the | | | Gross | | | | | | offset in the Statements | | | |
| | | | | Statements | | | Amounts | | | | | | of Assets & Liabilities | | | |
| | | Investment | | of Assets & | | | Available | | | Net | | | Financial | | | Collateral | | | Net | |
| Counterparty | | Type | | Liabilities | | | Offset | | | Amounts | | | Instruments | | | Received | | | Amount | |
| National Bank of Canada | | Total Return Swap Contracts | | $ | 615,627 | | | $ | — | | | $ | 615,627 | | | $ | — | | | $ | — | | | $ | 615,627 | |
The average monthly notional amount of the swap contracts during the year ended September 30, 2023 for the Funds were:
| ETFMG U.S. Alternative Harvest ETF Swap Contracts | $71,394,756 |
| | | |
The following is a summary of the effect of swap contracts on the Funds’ Statements of Assets and Liabilities as of September 30, 2023:
| | | Assets | | | Liabilities | | | Net Unrealized Gain (Loss) | |
| ETFMG U.S. Alternative Harvest ETF Swap Contracts | | $ | 615,627 | | | $ | — | | | $ | — | |
The following is a summary of the effect of swap contracts on the Funds’ Statements of Operations for the year ended September 30, 2023:
| | | Realized
Gain (Loss) | | | Change in
Unrealized
Appreciation/
Depreciation | |
| ETFMG U.S. Alternative Harvest ETF Swap Contracts | | $ | (5,854,648 | ) | | $ | — | |
NOTE 3 – RISK FACTORS
Investing in the Funds may involve certain risks, as discussed in the Funds’ prospectus, including, but not limited to, those described below. Any of these risks could cause an investor to lose money.
Market Risk. Financial markets rise and fall in response to a variety of factors, sometimes rapidly and unpredictably. As with any investment whose performance is tied to these markets, the value of an investment in a Fund will fluctuate, which means that an investor could lose money over short or long periods.
Investment Style Risk. The Funds are not actively managed (“Index Funds”). Therefore, those Funds follow the securities included in its respective index during upturns as well as downturns. Because of their indexing strategies, the Index Funds do not take steps to reduce market exposure or to lessen the effects of a declining market. In addition, because of the Index Funds’ expenses, the Index Funds’ performance may be below that of their respective index.
Equity Risk. The prices of equity securities rise and fall daily. These price movements may result from factors affecting individual companies, industries or the securities market as a whole. In addition, equity markets tend to move in cycles which may cause stock prices to fall over short or extended periods of time.
Securities Lending Risk. Securities lending involves the risk of loss of rights in, or delay in recovery of, the loaned securities if the borrower fails to return the security loaned or becomes insolvent.
Concentration Risk. To the extent that a Fund’s or an index’s portfolio is concentrated in the securities of issuers in a particular market, industry, group of industries, sector or asset class, the fund may be adversely affected by the performance of those securities, may be subject to increased price volatility and may be more vulnerable to adverse economic, market, political or regulatory occurrences affecting that market, industry, group of industries, sector or asset class.
NOTES TO FINANCIAL STATEMENTS
September 30, 2023
Natural Disaster/Epidemic Risk. Natural or environmental disasters, such as earthquakes, fires, floods, hurricanes, tsunamis and other severe weather-related phenomena generally, and widespread disease, including pandemics and epidemics (for example, the novel coronavirus COVID-19),have been and can be highly disruptive to economies and markets and have recently led, and may continue to lead, to increased market volatility and significant market losses. Such natural disaster and health crises could exacerbate political, social, and economic risks previously mentioned, and result in significant breakdowns, delays, shutdowns, social isolation, and other disruptions to important global, local and regional supply chains affected, with potential corresponding results on the operating performance of the Funds and their investments. A climate of uncertainty and panic, including the contagion of infectious viruses or diseases, may adversely affect lobal, regional, and local economies and reduce the availability of potential investment opportunities, and increases the difficulty of performing due diligence and modeling market conditions, potentially reducing the accuracy of financial projections. Under the circumstances, the Funds may have difficulty achieving their investment objectives which may adversely impact performance. Further, such events can be highly disruptive to economies and markets, significantly disrupt the operations of individual companies (including, but not limited to, the Funds’ Sponsor and third party service providers), sectors, industries, markets, securities and commodity exchanges, currencies, interest and inflation rates, credit ratings, investor sentiment, and other factors affecting the value of the Funds’ investments. These factors can cause substantial market volatility. exchange trading suspensions and closures and can impact the ability of the Funds to complete redemptions and otherwise affect Fund performance and Fund trading in the secondary market. A widespread crisis may also affect the global economy in ways that cannot necessarily be foreseen at the current time. How long such events will last and whether they will continue or recur cannot be predicted. Impacts from these events could have significant impact on a Fund’s performance, resulting in losses to the Funds.
Derivatives Risk. Derivatives are financial instruments that derive value from the underlying reference asset or assets, such as stocks, bonds, or funds (including ETFs), interest rates or indexes. A Fund’s investments in derivatives may pose risks in addition to, and greater than, those associated with directly investing in securities or other ordinary investments, including risk related to the market, leverage, imperfect daily correlations with underlying investments or the Fund’s other portfolio holdings, higher price volatility, lack of availability, counterparty risk, liquidity, valuation and legal restrictions. The use of derivatives is a highly specialized activity that involves investment techniques and risks different from those associated with ordinary portfolio securities transactions. The use of derivatives may result in larger losses or smaller gains than directly investing in securities. When a Fund uses derivatives, there may be imperfect correlation between the value of the reference assets and the derivative, which may prevent the Fund from achieving its investment objective. Because derivatives often require only a limited initial investment, the use of derivatives may expose a Fund to losses in excess of those amounts initially invested.
Daily Index Correlation/Tracking Risk. There is no guarantee that a Fund will achieve a high degree of correlation to the Index and therefore achieve its daily leveraged investment objective. To achieve a high degree of correlation with the Index, a Fund seeks to rebalance its portfolio daily to keep leverage consistent with its daily leveraged investment objective. In addition, a Fund’s exposure to the Index is impacted by the Index’s movement. Because of this, it is unlikely that a Fund will be perfectly exposed to the Index at the end of each day. The possibility of the Fund being materially over- or under -exposed to the Index increases on days when the Index is volatile near the close of the trading day. Market disruptions, regulatory restrictions and extreme volatility will also adversely affect a Fund’s ability to adjust exposure to the required levels.
On February 24, 2022, Russia commenced a military attack on Ukraine. The outbreak of hostilities between the two countries could result in more widespread conflict and could have a severe adverse effect on the region and the markets. In addition, sanctions imposed on Russia by the United States and other countries, and any sanctions imposed in the future could have a significant adverse impact on the Russian economy and related markets.
NOTES TO FINANCIAL STATEMENTS
September 30, 2023
On October 7, 2023, Hamas launched a significant attack on Israel from the Gaza Strip. The extent and duration of the Israel-Hamas war and any related economic and market impacts are impossible to predict but may be significant and may negatively impact Israel’s economy. The price and liquidity of investments may fluctuate widely as a result of these conflicts and related events. How long such conflicts and related events will last, and whether either may escalate further, cannot be predicted, however such conflicts may negatively impact issuers of securities in which the Fund(s) invests.
A complete description of the principal risks is included in each Fund’s prospectus under the heading “Principal Investment Risks.”
NOTE 4 – MANAGEMENT AND OTHER CONTRACTS
The Advisor serves as the investment advisor to the Funds. Pursuant to an Investment Advisory Agreement (“Advisory Agreement”) between the Trust, on behalf of the Funds, and the Advisor, the Advisor provides investment advice to the Funds and oversees the day-to-day operations of the Funds, subject to the direction and control of the Board and the officers of the Trust. Under the Advisory Agreement, the Advisor is also responsible for arranging transfer agency, custody, fund administration and accounting, and other non-distribution related services necessary for the Funds to operate.
Under the Investment Advisory Agreement, the Advisor has overall responsibility for the general management and administration of the Funds and arranges for sub-advisory, transfer agency, custody, fund administration, securities lending, and all other non-distribution related services necessary for the Funds to operate. The Funds unitary fees are accrued daily and paid monthly. The Advisor bears the costs of all advisory and non-advisory services required to operate the Funds, in exchange for a single unitary fee at the following annual rates:
| ETFMG Alternative Harvest ETF | 0.75% |
| ETFMG U.S. Alternative Harvest ETF | 0.75% |
The Advisor waives a portion of its unitary fee related to the ETFMG Alternative Harvest ETF investment in ETFMG U.S. Alternative Harvest ETF. During the year ended September 30, 2023, the Advisor waived ($870,567).
Under the Investment Advisory Agreement, the Advisor has agreed to pay all expenses of the Funds, except for: the fee paid to the Advisor pursuant to the Investment Advisory Agreement, interest charges on any borrowings, taxes, brokerage commissions and other expenses incurred in placing orders for the purchase and sale of securities and other investment instruments, acquired fund fees and expenses, accrued deferred tax liability, extraordinary expenses, and distribution (12b-1) fees and expenses (collectively, “Excluded Expenses”). The Advisor has entered into an agreement with Foreside Fund Services LLC to serve as distributor to the Funds (the “Distributor”). The Distributor provides marketing support for the Funds, including distributing marketing materials related to the Funds. Level ETF Ventures, LLC (“Level”) serves as the index provider for MJ and MJUS. Level is not affiliated with the Trust or the Advisor.
U.S. Bancorp Fund Services, LLC doing business as U.S. Bank Global Fund Services (the “Administrator”) provides fund accounting, fund administration, and transfer agency services to the Funds. The Advisor compensates the Administrator for these services under an administration agreement between the two parties.
The Advisor pays each independent Trustee a quarterly fee for service to the Funds. Each Trustee is also reimbursed by the Advisor for all reasonable out-of-pocket expenses incurred in connection with his duties as Trustee, including travel and related expenses incurred in attending Board meetings.
NOTE 5 – DISTRIBUTION PLAN
The Funds have each adopted a Plan of Distribution pursuant to Rule 12b-1 under the 1940 Act. Under the Plan, each Fund may pay compensation to the Distributor or any other distributor or financial institution with which the Trust has an agreement with respect to each Fund, with the amount of such compensation not to exceed an annual rate of 0.25% of each Fund’s average daily net assets. During the year ended September 30, 2023, the Funds did not incur any 12b-1 expenses.
NOTES TO FINANCIAL STATEMENTS
September 30, 2023
NOTE 6 - PURCHASES AND SALES OF SECURITIES
The costs of purchases and sales of securities, excluding short-term securities and in-kind transactions, during the year ended September 30, 2023:
| | | Purchases | | | Sales | |
| ETFMG Alternative Harvest ETF | | $ | 181,906,918 | | | $ | 209,460,910 | |
| ETFMG U.S. Alternative Harvest ETF | | | 39,939,198 | | | | 19,495,810 | |
The costs of purchases and sales of in-kind transactions associated with creations and redemptions during the year ended September 30, 2023:
| | | Purchases In-Kind | | | Sales In-Kind | |
| ETFMG Alternative Harvest ETF | | $ | 13,426,605 | | | $ | 10,526,571 | |
| ETFMG U.S. Alternative Harvest ETF | | | 1,842,072 | | | | 315,991 | |
Purchases in-kind are the aggregate of all in-kind purchases and sales in-kind are the aggregate of all in-kind sales. Net capital gains or losses resulting from in-kind redemptions are excluded from the Funds’ determination of taxable gains and are not distributed to shareholders.
ETFMG U.S. Alternative Harvest ETF had purchases of $310,557,708 and $292,722,264 sales of U.S. Government obligations during the year ended September 30, 2023.
NOTE 7 — SECURITIES LENDING
The Funds may lend up to 33 1⁄3% of the value of the securities in its portfolio to brokers, dealers and financial institutions (but not individuals) under terms of participation in a securities lending program administered by U.S. Bank N.A. (“the Custodian”). The securities lending agreement requires that loans are collateralized at all times in an amount equal to at least 102% of the value of any loaned securities at the time of the loan, plus accrued interest. The Funds receive compensation in the form of fees and earn interest on the cash collateral. The amount of fees depends on a number of factors including the type of security and length of the loan. The Funds continue to receive interest payments or dividends on the securities loaned during the borrowing period. Gain or loss in the fair value of securities loaned that may occur during the term of the loan will be for the account of the Funds. The Funds have the right under the terms of the securities lending agreement to recall the securities from the borrower on demand. The cash collateral is invested by the Custodian in accordance with approved investment guidelines. Those guidelines require the cash collateral to be invested in readily marketable, high quality, short-term obligations either directly on behalf of each Fund or through one or more joint accounts, money market funds, or short-term bond funds, including those advised by or affiliated with the Adviser; however, such investments are subject to risk of payment delays or default on the part of the issuer or counterparty or otherwise may not generate sufficient interest to support the costs associated with securities lending. Other investment companies, in which a Fund may invest cash collateral, can be expected to incur fees and expenses for operations, such as investment advisory and administration fees, which would be in addition to those incurred by the Fund, and which may be received in full or in part by the Adviser. Pursuant to guidance issued by the SEC staff, fees and expenses of money market funds used for cash collateral received in connection with loans of securities are not treated as Acquired Fund Fees and Expenses, which reflect a fund’s pro rata share of the fees and expenses incurred by other investment companies in which the Fund invests (as disclosed in the Prospectus, as applicable). The Funds could also experience delays in recovering its securities and possible loss of income or value if the borrower fails to return the borrowed securities, although the Fund is indemnified from this risk by contract with the securities lending agent.
NOTES TO FINANCIAL STATEMENTS
September 30, 2023
As of the year ended September 30, 2023 the value of the securities on loan and payable for collateral due to broker were as follows:
Value of Securities on Loan Collateral Received
| Fund | | Values of Securities on Loan | | | Fund Collateral Received* | |
| ETFMG Alternative Harvest ETF | | $ | 81,686,104 | | | $ | 96,949,571 | |
| ETFMG U.S. Alternative Harvest ETF | | | 4,766,178 | | | | 4,735,800 | |
| * | The cash collateral received was invested in the Mount Vernon Liquid Assets Portfolio, a money market fund with an overnight and continuous maturity. |
NOTE 8 – FEDERAL INCOME TAXES
The components of distributable earnings (losses) and cost basis of investments for federal income tax purposes at September 30, 2023 were as follows:
| | | Cost | | | Gross Unrealized Appreciation | | | Gross Unrealized Depreciation | | | Net Unrealized Appreciation (Depreciation) | |
| ETFMG Alternative Harvest ETF | | $ | 694,010,638 | | | $ | 12,663,232 | | | $ | (351,106,545 | ) | | $ | (338,443,313 | ) |
| ETFMG U.S. Alternative Harvest ETF | | | 151,373,072 | | | | 768,943 | | | | (11,567,706 | ) | | | (10,798,763 | ) |
The difference between the tax cost of investments and the cost of investments for GAAP purposes is primarily due to the tax treatment of wash sale losses.
As of September 30, 2023, the components of distributable earnings (loss) on a tax basis were as follows:
| | | Undistributed
Ordinary
Income | | | Undistributed
Long-Term
Gain | | | Total
Distributable
Earnings | | | Other
Accumulated
Loss | | | Total
Accumulated
Gain (Loss) | |
| ETFMG Alternative Harvest ETF | | $ | 1,560,377 | | | $ | — | | | $ | 1,560,377 | | | $ | (1,521,778,910 | ) | | $ | (1,858,661,846 | ) |
| ETFMG U.S. Alternative Harvest ETF | | | — | | | | — | | | | — | | | | (16,049,257 | ) | | | (26,848,020 | ) |
The difference between the tax cost of investments and the cost of investments for GAAP purposes is primarily due to the tax treatment of wash sale losses.
As of September 30, 2023, the Funds had accumulated capital loss carryovers of:
| | | Capital Loss Carryforward ST | | | Capital Loss Carryforward LT | | | Expires | |
| ETFMG Alternative Harvest ETF | | $ | (429,384,981 | ) | | $ | (1,092,392,312 | ) | | | Indefinite | |
| ETFMG U.S. Alternative Harvest ETF | | | (14,868,468) | | | | (1,180,800 | ) | | | Indefinite | |
Under current tax law, capital and currency losses realized after October 31 of a Fund’s fiscal year may be deferred and treated as occurring on the first business day of the following fiscal year for tax purposes. The following Funds had deferred post-October capital and currency losses, which will be treated as arising on the first business day of the year ending September 30, 2023.
| | | | Late Year
Ordinary Loss | | | | Post-October
Capital Loss | |
| ETFMG Alternative Harvest ETF | | $ | — | | | $ | — | |
| ETFMG U.S. Alternative Harvest ETF | | | — | | | | — | |
NOTES TO FINANCIAL STATEMENTS
September 30, 2023
U.S. GAAP requires that certain components of net assets relating to permanent differences be reclassified between financial and tax reporting. These reclassifications have no effect on net assets or net asset value per share. For the fiscal year ended September 30, 2023, the following table shows the reclassifications made:
| | | Total
Distributable
Earnings/(Loss) | | | Paid-In
Capital | |
| ETFMG Alternative Harvest ETF | | $ | 15,616,605 | | | $ | (15,616,605 | ) |
| ETFMG U.S. Alternative Harvest ETF | | | 14,527,357 | | | | (14,527,357 | ) |
The tax character of distributions paid during the years ended September 30, 2023 and September 30, 2022 were as follows:
| | | Year Ended
September 30, 2023 | | | Year Ended
September 30, 2022 | |
| | | From
Ordinary
Income | | | | From
Capital
Gains | | | | From
Ordinary
Income | | | | From
Capital
Gains | |
| ETFMG Alternative Harvest ETF | | $ | 8,926,095 | | | | — | | | $ | 12,808,889 | | | | — | |
| ETFMG U.S. Alternative Harvest ETF | | | — | | | | — | | | | — | | | | — | |
NOTE 9 – INVESTMENTS IN AFFILIATES
ETFMG Alternative Harvest ETF
ETFMG Alternative Harvest ETF owned the following companies during the year ended September 30, 2023. ETFMG Sit Ultra Short ETF and ETFMG U.S. Alternative Harvest ETF were deemed to be affiliates of the Fund as defined by the 1940 Act during the year ended September 30, 2023. Transactions during the year in these securities were as follows:
| Security Name | | Value at
September 30, 2022 | | | Purchases | | | Sales | | | Realized
Gain
(Loss)(1) | | | Change in
Unrealized
Appreciation
(Depreciation) | | | Dividend
Income | | | Value at
September 30, 2023 | | | Ending
Shares | |
| ETFMG U.S. Alternative Harvest ETF * | | $ | 83,831,447 | | | $ | 96,753,464 | | | $ | (35,728,757 | ) | | $ | (26,234,892 | ) | | $ | 14,316,731 | | | $ | — | | | $ | 132,937,993 | | | | 71,870,029 | |
| ETFMG Sit Ultra Short ETF | | | 28,845,000 | | | | — | | | | (29,076,947 | ) | | | (771,850 | ) | | | 1,003,797 | | | | — | | | | — | | | | — | |
| * | Affiliate as of September 30, 2023. |
| 1 | Realized Losses include transactions in affiliated investments and affiliated in-kind redemptions. |
NOTE 10 – LEGAL MATTERS
The Trust, the Adviser, and certain officers and affiliated persons of the Adviser (together with the Adviser, the “Adviser Defendants”) were named as defendants in an action filed December 21, 2021, in the Superior Court of New Jersey, Union County, captioned PureShares, LLC, d/b/a PureFunds et al. v. ETF Managers Group, LLC et al., Docket No. UNN-C-152-21 (the “NJ Action”). The NJ Action asserted breach of contract and other tort claims and sought damages in unspecified amounts and injunctive relief. On May 25, 2022, the court in the NJ Action dismissed with prejudice all claims asserted against the Trust, as well as all contract claims and all except one tort claim asserted against the Adviser Defendants. With respect to the tort claim asserted against the Adviser Defendants, the parties stipulated and agreed to dismiss that claim without prejudice in May 2023.
The Adviser and certain of its affiliates have entered into a settlement agreement with the Securities and Exchange Commission (“SEC”) regarding certain alleged conflicts of interest arising in connection with ETFMG Alternative Harvest ETF’s (MJ) participation in the securities lending program administered by its prior custodian. Without admitting or denying the SEC’s findings, the Adviser and its parent company agreed to censures, to a cease-and-desist order, and to pay, jointly and severally, a civil penalty of $4 million. The settlement resolves the SEC’s investigation of the Adviser and its affiliates.
As of September 30, 2023, there were no adjustments made to the accompanying financial statements based on the above legal matters.
NOTES TO FINANCIAL STATEMENTS
September 30, 2023
NOTE 11 – SUBSEQUENT EVENTS
In preparing these financial statements, the Funds have evaluated events and transactions for potential recognition or disclosure through the date the financial statements were issued.
The Board of the Trust has approved an Agreement and Plan of Reorganization (the “Agreement”) providing for the reorganization of the Target Funds into corresponding new funds (the “Acquiring Funds”), which is a newly created series of Amplify ETF Trust with similar investment objectives and the same fees and expenses as the corresponding Target Funds. The Reorganization is subject to certain conditions including approval by shareholders of the Target Funds. The following table shows shares of the Acquiring Funds that will be issued to shareholders of the corresponding Target Funds.
| Target Fund | Acquiring Fund |
| ETFMG Alternative Harvest ETF | Amplify Alternative Harvest ETF |
| ETFMG U.S. Alternative Harvest | Amplify U.S. Alternative Harvest ETF |
The proxy solicitation materials were filed with the SEC on October 13, 2023. The Joint Special Meeting of Shareholders is to be held on December 28, 2023.
Other than as disclosed, there were no other subsequent events requiring recognition or disclosure through the date the financial statements were issued.
Report of Independent Registered Public Accounting Firm
To the Board of Trustees of ETF Managers Trust
and the Shareholders of ETFMG Alternative Harvest ETF and ETFMG U.S. Alternative Harvest ETF:
Opinion on the Financial Statements
We have audited the accompanying statements of assets and liabilities, including the schedules of investments of ETFMG Alternative Harvest ETF and ETFMG U.S. Alterative Harvest ETF and the schedules of investments and total return swaps of ETFMG Alternative Harvest ETF and ETFMG U.S. Alterative Harvest ETF (collectively the “Funds”) (certain of the Funds comprising ETF Managers Trust), as of September 30, 2023, the related statements of operations for the year then ended, the statements of changes in net assets for each of the two years in the period then ended of ETFMG Alternative Harvest ETF and ETFMG U.S. Alternative Harvest ETF, the financial highlights for each of the periods indicated therein and the related notes (collectively referred to as the “financial statements”). In our opinion, the financial statements present fairly, in all material respects, the financial position of the Funds as of September 30, 2023, and the results of their operations for the year then ended, the changes in net assets for each of the two years in the period then ended of ETFMG Alternative Harvest ETF and ETFMG U.S. Alternative Harvest ETF, and the financial highlights for each of the periods indicated therein, in conformity with accounting principles generally accepted in the United States of America.
Basis for Opinion
These financial statements and financial highlights are the responsibility of the Funds’ management. Our responsibility is to express an opinion on these financial statements based on our audits. We are a public accounting firm registered with the Public Company Accounting Oversight Board (United States) (“PCAOB”) and are required to be independent with respect to the Funds in accordance with the U.S. federal securities laws and the applicable rules and regulations of the Securities and Exchange Commission and the PCAOB.
We conducted our audits in accordance with the standards of the PCAOB. Those standards require that we plan and perform the audits to obtain reasonable assurance about whether the financial statements and financial highlights are free of material misstatement, whether due to error or fraud. The Funds are not required to have, nor were we engaged to perform, an audit of their internal control over financial reporting. As part of our audits, we are required to obtain an understanding of internal control over financial reporting but not for the purpose of expressing an opinion on the effectiveness of the Funds’ internal control over financial reporting. Accordingly, we express no such opinion.
Our audits included performing procedures to assess the risks of material misstatement of the financial statements and financial highlights, whether due to error or fraud, and performing procedures that respond to those risks. Such procedures included examining, on a test basis, evidence regarding the amounts and disclosures in the financial statements and financial highlights. Our audits also included evaluating the accounting principles used and significant estimates made by management, as well as evaluating the overall presentation of the financial statements and financial highlights. Our procedures included confirmation of securities owned as of September 30, 2023 by correspondence with the custodian. We believe that our audits provide a reasonable basis for our opinion.
/s/WithumSmith+Brown, PC
We have served as the auditor for one or more series of the Trust since 2013.
New York, New York
November 29, 2023
ETFMG TM ETFs
EXPENSE EXAMPLE
Six Months Ended September 30, 2023 (Unaudited)
As a shareholder of the Funds you incur two types of costs: (1) transaction costs, including brokerage commissions on purchases and sales of Fund shares, and (2) ongoing costs, including management fees and other Fund expenses. These examples are intended to help you understand your ongoing costs (in dollars) of investing in the Funds and to compare these costs with the ongoing costs of investing in other funds. The examples are based on an investment of $1,000 invested for the period of time as indicated in the table below.
Actual Expenses
The first line of the table provides information about actual account values based on actual returns and actual expenses. You may use the information in this line, together with the amount you invested, to estimate the expenses that you paid over the period. Simply divide your account value by $1,000 (for example, an $8,600 account value divided by $1,000 = 8.6), then, multiply the result by the number in the first line under the heading entitled “Expenses Paid During Period” to estimate the expenses you paid on your account during this period.
Hypothetical Example for Comparison Purposes
The second line of the table provides information about hypothetical account values based on a hypothetical return and hypothetical expenses based on the Fund’s actual expense ratio and an assumed rate of return of 5% per year before expenses, which is not the Fund’s actual return. The hypothetical account values and expenses may not be used to estimate the actual ending account balance or expenses you paid for the period. You may use this information to compare the ongoing costs of investing in the Fund and other funds. To do so, compare this 5% hypothetical example with the 5% hypothetical examples that appear in the shareholder reports of the other funds. Please note that the expenses shown in the table are meant to highlight your ongoing costs only and do not reflect any transactional costs, such as brokerage commissions paid on purchases and sales of Fund shares. Therefore, the second line of the table is useful in comparing ongoing costs only and will not help you determine the relative total costs of owning different funds. If these transactional costs were included, your costs would have been higher.
| Fund Name | | Beginning
Account Value
April 1, 2023 | | | Ending
Account Value
September 30,
2023 | | | Expenses
Paid
During
the
Period^ | | | Annualized
Expense
Ratio
During the
Period
April 1,
2023 to
September
30, 2023 | |
| ETFMG Alternative Harvest ETF | | | | | | | | | | | | | | | | |
| Actual | | $ | 1,000.00 | | | $ | 1,057.60 | | | $ | 2.27 | | | | 0.44 | % |
| Hypothetical (5% annual) | | | 1,000.00 | | | | 1,022.86 | | | | 2.23 | | | | 0.44 | % |
| ETFMG U.S. Alternative Harvest ETF | | | | | | | | | | | | | | | | |
| Actual | | | 1,000.00 | | | | 1,210.00 | | | | 4.21 | | | | 0.76 | % |
| Hypothetical (5% annual) | | | 1,000.00 | | | | 1,021.26 | | | | 3.85 | | | | 0.76 | % |
| ^ | The dollar amounts shown as expenses paid during the period are equal to the annualized six-month expense ratio multiplied by the average account value during the period, multiplied by 183/365 (to reflect the one-half year period). |
ETFMG TM ETFs
SUPPLEMENTARY INFORMATION
September 30, 2023 (Unaudited)
NOTE 1 – FREQUENCY DISTRIBUTION OF PREMIUMS AND DISCOUNTS
Information regarding how often shares of each Fund traded on the Exchange at a price above (i.e., at a premium) or below (i.e., at a discount) the NAV is available on the Fund’s website at www.etfmgfunds.com.
NOTE 2 – FEDERAL TAX INFORMATION
Qualified Dividend Income/Dividends Received Deduction
For the most recent fiscal year ended September 30, 2023, certain dividends paid by the Funds may be subject to a maximum tax rate of 15%, as provided for by the Jobs and Growth Tax Reconciliation Act of 2003. The percentage of dividends declared from ordinary income designated as qualified dividend income was as follows:
| Fund Name | | Qualified
Dividend
Income | |
| ETFMG Alternative Harvest ETF | | | 20.60 | % |
| ETFMG U.S. Alternative Harvest ETF | | | 0.00 | % |
For corporate shareholders, the percent of ordinary income distributions qualifying for the corporate dividends received deduction for the most recent fiscal year ended September 30, 2023 was as follows:
| Fund Name | | Dividends
Received
Deduction | |
| ETFMG Alternative Harvest ETF | | | 13.28 | % |
| ETFMG U.S. Alternative Harvest ETF | | | 0.00 | % |
Short Term Capital Gain
The percentage of taxable ordinary income distributions that are designated as short-term capital gain distributions under Internal Revenue Section 871 (k)(2)(C) for each Fund were as follows:
| Fund Name | | Short-Term
Capital Gain | |
| ETFMG Alternative Harvest ETF | | | 0.00 | % |
| ETFMG U.S. Alternative Harvest ETF | | | 0.00 | % |
During the year ended September 30, 2023, the Funds did not declare any long-term realized gains distributions.
ETFMG TM ETFs
SUPPLEMENTARY INFORMATION
September 30, 2023 (Unaudited)(Continued)
NOTE 3 – INFORMATION ABOUT PORTFOLIO HOLDINGS
The Funds file their complete schedule of portfolio holdings for their first and third fiscal quarters with the Securities and Exchange Commission (“SEC”) on Part F of Form N-PORT. The Funds’ Part F of Form N-PORT is available on the website of the SEC at www.sec.gov and the Funds’ website at www.etfmgfunds.com. Each Fund’s portfolio holdings are posted on their website at www.etfmgfunds.com daily.
NOTE 4 – INFORMATION ABOUT PROXY VOTING
A description of the policies and procedures the Funds use to determine how to vote proxies relating to portfolio securities is provided in the Statement of Additional Information (“SAI”). The SAI is available without charge upon request by calling toll-free at (877) 756-7873, by accessing the SEC’s website at www.sec.gov, or by accessing the Funds’ website at www.etfmgfunds.com.
Information regarding how the Funds voted proxies relating to portfolio securities during the period ending December 31 is available by calling toll-free at (877) 756-7873 or by accessing the SEC’s website at www.sec.gov.
Carefully consider the Fund’s investment objectives, risk factors, charges, and expenses before investing. This and additional information can be found in the Fund’s prospectus, which may be obtained by calling 1-844-ETF-MGRS (1-844-383-6477) or by visiting www.etfmgfunds.com. This report must be preceded or accompanied by a prospectus.
ETFMG TM ETFs
Board of Trustees
Set forth below are the names, birth years, positions with the Trust, length of term of office, and the principal occupations and other directorships held during at least the last five years of each of the persons currently serving as a Trustee of the Trust, as well as information about each officer. The business address of each Trustee and officer is 30 Maple Street, 2nd Floor, Summit, New Jersey 07901. The SAI includes additional information about Fund directors and is available, without charge, upon request by calling 1-844-ETF-MGRS (1-844-383-6477).
| Name and Year of Birth | Position(s) Held
with the Trust,
Term of Office
and Length of
Time Served | Principal Occupation(s)
During Past 5 Years | Number of
Portfolios in
Fund
Complex
Overseen By
Trustee | Other
Directorships
Held by Trustee
During Past 5
Years |
| Interested Trustee and Officers | | | |
Michael Minella
(1971) | President (since 2023) | Senior Principal Consultant, ACA Group (since 2022); Vice President and Director, Fidelity Investments (2009-2022). | n/a | n/a |
John A. Flanagan
(1946) | Treasurer (since 2015) | President, John A. Flanagan CPA, LLC (accounting services) (since 2010); Treasurer, ETF Managers Trust (since 2015); Chief Financial Officer, ETF Managers Capital, LLC (commodity pool operator) (since 2015). | n/a | Independent Trustee - Absolute Shares Trust (since 2014) (6 portfolios) |
Kevin Hourihan
(1978) | Chief Compliance Officer (since 2022) | Senior Principal Consultant, Fund Chief Compliance Officer, ACA Global, LLC (since 2022); Chief Compliance Officer, Ashmore Funds (2017-2022); Chief Compliance Officer, Ashmore Investment Management (US) Corp (2014- 2022); Chief Compliance Officer, Ashmore Equities Investment Management (2015- 2019). | n/a | n/a |
Matthew J. Bromberg
(1973) | Secretary (since 2023) | Chief Compliance Officer and Chief Compliance Officer of ETF Managers Group, LLC (since 2022); General Counsel and Secretary of Exchange Traded Managers Group LLC (since 2020); ETF Managers Group LLC (since 2020); ETFMG Financial LLC (since 2020); ETF Managers Capital LLC (since 2020); Partner of Dorsey & Whitney LLP (law firm) (2019- 2020); General Counsel of WBI Investments, Inc. (2016-2019); Millington Securities, Inc. (2016- 2019). | n/a | n/a |
ETFMG Alternative Harvest ETF
Board of Trustees (Continued)
| Name and Year of Birth | Position(s) Held
with the Trust,
Term of Office
and Length of
Time Served | Principal Occupation(s)
During Past 5 Years | Number of
Portfolios in
Fund
Complex
Overseen By
Trustee | Other
Directorships
Held by Trustee
During Past 5
Years |
Terry Loebs
(1963) | Chairman of the Board (since 2023); Trustee (since 2014); Lead Independent Trustee (since 2020) | Founder and Managing Member, Pulsenomics LLC (index product development and consulting firm) (since 2011); Managing Director, MacroMarkets, LLC (exchange- traded products firm) (2006-2011). | 12 | None |
Eric Wiegel
(1960) | Trustee (since 2020) | Managing Partner, Global Focus Capital LLC (since 2013); Senior Portfolio Manager, Little House Capital (2019-2021); Chief Investment Officer, Insight Financial Strategist LLC (2017- 2018). | 12 | None |
ETFMG TM ETFs
ETF MANAGERS TRUST
Privacy Policy and Procedures
ETF Managers Trust, (the “Trust”) has adopted the following privacy policies in order to safeguard the personal information of the Trust’s customers and consumers in accordance with Regulation S-P as promulgated by the U.S. Securities and Exchange Commission.
Trust officers are responsible for ensuring that the following policies and procedures are implemented:
1) The Trust is committed to protecting the confidentiality and security of the information they collect and will handle personal customer and consumer information only in accordance with Regulation S-P and any other applicable laws, rules and regulations1. The Trust will ensure: (a) the security and confidentiality of customer records and information; (b) that customer records and information are protected from any anticipated threats and hazards; and (c) that customer records and information are protected from unauthorized access or use.
2) The Trust conducts its business affairs through its trustees, officers and third parties that provide services pursuant to agreements with the Trust. The Trust has no employees. It is anticipated that the trustees and officers of the Trust who are not employees of service providers of the Trust will not have access to customer records and information in the performance of their normal responsibilities for the Trust.
3) The Trust may share customer information with its affiliates, subject to the customers’ right to prohibit such sharing.
4) The Trust may share customer information with unaffiliated third parties only in accordance with the requirements of Regulation S-P. Pursuant to this policy, the Trust will not share customer information with unaffiliated third parties other than as permitted by law, unless authorized to do so by the customer.
Consistent with these policies, the Trust has adopted the following procedures:
1) The Trust will determine that the policies and procedures of its affiliates and Service Providers are reasonably designed to safeguard customer information and only permit appropriate and authorized access to and use of customer information through the application of appropriate administrative, technical and physical protections.
2) The Trust will direct each of its Service Providers to adhere to the privacy policy of the Trust and to its privacy policies with respect to all customer information of the Trust and to take all actions reasonably necessary so that the Trust is in compliance with the provisions of Regulation S-P, including, as applicable, the development and delivery of privacy notices and the maintenance of appropriate and adequate records.
3) The Trust requires its Service Providers to provide periodic reports to the Trust’s Board of Trustees outlining their privacy policies and the implementation of such policies. Each Service Provider is required to promptly report to the Trust’s Board any material changes to its privacy policy before, or promptly after, the adoption of such changes.
| (1) | Generally, the Funds have institutional clients which are not considered “customers” for purposes of regulation S-P. |
Advisor
ETF Managers Group, LLC
350 Springfield Ave., Suite 200, Summit, NJ 07901
Distributor
Foreside Fund Services LLC
Three Canal Plaza, Suite 100, Portland, Maine 04101
Custodian
U.S. Bank National Association
Custody Operations
1555 North River Center Drive, Suite 302, Milwaukee, Wisconsin 53212
Transfer Agent
U.S. Bancorp Fund Services, LLC doing business as U.S. Bank Global Fund Services
615 East Michigan Street, Milwaukee, Wisconsin 53202
Securities Lending Agent
U.S. Bank, National Association
Securities Lending
800 Nicolet Mall
Minneapolis, MN 55402-7020
Independent Registered Public Accounting Firm
WithumSmith + Brown, PC
1411 Broadway, 9th Floor, New York, NY 10018
Legal Counsel
Sullivan & Worcester LLP
1666 K Street NW, Washington, DC 20006
ETFMG Prime Junior Silver Miners ETF
SILJ
Annual Report
September 30, 2023

The fund is a series of ETF Managers Trust.
ETFMG™ ETFs
TABLE OF CONTENTS
September 30, 2023
ETFMG™ ETFs
Dear Shareholder,
On behalf of the entire team, we want to express our appreciation for the confidence you have placed in the ETFMG Prime Junior Silver ETF (the “Fund”). The following information pertains to the fiscal period from October 1, 2022 to September 30, 2023 (the “Annual Period”).
Market Overview
The U.S. economy performed better than expected despite persistent inflationary pressure, rising interest rates and geo-political conflict during the Annual Period.
Early in the Annual Period, inflation had risen sharply because of supply chain disruptions, high food and energy prices and the Russia-Ukraine war, reaching its peak level, just prior to the Annual Period, in September 2022. In the first quarter of 2023, U.S. equities managed to deliver gains, despite the significant volatility. The January rally, however, gave way to a February sell off as higher-than-expected inflation, a tight labor market and solid economic growth indicated that the U.S. Federal Reserve’s (Fed) monetary policy would remain tight for the foreseeable future. One of the most significant impacts occurred in the banking sector in March 2023, when Silicon Valley Bank, Signature Bank, and First Republic Bank, among others, failed. In the same month, Swiss bank UBS agreed to buy Credit Suisse, considered vulnerable in the then current environment.
In the second quarter of 2023, the economy grew at an annualized rate of 2.1%, according to the third estimate from the U.S. Bureau of Economic Analysis, compared to 2.2% in the first quarter and in line with 2.1% in 2022 overall. Since then, price pressures have eased given normalization in supply chains, falling energy prices and aggressive measures by the Fed and other global central banks to tighten financial conditions and slow demand in their economies. Nevertheless, during the Annual Period inflation levels remained much higher than central banks’ target levels, with the Fed raising its target fed funds rate six times during the Annual Period, bringing it to a range of 5.25% to 5.50% as of July 2023. As of August 2023, the unemployment rate was 3.8%, near its pre-pandemic low, although monthly job growth continued to be moderate. In September 2023, the Fed’s policy committee voted to hold the rate steady.
As the U.S. Congress neared its September 30, 2023, deadline to approve federal funding, investor concerns about a potential government shutdown and the impact this could have on the U.S. economy increased. The shutdown, however, was averted because of a Continuing Resolution which temporarily kept the government open for forty-five more days. Despite higher rates and increased market volatility, U.S. stocks for the Annual Period had strong returns of 21.62%, as measured by the S&P 500 Index.
These conditions have impacted the performance of the Fund during the Annual Period, among other factors, and the value of an investment in the Fund. We encourage you to talk with your financial advisor and visit etfmg.com for further insight into investing in today’s markets.
Performance Overview
The ETFMG Prime Junior Silver ETF (SILJ) seeks to provide investment results that, before fees and expenses, correspond generally to the total return performance of the Prime Junior Silver Miners & Explorers Index (the “Index”).
Over the Annual Period, the total return for the Fund was -7.23%, while the total return for the Index, which does not incur Fund expenses, was -6.45%. The best performers in the Fund on the basis of contribution to return were McEwen Mining Inc., Sabina Gold & Silver Corp., Gatos Silver Inc., Capstone Copper Corp., and Harmony Gold Mining, while the worst performers in the Fund on the basis of contribution to return were Golden Minerals Co., Gold Resource Corp., Bear Creek Mining Corp., Canada Silver Cobalt Works, and Excellon Resources Inc.
At the end of the Annual Period, the Fund saw an approximate allocation of 99.17% to Materials. The Fund was exposed predominately to Canada 73.48%, 11.59% to United States and 3.89% to South Africa.
You can find further details about SILJ by visiting www.etfmg.com, or by calling 1- 844-ETF-MGRS (1-844-383-6477).
Sincerely

John A. Flanagan
Principal Financial Officer
ETFMG Prime Junior Silver Miners ETF
Growth of $10,000 (Unaudited)
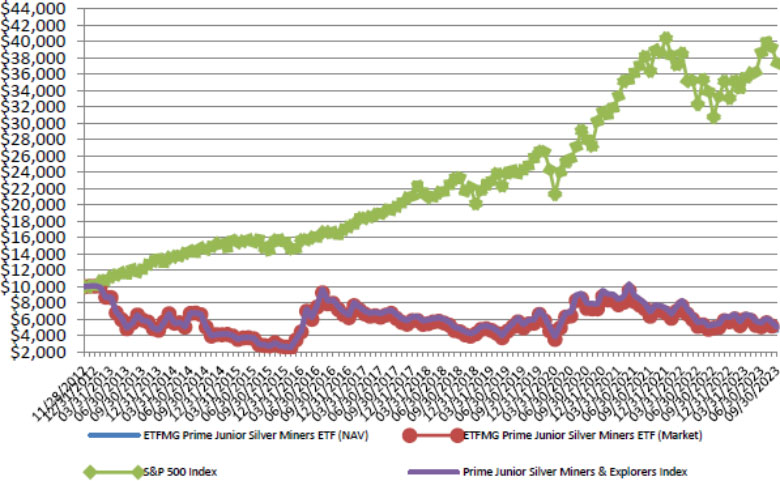
Average Annual Returns
Year Ended September 30, 2023 | | 1 Year
Return | | | 5 Year
Return | | | Since
Inception
(11/28/12) | | | Value of
$10,000
(9/30/2023) | |
| ETFMG Prime Junior Silver Miners ETF (NAV) | | | -7.23 | % | | | 0.41 | % | | | -6.96 | % | | $ | 4,577 | |
| ETFMG Prime Junior Silver Miners ETF (Market) | | | -6.97 | % | | | 0.46 | % | | | -6.94 | % | | $ | 4,585 | |
| S&P 500 Index | | | 21.62 | % | | | 9.92 | % | | | 12.95 | % | | $ | 37,429 | |
| Prime Junior Silver Miners & Explorers Index* | | | -6.45 | % | | | 0.70 | % | | | -6.18 | % | | $ | 5,009 | |
| * | The Fund’s benchmark before 8/1/17 was the ISE Junior Silver (Small Cap Miners/Explorers) Index. On 8/1/17, the Fund’s benchmark became the Prime Junior Silver Miners & Explorers Index. |
Performance data quoted represents past performance and does not guarantee future results. The investment return and principal value of an investment will fluctuate so that an investor’s shares, when redeemed, may be worth more or less than their original cost. Current performance of the Fund may be lower or higher than the performance quoted. All performance is historical and includes reinvestment of dividends and capital gains. Performance data current to the most recent month end may be obtained by calling 1-844-ETF-MGRS (1-844-383-6477).
The chart illustrates the performance of a hypothetical $10,000 investment made on November 28, 2012, and is not intended to imply any future performance. The returns shown do not reflect the deduction of taxes that a shareholder would pay on fund distributions from the sale of Fund shares. The chart assumes reinvestment of capital gains and dividends, if any. The index returns do not reflect fees or expenses and are not available for direct investment.
ETFMG Prime Junior Silver Miners ETF
Top Ten Holdings as of September 30, 2023 (Unaudited)*
| | | Security | | % of Total
Investments | |
| 1 | | Pan American Silver Corp. | | | 13.71 | % |
| 2 | | First Majestic Silver Corp. | | | 10.54 | % |
| 3 | | Capstone Copper Corp. | | | 7.68 | % |
| 4 | | MAG Silver Corp. | | | 6.64 | % |
| 5 | | SSR Mining, Inc. | | | 5.52 | % |
| 6 | | Hecla Mining Co. | | | 4.31 | % |
| 7 | | Harmony Gold Mining Co., Ltd. – ADR | | | 4.25 | % |
| 8 | | Compania de Minas Buenaventura SAA – ADR | | | 3.69 | % |
| 9 | | Filo Corp. | | | 3.48 | % |
| 10 | | Eldorado Gold Corp. | | | 3.23 | % |
| | | | | | | |
| | | Top Ten Holdings = 63.05% of Total Investments | | | | |
| * | Current Fund holdings may not be indicative of future Fund holdings. |
ETFMG™ ETFs
Important Disclosures and Key Risk Factors
Investing involves risk, including the possible loss of principal. Shares of any ETF are bought and sold at market price (not NAV), may trade at a discount or premium to NAV and are not individually redeemed from the Fund. Brokerage commissions will reduce returns. Narrowly focused investments typically exhibit higher volatility.
Past performance is not indicative of future return. A fund’s performance for very short time periods may not be indicative of future performance.
SILJ
The ETFMG Prime Junior Silver Miners ETF (the “Fund” or the “Junior Silver ETF”) seeks to provide investment results that, before fees and expenses, correspond generally to the price and yield performance of the Prime Junior Silver Miners & Explorers Index (the “Index”).
Investments in foreign securities involve political, economic and currency risks, greater volatility and differences in accounting methods. These risks are greater for investments in emerging markets. The Fund is non-diversified, meaning it may concentrate its assets in fewer individual holdings than a diversified fund. Therefore, the Fund is more exposed to individual issuer volatility than a diversified fund. Funds that are less diversified across countries or geographic regions are generally riskier than more geographically diversified funds and risks associated with such countries or geographic regions may negatively affect a Fund. Investments in small capitalization companies tend to have limited liquidity and greater price volatility than large-capitalization companies. The ETFMG Prime Junior Silver Miners ETF is subject to risks associated with the worldwide price of silver and the costs of extraction and production. Worldwide silver prices may fluctuate substantially over short periods of time, so the Fund’s share price may be more volatile than other types of economic conditions, tax treatment, government regulation and intervention, and world events in the regions in which the company’s operation. Several foreign countries have begun a process of privatizing certain entities and industries. Privatized entities may lose money or be renationalized. The Fund invests in some economies that are heavily dependent upon trading with key partners. Any reduction in this trading may cause an adverse impact on the economy in which the Fund invests. The Fund’s return may not match or achieve a high degree of correlation with the return of the Prime Junior Silver Miners & Explorers Index. To the extent the Fund utilizes a sampling approach, it may experience tracking error to a greater extent than if the Fund had sought to replicate the Prime Junior Silver Miners & Explorers Index. IOPV or indicative optimized portfolio value is an estimated intraday fair value of one share of an ETF determined by the last trade price of the fund’s underlying securities.
The Prime Junior Silver Miners & Explorers Index is designed to provide a benchmark for investors interested in tracking public, small-cap companies that are active in silver mining exploration and production industry. The stocks are screened for liquidity and weighted according to modified freefloat market capitalization. The Index generally is comprised of 25-35 securities. An investment cannot be made directly in an index.
Unlike with an actively managed fund, the Fund’s adviser does not use techniques or defensive strategies designed to lessen the effects of market volatility or to reduce the impact of periods of market decline. This means that, based on market and economic conditions, the Fund’s performance could be lower than other types of funds that may actively shift their portfolio assets to take advantage of market opportunities or to lessen the impact of a market decline.
Natural or environmental disasters, such as earthquakes, fires, floods, hurricanes, tsunamis and other severe weather- related phenomena generally, and widespread disease, including pandemics and epidemics, have been and may be highly disruptive to economies and markets, adversely impacting individual companies, sectors, industries, markets, currencies, interest and inflation rates, credit ratings, investor sentiment, and other factors affecting the value of the Fund’s investments. Given the increasing interdependence among global economies and markets, conditions in one country, market, or region are increasingly likely to adversely affect markets, issuers, and/or foreign exchange rates in other countries, including the U.S. Any such events could have a significant adverse impact on the value of the Fund’s investments.
Additionally, natural or environmental disasters, widespread disease or other public health issues, war, acts of terrorism or other events could result in increased premiums or discounts to the Fund’s NAV.
ETF Managers Group LLC is the investment adviser to the Fund.
Effective, August 14, 2023, the Fund is distributed by Foreside Fund Services LLC. ETF Managers Group LLC is a wholly owned subsidiary of Exchange Traded Managers Group LLC (collectively, “ETFMG”).
ETFMG™ ETFs
PORTFOLIO ALLOCATIONS
As of September 30, 2023 (Unaudited)
| | | ETFMG | |
| | | Prime Junior | |
| | | Silver Miners | |
| | | ETF | |
| As a percent of Net Assets: | | | | |
| Australia | | | 0.4 | % |
| Canada | | | 77.7 | |
| Luxembourg | | | 0.9 | |
| Peru | | | 3.7 | |
| South Africa | | | 4.3 | |
| United Kingdom | | | 1.7 | |
| United States | | | 10.3 | |
| Virgin Islands (UK) | | | 0.2 | |
| Short-Term and other Net Assets (Liabilities) | | | 0.8 | |
| | | | 100.0 | % |
ETFMG™ ETFs
ETFMG Prime Junior Silver Miners ETF
Schedule of Investments
September 30, 2023
| | | Shares | | | Value | |
| COMMON STOCKS - 99.2% | | | | | | | | |
| Australia - 0.4% | | | | | | | | |
| Metals & Mining - 0.4% (d) | | | | | | | | |
| Kingsgate Consolidated, Ltd. (a) | | | 2,673,120 | | | $ | 2,079,607 | |
| | | | | | | | | |
| Canada - 77.7% | | | | | | | | |
| Metals & Mining - 77.7% (d) | | | | | | | | |
| AbraSilver Resource Corp. (a) | | | 10,604,214 | | | | 2,342,179 | |
| Americas Gold & Silver Corp. (a)(e) | | | 4,370,301 | | | | 1,560,535 | |
| Andean Precious Metals Corp. (a)(e) | | | 3,168,463 | | | | 1,376,325 | |
| Aris Mining Corp. (a) | | | 1,421,611 | | | | 3,234,145 | |
| Ascot Resources, Ltd. (a) | | | 3,740,916 | | | | 1,032,832 | |
| Avino Silver & Gold Mines, Ltd. (a)(e) | | | 2,465,831 | | | | 1,270,813 | |
| Aya Gold & Silver, Inc. (a) | | | 2,654,170 | | | | 14,245,462 | |
| Bear Creek Mining Corp. (a)(e) | | | 3,121,893 | | | | 482,678 | |
| Capstone Copper Corp. (a) | | | 10,513,008 | | | | 44,583,049 | |
| Coppernico Metals, Inc. (a)(b)(e) | | | 585,867 | | | | 120,865 | |
| Discovery Silver Corp. NPV (a) | | | 7,975,891 | | | | 3,993,084 | |
| Dolly Varden Silver Corp. (a) | | | 5,147,962 | | | | 2,425,692 | |
| Dundee Precious Metals, Inc. | | | 1,917,426 | | | | 11,858,184 | |
| Eldorado Gold Corp. (a) | | | 2,101,868 | | | | 18,755,487 | |
| Endeavour Silver Corp. (a) | | | 5,517,666 | | | | 13,407,928 | |
| Filo Corp. (a) | | | 1,353,916 | | | | 20,225,257 | |
| First Majestic Silver Corp. | | | 11,931,256 | | | | 61,207,343 | |
| Fortuna Silver Mines, Inc. (a) | | | 3,014,354 | | | | 8,211,382 | |
| GoGold Resources, Inc. (a) | | | 6,587,397 | | | | 5,868,397 | |
| Guanajuato Silver Co., Ltd. (a) | | | 6,636,543 | | | | 1,392,538 | |
| Hudbay Minerals, Inc. | | | 3,587,465 | | | | 17,458,600 | |
| Kootenay Resources, Inc. (a)(b)(e) | | | 224,973 | | | | 1,656 | |
| Kootenay Silver, Inc. (a)(e) | | | 8,868,212 | | | | 522,332 | |
| Liberty Gold Corp. (a) | | | 3,307,479 | | | | 669,653 | |
| MAG Silver Corp. (a) | | | 3,728,843 | | | | 38,544,418 | |
| Mako Mining Corp. (a) | | | 442,912 | | | | 440,222 | |
| Mandalay Resources Corp. (a)(e) | | | 625,267 | | | | 893,074 | |
| Metalla Royalty & Streaming, Ltd. | | | 355,571 | | | | 1,091,648 | |
| Minaurum Gold, Inc. (a) | | | 2,467,336 | | | | 272,483 | |
| Mirasol Resources, Ltd. (a) | | | 441,775 | | | | 175,637 | |
| New Gold, Inc. (a) | | | 7,092,559 | | | | 6,527,295 | |
| New Pacific Metals Corp. (a) | | | 1,060,437 | | | | 1,826,926 | |
| Orla Mining, Ltd. (a) | | | 3,247,942 | | | | 11,478,094 | |
| Pan American Silver Corp. | | | 5,498,598 | | | | 79,589,499 | |
| Santacruz Silver Mining, Ltd. (a) | | | 7,085,846 | | | | 965,125 | |
| Seabridge Gold, Inc. (a) | | | 646,415 | | | | 6,796,103 | |
| Sierra Metals, Inc. (a) | | | 1,103,214 | | | | 324,893 | |
| Silvercorp Metals, Inc. | | | 4,012,861 | | | | 9,336,014 | |
| SilverCrest Metals, Inc. (a) | | | 4,243,726 | | | | 18,746,443 | |
| SSR Mining, Inc. | | | 2,411,610 | | | | 32,030,513 | |
| Summa Silver Corp. (a)(e) | | | 1,843,670 | | | | 597,250 | |
| Thesis Gold, Inc. (a) | | | 1,688,589 | | | | 795,654 | |
| Trevali Mining Corp. (a)(b)(e) | | | 967,999 | | | | — | |
| Vizsla Silver Corp. (a)(e) | | | 4,199,002 | | | | 4,513,560 | |
| Total Metals & Mining | | | | | | | 451,191,267 | |
| Luxembourg - 0.9% | | | | | | | | |
| Metals & Mining - 0.9% (d) | | | | | | | | |
| Nexa Resources SA (e) | | | 890,754 | | | | 5,389,061 | |
The accompanying notes are an integral part of these financial statements.
ETFMG™ ETFs
ETFMG Prime Junior Silver Miners ETF
Schedule of Investments
September 30, 2023
| | | Shares | | | Value | |
| Peru - 3.7% | | | | | | | | |
| Metals & Mining - 3.7% (d) | | | | | | | | |
| Cia de Minas Buenaventura SAA - ADR | | | 2,512,586 | | | $ | 21,407,233 | |
| | | | | | | | | |
| South Africa - 4.3% | | | | | | | | |
| Metals & Mining - 4.3% (d) | | | | | | | | |
| Harmony Gold Mining Co., Ltd. - ADR | | | 6,554,913 | | | | 24,646,473 | |
| | | | | | | | | |
| United Kingdom - 1.7% | | | | | | | | |
| Metals & Mining - 1.7% (d) | | | | | | | | |
| Adriatic Metals PLC (a)(e) | | | 1,975,580 | | | | 4,507,485 | |
| Hochschild Mining PLC (a) | | | 5,328,540 | | | | 5,409,157 | |
| Total Metals & Mining | | | | | | | 9,916,642 | |
| | | | | | | | | |
| United States - 10.3% | | | | | | | | |
| Metals & Mining - 10.3% (d) | | | | | | | | |
| Coeur Mining, Inc. (a) | | | 3,657,420 | | | | 8,119,472 | |
| Gatos Silver, Inc. (a) | | | 2,014,166 | | | | 10,433,380 | |
| Gold Resource Corp. | | | 916,189 | | | | 392,129 | |
| Hecla Mining Co. | | | 6,393,289 | | | | 24,997,760 | |
| Ivanhoe Electric, Inc. (a) | | | 1,074,806 | | | | 12,790,191 | |
| McEwen Mining, Inc. (a) | | | 491,643 | | | | 3,195,680 | |
| Total Metals & Mining | | | | | | | 59,928,612 | |
| | | | | | | | | |
| Virgin Islands (UK) - 0.2% | | | | | | | | |
| Metals & Mining - 0.2% (d) | | | | | | | | |
| Sailfish Royalty Corp. (e) | | | 1,432,297 | | | | 1,138,878 | |
| TOTAL COMMON STOCKS (Cost $711,484,880) | | | | | | | 575,697,773 | |
| | | | | | | | | |
| SHORT-TERM INVESTMENTS - 0.8% | | | | | | | | |
| Money Market Funds - 0.8% | | | | | | | | |
| First American Government Obligations Fund - Class X, 5.26% (c) | | | 4,880,125 | | | | 4,880,125 | |
| TOTAL MONEY MARKET FUNDS (Cost $4,880,125) | | | | | | | 4,880,125 | |
| | | | | | | | | |
| Total Investments (Cost $716,365,005) - 100.0% | | | | | | | 580,577,898 | |
| Liabilities in Excess of Other Assets - (0.0)% (f) | | | | | | | (179,602 | ) |
| TOTAL NET ASSETS - 100.0% | | | | | | $ | 580,398,296 | |
Percentages are stated as a percent of net assets.
| ADR | American Depositary Receipt |
| PLC | Public Limited Company |
| (a) | Non-income producing security. |
| (b) | Value determined based on estimated fair value. The value of these securities total $122,521, which represents 0.02% of total net assets. Classified as Level 3 in the fair value hierarchy. Please refer to Note 2 of the Notes to Financial Statements. |
| (c) | The rate shown is the annualized seven-day yield at period end. |
| (d) | As of September 30, 2023, the Fund had a significant portion of its assets invested in the Metals & Mining Industry. |
| (e) | These securities have been deemed illiquid according to the Fund’s liquidity guidelines. The value of these securities total $22,374,512, which represents 3.85% of total net assets. |
| (f) | Amount is less than (0.05)%. |
The Global Industry Classification Standard (GICS®) was developed by and/or is the exclusive property of MSCI, Inc. and Standard & Poor’s Financial Services LLC (“S&P”). GICS is a service mark of MSCI and S&P and has been licensed for use by U.S. Bancorp Fund Services, LLC, doing business as U.S. Bank Global Fund Services (“Fund Services”).
The accompanying notes are an integral part of these financial statements.
ETFMG™ ETFs
STATEMENT OF ASSETS AND LIABILITIES
As of September 30, 2023
| | | ETFMG Prime | |
| | | Junior Silver | |
| | | Miners ETF | |
| ASSETS | | | |
| Investments in unaffiliated securities, at value* | | $ | 580,577,898 | |
| Foreign currency* | | | 745 | |
| Receivables: | | | | |
| Dividends and interest receivable | | | 133,163 | |
| Receivable for fund shares sold | | | 4,219,750 | |
| Total assets | | | 584,931,556 | |
| | | | | |
| LIABILITIES | | | | |
| Payables: | | | | |
| Management fees payable | | | 349,829 | |
| Payable for investments purchased | | | 4,183,431 | |
| Total liabilities | | | 4,533,260 | |
| Net Assets | | $ | 580,398,296 | |
| | | | | |
| NET ASSETS CONSIST OF: | | | | |
| Paid-in Capital | | $ | 1,113,556,111 | |
| Total Distributable Earnings (Accumulated Losses) | | | (533,157,815 | ) |
| Net Assets | | $ | 580,398,296 | |
| | | | | |
| *Identified Cost: | | | | |
| | | | | |
| Investments in unaffiliated securities | | $ | 716,365,005 | |
| Foreign currency | | | 669 | |
| | | | | |
| Shares Outstanding^ | | | 68,700,000 | |
| Net Asset Value, Offering and Redemption Price per Share | | $ | 8.45 | |
| ^ | No par value, unlimited number of shares authorized |
The accompanying notes are an integral part of these financial statements.
ETFMG™ ETFs
STATEMENT OF OPERATIONS
For the Year Ended September 30, 2023
| | | ETFMG Prime | |
| | | Junior Silver | |
| | | Miners ETF | |
| INVESTMENT INCOME | | | | |
| Income: | | | | |
| Dividends from unaffiliated securities (net of foreign withholdings tax of $485,244) | | $ | 3,344,173 | |
| Interest | | | 235,253 | |
| Total Investment Income | | | 3,579,426 | |
| | | | | |
| Expenses: | | | | |
| Unitary fees | | | 4,687,198 | |
| Total Expenses | | | 4,687,198 | |
| Net Investment Loss | | | (1,107,772 | ) |
| | | | | |
| REALIZED & UNREALIZED GAIN (LOSS) ON INVESTMENTS | | | | |
| Net Realized Gain (Loss) on: | | | | |
| Unaffiliated Investments | | | (137,186,004 | ) |
| In-Kind redemptions | | | 5,474,021 | |
| Foreign currency and foreign currency translation | | | (1,234,854 | ) |
| Net Realized Loss on Investments and In-Kind redemptions | | | (132,946,837 | ) |
| Net Change in Unrealized Appreciation (Depreciation) of: | | | | |
| Unaffiliated Investments | | | 86,306,445 | |
| Foreign currency and foreign currency translation | | | 216 | |
| Net change in Unrealized Appreciation (Depreciation) on Investments | | | 86,306,661 | |
| Net Realized and Unrealized Loss on Investments | | | (46,640,176 | ) |
| NET DECREASE IN NET ASSETS RESULTING FROM OPERATIONS | | $ | (47,747,948 | ) |
The accompanying notes are an integral part of these financial statements.
ETFMG Prime Junior Silver Miners ETF
STATEMENTS OF CHANGES IN NET ASSETS
| | | Year Ended | | | Year Ended | |
| | | September 30, | | | September 30, | |
| | | 2023 | | | 2022 | |
| OPERATIONS | | | | | | | | |
| Net investment income (loss) | | $ | (1,107,772 | ) | | $ | 933,359 | |
| Net realized loss on investments, in-kind redemptions and foreign currency and foreign currency translation | | | (132,946,837 | ) | | | (130,198,048 | ) |
| Net change in unrealized appreciation (depreciation) of investments and foreign currency and foreign currency translation | | | 86,306,661 | | | | (73,184,613 | ) |
| Net decrease in net assets resulting from operations | | | (47,747,948 | ) | | | (202,449,302 | ) |
| | | | | | | | | |
| DISTRIBUTIONS TO SHAREHOLDERS | | | | | | | | |
| Total distributions from distributable earnings | | | (380,891 | ) | | | (2,774,481 | ) |
| | | | | | | | | |
| CAPITAL SHARE TRANSACTIONS | | | | | | | | |
| Net increase in net assets derived from net change in outstanding shares | | | 22,169,535 | | | | 83,589,400 | |
| Transaction Fees (See Note 1) | | | — | | | | 4,914 | |
| Net increase in net assets from capital share transactions | | | 22,169,535 | | | | 83,594,314 | |
| Total decrease in net assets | | | (25,959,304 | ) | | | (121,629,469 | ) |
| | | | | | | | | |
| NET ASSETS | | | | | | | | |
| Beginning of Year | | | 606,357,600 | | | | 727,987,069 | |
| End of Year | | $ | 580,398,296 | | | $ | 606,357,600 | |
| Summary of share transactions is as follows: |
| | | | | | | | | | |
| | | Year Ended | | | Year Ended | |
| | | September 30, 2023 | | | September 30, 2022 | |
| | | Shares | | | Amount | | | Shares | | | Amount | |
| Shares Sold | | | 4,500,000 | | | $ | 47,001,305 | | | | 18,400,000 | | | $ | 245,058,950 | |
| Transaction Fees (See Note 1) | | | — | | | | — | | | | — | | | | 4,914 | |
| Shares Redeemed | | | (2,350,000 | ) | | | (24,831,770 | ) | | | (13,450,000 | ) | | | (161,469,550 | ) |
| Net Transactions in Fund Shares | | | 2,150,000 | | | $ | 22,169,535 | | | | 4,950,000 | | | $ | 83,594,314 | |
| Beginning Shares | | | 66,550,000 | | | | | | | | 61,600,000 | | | | | |
| Ending Shares | | | 68,700,000 | | | | | | | | 66,550,000 | | | | | |
The accompanying notes are an integral part of these financial statements.
ETFMG Prime Junior Silver Miners ETF
FINANCIAL HIGHLIGHTS
For a capital share outstanding throughout each year
| | | Year | | | Year | | | Year | | | Year | | | Year | |
| | | Ended | | | Ended | | | Ended | | | Ended | | | Ended | |
| | | September 30, | | | September 30, | | | September 30, | | | September 30, | | | September 30, | |
| | | 2023 | | | 2022 | | | 2021 | | | 2020 | | | 2019 | |
| Net Asset Value, Beginning of Year | | $ | 9.11 | | | $ | 11.82 | | | $ | 13.79 | | | $ | 9.45 | | | $ | 8.70 | |
| Income (Loss) from Investment Operations: | | | | | | | | | | | | | | | | | | | | |
| Net investment income (loss)1 | | | (0.02 | ) | | | 0.01 | | | | (0.01 | ) | | | (0.05 | ) | | | (0.02 | ) |
| Net realized and unrealized gain (loss) on investments | | | (0.63 | ) | | | (2.68 | ) | | | (1.76 | ) | | | 4.56 | | | | 0.91 | |
| Total from investment operations | | | (0.65 | ) | | | (2.67 | ) | | | (1.77 | ) | | | 4.51 | | | | 0.89 | |
| Less Distributions: | | | | | | | | | | | | | | | | | | | | |
| Distributions from net investment income | | | (0.01 | ) | | | (0.04 | ) | | | (0.20 | ) | | | (0.17 | ) | | | (0.14 | ) |
| Total distributions | | | (0.01 | ) | | | (0.04 | ) | | | (0.20 | ) | | | (0.17 | ) | | | (0.14 | ) |
| Capital Share Transactions: | | | | | | | | | | | | | | | | | | | | |
| Transaction fees | | | — | | | | 0.00 | 2 | | | 0.00 | 2 | | | — | | | | — | |
| Net asset value, end of year | | $ | 8.45 | | | $ | 9.11 | | | $ | 11.82 | | | $ | 13.79 | | | $ | 9.45 | |
| Total Return | | | (7.23 | )% | | | (22.63 | )% | | | (13.06 | )% | | | 48.06 | % | | | 10.45 | % |
| | | | | | | | | | | | | | | | | | | | | |
| Ratios/Supplemental Data: | | | | | | | | | | | | | | | | | | | | |
| Net assets at end year (000’s) | | $ | 580,398 | | | $ | 606,358 | | | $ | 727,987 | | | $ | 408,319 | | | $ | 100,119 | |
| | | | | | | | | | | | | | | | | | | | | |
| Gross Expenses to Average Net Assets | | | 0.69 | % | | | 0.69 | % | | | 0.69 | % | | | 0.69 | % | | | 0.69 | % |
| Net Investment Income (Loss) to Average Net Assets | | | (0.16 | )% | | | 0.12 | % | | | (0.10 | )% | | | (0.46 | )% | | | (0.21 | )% |
| Portfolio Turnover Rate | | | 80 | % | | | 34 | % | | | 26 | % | | | 71 | % | | | 34 | % |
| 1 | Calculated based on average shares outstanding during the year. |
| 2 | Amount is less than 0.005%.per share. |
The accompanying notes are an integral part of these financial statements.
ETFMG™ ETFs
NOTES TO FINANCIAL STATEMENTS
September 30, 2023
NOTE 1 – ORGANIZATION
ETFMG Prime Junior Silver Miners ETF (“SILJ”, or the “Fund”) is a series of ETF Managers Trust (the “Trust”), an open-end management investment company consisting of multiple investment series, organized as a Delaware statutory trust on July 1, 2009. The Trust is registered with the SEC under the Investment Company Act of 1940, as amended (the “1940 Act”), as an open-end management investment company and the offering of the Fund’s shares (“Shares”) is registered under the Securities Act of 1933, as amended (the “Securities Act”).
The following table is a summary of the Strategy Commencement Date and Strategy of the Fund:
| | | Strategy | | |
| | | Commencement | | |
| Fund Ticker | | Date | | Strategy |
| ETFMG Prime Junior Silver Miners ETF | 8/1/2017 | | Seeks to provide investment results that, before fees and expenses, correspond generally to the price and yield performance of the Prime Junior Silver Miners & Explorers Index (the “Index”). |
The Fund currently offers one class of shares, which have no front-end sales load, no deferred sales charges, and no redemption fees. The Fund may issue an unlimited number of shares of beneficial interest, with no par value. All shares of the Fund have equal rights and privileges.
Shares of the Fund are listed and traded on the NYSE Arca, Inc. Market prices for the shares may be different from its net asset value (“NAV”). The Fund issues and redeems shares on a continuous basis at NAV only in blocks of 50,000 shares, called “Creation Units.” Creation Units are issued and redeemed principally in-kind for securities included in a specified Index. Once created, shares generally trade in the secondary market at market prices that change throughout the day in quantities less than a Creation Unit. Except when aggregated in Creation Units, shares are not redeemable securities of the Fund. Shares of the Fund may only be purchased or redeemed by certain financial institutions (“Authorized Participants”). An Authorized Participant is either (i) a broker-dealer or other participant in the clearing process through the Continuous Net Settlement System of the National Securities Clearing Corporation or (ii) a DTC participant and, in each case, must have executed a Participant Agreement with the Distributor. Most retail investors do not qualify as Authorized Participants nor have the resources to buy and sell whole Creation Units. Therefore, they are unable to purchase or redeem the shares directly from the Fund. Rather, most retail investors may purchase Shares in the secondary market with the assistance of a broker and may be subject to customary brokerage commissions or fees.
Authorized Participants transacting in Creation Units for cash may pay an additional variable charge to compensate the Fund for certain transaction costs (i.e., brokerage costs) and market impact expenses relating to investing in portfolio securities. Such variable charges, if any, are included in Transaction Fees” in the Statements of Changes in Net Assets.
NOTE 2 – SIGNIFICANT ACCOUNTING POLICIES
The following is a summary of significant accounting policies consistently followed by the Fund. These policies are in conformity with accounting principles generally accepted in the United States of America (“U.S. GAAP”).
The Fund follows the investment company accounting and reporting guidance of the Financial Accounting Standards Board Accounting Standard Codification Topic 946 Financial Services – Investment Companies.
ETFMG™ ETFs
NOTES TO FINANCIAL STATEMENTS
September 30, 2023
The Fund may invest in certain other investment companies (underlying funds). For more information about the underlying Fund’s operations and policies, please refer to those Fund’s semiannual and annual reports, which are filed with the SEC.
| A. | Security Valuation. Securities listed on a securities exchange, market or automated quotation system for which quotations are readily available (except for securities traded on NASDAQ), including securities traded over the counter, are valued at the last quoted sale price on the primary exchange or market (foreign or domestic) on which they are traded on the valuation date (or at approximately 4:00 pm Eastern Time if a security’s primary exchange is normally open at that time), or, if there is no such reported sale on the valuation date, at the most recent quoted bid price. For securities traded on NASDAQ, the NASDAQ Official Closing Price will be used. |
Securities for which quotations are not readily available are valued at their respective fair values as determined in good faith by ETF Managers Group, LLC (the “Adviser”), using procedures adopted by the Board of Trustees (the “Board”). When a security is “fair valued,” consideration is given to the facts and circumstances relevant to the particular situation, including a review of various factors set forth in the pricing procedures adopted by the Fund’s Board. The use of fair value pricing by a Fund may cause the net asset value of its shares to differ significantly from the net asset value that would be calculated without regard to such considerations. As of September 30, 2023, the Fund held three securities that were fair valued by the Adviser.
As described above, the Fund utilizes various methods to measure the fair value of its investments on a recurring basis. U.S. GAAP establishes a hierarchy that prioritizes inputs to valuation methods. The three levels of inputs are:
| Level 1 | Unadjusted quoted prices in active markets for identical assets or liabilities that the Fund has the ability to access. |
| Level 2 | Observable inputs other than quoted prices included in Level 1 that are observable for the asset or liability, either directly or indirectly. These inputs may include quoted prices for the identical instrument on an inactive market, prices for similar instruments, interest rates, prepayment speeds, credit risk, yield curves, default rates and similar data. |
| Level 3 | Unobservable inputs for the asset or liability, to the extent relevant observable inputs are not available; representing the Fund’s own assumptions about the assumptions a market participant would use in valuing the asset or liability, and would be based on the best information available. |
The availability of observable inputs can vary from security to security and is affected by a wide variety of factors, including, for example, the type of security, whether the security is new and not yet established in the marketplace, the liquidity of markets, and other characteristics particular to the security. To the extent that valuation is based on models or inputs that are less observable or unobservable in the market, the determination of fair value requires more judgment. Accordingly, the degree of judgment exercised in determining fair value is greatest for instruments categorized in Level 3.
The inputs used to measure fair value may fall into different levels of the fair value hierarchy. In such cases, for disclosure purposes, the level in the fair value hierarchy within which the fair value measurement falls in its entirety, is determined based on the lowest level input that is significant to the fair value measurement in its entirety.
ETFMG™ ETFs
NOTES TO FINANCIAL STATEMENTS
September 30, 2023
The following is a summary of the inputs used to value the Fund’s net assets as of September 30, 2023:
| ETFMG Prime Junior Silver Miners ETF | | | | | | | | | | | | | | | | |
| Assets^ | | Level 1 | | | Level 2 | | | Level 3 | | | Total | |
| Common Stocks | | $ | 575,575,252 | | | $ | — | | | $ | 122,521 | | | $ | 575,697,773 | |
| Short Term Investments | | | 4,880,125 | | | | — | | | | — | | | | 4,880,125 | |
| Total Investments in Securities | | $ | 580,455,377 | | | $ | — | | | $ | 122,521 | | | $ | 580,577,898 | |
| ^ | See Schedule of Investments for classifications by country and industry. |
| B. | Federal Income Taxes. The Fund has elected to be taxed as a “regulated investment company” and intends to distribute substantially all taxable income to its shareholders and otherwise comply with the provisions of the Internal Revenue Code applicable to regulated investment companies. Therefore, no provisions for federal income taxes or excise taxes have been made. |
To avoid imposition of the excise tax applicable to regulated investment companies, the Fund intends to declare each year as dividends, in each calendar year, at least 98.0% of its net investment income (earned during the calendar year) and 98.2% of its net realized capital gains (earned during the twelve months ended October 31) plus undistributed amounts, if any, from prior years.
Net capital losses incurred after October 31, within the taxable year are deemed to arise on the first business day of the Fund’s next taxable year.
The Fund recognizes the tax benefits of uncertain tax positions only where the position is “more likely than not” to be sustained assuming examination by tax authorities. The Fund has analyzed its tax position and has concluded that no liability for unrecognized tax benefits should be recorded related to uncertain tax positions expected to be taken in the Fund’s 2023 tax returns. The Fund identifies its major tax jurisdictions as U.S. Federal, the State of New Jersey, and the State of Delaware; however the Fund is not aware of any tax positions for which it is reasonably possible that the total amounts of unrecognized tax benefits will change materially in the next twelve months.
As of September 30, 2023, management has reviewed the tax positions for open periods (for Federal purposes, three years from the date of filing and for state purposes, generally a range of three to four years from the date of filing), as applicable to the Fund, and has determined that no provision for income tax is required in the Fund’s financial statements.
| C. | Security Transactions and Investment Income. Investment securities transactions are accounted for on the trade date. Gains and losses realized on sales of securities are determined on a specific identification basis. Discounts/premiums on debt securities purchased are accreted/amortized over the life of the respective securities using the effective interest method. Dividend income is recorded on the ex-dividend date. Interest income is recorded on an accrual basis. Income, including gains, from investments in foreign securities received by the Fund may be subject to income, withholding or other taxes imposed by foreign countries. |
| D. | Foreign Currency Translations and Transactions. The Fund may engage in foreign currency transactions. Foreign currency transactions are translated into U.S. dollars on the following basis: (i) market value of investment securities, assets and liabilities at the daily rates of exchange, and (ii) purchases and sales of investment securities, dividend and interest income and certain expenses at the rates of exchange prevailing on the respective dates of such transactions. For financial reporting purposes, the Fund does not isolate changes in the exchange rate of investment securities from the fluctuations arising from changes in the market prices of securities for unrealized gains and losses. However, for federal income tax purposes, the Fund does isolate and treat as ordinary income the effect of changes in foreign exchange rates on realized gains or losses from the sale of investment securities and payables and receivables arising from trade-date and settlement-date differences. |
ETFMG™ ETFs
NOTES TO FINANCIAL STATEMENTS
September 30, 2023
| E. | Distributions to Shareholders. Distributions to shareholders from net investment income are generally declared and paid by the Fund on a quarterly basis. Distributions to shareholders from realized gains on securities for the Fund normally are declared and paid on an annual basis. Distributions are recorded on the ex-dividend date. |
| F. | Use of Estimates. The preparation of financial statements in conformity with U.S. GAAP requires management to make estimates and assumptions that affect the reported amounts of assets and liabilities at the date of the financial statements, as well as the reported amounts of revenues and expenses during the reporting period. Actual results could differ from those estimates. |
| G. | Share Valuation. The net asset value (“NAV”) per share of the Fund is calculated by dividing the sum of the value of the securities held by the Fund, plus cash and other assets, minus all liabilities (including estimated accrued expenses) by the total number of shares outstanding for the Fund, rounded to the nearest cent. The Fund’s shares will not be priced on the days on which the NYSE is closed for trading. For Authorized Participants, the offering and redemption price per share for the Fund are equal to the Fund’s respective net asset value per share. |
| H. | Guarantees and Indemnifications. In the normal course of business, the Fund enters into contracts with service providers that contain general indemnification clauses. The Fund’s maximum exposure under these arrangements is unknown as this would involve future claims that may be made against the Fund that have not yet occurred. However, based on experience, the Fund expects the risk of loss to be remote. |
NOTE 3 – RISK FACTORS
Investing in the Fund may involve certain risks, as discussed in the Fund’s prospectus, including, but not limited to, those described below. Any of these risks could cause an investor to lose money.
Market Risk. Financial markets rise and fall in response to a variety of factors, sometimes rapidly and unpredictably. As with any investment whose performance is tied to these markets, the value of an investment in the Fund will fluctuate, which means that an investor could lose money over short or long periods.
Investment Style Risk. The Fund is not actively managed (“Index Fund”). Therefore, the Fund follows the securities included in its index during upturns as well as downturns. Because of its indexing strategies, the Index Fund does not take steps to reduce market exposure or to lessen the effects of a declining market. In addition, because of the Index Fund’s expenses, the Index Fund’s performance may be below that of its respective index.
Equity Risk. The prices of equity securities rise and fall daily. These price movements may result from factors affecting individual companies, industries or the securities market as a whole. In addition, equity markets tend to move in cycles which may cause stock prices to fall over short or extended periods of time.
Securities Lending Risk. Securities lending involves the risk of loss of rights in, or delay in recovery of, the loaned securities if the borrower fails to return the security loaned or becomes insolvent.
Concentration Risk. To the extent that the Fund’s or an index’s portfolio is concentrated in the securities of issuers in a particular market, industry, group of industries, sector or asset class, the fund may be adversely affected by the performance of those securities, may be subject to increased price volatility and may be more vulnerable to adverse economic, market, political or regulatory occurrences affecting that market, industry, group of industries, sector or asset class.
ETFMG™ ETFs
NOTES TO FINANCIAL STATEMENTS
September 30, 2023
Natural Disaster/Epidemic Risk. Natural or environmental disasters, such as earthquakes, fires, floods, hurricanes, tsunamis and other severe weather-related phenomena generally, and widespread disease, including pandemics and epidemics (for example, the novel coronavirus COVID -19), have been and can be highly disruptive to economies and markets and have recently led, and may continue to lead, to increased market volatility and significant market losses. Such natural disaster and health crises could exacerbate political, social, and economic risks previously mentioned, and result in significant breakdowns, delays, shutdowns, social isolation, and other disruptions to important global, local and regional supply chains affected, with potential corresponding results on the operating performance of the Fund and its investments. A climate of uncertainty and panic, including the contagion of infectious viruses or diseases, may adversely affect lobal, regional, and local economies and reduce the availability of potential investment opportunities, and increases the difficulty of performing due diligence and modeling market conditions, potentially reducing the accuracy of financial projections. Under the circumstances, the Fund may have difficulty achieving its investment objectives which may adversely impact performance. Further, such events can be highly disruptive to economies and markets, significantly disrupt the operations of individual companies (including, but not limited to, the Fund’s Sponsor and third party service providers), sectors, industries, markets, securities and commodity exchanges, currencies, interest and inflation rates, credit ratings, investor sentiment, and other factors affecting the value of the Fund’s investments. These factors can cause substantial market volatility. exchange trading suspensions and closures and can impact the ability of the Fund to complete redemptions and otherwise affect Fund performance and Fund trading in the secondary market. A widespread crisis may also affect the global economy in ways that cannot necessarily be foreseen at the current time. How long such events will last and whether they will continue or recur cannot be predicted. Impacts from these events could have significant impact on the Fund’s performance, resulting in losses to the Fund.
Daily Index Correlation/Tracking Risk. There is no guarantee that the Fund will achieve a high degree of correlation to the Index and therefore achieve its daily leveraged investment objective. To achieve a high degree of correlation with the Index, the Fund seeks to rebalance its portfolio daily to keep leverage consistent with its daily leveraged investment objective. In addition, the Fund’s exposure to the Index is impacted by the Index’s movement. Because of this, it is unlikely that the Fund will be perfectly exposed to the Index at the end of each day. The possibility of the Fund being materially over- or under -exposed to the Index increases on days when the Index is volatile near the close of the trading day. Market disruptions, regulatory restrictions and extreme volatility will also adversely affect the Fund’s ability to adjust exposure to the required levels.
On February 24, 2022, Russia commenced a military attack on Ukraine. The outbreak of hostilities between the two countries could result in more widespread conflict and could have a severe adverse effect on the region and the markets. In addition, sanctions imposed on Russia by the United States and other countries, and any sanctions imposed in the future could have a significant adverse impact on the Russian economy and related markets.
On October 7, 2023, Hamas launched a significant attack on Israel from the Gaza Strip. The extent and duration of the Israel-Hamas war and any related economic and market impacts are impossible to predict but may be significant and may negatively impact Israel’s economy. The price and liquidity of investments may fluctuate widely as a result of these conflicts and related events. How long such conflicts and related events will last, and whether either may escalate further, cannot be predicted, however such conflicts may negatively impact issuers of securities in which the Fund(s) invests.
A complete description of the principal risks is included in the Fund’s prospectus under the heading “Principal Investment Risks.”
ETFMG™ ETFs
NOTES TO FINANCIAL STATEMENTS
September 30, 2023
NOTE 4 – MANAGEMENT AND OTHER CONTRACTS
The Adviser serves as the investment advisor to the Fund. Pursuant to an Investment Advisory Agreement (“Advisory Agreement”) between the Trust, on behalf of the Fund, and the Adviser, the Adviser provides investment advice to the Fund and oversees the day-to-day operations of the Fund, subject to the direction and control of the Board and the officers of the Trust. Under the Advisory Agreement, the Adviser is also responsible for arranging transfer agency, custody, fund administration and accounting, and other non-distribution related services necessary for the Fund to operate.
Under the Investment Advisory Agreement, the Adviser has overall responsibility for the general management and administration of the Fund and arranges for sub-advisory, transfer agency, custody, fund administration, securities lending, and all other non-distribution related services necessary for the Fund to operate. The Fund’s unitary fees are accrued daily and paid monthly. The Adviser bears the costs of all advisory and non-advisory services required to operate the Fund, in exchange for a single unitary fee at the following annual rates:
| ETFMG Prime Junior Silver Miners ETF | 0.69% |
Under the Investment Advisory Agreement, the Adviser has agreed to pay all expenses of the Fund, except for: the fee paid to the Adviser pursuant to the Investment Advisory Agreement, interest charges on any borrowings, taxes, brokerage commissions and other expenses incurred in placing orders for the purchase and sale of securities and other investment instruments, acquired fund fees and expenses, accrued deferred tax liability, extraordinary expenses, and distribution (12b-1) fees and expenses (collectively, “Excluded Expenses”). The Adviser has entered into an agreement with Foreside Fund Services LLC to serve as distributor to the Fund (the “Distributor”). The Distributor provides marketing support for the Fund, including distributing marketing materials related to the Funds. Level ETF Ventures, LLC (“Level”) serves as the index provider for the Fund. Level is not affiliated with the Trust or the Adviser.
U.S. Bancorp Fund Services, LLC doing business as U.S. Bank Global Fund Services (the “Administrator”) provides fund accounting, fund administration, and transfer agency services to the Fund. The Adviser compensates the Administrator for these services under an administration agreement between the two parties.
The Adviser pays each independent Trustee a quarterly fee for service to the Fund. Each Trustee is also reimbursed by the Adviser for all reasonable out-of-pocket expenses incurred in connection with his duties as Trustee, including travel and related expenses incurred in attending Board meetings.
NOTE 5 – DISTRIBUTION PLAN
The Fund has adopted a Plan of Distribution pursuant to Rule 12b-1 under the 1940 Act. Under the Plan, the Fund may pay compensation to the Distributor or any other distributor or financial institution with which the Trust has an agreement with respect to the Fund, with the amount of such compensation not to exceed an annual rate of 0.25% of the Fund’s average daily net assets. During the year ended September 30, 2023, the Fund did not incur any 12b-1 expenses.
ETFMG™ ETFs
NOTES TO FINANCIAL STATEMENTS
September 30, 2023
NOTE 6 - PURCHASES AND SALES OF SECURITIES
The costs of purchases and sales of securities, excluding short-term securities and in-kind transactions, during the year ended September 30, 2023:
| | | Purchases | | | Sales | |
| ETFMG Prime Junior Silver Miners ETF | | $ | 537,112,716 | | | $ | 531,588,797 | |
The costs of purchases and sales of in-kind transactions associated with creations and redemptions during the year ended September 30, 2023:
| | | Purchases In- | | | Sales In- | |
| | | Kind | | | Kind | |
| ETFMG Prime Junior Silver Miners ETF | | $ | 45,632,998 | | | $ | 24,511,687 | |
Purchases in-kind are the aggregate of all in-kind purchases and sales in-kind are the aggregate of all in-kind sales. Net capital gains or losses resulting from in-kind redemptions are excluded from the Fund’s determination of taxable gains and are not distributed to shareholders.
There were no purchases or sales of U.S. Government obligations during the year ended September 30, 2023.
NOTE 7 – FEDERAL INCOME TAXES
The components of distributable earnings (losses) and cost basis of investments for federal income tax purposes at September 30, 2023 were as follows:
| | | | | | | | | Net | |
| | | Gross | | | Gross | | | Unrealized | |
| | | Unrealized | | | Unrealized | | | Appreciation | |
| | | Cost | | | Appreciation | | | Depreciation | | | (Depreciation) | |
| ETFMG Prime Junior Silver Miners ETF | | $ | 813,795,231 | | | $ | 27,477,165 | | | $ | (260,694,498 | ) | | $ | (233,217,333 | ) |
The difference between the tax cost of investments and the cost of investments for GAAP purposes is primarily due to the tax treatment of wash sale losses.
As of September 30, 2023, the components of distributable earnings (loss) on a tax basis were as follows:
| | | Undistributed
Ordinary
Income | | | Undistributed
Long-Term
Gain | | | Total
Distributable
Earnings | | | Other
Accumulated
Loss | | | Total
Accumulated
Gain (Loss) | |
| ETFMG Prime Junior Silver Miners ETF | | $ | — | | | $ | — | | | $ | — | | | $ | (299,940,482 | ) | | $ | (533,157,815 | ) |
The difference between the tax cost of investments and the cost of investments for GAAP purposes is primarily due to the tax treatment of wash sale losses.
As of September 30, 2023, the Fund had accumulated capital loss carryovers of:
| | | Capital Loss | | | Capital Loss | | | | |
| | | Carryforward | | | Carryforward | | | | |
| | | ST | | | LT | | | Expires | |
| ETFMG Prime Junior Silver Miners ETF | | $ | (132,046,895 | ) | | $ | (166,521,331 | ) | | Indefinite | |
ETFMG™ ETFs
NOTES TO FINANCIAL STATEMENTS
September 30, 2023
Under current tax law, capital and currency losses realized after October 31 of the Fund’s fiscal year may be deferred and treated as occurring on the first business day of the following fiscal year for tax purposes. The following Fund had deferred post-October capital and currency losses, which will be treated as arising on the first business day of the year ending September 30, 2023.
| | | Late Year | | Post-October | |
| | | Ordinary Loss | | Capital Loss | |
| ETFMG Prime Junior Silver Miners ETF | | $ | (1,372,333 | ) | $ | — | |
U.S. GAAP requires that certain components of net assets relating to permanent differences be reclassified between financial and tax reporting. These reclassifications have no effect on net assets or net asset value per share. For the fiscal year ended September 30, 2023, the following table shows the reclassifications made:
| | | Total
Distributable
Earnings/(Loss) | | Paid-In
Capital | |
| ETFMG Prime Junior Silver Miners ETF | | $ | (2,534,506 | ) | $ | 2,534,506 | |
The tax charter of distributions paid during the year ended September 30, 2023, and the year ended September 30, 2022 were as follows:
| | | Year Ended | | | Year Ended | |
| | | September 30, 2023 | | | September 30, 2022 | |
| | | From | | | From | | | From | | | From | |
| | | Ordinary | | | Capital | | | Ordinary | | | Capital | |
| | | Income | | | Gains | | | Income | | | Gains | |
| ETFMG Prime Junior Silver Miners ETF | | $ | 380,891 | | | | — | | | $ | 2,774,481 | | | | — | |
NOTE 8 – LEGAL MATTERS
The Trust, the Adviser, and certain officers and affiliated persons of the Adviser (together with the Adviser, the “Adviser Defendants”) were named as defendants in an action filed December 21, 2021, in the Superior Court of New Jersey, Union County, captioned PureShares, LLC, d/b/a PureFunds et al. v. ETF Managers Group, LLC et al., Docket No. UNN-C-152-21 (the “NJ Action”). The NJ Action asserted breach of contract and other tort claims and sought damages in unspecified amounts and injunctive relief. On May 25, 2022, the court in the NJ Action dismissed with prejudice all claims asserted against the Trust, as well as all contract claims and all except one tort claim asserted against the Adviser Defendants. With respect to the tort claim asserted against the Adviser Defendants, the parties stipulated and agreed to dismiss that claim without prejudice in May 2023.
The Adviser and certain of its affiliates have entered into a settlement agreement with the Securities and Exchange Commission (“SEC”) regarding certain alleged conflicts of interest arising in connection with ETFMG Alternative Harvest ETF’s (MJ) participation in the securities lending program administered by its prior custodian. Without admitting or denying the SEC’s findings, the Adviser and its parent company agreed to censures, to a cease-and-desist order, and to pay, jointly and severally, a civil penalty of $4 million. The settlement resolves the SEC’s investigation of the Adviser and its affiliates.
As of September 30, 2023, there were no adjustments made to the accompanying financial statements based on the above legal matters.
NOTE 9 – SUBSEQUENT EVENTS
In preparing these financial statements, the Fund has evaluated events and transactions for potential recognition or disclosure through the date the financial statements were issued.
ETFMG™ ETFs
NOTES TO FINANCIAL STATEMENTS
September 30, 2023
The Board of the Trust has approved an Agreement and Plan of Reorganization (the “Agreement”) providing for the reorganization of the Target Fund into a corresponding new fund (the “Acquiring Fund”), which is a newly created series of Amplify ETF Trust with similar investment objectives and the same fees and expenses as the corresponding Target Fund. The Reorganization is subject to certain conditions including approval by shareholders of the Target Fund. The following table shows shares of the Acquiring Fund that will be issued to shareholders of the corresponding Target Fund.
| Target Fund | Acquiring Fund |
| ETFMG Prime Junior Silver Miners ETF | Amplify Junior Silver Miners ETF |
The proxy solicitation materials were filed with the SEC on October 13, 2023. The Joint Special Meeting of Shareholders is to be held on December 28, 2023.
Other than as disclosed, there were no other subsequent events requiring recognition or disclosure through the date the financial statements were issued.
Report of Independent Registered Public Accounting Firm
To the Board of Trustees of ETF Managers Trust
and the Shareholders of ETFMG Prime Junior Silver Miners ETF:
Opinion on the Financial Statements
We have audited the accompanying statements of assets and liabilities, including the schedule of investments of ETFMG Prime Junior Silver Miners ETF (the “Fund”) as of September 30, 2023, the related statements of operations for the year then ended, the statements of changes in net assets for each of the two years in the period then ended, the financial highlights for each of periods indicated therein, and the related notes (collectively referred to as the “financial statements”). In our opinion, the financial statements present fairly, in all material respects, the financial position of the Funds as of September 30, 2023, and the results of their operations for the year then ended, the changes in net assets for each of the two years in the period then ended, and the financial highlights for each of the periods indicated therein, in conformity with accounting principles generally accepted in the United States of America.
Basis for Opinion
These financial statements and financial highlights are the responsibility of the Funds’ management. Our responsibility is to express an opinion on these financial statements and financial highlights based on our audits. We are a public accounting firm registered with the Public Company Accounting Oversight Board (United States) (“PCAOB”) and are required to be independent with respect to the Funds in accordance with the U.S. federal securities laws and the applicable rules and regulations of the Securities and Exchange Commission and the PCAOB.
We conducted our audits in accordance with the standards of the PCAOB. Those standards require that we plan and perform the audits to obtain reasonable assurance about whether the financial statements and financial highlights are free of material misstatement, whether due to error or fraud. The Funds are not required to have, nor were we engaged to perform, an audit of their internal control over financial reporting. As part of our audits we are required to obtain an understanding of internal control over financial reporting but not for the purpose of expressing an opinion on the effectiveness of the Funds’ internal control over financial reporting. Accordingly, we express no such opinion.
Our audits included performing procedures to assess the risks of material misstatement of the financial statements and financial highlights, whether due to error or fraud, and performing procedures that respond to those risks. Such procedures included examining, on a test basis, evidence regarding the amounts and disclosures in the financial statements and financial highlights. Our audits also included evaluating the accounting principles used and significant estimates made by management, as well as evaluating the overall presentation of the financial statements and financial highlights. Our procedures included confirmation of securities owned as of September 30, 2023 by correspondence with the custodian. We believe that our audits provide a reasonable basis for our opinion.
/s/WithumSmith+Brown, PC
We have served as the auditor of one or more series of the Trust since 2013.
New York, New York
November 29, 2023
ETFMG™ ETFs
EXPENSE EXAMPLE
Period Ended September 30, 2023 (Unaudited)
As a shareholder of the Funds you incur two types of costs: (1) transaction costs, including brokerage commissions on purchases and sales of Fund shares, and (2) ongoing costs, including management fees and other Fund expenses. These examples are intended to help you understand your ongoing costs (in dollars) of investing in the Funds and to compare these costs with the ongoing costs of investing in other funds. The examples are based on an investment of $1,000 invested for the period of time as indicated in the table below.
Actual Expenses
The first line of the table provides information about actual account values based on actual returns and actual expenses. You may use the information in this line, together with the amount you invested, to estimate the expenses that you paid over the period. Simply divide your account value by $1,000 (for example, an $8,600 account value divided by $1,000 = 8.6), then, multiply the result by the number in the first line under the heading entitled “Expenses Paid During Period’’ to estimate the expenses you paid on your account during this period.
Hypothetical Example for Comparison Purposes
The second line of the table provides information about hypothetical account values based on a hypothetical return and hypothetical expenses based on the Fund’s actual expense ratio and an assumed rate of return of 5% per year before expenses, which is not the Fund’s actual return. The hypothetical account values and expenses may not be used to estimate the actual ending account balance or expenses you paid for the period. You may use this information to compare the ongoing costs of investing in the Fund and other funds. To do so, compare this 5% hypothetical example with the 5% hypothetical examples that appear in the shareholder reports of the other funds. Please note that the expenses shown in the table are meant to highlight your ongoing costs only and do not reflect any transactional costs, such as brokerage commissions paid on purchases and sales of Fund shares. Therefore, the second line of the table is useful in comparing ongoing costs only and will not help you determine the relative total costs of owning different funds. If these transactional costs were included, your costs would have been higher.
| | | | | | | | | | | | Annualized | |
| | | | | | | | | | | | Expense | |
| | | | | | | | | | | | Ratio | |
| | | | | | | | | | | | During the | |
| | | Beginning | | | Ending | | | Expenses | | | Period | |
| | | Account | | | Account | | | Paid | | | April 1, | |
| | | Value | | | Value | | | During | | | 2023 to | |
| | | April 1, | | | September | | | the | | | September | |
| Fund Name | | 2023 | | | 30, 2023 | | | Period^ | | | 30, 2023 | |
| ETFMG Prime Junior Silver Miners ETF | | | | | | | | | | | | | | | | |
| Actual | | $ | 1,000.00 | | | $ | 760.80 | | | $ | 3.05 | | | | 0.69 | % |
| Hypothetical (5% annual) | | | 1,000.00 | | | | 1,021.61 | | | | 3.50 | | | | 0.69 | % |
| ^ | The dollar amounts shown as expenses paid during the period are equal to the annualized six-month expense ratio multiplied by the average account value during the period, multiplied by 183/365 (to reflect the one-half year period). |
ETFMG™ ETFs
Board of Trustees
Set forth below are the names, birth years, positions with the Trust, length of term of office, and the principal occupations and other directorships held during at least the last five years of each of the persons currently serving as a Trustee of the Trust, as well as information about each officer. The business address of each Trustee and officer is 30 Maple Street, 2nd Floor, Summit, New Jersey 07901. The SAI includes additional information about Fund directors and is available, without charge, upon request by calling 1-844-ETF-MGRS (1-844-383-6477).
Name and Year of Birth | Position(s) Held with the Trust, Term of Office and Length of Time Served | Principal Occupation(s) During Past 5 Years | Number of Portfolios in Fund Complex Overseen By Trustee | Other Directorships Held by Trustee During Past 5 Years |
| Interested Trustee and Officers |
Michael Minella
(1971) | President (since 2023) | Senior Principal Consultant, ACA Group (since 2022); Vice President and Director, Fidelity Investments (2009-2022). | n/a | n/a |
John A. Flanagan
(1946) | Treasurer (since 2015) | President, John A. Flanagan CPA, LLC (accounting services) (since 2010); Treasurer, ETF Managers Trust (since 2015); Chief Financial Officer, ETF Managers Capital, LLC (commodity pool operator) (since 2015). | n/a | Independent Trustee - Absolute Shares Trust (since 2014) (6 portfolios) |
Kevin Hourihan
(1978) | Chief Compliance Officer (since 2022) | Senior Principal Consultant, Fund Chief Compliance Officer, ACA Global, LLC (since 2022); Chief Compliance Officer, Ashmore Funds (2017-2022); Chief Compliance Officer, Ashmore Investment Management (US) Corp (2014-2022); Chief Compliance Officer, Ashmore Equities Investment Management (2015-2019). | n/a | n/a |
Matthew J. Bromberg
(1973) | Secretary (since 2023) | Chief Compliance Officer and Chief Compliance Officer of ETF Managers Group, LLC (since 2022); General Counsel and Secretary of Exchange Traded Managers Group LLC (since 2020); ETF Managers Group LLC (since 2020); ETFMG Financial LLC (since 2020); ETF Managers Capital LLC (since 2020); Partner of Dorsey & Whitney LLP (law firm) (2019-2020); General Counsel of WBI Investments, Inc. (2016-2019); Millington Securities, Inc. (2016-2019). | n/a | n/a |
ETFMG™ ETFs
Board of Trustees (Continued)
Name and Year of Birth | Position(s) Held with the Trust, Term of Office and Length of Time Served | Principal Occupation(s) During Past 5 Years | Number of Portfolios in Fund Complex Overseen By Trustee | Other Directorships Held by Trustee During Past 5 Years |
Terry Loebs
(1963) | Chairman of the Board (since 2023); Trustee (since 2014); Lead Independent Trustee (since 2020) | Founder and Managing Member, Pulsenomics LLC (index product development and consulting firm) (since 2011); Managing Director, MacroMarkets, LLC (exchange- traded products firm) (2006- 2011). | 12 | None |
Eric Wiegel
(1960) | Trustee (since 2020) | Managing Partner, Global Focus Capital LLC (since 2013); Senior Portfolio Manager, Little House Capital (2019-2021); Chief Investment Officer, Insight Financial Strategist LLC (2017- 2018). | 12 | None |
SUPPLEMENTARY INFORMATION
September 30, 2023 (Unaudited)
NOTE 1 – FREQUENCY DISTRIBUTION OF PREMIUMS AND DISCOUNTS
Information regarding how often shares of the Fund traded on the Exchange at a price above (i.e., at a premium) or below (i.e., at a discount) the NAV is available on the Fund’s website at www.etfmgfunds.com.
NOTE 2 – FEDERAL TAX INFORMATION
Qualified Dividend Income/Dividends Received Deduction
For the fiscal year ended September 30, 2023, certain dividends paid by the Fund may be subject to a maximum tax rate of 15%, as provided for by the Jobs and Growth Tax Reconciliation Act of 2003. The percentage of dividends declared from ordinary income designated as qualified dividend income was as follows:
| | | Qualified | |
| Fund Name | | Dividend Income | |
| ETFMG Prime Junior Silver Miners ETF | | | 100.00 | % |
For corporate shareholders, the percent of ordinary income distributions qualifying for the corporate dividends received deduction for the fiscal year ended September 30, 2023 was as follows:
| | | Dividends | |
| Fund Name | | Received Deduction | |
| ETFMG Prime Junior Silver Miners ETF | | | 48.64 | % |
Short Term Capital Gain
The percentage of taxable ordinary income distributions that are designated as short-term capital gain distributions under Internal Revenue Section 871 (k)(2)(C) for the Fund was as follows:
| | | Short-Term | |
| Fund Name | | Capital Gain | |
| ETFMG Prime Junior Silver Miners ETF | | | 0.00 | % |
During the year ended September 30, 2023, the Fund did not declare any long-term realized gains distributions.
Pursuant to Section 853 of the Internal Revenue Code, the Fund designated the following amounts as foreign taxes paid for the year ended September 30, 2023. Foreign taxes paid for purposes of Section 853 may be less than actual foreign taxes paid for financial statement purposes.
| | | | | | | | | Per Share | | | | |
| | | Gross | | | | | | Gross | | | | | | | |
| | | Foreign | | | Foreign | | | Foreign | | | Foreign | | | Shares | |
| | | Source | | | Taxes | | | Source | | | Taxes | | | Outstanding | |
| Fund | | Income | | | Passthrough | | | Income | | | Passthrough | | | at 9/30/23 | |
| ETFMG Prime Junior Silver Miners ETF | | | 3,645,531 | | | | 485,244 | | | | 0.05306450 | | | | 0.00706323 | | | | 68,700,000 | |
Foreign taxes paid or withheld should be included to taxable income with an offsetting deduction from gross income or as a credit for taxes paid to foreign governments.
Above figures may differ from those cited elsewhere in this report due to difference in the calculation of income and gains under GAAP purposes and Internal Revenue Service purposes.
NOTE 3 – INFORMATION ABOUT PORTFOLIO HOLDINGS
The Fund files its complete schedule of portfolio holdings for its first and third fiscal quarters with the Securities and Exchange Commission (“SEC”) on Part F of Form N-PORT. The Fund’s Part F of Form N-PORT is available on the website of the SEC at www.sec.gov and the Fund’s website at www.etfmgfunds.com. The Fund’s portfolio holdings are posted on its website at www.etfmgfunds.com, daily.
NOTE 4 – INFORMATION ABOUT PROXY VOTING
A description of the policies and procedures the Fund uses to determine how to vote proxies relating to portfolio securities is provided in the Statement of Additional Information (“SAI”). The SAI is available without charge upon request by calling toll-free at (877) 756-7873, by accessing the SEC’s website at www.sec.gov, or by accessing the Fund’s website at www.etfmgfunds.com.
Information regarding how the Fund voted proxies relating to portfolio securities during the period ending June 30 is available by calling toll-free at (877) 756-7873 or by accessing the SEC’s website at www.sec.gov.
Carefully consider the Fund’s investment objectives, risk factors, charges, and expenses before investing. This and additional information can be found in the Fund’s prospectus, which may be obtained by calling 1-844-ETF-MGRS (1-844-383-6477) or by visiting www.etfmgfunds.com. This report must be preceded or accompanied by a prospectus.
ETFMG™ ETFs
ETF MANAGERS TRUST
Privacy Policy and Procedures
ETF Managers Trust, (the “Trust”) has adopted the following privacy policies in order to safeguard the personal information of the Trust’s customers and consumers in accordance with Regulation S-P as promulgated by the U.S. Securities and Exchange Commission.
Trust officers are responsible for ensuring that the following policies and procedures are implemented:
1) The Trust is committed to protecting the confidentiality and security of the information they collect and will handle personal customer and consumer information only in accordance with Regulation S-P and any other applicable laws, rules and regulations1. The Trust will ensure: (a) the security and confidentiality of customer records and information; (b) that customer records and information are protected from any anticipated threats and hazards; and (c) that customer records and information are protected from unauthorized access or use.
2) The Trust conducts its business affairs through its trustees, officers and third parties that provide services pursuant to agreements with the Trust. The Trust has no employees. It is anticipated that the trustees and officers of the Trust who are not employees of service providers of the Trust will not have access to customer records and information in the performance of their normal responsibilities for the Trust.
3) The Trust may share customer information with its affiliates, subject to the customers’ right to prohibit such sharing.
4) The Trust may share customer information with unaffiliated third parties only in accordance with the requirements of Regulation S-P. Pursuant to this policy, the Trust will not share customer information with unaffiliated third parties other than as permitted by law, unless authorized to do so by the customer.
Consistent with these policies, the Trust has adopted the following procedures:
1) The Trust will determine that the policies and procedures of its affiliates and Service Providers are reasonably designed to safeguard customer information and only permit appropriate and authorized access to and use of customer information through the application of appropriate administrative, technical and physical protections.
2) The Trust will direct each of its Service Providers to adhere to the privacy policy of the Trust and to its privacy policies with respect to all customer information of the Trust and to take all actions reasonably necessary so that the Trust is in compliance with the provisions of Regulation S-P, including, as applicable, the development and delivery of privacy notices and the maintenance of appropriate and adequate records.
3) The Trust requires its Service Providers to provide periodic reports to the Trust’s Board of Trustees outlining their privacy policies and the implementation of such policies. Each Service Provider is required to promptly report to the Trust’s Board any material changes to its privacy policy before, or promptly after, the adoption of such changes.
(1) Generally, the Funds have institutional clients which are not considered “customers” for purposes of regulation S-P.
Advisor
ETF Managers Group, LLC
350 Springfield Ave., Suite 200, Summit, NJ 07901
Distributor
Foreside Fund Services LLC
Three Canal Plaza, Suite 100, Portland, Maine 04101
Custodian
U.S. Bank National Association
Custody Operations
1555 North River Center Drive, Suite 302, Milwaukee, Wisconsin 53212
Transfer Agent
U.S. Bancorp Fund Services, LLC doing business as U.S. Bank Global Fund Services
615 East Michigan Street, Milwaukee, Wisconsin 53202
Independent Registered Public Accounting Firm
WithumSmith + Brown, PC
1411 Broadway, 9th Floor, New York, NY 10018
Legal Counsel
Sullivan & Worcester LLP
1666 K Street NW, Washington, DC 20006
Item 2. Code of Ethics.
The registrant has adopted a code of ethics that applies to the registrant’s principal executive officer and principal financial officer. The registrant has not made any amendments to its code of ethics during the period covered by this report. The registrant has not granted any waivers from any provisions of the code of ethics during the period covered by this report.
A copy of the registrant’s Code of Ethics is filed herewith
Item 3. Audit Committee Financial Expert.
The Board believes that the collective knowledge and experience of the members of the audit committee enable the committee to provide appropriate oversight given the Trust's level of financial complexity. In addition, the Board notes that the audit committee has the authority to retain any experts necessary to carry out its duties.
Item 4. Principal Accountant Fees and Services.
The registrant has engaged its principal accountant to perform audit services, audit-related services, tax services and other services during the past fiscal year. “Audit services” refer to performing an audit of the registrant's annual financial statements or services that are normally provided by the accountant in connection with statutory and regulatory filings or engagements for those fiscal years. “Audit-related services” refer to the assurance and related services by the principal accountant that are reasonably related to the performance of the audit. “Tax services” refer to professional services rendered by the principal accountant for tax compliance, tax advice, and tax planning. There were no “Other services” provided by the principal accountant. The following table details the aggregate fees billed or expected to be billed for the last fiscal year for audit fees, audit-related fees, tax fees and other fees by the principal accountant.
| | FYE 9/30/2023 | FYE 9/30/2022 |
Audit Fees | $318,000 | $368,200 |
Audit-Related Fees | N/A | N/A |
Tax Fees | $72,975 | $83,050 |
All Other Fees | N/A | N/A |
(e)(1) The audit committee has adopted pre-approval policies and procedures that require the audit committee to pre‑approve all audit and non‑audit services of the registrant, including services provided to any entity affiliated with the registrant.
(e)(2) The percentage of fees billed by WithumSmith+Brown, PC applicable to non-audit services pursuant to waiver of pre-approval requirement were as follows:
| | FYE 9/30/2023 | FYE 9/30/2022 |
Audit-Related Fees | 0% | 0% |
Tax Fees | 0% | 0% |
All Other Fees | 0% | 0% |
(f) All of the principal accountant’s hours spent on auditing the registrant’s financial statements were attributed to work performed by full‑time permanent employees of the principal accountant.
(g) The following table indicates the non-audit fees billed or expected to be billed by the registrant’s accountant for services to the registrant and to the registrant’s investment adviser (and any other controlling entity, etc.—not sub-adviser) for the past year.
Non-Audit Related Fees | FYE 9/30/2023 | FYE 9/30/2022 |
Registrant | N/A | N/A |
Registrant’s Investment Adviser | N/A | N/A |
(h) The audit committee of the board of trustees/directors has considered whether the provision of non-audit services that were rendered to the registrant's investment adviser is compatible with maintaining the principal accountant's independence and has concluded that the provision of such non-audit services by the accountant has not compromised the accountant’s independence.
The registrant has not been identified by the U.S. Securities and Exchange Commission as having filed an annual report issued by a registered public accounting firm branch or office that is located in a foreign jurisdiction where the Public Company Accounting Oversight Board is unable to inspect or completely investigate because of a position taken by an authority in that jurisdiction.
The registrant is not a foreign issuer.
Item 5. Audit Committee of Listed Registrants.
| (a) | The registrant is an issuer as defined in Rule 10A-3 under the Securities Exchange Act of 1934, (the “Act”) and has a separately-designated standing audit committee established in accordance with Section 3(a)(58)(A) of the Act. The independent members of the committee, consisting solely of independent trustees, are Mr. Eric Weigel and Mr. Terry Loebs.
|
Item 6. Investments.
| a) | Schedule of Investments is included as part of the report to shareholders filed under Item 1 of this Form.
|
Item 7. Disclosure of Proxy Voting Policies and Procedures for Closed-End Management Investment Companies.
Not applicable to open-end investment companies.
Item 8. Portfolio Managers of Closed-End Management Investment Companies.
Not applicable to open-end investment companies.
Item 9. Purchases of Equity Securities by Closed‑End Management Investment Company and Affiliated Purchasers.
Not applicable to open-end investment companies.
Item 10. Submission of Matters to a Vote of Security Holders.
There have been no material changes to the procedures by which shareholders may recommend nominees to the registrant’s board of trustees.
Item 11. Controls and Procedures.
| (a) | The Registrant’s Principal Executive Officer and Principal Financial Officer/Treasurer have reviewed the Registrant's disclosure controls and procedures (as defined in Rule 30a-3(c) under the Investment Company Act of 1940 (the “Act”)) as of a date within 90 days of the filing of this report, as required by Rule 30a-3(b) under the Act and Rules 13a-15(b) or 15d‑15(b) under the Securities Exchange Act of 1934. Based on their review, such officers have concluded that the disclosure controls and procedures are effective in ensuring that information required to be disclosed in this report is appropriately recorded, processed, summarized and reported and made known to them by others within the Registrant and by the Registrant’s service provider. |
| (b) | There were no changes in the Registrant's internal control over financial reporting (as defined in Rule 30a-3(d) under the Act) that occurred during the second fiscal quarter of the period covered by this report that has materially affected, or is reasonably likely to materially affect, the Registrant's internal control over financial reporting. |
Item 12. Disclosure of Securities Lending Activities for Closed-End Management Investment Companies
Not applicable to open-end investment companies.
Item 13. Exhibits.
(3) Any written solicitation to purchase securities under Rule 23c‑1 under the Act sent or given during the period covered by the report by or on behalf of the registrant to 10 or more persons. Not applicable to open-end investment companies.
(4) Change in the registrant’s independent public accountant. There was no change in the registrant’s independent public accountant for the period covered by this report.
SIGNATURES
Pursuant to the requirements of the Securities Exchange Act of 1934 and the Investment Company Act of 1940, the registrant has duly caused this report to be signed on its behalf by the undersigned, thereunto duly authorized.
(Registrant) ETF Managers Trust
By (Signature and Title)* /s/ Michael Minella
Michael Minella, President
Date December 5, 2023
Pursuant to the requirements of the Securities Exchange Act of 1934 and the Investment Company Act of 1940, this report has been signed below by the following persons on behalf of the registrant and in the capacities and on the dates indicated.
By (Signature and Title)* /s/ Michael Minella
Michael Minella, President
By (Signature and Title)* /s/ John Flanagan
John Flanagan, Principal Financial Officer/Treasurer
Date December 5, 2023
* Print the name and title of each signing officer under his or her signature.