UNITED STATES SECURITIES AND EXCHANGE COMMISSION
Washington, D.C. 20549
FORM 6-K
REPORT OF FOREIGN PRIVATE ISSUER
PURSUANT TO RULE 13a-16 OR 15d-16 UNDER
THE SECURITIES EXCHANGE ACT OF 1934
For the month of September 2022
ANTELOPE ENTERPRISE HOLDINGS LTD.
(Translation of registrant's name into English)
c/o Jinjiang Hengda Ceramics Co., Ltd.
Junbing Industrial Zone, Anhai, Jinjiang City, Fujian Province, PRC
Telephone +86 (595) 8576 5053
(Address of Principal Executive Office)
Indicate by check mark whether the registrant files or will file annual reports under cover of Form 20-F or Form 40-F.
Form 20-F ☒ Form 40-F ☐
Indicate by check mark if the registrant is submitting the Form 6-K in paper as permitted by Regulation S-T Rule 101(b)(1): ☐
Indicate by check mark if the registrant is submitting the Form 6-K in paper as permitted by Regulation S-T Rule 101(b)(7): ☐
Indicate by check mark whether the registrant by furnishing the information contained in this Form is also thereby furnishing the information to the Commission pursuant to Rule 12g3-2(b) under the Securities Exchange Act of 1934.
Yes ☐ No ☒
If “Yes” is marked, indicate below the file number assigned to the registrant in connection with Rule 12g3-2(b): 82- .
EXPLANATORY NOTE
This Report of Foreign Private Issuer on Form 6-K filed by Antelope Enterprise Holdings Limited. (together with our subsidiaries, unless the context indicates otherwise, “we,” “us,” “our,” or the “Company”) contains forward-looking statements within the meaning of Section 27A of the Securities Act of 1933, as amended, and Section 21E of the Securities Exchange Act of 1934, as amended. These statements relate to future events or the Company’s future financial performance. The Company has attempted to identify forward-looking statements by terminology including ”anticipates,” “believes,” “expects,” “can,” “continue,” “could,” “estimates,” “intends,” “may,” “plans,” “potential,” “predict,” “should” or “will” or the negative of these terms or other comparable terminology. These statements are only predictions, uncertainties and other factors may cause the Company’s actual results, levels of activity, performance or achievements to be materially different from any future results, levels or activity, performance or achievements expressed or implied by these forward-looking statements. The information in this Report on Form 6-K is not intended to project future performance of the Company. Although the Company believes that the expectations reflected in the forward-looking statements are reasonable, the Company does not guarantee future results, levels of activity, performance or achievements. The Company expectations are as of the date this Form 6-K is filed, and the Company does not intend to update any of the forward-looking statements after the date this Report on Form 6-K is filed to confirm these statements to actual results, unless required by law.
ANTELOPE ENTERPRISE HOLDINGS LIMITED AND SUBSIDIARIES
CONSOLIDATED STATEMENTS OF COMPREHENSIVE LOSS
| | | | | | |
| | | | Six Months ended June 30, | ||
| | | | 2022 | | 2021 |
|
| Notes |
| RMB’000 | | RMB’000 |
Net sales | | 5 | | 134,961 | | 50,107 |
|
|
|
| | | |
Cost of goods sold |
|
|
| 135,365 | | 56,610 |
|
|
|
| | | |
Gross profit (loss) |
|
|
| (404) | | (6,503) |
|
|
|
| | | |
Other income |
| 5 |
| 10,399 | | 7,154 |
Selling and distribution expenses |
|
|
| (4,852) | | (3,219) |
Administrative expenses |
|
|
| (16,513) | | (17,196) |
Bad debt expense |
|
|
| (13,536) | | (49,827) |
Finance costs |
| 6 |
| (753) | | (1,094) |
Other expenses |
|
|
| (4) | | (77) |
|
|
|
| | | |
Loss before taxation |
| 6 |
| (25,663) | | (70,762) |
|
|
|
| | | |
Income tax expense |
| 7 |
| (83) | | (7) |
| | | | | | |
Net loss |
|
|
| (25,746) | | (70,769) |
| | | | | | |
Net income (loss) attributable to : |
|
|
| | | |
Equity holders of the Company |
|
|
| (29,335) | | (70,769) |
Non-controlling interest | | | | 3,589 | | — |
Net loss | | | | (25,746) | | (70,769) |
| | | | | | |
Other comprehensive income (loss) |
|
|
| | | |
Exchange differences on translation of financial statements of foreign operations |
|
|
| 114 | | 76 |
|
|
|
| | | |
Total comprehensive loss for the year |
|
|
| (25,632) | | (70,693) |
|
|
|
| | | |
Total comprehensive loss attributable to: | | | | | | |
Equity holders of the Company | | | | (29,221) | | (70,693) |
Non-controlling interest | | | | 3,589 | | — |
Total comprehensive loss | | | | (25,632) | | (70,693) |
| | | | | | |
Loss per share attributable to the equity holders of the Company |
|
|
| | | |
Basic (RMB) |
| 8 |
| (4.88) | | (16.24) |
Diluted (RMB) |
| 8 |
| (4.88) | | (16.24) |
The accompanying notes are an integral part of these consolidated financial statements.
ANTELOPE ENTERPRISE HOLDINGS LIMITED AND SUBSIDIARIES
CONSOLIDATED STATEMENTS OF FINANCIAL POSITION
| | | | | | |
| | | | As of June 30, 2022 | | As of December 31, 2021 |
|
| Notes |
| RMB’000 |
| RMB’000 |
ASSETS AND LIABILITIES | |
| |
| |
|
NONCURRENT ASSETS |
|
|
|
|
|
|
Property and equipment, net |
| |
| 1,129 |
| 1,250 |
Intangible asset, net | | | | 6 | | — |
Right-of-use assets, net |
| 13 |
| 37,952 |
| 44,288 |
Total noncurrent assets |
|
|
| 39,087 |
| 45,538 |
|
|
|
|
|
|
|
CURRENT ASSETS |
|
|
|
|
|
|
Inventories, net |
| 9 |
| 37,040 |
| 31,589 |
Trade receivables, net |
| 10 |
| 18,893 |
| 51,416 |
VAT receivables |
| |
| 1,675 |
| 663 |
Other receivables and prepayments |
| |
| 14,994 |
| 20,781 |
Restricted cash |
| |
| 8,550 |
| — |
Cash and bank balances |
| |
| 15,003 |
| 27,880 |
Total current assets |
|
|
| 96,155 |
| 132,329 |
|
| |
| |
| |
CURRENT LIABILITIES |
|
|
| |
| |
Trade payables |
| 11 |
| 10,222 |
| 6,290 |
Accrued liabilities and other payables | | 12 | | 20,038 | | 22,381 |
Unearned revenue |
| |
| 7,187 |
| 15,545 |
Amounts owed to related parties |
| 15 |
| 36,348 |
| 36,348 |
Lease liabilities | | 13 | | 13,745 | | 13,404 |
Taxes payable |
| |
| 835 |
| 1,018 |
Total current liabilities |
|
|
| 88,375 |
| 94,986 |
|
|
|
| |
| |
NET CURRENT ASSETS |
|
|
| 7,780 |
| 37,343 |
|
|
|
| |
| |
NONCURRENT LIABILITIES | | | | | | |
Lease liabilities | | 13 | | 19,468 | | 33,325 |
Total noncurrent liabilities | | | | 19,468 | | 33,325 |
| | | | | | |
NET ASSETS |
|
|
| 27,399 |
| 49,556 |
|
|
|
| |
|
|
EQUITY |
|
|
| |
|
|
Share capital |
| 14 |
| 964 |
| 943 |
Reserves |
| |
| 21,702 |
| 49,919 |
Noncontrolling interest | | | | 4,733 | | (1,306) |
| | | | | | |
Total equity |
|
|
| 27,399 |
| 49,556 |
The accompanying notes are an integral part of these consolidate financial statements.
ANTELOPE ENTERPRISE HOLDINGS LIMITED AND SUBSIDIARIES
CONSOLIDATED STATEMENTS OF CHANGES IN EQUITY
| | | | | | | | | | | | | | | | | | | | | | | | |
|
| |
| |
| Reverse |
| |
| Share-based |
| |
| |
| |
| Currency | | | | |
| |
| | | | Share | | recapitalization | | Merger | | payment | | Statutory | | Capital | | Retained | | translation | | | | Noncontrolling | | |
| | Share capital | | premium | | reserve | | reserve | | reserves | | reserve | | reserve | | earnings | | reserve | | Total | | Interest | | Total Equity |
| | RMB’000 | | RMB’000 | | RMB’000 | | RMB’000 | | RMB’000 | | RMB’000 | | RMB’000 | | RMB’000 | | RMB’000 | | RMB'000 | | RMB'000 | | RMB’000 |
Notes | | Note 14 | | | | | | | | | | | | | | | | | | | | | | |
| | | | | | | | | | | | | | | | | | | | | | | | |
Balance at January 1,2021 | | 591 |
| 717,808 |
| (507,235) |
| 58,989 |
| 126,164 | | 135,343 |
| 61,266 |
| (494,068) | | (1,509) | | 97,349 | | — | | 97,349 |
Net income (loss) for the year | | — |
| — |
| — |
| — |
| — | | — |
| — |
| (70,769) | | — | | (70,769) | | — | | (70,769) |
Exchange difference on transaction of financial statements of foreign operations | | — |
| — |
| — |
| — |
| — | | — |
| — |
| — | | 76 | | 76 | | — | | 76 |
Total comprehensive loss for the year | | — |
| — |
| — |
| — |
| — | | — |
| — |
| (70,769) | | 76 | | (70,693) | | — | | (70,693) |
Issuance of new shares for equity financing | | 233 |
| 29,744 |
| — |
| — |
| — | | — |
| — |
| — | | — | | 29,977 | | — | | 29,977 |
Warrants exercised | | 106 |
| 10,287 |
| — |
| — |
| — | | — |
| — |
| — | | — | | 10,393 | | — | | 10,393 |
Equity compensation - employee share-based compensation | | 7 |
| — |
| — |
| — |
| 825 | | — |
| — |
| — | | — | | 832 | | — | | 832 |
Transfer to statutory reserves | | — |
| — |
| — |
| — |
| — | | — |
| — |
| — | | — | | — | | — | | — |
Balance at June 30, 2021 | | 937 |
| 757,839 |
| (507,235) |
| 58,989 |
| 126,989 | | 135,343 |
| 61,266 |
| (564,837) | | (1,433) | | 67,858 | | — | | 67,858 |
| |
|
|
|
|
|
|
|
|
| |
|
|
|
|
| |
| | | | | |
|
Balance at January 1,2022 | | 943 | | 757,318 | | (507,235) | | 58,989 | | 127,982 | | 135,343 | | 61,266 | | (582,820) | | (924) | | 50,862 | | (1,306) | | 49,556 |
Net income (loss) for the year | | — |
| — |
| — |
| — |
| — | | — |
| — |
| (29,335) | | — | | (29,335) | | 3,589 | | (25,746) |
Exchange difference on transaction of financial statements of foreign operations | | — |
| — |
| — |
| — |
| — | | — |
| — |
| — | | 114 | | 114 | | — | | 114 |
Total comprehensive loss for the year | | — |
| — |
| — |
| — |
| — | | — |
| — |
| (29,335) | | 114 | | (29,221) | | 3,589 | | (25,632) |
Issuance of new shares for equity financing | | — |
| — |
| — |
| — |
| — | | — |
| — |
| — | | — | | — | | — | | — |
Additional paid in capital | | — | | — | | — | | — | | — | | — | | — | | — | | — | | — | | 2,450 | | 2,450 |
Equity compensation - employee share-based compensation | | 21 | | — | | — | | — | | 1,004 | | — | | — | | — | | — | | 1,025 | | — | | 1,025 |
Transfer to statutory reserves | | — |
| — |
| — |
| — |
| — | | — |
| — |
| — | | — | | — | | — | | — |
Balance at June 30, 2022 | | 964 |
| 757,318 |
| (507,235) |
| 58,989 |
| 128,986 | | 135,343 |
| 61,266 |
| (612,155) | | (810) | | 22,666 | | 4,733 | | 27,399 |
The accompanying notes are an integral part of these condensed consolidated interim financial statements.
ANTELOPE ENTERPRISE HOLDINGS LIMITED AND SUBSIDIARIES
CONSOLIDATED STATEMENTS OF CASH FLOWS
| | | | | | |
| | | | Six Months ended June 30, | ||
| | | | 2022 | | 2021 |
|
| Notes |
| RMB’000 |
| RMB’000 |
CASH FLOWS FROM OPERATING ACTIVITIES: | |
| |
| |
|
Loss before taxation |
|
|
| (25,663) |
| (70,762) |
Adjustments for |
|
|
| |
| |
Operating lease charge | | 13 | | 6,564 | | 7,035 |
Depreciation of property, plant and equipment |
| 6 |
| 132 |
| 19 |
Bad debt provision of trade receivables |
| |
| 13,536 |
| 49,827 |
Share based compensation |
| 14 |
| 1,025 |
| 832 |
Interest expense on lease liability |
| 13 |
| 753 |
| 1,094 |
Operating cash flows before working capital changes |
|
|
| (3,653) |
| (11,955) |
Decrease (Increase) in inventories |
|
|
| (5,451) |
| 24,837 |
Decrease (Increase) in trade receivables |
|
|
| 18,987 |
| (7,139) |
Decrease (Increase) in other receivables and prepayments |
|
|
| 5,787 |
| (6,934) |
Decrease in trade payables |
|
|
| 3,932 |
| (1,255) |
Decrease (Increase) in unearned revenue |
|
|
| (8,357) |
| — |
Decrease in taxes payable | | | | (1,253) | | (1,315) |
Increase in accrued liabilities and other payables |
|
|
| (2,344) |
| 82 |
Cash generated from (used in) operations |
|
|
| 7,648 |
| (3,679) |
Interest paid |
|
|
| — |
| — |
Income tax paid |
|
|
| (25) |
| (7) |
| | | | | | |
Net cash generated from (used in) operating activities |
|
|
| 7,623 |
| (3,686) |
|
|
|
| |
| |
CASH FLOWS FROM INVESTING ACTIVITIES: |
|
|
| |
| |
Acquisition of fixed assets |
|
|
| (11) |
| (129) |
Acquisition of intangible assets | | | | (6) | | — |
Increase in restricted cash |
|
|
| (8,550) |
| — |
| | | | | | |
Net cash used in investing activities |
|
|
| (8,567) |
| (129) |
|
|
|
|
|
|
|
CASH FLOWS FROM FINANCING ACTIVITIES: |
|
|
|
|
|
|
Payment for lease liabilities | | 13 | | (14,480) | | (14,964) |
Additional paid in capital |
| |
| 2,450 |
| 29,976 |
Warrants exercised | | | | — | | 10,394 |
Advance from related parties |
| 15 |
| — |
| — |
| | | | | | |
Net cash generated from (used in) financing activities |
|
|
| (12,030) |
| 25,406 |
|
|
|
| |
| |
NET INCREASE (DECREASE) IN CASH & EQUIVALENTS |
|
|
| (12,974) |
| 21,591 |
CASH & EQUIVALENTS, BEGINNING OF PERIOD |
|
|
| 27,880 |
| 12,344 |
EFFECT OF FOREIGN EXCHANGE RATE DIFFERENCES |
|
|
| 97 |
| 94 |
| | | | | | |
CASH & EQUIVALENTS, END OF PERIOD |
|
|
| 15,003 |
| 34,029 |
The accompanying notes are an integral part of these consolidated financial statements.
CHINA CERAMICS CO. LTD. AND SUBSIDIARIES
NOTES TO CONDENSED CONSOLIDATED FINANCIAL STATEMENTS
FOR THE SIX MONTHS ENDED JUNE 30, 2022
(UNAUDITED)
1. | GENERAL INFORMATION |
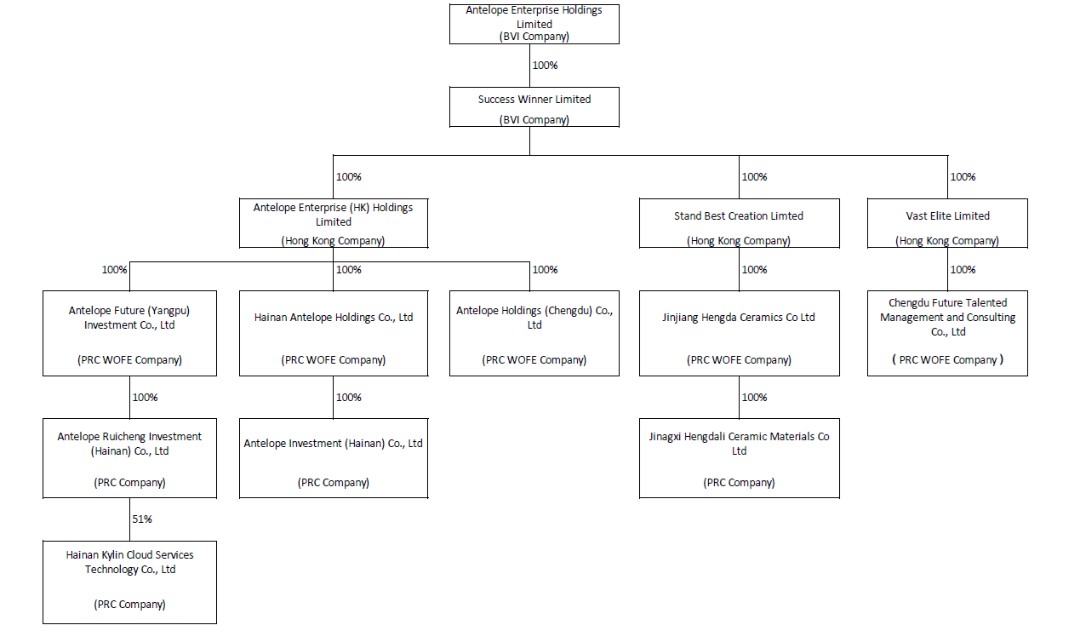
Antelope Enterprise Holdings Limited (“Antelope Enterprise” or the “Company”), formerly known as China Ceramics Co., Ltd (“CCCL”), is a British Virgin Islands company operating under the BVI Business Companies Act (2004) with its shares listed on the NASDAQ Stock Market (“symbol: AEHL”). Its predecessor company, China Holdings Acquisition Corp. (“CHAC”), was incorporated in Delaware on June 22, 2007, and was organized as a blank check company for the purpose of acquiring, through a stock exchange, an asset acquisition or other similar business combination, or controlling, through contractual arrangements, an operating business, that has its principal operations in Asia. The Company has no operations and has no assets or liabilities of consequence outside its investments in its operating subsidiaries. The head office of the Company is located at Junbing Industrial Zone, Jinjiang City, Fujian Province, the People’s Republic of China (“PRC”).
Antelope Enterprise and its subsidiaries’ corporate structure as of June 30, 2022 is as follows:
2. | BASIS OF PREPARATION AND SUMMARY OF SIGNIFICANT ACCOUNTING POLICIES |
The accompanying unaudited condensed consolidated interim financial statements have been prepared in accordance with International Accounting Standard (“IAS”) 34 Interim Financial Reporting, as issued by the International Accounting Standards Board (“IASB”). They do not include all of the information required in annual financial statements in accordance with International Financial Reporting Standards (“IFRS”), and should be read in conjunction with the audited consolidated financial statements and related footnotes on Form 20-F for the year ended December 31, 2021 as filed with the Securities and Exchange Commission. The accompanying unaudited condensed consolidated interim financial statements reflect all normal recurring adjustments which, in the opinion of management, are necessary for a fair statement of the results for the interim periods presented. Results for the six months ended June 30, 2022 are not necessarily indicative of the results expected for the full fiscal year or for any future period.
These interim financial statements are presented in RMB, unless otherwise stated. They were approved for issue by the Audit Committee of the Board of Directors and the Board of Directors on September 29, 2022.
These interim financial statements have been prepared in accordance with the same accounting policies adopted in the 2021 annual financial statements, except for the accounting policy changes that are expected to be reflected in the 2022 annual financial statements. Details of any changes in accounting policies are set out in note 3.
These interim financial statements contain condensed consolidated financial statements and selected explanatory notes. The notes include an explanation of events and transactions that are significant to an understanding of the changes in financial position and performance of the Group since the 2021 annual financial statements.
3. | CHANGES IN ACCOUNTING POLICIES AND DISCLOSURES |
At the date of authorization of these financial statements, the IASB has issued a number of amendments, new standards and interpretations which are not yet effective for the six months ended June 30, 2022 and which have not been adopted in these financial statements. These include the following which may be relevant to the Group:
| |
Amendments to IAS 1 | Classification of Liabilities as Current or Non-current (1) |
Amendments to IFRS 4 | Extension of the Temporary Exemption from Applying IFRS 9 (1) |
| 1. | Effective for annual periods beginning on or after January 1, 2023 |
| 2. | The effective date of the amendments has yet to be set by the IASB; however, earlier application of the amendments is permitted |
The management of the Company anticipate that the application of all the new and amendments to IFRSs will have no material impact on the consolidated financial statements in the foreseeable future.
4.CRITICAL ACCOUNTING ESTIMATES AND JUDGEMENTS
The preparation of interim financial statements in conformity with IAS 34 requires management to make judgments, estimates and assumptions that affect the application of policies and reported amounts of assets and liabilities, income and expenses on a year to date basis. Actual results may differ from these estimates.
5.REVENUE AND OTHER INCOME
| a) | An analysis of the Company’s revenue and other income is as follows: |
| | | | |
| | For the six months ended June 30, | ||
| | 2022 | | 2021 |
|
| RMB’000 |
| RMB’000 |
Revenue | |
| |
|
Sale of goods |
| 16,715 |
| 42,186 |
Business management and consulting revenue | | 118,246 | | 7,921 |
Other income |
|
|
|
|
Interest income |
| 182 |
| 7 |
Government grant |
| 632 |
| — |
Tax subsidy |
| 887 |
| — |
Other income | | 127 | | 5 |
Rental income |
| 8,571 |
| 7,142 |
b) | Segment reporting |
The Company identifies operating segments and prepares segment information based on the regular internal financial information reported to the Chief Executive Officer and executive directors, who are the Company’s chief operating decision makers for their decisions about the allocation of resources to the Company’s business components and for their review of the performance of those components.
All of the Company’s operations are considered by the chief operating decision makers to be aggregated into two reportable operating segments: 1) the manufacture and sale of standard to high-end ceramic tiles, 2) the provision of business management and consulting which consists of computer consulting services, software development, and operations in the online commerce and live streaming industry, which is a relatively new operating segment for the
Company as it continues to implement a strategic transformation towards trending technology businesses in China to mitigate the challenging conditions in the real estate market in China, and associated industries like our ceramic tile business. Operating segments are defined as components of an enterprise for which separate financial information is available and evaluated regularly by the Company’s chief operating decision makers in deciding how to allocate resources and in assessing performance.
The business of the Company is engaged entirely in the PRC. The Chief Executive Officer and executive directors regularly review the Company’s business as one geographical segment.
The following table shows the Company’s operations by business segment for the six months ended June 30, 2022 and 2021.
| | | | | | |
| | For the Six Months Ended June 30, | ||||
| | 2022 | | 2021 | ||
|
| RMB’000 |
| RMB’000 | ||
Revenues | | | | | | |
Sale of ceramic tile products |
| | 16,715 |
| | 42,186 |
Business management and consulting revenue |
| | 118,246 |
| | 7,921 |
Total revenues |
| | 134,961 |
| | 50,107 |
| | | | | | |
Cost of revenues |
| |
|
| |
|
Sale of tile products |
| | 19,024 |
| | 53,790 |
Business management and consulting revenue |
| | 116,341 |
| | 2,820 |
Total cost of revenues |
| | 135,365 |
| | 56,610 |
| | | | | | |
Operating costs and expenses |
| |
|
| |
|
Sale of ceramic tile products |
| | 24,247 |
| | 50,709 |
Business management and consulting revenue |
| | (1,068) |
| | 1,977 |
Others |
| | 2,080 |
| | 11,573 |
Total operating costs and expenses |
| | 25,259 |
| | 64,259 |
| | | | | | |
Net loss |
| |
|
| |
|
Sale of tile products |
| | (26,556) |
| | 68,094 |
Business management and consulting revenue |
| | 2,890 |
| | (3,115) |
Others |
| | (2,080) |
| | 5,790 |
Net loss |
| | (25,746) |
| | 70,769 |
| | | | |
|
| As of June 30, 2022 |
| As of December 31, 2021 |
Segment assets |
|
|
|
|
Ceramic tile products |
| 105,979 |
| 147,890 |
Business management and consulting |
| 26,053 |
| 27,222 |
Others |
| 3,210 |
| 2,755 |
Total assets |
| 135,242 |
| 177,867 |
6.LOSS BEFORE TAXATION
| | | | |
| | For the six months ended June 31, | ||
| | 2022 | | 2021 |
|
| RMB’000 |
| RMB’000 |
Finance costs | | | | |
Interest expense on lease liability | | 753 | | 1,094 |
Cost of inventories recognized as an expense (including depreciation charge of right-of-use assets for leases) | | 19,025 | | 56,610 |
Depreciation of fixed assets |
| 132 |
| 19 |
Depreciation charge of right-of-use assets for leases (included in the administrative expenses) |
| 163 |
| 635 |
Research and development costs | | 806 | | 1,017 |
Staff costs (including key management personnel remuneration) |
| 5,962 |
| 6,627 |
For the six months ended June 30, 2022, the cost of inventories recognized as expense included staff costs of RMB 1.6 million (for the six months ended June 30, 2021, this figure was RMB 2.4 million), depreciation and amortization expense
(including a depreciation charge of right-of-use assets) of RMB 6.4 million (for the six months ended June 30, 2021, this figure was also RMB 6.4 million).
7.INCOME TAX
| | | | |
| | For the six months ended June 30, | ||
| | 2022 | | 2021 |
| | RMB’000 | | RMB’000 |
Current Tax: |
|
|
|
|
PRC Income Tax Expense |
| 83 |
| 7 |
Deferred tax expense |
| — |
| — |
|
| 83 |
| 7 |
British Virgin Islands Profits Tax
The Company has not been subject to any taxation in this jurisdiction for the six months ended June 30, 2022 and 2021.
Hong Kong Profits Tax
The subsidiaries in Hong Kong are subject to tax charged on Hong Kong sourced income, the corporate tax rate in Hong Kong is a two-tier one starting with the year of assessment 2018/2019 (from April 1 2018): the tax is 8.25% (7.5% for unincorporated companies) on the first 2 million HKD of taxable profits and 16.5% (15% for unincorporated companies) for the rest of the profits. No Hong Kong profits tax has been provided as the Company has no assessable profit arising in Hong Kong for the six months ended June 30, 2022 and 2021.
PRC Income Tax
Most subsidiaries of the Company in the PRC are subject to the enterprise income tax in accordance with “PRC Enterprise Income Tax Law” (“EIT Law”), and the applicable income tax rate for the six months ended June 30, 2022 and 2021 is 25%. Both Antelope Holdings (Chengdu) Co., Ltd (“Antelope Chengdu”) and Chengdu Future Talented Management and Consulting Co, Ltd (“Chengdu Future”) are subject to 2.5% preferential income tax rate for the six months ended June 30, 2022 and 2021.
8.LOSS PER SHARE
| | | | |
| | For the six months ended June 30, | ||
|
| 2022 |
| 2021 |
| | RMB’000 | | RMB’000 |
Loss attributable to holders of ordinary shares (RMB’000): |
| (29,335) |
| (70,769) |
Weighted average number of ordinary shares outstanding used in computing basic and diluted earnings per share* | | 6,013,143 | | 4,357,598 |
Loss per share - basic (RMB) |
| (4.88) |
| (16.24) |
Loss per share - diluted (RMB) |
| (4.88) |
| (16.24) |
* Warrants to purchase common stock are not included in the diluted loss per share calculations when their effect is antidilutive. For the six months ended June 30, 2022 and 2021, 1,868,414 shares and 1,353,157 shares, respectively, on a weighted average basis of potential common stock related to outstanding stock warrants were excluded from the calculation of diluted net loss per share as such shares are antidilutive when there is a loss.
9.INVENTORIES
| | | | |
| | As of | ||
|
| June 30, 2022 |
| December 31, 2021 |
| | RMB’000 | | RMB’000 |
Raw materials |
| 6,761 |
| 4,741 |
Work in progress |
| 244 |
| 244 |
Finished goods |
| 37,548 |
| 34,117 |
| | 44,553 | | 39,102 |
Less: Inventory impairment provision | | (7,513) | | (7,513) |
Total |
| 37,040 |
| 31,589 |
The analysis of the amount of inventories recognized as an expense and included in profit or loss is as follows:
| | | | |
| | For the six months ended June 30, | ||
|
| 2022 |
| 2021 |
| | RMB’000 | | RMB’000 |
Carrying amount of inventories sold |
| 11,472 |
| 16,625 |
Write down of inventories (included in cost of sales) |
| — |
| — |
|
| 11,472 |
| 16,625 |
10. TRADE RECEIVABLES
| | | | |
| | As of | ||
|
| June 30, 2022 |
| December 31, 2021 |
| | RMB’000 | | RMB’000 |
Trade receivables |
| 798,905 |
| 822,747 |
Less: provision for impairment |
| (780,012) |
| (771,331) |
|
| 18,893 |
| 51,416 |
The Company’s trade receivables are denominated in Renminbi and are non-interest bearing.
An aging analysis of the Company’s trade receivables, based on the invoice date, is as follows:
| | | | |
| | As of | ||
|
| June 30, 2022 |
| December 31, 2021 |
| | RMB’000 | | RMB’000 |
Within 90 days |
| 422 |
| 81 |
Between 3 and 6 months |
| — |
| — |
More than 6 months |
| 18,471 |
| 51,335 |
|
| 18,893 |
| 51,416 |
As of June 30, 2022, the Company is exposed to certain credit risks as 17% and 48% of the total gross trade receivables were due from the Company’s largest and five largest customers, respectively.
As of December 31, 2021, the Company is exposed to certain credit risks as 16% and 47% of the total gross trade receivables were due from the Company’s largest and the five largest customers, respectively.
11.TRADE PAYABLES
| | | | |
| | As of | ||
|
| June 30, 2022 |
| December 31, 2021 |
| | RMB’000 | | RMB’000 |
Trade payables |
| 10,222 |
| 6,290 |
Trade payables are denominated in Renminbi, non-interest bearing and generally settled within 120-day terms. All of the trade payables are expected to be settled within one year. The carrying value of trade payables is considered to be a reasonable approximation of fair value.
12.ACCRUED LIABILITIES AND OTHER PAYABLES
| | | | |
| | As of | ||
|
| June 30, 2022 |
| December 31, 2021 |
| | RMB’000 | | RMB’000 |
Deposits received from distributors |
| 16,200 |
| 16,200 |
Accrued salary |
| 754 |
| 514 |
Accrued rent, electricity and water |
| 1,231 |
| 1,156 |
Accrued other taxes |
| 866 |
| 866 |
Others |
| 987 |
| 3,645 |
|
| 20,038 |
| 22,381 |
The Company usually requests a deposit from RMB 400,000 to RMB 1,000,000 from new distributors upon signing a distributorship agreement as security for the performance of their obligations under the distributorship agreement.
Accrued liabilities consist mainly of accrued rental, wages and utility expenses.
The carrying value of accrued liabilities and other payables is considered to be a reasonable approximation of fair value.
13.LEASES
(a) | Amounts recognized in the consolidated statement of financial position |
The carrying amounts of right-of-use assets for lease, and lease liabilities are as below:
| | |
Right-of-use assets |
| RMB’000 |
Net book amount at January 1, 2022 |
| 44,288 |
Net book amount at June 30, 2022 |
| 37,952 |
| | |
Lease liabilities |
| RMB’000 |
Net book amount at January 1, 2022 (current of 13,404 and non-current of 33,325) |
| 46,729 |
Net book amount at June 30, 2022 (current of 13,745 and non-current of 19,468) |
| 33,213 |
(b) | Amounts recognized in the consolidated income statement |
The consolidated income statement shows the following amounts relating to leases:
| | | | |
| | Six months ended June 30 | ||
| | 2022 | | 2021 |
|
| RMB’000 |
| RMB’000 |
Depreciation charge of right-of-use assets |
| 6,564 |
| 7,035 |
Interest expense |
| 753 |
| 1,094 |
The total cash outflow in financing activities for leases during the six months ended June 30, 2022 and 2021 was RMB 14,480,000 and 14,964,000, respectively.
14.SHARE CAPITAL
| | | | | | | | |
| | As of | ||||||
| | June 30, 2022 | | December 31, 2021 | ||||
|
| Number |
| US$ |
| Number |
| US$ |
| | of shares | | ‘000 | | of shares | | ‘000 |
Authorized: |
|
|
|
|
|
|
|
|
Ordinary shares of US$ 0.024 each |
| 50,000,000 |
| 1,200 |
| 50,000,000 |
| 1,200 |
| | | | |
| | | | |
| | June 30, 2022 | ||
|
| Number |
| RMB |
| | of shares | | ‘000 |
Outstanding and fully paid: |
|
|
|
|
Ordinary shares of US$ 0.024 each |
|
|
|
|
At January 1, 2022 |
| 5,976,098 |
| 943 |
Issuance of new shares for equity financing |
| — |
| — |
Warrants exercised |
| — |
| — |
Issuance of new shares – share-based compensation to CEO and CFO |
| 132,231 |
| 21 |
At June 30, 2022 |
| 6,108,329 |
| 964 |
On February 12, 2021, the Company entered into a Securities Purchase Agreement with certain institutional investors for the sale of 588,235 common shares, at a purchase price of $3.57 per share. Concurrently with the sale of the Common Shares, pursuant to the Purchase Agreement the Company also sold warrants to purchase 588,235 common shares. The Company sold the Common Shares and Warrants for aggregate gross proceeds of approximately US$2.1 million, before commissions and expenses. The five-year Warrants will be immediately exercisable at an exercise price equal to $3.57 per share, and will terminate on the five-year anniversary of the initial exercise date of the Warrants. The net proceeds from the transactions will be approximately US$1.86 million, after deducting certain fees due to the placement agent and the Company’s estimated transaction expenses, and will be used for working capital and general corporate purposes.
In addition, the Placement Agent of this offering also received five-year warrants (the “Compensation Warrants”) to purchase up to a number of common shares equal to 5% of the aggregate number of shares sold in the Offering, including the warrant shares issuable upon exercise of the Warrants, which such Compensation Warrants have substantially the same terms as the Warrants sold in the Offering, except that such Compensation Warrants have an exercise price of $4.46 per share and will be
exercisable six months from the effective date of this offering and will terminate on the five year anniversary of the effective date of this offering.
| | | | |
|
| | February 17, | |
Grant date (investors and placement agent, respectively) | | | 2021 | |
Share price at date of grant (investors and placement agent, respectively) |
| US$ | 4.45 | |
Exercise price at date of grant (investors and placement agent, respectively) |
| US$ | 3.57 & 4.46 | |
Volatility |
| | 107 | % |
Warrant life |
| | 5 years | |
Dividend yield |
| | 0 | % |
Risk-free interest rate |
| | 0.57 | % |
Average fair value at grant date |
| US$ | 3.54 | |
On June 10, 2021, the Company commenced a registered direct offering of securities, and executed a Securities Purchase Agreement (“SPA”) with three institutional accredited investors pursuant to which it sold 913,875 of the Company’s common shares at the per share price of $3.48 (which was priced in excess of the average of the five-day closing price for the Company’s common shares preceding execution of the SPA, which was $3.42). In a concurrent private placement, the Company sold to such investors warrants to purchase 913,875 common shares (the “Investor Warrants”). The Investor Warrants have an exercise price per share of $3.42, subject to adjustment, and have a term of five years. The transactions yielded gross proceeds to the Company of $3,180,285, before the payment of commissions and expenses.
In addition, the Company issued warrants (the “Placement Agent Warrants”) to the Placement Agent to purchase a number of common shares equal to 5.0% of the aggregate number of shares sold to the investors in this offering, as well as the warrant shares issuable upon exercise of the Warrants issued in the concurrent private placement, as additional placement agency compensation. The Placement Agent Warrants have substantially the same terms as the Investor Warrants, except that the Placement Agent Warrants will have an exercise price of $4.35.
| | | | |
Grant date (investors and placement agent, respectively) |
| | June 14, 2021 | |
Share price at date of grant (investors and placement agent, respectively) |
| US$ | 3.15 | |
Exercise price at date of grant (investors and placement agent, respectively) |
| US$ | 3.42 & 4.35 | |
Volatility |
| | 115 | % |
Warrant life |
| | 5 years | |
Dividend yield |
| | 0 | % |
Risk-free interest rate |
| | 0.80 | % |
Average fair value at grant date |
| US$ | 2.50 | |
Following is a summary of the warrant activity for the six months ended June 30, 2022:
| | | | | | | |
|
| |
| | |
| Weighted |
| | | | | | | Average |
| | | | | | | Remaining |
| | | | Average | | Contractual | |
| | Number of | | Exercise | | Term in | |
| | Warrants | | Price | | Years | |
Outstanding at December 31, 2021 |
| 1,868,414 | | $ | 3.50 |
| 4.14 |
Exercisable at December 31, 2021 |
| 1,868,414 | | | 3.50 |
| 4.14 |
Issued |
| — | | | — |
| — |
Exercised |
| — | |
| — |
| — |
Expired |
| — | |
| — |
| — |
Outstanding at June 30, 2022 |
| 1,868,414 | | | 3.50 |
| 3.65 |
Exercisable at June 30, 2022 |
| 1,868,414 | | $ | 3.50 |
| 3.65 |
From January 1 to June 30, 2022, the Company issued an aggregate of 41,742 shares to its Chief Financial Officer as stock compensation expense. The fair value of 41,742 shares was RMB 301,404. From January 1 to June 30, 2022, the Company issued aggregate of 90,489 shares to its Chief Executive Officer as stock compensation expense. The fair value of 90,489 shares was RMB 723,395.
15.RELATED PARTY TRANSACTIONS
Apart from those discussed elsewhere in these condensed consolidated financial statements, the following are significant related party transactions entered into between the Company and its related parties at agreed rates:
| | | | |
|
| As of | ||
| | June 30, 2022 |
| December 31, 2021 |
| | RMB’000 | | RMB’000 |
Amounts owed to related parties |
| 36,348 |
| 36,348 |
Mr. Huang Jia Dong, the Founder and Chairman of Hengda and the former Chief Executive Officer and one of the directors of the Company, and Mr. Wong Kung Tok, formerly one of the Company’s significant shareholders, provide working capital loans to the Company from time to time during the normal course of its business. These loans amounted to RMB 35,057,000 and RMB 35,057,000 as of June 30, 2022 and December 31, 2021, respectively. These loans are interest free, unsecured and repayable on demand. Mr. Huang and Mr. Wong are brothers-in-law.
As of June 30, 2022 and December 31, 2021, the Company had a loan of US$ 167,000 (equivalent to RMB 1,160,000) and US$ 167,000 (equivalent to RMB 1,160,000), respectively, payable to Sound Treasure Limited, an affiliate of Mr. Huang Jia Dong and a shareholder of the Company. This loan is interest free, unsecured and repayable on demand.
As of June 30, 2022, and December 31, 2021, the Company had a loan of US $20,000 (equivalent to RMB 131,000) and of US $20,000 (equivalent to RMB 131,000), respectively, payable to Mr. Alex Ng, who is the executive director of the Company. This loan is interest free, unsecured and repayable on demand.
16.COMMITMENTS
(a)Operating lease commitments
The Company had several operating leases as of June 30, 2022, including 1) a series of five-year leases of production factories, warehouses and an employees’ hostel in Jingjiang City, Fujian Province, from unrelated parties under non-cancellable operating lease arrangements, and 4) a two-year office lease in Hong Kong. These leases have various terms and the total future minimum lease payments of the Company under these non-cancellable operating leases are payable as follows:
| | | | |
| | As of | ||
|
| June 30, 2022 |
| December 31, 2021 |
| | RMB’000 | | RMB’000 |
Within one year |
| 13,745 |
| 13,404 |
After one year and within five years |
| 19,468 |
| 33,325 |
|
| 33,213 |
| 46,729 |
(b)Capital commitments
The Company’s capital expenditures consist of expenditures on property, plant and equipment and capital contributions. Capital expenditures contracted for at the balance sheet date but not recognized in the financial statements are as follows:
| | | | |
| | As of | ||
|
| June 30, 2022 |
| December 31, 2021 |
| | RMB’000 | | RMB’000 |
Contracted for capital commitment with respect to capital contributions to its wholly foreign owned subsidiary in the PRC: |
|
|
|
|
Chengdu Future |
| 30,000 |
| 30,000 |
Antelope Chengdu | | 65,250 | | 65,250 |
Hainan Antelope Holding | | 63,726 | | 63,726 |
Antelope Future (Yangpu) | | 62,426 | | 63,726 |
Antelope Investment (Hainan) | | 50,000 | | 50,000 |
Antelope Ruicheng Investment | | 48,710 | | 50,000 |
Hainan Kylin Cloud Service Technology |
| 1,275 |
| 5,000 |
17.SUBSEQUENT EVENTS
The Company has evaluated all events that have occurred subsequent to June 30, 2022 through the date that the consolidated financial statements were issued. Management has concluded that the following subsequent events required disclosure in the financial statements:
On September 15, 2022, the Company’s shareholders approved an amendment to increase the number of authorized shares of the Company’s stock from 50,000,000 to 200,000,000.
MANAGEMENT’S DISCUSSION AND ANALYSIS
OF FINANCIAL CONDITION AND RESULTS OF OPERATIONS
Overview
We are a British Virgin Islands limited liability company whose predecessor, CHAC, was incorporated in Delaware on June 22, 2007 and was organized as a “blank check” company for the purpose of acquiring, through a stock exchange, an asset acquisition or other similar business combination, or controlling, through contractual arrangements, an operating business that had its principal operations in Asia, with a focus on potential acquisition target in China.
Pursuant to the terms of a merger and stock purchase agreement dated August 19, 2009, on November 20, 2009, CHAC merged with and into Antelope Enterprise Holdings Limited (“Antelope Enterprise” or the “Company”), formerly known as China Ceramics Co., Ltd., its wholly owned British Virgin Islands subsidiary, and immediately thereafter, as part of the same integrated transaction, Antelope Enterprise acquired all of the outstanding securities of Success Winner.
Antelope Enterprise, through its operating subsidiaries, is a PRC-based manufacturer of ceramic tiles used for exterior siding and for interior flooring and design in residential and commercial buildings. The ceramic tiles, sold under the “HD” or “Hengda” brands, are available in over two thousand styles, colors and size combinations. Currently, we have five principal product categories: (i) porcelain tiles, (ii) glazed tiles, (iii) glazed porcelain tiles, (iv) rustic tiles, and (v) polished glazed tiles. Porcelain tiles are our best-selling products, accounting for 100.0% and 85.4% of our total ceramic tile products sales revenue for the six months ended June 30, 2022 and 2021, respectively.
Antelope Enterprise also engages in business management and consulting, which consists of computer consulting, software development, and operations in the online commerce and live streaming industry. This is a relatively new operating segment for the Company, and it accounted for 87.6% of total revenue for the six months ended June 30, 2022, a marked increase from the 38.3% that this segment contributed to total Company revenue for the six months ended December 31, 2021. Business management and consulting segment sales are likely to increase as a percentage of total Company revenue in the periods ahead as the Company continues to implement a strategic transformation towards trending technology businesses in China to mitigate the challenging conditions in the real estate market in China and associated industries like our ceramic tile business.
The Company’s total annual production capacity is 22.8 million square meters of ceramic tiles which is solely attributable to its Hengda facility. In 2017, the Company retired two old furnaces at the Hengda facility and in July of 2018, it retired two more old furnaces. This resulted in the annual production capacity at Hengda being reduced to 22.8 million square meters of ceramic tiles which, represents the Company’s total current production capacity of ceramic tiles.
Because the Company has no present intention to use the Hengdali facility for its own production purposes, we entered into a new lease agreement, effective November 1, 2021, with an existing lessee at the facility who had been leasing one of the production lines with the capacity to produce approximately 10 million square meters of ceramic tiles annually at the Hengdali facility. The new lease agreement replaces the eight-year contract entered into on March 1, 2016 and is for the Hengdali facility in its entirety which includes building, plant and facilities, and which contains all of its machinery, equipment and production lines. The new lease has a term of five years, from November 1, 2021 through October 31, 2026, for an annual rent of RMB 18.0 million. The leased Hengdali facility has an annual production capacity of 22.8 million square meters of ceramic tiles. The Company believes that it is prudent to generate income from its unused production capacity from a third party rather than let it remain idle.
Due to currently challenging economic conditions, for the six months ended June 30, 2022, we utilized production facilities capable of producing 0.8 million square meters ceramic tiles, as compared with the six months ended June 30, 2021, when we utilized production facilities capable of producing 1.1 million square meters of ceramic tiles. During the six month period ended June 30, 2022, we had seven production lines available for production (all were from Hengda), one of which was in use as of June 30, 2022. When in operation, each production line is optimized to manufacture specific size ranges to maximize efficiency and output.
To mitigate the challenging conditions in the real estate market in China and associated industries like our ceramic tile business, we incorporated new subsidiaries which are mainly engaged in trending technology business in China such as business management and consulting including human resource restructuring and optimization, information system technology consulting services including the sales of software use rights for digital data deposit platforms and asset management systems, and an online social media platform including live streaming and e-commence platform development and consulting. These new subsidiaries include:
| ● | On November 20, 2019, we incorporated a 100% owned operating subsidiary Chengdu Future Talented Management and Consulting Co, Ltd (“Chengdu Future”) in China. Chengdu Future is engaged in business management and consulting services. |
| ● | On May 5, 2020, Antelope Enterprise (HK) Holdings Limited incorporated a 100% owned subsidiary Antelope Holdings (Chengdu) Co., Ltd (“Antelope Chengdu”) in China. Antelope Chengdu is engaged in computer consulting and software development. |
| ● | On August 10, 2021, Antelope HK incorporated a 100% owned subsidiary Hainan Antelope Holdings Co., Ltd (“Antelope Hainan”) in China. Antelope Hainan is engaged in business management and consulting services. Antelope Hainan does not have any operations as of this report date. |
| ● | On August 11, 2021, Antelope HK incorporated a 100% owned subsidiary Antelope Future (Yangpu) Investment Co., Ltd (“Antelope Yangpu”) in China. Antelope Yangpu is engaged in business management and consulting services. Antelope Yangpu does not have any operations as of this report date. |
| ● | On August 23, 2021, Antelope Hainan incorporated a 100% owned subsidiary Antelope Investment (Hainan) Co., Ltd (“Antelope Investment”) in China. Antelope Investment is engaged in business management and consulting services. Antelope Investment does not have any operations as of this report date. |
| ● | On September 9, 2021, Antelope Future incorporated a 100% owned subsidiary Antelope Ruicheng Investment (Hainan) Co., Ltd (“Antelope Ruicheng”) in China. Antelope Ruicheng is engaged in business management and consulting services. Antelope Ruicheng does not have any operations as of this report date. |
| ● | On September 18, 2021, Antelope Ruicheng incorporated a 51% owned subsidiary Hainan Kylin Cloud Services Technology Co., Ltd (“Hainan Kylin”) in China. Hainan Kylin is engaged in business management and consulting services for the online social commerce and live streaming industry. |
In December 2019, a novel strain of coronavirus (COVID-19) was reported and the World Health Organization has declared the outbreak to constitute a “Public Health Emergency of International Concern” and a global pandemic. We experienced (and continue to experience) significant adverse impacts resulting from COVID-19 pandemic and the related public health orders. The COVID-19 pandemic is disrupting supply chains and affecting production and sales across a range of industries as a result of quarantines, facility closures, and travel and logistics restrictions in connection with the outbreak. We are experiencing reduced demand for our products both internationally and domestically and an increased level of purchase order cancellations as a result of the COVID-19 pandemic. We also continue to face increasing uncertainties around our estimates of revenue collectability and accounts receivable credit losses. The impact of the COVID-19 outbreak has had (and continues to have) a material adverse impact on our operations and financial results.
Basis of Presentation
The following discussion and analysis of our financial condition and results of operations is based on the selected financial information as of and for the six months ended June 30, 2022 and has been prepared based on the consolidated financial statements of Antelope Enterprise Holdings Limited and its subsidiaries. The consolidated financial statements of Antelope Enterprise Holdings Limited and its subsidiaries have been prepared in accordance with IFRS as issued by the International Accounting Standards Board, or “IASB.” The consolidated financial statements have been prepared on the historical cost basis, except for derivative financial instruments that have been measured at fair value.
Results of Operations
The following table sets forth our financial results for the six months ended June 30, 2022 and 2021, respectively:
| | | | |
RMB(‘000) |
| June 30, 2022 |
| June 30, 2021 |
Revenues |
| 134,961 |
| 50,017 |
Cost of revenues |
| (135,365) |
| (56,610) |
Gross profit (loss) |
| (404) |
| (6,503) |
Other income |
| 10,399 |
| 7,154 |
Other expenses |
| (4) |
| (77) |
Selling and distribution expenses |
| (4,852) |
| (3,219) |
Administrative expenses |
| (16,513) |
| (17,196) |
Bad debt expense |
| (13,536) |
| (49,827) |
Finance costs |
| (753) |
| (1,094) |
Loss before taxation |
| (25,663) |
| (70,762) |
Income tax expenses | | (83) | | (7) |
Net loss | | (25,746) | | (70,769) |
Net loss attributable to: | | | | |
Equity holders of the Company | | (29,335) | | (70,769) |
Non-controlling interest |
| 3,589 |
| — |
Net loss |
| (25,746) |
| (70,769) |
The following table shows the Company’s operations by business segment for the six months ended June 30, 2022 and 2021, respectively:
| | | | |
|
| For the Six Months Ended June 30, | ||
|
| 2022 |
| 2021 |
|
| RMB’000 |
| RMB’000 |
Revenues |
|
|
|
|
Sale of ceramic tile products |
| 16,715 |
| 42,186 |
Business management and consulting revenue |
| 118,246 |
| 7,921 |
Total revenues |
| 134,961 |
| 50,107 |
| | | | |
Cost of revenues |
|
|
|
|
Sale of ceramic tile products |
| 19,024 |
| 53,790 |
Business management and consulting revenue |
| 116,341 |
| 2,820 |
Total cost of revenues |
| 135,365 |
| 56,610 |
| | | | |
Operating costs and expenses |
|
|
|
|
Sale of ceramic tile products |
| 24,247 |
| 50,709 |
Business management and consulting revenue |
| (1,068) |
| 1,977 |
Others |
| 2,080 |
| 11,573 |
Total operating costs and expenses |
| 25,259 |
| 64,259 |
| | | | |
Net loss |
|
|
|
|
Sale of ceramic tile products |
| (26,556) |
| 68,094 |
Business management and consulting revenue |
| 2,890 |
| (3,115) |
Others |
| (2,080) |
| 5,790 |
Net loss |
| (25,746) |
| 70,769 |
Description of Selected Income Statement Items
Revenue from sales of ceramic tile products. We generate revenue from the sales of ceramic tiles, including porcelain tiles, glazed porcelain tiles, glazed tiles, rustic tiles and polished glazed tiles, net of rebates and discounts. Under normal circumstance, the second and third calendar quarters have been the peak season of the property development industry, and, therefore, our quarterly sales are usually highest from May to September compared to the rest of the year. Conversely, our sales were lower between the months of January to March. This is because property developing activities tend to be low due to the effects of cold weather and the PRC Spring Festival. Beginning on July 1, 2016 through 2019, we decreased the pricing of our ceramic tile products several times in response to the difficult market conditions in China. In 2020, we did not adjust the selling prices of our ceramic tile products. In July 2021, Hengda increased the pricing of its ceramic tile products by an average of 15%, and Hengdali decreased the pricing of its ceramic tile products by an average of 5%. For the six months ended June 30, 2022, we did not adjust the pricing of our ceramic tile products, but
our sales of ceramic tiles was significantly impacted by uncertainties in the real estate market as well as the continued effects of the COVID-19 pandemic. Revenue from the sale of ceramic tile products decreased by 60.4% for the six months ended June 30, 2022 as compared to the six months ended June 30, 2021, mainly due to the 65.7% decrease in sales volume, which was partly offset by an increase in average selling price of 15.4%, which was due to our selling only porcelain tile products that have a higher average selling price. We produced and sold only porcelain tiles for the six month period ended June 30, 2022 to position our sales efforts on as realistic a basis as possible to address the difficult business conditions attributable to uncertainties in the real estate market as well as the continued effects of the COVID-19 pandemic.
We also generated revenue from business management consulting, information system technology consulting services including the sales of software use rights for digital data deposit platforms and asset management systems, and social media platform development and consulting. For the six months ended June 30, 2022 and 2021, we generated RMB 118.2 million and RMB 7.9 million, respectively, from Antelope Chengdu, Chengdu Future and Hainan Kylin Cloud Services, who are engaged in these sectors.
Cost of revenues. Cost of revenues for ceramic tile products consist of costs directly attributable to production, including the cost of clay, color materials, glaze materials, natural gas, salaries for staff engaged in production activity, electricity, depreciation, packing materials, and related expenses. Cost of revenues for business management and consulting mainly consists of professional costs for outsourcing technology services.
The most significant factors that directly or indirectly affect our cost of tile products sales are as follows:
| ● | Availability and price of clay; |
| ● | Availability and price of natural gas; and |
| ● | Availability and price of dyes; and |
| ● | Price of energy. |
Clay is a key material for making ceramic tiles, and accounted for approximately 22.7% and 7.4% of our cost of sales for the six months ended June 30, 2022 and 2021, respectively. Fujian and Jiangxi Provinces, where our production facilities are located, are the largest clay resources areas in China and clay supply is stable and sufficient for our production and planned production.
Dyes are another key material for making ceramic tiles, and accounted for approximately 29.0% and 9.4% of our cost of sales for the six months ended June 30, 2022 and 2021, respectively. A number of dyes are used in ceramic tiles, and the prices of different dyes have fluxtuated over the past few years.
Natural gas has largely replaced coal in our manufacturing of ceramic tiles, and natural gas accounted for approximately 11.2% and 5.1% of our cost of sales for the six months ended June 30, 2022 and 2021, respectively.
For the six months ended June 30, 2022 and 2021, we had cost of revenues related to business management and consulting income of RMB 116.3 million and RMB 2.8 million, respectively, which mainly consisted of professional costs for outsourcing technology services.
Other income and other expenses. Other income consists of interest income, foreign exchange gain, government grant, tax subsidy and rental income by leasing out Hengdali facility. Other expenses primarily consist of the exchange loss.
Selling and distribution expenses. Selling and distribution expenses consist of payroll, traveling expenses, transportation and advertising expenses incurred by our selling and distribution team.
Administrative expenses. Administrative expenses consist primarily of R&D expense, employee remuneration, payroll taxes and benefits, general office expenses and depreciation.
Income taxes. Our subsidiaries in the PRC are subject to the PRC Enterprise Income Tax Law, and the applicable income tax rate pursuant to such law for the six months ended June 30, 2022 and 2021 is 25% for Hengda, Hengdali, Hainan Kylin Cloud Services Technology, 2.5% for Chengdu Future and Antelope Chengdu.
Results of Operations
Six Months Ended June 30, 2022 Compared to the Six Months Ended June 30, 2021
Revenue from sales of ceramic tile products. The following table sets forth the breakdown of revenue, by product categories, for the six Months ended June 30, 2022 and 2021.
| | | | | | | | | |
Revenue RMB (000) |
| 2022 |
| Percentage |
| 2021 |
| Percentage |
|
Porcelain |
| 16,715 |
| 100.0 | % | 36,035 |
| 85.4 | % |
Glazed Porcelain |
| — |
| — | % | — |
| — | % |
Glazed |
| — |
| — | % | — |
| — | % |
Rustic |
| — |
| — | % | 5,948 |
| 14.1 | % |
Polished Glazed |
| — |
| — | % | 203 |
| 0.5 | % |
Total |
| 16,715 |
| 100.0 | % | 42,186 |
| 100.0 | % |
Revenue from sales of tile products was RMB 16.7 million (US$ 2.6 million) for the six months ended June 30, 2022, compared to RMB 42.2 million (US$ 6.5 million) for the six months ended June 30, 2021, representing a decrease of RMB 25.5 million, or 60.4%. The decrease in revenue was primarily due to the decrease in sales volume of 65.7% which was partly offset by an increase in average selling price of 15.4%. The decrease in sales resulted from the continued slowdown of China’s economy, and both the manufacturing sector and the real estate industry were affected by the weaker economy and the adverse impact of the COVID-19 outbreak.
Porcelain tiles. Revenue from the sales of porcelain tiles decreased 53.6%, from RMB 36.0 million (US$ 5.6 million) for the six months ended June 30, 2021 to RMB 16.7 million (US$ 2.6 million) for the six months ended June 30, 2022. The decrease was primarily attributable to a decrease in our sales volume for the year of 2022 as compared to the same period of 2021. Porcelain tiles for exterior walls are still our most popular product and have the largest market potential of all of our ceramic tiles. We expect porcelain tiles to continue to be our key ceramic tile product for the foreseeable future. We produced and sold only porcelain tiles for the six month period ended June 30, 2022 to position our sales efforts on as realistic a basis as possible to address the difficult business conditions attributable to uncertainties in the real estate market as well as the continued effects of the COVID-19 pandemic.
Glazed porcelain tiles. Revenue from glazed porcelain tiles was nil for the six months ended June 30, 2022 and 2021.
Glazed tiles. Revenue from glazed tiles was nil for the six months ended June 30, 2022 and 2021.
Rustic tiles. Revenue from rustic tiles decreased 100.0%, from RMB 5.9 million (US$ 0.9 million) for the six months ended June 30, 2021 to RMB nil (US$ nil) for the six months ended June 30, 2022.
Polished glazed tiles. Revenue from polished glazed tiles decreased 100.0%, from RMB 203,000 (US$ 31,000) for the six months ended June 30, 2021 to RMB nil (US$ nil) for the six months ended June 30, 2022. We believe that this product represents both a functional and cost-effective replacement for actual marble or stone materials used in a decorative fashion inside homes. However, the demand for this type of tile decreased significantly due to the impact of the continued effects of the COVID-19 pandemic.
Revenue from business management and consulting
For the six months ended June 30, 2022 and 2021, revenue from our business management and consulting segment was RMB 118.2 million (US$ 18.3 million) and RMB 7.9 million (US$1.2 million), respectively, representing an increase of RMB 110.3 million, or 1396.2% in 2022. To mitigate the challenging conditions in the real estate market in China and associated industries like our ceramic tile business, we continued to implement a strategic transformation to focus Company resources on trending technology business in China such as human resource restructuring and optimization, information system technology consulting services for digital data deposit platforms and asset management systems, and live streaming and e-commence platform development and consulting.
Cost of sales for sales of ceramic tile products. The following table sets forth the breakdown of cost of sales, by product segment, for the six months ended June 30, 2022 and 2021:
| | | | | | | | | |
Cost of sales RMB (‘000) |
| 2022 |
| Percentage |
| 2021 |
| Percentage |
|
Porcelain |
| 19,024 |
| 100.0 | % | 46,564 |
| 86.6 | % |
Glazed Porcelain |
| — |
| — | % | — |
| — | % |
Glazed |
| — |
| — | % | — |
| — | % |
Rustic |
| — |
| — | % | 6,992 |
| 13.0 | % |
Polished Glazed |
| — |
| — | % | 234 |
| 0.4 | % |
Total |
| 19,024 |
| 100.00 | % | 53,790 |
| 100.00 | % |
Cost of sales for sales of tile products was RMB 19.0 million (US$ 2.9 million) for the six months ended June 30, 2022, compared to RMB 53.8 million (US$ 8.3 million) for the six months ended June 30, 2021, representing a decrease of RMB 34.8 million, or 64.6%. The decrease in cost of sales was primarily due to decreased sales and production.
Cost of sales for business management and consulting
Cost of sales for business management and consulting services was RMB 116.3 million (US$ 18.0 million) and RMB 2.8 million (US $0.4 million) for the six months ended June 30, 2022 and 2021, respectively, representing an increase of RMB 113.5 million, or 4,053.6% in 2022. The increased in cost of sales was mainly due to the increase of revenue.
Gross profit for sales of ceramic tile products. The following table sets forth the breakdown of our gross profit (loss) and gross profit (loss) margin by product segment for the six months ended June 30, 2022 and 2021:
| | | | | | | | | |
| | 2022 | | 2021 |
| ||||
| | Gross |
| |
| |
| |
|
| | Profit | | Profit (Loss) | | Gross | | Profit | |
RMB (‘000) |
| (Loss) |
| Margin |
| Profit |
| Margin | |
Porcelain |
| (23,109) |
| (13.8) | % | (10,529) |
| (29.2) | % |
Glazed Porcelain |
| — |
| — | | — |
| — | |
Glazed |
| — |
| — | | — |
| — | |
Rustic |
| — |
| — | | (1,044) |
| (17.6) | % |
Polished Glazed |
| — |
| — | | (32) |
| (15.8) | % |
All products |
| (23,109) |
| (13.8) | % | (11,605) |
| (27.5) | % |
Gross loss was RMB 2.3 million (US$ 0.4 million) for the six months ended June 30, 2022, as compared to a gross loss of RMB 11.6 million (US$ 1.8 million) for the six months ended June 30, 2021, a decrease of RMB 9.3 million.
Gross profit for business management and consulting,
Gross profit for the business management and consulting services was RMB 1.9 million (US$ 0.3 million) and RMB 5.1 million (US$ 0.8 million) for the six months ended June 30, 2022 and 2021, respectively, representing a decrease of RMB 3.2 million, or 62.7% in 2022.
Other income. Other income for the six months ended June 30, 2022 was RMB 10.4 million (US$ 1.6 million), as compared to RMB 7.1 million (US$ 1.1 million) for the same period of 2021. For the six month periods ended June 30, 2022 and 2021, other income was mainly attributable to the income from leasing out our Hengdali facility. In addition, we generated RMB 632,000 in a government grant and RMB 887,000 in a tax subsidy for the six months ended June 30, 2022.
Selling and distribution expenses. Selling and distribution expenses were RMB 4.9 million (US$ 0.7 million) for the six months ended June 30, 2022, compared to RMB 3.2 million (US$ 0.5 million) for the six months ended June 30, 2021, representing an increase of RMB 1.6 million, or 50.7%. The increase in selling and distribution expenses was primarily due to the increased commission expense of RMB 1.9 million which was partly offset by the decreased salary expense of RMB 0.2 million and the decreased travel expense of RMB 6,600.
Administrative expenses. Administrative expenses were RMB 16.5 million (US$ 2.5 million) for the six months ended June 30, 2022, compared to RMB 17.2 million (US$ 2.7 million) for the six months ended June 30, 2021, representing a decrease of RMB 683,000, or 4.0%. The decrease in administrative expenses was primarily due to a decrease in consultant fees of RMB 4.7 million which was partly offset by (i) an RMB 1.1 million increase in an assets assessment fee, (ii) an RMB 0.4 million increase in professional fees, (iii) an RMB 0.8 million increase in audit fees, (iv) an RMB 0.5 million increase in an investor relations fee, (v) an RMB 0.9 million increase in insurance expense, and (vi) an RMB 0.3 million increase in payroll expense.
Bad debt expense. Bad debt expense was RMB 13.5 million (US$ 2.1 million) for the six months ended June 30, 2022, compared to RMB 49.8 million (US$ 7.7 million) for the six months ended June 30, 2021. We recognize a loss allowance for expected credit loss on our financial assets, primarily on trade receivables, which are subject to impairment under IFRS 9 - Financial Instruments. We believe that we have undertaken appropriate measures to resolve the bad debt expense. We will continue to review each of our customers for credit quality as well as assiduously test their accounts receivables balances in each upcoming fiscal period.
Finance costs. Finance costs were RMB 0.8 million (US$ 0.1 million) for the six months ended June 30, 2022, compared to RMB 1.1 million (US$ 0.2 million) for the six months ended June 30, 2021. The decrease was mainly due to the decrease of interest expense on lease liabilities.
Loss before taxation. Loss before taxation was RMB 25.7 million (US$ 4.0 million) for the six months ended June 30, 2022, as compared to a loss before taxation of RMB 70.8 million (US$ 10.9 million) for the six months ended June 30, 2021. The decrease in loss before taxation was mainly due to a decrease in bad debt expense, an increase in other income and a decrease in gross loss for the six months ended June 30, 2022 as compared to June 30, 2021 as described above.
Income taxes. We incurred an income tax expense of RMB 83,000 (US$ 13,000) for the six months ended June 30, 2022 compared to an income tax expense of RMB 7,000 (US$ 1,000) for the six months ended June 30, 2021. Our PRC statutory enterprise income tax rate was 25% for the six months ended June 30, 2022 and 2021, except for Antelope Chengdu and Chengdu Future who are subject to 2.5% preferential income tax rate.
Net loss attributable to equity holders of the Company. Net loss attribute to equity holders of the Company was RMB 29.3 million (US$ 4.5 million) for the six months ended June 30, 2022, as compared to a loss attributable to the Company’s shareholders of RMB 70.8 million (US$ 10.9 million) for the six months ended June 30, 2021. The decrease in net loss attributable to shareholders in 2022 was attributable to the reasons described above.
Net income attributed to non-controlling interest. Net income attributed to non-controlling interest was RMB 3.6 million (US$ 0.6 million) and RMB nil (US$ nil) for the six months ended June 30, 2022 and 2021, respectively. Non-controlling interest represented the 49% ownership of Hainan Kylin.
Liquidity and Capital Resources
The following table presents a summary of our cash flows and beginning and ending cash balances for the six months ended June 30, 2022 and 2021:
| | | | |
RMB (‘000) |
| 2022 |
| 2021 |
Net cash generated from / (used in) operating activities |
| 7,623 |
| (3,686) |
Net cash used in investing activities |
| (8,567) |
| (129) |
Net cash generated from / (used in) financing activities |
| (12,030) |
| 25,406 |
Net cash flow |
| (12,974) |
| 21,591 |
Cash and cash equivalents at beginning of year |
| 27,880 |
| 12,344 |
Effect of foreign exchange rate differences |
| 97 |
| 94 |
Cash and cash equivalents at end of period |
| 15,003 |
| 34,029 |
We have historically financed our liquidity requirements mainly through operating cash flow, bank loans and issuance of new shares. We believe that we will generate sufficient cash from operations to meet our needs for the next twelve months.
However, we may sell additional equity or obtain credit facilities to enhance our liquidity position or to increase our cash reserve for future acquisitions and capital equipment expenditures. The sale of additional equity would result in further dilution of our equity to our shareholders. The incurrence in indebtedness would result in increased fixed obligations and could result in operating covenants that would restrict our operations. We cannot provide assurance that financing will be available in amounts or on terms acceptable to us, if at all.
On February 12, 2021, the Company entered into a Securities Purchase Agreement with certain institutional investors for the sale of 588,235 common shares, at a purchase price of $3.57 per share. Concurrently with the sale of the Common Shares, pursuant to the Purchase Agreement the Company also sold warrants to purchase 588,235 common shares. The Company sold the Common Shares and Warrants for aggregate gross proceeds of approximately $2.1 million, before commissions and expenses. The five-year Warrants will be immediately exercisable at an exercise price equal to $3.57 per share, and will terminate on the five-year anniversary of the initial exercise date of the Warrants. The net proceeds from the transactions will be approximately $1.86 million, after deducting certain fees due to the placement agent and the Company’s estimated transaction expenses, and will be used for working capital and general corporate purposes.
In addition, the Placement Agent of this offering also received five-year warrants (the “Compensation Warrants”) to purchase up to a number of common shares equal to 5% of the aggregate number of shares sold in the Offering, including the warrant shares issuable upon exercise of the Warrants, which such Compensation Warrants have substantially the same terms as the Warrants sold in the Offering, except that such Compensation Warrants have an exercise price of $4.46 per share and will be exercisable six months from the effective date of this offering and will terminate on the five year anniversary of the effective date of this offering.
On June 10, 2021, the Company commenced a registered direct offering of securities, and executed a Securities Purchase Agreement (the “SPA”) with three institutional accredited investors pursuant to which it sold 913,875 of the Company’s common shares at the per share price of $3.48 (which was priced in excess of the average of the five-day closing price for the Company’s common shares preceding execution of the SPA, which was $3.42). In a concurrent private placement, the Company sold to such investors warrants to purchase 913,875 common shares. The Investor Warrants have an exercise price per share of $3.42, subject to adjustment and have a term of five years; the transaction yielded gross proceeds to the Company of $3,180,285, before payment of commissions and expenses.
In addition, the Company issued warrants to the Placement Agent to purchase a number of common shares equal to 5.0% of the aggregate number of shares sold to the investors in this offering, as well as the warrant shares issuable upon exercise of the Warrants issued in the concurrent private placement, as additional placement agency compensation. The Placement Agent Warrants have substantially the same terms as the Investor Warrants, except that the Placement Agent Warrants will have an exercise price of $4.35.
Cash flows from operating activities.
Our net cash provided by operating activities was RMB 7.6 million ($1.2 million) for the six months ended June 30, 2022, an increase of RMB 11.3 million as compared to a cash outflow of RMB 3.7 million for the six months ended June 30, 2021. The increase in cash inflow was mainly due to an increase in operating cash inflow before working capital changes of RMB 8.3 million, an increase in cash inflow on trade receivables of RMB 26.1 million, a decrease in cash outflow on other receivables and prepayments of RMB 12.7 million and increased cash inflow on trade payable of RMB 5.2 million, which was partly offset by a decrease in cash inflow from inventories of RMB 30.3 million, a increase in cash out flow on unearned revenue of RMB 8.4 million and a increase in cash outflow from accrued liabilities and other payables of RMB 2.4 million.
Cash flows from investing activities.
Net cash used in investing activities for the six months ended June 30, 2022 was RMB 8.6 million (US$ 1.3 million), compared to cash inflow of RMB 129,000 for the six months ended June 30, 2021. The increase of cash outflow was mainly due to the increase in restricted cash of RMB8.6 million in 2022.
Cash flows from financing activities.
Net cash used in financing activities was RMB 12.0 million (US$ 1.9 million) for the six months ended June 30, 2022, compared to a cash inflow of RMB 25.4 million for the six months ended June 30, 2021; during the six months ended June 30, 2022, we had a payment for lease liabilities of RMB 14.5 million, but this was offset with the cash inflow for a capital contribution of RMB 2.5 million. In the six months ended June 30, 2021, we had proceeds of RMB 30.0 million from issuance of share capital, and proceeds from warrants exercised of RMB 10.4 million, which was partly offset by the payment for lease liabilities of RMB 15.0 million.
Cash and bank balances were RMB 15.0 million (US$ 2.2 million) as of June 30, 2022, as compared to RMB 34.0 million as of June 30, 2021.
As of June 30, 2022, our total outstanding bank loan amounts were nil.
Inventory Management
Our inventory is comprised of raw materials, work in progress and finished goods of ceramic tile products. Raw materials are purchased from our suppliers located in Fujian, Guangdong and Jiangxi Provinces and comprise mainly of clay, coal, colorings and glazing materials.
We have sufficient raw materials to support, on average, three weeks of production at any point in time. This helps to minimize any potential delays in our production process which may arise due to insufficient raw materials. Our production of ceramic tiles is based on customers’ orders. In doing so, we minimize storage space and maintain a relatively low inventory level of finished products. Our inventory turnover for the six months ended June 30, 2022 and 2021 are as follows:
| | | | |
|
| 2022 |
| 2021 |
Inventories (RMB’000) |
| 37,040 |
| 27,364 |
Inventory turnover (days) (1) |
| 327 |
| 128 |
| (1) | The average inventory turnover is computed based on the formula: (simple average opening and closing inventories balance in a financial year / cost of sales) × 181 days. |
There was no write-down of inventory for the six months ended June 30, 2022 and June 30, 2021.
Credit Management
Credit terms to our customers
We typically extend credit terms of approximately 90 days to our tile -products customers. We grant credit terms based on the reputation, creditworthiness, size of orders, payment records and number of years we have done business with the customer. We do not have a products’ return policy. In the six months ended June 30, 2022 and 2021, we recorded RMB 13.5 million (US$ 2.1 million) and RMB 49.8 million (US$ 7.7 million), respectively, for provision for bad debt related to the amount of outstanding trade receivables that did not conform with the Company’s credit policy.
Personnel from our sales and marketing department typically conduct visits to new customers to evaluate their credit worthiness before entering into any arrangements with them. In addition, as Hengda was awarded a Top 500 Brand award, we increased the deposit required from new distributors from RMB 0.4 million to RMB 1.0 million.
Our average trade receivables’ turnover for sales of ceramic tile products for the six months ended June 30, 2022 and 2021 are as follows:
| | | | |
|
| 2022 |
| 2021 |
Trade receivables (RMB’000) |
| 18,471 |
| 58,782 |
Trade receivables turnover (days) (1) |
| 329 |
| 253 |
Our average trade receivables’ turnover for business management and consulting for the six months ended June 30, 2022 and 2021 are as follows:
| | | | |
|
| 2022 |
| 2021 |
Trade receivables (RMB’000) |
| 422 |
| — |
Trade receivables turnover (days) (1) |
| 0.3 |
| — |
| (1) | The average trade receivables’ turnover is computed based on the formula: (simple average opening and closing trade receivables balance, net of value-added tax in financial year / purchases) × 181 days. |
Credit terms from our suppliers
Our typical credit terms from our major suppliers are from 1 to 4 months after the raw materials have been delivered. Our average trade payables’ turnover for sales of ceramic tile products for the six months ended June 30, 2022 and 2021 are as follows:
| | | | |
|
| 2022 |
| 2021 |
Trade payables (RMB’000) |
| 4,041 |
| 5,494 |
Trade payables turnover (days) (1) |
| 32 |
| 17 |
Our average trade payables’ turnover for business management and consulting for the six months ended June 30, 2022 and 2021 are as follows:
| | | | |
|
| 2022 |
| 2021 |
Trade payables (RMB’000) |
| 6,181 |
| — |
Trade payables turnover (days) (1) |
| 5 |
| — |
| (1) | The average trade payables’ turnover is computed based on the formula: (simple average opening and closing trade payables balance, net of value-added tax in financial year / purchases) × 181 days. |
Capital Expenditures
Our capital expenditures primarily consist of expenditures on property, plant and equipment.
There were RMB 11,000 and RMB 129,000 capital expenditures for the six months ended June 30, 2022 and 2021, respectively.
Contractual Obligations
Our contractual obligations consist mainly of debt obligations, operating lease obligations and other purchase obligations and commitments, and will be paid off with our cash flow from operations. The following table sets forth a breakdown of our contractual obligations (including both interest and principal cash flows) as of June 30, 2022:
| | | | | | | | | | |
| | Payment Due by Period | ||||||||
| | | | Less than 1 | | 1-3 | | 3-5 | | More than 5 |
|
| Total |
| year |
| years |
| years |
| years |
Short-term debt obligations (1) |
| — |
| — |
| — |
| — |
| — |
Operating lease obligations (2) |
| 35,213 |
| 14,641 |
| 20,572 |
| — |
| — |
Other obligations (3) |
| — |
| — |
| — |
| — |
| — |
Total |
| 35,213 |
| 14,641 |
| 20,572 |
| — |
| — |
| (1) | Amounts represent principal and interest cash payments over the life of the bank loans, including anticipated interest payments that are not recorded in the financial statements. |
| (2) | We lease plant buildings, production factories, warehouses and an employees’ hostel from non-related parties under non-cancellable operating lease arrangements. |
| (3) | Includes advertising and insurance expenditure contracted but not provided for in the financial statements. |
Off-Balance Sheet Arrangements
We do not have any outstanding off-balance arrangements and have not entered into any transactions that are established for the purpose of facilitating off-balance sheet arrangements.
Impact of Inflation
The general annual inflation rate in China was approximately 2.5% in 2020, 0.9% in 2021, and is projected to be 2.3% in 2022 according to the National Bureau of Statistics of China. Our results of operations may be affected by inflation, particularly rising prices for energy, labor costs, raw materials and other operating costs. See our Form 20-F for the year ended December 31, 2021 as filed with the Securities and Exchange Commission under the section titled, “Item 3. Key Information — Risk Factors — Risks relating to our business. If China’s inflation increases or the prices of energy or raw materials increase, we may not be able to pass the resulting increased costs to our customers and this may adversely affect our profitability or cause us to suffer operating losses.”
FINANCIAL RISK MANAGEMENT
We are exposed to financial risks arising from our operations and the use of financial instruments. The key financial risks included credit risk, liquidity risk, interest rate risk, foreign currency risk and market price risk.
We do not hold or issue derivative financial instruments for trading purposes or to hedge against fluctuations, if any, in interest rates and foreign exchange rates.
| (i) | Credit risk |
Credit risk refers to the risk that a counterparty will default on its contractual obligations resulting in financial loss us. Our exposure to credit risk arises primarily from bank balances and trade receivables. For trade receivables, we adopt the policy of dealing only with customers of appropriate credit history to mitigate credit risk. For other financial assets, we adopt the policy of dealing only with high credit quality counterparties.
As we do not hold any collateral, the maximum exposure to credit risk for each class of financial assets is the carrying amount of that class of financial assets presented on the consolidated statements of financial position.
Cash and bank balances
Our bank deposits are placed with reputable banks in the PRC, Hong Kong and the United States. The credit exposure of our cash and bank balances (excluding restricted cash) as of June 30, 2022 and December 31, 2021 were RMB 15,003,000 and RMB 27,880,000, respectively.
| (ii) | Liquidity risk |
Liquidity risk is the risk that we will encounter difficulty in raising funds to meet commitments associated with financial instruments. Liquidity risk may result from an inability to sell a financial asset quickly at close to its fair value.
Our exposure to liquidity risk arises primarily from mismatches of the maturities of financial assets and liabilities. Our objective is to maintain a balance between continuity of funding and flexibility through the use of stand-by credit facilities.
The table below summarizes the maturity profile of the liabilities based on contractual undiscounted payments:
| | | | | | |
| | As of June 30, 2022 | ||||
| | | | More than 1 | | |
| | | | year but less | | |
| | Within 1 year | | than 5 years | | Total |
|
| RMB’000 |
| RMB’000 |
| RMB’000 |
Trade payables |
| 10,222 |
| — |
| 10,222 |
Amounts owed to related parties |
| 36,348 |
| — |
| 36,348 |
Lease liabilities |
| 14,641 |
| 20,572 |
| 35,213 |
Total |
| 61,211 |
| 20,572 |
| 81,783 |
| (iii) | Interest rate risk |
Interest rate risk is the risk that the fair value or future cash flows of our financial instruments will fluctuate because of changes in market interest rates.
Our interest-bearing bank deposits and borrowings were nil as of June 30, 2022.
| (iv) | Foreign currency risk |
Currency risk is the risk that the value of a financial instrument will fluctuate due to changes in foreign exchange rates. Currency risk arises when transactions are denominated in foreign currencies.
Our operations are primarily conducted in the PRC. All the sales and purchases transactions are denominated in RMB. As such, our operations are not exposed to exchange rate fluctuation.
As of June 30, 2022 and December 31, 2021, nearly all of our monetary assets and monetary liabilities were denominated in RMB except certain bank balances and other payables which were denominated in US dollars and HKD.
Critical Accounting Policies and Judgment
The preparation of the condensed consolidated interim financial statements, which have been prepared in accordance with International Accounting Standard (“IAS”) as issued by the International Accounting Standards Board (“IASB”), requires us to make estimates, judgments and assumptions that affect the reported amounts of assets, liabilities, revenues and expenses. Estimates and judgments are continually evaluated and are based on historical experiences and other factors, including expectations of future events that are believed to be reasonable under the circumstances. Actual results may materially differ from these estimates under different assumptions or conditions.
See Note 2 to our consolidated interim financial statements, “Basis of Preparation and Summary of Significant Accounting Policies.”
Critical accounting estimates and assumptions
We make estimates and assumptions concerning the future. The resulting accounting estimates will, by definition, seldom equal the related actual results. The key sources of estimation uncertainty and key assumptions concerning the future at the end of the reporting period, that have a significant risk of causing a material adjustment to the carrying amounts of assets and liabilities within the next financial year are discussed below:
Useful lives and impairment assessment of property, plant and equipment
Property, plant and equipment are stated at cost less accumulated depreciation and identified impairment losses. The estimation of useful lives impacts the level of annual depreciation expenses recorded. Property, plant and equipment are evaluated for possible impairment on a specific asset basis or in groups of similar assets, as applicable. This process requires management’s estimate of future cash flows generated by each asset or group of assets. For any instance where this evaluation process indicates impairment, the relevant asset’s carrying amount is written down to the recoverable amount and the amount of the write-down is charged against profit or loss.
Useful lives and impairment assessment of investment property
Investment properties are stated at cost less accumulated depreciation and identified impairment losses. The estimation of useful lives impacts the level of annual depreciation expenses recorded. Investment properties are evaluated for possible impairment on a specific asset basis or in groups of similar assets, as applicable. This process requires management’s estimate of future cash flows generated by each asset or group of assets. For any instance where this evaluation process indicates impairment, the relevant asset’s carrying amount is written down to the recoverable amount and the amount of the write-down is charged against profit or loss.
Impairment loss recognized in respect of property, plant and equipment
As of June 30, 2022, the carrying amount of property, plant and equipment was approximately RMB 1,129,000 (2021: RMB 1,250,000). No impairment loss was recognized for the six months ended June 30, 2022 and 2021. Determining whether property, plant and equipment are impaired requires an estimation of the recoverable amount of the property, plant and equipment. Such an estimate was based on certain assumptions which are subject to uncertainty and might materially differ from the actual results.
Impairment loss recognized in respect of investment property
As of June 30, 2022, the carrying amount of investment property was nil (2021: nil). No impairment loss was recognized in the six months ended June 30, 2022 and 2021. Determining whether an investment property is impaired requires an estimate of the recoverable amount of the investment property. Such an estimate was based on certain assumptions which are subject to uncertainty and might materially differ from the actual results.
Impairment loss recognized in respect of land use rights
As of June 30, 2022, the carrying amounts of land used rights was nil (2021: nil). No impairment loss was recognized in the six months ended June 30, 2022 and 2021. Determining whether land use rights are impaired requires an estimate of the recoverable amount of the land use rights. Such an estimate was based on certain assumptions which are subject to uncertainty and might materially differ from the actual results.
Income tax
The Company has exposure to income taxes in the PRC. Significant judgment is required in determining the provision for income taxes. There are certain transactions and computations for which the ultimate tax determination is uncertain during the ordinary course of business. The Company recognizes liabilities for expected tax issues based on estimates of whether additional taxes will be due. When the final tax outcome of these matters is different from the amounts that were initially recognized, such differences will impact the income tax and deferred tax provisions in the period in which such determination is made.
Impairment of financial assets (trade receivables)
The Company recognizes a loss allowance for expected credit loss (“ECL”) on financial assets which are subject to impairment under IFRS 9 (including trade and other receivables, amounts due from related parties, restricted cash, bank balances and cash). The amount of ECL is updated at each reporting date to reflect changes in credit risk since initial recognition.
Lifetime ECL represents the ECL that will result from all possible default events over the expected life of the relevant instrument. In contrast, 12-month ECL (“12m ECL”) represents the portion of lifetime ECL that is expected to result from default events that are possible within 12 months after the reporting date. Assessment are done based on the Company’s historical credit loss experience, adjusted for factors that are specific to the debtors, general economic conditions and an assessment of both the current conditions at the reporting date as well as the forecast of future conditions.
The Company applies the IFRS 9 simplified approach to measure ECL which uses a lifetime ECL for all trade receivables. The ECL on these assets are assessed individually for debtors with significant balances and/or collectively using a provision matrix with appropriate groupings.
For all other instruments, the Company measures the loss allowance equal to 12m ECL, unless when there has been a significant increase in credit risk since initial recognition, the Company recognizes lifetime ECL. The assessment of whether lifetime ECL should be recognized is based on significant increases in the likelihood or risk of a default occurring since initial recognition.
The Company recognized bad debts of RMB 13.5 million and RMB 49.8 million in the six months ended June 30, 2022 and 2021, respectively.
Net realizable value of inventories
Net realizable value of inventories is management’s estimate of future selling price in the ordinary course of business, less estimated costs of completion and selling expenses. These estimates are based on current market conditions and the historical experience of selling products of a similar nature and could change significantly as a result of various market factors.
Share-based payment transaction
The Company measures the cost of equity-settled transactions with employees by reference to the fair value of the equity instruments at the date at which they are granted. Estimating fair value for share-based payment transactions requires determining the most appropriate valuation model which is dependent on the terms and conditions of the grant. This estimate also requires determining the most appropriate inputs to the valuation model including the expected life of the stock option, volatility and dividend yield, and the assumptions as to these components.
SIGNATURES
Pursuant to the requirements of the Securities Exchange Act of 1934, the Registrant has duly caused this report to be signed on its behalf by the undersigned, hereunto duly authorized.
| | |
| | |
| Antelope Enterprise Holdings Ltd. | |
| | |
| By: | /s/ Hen Man Edmund |
| | Hen Man Edmund, |
| | Chief Financial Officer |
| | |
| | |
Date: September 29, 2022