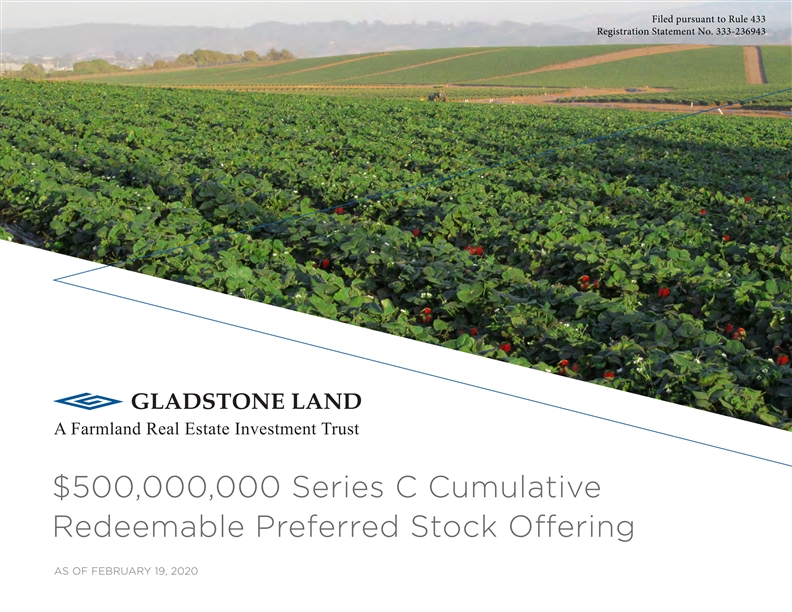
Filed pursuant to Rule 433 Registration Statement No. 333-236943 A Farmland Real Estate Investment Trust $500,000,000 Series C Cumulative Redeemable Preferred Stock Oering AS OF FEBRUARY 19, 2020Filed pursuant to Rule 433 Registration Statement No. 333-236943 A Farmland Real Estate Investment Trust $500,000,000 Series C Cumulative Redeemable Preferred Stock Oering AS OF FEBRUARY 19, 2020
Legal Disclaimers ESTIMATES This presentation contains industry and market data, forecasts, and projections that are based on internal data and estimates, independent industry publications, reports by market research firms, or other published independent sources. We believe these data to be reliable as of the date of this presentation, but there can be no assurance as to the accuracy or completeness of such information. We have not independently verified all market and industry data obtained from these third-party sources. Our internal data and estimates are based upon information obtained from trade and business organizations, other contacts in the markets in which we operate, and our management’s understanding of industry conditions. You should carefully consider the inherent risks and uncertainties associated with the market and other industry data contained in this presentation. FORWARD-LOOKING STATEMENTS This presentation may include statements that constitute “forward-looking statements”within the meaning of the Securities Act of 1933 or the Securities Exchange Act of 1934. These forward-looking statements include comments with respect to our objectives and strategies and the results of our operations and our business. By their nature, these forward-looking statements involve numerous assumptions, uncertainties and opportunities, both general and specific. The risk exists that these statements may not be fulfilled. We caution readers of this presentation not to place undue reliance on these forward-looking statements, as a number of factors could cause future Company results to dier materially from these statements, including those factors listed under the caption, “Risk Factors,” in our Form 10-K and 10-Q filings and our registration statement, including our prospectus and prospectus supplement, as filed with the Securities and Exchange Commission (“SEC”), all of which can be found on our website, www.GladstoneLand.com, or the SEC website, www.SEC.gov. Any results or performance implied by forward-looking statements may be influenced in particular by factors such as fluctuations in interest rates and stock indices, the eects of competition in the areas in which we operate, and changes in economic, political, regulatory, and technological conditions. We caution that the foregoing list is not exhaustive. When relying on forward-looking statements to make decisions, investors should carefully consider the aforementioned factors as well as other uncertainties and events. The Company has no duty to, and does not intend to, update or revise any forward-looking statements, except as required by law. PAST OR PRESENT PERFORMANCE DISCLAIMER This presentation includes information regarding past or present performance of the Company. Please note that past or present performance is not a guarantee of future performance or future results. 2Legal Disclaimers ESTIMATES This presentation contains industry and market data, forecasts, and projections that are based on internal data and estimates, independent industry publications, reports by market research firms, or other published independent sources. We believe these data to be reliable as of the date of this presentation, but there can be no assurance as to the accuracy or completeness of such information. We have not independently verified all market and industry data obtained from these third-party sources. Our internal data and estimates are based upon information obtained from trade and business organizations, other contacts in the markets in which we operate, and our management’s understanding of industry conditions. You should carefully consider the inherent risks and uncertainties associated with the market and other industry data contained in this presentation. FORWARD-LOOKING STATEMENTS This presentation may include statements that constitute “forward-looking statements”within the meaning of the Securities Act of 1933 or the Securities Exchange Act of 1934. These forward-looking statements include comments with respect to our objectives and strategies and the results of our operations and our business. By their nature, these forward-looking statements involve numerous assumptions, uncertainties and opportunities, both general and specific. The risk exists that these statements may not be fulfilled. We caution readers of this presentation not to place undue reliance on these forward-looking statements, as a number of factors could cause future Company results to dier materially from these statements, including those factors listed under the caption, “Risk Factors,” in our Form 10-K and 10-Q filings and our registration statement, including our prospectus and prospectus supplement, as filed with the Securities and Exchange Commission (“SEC”), all of which can be found on our website, www.GladstoneLand.com, or the SEC website, www.SEC.gov. Any results or performance implied by forward-looking statements may be influenced in particular by factors such as fluctuations in interest rates and stock indices, the eects of competition in the areas in which we operate, and changes in economic, political, regulatory, and technological conditions. We caution that the foregoing list is not exhaustive. When relying on forward-looking statements to make decisions, investors should carefully consider the aforementioned factors as well as other uncertainties and events. The Company has no duty to, and does not intend to, update or revise any forward-looking statements, except as required by law. PAST OR PRESENT PERFORMANCE DISCLAIMER This presentation includes information regarding past or present performance of the Company. Please note that past or present performance is not a guarantee of future performance or future results. 2

Risk Factors Please consult the prospectus supplement for this oering for a recitation of the risk factors of this oering. If any of the risks contained in or incorporated by reference into the prospectus supplement or the accompanying prospectus develop into actual events, our business, financial condition, liquidity, results of operations, FFO, adjusted funds from operations or our prospects could be materially and adversely aected, we may be unable to timely pay the dividends accrued on the Series C Preferred Stock (the “Shares”), the value of the Shares could decline and you may lose all or part of your investment. In addition, new risks may emerge at any time and we cannot predict such risks or estimate the extent to which they may aect our financial performance. Some statements in the prospectus supplement, including statements in the risk factors, constitute forward-looking statements. See the “Forward-Looking Statements” and “Risk Factors” sections in the prospectus supplement, the accompanying prospectus and in our regular filings with the SEC for additional risks which may aect us or the Shares. > There will initially be no public market for the Shares as we do not > If you elect to exercise the Stockholder Redemption Option, the cash intend to apply for quotation on Nasdaq until after the Termination payment that you receive as a result of your optional redemption will Date, and even after listing, if achieved, a liquid secondary trading be a substantial discount to the price that you paid for the Shares. market may not develop and the features of the Shares may not > Upon the sale of any individual property, holders of Shares do not have provide you with favorable liquidity options. a priority over holders of our common stock regarding return of capital. > The Shares have not been rated. > Your percentage of ownership may become diluted if we incur additional > Dividend payments on the Shares are not guaranteed. debt or issue new shares of stock or other securities, and incurrence of indebtedness and issuances of additional preferred stock or other > We operate as a holding company dependent upon the assets and securities by us may further subordinate the rights of the holders of our operations of our subsidiaries, and because of our structure, we may common stock and preferred stock. not be able to generate the funds necessary to make distributions on the Shares. > Our ability to pay dividends and/or redeem shares of Shares may be limited by Maryland law. > We will be required to terminate this oering if both our Common Stock and our Series A Preferred Stock are no longer listed on Nasdaq > You will experience dilution in your ownership percentage of Shares if you or another national securities exchange. do not participate in our dividend reinvestment plan. > The ability to redeem shares of Shares may be limited. > Our charter contains restrictions upon ownership and transfer of the Shares, which may impair the ability of holders to acquire or dispose > The Shares will bear a risk of redemption by us. of the Shares. > The cash distributions you receive may be less frequent or lower in amount than you expect. 3Risk Factors Please consult the prospectus supplement for this oering for a recitation of the risk factors of this oering. If any of the risks contained in or incorporated by reference into the prospectus supplement or the accompanying prospectus develop into actual events, our business, financial condition, liquidity, results of operations, FFO, adjusted funds from operations or our prospects could be materially and adversely aected, we may be unable to timely pay the dividends accrued on the Series C Preferred Stock (the “Shares”), the value of the Shares could decline and you may lose all or part of your investment. In addition, new risks may emerge at any time and we cannot predict such risks or estimate the extent to which they may aect our financial performance. Some statements in the prospectus supplement, including statements in the risk factors, constitute forward-looking statements. See the “Forward-Looking Statements” and “Risk Factors” sections in the prospectus supplement, the accompanying prospectus and in our regular filings with the SEC for additional risks which may aect us or the Shares. > There will initially be no public market for the Shares as we do not > If you elect to exercise the Stockholder Redemption Option, the cash intend to apply for quotation on Nasdaq until after the Termination payment that you receive as a result of your optional redemption will Date, and even after listing, if achieved, a liquid secondary trading be a substantial discount to the price that you paid for the Shares. market may not develop and the features of the Shares may not > Upon the sale of any individual property, holders of Shares do not have provide you with favorable liquidity options. a priority over holders of our common stock regarding return of capital. > The Shares have not been rated. > Your percentage of ownership may become diluted if we incur additional > Dividend payments on the Shares are not guaranteed. debt or issue new shares of stock or other securities, and incurrence of indebtedness and issuances of additional preferred stock or other > We operate as a holding company dependent upon the assets and securities by us may further subordinate the rights of the holders of our operations of our subsidiaries, and because of our structure, we may common stock and preferred stock. not be able to generate the funds necessary to make distributions on the Shares. > Our ability to pay dividends and/or redeem shares of Shares may be limited by Maryland law. > We will be required to terminate this oering if both our Common Stock and our Series A Preferred Stock are no longer listed on Nasdaq > You will experience dilution in your ownership percentage of Shares if you or another national securities exchange. do not participate in our dividend reinvestment plan. > The ability to redeem shares of Shares may be limited. > Our charter contains restrictions upon ownership and transfer of the Shares, which may impair the ability of holders to acquire or dispose > The Shares will bear a risk of redemption by us. of the Shares. > The cash distributions you receive may be less frequent or lower in amount than you expect. 3
Risk Factors (cont.) > Holders of the Shares will be subject to inflation risk. > If the properties we acquire or invest in do not produce the cash flow that we expect in order to meet our REIT minimum > An investment in the Shares bears interest rate risk. distribution requirement, we may decide to borrow funds to meet the REIT minimum distribution requirements, which could > Holders of Shares will bear reinvestment risk. adversely aect our overall financial performance. > Holders of Shares will have no control over changes in our policies > Gladstone Securities, the dealer manager in this oering, is our and operations, and have extremely limited voting rights. aliate, and we established the oering price and other terms for > Our management will have broad discretion in the use of the net the Shares pursuant to discussions between us and our aliated proceeds from this oering and may allocate the net proceeds from dealer manager; as a result, the actual value of your investment this oering in ways that you and other stockholders may not approve. may be substantially less than what you pay. > We may be unable to invest a significant portion of the net > Payment of fees to our Adviser and its aliates, including our proceeds of this oering on acceptable terms. aliated dealer manager will reduce the cash available for investment and distribution and will increase the risk that you will > We have paid, may continue to pay, or may in the future pay, not be able to recover the amount of your investment in our distributions from oering proceeds, borrowings or the sale of shares of Shares. assets to the extent our cash flow from operations or earnings are not sucient to fund declared distributions. Rates of distribution > We may have conflicts of interest with our aliates, which could to holders of our common stock and preferred stock will not result in investment decisions that are not in the best interests of necessarily be indicative of our operating results. If we make our stockholders. distributions from sources other than our cash flows from > If you fail to meet the fiduciary and other standards under ERISA operations or earnings, we will have fewer funds available for the or the Code as a result of an investment in this oering, you could acquisition of properties and your overall return may be reduced. be subject to liability and civil or criminal penalties. Gladstone Land Corporation (“LAND”) has filed a registration statement (including a prospectus) and a prospectus supplement with the SEC for the oering to which this communication relates. Before you invest, you should read the prospectus in that registration statement, the prospectus supplement and other documents that LAND has filed with the SEC for more complete information about LAND and this oering. You may get these documents for free by visiting EDGAR on the SEC Web site at www.sec.gov. Alternatively, Gladstone Securities, LAND’s dealer manager for this oering, will arrange to send you the prospectus and prospectus supplement if you request it by calling toll-free at (833) 849-5993. 4Risk Factors (cont.) > Holders of the Shares will be subject to inflation risk. > If the properties we acquire or invest in do not produce the cash flow that we expect in order to meet our REIT minimum > An investment in the Shares bears interest rate risk. distribution requirement, we may decide to borrow funds to meet the REIT minimum distribution requirements, which could > Holders of Shares will bear reinvestment risk. adversely aect our overall financial performance. > Holders of Shares will have no control over changes in our policies > Gladstone Securities, the dealer manager in this oering, is our and operations, and have extremely limited voting rights. aliate, and we established the oering price and other terms for > Our management will have broad discretion in the use of the net the Shares pursuant to discussions between us and our aliated proceeds from this oering and may allocate the net proceeds from dealer manager; as a result, the actual value of your investment this oering in ways that you and other stockholders may not approve. may be substantially less than what you pay. > We may be unable to invest a significant portion of the net > Payment of fees to our Adviser and its aliates, including our proceeds of this oering on acceptable terms. aliated dealer manager will reduce the cash available for investment and distribution and will increase the risk that you will > We have paid, may continue to pay, or may in the future pay, not be able to recover the amount of your investment in our distributions from oering proceeds, borrowings or the sale of shares of Shares. assets to the extent our cash flow from operations or earnings are not sucient to fund declared distributions. Rates of distribution > We may have conflicts of interest with our aliates, which could to holders of our common stock and preferred stock will not result in investment decisions that are not in the best interests of necessarily be indicative of our operating results. If we make our stockholders. distributions from sources other than our cash flows from > If you fail to meet the fiduciary and other standards under ERISA operations or earnings, we will have fewer funds available for the or the Code as a result of an investment in this oering, you could acquisition of properties and your overall return may be reduced. be subject to liability and civil or criminal penalties. Gladstone Land Corporation (“LAND”) has filed a registration statement (including a prospectus) and a prospectus supplement with the SEC for the oering to which this communication relates. Before you invest, you should read the prospectus in that registration statement, the prospectus supplement and other documents that LAND has filed with the SEC for more complete information about LAND and this oering. You may get these documents for free by visiting EDGAR on the SEC Web site at www.sec.gov. Alternatively, Gladstone Securities, LAND’s dealer manager for this oering, will arrange to send you the prospectus and prospectus supplement if you request it by calling toll-free at (833) 849-5993. 4
Oering Summary OFFERING LIQUIDITY OPTIONS Up to $500 million Series C Preferred Stock oering Redeemable at $22.50 per share throughout the oering of a public REIT > 10% discount to the Liquidation Preference of $25 per share > Up to an additional $150 million Series C Preferred > Our obligation to redeem the Shares is limited to the extent Stock (the “Shares”) issued through a Dividend that our Board of Directors determines that it does not have Reinvestment Plan (“DRIP”) sucient funds available or it is restricted by applicable law from making such redemption > The Shares will rank senior to Gladstone Land Corporation’s (the “Company” or “we”) Common Stock, which has traded on Nasdaq under the ticker “LAND” Nasdaq listing after the oering terminates since our 2013 IPO > We anticipate applying to list the Shares on Nasdaq or another national securities exchange within one calendar DIVIDEND year after the oering ends, but there can be no assurance that we will achieve this objective Annualized 6.00% dividend, payable monthly > There is currently no public market for the Shares, and we do > Dividends on the shares are cumulative and must be not expect one to develop prior to listing the Shares on paid in preference to dividends on our Common Stock exchange, if at all > There is no guarantee of capital preservation or continuous dividends COMMISSIONS, FEES & EXPENSES Up to 6.0% selling commission, 3.0% dealer-manager fee, OFFERING TYPE and up to 2.5% expenses Continuous Oering of Registered, > We, through Gladstone Securities, will pay all commissions Non-Listed Preferred and expenses associated with the sale of the Shares > We and Gladstone Securities will not pay selling commissions on sales to fee-based (and certain other) accounts, as described in the prospectus supplement 5Oering Summary OFFERING LIQUIDITY OPTIONS Up to $500 million Series C Preferred Stock oering Redeemable at $22.50 per share throughout the oering of a public REIT > 10% discount to the Liquidation Preference of $25 per share > Up to an additional $150 million Series C Preferred > Our obligation to redeem the Shares is limited to the extent Stock (the “Shares”) issued through a Dividend that our Board of Directors determines that it does not have Reinvestment Plan (“DRIP”) sucient funds available or it is restricted by applicable law from making such redemption > The Shares will rank senior to Gladstone Land Corporation’s (the “Company” or “we”) Common Stock, which has traded on Nasdaq under the ticker “LAND” Nasdaq listing after the oering terminates since our 2013 IPO > We anticipate applying to list the Shares on Nasdaq or another national securities exchange within one calendar DIVIDEND year after the oering ends, but there can be no assurance that we will achieve this objective Annualized 6.00% dividend, payable monthly > There is currently no public market for the Shares, and we do > Dividends on the shares are cumulative and must be not expect one to develop prior to listing the Shares on paid in preference to dividends on our Common Stock exchange, if at all > There is no guarantee of capital preservation or continuous dividends COMMISSIONS, FEES & EXPENSES Up to 6.0% selling commission, 3.0% dealer-manager fee, OFFERING TYPE and up to 2.5% expenses Continuous Oering of Registered, > We, through Gladstone Securities, will pay all commissions Non-Listed Preferred and expenses associated with the sale of the Shares > We and Gladstone Securities will not pay selling commissions on sales to fee-based (and certain other) accounts, as described in the prospectus supplement 5

DIVERSIFIED PORTFOLIO TRANSPARENCY The Company owns a portfolio of 113 The Company went public in 2013 and farms with approximately 88,000 acres has been in business since 1997 across ten states valued at approximately $885 million, as of > Common stock is listed on Nasdaq February 19, 2019 under “LAND” > Most farms have been farmed for > The Company files annual, quarterly, decades, and most farms have their and periodic reports with the SEC own water sources > Because the Shares are not traded, it may be dicult to determine the value of Investment your Shares or your return on investment INFLATION Features The prices of produce crops have historically outpaced inflation, according to DIVIDEND COVERAGE 1 data from the U.S. Department of Labor In 2019, Gladstone Land covered its preferred > The Company primarily owns farms that stock dividends by approximately 2.86x grow fresh produce crops, some nut (i.e., earned $2.86 of AFFO to pay every orchards, and only a few that grow corn, $1 of preferred dividends) wheat, or soy > The Company is unable to pay distributions > Management seeks to structure leases to common stockholders unless it has with contractual rent escalators. paid dividends on all Preferred Stock There can be no guarantee that rental rates on lease renewals will continue to increase Notes: 1. Data from 1980-2017 6 Source: http://www.bls.gov/cpiDIVERSIFIED PORTFOLIO TRANSPARENCY The Company owns a portfolio of 113 The Company went public in 2013 and farms with approximately 88,000 acres has been in business since 1997 across ten states valued at approximately $885 million, as of > Common stock is listed on Nasdaq February 19, 2019 under “LAND” > Most farms have been farmed for > The Company files annual, quarterly, decades, and most farms have their and periodic reports with the SEC own water sources > Because the Shares are not traded, it may be dicult to determine the value of Investment your Shares or your return on investment INFLATION Features The prices of produce crops have historically outpaced inflation, according to DIVIDEND COVERAGE 1 data from the U.S. Department of Labor In 2019, Gladstone Land covered its preferred > The Company primarily owns farms that stock dividends by approximately 2.86x grow fresh produce crops, some nut (i.e., earned $2.86 of AFFO to pay every orchards, and only a few that grow corn, $1 of preferred dividends) wheat, or soy > The Company is unable to pay distributions > Management seeks to structure leases to common stockholders unless it has with contractual rent escalators. paid dividends on all Preferred Stock There can be no guarantee that rental rates on lease renewals will continue to increase Notes: 1. Data from 1980-2017 6 Source: http://www.bls.gov/cpi
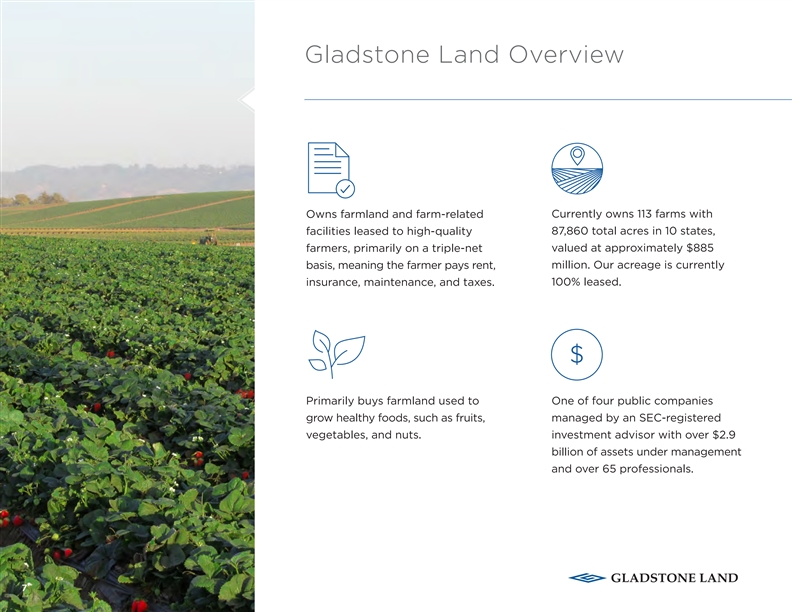
Gladstone Land Overview Owns farmland and farm-related Currently owns 113 farms with facilities leased to high-quality 87,860 total acres in 10 states, farmers, primarily on a triple-net valued at approximately $885 basis, meaning the farmer pays rent, million. Our acreage is currently insurance, maintenance, and taxes. 100% leased. $ Primarily buys farmland used to One of four public companies grow healthy foods, such as fruits, managed by an SEC-registered vegetables, and nuts. investment advisor with over $2.9 billion of assets under management and over 65 professionals. 7Gladstone Land Overview Owns farmland and farm-related Currently owns 113 farms with facilities leased to high-quality 87,860 total acres in 10 states, farmers, primarily on a triple-net valued at approximately $885 basis, meaning the farmer pays rent, million. Our acreage is currently insurance, maintenance, and taxes. 100% leased. $ Primarily buys farmland used to One of four public companies grow healthy foods, such as fruits, managed by an SEC-registered vegetables, and nuts. investment advisor with over $2.9 billion of assets under management and over 65 professionals. 7
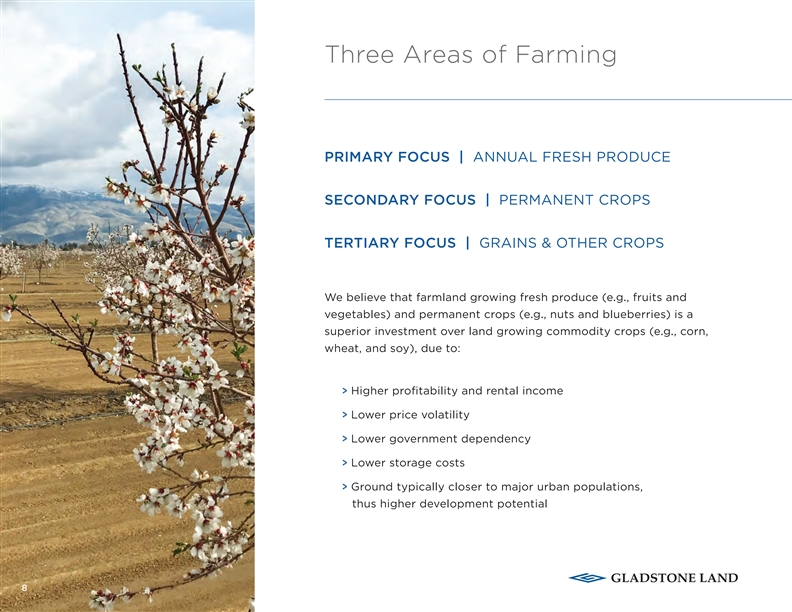
Three Areas of Farming PRIMARY FOCUS | ANNUAL FRESH PRODUCE SECONDARY FOCUS | PERMANENT CROPS TERTIARY FOCUS | GRAINS & OTHER CROPS We believe that farmland growing fresh produce (e.g., fruits and vegetables) and permanent crops (e.g., nuts and blueberries) is a superior investment over land growing commodity crops (e.g., corn, wheat, and soy), due to: > Higher profitability and rental income > Lower price volatility > Lower government dependency > Lower storage costs > Ground typically closer to major urban populations, thus higher development potential 8Three Areas of Farming PRIMARY FOCUS | ANNUAL FRESH PRODUCE SECONDARY FOCUS | PERMANENT CROPS TERTIARY FOCUS | GRAINS & OTHER CROPS We believe that farmland growing fresh produce (e.g., fruits and vegetables) and permanent crops (e.g., nuts and blueberries) is a superior investment over land growing commodity crops (e.g., corn, wheat, and soy), due to: > Higher profitability and rental income > Lower price volatility > Lower government dependency > Lower storage costs > Ground typically closer to major urban populations, thus higher development potential 8
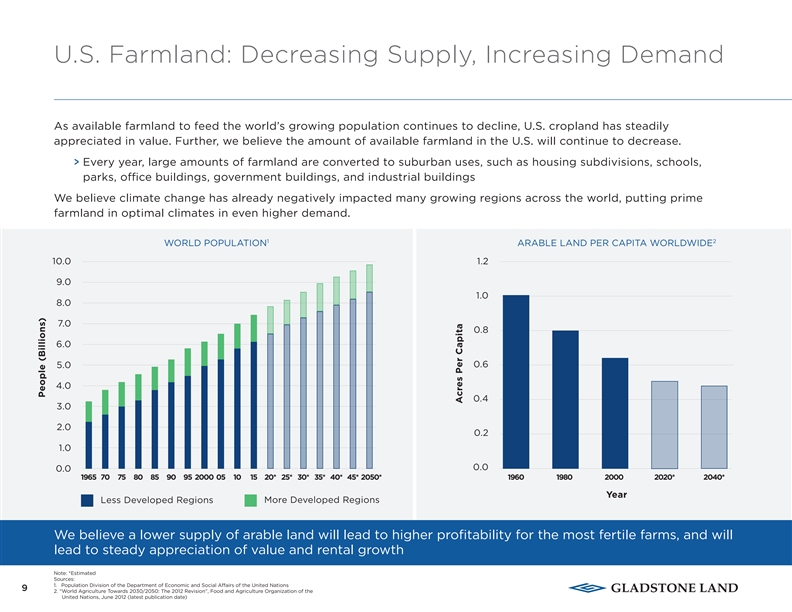
U.S. Farmland: Decreasing Supply, Increasing Demand As available farmland to feed the world’s growing population continues to decline, U.S. cropland has steadily appreciated in value . Further, we believe the amount of available farmland in the U.S. will continue to decrease. > Every year, large amounts of farmland are converted to suburban uses, such as housing subdivisions, schools, parks, oce buildings, government buildings, and industrial buildings We believe climate change has already negatively impacted many growing regions across the world, putting prime farmland in optimal climates in even higher demand. 1 2 WORLD POPULATION ARABLE LAND PER CAPITA WORLDWIDE 10.0 1.2 9.0 1.0 8.0 7.0 0.8 6.0 0.6 5.0 4.0 0.4 3.0 2.0 0.2 1.0 0.0 0.0 1965 70 75 80 85 90 95 2000 05 10 15 20* 25* 30* 35* 40* 45* 2050* 1960 1980 2000 2020* 2040* Year Less Developed Regions More Developed Regions We believe a lower supply of arable land will lead to higher profitability for the most fertile farms, and will lead to steady appreciation of value and rental growth Note: *Estimated Sources: 1. Population Division of the Department of Economic and Social Aairs of the United Nations 9 2. “World Agriculture Towards 2030/2050: The 2012 Revision”, Food and Agriculture Organization of the United Nations, June 2012 (latest publication date) People (Billions) Acres Per CapitaU.S. Farmland: Decreasing Supply, Increasing Demand As available farmland to feed the world’s growing population continues to decline, U.S. cropland has steadily appreciated in value . Further, we believe the amount of available farmland in the U.S. will continue to decrease. > Every year, large amounts of farmland are converted to suburban uses, such as housing subdivisions, schools, parks, oce buildings, government buildings, and industrial buildings We believe climate change has already negatively impacted many growing regions across the world, putting prime farmland in optimal climates in even higher demand. 1 2 WORLD POPULATION ARABLE LAND PER CAPITA WORLDWIDE 10.0 1.2 9.0 1.0 8.0 7.0 0.8 6.0 0.6 5.0 4.0 0.4 3.0 2.0 0.2 1.0 0.0 0.0 1965 70 75 80 85 90 95 2000 05 10 15 20* 25* 30* 35* 40* 45* 2050* 1960 1980 2000 2020* 2040* Year Less Developed Regions More Developed Regions We believe a lower supply of arable land will lead to higher profitability for the most fertile farms, and will lead to steady appreciation of value and rental growth Note: *Estimated Sources: 1. Population Division of the Department of Economic and Social Aairs of the United Nations 9 2. “World Agriculture Towards 2030/2050: The 2012 Revision”, Food and Agriculture Organization of the United Nations, June 2012 (latest publication date) People (Billions) Acres Per Capita
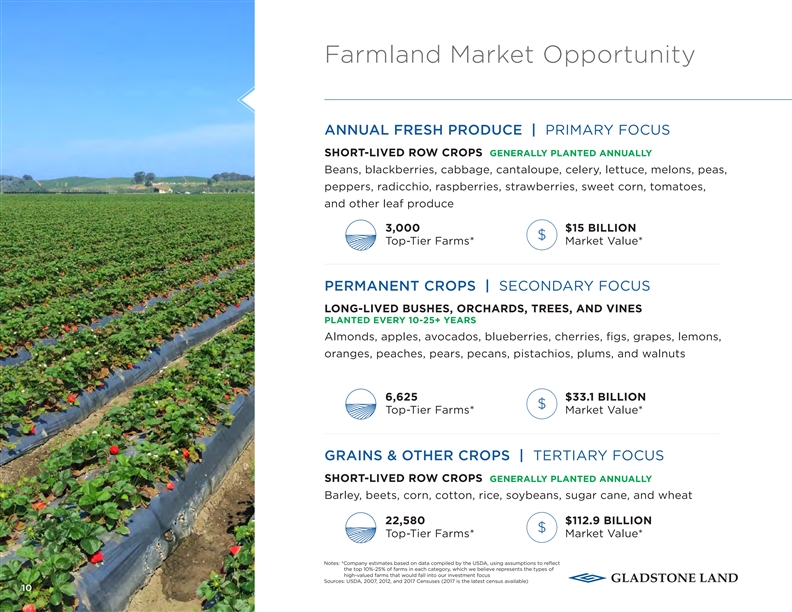
Farmland Market Opportunity ANNUAL FRESH PRODUCE | PRIMARY FOCUS SHORT-LIVED ROW CROPS GENERALLY PLANTED ANNUALLY Beans, blackberries, cabbage, cantaloupe, celery, lettuce, melons, peas, peppers, radicchio, raspberries, strawberries, sweet corn, tomatoes, and other leaf pr oduce 3,000 $15 BILLION $ Top-Tier Farms* Market Value* PERMANENT CROPS | SECONDARY FOCUS LONG-LIVED BUSHES, ORCHARDS, TREES, AND VINES PLANTED EVERY 10-25+ YEARS Almonds, apples, avocados, blueberries, cherries, figs, grapes, lemons, oranges, peaches, pears, pecans, pistachios, plums, and walnuts 6,625 $33.1 BILLION $ Top-Tier Farms* Market Value* GRAINS & OTHER CROPS | TERTIARY FOCUS SHORT-LIVED ROW CROPS GENERALLY PLANTED ANNUALLY Barley, beets, corn, cotton, rice, soybeans, sugar cane, and wheat 22,580 $112.9 BILLION $ Top-Tier Farms* Market Value* Notes: *Company estimates based on data compiled by the USDA, using assumptions to reflect the top 10%-25% of farms in each category, which we believe represents the types of high-valued farms that would fall into our investment focus Sources: USDA, 2007, 2012, and 2017 Censuses (2017 is the latest census available) 10Farmland Market Opportunity ANNUAL FRESH PRODUCE | PRIMARY FOCUS SHORT-LIVED ROW CROPS GENERALLY PLANTED ANNUALLY Beans, blackberries, cabbage, cantaloupe, celery, lettuce, melons, peas, peppers, radicchio, raspberries, strawberries, sweet corn, tomatoes, and other leaf pr oduce 3,000 $15 BILLION $ Top-Tier Farms* Market Value* PERMANENT CROPS | SECONDARY FOCUS LONG-LIVED BUSHES, ORCHARDS, TREES, AND VINES PLANTED EVERY 10-25+ YEARS Almonds, apples, avocados, blueberries, cherries, figs, grapes, lemons, oranges, peaches, pears, pecans, pistachios, plums, and walnuts 6,625 $33.1 BILLION $ Top-Tier Farms* Market Value* GRAINS & OTHER CROPS | TERTIARY FOCUS SHORT-LIVED ROW CROPS GENERALLY PLANTED ANNUALLY Barley, beets, corn, cotton, rice, soybeans, sugar cane, and wheat 22,580 $112.9 BILLION $ Top-Tier Farms* Market Value* Notes: *Company estimates based on data compiled by the USDA, using assumptions to reflect the top 10%-25% of farms in each category, which we believe represents the types of high-valued farms that would fall into our investment focus Sources: USDA, 2007, 2012, and 2017 Censuses (2017 is the latest census available) 10

Investment Focus WE FOCUS ON ACQUIRING HIGH-VALUE FARMLAND THAT WE BELIEVE WILL GENERATE ABOVE-AVERAGE REVENUES AND PROFITS Adequate & clean water supply with Excellent weather combined with Locations in established rental fertile soil that is rich in nutrients long growing seasons that provide markets with a prominent farming adequate sunshine and low wind presence and an abundance of conditions strong operators 11Investment Focus WE FOCUS ON ACQUIRING HIGH-VALUE FARMLAND THAT WE BELIEVE WILL GENERATE ABOVE-AVERAGE REVENUES AND PROFITS Adequate & clean water supply with Excellent weather combined with Locations in established rental fertile soil that is rich in nutrients long growing seasons that provide markets with a prominent farming adequate sunshine and low wind presence and an abundance of conditions strong operators 11
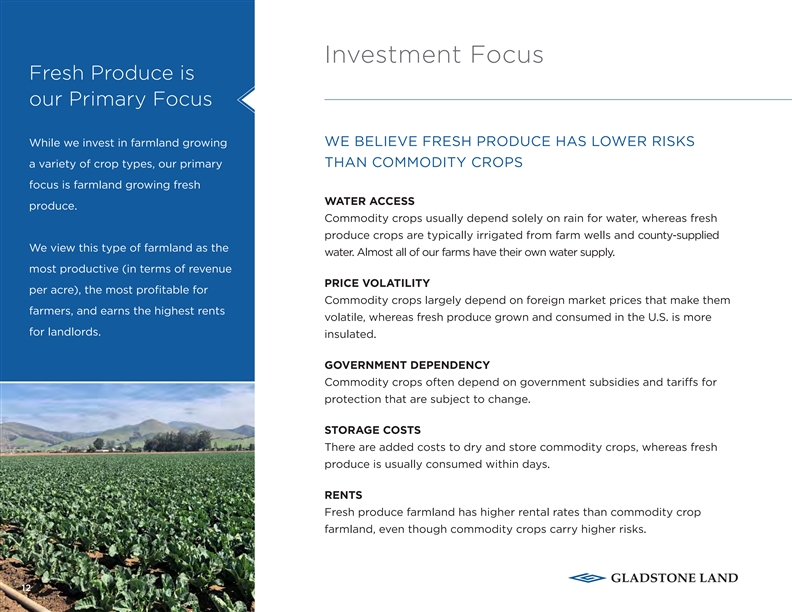
Investment Focus Fresh Produce is our Primary Focus WE BELIEVE FRESH PRODUCE HAS LOWER RISKS While we invest in farmland growing THAN COMMODITY CROPS a variety of crop types, our primary focus is farmland growing fresh WATER ACCESS produce . Commodity crops usually depend solely on rain for water, whereas fresh produce crops are typically irrigated from farm wells and county-supplied We view this type of farmland as the water. Almost all of our farms have their own water supply. most productive (in terms of revenue PRICE VOLATILITY per acre), the most profitable for Commodity crops largely depend on foreign market prices that make them farmers, and earns the highest rents volatile, whereas fresh produce grown and consumed in the U.S. is more for landlords. insulated. GOVERNMENT DEPENDENCY Commodity crops often depend on government subsidies and taris for protection that are subject to change. STORAGE COSTS There are added costs to dry and store commodity crops, whereas fresh produce is usually consumed within days. RENTS Fresh produce farmland has higher rental rates than commodity crop farmland, even though commodity crops carry higher risks. 12Investment Focus Fresh Produce is our Primary Focus WE BELIEVE FRESH PRODUCE HAS LOWER RISKS While we invest in farmland growing THAN COMMODITY CROPS a variety of crop types, our primary focus is farmland growing fresh WATER ACCESS produce . Commodity crops usually depend solely on rain for water, whereas fresh produce crops are typically irrigated from farm wells and county-supplied We view this type of farmland as the water. Almost all of our farms have their own water supply. most productive (in terms of revenue PRICE VOLATILITY per acre), the most profitable for Commodity crops largely depend on foreign market prices that make them farmers, and earns the highest rents volatile, whereas fresh produce grown and consumed in the U.S. is more for landlords. insulated. GOVERNMENT DEPENDENCY Commodity crops often depend on government subsidies and taris for protection that are subject to change. STORAGE COSTS There are added costs to dry and store commodity crops, whereas fresh produce is usually consumed within days. RENTS Fresh produce farmland has higher rental rates than commodity crop farmland, even though commodity crops carry higher risks. 12
Investment Focus WE SEEK TO ACQUIRE HIGH-VALUE FARMLAND AND FARM-RELATED FACILITIES THAT WE LEASE TO CORPORATE AND INDEPENDENT FARMERS, PRIMARILY ON A TRIPLE-NET LEASE BASIS PROPERTY TYPES TRANSACTION SIZES High-value cropland with on-site water sources $2M to $50M+ LOCATIONS LEASE TERMS Regions with established rental markets and an 5 to 10+ years, with annual escalations and upward abundance of strong operators market resets . There can be no guarantee that rental rates on lease renewals will continue to increase PRIMARY FOCUS Annual fresh produce (most fruits and vegetables) RENTAL PAYMENTS (i) Fixed cash rent, or (ii) fixed cash rent plus a percentage of the farm’s gross revenues (participating SECONDARY FOCUS leases) Permanent crops (blueberries, nuts, etc.) TENANT-FARMERS Corporate and independent tenants with strong operating histories and substantial farming resources 13Investment Focus WE SEEK TO ACQUIRE HIGH-VALUE FARMLAND AND FARM-RELATED FACILITIES THAT WE LEASE TO CORPORATE AND INDEPENDENT FARMERS, PRIMARILY ON A TRIPLE-NET LEASE BASIS PROPERTY TYPES TRANSACTION SIZES High-value cropland with on-site water sources $2M to $50M+ LOCATIONS LEASE TERMS Regions with established rental markets and an 5 to 10+ years, with annual escalations and upward abundance of strong operators market resets . There can be no guarantee that rental rates on lease renewals will continue to increase PRIMARY FOCUS Annual fresh produce (most fruits and vegetables) RENTAL PAYMENTS (i) Fixed cash rent, or (ii) fixed cash rent plus a percentage of the farm’s gross revenues (participating SECONDARY FOCUS leases) Permanent crops (blueberries, nuts, etc.) TENANT-FARMERS Corporate and independent tenants with strong operating histories and substantial farming resources 13
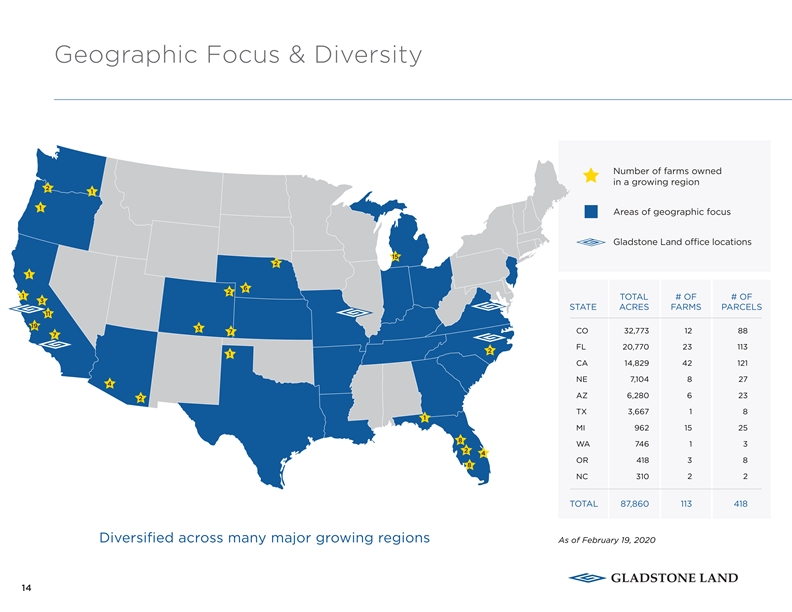
Geographic Focus & Diversity Number of farms owned in a growing region 2 1 1 Areas of geographic focus Gladstone Land oce locations 15 2 1 6 2 1 TOTAL # OF # OF 3 STATE ACRES FARMS PARCELS 11 19 3 CO 32,773 12 88 7 7 FL 20,770 23 113 2 1 CA 14,829 42 121 NE 7,104 8 27 4 AZ 6,280 6 23 2 TX 3,667 1 8 1 MI 962 15 25 8 WA 746 1 3 2 4 OR 418 3 8 8 NC 310 2 2 TOTAL 87,860 113 418 Diversified across many major growing regions As of February 19, 2020 14Geographic Focus & Diversity Number of farms owned in a growing region 2 1 1 Areas of geographic focus Gladstone Land oce locations 15 2 1 6 2 1 TOTAL # OF # OF 3 STATE ACRES FARMS PARCELS 11 19 3 CO 32,773 12 88 7 7 FL 20,770 23 113 2 1 CA 14,829 42 121 NE 7,104 8 27 4 AZ 6,280 6 23 2 TX 3,667 1 8 1 MI 962 15 25 8 WA 746 1 3 2 4 OR 418 3 8 8 NC 310 2 2 TOTAL 87,860 113 418 Diversified across many major growing regions As of February 19, 2020 14

Selected Properties PALM CITY, FLORIDA OXNARD, CALIFORNIA WATSONVILLE, CALIFORNIA Snap Peas Strawberries Raspberries COALINGA, CALIFORNIA ARVIN, CALIFORNIA OKEECHOBEE, FLORIDA Pistachios Almond Trees Cabbage 15Selected Properties PALM CITY, FLORIDA OXNARD, CALIFORNIA WATSONVILLE, CALIFORNIA Snap Peas Strawberries Raspberries COALINGA, CALIFORNIA ARVIN, CALIFORNIA OKEECHOBEE, FLORIDA Pistachios Almond Trees Cabbage 15
Underwriting Process DUAL-FOCUSED UNDERWRITING PROCESS FOR EACH NEW INVESTMENT, LEVERAGING OUR MANAGEMENT TEAM’S EXTENSIVE EXPERIENCE IN CREDIT UNDERWRITING AND KNOWLEDGE OF FARMLAND DUE DILIGENCE ON THE FARM DUE DILIGENCE ON THE TENANT Appraisal on each property by an Detailed underwriting of the farming independent licensed expert in farmland tenant’s operations appraising Investigate the management of the Visit property to ensure that the farm is farming operations in an active rental market Determine the tenant’s ability to sell Water and well testing to determine their crops availability of water Evaluate the labor needs of the tenant Soil tests to determine quality Evaluate the probability of the tenant Zoning and title report to assure there missing future rental payments are no deed problems (probability of default) Leading to high quality farms with strong, established tenants 16Underwriting Process DUAL-FOCUSED UNDERWRITING PROCESS FOR EACH NEW INVESTMENT, LEVERAGING OUR MANAGEMENT TEAM’S EXTENSIVE EXPERIENCE IN CREDIT UNDERWRITING AND KNOWLEDGE OF FARMLAND DUE DILIGENCE ON THE FARM DUE DILIGENCE ON THE TENANT Appraisal on each property by an Detailed underwriting of the farming independent licensed expert in farmland tenant’s operations appraising Investigate the management of the Visit property to ensure that the farm is farming operations in an active rental market Determine the tenant’s ability to sell Water and well testing to determine their crops availability of water Evaluate the labor needs of the tenant Soil tests to determine quality Evaluate the probability of the tenant Zoning and title report to assure there missing future rental payments are no deed problems (probability of default) Leading to high quality farms with strong, established tenants 16

Growth Opportunity 14% Institutional Ownership U.S. FARM OWNERSHIP: 1 A FRAGMENTED INDUSTRY 2 Total U.S. farmland value is approximately $2.4 trillion Approximately 62% of U.S. farm operators are over 55 86% Family Ownership 1 years of age, and the average age is 58 years old 40% of all U.S. farm acreage is leased to and operated 1 by non-owners RECENT ACQUISITIONS WE TARGET FAMILY-OWNED FARMS AGGREGATE PERIOD PROPERTY NO. OF PRIMARY GROSS PURCHASE LOCATIONS FARMS CROP(S) ACRES PRICE ($M) Target Purchase Price: $2 – $50M+ (relatively small for most institutions) Q1 2019 NE 1 Edible beans & popcorn 695 $2.4 Q2 2019 CA & MI 12 Blueberries, cranberries, 1,986 $45.5 Oer sale-leaseback opportunities to allow olives (olive oil), & pistachios the seller to continue farming the land Q3 2019 CA & FL 7 Pistachios, sod, strawberries, 5,700 $153.3 vegetables, water retention, & wine grapes Able to oer shares of our operating partnership to allow for a tax-free exchange Q4 2019 CA & NE 6 Corn, edible beans, 4,949 $51.7 pistachios, & soybeans 2 Q1 2020* CO Sugar beets, edible 1,325 $7.5 Note: *As of February 19, 2020 Sources: beans, potatoes, & corn 1. USDA National Agricultural Statistics Service, Census of Agriculture, 2017 (latest published data) 2. US Department of Agriculture; Economic Research Service; 2018 17Growth Opportunity 14% Institutional Ownership U.S. FARM OWNERSHIP: 1 A FRAGMENTED INDUSTRY 2 Total U.S. farmland value is approximately $2.4 trillion Approximately 62% of U.S. farm operators are over 55 86% Family Ownership 1 years of age, and the average age is 58 years old 40% of all U.S. farm acreage is leased to and operated 1 by non-owners RECENT ACQUISITIONS WE TARGET FAMILY-OWNED FARMS AGGREGATE PERIOD PROPERTY NO. OF PRIMARY GROSS PURCHASE LOCATIONS FARMS CROP(S) ACRES PRICE ($M) Target Purchase Price: $2 – $50M+ (relatively small for most institutions) Q1 2019 NE 1 Edible beans & popcorn 695 $2.4 Q2 2019 CA & MI 12 Blueberries, cranberries, 1,986 $45.5 Oer sale-leaseback opportunities to allow olives (olive oil), & pistachios the seller to continue farming the land Q3 2019 CA & FL 7 Pistachios, sod, strawberries, 5,700 $153.3 vegetables, water retention, & wine grapes Able to oer shares of our operating partnership to allow for a tax-free exchange Q4 2019 CA & NE 6 Corn, edible beans, 4,949 $51.7 pistachios, & soybeans 2 Q1 2020* CO Sugar beets, edible 1,325 $7.5 Note: *As of February 19, 2020 Sources: beans, potatoes, & corn 1. USDA National Agricultural Statistics Service, Census of Agriculture, 2017 (latest published data) 2. US Department of Agriculture; Economic Research Service; 2018 17
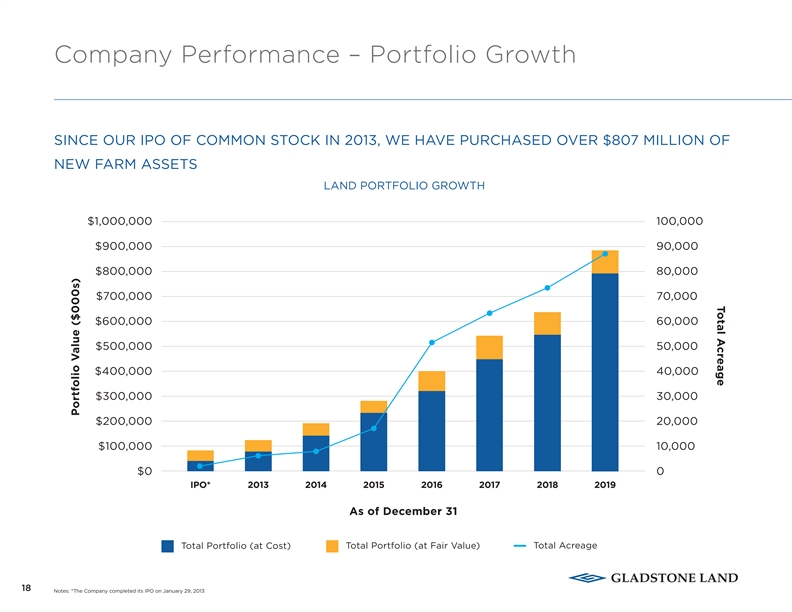
Total Acreage Company Performance – Portfolio Growth SINCE OUR IPO OF COMMON STOCK IN 2013, WE HAVE PURCHASED OVER $807 MILLION OF NEW FARM ASSETS LAND PORTFOLIO GROWTH $1,000,000 100,000 $900,000 90,000 $800,000 80,000 $700,000 70,000 $600,000 60,000 $500,000 50,000 $400,000 40,000 $300,000 30,000 $200,000 20,000 $100,000 10,000 $0 0 IPO* 2013 2014 2015 2016 2017 2018 2019 As of December 31 Total Acreage Total Portfolio (at Cost) Total Portfolio (at Fair Value) 18 Notes: *The Company completed its IPO on January 29, 2013 Portfolio Value ($000s)Total Acreage Company Performance – Portfolio Growth SINCE OUR IPO OF COMMON STOCK IN 2013, WE HAVE PURCHASED OVER $807 MILLION OF NEW FARM ASSETS LAND PORTFOLIO GROWTH $1,000,000 100,000 $900,000 90,000 $800,000 80,000 $700,000 70,000 $600,000 60,000 $500,000 50,000 $400,000 40,000 $300,000 30,000 $200,000 20,000 $100,000 10,000 $0 0 IPO* 2013 2014 2015 2016 2017 2018 2019 As of December 31 Total Acreage Total Portfolio (at Cost) Total Portfolio (at Fair Value) 18 Notes: *The Company completed its IPO on January 29, 2013 Portfolio Value ($000s)
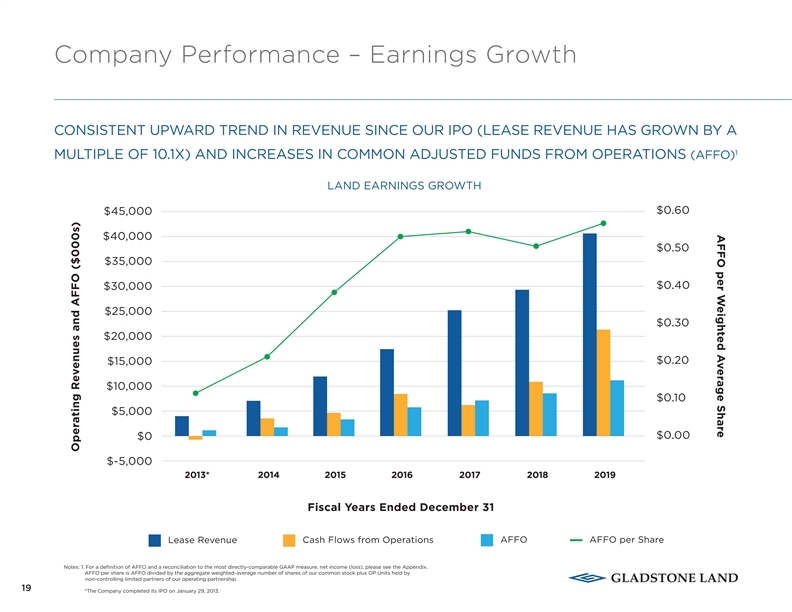
AFFO per Weighted Average Share Company Performance – Earnings Growth CONSISTENT UPWARD TREND IN REVENUE SINCE OUR IPO (LEASE REVENUE HAS GROWN BY A 1 MULTIPLE OF 10.1X) AND INCREASES IN COMMON ADJUSTED FUNDS FROM OPERATIONS (AFFO) LAND EARNINGS GROWTH $0.60 $45,000 $40,000 $0.50 $35,000 $0.40 $30,000 $25,000 $0.30 $20,000 $0.20 $15,000 $10,000 $0.10 $5,000 $0.00 $0 $-5,000 2013* 2014 2015 2016 2017 2018 2019 Fiscal Years Ended December 31 Lease Revenue Cash Flows from Operations AFFO AFFO per Share Notes: 1. For a definition of AFFO and a reconciliation to the most directly-comparable GAAP measure, net income (loss), please see the Appendix. AFFO per share is AFFO divided by the aggregate weighted-average number of shares of our common stock plus OP Units held by non- controlling limited partners of our operating partnership. 19 *The Company completed its IPO on January 29, 2013. Operating Revenues and AFFO ($000s)AFFO per Weighted Average Share Company Performance – Earnings Growth CONSISTENT UPWARD TREND IN REVENUE SINCE OUR IPO (LEASE REVENUE HAS GROWN BY A 1 MULTIPLE OF 10.1X) AND INCREASES IN COMMON ADJUSTED FUNDS FROM OPERATIONS (AFFO) LAND EARNINGS GROWTH $0.60 $45,000 $40,000 $0.50 $35,000 $0.40 $30,000 $25,000 $0.30 $20,000 $0.20 $15,000 $10,000 $0.10 $5,000 $0.00 $0 $-5,000 2013* 2014 2015 2016 2017 2018 2019 Fiscal Years Ended December 31 Lease Revenue Cash Flows from Operations AFFO AFFO per Share Notes: 1. For a definition of AFFO and a reconciliation to the most directly-comparable GAAP measure, net income (loss), please see the Appendix. AFFO per share is AFFO divided by the aggregate weighted-average number of shares of our common stock plus OP Units held by non- controlling limited partners of our operating partnership. 19 *The Company completed its IPO on January 29, 2013. Operating Revenues and AFFO ($000s)

Valuation of Farms While most REITs do not disclose the fair value of their properties, we provide updated valuations of our farms in our quarterly filings with the SEC to show the estimated fair value of our farmland portfolio At least once every three years, we will have each of our farms appraised by an independent, third-party $ agricultural appraiser > We use appraisers who are certified by a society of agricultural appraisers and are trained in the methods used by farm appraisers > Between appraisals, the farmland values are determined by our valuation sta, using updated market data obtained from third-party appraisal reports on other properties in the same regions AS OF DECEMBER 31, 2019, THE FAIR VALUE OF OUR FARMLAND PORTFOLIO WAS DETERMINED: VALUATION METHOD # OF FARMS TOTAL FAIR VALUE ($M) % OF TOTAL FAIR VALUE Purchase Price 26 $252.90 28.8% Third-Party Appraisal 85 $624.60 71.2% TOTAL 111 $877.50 100.0% 20Valuation of Farms While most REITs do not disclose the fair value of their properties, we provide updated valuations of our farms in our quarterly filings with the SEC to show the estimated fair value of our farmland portfolio At least once every three years, we will have each of our farms appraised by an independent, third-party $ agricultural appraiser > We use appraisers who are certified by a society of agricultural appraisers and are trained in the methods used by farm appraisers > Between appraisals, the farmland values are determined by our valuation sta, using updated market data obtained from third-party appraisal reports on other properties in the same regions AS OF DECEMBER 31, 2019, THE FAIR VALUE OF OUR FARMLAND PORTFOLIO WAS DETERMINED: VALUATION METHOD # OF FARMS TOTAL FAIR VALUE ($M) % OF TOTAL FAIR VALUE Purchase Price 26 $252.90 28.8% Third-Party Appraisal 85 $624.60 71.2% TOTAL 111 $877.50 100.0% 20
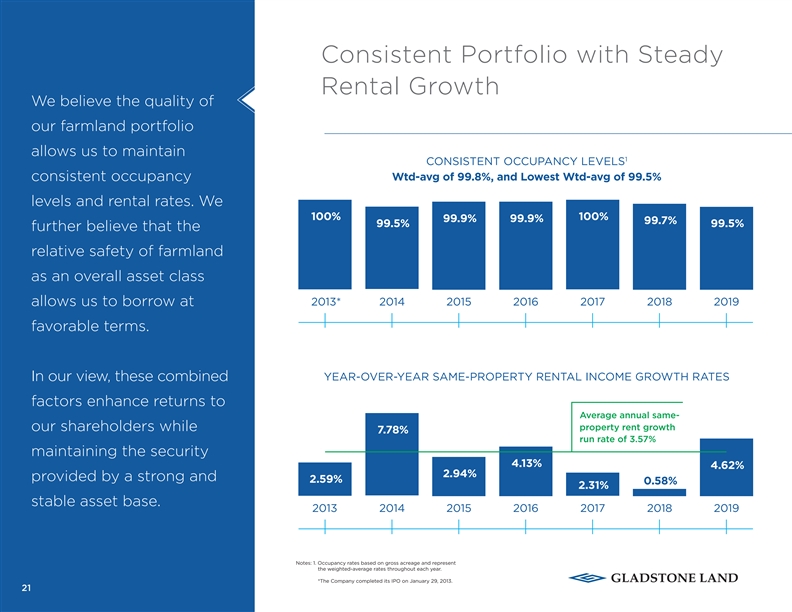
Consistent Portfolio with Steady Rental Growth We believe the quality of our farmland portfolio allows us to maintain 1 CONSISTENT OCCUPANCY LEVELS consistent occupancy Wtd-avg of 99.8%, and Lowest Wtd-avg of 99.5% levels and rental rates. We 100% 100% 99.9% 99.9% 99.7% 99.5% 99.5% further believe that the relative safety of farmland as an overall asset class allows us to borrow at 2013* 2014 2015 2016 2017 2018 2019 favorable terms. In our view, these combined YEAR-OVER-YEAR SAME-PROPERTY RENTAL INCOME GROWTH RATES factors enhance returns to Average annual same- property rent growth our shareholders while 7.78% run rate of 3.57% maintaining the security 4.13% 4.62% 2.94% provided by a strong and 2.59% 0.58% 2.31% stable asset base. 2013 2014 2015 2016 2017 2018 2019 Notes: 1. Occupancy rates based on gross acreage and represent the weighted-average rates throughout each year. *The Company completed its IPO on January 29, 2013. 21Consistent Portfolio with Steady Rental Growth We believe the quality of our farmland portfolio allows us to maintain 1 CONSISTENT OCCUPANCY LEVELS consistent occupancy Wtd-avg of 99.8%, and Lowest Wtd-avg of 99.5% levels and rental rates. We 100% 100% 99.9% 99.9% 99.7% 99.5% 99.5% further believe that the relative safety of farmland as an overall asset class allows us to borrow at 2013* 2014 2015 2016 2017 2018 2019 favorable terms. In our view, these combined YEAR-OVER-YEAR SAME-PROPERTY RENTAL INCOME GROWTH RATES factors enhance returns to Average annual same- property rent growth our shareholders while 7.78% run rate of 3.57% maintaining the security 4.13% 4.62% 2.94% provided by a strong and 2.59% 0.58% 2.31% stable asset base. 2013 2014 2015 2016 2017 2018 2019 Notes: 1. Occupancy rates based on gross acreage and represent the weighted-average rates throughout each year. *The Company completed its IPO on January 29, 2013. 21

Capital Structure Overview 1 CURRENT CAPITAL STRUCTURE CAPITAL STRUCTURE DETAILS @ 12/31/2019 (AS OF 12/31/2019) WTD-AVG $1,000,000 DOLLARS IN 000s, WTD-AVG TERM WTD-AVG FIXED PRICE 2 EXCEPT STOCK PRICE TO MATURITY (YRS) RATE TERM (YRS) VALUE Variable-rate Debt $900,000 0.0% Lines of credit 4.3 L + 2.00% N/A $100 $800,000 $100 Variable-rate Debt $700,000 Net Fixed-rate Debt Notes and bonds payable – principal 10.5 3.595% 6.0 $484,950 52.6% Less cash and cash equivalents (13,688) $600,000 Net Fixed-rate Debt $471,262 $500,000 Term Preferred Stock Series A – shares outstanding 1,150,000 3.3% Series A stock price $25.70 $400,000 Term Preferred Stock 1.7 6.201% 1.7 $29,555 $300,000 Preferred Equity Series B – shares outstanding 4,755,869 13.3% Series B – fair value $25.00 $200,000 Preferred Equity N/A Perpetuity $118,897 6.000% $100,000 Common Equity (3) Diluted common shares outstanding 21,224,961 30.8% $0 Common stock price $12.97 Total = $895.1M Common Equity N/A N/A $275,288 4.126% TOTAL ENTERPRISE VALUE $895,101 CURRENT LENDERS Notes: 1. Stock prices for the Series A Term Preferred Stock and the common stock represent the respective closing stock prices per share as of the measurement date. Fair value of the Series B Preferred Stock determined with the assistance of an unrelated third-party valuation expert, which value equals the security’s liquidation value. 2. Rate on certain fixed-rate debt is shown net of expected interest patronage, or refunded interest. Rate on the Series A Term Preferred Stock represents the eective yield based on the stock’s closing stock price as of the measurement date. Rate on the common stock represents the resulting yield based on the dividend in place and the closing stock price as of the measurement date. 3. Includes OP Units held by non-controlling OP Unitholders. 22Capital Structure Overview 1 CURRENT CAPITAL STRUCTURE CAPITAL STRUCTURE DETAILS @ 12/31/2019 (AS OF 12/31/2019) WTD-AVG $1,000,000 DOLLARS IN 000s, WTD-AVG TERM WTD-AVG FIXED PRICE 2 EXCEPT STOCK PRICE TO MATURITY (YRS) RATE TERM (YRS) VALUE Variable-rate Debt $900,000 0.0% Lines of credit 4.3 L + 2.00% N/A $100 $800,000 $100 Variable-rate Debt $700,000 Net Fixed-rate Debt Notes and bonds payable – principal 10.5 3.595% 6.0 $484,950 52.6% Less cash and cash equivalents (13,688) $600,000 Net Fixed-rate Debt $471,262 $500,000 Term Preferred Stock Series A – shares outstanding 1,150,000 3.3% Series A stock price $25.70 $400,000 Term Preferred Stock 1.7 6.201% 1.7 $29,555 $300,000 Preferred Equity Series B – shares outstanding 4,755,869 13.3% Series B – fair value $25.00 $200,000 Preferred Equity N/A Perpetuity $118,897 6.000% $100,000 Common Equity (3) Diluted common shares outstanding 21,224,961 30.8% $0 Common stock price $12.97 Total = $895.1M Common Equity N/A N/A $275,288 4.126% TOTAL ENTERPRISE VALUE $895,101 CURRENT LENDERS Notes: 1. Stock prices for the Series A Term Preferred Stock and the common stock represent the respective closing stock prices per share as of the measurement date. Fair value of the Series B Preferred Stock determined with the assistance of an unrelated third-party valuation expert, which value equals the security’s liquidation value. 2. Rate on certain fixed-rate debt is shown net of expected interest patronage, or refunded interest. Rate on the Series A Term Preferred Stock represents the eective yield based on the stock’s closing stock price as of the measurement date. Rate on the common stock represents the resulting yield based on the dividend in place and the closing stock price as of the measurement date. 3. Includes OP Units held by non-controlling OP Unitholders. 22

Gladstone Land | Executive Management DAVID GLADSTONE | CHAIRMAN & CEO JAY BECKHORN | TREASURER > Chairman and CEO since inception > Treasurer since January 2015 > Former owner of Coastal Berry, one of the largest > Former Senior Vice President with Sunrise Senior strawberry farm operations in CA (1997-2004) Living (2000-2008) > Former Chairman of American Capital (Nasdaq: ACAS) > Over 25 years of experience in securing debt financing (1997-2001) for real estate properties > Former Chairman and CEO of Allied Capital Corporation (NYSE: ALD) (1974-1997) JOHN KENT | MANAGING DIRECTOR (CAPITAL MARKETS) > Over 30 years of experience in the farming industry > Joined Gladstone Management in 2017 > Formerly in investment banking at UBS, Nomura and TERRY LEE BRUBAKER | VICE CHAIRMAN & COO Macquarie > Over 20 years experience in public and private capital > Vice Chairman and COO since 2004 markets > Founded Heads Up Systems in 1999 > Vice President of the paper group for the American Forest & Paper Association (1996-1999) Experienced management that LEWIS PARRISH | CFO owns approximately 15% of our > CFO since July 2014 common stock > Over 14 years of public accounting and industry experience > Licensed CPA in the Commonwealth of Virginia 23Gladstone Land | Executive Management DAVID GLADSTONE | CHAIRMAN & CEO JAY BECKHORN | TREASURER > Chairman and CEO since inception > Treasurer since January 2015 > Former owner of Coastal Berry, one of the largest > Former Senior Vice President with Sunrise Senior strawberry farm operations in CA (1997-2004) Living (2000-2008) > Former Chairman of American Capital (Nasdaq: ACAS) > Over 25 years of experience in securing debt financing (1997-2001) for real estate properties > Former Chairman and CEO of Allied Capital Corporation (NYSE: ALD) (1974-1997) JOHN KENT | MANAGING DIRECTOR (CAPITAL MARKETS) > Over 30 years of experience in the farming industry > Joined Gladstone Management in 2017 > Formerly in investment banking at UBS, Nomura and TERRY LEE BRUBAKER | VICE CHAIRMAN & COO Macquarie > Over 20 years experience in public and private capital > Vice Chairman and COO since 2004 markets > Founded Heads Up Systems in 1999 > Vice President of the paper group for the American Forest & Paper Association (1996-1999) Experienced management that LEWIS PARRISH | CFO owns approximately 15% of our > CFO since July 2014 common stock > Over 14 years of public accounting and industry experience > Licensed CPA in the Commonwealth of Virginia 23

Gladstone Land | Deal Team BILL HUGHES | MANAGING DIRECTOR (MIDWEST) BILL FRISBIE | MANAGING DIRECTOR (EAST COAST) > Fourth-generation farmer focused on the Midwest > Joined Gladstone Management in 2006; helped take Gladstone Land public in 2013 > 14 years of experience in agricultural investing with U.S. Trust’s Specialty Investments group > Responsible for sourcing and executing farmland acquisitions across the U.S., with focus on the east coast > Current President of U.S. Agri-Services Group > Former Chairman of the NCREIF Farmland Index BILL REIMAN | MANAGING DIRECTOR (WEST COAST) TONY MARCI | MANAGING DIRECTOR (WEST COAST) > Fifth-generation farmer focused on coastal California > Joined Gladstone Land in 2018 > Built and managed a $25M strawberry and raspberry > Focused on farmland acquisitions and managing farming operation existing properties > Recent Chairman of California Strawberry Commission > Served for several years on the board of directors of & Ventura County Agricultural Association the California Strawberry Commission Deal team with strong farm operating background and investment-oriented focus 24Gladstone Land | Deal Team BILL HUGHES | MANAGING DIRECTOR (MIDWEST) BILL FRISBIE | MANAGING DIRECTOR (EAST COAST) > Fourth-generation farmer focused on the Midwest > Joined Gladstone Management in 2006; helped take Gladstone Land public in 2013 > 14 years of experience in agricultural investing with U.S. Trust’s Specialty Investments group > Responsible for sourcing and executing farmland acquisitions across the U.S., with focus on the east coast > Current President of U.S. Agri-Services Group > Former Chairman of the NCREIF Farmland Index BILL REIMAN | MANAGING DIRECTOR (WEST COAST) TONY MARCI | MANAGING DIRECTOR (WEST COAST) > Fifth-generation farmer focused on coastal California > Joined Gladstone Land in 2018 > Built and managed a $25M strawberry and raspberry > Focused on farmland acquisitions and managing farming operation existing properties > Recent Chairman of California Strawberry Commission > Served for several years on the board of directors of & Ventura County Agricultural Association the California Strawberry Commission Deal team with strong farm operating background and investment-oriented focus 24
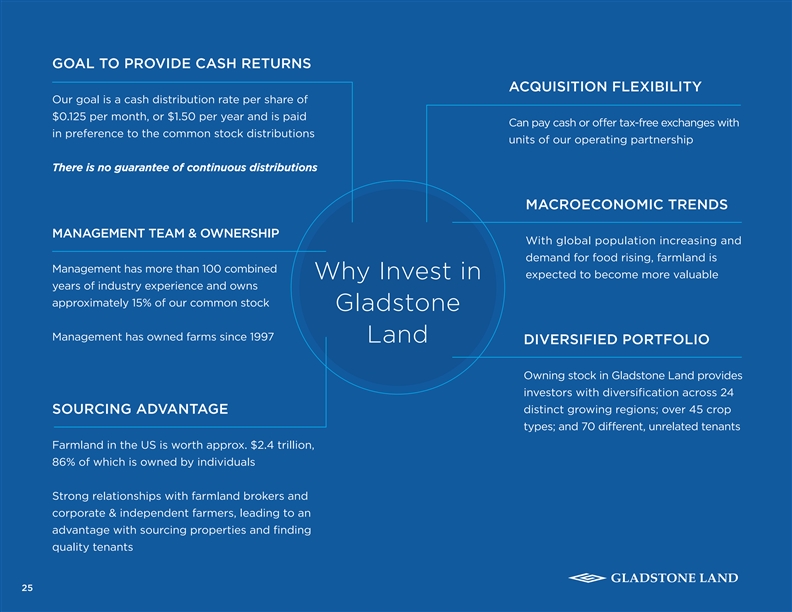
GOAL TO PROVIDE CASH RETURNS ACQUISITION FLEXIBILITY Our goal is a cash distribution rate per share of $0.125 per month, or $1.50 per year and is paid Can pay cash or oer tax-free exchanges with in preference to the common stock distributions units of our operating partnership There is no guarantee of continuous distributions MACROECONOMIC TRENDS MANAGEMENT TEAM & OWNERSHIP With global population increasing and demand for food rising, farmland is Management has more than 100 combined expected to become more valuable Why Invest in years of industry experience and owns approximately 15% of our common stock Gladstone Management has owned farms since 1997 Land DIVERSIFIED PORTFOLIO Owning stock in Gladstone Land provides investors with diversification across 24 distinct growing regions; over 45 crop SOURCING ADVANTAGE types; and 70 dierent, unrelated tenants Farmland in the US is worth approx. $2.4 trillion, 86% of which is owned by individuals Strong relationships with farmland brokers and corporate & independent farmers, leading to an advantage with sourcing properties and finding quality tenants 25GOAL TO PROVIDE CASH RETURNS ACQUISITION FLEXIBILITY Our goal is a cash distribution rate per share of $0.125 per month, or $1.50 per year and is paid Can pay cash or oer tax-free exchanges with in preference to the common stock distributions units of our operating partnership There is no guarantee of continuous distributions MACROECONOMIC TRENDS MANAGEMENT TEAM & OWNERSHIP With global population increasing and demand for food rising, farmland is Management has more than 100 combined expected to become more valuable Why Invest in years of industry experience and owns approximately 15% of our common stock Gladstone Management has owned farms since 1997 Land DIVERSIFIED PORTFOLIO Owning stock in Gladstone Land provides investors with diversification across 24 distinct growing regions; over 45 crop SOURCING ADVANTAGE types; and 70 dierent, unrelated tenants Farmland in the US is worth approx. $2.4 trillion, 86% of which is owned by individuals Strong relationships with farmland brokers and corporate & independent farmers, leading to an advantage with sourcing properties and finding quality tenants 25

Appendix 26Appendix 26

Adjusted Funds from Operations (AFFO) FUNDS FROM OPERATIONS (FFO) The National Association of Real Estate Investment Trusts (NAREIT) developed FFO as a relative non-GAAP supplemental measure of operating performance of an equity REIT in order to recognize that income-producing real estate historically has not depreciated on the basis determined under GAAP. FFO, as defined by NAREIT, is net income (computed in accordance with GAAP), excluding gains (or losses) from sales of property and impairment losses on property, plus depreciation and amortization of real estate assets, and after adjustments for unconsolidated partnerships and joint ventures. The Company believes that FFO provides investors with an additional context for evaluating its financial performance and as a supplemental measure to compare it to other REITs; however, comparisons of the Company’s FFO to the FFO of other REITs may not necessarily be meaningful due to potential dierences in the application of the NAREIT definition used by such other REITs. CORE FFO (CFFO) CFFO is FFO, adjusted for items that are not indicative of the results provided by the Company’s operating portfolio and aect the comparability of the Company’s period-over-period performance. These items include certain non-recurring items, such as acquisition-related expenses, income tax provisions and property and casualty losses or recoveries. Although the Company’s calculation of CFFO diers from NAREIT’s definition of FFO and may not be comparable to that of other REITs, the Company believes it is a meaningful supplemental measure of its sustainable operating performance. Accordingly, CFFO should be considered a supplement to net income computed in accordance with GAAP as a measure of our performance. For a full explanation of the adjustments made to arrive at CFFO, please read the Company’s most recent Form 10-Q or Form 10-K, as appropriate, as filed with the SEC. ADJUSTED FFO (AFFO) AFFO is CFFO, adjusted for certain non-cash items, such as the straight-lining of rents and amortizations into rental income (resulting in cash rent being recognized ratably over the period in which the cash rent is earned). Although the Company’s calculation of AFFO diers from NAREIT’s definition of FFO and may not be comparable to that of other REITs, the Company believes it is a meaningful supplemental measure of its sustainable operating performance on a cash basis. Accordingly, AFFO should be considered a supplement to net income computed in accordance with GAAP as a measure of our performance. For a full explanation of the adjustments made to arrive at AFFO, please read the Company’s most recent Form 10-Q or Form 10-K, as appropriate, as filed with the SEC. The Company’s presentation of FFO, as defined by NAREIT, or CFFO or AFFO, as defined above, does not represent cash flows from operating activities determined in accordance with GAAP and should not be considered an alternative to net income as an indication of its performance or to cash flow from operations as a measure of liquidity or ability to make distributions. 27Adjusted Funds from Operations (AFFO) FUNDS FROM OPERATIONS (FFO) The National Association of Real Estate Investment Trusts (NAREIT) developed FFO as a relative non-GAAP supplemental measure of operating performance of an equity REIT in order to recognize that income-producing real estate historically has not depreciated on the basis determined under GAAP. FFO, as defined by NAREIT, is net income (computed in accordance with GAAP), excluding gains (or losses) from sales of property and impairment losses on property, plus depreciation and amortization of real estate assets, and after adjustments for unconsolidated partnerships and joint ventures. The Company believes that FFO provides investors with an additional context for evaluating its financial performance and as a supplemental measure to compare it to other REITs; however, comparisons of the Company’s FFO to the FFO of other REITs may not necessarily be meaningful due to potential dierences in the application of the NAREIT definition used by such other REITs. CORE FFO (CFFO) CFFO is FFO, adjusted for items that are not indicative of the results provided by the Company’s operating portfolio and aect the comparability of the Company’s period-over-period performance. These items include certain non-recurring items, such as acquisition-related expenses, income tax provisions and property and casualty losses or recoveries. Although the Company’s calculation of CFFO diers from NAREIT’s definition of FFO and may not be comparable to that of other REITs, the Company believes it is a meaningful supplemental measure of its sustainable operating performance. Accordingly, CFFO should be considered a supplement to net income computed in accordance with GAAP as a measure of our performance. For a full explanation of the adjustments made to arrive at CFFO, please read the Company’s most recent Form 10-Q or Form 10-K, as appropriate, as filed with the SEC. ADJUSTED FFO (AFFO) AFFO is CFFO, adjusted for certain non-cash items, such as the straight-lining of rents and amortizations into rental income (resulting in cash rent being recognized ratably over the period in which the cash rent is earned). Although the Company’s calculation of AFFO diers from NAREIT’s definition of FFO and may not be comparable to that of other REITs, the Company believes it is a meaningful supplemental measure of its sustainable operating performance on a cash basis. Accordingly, AFFO should be considered a supplement to net income computed in accordance with GAAP as a measure of our performance. For a full explanation of the adjustments made to arrive at AFFO, please read the Company’s most recent Form 10-Q or Form 10-K, as appropriate, as filed with the SEC. The Company’s presentation of FFO, as defined by NAREIT, or CFFO or AFFO, as defined above, does not represent cash flows from operating activities determined in accordance with GAAP and should not be considered an alternative to net income as an indication of its performance or to cash flow from operations as a measure of liquidity or ability to make distributions. 27

AFFO (cont.) A reconciliation of AFFO to its most directly-comparable GAAP measure, net income (loss), for the most recently-completed period is presented below: For the Years Ended (Dollars in thousands, except per-share data) 12/31/2019 12/31/2018 (Unaudited) Net income $1,762 $2,766 Less: Dividends declared on Series B Preferred Stock (4,240) (379) Net (loss) income available to common stockholders and non-controlling OP Unitholders (2,478) 2,387 Plus: Real estate and intangible depreciation and amortization 12,790 9,375 Plus (less): Losses (gains) on dispositions of real estate assets, net 328 (5,532) 1 Adjustments for unconsolidated entities 1 - FFO available to common stockholders and non-controlling OP Unitholders 10,641 6,230 Plus: Acquisition- and disposition-related expenses 380 274 2 (Less) plus: Other (receipts) charges, net (1) 1,790 CFFO available to common stockholders and non-controlling OP Unitholders 11,020 8,294 3 Net rent adjustment (382) (485) Plus: Amortization of debt issuance costs 630 582 AFFO available to common stockholders and non-controlling OP Unitholders $11,268 $8,391 Weighted-average shares of common stock outstanding – basic and diluted 19,602,533 15,503,341 Weighted-average non-controlling common OP Units outstanding 235,613 809,022 Weighted-average total common shares outstanding 19,838,146 16,312,363 Diluted net income (loss) per weighted-average total common share $(0.1249) $0.1463 Diluted AFFO per weighted-average total common share $0.5680 $0.5144 Dividends paid per common share $0.5343 $0.5319 Notes: 1. Represents our pro-rata share of depreciation expense recorded in unconsolidated entities during the period. 2. For the period ended 12/31/2018, consists primarily of the net incremental impact of the farming operations conducted through our TRS. 3. This adjustment removes the eects of straight-lining rental income, as well as the amortization related to above-market lease values and lease incentives and accretion related to below-market lease values, tenant improvements, and other deferred revenue, resulting in rental income reflected on a modified 28 accrual cash basis. The eect to AFFO is that cash rents received pertaining to a lease year are normalized over that respective lease year on a straight-line basis, resulting in cash rent being recognized ratably over the period in which the cash rent is earned.AFFO (cont.) A reconciliation of AFFO to its most directly-comparable GAAP measure, net income (loss), for the most recently-completed period is presented below: For the Years Ended (Dollars in thousands, except per-share data) 12/31/2019 12/31/2018 (Unaudited) Net income $1,762 $2,766 Less: Dividends declared on Series B Preferred Stock (4,240) (379) Net (loss) income available to common stockholders and non-controlling OP Unitholders (2,478) 2,387 Plus: Real estate and intangible depreciation and amortization 12,790 9,375 Plus (less): Losses (gains) on dispositions of real estate assets, net 328 (5,532) 1 Adjustments for unconsolidated entities 1 - FFO available to common stockholders and non-controlling OP Unitholders 10,641 6,230 Plus: Acquisition- and disposition-related expenses 380 274 2 (Less) plus: Other (receipts) charges, net (1) 1,790 CFFO available to common stockholders and non-controlling OP Unitholders 11,020 8,294 3 Net rent adjustment (382) (485) Plus: Amortization of debt issuance costs 630 582 AFFO available to common stockholders and non-controlling OP Unitholders $11,268 $8,391 Weighted-average shares of common stock outstanding – basic and diluted 19,602,533 15,503,341 Weighted-average non-controlling common OP Units outstanding 235,613 809,022 Weighted-average total common shares outstanding 19,838,146 16,312,363 Diluted net income (loss) per weighted-average total common share $(0.1249) $0.1463 Diluted AFFO per weighted-average total common share $0.5680 $0.5144 Dividends paid per common share $0.5343 $0.5319 Notes: 1. Represents our pro-rata share of depreciation expense recorded in unconsolidated entities during the period. 2. For the period ended 12/31/2018, consists primarily of the net incremental impact of the farming operations conducted through our TRS. 3. This adjustment removes the eects of straight-lining rental income, as well as the amortization related to above-market lease values and lease incentives and accretion related to below-market lease values, tenant improvements, and other deferred revenue, resulting in rental income reflected on a modified 28 accrual cash basis. The eect to AFFO is that cash rents received pertaining to a lease year are normalized over that respective lease year on a straight-line basis, resulting in cash rent being recognized ratably over the period in which the cash rent is earned.

Net Asset Value (NAV) NET ASSET VALUE (NAV) Pursuant to a valuation policy approved by our board of directors, our valuation team, with oversight from the chief valuation ocer, provides recommendations of value for our properties to our board of directors, who then review and approve the fair values of our properties. Per our valuation policy, our valuations are derived based on either the purchase price of the property; values as determined by an independent, third-party appraiser; or through an internal valuation process, which process is, in turn, based on values as determined by independent, third-party appraisers. In any case, we intend to have each property valued by an independent, third-party appraiser at least once every three years, or more frequently in some instances. Various methodologies are used, both by the appraisers and in our internal valuations, to determine the fair value of our real estate on an “As Is” basis, including the sales comparison, income capitalization (or a discounted cash flow analysis) and cost approaches of valuation. NAV is a non-GAAP, supplemental measure of financial position of an equity REIT and is calculated as total equity, adjusted for the increase or decrease in fair value of our real estate assets and encumbrances relative to their respective cost bases. Further, we calculate NAV per share by dividing NAV by our total shares outstanding. Comparison of estimated NAV and estimated NAV per share to similarly-titled measures for other REITs may not necessarily be meaningful due to possible dierences in the calculation or application of the definition of NAV used by such REITs. In addition, the trading price of our common shares may dier significantly from our most recent estimated NAV per share calculation. The Company’s independent auditors have neither audited nor reviewed our calculation of NAV or NAV per share. For a full explanation of our valuation policy, please read the Company’s most recent Form 10-Q or Form 10-K, as appropriate, as filed with the SEC. 29Net Asset Value (NAV) NET ASSET VALUE (NAV) Pursuant to a valuation policy approved by our board of directors, our valuation team, with oversight from the chief valuation ocer, provides recommendations of value for our properties to our board of directors, who then review and approve the fair values of our properties. Per our valuation policy, our valuations are derived based on either the purchase price of the property; values as determined by an independent, third-party appraiser; or through an internal valuation process, which process is, in turn, based on values as determined by independent, third-party appraisers. In any case, we intend to have each property valued by an independent, third-party appraiser at least once every three years, or more frequently in some instances. Various methodologies are used, both by the appraisers and in our internal valuations, to determine the fair value of our real estate on an “As Is” basis, including the sales comparison, income capitalization (or a discounted cash flow analysis) and cost approaches of valuation. NAV is a non-GAAP, supplemental measure of financial position of an equity REIT and is calculated as total equity, adjusted for the increase or decrease in fair value of our real estate assets and encumbrances relative to their respective cost bases. Further, we calculate NAV per share by dividing NAV by our total shares outstanding. Comparison of estimated NAV and estimated NAV per share to similarly-titled measures for other REITs may not necessarily be meaningful due to possible dierences in the calculation or application of the definition of NAV used by such REITs. In addition, the trading price of our common shares may dier significantly from our most recent estimated NAV per share calculation. The Company’s independent auditors have neither audited nor reviewed our calculation of NAV or NAV per share. For a full explanation of our valuation policy, please read the Company’s most recent Form 10-Q or Form 10-K, as appropriate, as filed with the SEC. 29
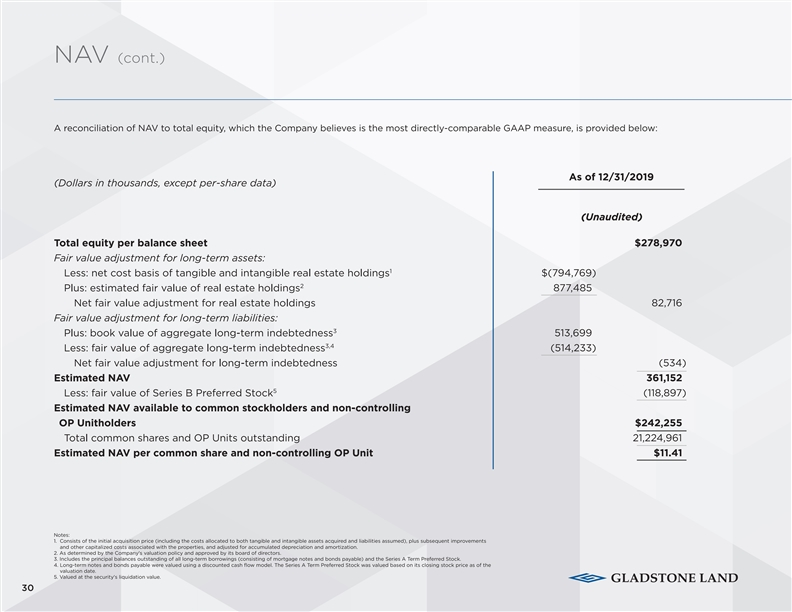
NAV (cont.) A reconciliation of NAV to total equity, which the Company believes is the most directly-comparable GAAP measure, is provided below: As of 12/31/2019 (Dollars in thousands, except per-share data) (Unaudited) Total equity per balance sheet $278,970 Fair value adjustment for long-term assets: 1 Less: net cost basis of tangible and intangible real estate holdings $(794,769) 2 Plus: estimated fair value of real estate holdings 877,485 Net fair value adjustment for real estate holdings 82,716 Fair value adjustment for long-term liabilities: 3 Plus: book value of aggregate long-term indebtedness 513,699 3,4 Less: fair value of aggregate long-term indebtedness (514,233) Net fair value adjustment for long-term indebtedness (534) Estimated NAV 361,152 5 Less: fair value of Series B Preferred Stock (118,897) Estimated NAV available to common stockholders and non-controlling OP Unitholders $242,255 Total common shares and OP Units outstanding 21,224,961 Estimated NAV per common share and non-controlling OP Unit $11.41 Notes: 1. Consists of the initial acquisition price (including the costs allocated to both tangible and intangible assets acquired and liabilities assumed), plus subsequent improvements and other capitalized costs associated with the properties, and adjusted for accumulated depreciation and amortization. 2. As determined by the Company's valuation policy and approved by its board of directors. 3. Includes the principal balances outstanding of all long-term borrowings (consisting of mortgage notes and bonds payable) and the Series A Term Preferred Stock. 4. Long-term notes and bonds payable were valued using a discounted cash flow model. The Series A Term Preferred Stock was valued based on its closing stock price as of the valuation date. 5. Valued at the security's liquidation value. 30NAV (cont.) A reconciliation of NAV to total equity, which the Company believes is the most directly-comparable GAAP measure, is provided below: As of 12/31/2019 (Dollars in thousands, except per-share data) (Unaudited) Total equity per balance sheet $278,970 Fair value adjustment for long-term assets: 1 Less: net cost basis of tangible and intangible real estate holdings $(794,769) 2 Plus: estimated fair value of real estate holdings 877,485 Net fair value adjustment for real estate holdings 82,716 Fair value adjustment for long-term liabilities: 3 Plus: book value of aggregate long-term indebtedness 513,699 3,4 Less: fair value of aggregate long-term indebtedness (514,233) Net fair value adjustment for long-term indebtedness (534) Estimated NAV 361,152 5 Less: fair value of Series B Preferred Stock (118,897) Estimated NAV available to common stockholders and non-controlling OP Unitholders $242,255 Total common shares and OP Units outstanding 21,224,961 Estimated NAV per common share and non-controlling OP Unit $11.41 Notes: 1. Consists of the initial acquisition price (including the costs allocated to both tangible and intangible assets acquired and liabilities assumed), plus subsequent improvements and other capitalized costs associated with the properties, and adjusted for accumulated depreciation and amortization. 2. As determined by the Company's valuation policy and approved by its board of directors. 3. Includes the principal balances outstanding of all long-term borrowings (consisting of mortgage notes and bonds payable) and the Series A Term Preferred Stock. 4. Long-term notes and bonds payable were valued using a discounted cash flow model. The Series A Term Preferred Stock was valued based on its closing stock price as of the valuation date. 5. Valued at the security's liquidation value. 30
