UNITED STATES
SECURITIES AND EXCHANGE COMMISSION
Washington, D.C. 20549
FORM 10-K
(Mark One)
| x | ANNUAL REPORT PURSUANT TO SECTION 13 OR 15(d) OF THE SECURITIES EXCHANGE ACT OF 1934 |
For the fiscal year ended December 31, 2014
| OR | |
| o | TRANSITION REPORT PURSUANT TO SECTION 13 OR 15(d) OF THE SECURITIES EXCHANGE ACT OF 1934 |
| For the transition period from _________ to __________ | |
Commission file number: 001-35263 and 333-197780
AMERICAN REALTY CAPITAL PROPERTIES, INC.
ARC PROPERTIES OPERATING PARTNERSHIP, L.P.
(Exact name of registrant as specified in its charter)
| Maryland (American Realty Capital Properties, Inc.) | 45-2482685 | |
| Delaware (ARC Properties Operating Partnership, L.P.) | 45-1255683 | |
| (State or other jurisdiction of incorporation or organization) | (I.R.S. Employer Identification No.) | |
| 2325 E. Camelback Road, Suite 1100, Phoenix, AZ | 85016 | |
| (Address of principal executive offices) | (Zip Code) | |
| (800) 606-3610 |
| (Registrant’s telephone number, including area code) |
| Securities registered pursuant to Section 12(b) of the Securities Exchange Act of 1934: | ||
| Title of each class: | Name of each exchange on which registered: | |
| Common Stock, $0.01 par value per share (American Realty Capital Properties, Inc.) | NASDAQ Stock Market | |
| Series F Preferred Stock, $0.01 par value per share (American Realty Capital Properties, Inc.) | NASDAQ Stock Market | |
| Securities registered pursuant to Section 12(g) of the Securities Exchange Act of 1934: | ||
| None | ||
Indicate by check mark if the registrant is a well-known seasoned issuer, as defined in Rule 405 of the Securities Act of 1933. American Realty Capital Properties, Inc. Yes o No x ARC Properties Operating Partnership, L.P. Yes o No x
Indicate by check mark if the registrant is not required to file reports pursuant to Section 13 or Section 15(d) of the Securities Exchange Act of 1934. American Realty Capital Properties, Inc. Yes o No x ARC Properties Operating Partnership, L.P. Yes o No x
Indicate by check mark whether the registrant (1) has filed all reports required to be filed by Section 13 or 15(d) of the Securities Exchange Act of 1934 during the preceding 12 months (or for such shorter period that the registrant was required to file such reports), and (2) has been subject to such filing requirements for the past 90 days. American Realty Capital Properties, Inc. Yes x No o ARC Properties Operating Partnership, L.P. Yes x No o
Indicate by check mark whether the registrant submitted electronically and posted on its corporate Web Site, if any, every Interactive Data File required to be submitted and posted pursuant to Rule 405 of Regulation S-T during the preceding 12 months (or for such shorter period that the registrant was required to submit and post such files). American Realty Capital Properties, Inc. Yes x No o ARC Properties Operating Partnership, L.P. Yes x No o
Indicate by check mark if disclosure of delinquent filers pursuant to Item 405 of Regulation S-K is not contained herein, and will not be contained, to the best of registrant’s knowledge, in definitive proxy or information statements incorporated by reference in Part III of this Form 10-K or any amendment to this Form 10-K. o
Indicate by check mark whether the registrant is a large accelerated filer, an accelerated filer, a non-accelerated filer, or a smaller reporting company. See definition of “large accelerated filer,” “accelerated filer,” and “smaller reporting company” in Rule 12b-2 of the Exchange Act.
| American Realty Capital Properties, Inc.: | Large accelerated filer x | Accelerated filer o | |
Non-accelerated filer o | (Do not check if a smaller reporting company) | Smaller reporting company o | |
| ARC Properties Operating Partnership, L.P.: | Large accelerated filer o | Accelerated filer o | |
Non-accelerated filer x | (Do not check if a smaller reporting company) | Smaller reporting company o | |
Indicate by check mark whether the registrant is a shell company (as defined in Rule 12b-2 of the Exchange Act). American Realty Capital Properties, Inc. Yes o No x ARC Properties Operating Partnership, L.P. Yes o No x
As of June 30, 2014, the aggregate market value of voting and non-voting common stock held by non-affiliates of American Realty Capital Properties, Inc. was $11.3 billion based on the closing sale price of $12.53 as reported on the NASDAQ Global Select Market on June 30, 2014. As of March 27, 2015, there were 905,193,685 shares of common stock outstanding. There is no public trading market for the units of limited partner interests of ARC Properties Operating Partnership, L.P. As a result, the aggregate market value of the common units held by non-affiliates of ARC Properties Operating Partnership, L.P. cannot be determined.
AMERICAN REALTY CAPITAL PROPERTIES, INC. AND
ARC PROPERTIES OPERATING PARTNERSHIP, L.P.
For the fiscal year ended December 31, 2014
| Page | |
2
Forward-Looking Statements
Certain statements included herein are “forward-looking statements” within the meaning of Section 27A of the Securities Act of 1933, as amended, and Section 21E of the Securities Exchange Act of 1934, as amended. Those statements include statements regarding the intent, belief or current expectations of American Realty Capital Properties, Inc. (“ARCP” or the “General Partner”), ARC Properties Operating Partnership, L.P. (the “OP” or the “Operating Partnership”) and members of our management team, as well as the assumptions on which such statements are based, and generally are identified by the use of words such as “may,” “will,” “seeks,” “anticipates,” “believes,” “estimates,” “expects,” “targets,” “goals,” “projects,” “plans,” “intends,” “should,” variations of such words or similar expressions. Actual results may differ materially from those contemplated by such forward-looking statements. Any statements regarding ARCP’s or the OP’s future financial condition, results of operations and business are also forward-looking statements. Further, forward-looking statements speak only as of the date they are made, and we undertake no obligation to update or revise forward-looking statements to reflect changed assumptions, the occurrence of unanticipated events or changes to future operating results over time, unless required by law.
As used herein, the terms the “Company,” “we,” “our” and “us” refer to ARCP, a Maryland corporation, together with our consolidated subsidiaries, including the OP, a Delaware limited partnership of which we are the sole general partner. The “Former Manager” refers to ARC Properties Advisors, LLC, a Delaware limited liability company, our former external manager. “ARC” refers to AR Capital, LLC (formerly known as American Realty Capital II, LLC) and its affiliated companies, which formerly was our sponsor. During the years ended December 31, 2013 and 2012, we retained the Former Manager to manage our affairs on a day-to-day basis and, as a result, were generally externally managed, with the exception of certain acquisition, accounting and portfolio management services performed by our employees. We ceased to be externally managed on January 8, 2014.
The following are some of the assumptions, risks, uncertainties and other factors, although not all assumptions, risks, uncertainties and other factors, that could cause our actual results to differ materially from those presented in our forward-looking statements:
| • | We encounter significant competition in the acquisition of properties and we may be unable to acquire properties on advantageous terms. |
| • | We are subject to risks associated with lease terminations, tenant defaults, bankruptcies and insolvencies and credit, geographic and industry concentrations with respect to tenants. |
| • | We may be unable to renew leases, lease vacant space or re-lease space as leases expire on favorable terms or at all. |
| • | We may not be able to effectively manage or dispose of assets acquired in connection with our Recent Acquisitions that do not fit within our target assets. |
| • | We may not be able to effectively integrate and manage our expanded portfolio and operations following our Recent Acquisitions. |
| • | We could be subject to unexpected costs or unexpected liabilities that may arise from our Recent Acquisitions. |
| • | Our properties may be subject to impairment charges. |
| • | We have substantial indebtedness, which may affect our ability to pay dividends, and expose us to interest rate fluctuations and the risk of default. |
| • | Our overall borrowing and operating flexibility may be adversely affected by the terms of our Amended Credit Agreement and the indentures governing our senior unsecured notes and convertible notes. |
| • | Our access to capital and terms of future financings may be adversely affected by our recent credit rating downgrade and loss of eligibility to register the offer and sale of our securities on Form S-3. |
| • | We may be affected by the incurrence of additional secured or unsecured debt. |
| • | We may not be able to achieve and maintain profitability. |
| • | We may be affected by risks associated with current and future litigation. |
| • | We may fail to remain qualified as a real estate investment trust for U.S. federal income tax purposes (“REIT”). |
| • | We may be deemed to be an investment company under the Investment Company Act of 1940, as amended (the “Investment Company Act”) and thus subject to regulation under the Investment Company Act. |
| • | There can be no assurance as to when we will resume paying a dividend in respect of our and our OP’s respective common equity, or, when it is resumed, that it will be paid at a rate equal to or at the same frequency as our previously declared monthly dividend. |
| • | We may not generate cash flows sufficient to pay our dividends to stockholders, and therefore may be forced to borrow at higher rates to fund our dividends. |
3
| • | We are subject to litigation and governmental investigations related to the findings of a recent Audit Committee investigation. |
| • | We have material weaknesses in our disclosure controls and procedures and our internal control over financial reporting and we may not be able to remediate such material weaknesses in a timely manner. |
| • | We may be unable to reestablish the financial network which supports Cole Capital and its Managed REITs and/or regain the prior transaction and capital raising volume of Cole Capital Corporation. |
| • | Our Cole Capital operations are subject to extensive governmental regulation. |
| • | We may not satisfy NASDAQ’s requirements for regaining compliance with its listing rules and, if so, NASDAQ could delist our common stock and Series F Preferred Stock. |
| • | We may be unable to retain or hire key personnel. |
All forward-looking statements should be read in light of the risks identified in Part I, Item 1A of this report.
We use certain defined terms throughout this document that have the following meanings:
Under a “net lease,” the tenant occupying the leased property (usually as a single tenant) does so in much the same manner as if the tenant were the owner of the property. There are various forms of net leases, most typically classified as triple net or double net. Triple net leases typically require the tenant to pay all costs associated with a property, including real estate taxes, insurance, utilities and routine maintenance, in addition to the base rent. Double net leases typically require the tenant to pay all the costs as triple net leases, but hold the landlord responsible for capital expenditures, including the repair or replacement of specific structural and/or bearing components of a property, such as the roof or structure of the building. Accordingly, the owner receives the rent “net” of these expenses, rendering the cash flow associated with the lease predictable for the term of the lease. Under a net lease, the tenant generally agrees to lease the property for a significant term and agrees that it will either have no ability or only limited ability to terminate the lease or abate rent prior to the expiration of the term of the lease as a result of real estate driven events such as casualty, condemnation or failure by the landlord to fulfill its obligations under the lease.
Under a “modified gross lease,” the commercial enterprises occupying the leased property pay base rent plus a proportional share of some of the other costs associated with the property, such as property taxes, utilities, insurance and maintenance.
When we refer to a “creditworthy tenant,” we mean a tenant that has entered into a lease that we determine is creditworthy and may include tenants with an investment grade or below investment grade credit rating, as determined by major credit rating agencies, or unrated tenants. To the extent we determine that a tenant is a “creditworthy tenant” even though it does not have an investment grade credit rating, we do so based on our management’s determination that a tenant should have the financial wherewithal to honor its obligations under its lease with us. This determination is based on our management’s substantial experience closing net lease transactions and is made after evaluating all tenants’ due diligence materials that are made available to us, including financial statements and operating data.
When we refer to “annualized rental income,” we mean the rental income under our leases reflecting straight-line rent adjustments associated with contractual rent increases in the leases as required by generally accepted accounting principles in the United States (“U.S. GAAP”), which includes the effect of tenant concessions such as free rent, as applicable. When we refer to annualized rental income/net operating income (“NOI”) for net leases, we mean rental income on a straight-line basis, which includes the effect of tenant concessions such as free rent as applicable. For modified gross leased properties, NOI is rental income on a straight-line basis, which includes the effect of tenant concessions such as free rent, as applicable, plus operating expense reimbursement revenue less property expenses.
When we refer to properties that are net leased on a “long-term basis,” we mean properties with remaining primary lease terms of generally 10 years or longer on average.
4
PART I
Item 1. Business.
Overview
ARCP is a self-managed Maryland corporation incorporated on December 2, 2010 that qualified as a real estate investment trust (“REIT”) for U.S. federal income tax purposes beginning in the taxable year ended December 31, 2011. On September 6, 2011, the Company completed its initial public offering (the “IPO”). ARCP’s common stock trades on the NASDAQ Global Select Market (“NASDAQ”) under the symbol “ARCP.”
We operate through two business segments, Real Estate Investment (“REI”) and our private capital management business (“PCM”), Cole Capital® (“Cole Capital”), as further discussed in Note 5 – Segment Reporting. Through the REI segment, we acquire, own and operate single-tenant, freestanding, commercial real estate properties, primarily subject to long-term net leases with high credit quality tenants. We seek to acquire net lease assets by self-originating individual or small portfolio acquisitions, by executing sale-leaseback transactions, and in connection with build-to-suit or forward take-out opportunities, to the extent they are appropriate in terms of capitalization rate and scale. We have also advanced our investment objectives through strategic mergers and acquisitions. See Note 2 – Mergers and Significant Acquisitions and Sales to the consolidated financial statements in this report.
Cole Capital is contractually responsible for managing the affairs of the Managed REITs (as defined below) on a day-to-day basis, identifying and making acquisitions and investments on the Managed REITs’ behalf, and recommending to each of the Managed REIT’s respective board of directors an approach for providing investors with liquidity. Cole Capital receives compensation and reimbursement for services relating to these services.
Substantially all of our REI segment is conducted through the OP. We are the sole general partner and holder of 97.4% of the common equity interests in the OP as of December 31, 2014 with the remaining 2.6% common equity interests owned by certain unaffiliated investors. Under the limited partnership agreement of the OP (the “LPA”), after holding units of limited partner interests in the OP (“OP Units”) for a period of one year, unless otherwise consented to by us, holders of OP Units have the right to redeem the OP Units for the cash value of a corresponding number of shares of our common stock or, at our option, as general partner of the OP, a corresponding number of shares of our common stock. The remaining rights of the holders of OP Units are limited, and do not include the ability to replace the general partner or to approve the sale, purchase or refinancing of the OP’s assets. Substantially all of the Cole Capital segment is conducted through Cole Capital Advisors, Inc. (“CCA”), an Arizona corporation and a wholly owned subsidiary of the OP. CCA is treated as a taxable REIT subsidiary (“TRS”) under Section 856 of the Internal Revenue Code of 1986, as amended (the “Internal Revenue Code”).
Prior to January 8, 2014, we retained the Former Manager to manage our affairs on a day-to-day basis with the exception of certain acquisition, accounting and portfolio management services performed by our employees. In August 2013, our board of directors determined that it is in the best interests of us and our stockholders to become self-managed and we completed our transition to self-management on January 8, 2014. As of December 31, 2014, we had approximately 400 employees. For a discussion of certain transactions with the Former Manager in connection with our transition to self-management see Note 20 – Related Party Transactions and Arrangements to the consolidated financial statements.
As of December 31, 2014, we owned 4,648 properties consisting of 103.1 million square feet, which were 99.3% leased with a weighted-average remaining lease term of 11.8 years. In constructing our portfolio, we are committed to diversification by industry, tenant and geography. As of December 31, 2014, rental revenues derived from investment grade tenants and tenants affiliated with investment grade entities as determined by a major rating agency approximated 46.9% (we have attributed the rating of each parent company to its wholly owned subsidiary for purposes of this disclosure). Our strategy encompasses receiving the majority of our revenue from investment grade and creditworthy tenants as we further acquire properties and enter into or assume lease arrangements.
Recent Developments
Management and Board Changes
During the fourth quarter of 2014, the Company underwent a change in senior leadership as a result of the resignations of the Company’s Executive Chairman of the Board, Chief Executive Officer and director, President and Chief Operating Officer, Chief Financial Officer and Chief Accounting Officer. On October 28, 2014, the Company’s board of directors (the “Board of Directors”) appointed Michael J. Sodo as Chief Financial Officer and Gavin B. Brandon as Chief Accounting Officer. On December 15, 2014, William G. Stanley, who had been serving as the Company’s Lead Independent Director, became Interim Chairman of the Board and Interim Chief Executive Officer pending completion of the Board’s search, with the assistance of an independent search firm, for a new non-executive Chairman of the Board and a new permanent Chief Executive Officer.
5
On March 10, 2015, the Company announced that the Board of Directors had appointed Glenn J. Rufrano to serve as the Company’s new Chief Executive Officer and a director, effective April 1, 2015. The Company also announced that, with the Restatement (as defined below) completed, the Company expecting to file this report by the end of March 2015 and the appointment of Mr. Rufrano, two of the Company’s directors, Leslie D. Michelson and Governor Edward G. Rendell, decided that it was the right time to step down from the Board of Directors, effective April 1, 2015, to make way for new directors. In addition to a non-executive Chairman of the Board, the Board of Directors is in the process of recruiting two other new independent directors, which will result in a seven-member board. The decision about renomination of the other existing directors for election at the 2015 annual meeting will be made by the disinterested members of the reconstituted board. Mr. Stanley will continue to serve as Interim Chairman of the Board until the appointment of the new non-executive Chairman of the Board.
Audit Committee Investigation and Restatement
On March 2, 2015, ARCP restated and amended its consolidated financial statements and related financial information as of and for the fiscal years ended December 31, 2013 and 2012 and the fiscal periods ended March 31, 2014 and 2013, June 30, 2014 and 2013 and September 30, 2013 and the OP restated and amended its consolidated financial statements and related financial information as of and for the fiscal years ended December 31, 2013 and 2012 and the fiscal periods ended June 30, 2014 and 2013 (collectively, the “Restatement”). The Restatement reflected the findings of an independent investigation conducted by the Audit Committee of the Board of Directors (the “Audit Committee”) into concerns regarding accounting practices and other matters that had first been reported to it on September 7, 2014 (the “Audit Committee Investigation”) as well as a review performed by the Company’s new management. For information concerning the findings of the Audit Committee Investigation, see the Explanatory Note at the beginning of any of the following reports, each filed as of March 2, 2015: Amendment No. 2 to the Company’s Annual Report on Form 10-K/A for the fiscal year ended December 31, 2013 or the Company’s Quarterly Report on Form 10-Q/A for the fiscal period ended March 31, 2014 or June 30, 2014.
Settlement of the Cole Capital Litigation
On September 30, 2014, an affiliate of the Company and RCS Capital Corporation (“RCAP”) entered into an equity purchase agreement (the “Cole Purchase Agreement”) pursuant to which RCAP agreed to purchase all of the Company’s outstanding equity interests in Cole Capital for $700.0 million plus an earn-out of up to an additional $130.0 million. On November 3, 2014, the Company received notice from RCAP purporting to terminate the Cole Purchase Agreement. On November 11, 2014, the Company filed litigation against RCAP in the Court of Chancery of the State of Delaware to enforce its rights under the Cole Purchase Agreement. On December 4, 2014, the Company announced that it had entered into a settlement agreement with RCAP that resolved their dispute relating to the Cole Purchase Agreement. The settlement included $42.7 million (inclusive of $10.0 million previously delivered) in cash paid by RCAP to the Company; a $15.3 million unsecured note issued by RCAP to the OP, which matures not later than March 31, 2017; and a release of the Company from a payment obligation in the amount of $2.0 million in favor of RCAP or its affiliates. In addition to the settlement, the Company and RCAP have agreed to terminate, unwind or otherwise discontinue agreements, arrangements and understandings between the two parties and any of their respective subsidiaries.
Recent Mergers and Portfolio Acquisitions and Sale
The following summarizes mergers and portfolio acquisitions (the “Recent Acquisitions”) and a major portfolio sale that have been consummated since January 1, 2014:
American Realty Capital Trust IV, Inc. Merger
On July 1, 2013, we entered into an Agreement and Plan of Merger, as amended on October 6, 2013 and October 11, 2013, (the “ARCT IV Merger Agreement”) with American Realty Capital Trust IV, Inc., a Maryland corporation (“ARCT IV”), and certain subsidiaries of each company. The ARCT IV Merger Agreement provided for the merger of ARCT IV with and into a subsidiary of the OP (the “ARCT IV Merger”). We consummated the ARCT IV Merger on January 3, 2014. See Note 2 – Mergers and Significant Acquisitions and Sales to the consolidated financial statements in this report for further discussion of the ARCT IV Merger.
ARCP and ARCT IV, from inception to the ARCT IV Merger date, were considered to be entities under common control. Both entities’ advisors were wholly owned subsidiaries of ARC. ARC and its related parties had ownership interests in us and in ARCT IV through the ownership of shares of common stock, OP Units and other equity interests. In addition, the advisors of both entities were contractually eligible to receive potential fees for their services to both of the companies, including asset management fees, incentive fees and other fees and had continued to receive fees from us prior to our transition to self-management on January 8, 2014. Due to the significance of these fees, the advisors and ultimately ARC were determined to have a significant economic interest in both companies in addition to having the power to direct the activities of the companies through advisory/management agreements, which qualified them as affiliated companies under common control in accordance with U.S. GAAP. The acquisition of an entity under common control is accounted for on the carryover basis of accounting, whereby the assets and liabilities of the
6
companies are recorded upon the merger on the same basis as they were carried by the companies on the ARCT IV Merger date. In addition, U.S. GAAP requires us to present historical financial information as if the entities were combined for all periods the entities were under common control. Therefore, the accompanying financial statements including the notes thereto are presented as if the ARCT IV Merger, including the impact of the equity transactions entered into to consummate the merger, had occurred at inception.
Fortress Portfolio Acquisition
On July 24, 2013, ARC and another related entity, on behalf of the Company and certain other entities sponsored directly or indirectly by ARC, entered into a purchase and sale agreement with affiliates of funds managed by Fortress Investment Group LLC (“Fortress”) for the purchase of 196 properties owned by Fortress, for an aggregate contract purchase price of $972.5 million, subject to adjustments set forth in the purchase and sale agreement and exclusive of closing costs, which were allocated to the Company based on the pro rata fair value of the properties acquired by the Company relative to the fair value of all 196 properties sold by Fortress. Of the 196 properties, 120 properties were allocated to the Company (the “Fortress Portfolio”). On October 1, 2013, the Company closed on 41 of the 120 properties with a total purchase price of $200.3 million, exclusive of closing costs. On January 8, 2014, the Company closed the acquisition of the remaining 79 properties in the Fortress Portfolio, for an aggregate contract purchase price of $400.9 million, exclusive of closing costs. The total purchase price of the Fortress Portfolio was $601.2 million, exclusive of closing costs.
Inland Portfolio Acquisition
On August 8, 2013, ARC and another related entity, on behalf of the Company and certain other entities sponsored directly or indirectly by ARC, entered into a purchase and sale agreement with Inland American Real Estate Trust, Inc. (“Inland”) for the purchase of the equity interests of 67 companies owned by Inland for an aggregate contract purchase price of $2.3 billion, subject to adjustments set forth in the purchase and sale agreement and exclusive of closing costs. Of the 67 companies, the equity interests of 10 companies holding in the aggregate 33 properties (the “Inland Portfolio”) were allocated to the Company for a purchase price of $501.0 million, subject to adjustments set forth in the purchase and sale agreement and exclusive of closing costs, which were allocated to the Company based on the pro rata fair value of the Inland Portfolio relative to the fair value of all 67 companies sold by Inland. As of December 31, 2014, the Company had closed on 32 of the 33 properties for a total purchase price of $288.2 million, exclusive of closing costs. The Company will not close on the remaining one property.
Cole Real Estate Investments, Inc. Merger
On October 22, 2013, ARCP and a wholly-owned subsidiary entered into an agreement and plan of merger (the “Cole Merger Agreement”) with Cole Real Estate Investments, Inc. (“Cole”), a publicly traded Maryland corporation. The Cole merger agreement provided for the merger of Cole with and into our wholly owned subsidiary (the “Cole Merger”). The Cole Merger was consummated on February 7, 2014. See Note 2 – Mergers and Significant Acquisitions and Sales to the consolidated financial statements in this report for further discussion of the Cole Merger.
Cole Credit Property Trust, Inc. Merger
On March 17, 2014, ARCP and a wholly-owned subsidiary entered into an Agreement and Plan of Merger (the “CCPT Merger Agreement”) with Cole Credit Property Trust, Inc., a Maryland corporation (“CCPT”). The CCPT merger agreement provided for the merger of CCPT with and into a subsidiary of the Company (the “CCPT Merger”). The CCPT Merger was consummated on May 19, 2014. See Note 2 – Mergers and Significant Acquisitions and Sales to the consolidated financial statements in this report for further discussion of the CCPT Merger.
Red Lobster Portfolio Acquisition
On May 15, 2014, we entered into a master purchase agreement to acquire over 500 properties, substantially all of which are operating as Red Lobster® restaurants from a third party. The transaction was structured as a sale-leaseback in which we purchased and immediately leased the portfolio back to the third party pursuant to the terms of multiple master leases. The overall sale-leaseback transaction consisted of 522 Red Lobster® restaurants and 20 other branded restaurant properties for a purchase price of $1.7 billion. The Company closed the Red Lobster Portfolio acquisition in the third quarter of 2014.
Abandoned Spin-off of Multi-Tenant Shopping Center Portfolio; Sale to Blackstone/DDR Joint Venture
On March 13, 2014, we announced our intention to spin off our multi-tenant shopping center business (the “MT Spin-off”) into a publicly traded REIT, American Realty Capital Centers, Inc., which was expected to operate under the name “ARCenters” and to trade on the NASDAQ Global Market under the symbol “ARCM.” The OP was expected to retain 25% ownership of ARCM. The MT Spin-off was expected to be effectuated through a pro rata taxable special distribution of one share of ARCM common stock for every 10 shares of our common stock and every 10 OP Units held by third parties in the OP. On April 4, 2014, ARCM
7
filed a Registration Statement on Form 10 to register ARCM’s common stock, par value $0.01 per share, pursuant to Section 12(b) of the Exchange Act so that, upon consummation of the MT Spin-off, shares of ARCM received by holders of our common stock, or OP Units, as applicable, could freely trade their newly received ARCM common stock. ARCM was expected to be externally managed by us. On May 21, 2014, we announced that we had reassessed our plans for the multi-tenant shopping center portfolio and entered into a letter of intent to sell such portfolio to Blackstone Real Estate Partners VII L.P. (“Blackstone”), expecting to finalize pertinent documentation related thereto within 30 days of such date. The 64 multi-tenant properties and seven single-tenant properties (the “Multi-tenant Portfolio”) included in such sale were the same properties that would have been spun off into ARCM and, consequently, we abandoned our proposed spin-off at such time. On June 11, 2014, certain of our indirect subsidiaries entered into an agreement of purchase and sale with BRE DDR Retail Holdings III LLC (the “Blackstone/DDR Joint Venture”), an entity indirectly jointly owned by affiliates of Blackstone and DDR Corp. (“DDR”), pursuant to which the parties consummated the sale of our multi-tenant shopping center portfolio. On October 17, 2014, we completed the sale of the Multi-tenant Portfolio for $1.9 billion to the Blackstone/DDR Joint Venture. Additionally, we entered into a letter of intent with an unrelated third party to sell five multi-tenant properties for $52.3 million bringing total expected sale proceeds to $2.0 billion. The transaction aimed to simplify our REI business model, allowing us to focus solely on its single-tenant, net lease investments of $1.3 billion of net proceeds, of which $1.2 billion was used to reduce our leverage by paying down our line of credit and $542.8 million of secured mortgage debt was either repaid or assumed by the Blackstone/DDR Joint Venture. We reported a net loss on sale of $262.0 million, which includes the write-off of $195.5 million of goodwill allocated to the cost basis of the Multi-tenant Portfolio.
Transition to Self-Management
Prior to January 8, 2014, the Former Manager, a wholly owned subsidiary of ARC, managed our affairs on a day-to-day basis, with the exception of certain acquisition, accounting and portfolio management services performed by our employees. In August 2013, the Board of Directors determined that it was in the best interests of us and our stockholders to become self-managed, and we completed our transition to self-management on January 8, 2014. In connection with becoming self-managed, we terminated the existing management agreement with the Former Manager.
Under the termination agreement, the Former Manager agreed to provide services previously provided under the management agreement, to the extent required by ARCP, for a tail period of 60 days following January 8, 2014 in exchange for a payment in the amount of $10.0 million. In addition, pursuant to a separate transition services agreement, affiliates of the Former Manager agreed to provide certain transition services, including accounting support, acquisition support, investor relations support, public relations support, human resources and administration, general human resources duties, payroll services, benefits services, treasury, insurance and risk management, information technology, telecommunications and Internet and services relating to office supplies for a 60-day term, which was subject to extension by ARCP. For additional services as required by ARCP, ARCP paid an hourly rate or flat rate to be agreed on, that was not to exceed market rate. See Note 20 – Related Party Transactions and Arrangements to the consolidated financial statements in this report for further discussion.
Information relating to certain employment agreements and incentive compensation arrangments entered into in connection with the transition to self-management and subsequently terminated will be included in Part III of this report, which is expected to be filed by amendment prior to April 30, 2015.
Investment Policies
Our primary business objective is to generate a predictable level of monthly rents paid by primarily investment-grade rated and other creditworthy tenants under long-term leases. After consummation of the Recent Acquisitions discussed above, we own a portfolio that combines properties with stable income from creditworthy tenants with properties that we believe have strong fundamental business operations with the prospect for long-term sustainability. Our ongoing focus will be on actively managing our portfolio of high-quality, well located net leased properties diversified by tenant, industry and geography. We intend to strategically reinvest certain disposition proceeds into core, single-tenant net lease real estate that maintains or improves the quality of our portfolio while seeking self-originated investment opportunities. We expect this investment strategy to provide for stable income from our diverse portfolio creditworthy tenants and other tenants. We intend to pursue an investment strategy that maximizes current cash flow and achieves sustainable long-term growth. We expect to achieve these objectives by acquiring net leased properties that either (a) have in-place long-term net leases located in sub-markets with stable or improving market fundamentals or (b) provide a vital location or infrastructure that is essential to the business operations of the tenant.
Primary Investment Focus
Our REI business focuses on investing in single-tenant, freestanding, commercial real estate properties, primarily subject to long-term net leases with high credit quality tenants including retail, restaurants, office and distribution properties. We seek to invest in properties with tenants that reflect a diversity of industries, geographies and sizes. A significant majority of our net lease investments have been and will continue to be in properties net leased to investment grade-tenants, although at any particular time our portfolio may not reflect this. Our properties are primarily located in “Main & Main’’ locations in markets that we believe
8
exhibit demographic and economic trends that will support growth. We believe the diversification of our portfolio reduces the risks associated with potential adverse events that may impact any one tenant, industry, asset type or location. We believe our scale will enable us to continue to make acquisitions without exposing ourselves to excessive concentration risk. Our strategy encompasses receiving the majority of our revenue from investment grade and creditworthy tenants as we further acquire properties and enter into (or assume) lease arrangements.
Under net lease arrangements, tenants enter into long-term leases and pay most of the costs associated with the property and limited day-to-day property management by us is required. As a result, net lease companies are generally able to increase their size and scale with minimal incremental expense. This enables us to take advantage of economies of scale resulting in significant operational efficiencies as we grow. We believe that our focus on net leases has also enabled us to achieve greater tenant and geographic diversification, more stable cash flows, increased liquidity and lower cost of capital.
Investing in Real Property
We invest, and expect to continue to invest, primarily in single-tenant, freestanding commercial real estate properties net leased to investment grade and creditworthy tenants. When evaluating prospective investments in real property, our management considers relevant real estate and financial factors, including the location of the property, the leases and other agreements affecting the property, the creditworthiness of major tenants, its income-producing capacity, its physical condition, its prospects for appreciation, its prospects for liquidity, tax considerations and other factors. In this regard, our management will have substantial discretion with respect to the selection of specific investments, subject to approval of the Board of Directors.
As of December 31, 2014, we owned 4,648 properties, primarily double-net lease and triple-net lease assets, across property types. As a percentage of rental income, as of December 31, 2014, retail and restaurant properties represented 62%, office properties represented 23% and distribution properties represented 15% of our total portfolio. Our portfolio is located across 49 states, the District of Columbia, Puerto Rico, and Canada. Our tenant base is comprised of 803 tenants, which include well-known national, as well as regional, companies across 42 industries.
The following table lists the tenant whose annualized rental income represented greater than 10% of consolidated annualized rental income, as of December 31, 2014 and 2013:
| Tenant | 2014 | 2013 | ||
| Red Lobster | 11.6% | * | ||
_______________________________________________
* The tenants’ annualized rental income was not greater than 10% of total annualized rental income for all portfolio properties as of the period specified.
The following table lists the state where we have a concentration of properties in which annualized rental income represented greater than 10% of consolidated annualized rental income, on a straight-line basis, as of December 31, 2014 and 2013:
| State | 2014 | 2013 | ||
| Texas | 12.7% | 10.7% | ||
We do not have any specific policy as to the amount or percentage of our assets which will be invested in any specific property, other than the requirements under REIT qualification rules. We currently anticipate that our real estate investments will continue to be diversified in multiple net leased single-tenant properties and in multiple geographic markets.
Purchase and Sale of Investments
We may dispose of properties in the future and redeploy funds into new acquisitions that better align with our strategic objectives. Further, on a limited and opportunistic basis, we intend to acquire and promptly resell medium-term net lease assets for immediate gain. To the extent we engage in these activities, to avoid adverse U.S. federal income tax consequences, we generally must do so through a taxable REIT subsidiary (“TRS”). In general, a TRS is treated as a regular “C corporation” and therefore must pay corporate-level taxes on its taxable income. Thus, our yield on such activities will be reduced by such taxes borne by the TRS.
Investments in Real Estate Mortgages
While our current portfolio consists of, and our business objectives emphasize acquiring, owning and operating commercial real estate properties, we may, at the discretion of the Board of Directors and without a vote of our stockholders, invest in mortgages and other types of real estate interests consistent with our qualification as a REIT. We acquired $97.6 million of mortgage loans and $211.9 million of collateralized mortgage backed securities (“CMBS”) pursuant to the Cole Merger and merger with CapLease
9
Inc. (“CapLease”), a Maryland corporation, and certain subsidiaries of each company on May 28, 2013 (the “CapLease Merger”). Investments in real estate mortgages run the risk that one or more borrowers may default under the mortgages and that the collateral securing those mortgages may not be sufficient to enable us to recoup our full investment. Investments in mortgages are also subject to our policy not to be treated as an “investment company” under the Investment Company Act.
Securities of or Interests in Persons Primarily Engaged in Real Estate Activities and Other Issuers
Subject to the asset tests and income tests necessary for REIT qualification, we may invest in securities of other REITs, other entities engaged in real estate activities or securities of other issuers (including partnership interests, limited liability company interests, common stock and preferred stock), where such investment would be consistent with our investment objectives, including for the purpose of exercising control over such entities. There are no limitations on the amount or percentage of our total assets that may be invested in any one issuer, other than those imposed by the gross asset tests we must meet in order to qualify as a REIT under the Internal Revenue Code of 1986, as amended (the “Code”). We do not intend that our investments in securities will require us to register as an “investment company” under the Investment Company Act, and we would generally divest appropriate securities before any such registration would be required.
Build-to-Suit and Properties Under Development
We are also expanding our investment activities beyond the traditional investment in completed properties with tenants in occupancy and paying rents by exploring a build-to-suit program and the acquisition of properties under development. Through the build-to-suit program and acquisition of properties under development or that require substantial refurbishment or renovation, we seek to source investments at higher rates of return relative to completed projects. We believe that by entering into projects with established developer partners, we can provide the capital needed to get projects built, while at the same time securing long-term investment assets for our company at yields significantly higher than those available for completed properties.
Cole Capital®
We acquired Cole Capital as part of our acquisition of Cole. Cole Capital sponsors and manages direct investment programs, which primarily include four publicly registered, non-traded REITs (the “Managed REITS”). Cole Capital is responsible for managing the day-to-day affairs of the Managed REITs, identifying and making acquisitions and investments on behalf of the Managed REITs, and recommending to each of the Managed REIT’s respective board of directors an approach for providing investors with liquidity. Cole Capital serves as the dealer manager and distributes shares of common stock for certain Managed REITs and advises them regarding offerings, manages relationships with participating broker-dealers and financial advisors and provides assistance in connection with compliance matters relating to the offerings. Cole Capital receives compensation and reimbursement for services relating to the Managed REITs’ offerings and the investment, management, financing and disposition of their respective assets, as applicable. Cole Capital also develops new REIT offerings, including obtaining regulatory approvals from the U.S. Securities and Exchange Commission (the “SEC”), the Financial Industry Regulatory Authority, Inc. (“FINRA”) and various blue sky jurisdictions for such offerings.
Joint Ventures
We may acquire or enter into joint ventures from time to time, if we determine that doing so would be the most cost-effective and efficient means of raising capital. Equity investments may be subject to existing mortgage financing and other indebtedness or such financing or indebtedness may be incurred in connection with acquiring investments. Any such financing or indebtedness will have priority over our equity interest in such property.
Financing Policies
We rely on leverage to allow us to invest in a greater number of assets and enhance our asset returns. We expect our leverage levels to decrease over time, as a result of one or more of the following factors: scheduled principal amortization on our debt and lower leverage on new asset acquisitions. We expect to continue to strengthen our balance sheet through debt repayment or repurchase and also opportunistically grow our portfolio through new property acquisitions.
We intend to finance future acquisitions with the most advantageous source of capital available to us at the time of the transaction, which may include a combination of public and private offerings of our equity and debt securities, secured and unsecured corporate-level debt, property-level debt and mortgage financing and other public, private or bank debt. In addition, we may acquire properties in exchange for the issuance of common stock or OP Units and in many cases we may acquire properties subject to existing mortgage indebtedness.
When we use mortgage financing, we generally seek to finance our properties with, or acquire properties subject to, long-term, fixed-rate, non-recourse debt, effectively locking in the spread we expect to generate on our properties and isolating the default risk to solely the properties financed. Through non-recourse debt, we seek to limit the overall company exposure in the
10
event we default on the debt to the amount we have invested in the asset or assets financed. We seek to finance our assets with “match-funded” or substantially “match-funded” debt, meaning that we seek to obtain debt whose maturity matches as closely as possible the lease maturity of the asset financed. At December 31, 2014, our corporate leverage ratio (total debt outstanding less on-hand cash and cash equivalents divided by base purchase price of acquired properties) was 56.6%.
We also may obtain secured or unsecured debt to acquire properties, and we expect that our financing sources will include banks, institutional investment firms, including asset managers and life insurance companies. Although we intend to maintain a conservative capital structure, our charter does not contain a specific limitation on the amount of debt we may incur and the Board of Directors may implement or change target debt levels at any time without the approval of our stockholders.
For information relating to recent amendments to our credit agreement, see “Management’s Discussion and Analysis of Financial Condition and Results of Operations – Liquidity and Capital Resources.” We intend to continue to emphasize unsecured corporate-level or OP-level debt in our financing and to seek to reduce the percentage of our assets which are secured by mortgage loans.
Lending Policies
We do not have a policy limiting our ability to make loans to other persons, although we may be so limited by applicable law, such as the Sarbanes-Oxley Act. Subject to REIT qualification rules, we may make loans to unaffiliated third parties. For example, we may consider offering purchase money financing in connection with the disposition of properties in instances where the provision of that financing would increase the value to be received by us for the property sold. We do not expect to engage in any significant lending in the future. We may choose to guarantee debt of certain joint ventures with third parties. Consideration for those guarantees may include, but is not limited to, fees, long-term management contracts, options to acquire additional ownership interests and promoted equity positions. The Board of Directors may, in the future, adopt a formal lending policy without notice to or consent of our stockholders.
Dividend Policy
Until the completion of the Restatement and the filing of this report and in connection with the Amended Credit Agreement (as defined below), the Company agreed to suspend payment of dividends on its common stock until it complied with certain requirements set forth in such amendments. The Board of Directors is currently evaluating our dividend policy and expects to adopt a policy of paying a common stock dividend in line with our industry peers, while still meeting the minimum distribution requirement to maintain our status as a REIT, as discussed below.
We intend to continue to pay regular monthly dividends to holders of our Series F cumulative redeemable preferred stock. U.S. federal income tax law generally requires that a REIT distribute annually at least 90% of its REIT taxable income, without regard to the deduction for dividends paid and excluding net capital gains, and that it pay tax at regular corporate rates to the extent that it annually distributes less than 100% of its REIT taxable income.
We have the ability to fund dividends from any source, including borrowing funds and using the proceeds of equity and debt offerings. Dividends made by us will be authorized by the Board of Directors in its sole discretion out of funds legally available therefor and will be dependent upon a number of factors, including restrictions under applicable law and our capital requirements.
Tax Status
ARCP currently qualifies and has elected to be taxed as a REIT for federal income tax purposes under Sections 856 through 860 of the Internal Revenue Code. As a REIT, except as discussed below, ARCP generally is not subject to federal income tax on taxable income that it distributes to its stockholders so long as it distributes at least 90% of its annual taxable income (computed without regard to the dividends paid deduction and excluding net capital gains). REITs are subject to a number of other organizational and operational requirements. Even if ARCP maintains its qualification for taxation as a REIT, it may be subject to certain state and local taxes on its income and property, federal income taxes on certain income and excise taxes on its undistributed income.
The OP is classified as a partnership for federal income tax purposes. As a partnership, the OP is not a taxable entity for federal income tax purposes. Instead, each partner in the OP is required to take into account its allocable share of the OP’s income, gains, losses, deductions, and credits for each taxable year. However, the OP may be subject to certain state and local taxes on its income and property.
The Company conducts substantially all of its Cole Capital business operations through a TRS. A TRS is a subsidiary of a REIT that is subject to corporate federal, state and local income taxes, as applicable. The Company’s use of a TRS enables it to engage in certain business activities while complying with the REIT qualification requirements and to retain any income generated by these businesses for reinvestment without the requirement to distribute those earnings. The Company conducts all of its business in the United States and Canada, and as a result, it files income tax returns in the U.S. federal jurisdiction, Canadian federal
11
jurisdiction and various state and local jurisdictions. Certain of the Company’s inter-company transactions that have been eliminated in consolidation for financial accounting purposes are also subject to taxation.
Competition
We are subject to competition in the acquisition of properties and intense competition in the leasing of our properties. We compete with a number of developers, owners and operators of retail, restaurant, industrial and office real estate, many of which own properties similar to ours in the same markets in which our properties are located, in the leasing of our properties. We also may face new competitors and, due to our focus on single-tenant properties located throughout the United States, and because many of our competitors are locally or regionally focused, we will not encounter the same competitors in each region of the United States.
Many of our competitors have greater financial and other resources and may have other advantages over us. Our competitors may be willing to accept lower returns on their investments and may succeed in buying the properties that we have targeted for acquisition. We may also incur costs on unsuccessful acquisitions that we will not be able to recover.
Regulations
Our investments are subject to various federal, state, local and foreign laws, ordinances and regulations, including, among other things, zoning regulations, land use controls, environmental controls relating to air and water quality, noise pollution and indirect environmental impacts such as increased motor vehicle activity. We believe that we have all material permits and approvals necessary under current law to operate our investments.
Environmental Matters
Under various federal, state and local environmental laws, a current owner of real estate may be required to investigate and clean up contaminated property. Under these laws, courts and government agencies have the authority to impose cleanup responsibility and liability even if the owner did not know of and was not responsible for the contamination. For example, liability can be imposed upon us based on the activities of our tenants or a prior owner. In addition to the cost of the cleanup, environmental contamination on a property may adversely affect the value of the property and our ability to sell, rent or finance the property, and may adversely impact our investment in that property.
Prior to acquisition of a property, we will obtain Phase I environmental reports, or will rely on recent Phase I environmental reports. These reports will be prepared in accordance with an appropriate level of due diligence based on our standards and generally include a physical site inspection, a review of relevant federal, state and local environmental and health agency database records, one or more interviews with appropriate site-related personnel, review of the property’s chain of title and review of historic aerial photographs and other information on past uses of the property and nearby or adjoining properties. We may also obtain a Phase II investigation which may include limited subsurface investigations and tests for substances of concern where the results of the Phase I environmental reports or other information indicates possible contamination or where our consultants recommend such procedures.
Employees
As of December 31, 2014, we had approximately 400 employees compared to 12 employees at December 31, 2013.
Inflation
We may be adversely impacted by inflation on any leases that do not contain indexed escalation provisions. However, net leases that require the tenant to pay its allocable share of operating expenses, including common area maintenance costs, real estate taxes and insurance may reduce our exposure to increases in costs and operating expenses resulting from inflation.
Available Information
We electronically file Annual Reports on Form 10-K, Quarterly Reports on Form 10-Q, Current Reports on Form 8-K and all amendments to those reports, and proxy statements, with the SEC. You may read and copy any materials we file with the SEC at the SEC’s Public Reference Room at 100 F Street, NE, Washington, D.C. 20549, or you may obtain information by calling the SEC at 1-800-SEC-0330. The SEC maintains an internet address at http://www.sec.gov that contains reports, proxy statements and information statements, and other information, which you may obtain free of charge. In addition, copies of our filings with the SEC may be obtained from the website maintained for us at www.arcpreit.com.
12
Item 1A. Risk Factors.
This “Risk Factors” section contains references to our “capital stock” and to our “stockholders.” Unless expressly stated otherwise, the references to our “capital stock” represent our common stock and any class or series of our preferred stock, while the references to our “stockholders” represent holders of our common stock and any class or series of our preferred stock.
Risks Related to Recent Events
Following the announcement made by the Company on October 29, 2014 that certain of its financial statements could no longer be relied upon, various broker-dealers and clearing firms participating in offerings of Cole Capital’s Managed REITs suspended sales activity with Cole Capital, resulting in a significant decrease in capital raising activity and, consequently, a decline in the overall revenue generated by Cole Capital. While the Company has completed the Restatement and has become current in its filings with the SEC, there can be no assurance that Cole Capital will successfully or timely reengage some or all of the broker-dealers and clearing firms that formerly participated in its Managed REITs’ offerings and, therefore, the long-term capital raising activity and financial success of Cole Capital could be adversely affected.
Three of the four Managed REITs currently sponsored and managed by Cole Capital have ongoing initial public offerings and are early in their acquisitions stage, with a large amount of real estate acquisitions to come in the future if and, to the extent such Managed REITs raise additional capital in their respective initial public offerings. Following the October 29, 2014 announcement made by the Company that, based upon the preliminary findings of the Audit Committee Investigation, the Audit Committee had concluded that certain of the Company’s financial statements could no longer be relied upon, various broker-dealers and clearing firms which were participating in the initial public offerings of Cole Capital’s Managed REITs notified Cole Capital that for an indefinite period of time, they would not participate in such Managed REITs’ initial public offerings. Further, following such suspensions, Cole Capital experienced certain personnel departures.
Cole Capital generates revenue from capital raising activity and advisory activity, the latter of which is also contingent upon successful capital raising activity as each of the Managed REITs is a blind pool whose portfolio is largely built through the deployment of proceeds received in the respective Managed REIT’s initial public offering. Revenue generated from Cole Capital’s capital raising activity is received in the form of dealer manager fees, which are earned at the point of sale of the Managed REITs’ common stock and, therefore, a reduction in capital raising activity directly results in a reduction in such dealer manager fees. Additionally, Cole Capital receives one-time acquisition fees and ongoing advisory fees from its advisory activity. Acquisition fees are earned, in large part, when Cole Capital deploys raised capital from a Managed REIT’s initial public offering into real estate acquisitions. Cole Capital also receives advisory fees determined by the value of each Managed REIT’s total assets. An increase in assets under management, which occurs as the Managed REITs deploy more raised capital, results in increased advisory fees. If the Managed REITs receive little or no proceeds from their initial public offerings, Cole Capital will receive little or no acquisition fees and asset management fees will remain at their same levels as the Managed REITs’ portfolios experience little increase in value, if any. Additional fees may be earned by Cole Capital following the completion of a Managed REIT’s initial public offering and deployment of capital therefrom and, therefore, a slowdown in capital raising activity could delay or eliminate Cole Capital’s receipt of those additional fees. A description of Cole Capital’s fees is contained in Note 20 – Related Party Transactions and Arrangements to the consolidated financial statements in this report.
While the Company has completed the Restatement and become current in its filings with the SEC, there can be no assurance that any or all of the broker-dealers and clearing firms participating in the initial public offerings of Cole Capital’s Managed REITs will reengage with Cole Capital on a timely basis or at all and that Cole Capital will find suitable replacements for its recently departed personnel. If these circumstances continue for a prolonged period of time, capital raising activity at Cole Capital would be negatively affected, reducing overall fee generation at Cole Capital and, therefore, the overall financial success of Cole Capital and the Company could be adversely affected and have an adverse effect on our financial condition, results of operations and cash flows. During the year ended December 31, 2014, we recorded significant impairment charges relating to the intangible asset value associated with the dealer manager and advisory contracts of the Managed REITs. See Note 3 – Summary of Significant Accounting Policies to the consolidated financial statements in this report for discussion of impairment charges.
Government investigations relating to the findings of the Audit Committee Investigation may require significant management time and attention, result in significant legal expenses or damages and cause our business, financial condition, results of operations and cash flows to suffer.
On November 13, 2014, we received the first of two subpoenas relating to the findings of the Audit Committee Investigation from the staff of the SEC, each of which calls for the production of documents. On December 19, 2014, we received a subpoena from the Securities Division of the Office of the Secretary of the Commonwealth of Massachusetts. The U.S. Attorney’s Office for the Southern District of New York has contacted counsel for the Company and counsel for the Audit Committee. We and the Audit Committee are cooperating with these regulators in their investigations. The amount of time needed to resolve these investigations is uncertain, and we cannot predict the outcome of these investigations or whether we will face additional government
13
investigations, inquiries or other actions related to the matters described in this filing. Subject to certain limitations, we are obligated to indemnify our current and former directors, officers and employees in connection with the ongoing governmental investigations and any future government inquiries, investigations or actions. These matters could require us to expend significant management time and incur significant legal and other expenses and could result in civil and criminal actions seeking, among other things, injunctions against us and the payment of significant fines and penalties by us, which could have a material adverse effect on our financial condition, business, results of operations and cash flow. If any of these governmental authorities were to commence legal action, we could be required to pay significant penalties and could become subject to injunctions, a cease and desist order and other equitable remedies. We can provide no assurance as to the outcome of any governmental investigation.
ARCP and certain of our current and former officers and directors have been named as defendants in various lawsuits and other proceedings related to the findings of the Audit Committee Investigation and those lawsuits and other proceedings may require significant management time and attention, result in significant legal expenses or damages, including indemnification obligations, and have a material adverse effect on our business, financial condition, results of operations and cash flows.
Between October 30, 2014 and January 20, 2015, the Company and its current and former officers and directors (along with others) were named as defendants in ten putative securities class action complaints in the United States District Court for the Southern District of New York. At a February 10, 2015 status conference, the court consolidated these actions and appointed a lead plaintiff. The consolidated case is captioned In re American Realty Capital Properties, Inc. Litigation, 1:15-mc-00040-AKH. The consolidated class action complaint asserts claims for violations of Sections 11, 12(a)(2) and 15 of the Securities Act of 1933 and Sections 10(b), 14(a) and 20(a) of the Securities Exchange Act of 1934 and Rules 10b-5 and 14a-9 promulgated thereunder, arising out of allegedly false and misleading statements in connection with the purchase or sale of the Company’s securities. The proposed class period runs from May 6, 2013 to October 29, 2014. In light of certain additional disclosures made by the Company on March 2, 2015, lead plaintiff has indicated an intention to file an amended class action complaint. The court has set a deadline of April 17 for lead plaintiff to file its amended complaint, and set a deadline of May 29 for the defendants to respond to the amended complaint.
In addition, on November 25, 2014, an additional putative securities class action complaint was filed in the Circuit Court for Baltimore County, Maryland, which the Company removed to the United States District Court for the District of Maryland (Northern Division) on December 23, 2014 and seeks to have transferred to the Southern District of New York. This action asserts claims for violations of Sections 11 and 15 of the Securities Act of 1933, arising out of allegedly false and misleading statements made in connection with the Company’s securities issued in connection with the Cole Merger. The Company is not yet required to respond to this complaint.
Between November 17, 2014 and January 29, 2015, nine shareholder derivative actions, purportedly in the name and for the benefit of the Company, were filed against certain of the Company’s current and former officers and directors in the United States District Court for the Southern District of New York, the Circuit Court for Baltimore City, Maryland and the Supreme Court of the State of New York. On February 9, 2015 and February 20, 2015, three of the plaintiffs who filed actions in the New York federal court voluntarily dismissed those actions without prejudice. The remaining six actions seek money damages and other relief on behalf of the Company for, among other things, alleged breaches of fiduciary duty, abuse of control, gross mismanagement and unjust enrichment in connection with the alleged conduct underlying the claims asserted in the securities class actions negligence and breach of contract. On February 10, 2015 status conference, the court consolidated the SDNY Derivative Actions under the caption Serafin v. Schorsch, et al., No. 14-cv-9672 (AKH) (the “SDNY Consolidated Derivative Action”) and directed the plaintiffs to file a consolidated amended complaint by March 10, 2015. On February 18, 2015, the parties to the New York Derivative Action entered into a stipulation setting a deadline of April 20, 2015 for the Company and defendants to respond to the complaint in the action. On March 10, 2015, the plaintiffs in the SDNY Consolidated Derivative Action filed a consolidated amended complaint. The Company and defendants are required to file motions to dismiss the consolidated amended complaint in the SDNY Consolidated Derivative Action by April 3, 2015. On March 18, 2015, the parties to the Maryland Derivative Actions entered into a stipulation providing for, among other things, the consolidation of those actions. The plaintiffs and certain defendants in the Maryland state action have sought to consolidate those two actions, after which the plaintiffs intend to file a consolidated complaint.
On December 18, 2014, a former employee, Lisa McAlister, filed a defamation action against the Company and certain of its former officers and directors in the New York Supreme Court, captioned McAlister v. American Realty Capital Properties, Inc., et al., Index No. 162499/2014. On January 26, 2015, ARCP and defendants filed a motion to dismiss plaintiff’s complaint. Subsequently, Ms. McAlister voluntarily dismissed her complaint.
On January 7, 2015, Ms. McAlister also filed a complaint, No. 2-4173-15-016, with the Occupational Safety and Health Administration of the United States Department of Labor. Subsequently, Ms. McAlister voluntarily withdrew her complaint.
14
On January 15, 2015, the Company and certain of its former directors and officers were named as defendants in an individual securities fraud action filed in the United States District Court for the Southern District of New York, captioned Jet Capital Master Fund, L.P. v. American Realty Capital Properties, Inc., et al., No. 15-cv-307 (AKH) (the “Jet Capital Action”). The Jet Capital Action seeks money damages and asserts claims for alleged violations of Sections 10(b), 18 and 20(a) of the Securities Exchange Act of 1934 and Rule 10b-5 promulgated thereunder, as well as common law fraud under New York law in connection with the purchase of the Company’s securities. At the request of the parties, the court has set a deadline of May 29 for the defendants to respond to the complaint.
On February 20, 2015, the Company, certain of its current and former directors and officers, and ARC Properties Operating Partnership L.P. (in addition to several other individuals and entities) were named as defendants in an individual securities fraud action filed in the United States District Court for the Southern District of New York, captioned Twin Securities, Inc. v. American Realty Capital Properties, Inc., et al., No. 15-cv-1291 (the “Twin Securities Action”). The Twin Securities Action seeks money damages and asserts claims for alleged violations of Sections 10(b), 14(a), 18, and 20(a) of the Securities Exchange Act of 1934 and Rules 10b-5 and 14a-9 promulgated thereunder, Sections 11, 12(a)(2), and 15 of the Securities Act of 1933, as well as common law fraud under New York law in connection with the purchase of the Company’s securities. The Company is not yet required to respond to the complaint in the Twin Securities Action.
As a result of the various litigations described above, we may be obligated to advance legal expenses to and indemnify our current and former directors, officers and employees, as well as certain outside individuals and entities, including underwriters of prior securities offerings and directors of Cole Real Estate Investment, Inc. and ARCT IV. In addition, any of these lawsuits or other legal proceedings may require significant management time and attention, result in significant legal expenses or damages and have a material adverse effect on the Company’s business, financial condition, results of operations and cash flows.
We have identified material weaknesses in our disclosure controls and procedures and internal control over financial reporting. If not remediated, our failure to establish and maintain effective disclosure controls and procedures and internal control over financial reporting could result in material misstatements in our financial statements and a failure to meet our reporting and financial obligations, each of which could have a material adverse effect on our financial condition and the trading price of our common stock.
Maintaining effective internal control over financial reporting and effective disclosure controls and procedures are necessary for us to produce reliable financial statements. As previously disclosed in connection with the Restatements, the Company’s new management concluded that, as a result of certain material weaknesses at each evaluation date, the Company’s disclosure controls and procedures and internal control over financial reporting were not effective at December 31, 2013, March 31, 2014 June 30, 2014 or September 30, 2014. Although, during the fourth quarter of 2014, the Company’s prior senior management resigned and new management commenced taking remedial actions, the existing material weaknesses had not been remediated at December 31, 2014 and, accordingly, management concluded that our disclosure controls and procedures and our internal control over financial reporting were not effective at that date. See Item 9A – “Controls and Procedures.”
A material weakness is defined as a deficiency, or a combination of deficiencies, in internal control over financial reporting such that there is a reasonable possibility that a material misstatement of our annual or interim financial statements will not be prevented or detected on a timely basis. The Company is committed to remediating its material weaknesses as promptly as possible. Implementation of the Company’s remediation plans has commenced and is being overseen by the Audit Committee. However, there can be no assurance as to when these material weaknesses will be remediated or that additional material weaknesses will not arise in the future. Any failure to remediate the material weaknesses, or the development of new material weaknesses in our internal control over financial reporting, could result in material misstatements in our financial statements and cause us to fail to meet our reporting and financial obligations, which in turn could have a material adverse effect on our financial condition and the trading price of our common stock.
We have not been in compliance with the requirements of NASDAQ for continued listing, and if NASDAQ does not concur that we have adequately remedied our non-compliance, our common stock may be delisted from trading on NASDAQ, which could have a material adverse effect on us and our shareholders.
We were delinquent in the filing of our Quarterly Report on Form 10-Q for the fiscal period ended September 30, 2014 (the “Third Quarter 10-Q”) and this Annual Report on Form 10-K for the fiscal year ended December 31, 2014. As a result, we have not been in compliance with the listing rules of NASDAQ. On January 12, 2015, we submitted a compliance plan to NASDAQ and the staff at NASDAQ granted us an exception to file our Third Quarter 10-Q and any other delinquent SEC filings on or before April 15, 2015 in order to enable us to regain compliance with the listing rules. We filed our Third Quarter 10-Q with the SEC on March 2, 2015 and have now filed this Form 10-K. As a result, we currently believe that we have adequately remedied our non-compliance with NASDAQ’s listing rules within NASDAQ’s terms of exception. However, there can be no assurance that NASDAQ will concur that we have remedied our current non-compliance, in which case our common stock could remain subject to delisting
15
by NASDAQ. Moreover, although we may be able to avail ourselves of a cure period, if the Board of Directors does not appoint additional independent directors on or before April 1, 2015, we will not be in compliance with NASDAQ rules requires that we have a majority of independent directors and a three-member Audit Committee. If our common stock were delisted, there can be no assurance whether or when it would again be listed for trading on NASDAQ or any other securities exchange. In addition, the market price of our shares might decline and become more volatile, and our shareholders might find that their investment in our shares has limited liquidity. Furthermore, institutions whose charters do not allow them to hold securities in unlisted companies might sell our shares, which could have a further adverse effect on the price of our stock.
Prior to the filing of this report and the provision of other required deliverables to the lenders under the credit facility, the amended credit agreement prohibited us and the OP from making distributions in respect of their respective common equity; although ARCP and the OP expect to this prohibition to end on the filing date of this report, there can be no assurance as to when or at what rate we and the OP will resume common equity distributions.
In connection with their entry into the Consent and Waiver (as defined below), ARCP and the OP agreed that, until such time as they had delivered the required financial statements and provided certain other financial deliverables to the lenders under the amended and restated credit agreement (the “Amended Credit Agreement”), ARCP and the OP would not make distribution payments in respect of our respective common equity. They expect this prohibition to end on the date of filing this report and providing this report and the other requisite deliverables to the lenders. However, there can be no assurance as to the timing of the declaration of their common stock distribution or the rate or frequency at which such distribution will be set and there can be no assurance that the rate at which they reinstate their common equity distributions will be consistent with the previous common equity distribution rate and frequency. Further, their ability to fund any future common equity distributions to be paid by ARCP and the OP to their respective common equity holders may be adversely affected by their recently reduced borrowing capacity under the Amended Credit Agreement.
The recent downgrades in our credit ratings by Standard & Poor’s and Moody’s could impact our access to capital and materially adversely affect our business and financial condition.
The credit ratings for our senior notes have been downgraded by Moody’s Investor Service, Inc. and Standard & Poor’s Rating Services to a non-investment grade credit rating and there can be no assurance that they will not be downgraded further. The current downgrade, and any further downgrade, could adversely affect the cost and availability of capital we can access, as well as the terms of any financing we obtain. Since we depend in part on debt financing to fund our growth, such an adverse change in our credit rating could have a material adverse effect on our financial condition, results of operations and liquidity, the trading price of the notes, and future growth and on transactions in which we must obtain debt capital at an advantageous cost. Credit ratings are not recommendations to purchase, hold or sell the notes. Additionally, credit ratings may not reflect the potential effect of risks relating to the structure or marketing of the notes.
As a result of the delayed filing of our periodic reports with the SEC, we are not currently eligible to use a registration statement on Form S-3 to register the offer and sale of securities, which may adversely affect our ability to raise future capital or complete acquisitions.
We are not currently eligible to register the offer and sale of our securities using a registration statement on Form S-3 and we will not become eligible until we have timely filed certain periodic reports required under the Securities Exchange Act of 1934 for 12 consecutive calendar months. There can be no assurance when we will meet this requirement, which depends in part upon our ability to file our periodic reports on a timely basis in the future. Should we wish to register the offer and sale of our securities to the public before we are eligible to do so on Form S-3, our transaction costs and the amount of time required to complete the transaction could increase, making it more difficult to execute any such transaction successfully and potentially having an adverse effect on our financial condition.
Risks Related to Our Properties and Operations
Our growth will partially depend upon our ability to successfully acquire future properties, and we may be unable to enter into and consummate property acquisitions on advantageous terms or our property acquisitions may not perform as we expect due to competitive conditions and other factors.
We acquire primarily freestanding, single-tenant properties net leased primarily to investment-grade and other credit tenants. The acquisition of properties entails various risks, including the risks that our investments may not perform as we expect, that we may be unable to quickly and efficiently integrate our new acquisitions into our existing operations and that our cost estimates for bringing an acquired property up to market standards may prove inaccurate. Further, we expect to finance future acquisitions through a combination of borrowings under a credit facility with Wells Fargo, National Association, as administrative agent and other lenders party thereto (the “Credit Facility”), as amended, proceeds from equity or debt offerings by ARCP or the Operating Partnership or its subsidiaries and proceeds from property contributions and divestitures, which may not be available and which
16
could adversely affect our cash flows. Any of the above risks could adversely affect our financial condition, results of operations, cash flows and ability to pay distributions on, and the market price of, our common stock.
In addition, our growth strategy includes the disciplined acquisition of properties as opportunities arise. Our ability to acquire properties on satisfactory terms and successfully integrate and operate them is subject to the following significant risks:
| • | we may be unable to acquire desired properties because of competition from other real estate investors with more capital, including other real estate operating companies, REITs and investment funds, including the Managed REITs; |
| • | we may acquire properties that are not accretive to our results upon acquisition, and we may not successfully manage and lease those properties to meet our expectations; |
| • | competition from other potential acquirers may significantly increase the purchase price of a desired property; |
| • | we may be unable to generate sufficient cash from operations, or obtain the necessary debt or equity financing to consummate an acquisition or, if obtainable, financing may not be on satisfactory terms; |
| • | we may need to spend more than budgeted amounts to make necessary improvements or renovations to acquired properties; |
| • | agreements for the acquisition of properties are typically subject to customary conditions to closing, including satisfactory completion of due diligence investigations, and we may spend significant time and money on potential acquisitions that we do not consummate; |
| • | the process of acquiring or pursuing the acquisition of a new property may divert the attention of our management from our existing business operations; |
| • | we may be unable to quickly and efficiently integrate new acquisitions, particularly acquisitions of portfolios of properties, into our existing operations; |
| • | market conditions may result in future vacancies and lower-than-expected rental rates; and |
| • | we may acquire properties without any recourse, or with only limited recourse, for liabilities, whether known or unknown, such as cleanup of environmental contamination, claims by tenants, vendors or other persons against the former owners of the properties and claims for indemnification by general partners, directors, officers and others indemnified by the former owners of the properties. |
If we cannot complete property acquisitions on favorable terms, or operate acquired properties to meet our goals or expectations, our business, financial condition, results of operations and cash flow, the per share trading price of our common stock, and our ability to satisfy our debt service obligations and to pay dividends to our stockholders could be materially adversely affected.
We may be unable to renew leases, lease vacant space or re-lease space as leases expire on favorable terms or at all, which could have a material adverse effect on our financial condition, results of operations, cash flow, cash available for dividends to our stockholders, the per share trading price of our common stock and our ability to satisfy our debt service obligations.
Because we compete with a number of real estate operators in connection with the leasing of our properties, the possibility exists that one or more of our tenants will extend or renew its lease with us when the lease term expires on terms that are less favorable to us than the terms of the then-expiring lease, or that such tenant or tenants will not renew at all. Because we depend, in large part, on rental payments from our tenants, if one or more tenants renews its lease on terms less favorable to us, does not renew its lease or we do not re-lease a significant portion of the space made available due to vacancy, our financial condition, results of operations, cash flow, cash available for dividends to our stockholders, the per share trading price of our common stock and our ability to satisfy our debt service obligations could be materially adversely affected.
We are dependent on single-tenant leases for our revenue and, accordingly, lease terminations or tenant defaults could have a material adverse effect on our results of operations.
We focus our investment activities on ownership of freestanding, single-tenant commercial properties that are net leased to a single tenant. Therefore, the financial failure of, or other default in payment by, a single tenant under its lease is likely to cause a significant reduction in our operating cash flows from that property and a significant reduction in the value of the property, and could cause a significant reduction in our revenues. If a lease is terminated or defaulted on, we may experience difficulty or significant delay in re-leasing such property, or we may be unable to find a new tenant to re-lease the vacated space, which could result in us incurring a loss. To the extent that we have entered into a master lease with a particular tenant, the termination of such master lease could affect each property subject to the master lease, resulting in the loss of revenue from all such properties. Additionally, we would then be obligated to re-lease all of the locations previously subject to the master lease. Overall, the current economic conditions may put financial pressure on and increase the likelihood of the financial failure of, or other default in payment by, one or more of the tenants to whom we have exposure.
17
The failure by any major tenant with leases in multiple locations to make rental payments to us, because of a deterioration of its financial condition or otherwise, or the termination or non-renewal of a lease by a major tenant, would have a material adverse effect on us.
Our ability to generate cash from operations is dependent on the rents that we are able to charge and collect from our tenants. While we evaluate the creditworthiness of our tenants by reviewing available financial and other pertinent information, there can be no assurance that any tenant will be able to make timely rental payments or avoid defaulting under its lease. At any time, our tenants may experience an adverse change in their business. For example, the downturn in the global economy that commenced in 2008 may have adversely affected, or may in the future adversely affect, one or more of our tenants. If any of our tenants’ businesses experience significant adverse changes, they may decline to extend or renew leases upon expiration, fail to make rental payments when due, close a number of stores, exercise early termination rights (to the extent such rights are available to the tenant) or declare bankruptcy. If a tenant defaults, we may experience delays in enforcing our rights as landlord and may incur substantial costs in protecting our investment.
If any of the foregoing were to occur, it could result in the termination of the tenant’s leases and the loss of rental income attributable to the terminated leases. If a lease is terminated or defaulted on, we may be unable to find a new tenant to re-lease the vacated space at attractive rents or at all, which would have a material adverse effect on our results of operations and our financial condition. Furthermore, the consequences to us would be exacerbated if one of our major tenants were to experience an adverse development in its business that resulted in it being unable to make timely rental payments or to default under its lease. The occurrence of any of the situations described above would have a material adverse effect on our results of operations and our financial condition.
The acquisition of the Red Lobster Portfolio resulted in 11.6% of our annualized base rent as of December 31, 2014 being derived from a single tenant, which is a non-investment grade tenant that owns a business that has previously reported declines in revenues and other operational difficulties.
The acquisition of the Red Lobster Portfolio resulted in 11.6% of annualized base rent as of December 31, 2014 being derived from a single tenant, a wholly owned subsidiary of Golden Gate Capital. A downturn in the demand for casual restaurant dining generally or casual seafood dining at Red Lobster® restaurants specifically could adversely impact the ability of such tenant to satisfy its rent obligations. In addition, Red Lobster does not constitute an investment grade tenant and has reported declines in revenue. A default by such tenant could result in a material reduction in our cash flows or result in material losses in the value of our property portfolio.
If a sale-leaseback transaction is re-characterized in a tenant’s bankruptcy proceeding, our financial condition could be adversely affected.
We have entered and may continue to enter into sale-leaseback transactions. In a sale-leaseback transaction, we purchase a property and then lease it back to the person from whom we purchased it. In the event of the bankruptcy of a tenant, a transaction structured as a sale-leaseback may be re-characterized as either a financing or a joint venture, either of which outcomes could adversely affect our financial condition, cash flow and the amount available for distributions to our stockholders.
If the sale-leaseback were re-characterized as a financing, we might not be considered the owner of the property and, as a result, would have the status of a creditor in relation to the tenant. In that event, we would no longer have the right to sell or encumber our ownership interest in the property. Instead, we would have a claim against the tenant for the amounts owed under the lease, with the claim arguably secured by the property. The tenant/debtor might have the ability to propose a plan restructuring the term, interest rate and amortization schedule of its outstanding balance. If confirmed by the bankruptcy court, we could be bound by the new terms and prevented from foreclosing our lien on the property. If the sale-leaseback were re-characterized as a joint venture, our lessee and we could be treated as co-venturers with regard to the property. As a result, we could be held liable, under some circumstances, for debts incurred by the lessee relating to the property.
We are subject to tenant geographic concentrations that make us more susceptible to adverse events with respect to certain geographic areas.
We are subject to geographic concentrations, the most significant of which, as of December 31, 2014, are the following:
| • | $175.3 million, or 12.7%, of our annualized rental income came from properties located in Texas; |
| • | $82.3 million, or 6.0%, of our annualized rental income came from properties located in Illinois; |
| • | $81.1 million, or 5.9%, of our annualized rental income came from properties located in Florida; |
| • | $75.7 million, or 5.5%, of our annualized rental income came from properties located in California; and |
| • | $67.9 million, or 4.9%, of our annualized rental income came from properties located in Georgia. |
18
Any downturn of the economies in one or more of these states, or in any other state in which we, may have a significant credit concentration in the future, could result in a material reduction of our cash flows or material losses to us.
Our net leases may require us to pay property-related expenses that are not the obligations of our tenants.
Under the terms of the majority of our net leases, in addition to satisfying their rent obligations, our tenants are responsible for the payment of real estate taxes, insurance and ordinary maintenance and repairs. However, under the provisions of certain existing leases and leases that we may enter into in the future with our tenants, we may be required to pay some expenses, such as the costs of environmental liabilities, roof and structural repairs, insurance, certain non-structural repairs and maintenance. If our properties incur significant expenses that must be paid by us under the terms of our leases, our business, financial condition and results of operations will be adversely affected and the amount of cash available to meet expenses and to pay dividends to holders of our capital stock may be reduced.
Net leases may not result in fair market lease rates over time, which could negatively impact our income and reduce the amount of funds available to make distributions to stockholders.
The vast majority of our rental income comes from net leases, which generally provide the tenant greater discretion in using the leased property than ordinary property leases, such as the right to freely sublease the property, to make alterations in the leased premises and to terminate the lease prior to its expiration under specified circumstances. Furthermore, net leases typically have longer lease terms and, thus, there is an increased risk that contractual rental increases in future years will fail to result in fair market rental rates during those years. As a result, our income and distributions to our stockholders could be lower than they would otherwise be if we did not enter into net leases.
Long-term leases with tenants may not result in fair value over time.
Long-term leases do not allow for significant changes in rental payments and do not expire in the near term. If we do not accurately judge the potential for increases in market rental rates when negotiating these long-term leases, significant increases in future property operating costs, to the extent not covered under the net leases, could result in us receiving less than fair value from these leases. These circumstances would adversely affect our revenues and funds available for distribution to our stockholders.
Any of our properties that incurs a vacancy could be difficult to sell or re-lease.
We have and may continue to experience vacancies either by the continued default of a tenant under its lease or the expiration of one of our leases. Certain of our properties may be specifically suited to the particular needs of a tenant (e.g., a retail bank branch or distribution warehouse) and major renovations and expenditures may be required in order for us to re-lease vacant space for other uses. We may have difficulty obtaining a new tenant for any vacant space we have in our properties, including our presently vacant property. If the vacancies continue for a long period of time, we may suffer reduced revenues, resulting in less cash available to be distributed to stockholders. In addition, the resale value of a property could be diminished because the market value of a particular property will depend principally upon the value of the leases of such property.
Our properties may be subject to impairment charges.
We periodically evaluate our real estate investments for impairment indicators. The judgment regarding the existence of impairment indicators is based on factors such as market conditions, tenant performance and legal structure. For example, the early termination of, or default under, a lease by a tenant may lead to an impairment charge. Since our investment focus is on properties net leased to a single tenant, the financial failure of, or other default in payment by, a single tenant under its lease may result in a significant impairment loss. If we determine that an impairment has occurred, we would be required to make an adjustment to the net carrying value of the property, which could have a material adverse effect on our results of operations in the period in which the impairment charge is recorded. During the year ended December 31, 2014, we recorded significant property related impairment charges. See Note 3 – Summary of Significant Accounting Policies to the consolidated financial statements in this report for discussion of impairment charges.
Our real estate investments are relatively illiquid and therefore we may not be able to dispose of properties when appropriate or on favorable terms.
The real estate investments made, and to be made, by us are relatively difficult to sell quickly. Return of capital and realization of gains, if any, from an investment generally will occur upon disposition or refinancing of a property. In addition, the Internal Revenue Code of 1986, as amended (the “Code”), imposes restrictions on the ability of a REIT to dispose of properties that are not applicable to other types of real estate companies. We may be unable to realize our investment objectives by disposition or refinancing of a property at attractive prices within any given period of time or may otherwise be unable to complete any exit strategy. In particular, these risks could arise from weakness in or even the lack of an established market for a property, changes
19
in the financial condition or prospects of prospective purchasers, changes in national or international economic conditions, and changes in laws, regulations or fiscal policies of jurisdictions in which the property is located.
Our investments in properties backed by below investment grade credits will have a greater risk of default.
As of December 31, 2014, 53.1% of our annualized rental income is derived from tenants who do not have investment grade credit ratings from a major ratings agency or are not affiliates of companies having an investment grade credit rating. We also may invest in other properties in the future where the tenant is not rated or the tenant’s credit rating is below investment grade. These investments will have a greater risk of default and bankruptcy than investments in properties leased exclusively to investment grade tenants.
Our investments in properties where the underlying tenant does not have a publicly available credit rating will expose us to certain risks.
When we invest in properties where the underlying tenant does not have a publicly available credit rating, we will rely on our own estimates of the tenant’s credit rating. If our lender or a credit rating agency disagrees with our ratings estimates, or our ratings estimates are inaccurate, we may not be able to obtain our desired level of leverage or our financing costs may exceed those that we projected. This outcome could have an adverse impact on our returns on that asset and hence our operating results.
ARCP has a history of operating losses and cannot assure you that it will achieve profitability.
Since ARCP’s inception in 2010, ARCP has experienced net losses (calculated in accordance with GAAP) each fiscal year and, as of December 31, 2014, had an accumulated deficit of $2.8 billion. The extent of ARCP’s future operating losses and the timing of when ARCP will achieve profitability are uncertain, and depends on the demand for, and value of, ARCP’s portfolio of properties and ARCP may never achieve or sustain profitability.
Dividends paid from sources other than our cash flow from operations, particularly from proceeds of financings, will result in us having fewer funds available for the acquisition of properties and other real estate-related investments and may dilute stockholders’ interests in us, which may adversely affect our ability to fund future dividends with cash flow from operations and may adversely affect stockholders’ overall return.
Our cash flows provided by operations were $502.9 million for the year ended December 31, 2014. During the year we paid dividends of $920.3 million partially funded from cash flows from operations and through $3.3 billion from proceeds of financing activities, which exclude dividends paid. Additionally, we may in the future pay dividends from sources other than from our cash flow from operations.
We may not generate sufficient cash flow from operations to pay dividends. If we have not generated sufficient cash flow from our operations and other sources, such as from borrowings, and/or the sale of additional securities to fund distributions, we may use the proceeds from offerings of securities. We have not established any limit on the amount of proceeds from an offering that may be used to fund dividends, except that, in accordance with our organizational documents and Maryland law, we may not make dividend distributions that would: (1) cause us to be unable to pay our debts as they become due in the usual course of business; (2) cause our total assets to be less than the sum of our total liabilities plus senior liquidation preferences; or (3) jeopardize our ability to qualify as a REIT.
If we fund dividends from the proceeds of offerings of securities, we will have less funds available for acquiring properties or other real estate-related investments. As a result, the return you realize on your investment may be reduced. Funding dividends from borrowings could restrict the amount we can borrow for investments, which may affect our profitability. Funding dividends with the sale of assets or the proceeds of offerings of securities may affect our ability to generate cash flows. Funding dividends from the sale of additional securities could dilute your interest in us if we sell shares of our common stock or securities convertible or exercisable into shares of our common stock to third party investors. Payment of dividends from these sources could restrict our ability to generate sufficient cash flow from operations, affect our profitability and/or affect the dividends payable to you upon a liquidity event, any or all of which may have an adverse effect on your investment.
We disclose Funds from Operations (“FFO”) and adjusted funds from operations (“AFFO”), which are non-GAAP financial measures, including in documents filed with the SEC; however, FFO and AFFO are not equivalent to our net income or loss as determined under GAAP, and you should consider GAAP measures to be more relevant to our operating performance.
We use and disclose to investors FFO and AFFO, which are non-GAAP financial measures. See ’’Management’s Discussion and Analysis of Financial Condition and Results of Operations - Funds from Operations and Adjusted Funds from Operations.’’ FFO and AFFO are not equivalent to our net income or loss as determined in accordance with GAAP, and investors should consider GAAP measures to be more relevant to evaluating our operating performance. FFO and AFFO and GAAP net income differ because
20
one or both of FFO and AFFO exclude gains and losses from the sale of property, plus depreciation and amortization, merger related and other non-routine transaction costs, acquisition-related fees and expenses and other non cash charges.
Because of the differences between FFO and AFFO and GAAP net income or loss, FFO and AFFO may not be accurate indicators of our operating performance, especially during periods in which we are acquiring properties. In addition, FFO and AFFO are not necessarily indicative of cash flow available to fund cash needs and investors should not consider FFO and AFFO as alternatives to cash flows from operations, as an indication of our liquidity, or as indicative of funds available to fund our cash needs, including our ability to make distributions to our stockholders.
Neither the SEC nor any other regulatory body has passed judgment on the acceptability of the adjustments that we use to calculate FFO and AFFO. Also, because not all companies calculate FFO and AFFO the same way, comparisons with other companies may not be meaningful.
Operating expenses of our properties will reduce our cash flow and funds available for future distributions.
For certain of our properties, we are responsible for some or all of the operating costs of the property. In some of these instances, our leases require the tenant to reimburse us for all or a portion of these costs, either in the form of an expense reimbursement or increased rent. Our reimbursement may be limited to a fixed amount or a specified percentage annually. To the extent operating costs exceed our reimbursement, our returns and net cash flows from the property and hence our overall operating results and cash flows could be materially adversely affected.
We would face potential adverse effects from tenant defaults, bankruptcies or insolvencies.
The bankruptcy of our tenants may adversely affect the income generated by our properties. If our tenant files for bankruptcy, we generally cannot evict the tenant solely because of such bankruptcy. In addition, a bankruptcy court could authorize a bankrupt tenant to reject and terminate its lease with us. In such a case, our claim against the tenant for unpaid and future rent would be subject to a statutory cap that might be substantially less than the remaining rent actually owed under the lease, and it is unlikely that a bankrupt tenant would pay in full amounts it owes us under the lease. Any shortfall resulting from the bankruptcy of one or more of our tenants could adversely affect our cash flow and results of operations.
We have assumed, and expect in the future to continue to assume, liabilities in connection with our property acquisitions, including unknown liabilities.
We have assumed existing liabilities, some of which may have been unknown or unquantifiable at the time of the transaction, related to our formation transactions, the Recent Acquisitions and certain other property acquisitions, and expect in the future to continue to assume existing liabilities related to our property acquisitions. Unknown liabilities might include liabilities for cleanup or remediation of undisclosed environmental conditions, claims of tenants or other persons dealing with the sellers prior to our acquisition of the properties, tax liabilities, employment-related issues, and accrued but unpaid liabilities whether incurred in the ordinary course of business or otherwise. If the magnitude of such unknown liabilities is high, either singly or in the aggregate, they could adversely affect our business, financial condition, results of operations, cash flow, per share trading price of our common stock and ability to satisfy our debt service obligations and to make distributions to our stockholders.
We face intense competition, which may decrease or prevent increases in the occupancy and rental rates of our properties.
We compete with numerous developers, owners and operators of retail, industrial and office real estate, many of which own properties similar to ours in the same markets in which our properties are located. If one of our properties becomes vacant and our competitors (which would include funds sponsored by us) offer space at rental rates below current market rates, or below the rental rates we currently charge our tenants, we may lose existing or potential tenants and we may be pressured to reduce our rental rates below those we currently charge or to offer substantial rent abatements. As a result, our financial condition, results of operations, cash flow, per share trading price of our common stock and ability to satisfy our debt service obligations and to pay dividends to our stockholders may be adversely affected.
The value of our real estate investments is subject to risks associated with our real estate assets and with the real estate industry.
Our real estate investments are subject to various risks, fluctuations and cycles in value and demand, many of which are beyond our control. Certain events may decrease cash available for dividends, as well as the value of our properties. These events include, but are not limited to:
| • | adverse changes in international, national or local economic and demographic conditions such as the recent global economic downturn; |
| • | vacancies or our inability to rent space on favorable terms, including possible market pressures to offer tenants rent abatements, tenant improvements, early termination rights or tenant-favorable renewal options; |
21
| • | adverse changes in financial conditions of buyers, sellers and tenants of properties; |
| • | inability to collect rent from tenants; |
| • | competition from other real estate investors with significant capital, including other real estate operating companies, REITs and institutional investment funds; |
| • | reductions in the level of demand for commercial space generally, and freestanding net leased properties specifically, and changes in the relative popularity of our properties; |
| • | increases in the supply of freestanding single-tenant properties; |
| • | fluctuations in interest rates, which could adversely affect our ability, or the ability of buyers and tenants of our properties, to obtain financing on favorable terms or at all; |
| • | increases in expenses, including, but not limited to, insurance costs, labor costs, energy prices, real estate assessments and other taxes and costs of compliance with laws, regulations and governmental policies, all of which have an adverse impact on the rent a tenant may be willing to pay us in order to lease one or more of our properties; and |
| • | changes in, and changes in enforcement of, laws, regulations and governmental policies, including, without limitation, health, safety, environmental, zoning and tax laws, governmental fiscal policies and the Americans with Disabilities Act of 1990. |
In addition, periods of economic slowdown or recession, such as the recent global economic downturn, rising interest rates or declining demand for real estate, or the public perception that any of these events may occur, could result in a general decline in rents or an increased incidence of defaults under existing leases. If we cannot operate our properties to meet our financial expectations, our business, financial condition, results of operations and cash flow, the market price of our common stock and our ability to satisfy our debt service obligations and to pay dividends to our stockholders could be materially adversely affected.
A potential change in U.S. accounting standards regarding operating leases may make the leasing of our properties less attractive to our potential tenants, which could reduce overall demand for our leasing services.
Under current authoritative accounting guidance for leases, a lease is classified by a tenant as a capital lease if the significant risks and rewards of ownership are considered to reside with the tenant. Under capital lease accounting for a tenant, both the leased asset and liability are reflected on its balance sheet. If the lease does not meet any of the criteria for a capital lease, the lease is considered an operating lease by the tenant, and the obligation does not appear on the tenant’s balance sheet; rather, the contractual future minimum payment obligations are only disclosed in the footnotes thereto. Thus, entering into an operating lease can appear to enhance a tenant’s balance sheet in comparison to direct ownership. The Financial Accounting Standards Board (the “FASB”) and the International Accounting Standards Board (the “IASB”) conducted a joint project to re-evaluate lease accounting. In August 2010, the FASB and the IASB jointly released exposure drafts of a proposed accounting model that would significantly change lease accounting. Based on comments received, a revised exposure was released in May 2013. Changes to the accounting guidance could affect both our accounting for leases as well as that of our current and potential tenants. These changes may affect how our real estate leasing business is conducted. For example, if the accounting standards regarding the financial statement classification of operating leases are revised, then companies may be less willing to enter into leases with us in general or desire to enter into leases with us with shorter terms because the apparent benefits to their balance sheets could be reduced or eliminated. This in turn could make it more difficult for us to enter into leases on terms we find favorable. After receiving extensive comments on the Exposure Drafts, the Boards are considering all feedback received and are re-deliberating all significant issues through 2015.
Risks Related to Financing
We will rely on external sources of capital to fund future capital needs, and if we encounter difficulty in obtaining such capital, we may not be able to make future acquisitions necessary to grow our business or meet maturing obligations.
In order to qualify as a REIT under the Code, we are required, among other things, to distribute annually to our stockholders at least 90% of our REIT taxable income (which does not equal net income as calculated in accordance with GAAP), determined without regard to the deduction for dividends paid and excluding any net capital gain. Because of this dividend requirement, we may not be able to fund, from cash retained from operations, all of our future capital needs, including capital needed to make investments and to satisfy or refinance maturing obligations.
We expect to rely on external sources of capital, including debt and equity financing, to fund future capital needs. However, the U.S. and global economic slowdown that commenced in 2008 has had an impact on the capital environment, characterized by limited availability, increasing costs and significant volatility. If we are unable to obtain needed capital on satisfactory terms or at all, we may not be able to make the investments needed to expand our business, or to meet our obligations and commitments as they mature.
22
Any additional debt we incur will increase our leverage. Our access to capital will depend upon a number of factors over which we have little or no control, including:
| • | general market conditions; |
| • | the market’s perception of our growth potential; |
| • | our current debt levels; |
| • | our current and expected future earnings; |
| • | our cash flow and cash dividends; and |
| • | the market price per share of our common stock. |
We may not be in a position to take advantage of attractive investment opportunities for growth if we are unable to access the capital markets on a timely basis on favorable terms.
Our ability to sell equity to expand our business will depend, in part, on the market price of our common stock, and our failure to meet market expectations with respect to our business could negatively affect the market price of our common stock and limit our ability to sell equity.
The availability of equity capital to us will depend, in part, on the market price of our common stock, which, in turn, will depend upon various market conditions and other factors that may change from time to time, including:
| • | the extent of investor interest, including the impact of recent events; |
| • | our ability to satisfy the dividend requirements applicable to REITs; |
| • | the general reputation of REITs and the attractiveness of their equity securities in comparison to other equity securities, including securities issued by other real estate-based companies; |
| • | our financial performance and that of our tenants; |
| • | analyst reports about us and the REIT industry; |
| • | general stock and bond market conditions, including changes in interest rates on fixed-income securities, which may lead prospective purchasers of our common stock to demand a higher annual yield from future dividends; |
| • | a failure to maintain or increase our dividend, which is dependent, to a large part, on FFO, which, in turn, depends upon increased revenue from additional acquisitions and rental increases; and |
| • | other factors such as governmental regulatory action and changes in REIT tax laws. |
Our failure to meet market expectations with regard to future earnings and cash dividends would likely adversely affect the market price of our common stock and, as a result, the availability of equity capital to us. See also “–As a result of the delayed filing of our periodic reports with the SEC, we are not currently eligible to use a registration statement on Form S-3 to register the offer and sale of securities, which may adversely affect our ability to raise future capital or complete acquisitions.”
We have substantial amounts of indebtedness outstanding, which may affect our ability to make dividends, may expose us to interest rate fluctuation risk and may expose us to the risk of default under our debt obligations.
As of December 31, 2014, our aggregate indebtedness was $10.5 billion. We may incur significant additional debt for various purposes including, without limitation, the funding of future acquisitions, capital improvements and leasing commissions in connection with the repositioning of a property.
We intend to incur additional indebtedness in the future, including borrowings under our existing $3.6 billion Credit Facility. At December 31, 2014, we had $416.0 million undrawn commitments under the Credit Facility.
Payments of principal and interest on borrowings may leave us with insufficient cash resources to make the dividend payments necessary to maintain our REIT qualification. Our substantial outstanding indebtedness, and the limitations imposed on us by our debt agreements, could have other significant adverse consequences, including as follows:
| • | our cash flow may be insufficient to meet our required principal and interest payments; |
| • | we may be unable to borrow additional funds as needed or on satisfactory terms, which could, among other things, adversely affect our ability to capitalize upon emerging acquisition opportunities or meet needs to fund capital improvements and leasing commissions; |
| • | we may be unable to refinance our indebtedness at maturity or the refinancing terms may be less favorable than the terms of our original indebtedness; |
| • | we may be forced to dispose of one or more of our properties, possibly on disadvantageous terms; |
23
| • | we may violate restrictive covenants in our loan documents, which would entitle the lenders to accelerate our debt obligations; |
| • | certain of the property subsidiaries’ loan documents may include restrictions on such subsidiary’s ability to make dividends to us; |
| • | we may be unable to hedge floating-rate debt, counterparties may fail to honor their obligations under our hedge agreements, these agreements may not effectively hedge interest rate fluctuation risk, and, upon the expiration of any hedge agreements, we would be exposed to then-existing market rates of interest and future interest rate volatility; |
| • | we may default on our obligations and the lenders or mortgagees may foreclose on our properties that secure their loans and receive an assignment of rents and leases; |
| • | increasing our vulnerability to general adverse economic and industry conditions; |
| • | limiting our ability to obtain additional financing to fund future working capital, capital expenditures and other general corporate requirements; |
| • | requiring the use of a substantial portion of our cash flow from operations for the payment of principal and interest on indebtedness, thereby reducing our ability to use our cash flow to fund working capital, acquisitions, capital expenditures and general corporate requirements; |
| • | limiting our flexibility in planning for, or reacting to, changes in our business and industry; and |
| • | putting us at a disadvantage compared to our competitors with less indebtedness. |
If we default under a loan or indenture (including any default in respect of the financial maintenance and negative covenants contained in the Credit Facility), we may automatically be in default under any other loan or indenture that has cross-default provisions (including the Credit Facility), and further borrowings under the Credit Facility will be prohibited, outstanding indebtedness under the Credit Facility, our indenture or such other loans may be accelerated, and to the extent the Credit Facility, our indenture or such other loans are secured, directly or indirectly by any properties or assets, lenders or trustees under the Credit Facility, our indenture or such other loans may foreclose on the collateral securing such indebtedness as a result. In addition, increases in interest rates may impede our operating performance and put us at a competitive disadvantage. Further, payments of required debt service or amounts due at maturity, or creation of additional reserves under loan agreements or indentures, could adversely affect our financial condition and operating results.
If any one of these events were to occur, our business, financial condition, results of operations, cash flow, per share trading price of our common stock and ability to satisfy our debt service obligations and to make dividends to our stockholders could be materially and adversely affected. In addition, any foreclosure on our properties could create taxable income without accompanying cash proceeds, which could adversely affect our ability to meet the REIT dividend requirements imposed by the Code.
The indenture governing our senior notes and the Amended Credit Agreement contain restrictive covenants that limit our operating flexibility.
The indenture governing our senior notes and the Amended Credit Agreement require us to meet specified financial and operating covenants, including financial maintenance covenants with respect to maximum consolidated leverage ratio, maximum secured recourse indebtedness, minimum fixed charge coverage, minimum borrowing base interest coverage, maximum secured leverage, minimum tangible net worth and maximum variable rate indebtedness and borrowing base asset value ratio. In addition, the Amended Credit Agreement contains certain customary negative covenants that restrict the ability of our OP to incur secured and unsecured indebtedness. These covenants may restrict our ability to expand or fully pursue our business strategies or certain acquisition transactions. Further, pursuant to two amendments to the Amended Credit Agreement executed in the fourth quarter of 2014 following the announcements made by the Company on October 29, 2014 with respect to its financial statements, certain covenants and terms related thereto became more restrictive, including: a requirement that we maintain a minimum unencumbered asset value of $10.5 billion; the reduction of our overall borrowing capacity to $3.6 billion; and the removal of a “covenant holiday” upon our consummation of a material acquisition. Our ability to pay distributions could also be impacted by these restrictions.
Our ability to comply with these and other provisions of the indenture governing our senior notes and the Amended Credit Agreement may be affected by changes in our operating and financial performance, changes in general business and economic conditions, adverse regulatory developments or other events adversely impacting us. Any failure to comply with these financial maintenance covenants and negative covenants would constitute a default under the Credit Facility and/or senior note indenture, as applicable and would prevent further borrowings under the Credit Facility, and could cause those and other obligations to become due and payable. If any of our indebtedness is accelerated, we may not be able to repay it.
24
Our organizational documents have no limitation on the amount of indebtedness that we may incur. As a result, we may become highly leveraged in the future, which could adversely affect our financial condition.
Our business strategy contemplates the use of both secured and unsecured debt to finance long-term growth. While we intend to limit our indebtedness to maintain an overall net debt to gross asset value of approximately 45% to 55%, provided that we may exceed this amount for individual properties in select cases where attractive financing is available, our governing documents contain no limitations on the amount of debt that we may incur and the Amended Credit Agreement contains less strict limitations. Further, the Board of Directors may change our financing policy at any time without stockholder approval. As a result, we may be able to incur substantial additional debt, including secured debt, in the future, which could result in an increase in our debt service and harm our financial condition.
Increases in interest rates would increase our debt service costs, may adversely affect any future refinancing of our debt and our ability to incur additional debt, and could adversely affect our financial condition, cash flow and results of operations.
Certain of our borrowings bear interest at variable rates, and we may incur additional variable-rate debt in the future. Increases in interest rates would result in higher interest expenses on our existing unhedged variable rate debt, and increase the costs of refinancing existing debt or incurring new debt. Additionally, increases in interest rates may result in a decrease in the value of our real estate and decrease the market price of ARCP’s common stock and could accordingly adversely affect our financial condition, cash flow and results of operations.
We may not be able to generate sufficient cash flow to meet our debt service obligations.
Our ability to make payments on and to refinance our indebtedness, and to fund our operations, working capital and capital expenditures, depends on our ability to generate cash in the future. To a certain extent, our cash flow is subject to general economic, industry, financial, competitive, operating, legislative, regulatory and other factors, many of which are beyond our control.
We cannot assure you that our business will generate sufficient cash flow from operations or that future sources of cash will be available to us in an amount sufficient to enable us to pay amounts due on our indebtedness or to fund our other liquidity needs.
Additionally, if we incur additional indebtedness in connection with future acquisitions or development projects or for any other purpose, our debt service obligations could increase. We may need to refinance all or a portion of our indebtedness or before maturity. Our ability to refinance our indebtedness or obtain additional financing will depend on, among other things:
| • | our financial condition and market conditions at the time; and |
| • | restrictions in the agreements governing our indebtedness. |
As a result, we may not be able to refinance any of our indebtedness on commercially reasonable terms, or at all. If we do not generate sufficient cash flow from operations, and additional borrowings or refinancings or proceeds of asset sales or other sources of cash are not available to us, we may not have sufficient cash to enable us to meet all of our obligations. Accordingly, if we cannot service our indebtedness, we may have to take actions such as seeking additional equity, or delaying strategic acquisitions and alliances or capital expenditures, any of which could have a material adverse effect on our operations. We cannot assure you that we will be able to effect any of these actions on commercially reasonable terms, or at all.
Additional Risks Relating to our REI Segment
The continued recovery of real estate markets from the recent recession is dependent upon forecasted moderate economic growth which, if significantly slower than expected, could have a negative impact on the performance of our investment portfolio.
The U.S. economy is in its fifth year of recovery from a severe global recession. Based on moderate economic growth in the future, and historically low levels of new supply in the commercial real estate pipeline, a stronger recovery is forecasted for all property sectors over the next two years. Nevertheless, this ongoing economic recovery remains fragile, and could be slowed or halted by significant external events. As a result, real estate markets could perform lower than expected as a result of reduced tenant demand. A severe weakening of the economy or a renewed recession could also lead to higher tenancy default and vacancy rates, which could create an oversupply of rentable space, increased property concessions and tenant improvement expenditures and reduced rental rates to maintain occupancies. There can be no assurance that our real estate investments will not be adversely impacted by a severe slowing of the economy or renewed recession. Tenant defaults, fluctuations in interest rates, limited availability of capital and other economic conditions beyond our control could negatively impact our portfolio and decrease the value of your investment.
25
Uninsured losses or losses in excess of our insurance coverage could adversely affect our financial condition and cash flows, and there can be no assurance as to future costs and the scope of coverage that may be available under insurance policies.
We carry comprehensive liability, fire, extended coverage, business interruption and rental loss insurance covering all of the properties in our portfolio under a blanket insurance policy with policy specifications, limits and deductibles customarily carried for similar properties. In addition, we carry professional liability and directors’ and officers’ insurance. We have selected policy specifications and insured limits that we believe are appropriate and adequate given the relative risk of loss, the cost of the coverage and industry practice. We do not carry insurance for certain losses, including, but not limited to, losses caused by riots or war. Certain types of losses may be either uninsurable or not economically insurable, such as losses due to earthquakes, riots or acts of war. Should an uninsured loss occur, we could lose both our investment in and anticipated profits and cash flow from a property. If any such loss is insured, we may be required to pay a significant deductible on any claim for recovery of such a loss prior to our insurer being obligated to reimburse us for the loss, or the amount of the loss may exceed our coverage for the loss. In addition, future lenders may require such insurance, and our failure to obtain such insurance could constitute a default under our loan agreements. In addition, we may reduce or discontinue terrorism, earthquake, flood or other insurance on some or all of our properties in the future if the cost of premiums for any of these policies exceeds, in our judgment, the value of the coverage discounted for the risk of loss. Our title insurance policies may not insure for the current aggregate market value of our portfolio, and we do not intend to increase our title insurance coverage as the market value of our portfolio increases. As a result, our business, financial condition, results of operations, cash flow, per share trading price of our common stock and ability to satisfy our debt service obligations and to make dividends to our stockholders may be materially and adversely affected.
If we or one or more of our tenants experiences a loss that is uninsured or which exceeds policy limits, we could lose the capital invested in the damaged properties as well as the anticipated future cash flows from those properties. In addition, if the damaged properties are subject to recourse indebtedness, we would continue to be liable for the indebtedness, even if these properties were irreparably damaged.
If any of our insurance carriers becomes insolvent, we could be adversely affected.
We carry several different lines of insurance, placed with several large insurance carriers. If any one of these large insurance carriers were to become insolvent, we would be forced to replace the existing insurance coverage with another suitable carrier, and any outstanding claims would be at risk for collection. In such an event, we cannot be certain that we would be able to replace the coverage at similar or otherwise favorable terms. Replacing insurance coverage at unfavorable rates and the potential of uncollectible claims due to carrier insolvency could adversely affect our results of operations and cash flows.
Terrorism and other factors affecting demand for our properties could harm our operating results.
The strength and profitability of our business depends on demand for and the value of our properties. Future terrorist attacks in the United States, such as the attacks that occurred in New York and Washington, D.C. on September 11, 2001, and other acts of terrorism or war could have a negative impact on our operations. Such terrorist attacks could have an adverse impact on our business even if they are not directed at our properties. In addition, the terrorist attacks of September 11, 2001 have substantially affected the availability and price of insurance coverage for certain types of damages or occurrences, and our insurance policies for terrorism include large deductibles and co-payments. The lack of sufficient insurance for these types of acts could expose us to significant losses and could have a negative impact on our operations.
We may be required to make significant capital expenditures to improve our properties in order to retain and attract tenants, causing a decline in operating revenue and reducing cash available for debt service and distributions to stockholders.
Upon expiration of leases at our properties, we may be required to make rent or other concessions to tenants, or accommodate requests for renovations, build-to-suit remodeling and other improvements. As a result, we may have to make significant capital or other expenditures in order to retain tenants whose leases expire and to attract new tenants. Additionally, we may need to raise capital to make such expenditures. If we are unable to do so or capital is otherwise unavailable, we may be unable to make the required expenditures. This could result in non-renewals by tenants upon expiration of their leases, which would result in declines in revenue from operations and reduce cash available for debt service and dividends to stockholders.
Difficult conditions in the commercial real estate markets may cause us to experience market losses related to our holdings, and these conditions may not improve in the near future.
Our results of operations are materially affected by conditions in the real estate markets, the financial markets and the economy generally and may cause commercial real estate values, including the values of our properties, and market rental rates, including rental rates that we are able to charge, to decline significantly. Recent economic and credit market conditions have contributed to increased volatility and diminished expectations for real estate markets, as well as adversely impacted inflation, energy costs, geopolitical issues and the availability and cost of credit, and may continue to do so going forward. The further deterioration of
26
the real estate market may cause us to record losses on our assets, reduce the proceeds we receive upon sale or refinance of our assets or adversely impact our ability to lease our properties. Declines in the market values of our properties may adversely affect our results of operations and credit availability, which may reduce earnings and, in turn, cash available for dividends to our stockholders. Economic and credit market conditions may also cause one or more of the tenants to whom we have exposure to fail or default in their payment obligations, which could cause us to record material losses or a material reduction in our cash flows.
Because we own real property, we are subject to extensive environmental regulation, which creates uncertainty regarding future environmental expenditures and liabilities.
Environmental laws regulate, and impose liability for, releases of hazardous or toxic substances into the environment. Under various provisions of these laws, an owner or operator of real estate, such as us, is or may be liable for costs related to soil or groundwater contamination on, in, or migrating to or from its property. In addition, persons who arrange for the disposal or treatment of hazardous or toxic substances may be liable for the costs of cleaning up contamination at the disposal site. Such laws often impose liability regardless of whether the person knew of, or was responsible for, the presence of the hazardous or toxic substances that caused the contamination. The presence of, or contamination resulting from, any of these substances, or the failure to properly remediate them, may adversely affect our ability to sell or lease our property or to borrow using such property as collateral. In addition, persons exposed to hazardous or toxic substances may sue us for personal injury damages. For example, certain laws impose liability for release of or exposure to asbestos-containing materials and contamination from past operations or from off-site sources. As a result, in connection with our current or former ownership, operation, management and development of real properties, we may be potentially liable for investigation and cleanup costs, penalties, and damages under environmental laws.
Although all of our properties were, at the time they were acquired by our predecessor, subjected to preliminary environmental assessments, known as Phase I assessments, by independent environmental consultants that identify certain liabilities, Phase I assessments are limited in scope, and may not include or identify all potential environmental liabilities or risks associated with the property. Further, any environmental liabilities that arose since the date the studies were done would not be identified in the assessments. Unless required by applicable laws or regulations, we may not further investigate, remedy or ameliorate the liabilities disclosed in the Phase I assessments.
We cannot assure you that these or other environmental studies identified all potential environmental liabilities, or that we will not incur material environmental liabilities in the future. If we do incur material environmental liabilities in the future, we may face significant remediation costs, and we may find it difficult to sell any affected properties.
We are subject to risks relating to mortgage, bridge or mezzanine loans.
Investing in mortgage, bridge or mezzanine loans involves risk of defaults on those loans caused by many conditions beyond our control, including local and other economic conditions affecting real estate values, interest rate changes, rezoning, and failure by the borrower to maintain the property. If there are defaults under these loans, we may not be able to repossess and sell quickly any properties securing such loans. An action to foreclose on a property securing a loan is regulated by state statutes and regulations and is subject to many of the delays and expenses of any lawsuit brought in connection with the foreclosure if the defendant raises defenses or counterclaims. In the event of default by a mortgagor, these restrictions, among other things, may impede our ability to foreclose on or sell the mortgaged property or to obtain proceeds sufficient to repay all amounts due to us on the loan, which could reduce the value of our investment in the defaulted loan. In addition, investments in mezzanine loans involve a higher degree of risk than long-term senior mortgage loans secured by income-producing real property because the investment may become unsecured as a result of foreclosure on the underlying real property by the senior lender.
We are subject to risks relating to real estate-related securities in general.
Investments in real estate-related securities involve special risks relating to the particular issuer of the securities, including the financial condition and business outlook of the issuer. Issuers of real estate-related equity securities generally invest in real estate or real estate-related assets and are subject to the inherent risks associated with real estate-related investments discussed herein, including risks relating to rising interest rates.
Real estate-related securities are often unsecured and also may be subordinated to other obligations of the issuer. As a result, investments in real estate-related securities are subject to risks of (1) limited liquidity in the secondary trading market in the case of unlisted or thinly traded securities, (2) substantial market price volatility resulting from changes in prevailing interest rates in the case of traded equity securities, (3) subordination to the prior claims of banks and other senior lenders to the issuer, (4) the operation of mandatory sinking fund or call/redemption provisions during periods of declining interest rates that could cause the issuer to reinvest redemption proceeds in lower yielding assets, (5) the possibility that earnings of the issuer may be insufficient to meet its debt service and distribution obligations and (6) the declining creditworthiness and potential for insolvency of the issuer
27
during periods of rising interest rates and economic slowdown or downturn. These risks may adversely affect the value of outstanding real estate-related securities and the ability of the issuers thereof to repay principal and interest or make distribution payments.
We may not have the expertise necessary to maximize the return on our investment in real estate-related securities. If we determine that it is advantageous to us to make the types of investments in which we do not have experience, we intend to employ persons, engage consultants or partner with third parties that have, in our opinion, the relevant expertise necessary to assist us in evaluating, making and administering such investments.
We are subject to risks relating to CMBS.
CMBS are securities that evidence interests in, or are secured by, a single commercial mortgage loan or a pool of commercial mortgage loans. Accordingly, these securities are subject to all of the risks of the underlying mortgage loans. In a rising interest rate environment, the value of CMBS may be adversely affected when payments on underlying mortgages do not occur as anticipated, resulting in the extension of the security’s effective maturity and the related increase in interest rate sensitivity of a longer-term instrument. The value of CMBS may also change due to shifts in the market’s perception of issuers and regulatory or tax changes adversely affecting the mortgage securities market as a whole. In addition, CMBS are subject to the credit risk associated with the performance of the underlying mortgage properties. CMBS are issued by investment banks, not financial institutions, and are not insured or guaranteed by the U.S. government.
CMBS are also subject to several risks created through the securitization process. Subordinate CMBS are paid interest only to the extent that there are funds available to make payments. To the extent the collateral pool includes delinquent loans, there is a risk that interest payments on subordinate CMBS will not be fully paid. Subordinate CMBS are also subject to greater credit risk than those CMBS that are more highly rated. In certain instances, third-party guarantees or other forms of credit support can reduce the credit risk.
The value of CMBS can be negatively impacted by any dislocation in the mortgage-backed securities market in general. Currently, the mortgage-backed securities market is suffering from a severe dislocation created by mortgage pools that include sub-prime mortgages secured by residential real estate. Sub-prime loans often have high interest rates and are often made to borrowers with credit scores that would not qualify them for prime conventional loans. In recent years, banks made a great number of the sub-prime residential mortgage loans with high interest rates, floating interest rates, interest rates that reset from time to time and/or interest-only payment features that expire over time. These terms, coupled with rising interest rates, have caused an increasing number of homeowners to default on their mortgages. Purchasers of mortgage-backed securities collateralized by mortgage pools that include risky sub-prime residential mortgages have experienced severe losses as a result of the defaults and such losses have had a negative impact on the CMBS market.
Our build-to-suit program is subject to additional risks related to properties under development.
Following our consummation of the Cole and CapLease Mergers, we began to engage in build-to-suit programs and acquisition of properties under development. In connection with these businesses, we enter into purchase and sale arrangements with sellers or developers of suitable properties under development or construction. In such cases, we are obligated to purchase the property at the completion of construction, provided that the construction conforms to definitive plans, specifications, and costs approved by us in advance. We may advance significant amounts in connection with certain development projects as well. We may continue this business.
As a result, we are subject to potential development risks and construction delays and the resultant increased costs and risks, as well as the risk of loss of certain amounts that we have advanced should a development project not be completed. If we engage in development or construction projects, we will be subject to uncertainties associated with re-zoning for development, environmental concerns of governmental entities and/or community groups, and the builder’s ability to build in conformity with plans, specifications, budgeted costs and timetables. If a builder fails to perform, we may resort to legal action to rescind the purchase or the construction contract or to compel performance. A builder’s performance may also be affected or delayed by conditions beyond the builder’s control. Delays in completion of construction could also give tenants the right to terminate preconstruction leases. We may incur additional risks if we make periodic progress payments or other advances to builders before they complete construction. These and other such factors can result in increased project costs or loss of our investment. In addition, we will be subject to normal lease-up risks relating to newly constructed projects. We also will rely on rental income and expense projections and estimates of the fair market value of property upon completion of construction when agreeing upon a price at the time we acquire the property. If these projections are inaccurate, we may pay too much for a property and our return on our investment could suffer. If we contract with a development company for newly developed properties, we anticipate that it will be obligated to pay a substantial earnest money deposit at the time of contracting to acquire such properties. In the case of properties to be developed by a development company, we anticipate that it will be required to close the purchase of the property upon completion of the development of the property. At the time of contracting and the payment of the earnest money deposit, the
28
development company typically will not have acquired title to any real property and there is a risk that its earnest money deposit made to the development company may not be fully refunded.
Additional Risks Relating to our Cole Capital Segment
Cole Capital, which was acquired from Cole, is subject to risks that are particular to their role as sponsor and dealer manager for direct investment program offerings.
Cole Capital, including Cole Capital Corporation, which was Cole’s broker-dealer subsidiary and is a wholesale broker-dealer registered with the SEC and a member firm of FINRA, is subject to various risk and uncertainties that are common in the securities industry. Such risks and uncertainties include:
| • | the volatility of financial markets; |
| • | extensive governmental regulation; |
| • | litigation; and |
| • | intense competition. |
Cole Capital, which involves sponsoring and distributing interests in direct investment programs, will depend on a number of factors including our ability to enter into agreements with broker-dealers and independent investment advisors who will sell interests to their clients, our success in investing the proceeds of each offering, managing the properties acquired and generating cash flow to make distributions to investors in our direct investment programs and our success in entering into liquidity event for the direct investment programs. We are subject to competition from other sponsors and dealer managers of direct investment programs and other investments, and there can be no assurance that this business will be successful.
Sponsorship of non-traded REITs also involves risks relating to the possibility that such programs will not receive capital at the levels and timing that are anticipated and that sufficient capital will not be raised to repay investments of cash in, and loans to, such non-traded REITs needed to meet up-front costs, the initial breaking of escrow and the acquisition of properties will not be made, as well as risks relating to competition from other sponsors of other similar programs.
In addition, Cole Capital is subject to risks that are particular to its function as a wholesale broker-dealer and sponsoring non-traded REITs. For example, the broker-dealer provides substantial promotional support to broker-dealers selling a particular offering, including by providing sales literature, forums, webinars, press releases and other mass forms of communication. Due to Cole Capital acting as a sponsor of non-traded REITs and the volume of materials that Cole Capital Corporation may provide throughout the course of an offering, much of Cole Capital’s activities may be scrutinized by regulators. We and Cole Capital Corporation may be exposed to significant liability under federal and state securities laws. Additionally, Cole Capital Corporation may be subject to fines and suspension from the SEC and FINRA. For a description of recent developments that affected Cole Capital, see “– Following the announcements made by the Company on October 29, 2014 that certain of its financial statements could no longer be relied upon, various broker-dealers and clearing firms participating in offerings of Cole Capital’s Managed REITs suspended sales activity with Cole Capital, resulting in a significant decrease in capital raising activity and, consequently, a decline in the overall revenue generated by Cole Capital. While the Company has completed its restatements and has become current in its filings with the SEC, there can be no assurance that Cole Capital will successfully or timely reengage all of the broker-dealers and clearing firms that participated in its Managed REITs’ offerings prior to the October 29, 2014 announcements and, therefore, the capital raising activity and long-term financial success of Cole Capital could be negatively affected.”
Failure to comply with the net capital requirements could subject us to sanctions imposed by the SEC or FINRA.
Our broker-dealer subsidiary is required to maintain certain levels of minimum net capital subject to the SEC’s net capital rule. The net capital rule is designed to measure the general financial integrity and liquidity of a broker-dealer. Compliance with the net capital rule limits those operations of broker-dealers that require the intensive use of their capital, such as underwriting commitments and principal trading activities. The rule also limits the ability of securities firms to pay dividends or make payments on certain indebtedness, such as subordinated debt, as it matures. FINRA may enter the offices of a broker-dealer at any time, without notice, and calculate the firm’s net capital. If the calculation reveals a deficiency in net capital, FINRA may immediately restrict or suspend certain or all the activities of a broker-dealer. Our broker-dealer subsidiary may not be able to maintain adequate net capital, or its net capital may fall below requirements established by the SEC, and it may be subject to disciplinary action in the form of fines, censure, suspension, expulsion or the termination of business altogether. In addition, if these net capital rules are changed or expanded, or if there is an unusually large charge against net capital, operations that require the intensive use of capital would be limited. A large operating loss or charge against net capital could adversely affect our broker-dealer’s ability to expand or even maintain its present levels of business, which could have a material adverse effect on its business of sponsoring and distributing interests in direct investment programs. In addition, our broker-dealer subsidiary may become subject to net capital requirements in other foreign jurisdictions in which it operates. We cannot predict its future capital needs or its ability to obtain additional financing.
29
Broker-dealers and other financial services firms are subject to extensive regulations and increased scrutiny.
The financial services industry is subject to extensive regulation by U.S. federal, state and international government agencies, as well as various self-regulatory agencies. Recent turmoil in the financial markets has contributed to significant rule changes, heightened scrutiny of the conduct of financial services firms and increasing penalties for rule violations. Our broker-dealer subsidiary may be adversely affected by new laws or rules or changes in the interpretation of existing rules or more rigorous enforcement. Significant new rules are developing under the Dodd-Frank Wall Street Reform and Consumer Protection Act of 2010. Some of these rules could impact our broker-dealer subsidiary’s business, including through the potential implementation of a more stringent fiduciary standard for brokers and enhanced regulatory oversight over incentive compensation.
Our broker-dealer subsidiary also may be adversely affected by other evolving regulatory standards, such as those relating to suitability and supervision. Legal claims or regulatory actions against our broker-dealer subsidiary also could have adverse financial effects on us or harm our reputation, which could harm our business prospects.
Our broker-dealer subsidiary, which is registered as a broker-dealer under the Exchange Act and is a member of FINRA, is subject to regulation, examination and supervision by the SEC, FINRA, other self-regulatory organizations and state securities regulators. Broker-dealers are subject to regulations that cover all aspects of the securities business, including sales practices, use and safekeeping of clients’ funds and securities’ capital adequacy, record-keeping and the conduct and qualification of officers, employees and independent contractors. Failure by our broker-dealers to comply with applicable laws or regulations could result in censures, penalties or fines, the issuance of cease and desist orders, the suspension or expulsion from the securities industry of any such broker-dealer, or its officers, employees or independent contractors or other similar adverse consequences. Additionally, the adverse publicity arising from the imposition of sanctions could harm our reputation and cause us to lose existing clients or fail to gain new clients.
Financial services firms are also subject to rules and regulations relating to the prevention and detection of money laundering. The USA PATRIOT Act of 2001 mandates that financial institutions, including broker-dealers and investment advisors, establish and implement anti-money laundering (“AML”) programs reasonably designed to achieve compliance with the Bank Secrecy Act of 1970 and the rules thereunder. Financial services firms must maintain AML policies, procedures and controls, designate an AML compliance officer to oversee the firm’s AML program, implement appropriate employee training and provide for annual independent testing of the program. Our broker-dealer subsidiary has established AML programs but there can be no assurance of the effectiveness of these programs. Failure to comply with AML requirements could subject our broker-dealer subsidiary to disciplinary sanctions and other penalties. Financial services firms must also comply with applicable privacy and data protection laws and regulations, including SEC Regulation S-P and applicable provisions of the 1999 Gramm-Leach-Bliley Act, the Fair Credit Reporting Act of 1970 and the 2003 Fair and Accurate Credit Transactions Act. Any violations of laws and regulations relating to the safeguarding of private information could subject our broker-dealer subsidiary to fines and penalties, as well as to civil action by affected parties.
Risks Related to our Organization and Structure
We are a holding company with no direct operations. As a result, we rely on funds received from the Operating Partnership to pay liabilities and dividends, our stockholders’ claims will be structurally subordinated to all liabilities of the Operating Partnership and our stockholders do not have any voting rights with respect to the Operating Partnership’s activities, including the issuance of additional OP units.
We are a holding company and conduct all of our operations through the Operating Partnership. We do not have, apart from our ownership of the Operating Partnership, any independent operations. As a result, we rely on distributions from the Operating Partnership to pay any dividends we might declare on shares of our common stock. We also rely on distributions from the Operating Partnership to meet any of our obligations, including tax liability on taxable income allocated to us from the Operating Partnership (which might make distributions to us not equal to the tax on such allocated taxable income).
In addition, because we are a holding company, stockholders’ claims will be structurally subordinated to all existing and future liabilities and obligations (whether or not for borrowed money) of the Operating Partnership and its subsidiaries. Therefore, in the event of our bankruptcy, liquidation or reorganization, claims of our stockholders will be satisfied only after all of our and the Operating Partnership’s and its subsidiaries’ liabilities and obligations have been paid in full.
As of December 31, 2014, we owned approximately 97.4% of the OP units in the Operating Partnership. However, the Operating Partnership may issue additional OP units in the future. Such issuances could reduce our ownership percentage in the Operating Partnership. Because our stockholders will not directly own any OP units, they will not have any voting rights with respect to any such issuances or other partnership-level activities of the Operating Partnership.
30
Our charter and bylaws and Maryland law contain provisions that may delay or prevent a change of control transaction.
Our charter, subject to certain exceptions, limits any person to actual or constructive ownership of no more than 9.8% in value of the aggregate of our outstanding shares of stock and not more than 9.8% (in value or in number of shares, whichever is more restrictive) of any class or series of our shares of stock. The Board of Directors, in its sole discretion and upon receipt of certain representations and undertakings, may exempt a person (prospectively or retroactively) from the ownership limits. However, the Board of Directors may not, among other limitations, grant an exemption from the ownership limits to any person whose ownership, direct or indirect, in excess of the 9.8% ownership limit would cause us to fail to qualify as a REIT. In addition, our charter provides that we may not consolidate, merge, sell all or substantially all of our assets or engage in a share exchange unless such actions are approved by the affirmative vote of at least two-thirds of the Board of Directors. The ownership limits and the other restrictions on ownership and transfer of our stock and the Board approval requirements contained in our charter may delay or prevent a transaction or a change of control that might involve a premium price for our common stock or otherwise be in the best interest of our stockholders.
Further, certain provisions of the Maryland General Corporation Law (the “MGCL”) may have the effect of requiring a third party seeking to acquire us to negotiate with the Board of Directors, including:
| • | “business combination” provisions that, subject to limitations, prohibit certain business combinations between us and an “interested stockholder” (defined generally as any person who beneficially owns 10% or more of the voting power of our outstanding voting stock or an affiliate or associate of our company who, at any time within the two-year period prior to the date in question, was the beneficial owner of 10% or more of the voting power of our then outstanding stock) or an affiliate of an interested stockholder for five years after the most recent date on which the stockholder becomes an interested stockholder, and thereafter imposes special appraisal rights and stockholder supermajority voting requirements on these combinations; and |
| • | “control share” provisions that provide that “control shares” of our company (defined as shares which, when aggregated with other shares controlled by the stockholder (except solely by virtue of a revocable proxy), entitle the stockholder to exercise one of three increasing ranges of voting power in electing directors) acquired in a “control share acquisition” (defined as the direct or indirect acquisition of ownership or control of issued and outstanding “control shares”) have no voting rights except to the extent approved by our stockholders by the affirmative vote of at least two-thirds of all the votes entitled to be cast on the matter, excluding all interested shares. |
The Board of Directors previously adopted a resolution which exempted certain business combination transactions from the above requirements, as permitted by the MGCL. Such transactions would include combinations: (1) between us and any person, provided that such business combination is first approved by the Board of Directors (including a majority of directors who are not affiliates or associates of such person); and (2) between us and ARC, the Former Manager, the Operating Partnership or any of their respective affiliates. Consequently, the five-year prohibition and the supermajority vote requirements described above will not apply to such business combinations. However, if this resolution is repealed, or the Board of Directors does not otherwise approve a business combination with a person other than ARC, the Former Manager, the Operating Partnership or any of their respective affiliates, the statute may discourage others from trying to acquire control of us and increase the difficulty of consummating any offer.
Additionally, pursuant to a provision in our bylaws, we have opted out of the control share provisions of the MGCL. However, we may, by amendment to our bylaws, opt in to the control shares provisions of the MGCL in the future.
Finally, Title 3, Subtitle 8 of the MGCL permits the Board of Directors, without stockholder approval and regardless of what is currently provided in our charter or bylaws, to implement certain takeover defenses, such as a classified board, some of which we do not yet have. These provisions may have the effect of inhibiting a third party from making an acquisition proposal for us or of delaying, deferring or preventing a change in control of us under the circumstances that otherwise could provide our stockholders with the opportunity to realize a premium over the then current market price. While we continue to consider these corporate governance matters, our governing documents and the MGCL provide the above-described protections against a change of control transaction, among others.
The Board of Directors may create and issue a class or series of common or preferred stock without stockholder approval.
The Board of Directors is empowered under our charter to amend our charter from time to time to increase or decrease the aggregate number of shares of our stock or the number of shares of stock of any class or series that we have authority to issue, to designate and issue from time to time one or more classes or series of stock and to classify or reclassify any unissued shares of our common stock or preferred stock without stockholder approval. The Board of Directors may determine the relative preferences, conversion or other rights, voting powers, restrictions, limitations as to dividends or other distributions, qualifications or terms or conditions of redemption of any class or series of stock issued. As a result, we may issue series or classes of stock with voting rights, rights to dividends or other rights, senior to the rights of holders of our capital stock. The issuance of any such stock could
31
also have the effect of delaying or preventing a change of control transaction that might otherwise be in the best interests of our stockholders.
Certain provisions in the LPA may delay or prevent unsolicited acquisitions of us.
Certain provisions in the LPA may delay or make more difficult unsolicited acquisitions of us or changes in our control. These provisions could discourage third parties from making proposals involving an unsolicited acquisition of us or change of our control, although some stockholders might consider such proposals, if made, desirable. These provisions include, among others:
| • | redemption rights of qualifying parties; |
| • | transfer restrictions on the OP units; |
| • | the ability of the General Partner in some cases to amend the LPA without the consent of the limited partners; |
| • | the right of the limited partners to consent to transfers of the general partnership interest of the General Partner and mergers or consolidations of our company under specified limited circumstances; and |
| • | restrictions relating to our qualification as a REIT under the Code. |
The LPA also contain other provisions that may delay, defer or prevent a transaction or a change of control that might involve a premium price for our common stock or otherwise be in the best interest of our stockholders.
Tax protection provisions on certain properties could limit our operating flexibility.
We have agreed with the ARC Real Estate Partners, LLC, an affiliate of the Former Manager, to indemnify it against adverse tax consequences if we were to sell, convey, transfer or otherwise dispose of all or any portion of the interests in the continuing properties acquired by us in the formation transactions, in a taxable transaction. However, we can sell these properties in a taxable transaction if we pay ARC Real Estate Partners, LLC cash in the amount of its tax liabilities arising from the transaction and tax payments. These tax protection provisions apply until September 6, 2021, which is the 10th anniversary of the closing of our IPO. Although it may be in our stockholders’ best interest that we sell a property, it may be economically disadvantageous for us to do so because of these obligations. We have also agreed to make debt available for the Contributor to guarantee. We agreed to these provisions in order to assist the Contributor in preserving its tax position after its contribution of its interests in our initial properties. As a result, we may be required to incur and maintain more debt than we would otherwise.
The Company’s fiduciary duties as sole general partner of the Operating Partnership could create conflicts of interest.
The Company has fiduciary duties to the Operating Partnership and the limited partners in the Operating Partnership, the discharge of which may conflict with the interests of its stockholders. The LPA provides that, in the event of a conflict between the duties owed by the Company’s directors to the Company and the duties that the Company owes in its capacity as the sole general partner of the Operating Partnership to the Operating Partnership’s limited partners, the Company’s directors are under no obligation to give priority to the interests of such limited partners. As a holder of OP units, the Company will have the right to vote on certain amendments to the LPA (which require approval by a majority in interest of the limited partners, including the Company) and individually to approve certain amendments that would adversely affect their rights, as well as the right to vote on mergers and consolidations of the Company in its capacity as sole general partner of the Operating Partnership in certain limited circumstances. These voting rights may be exercised in a manner that conflicts with the interests of the Company’s stockholders. For example, the Company cannot adversely affect the limited partners’ rights to receive distributions, as set forth in the LPA, without their consent, even though modifying such rights might be in the best interest of the Company’s stockholders generally.
The Board of Directors may change significant corporate policies without stockholder approval.
Our investment, financing, borrowing and dividend policies and our policies with respect to other activities, including growth, debt, capitalization and operations, will be determined by the Board of Directors. These policies may be amended or revised at any time and from time to time at the discretion of the Board of Directors without a vote of our stockholders. In addition, the Board of Directors may change our policies with respect to conflicts of interest provided that such changes are consistent with applicable legal requirements. A change in these policies could have an adverse effect on our business, financial condition, results of operations, cash flow, per share trading price of our common stock and ability to satisfy our debt service obligations and to make distributions to our stockholders.
We may not be able to maintain our competitive advantages if we are not able to attract and retain key personnel.
Our success depends to a significant extent on our ability to attract and retain key members of our executive team and staff. While we have taken steps to retain such key personnel, there can be no assurance that we will be able to retain the services of individuals whose knowledge and skills are important to our businesses. Our success also depends on our ability to prospectively attract, expand, integrate, train and retain qualified management personnel. Because the competition for qualified personnel is
32
intense, costs related to compensation and retention could increase significantly in the future. Additionally, integration of the Recent Acquisitions can be disruptive and may lead to the departure of key employees. If we were to lose a sufficient number of our key employees and were unable to replace them in a reasonable period of time, these losses could seriously damage our business and adversely affect our results of operations.
Cybersecurity risks and cyber incidents may adversely affect our business by causing a disruption to our operations, a compromise or corruption of our confidential information, and/or damage to our business relationships, all of which could negatively impact our financial results.
A cyber incident is considered to be any adverse event that threatens the confidentiality, integrity or availability of our information resources. These incidents may be an intentional attack or an unintentional event and could involve gaining unauthorized access to our information systems for purposes of misappropriating assets, stealing confidential information, corrupting data or causing operational disruption. The result of these incidents may include disrupted operations, misstated or unreliable financial data, liability for stolen assets or information, increased cybersecurity protection and insurance costs, litigation and damage to our tenant and investor relationships. As our reliance on technology has increased, so have the risks posed to our information systems, both internal and those we have outsourced. We have implemented processes, procedures and internal controls to help mitigate cybersecurity risks and cyber intrusions, but these measures, as well as our increased awareness of the nature and extent of a risk of a cyber incident, do not guarantee that our financial results, operations, business relationships or confidential information will not be negatively impacted by such an incident.
Risks Relating to the Recent Acquisitions
We could incur liability as a result of a lawsuit to which Cole is subject in connection with the merger between Cole and Cole Holdings Corporation (“Cole Holdings”), pursuant to which Cole became a self-managed REIT.
Three outstanding putative class action and/or derivative lawsuits, which were filed in early 2014, assert claims for breach of fiduciary duty, abuse of control, corporate waste, unjust enrichment, aiding and abetting breach of fiduciary duty and other claims relating to the merger between a wholly owned subsidiary of Cole and Cole Holdings, pursuant to which Cole became a self-managed REIT. The Court in one of the lawsuits has granted defendants’ motion to dismiss with prejudice, but the plaintiffs have filed a notice of appeal of this dismissal. The other two lawsuits, which also purport to assert claims under the Securities Act, are pending in the United States District Court for the District of Arizona. Defendants filed a motion to dismiss both complaints on January 10, 2014.
Whether or not any plaintiffs’ claims are successful, this type of litigation is often expensive and diverts management’s attention and resources, which could adversely affect our operations.
We could incur liability as a result of an adverse judgment in litigation challenging one or more of our Recent Acquisitions, including the Cole Merger, the CapLease Merger and the ARCT III Merger.
Stockholders of Cole have filed lawsuits and may file additional lawsuits challenging the Cole Merger, which name and may name ARCP as a defendant. To date, eleven such lawsuits have been filed. Two putative class actions have been filed in in the U.S. District Court of Arizona, captioned as: (i) Wunsch v. Cole Real Estate Investment, Inc., et al.; and (ii) Sobon v. Cole Real Estate Investments, Inc., et al. Eight other putative stockholder class action lawsuits have been filed in the Circuit Court for Baltimore City, Maryland, captioned as: (i) Operman v. Cole Real Estate Investments, Inc., et al.; (ii) Branham v. Cole Real Estate Investments, Inc., et al.; (iii) Wilfong v. Cole Real Estate Investments, Inc., et al.; (iv) Polage v. Cole Real Estate Investments, Inc., et al.; (v) Flynn v. Cole Real Estate Investments, Inc., et al.; (vi) Corwin v. Cole Real Estate Investments, Inc., et al.; (vii) Green v. Cole Real Estate Investments, Inc., et al.; and (viii) Morgan v. Cole Real Estate Investments, Inc., et al. (collectively, the ‘‘Baltimore Actions’’). All of these lawsuits name ARCP, Cole and the Cole board of directors as defendants. All of the named plaintiffs in the Baltimore Actions and the two actions filed in the U.S. District Court of Arizona claim to be Cole stockholders and purport to represent all holders of Cole’s common stock. Each complaint generally alleges that the individual defendants breached fiduciary duties owed to plaintiff, the other public stockholders of Cole and to Cole, and that certain entity defendants aided and abetted those breaches. In addition, certain lawsuits claim that the individual defendants breached their duty of candor to our stockholders and the Branham, Polage and Flynn lawsuits assert claims derivatively against the individual defendants for their alleged breach of fiduciary duties owed to Cole. The Polage lawsuit also asserts derivative claims for waste of corporate assets and unjust enrichment. The eight Baltimore Actions were consolidated on December 12, 2013. The Wunsch and Sobon lawsuits, which were consolidated by court order on January 17, 2014, also allege that the joint proxy statement filed in relation to the Cole Merger contains materially incomplete and misleading disclosures in violation of Sections 14(a) and 20(a) of the Exchange Act. Among other remedies, the complaints seek money damages, costs and attorneys’ fees.
On January 10, 2014, solely to avoid the costs, risks, and uncertainties inherent in litigation and without admitting any liability or wrongdoing, ARCP, Cole and the other named defendants in the Baltimore Actions entered into a memorandum of understanding
33
with the plaintiffs in the Baltimore Actions to settle the cases. The memorandum of understanding contemplates that the parties will enter into a stipulation of settlement. On August 14, 2014, the parties in the Baltimore Actions executed a Stipulation and Release and Agreement of Compromise and Settlement (the “Settlement Stipulation”). The parties in the Baltimore Actions submitted the Settlement Stipulation, along with related filings, for approval by the Maryland court on August 18, 2014. On August 25, 2014, the Baltimore Court entered an Order on Preliminary Approval of Derivative and Class Action Settlement and Class Action Certification (the “Preliminary Approval Order”). Pursuant to the Preliminary Approval Order, the defendants mailed the Notice of Pendency of Derivative and Class Action (the “Class Notice”) to the Cole shareholders on October 7, 2014. On December 3, 2014, the parties in the Baltimore Actions executed an Amended Stipulation and Release and Agreement of Compromise and Settlement (the “Amended Stipulation”) modifying the Settlement Stipulation. A final settlement hearing in the Baltimore Actions was held on December 12, 2014, and on January 13, 2015, the Baltimore Court issued an order approving the settlement pursuant to the terms of the Amended Stipulation. Two objectors subsequently filed a notice of appeal of the settlement order. Following court approval of the settlement of the Baltimore Actions, the Wunsch case was dismissed voluntarily on January 21, 2015.
One additional putative class action has been filed in the Supreme Court of New York, captioned as: Realistic Partners v. Schorsch et al. (the ‘‘Realistic Partners Action’’). This lawsuit names ARCP, the ARCP board of directors and Cole as defendants. The named plaintiff claims to be an ARCP stockholder and purports to represent all holders of ARCP’s common stock. The complaint generally alleges that ARCP and the individual defendants breached a fiduciary duty of candor allegedly owed to plaintiff and to the other public stockholders of ARCP, and that Cole aided and abetted those breaches. On January 17, 2014, solely to avoid the costs, risks, and uncertainties inherent in litigation and without admitting any liability or wrongdoing, ARCP, Cole and the other named defendants in the Realistic Partners Action entered into a memorandum of understanding with the plaintiff in the Realistic Partners Action to settle the case. The memorandum of understanding contemplates that the parties will enter into a stipulation of settlement. The stipulation of settlement will be subject to customary conditions, including court approval following notice to ARCP’s and Cole’s stockholders. In the event that the parties enter into a stipulation of settlement, a hearing will be scheduled by the court to consider the fairness, reasonableness, and adequacy of the settlement. In the event the settlement is finally approved by the court, it will resolve and release all claims in all actions that were or could have been brought challenging any aspect of the Cole Merger, the Cole Merger Agreement, and any disclosure made in connection therewith, among other claims, pursuant to terms that will be disclosed to stockholders prior to final approval of the settlement. In addition, in connection with the settlement, the parties contemplate that plaintiff’s counsel in the Realistic Partners Action will file a petition in the court for an award of attorneys’ fees and expenses to be paid by ARCP, which the defendants may oppose. ARCP will pay or cause to be paid any attorneys’ fees and expenses awarded by the court. There can be no assurance that the parties will ultimately enter into a stipulation of settlement or that the court will approve the settlement even if the parties were to enter into such stipulation. In such event, the proposed settlement as contemplated by the memorandum of understanding may be terminated.
A number of lawsuits by CapLease’s stockholders have been filed challenging the CapLease Merger, some of which name ARCP and the OP as defendants. Additionally, a lawsuit was commenced on behalf of holders of certain series of CapLease’s preferred stock in connection with the CapLease Merger alleging that the conversion of such preferred stock pursuant to the terms of the CapLease Merger Agreement violated the Articles Supplementary classifying and designating such preferred stock.
After the announcement of the ARCT III Merger Agreement, Randell Quaal filed a putative class action lawsuit on January 30, 2013 against the Company, the OP, ARCT III, ARCT III OP, the members of the board of directors of ARCT III and certain subsidiaries of the Company in the Supreme Court of the State of New York. In February 2013, the parties agreed to a memorandum of understanding regarding settlement of all claims asserted on behalf of the alleged class of ARCT III stockholders. In connection with the settlement contemplated by the memorandum of understanding, the class action and all claims asserted therein will be dismissed, subject to court approval. If the parties enter into a stipulation of settlement, a hearing will be scheduled at which the court will consider the fairness, reasonableness and adequacy of the settlement. There can be no assurance that the parties will ultimately enter into a stipulation of settlement, that the court will approve any proposed settlement, or that any eventual settlement will be under the same terms as those contemplated by the memorandum of understanding, therefore any losses that may be incurred to settle this matter are not determinable.
We cannot assure you as to the outcome of these lawsuits, including the costs associated with defending these claims or any other liabilities that may be incurred in connection with the litigation or settlement of these claims. Whether or not any plaintiffs’ claims are successful, this type of litigation is often expensive and diverts management’s attention and resources, which could adversely affect the operation of our business.
Our future results will suffer if we do not effectively manage our expanded portfolio and operations following the Recent Acquisitions.
Following the Recent Acquisitions, we have an expanded portfolio and operations and may continue to expand its operations through additional acquisitions and other strategic transactions, some of which may involve complex challenges. Our future success will depend, in part, upon our ability to manage our expansion opportunities, integrate new operations into our existing business
34
in an efficient and timely manner, successfully monitor our operations, costs, regulatory compliance and service quality, and maintain other necessary internal controls. We cannot assure you that our expansion or acquisition opportunities will be successful, or that we will realize the expected operating efficiencies, cost savings, revenue enhancements, synergies or other benefits.
ARCP may be unable to integrate the recently acquired GE Capital, Fortress, Red Lobster and Inland Portfolios into ARCP’s existing portfolio or CapLease’s, ARCT IV’s and Cole’s businesses with ARCP’s business successfully and realize the anticipated synergies and related benefits of such transactions and other pending acquisitions or do so within the anticipated timeframe.
ARCP’s consummation of the CapLease Merger, the ARCT IV Merger and the Cole Merger, involves the combination of companies that, prior to the consummation thereof, operated as independent companies. Additionally, ARCP recently acquired the GE Capital, Fortress, Red Lobster and Inland Portfolios. ARCP may be required to devote significant management attention and resources to integrating ARCP’s business practices and operations with those of CapLease, ARCT IV and Cole and the acquired GE Capital, Inland, Red Lobster and Fortress Portfolios. Potential difficulties ARCP may encounter in the integration process include the following:
| • | the inability to successfully combine ARCP’s business with CapLease’s, ARCT IV’s or Cole’s business or the GE Capital, Inland and Fortress Portfolios into ARCP’s portfolio, in each case in a manner that permits the combined company to achieve the anticipated cost savings, which would result in the anticipated benefits of the mergers and acquisitions not being realized in the timeframe anticipated or at all; |
| • | the complexities associated with managing the combined business out of several different locations and integrating personnel from the two companies; |
| • | the additional complexities of combining companies with different histories, cultures, potential regulatory restrictions, markets and tenant bases; |
| • | the failure to retain ARCP’s key employees or those of CapLease or Cole; |
| • | the inability to divest certain ARCT IV, CapLease or Cole assets not fundamental to ARCP’s business; |
| • | potential unknown liabilities and unforeseen increased expenses, delays or regulatory conditions associated with the combinations; and |
| • | performance shortfalls as a result of the diversion of management’s attention caused by completing the mergers and acquisitions described above and integrating the operations related thereto. |
For all these reasons, our stockholders should be aware that it is possible that the integration process following the Recent Acquisitions could result in the distraction of our management, the disruption of our ongoing business or inconsistencies in our services, standards, controls, procedures and policies, any of which could adversely affect our ability to maintain relationships with tenants, vendors and employees or to achieve the anticipated benefits of such transactions, or could otherwise adversely affect the business and our financial results.
U.S. Federal Income and Other Tax Risks
Our failure to remain qualified as a REIT would subject us to U.S. federal income tax and potentially state and local tax, and would adversely affect our operations and the market price of our common stock.
We elected to be taxed as a REIT commencing with the taxable year ended December 31, 2011 and believe we have operated, and intend to operate, in a manner that has allowed us to have qualified as a REIT and will allow us to continue to qualify as a REIT. However, we may terminate our REIT qualification if the Board of Directors determines that not qualifying as a REIT is in our best interests, or inadvertently. Our qualification as a REIT depends upon our satisfaction of certain asset, income, organizational, distribution, stockholder ownership and other requirements on a continuing basis. We structured our activities in a manner designed to satisfy all requirements for qualification as a REIT. However, the REIT qualification requirements are extremely complex and interpretation of the U.S. federal income tax laws governing qualification as a REIT is limited. Accordingly, we cannot be certain that we have been or will be successful in qualifying to be taxed as a REIT. Our ability to satisfy the asset tests depends on our analysis of the characterization and fair market values of our assets, some of which are not susceptible to a precise determination, and for which we will not obtain independent appraisals. Our compliance with the REIT income or quarterly asset requirements also depends on our ability to successfully manage the composition of our income and assets on an ongoing basis. Accordingly, if certain of our operations were to be recharacterized by the IRS, such recharacterization would jeopardize our ability to satisfy all requirements for qualification as a REIT. Furthermore, future legislative, judicial or administrative changes to the U.S. federal income tax laws could result in our disqualification as a REIT for past or future periods.
If we fail to qualify as a REIT for any taxable year and we do not qualify for certain statutory relief provisions, we will be subject to U.S. federal income tax on our taxable income at corporate rates. In addition, we would generally be disqualified from treatment as a REIT for the four taxable years following the year of losing our REIT qualification. Losing our REIT qualification would reduce our net earnings available for investment or distribution to stockholders because of the additional tax liability. In
35
addition, distributions to stockholders would no longer qualify for the dividends paid deduction, and we would no longer be required to make distributions. If this occurs, we might be required to borrow funds or liquidate some investments in order to pay the applicable tax.
Even with our REIT qualification, in certain circumstances, we may incur tax liabilities that would reduce our cash available for distribution to our stockholders.
Even with our REIT qualification, we may be subject to U.S. federal, state and local income taxes. For example, net income from the sale of properties that are “dealer” properties sold by a REIT (a “prohibited transaction” under the Code) will be subject to a 100% tax. In addition, we may not make sufficient dividends to avoid income and excise taxes on retained income. We also may decide to retain net capital gain we earn from the sale or other disposition of our property or other assets and pay U.S. federal income tax directly on such income. In that event, our stockholders would be treated for federal income tax purposes as if they earned that income and paid the tax on it directly. However, stockholders that are tax-exempt, such as charities or qualified pension plans, would have no benefit from their deemed payment of such tax liability unless they file U.S. federal income tax returns and thereon seek a refund of such tax. We may, in certain circumstances, be required to pay an excise or penalty tax (which could be significant in amount) in order to utilize one or more relief provisions under the Code to maintain our qualification as a REIT. We also may be subject to state and local taxes on our income or property, including franchise, payroll and transfer taxes, either directly or at the level of our operating partnership or at the level of the other companies through which we indirectly own our assets, such as TRSs, which are subject to full U.S. federal, state, local and foreign corporate-level income taxes. Any taxes we pay directly or indirectly will reduce our cash available for distribution to our stockholders.
To qualify as a REIT we must meet annual distribution requirements, which may force us to forgo otherwise attractive opportunities or borrow funds during unfavorable market conditions. This could delay or hinder our ability to meet our investment objectives and reduce our stockholders’ overall return.
In order to qualify as a REIT, we must distribute annually to our stockholders at least 90% of our REIT taxable income (which does not equal net income as calculated in accordance with GAAP), determined without regard to the deduction for dividends paid and excluding any net capital gain. We will be subject to U.S. federal income tax on our undistributed taxable income and net capital gain and to a 4% nondeductible excise tax on any amount by which dividends we pay with respect to any calendar year are less than the sum of (a) 85% of our ordinary income, (b) 95% of our capital gain net income and (c) 100% of our undistributed income from prior years. These requirements could cause us to distribute amounts that otherwise would be spent on investments in real estate assets and it is possible that we might be required to borrow funds, possibly at unfavorable rates, or sell assets to fund these dividends or make taxable stock dividends. Although we intend to make distributions sufficient to meet the annual distribution requirements and to avoid U.S. federal income and excise taxes on our earnings while we qualify as a REIT, it is possible that we might not always be able to do so.
Certain of our business activities are potentially subject to the prohibited transaction tax, which could reduce the return on our stockholders’ investments.
For so long as we qualify as a REIT, our ability to dispose of property during the first few years following acquisition may be restricted to a substantial extent as a result of our REIT qualification. Under applicable provisions of the Code regarding prohibited transactions by REITs, while we qualify as a REIT, we generally will be subject to a 100% penalty tax on any gain recognized on the sale or other disposition of any property (other than foreclosure property) that we own, directly or through any subsidiary entity, including our operating partnership, but generally excluding our TRSs, that is deemed to be inventory or property held primarily for sale to customers in the ordinary course of a trade or business. Whether property is inventory or otherwise held primarily for sale to customers in the ordinary course of a trade or business depends on the particular facts and circumstances surrounding each property. While we qualify as a REIT, we intend to avoid the 100% prohibited transaction tax by (a) conducting activities that may otherwise be considered prohibited transactions through a TRS (but such TRS will incur corporate rate income taxes with respect to any income or gain recognized by it), (b) conducting our operations in such a manner so that no sale or other disposition of an asset we own, directly or through any subsidiary, will be treated as a prohibited transaction and/or (c) structuring certain dispositions of our properties to comply with the requirements of a prohibited transaction “safe harbor” available under the Code for properties that, among other requirements, have been held for at least two years. However, despite our present intention, no assurance can be given that any particular property we own, directly or through any subsidiary entity, including our operating partnership, but generally excluding our TRSs, will not be treated as inventory or property held primarily for sale to customers in the ordinary course of a trade or business.
Our TRSs are subject to corporate-level taxes and our dealings with our TRSs may be subject to 100% excise tax.
A REIT may own up to 100% of the stock of one or more TRSs. Both the subsidiary and the REIT must jointly elect to treat the subsidiary as a TRS. A corporation of which a TRS directly or indirectly owns more than 35% of the voting power or value
36
of the stock will automatically be treated as a TRS. Overall, as of the end of each calendar quarter, no more than 25% of the value of a REIT’s assets may consist of stock or securities of one or more TRSs.
A TRS may hold assets and earn income that would not be qualifying assets or income if held or earned directly by a REIT, including gross income from operations pursuant to advisory agreements with the Managed REITs. We may use TRSs generally to hold properties for sale in the ordinary course of business or to hold assets or conduct activities that we cannot conduct directly as a REIT. Our TRSs will be subject to applicable U.S. federal, state, local and foreign income tax on their taxable income. In addition, the TRS rules limit the deductibility of interest paid or accrued by a TRS to its parent REIT to ensure that the TRS is subject to an appropriate level of corporate taxation. The rules which are applicable to us as a REIT also impose a 100% excise tax on certain transactions between a TRS and its parent REIT that are not conducted on an arm’s-length basis.
If our operating partnership failed to qualify as a partnership or was not otherwise disregarded for U.S. federal income tax purposes, then we would cease to qualify as a REIT.
We intend to maintain the status of our operating partnership as a partnership for U.S. federal income tax purposes. However, if the IRS were to successfully challenge the status of our operating partnership as a partnership for such purposes, it would be taxable as a corporation. In such event, this would reduce the amount of distributions that our operating partnership could make to us. This would also result in our failing to qualify as a REIT, and becoming subject to a corporate-level tax on our income. This would substantially reduce our cash available to pay distributions and the yield on our stockholders’ investments. In addition, if one or more of the partnerships or limited liability companies through which our operating partnership owns its properties, in whole or in part, loses its characterization as a partnership and is otherwise not disregarded for U.S. federal income tax purposes, then it would be subject to taxation as a corporation, thereby reducing distributions to the operating partnership. Such a recharacterization of an underlying property owner could also threaten our ability to maintain our REIT qualification.
We may choose to make distributions in our own stock, in which case stockholders may be required to pay U.S. federal income taxes in excess of the cash distributions stockholders receive.
In connection with our qualification as a REIT, we are required to distribute annually to our stockholders at least 90% of our REIT taxable income (which does not equal net income as calculated in accordance with U.S. GAAP), determined without regard to the deduction for dividends paid and excluding net capital gain. In order to satisfy this requirement, we may make taxable stock distributions, such as distributions that are payable in cash and/or shares of our common stock at the election of each stockholder. Taxable stockholders receiving taxable stock distributions will be required to include the amount of such distributions (i.e., the value of the stock received plus the amount of any cash received) as ordinary dividend income to the extent of our current or accumulated earnings and profits, as determined for U.S. federal income tax purposes. As a result, U.S. stockholders may be required to pay U.S. federal income taxes with respect to such distributions in excess of the cash portion of the distribution received. Accordingly, U.S. stockholders receiving a distribution of our shares may be required to sell shares received in such distribution or may be required to sell other stock or assets owned by them, at a time that may be disadvantageous, in order to satisfy any tax imposed on such distribution. If a U.S. stockholder sells the stock that it receives as part of the distribution in order to pay this tax, the sales proceeds may be less than the amount included in income with respect to the distribution, depending on the market price of our stock at the time of the sale. Furthermore, with respect to certain non-U.S. stockholders, we may be required to withhold U.S. tax with respect to such distribution, including in respect of all or a portion of such distribution that is payable in stock, by withholding or disposing of part of the shares included in such distribution and using the proceeds of such disposition to satisfy the withholding tax imposed. In addition, if a significant number of our stockholders determine to sell shares of our common stock in order to pay taxes owed on dividend income, such sale may put downward pressure on the market price of our common stock.
Various tax aspects of such a taxable cash/stock distribution are uncertain and have not yet been addressed by the IRS. No assurance can be given that the IRS will not impose requirements in the future with respect to taxable cash/stock distributions, including on a retroactive basis, or assert that the requirements for such taxable cash/stock distributions have not been met.
The taxation of distributions to our stockholders can be complex; however, dividends that we make to our stockholders generally will be taxable as ordinary income.
Dividends that we make to our taxable stockholders out of current and accumulated earnings and profits (and not designated as capital gain dividends or qualified dividend income) generally will be taxable as ordinary income. However, a portion of our dividends may (1) be designated by us as capital gain dividends generally taxable as long-term capital gain to the extent that they are attributable to net capital gain recognized by us, (2) be designated by us as qualified dividend income generally to the extent they are attributable to dividends we receive from our TRSs, or (3) constitute a nondividend distribution generally to the extent that they exceed our accumulated earnings and profits as determined for U.S. federal income tax purposes. A nondividend distribution is not taxable to the extent of a stockholder’s adjusted basis in our common stock, but instead has the effect of reducing such adjusted basis, but not below zero, in our common stock. Any nondividend distribution in excess of a stockholder’s adjusted
37
basis in our common stock, will be taxed to such stockholder as long term capital gain if such stockholder held our common shares for more than one year, or short term capital gain, if the shares of our stock have been held for one year or less.
Dividends payable by REITs generally do not qualify for the reduced tax rates available for some dividends.
Currently, the maximum federal tax rate applicable to qualified dividend income payable to U.S. stockholders that are individuals, trusts and estates is 20% (not including the net investment income tax). Dividends payable by REITs, however, generally are not eligible for this reduced rate. Although this does not adversely affect the taxation of REITs or dividends payable by REITs, the more favorable rates applicable to regular corporate qualified dividends could cause investors who are individuals, trusts and estates to perceive investments in REITs to be relatively less attractive than investments in the stocks of non-REIT corporations that pay dividends, which could adversely affect the value of the shares of REITs, including our common stock. Tax rates could be changed in future legislation.
If we were considered to actually or constructively pay a “preferential dividend” to certain of our stockholders, our status as a REIT could be adversely affected.
In order to qualify as a REIT, we must distribute annually to our stockholders at least 90% of our REIT taxable income (which does not equal net income as calculated in accordance with U.S. GAAP), determined without regard to the deduction for dividends paid and excluding net capital gain. In order for distributions to be counted as satisfying the annual distribution requirements for REITs, and to provide us with a REIT-level tax deduction, the distributions must not be “preferential dividends.” A dividend is not a preferential dividend if the distribution is pro rata among all outstanding shares of stock within a particular class, and in accordance with the preferences among different classes of stock as set forth in our organizational documents. Currently, there is uncertainty as to the IRS’s position regarding whether certain arrangements that REITs have with their stockholders could give rise to the inadvertent payment of a preferential dividend (e.g., the pricing methodology for stock purchased under a distribution reinvestment plan inadvertently causing a greater than 5% discount on the price of such stock purchased). While we believe that our operations have been structured in such a manner that we will not be treated as inadvertently paying preferential dividends, there is no de minimis or reasonable cause exception with respect to preferential dividends under the Code. Therefore, if the IRS were to take the position that we inadvertently paid a preferential dividend, we may be deemed either to (a) have distributed less than 100% of our REIT taxable income and be subject to tax on the undistributed portion, or (b) have distributed less than 90% of our REIT taxable income and our status as a REIT could be terminated for the year in which such determination is made if we were unable to cure such failure.
Complying with REIT requirements may limit our ability to hedge our liabilities effectively and may cause us to incur tax liabilities.
The REIT provisions of the Code may limit our ability to hedge our liabilities. Any income from a hedging transaction we enter into to manage risk of interest rate changes, price changes or currency fluctuations with respect to borrowings made or to be made to acquire or carry real estate assets, if properly identified under applicable Treasury Regulations, does not constitute “gross income” for purposes of the 75% or 95% gross income tests. To the extent that we enter into other types of hedging transactions, the income from those transactions will likely be treated as non-qualifying income for purposes of one or both of the gross income tests. As a result of these rules, we may need to limit our use of advantageous hedging techniques or implement those hedges through a TRS. This could increase the cost of our hedging activities because our TRSs would be subject to tax on gains or expose us to greater risks associated with changes in interest rates than we would otherwise want to bear. In addition, losses in a TRS generally will not provide any tax benefit, except for being carried forward against future taxable income of such TRS.
Complying with REIT requirements may force us to forgo or liquidate otherwise attractive investment opportunities.
To qualify as a REIT, we must ensure that we meet the REIT gross income tests annually and that at the end of each calendar quarter, at least 75% of the value of our assets consists of cash, cash items, government securities and qualified REIT real estate assets, including certain mortgage loans and certain kinds of mortgage-related securities. The remainder of our investment in securities (other than government securities, qualified real estate assets and stock of a TRS) generally cannot include more than 10% of the outstanding voting securities of any one issuer or more than 10% of the total value of the outstanding securities of any one issuer. In addition, in general, no more than 5% of the value of our assets (other than government securities, qualified real estate assets and stock of a TRS) can consist of the securities of any one issuer, and no more than 25% of the value of our total assets can be represented by securities of one or more TRSs. If we fail to comply with these requirements at the end of any calendar quarter, we must correct the failure within 30 days after the end of the calendar quarter or qualify for certain statutory relief provisions to avoid losing our REIT qualification and suffering adverse tax consequences. As a result, we may be required to liquidate assets from our portfolio or not make otherwise attractive investments in order to maintain our qualification as a REIT. These actions could have the effect of reducing our income and amounts available for distribution to our stockholders.
38
The ability of the Board of Directors to revoke our REIT qualification without stockholder approval may subject us to U.S. federal income tax and reduce dividends to our stockholders.
Our charter provides that the Board of Directors may revoke or otherwise terminate our REIT election, without the approval of our stockholders, if it determines that it is no longer in our best interest to continue to qualify as a REIT. While we elected to be taxed as a REIT, we may terminate our REIT election if we determine that qualifying as a REIT is no longer in the best interests of our stockholders. If we cease to be a REIT, we would become subject to U.S. federal income tax on our taxable income and would no longer be required to distribute most of our taxable income to our stockholders, which may have adverse consequences on our total return to our stockholders and on the market price of our common stock.
We may incur adverse tax consequences if ARCT III, CapLease, ARCT IV or Cole has failed qualify as a REIT for U.S. federal income tax purposes.
If ARCT III, CapLease, ARCT IV or Cole has failed to qualify as a REIT for U.S. federal income tax purposes at any time prior to the ARCT III Merger, the CapLease Merger, the ARCT IV Merger and the Cole Merger, respectively, we may inherit significant tax liabilities and could fail to qualify as a REIT should disqualifying activities continue after the mergers.
We may be subject to adverse legislative or regulatory tax changes that could increase our tax liability, reduce our operating flexibility and reduce the market price of our common stock.
In recent years, numerous legislative, judicial and administrative changes have been made in the provisions of U.S. federal income tax laws applicable to investments similar to an investment in shares of our common stock. Additional changes to the tax laws are likely to continue to occur, and we cannot assure our stockholders that any such changes will not adversely affect the taxation of a stockholder. Any such changes could have an adverse effect on an investment in our shares or on the market value or the resale potential of our assets. Our stockholders are urged to consult with their tax advisor with respect to the impact of recent legislation on their investment in our shares and the status of legislative, regulatory or administrative developments and proposals and their potential effect on an investment in our shares.
Although REITs generally receive better tax treatment than entities taxed as regular corporations, it is possible that future legislation would result in a REIT having fewer tax advantages, and it could become more advantageous for a company that invests in real estate to elect to be treated for U.S. federal income tax purposes as a regular corporation. As a result, our charter provides the Board of Directors with the power, under certain circumstances, to revoke or otherwise terminate our REIT election and cause us to be taxed as a regular corporation, without the vote of our stockholders. The Board of Directors has fiduciary duties to us and our stockholders and could only cause such changes in our tax treatment if it determines in good faith that such changes are in the best interest of our stockholders.
The share ownership restrictions of the Code for REITs and the 9.8% share ownership limit in our charter may inhibit market activity in our shares of stock and restrict our business combination opportunities.
In order to qualify as a REIT, five or fewer individuals, as defined in the Code, may not own, actually or constructively, more than 50% in value of our issued and outstanding shares of stock at any time during the last half of each taxable year, other than the first year for which a REIT election is made. Attribution rules in the Code determine if any individual or entity actually or constructively owns our shares of stock under this requirement. Additionally, at least 100 persons must beneficially own our shares of stock during at least 335 days of a taxable year for each taxable year, other than the first year for which a REIT election is made. To help insure that we meet these tests, among other purposes, our charter restricts the acquisition and ownership of our shares of stock.
Our charter, with certain exceptions, authorizes our directors to take such actions as are necessary and desirable to preserve our qualification as a REIT while we so qualify. Unless exempted by the Board of Directors, for so long as we qualify as a REIT, our charter prohibits, among other limitations on ownership and transfer of shares of our stock, any person from beneficially or constructively owning (applying certain attribution rules under the Code) more than 9.8% in value of the aggregate of our outstanding shares of stock and more than 9.8% (in value or in number of shares, whichever is more restrictive) of any class or series of our shares of stock. The Board of Directors may not grant an exemption from these restrictions to any proposed transferee whose ownership in excess of the 9.8% ownership limit would result in the termination of our qualification as a REIT. These restrictions on transferability and ownership will not apply, however, if the Board of Directors determines that it is no longer in our best interest to continue to qualify as a REIT or that compliance with the restrictions is no longer required in order for us to continue to so qualify as a REIT.
These ownership limits could delay or prevent a transaction or a change in control that might involve a premium price for our common stock or otherwise be in the best interest of our stockholders.
39
Non-U.S. stockholders will be subject to U.S. federal withholding tax and may be subject to U.S. federal income tax on dividends received from us and upon the disposition of our shares.
Subject to certain exceptions, distributions received from us will be treated as dividends of ordinary income to the extent of our current or accumulated earnings and profits. Such dividends ordinarily will be subject to U.S. withholding tax at a 30% rate, or such lower rate as, and to the extent, may be specified by an applicable income tax treaty, unless the dividends are treated as “effectively connected” with the conduct by the non-U.S. stockholder of a U.S. trade or business. Pursuant to the Foreign Investment in Real Property Tax Act of 1980, or FIRPTA, distributions attributable to sales or exchanges of “U.S. real property interests,” or USRPIs, by us generally will be taxed to a non-U.S. stockholder as if such gain were effectively connected with a U.S. trade or business. However, a distribution of USRPI gain will not be treated as effectively connected income if (a) the distribution is received with respect to a class of stock that is regularly traded on an established securities market located in the United States; and (b) the non-U.S. stockholder does not own more than 5% of the class of our stock at any time during the one year period ending on the date of such distribution. We anticipate that our shares will be “regularly traded” on an established securities market for the foreseeable future, although, no assurance can be given that this will be the case.
Gain recognized by a non-U.S. stockholder upon the sale or exchange of our common stock generally will not be subject to U.S. federal income taxation unless such stock constitutes a USRPI under FIRPTA. Our common stock will not constitute a USRPI so long as we are a “domestically-controlled qualified investment entity.” A domestically-controlled qualified investment entity includes a REIT if at all times during a specified testing period, less than 50% in value of such REIT’s stock is held directly or indirectly by non-U.S. stockholders. We believe that we are a domestically-controlled qualified investment entity. However, because our common stock is and will be publicly traded, no assurance can be given that we are or will be a domestically-controlled qualified investment entity.
Even if we do not qualify as a domestically-controlled qualified investment entity at the time a non-U.S. stockholder sells or exchanges our common stock, gain arising from such a sale or exchange would not be subject to U.S. taxation under FIRPTA as a sale of a USRPI if: (a) our common stock is “regularly traded,” as defined by applicable Treasury regulations, on an established securities market, and (b) such non-U.S. stockholder owned, actually and constructively, 5% or less of our common stock at any time during the five-year period ending on the date of the sale. We encourage our stockholders to consult their tax advisor to determine the tax consequences applicable to them if they are non-U.S. stockholders.
Dividends or gain on sale may be treated as unrelated business taxable income to tax-exempt investors.
If (a) we are a “pension-held REIT,” (b) a tax-exempt stockholder has incurred (or is deemed to have incurred) debt to purchase or hold our common stock, or (c) a holder of common stock is a certain type of tax-exempt stockholder, dividends on, and gains recognized on the sale of, common stock by such tax-exempt stockholder may be subject to U.S. federal income tax as unrelated business taxable income under the Code. We encourage our stockholders to consult their tax advisor to determine the tax consequences applicable to them if they are tax-exempt stockholders.
Even if we qualify as a REIT for federal income tax purposes and incur no federal corporate or excise taxes on our federal taxable income, we may still be subject to various taxes in the state, local and foreign taxing jurisdictions in which we directly or indirectly own properties or otherwise conduct business.
Not all taxing jurisdictions recognize the favorable tax treatment afforded to REITs under the Code. As such, we may be subject to regular corporate net income taxes in certain state, local or foreign taxing jurisdictions. In addition, we, the Operating Partnership, our TRSs, and/or other entities through which we conduct our business may also be subject to state, local or foreign income, franchise, sales, transfer, excise or other taxes. Any taxes that we incur directly or indirectly will reduce our cash available for distribution to our stockholders. Additionally, changes in state, local or foreign tax law could reduce the cash flow from certain investments made by us and could make such investments less attractive to potential buyers when we seek to liquidate such investments.
Item 1B. Unresolved Staff Comments.
None.
Item 2. Properties.
General
As of December 31, 2014, we owned 4,648 properties, comprised of 103.1 million square feet and located in 49 states, the District of Columbia, Puerto Rico, and Canada. Our properties were 99.3% occupied with a weighted-average remaining lease term of 11.8 years as of December 31, 2014.
40
Industry Distribution
The following table details the industry distribution of our portfolio as of December 31, 2014 (dollars in thousands):
| Industry | Number of Leases | Square Feet | Square Feet as a % of Total Portfolio | Annualized Rental Income | Annualized Rental Income as a % of Total Portfolio | |||||||||||
| Accommodation & Food Services | 1 | 9,513 | — | % | $ | 228 | — | % | ||||||||
| Administrative & Support Services | 5 | 430,227 | 0.4 | % | 4,054 | 0.3 | % | |||||||||
| Agricultural | 2 | 137,520 | 0.1 | % | 1,245 | 0.1 | % | |||||||||
| Billboard | 5 | — | — | % | 53 | — | % | |||||||||
| Construction | 1 | 27,115 | — | % | 344 | — | % | |||||||||
| Education | 5 | 1,887,164 | 1.8 | % | 20,763 | 1.5 | % | |||||||||
| Entertainment & Recreation | 23 | 850,981 | 0.8 | % | 15,752 | 1.1 | % | |||||||||
| Finance | 309 | 3,086,515 | 3.0 | % | 65,965 | 4.8 | % | |||||||||
| Government & Public Services | 31 | 1,275,972 | 1.2 | % | 30,995 | 2.3 | % | |||||||||
| Healthcare | 82 | 1,662,903 | 1.6 | % | 30,246 | 2.2 | % | |||||||||
| Information & Communications | 17 | 1,507,709 | 1.5 | % | 27,289 | 2.0 | % | |||||||||
| Insurance | 20 | 2,163,389 | 2.1 | % | 40,764 | 3.0 | % | |||||||||
| License Agreement | 8 | — | — | % | 8 | — | % | |||||||||
| Logistics | 63 | 4,800,451 | 4.7 | % | 41,507 | 3.0 | % | |||||||||
| Manufacturing | 69 | 19,428,581 | 18.8 | % | 127,237 | 9.2 | % | |||||||||
| Mining & Natural Resources | 16 | 736,172 | 0.7 | % | 14,744 | 1.1 | % | |||||||||
| Other Services | 38 | 5,234,675 | 5.1 | % | 19,417 | 1.4 | % | |||||||||
| Parking Lot | 2 | 8,400 | — | % | 38 | — | % | |||||||||
| Professional Services | 72 | 4,242,109 | 4.1 | % | 59,606 | 4.3 | % | |||||||||
| Real Estate | 3 | 44,059 | — | % | 658 | — | % | |||||||||
| Rental | 44 | 712,860 | 0.7 | % | 6,734 | 0.5 | % | |||||||||
| Restaurants - Other | 998 | 6,818,126 | 6.6 | % | 253,936 | 18.4 | % | |||||||||
| Restaurants - Quick Service | 1,218 | 4,372,927 | 4.2 | % | 121,506 | 8.8 | % | |||||||||
| Retail - Apparel & Jewelry | 15 | 1,402,799 | 1.4 | % | 15,311 | 1.1 | % | |||||||||
| Retail - Automotive | 167 | 1,197,391 | 1.2 | % | 21,987 | 1.6 | % | |||||||||
| Retail - Department Stores | 14 | 1,050,948 | 1.0 | % | 8,591 | 0.6 | % | |||||||||
| Retail - Discount | 830 | 10,282,525 | 10.0 | % | 93,982 | 6.8 | % | |||||||||
| Retail - Electronics & Appliances | 23 | 701,381 | 0.7 | % | 9,617 | 0.7 | % | |||||||||
| Retail - Gas & Convenience | 127 | 526,556 | 0.5 | % | 27,114 | 2.0 | % | |||||||||
| Retail - Grocery & Supermarket | 87 | 5,631,656 | 5.5 | % | 59,055 | 4.3 | % | |||||||||
| Retail - Hobby, Books & Music | 10 | 364,971 | 0.4 | % | 3,557 | 0.3 | % | |||||||||
| Retail - Home & Garden | 103 | 7,866,439 | 7.6 | % | 57,724 | 4.2 | % | |||||||||
| Retail - Home Furnishings | 39 | 452,976 | 0.4 | % | 7,400 | 0.5 | % | |||||||||
| Retail - Internet | 3 | 3,048,444 | 3.0 | % | 14,159 | 1.0 | % | |||||||||
| Retail - Office Supply | 5 | 97,396 | 0.1 | % | 1,355 | 0.1 | % | |||||||||
| Retail - Pet Supply | 25 | 902,817 | 0.9 | % | 18,444 | 1.3 | % | |||||||||
| Retail - Pharmacy | 339 | 4,915,236 | 4.8 | % | 110,836 | 8.1 | % | |||||||||
| Retail - Specialty (Other) | 27 | 575,679 | 0.6 | % | 6,362 | 0.5 | % | |||||||||
| Retail - Sporting Goods | 22 | 1,271,446 | 1.2 | % | 14,876 | 1.1 | % | |||||||||
| Retail - Warehouse Clubs | 17 | 2,630,903 | 2.6 | % | 22,368 | 1.7 | % | |||||||||
| Transportation | 1 | 49,920 | — | % | 6 | — | % | |||||||||
| Utilities | 2 | 40,734 | — | % | 931 | 0.1 | % | |||||||||
| Vacant | 43 | 700,961 | 0.7 | % | — | — | % | |||||||||
| 4,931 | 103,148,546 | 100 | % | $ | 1,376,764 | 100 | % | |||||||||
41
Geographical Distribution
The following table details the geographic distribution of our portfolio as of December 31, 2014 (dollars in thousands):
| State/Possession | Number of Properties | Square Feet | Square Feet as a % of Total Portfolio | Annualized Rental Income | Annualized Rental Income as a % of Total Portfolio | |||||||||||
| Alabama | 158 | 1,765,783 | 1.7 | % | $ | 32,818 | 2.4 | % | ||||||||
| Alaska | 3 | 25,070 | — | % | 774 | 0.1 | % | |||||||||
| Alberta | 4 | 31,667 | — | % | 1,912 | 0.1 | % | |||||||||
| Arizona | 88 | 3,009,724 | 2.9 | % | 53,067 | 3.9 | % | |||||||||
| Arkansas | 103 | 1,027,467 | 1.0 | % | 13,083 | 1.0 | % | |||||||||
| California | 102 | 5,028,083 | 4.9 | % | 75,691 | 5.5 | % | |||||||||
| Colorado | 59 | 1,935,612 | 1.9 | % | 29,251 | 2.1 | % | |||||||||
| Connecticut | 20 | 99,818 | 0.1 | % | 2,840 | 0.2 | % | |||||||||
| Delaware | 12 | 106,658 | 0.1 | % | 2,582 | 0.2 | % | |||||||||
| District of Columbia | 1 | 3,210 | — | % | 44 | — | % | |||||||||
| Florida | 303 | 5,230,412 | 5.1 | % | 81,141 | 5.9 | % | |||||||||
| Georgia | 227 | 5,010,854 | 4.9 | % | 67,873 | 4.9 | % | |||||||||
| Idaho | 20 | 146,935 | 0.1 | % | 4,542 | 0.3 | % | |||||||||
| Illinois | 193 | 6,136,866 | 6.0 | % | 82,280 | 6.0 | % | |||||||||
| Indiana | 147 | 5,972,034 | 5.8 | % | 46,595 | 3.4 | % | |||||||||
| Iowa | 54 | 1,621,488 | 1.6 | % | 15,524 | 1.1 | % | |||||||||
| Kansas | 53 | 2,400,807 | 2.3 | % | 17,035 | 1.2 | % | |||||||||
| Kentucky | 95 | 2,242,251 | 2.2 | % | 27,355 | 2.0 | % | |||||||||
| Louisiana | 103 | 1,685,842 | 1.6 | % | 23,878 | 1.7 | % | |||||||||
| Maine | 25 | 648,410 | 0.6 | % | 8,547 | 0.6 | % | |||||||||
| Manitoba | 2 | 15,900 | — | % | 827 | 0.1 | % | |||||||||
| Maryland | 35 | 871,590 | 0.8 | % | 17,910 | 1.3 | % | |||||||||
| Massachusetts | 41 | 2,650,803 | 2.6 | % | 31,059 | 2.3 | % | |||||||||
| Michigan | 194 | 2,495,930 | 2.4 | % | 39,966 | 2.9 | % | |||||||||
| Minnesota | 48 | 585,633 | 0.6 | % | 9,188 | 0.7 | % | |||||||||
| Mississippi | 81 | 1,843,066 | 1.8 | % | 16,397 | 1.2 | % | |||||||||
| Missouri | 172 | 1,954,947 | 1.9 | % | 27,910 | 2.0 | % | |||||||||
| Montana | 10 | 85,057 | 0.1 | % | 1,701 | 0.1 | % | |||||||||
| Nebraska | 25 | 695,991 | 0.7 | % | 12,719 | 0.9 | % | |||||||||
| Nevada | 33 | 753,105 | 0.7 | % | 9,870 | 0.7 | % | |||||||||
| New Hampshire | 20 | 250,717 | 0.2 | % | 4,398 | 0.3 | % | |||||||||
| New Jersey | 39 | 1,693,388 | 1.6 | % | 37,458 | 2.7 | % | |||||||||
| New Mexico | 57 | 934,278 | 0.9 | % | 14,514 | 1.0 | % | |||||||||
| New York | 94 | 1,809,498 | 1.8 | % | 34,465 | 2.5 | % | |||||||||
| North Carolina | 187 | 3,965,561 | 3.8 | % | 43,417 | 3.2 | % | |||||||||
| North Dakota | 12 | 200,818 | 0.2 | % | 4,589 | 0.3 | % | |||||||||
| Ohio | 301 | 5,829,486 | 5.7 | % | 56,768 | 4.1 | % | |||||||||
| Oklahoma | 90 | 2,113,928 | 2.0 | % | 27,318 | 2.0 | % | |||||||||
| Ontario | 11 | 77,885 | 0.1 | % | 4,242 | 0.3 | % | |||||||||
| Oregon | 17 | 319,773 | 0.3 | % | 4,433 | 0.3 | % | |||||||||
| Pennsylvania | 176 | 5,806,529 | 5.6 | % | 60,286 | 4.4 | % | |||||||||
| Puerto Rico | 3 | 87,550 | 0.1 | % | 2,429 | 0.2 | % | |||||||||
42
| State/Possession | Number of Properties | Square Feet | Square Feet as a % of Total Portfolio | Annualized Rental Income | Annualized Rental Income as a % of Total Portfolio | |||||||||||
| Rhode Island | 14 | 214,079 | 0.2 | % | $ | 3,649 | 0.3 | % | ||||||||
| Saskatchewan | 2 | 16,800 | — | % | 796 | 0.1 | % | |||||||||
| South Carolina | 126 | 3,380,193 | 3.3 | % | 30,641 | 2.2 | % | |||||||||
| South Dakota | 11 | 124,104 | 0.1 | % | 1,614 | 0.1 | % | |||||||||
| Tennessee | 137 | 3,487,182 | 3.4 | % | 34,528 | 2.5 | % | |||||||||
| Texas | 628 | 12,037,105 | 11.7 | % | 175,323 | 12.7 | % | |||||||||
| Utah | 14 | 142,598 | 0.1 | % | 3,178 | 0.2 | % | |||||||||
| Vermont | 8 | 36,749 | — | % | 734 | 0.1 | % | |||||||||
| Virginia | 120 | 2,135,543 | 2.1 | % | 38,281 | 2.8 | % | |||||||||
| Washington | 27 | 492,078 | 0.5 | % | 11,840 | 0.9 | % | |||||||||
| West Virginia | 44 | 271,806 | 0.3 | % | 6,917 | 0.5 | % | |||||||||
| Wisconsin | 88 | 1,569,827 | 1.5 | % | 18,858 | 1.4 | % | |||||||||
| Wyoming | 11 | 70,058 | 0.1 | % | 1,709 | 0.1 | % | |||||||||
| 4,648 | 103,148,546 | 100.0 | % | $ | 1,376,764 | 100.0 | % | |||||||||
Tenant Concentration
Red Lobster’s annualized rental income, on a straight-line basis, represented 11.6% of consolidated annualized rental income on a straight-line basis as of December 31, 2014.
Property Type
The following table details the property type of our portfolio as of December 31, 2014 (dollars in thousands):
| Property Type | Number of Properties | Square Feet | Square Feet as a % of Total Portfolio | Annualized Rental Income | Annualized Rental Income as a % of Total Portfolio | |||||||||||
| Billboard | 4 | — | — | % | $ | 51 | — | % | ||||||||
| Construction in Progress | 22 | 710,262 | 0.7 | % | 6,782 | 0.5 | % | |||||||||
| Distribution | 94 | 28,303,085 | 27.4 | % | 142,393 | 10.3 | % | |||||||||
| Industrial | 79 | 11,766,597 | 11.5 | % | 67,213 | 4.9 | % | |||||||||
| Multi-Tenant Retail | 20 | 1,880,571 | 1.8 | % | 26,501 | 1.9 | % | |||||||||
| Office | 165 | 17,414,512 | 16.9 | % | 314,059 | 22.9 | % | |||||||||
| Parking Lot | 1 | 8,400 | — | % | 1 | — | % | |||||||||
| Restaurant | 2,175 | 11,084,904 | 10.7 | % | 372,200 | 27.0 | % | |||||||||
| Retail | 2,084 | 31,736,460 | 30.8 | % | 447,564 | 32.5 | % | |||||||||
| Vacant | 4 | 243,755 | 0.2 | % | — | — | % | |||||||||
| 4,648 | 103,148,546 | 100.0 | % | $ | 1,376,764 | 100.0 | % | |||||||||
Property Financing
Our mortgage notes payable consist of the following as of December 31, 2014 and 2013 (dollar amounts in thousands):
| Encumbered Properties | Outstanding Loan Amount | Weighted Average Effective Interest Rate (1) | Weighted Average Maturity (2) | |||||||||
| December 31, 2014 | 776 | $ | 3,689,795 | 4.88 | % | 6.18 | ||||||
| December 31, 2013 | 177 | $ | 1,258,661 | 3.42 | % | 3.41 | ||||||
_______________________________________________
| (1) | Mortgage notes payable have fixed rates or are fixed by way of interest rate swap arrangements. Effective interest rates range from 2.75% to 7.20% at December 31, 2014 and 1.83% to 6.28% at December 31, 2013. |
| (2) | Weighted-average remaining years until maturity as of December 31, 2014 and 2013, respectively. |
43
In addition, we have financing, which is not secured by interests in real property, which is described under Item 7. Management’s Discussion and Analysis of Financial Condition and Results of Operations.
Future Minimum Lease Payments
The following table presents future minimum base rental cash payments due to us over the next 10 years. These amounts exclude contingent rent payments, as applicable, that may be collected from certain tenants based on provisions related to sales thresholds and increases in annual rent based on exceeding certain economic indexes among other items (amounts in thousands):
| Future Minimum Base Rent Payments | ||||
| 2015 | $ | 1,249,809 | ||
| 2016 | 1,244,263 | |||
| 2017 | 1,212,087 | |||
| 2018 | 1,174,316 | |||
| 2019 | 1,132,671 | |||
| 2020 | 1,093,941 | |||
| 2021 | 1,051,088 | |||
| 2022 | 971,473 | |||
| 2023 | 890,911 | |||
| 2024 | 811,181 | |||
| Thereafter | 5,238,869 | |||
| $ | 16,070,609 | |||
Future Lease Expirations
The following is a summary of lease expirations for the next 10 years at the properties we own as of December 31, 2014 (dollar amounts in thousands):
| Year of Expiration | Number of Leases Expiring | Square Feet | Square Feet as a % of Total Portfolio | Annualized Rental Income Expiring | Annualized Rental Income Expiring as a % of Total Portfolio | |||||||||||
| 2015 | 129 | 1,764,327 | 1.7 | % | $ | 20,620 | 1.5 | % | ||||||||
| 2016 | 153 | 3,555,200 | 3.5 | % | 34,004 | 2.5 | % | |||||||||
| 2017 | 278 | 5,073,324 | 4.9 | % | 59,116 | 4.3 | % | |||||||||
| 2018 | 248 | 3,107,173 | 3.0 | % | 41,052 | 3.0 | % | |||||||||
| 2019 | 201 | 3,343,272 | 3.2 | % | 56,797 | 4.1 | % | |||||||||
| 2020 | 188 | 3,672,980 | 3.6 | % | 45,729 | 3.3 | % | |||||||||
| 2021 | 183 | 12,263,521 | 11.9 | % | 92,984 | 6.8 | % | |||||||||
| 2022 | 265 | 9,379,757 | 9.1 | % | 79,730 | 5.8 | % | |||||||||
| 2023 | 234 | 6,536,828 | 6.3 | % | 86,953 | 6.3 | % | |||||||||
| 2024 | 199 | 10,305,839 | 10.0 | % | 127,311 | 9.3 | % | |||||||||
| 2,078 | 59,002,221 | 57.2 | % | $ | 644,296 | 46.9 | % | |||||||||
Item 3. Legal Proceedings.
The information contained under the heading “Litigation” in Note 17 – Commitments and Contingencies to our consolidated financial statements in this report is incorporated by reference into this Item 3.
Item 4. Mine Safety Disclosures.
Not applicable.
44
PART II
Item 5. Market for Registrant’s Common Equity, Related Stockholder Matters and Issuer Purchases of Equity Securities.
Market Information
Our common stock is currently traded on the NASDAQ under the symbol “ARCP”. Set forth below is a line graph comparing the cumulative total stockholder return on our common stock, based on the market price of the common stock and assuming reinvestment of dividends, with the FTSE National Association of Real Estate Investment Trusts All Equity REITs Index (“FTSE NAREIT All Equity REITs”) and the S&P 500 Index (“S&P 500”) for the period commencing September 6, 2011, the date of our IPO, and ending December 31, 2014. The graph assumes an investment of $100 on September 6, 2011.
Comparison to Cumulative Total Return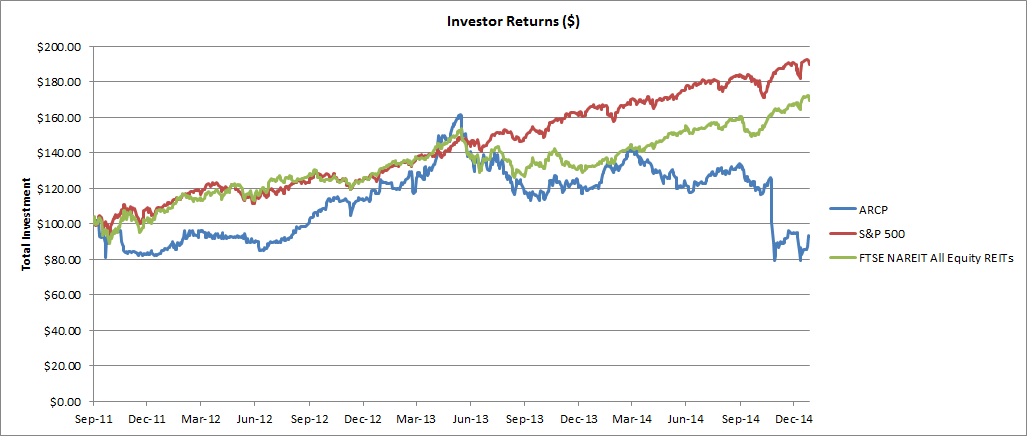
For each calendar quarter indicated, the following table reflects respective high, low and closing sales prices for the common stock as quoted by NASDAQ and the dividends paid per common share in each such period:
| First Quarter 2013 | Second Quarter 2013 | Third Quarter 2013 | Fourth Quarter 2013 | First Quarter 2014 | Second Quarter 2014 | Third Quarter 2014 | Fourth Quarter 2014 | |||||||||||||||||||||||||
| High | $ | 14.92 | $ | 18.05 | $ | 15.36 | $ | 13.94 | $ | 14.96 | $ | 14.17 | $ | 13.44 | $ | 12.48 | ||||||||||||||||
| Low | $ | 12.45 | $ | 13.99 | $ | 12.13 | $ | 12.16 | $ | 12.60 | $ | 11.76 | $ | 12.00 | $ | 7.38 | ||||||||||||||||
| Close | $ | 14.67 | $ | 15.26 | $ | 12.20 | $ | 12.85 | $ | 14.02 | $ | 12.53 | $ | 12.06 | $ | 9.05 | ||||||||||||||||
| Dividends paid monthly per common share | $ | 0.23 | $ | 0.23 | $ | 0.23 | $ | 0.23 | $ | 0.33 | $ | 0.25 | $ | 0.25 | $ | 0.25 | ||||||||||||||||
Holders
As of March 27, 2015, we had 905,193,685 shares of common stock outstanding held by 5,344 stockholders of record.
Dividends
On December 23, 2014, pursuant to a waiver and consent relating to the Credit Facility, we agreed to not pay a dividend on our common stock until the filing of this report. Our board of directors is currently reviewing our dividend policy and following delivery of its financial statements, expects to adopt a policy of paying a common stock dividend in line with our industry peers, while still meeting the minimum distribution requirement to maintain our status as a REIT.
45
Securities Authorized for Issuance Under Equity Compensation Plans
See Note 19 – Equity-based Compensation to the consolidated financial statements in this report for discussion on the Company’s equity plans.
Purchases of Equity Securities
During the fourth quarter of 2014, the Company purchased the following shares in order to satisfy the minimum tax withholding obligation for state and federal payroll taxes on employee stock awards:
| Period | Total Number of Shares Purchased | Average Price Paid Per Share | |||||
| October | 347,935 | $ | 9.42 | ||||
| November | 9,566 | 9.00 | |||||
| December | 9,165 | 9.26 | |||||
| Total | 366,666 | $ | 9.40 | ||||
Item 6. Selected Financial Data.
The following selected financial data should be read in conjunction with the accompanying consolidated financial statements and related notes thereto and “Item 7. Management’s Discussion and Analysis of Financial Condition and Results of Operations” appearing elsewhere in this report. The selected financial data (in thousands, except share and per share amounts) presented below was derived from our consolidated financial statements.
Balance sheet data (amounts in thousands):
| December 31, | ||||||||||||||||||||
| 2014 | 2013 | 2012 | 2011 | 2010 | ||||||||||||||||
| Total real estate investments, at cost | $ | 18,292,560 | $ | 7,459,142 | $ | 1,875,615 | $ | 209,326 | $ | — | ||||||||||
| Total assets | $ | 20,515,139 | $ | 7,809,083 | $ | 2,182,195 | $ | 221,578 | $ | 279 | ||||||||||
| Mortgage notes payable, net | $ | 3,759,935 | $ | 1,301,114 | $ | 265,118 | $ | 35,320 | $ | — | ||||||||||
| Credit facilities | $ | 3,184,000 | $ | 1,819,800 | $ | 124,604 | $ | 42,407 | $ | — | ||||||||||
| Corporate bonds, net | $ | 2,546,499 | $ | — | $ | — | $ | — | $ | — | ||||||||||
| Convertible debt, net | $ | 977,521 | $ | 972,490 | $ | — | $ | — | $ | — | ||||||||||
| Other debt | $ | 45,826 | $ | 104,804 | $ | — | $ | — | $ | — | ||||||||||
| Due to affiliates | $ | 559 | $ | 103,434 | $ | 1,522 | $ | — | $ | — | ||||||||||
| Total liabilities | $ | 11,132,809 | $ | 5,310,556 | $ | 513,435 | $ | 80,790 | $ | 279 | ||||||||||
| Total equity | $ | 9,382,330 | $ | 2,229,228 | $ | 1,668,760 | $ | 140,788 | $ | — | ||||||||||
46
Operating data, cash flow data and per share data (amounts in thousands except share and per share data):
| Year ended December 31, | Period from December 2, 2010 (Date of Inception) to December 31, 2010 | |||||||||||||||||||
| 2014 | 2013 | 2012 | 2011 | |||||||||||||||||
| Operating data: | ||||||||||||||||||||
| Total revenues | $ | 1,579,257 | $ | 329,323 | $ | 67,207 | $ | 3,970 | $ | — | ||||||||||
| Operating expenses: | ||||||||||||||||||||
| Cole Capital reallowed fees and commissions | 66,228 | — | — | — | — | |||||||||||||||
| Acquisition related | 38,831 | 76,113 | 45,070 | 3,898 | — | |||||||||||||||
| Merger and other non-routine transactions | 200,514 | 210,543 | 2,603 | — | — | |||||||||||||||
| Property operating | 137,741 | 23,616 | 3,522 | 220 | — | |||||||||||||||
| Management fees to affiliates | 13,888 | 17,462 | 212 | — | — | |||||||||||||||
| General and administrative | 174,741 | 123,172 | 5,458 | 749 | — | |||||||||||||||
| Depreciation and amortization | 916,003 | 210,976 | 40,957 | 2,097 | — | |||||||||||||||
| Impairments | 409,991 | 3,346 | — | — | ||||||||||||||||
| Total operating expenses | 1,957,937 | 665,228 | 97,822 | 6,964 | — | |||||||||||||||
| Operating loss | (378,680 | ) | (335,905 | ) | (30,615 | ) | (2,994 | ) | — | |||||||||||
| Other (expense) income: | ||||||||||||||||||||
| Interest expense | (452,648 | ) | (105,548 | ) | (11,856 | ) | (960 | ) | — | |||||||||||
| Extinguishment of debt, net | (21,869 | ) | — | — | — | — | ||||||||||||||
| Other income, net | 123,529 | 3,824 | 979 | 4 | — | |||||||||||||||
| Loss on derivative instruments, net | (10,570 | ) | (67,946 | ) | — | (2 | ) | — | ||||||||||||
| Loss on held for sale assets and disposition of properties, net | (277,031 | ) | — | — | — | — | ||||||||||||||
| Loss on sale of investments in affiliates | — | (411 | ) | — | — | — | ||||||||||||||
| Gain (loss) on sale of investments | 6,357 | (1,795 | ) | — | — | — | ||||||||||||||
| Total other expenses, net | (632,232 | ) | (171,876 | ) | (10,877 | ) | (958 | ) | — | |||||||||||
| Loss from continuing operations | (1,010,912 | ) | (507,781 | ) | (41,492 | ) | (3,952 | ) | — | |||||||||||
| Net loss from discontinued operations | — | (34 | ) | (745 | ) | (852 | ) | — | ||||||||||||
| Net loss | (1,010,912 | ) | (507,815 | ) | (42,237 | ) | (4,804 | ) | — | |||||||||||
| Net loss attributable to non-controlling interests | 33,727 | 16,316 | 585 | 105 | — | |||||||||||||||
| Net loss attributable to stockholders | $ | (977,185 | ) | $ | (491,499 | ) | $ | (41,652 | ) | $ | (4,699 | ) | $ | — | ||||||
| Cash flow data: | ||||||||||||||||||||
| Net cash flows provided (used in) by operating activities | $ | 502,887 | $ | 11,918 | $ | 9,440 | $ | (257 | ) | $ | — | |||||||||
| Net cash flows used in investing activities | $ | (2,554,456 | ) | $ | (4,541,718 | ) | $ | (1,701,422 | ) | $ | (89,981 | ) | $ | — | ||||||
| Net cash flows provided by financing activities | $ | 2,415,555 | $ | 4,289,950 | $ | 1,965,226 | $ | 109,569 | $ | — | ||||||||||
| Per share data: | ||||||||||||||||||||
| Basic and diluted net loss per share from continuing operations attributable to common stockholders | $ | (1.36 | ) | $ | (2.41 | ) | $ | (0.40 | ) | $ | (1.04 | ) | $ | — | ||||||
| Basic and diluted net loss per share attributable to common stockholders | $ | (1.36 | ) | $ | (2.41 | ) | $ | (0.41 | ) | $ | (1.26 | ) | $ | — | ||||||
| Annualized distributions declared per common share | $ | 1.00 | $ | 0.91 | $ | 0.89 | $ | 0.88 | $ | — | ||||||||||
Weighted-average number of common shares outstanding - basic (1) | 793,150,098 | 205,341,431 | 103,306,366 | 3,720,351 | — | |||||||||||||||
_______________________________________________
(1) For all periods presented, the effect of certain OP Units outstanding, LTIP Units, unvested restricted shares and convertible preferred shares were excluded from the weighted-average share calculation as the effect would be anti-dilutive.
Item 7. Management’s Discussion and Analysis of Financial Condition and Results of Operations.
The following discussion and analysis should be read in conjunction with the accompanying consolidated financial statements of the Company and the notes thereto.
47
Restatement and Recast
As discussed under “Item 1. Business – Recent Developments – Audit Committee Investigation and Restatement”, ARCP previously restated its consolidated financial statements and related financial information for the years ended December 31, 2013 and 2012 and the fiscal periods ended March 31, 2014 and 2013, June 30, 2014 and 2013 and September 30, 2013 and the OP restated and amended its consolidated financial statements and related financial information as of and for the years ended December 31, 2013 and 2012 and the quarterly periods ended June 30, 2014 and 2013. For a discussion of reconciliations of originally reported amounts to the corresponding restated amounts, see one of the following filings made with the SEC on March 2, 2015: Amendment No. 2 to our Annual Report on Form 10-K/A for the fiscal year ended December 31, 2013 or our Quarterly Reports on Form 10-Q/A for the fiscal periods ended March 31, 2014 and June 30, 2014. In addition, on January 3, 2014, we acquired ARCT IV, and together we were considered to be entities under common control because the entities’ advisors were wholly-owned subsidiaries of ARC. Accordingly, our consolidated financial statements have been recast in applying the carryover basis of accounting to include ARCT IV. See Note 1 – Organization to the consolidated financial statements in this report for further explanation. The following discussion and analysis of our financial condition and results of operations is based on the restated and recasted amounts.
Overview
We are a self-managed Maryland corporation incorporated on December 2, 2010 that qualified as a REIT for U.S. federal income tax purposes beginning in the taxable year ended December 31, 2011. On September 6, 2011, the Company completed the IPO. The Company’s common stock trades on NASDAQ under the symbol “ARCP.”
We operate through two business segments, Real Estate Investment and our private capital management business, Cole Capital, as further discussed in Note 5 – Segment Reporting. Through the REI segment, we acquire, own and operate single-tenant, freestanding, commercial real estate properties, primarily subject to long-term net leases with high credit quality tenants. We seek to acquire net lease assets by self-originating individual or small portfolio acquisitions, by executing sale-leaseback transactions, and in connection with build-to-suit or forward take-out opportunities, to the extent they are appropriate in terms of capitalization rate and scale. We have also advanced our investment objectives through strategic mergers and acquisitions. See Note 2 – Mergers and Significant Acquisitions and Sales to the consolidated financial statements in this report.
Cole Capital is contractually responsible for managing the affairs of the Managed REITs on a day-to-day basis, identifying and making acquisitions and investments on the Managed REITs’ behalf, and recommending to each of the Managed REIT’s respective board of directors an approach for providing investors with liquidity. Cole Capital receives compensation and reimbursement for services relating to these services.
Substantially all of our REI segment is conducted through the OP. We are the sole general partner and holder of 97.4% of the common equity interests in the OP as of December 31, 2014, with the remaining 2.6% common equity interests owned by certain unaffiliated investors. Under the LPA, after holding units of limited partner interests in the OP for a period of one year, unless otherwise consented to by us, holders of OP Units have the right to redeem the OP Units for the cash value of a corresponding number of shares of our common stock or, at our option, a corresponding number of shares of our common stock. The remaining rights of the holders of OP Units are limited, however, and do not include the ability to replace the general partner or to approve the sale, purchase or refinancing of the OP’s assets. Substantially all of the Cole Capital segment is conducted through CCA, an Arizona corporation and a wholly owned subsidiary of the OP. CCA is treated as a TRS under the Internal Revenue Code.
Prior to January 8, 2014, we retained the Former Manager to manage our affairs on a day-to-day basis with the exception of certain acquisition, accounting and portfolio management services performed by our employees. In August 2013, our board of directors determined that it is in the best interests of us and our stockholders to become self-managed and we completed our transition to self-management on January 8, 2014. See Note 20 – Related Party Transactions and Arrangements to the consolidated financial statements.
As of December 31, 2014, we owned 4,648 properties consisting of 103.1 million square feet, which were 99.3% leased with a weighted-average remaining lease term of 11.8 years. In constructing our portfolio, we are committed to diversification by industry, tenant and geography. As of December 31, 2014, rental revenues derived from investment grade tenants and tenants affiliated with investment grade entities as determined by a major rating agency approximated 46.9% (we have attributed the rating of each parent company to its wholly owned subsidiary for purposes of this disclosure). Our strategy encompasses receiving the majority of our revenue from investment grade and creditworthy tenants as we further acquire properties and enter into or assume lease arrangements.
48
Recent Mergers and Major Acquisitions and Sales
ARCT IV Merger
On July 1, 2013, we entered into an Agreement and Plan of Merger, as amended on October 6, 2013 and October 11, 2013, with ARCT IV, and certain subsidiaries of each company. The ARCT IV Merger Agreement provided for the merger of ARCT IV with and into a subsidiary of the OP, which was consummated on January 3, 2014.
Fortress Portfolio Acquisition
On July 24, 2013, ARC and another related entity, on behalf of the Company and certain other entities sponsored directly or indirectly by ARC, entered into a purchase and sale agreement with affiliates of funds managed by Fortress for the purchase of 196 properties owned by Fortress, for an aggregate contract purchase price of $972.5 million. Of the 196 properties, 120 properties were allocated to and assigned by us. On October 1, 2013, we closed on 41 of the 120 properties with a total purchase price of $200.3 million, exclusive of closing costs. During the year ended December 31, 2014, we closed the acquisition of the remaining 79 properties in the Fortress Portfolio for an aggregate contract purchase price of $400.9 million, exclusive of closing costs.
Inland Portfolio Acquisition
On August 8, 2013, ARC and another related entity, on behalf of the Company and certain other entities sponsored directly or indirectly by ARC, entered into a purchase and sale agreement with Inland for the purchase of the equity interests of 67 companies owned by Inland for an aggregate contract purchase price of $2.3 billion. Of the 67 companies, the equity interests of 10 companies holding in the aggregate 33 properties were acquired, in total, by us from Inland for a purchase price of $501.0 million. As of December 31, 2014, we had closed on 32 of the 33 properties for a total purchase price of $288.2 million, exclusive of closing costs. The Company will not close on the remaining one property.
Cole Merger
On October 22, 2013, ARCP and a wholly-owned subsidiary entered into an agreement and plan of merger with Cole , a publicly traded Maryland corporation. The Cole Merger Agreement provided for the merger of Cole with and into ARCP’s wholly owned subsidiary. The Cole Merger was consummated on February 7, 2014.
CCPT Merger
On March 17, 2014, ARCP and a wholly-owned subsidiary entered into an Agreement and Plan of Merger with CCPT, a Maryland corporation. The CCPT Merger Agreement provided for the merger of CCPT with and into the wholly owned subsidiary of ARCP. The CCPT Merger was consummated on May 19, 2014.
Red Lobster Portfolio Acquisition
On May 15, 2014, we entered into a master purchase agreement to acquire over 500 properties, substantially all of which are operating as Red Lobster® restaurants from a third party. The transaction was structured as a sale-leaseback in which we purchased and immediately leased the portfolio back to the third party pursuant to the terms of multiple master leases. The overall sale-leaseback transaction consisted of 522 Red Lobster® restaurants and 20 other branded restaurant properties for a purchase price of $1.7 billion. The Company closed the Red Lobster Portfolio acquisition in the third quarter of 2014.
Abandoned Spin-off of Multi-Tenant Shopping Center Portfolio; Sale to Blackstone/DDR Joint Venture
On March 13, 2014, we announced our intention to spin off our multi-tenant shopping center business into a publicly traded REIT, American Realty Capital Centers, Inc., which was expected to operate under the name “ARCenters” and to trade on the NASDAQ Global Market under the symbol “ARCM.” The OP was expected to retain 25% ownership of ARCM. The MT Spin-off was expected to be effectuated through a pro rata taxable special distribution of one share of ARCM common stock for every 10 shares of our common stock and every 10 OP Units held by third parties in the OP. On April 4, 2014, ARCM filed a Registration Statement on Form 10 to register ARCM’s common stock, par value $0.01 per share, pursuant to Section 12(b) of the Exchange Act so that, upon consummation of the MT Spin-off, shares of ARCM received by holders of our common stock, or OP Units, as applicable, could freely trade their newly received ARCM common stock. ARCM was expected to be externally managed by us. On May 21, 2014, we announced that we had reassessed our plans for the multi-tenant shopping center portfolio and entered into a letter of intent to sell such portfolio to Blackstone Real Estate Partners VII L.P. (“Blackstone”), expecting to finalize pertinent documentation related thereto within 30 days of such date. The 64 multi-tenant properties and seven single-tenant properties included in such sale were the same properties that would have been spun off into ARCM and, consequently, we abandoned our proposed spin-off at such time. On June 11, 2014, certain of our indirect subsidiaries entered into an agreement of purchase and sale with the Blackstone/DDR Joint Venture, an entity indirectly jointly owned by affiliates of Blackstone and DDR, pursuant to which the parties consummated the sale of our multi-tenant shopping center portfolio. On October 17, 2014, we completed the sale of the Multi-tenant Portfolio for $1.9 billion to the Blackstone/DDR Joint Venture. Additionally, we entered into a letter of
49
intent with an unrelated third party to sell five multi-tenant properties for $52.3 million bringing total expected sale proceeds to $2.0 billion. The transaction aimed to simplify our REI business model, allowing us to focus solely on its single-tenant, net lease investments of $1.3 billion of net proceeds, of which $1.2 billion was used to reduce our leverage by paying down our line of credit and $542.8 million of secured mortgage debt was either repaid or assumed by the Blackstone/DDR Joint Venture. We reported a net loss on sale of $262.0 million, which includes the write-off of $195.5 million of goodwill allocated to the cost basis of the Multi-tenant Portfolio.
See Note 4 – Acquisitions of CapLease, Cole and CCPT and Note 22 – Property Dispositions to our consolidated financial statements in this report for further discussion on the mergers, acquisitions and dispositions.
Critical Accounting Policies and Significant Accounting Estimates
Our accounting policies have been established to conform to GAAP. The preparation of financial statements in conformity with GAAP requires us to use judgment in the application of accounting policies, including making estimates and assumptions. These judgments affect the reported amounts of assets and liabilities and disclosure of contingent assets and liabilities at the dates of the financial statements and the reported amounts of revenue and expenses during the reporting periods. If our judgment or interpretation of the facts and circumstances relating to the various transactions had been different, it is possible that different accounting policies would have been applied, thus resulting in a different presentation of the financial statements. Additionally, other companies may utilize different estimates that may impact comparability of our results of operations to those of companies in similar businesses.
Set forth below is a summary of the significant accounting estimates and critical accounting policies that management believes are important to the preparation of our financial statements. Certain of our accounting estimates are particularly important for an understanding of our financial position and results of operations and require the application of significant judgment by our management. As a result, these estimates are subject to a degree of uncertainty. These significant accounting estimates include:
Revenue Recognition
Upon the acquisition of real estate, certain properties will have leases where minimum rent payments change during the term of the lease. The Company will record rental revenue for the full term of each lease on a straight-line basis. When the Company acquires a property, the term of existing leases is considered to commence as of the acquisition date for the purposes of this calculation. Cost recoveries from tenants are included in tenant reimbursement income in the period the related costs are incurred, as applicable.
The Company’s revenues, which are derived primarily from rental income, include rents that each tenant pays in accordance with the terms of each lease reported on a straight-line basis over the initial term of the lease. Since many of the leases provide for rental increases at specified intervals, straight-line basis accounting requires the Company to record a receivable, and include in revenues, unbilled rent receivables that the Company will only receive if the tenant makes all rent payments required through the expiration of the initial term of the lease. Straight-line rent receivables are included in prepaid expenses and other assets on the consolidated balance sheets. See Note 10 – Deferred Costs and Other Assets, Net to the consolidated financial statements contained in this report. The Company defers the revenue related to lease payments received from tenants in advance of their due dates. As of December 31, 2014 and 2013, the Company had $57.8 million and $20.4 million, respectively, of deferred rental income, which is included in deferred rent and other liabilities on the consolidated balance sheets.
The Company continually reviews receivables related to rent and unbilled rent receivables and determines collectability by taking into consideration the tenant’s payment history, the financial condition of the tenant, business conditions in the industry in which the tenant operates and economic conditions in the area in which the property is located. In the event that the collectability of a receivable is in doubt, the Company will record an increase in the allowance for uncollectible accounts or record a direct write-off of the receivable in the consolidated statements of operations and comprehensive loss. As of December 31, 2014 and December 31, 2013, the Company recorded an allowance for uncollectible accounts of $2.5 million and $0.2 million, respectively.
Real Estate Investments
The Company records acquired real estate at cost and makes assessments as to the useful lives of depreciable assets. The Company considers the period of future benefit of the asset to determine the appropriate useful lives. Depreciation is computed using a straight-line method over the estimated useful life of 40 years for buildings, five to 15 years for building fixtures and improvements and the remaining lease term for acquired intangible lease assets.
Allocation of Purchase Price of Business Combinations including Acquired Properties
In accordance with the guidance for business combinations, the Company determines whether a transaction or other event is a business combination. If the transaction is determined to be a business combination, the Company determines if the transaction is considered to be between entities under common control. The acquisition of an entity under common control is accounted for on the carryover basis of accounting whereby the assets and liabilities of the acquired companies are recorded upon the merger
50
on the same basis as they were carried by the acquired companies on the merger date. All other business combinations are accounted for by applying the acquisition method of accounting. Under the acquisition method, the Company recognizes the identifiable assets acquired, the liabilities assumed and any non-controlling interest in the acquired entity at fair value. In addition, the Company evaluates the existence of goodwill or a gain from a bargain purchase. The Company will immediately expense acquisition-related costs and fees associated with business combinations and asset acquisitions.
The Company allocates the purchase price of acquired properties and businesses accounted for under the acquisition method of accounting to tangible and identifiable intangible assets and liabilities acquired based on their respective fair values. Tangible assets include land, buildings, equipment and tenant improvements on an as-if vacant basis. The Company utilizes various estimates, processes and information to determine the as-if vacant property value. Estimates of value are made using customary methods, including data from appraisals, comparable sales, discounted cash flow analysis and other methods. Identifiable intangible assets and liabilities include amounts allocated to acquired leases for above-market and below-market lease rates and the value of in-place leases.
Amounts allocated to land, buildings, equipment and fixtures are based on cost segregation studies performed by independent third parties or on the Company’s analysis of comparable properties in its portfolio.
The aggregate value of intangible assets related to in-place leases is primarily the difference between the property valued with existing in-place leases adjusted to market rental rates and the property valued as if vacant. Factors considered by the Company in its analysis of the in-place lease intangibles include an estimate of carrying costs during the expected lease-up period for each property, taking into account current market conditions and costs to execute similar leases. In estimating carrying costs, the Company includes real estate taxes, insurance and other operating expenses and estimates of lost rentals at market rates during the expected lease-up period, which typically ranges from six to 18 months. The Company also estimates costs to execute similar leases including leasing commissions, legal and other related expenses.
Above-market and below-market in-place lease values for owned properties are recorded based on the present value (using an interest rate which reflects the risks associated with the leases acquired) of the difference between the contractual amounts to be paid pursuant to the in-place leases and management’s estimate of fair market lease rates for the corresponding in-place leases, measured over a period equal to the remaining non-cancelable term of the lease, including any bargain renewal periods. Above-market leases are amortized as a reduction to rental income over the remaining terms of the respective leases. Below-market leases are amortized as an increase to rental income over the remaining terms of the respective leases, including any bargain renewal periods.
The fair value of investments and debt are valued using techniques consistent with those disclosed in Note 11 – Fair Value of Financial Instruments to the consolidated financial statements contained in this report, depending on the nature of the investment or debt. The fair value of all other assumed assets and liabilities based on the best information available.
The value of in-place leases is amortized to expense over the initial term of the respective leases, which range primarily from two to 20 years. If a tenant terminates its lease and the unamortized portion of the in-place lease value is charged to expense.
In making estimates of fair values for purposes of allocating purchase price, the Company utilizes a number of sources, including independent appraisals that may be obtained in connection with the acquisition or financing of the respective property and other market data. The Company also considers information obtained about each property as a result of its pre-acquisition due diligence, as well as subsequent marketing and leasing activities, in estimating the fair value of the tangible and intangible assets acquired and intangible liabilities assumed.
Goodwill
In the case of a business combination, after identifying all tangible and intangible assets and liabilities, the excess consideration paid over the fair value of the assets and liabilities acquired and assumed, respectively, represents goodwill. Goodwill that arose as a result of the Company’s mergers and acquisitions was recorded in the Company’s consolidated financial statements.
In the event the Company disposes of a property that constitutes a business under U.S. GAAP from a reporting unit with goodwill, the Company will allocate a portion of the reporting unit’s goodwill to that business in determining the gain or loss on the disposal of the business. The amount of goodwill allocated to the business will be based on the relative fair value of the business to the fair value of the reporting unit. The REI segment and Cole Capital each comprise one reporting unit.
Impairments
Real Estate Assets
The Company continually monitors events and changes in circumstances that could indicate that the carrying amounts of its real estate assets may not be recoverable. Impairment indicators that the Company considers include, but are not limited to, bankruptcy or other credit concerns of a property’s major tenant, such as a history of late payments, rental concessions and other
51
factors, a significant decrease in a property’s revenues due to lease terminations, vacancies, co-tenancy clauses, reduced lease rates or other circumstances. When indicators of potential impairment are present, the Company assesses the recoverability of the assets by determining whether the carrying amount of the assets will be recovered through the undiscounted future cash flows expected from the use of the assets and their eventual disposition. In the event that such expected undiscounted future cash flows do not exceed the carrying amount, the Company will adjust the real estate assets to their respective fair values and recognize an impairment loss. Generally, fair value is determined using a discounted cash flow analysis and recent comparable sales transactions. When developing estimates of expected future cash flows, the Company makes certain assumptions regarding future market rental income amounts subsequent to the expiration of current lease agreements, property operating expenses, terminal capitalization and discount rates, the expected number of months it takes to re-lease the property, required tenant improvements and the number of years the property will be held for investment. The use of alternative assumptions in estimating expected future cash flows could result in a different determination of the property’s expected future cash flows and a different conclusion regarding the existence of an impairment, the extent of such loss, if any, as well as the fair value of the real estate assets.
The Company recorded $100.5 million of impairment charges on real estate investments from continuing operations during the year ended December 31, 2014, of which impairment charges totaling $96.7 million arose during the three months ended December 31, 2014. In determining the fourth quarter impairment charges, the Company evaluated each of the respective properties’ highest and best use and concluded that such use would be to sell certain office properties that were deemed to be impaired, as if such properties were vacant at the time of the expected sale and did not contain a tenant under a long term lease. During the nine months ended September 30, 2014, the Company’s intention was to re-lease the respective properties at the end of each such tenant’s existing lease term, which were during 2015 through 2016. However, the respective tenants either provided notice that they did not intend to renew their lease or had already vacated the property and were continuing to pay the lease until expiration. In evaluating lease-up scenarios, the Company assessed the necessary capital expenditures that would be incurred to ready the respective properties for lease and determined that such capital expenditures would not be recoverable under the expected terms of a new lease in the current and future rental markets for such properties. In addition, the Company utilized the sale price received for one of the properties that was sold in 2015 in the determination of fair value, noting that the offers received in such sale were consistent with current market transactions evaluated as comparable transactions. The price received at sale was an indication that the carrying amount was greater than the properties’ estimated fair values.
The Company recorded $3.3 million in impairment charges on real estate investments from continuing operations during the year ended December 31, 2013, but did not record any impairment on real estate investments from discontinued operations during that year. The Company did not record any impairment on real estate investments from continuing operations during the year ended December 31, 2012, but did record $0.6 million of impairment charges from discontinued operations during that year.
Goodwill
The Company will evaluate goodwill for impairment annually or more frequently when an event occurs or circumstances change that indicate the carrying value, by reporting unit, may not be recoverable. The Company’s annual testing date is during the fourth quarter. The Company tests goodwill for impairment by first comparing the carrying value of net assets to the fair value of each reporting unit. If the fair value is determined to be less than the carrying value or if qualitative factors indicate that it is more likely than not that goodwill is impaired, a second step is performed to compute the amount of impairment as the difference between the estimated fair value of goodwill and the carrying value. The Company estimates the fair value of the reporting units using discounted cash flows and relevant competitor multiples. The evaluation of goodwill for potential impairment requires the Company’s management to exercise significant judgment and to make certain assumptions. The use of different judgments and assumptions could result in different conclusions.
The Company tested the goodwill allocated to the Cole Capital segment for impairment during the three months ended December 31, 2014 using an income approach. The assumptions utilized in the evaluation of the impairment of goodwill under the income approach include revenue growth rates, cash flows, earnings before income taxes, tax rates, capital expenditures, the weighted average cost of capital (“WACC”) and expected long-term growth rates (residual growth rate). The assumptions which have the most significant effect on our valuations derived using a discounted cash flows methodology are: (1) revenue growth rate, (2) cash flow assumptions and (3) the discount rate. The cash flows utilized in the income approach are based on our most recent budgets, forecasts, and business plans as well as various growth rate assumptions for years beyond the current business plan period. Long-term growth rates represent the expected long-term growth rate for the reporting unit, considering the industry in which we operate and the global economy. Discount rate assumptions are based on an assessment of the risk inherent in the future revenue streams and cash flows and our WACC. The risk adjusted discount rate used represents the estimated WACC for our reporting unit. The carrying value of the Cole Capital reporting unit exceeded the estimated fair value at December 31, 2014 and therefore the second step of the goodwill impairment analysis was performed to compute the amount of the impairment. As a result, the Company recorded an impairment charge of $223.1 million during the three months ended December 31, 2014.
52
The Company also tested the goodwill allocated to the REI segment for impairment during the three months ended December 31, 2014 using a market approach. The assumptions utilized in the market approach include the selection of comparable companies, which are subject to change based on the economic characteristics of our reporting unit. Adjusted funds from operations and funds from operations, each non-GAAP supplemental financial performance measures, multiples for market comparable companies for the current and future fiscal periods were used to estimate the fair value of the reporting unit by applying those multiples to the projected financial information prepared by management. The carrying value of the REI reporting unit was $19.3 billion at December 31, 2014. The estimated fair value of the reporting unit exceeded its carrying value by 5%. As such, no goodwill impairment was recorded during the three months ended December 31, 2014 on the REI reporting segment. This reporting unit remains at risk for future impairment if the projected operating results are not met or other inputs into the fair value measurement change. We continue to monitor actual results versus forecasted results and external factors that may impact the fair value of the reporting unit. Factors we are monitoring that may impact the fair value of the reporting unit include, but are not limited to, market comparable company multiples, interest rates, and global economic conditions.
Intangible Assets
The Company evaluates intangible assets, which primarily consists of dealer manager and advisory contracts with the Managed REITs, for impairment when an event occurs or circumstances change that indicate the carrying value may not be recoverable. The Company will test intangible assets for impairment by first comparing the carrying value of the asset group to the undiscounted future cash flows expected from the use of the assets and their eventual disposition. In the event that such expected undiscounted future cash flows do not exceed the carrying amount, the Company will adjust the intangible assets to their respective fair values and recognize an impairment loss.. The Company will estimate the fair value the intangible assets using a discounted cash flow model specific to the Managed REITs that were included in the initial value of the intangible assets as of the Cole Acquisition Date. The evaluation of goodwill for potential impairment requires the Company’s management to exercise significant judgment and to make certain assumptions. The use of different judgments and assumptions could result in different conclusions.
During the three months ended December 31, 2014, as a result of the preliminary findings of the Audit Committee Investigation, which led to the withdrawal of reliance on certain of the Company’s previously-issued financial statements and a delay in issuing its financial statements for the third quarter of 2014 that also led to a delay in filing the annual report on Form 10-K for the year ended 2014, the Company experienced adverse changes to its business, some of which included suspension and/or termination of selling agreements relating to its Cole Capital segment and a significant drop in stock price. The Company determined these events warranted an assessment of the recoverability of the intangible asset value associated with the dealer manager and advisory contracts for its Cole Capital segment. Based on the analysis, the Company recorded $86.4 million of impairment charges on the intangible assets.
Investment in Unconsolidated Entities
The Company is required to determine whether an event or change in circumstances has occurred that may have a significant adverse effect on the fair value of any of its investment in the unconsolidated entities. If an event or change in circumstance has occurred, the Company is required to evaluate its investment in the unconsolidated entity for potential impairment and determine if the carrying amount of its investment exceeds its fair value. An impairment charge is recorded when an impairment is deemed to be other-than-temporary. To determine whether an impairment is other-than-temporary, the Company considers whether it has the ability and intent to hold the investment until the carrying amount is fully recovered. The evaluation of an investment in an unconsolidated entity for potential impairment requires the Company’s management to exercise significant judgment and to make certain assumptions. The use of different judgments and assumptions could result in different conclusions. No impairments of unconsolidated entities were identified during the year ended December 31, 2014.
Leasehold Improvements and Property and Equipment
Leasehold improvements and property and equipment are reviewed for impairment when events or changes in circumstances indicate that the carrying amount of such assets may not be recoverable. If this review indicates that the carrying amount of the asset is not recoverable, the Company records an impairment loss, measured at fair value by estimated discounted cash flows or market appraisals. The evaluation of an investment in a property for potential impairment requires the Company’s management to exercise significant judgment and to make certain assumptions. The use of different judgments and assumptions could result in different conclusions. The Company identified properties during the years ended December 31, 2014 and 2013 with impairment indicators for which the undiscounted future cash flows expected as a result of the use and eventual disposition of the real estate and related assets was less than the carrying amount of each respective properties, as discussed in Note 11 – Fair Value of Financial Instruments.
53
Income Taxes
ARCP currently qualifies and has elected to be taxed as a REIT for federal income tax purposes under Sections 856 through 860 of the Internal Revenue Code. As a REIT, except as discussed below, ARCP generally is not subject to federal income tax on taxable income that it distributes to its stockholders so long as it distributes at least 90% of its annual taxable income (computed without regard to the dividends paid deduction and excluding net capital gains). REITs are subject to a number of other organizational and operational requirements. Even if ARCP maintains its qualification for taxation as a REIT, it may be subject to certain state and local taxes on its income and property, federal income taxes on certain income and excise taxes on its undistributed income.
The Operating Partnership is classified as a partnership for federal income tax purposes. As a partnership, the Operating Partnership is not a taxable entity for federal income tax purposes. Instead, each partner in the Operating Partnership is required to take into account its allocable share of the Operating Partnership’s income, gains, losses, deductions, and credits for each taxable year. However, the Operating Partnership may be subject to certain state and local taxes on its income and property.
As of December 31, 2014, the Operating Partnership and ARCP had no material uncertain income tax positions. The tax years subsequent to and including the fiscal year ended December 31, 2010 remain open to examination by the major taxing jurisdictions to which the Operating Partnership, ARCP, ARCT III and ARCT IV are subject.
Under the LPA, the Operating Partnership is to conduct business in such a manner as to permit ARCP at all times to qualify as a REIT.
The Company conducts substantially all of its Cole Capital business operations through a TRS. A TRS is a subsidiary of a REIT that is subject to corporate federal, state and local income taxes, as applicable. The Company’s use of a TRS enables it to engage in certain business activities while complying with the REIT qualification requirements and to retain any income generated by these businesses for reinvestment without the requirement to distribute those earnings. The Company conducts all of its business in the United States and Canada, and as a result, it files income tax returns in the U.S. federal jurisdiction, Canadian federal jurisdiction and various state and local jurisdictions. Certain of the Company’s inter-company transactions that have been eliminated in consolidation for financial accounting purposes are also subject to taxation.
The Company provides for income taxes in accordance with current authoritative accounting and tax guidance. The tax expense or benefit related to significant, unusual or extraordinary items is recognized in the quarter in which those items occur. In addition, the effect of changes in enacted tax laws, rates or tax status is recognized in the quarter in which the change occurs. The accounting estimates used to compute the provision for income taxes may change as new events occur, additional information is obtained or the tax environment changes.
In conjunction with the acquisition of the Red Lobster Portfolio, the Company entered into a reverse section 1031 like-kind exchange agreement with a third party intermediary. The exchange agreement is for a maximum of 180 days and allows the Company, for tax purposes, to defer gains on the sale of other properties sold within this period. Until the earlier of termination of the exchange agreements or 180 days after the first acquisition date, the third party intermediary is the legal owner of each property, although the Company controls the activities that most significantly impact each property and retains all of the economic benefits and risks associated with each property. Each property is held by the third party intermediary in a variable interest entity for which the Company is the primary beneficiary. Accordingly, the Company consolidates these properties and their operations even during the period they are held by the third party intermediary. As of December 31, 2014, none of the Red Lobster properties were held by the third party intermediary, as the reverse section 1031 like-kind exchange agreement was completed on October 17, 2014.
Recently Issued Accounting Pronouncements
Recently issued accounting pronouncements are described in Note 3 – Summary of Significant Accounting Policies to our consolidated financial statements in this report.
54
Results of Operations
As a result of the Cole Merger, we evaluate our operating results by our two business segments, REI and Cole Capital.
REI Segment
Our results of operations are influenced by the timing of acquisitions and the operating performance of our real estate investments. The following table shows the property statistics of our real estate assets, excluding properties owned through consolidated joint ventures, as of December 31, 2014, 2013 and 2012:
| December 31, | |||||
| 2014 | 2013 (3) | 2012 (3) | |||
Number of commercial properties (1) | 4,648 | 2,559 | 702 | ||
Approximate rentable square feet (in millions) (2) | 103.1 | 43.8 | 15.8 | ||
| Percentage of rentable square feet leased | 99.3% | 99.0% | 100.0% | ||
| (1) | Excludes properties owned through the Unconsolidated Joint Ventures. |
| (2) | Includes square feet of the buildings on land that are subject to ground leases. |
| (3) | 2013 and 2012 balances reflect properties after giving effect to the properties owned by ARCT IV, which we acquired on January 3, 2014. |
Comparison of the year ended December 31, 2014 to the year ended December 31, 2013
Total Real Estate Investment Revenue
REI revenue increased $1.0 billion to $1.4 billion for the year ended December 31, 2014, compared to $0.3 billion for the year ended December 31, 2013. Our REI revenue consisted primarily of rental income from net leased commercial properties, which accounted for 92% and 94% of total REI revenue during the year ended December 31, 2014 and 2013, respectively.
Rental Income
Rental income increased $1.0 billion to $1.3 billion for the year ended December 31, 2014, compared to $0.3 billion for the year ended December 31, 2013. The increase was primarily due to our net acquisition of 2,160 properties (which excludes properties that are accounted for as direct financing leases) primarily through various mergers and portfolio acquisitions subsequent to December 31, 2013, as well as significant 2013 acquisitions occurring late in the year.
Direct Financing Lease Income
Direct financing lease income of $3.6 million was recognized for the year ended December 31, 2014, an increase of $1.4 million from $2.2 million for the year ended December 31, 2013. Direct financing lease income was primarily driven by our net acquisition of 40 properties comprised of $56.1 million of net investments subject to direct financing leases acquired at the end of or subsequent to December 31, 2013.
Operating Expense Reimbursements
Operating expense reimbursements increased by $84.0 million to $100.5 million for the year ended December 31, 2014 compared to $16.6 million for the year ended December 31, 2013. Operating expense reimbursements represent reimbursements for taxes, property maintenance and other charges contractually due from the tenant per their respective leases. Operating expense reimbursements increases were driven by our net acquisition of 2,160 properties subsequent to December 31, 2013, as well as significant 2013 acquisitions occurring late in the year.
We also review our stabilized operating results from properties that we owned for the entirety of both the current and prior year reporting periods, referred to as “same store.” Cash same store rents on the 698 properties held for the full period in each of the year ended December 31, 2014 and 2013 increased $0.9 million, or 0.6%, to $146.9 million compared to $146.0 million for the year ended December 31, 2013, respectively. Same store annualized average rental income per square foot was $18.61 at December 31, 2014 compared to $18.50 at December 31, 2013. Both cash and annualized average same store rents increases are due to contractual rent increases as well as lease renewals with increased contractual rents.
Acquisition Related Expenses
Acquisition related expenses decreased $40.6 million to $35.5 million for the year ended December 31, 2014, compared to $76.1 million for the year ended December 31, 2013. Acquisition costs primarily consisted of legal costs, deed transfer costs and other costs related to granular and portfolio real estate purchase transactions as well as contingent consideration expenses. Acquisition costs for the year ended December 31, 2014 related to the Red Lobster Portfolio, Inland Portfolio and Fortress Portfolio
55
acquisitions, as well as granular acquisitions. In addition to the type of acquisition costs above, during the year ended December 31, 2013, ARCPT IV paid acquisition fees to affiliates of the Former Manager for acquisitions by ARCT IV. In conjunction with the ARCT IV Merger, it was agreed that the affiliate of the Former Manager would no longer charge acquisition fees.
Merger and Other Non-routine Transaction Related Expenses
Costs related to various mergers, as well as other non-routine transaction costs decreased $12.0 million to $198.5 million for the year ended December 31, 2014, compared to $210.5 million for the year ended December 31, 2013. Upon the consummation of the ARCT IV Merger, an affiliate of the Former Manager received a subordinated incentive distribution upon the attainment of certain performance hurdles. For the year ended December 31, 2014, $78.2 million was recorded for this fee. We issued 6.7 million OP Units to the affiliate of the Former Manager as compensation for this fee. In addition, merger and other non-routine transaction related expenses consisted of expenses related internalization as well as professional fees, printing fees, proxy services and other costs associated with entering into and completing the Cole Merger and CCPT Merger, as well as expenses related to becoming self-managed. The related mergers during December 31, 2013 were with ARCT III and ARCT IV. Further, during the year ended December 31, 2014, we incurred $17.7 million of expenses related to the Audit Committee Investigation and related litigation.
Merger and other non-routine transaction related expenses included $137.8 million and $156.1 million paid to the Former Manager and its affiliates in the years ended December 31, 2014 and 2013, respectively. See “Related Party Transactions and Agreements” below. The Audit Committee Investigation identified certain payments made by us to the Former Manager and its affiliates that were not sufficiently documented or that otherwise warrant scrutiny. The Company is considering whether it has a right to seek recovery for any such payments and, if so, its alternatives for seeking recovery. No asset was recognized in the financial statements related to any potential recovery.
Property Operating Expenses
Property operating expenses increased $114.1 million to $137.7 million for the year ended December 31, 2014, compared to $23.6 million for the year ended December 31, 2013. The increase was primarily due to increased property taxes, utilities, repairs and maintenance and insurance expenses relating to the acquisition of 2,160 rental income-producing properties subsequent to December 31, 2013.
Management Fees to Affiliates
Management fees to affiliates decreased $3.6 million from $17.5 million to $13.9 million from December 31, 2013 to December 31, 2014. The decrease was primarily a result of the Company’s termination of the amended and restated management agreement with the Former Manager, which eliminated base asset management fees during year ended December 31, 2014 as discussed within Note 20 – Related Party Transactions and Arrangements to the consolidated financial statements contained in this report. Also, comparatively, during the year ended December 31, 2013, the Company paid property management fees of $0.8 million in relation to the ARCT III merger to an affiliate of ARC, which were terminated during 2014.
General and Administrative Expenses
General and administrative expenses decreased $39.7 million to $83.6 million for the year ended December 31, 2014, compared to $123.2 million for the year ended December 31, 2013. The decrease in general and administrative expense is primarily related to a decrease in equity-based compensation of $76.5 million, specifically because of the establishment of the New OPP, which replaced the OPP, as discussed within Note 19 – Equity-based Compensation to the consolidated financial statements contained in this report. This decrease was partially offset by an increase of $36.9 million related to other general and administrative expenses which include employee insurance, training, travel and hardware and software maintenance.
Depreciation and Amortization Expenses
Depreciation and amortization expenses increased $633.7 million to $844.7 million for the year ended December 31, 2014, compared to $211.0 million for the year ended December 31, 2013. The increase in depreciation and amortization was driven by our net acquisition of 2,160 properties subsequent to December 31, 2013, as well as significant 2013 acquisitions occurring late in the year.
Impairment of Real Estate
During the year ended December 31, 2014, we recorded an impairment on real estate of $100.5 million related to 16 properties. During the year ended December 31, 2013, we recorded an impairment on real estate of $3.3 million related to two properties. The increase of $97.2 million relates to several properties that were deemed to be impaired whose carrying amounts were reduced to their estimated fair values. Refer to Note 3 – Summary of Significant Accounting Policies and Note 11 – Fair Value of Financial Instruments to our consolidated financial statements in this report for further discussion.
56
Interest Expense, Net
Interest expense increased $347.1 million to $452.6 million for the year ended December 31, 2014, compared to $105.5 million during the year ended December 31, 2013. The increase in interest expense was due to an increase in the debt balance to $10.5 billion for the year ended December 31, 2014 compared to $4.3 billion for the year ended December 31, 2013. The increase in debt was primarily due to the assumption of mortgage notes in connection with the various mergers and portfolio acquisitions, the issuance of the corporate bonds and the increased draws on the credit facilities. Additionally, we recorded $32.6 million in interest expense as amortization of deferred financing costs associated with the termination of the Barclays Facility. The average annualized interest rate on all debt, including the effect of derivative instruments used to hedge the effects of interest rate volatility but excluding amortization of deferred financing costs and non-usage fees, for the year ended December 31, 2014 and 2013 was 3.74% and 4.08%, respectively.
Extinguishment of Debt, Net
Loss on extinguishment of debt for the year ended December 31, 2014 was $21.9 million, which is comprised of $35.9 million of prepayment fees related to to the defeasance of mortgage notes payable and other corporate debt, partially offset by the write-off of $14.0 million of net premiums and discounts associated with the debt. There was no loss on extinguishment of debt recorded for the year ended December 31, 2013.
Other Income, Net
Other income increased $76.8 million to $80.6 million for the year ended December 31, 2014, compared to income of $3.8 million for the year ended December 31, 2013. During the year ended December 31, 2014, we recorded $66.4 million in other non-rental related income relating primarily to the $60.0 million the Company received as part of the settlement agreement with RCAP as a result of the unconsummated sale of Cole Capital as discussed in detail within Note 20 – Related Party Transactions and Arrangements to the consolidated financial statements contained in this report. In addition, during the year ended December 31, 2014, the Company also recorded $15.9 million in interest income related to loans held for investment and CMBS securities, most of which were acquired in the Cole Merger, compared with $1.6 million during the year ended December 31, 2013, an increase of $14.3 million.
Loss on Derivative Instruments, Net
Loss on derivative instruments for the year ended December 31, 2014 was $10.6 million, which primarily related to a loss of $18.8 million recorded on the Series D embedded derivative, which was settled in conjunction with the redemption of the Series D Preferred Stock and discussed within Note 18 – Preferred and Common Stock and OP Units to the consolidated financial statements contained in this report. We recorded a loss on derivative instruments of $67.9 million during the year ended December 31, 2013 that resulted from marking our derivate instruments to fair value.
Loss on Held for Sale Assets and Disposition of Properties, Net
Loss on held for sale assets and disposition of properties for the year ended December 31, 2014 was $277.0 million, which largely consisted of loss on sale of real estate of $262.0 million, in connection with the Multi-tenant Portfolio, as discussed within Note 22 – Property Dispositions to the consolidated financial statements contained in this report. In addition, the aggregate loss was also comprised of losses incurred in connection with the disposition of 45 single-tenant properties and 65 multi-tenant properties as well as two properties which were classified as held for sale. As of December 31, 2013, the Company classified one property as held for sale, which has been presented as discontinued operations on the Company’s consolidated statements of operations. There were no properties disposed of during the year ended December 31, 2013.
Gain (Loss) on Sale of Investments
Gain on sale of investments increased $8.2 million to a gain of $6.4 million during the year ended December 31, 2014, compared to a loss of $1.8 million for the year ended December 31, 2013. We recorded a gain of $6.2 million in connection with the sale of the 15 CMBS the Company had acquired in the Cole merger during the year ended December 31, 2014. During the year ended December 31, 2013, we recorded a loss of $1.8 million in connection with a sale of investments in redeemable preferred stock, common stock and senior notes.
Comparison of the Year Ended December 31, 2013 to the Year Ended December 31, 2012
Rental Income
Rental income increased $245.2 million to $310.5 million for the year ended December 31, 2013 compared to $65.3 million for the year ended December 31, 2012. Rental income was driven by our acquisition of 1,807 properties, which excludes 50 properties that are accounted for as direct financing leases, acquired during the year ended December 31, 2013 for an aggregate
57
purchase price of $5.5 billion. The annualized rental income per square foot of the properties at December 31, 2013 was $12.66 with a weighted-average remaining lease term of 9.4 years, compared to $9.59 per square foot at December 31, 2012.
Our properties are generally leased from two to twenty years and 60% are leased to investment grade tenants and affiliates of investment grade tenants, as determined by major credit rating agencies. Cash same store rents on the 129 properties held for the full period in each of the years ended December 31, 2013 and 2012 increased $0.2 million, or 1.3%, to $16.2 million compared to $16.0 million for the years ended December 31, 2013 and 2012 , respectively. Same store annualized average rental income per square foot was $11.37 at December 31, 2013 compared to $11.23 at December 31, 2012.
Direct Financing Lease Income
Direct financing lease income of $2.2 million was recognized for the year ended December 31, 2013. Direct financing lease income was primarily driven by our 2013 acquisition of 50 properties comprised of $66.1 million million of net investments subject to direct financing leases during the year ended December 31, 2013.
Operating Expense Reimbursements
Operating expense reimbursements increased by $14.7 million to $16.6 million for the year ended December 31, 2013 compared to $1.9 million for the year ended December 31, 2012. Operating expense reimbursements represent reimbursements for taxes, property maintenance and other charges contractually due from tenants per their respective leases. Operating expense reimbursements were driven by our acquisition of 1,807 properties since December 31, 2012.
Acquisition Related Expenses
Acquisition related costs increased by $31.0 million to $76.1 million for the year ended December 31, 2013 compared to $45.1 million for the year ended December 31, 2012. Acquisition expenses mainly consisted of acquisition fees, legal costs, deed transfer costs and other costs related to real estate purchase transactions. The increase is driven by our acquisition of 1,807 properties during the year ended December 31, 2013 compared to 573 during the year ended December 31, 2012. This increase was offset by the agreement with our Former Manager in conjunction with the ARCT III Merger, where it was agreed that our Former Manager would no longer charge acquisition fees. Subsequent to December 31, 2013, the management agreement was terminated as a result of our transition to self-management.
Merger and Other Non-routine Transaction Related Expenses
Expenses related to various mergers, as well as other non-routine transaction expenses, increased by $207.9 million to $210.5 million for the year ended December 31, 2013 compared to $2.6 million for the year ended December 31, 2012. Upon the consummation of the ARCT III Merger, an affiliate of ARCT III received a subordinated incentive distribution upon the attainment of certain performance hurdles. For the year ended December 31, 2013, $98.4 million was recorded for this fee, which was settled in 7.3 million OP Units issued to the affiliate. During the year ended December 31, 2013, the Company incurred $62.3 million of strategic advisory services, $16.0 million of legal fees and $8.9 million of transfer taxes relating to the various mergers and acquisitions. In addition, merger and other non-routine transaction related expenses for the year ended December 31, 2013 included $24.9 million in post-transaction support fees, printing fees, proxy services and other costs associated with entering into and completing the various mergers and acquisitions. During the year ended December 31, 2012, the $2.6 million of merger and other non-routine transaction related expenses consisted of legal fees related to the merger with ARCT III announced in December 2012.
Merger and other non-routine transaction related expenses included $156.1 million paid to the Former Manager and its affiliates in the year ended December 31, 2013. No amounts were paid to the Former Manager and its affiliates in the year ended December 31, 2012. The Audit Committee Investigation identified certain payments made by us to the Former Manager and its affiliates that were not sufficiently documented or that otherwise warrant scrutiny. The Company is considering whether it has a right to seek recovery for any such payments and, if so, its alternatives for seeking recovery. No asset was recognized in the financial statements related to any potential recovery.
Property Operating Expenses
Property expenses increased by $20.1 million to $23.6 million for the year ended December 31, 2013 compared to $3.5 million for the year ended December 31, 2012. These costs relate to expenses associated with maintaining certain properties, including real estate taxes, ground lease rent, insurance and repairs and maintenance expenses. The increase in property expenses are primarily due to our acquisition of properties with modified gross leases subsequent to December 31, 2012, and an increased number of properties for which we pay expenses, which are reimbursed by the tenant.
58
Management Fees to Affiliates
Prior to the consummation of the ARCT III Merger, we paid the Former Manager an annual base management fee equal to 0.50% per annum of the average unadjusted book value of our real estate assets, calculated and payable monthly in advance, provided that the full amount of the distributions we have declared for the six immediately preceding months is equal to or greater than certain net income thresholds related to our operations. Subsequent to the consummation of the ARCT III Merger, we paid the Former Manager an annual base management fee equal to 0.50% per annum for up to $3.0 billion of unadjusted book value of assets and 0.40% of unadjusted book value of assets greater than $3.0 billion. For the years ended December 31, 2013 and 2012, the Former Manager waived base management fees earned of $6.1 million and $1.8 million, respectively.
We were required to pay the Former Manager a quarterly incentive fee, equal to the difference between (1) the product of (a) 20% and (b) the excess of our annualized core earnings (as defined in the management agreement with the Former Manager) over the product of (i) the weighted-average number of shares multiplied by the weighted-average issuance price per share of common stock (ii) 8% and (2) the sum of any incentive compensation paid to the Former Manager with respect to the first three calendar quarters of the previous 12-month period. One half of each quarterly installment of the incentive fee were payable in shares of common stock. The remainder of the incentive fee was payable in cash. No incentive fees were earned for the years ended December 31, 2013 and 2012, respectively. Subsequent to December 31, 2013, the management agreement was terminated as a result of our transition to self-management.
Management fees to affiliates increased by $17.3 million to $17.5 million for the year ended December 31, 2013 compared to $0.2 million for the year ended December 31, 2012. Of the $17.3 million, $5.0 million related to base management fees, $9.4 million related to ARCT III asset management fees settled in OP Units upon the closing of the ARCT III Merger and $3.1 million related to property management services. For the year ended December 31, 2013, the Former Manager waived all but $0.2 million of base management fees.
General and Administrative Expenses
General and administrative expenses increased by $117.7 million to $123.2 million for the year ended December 31, 2013 compared to $5.5 million for the year ended December 31, 2012. General and administrative expenses increased as a result of higher professional fees, such as legal fees, accountant fees and financial printer services fees, insurance expense, salary-related expenses and board member compensation to support our increased real estate portfolio.
Also, included in general and administrative expenses is equity-based compensation expense, which increased by $99.1 million to $100.3 million for the year ended December 31, 2013 compared to $1.2 million for the year ended December 31, 2012. Equity-based compensation expenses for the current year primarily included expenses for the OPP, which was entered into upon consummation of the ARCT III Merger, as well as the amortization of restricted stock. During the year ended December 31, 2013, we recorded equity-based compensation of $92.3 million for the OPP, of which $59.6 million related to accelerating the vesting of OP units in relation to our transition to self-management and $32.7 million of the expense was locked in based on OPP provisions. During the year ended December 31, 2012, equity-based compensation expense related only to the amortization of restricted stock.
Depreciation and Amortization Expense
Depreciation and amortization expense increased by $170.0 million to $211.0 million for the year ended December 31, 2013 compared to $41.0 million for the year ended December 31, 2012. The increase in depreciation and amortization expense was driven by our acquisition of 1,807 properties since December 31, 2012 for an aggregate purchase price of $3.5 billion.
Impairment of Real Estate
For the year ended December 31, 2013, we recorded an impairment loss of $3.3 million. No impairments were recorded for the year ended December 31, 2012. After reviewing our portfolio for impairment indicators, we performed a recoverability test as of the dates on which the indicators existed. Certain properties failed the recoverability test, as such a fair value analysis was performed to determine the amount of impairment. An impairment loss was calculated based on the difference between the carrying amount of each property and the estimated fair value of each property as of the respective measurement dates.
Interest Expense, Net
Interest expense increased by $93.6 million to $105.5 million for the year ended December 31, 2013 compared to $11.9 million for the year ended December 31, 2012. The increase in interest expense was due to increases in debt balances used to fund portfolio acquisitions, partially offset by a decrease in the weighted-average annualized interest rate on borrowings. The weighted-average debt balances for the years ended December 31, 2013 and 2012 were $1.8 billion and $205.1 million, respectively. The weighted-average annualized interest rate on all debt, including the effect of derivative instruments used to hedge the effects of interest rate
59
volatility but excluding amortization of deferred financing costs and non-usage fees, for the years ended December 31, 2013 and 2012 was 3.40% and 4.16%, respectively.
Our interest expense in future periods will vary based on our level of future borrowings, which will depend on the level of proceeds raised in offerings, our credit rating, the cost of borrowings, and the opportunity to acquire real estate assets which meet our investment objectives.
Other Income, Net
Other income increased by $2.8 million to $3.8 million for the year ended December 31, 2013 compared to other income of $1.0 million for the year ended December 31, 2012. The increase is primarily related to income earned on investments in redeemable preferred stock, senior notes and common stock, all of which were sold as of December 31, 2013, and investment income on certain assets acquired from CapLease during the fourth quarter of the year ended December 31, 2013.
Loss on Derivative Instruments, Net
Loss on the fair value of derivative instruments for the year ended December 31, 2013 was $67.9 million, which primarily consisted of a loss on contingent value rights. The loss pertains to the fair value of our obligation to pay certain preferred and common stockholders for the difference between the value of our shares on certain measurement dates and the value of the shares at the time of issuance as set forth by the contingent value rights agreement. The obligations were settled in full during the year ended December 31, 2013. The loss was partially offset by a gain on derivative instruments resulting from marking our derivative instruments to fair value. No gain or loss on derivative instruments was recorded during the year ended December 31, 2012.
Loss on Sale of Investment in Affiliates
Loss on sale of investment in affiliates for the year ended December 31, 2013 was $0.4 million resulting from the sale of our investment in a real estate fund sponsored by ARC purchased during the year ended December 31, 2013. No loss on the sale of investment in such funds was recorded during the year ended December 31, 2012.
Gain (Loss) on Sale of Investments
Loss on sale of investment securities, net for the year ended December 31, 2013 of $1.8 million primarily related to a $2.3 million loss on the sale of investments in redeemable preferred stock, senior notes and common stock, all of which were purchased in 2013 and sold as of December 31, 2013, partially offset by a $0.5 million gain on sale of investments in redeemable preferred stock, all of which were purchased in 2012 and sold as of December 31, 2013. The Company did not sell any investment securities during the year ended December 31, 2012.
Net Loss from Discontinued Operations
Net loss from discontinued operations decreased by $0.7 million to a net loss of $34,000 for the year ended December 31, 2013 compared to a net loss of $0.7 million for the year ended December 31, 2012. As of December 31, 2013 and 2012, we classified one property as held for sale on the consolidated balance sheets and reported in discontinued operations on the consolidated statements of operations and comprehensive loss. The net losses from discontinued operations during each year were primarily due to impairment on the held for sale property representing the difference between the carrying value and estimated proceeds from the sale of the property less estimated selling costs.
Comparison of the Year Ended December 31, 2012 to Year Ended December 31, 2011
Rental Income
Rental income increased by $61.5 million to $65.3 million for the year ended December 31, 2012 compared to $3.8 million for the year ended December 31, 2011. Rental income was driven by our acquisition of 573 properties during the year ended December 31, 2012 for an aggregate purchase price of $1.7 billion, as well as revenue for a full year from the 129 properties held as of December 31, 2011. The annualized rental income per square foot of the properties at December 31, 2012 was $9.59 with a weighted-average remaining lease term of 10.4 years, compared to $11.59 per square foot at December 31, 2011. There were no properties held for sale for the full period in each of the years ended December 31, 2012 and 2011.
Operating Expense Reimbursements
Operating expense reimbursements increased by $1.7 million to $1.9 million for the year ended December 31, 2012 compared to $0.2 million for the year ended December 31, 2011. Operating expense reimbursements represent reimbursements for taxes, property maintenance and other charges contractually due from tenants per their respective leases. Operating expense
60
reimbursements were driven by our acquisition of 573 properties during the year ended December 31, 2012 as well as reimbursements for a full year from the 129 properties held as of December 31, 2011.
Acquisition Related Expenses
Acquisition related expenses increased by $41.2 million to $45.1 million for the year ended December 31, 2012 compared to $3.9 million for the year ended December 31, 2011. The increase is driven by our acquisition of 573 properties during the year ended December 31, 2012 compared to 69 during the year ended December 31, 2011. Acquisition and related costs represent the costs related to the acquisition of properties. Acquisition costs mainly consisted of legal costs, deed transfer costs and other costs related to real estate purchase transactions.
Merger and Other Non-routine Transaction Related Expenses
During the year ended December 31, 2012, expenses related to the merger with ARCT III announced in December 2012 and other transaction costs were $2.6 million. These costs primarily consisted of legal fees, accountant fees and other costs associated with entering into the ARCT III merger agreement. There were no such merger expenses incurred during the year ended December 31, 2011.
Property Operating Expenses
Property expenses increased by $3.3 million to $3.5 million for the year ended December 31, 2012 compared to $0.2 million for the year ended December 31, 2011. These expenses relate to costs associated with maintaining certain properties, including real estate taxes, ground lease rent, insurance and repairs and maintenance expenses. The increase in property expenses is mainly due to our acquisition of properties with modified gross leases during the year ended December 31, 2012 and an increased number of properties for which we pay expenses, which are reimbursed by the tenant.
Management Fees to Affiliates
We paid the Former Manager an annual base management fee equal to 0.50% per annum of the average unadjusted book value of our real estate assets, calculated and payable monthly in advance, provided that the full amount of the distributions we have declared for the six immediately preceding months is equal to or greater than certain net income thresholds related to our operations. The Former Manager waived such portion of its management fee in excess of such thresholds. For the years ended December 31, 2012 and 2011, the Former Manager waived base management fees earned of $1.8 million and $0.3 million, respectively.
We were required to pay the Former Manager a quarterly incentive fee, calculated based on 20% of the excess of our annualized core earnings (as defined in the management agreement with our Former Manager) over the weighted-average number of shares multiplied by the weighted-average price per share of common stock. One half of each quarterly installment of the incentive fee would be payable in shares of common stock. The remainder of the incentive fee would be payable in cash. No incentive fees were earned for the years ended December 31, 2012 and 2011, respectively.
Management fees to affiliates were $0.2 million for the year ended December 31, 2012, compared to no such fees for the year ended December 31, 2011, which was the result of decisions by the Former Manager to not waive base management fees of $0.2 million in 2012 whereas the Former Manager waived all fees in 2011.
General and Administrative Expenses
General and administrative expenses increased by $4.8 million to $5.5 million for the year ended December 31, 2012 compared to $0.7 million for the year ended December 31, 2011. General and administrative expenses increased primarily as a result of higher professional fees, such as legal fees, accountant fees and financial printer services fees, insurance expense and board member compensation to support our increased real estate portfolio.
Depreciation and Amortization Expense
Depreciation and amortization expense increased by $38.9 million to $41.0 million for the year ended December 31, 2012 compared to $2.1 million for the year ended December 31, 2011. The increase in depreciation and amortization expense was driven by our acquisition of 573 properties during the year ended December 31, 2012 for an aggregate purchase price of $1.7 billion as well as depreciation and amortization expense for a full year from the 129 properties held as of December 31, 2011.
Interest Expense, Net
Interest expense increased by $10.9 million to $11.9 million for the year ended December 31, 2012 compared to $1.0 million for the year ended December 31, 2011. The increase primarily related to the increase in debt balances used to fund portfolio
61
acquisitions as the outstanding balance on our senior secured revolving credit facility increased by $82.2 million during the year ended December 31, 2012. Interest expense also related to outstanding mortgage notes payable, which increased $229.8 million million during the year ended December 31, 2012, partially offset by a slightly lower weighted-average effective interest rate during 2012 as compared to 2011.
Our interest expense in future periods will vary based on our level of future borrowings, which will depend on the level of proceeds raised in offerings, our credit ratings, the cost of borrowings, and the opportunity to acquire real estate assets which meet our investment objectives.
Other Income, Net
Other income increased by $1.0 million to $1.0 million for the year ended December 31, 2012 compared to $4,000 for the year ended December 31, 2011. The increase was primarily due to income on investment securities purchased during the year ended December 31, 2012.
Net Loss from Discontinued Operations
Net loss from discontinued operations decreased by $0.2 million to $0.7 million for the year ended December 31, 2012 compared to $0.9 million for the year ended December 31, 2011. As of the year ended December 31, 2012 and 2011, we had one and two vacant properties, respectively, classified as held for sale on the consolidated balance sheets and reported in discontinued operations on the consolidated statements of operations and comprehensive loss. The net losses from discontinued operations during each year were primarily due to impairments on the held for sale properties representing the difference between the carrying value and estimated proceeds from the sale of the properties less estimated selling costs. On July 3, 2012, one of the properties was sold for $0.6 million of net proceeds.
Cole Capital
Effective February 7, 2014, we consummated the Cole Merger and acquired Cole Capital. As we did not commence operations for Cole Capital until February 7, 2014, comparative financial data is not presented for the year ended December 31, 2013.
Year ended December 31, 2014
Cole Capital Revenue
Cole Capital revenue for the year ended December 31, 2014 was $203.6 million. Cole Capital revenue primarily consisted of transaction services revenue of $60.7 million, which included acquisition fees related to the acquisition of properties on behalf of certain of the Managed REITs. We also recorded management fees and reimbursements of $55.8 million, which consisted of advisory fees and asset and property management fees of $42.7 million from certain Managed REITs and other programs sponsored by us and reimbursements of $13.1 million for expenses incurred in providing advisory and asset and property management services to certain Managed REITs.
Cole Capital Reallowed fees and commissions
Reallowed fees and commissions relate to selling commissions earned by participating broker-dealers related to the sale of securities of the Managed REITs or the payment of all or a portion of our dealer manager fees to participating broker-dealers as a marketing and due diligence expense reimbursement, based on factors such as the volume of shares sold by such participating broker-dealers and the amount of marketing support provided by such participating broker-dealers. Reallowed fees and commissions for the year ended December 31, 2014 were $66.2 million, which consisted of $57.0 million of reallowed securities commissions as well as $9.2 million reallowed dealer manager fees. See Note 20 – Related Party Transactions and Arrangements to the consolidated financial statements contained in this report for further discussion.
Acquisition Related and Merger and Other Non-routine Transaction Related Expenses
Acquisition and merger and other non-routing transaction related expenses for the year ended December 31, 2014 were $5.3 million. $3.4 million of the total expenses for the year relate to “dead deal” acquisition related expenses.
General and Administrative Expenses
General and administrative expenses were $91.2 million for the year ended December 31, 2014, which primarily consisted of employee compensation costs of $71.7 million and equity-based compensation expense of $9.5 million. These expenses also include $2.3 million relating to legal, accounting, and professional fees. The remaining general and administrative expenses include insurance and other operating costs.
62
Depreciation and Amortization Expenses
Depreciation and amortization expenses were $71.3 million for the year ended December 31, 2014, which primarily consisted of amortization related to the intangible assets acquired in connection with the Cole Merger of $68.5 million. Depreciation and amortization expenses also includes depreciation and amortization related to leasehold improvements and property and equipment.
Impairments
During the year ended December 31, 2014, we recorded an impairment of $309.4 million related to intangible assets and goodwill, as further discussed within Note 3 – Summary of Significant Accounting Policies and Note 6 – Goodwill and Other Intangibles.
Other Income, Net
Other income for the year ended December 31, 2014 was $42.9 million, which primarily consisted of a benefit from income taxes recorded of $40.6 million related to our TRS, of which $35.3 million relates to federal income tax and $5.3 million relates to state income tax. While most of the business activities of Cole Capital are conducted through the TRS, revenues and expenses recorded in the TRS for tax purposes are not the same as those included in Cole Capital in accordance with U.S. GAAP.
Funds from Operations and Adjusted Funds from Operations
Due to certain unique operating characteristics of real estate companies, as discussed below, the National Association of Real Estate Investment Trusts, Inc. (“NAREIT”), an industry trade group, has promulgated a measure known as funds from operations (“FFO”), which we believe to be an appropriate supplemental measure to reflect the operating performance of a REIT. The use of FFO, a non-GAAP supplemental financial performance measure, is recommended by the REIT industry as a supplemental performance measure. FFO is not equivalent to our net income or loss as determined under U.S. GAAP.
NAREIT defines FFO as net income or loss computed in accordance with U.S. GAAP, excluding gains or losses from disposition of property, depreciation and amortization of real estate assets and impairment write-downs on real estate including pro rata share of adjustments for unconsolidated partnerships and joint ventures. Our FFO calculation complies with NAREIT’s policy described above.
In addition to FFO, we use Adjusted Funds From Operations (“AFFO”) as a non-GAAP supplemental financial performance measure to evaluate the operating performance of our company. AFFO, as defined by our Company, excludes from FFO items one time items such as acquisition related costs, merger and other non-routine transactions costs, gains or losses on sale of investments, insurance and litigation settlements and extinguishment of debt cost. The Company also excludes certain non-cash items such as impairments of intangible, straight-line rental revenue, unrealized gains or losses on derivatives, amortization of intangibles, deferred financing costs, above and below market leases as well as equity based compensation. Management believes that excluding these costs from FFO provides investors with supplemental performance information that is consistent with the performance models and analysis used by management, and provides investors a view of the performance of our portfolio over time, including after we cease to acquire properties on a frequent and regular basis. AFFO also allows for a comparison of the performance of our operations with other traded REITs that are not currently engaging in acquisitions and mergers, as well as a comparison of our performance with that of other traded REITs, as AFFO, or an equivalent measure, is routinely reported by traded REITs, and we believe often used by analysts and investors for comparison purposes.
For all of these reasons, we believe FFO and AFFO, in addition to net loss and cash flows from operating activities, as defined by GAAP, are helpful supplemental performance measures and useful in understanding the various ways in which our management evaluates the performance of our company over time. However, not all REITs calculate FFO and AFFO the same way, so comparisons with other REITs may not be meaningful. FFO and AFFO should not be considered as alternatives to net loss or to cash flows from operating activities, and are not intended to be used as a liquidity measure indicative of cash flow available to fund our cash needs.
AFFO may provide investors with a view of our future performance and future dividend policy. However, because AFFO excludes items that are an important component in an analysis of the historical performance of a property, AFFO should not be construed as a historic performance measure. Neither the SEC, NAREIT, nor any other regulatory body has evaluated the acceptability of the exclusions contemplated to adjust FFO in order to calculate AFFO and its use as a non-GAAP financial performance measure.
63
The table below presents FFO and AFFO for the years ended December 31, 2014, 2013 and 2012 (in thousands, except share and per share data).
| Year Ended December 31, | ||||||||||||
| 2014 | 2013 | 2012 | ||||||||||
| Net loss | $ | (1,010,912 | ) | $ | (507,815 | ) | $ | (42,237 | ) | |||
| Dividends on non-convertible preferred stock | (71,094 | ) | — | — | ||||||||
| Adjusted net loss | (1,082,006 | ) | (507,815 | ) | (42,237 | ) | ||||||
| Loss on held for sale assets and disposition of properties, net | 277,031 | — | 600 | |||||||||
| Depreciation and amortization of real estate assets | 844,527 | 210,976 | 40,957 | |||||||||
| Impairment of real estate | 100,547 | 3,346 | — | |||||||||
| Proportionate share of adjustments for unconsolidated entities | 9,037 | — | — | |||||||||
| FFO | 149,136 | (293,493 | ) | (680 | ) | |||||||
| Acquisition related | 38,831 | 76,113 | 45,070 | |||||||||
| Merger and other transaction related | 200,514 | 210,543 | 2,603 | |||||||||
| Impairment of intangible assets | 309,444 | — | — | |||||||||
| RCS litigation settlement | (60,000 | ) | — | — | ||||||||
| Litigation insurance proceeds | (3,995 | ) | — | — | ||||||||
| (Gain) loss on sale of investment securities | (6,357 | ) | 2,206 | — | ||||||||
| (Gain) loss on derivative instruments, net | 10,570 | 67,946 | — | |||||||||
| Interest on convertible obligation to preferred investors | — | 10,802 | — | |||||||||
| Interest premiums and discounts on debt, net and settlement of convertible obligations to preferred investors | — | 12,072 | — | |||||||||
| Amortization of premiums and discounts on debt and investments | (6,449 | ) | — | — | ||||||||
| Amortization of above- and below- market lease assets and liabilities | 5,900 | (178 | ) | 118 | ||||||||
| Net direct financing lease adjustments | 1,595 | 496 | — | |||||||||
| Amortization and write off of deferred financing costs | 91,922 | 29,161 | 1,985 | |||||||||
| Amortization of management contracts | 68,537 | — | — | |||||||||
Deferred tax benefit (1) | (33,324 | ) | — | — | ||||||||
| Extinguishment of debt | 21,869 | — | — | |||||||||
| Straight-line rent | (75,171 | ) | (15,272 | ) | (2,212 | ) | ||||||
| Non-cash equity compensation expense | 31,825 | 100,261 | 1,197 | |||||||||
| Other amortization and non-cash charges | 2,727 | 172 | 46 | |||||||||
| Proportionate share of adjustments for unconsolidated entities | 3,140 | — | — | |||||||||
| AFFO | $ | 750,714 | $ | 200,829 | $ | 48,127 | ||||||
| Weighted-average shares outstanding - basic | 793,150,098 | 205,341,431 | 103,306,366 | |||||||||
| Effect of dilutive securities | 44,502,144 | 25,223,423 | 1,316,197 | |||||||||
Weighted-average shares outstanding - diluted (2) | 837,652,242 | 230,564,854 | 104,622,563 | |||||||||
| AFFO per dilutive share | $ | 0.90 | $ | 0.87 | $ | 0.46 | ||||||
(1) The Company recognized a tax benefit of $40.6 million in net loss. This adjustment represents the non-current portion of the benefit in order to show only the current portion of the benefit as an impact to AFFO.
(2) Weighted-average shares for all periods presented excludes the effect of the convertible debt as the effect would be antidilutive.
Liquidity and Capital Resources
In the normal course of business, our principal demands for funds will continue to be for property acquisitions, either directly or through investment interests, for the payment of operating expenses, distributions to our investors, and for the payment of principal and interest on our outstanding indebtedness. Our cash needs are intended to be provided by cash flow from operations. If we are unable to satisfy our operating costs with our cash flow from operations, we may use borrowings on our line of credit and proceeds from issuances of equity or debt securities to cover such obligations, as necessary. A significant portion of our net leases contain contractual rent escalations during the primary term of the lease. Other potential future sources of capital include proceeds from secured or unsecured financings from banks or other lenders, proceeds from offerings, proceeds from the sale of properties and undistributed funds from operations.
64
As of December 31, 2014, we had $416.7 million of cash and cash equivalents.
Sources of Funds
Capital Markets
On August 1, 2012, we filed a $500.0 million universal shelf registration statement and a resale registration statement with the SEC. Each registration statement became effective on August 17, 2012. As of December 31, 2014, the General Partner had issued 2.1 million shares of common stock and no preferred stock, debt or equity-linked security had been issued under the universal shelf registration statement. Concurrently with the General Partner’s issuance of the 2.1 million shares of common stock referenced above, the Operating Partnership issued 2.1 million General Partner OP Units to the General Partner. The resale registration statement, as amended, registered the resale of up to 1,882,248 shares of ARCP’s common stock issued in connection with any future conversion of certain currently outstanding restricted shares, preferred stock or Limited Partner OP Units.
In January 2013, we commenced an “at the market” equity offering program (“ATM”) in which we may from time to time offer and sell shares of our common stock having an aggregate offering proceeds of up to $60.0 million. The shares would be issued pursuant to our $500.0 million universal shelf registration statement.
On March 14, 2013, we filed a universal automatic shelf registration statement and achieved well-known seasoned issuer (“WKSI”) status. As a result of the delayed filing of certain of our periodic reports with the SEC, we are not currently eligible to register the offer and sale of our securities using a registration statement on Form S-3 and, therefore, are not eligible to use such WKSI shelf registration statement or the $500.0 million universal shelf registration statement described above, and we will not become eligible until we have timely filed certain periodic reports required under the Securities Exchange Act of 1934 for 12 consecutive calendar months.
On May 28, 2014, we closed on an underwriting agreement relating to a public offering of 138.0 million shares of common stock. The offering price to public was $12.00 per share. The net proceeds were $1.6 billion after deducting underwriting discounts and commissions, but excluding expenses which include a $2.0 million structuring fee paid to an affiliate of the Former Manager, RCS.
In addition to our common stock offerings, on June 7, 2013, we issued 28.4 million shares of convertible preferred stock (the “Series C Shares”) for gross proceeds of $445.0 million. On November 12, 2013, we converted outstanding Series C Shares into our common stock. Pursuant to the Series C Shares’ Articles Supplementary, the number of shares of common stock that could be issued upon conversion of Series C Shares was limited to an exchange cap. Therefore, we converted 1.1 million Series C Shares into 1.4 million shares of our common stock. With respect to the 27.3 million Series C Shares for which we could not issue shares of our common stock upon conversion due to the exchange cap, we paid holders of Series C Shares an aggregate cash amount equal to $441.4 million in exchange for such Series C Shares. Based on our share price on the conversion date, the total settlement value was $458.8 million.
On September 15, 2013, we entered into definitive purchase agreements pursuant to which we agreed to issue Series D Preferred Stock, par value $0.01 per share, and common stock, par value $0.01 per share, to certain institutional holders promptly following the close of our merger with CapLease. Pursuant to the definitive purchase agreements, we issued approximately 21.7 million shares of Series D Preferred Stock and 15.1 million shares of common stock, for gross proceeds of $288.0 million and $186.0 million, respectively, on November 12, 2013. On August 31, 2014, we redeemed all outstanding shares of Series D Preferred Stock for payment of $316.1 million.
Upon consummation of the ARCT IV merger on January 3, 2014, 42.2 million shares of a new series of preferred stock designated as the 6.70% Series F Cumulative Redeemable Preferred Stock (“Series F Preferred Stock”) were issued to ARCT IV stockholders. As of December 31, 2014, there were 42.8 million issued and outstanding shares of Series F Preferred Stock. See Note 18 – Preferred and Common Stock and OP Units to our consolidated financial statements in this report for a description of the Series D Preferred Stock and Series F Preferred Stock.
Availability of Funds from Credit Facilities
We, as guarantor, and the OP, as borrower, are parties to a credit facility with Wells Fargo, National Association, as administrative agent and other lenders party thereto (the “Credit Facility”), as amended.
The Credit Facility was initially comprised of a $1.2 billion term loan facility (with a delayed draw component equal to $200.0 million), a $3.3 billion dollar-denominated revolving credit facility and a $250.0 million multi-currency revolving facility (all of which can be borrowed in dollars, at the Company’s discretion). The Credit Facility included an accordion feature, which, if exercised in full, allowed the Company to increase the aggregate commitments under the Credit Facility to $6.0 billion, subject to the receipt of such additional commitments and the satisfaction of certain customary conditions. Subsequent to the Credit Agreement date, the Company accepted an additional $50.0 million commitment on the revolving credit facility from one of the original 20 financial institutions, bringing the total Credit Facility commitments to $4.65 billion.
65
The revolving credit facility generally bears interest at an annual rate of LIBOR plus from 1.00% to 1.80% or Base Rate plus 0.00% to 0.80% (based upon ARCP’s then current credit rating). “Base Rate” is defined as the highest of the prime rate, the federal funds rate plus 0.50% or a floating rate based on one month LIBOR, determined on a daily basis. The term loan facility generally bears interest at an annual rate of LIBOR plus 1.15% to 2.05%, or Base Rate plus 0.15% to 1.05% (based upon ARCP’s then current credit rating). The Loans were initially to be priced with an applicable margin of 1.35% in the case of LIBOR revolving loans and 1.60% in the case of LIBOR term loans. In addition, the Credit Agreement provides the flexibility for interest rate auctions, pursuant to which, at the Company’s election, the Company may request that lenders make competitive bids to provide revolving loans, which competitive bids may be at pricing levels that differ from the foregoing interest rates.
The Credit Agreement provides for monthly interest payments under the Credit Facility. In the event of default, at the election of the majority of the lenders (or automatically upon a bankruptcy event of default with respect to the OP or the Company), the commitments of the lenders under the Credit Facility terminate, and payment of any unpaid amounts in respect of the Credit Facility is accelerated. The revolving credit facility and the term loan facility both terminate on June 30, 2018, in each case, unless extended in accordance with the terms of the Credit Agreement. The Credit Agreement provides for a one-year extension option with respect to each of the revolving credit facility and the term loan facility, exercisable at the Company’s election and subject to certain customary conditions, as well as certain customary “amend and extend” provisions. At any time, upon timely notice by the OP and subject to any breakage fees, the OP may prepay borrowings under the Credit Facility (subject to certain limitations applicable to the prepayment of any loans obtained through an interest rate auction, as described above). The OP incurs a fee equal to 0.15% to 0.25% per annum (based upon ARCP’s then current credit rating) multiplied by the commitments (whether or not utilized) in respect of the dollar revolving credit facility and the multi-currency credit facility. The OP incurs an unused fee of 0.25% per annum on the unused amount of the delayed draw term loan commitments. In addition, the OP incurs customary administrative agent, letter of credit issuance, letter of credit fronting, extension and other fees.
The Credit Facility requires restrictions on corporate guarantees, as well as the maintenance of financial covenants, including the maintenance of certain financial ratios (such as specified debt to equity and debt service coverage ratios) and the maintenance of a minimum net worth.
In connection with the Credit Agreement, the Company expensed $3.9 million of unamortized deferred financing costs incurred in connection with the original Credit Facility, which is included in interest expense, net in the accompanying consolidated unaudited statements of operations.
On November 12, 2014, the Company entered into a consent, waiver and amendment (“the Amendment”) with its lenders under its unsecured credit facility for an extension of the date for delivery of its third quarter 2014 financial statements and certain other financial deliverables until the earlier of five days following the date the Company filed with the SEC its third quarter 2014 10-Q and January 5, 2015. The Amendment allowed the Company to remain compliant with its borrowing obligations under its Credit Facility during the Restatement process. As part of the Amendment, the Company agreed to reduce the maximum amount of indebtedness from $4.65 billion to $4.0 billion. Additionally, until the 2013 and 2014 financial statements were filed with the SEC, the maximum principal amount of indebtedness outstanding under the Credit Facility was temporarily reduced to $3.6 billion.
On December 23, 2014, the Company and the OP, as the borrower, entered into a Consent and Waiver Agreement (the “Consent and Waiver”) with respect to the Credit Agreement, as amended. The Consent and Waiver, among other things, (i) provided for a further extension of the date for delivery of the Company’s third quarter 2014 financial statements and certain other financial deliverables that the Company agreed to provide under the Amendment until the earlier of March 2, 2015 and 45 days following the receipt of a notice of breach or default from the applicable trustee or the requisite percentage of holders under the Company’s and the OP’s respective indentures, (ii) provided an extension from the lenders for the delivery of the Company’s full-year 2014 audited financial statements until the earlier of the fifth day after the date that the Company files its Annual Report on Form 10-K with the SEC for the fiscal year ended December 31, 2014 and March 31, 2015, (iii) permanently reduced the maximum amount of indebtedness under the Credit Agreement to $3.6 billion, including the reduction of commitments under the undrawn term loan commitments and the Company’s revolving facilities as well as the elimination of the $25 million swingline facility, (iv) provided that until the date that all required financial deliverables have been delivered, no further loans or letters of credit would be requested under the Credit Agreement, as amended, by the Company, other than in accordance with the cash flow forecast provided by the Company to the lenders thereunder, that neither the Company nor the OP would pay any dividends on, or make any other Restricted Payment (as defined in the Credit Agreement) on, its respective common equity and (v) provided that the Company would provide additional financial and other information to the lenders from time to time. In connection with the Amendment and the Consent and Waiver, the Company agreed to pay certain customary fees to the consenting lenders and agreed to reimburse certain customary expenses of the arrangers. On February 20, 2015, we entered into a third consent (the “Third Consent”) to clarify the required financial deliverables due to the lenders.
As of December 31, 2014, the outstanding balance on the Credit Facility was $3.2 billion, of which $2.2 billion bore a floating interest rate of 1.95% at December 31, 2014. The remaining outstanding balance on the Credit Facility of $1.0 billion is fixed through the use of derivative instruments used to hedge interest rate volatility. Including the spread, which can vary based on
66
ARCP’s credit rating, the interest rate on this portion was 3.28% at December 31, 2014. As of December 31, 2014, a maximum of $416.0 million was available to the OP for future borrowings, subject to borrowing availability. The credit facility matures on June 30, 2018.
Principal Use of Funds
Acquisitions
Cash needs for property acquisitions will generally be met through proceeds from the public or private offerings of debt and equity, availability on our credit facility and other financings. We may also from time to time enter into other agreements with third parties whereby third parties will make equity investments in specific properties or groups of properties that we acquire.
We evaluate potential acquisitions of real estate and real estate-related assets and engage in negotiations with sellers and borrowers. Investors and stockholders should be aware that after a purchase contract is executed that contains specific terms the property will not be purchased until the successful completion of due diligence and negotiation of final binding agreements. During this period, we may decide to temporarily invest any unused proceeds from equity offerings in certain investments that could yield lower returns than the properties. These lower returns may affect our ability to make distributions.
We financed the aggregate purchase prices of the recent mergers and acquisitions discussed in Note 2 – Mergers and Significant Acquisitions and Sales to our consolidated financial statements in this report in part through the assumption of outstanding indebtedness, and through a combination of available cash on hand from (a) a portion of the $2.5 billion in proceeds from the corporate bond offering; (b) financing available under our credit facility; (c) a portion of the $1.6 billion in net proceeds from the sale of ARCP’s common stock on May 28, 2014; and (d) additional alternative financing arrangements, as needed, from the issuance of additional common stock, preferred securities or other debt, equity or equity-linked financings.
Dividends
The amount of dividends payable to our stockholders is determined by our board of directors and is dependent on a number of factors, including funds available for dividends, financial condition, capital expenditure requirements, as applicable, and annual dividend requirements needed to qualify and maintain our status as a REIT under the Internal Revenue Code. Operating cash flows are expected to increase as additional properties are acquired in our investment portfolio.
Until the completion of the Restatement and the filing of this report and in connection with the amendments to the Amended Credit Agreement, the Company agreed to suspend payment of dividends on its common stock until it complied with certain requirements set forth in such amendments. The Board of Directors is currently evaluating our dividend policy and expects to adopt a policy of paying a common stock dividend in line with our industry peers, while still meeting the minimum distribution requirement to maintain our status as a REIT.
As our real estate portfolio matures, we expect cash flows from operations to cover our dividends.
Loan Obligations
At December 31, 2014, our leverage ratio (net debt, excluding debt convertible to common stock, divided by enterprise value) was 55.2%
The payment terms of our loan obligations vary. In general, only interest amounts are payable monthly with all unpaid principal and interest due at maturity. Some of our loan agreements stipulate that we comply with specific reporting and financial covenants mainly related to debt coverage ratios and loan to value ratios. Each loan that has these requirements has specific ratio thresholds that must be met. As of December 31, 2014, we believe we are in compliance with the debt covenants under our respective loan agreements.
As of December 31, 2014, we had non-recourse mortgage indebtedness of $3.7 billion, which was collateralized by 776 properties. Our mortgage indebtedness bore interest at the weighted average rate of 4.88% per annum and had a weighted average maturity of 6.2 years. We may in the future incur additional mortgage debt on the properties we currently own or use long-term non-recourse financing to acquire additional properties in the future.
As of December 31, 2014, there was $1.0 billion outstanding on our convertible senior notes. Of the convertible senior notes, $597.5 million and $402.5 million may be converted into cash, common stock, or a combination thereof any time after February 1, 2018 and June 15, 2020, respectively, and in limited circumstances prior to such dates. The convertible senior notes bear interest at the weighted average rate of 3.3% per annum and had a weighted average maturity of 4.5 years.
As of December 31, 2014, there was $3.2 billion outstanding on the Credit Facility, of which $2.2 billion bore a floating interest rate of 1.95%. There is $1.0 billion outstanding on the Credit Facility which is fixed through the use of derivative instruments used to hedge interest rate volatility. Including the spread, which can vary based on the Company’s credit rating, interest on this portion was 3.28% at December 31, 2014. At December 31, 2014, there was up to $0.4 billion available to the Company for future borrowings, subject to borrowing availability.
67
Our loan obligations require the maintenance of financial covenants, as well as restrictions on corporate guarantees, the maintenance of certain financial ratios (such as specified debt to equity and debt service coverage ratios), as well as the maintenance of a minimum net worth.
Bond Offering
On February 6, 2014, the OP issued, in a private offering, $2.55 billion aggregate principal amount of senior unsecured notes consisting of $1.3 billion aggregate principal amount of 2.00% senior notes due 2017 (the “2017 Notes”), $750.0 million aggregate principal amount of 3.00% senior notes due 2019 (the “2019 Notes”) and $500.0 million aggregate principal amount of 4.60% senior notes due 2024 (the “2024 Notes”, and, together with the 2017 Notes and 2019 Notes, the “Notes”). The Notes are guaranteed by the Company. The Company used a portion of the net proceeds to partially fund the cash consideration, fees and expenses relating to Cole Merger and repayment of Cole’s credit facility. The Company used the remaining portion of the net proceeds from the offering to repay $900.0 million outstanding under the OP’s prior credit facility and for other general corporate purposes. The OP completed an exchange offer of substantially similar registered notes for the Notes during the year ended December 31, 2014.
Contractual Obligations
The following is a summary of our contractual obligations as of December 31, 2014 (in thousands):
| Total | 2015 | 2016 | 2017 | 2018 | 2019 | Thereafter | ||||||||||||||||||||||
| Principal payments due on mortgage notes payable | $ | 3,689,795 | $ | 163,821 | $ | 250,658 | $ | 457,903 | $ | 221,105 | $ | 297,146 | $ | 2,299,162 | ||||||||||||||
| Interest payments due on mortgage notes payable | 1,096,811 | 178,090 | 166,185 | 141,867 | 127,641 | 117,870 | 365,158 | |||||||||||||||||||||
| Principal payments due on credit facility | 3,184,000 | — | — | — | 3,184,000 | — | — | |||||||||||||||||||||
| Interest payments due on credit facility | 310,663 | 66,621 | 85,757 | 101,386 | 56,899 | — | — | |||||||||||||||||||||
| Principal payments due on corporate bonds | 2,550,000 | — | — | 1,300,000 | — | 750,000 | 500,000 | |||||||||||||||||||||
| Interest payments due on corporate bonds | 355,952 | 71,500 | 71,500 | 48,028 | 45,500 | 25,188 | 94,236 | |||||||||||||||||||||
| Principal payments due on convertible debt | 1,000,000 | — | — | — | 597,500 | — | 402,500 | |||||||||||||||||||||
| Interest payments due on convertible debt | 154,124 | 33,019 | 33,019 | 33,019 | 25,550 | 15,094 | 14,423 | |||||||||||||||||||||
| Principal payments due on other debt | 45,325 | 11,862 | 12,516 | 7,680 | 13,267 | — | — | |||||||||||||||||||||
| Interest payments due on other debt | 4,658 | 2,205 | 1,569 | 882 | 2 | — | — | |||||||||||||||||||||
| Payments due on lease obligations | 374,605 | 24,093 | 22,880 | 22,014 | 19,958 | 72,316 | 213,344 | |||||||||||||||||||||
| Total | $ | 12,765,933 | $ | 551,211 | $ | 644,084 | $ | 2,112,779 | $ | 4,291,422 | $ | 1,277,614 | $ | 3,888,823 | ||||||||||||||
Cash Flows for the year ended December 31, 2014
During the year ended December 31, 2014, net cash provided by operating activities was $502.9 million. The level of cash flows used in or provided by operating activities is affected by acquisition and transaction costs, the timing of interest payments, as well as the receipt of scheduled rent payments. Cash flows provided by operating activities during the year ended December 31, 2014 were mainly due to adjusted net income of $806.6 million (net loss of $1.0 billion adjusted for non-cash items including the issuance of OP Units, depreciation and amortization, gain on sale of properties, equity-based compensation, gain on derivative instruments and gain on the early extinguishment of debt totaling $1.8 billion, in the aggregate), offset by a decrease in accounts payable and accrued expenses of $16.3 million, a decrease in prepaid and other assets of $97.1 million and a decrease in deferred rent, derivative and other liabilities of $99.9 million.
Net cash used in investing activities for the year ended December 31, 2014 was $2.6 billion, primarily related to the total cash consideration of $756.2 million for the ARCT IV Merger, Cole Merger and CCPT Merger and $3.5 billion in the acquisition of 1,107 properties. The net cash used in investing activities was partially offset by the proceeds from the sale of properties of $1.6 billion, combined with the proceeds from the sale of investment securities of $159.8 million.
Net cash provided by financing activities was $2.4 billion during the year ended December 31, 2014 related to proceeds from the issuance of corporate bonds of $2.5 billion, proceeds from mortgage notes payable of $1.0 billion and proceeds from the issuance of common stock of $1.6 billion. These inflows were partially offset by payments on mortgage notes payable of $1.1 billion, total distributions paid of $920.3 million and $116.4 million of deferred financing cost payments.
68
Cash Flows for the year ended December 31, 2013
During the year ended December 31, 2013, net cash used in operating activities was $11.9 million. The level of cash flows used in or provided by operating activities is affected by acquisition and transaction costs, the timing of interest payments, as well as the receipt of scheduled rent payments. Cash flows used in operating activities during the year ended December 31, 2013 were mainly due to an adjusted net loss of $57.7 million (net loss of $507.8 million adjusted for non-cash items, including the issuance of OP Units, depreciation and amortization, amortization of deferred financing costs, equity based compensation, loss on held for sale properties, loss on derivative instruments and gain on sale on investments of $450.2 million, in the aggregate), and a decrease in deferred costs and other assets of $19.9 million, offset by an increase in amounts due to affiliates of $43.8 million and an increase in accounts payable and accrued expenses of $20.8 million.
Net cash used in investing activities for the year ended December 31, 2013 was $4.5 billion, primarily related to the acquisition of 1,739 properties with an aggregate purchase price of $3.5 billion, the purchase of investment securities of $81.6 million, and the investment in direct financing leases of $68.6 million, partially offset by the proceeds from the sales of investment securities of $119.5 million.
Net cash provided by financing activities of $4.3 billion during the year ended December 31, 2013 related to proceeds net of offering-related costs from the issuance of common stock of $2.0 billion, proceeds net of repayments from our credit facilities of $1.7 billion, $967.8 million and $30.9 million of contributions from our affiliate. These inflows were partially offset by common stock repurchases of $359.2 million, $101.2 million of deferred financing cost payments, total distributions paid of $234.9 million, and distributions to non-controlling interest holders of $8.2 million.
Cash Flows for the Year Ended December 31, 2012
During the year ended December 31, 2012, net cash provided by operating activities was $9.4 million. The level of cash flows used in or provided by operating activities is affected by acquisition and transaction costs, the timing of interest payments, as well as the receipt of scheduled rent payments. Cash flows provided by operating activities during the year ended December 31, 2012 was primarily due to an increase in adjusted net income of $2.7 million (net loss of 42.2 million adjusted for non-cash items, the most significant of which were depreciation and amortization expense and equity-based compensation, which totaled $44.4 million, in the aggregate). Cash inflows included an increase in accounts payable and accrued expenses of $8.3 million and in increase in deferred rent and other liabilities of $3.5 million, partially offset by an increase in prepaid and other assets of $5.1 million.
Net cash used in investing activities for the year ended December 31, 2012 was $1.7 billion, primarily related to an increase in investment in real estate assets paid for with cash of $1.7 billion and the purchase of investment securities of $41.7 million.
Net cash provided by financing activities of $2.0 billion during the year ended December 31, 2012 primarily related to cash inflows from the issuances of stock and debt, most notably $1.7 billion of proceeds net of offering-related costs from the issuance of common and preferred stock, $229.8 million of proceeds from mortgage notes payable and $82.3 million of proceeds from our senior secured revolving credit facility. These inflows were partially offset by cash outflows, most notably by total distributions paid of $38.3 million and payments related to deferred financing costs of $14.0 million.
Election as a REIT
We elected to be taxed as a REIT under Sections 856 through 860 of the Code commencing with the taxable year ended December 31, 2011. If we continue to qualify for taxation as a REIT, we generally will not be subject to federal corporate income tax to the extent we distribute our REIT taxable income to our stockholders, and so long as we distribute at least 90% of our REIT taxable income, computed without regard to the dividends paid deduction and excluding net capital gain. REITs are subject to a number of other organizational and operational requirements. Even if we qualify for taxation as a REIT, we may be subject to certain state and local taxes on our income and property, federal income taxes on certain income and excise taxes on our undistributed income. We believe we are organized and operating in such a manner as to qualify to be taxed as a REIT for the taxable year ended December 31, 2014.
Inflation
We may be adversely impacted by inflation on any leases that do not contain indexed escalation provisions. However, net leases that require the tenant to pay its allocable share of operating expenses, including common area maintenance costs, real estate taxes and insurance may reduce our exposure to increases in costs and operating expenses resulting from inflation.
Related Party Transactions and Agreements
In the past, we entered into certain agreements and paid certain fees or reimbursements to ARC, the Former Manager and their affiliates. As of December 31, 2014, as a result of the resignations of certain executive officers (one of whom was a director) earlier in the fourth quarter, the Former Manager and its affiliates were no longer affiliated with the Company.
69
The Audit Committee Investigation identified certain payments made by the Company to the Former Manager and its affiliates that were not sufficiently documented or that otherwise warrant scrutiny. In November 2014, as a result of the Audit Committee Investigation, the Company terminated a lease agreement with an affiliate of its Former Manager for space in a building in Newport, Rhode Island. The Company, which never occupied the building, was reimbursed for certain leasehold improvements and other costs by delivery of 916,423 OP Units valued at $8.5 million, which were retired. The Company is considering whether it has a right to seek recovery for any other such payments and , if so, its alternatives for seeking recovery. No asset has been recognized in the accompanying consolidated financial statements related to any potential recovery. See Note 20 – Related Party Transactions and Arrangements to our consolidated financial statements in this report for further discussion.
We are contractually responsible for managing the Managed REITs’ affairs on a day-to-day basis, identifying and making acquisitions and investments on the Managed REITs’ behalf, and recommending to each of the Managed REIT’s respective board of directors an approach for providing investors with liquidity. In addition, we distribute the shares of common stock for certain of the Managed REITs and advise them regarding offerings, manage relationships with participating broker-dealers and financial advisors, and provide assistance in connection with compliance matters relating to the offerings. We receive compensation and reimbursement for services relating to the Managed REITs’ offerings and the investment, management and disposition of their respective assets, as applicable. See Note 20 – Related Party Transactions and Arrangements to our consolidated financial statements in this report for a further explanation of the various related party transactions, agreements and fees.
Off-Balance Sheet Arrangements
We have no material off-balance sheet arrangements that have had or are reasonably likely to have a current or future effect on our financial condition, changes in financial condition, revenues or expenses, results of operations, liquidity, capital expenditures or capital resources.
Item 7A. Quantitative and Qualitative Disclosures About Market Risk.
The market risk associated with financial instruments and derivative financial instruments is the risk of loss from adverse changes in market prices or interest rates. Our market risk arises primarily from interest rate risk relating to variable-rate borrowings. To meet our short and long-term liquidity requirements, we borrow funds at a combination of fixed and variable rates. Our interest rate risk management objectives are to limit the impact of interest rate changes in earnings and cash flows and to lower our overall borrowing costs. To achieve these objectives, from time to time, we may enter into interest rate hedge contracts such as swaps, collars and treasury lock agreements in order to mitigate our interest rate risk with respect to various debt instruments. We would not hold or issue these derivative contracts for trading or speculative purposes. We do not have any foreign operations and thus we are not exposed to foreign currency fluctuations.
As of December 31, 2014, our debt included fixed-rate debt, including debt that has interest rates that are fixed with the use of derivative instruments, with a fair and carrying value of $8.7 billion and $8.4 billion, respectively. Changes in market interest rates on our fixed rate debt impact fair value of the debt, but they have no impact on interest incurred or cash flow. For instance, if interest rates rise 100 basis points and our fixed rate debt balance remains constant, we expect the fair value of our debt to decrease, the same way the price of a bond declines as interest rates rise. The sensitivity analysis related to our fixed-rate debt assumes an immediate 100 basis point move in interest rates from their December 31, 2014 levels, with all other variables held constant. A 100 basis point increase in market interest rates would result in a decrease in the fair value of our fixed rate debt by $314.5 million. A 100 basis point decrease in market interest rates would result in an increase in the fair value of our fixed-rate debt by $356.9 million.
As of December 31, 2014, our debt included variable-rate debt with an aggregate fair value and carrying value of $2.1 billion and $2.2 billion, respectively. The sensitivity analysis related to our variable-rate debt assumes an immediate 100 basis point move in interest rates from their December 31, 2014 levels, with all other variables held constant. A 100 basis point increase or decrease in variable interest rates on our variable-rate notes payable would increase or decrease our interest expense by $21.8 million annually.
As the information presented above includes only those exposures that existed as of December 31, 2014, it does not consider exposures or positions arising after that date. The information represented herein has limited predictive value. Future actual realized gains or losses with respect to interest rate fluctuations will depend on cumulative exposures, hedging strategies employed and the magnitude of the fluctuations.
These amounts were determined by considering the impact of hypothetical interest rate changes on our borrowing costs, and, assume no other changes in our capital structure.
70
Item 8. Financial Statements and Supplementary Data.
The information required by Item 8 is hereby incorporated by reference to our consolidated financial statements beginning on page F-1 of this document.
Item 9. Changes in and Disagreements with Accountants on Accounting and Financial Disclosure.
None.
Item 9A. Controls and Procedures.
I. Discussion of Controls and Procedures of ARCP
For purposes of the discussion in this Part I of Item 9A, the “Company” refers to ARCP.
Background
On March 2, 2015, reflecting the findings of the Audit Committee Investigation, as well as a review performed by the Company’s new management, the Company restated and amended its previously-issued consolidated financial statements and related financial information as of and for the fiscal years ended December 31, 2013 and 2012 and the fiscal periods ended March 31, 2014 and 2013, June 30, 2014 and 2013 and September 30, 2013. As previously disclosed, the Company’s new management re-evaluated the Company’s internal control over financial reporting and its disclosure controls and procedures and concluded that they were not effective at December 31, 2013 due to certain material weaknesses. These material weaknesses had not been remediated, and additional weaknesses in our internal control over financial reporting existed, at March 31, 2014, June 30, 2014 and September 30, 2014. In addition, at those dates, our disclosure controls and procedures were not effective. Although during the fourth quarter of 2014 the Company’s prior senior management resigned and new management commenced taking remedial actions, the existing material weaknesses had not been remediated at December 31, 2014. As discussed below, the Company is committed to remediating the material weaknesses as promptly as possible. Implementation of the Company’s remediation plans is being overseen by the Audit Committee.
For information concerning the findings of the Audit Committee Investigation, see the Explanatory Note at the beginning of any of the following reports: Amendment No. 2 to the Company’s Annual Report on Form 10-K/A for the fiscal year ended December 31, 2013 or the Company’s Quarterly Report on Form 10-Q/A for the fiscal period ended March 31, 2014 or June 30, 2014.
Evaluation of Disclosure Controls and Procedures
Management, under the supervision of our Interim Chief Executive Officer and our Chief Financial Officer, evaluated the effectiveness of the Company’s disclosure controls and procedures (as defined in §240.13a-15(e) or 240.15d-15(e) of the Securities Exchange Act of 1934 (the “Exchange Act”)) and, based on that evaluation, our Interim Chief Executive Officer and our Chief Financial Officer concluded that the Company’s disclosure controls and procedures were not effective at December 31, 2014 as a result of the matters discussed under “Material Weaknesses in Disclosure Controls and Procedures” below.
Management’s Report on Internal Control over Financial Reporting
Management is responsible for establishing and maintaining adequate internal control over financial reporting of the Company. Management assessed the Company’s internal control over financial reporting (as defined in §240.13a-15(f) or 240.15d-15(f) of the Exchange Act) under the criteria set forth by the Committee of Sponsoring Organizations of the Treadway Commission in the Internal Control – Integrated Framework (2013) and concluded that the Company’s internal control over financial reporting was not effective as of December 31, 2014 as a result of the matters discussed under “Material Weaknesses in Internal Control over Financial Reporting” below.
Material Weaknesses
Material Weaknesses in Disclosure Controls and Procedures. At December 31, 2014, the Company’s disclosure controls and procedures were not properly designed or implemented to ensure that the information contained in the Company’s periodic reports and other SEC filings correctly reflected the information contained in the Company’s accounting records and other supporting information and, in the case of AFFO per share (a non-GAAP measure that is an important industry metric), was correctly calculated. In addition, the Company did not have appropriate controls to ensure that its SEC filings were reviewed on a timely basis by senior management or that significant changes to amounts or other disclosures contained in a document that had previously been reviewed and approved by the Audit Committee were brought to the attention of the Audit Committee or its Chair for review and approval before the document was filed with the SEC. Finally, the Company did not have appropriate controls over the formulation of AFFO
71
per share guidance or the periodic re-assessment of the Company’s ability to meet its guidance.
Material Weaknesses in Internal Control over Financial Reporting. Under standards established by the Public Company Accounting Oversight Board, a material weakness is defined as a deficiency, or a combination of deficiencies, in internal control over financial reporting such that there is a reasonable possibility that a material misstatement of our annual or interim financial statements will not be prevented or detected on a timely basis.
During 2013, due in part to a number of large portfolio acquisitions, the Company experienced significant growth and increases in the complexity of its financial reporting and number of non-routine transactions. In late 2013 and early in the first quarter of 2014, as a result of the anticipation and then completion of the Company’s transition from management by the Former Manager to self-management and the Company’s acquisitions of ARCT IV and Cole, the complexity of the Company’s transactions and the need for accounting judgments and estimates became more prevalent and had a severe impact on the Company’s control environment. The following material weaknesses in the Company’s internal control over financial reporting existed at December 31, 2014:
Control Environment – The Company failed to implement and maintain an effective internal control environment that had appropriate processes to manage the changes in business conditions resulting from the volume and complexity of its 2013 and first quarter 2014 transactions, combined with the pressure of market expectations inherent in announcing AFFO per share guidance for 2014.
The control environment, as part of the internal control framework, sets the tone of an organization, influencing the control consciousness of its people and providing discipline and structure. Among the deficiencies in the control environment were failures to:
| • | Emphasize the importance of adherence to the Company’s Code of Business Conduct and Ethics; |
| • | Establish appropriate policies and procedures surrounding the accounting treatment and classification of merger-related expenses, goodwill, impairments and purchase accounting; |
| • | Establish controls designed to prevent changes to the financial statements and supporting financial information by senior management without the proper levels of review, support and approval; and |
| • | Establish controls designed to ensure that accounting employees would not be subject to pressure to make inappropriate decisions affecting the financial statements and/or the financial statement components of the calculation of AFFO, and that accounting concerns raised by employees would be timely and appropriately addressed by senior management. |
Related Party Transactions and Conflicts of Interest – The Company did not maintain the appropriate controls to assess, authorize and monitor related party transactions, validate the appropriateness of such transactions or, manage the risks arising from contractual relationships with affiliates. Without the appropriate controls, the Company made certain payments to the Former Manager and its affiliates that were not sufficiently documented or that otherwise warrant scrutiny.
Equity-Based Compensation – The Company did not maintain appropriate controls over various grants of equity-based compensation. In the fourth quarter of 2013, in anticipation of the Company’s transition to self-management, the Company entered into employment agreements with the Company’s former Executive Chairman and Chief Executive Officer and its former Chief Financial Officer (which took effect on January 8, 2014), and also approved the 2014 Multi-Year Outperformance Plan pursuant to which awards were made to them on January 8, 2014. Without the appropriate controls, these documents contained terms that were inconsistent with the terms authorized by the Compensation Committee. Additionally, the Company did not obtain copies of or administer the equity awards made by means of block grants allocated by the Former Manager and its affiliates, nor did it review the awards for consistency with the Compensation Committee’s authorization.
Accounting Close Process – The Company did not have consistent policies and procedures throughout its offices relating to purchase accounting, accounting for gain or loss on disposition and testing for impairment. In addition, senior management did not establish clear reporting lines and job responsibilities, or promote accountability over business process control activities.
Critical Accounting Estimates and Non-Routine Transactions – The Company did not maintain effective controls or develop standardized policies and procedures for critical accounting estimates and non-routine transactions, including management review and approval of the accounting treatment of all critical and significant estimates on a periodic basis.
Cash Reconciliations and Monitoring – The Company did not implement appropriate controls to record payments received and to reconcile its cash receipts and bank accounts on a timely basis.
Information Technology General Controls – Access, Authentication and Information Technology Environment – The Company did not maintain effective information technology environmental and governance controls, including controls over information systems security administration and management functions in the following areas: (a) granting and revoking user access rights; (b) timely notification of user departures; (c) periodic review of appropriateness of access rights; (d) physical access
72
restrictions; and (e) segregation of duties.
Information Technology General Controls Over Management of Third Party Service Providers – When the transition services agreement between the Company and the Former Manager was terminated on January 8, 2014, the Company did not enter into a follow-on formal agreement with the affiliate of the Former Manager that managed technology infrastructure and systems significant to the Company’s financial reporting process. Without a formal agreement governing the delivery of services, the Company’s management cannot make any assertions about the operating effectiveness of the third party service provider’s controls over information systems, programs, data and processes financially significant to the Company or the security of the Company’s data under the control of the related third party service provider.
Attestation Report of Our Independent Registered Public Accounting Firm
Grant Thornton LLP, our independent registered public accounting firm that audited the Company’s financial statements included in this Annual Report on Form 10-K, has issued an attestation report on the Company’s internal control over financial reporting, which appears on page 77 of this Annual Report on Form 10-K.
Remediation
As discussed below, the Company is actively engaged in improving its disclosure controls and procedures and internal control over financial reporting. The Company’s new senior management will report on a quarterly basis to the Audit Committee and, where applicable, to the other Committees of the Board of Directors as to the progress made in remediating the material weaknesses identified above.
Control Environment – During the fourth quarter of 2014, the Company underwent a change in senior leadership as a result of the resignations of the Company’s Executive Chairman of the Board, Chief Executive Officer and director, President and Chief Operating Officer, Chief Financial Officer and Chief Accounting Officer. On October 28, 2014, the Board of Directors appointed Michael J. Sodo as the Company’s Chief Financial Officer and Gavin B. Brandon as the Company’s Chief Accounting Officer. On December 15, 2014, William G. Stanley, who had been serving as the Company’s Lead Independent Director, became Interim Chairman of the Board and Interim Chief Executive Officer pending completion of the Board’s search, with the assistance of an independent search firm, for a new non-executive Chairman of the Board and a new permanent Chief Executive Officer.
The Audit Committee, the Board of Directors and new senior leadership are committed to establishing a culture of compliance, integrity and transparency and have begun communicating their commitment and expectations to all employees of Company. This commitment was an important consideration in the Board of Directors’ selection of Glenn J. Rufrano to serve as the Company’s new Chief Executive Officer and a director effective April 1, 2015 and will also be an important consideration in its selection of a new independent Chairman of the Board. On March 10, 2015, the Company announced that with the Restatement completed, the Company expecting to file this report by the end of March 2015 and the appointment of a new Chief Executive Officer, two of the Company’s directors, Leslie D. Michelson and Edward G. Rendell, decided that it was the right time to step down from the Board, effective April 1, 2015, to make way for new directors. In addition to a new non-executive Chairman, the Board is in the process of recruiting two other new independent directors, which will result in a seven-member Board. The decision about re-nomination of the other existing directors for election at the 2015 annual meeting will be made by the disinterested members of the reconstituted Board.
The Board of Directors, with the assistance of outside counsel, has commenced a comprehensive review of its key practices and procedures. This review will include, among other things, the nature, transparency and timeliness of information provided to the Board of Directors by management, the agenda-setting process, the process by which the Board of Directors oversees the Company’s risk management functions and the roles and responsibilities, charters, key practices and procedures of the committees of the Board of Directors. As an outgrowth of this review, in late December 2014, the Board of Directors adopted a new related person transactions policy and assigned the administration of this policy to the Nominating and Corporate Governance Committee.
Under the Audit Committee’s oversight, management has commenced a comprehensive review of corporate compliance policies and programs and is initiating periodic Company-wide training on ethics, reporting procedures and other key topics as well as a review of the Company’s whistleblower hotline policies and procedures.
The Company is also in the process of strengthening its controls in a number of areas highlighted by the Audit Committee investigation, as follows:
| • | Adding additional layers of review of the Company’s significant accounting policies and estimates, including the bonus accrual process; |
| • | Improving the controls around decisions on whether or not to reflect certain accounting adjustments in the Company’s books and records and/or to report such adjustments within financial statements, by revising its policies, implementing additional review and training all accounting personnel on the revised policies; |
73
| • | Adopting new accounting policies that incorporate technical accounting guidance as to when expenses may be appropriately classified as merger-related expenses, and conducting training on the implementation of this policy with relevant members of its accounting staff; and |
| • | Adopting new practices surrounding the calculation and presentation of AFFO and the formulation and review of AFFO guidance. |
Financial Reporting Disclosure Controls – Under the oversight of the Audit Committee, the Company is in the process of creating a chartered Disclosure Committee to be comprised of senior attorneys, accounting personnel and executives and heads of other pertinent firm-wide disciplines. The Chair of the Disclosure Committee will have ongoing dialogue with the Audit Committee and the Board of Directors on how the Disclosure Committee is fulfilling its mandate to ensure the timeliness, accuracy, completeness and quality of the Company’s SEC filings and other public disclosures. The Disclosure Committee will be responsible for establishing and administering a process by which certain personnel in relevant functions and areas will be required to provide sub-certifications in support of the certifications that the Company’s principal executive and principal financial officers are required to provide in connection with each periodic SEC report. Processes will be implemented to help plan appropriately for quarterly financial reporting as well as securities offerings.
Additionally, at the direction of the Audit Committee, the Company is enhancing and formalizing the procedures for the review and approval of annual and quarterly SEC reports (some of which were previously less formal) as follows:
| • | Drafts of reports will be circulated sufficiently in advance of Audit Committee meetings to permit adequate review; |
| • | Audit Committee meetings will be attended in person to the extent practicable and, in addition to Audit Committee members, required attendees will include the Chief Financial Officer, Chief Accounting Officer, General Counsel, Chair of the Disclosure Committee, head of Internal Audit, independent auditors and outside legal counsel as necessary; |
| • | At Audit Committee meetings, in addition to required communications from the independent auditors, reports will be made by the Chief Accounting Officer and the Chair of the Disclosure Committee on significant changes from prior filings, significant judgments reflected in the report and receipt of sub-certifications; |
| • | At Audit Committee meetings, separate executive sessions will be held with the independent auditor, head of Internal Audit, General Counsel and others as necessary; and |
| • | Any changes to a draft of a periodic report that has been approved by the Audit Committee must be submitted to and reviewed and approved by the Chair of the Audit Committee prior to filing. |
Related Party Transactions and Conflicts of Interest – The resignation of the members of senior management affiliated with the Former Manager has eliminated certain conflicts of interest that existed prior to such resignations.
The Audit Committee Investigation identified certain payments made by the Company to the Former Manager or its affiliates that were not sufficiently documented or otherwise require scrutiny. In November 2014, as a result of the Audit Committee Investigation, the Company terminated a lease agreement with an affiliate of its Former Manager for space in a building in Newport, Rhode Island. The Company, which never occupied the building, was reimbursed for certain leasehold improvements and other costs by delivery of 916,423 OP Units valued at $8.5 million, which were retired. The Company is considering whether it has a right to seek recovery for any other such payments and, if so, its alternatives for seeking recovery. No asset has been recognized in the financial statements related to any potential recovery.
The Company is working closely with outside counsel to terminate its remaining relationships with affiliates of its Former Manager, including ARC and RCAP, and to disentangle its internal control framework from the affiliated entities. The Company is seeking to obtain copies of all of its books and records held by ARC and to eliminate all human resource, information technology and other overlapping departmental services.
The Company has also enhanced the procedures for review and approval of potential related party transactions with directors, director nominees, executive officers, 5% shareholders and their immediate family members through the adoption of a new related party transactions policy administered by the Nominating and Corporate Governance Committee. The Nominating and Corporate Governance Committee will annually assess the use and effectiveness of the policy.
Equity-Based Compensation – The Company has obtained copies from ARC of all equity awards made by means of block grants allocated by the Former Manager or its affiliates and has sought to assume administration of those awards. In addition, the Company will review these equity awards for consistency with Compensation Committee authorization.
Under the Compensation Committee’s oversight, the Company is implementing new governance processes for the authorization, documentation, issuance, administration and accounting for equity-based compensation. The Compensation Committee will approve each award, rather than delegating authority to management to allocate large tranches of awards. In-house
74
counsel, accounting, tax, and human resources personnel will work together to oversee the issuance of equity compensation to directors, officers and employees. Equity compensation tracking and recordkeeping will be improved through the use of equity tracking software. All compensation matters within the Compensation Committee’s purview will be reviewed by the Compensation Committee Chair and in-house counsel against the Compensation Committee’s authorization to ensure consistency and appropriate documentation. In respect of all other employment matters, the human resources department will consult in-house counsel before making any offer of employment or any compensation adjustment that includes any equity award or otherwise raises equity compensation issues.
Accounting Close Process – The Company has begun to standardize its internal accounting close process and intends to complete the integration of its accounting and financial reporting processes among its various offices. Toward this end, the Company has documented, and intends to continue to document, its key and significant operational activities and accounting policies and procedures. In addition, the Company has designed and implemented internal controls within its accounting close process to ensure that closing activities, such as reconciliations, timely reviews, journal entry reviews and comprehensive financial analysis, are performed and reviewed. The Company intends to create a financial reporting sub-certification process and is defining key roles and responsibilities within the organizational structure. Lastly, the Company has conducted trainings, and will conduct additional trainings, for its accounting and other professionals to ensure the accounting close processes and entity level and company level controls and procedures are well defined, documented and implemented to support operational effectiveness.
Critical Accounting Estimates and Non-Routine Transactions – The Company has documented various critical accounting policies, and intends to continue to document new accounting policies and to update its existing documentation for any noted changes on a timely basis. New policies have been communicated to the relevant Company employees. The Company has also established a process under which senior management approves all critical accounting estimates and non-routine transactions on a periodic basis as part of the financial close and reporting processes.
Cash Reconciliations and Monitoring – The Company has documented treasury and accounting policies and procedures, implemented controls over the monitoring and reconciliation of cash accounts and plans to review all bank accounts associated with the Company. In addition, the Company has established roles and responsibilities to monitor and account for its various bank accounts.
Information Technology General Controls – Access, Authentication and IT Environment – The Company has implemented an access management system to govern the granting and revocation of user access rights and standardized the administration of access to financially significant systems within the information technology organization. The system maintains a database of access grants and a record of business approvals. The controls governing access to programs and data have been updated to reflect the use of the access management system. The Company has trained business approvers, managers, information technology staff, and human resources staff on the revised controls and their respective roles and responsibilities within each control. The process for managing and conducting the periodic system access reviews has been standardized across all systems. Periodic access reviews will be managed by the Information Technology department to ensure adherence to the control standard.
Information Technology General Controls Over Management of Third Party Service Providers – Executive management responsible for this directive is no longer with the Company. The Company is working to complete the integration of systems, offices and business processes so as to remove the dependencies on the formerly affiliated party service provider as soon as possible. The Company is also establishing a control framework to ensure all service providers have the appropriate contracts and service level agreements in place prior to initiation of any services.
Changes in Internal Control over Financial Reporting
During the three months ended December 31, 2014, there were no changes in our internal control over financial reporting, that have materially affected, or were reasonably likely to materially affect, our internal control over financial reporting, other than ongoing integration activities relating to the Company’s acquisitions of large portfolios in 2013, and of ARCT IV and Cole Real Estate Investments, Inc. in the first quarter of 2014 and the remediation efforts described above.
II. Discussion of Controls and Procedures of the Operating Partnership
In the information incorporated by reference into this Part II of Item 9A, the term “Company” refers to the Operating Partnership, except as the context otherwise requires.
Background
On March 2, 2015, reflecting the findings of the Audit Committee Investigation, as well as a review performed by the General Partner’s new management, the Operating Partnership restated and amended its previously-issued consolidated financial statements and related financial information as of and for the fiscal years ended December 31, 2013 and 2012 and the fiscal
75
periods ended June 30, 2014 and 2013.
Evaluation of Disclosure Controls and Procedures
Management of the General Partner, under the supervision of its Interim Chief Executive Officer and its Chief Financial Officer, evaluated the effectiveness of the Operating Partnership’s disclosure controls and procedures (as defined in §240.13a-15(e) or 240.15d-15(e) of the Exchange Act) and, based on that evaluation, the General Partner’s Interim Chief Executive Officer and the General Partner’s Chief Financial Officer concluded that the Operating Partnership’s disclosure controls and procedures were not effective at December 31, 2014 as a result of the matters discussed under “Material Weaknesses in Disclosure Controls and Procedures” in Part I of this Item 9A above.
Management’s Report on Internal Control over Financial Reporting
Management of the General Partner is responsible for establishing and maintaining adequate internal control over financial reporting of the Operating Partnership. Management of the General Partner assessed the Operating Partnership’s internal control over financial reporting (as defined in §240.13a-15(f) or 240.15d-15(f) of the Exchange Act) under the criteria set forth by the Committee of Sponsoring Organizations of the Treadway Commission in the Internal Control - Integrated Framework (2013) and concluded that the Operating Partnership’s internal control over financial reporting was not effective as of December 31, 2014 as a result of the matters discussed under “Material Weaknesses in Internal Control over Financial Reporting” in Part I of this Item 9A above.
Material Weaknesses
The information under the heading “Material Weaknesses” in Part I of this Item 9A is incorporated herein by reference.
Remediation
The information under the heading “Remediation” in Part I of this Item 9A is incorporated herein by reference.
Changes in Internal Control over Financial Reporting
The information under the heading “Changes in Internal Control over Financial Reporting” in Part I of this Item 9A is incorporated herein by reference.
76
REPORT OF INDEPENDENT REGISTERED PUBLIC ACCOUNTING FIRM
Board of Directors and Shareholders
American Realty Capital Properties, Inc.
We have audited the internal control over financial reporting of American Realty Capital Properties, Inc. (a Maryland corporation) and subsidiaries (the “Company”) as of December 31, 2014, based on criteria established in the 2013 Internal Control-Integrated Framework issued by the Committee of Sponsoring Organizations of the Treadway Commission (COSO). The Company’s management is responsible for maintaining effective internal control over financial reporting and for its assessment of the effectiveness of internal control over financial reporting, included in the accompanying Management’s Report on Internal Control Over Financial Reporting (“Management’s Report”) presented in Part I of Item 9A, “Controls and Procedures.” Our responsibility is to express an opinion on the Company’s internal control over financial reporting based on our audit.
We conducted our audit in accordance with the standards of the Public Company Accounting Oversight Board (United States). Those standards require that we plan and perform the audit to obtain reasonable assurance about whether effective internal control over financial reporting was maintained in all material respects. Our audit included obtaining an understanding of internal control over financial reporting, assessing the risk that a material weakness exists, testing and evaluating the design and operating effectiveness of internal control based on the assessed risk, and performing such other procedures as we considered necessary in the circumstances. We believe that our audit provides a reasonable basis for our opinion.
A company’s internal control over financial reporting is a process designed to provide reasonable assurance regarding the reliability of financial reporting and the preparation of financial statements for external purposes in accordance with generally accepted accounting principles. A company’s internal control over financial reporting includes those policies and procedures that (1) pertain to the maintenance of records that, in reasonable detail, accurately and fairly reflect the transactions and dispositions of the assets of the company; (2) provide reasonable assurance that transactions are recorded as necessary to permit preparation of financial statements in accordance with generally accepted accounting principles, and that receipts and expenditures of the company are being made only in accordance with authorizations of management and directors of the company; and (3) provide reasonable assurance regarding prevention or timely detection of unauthorized acquisition, use, or disposition of the company’s assets that could have a material effect on the financial statements.
Because of its inherent limitations, internal control over financial reporting may not prevent or detect misstatements. Also, projections of any evaluation of effectiveness to future periods are subject to the risk that controls may become inadequate because of changes in conditions, or that the degree of compliance with the policies or procedures may deteriorate.
A material weakness is a deficiency, or combination of control deficiencies, in internal control over financial reporting, such that there is a reasonable possibility that a material misstatement of the company’s annual or interim financial statements will not be prevented or detected on a timely basis. The following material weaknesses have been identified and included in management’s assessment.
| • | A material weakness related to the Company’s failure to implement and maintain an effective internal control environment. |
| • | A material weakness related to the Company’s failure to maintain controls associated with related party transactions and risks arising from contractual arrangements with affiliates. |
| • | A material weakness related to the Company’s failure to maintain controls related to stock based compensation, including documentation of key terms of awards and the administration of certain restricted stock awards. |
| • | A material weakness related to the Company’s failure to establish appropriate policies, procedures and controls in the internal control environment, including those related to the accounting close process, critical accounting estimates and non-routine transactions. |
| • | A material weakness related to the Company’s failure to monitor and reconcile cash. |
| • | A material weakness related to the Company’s failure to maintain effective information technology environmental and governance controls, including management of system access and third party service providers. |
In our opinion, because of the effect of the material weakness described above on the achievement of the objectives of the control criteria, the Company has not maintained effective internal control over financial reporting as of December 31, 2014, based on criteria established in the 2013 Internal Control-Integrated Framework issued by COSO.
We do not express an opinion or any other form of assurance on management’s statements referring to “Material Weaknesses in Disclosure Controls and Procedures,” the “Material Weaknesses in Internal Control over Financial Reporting – Control
77
Environment” as it relates to pressure surrounding decisions affecting the calculation of AFFO, and “Remediation” included in Management’s Report.
We also have audited, in accordance with the standards of the Public Company Accounting Oversight Board (United States), the consolidated financial statements of the Company as of and for the year ended December 31, 2014. The material weaknesses identified above were considered in determining the nature, timing, and extent of audit tests applied in our audit of the 2014 consolidated financial statements, and this report does not affect our report dated March 30, 2015, which expressed an unqualified opinion on those financial statements.
/s/ GRANT THORNTON LLP
Phoenix, Arizona
March 30, 2015
78
Item 9B. Other Information.
None.
79
PART III
Item 10. Directors, Executive Officers and Corporate Governance.
The information required by this Item is expected to be filed by amendment prior to April 30, 2015.
Item 11. Executive Compensation.
The information required by this Item is expected to be filed by amendment prior to April 30, 2015.
Item 12. Security Ownership of Certain Beneficial Owners and Management and Related Stockholder Matters.
The information required by this Item is expected to be filed by amendment prior to April 30, 2015.
Item 13. Certain Relationships and Related Transactions, and Director Independence.
The information required by this Item is expected to be filed by amendment prior to April 30, 2015.
Item 14. Principal Accounting Fees and Services.
The information required by this Item is expected to be filed by amendment prior to April 30, 2015.
80
PART IV
Item 15. Exhibit Index.
The following documents are filed as part of this Annual Report on Form 10-K:
| Exhibit No. | Description | |
2.1 (1) | Agreement and Plan of Merger by and among American Realty Capital Properties, Inc., ARC Properties Operating Partnership, L.P., Tiger Acquisition LLC, American Realty Capital Trust III, Inc. and American Realty Capital Operating Partnership III, L.P., dated as of December 14, 2012** | |
2.2 (7) | Agreement and Plan of Merger, by and among, American Realty Capital Properties, Inc., ARC Properties Operating Partnership, L.P., Safari Acquisition, LLC, CapLease, Inc., CapLease, LP and CLF OP General Partner LLC, dated as of May 28, 2013.** | |
2.3 (8) | Purchase and Sale Agreement, by and among, CNL APF Partners, LP and Certain Affiliates as Seller Parties, and ARC Properties Operating Partnership, L.P., as Purchaser, dated May 31, 2013.** | |
2.4 (10) | Agreement and Plan of Merger, dated as of July 1, 2013, among American Realty Capital Properties, Inc., American Realty Capital Trust IV, Inc., Thunder Acquisition, LLC, ARC Properties Operating Partnership, L.P. and American Realty Capital Operating Partnership IV, L.P.** | |
2.4.1 (15) | Amendment dated as of October 6, 2013 to the Agreement and Plan of Merger, dated as of July 1, 2013, by and among American Realty Capital Properties, Inc., ARC Properties Operating Partnership, L.P., Thunder Acquisition, LLC, American Realty Capital Trust IV, Inc. and American Realty Capital Operating Partnership IV, L.P. | |
2.4.2 (22) | Second Amendment dated as of October 11, 2013 to the Agreement and Plan of Merger, dated as of July 1, 2013, by and among American Realty Capital Properties, Inc., ARC Properties Operating Partnership, L.P., Thunder Acquisition, LLC, American Realty Capital Trust IV, Inc. and American Realty Capital Operating Partnership IV, L.P. | |
2.5 (14) | Equity Interest Purchase Agreement by and between Inland American Real Estate Trust, Inc. and AR Capital, LLC, dated as of August 8, 2013. ** | |
2.6 (16) | Purchase and Sale Agreement by and among ARC PADRBPA001, LLC and AR Capital, LLC and the sellers described on schedules thereto, dated as of July 24, 2013. ** | |
2.7 (17) | Agreement and Plan of Merger, dated as of October 22, 2013, by and among American Realty Capital Properties, Inc., Cole Real Estate Investments, Inc. and Clark Acquisition, LLC.** | |
3.1 (2) | Articles of Amendment and Restatement of American Realty Capital Properties, Inc. | |
3.2 (3) | Bylaws of American Realty Capital Properties, Inc. | |
3.3 (4) | Articles Supplementary Relating to the Series A Convertible Preferred Stock of American Realty Capital Properties, Inc., dated May 10, 2012. | |
3.4 (5) | Articles Supplementary Relating to the Series B Convertible Preferred Stock of American Realty Capital Properties, Inc., dated July 24, 2012. | |
3.5 (9) | Articles Supplementary for the Series C Convertible Preferred Stock of American Realty Capital Properties, Inc., dated June 6, 2013. | |
3.6 (11) | Articles of Amendment to Articles of Amendment and Restatement of American Realty Capital Properties, Inc., effective July 2, 2013. | |
3.7 (21) | Articles Supplementary for the Series D Cumulative Convertible Preferred Stock of American Realty Capital Properties, Inc., filed November 8, 2013. | |
3.8 (24) | Articles of Amendment to Articles of Amendment and Restatement of American Realty Capital Properties, Inc., filed with the SDAT on December 9, 2013. | |
3.9 (25) | Articles Supplementary to the Articles of Incorporation of American Realty Capital Properties, Inc. classifying and designating the 6.70% Series F Cumulative Redeemable Preferred Stock, dated January 2, 2014. | |
3.10 (27) | Amendment to American Realty Capital Properties, Inc.’s bylaws, effective as of February 7, 2014. | |
3.11 (34) | Amendment No. 2 to American Realty Capital Properties, Inc.’s bylaws, effective December 31, 2014. | |
3.12 (40) | Certificate of Limited Partnership of ARC Properties Operating Partnership, L.P. | |
4.1 (30) | Third Amended and Restated Agreement of Limited Partnership of ARC Properties Operating Partnership, L.P., effective January 3, 2014. | |
4.2 (11) | Indenture, dated as of July 29, 2013, between American Realty Capital Properties, Inc. and U.S. Bank National Association, as trustee. | |
4.3 (11) | First Supplemental Indenture, dated as of July 29, 2013, between American Realty Capital Properties, Inc. and U.S. Bank National Association, as trustee. | |
4.4 (20) | Form of 3.00% Convertible Senior Notes due 2018 (included in Exhibit 4.3). | |
4.5 (19) | Indenture, dated as of October 9, 2007, by and among CapLease, Inc., Caplease, LP, CapLease Debt Funding, LP, CapLease Services Corp., CapLease Credit LLC and Deutsche Bank Trust Company Americas, as trustee. | |
4.6 (19) | Supplemental Indenture, dated as of November 5, 2013, by and among American Realty Capital Properties, Inc., ARC Properties Operating Partnership, L.P., CapLease, Inc., CapLease, LP and Deutsche Bank Trust Company Americas, as trustee. | |
4.7 (19) | Junior Subordinated Indenture, dated as of December 13, 2005, by and between CapLease, LP and The Bank of New York Mellon, as trustee, as successor-in-trust to JPMorgan Chase Bank, National Association. | |
81
| Exhibit No. | Description | |
4.8 (19) | Supplemental Indenture, dated November 5, 2013, by and among ARC Properties Operating Partnership, L.P., CapLease, LP and The Bank of New York Mellon, as trustee, as successor-in-trust to JPMorgan Chase Bank, National Association. | |
4.9 (23) | Second Supplemental Indenture, dated as of December 10, 2013, between American Realty Capital Properties, Inc. and U.S. Bank National Association, as trustee. | |
4.10 (23) | Form of 3.75% Convertible Senior Notes due 2020. | |
4.11 (27) | Indenture, dated as of February 6, 2014, among ARC Properties Operating Partnership, L.P., Clark Acquisition, LLC, the guarantors named therein and U.S. Bank National Association, as trustee. | |
4.12 (27) | Officers’ Certificate, dated as of February 6, 2014. | |
4.13 (27) | Registration Rights Agreement, dated as of February 6, 2014, among ARC Properties Operating Partnership, L.P., Clark Acquisition, LLC, the guarantors named therein, Barclays Capital Inc. and Citigroup Global Markets Inc. | |
10.1 (29) | Amendment and Acknowledgment of Termination of Amended and Restated Management Agreement, entered into as of January 8, 2014, by and among American Realty Capital Properties, Inc. and ARC Properties Advisors, LLC. | |
10.2 (3) | Equity Plan, effective September 5, 2011 of American Realty Capital Properties, Inc. | |
| 10.3* | First Amendment to American Realty Capital Properties, Inc.’s Equity Plan, effective November 12, 2012. | |
| 10.4* | Second Amendment to American Realty Capital Properties, Inc.’s Equity Plan, effective February 28, 2013. | |
10.5 (3) | Director Stock Plan of American Realty Capital Properties, Inc. | |
10.6 (3) | Form of Restricted Stock Award Agreement for Non-Executive Directors. | |
10.7 (3) | Form of Restricted Stock Award Agreement for ARC Properties Advisors, LLC. | |
10.8 (7) | Voting Agreement, dated as of May 28, 2013, by and among American Realty Capital Properties, Inc., Paul H. McDowell, William R. Pollert, Shawn P. Seale, Robert C. Blanz and Paul C. Hughes. | |
10.9 (7) | Management Letter Agreement, dated as of May 28, 2013, among American Realty Capital Properties, Inc., Paul H. McDowell, William R. Pollert, Shawn P. Seale, Robert C. Blanz, Michael J. Heneghan and Paul C. Hughes. | |
10.10 (10) | Letter Agreement, dated as of July 1, 2013, among American Realty Capital Properties, Inc., American Realty Capital Trust IV, Inc., American Realty Capital Operating Partnership IV, L.P., American Realty Capital Trust IV Special Limited Partner, LLC, American Realty Capital Advisors IV, LLC and American Realty Capital Properties IV, LLC. | |
10.11 (10) | Asset Purchase and Sale Agreement, dated as of July 1, 2013, between ARC Properties Operating Partnership, L.P. and American Realty Capital Advisors IV, LLC. | |
10.12 (12) | Augmenting Lender and Increasing Lender Supplement and Incremental Amendment, dated as of March 28, 2013, to the Credit Agreement, among ARC Properties Operating Partnership, L.P., Tiger Acquisition, LLC, American Realty Capital Properties, Inc., the lenders party thereto and Wells Fargo Bank, National Association. | |
10.13 (12) | Third Amendment to Credit Agreement, by and among ARC Properties Operating Partnership, L.P., Tiger Acquisition, LLC, American Realty Capital Properties, Inc., the Lenders party thereto, and Wells Fargo Bank, National Association, dated as of May 28, 2013. | |
10.14 (12) | Fourth Amendment to Credit Agreement, by and among ARC Properties Operating Partnership, L.P., Tiger Acquisition, LLC, American Realty Capital Properties, Inc., the Lenders party thereto, and Wells Fargo Bank, National Association, dated as of July 22, 2013. | |
10.15 (12) | Indemnity Agreement, by Indemnitors, in favor of ARC Real Estate Partners, LLC, dated December 28, 2012. | |
10.16 (13) | Credit Agreement, dated as of February 14, 2013, among American Realty Capital Operating Partnership III, L.P., American Realty Capital Trust III, Inc., Wells Fargo Bank, National Association, RBS Citizens, N.A., Regions Bank, Capital One, N.A. and JPMorgan Chase Bank, N.A. and the other lenders party hereto. | |
10.17 (13) | Common Stock Purchase Agreement, dated as of September 15, 2013, entered into by and between American Realty Capital Properties, Inc. and certain investors party thereto. | |
10.18 (19) | Credit Agreement, dated June 29, 2012, by and among CapLease, Inc., CapLease, LP, certain subsidiaries of CapLease, LP party thereto and Wells Fargo Bank, National Association, as administrative agent and sole lender. | |
10.19 (19) | First Amendment to Credit Agreement, dated April 16, 2013, by and among CapLease, Inc., CapLease, LP, certain subsidiaries of CapLease, LP party thereto and Wells Fargo Bank, National Association, as administrative agent and sole lender. | |
10.20 (19) | Second Amendment to Credit Agreement, dated June 21, 2013, by and among CapLease, Inc., CapLease, LP, certain subsidiaries of CapLease, LP party thereto and Wells Fargo Bank, National Association, as administrative agent and sole lender. | |
10.21 (19) | Third Amendment to Credit Agreement, dated November 5, 2013, by and among American Realty Capital Properties, Inc., ARC Properties Operating Partnership, L.P., Safari Acquisition, LLC, certain subsidiaries of Safari Acquisition, LLC party thereto and Wells Fargo Bank, National Association, as administrative agent and sole lender. | |
10.22 (17) | Voting Agreement, dated as of October 22, 2013, by and among American Realty Capital Properties, Inc., Cole Real Estate Investments, Inc., Christopher H. Cole and Marc T. Nemer. | |
10.23 (17) | Letter Agreement, dated as of October 22, 2013, by and among American Realty Capital Properties, Inc., Cole Real Estate Investments, Inc. and Christopher H. Cole. | |
10.24 (17) | Letter Agreement, dated as of October 22, 2013, by and among American Realty Capital Properties, Inc., Cole Real Estate Investments, Inc. and Marc T. Nemer. | |
10.25 (18) | Letter Agreement, dated as of October 22, 2013, between American Realty Capital Properties, Inc. and Kirk McAllaster. | |
10.26 (18) | Letter Agreement, dated as of October 22, 2013, by and among American Realty Capital Properties, Inc. and Stephan Keller. | |
82
| Exhibit No. | Description | |
10.27 (18) | Letter Agreement, dated as of October 22, 2013, by and among American Realty Capital Properties, Inc. and Jeffery Holland. | |
10.28 (20) | First Amendment dated as of September 30, 2013 to the Purchase and Sale Agreement dated July 24, 2013, by and among ARC DB5PROP001, LLC, ARC DBPGDYR001, LLC, ARC DBPPROP001, LLC, ARC DB5SAAB001, LLC, ARC DBGWSDG001, LLC and ARC DBGESRG001, LLC and the sellers described on the schedules thereto. | |
10.29 (20) | Second Amendment dated as October 1, 2013 to the Purchase and Sale Agreement dated July 24, 2013, by and among ARC DB5PROP001, LLC, ARC DBPGDYR001, LLC, ARC DBPPROP001, LLC, ARC DB5SAAB001, LLC, ARC DBGWSDG001, LLC and ARC DBGESRG001, LLC and the sellers described on the schedules thereto. | |
10.30 (20) | Third Amendment dated as of October 30, 2013 to the Purchase and Sale Agreement dated July 24, 2013, by and among ARC DB5PROP001, LLC, ARC DBPGDYR001, LLC, ARC DBPPROP001, LLC, ARC DB5SAAB001, LLC, ARC DBGWSDG001, LLC and ARC DBGESRG001, LLC and the sellers described on the schedules thereto. | |
10.31 (20) | Sixth Amendment to the Credit Agreement, by and among ARC Properties Operating Partnership, L.P., Tiger Acquisition, LLC, American Realty Capital Properties, Inc., the Lenders party thereto, and Wells Fargo Bank, National Association, dated as of November 4, 2013. | |
10.32 (20) | Employment Agreement, dated as of October 21, 2013, by and between American Realty Capital Properties, Inc. and Nicholas S. Schorsch. | |
10.33 (20) | Employment Agreement, dated as of October 21, 2013, by and between American Realty Capital Properties, Inc. and Brian S. Block. | |
10.34 (20) | Employment Agreement, dated as of October 21, 2013, by and between American Realty Capital Properties Operating Partnership, L.P. and Lisa Beeson. | |
10.35 (26) | Contribution and Exchange Agreement, dated as of January 3, 2014, among ARC Properties Operating Partnership, L.P., American Realty Capital Trust IV Special Limited Partner, LLC, AREP and ARCT IV Operating Partnership. | |
10.36 (29) | Asset Purchase and Sale Agreement, entered into as of January 8, 2014, by and among ARC Properties Operating Partnership, L.P. and ARC Properties Advisors, LLC. | |
10.37 (29) | Employment Agreement, dated as of November 22, 2013, by and between American Realty Capital Properties Operating Partnership, L.P. and David S. Kay. | |
10.38 (29) | 2014 Multi-Year Outperformance Plan of American Realty Capital Properties, Inc. | |
10.39 (29) | Form of Award Agreement Under the American Realty Capital Properties, Inc.’s 2014 Multi-Year Outperformance Plan. | |
10.40 (29) | Seventh Amendment to Credit Agreement, dated December 4, 2013, by and among, ARC Properties Operating Partnership, L.P., Tiger Acquisition, LLC, American Realty Capital Properties, Inc., the lenders party thereto and Wells Fargo Bank, National Association, as administrative agent, issuing bank and swingline lender. | |
10.41 (29) | Augmenting Lender and Increasing Lender Supplement, dated as of December 20, 2013, among ARC Properties Operating Partnership, L.P., Tiger Acquisition, LLC, American Realty Capital Properties, Inc., the lenders party thereto and Wells Fargo Bank, National Association, as administrative agent, issuing bank and swingline lender. | |
10.42 (29) | Augmenting Lender Supplement, dated as of January 17, 2014, among ARC Properties Operating Partnership, L.P., Tiger Acquisition, LLC, American Realty Capital Properties, Inc., the lenders party thereto and Wells Fargo Bank, National Association, as administrative agent, issuing bank and swingline lender. | |
10.43 (29) | Tenth Amendment to Credit Agreement, dated February 4, 2014, by and among, ARC Properties Operating Partnership, L.P., Tiger Acquisition, LLC, American Realty Capital Properties, Inc., the lenders party thereto and Wells Fargo Bank, National Association, as administrative agent, issuing bank and swingline lender. | |
10.44 (29) | Assignment and Assumption Agreement, dated January 8, 2014, by and between AR Capital, LLC and American Realty Capital Properties, Inc. | |
10.45(31) | Augmenting Lender Supplement, dated as of March 31, 2014, among ARC Properties Operating Partnership, L.P., Tiger Acquisition, LLC, the Company, the lenders party thereto and Wells Fargo Bank, National Association, as administrative agent, issuing bank and swingline lender. | |
10.46(32) | Employment Offer Letter, dated as of October 21, 2013, by and between American Realty Capital Properties, Inc. and Lisa Pavelka McAlister. | |
10.47(32) | Employment Agreement, dated as of February 24, 2014, by and between American Realty Capital Properties, Inc. and Richard A. Silfen. | |
10.48(32) | Agreement of Purchase and Sale, dated as of June 11, 2014, among certain subsidiaries of American Realty Capital Properties, Inc. party thereto and BRE DDR Retail Holdings III LLC. | |
10.49(32) | Amended and Restated Credit Agreement, dated as of June 30, 2014, among ARC Properties Operating Partnership, L.P., American Realty Capital Properties, Inc., lenders party thereto, and Wells Fargo Bank, National Association, as administrative agent. | |
10.50(32) | First Amendment to Agreement of Purchase and Sale, dated as of July 18, 2014, among certain subsidiaries of American Realty Capital Properties, Inc. party thereto and BRE DDR Retail Holdings III LLC. | |
10.51(33) | Equity Purchase Agreement by and between ARC Properties Operating Partnership, L.P. and RCS Capital Corporation, dated as of September 30, 2014. | |
10.52(35) | Agreement between Nicholas S. Schorsch and American Realty Capital Properties, Inc., dated December 12, 2014. | |
10.53(35) | Separation Agreement and Release by and between the Co-Registrants and David Kay, dated December 14, 2014. | |
10.54(35) | Amended and Restated Employment Agreement between ARC Properties Operating Partnership, L.P. and David Kay, dated October 1, 2014. | |
83
| Exhibit No. | Description | |
10.55(35) | Separation Agreement and Release by and between the Co-Registrants and Lisa Beeson, dated December 15, 2014. | |
10.56(35) | Amended and Restated Employment Agreement between ARC Properties Operating Partnership, L.P. and Lisa Beeson, effective October 1, 2014. | |
10.57(36) | Consent and Waiver Agreement and First Amendment to Credit Agreement, dated as of November 12, 2014 by and among American Realty Capital Properties, Inc., ARC Properties Operating Partnership, L.P., the lenders party thereto and Wells Fargo Bank, National Association, as administrative agent. | |
10.58(37) | Form of Indemnification Agreement entered into with various executives on November 26, 2014. | |
10.59(38) | Employment Letter, dated December 16, 2014, between American Realty Capital Properties, Inc. and Gavin Brandon. | |
10.60(38) | Employee Confidentiality and Non-Competition Agreement, dated December 16, 2014, executed by Gavin Brandon. | |
10.61(39) | Consent and Waiver Agreement, dated as of December 23, 2014, by and among American Realty Capital Properties, Inc., ARC Properties Operating Partnership, L.P., the lenders party thereto and Wells Fargo Bank, National Association, as administrative agent. | |
14 (6) | Code of Ethics. | |
| 21* | List of Subsidiaries. | |
| 23.1* | Consent of Grant Thornton LLP. | |
| 31.1* | Certification of the Chief Executive Officer of American Realty Capital Properties, Inc. pursuant to Securities Exchange Act Rule 13a-14(a) or 15d-14(a), as adopted pursuant to Section 302 of the Sarbanes-Oxley Act of 2002. | |
| 31.2* | Certification of the Chief Financial Officer of American Realty Capital Properties, Inc. pursuant to Securities Exchange Act Rule 13a-14(a) or 15d-14(a), as adopted pursuant to Section 302 of the Sarbanes-Oxley Act of 2002. | |
| 31.3* | Certification of the Chief Executive Officer of ARC Properties Operating Partnership, L.P. pursuant to Securities Exchange Act Rule 13a-14(a) or 15d-14(a), as adopted pursuant to Section 302 of the Sarbanes-Oxley Act of 2002. | |
| 31.4* | Certification of the Chief Financial Officer of ARC Properties Operating Partnership, L.P. pursuant to Securities Exchange Act Rule 13a-14(a) or 15d-14(a), as adopted pursuant to Section 302 of the Sarbanes-Oxley Act of 2002. | |
| 32.1* | Written statements of the Chief Executive Officer of American Realty Capital Properties, Inc. pursuant to 18 U.S.C. Section 1350, as adopted pursuant to Section 906 of the Sarbanes-Oxley Act of 2002. | |
| 32.2* | Written statements of the Chief Financial Officer of American Realty Capital Properties, Inc. pursuant to 18 U.S.C. Section 1350, as adopted pursuant to Section 906 of the Sarbanes-Oxley Act of 2002. | |
| 32.3* | Written statements of the Chief Executive Officer of ARC Properties Operating Partnership, L.P. pursuant to 18 U.S.C. Section 1350, as adopted pursuant to Section 906 of the Sarbanes-Oxley Act of 2002. | |
| 32.4* | Written statements of the Chief Financial Officer of ARC Properties Operating Partnership, L.P. pursuant to 18 U.S.C. Section 1350, as adopted pursuant to Section 906 of the Sarbanes-Oxley Act of 2002. | |
| 101.INS*** | XBRL Instance Document. | |
| 101.SCH*** | XBRL Taxonomy Extension Schema Document. | |
| 101.CAL*** | XBRL Taxonomy Extension Calculation Linkbase Document. | |
| 101.DEF*** | XBRL Taxonomy Extension Definition Linkbase Document. | |
| 101.LAB*** | XBRL Taxonomy Extension Label Linkbase Document. | |
| 101.PRE*** | XBRL Taxonomy Extension Presentation Linkbase Document. | |
_____________________________
* Filed herewith
** Schedules and applicable exhibits omitted pursuant to Item 601(b)(2) of Regulation S-K. The Company agrees to furnish a supplemental copy of any omitted schedule to the SEC upon request.
*** XBRL (Extensible Business Reporting Language) information is furnished and not filed or a part of a registration statement or prospectus for purposes of Sections 11 or 12 of the Securities Act and is deemed not filed for purposes of Section 18 of the Exchange, and otherwise is not subject to liability under these sections.
| (1) | Previously filed with the Current Report on Form 8-K filed with the SEC on December 17, 2012. |
| (2) | Previously filed with the Pre-Effective Amendment No. 5 to Form S-11 Registration Statement (Registration No. 333-172205) filed by American Realty Capital Properties, Inc. with the SEC on July 5, 2011. |
| (3) | Previously filed with the Pre-Effective Amendment No. 4 to Form S-11 Registration Statement (Registration No. 333-172205) filed by American Realty Capital Properties, Inc. with the SEC on June 13, 2011. |
| (4) | Previously filed with the Current Report on Form 8-K filed with the SEC on May 15, 2012. |
| (5) | Previously filed with the Current Report on Form 8-K filed with the SEC on July 30, 2012. |
| (6) | Previously filed with the Current Report on Form 8-K filed with the SEC on August 1, 2012. |
(7) Previously filed with the Current Report on Form 8-K filed with the SEC on May 28, 2013.
| (8) | Previously filed with the Amended Current Report on Form 8-K/A filed with the SEC on June 7, 2013. |
| (9) | Previously filed with the Current Report on Form 8-K filed with the SEC on June 12, 2013. |
| (10) | Previously filed with the Current Report on Form 8-K filed with the SEC on July 2, 2013. |
84
| (11) | Previously filed with the Current Report on Form 8-K filed with the SEC on July 29, 2013. |
| (12) | Previously filed with the Quarterly Report on Form 10-Q for the quarter ended June 30, 2013 filed with the SEC on August 6, 2013. |
| (13) | Previously filed with the Amended Current Report on Form 8-K/A filed with the SEC on September 19, 2013. |
| (14) | Previously filed with the Amended Current Report on Form 8-K/A filed with the SEC on September 25, 2013. |
| (15) | Previously filed with the First Current Report on Form 8-K filed with the SEC on October 7, 2013. |
| (16) | Previously filed with the Second Current Report on Form 8-K filed with the SEC on October 7, 2013. |
| (17) | Previously filed with the Current Report on Form 8-K filed with the SEC on October 23, 2013. |
| (18) | Previously filed with the Amended Current Report on Form 8-K/A filed with the SEC on October 25, 2013. |
| (19) | Previously filed with the Current Report on Form 8-K filed with the SEC on November 5, 2013. |
| (20) | Previously filed with the Quarterly Report on Form 10-Q for the quarter ended September 30, 2013 filed with the SEC on November 7, 2013. |
| (21) | Previously filed with the Current Report on Form 8-K filed with the SEC on November 15, 2013. |
| (22) | Previously filed as Annex E with the Final Prospectus Filed Pursuant to Rule 424(b)(3) with the SEC on December 4, 2013. |
| (23) | Previously filed with the Current Report on Form 8-K filed with the SEC on December 10, 2013. |
| (24) | Previously filed with the Amended Current Report on Form 8-K/A filed with the SEC on December 19, 2013. |
| (25) | Previously filed with the Registration Statement on Form 8-A filed with the SEC on January 3, 2014. |
| (26) | Previously filed with the Current Report on Form 8-K filed with the SEC on January 3, 2014. |
| (27) | Previously filed with the Current Report on Form 8-K filed with the SEC on February 7, 2014. |
| (28) | Previously filed with Pre-Effective Amendment No. 7 to the Registration Statement on Form S-4/A filed with the SEC on December 3, 2013. |
| (29) | Previously filed with the Annual Report on Form 10-K for the year ended December 31, 2013 filed with the SEC on February 27, 2014. |
| (30) | Previously filed with the Amendment No. 2 to its Annual Report on Form 10-K/A for the year ended December 31, 2013 filed with the SEC on March 2, 2015. |
(31) Previously filed with the Quarterly Report on Form 10-Q for the three months ended March 31, 2014 filed with the SEC on May 8, 2014.
(32) Previously filed with the Quarterly Report on Form 10-Q for the three months ended June 30, 2014 filed with the SEC on July 29, 2014.
(33) Previously filed with the Quarterly Report on Form 10-Q for the three months ended September 30, 2014 filed with the SEC on March 2, 2015.
(34) Previously filed with the Current Report on Form 8-K filed with the SEC on January 5, 2015.
(35) Previously filed with the Current Report on Form 8-K filed with the SEC on December 15, 2014.
(36) Previously filed with the Current Report on Form 8-K filed with the SEC on November 18, 2014.
(37) Previously filed with the Current Report on Form 8-K filed with the SEC on December 3, 2014.
(38) Previously filed with the Current Report on Form 8-K filed with the SEC on December 22, 2014.
(39) Previously filed with the Current Report on Form 8-K filed with the SEC on December 30, 2014.
(40) Previously filed with the Registration Statement on Form S-4 filed with the SEC on August 1, 2014.
85
SIGNATURES
Pursuant to the requirements of the Securities Exchange Act of 1934, as amended, each registrant has duly caused this Annual Report on Form 10-K to be signed on its behalf by the undersigned thereunto duly authorized on this 30th day of March, 2015.
| AMERICAN REALTY CAPITAL PROPERTIES, INC. | ||
| By: | /s/ William G. Stanley | |
Interim Chief Executive Officer (Principal Executive Officer) | ||
| ARC PROPERTIES OPERATING PARTNERSHIP, L.P. | ||
| By: American Realty Capital Properties, Inc., its sole general partner | ||
| By: | /s/ William G. Stanley | |
Interim Chief Executive Officer (Principal Executive Officer) | ||
Pursuant to the requirements of the Securities Exchange Act of 1934, as amended, this Form 10-K has been signed below by the following persons on behalf of each registrant and in the capacities and on the dates indicated.
| Name | Capacity * | Date | ||
| /s/ William G. Stanley | Interim Chief Executive Officer and Interim Chairman of the Board | March 30, 2015 | ||
| William G. Stanley | of Directors (Principal Executive Officer and Director) | |||
| /s/ Michael J. Sodo | Executive Vice President, Chief Financial Officer and Treasurer | March 30, 2015 | ||
| Michael J. Sodo | (Principal Financial Officer) | |||
| /s/ Gavin B. Brandon | Senior Vice President and Chief Accounting Officer | March 30, 2015 | ||
| Gavin B. Brandon | (Principal Accounting Officer) | |||
| /s/ Thomas A. Andruskevich | Director | March 30, 2015 | ||
| Thomas A. Andruskevich | ||||
| /s/ Leslie D. Michelson | Director | March 30, 2015 | ||
| Leslie D. Michelson | ||||
| /s/ Edward G. Rendell | Director | March 30, 2015 | ||
| Edward G. Rendell | ||||
| /s/ Bruce D. Frank | Director | March 30, 2015 | ||
| Bruce D. Frank | ||||
____________________________________
| * | Each person is signing in his capacity as an officer and/or director of American Realty Capital Properties, Inc., which is the sole general partner of ARC Properties Operating Partnership, L.P. |
86
INDEX TO CONSOLIDATED FINANCIAL STATEMENTS
| Page | |
| Financial Statements | |
F-1
REPORT OF INDEPENDENT REGISTERED PUBLIC ACCOUNTING FIRM
Board of Directors and Shareholders
American Realty Capital Properties, Inc.
We have audited the accompanying consolidated balance sheets of American Realty Capital Properties, Inc. (a Maryland corporation) and subsidiaries (the “Company”) as of December 31, 2014 and 2013, and the related consolidated statements of operations, comprehensive loss, changes in equity, and cash flows for each of the three years in the period ended December 31, 2014. Our audits of the basic consolidated financial statements included the financial statement schedules listed in the Index to Consolidated Financial Statements. These financial statements and financial statement schedules are the responsibility of the Company’s management. Our responsibility is to express an opinion on these financial statements and financial statement schedules based on our audits.
We conducted our audits in accordance with the standards of the Public Company Accounting Oversight Board (United States). Those standards require that we plan and perform the audit to obtain reasonable assurance about whether the financial statements are free of material misstatement. An audit includes examining, on a test basis, evidence supporting the amounts and disclosures in the financial statements. An audit also includes assessing the accounting principles used and significant estimates made by management, as well as evaluating the overall financial statement presentation. We believe that our audits provide a reasonable basis for our opinion.
In our opinion, the consolidated financial statements referred to above present fairly, in all material respects, the financial position of American Realty Capital Properties, Inc. and subsidiaries as of December 31, 2014 and 2013, and the results of their operations and their cash flows for each of the three years in the period ended December 31, 2014 in conformity with accounting principles generally accepted in the United States of America. Also in our opinion, the related financial statement schedules, when considered in relation to the basic consolidated financial statements taken as a whole, present fairly, in all material respects, the information set forth therein.
We also have audited, in accordance with the standards of the Public Company Accounting Oversight Board (United States), the Company’s internal control over financial reporting as of December 31, 2014, based on criteria established in the 2013 Internal Control-Integrated Framework issued by the Committee of Sponsoring Organizations of the Treadway Commission (COSO), and our report dated March 30, 2015 expressed an adverse opinion.
/s/ GRANT THORNTON LLP
Phoenix, Arizona
March 30, 2015
F-2
REPORT OF INDEPENDENT REGISTERED PUBLIC ACCOUNTING FIRM
Board of Directors of General Partner and Limited Partners
ARC Properties Operating Partnership, L.P. and subsidiaries
We have audited the accompanying consolidated balance sheets of ARC Properties Operating Partnership, L.P. (a Delaware partnership) and subsidiaries (collectively the “Operating Partnership”) as of December 31, 2014 and 2013, and the related consolidated statements of operations, comprehensive loss, changes in equity, and cash flows for each of the three years in the period ended December 31, 2014. Our audits of the basic consolidated financial statements included the financial statement schedules listed in the Index to Consolidated Financial Statements. These financial statements and financial statement schedules are the responsibility of the Operating Partnership’s management. Our responsibility is to express an opinion on these financial statements and financial statement schedules based on our audits.
We conducted our audits in accordance with the standards of the Public Company Accounting Oversight Board (United States). Those standards require that we plan and perform the audit to obtain reasonable assurance about whether the financial statements are free of material misstatement. We were not engaged to perform an audit of the Operating Partnership’s internal control over financial reporting. Our audits included consideration of internal control over financial reporting as a basis for designing audit procedures that are appropriate in the circumstances, but not for the purpose of expressing an opinion on the effectiveness of the Operating Partnership’s internal control over financial reporting. Accordingly, we express no such opinion. An audit also includes examining, on a test basis, evidence supporting the amounts and disclosures in the financial statements, assessing the accounting principles used and significant estimates made by management, as well as evaluating the overall financial statement presentation. We believe that our audits provide a reasonable basis for our opinion.
In our opinion, the consolidated financial statements referred to above present fairly, in all material respects, the financial position of ARC Properties Operating Partnership, L.P. and subsidiaries as of December 31, 2014 and 2013, and the results of their operations and their cash flows for each of the three years in the period ended December 31, 2014 in conformity with accounting principles generally accepted in the United States of America. Also in our opinion, the related financial statement schedules, when considered in relation to the basic consolidated financial statements taken as a whole, present fairly, in all material respects, the information set forth therein.
/s/ GRANT THORNTON LLP
Phoenix, Arizona
March 30, 2015
F-3
AMERICAN REALTY CAPITAL PROPERTIES, INC.
CONSOLIDATED BALANCE SHEETS
(In thousands, except for share and per share data)
| December 31, 2014 | December 31, 2013 | |||||||
| ASSETS | ||||||||
| Real estate investments, at cost: | ||||||||
| Land | $ | 3,472,298 | $ | 1,380,308 | ||||
| Buildings, fixtures and improvements | 12,307,758 | 5,297,400 | ||||||
| Land and construction in progress | 77,450 | 21,839 | ||||||
| Intangible lease assets | 2,435,054 | 759,595 | ||||||
| Total real estate investments, at cost | 18,292,560 | 7,459,142 | ||||||
| Less: accumulated depreciation and amortization | (1,034,122 | ) | (267,278 | ) | ||||
| Total real estate investments, net | 17,258,438 | 7,191,864 | ||||||
| Investment in unconsolidated entities | 98,053 | — | ||||||
| Investment in direct financing leases, net | 56,076 | 66,112 | ||||||
| Investment securities, at fair value | 58,646 | 62,067 | ||||||
| Loans held for investment, net | 42,106 | 26,279 | ||||||
| Cash and cash equivalents | 416,711 | 52,725 | ||||||
| Restricted cash | 62,651 | 35,921 | ||||||
| Intangible assets, net | 150,359 | — | ||||||
| Deferred costs and other assets, net | 389,922 | 280,661 | ||||||
| Goodwill | 1,894,794 | 92,789 | ||||||
| Due from affiliates | 86,122 | — | ||||||
| Assets held for sale | 1,261 | 665 | ||||||
| Total assets | $ | 20,515,139 | $ | 7,809,083 | ||||
| LIABILITIES AND EQUITY | ||||||||
| Mortgage notes payable, net | $ | 3,759,935 | $ | 1,301,114 | ||||
| Corporate bonds, net | 2,546,499 | — | ||||||
| Convertible debt, net | 977,521 | 972,490 | ||||||
| Credit facilities | 3,184,000 | 1,969,800 | ||||||
| Other debt, net | 45,826 | 104,804 | ||||||
| Below-market lease liabilities, net | 317,838 | 77,169 | ||||||
| Accounts payable and accrued expenses | 163,025 | 730,571 | ||||||
| Deferred rent, derivative and other liabilities | 127,611 | 40,271 | ||||||
| Distributions payable | 9,995 | 10,903 | ||||||
| Due to affiliates | 559 | 103,434 | ||||||
| Total liabilities | 11,132,809 | 5,310,556 | ||||||
| Commitments and contingencies (Note 17) | ||||||||
| Series D preferred stock, $0.01 par value, zero and 21,735,008 shares (part of 100,000,000 aggregate preferred shares authorized) issued and outstanding at December 31, 2014 and 2013, respectively | — | 269,299 | ||||||
| Equity: | ||||||||
| Preferred stock (excluding Series D Preferred Stock), $0.01 par value, 100,000,000 shares authorized and 42,834,138 and 42,199,547 shares issued and outstanding at December 31, 2014 and 2013, respectively | 428 | 422 | ||||||
| Common stock, $0.01 par value, 1,500,000,000 shares authorized and 905,530,430 and 239,234,725 issued and outstanding at December 31, 2014 and 2013, respectively | 9,055 | 2,392 | ||||||
| Additional paid-in capital | 11,920,253 | 2,940,907 | ||||||
| Accumulated other comprehensive income | 2,728 | 7,666 | ||||||
| Accumulated deficit | (2,778,576 | ) | (877,957 | ) | ||||
| Total stockholders’ equity | 9,153,888 | 2,073,430 | ||||||
| Non-controlling interests | 228,442 | 155,798 | ||||||
| Total equity | 9,382,330 | 2,229,228 | ||||||
| Total liabilities and equity | $ | 20,515,139 | $ | 7,809,083 | ||||
The accompanying notes are an integral part of these statements.
F-4
AMERICAN REALTY CAPITAL PROPERTIES, INC.
CONSOLIDATED STATEMENTS OF OPERATIONS
(In thousands, except for per share data)
| Year Ended December 31, | ||||||||||||
| 2014 | 2013 | 2012 | ||||||||||
| Revenues: | ||||||||||||
| Rental income | $ | 1,271,574 | $ | 310,508 | $ | 65,262 | ||||||
| Direct financing lease income | 3,603 | 2,244 | — | |||||||||
| Operating expense reimbursements | 100,522 | 16,571 | 1,945 | |||||||||
| Cole Capital revenue | 203,558 | — | — | |||||||||
| Total revenues | 1,579,257 | 329,323 | 67,207 | |||||||||
| Operating expenses: | ||||||||||||
| Cole Capital reallowed fees and commissions | 66,228 | — | — | |||||||||
Acquisition related (including $1,652, $37,564 and $28,656 to affiliates, respectively) | 38,831 | 76,113 | 45,070 | |||||||||
Merger and other non-routine transactions (including $137,778, $156,146 and $0 to affiliates, respectively) | 200,514 | 210,543 | 2,603 | |||||||||
| Property operating | 137,741 | 23,616 | 3,522 | |||||||||
| Management fees to affiliates | 13,888 | 17,462 | 212 | |||||||||
General and administrative (including $16,089, $103,206 and $826 to affiliates, respectively) | 174,741 | 123,172 | 5,458 | |||||||||
| Depreciation and amortization | 916,003 | 210,976 | 40,957 | |||||||||
| Impairments | 409,991 | 3,346 | — | |||||||||
| Total operating expenses | 1,957,937 | 665,228 | 97,822 | |||||||||
| Operating loss | (378,680 | ) | (335,905 | ) | (30,615 | ) | ||||||
| Other (expense) income: | ||||||||||||
| Interest expense, net | (452,648 | ) | (105,548 | ) | (11,856 | ) | ||||||
| Extinguishment of debt, net | (21,869 | ) | — | — | ||||||||
| Other income, net | 123,529 | 3,824 | 979 | |||||||||
| Loss on derivative instruments, net | (10,570 | ) | (67,946 | ) | — | |||||||
| Loss on held for sale assets and disposition of properties, net | (277,031 | ) | — | — | ||||||||
| Loss on sale of investments in affiliates | — | (411 | ) | — | ||||||||
| Gain (loss) on sale of investments | 6,357 | (1,795 | ) | — | ||||||||
| Total other expenses, net | (632,232 | ) | (171,876 | ) | (10,877 | ) | ||||||
| Net loss from continuing operations | (1,010,912 | ) | (507,781 | ) | (41,492 | ) | ||||||
| Discontinued operations: | ||||||||||||
| Loss from operations of held for sale assets | — | (34 | ) | (145 | ) | |||||||
| Loss on held for sale properties | — | — | (600 | ) | ||||||||
| Net loss from discontinued operations | — | (34 | ) | (745 | ) | |||||||
| Net loss | (1,010,912 | ) | (507,815 | ) | (42,237 | ) | ||||||
| Net loss attributable to non-controlling interests | 33,727 | 16,316 | 585 | |||||||||
| Net loss attributable to the Company | $ | (977,185 | ) | $ | (491,499 | ) | $ | (41,652 | ) | |||
| Basic and diluted net loss per share from continuing operations attributable to common stockholders | $ | (1.36 | ) | $ | (2.41 | ) | $ | (0.40 | ) | |||
| Basic and diluted net loss per share from discontinued operations attributable to common stockholders | $ | 0.00 | $ | 0.00 | $ | (0.01 | ) | |||||
| Basic and diluted net loss per share attributable to common stockholders | $ | (1.36 | ) | $ | (2.41 | ) | $ | (0.41 | ) | |||
The accompanying notes are an integral part of these statements.
F-5
AMERICAN REALTY CAPITAL PROPERTIES, INC.
CONSOLIDATED STATEMENTS OF COMPREHENSIVE LOSS
(In thousands)
| Year Ended December 31, | ||||||||||||
| 2014 | 2013 | 2012 | ||||||||||
| Net loss | $ | (1,010,912 | ) | $ | (507,815 | ) | $ | (42,237 | ) | |||
| Other comprehensive income: | ||||||||||||
| Designated derivatives, fair value adjustments | (7,002 | ) | 11,481 | (3,743 | ) | |||||||
| Unrealized gain (loss) on investment securities, net | 9,716 | 119 | (93 | ) | ||||||||
| Reclassification of previous unrealized gains on investment securities into net loss | (7,652 | ) | — | — | ||||||||
| Total other comprehensive (loss) income | (4,938 | ) | 11,600 | (3,836 | ) | |||||||
| Total comprehensive loss | (1,015,850 | ) | (496,215 | ) | (46,073 | ) | ||||||
| Comprehensive loss attributable to non-controlling interests | 33,727 | 16,316 | 585 | |||||||||
| Total comprehensive loss attributable to the Company | $ | (982,123 | ) | $ | (479,899 | ) | $ | (45,488 | ) | |||
The accompanying notes are an integral part of these statements.
F-6
AMERICAN REALTY CAPITAL PROPERTIES, INC.
CONSOLIDATED STATEMENT OF CHANGES IN EQUITY
(In thousands, except for share data)
| Preferred Stock | Common Stock | |||||||||||||||||||||||||||||||||||||
| Number of Shares | Par Value | Number of Shares | Par Value | Additional Paid-In Capital | Accumulated Other Comprehensive Income | Accumulated Deficit | Total Stock-holders’ Equity | Non-Controlling Interests | Total Equity | |||||||||||||||||||||||||||||
| Balance, January 1, 2012 | — | $ | — | 17,162,016 | $ | 172 | $ | 144,230 | $ | (98 | ) | $ | (7,218 | ) | $ | 137,086 | $ | 3,702 | $ | 140,788 | ||||||||||||||||||
| Issuance of preferred stock | 6,990,328 | 70 | — | — | 8,992 | — | — | 9,062 | — | 9,062 | ||||||||||||||||||||||||||||
| Issuance of common stock | — | — | 164,775,688 | 1,648 | 1,911,126 | — | — | 1,912,774 | — | 1,912,774 | ||||||||||||||||||||||||||||
| Excess of ARCT IV Merger considerations over historical cost | — | — | — | — | (93,421 | ) | — | — | (93,421 | ) | — | (93,421 | ) | |||||||||||||||||||||||||
Offering costs, commissions and dealer manager fees (1) | — | — | — | — | (218,431 | ) | — | — | (218,431 | ) | — | (218,431 | ) | |||||||||||||||||||||||||
| Common stock issued through dividend reinvestment plan | — | — | 2,686,141 | 27 | 27,109 | — | — | 27,136 | — | 27,136 | ||||||||||||||||||||||||||||
| Equity-based compensation | — | — | 112,950 | 1 | 1,229 | — | — | 1,230 | — | 1,230 | ||||||||||||||||||||||||||||
| Distributions declared | — | — | — | — | — | — | (75,416 | ) | (75,416 | ) | — | (75,416 | ) | |||||||||||||||||||||||||
| Common stock repurchases | — | — | (183,119 | ) | (2 | ) | (1,951 | ) | ��� | — | (1,953 | ) | — | (1,953 | ) | |||||||||||||||||||||||
| OP Units issued to acquire real estate investment | — | — | — | — | — | — | — | — | 6,352 | 6,352 | ||||||||||||||||||||||||||||
| Contributions from non-controlling interest holders | — | — | — | — | — | — | — | — | 7,375 | 7,375 | ||||||||||||||||||||||||||||
| Distributions to non-controlling interest holders | — | — | — | — | — | — | — | — | (663 | ) | (663 | ) | ||||||||||||||||||||||||||
| Net loss | — | — | — | — | — | — | (41,652 | ) | (41,652 | ) | (585 | ) | (42,237 | ) | ||||||||||||||||||||||||
| Other comprehensive loss | — | — | — | — | — | (3,836 | ) | — | (3,836 | ) | — | (3,836 | ) | |||||||||||||||||||||||||
| Balance, December 31, 2012 | 6,990,328 | $ | 70 | 184,553,676 | $ | 1,846 | $ | 1,778,883 | $ | (3,934 | ) | $ | (124,286 | ) | $ | 1,652,579 | $ | 16,181 | $ | 1,668,760 | ||||||||||||||||||
| Issuances of preferred stock | 36,037,691 | 360 | — | — | — | — | — | 360 | — | 360 | ||||||||||||||||||||||||||||
| Issuance of common stock | — | — | 78,215,719 | 781 | 2,153,144 | — | — | 2,153,925 | — | 2,153,925 | ||||||||||||||||||||||||||||
| Excess of ARCT IV Merger considerations over historical cost | — | — | — | — | (558,089 | ) | — | — | (558,089 | ) | — | (558,089 | ) | |||||||||||||||||||||||||
Offering costs, commissions and dealer manager fees (1) | — | — | — | — | (165,531 | ) | — | — | (165,531 | ) | — | (165,531 | ) | |||||||||||||||||||||||||
| Common stock issued through dividend reinvestment plan | — | — | 940,737 | 10 | 25,554 | — | — | 25,564 | — | 25,564 | ||||||||||||||||||||||||||||
| Common stock repurchases | — | — | (28,319,972 | ) | (283 | ) | (357,758 | ) | — | — | (358,041 | ) | — | (358,041 | ) | |||||||||||||||||||||||
| Conversion of Convertible Preferred Stock Series A and B to common stock | (828,472 | ) | (8 | ) | 829,629 | 8 | — | — | — | — | — | — | ||||||||||||||||||||||||||
| Issuance of common stock in conversion of Convertible Preferred Stock Series C | — | — | 1,411,030 | 14 | 17,382 | — | — | 17,396 | — | 17,396 | ||||||||||||||||||||||||||||
| Conversion of OP Units to common stock | — | — | 599,233 | 6 | 5,794 | — | — | 5,800 | (5,800 | ) | — | |||||||||||||||||||||||||||
| Equity-based compensation | — | — | 1,004,673 | 10 | 7,952 | — | — | 7,962 | 32,700 | 40,662 | ||||||||||||||||||||||||||||
| Equity component of convertible debt | — | — | — | — | 28,559 | — | — | 28,559 | — | 28,559 | ||||||||||||||||||||||||||||
| Contribution from the Former Manager | — | — | — | — | 2,313 | — | — | 2,313 | — | 2,313 | ||||||||||||||||||||||||||||
| Consideration paid for assets of the Former Manager in excess of carryover basis | — | — | — | — | 2,704 | — | (2,704 | ) | — | — | — | |||||||||||||||||||||||||||
| Distributions declared | — | — | — | — | — | — | (259,468 | ) | (259,468 | ) | — | (259,468 | ) | |||||||||||||||||||||||||
| Issuance of OP Units | — | — | — | — | — | — | — | — | 107,771 | 107,771 | ||||||||||||||||||||||||||||
| Contributions from non-controlling interest holders | — | — | — | — | — | — | — | — | 30,861 | 30,861 | ||||||||||||||||||||||||||||
| Distributions to non-controlling interest holders | — | — | — | — | — | — | — | — | (9,014 | ) | (9,014 | ) | ||||||||||||||||||||||||||
| The consolidated statements of changes in equity continue onto the next page. | ||||||||||||||||||||||||||||||||||||||
F-7
AMERICAN REALTY CAPITAL PROPERTIES, INC.
CONSOLIDATED STATEMENT OF CHANGES IN EQUITY – (Continued)
(In thousands, except for share data)
| Preferred Stock | Common Stock | |||||||||||||||||||||||||||||||||||||
| Number of Shares | Par Value | Number of Shares | Par Value | Additional Paid-In Capital | Accumulated Other Comprehensive Income | Accumulated Deficit | Total Stock-holders’ Equity | Non-Controlling Interests | Total Equity | |||||||||||||||||||||||||||||
| Non-controlling interests retained in CapLease Merger | — | $ | — | — | $ | — | $ | — | $ | — | $ | — | $ | — | $ | 567 | $ | 567 | ||||||||||||||||||||
| Redemption of OP Units | — | — | — | — | — | — | — | — | (1,152 | ) | (1,152 | ) | ||||||||||||||||||||||||||
| Other comprehensive income | — | — | — | — | — | 11,600 | — | 11,600 | — | 11,600 | ||||||||||||||||||||||||||||
| Net loss | — | — | — | — | — | (491,499 | ) | (491,499 | ) | (16,316 | ) | (507,815 | ) | |||||||||||||||||||||||||
| Balance, December 31, 2013 | 42,199,547 | $ | 422 | 239,234,725 | $ | 2,392 | $ | 2,940,907 | $ | 7,666 | $ | (877,957 | ) | $ | 2,073,430 | $ | 155,798 | $ | 2,229,228 | |||||||||||||||||||
Issuance of common stock, net (1) | — | — | 662,305,318 | 6,623 | 8,923,640 | — | — | 8,930,263 | — | 8,930,263 | ||||||||||||||||||||||||||||
| Conversion of Common OP Units to common stock | — | — | 1,108,351 | 11 | 16,035 | — | — | 16,046 | (16,046 | ) | — | |||||||||||||||||||||||||||
| Conversion of Preferred OP Units to Series F Preferred Stock | 634,591 | 6 | — | — | 12,671 | — | — | 12,677 | (12,677 | ) | — | |||||||||||||||||||||||||||
| Repurchases of common stock to settle tax obligation | — | — | (551,664 | ) | (5 | ) | (7,685 | ) | — | — | (7,690 | ) | — | (7,690 | ) | |||||||||||||||||||||||
| Equity-based compensation | — | — | 3,433,701 | 34 | 30,227 | — | — | 30,261 | 1,600 | 31,861 | ||||||||||||||||||||||||||||
| Excess tax benefit | — | — | — | — | 4,458 | — | — | 4,458 | — | 4,458 | ||||||||||||||||||||||||||||
| Distributions declared on common stock | — | — | — | — | — | — | (819,377 | ) | (819,377 | ) | — | (819,377 | ) | |||||||||||||||||||||||||
| Issuance of OP Units | — | — | — | — | — | — | — | — | 152,484 | 152,484 | ||||||||||||||||||||||||||||
| Distributions to non-controlling interest holders | — | — | — | — | — | — | — | — | (36,318 | ) | (36,318 | ) | ||||||||||||||||||||||||||
| Distributions to participating securities | — | — | — | — | — | — | (5,335 | ) | (5,335 | ) | — | (5,335 | ) | |||||||||||||||||||||||||
| Distributions to preferred shareholders | — | — | — | — | — | — | (98,722 | ) | (98,722 | ) | — | (98,722 | ) | |||||||||||||||||||||||||
| Contributions from non-controlling interest holders | — | — | — | — | — | — | — | — | 982 | 982 | ||||||||||||||||||||||||||||
| Non-controlling interests retained in Cole Merger | — | — | — | — | — | — | — | — | 24,766 | 24,766 | ||||||||||||||||||||||||||||
| Redemption of OP Units | — | — | — | — | — | — | — | — | (8,420 | ) | (8,420 | ) | ||||||||||||||||||||||||||
| Net loss | — | — | — | — | — | — | (977,185 | ) | (977,185 | ) | (33,727 | ) | (1,010,912 | ) | ||||||||||||||||||||||||
| Other comprehensive loss | — | — | — | — | — | (4,938 | ) | — | (4,938 | ) | — | (4,938 | ) | |||||||||||||||||||||||||
| Balance, December 31, 2014 | 42,834,138 | $ | 428 | 905,530,431 | $ | 9,055 | $ | 11,920,253 | $ | 2,728 | $ | (2,778,576 | ) | $ | 9,153,888 | $ | 228,442 | $ | 9,382,330 | |||||||||||||||||||
_______________________________________________
(1) Includes $2.2 million, $161.8 million and $211.4 million to affiliates for the years ended December 31, 2014, December 31, 2013, and December 31, 2012, respectively.
The accompanying notes are an integral part of these statements.
F-8
AMERICAN REALTY CAPITAL PROPERTIES, INC.
CONSOLIDATED STATEMENTS OF CASH FLOWS
(In thousands)
| Year Ended December 31, | ||||||||||||
| 2014 | 2013 | 2012 | ||||||||||
| Cash flows from operating activities: | ||||||||||||
| Net loss | $ | (1,010,912 | ) | $ | (507,815 | ) | $ | (42,237 | ) | |||
| Adjustments to reconcile net loss to net cash provided by (used in) operating activities: | ||||||||||||
| Issuance of OP Units | 92,884 | 107,771 | — | |||||||||
| Depreciation and amortization | 1,007,164 | 238,307 | 43,152 | |||||||||
| Loss on held for sale assets and disposition of properties, net | 277,031 | — | 600 | |||||||||
| Impairments | 409,991 | 3,346 | — | |||||||||
| Equity-based compensation | 31,861 | 100,261 | 1,230 | |||||||||
| Equity in income of unconsolidated entities | 77 | — | — | |||||||||
| Distributions from unconsolidated entities | 8,335 | — | — | |||||||||
| Loss on derivative instruments | 10,570 | (1,739 | ) | — | ||||||||
| (Gain) loss on sale of investments, net | (6,357 | ) | 2,206 | — | ||||||||
| Loss on extinguishment of debt | (14,012 | ) | — | — | ||||||||
| Loss on extinguishment of Series C Stock | — | 13,749 | — | |||||||||
| Note receivable issued in legal settlement | (15,300 | ) | — | — | ||||||||
| Changes in assets and liabilities: | ||||||||||||
| Investment in direct financing leases | 1,597 | 2,505 | — | |||||||||
| Deferred costs, intangible and other assets, net | (97,125 | ) | (19,851 | ) | (5,089 | ) | ||||||
| Due from affiliates | (32,821 | ) | — | — | ||||||||
| Accounts payable and accrued expenses | (16,279 | ) | 20,789 | 8,277 | ||||||||
| Deferred rent, derivative and other liabilities | (99,930 | ) | 8,555 | 3,507 | ||||||||
| Due to affiliates | (43,887 | ) | 43,834 | — | ||||||||
| Net cash provided by operating activities | 502,887 | 11,918 | 9,440 | |||||||||
| Cash flows from investing activities: | ||||||||||||
| Investments in real estate and other assets | (3,539,906 | ) | (3,520,412 | ) | (1,659,536 | ) | ||||||
| Acquisition of a real estate business, net of cash acquired | (756,232 | ) | (878,898 | ) | — | |||||||
| Investment in direct financing leases | — | (68,617 | ) | — | ||||||||
| Capital expenditures | (34,687 | ) | (9,755 | ) | (54 | ) | ||||||
| Real estate developments | (72,515 | ) | — | — | ||||||||
| Principal repayments received from borrowers | 77,614 | 442 | — | |||||||||
| Investments in unconsolidated entities | (2,500 | ) | — | — | ||||||||
| Proceeds from disposition of properties | 1,598,767 | — | 553 | |||||||||
| Investment in leasehold improvements, property and equipment | (11,890 | ) | (543 | ) | — | |||||||
| Deposits for real estate investments | (265,372 | ) | (101,887 | ) | (638 | ) | ||||||
| Uses and refunds of deposits for real estate investments | 347,971 | — | — | |||||||||
| Purchases of investment securities | — | (81,590 | ) | (41,747 | ) | |||||||
| Line of credit advances to affiliates | (125,000 | ) | — | — | ||||||||
| Line of credit repayments from affiliates | 81,100 | — | — | |||||||||
| Investment in loans held for investment | (2,952 | ) | — | — | ||||||||
| Proceeds from sale of investment securities | 159,752 | 119,542 | — | |||||||||
| Change in restricted cash | (8,606 | ) | — | — | ||||||||
| Net cash used in investing activities | (2,554,456 | ) | (4,541,718 | ) | (1,701,422 | ) | ||||||
| Cash flows from financing activities: | ||||||||||||
| Proceeds from mortgage notes payable | 1,010,219 | 6,924 | 229,798 | |||||||||
| Payments on mortgage notes payable | (1,143,503 | ) | (5,711 | ) | — | |||||||
| Payments on other debt | (112,003 | ) | (9,368 | ) | — | |||||||
| Proceeds from credit facilities | 5,824,000 | 2,678,800 | 82,319 | |||||||||
| Payments on credit facilities | (5,918,800 | ) | (954,604 | ) | (122 | ) | ||||||
| Proceeds from corporate bonds | 2,545,760 | — | — | |||||||||
| Payments of deferred financing costs | (116,373 | ) | (101,196 | ) | (13,974 | ) | ||||||
| Proceeds from issuance of convertible debt | — | 967,786 | — | |||||||||
| Common stock repurchases | (7,690 | ) | (359,193 | ) | (1,534 | ) | ||||||
| Proceeds from issuances of preferred shares | — | — | 9,000 | |||||||||
| The consolidated statements of cash flows continue onto the next page. | ||||||||||||
F-9
AMERICAN REALTY CAPITAL PROPERTIES, INC.
CONSOLIDATED STATEMENTS OF CASH FLOWS – (Continued)
(In thousands)
| Year Ended December 31, | ||||||||||||
| 2014 | 2013 | 2012 | ||||||||||
| Proceeds from issuance of Series C Stock | $ | — | $ | 445,000 | $ | — | ||||||
| Cash payment on settlement of Series C Stock | — | (441,353 | ) | — | ||||||||
| Proceeds from issuance of Series D Preferred Stock | — | 287,991 | — | |||||||||
| Proceeds from issuances of common stock, net offering costs | 1,595,045 | 1,993,159 | 1,691,412 | |||||||||
| Redemption of Series D Preferred Stock | (316,126 | ) | — | — | ||||||||
| Contributions from non-controlling interest holders | 982 | 30,861 | 7,375 | |||||||||
| Distributions to non-controlling interest holders | (30,150 | ) | (8,219 | ) | (663 | ) | ||||||
| Distributions paid | (920,264 | ) | (234,897 | ) | (37,673 | ) | ||||||
| Windfall tax benefits related to equity-based compensation | 4,458 | — | — | |||||||||
| Payments from affiliates, net | — | (376 | ) | 396 | ||||||||
| Change in restricted cash | — | (5,654 | ) | (1,108 | ) | |||||||
| Net cash provided by financing activities | 2,415,555 | 4,289,950 | 1,965,226 | |||||||||
| Net change in cash and cash equivalents | 363,986 | (239,850 | ) | 273,244 | ||||||||
| Cash and cash equivalents, beginning of period | 52,725 | 292,575 | 19,331 | |||||||||
| Cash and cash equivalents, end of period | $ | 416,711 | $ | 52,725 | $ | 292,575 | ||||||
| Supplemental Disclosures: | ||||||||||||
| Cash paid for interest | $ | 330,652 | $ | 49,549 | $ | 8,983 | ||||||
| Cash paid for income taxes | $ | 7,616 | $ | 1,711 | $ | 173 | ||||||
| Non-cash investing and financing activities: | ||||||||||||
| OP units issued to acquire real estate investments | $ | — | $ | — | $ | 6,352 | ||||||
| Accrued capital expenditures and real estate developments | $ | 6,868 | $ | — | $ | — | ||||||
| Common stock issued through distribution reinvestment plan | $ | — | $ | 25,568 | $ | 27,136 | ||||||
The accompanying notes are an integral part of these statements.
F-10
ARC PROPERTIES OPERATING PARTNERSHIP, L.P.
CONSOLIDATED BALANCE SHEETS
(In thousands, except for unit data)
| December 31, 2014 | December 31, 2013 | |||||||
| ASSETS | ||||||||
| Real estate investments, at cost: | ||||||||
| Land | $ | 3,472,298 | $ | 1,380,308 | ||||
| Buildings, fixtures and improvements | 12,307,758 | 5,297,400 | ||||||
| Land and construction in progress | 77,450 | 21,839 | ||||||
| Intangible lease assets | 2,435,054 | 759,595 | ||||||
| Total real estate investments, at cost | 18,292,560 | 7,459,142 | ||||||
| Less: accumulated depreciation and amortization | (1,034,122 | ) | (267,278 | ) | ||||
| Total real estate investments, net | 17,258,438 | 7,191,864 | ||||||
| Investment in unconsolidated entities | 98,053 | — | ||||||
| Investment in direct financing leases, net | 56,076 | 66,112 | ||||||
| Investment securities, at fair value | 58,646 | 62,067 | ||||||
| Loans held for investment, net | 42,106 | 26,279 | ||||||
| Cash and cash equivalents | 416,711 | 52,725 | ||||||
| Restricted cash | 62,651 | 35,921 | ||||||
| Intangible assets, net | 150,359 | — | ||||||
| Deferred costs and other assets, net | 389,922 | 280,661 | ||||||
| Goodwill | 1,894,794 | 92,789 | ||||||
| Due from affiliates | 86,122 | — | ||||||
| Assets held for sale | 1,261 | 665 | ||||||
| Total assets | $ | 20,515,139 | $ | 7,809,083 | ||||
| LIABILITIES AND EQUITY | ||||||||
| Mortgage notes payable, net | $ | 3,759,935 | $ | 1,301,114 | ||||
| Corporate bonds, net | 2,546,499 | — | ||||||
| Convertible debt, net | 977,521 | 972,490 | ||||||
| Credit facilities | 3,184,000 | 1,969,800 | ||||||
| Other debt, net | 45,826 | 104,804 | ||||||
| Below-market lease liabilities, net | 317,838 | 77,169 | ||||||
| Accounts payable and accrued expenses | 163,025 | 730,571 | ||||||
| Deferred rent, derivative and other liabilities | 127,611 | 40,271 | ||||||
| Distributions payable | 9,995 | 10,903 | ||||||
| Due to affiliates | 559 | 103,434 | ||||||
| Total liabilities | 11,132,809 | 5,310,556 | ||||||
| Commitments and contingencies (Note 17) | ||||||||
| General partner’s Series D Preferred equity, zero and 21,735,008 General Partner Preferred Units issued and outstanding at December 31, 2014 and 2013, respectively | — | 269,299 | ||||||
| Equity: | ||||||||
| General partner’s common equity, 905,544,559 and 239,248,853 General Partner OP Units issued and outstanding at December 31, 2014 and 2013, respectively | 8,157,167 | 1,018,123 | ||||||
| General partner’s preferred equity (excluding Series D Preferred equity), 42,834,138 and 42,199,547 General Partner Preferred Units issued and outstanding at December 31, 2014 and 2013, respectively | 996,987 | 1,054,989 | ||||||
| Limited partners’ common equity, 23,763,797 and 17,832,274 Limited Partner OP Units issued and outstanding at December 31, 2014 and 2013, respectively | 201,102 | 139,083 | ||||||
| Limited partners’ preferred equity, 86,874,000 and 721,465,000 Limited Partner Preferred Units issued and outstanding at December 31, 2014 and 2013, respectively | 3,375 | 16,466 | ||||||
| Total partners’ equity | 9,358,631 | 2,228,661 | ||||||
| Non-controlling interests | 23,699 | 567 | ||||||
| Total equity | 9,382,330 | 2,229,228 | ||||||
| Total liabilities and equity | $ | 20,515,139 | $ | 7,809,083 | ||||
The accompanying notes are an integral part of these statements.
F-11
ARC PROPERTIES OPERATING PARTNERSHIP, L.P.
CONSOLIDATED STATEMENTS OF OPERATIONS
(In thousands, except for unit data)
| Year Ended December 31, | ||||||||||||
| 2014 | 2013 | 2012 | ||||||||||
| Revenues: | ||||||||||||
| Rental income | $ | 1,271,574 | $ | 310,508 | $ | 65,262 | ||||||
| Direct financing lease income | 3,603 | 2,244 | — | |||||||||
| Operating expense reimbursements | 100,522 | 16,571 | 1,945 | |||||||||
| Cole Capital revenue | 203,558 | — | — | |||||||||
| Total revenues | 1,579,257 | 329,323 | 67,207 | |||||||||
| Operating expenses: | ||||||||||||
| Cole Capital reallowed fees and commissions | 66,228 | — | — | |||||||||
| Acquisition related (including $1,652, $37,564 and $28,656 to affiliates, respectively) | 38,831 | 76,113 | 45,070 | |||||||||
| Merger and other non-routine transactions (including $137,778, $156,146 and $0 to affiliates, respectively) | 200,514 | 210,543 | 2,603 | |||||||||
| Property operating | 137,741 | 23,616 | 3,522 | |||||||||
| Management fees to affiliates | 13,888 | 17,462 | 212 | |||||||||
| General and administrative (including $16,089, $103,206 and $826 to affiliates, respectively) | 174,741 | 123,172 | 5,458 | |||||||||
| Depreciation and amortization | 916,003 | 210,976 | 40,957 | |||||||||
| Impairments | 409,991 | 3,346 | — | |||||||||
| Total operating expenses | 1,957,937 | 665,228 | 97,822 | |||||||||
| Operating loss | (378,680 | ) | (335,905 | ) | (30,615 | ) | ||||||
| Other (expense) income: | ||||||||||||
| Interest expense, net | (452,648 | ) | (105,548 | ) | (11,856 | ) | ||||||
| Extinguishment of debt, net | (21,869 | ) | — | — | ||||||||
| Other income, net | 123,529 | 3,824 | 979 | |||||||||
| Loss on derivative instruments, net | (10,570 | ) | (67,946 | ) | — | |||||||
| Loss on held for sale assets and disposition of properties, net | (277,031 | ) | — | — | ||||||||
| Loss on sale of investments in affiliates | — | (411 | ) | — | ||||||||
| Gain (loss) on sale of investments | 6,357 | (1,795 | ) | — | ||||||||
| Total other expenses, net | (632,232 | ) | (171,876 | ) | (10,877 | ) | ||||||
| Net loss from continuing operations | (1,010,912 | ) | (507,781 | ) | (41,492 | ) | ||||||
| Discontinued operations: | ||||||||||||
| Loss from operations of held for sale assets | — | (34 | ) | (145 | ) | |||||||
| Loss on held for sale properties | — | — | (600 | ) | ||||||||
| Net loss from discontinued operations | — | (34 | ) | (745 | ) | |||||||
| Net loss | (1,010,912 | ) | (507,815 | ) | (42,237 | ) | ||||||
| Net loss attributable to non-controlling interests | 154 | — | — | |||||||||
| Net loss attributable to the unitholders | $ | (1,010,758 | ) | $ | (507,815 | ) | $ | (42,237 | ) | |||
| Basic and diluted net loss from continuing operations per unit attributable to common unitholders | $ | (1.36 | ) | $ | (2.39 | ) | $ | (0.40 | ) | |||
| Basic and diluted net loss from discontinued operations per unit attributable to common unitholders | $ | 0.00 | $ | 0.00 | $ | (0.01 | ) | |||||
| Basic and diluted net loss per unit attributable to common unitholders | $ | (1.36 | ) | $ | (2.39 | ) | $ | (0.41 | ) | |||
The accompanying notes are an integral part of these statements.
F-12
ARC PROPERTIES OPERATING PARTNERSHIP, L.P.
CONSOLIDATED STATEMENTS OF COMPREHENSIVE LOSS (In thousands)
| Year Ended December 31, | ||||||||||||
| 2014 | 2013 | 2012 | ||||||||||
| Net loss | $ | (1,010,912 | ) | $ | (507,815 | ) | $ | (42,237 | ) | |||
| Other comprehensive income: | ||||||||||||
| Designated derivatives, fair value adjustments | (7,002 | ) | 11,481 | (3,743 | ) | |||||||
| Unrealized gain (loss) on investment securities, net | 9,716 | 119 | (93 | ) | ||||||||
| Reclassification of previous unrealized gains on investment securities into net loss | (7,652 | ) | — | — | ||||||||
| Total other comprehensive (loss) income | (4,938 | ) | 11,600 | (3,836 | ) | |||||||
| Total comprehensive loss | (1,015,850 | ) | (496,215 | ) | (46,073 | ) | ||||||
| Comprehensive loss attributable to non-controlling interests | 154 | — | — | |||||||||
| Total comprehensive loss attributable to unitholders | $ | (1,015,696 | ) | $ | (496,215 | ) | $ | (46,073 | ) | |||
The accompanying notes are an integral part of these statements.
F-13
ARC PROPERTIES OPERATING PARTNERSHIP, L.P.
CONSOLIDATED STATEMENT OF CHANGES IN EQUITY
(In thousands, except for unit data)
| Preferred Units | Common Units | ||||||||||||||||||||||||||||||||||||||||
| General Partner | Limited Partner | General Partner | Limited Partner | ||||||||||||||||||||||||||||||||||||||
| Number of Units | Capital | Number of Units | Capital | Number of Units | Capital | Number of Units | Capital | Total Partners' Capital | Non-Controlling Interests | Total Capital | |||||||||||||||||||||||||||||||
| Balance, January 1, 2012 | — | $ | — | — | $ | — | 17,162,016 | $ | 137,088 | 310,000 | $ | 3,700 | $ | 140,788 | $ | — | 140,788 | ||||||||||||||||||||||||
| Issuance of Common OP Units | — | — | — | — | 164,775,688 | 1,758,789 | — | — | 1,758,789 | — | 1,758,789 | ||||||||||||||||||||||||||||||
| Issuance of Common OP Units through distribution reinvestment plan | — | — | — | — | 2,686,141 | 27,136 | — | — | 27,136 | — | 27,136 | ||||||||||||||||||||||||||||||
Offering costs, commissions and dealer manager fees (1) | — | — | — | — | — | (218,431 | ) | — | — | (218,431 | ) | — | (218,431 | ) | |||||||||||||||||||||||||||
| Repurchases of Common OP Units | — | — | — | — | (183,119 | ) | (1,953 | ) | — | — | (1,953 | ) | — | (1,953 | ) | ||||||||||||||||||||||||||
| Issuance of Preferred OP Units | 828,472 | 9,000 | — | — | — | — | — | — | 9,000 | — | 9,000 | ||||||||||||||||||||||||||||||
| Excess of ARCT IV Merger considerations over historical cost | 6,161,856 | 154,047 | — | — | — | — | — | — | 154,047 | — | 154,047 | ||||||||||||||||||||||||||||||
| Conversion of Limited Partners’ Common OP Units to General Partner’s Common OP units | — | — | — | — | — | (93,421 | ) | — | — | (93,421 | ) | — | (93,421 | ) | |||||||||||||||||||||||||||
| Distributions declared on Common OP Units | — | — | — | — | 112,950 | 1,230 | — | — | 1,230 | — | 1,230 | ||||||||||||||||||||||||||||||
| Issuance of Limited Partner OP Units, net | — | — | — | — | — | (75,416 | ) | — | — | (75,416 | ) | — | (75,416 | ) | |||||||||||||||||||||||||||
| Contribution transactions | — | — | — | — | — | — | 576,376 | 6,352 | 6,352 | — | 6,352 | ||||||||||||||||||||||||||||||
| Contributions from non-controlling interest holders | — | — | — | — | — | — | 734,973 | 7,375 | 7,375 | — | 7,375 | ||||||||||||||||||||||||||||||
| Distributions to non-controlling interest holders | — | — | — | — | — | — | — | (663 | ) | (663 | ) | — | (663 | ) | |||||||||||||||||||||||||||
| Net loss | — | — | — | — | — | (41,652 | ) | — | (585 | ) | (42,237 | ) | — | (42,237 | ) | ||||||||||||||||||||||||||
| Other comprehensive income | — | — | — | — | — | (3,783 | ) | — | (53 | ) | (3,836 | ) | — | (3,836 | ) | ||||||||||||||||||||||||||
| Balance, December 31, 2012 | 6,990,328 | $ | 163,047 | — | $ | — | 184,553,676 | $ | 1,489,587 | 1,621,349 | $ | 16,126 | $ | 1,668,760 | $ | — | $ | 1,668,760 | |||||||||||||||||||||||
| Issuance of Common OP Units | — | — | — | — | 78,215,719 | 1,253,343 | — | — | 1,253,343 | — | 1,253,343 | ||||||||||||||||||||||||||||||
| Issuance of Common OP Units through distribution reinvestment plan | — | — | — | — | 940,737 | 25,564 | — | — | 25,564 | — | 25,564 | ||||||||||||||||||||||||||||||
Offering costs, commissions and dealer manager fees (1) | — | — | — | — | — | (165,531 | ) | — | — | (165,531 | ) | — | (165,531 | ) | |||||||||||||||||||||||||||
| Repurchases of Common OP Units | — | — | — | — | (28,305,844 | ) | (358,041 | ) | — | — | (358,041 | ) | — | (358,041 | ) | ||||||||||||||||||||||||||
| Issuance of Preferred OP Units | 36,037,691 | 900,942 | 721,465 | 16,466 | — | — | 630,689 | 14,395 | 931,803 | — | 931,803 | ||||||||||||||||||||||||||||||
| Excess of ARCT IV Merger considerations over historical cost | — | — | — | — | — | (558,089 | ) | — | — | (558,089 | ) | — | (558,089 | ) | |||||||||||||||||||||||||||
| Conversion of Limited Partners’ Common OP Units to General Partner's Common OP units | — | — | — | — | 599,233 | 5,800 | (599,233 | ) | (5,800 | ) | — | — | — | ||||||||||||||||||||||||||||
| Conversion of General Partner’s Preferred Units to General Partner’s Common OP Units | (828,472 | ) | (9,000 | ) | — | — | 829,629 | 9,000 | — | — | — | — | — | ||||||||||||||||||||||||||||
| Issuance of Common OP Units in conversion of Convertible Perferred OP Units Series C | — | — | — | — | 1,411,030 | 17,396 | — | — | 17,396 | — | 17,396 | ||||||||||||||||||||||||||||||
| Equity-based compensation | — | — | — | — | 1,004,673 | 7,962 | 8,241,100 | 32,700 | 40,662 | — | 40,662 | ||||||||||||||||||||||||||||||
| Equity component of convertible debt | — | — | — | — | — | 28,559 | — | — | 28,559 | — | 28,559 | ||||||||||||||||||||||||||||||
| Contribution from Advisor | — | — | — | — | — | 2,313 | — | — | 2,313 | — | 2,313 | ||||||||||||||||||||||||||||||
| Distributions declared on Common OP Units | — | — | — | — | — | (259,468 | ) | — | — | (259,468 | ) | — | (259,468 | ) | |||||||||||||||||||||||||||
| Issuance of Common OP Units | — | — | — | — | — | — | 8,029,545 | 107,771 | 107,771 | — | 107,771 | ||||||||||||||||||||||||||||||
| Non-controlling interest retained in Caplease merger | — | — | — | — | — | — | — | — | — | 567 | 567 | ||||||||||||||||||||||||||||||
| Redemption of Common OP Units | — | — | — | — | — | — | (91,176 | ) | (1,152 | ) | (1,152 | ) | — | (1,152 | ) | ||||||||||||||||||||||||||
| Distributions to non-controlling interest holders | — | — | — | — | — | — | — | (9,014 | ) | (9,014 | ) | — | (9,014 | ) | |||||||||||||||||||||||||||
| The consolidated statement of changed in equity continues onto the next page. | |||||||||||||||||||||||||||||||||||||||||
F-14
ARC PROPERTIES OPERATING PARTNERSHIP, L.P.
CONSOLIDATED STATEMENT OF CHANGES IN EQUITY – (Continued)
(In thousands, except for unit data)
| Preferred Units | Common Units | ||||||||||||||||||||||||||||||||||||||||
| General Partner | Limited Partner | General Partner | Limited Partner | ||||||||||||||||||||||||||||||||||||||
| Number of Units | Capital | Number of Units | Capital | Number of Units | Capital | Number of Units | Capital | Total Partners' Capital | Non-Controlling Interests | Total Capital | |||||||||||||||||||||||||||||||
| Net loss | — | $ | — | — | $ | — | — | $ | (491,499 | ) | $ | — | $ | (16,316 | ) | $ | (507,815 | ) | $ | — | $ | (507,815 | ) | ||||||||||||||||||
| Other comprehensive income | — | — | — | — | — | 11,227 | — | 373 | 11,600 | — | 11,600 | ||||||||||||||||||||||||||||||
| Balance, December 31, 2013 | 42,199,547 | $ | 1,054,989 | 721,465 | $ | 16,466 | 239,248,853 | $ | 1,018,123 | 17,832,274 | $ | 139,083 | $ | 2,228,661 | $ | 567 | $ | 2,229,228 | |||||||||||||||||||||||
Issuance of common OP units, net (1) | — | — | — | — | 662,305,318 | 8,930,263 | 7,956,297 | 152,484 | 9,082,747 | — | 9,082,747 | ||||||||||||||||||||||||||||||
| Conversion of Limited Partners’ Common OP Units to General Partner’s Common OP Units | — | — | — | — | 1,108,351 | 16,046 | (1,108,351 | ) | (16,046 | ) | — | — | — | ||||||||||||||||||||||||||||
| Conversion of Limited Partners’ Preferred OP Units to General Partner’s Preferred OP Units | 634,591 | 12,677 | (634,591 | ) | (12,677 | ) | — | — | — | — | — | — | — | ||||||||||||||||||||||||||||
| Issuance of Common OP Units in connection with share awards, net | — | — | — | — | (551,664 | ) | (7,690 | ) | — | — | (7,690 | ) | — | (7,690 | ) | ||||||||||||||||||||||||||
| Equity-based compensation | — | — | — | — | 3,433,701 | 30,261 | — | 1,600 | 31,861 | — | 31,861 | ||||||||||||||||||||||||||||||
| Excess tax benefit | — | — | — | — | — | 4,458 | — | — | 4,458 | — | 4,458 | ||||||||||||||||||||||||||||||
| Distributions to Common OP Units, LTIPs and non-controlling interests | — | — | — | — | — | (824,712 | ) | — | (33,856 | ) | (858,568 | ) | (2,462 | ) | (861,030 | ) | |||||||||||||||||||||||||
| Distributions to Preferred OP Units | — | (70,679 | ) | — | (414 | ) | — | (27,629 | ) | — | — | (98,722 | ) | — | (98,722 | ) | |||||||||||||||||||||||||
| Contributions from non-controlling interest holders | — | — | — | — | — | — | — | — | — | 982 | 982 | ||||||||||||||||||||||||||||||
| Non-controlling interests retained in Cole Merger | — | — | — | — | — | — | — | — | — | 24,766 | 24,766 | ||||||||||||||||||||||||||||||
| Redemption of OP Units | — | — | — | — | — | — | (916,423 | ) | (8,420 | ) | (8,420 | ) | — | (8,420 | ) | ||||||||||||||||||||||||||
| Net loss | — | — | — | — | — | (977,185 | ) | — | (33,573 | ) | (1,010,758 | ) | (154 | ) | (1,010,912 | ) | |||||||||||||||||||||||||
| Other comprehensive loss | — | — | — | — | — | (4,768 | ) | — | (170 | ) | (4,938 | ) | — | (4,938 | ) | ||||||||||||||||||||||||||
| Balance, December 31, 2014 | 42,834,138 | $ | 996,987 | 86,874 | $ | 3,375 | 905,544,559 | $ | 8,157,167 | 23,763,797 | $ | 201,102 | $ | 9,358,631 | $ | 23,699 | $ | 9,382,330 | |||||||||||||||||||||||
_______________________________________________
(1) Includes $2.2 million, $161.8 million and $211.4 million to affiliates for the years ended December 31, 2014, December 31, 2013, and December 31, 2012, respectively.
The accompanying notes are an integral part of these statements.
F-15
ARC PROPERTIES OPERATING PARTNERSHIP, L.P.
CONSOLIDATED STATEMENTS OF CASH FLOWS
(In thousands)
| Year Ended December 31, | ||||||||||||
| 2014 | 2013 | 2012 | ||||||||||
| Cash flows from operating activities: | ||||||||||||
| Net loss | $ | (1,010,912 | ) | $ | (507,815 | ) | $ | (42,237 | ) | |||
| Adjustments to reconcile net loss to net cash provided by (used in) operating activities: | ||||||||||||
| Issuance of common units in connection with the ARCT III and ARCT IV mergers | 92,884 | 107,771 | — | |||||||||
| Depreciation and amortization | 1,007,164 | 238,307 | 43,152 | |||||||||
| Loss on held for sale assets and disposition of properties, net | 277,031 | — | 600 | |||||||||
| Impairments | 409,991 | 3,346 | — | |||||||||
| Equity-based compensation | 31,861 | 100,261 | 1,230 | |||||||||
| Equity in income of unconsolidated entities | 77 | — | — | |||||||||
| Distributions from unconsolidated entities | 8,335 | — | — | |||||||||
| Loss on derivative instruments | 10,570 | (1,739 | ) | — | ||||||||
| (Gain) loss on sale of investments, net | (6,357 | ) | 2,206 | — | ||||||||
| Loss on extinguishment of debt | (14,012 | ) | — | — | ||||||||
| Loss on extinguishment of Series C Stock | — | 13,749 | — | |||||||||
| Note receivable issued in legal settlement | (15,300 | ) | — | — | ||||||||
| Changes in assets and liabilities: | ||||||||||||
| Investment in direct financing leases | 1,597 | 2,505 | — | |||||||||
| Deferred costs, intangible and other assets, net | (97,125 | ) | (19,851 | ) | (5,089 | ) | ||||||
| Due from affiliates | (32,821 | ) | — | — | ||||||||
| Accounts payable and accrued expenses | (16,279 | ) | 20,789 | 8,277 | ||||||||
| Deferred rent, derivative and other liabilities | (99,930 | ) | 8,555 | 3,507 | ||||||||
| Due to affiliates | (43,887 | ) | 43,834 | — | ||||||||
| Net cash provided by operating activities | 502,887 | 11,918 | 9,440 | |||||||||
| Cash flows from investing activities: | ||||||||||||
| Investments in real estate and other assets | (3,539,906 | ) | (3,520,412 | ) | (1,659,536 | ) | ||||||
| Acquisition of a real estate business, net of cash acquired | (756,232 | ) | (878,898 | ) | — | |||||||
| Investment in direct financing leases | — | (68,617 | ) | — | ||||||||
| Capital expenditures | (34,687 | ) | (9,755 | ) | (54 | ) | ||||||
| Real estate developments | (72,515 | ) | — | — | ||||||||
| Principal repayments received from borrowers | 77,614 | 442 | — | |||||||||
| Investments in unconsolidated entities | (2,500 | ) | — | — | ||||||||
| Proceeds from disposition of properties | 1,598,767 | — | 553 | |||||||||
| Investment in leasehold improvements, property and equipment | (11,890 | ) | (543 | ) | — | |||||||
| Deposits for real estate investments | (265,372 | ) | (101,887 | ) | (638 | ) | ||||||
| Uses and refunds of deposits for real estate investments | 347,971 | — | — | |||||||||
| Purchases of investment securities | — | (81,590 | ) | (41,747 | ) | |||||||
| Line of credit advances to affiliates | (125,000 | ) | — | — | ||||||||
| Line of credit repayments from affiliates | 81,100 | — | — | |||||||||
| Investment in loans held for investment | (2,952 | ) | — | — | ||||||||
| Proceeds from sale of investment securities | 159,752 | 119,542 | — | |||||||||
| Change in restricted cash | (8,606 | ) | — | — | ||||||||
| Net cash used in investing activities | (2,554,456 | ) | (4,541,718 | ) | (1,701,422 | ) | ||||||
| Cash flows from financing activities: | ||||||||||||
| Proceeds from mortgage notes payable | 1,010,219 | 6,924 | 229,798 | |||||||||
| Payments on mortgage notes payable | (1,143,503 | ) | (5,711 | ) | — | |||||||
| Payments on other debt | (112,003 | ) | (9,368 | ) | — | |||||||
| Proceeds from credit facilities | 5,824,000 | 2,678,800 | 82,319 | |||||||||
| Payments on credit facilities | (5,918,800 | ) | (954,604 | ) | (122 | ) | ||||||
| Proceeds from corporate bonds | 2,545,760 | — | — | |||||||||
| Payments of deferred financing costs | (116,373 | ) | (101,196 | ) | (13,974 | ) | ||||||
| Proceeds from issuance of convertible debt | — | 967,786 | — | |||||||||
| The consolidated statements of cash flows continue onto the next page. | ||||||||||||
F-16
ARC PROPERTIES OPERATING PARTNERSHIP, L.P.
CONSOLIDATED STATEMENTS OF CASH FLOWS – (Continued)
(In thousands)
| Year Ended December 31, | ||||||||||||
| 2014 | 2013 | 2012 | ||||||||||
| Repurchases of OP units | $ | (7,690 | ) | $ | (359,193 | ) | $ | (1,534 | ) | |||
| Proceeds from issuances of preferred units | — | — | 9,000 | |||||||||
| Proceeds from issuance of Series C Stock | — | 445,000 | — | |||||||||
| Proceeds from issuances of OP units, net of offering costs | 1,595,045 | 1,993,159 | 1,691,412 | |||||||||
| Cash payment on settlement of Series C Stock | — | (441,353 | ) | — | ||||||||
| Proceeds from issuance of Series D Preferred Stock | — | 287,991 | — | |||||||||
| Redemption of Series D Preferred Stock | (316,126 | ) | — | — | ||||||||
| Contributions from non-controlling interest holders | 982 | 30,861 | 7,375 | |||||||||
| Distributions to non-controlling interest holders | (30,150 | ) | (8,219 | ) | (663 | ) | ||||||
| Distributions paid | (920,264 | ) | (234,897 | ) | (37,673 | ) | ||||||
| Windfall tax benefit | 4,458 | — | — | |||||||||
| Payments from affiliates, net | — | (376 | ) | 396 | ||||||||
| Change in restricted cash | — | (5,654 | ) | (1,108 | ) | |||||||
| Net cash provided by financing activities | 2,415,555 | 4,289,950 | 1,965,226 | |||||||||
| Net change in cash and cash equivalents | 363,986 | (239,850 | ) | 273,244 | ||||||||
| Cash and cash equivalents, beginning of period | 52,725 | 292,575 | 19,331 | |||||||||
| Cash and cash equivalents, end of period | $ | 416,711 | $ | 52,725 | $ | 292,575 | ||||||
| Supplemental Disclosures: | ||||||||||||
| Cash paid for interest | $ | 330,652 | $ | 49,549 | $ | 8,983 | ||||||
| Cash paid for income taxes | $ | 7,616 | $ | 1,711 | $ | 173 | ||||||
| Non-cash investing and financing activities: | ||||||||||||
| OP units issued to acquire real estate investments | $ | — | $ | — | $ | 6,352 | ||||||
| Accrued capital expenditures and real estate developments | $ | 6,868 | $ | — | $ | — | ||||||
| Common stock issued through distribution reinvestment plan | $ | — | $ | 25,568 | $ | 27,136 | ||||||
The accompanying notes are an integral part of these statements.
F-17
AMERICAN REALTY CAPITAL PROPERTIES, INC. AND ARC PROPERTIES OPERATING PARTNERSHIP, L.P.
NOTES TO CONSOLIDATED FINANCIAL STATEMENTS
December 31, 2014
Note 1 – Organization
American Realty Capital Properties, Inc. (the “General Partner” or “ARCP”) is a self-managed Maryland corporation incorporated on December 2, 2010 that qualified as a real estate investment trust (“REIT”) for U.S. federal income tax purposes beginning in the taxable year ended December 31, 2011. On September 6, 2011, ARCP completed its initial public offering (the “IPO”). ARCP’s common stock trades on the NASDAQ Global Select Market (“NASDAQ”) under the symbol “ARCP.”
The Company (as defined below) operates through two business segments, Real Estate Investment (“REI”) and its private capital management business, Cole Capital (“Cole Capital”), as further discussed in Note 5 – Segment Reporting. Through the REI segment, the Company acquires, owns and operates single-tenant, freestanding, commercial real estate properties, primarily subject to long-term net leases with high credit quality tenants. The Company seeks to acquire net lease assets by self- originating individual or small portfolio acquisitions, by executing sale-leaseback transactions, and in connection with build-to-suit or forward take-out opportunities, to the extent they are appropriate in terms of capitalization rate and scale. Previously, the Company advanced its investment objectives by not only growing its net lease portfolio through granular, self-originated acquisitions, but also through strategic mergers and acquisitions. See Note 2 – Mergers and Significant Acquisitions and Sales to the consolidated financial statements in this report.
Cole Capital is contractually responsible for managing the Managed REITs’ (as defined in Note 3 - Summary of Significant Accounting Policies) affairs on a day-to-day basis, identifying and making acquisitions and investments on the Managed REITs’ behalf and recommending to each of the Managed REIT’s respective board of directors an approach for providing investors with liquidity. Cole Capital receives compensation and reimbursement for services relating to these services.
ARCP is the sole general partner of ARC Properties Operating Partnership, L.P. (together with its subsidiaries, the “Operating Partnership” or the “OP”), a Delaware limited partnership, which was formed on January 13, 2011 to conduct the primary business of acquiring, owning and operating single-tenant, freestanding commercial real estate properties. The Operating Partnership is the entity through which substantially all of the General Partner’s operations are conducted. Together, the General Partner, with the Operating Partnership and their consolidated subsidiaries are known as the “Company.”
The actions of the Operating Partnership and its relationship with ARCP are governed by that certain Third Amended and Restated Agreement of Limited Partnership, effective as of January 3, 2014, as amended (the “LPA”). The General Partner does not have any significant assets other than its investment in the Operating Partnership. Therefore, the assets and liabilities of the General Partner and the Operating Partnership are substantially the same. Additionally, pursuant to the LPA, all administrative expenses and expenses associated with the formation and continuity of existence and operation of the General Partner incurred by the General Partner on the Operating Partnership’s behalf shall be treated as expenses of the Operating Partnership. Further, when the General Partner issues any equity instrument that has been approved by the General Partner’s board of directors, the LPA requires the Operating Partnership to issue to the General Partner equity instruments with substantially similar terms, to protect the integrity of the Company’s umbrella partnership REIT structure, pursuant to which each holder of interests in the Operating Partnership has a proportionate economic interest in the Operating Partnership reflecting its capital contributions thereto. OP Units (as defined below) issued to the General Partner are referred to as General Partner OP Units. OP Units issued to parties other than the General Partner are referred to as Limited Partner OP Units. The LPA also provides that the Operating Partnership issue debt that mirrors debt issued by ARCP. The LPA will be amended to provide for the issuance of any additional class of equivalent equity instruments to the extent the General Partner’s board of directors authorizes the issuance of any new class of equity securities.
Substantially all of the Company’s REI segment is conducted through the OP. ARCP is the sole general partner and holder of 97.4% of the common equity interests in the OP as of December 31, 2014 with the remaining 2.6% of the common equity interests owned by certain unaffiliated investors. Under the LPA, after holding units of limited partner interests in the OP (“OP Units”) for a period of one year, unless otherwise consented to by ARCP, holders of OP Units have the right to redeem the OP Units for the cash value of a corresponding number of shares of ARCP’s common stock or, at the option of ARCP, a corresponding number of shares of ARCP’s common stock. The remaining rights of the holders of OP Units are limited, however, and do not include the ability to replace the General Partner or to approve the sale, purchase or refinancing of the OP’s assets. Substantially all of the Cole Capital segment is conducted through Cole Capital Advisors, Inc. (“CCA”), an Arizona corporation and a wholly owned subsidiary of the OP. CCA is treated as a taxable REIT subsidiary (“TRS”) under Section 856 of the Internal Revenue Code of 1986, as amended (the “Internal Revenue Code”).
Prior to January 8, 2014, ARC Properties Advisors, LLC (the “Former Manager”), a wholly owned subsidiary of AR Capital, LLC (“ARC”), managed the Company’s affairs on a day-to-day basis, with the exception of certain acquisition, accounting and
F-18
AMERICAN REALTY CAPITAL PROPERTIES, INC. AND ARC PROPERTIES OPERATING PARTNERSHIP, L.P.
NOTES TO CONSOLIDATED FINANCIAL STATEMENTS
December 31, 2014 – (Continued)
portfolio management services performed by employees of the Company. In August 2013, the Company’s board of directors determined that it was in the best interest of the Company and its stockholders to become self-managed, and the Company completed its transition to self-management on January 8, 2014. In connection with becoming self-managed, ARCP terminated the management agreement with the Former Manager and ARCP and the OP entered into employment and incentive compensation arrangements with ARCP executives. See Note 20 – Related Party Transactions and Arrangements for further discussion.
As discussed in Note 2 – Mergers and Significant Acquisitions and Sales, on January 3, 2014, the Company acquired American Realty Capital Trust IV, Inc. (“ARCT IV”). The Company and ARCT IV, from the date of the Company’s inception to January 3, 2014, were considered to be entities under common control because the entities’ advisors were wholly-owned subsidiaries of ARC. ARC and its related parties had ownership interests in the Company and ARCT IV through the ownership of shares of common stock and other equity interests. In addition, the advisors of the entities were contractually eligible to receive potential fees for their services from the companies, including asset management fees, incentive fees and other fees and had continued to receive fees from the Company prior to the Company’s transition to self-management, which was completed on January 8, 2014. Due to the significance of these fees, the entities’ advisors and ultimately ARC were determined to have a significant economic interest in both companies, in addition to having the power to direct the activities of the companies through advisory/management agreements, which qualified them as affiliated companies under common control in accordance with generally accepted accounting principles in the United States (“U.S. GAAP”). Accordingly, the balances represented throughout these financial statements have been recast in applying the carryover basis of accounting to include ARCT IV at inception.
On March 2, 2015, ARCP restated its consolidated financial statements as of and for the years ended December 31, 2013 and 2012 and quarterly periods ended March 31, 2014 and 2013, June 30, 2014 and 2013 and September 30, 2013 and the OP restated and amended its consolidated financial statements and related financial information as of and for the years ended December 31, 2013 and 2012 and the quarterly periods ended June 30, 2014 and 2013 to correct errors that were identified as a result of an investigation conducted by the Audit Committee of the Company’s Board of Directors (the “Audit Committee Investigation”), as well as certain other errors that were identified by the Company’s new management. In addition, the restatement reflected corrections of certain immaterial errors and certain previously identified errors that were identified by the Company in the normal course of business and were determined to be immaterial, both individually and in the aggregate, when the consolidated financial statements were originally issued. This restated and corrected data and the restated financial statements for the years ended December 31, 2013 and 2012 and quarterly periods ended March 31, 2014 and 2013, and June 30, 2014 and 2013 and September 30, 2013 are included in these consolidated financial statements and accompanying notes. See Amendment No. 2 to the Company’s Annual Report on Form 10-K/A filed on March 2, 2015 for additional information about the Audit Committee Investigation and reconciliations of the amounts as originally reported to the corresponding restated amounts.
Note 2 – Mergers and Significant Acquisitions and Sales
American Realty Capital Trust III, Inc. Merger
On December 14, 2012, ARCP entered into an Agreement and Plan of Merger (the “ARCT III Merger Agreement”) with ARCT III and certain subsidiaries of each company. The ARCT III Merger Agreement provided for the merger of ARCT III with and into a subsidiary of ARCP (the “ARCT III Merger”). The ARCT III Merger was consummated on February 28, 2013 (the “ARCT III Merger Date”).
Pursuant to the terms and subject to the conditions set forth in the ARCT III Merger Agreement, each outstanding share of common stock of ARCT III, including restricted shares that became vested, was converted into the right to receive (i) 0.95 of a share of ARCP’s common stock (the “ARCT III Exchange Ratio”) or (ii) $12.00 in cash. In addition, each outstanding unit of equity ownership of ARCT III’s operating partnership (the “ARCT III OP”) was converted into the right to receive 0.95 of the same class of unit of equity ownership in the OP.
Upon the closing of the ARCT III Merger on February 28, 2013, the Company paid an aggregate of $350 million in cash for 29.2 million shares that elected cash consideration, or 16.5% of the then outstanding shares of ARCT III’s common stock (which is equivalent to 27.7 million shares of ARCP’s common stock based on the ARCT III Exchange Ratio). In addition, 140.7 million shares of ARCP’s common stock were issued in exchange for 148.1 million shares of ARCT III’s common stock adjusted for the ARCT III Exchange Ratio. In accordance with the LPA, the OP issued a corresponding number of General Partner OP Units to ARCP when ARCP issued common stock to former common stockholders of ARCT III.
Upon the consummation of the ARCT III Merger, American Realty Capital Trust III Special Limited Partner, LLC (the “ARCT III Special Limited Partner”), the holder of the special limited partner interest in the ARCT III OP, was entitled to subordinated distributions of net sales proceeds from the ARCT III OP, which resulted in the issuance of units of limited partner interests in the
F-19
AMERICAN REALTY CAPITAL PROPERTIES, INC. AND ARC PROPERTIES OPERATING PARTNERSHIP, L.P.
NOTES TO CONSOLIDATED FINANCIAL STATEMENTS
December 31, 2014 – (Continued)
ARCT III OP. After applying the ARCT III Exchange Ratio, this distribution resulted in the issuance of an additional 7.3 million OP Units to affiliates of the Former Manager. The parties had agreed that such OP Units would be subject to a minimum one-year holding period from the date of issuance before being redeemable by the holder for cash or, at the option of ARCP, common stock of ARCP.
Also in connection with the ARCT III Merger, the Company entered into an agreement with the Former Manager and its affiliates to internalize certain functions performed by them prior to the ARCT III Merger, reduce certain fees paid to affiliates and pay certain merger related fees. See Note 20 – Related Party Transactions and Arrangements.
Accounting Treatment for the ARCT III Merger
The Company and ARCT III, from inception to the ARCT III Merger Date, were considered to be entities under common control. Both entities’ advisors were wholly owned subsidiaries of ARC. ARC and its related parties had significant ownership interests in the Company and ARCT III through the ownership of shares of common stock and other equity interests. In addition, the advisors of the Company and ARCT III were contractually eligible to receive potential fees for their services to both companies, including asset management fees, incentive fees and other fees, and continued to receive fees from the Operating Partnership, on behalf of ARCP, prior to ARCP’s transition to self-management. Due to the significance of these fees, the advisors and ultimately ARC were determined to have a significant economic interest in both companies in addition to having the power to direct the significant activities of the companies through advisory/management agreements, which qualified them as affiliated companies under common control in accordance with U.S. GAAP. The acquisition of an entity under common control is accounted for on the carryover basis of accounting, whereby the assets and liabilities of the companies are recorded upon the merger on the same basis as they were carried by the companies on the ARCT III Merger Date. In addition, U.S. GAAP requires the Company to present historical financial information as if the merger had occurred as of the earliest period of common control. Therefore, the accompanying consolidated financial statements including the notes thereto, are presented as if the ARCT III Merger had occurred at the earliest period presented.
GE Capital Portfolio Acquisitions
On June 27, 2013, the Company acquired, through subsidiaries of the OP, from certain affiliates of GE Capital Corp., the equity interests in the entities that own a real estate portfolio comprised of 447 properties (the “GE Capital Portfolio”) for a purchase price of $773.9 million, exclusive of closing costs, with no liabilities assumed. The 447 properties are subject to 409 property operating leases, as well as 38 direct financing leases.
During the year ended December 31, 2013, ARCT IV acquired, from certain affiliates of GE Capital Corp., the equity interests in the entities that own a real estate portfolio comprised of 924 properties (the “ARCT IV GE Capital Portfolio”) for a purchase price of $1.4 billion, exclusive of closing costs, with no liabilities assumed. The 924 properties are subject to 912 property operating leases, as well as 12 direct financing leases.
CapLease, Inc. Merger
On May 28, 2013, ARCP entered into an Agreement and Plan of Merger (the “CapLease Merger Agreement”) with CapLease Inc. (“CapLease”), a Maryland corporation, and certain subsidiaries of each company. The CapLease Merger Agreement provided for the merger of CapLease with and into a subsidiary of ARCP (the “CapLease Merger”).
On November 5, 2013, ARCP consummated the CapLease Merger. Pursuant to the terms of the CapLease Merger Agreement, each outstanding share of common stock of CapLease, other than shares owned by ARCP, CapLease or any of their respective wholly owned subsidiaries, was converted into the right to receive $8.50. Each outstanding share of preferred stock of CapLease, other than shares owned by ARCP, CapLease or any of their respective wholly owned subsidiaries, was converted into the right to receive an amount in cash equal to the sum of $25.00 plus all accrued and unpaid dividends on such shares of preferred stock. In addition, in connection with the merger of Caplease, LP with and into the OP, each outstanding unit of equity ownership of CapLease’s operating partnership, other than units owned by CapLease, the OP, or any other of their respective wholly owned subsidiaries, was converted into the right to receive $8.50. Shares of CapLease’s outstanding restricted stock were accelerated and became fully vested, and restricted stock and any outstanding performance shares were fully earned and received $8.50 per share. In total, cash consideration of $920.7 million was paid to CapLease’s common and preferred shareholders.
Accounting Treatment for the CapLease Merger
The CapLease Merger has been accounted for under the acquisition method of accounting in accordance with U.S. GAAP. Under the acquisition method of accounting, the assets acquired and liabilities assumed from CapLease have been recorded, as of the acquisition date, at their respective fair values. Any excess of purchase price over the fair values is recorded as goodwill. Results
F-20
AMERICAN REALTY CAPITAL PROPERTIES, INC. AND ARC PROPERTIES OPERATING PARTNERSHIP, L.P.
NOTES TO CONSOLIDATED FINANCIAL STATEMENTS
December 31, 2014 – (Continued)
of operations for CapLease are included in ARCP’s consolidated financial statements from the date of acquisition.
American Realty Capital Trust IV, Inc. Merger
On July 1, 2013, the General Partner entered into an Agreement and Plan of Merger, as amended on October 6, 2013 and October 11, 2013 (the “ARCT IV Merger Agreement”), with ARCT IV, and certain subsidiaries of each company. The ARCT IV Merger Agreement provided for the merger of ARCT IV with and into a subsidiary of the OP (the “ARCT IV Merger”). The ARCT IV Merger was consummated on January 3, 2014 (the “ARCT IV Merger Date”).
Pursuant to the terms of the ARCT IV Merger Agreement, as amended, each outstanding share of common stock of ARCT IV, including unvested restricted shares that vested in conjunction with the ARCT IV Merger, was exchanged for (i) $9.00 in cash, (ii) 0.5190 of a share of ARCP’s common stock (the “ARCT IV Exchange Ratio”) and (iii) 0.5937 of a share of a new series of preferred stock designated as the 6.70% Series F Cumulative Redeemable Preferred Stock (“Series F Preferred Stock”) and each outstanding unit of ARCT IV’s operating partnership (each, an “ARCT IV OP Unit”), other than ARCT IV OP Units held by American Realty Capital Trust IV Special Limited Partner, LLC (the “ARCT IV Special Limited Partner”), and American Realty Capital Advisors IV, LLC (the “ARCT IV Advisor”) was exchanged for (i) $9.00 in cash, (ii) 0.5190 of a Limited Partner OP Unit and (iii) 0.5937 of a Limited Partner OP Unit designated as Series F Preferred Units (“Limited Partner Series F OP Units”). In total, the Operating Partnership, on ARCP’s behalf, paid $651.4 million in cash, ARCP issued 36.9 million shares of common stock and 42.2 million shares of Series F Preferred Stock to the former ARCT IV shareholders, and the Operating Partnership issued 0.7 million units of Limited Partner Series F OP units and 0.6 million Limited Partner OP Units to the former ARCT IV OP Unit holders in connection with the consummation of the ARCT IV Merger. In addition, each outstanding ARCT IV Class B Unit (as defined below) and each outstanding ARCT IV OP Unit held by the ARCT IV Special Limited Partner and the ARCT IV Advisor was converted into 2.3961 Limited Partner OP Units, resulting in the OP issuing 1.2 million Limited Partner OP Units. In accordance with the LPA, the OP issued a corresponding number of General Partner OP Units and General Partner Series F Preferred Units to ARCP when shares of ARCP’s common stock and Series F Preferred Stock were issued to former common stockholders of ARCT IV, respectively.
On January 3, 2014, the OP entered into a Contribution and Exchange Agreement (the “ARCT IV Contribution and Exchange Agreement”) with the ARCT IV OP, the ARCT IV Special Limited Partner and ARC Real Estate Partners, LLC (“ARC Real Estate”), an entity under common ownership with the Former Manager. The ARCT IV Special Limited Partner was entitled to receive certain distributions from the ARCT IV OP, including the subordinated distribution of net sales proceeds resulting from an “investment liquidity event” (as defined in the agreement of limited partnership of the ARCT IV OP). The ARCT IV Merger constituted an “investment liquidity event,” as a result of which the ARCT IV Special Limited Partner, in connection with management’s successful attainment of the 6.0% performance hurdle and the return to ARCT IV’s stockholders of $358.3 million in addition to their initial investment, received a subordinated distribution of net sales proceeds from the ARCT IV OP equal to $63.2 million. Pursuant to the ARCT IV Contribution and Exchange Agreement, the ARCT IV Special Limited Partner contributed its interest in the ARCT IV OP, inclusive of the subordinated distribution proceeds received, to the ARCT IV OP in exchange for 2.8 million equity units of the ARCT IV OP, based on a price per share of $22.50. The fair value of these units at date of issuance was $78.2 million and has been included in merger and other non-routine transactions in the accompanying consolidated statement of operations for the year ended December 31, 2014. Upon consummation of the ARCT IV Merger, these equity units were immediately converted to 6.7 million Limited Partner OP Units after application of the exchange ratio of 2.3961 per ARCT IV OP Unit. In conjunction with the ARCT IV Merger Agreement, the ARCT IV Special Limited Partner agreed to a minimum two-year holding period for these Limited Partner OP Units before being redeemable by the holder for cash or, at the option of the General Partner, the common stock of ARCP.
In addition, as part of the ARCT IV Contribution and Exchange Agreement, ARC Real Estate contributed $750,000 in cash to the ARCT IV OP, effective prior to the consummation of the ARCT IV Merger, in exchange for ARCT IV OP Units. Upon the consummation of the ARCT IV Merger, these equity units converted at an exchange ratio of 2.3961 Limited Partner OP Units per ARCT IV OP Unit, resulting in the Operating Partnership issuing 0.1 million Limited Partner OP Units to ARC Real Estate.
Accounting Treatment for the ARCT IV Merger
The Company and ARCT IV, from inception to the ARCT IV Merger Date, were considered to be entities under common control. Both entities’ advisors were wholly owned subsidiaries of ARC. ARC and its related parties had ownership interests in the Company and ARCT IV through the ownership of shares of common stock, OP Units and other equity interests. In addition, the advisors of both entities were contractually eligible to receive potential fees for their services to both of the companies including asset management fees, incentive fees and other fees and had continued to receive fees from the OP prior to ARCP’s transition to self-management. Due to the significance of these fees, the advisors and ultimately ARC were determined to have a significant economic interest in both companies in addition to having the power to direct the activities of the companies through advisory/
F-21
AMERICAN REALTY CAPITAL PROPERTIES, INC. AND ARC PROPERTIES OPERATING PARTNERSHIP, L.P.
NOTES TO CONSOLIDATED FINANCIAL STATEMENTS
December 31, 2014 – (Continued)
management agreements, which qualified them as affiliated companies under common control in accordance with U.S. GAAP. The acquisition of an entity under common control is accounted for on the carryover basis of accounting, whereby the assets and liabilities of the companies are recorded upon the merger on the same basis as they were carried by the companies on the ARCT IV Merger Date. In addition, U.S. GAAP requires the Company to present historical financial information as of the earliest period of common control. Therefore, the accompanying consolidated financial statements including the notes thereto are presented as if the ARCT IV Merger, including the impact of the equity transactions entered into to consummate the merger, had occurred at the earliest period presented.
Fortress Portfolio Acquisition
On July 24, 2013, ARC and another related entity, on behalf of the Company and certain other entities sponsored directly or indirectly by ARC, entered into a purchase and sale agreement with affiliates of funds managed by Fortress Investment Group LLC (“Fortress”) for the purchase of 196 properties owned by Fortress, for an aggregate contract purchase price of $972.5 million, subject to adjustments set forth in the purchase and sale agreement and exclusive of closing costs, which were allocated to the Company based on the pro rata fair value of the properties acquired by the Company relative to the fair value of all 196 properties sold by Fortress. Of the 196 properties, 120 properties were allocated to the Company (the “Fortress Portfolio”). On October 1, 2013, the Company closed on 41 of the 120 properties with a total purchase price of $200.3 million, exclusive of closing costs. On January 8, 2014, the Company closed the acquisition of the remaining 79 properties in the Fortress Portfolio, for an aggregate contract purchase price of $400.9 million, exclusive of closing costs. The total purchase price of the Fortress Portfolio was $601.2 million, exclusive of closing costs.
Cole Real Estate Investments, Inc. Merger
On October 22, 2013, ARCP and a wholly owned subsidiary entered into an agreement and plan of merger (the “Cole Merger Agreement”) with Cole Real Estate Investments, Inc. (“Cole”), a publicly traded Maryland corporation. The Cole Merger Agreement provided for the merger of Cole with and into a wholly owned subsidiary of ARCP (the “Cole Merger”). The Cole Merger was consummated on February 7, 2014 (the “Cole Acquisition Date”).
Pursuant to the terms of the Cole Merger Agreement, each share of common stock of Cole issued and outstanding immediately prior to the effectiveness of the Cole Merger, including unvested restricted stock units and performance stock units that vested in conjunction with the Cole Merger, other than shares owned by ARCP, any subsidiary of ARCP or any wholly owned subsidiary of Cole, was converted into the right to receive either (i) 1.0929 shares of ARCP’s common stock (the “Stock Consideration”) or (ii) $13.82 in cash (the “Cash Consideration” and together with the Stock Consideration, the “Merger Consideration”). Holders of approximately 98% of outstanding Cole shares elected to receive Stock Consideration and holders of approximately 2% of outstanding Cole shares elected to receive Cash Consideration, pursuant to the terms of the Cole Merger Agreement, resulting in ARCP issuing approximately 520.8 million shares of common stock and paying $181.8 million in cash to Cole’s shareholders based on their elections. In accordance with the LPA, the Operating Partnership issued a corresponding number of General Partner OP Units to ARCP when shares of ARCP’s common stock were issued to former common stockholders of Cole.
In addition, ARCP issued approximately 2.8 million shares of common stock, in the aggregate, to certain executives of Cole pursuant to letter agreements entered into between the Company and such individuals, concurrently with the execution of the Cole Merger Agreement. Additionally, effective as of the Cole Acquisition Date, ARCP issued, but had not yet allocated, 0.4 million shares with dividend equivalent rights commensurate with ARCP’s common stock. In accordance with the LPA, the Operating Partnership issued a corresponding number of General Partner OP Units to ARCP when shares of ARCP’s common stock were issued to former executives of Cole.
The fair value of the consideration transferred at the Cole Acquisition Date totaled $7.5 billion and consisted of the following (in thousands):
| As of Cole Acquisition Date | |||
| Fair value of consideration transferred: | |||
| Cash | $ | 181,775 | |
| Common stock | 7,285,868 | ||
| Total consideration transferred | $ | 7,467,643 | |
The fair value of the 520.8 million shares of common stock issued, excluding those common shares transferred to former Cole executives, was determined based on the closing market price of the Company’s common stock on the Cole Acquisition Date.
F-22
AMERICAN REALTY CAPITAL PROPERTIES, INC. AND ARC PROPERTIES OPERATING PARTNERSHIP, L.P.
NOTES TO CONSOLIDATED FINANCIAL STATEMENTS
December 31, 2014 – (Continued)
Accounting Treatment for the Cole Merger
The Cole Merger has been accounted for under the acquisition method of accounting under U.S. GAAP. Under the acquisition method of accounting, the assets acquired and liabilities assumed from Cole have been recorded as of the acquisition date at their respective fair values. Any excess of purchase price over the fair values is recorded as goodwill. Results of operations for Cole are included in the Company’s consolidated financial statements subsequent to the Cole Acquisition Date. During the three months ended December 31, 2014, we recorded significant impairment charges. See Note 3 – Summary of Significant Accounting Policies for discussion on impairment charges.
Inland Portfolio Acquisition
On August 8, 2013, ARC and another related entity, on behalf of the Company and certain other entities sponsored directly or indirectly by ARC, entered into a purchase and sale agreement with Inland American Real Estate Trust, Inc. (“Inland”) for the purchase of the equity interests of 67 companies owned by Inland for an aggregate contract purchase price of $2.3 billion, subject to adjustments set forth in the purchase and sale agreement and exclusive of closing costs. Of the 67 companies, the equity interests of 10 companies holding in the aggregate 33 properties (the “Inland Portfolio”) were allocated to the Company for a purchase price of $501.0 million, subject to adjustments set forth in the purchase and sale agreement and exclusive of closing costs, which were allocated to the Company based on the pro rata fair value of the Inland Portfolio relative to the fair value of all 67 companies sold by Inland. As of December 31, 2014, the Company had closed on 32 of the 33 properties for a total purchase price of $288.2 million, exclusive of closing costs. The Company will not close on the remaining one property.
Cole Credit Property Trust, Inc. Merger
On March 17, 2014, the General Partner and a wholly owned subsidiary entered into an Agreement and Plan of Merger (the “CCPT Merger Agreement”) with Cole Credit Property Trust, Inc., a Maryland corporation (“CCPT”). The CCPT Merger Agreement provided for the merger of CCPT with and into a direct subsidiary of the General Partner (the “CCPT Merger”). The CCPT Merger was consummated on May 19, 2014 (the “CCPT Acquisition Date”). The fair value of the consideration transferred at the CCPT Acquisition Date totaled $73.2 million, which was paid in cash.
Pursuant to the CCPT Merger Agreement, the General Partner commenced a cash tender offer to purchase all of the outstanding shares of common stock of CCPT (the “CCPT Common Stock”) (other than shares owned by CCPT, the General Partner or any subsidiary of the Company), upon the terms and subject to the conditions set forth in the Offer to Purchase, dated March 31, 2014, and the related Letter of Transmittal (together with any amendments or supplements to the foregoing, the “Offer”), at a price of $7.25 per share (the “Offer Price”), net to the seller in cash, without interest, less any applicable withholding tax. On May 19, 2014, the General Partner accepted for payment and paid for all shares of CCPT Common Stock that were validly tendered in the Offer. As of the expiration of the Offer, a total of 7,735,069 shares of CCPT Common Stock were validly tendered and not withdrawn, representing approximately 77% of the shares of CCPT Common Stock outstanding.
Immediately following the acceptance for payment and payment for the shares of CCPT Common Stock that were validly tendered in the Offer, ARCP exercised its option (the “Top-Up Option”), granted pursuant to the CCPT Merger Agreement, to purchase, at a price per share equal to the Offer Price, 13,457,874 newly issued shares of CCPT Common Stock (collectively, the “Top-Up Shares”). The Top-Up Shares, taken together with the shares of CCPT Common Stock owned, directly or indirectly, by ARCP and its subsidiaries immediately following the acceptance for payment and payment for the shares of CCPT Common Stock that were validly tendered in the Offer, constituted one share more than 90% of the outstanding shares of CCPT Common Stock (after giving effect to the issuance of all shares subject to the Top-Up Option), the applicable threshold required to effect a short-form merger under applicable Maryland law without stockholder approval.
Following the consummation of the Offer and the exercise of the Top-Up Option, in accordance with the CCPT Merger Agreement, ARCP completed its acquisition of CCPT by effecting of a short-form merger under Maryland law, pursuant to which CCPT was merged with and into a subsidiary of ARCP, with the subsidiary surviving the merger as a wholly owned subsidiary of ARCP. The CCPT Merger became effective following the filing of the Articles of Merger with the State Department of Assessments and Taxation of Maryland and the filing of the Certificate of Merger with the Secretary of State of the State of Delaware with an effective date of May 19, 2014 (the “Effective Time”).
At the Effective Time, each share of CCPT Common Stock not purchased in the Offer (other than shares held by the CCPT, ARCP or any subsidiary of ARCP, which were automatically canceled and retired and ceased to exist) was converted into the right to receive an amount, in cash and without interest, equal to the Offer Price.
F-23
AMERICAN REALTY CAPITAL PROPERTIES, INC. AND ARC PROPERTIES OPERATING PARTNERSHIP, L.P.
NOTES TO CONSOLIDATED FINANCIAL STATEMENTS
December 31, 2014 – (Continued)
Accounting Treatment for the CCPT Merger
The CCPT Merger has been accounted for under the acquisition method of accounting under U.S. GAAP. Under the acquisition method of accounting, the assets acquired and liabilities assumed from CCPT have been recorded as of the acquisition date at their respective fair values. Any excess of purchase price over the fair values is recorded as goodwill. Results of operations for CCPT are included in the Company’s consolidated financial statements subsequent to the CCPT Acquisition Date.
Red Lobster Portfolio Acquisition
On May 15, 2014, the Operating Partnership, through a wholly owned subsidiary, entered into a master purchase agreement to acquire over 500 properties, substantially all of which are operating as Red Lobster® restaurants (the “Red Lobster Portfolio”) from a third party. The transaction was structured as a sale-leaseback in which the Operating Partnership agreed to purchase the Red Lobster Portfolio and would immediately lease the portfolio back to the third party pursuant to the terms of multiple master leases (the “Master Leases”). The overall sale-leaseback transaction consisted of 522 Red Lobster® restaurants and 20 other branded restaurant properties for a purchase price of $1.7 billion. The Company closed the Red Lobster Portfolio acquisition in the third quarter of 2014. The Red Lobster Portfolio acquisition is included in the 2014 Acquisitions (as defined in Note 7 – Real Estate Investments).
Abandoned Spin-off of Multi-Tenant Shopping Center Portfolio; Sale to Blackstone/DDR Joint Venture
On March 13, 2014, the Company announced its intention to spin off its multi-tenant shopping center business (the “MT Spin-off”) into a publicly traded REIT, American Realty Capital Centers, Inc., which was expected to operate under the name “ARCenters” and to trade on the NASDAQ Global Market under the symbol “ARCM.” The OP was expected to retain 25% ownership of ARCM. The MT Spin-off was expected to be effectuated through a pro rata taxable special distribution of one share of ARCM common stock for every 10 shares of the Company’s common stock and every 10 OP Units held by third parties in the OP. On April 4, 2014, ARCM filed a Registration Statement on Form 10 to register ARCM’s common stock, par value $0.01 per share, pursuant to Section 12(b) of the Exchange Act so that, upon consummation of the MT Spin-off, shares of ARCM received by holders of the Company’s common stock, or OP Units, as applicable, could freely trade their newly received ARCM common stock. ARCM was expected to be externally managed by the Company. On May 21, 2014, the Company announced that it had reassessed its plans for the multi-tenant shopping center portfolio and entered into a letter of intent to sell such portfolio to Blackstone, expecting to finalize pertinent documentation related thereto within 30 days of such date. The properties included in such sale were the same properties that would have been spun off into ARCM and, consequently, the Company abandoned its proposed spin-off at such time. On June 11, 2014, indirect subsidiaries of the Company entered into an Agreement of Purchase and Sale with BRE DDR Retail Holdings III LLC (the “Blackstone/DDR Joint Venture”), an entity indirectly jointly owned by affiliates of Blackstone Real Estate Partners VII L.P. and DDR Corp. (“DDR”), pursuant to which the parties consummated the sale of the Company’s multi-tenant shopping center portfolio. See Note 22 – Property Dispositions for further discussion on the sale of the properties, which closed on October 17, 2014.
Note 3 – Summary of Significant Accounting Policies
Basis of Accounting
The consolidated financial statements of the Company included herein include the accounts of ARCP and its consolidated subsidiaries, including the Operating Partnership. All intercompany amounts have been eliminated. The financial statements are prepared on the accrual basis of accounting in conformity with U.S. GAAP.
Principles of Consolidation and Basis of Presentation
The consolidated financial statements include the accounts of the Company, consolidated joint venture arrangements and its subsidiaries. The portions of the consolidated joint venture arrangements not owned by the Company are presented as non-controlling interests. In addition, as described in Note 1 – Organization, certain affiliates and non-affiliated third parties have been issued OP Units. Holders of OP Units are considered to be non-controlling interest holders in the OP and their ownership interest is reflected as equity in the consolidated balance sheets. In addition, a portion of the earnings and losses of the OP are allocated to non-controlling interest holders based on their respective ownership percentages. Upon conversion of OP Units to common stock, any difference between the fair value of common shares issued and the carrying value of the OP Units converted is recorded as a component of equity. As of December 31, 2014 and December 31, 2013, there were 23,763,797 and 9,591,173 OP Units outstanding, respectively. In addition, as discussed in Note 2 – Mergers and Significant Acquisitions and Sales, the historical information of ARCT III and ARCT IV has been presented as if the mergers had occurred as of the earliest period of common control. All intercompany accounts and transactions have been eliminated in consolidation.
F-24
AMERICAN REALTY CAPITAL PROPERTIES, INC. AND ARC PROPERTIES OPERATING PARTNERSHIP, L.P.
NOTES TO CONSOLIDATED FINANCIAL STATEMENTS
December 31, 2014 – (Continued)
In determining whether the Company has a controlling financial interest in a joint venture and the requirement to consolidate the accounts of that entity, management considers factors such as ownership interest, authority to make decisions and contractual and substantive participating rights of the other partners or members as well as whether the entity is a variable interest entity of which the Company is the primary beneficiary.
A variable interest is an investment or other interest that will absorb portions of an entity’s expected losses or receive portions of the entity’s expected residual returns. The Company’s evaluation includes consideration of the qualitative and quantitative significance of fees it earns from certain of its relationships and investments. If the Company determines that it has a variable interest in an entity, it evaluates whether such interest is in a variable interest entity (“VIE”). A VIE is broadly defined as an entity where either (1) the equity investors as a group, if any, lack the power through voting or similar rights to direct the activities of an entity that most significantly impact the entity’s economic performance or (2) the equity investment at risk is insufficient to finance that entity’s activities without additional subordinated financial support.
A variable interest holder is considered to be the primary beneficiary of a VIE if it has the power to direct the activities of a VIE that most significantly impact the entity’s economic performance and has the obligation to absorb losses of, or the right to receive benefits from, the entity that could potentially be significant to the VIE. The Company qualitatively assesses whether it is (or is not) the primary beneficiary of a VIE. Consideration of various factors include, but are not limited to, the Company’s ability to direct the activities that most significantly impact the entity’s economic performance, its form of ownership interest, its representation on the entity’s governing body, the size and seniority of its investment, its ability and the rights of other investors to participate in policy making decisions and to replace the manager of and/or liquidate the entity. The Company consolidates any VIEs when it is determined to be the primary beneficiary of the VIE’s operations and the difference between consolidating the VIE and accounting for it on the equity method would be material to the Company’s financial statements.
The Company continually evaluates the need to consolidate joint ventures and the managed investment programs based on standards set forth in GAAP as described above.
Reclassification
Certain prior year balances have been combined in the consolidated balance sheets into the captions deferred costs and other assets, net and credit facilities. Additionally, certain prior year balances relating to the payments on and proceeds from the various credit facilities have been combined in the consolidated statements of cash flows.
Use of Estimates
The preparation of financial statements in conformity with U.S. GAAP requires management to make estimates and assumptions that affect the reported amounts of assets and liabilities and disclosure of contingent assets and liabilities at the date of the financial statements and the reported amounts of revenues and expenses during the reporting period. Actual results could differ from those estimates. Management makes significant estimates regarding revenue recognition, investments in real estate, business combinations, impairments and derivative financial instruments and hedging activities, as applicable.
Real Estate Investments
The Company records acquired real estate at cost and makes assessments as to the useful lives of depreciable assets. The Company considers the period of future benefit of the asset to determine the appropriate useful lives. Depreciation is computed using a straight-line method over the estimated useful life of 40 years for buildings, five to 15 years for building fixtures and improvements and the remaining lease term for intangible lease assets.
Assets Held for Sale
The Company classifies real estate investments as held for sale in accordance with the criteria set forth in U.S. GAAP. Assets held for sale are recorded at the lower of carrying value or estimated fair value, less estimated cost to dispose of the asset. The results of operations and the related gain or loss on sale of properties that have been sold or that are classified as held for sale are included in discontinued operations in the consolidated statements of operations and comprehensive loss for all periods presented. At December 31, 2014 and December 31, 2013, the Company had two properties and one property, respectively, that were classified as held for sale.
If circumstances arise that the Company previously considered unlikely and, as a result, the Company decides not to sell a property previously classified as held for sale, the Company will reclassify the property as held and used. The Company measures and records a property that is reclassified as held and used at the lower of (i) its carrying amount before the property was classified as held for sale, adjusted for any depreciation expense that would have been recognized had the property been continuously classified as held and used or (ii) the estimated fair value at the date of the subsequent decision not to sell.
F-25
AMERICAN REALTY CAPITAL PROPERTIES, INC. AND ARC PROPERTIES OPERATING PARTNERSHIP, L.P.
NOTES TO CONSOLIDATED FINANCIAL STATEMENTS
December 31, 2014 – (Continued)
Development Activities
Project costs and expenses, which include interest expense, associated with the development, construction and lease-up of a real estate project are capitalized as construction in progress. Once the development and construction of the building is substantially completed, the amounts capitalized to construction in progress are transferred to (i) land and (ii) buildings and improvements. As required by U.S. GAAP, the Company computes and capitalizes interest expense on the full amount it has invested in the project, whether or not such investment is externally financed.
Investment in Unconsolidated Entities
Investment in Unconsolidated Joint Ventures
Investment in unconsolidated joint ventures as of December 31, 2014 consisted of the Company’s interest in six joint ventures that owned six properties (the “Unconsolidated Joint Ventures”). As of December 31, 2014, the Company owned aggregate equity investments of $94.2 million in the Unconsolidated Joint Ventures. The Company accounts for the Unconsolidated Joint Ventures using the equity method of accounting as the Company has the ability to exercise significant influence, but not control, over operating and financial policies of these investments. The equity method of accounting requires the investment to be initially recorded at cost and subsequently adjusted for the Company’s share of equity in the joint ventures’ earnings and distributions. The Company records its proportionate share of net income from the Unconsolidated Joint Ventures within the Other income, net line item in the consolidated statement of operations. During the year ended December 31, 2014, the Company recognized $1.5 million of net income from the Unconsolidated Joint Ventures. The Company did not recognize any net income from the Unconsolidated Joint Ventures during the year ended December 31, 2013.
Investment in Managed REITs
In conjunction with its Cole Merger, the Company acquired equity interests, in the following publicly registered, non-traded REITs: Cole Credit Property Trust IV, Inc. (“CCPT IV”); Cole Corporate Income Trust, Inc. (“CCIT”); Cole Real Estate Income Strategy (Daily NAV), Inc. (“INAV”); Cole Office & Industrial REIT (CCIT II), Inc. (“CCIT II”); and Cole Credit Property Trust V, Inc. (“CCPT V,” and collectively with CCPT IV, CCIT, INAV and CCIT II, the “Managed REITs”). As of December 31, 2014, the Company owned aggregate equity investments of $3.9 million in the Managed REITs. Prior to the CCPT Acquisition Date, CCPT was a Managed REIT and accounted for using the equity method. As of the CCPT Acquisition Date, the Company had a de minimis equity investment in CCPT. The Company accounts for these investments using the equity method of accounting which requires the investment to be initially recorded at cost and subsequently adjusted for the Company’s share of equity in the respective Managed REIT’s earnings and distributions. The Company records its proportionate share of net income from the Managed REITs within the Other income, net line item in the consolidated statement of operations. During the year ended December 31, 2014, the Company recognized $1.6 million of net loss from the Managed REITs. The Company did not recognize any net income or loss from the Managed REITs during the year ended December 31, 2013.
Leasehold Improvements and Property and Equipment
The Company leases its office facilities under operating leases. Leasehold improvements related to these are recorded at cost less accumulated amortization. Leasehold improvements are amortized over the lesser of the estimated useful life or remaining lease term.
Property and equipment, which primarily include office furniture, fixtures and equipment and computer hardware and software, are stated at cost less accumulated depreciation. Property and equipment are depreciated on a straight-line method over the estimated useful lives of the assets, which range from five to seven years. The Company reassesses the useful lives of its property and equipment and adjusts the future monthly depreciation expense based on the new useful life, as applicable. If the Company disposes of an asset, the asset and related accumulated depreciation are written off upon disposal.
Goodwill
In the case of a business combination, after identifying all tangible and intangible assets and liabilities, the excess consideration paid over the fair value of the assets and liabilities acquired and assumed, respectively, represents goodwill. Goodwill that arose as a result of the Company’s mergers and acquisitions was recorded in the Company’s consolidated financial statements.
In the event the Company disposes of a property that constitutes a business under U.S. GAAP from a reporting unit with goodwill, the Company will allocate a portion of the reporting unit’s goodwill to that business in determining the gain or loss on the disposal of the business. The amount of goodwill allocated to the business will be based on the relative fair value of the business to the fair value of the reporting unit. The REI segment and Cole Capital each comprise one reporting unit.
F-26
AMERICAN REALTY CAPITAL PROPERTIES, INC. AND ARC PROPERTIES OPERATING PARTNERSHIP, L.P.
NOTES TO CONSOLIDATED FINANCIAL STATEMENTS
December 31, 2014 – (Continued)
Impairments
Real Estate Assets
The Company continually monitors events and changes in circumstances that could indicate that the carrying amounts of its real estate assets may not be recoverable. Impairment indicators that the Company considers include, but are not limited to, bankruptcy or other credit concerns of a property’s major tenant, such as a history of late payments, rental concessions and other factors, a significant decrease in a property’s revenues due to lease terminations, vacancies, co-tenancy clauses, reduced lease rates or other circumstances. When indicators of potential impairment are present, the Company assesses the recoverability of the assets by determining whether the carrying amount of the assets will be recovered through the undiscounted future cash flows expected from the use of the assets and their eventual disposition. In the event that such expected undiscounted future cash flows do not exceed the carrying amount, the Company will adjust the real estate assets to their respective fair values and recognize an impairment loss. Generally, fair value is determined using a discounted cash flow analysis and recent comparable sales transactions. When developing estimates of expected future cash flows, the Company makes certain assumptions regarding future market rental income amounts subsequent to the expiration of current lease agreements, property operating expenses, terminal capitalization and discount rates, the expected number of months it takes to re-lease the property, required tenant improvements and the number of years the property will be held for investment. The use of alternative assumptions in estimating expected future cash flows could result in a different determination of the property’s expected future cash flows and a different conclusion regarding the existence of an impairment, the extent of such loss, if any, as well as the fair value of the real estate assets.
The Company recorded $100.5 million of impairment charges on real estate investments from continuing operations during the year ended December 31, 2014, of which impairment charges totaling $96.7 million arose during the three months ended December 31, 2014. In determining the fourth quarter impairment charges, the Company evaluated each of the respective properties’ highest and best use and concluded that such use would be to sell certain office properties that were deemed to be impaired, as if such properties were vacant at the time of the expected sale and did not contain a tenant under a long term lease. During the nine months ended September 30, 2014, the Company’s intention was to re-lease the respective properties at the end of each such tenant’s existing lease term, which were during 2015 through 2016. However, the respective tenants either provided notice that they did not intend to renew their lease or had already vacated the property and were continuing to pay the lease until expiration. In evaluating lease-up scenarios, the Company assessed the necessary capital expenditures that would be incurred to ready the respective properties for lease and determined that such capital expenditures would not be recoverable under the expected terms of a new lease in the current and future rental markets for such properties. In addition, the Company utilized the sale price received for one of the properties that was sold in 2015 in the determination of fair value, noting that the offers received in such sale were consistent with current market transactions evaluated as comparable transactions. The price received at sale was an indication that the carrying amount was greater than the properties’ estimated fair values.
The Company recorded $3.3 million in impairment charges on real estate investments from continuing operations during the year ended December 31, 2013, but did not record any impairment on real estate investments from discontinued operations during that year. The Company did not record any impairment on real estate investments from continuing operations during the year ended December 31, 2012, but did record $0.6 million of impairment charges from discontinued operations during that year.
Goodwill
The Company will evaluate goodwill for impairment annually or more frequently when an event occurs or circumstances change that indicate the carrying value, by reporting unit, may not be recoverable. The Company’s annual testing date is during the fourth quarter. The Company tests goodwill for impairment by first comparing the carrying value of net assets to the fair value of each reporting unit. If the fair value is determined to be less than the carrying value or if qualitative factors indicate that it is more likely than not that goodwill is impaired, a second step is performed to compute the amount of impairment as the difference between the estimated fair value of goodwill and the carrying value. The Company estimates the fair value of the reporting units using discounted cash flows and relevant competitor multiples. The evaluation of goodwill for potential impairment requires the Company’s management to exercise significant judgment and to make certain assumptions. The use of different judgments and assumptions could result in different conclusions.
The Company tested the goodwill allocated to the Cole Capital segment for impairment during the three months ended December 31, 2014 using an income approach. The assumptions utilized in the evaluation of the impairment of goodwill under the income approach include revenue growth rates, cash flows, earnings before income taxes, tax rates, capital expenditures, the weighted average cost of capital (“WACC”) and expected long-term growth rates (residual growth rate). The assumptions which have the most significant effect on our valuations derived using a discounted cash flows methodology are: (1) revenue growth rate, (2) cash flow assumptions and (3) the discount rate. The cash flows utilized in the income approach are based on our most recent budgets, forecasts, and business plans as well as various growth rate assumptions for years beyond the current business plan
F-27
AMERICAN REALTY CAPITAL PROPERTIES, INC. AND ARC PROPERTIES OPERATING PARTNERSHIP, L.P.
NOTES TO CONSOLIDATED FINANCIAL STATEMENTS
December 31, 2014 – (Continued)
period. Long-term growth rates represent the expected long-term growth rate for the reporting unit, considering the industry in which we operate and the global economy. Discount rate assumptions are based on an assessment of the risk inherent in the future revenue streams and cash flows and our WACC. The risk adjusted discount rate used represents the estimated WACC for our reporting unit. The carrying value of the Cole Capital reporting unit exceeded the estimated fair value at December 31, 2014 and therefore the second step of the goodwill impairment analysis was performed to compute the amount of the impairment. As a result, the Company recorded an impairment charge of $223.1 million during the three months ended December 31, 2014.
The Company also tested the goodwill allocated to the REI segment for impairment during the three months ended December 31, 2014 using a market approach. The assumptions utilized in the market approach include the selection of comparable companies, which are subject to change based on the economic characteristics of our reporting unit. Adjusted funds from operations and funds from operations, each non-GAAP supplemental financial performance measures, multiples for market comparable companies for the current and future fiscal periods were used to estimate the fair value of the reporting unit by applying those multiples to the projected financial information prepared by management. The carrying value of the REI reporting unit was $19.3 billion at December 31, 2014. The estimated fair value of the reporting unit exceeded its carrying value by 5%. As such, no goodwill impairment was recorded during the three months ended December 31, 2014 on the REI reporting segment. This reporting unit remains at risk for future impairment if the projected operating results are not met or other inputs into the fair value measurement change. We continue to monitor actual results versus forecasted results and external factors that may impact the fair value of the reporting unit. Factors we are monitoring that may impact the fair value of the reporting unit include, but are not limited to, market comparable company multiples, interest rates, and global economic conditions.
Intangible Assets
The Company evaluates intangible assets, which primarily consists of dealer manager and advisory contracts with the Managed REITs, for impairment when an event occurs or circumstances change that indicate the carrying value may not be recoverable. The Company tests intangible assets for impairment by first comparing the carrying value of the asset group to the undiscounted future cash flows expected from the use of the assets and their eventual disposition. In the event that such expected undiscounted future cash flows do not exceed the carrying amount, the Company will adjust the intangible assets to their respective fair values and recognize an impairment loss. The Company will estimate the fair value the intangible assets using a discounted cash flow model specific to the Managed REITs that were included in the initial value of the intangible assets as of the Cole Acquisition Date. The evaluation of intangible assets for potential impairment requires the Company’s management to exercise significant judgment and to make certain assumptions. The use of different judgments and assumptions could result in different conclusions.
During the three months ended December 31, 2014, as a result of the preliminary findings of the Audit Committee Investigation, which led to the withdrawal of reliance on certain of the Company’s previously-issued financial statements and a delay in issuing its financial statements for the third quarter of 2014 that also led to a delay in filing the annual report on Form 10-K for the year ended 2014, the Company experienced adverse changes to its business, some of which included suspension and/or termination of selling agreements relating to its Cole Capital segment and a significant drop in stock price. The Company determined these events warranted an assessment of the recoverability of the intangible asset value associated with the dealer manager and advisory contracts for its Cole Capital segment. Based on the analysis, the Company recorded $86.4 million of impairment charges on the intangible assets.
Investment in Unconsolidated Entities
The Company is required to determine whether an event or change in circumstances has occurred that may have a significant adverse effect on the fair value of any of its investment in the unconsolidated entities. If an event or change in circumstance has occurred, the Company is required to evaluate its investment in the unconsolidated entity for potential impairment and determine if the carrying amount of its investment exceeds its fair value. An impairment charge is recorded when an impairment is deemed to be other-than-temporary. To determine whether an impairment is other-than-temporary, the Company considers whether it has the ability and intent to hold the investment until the carrying amount is fully recovered. The evaluation of an investment in an unconsolidated entity for potential impairment requires the Company’s management to exercise significant judgment and to make certain assumptions. The use of different judgments and assumptions could result in different conclusions. No impairments of unconsolidated entities were identified during the year ended December 31, 2014.
Leasehold Improvements and Property and Equipment
Leasehold improvements and property and equipment are reviewed for impairment when events or changes in circumstances indicate that the carrying amount of such assets may not be recoverable. If this review indicates that the carrying amount of the asset is not recoverable, the Company records an impairment loss, measured at fair value by estimated discounted cash flows or market appraisals. The evaluation of leasehold improvements and property and equipment for potential impairment requires the
F-28
AMERICAN REALTY CAPITAL PROPERTIES, INC. AND ARC PROPERTIES OPERATING PARTNERSHIP, L.P.
NOTES TO CONSOLIDATED FINANCIAL STATEMENTS
December 31, 2014 – (Continued)
Company’s management to exercise significant judgment and to make certain assumptions. The use of different judgments and assumptions could result in different conclusions. The Company identified properties during the years ended December 31, 2014 and 2013 with impairment indicators for which the undiscounted future cash flows expected as a result of the use and eventual disposition of the real estate and related assets was less than the carrying amount of each respective properties, as discussed in Note 11 – Fair Value of Financial Instruments.
Allocation of Purchase Price of Business Combinations including Acquired Properties
In accordance with the guidance for business combinations, the Company determines whether a transaction or other event is a business combination. If the transaction is determined to be a business combination, the Company determines if the transaction is considered to be between entities under common control. The acquisition of an entity under common control is accounted for on the carryover basis of accounting whereby the assets and liabilities of the acquired companies are recorded upon the merger on the same basis as they were carried by the acquired companies on the merger date. All other business combinations are accounted for by applying the acquisition method of accounting. Under the acquisition method, the Company recognizes the identifiable assets acquired, the liabilities assumed and any non-controlling interest in the acquired entity at fair value. In addition, the Company evaluates the existence of goodwill or a gain from a bargain purchase. The Company expenses acquisition-related costs and fees associated with business combinations and asset acquisitions.
The Company allocates the purchase price of acquired properties and businesses accounted for under the acquisition method of accounting to tangible and identifiable intangible assets and liabilities acquired based on their respective fair values. Tangible assets include land, buildings, equipment and tenant improvements on an as-if vacant basis. The Company utilizes various estimates, processes and information to determine the as-if vacant property value. Estimates of value are made using customary methods, including data from appraisals, comparable sales, discounted cash flow analysis and other methods. Identifiable intangible assets and liabilities include amounts allocated to acquired leases for above-market and below-market lease rates and the value of in-place leases.
Amounts allocated to land, buildings, equipment and fixtures are based on cost segregation studies performed by independent third parties or on the Company’s analysis of comparable properties in its portfolio.
The aggregate value of intangible assets related to in-place leases is primarily the difference between the property valued with existing in-place leases adjusted to market rental rates and the property valued as if vacant. Factors considered by the Company in its analysis of the in-place lease intangibles include an estimate of carrying costs during the expected lease-up period for each property, taking into account current market conditions and costs to execute similar leases. In estimating carrying costs, the Company includes real estate taxes, insurance and other operating expenses and estimates of lost rentals at market rates during the expected lease-up period, which typically ranges from six to 18 months. The Company also estimates costs to execute similar leases including leasing commissions, legal and other related expenses.
Above-market and below-market in-place lease values for owned properties are recorded based on the present value (using an interest rate which reflects the risks associated with the leases acquired) of the difference between the contractual amounts to be paid pursuant to the in-place leases and management’s estimate of fair market lease rates for the corresponding in-place leases, measured over a period equal to the remaining non-cancelable term of the lease, including any bargain renewal periods. Above-market leases are amortized as a reduction to rental income over the remaining terms of the respective leases. Below-market leases are amortized as an increase to rental income over the remaining terms of the respective leases, including any bargain renewal periods.
The fair value of investments and debt are valued using techniques consistent with those disclosed in Note 11 – Fair Value of Financial Instruments, depending on the nature of the investment or debt. The fair value of all other assumed assets and liabilities is based on the best information available.
The value of in-place leases is amortized to expense over the initial term of the respective leases, which range primarily from two to 20 years. If a tenant terminates its lease, then the unamortized portion of the in-place lease value is charged to expense.
In making estimates of fair values for purposes of allocating purchase price, the Company utilizes a number of sources, including independent appraisals that may be obtained in connection with the acquisition or financing of the respective property and other market data. The Company also considers information obtained about each property as a result of its pre-acquisition due diligence, as well as subsequent marketing and leasing activities, in estimating the fair value of the tangible and intangible assets acquired and intangible liabilities assumed.
Cash and Cash Equivalents
Cash and cash equivalents include cash in bank accounts, as well as investments in highly-liquid money market funds with original maturities of three months or less. The Company deposits cash with high quality financial institutions. These deposits are guaranteed by the Federal Deposit Insurance Company (“FDIC”) up to an insurance limit. At December 31, 2014 and 2013, the
F-29
AMERICAN REALTY CAPITAL PROPERTIES, INC. AND ARC PROPERTIES OPERATING PARTNERSHIP, L.P.
NOTES TO CONSOLIDATED FINANCIAL STATEMENTS
December 31, 2014 – (Continued)
Company had deposits of $416.7 million and $52.7 million, respectively, of which $412.7 million and $44.3 million were in excess of the amount insured by the FDIC. Although the Company bears risk on amounts in excess of those insured by the FDIC, it does not anticipate any losses as a result due to the high quality of the institutions.
Restricted Cash
Restricted cash primarily consists of reserves related to lease expirations, as well as maintenance, structural and debt service reserves.
Investment in Direct Financing Leases
The Company has acquired certain properties that are subject to leases that qualify as direct financing leases in accordance with U.S. GAAP due to the significance of the lease payments from the inception of the leases compared to the fair value of the property. Investments in direct financing leases represent the fair value of the remaining lease payments on the leases and the estimated fair value of any expected residual property value at the end of the lease term. The fair value of the remaining lease payments is estimated using a discounted cash flow based on interest rates that would represent the Company’s incremental borrowing rate for similar types of debt. The expected residual property value at the end of the lease term is estimated using market data and assessments of the remaining useful lives of the properties at the end of the lease terms, among other factors. Income from direct financing leases is calculated using the effective interest method over the remaining term of the lease.
Loans Held for Investments
The Company classifies its loans as long-term investments, as the Company intends to hold the loans for the foreseeable future or until maturity. Loan investments are carried on the Company’s consolidated balance sheets at amortized cost (unpaid principal balance adjusted for unearned discount or premium and loan origination fees), net of any allowance for loan losses. Discounts or premiums and loan origination fees are amortized as a component of interest income using the effective interest method over the life of the loan.
From time to time, the Company may determine to sell a loan in which case it must reclassify the asset as held for sale. Loans held for sale are carried at the lower of cost or estimated fair value. The Company acquired two loan investments and issued one loan during the year ended December 31, 2014. Since the period the Company acquired the loan investments through December 31, 2014, the Company has not sold or reclassified any loans as held for sale.
The Company evaluates its loan investments for possible impairment on a quarterly basis. Refer to Note 9 – Loans Held for Investment.
Commercial Mortgage-Backed Securities
The Company classifies all of its commercial mortgage-backed securities (“CMBS”) as available for sale for financial accounting purposes. Under U.S. GAAP, securities classified as available for sale are carried on the consolidated balance sheet at fair value with the net unrealized gains or losses included in accumulated other comprehensive income (loss), a component of Stockholders’ Equity. Any premiums or discounts on securities are amortized as a component of interest income using the effective interest method.
The Company estimates fair value on all securities investments quarterly based on a variety of inputs. Under applicable accounting guidance, securities where the fair value is less than the Company’s cost are deemed impaired, and, therefore, must be measured for other-than-temporary impairment. If an impaired security (i.e., fair value below cost) is intended to be sold or required to be sold prior to expected recovery of the impairment loss, the full amount of the loss must be charged to earnings as other-than-temporary impairment. Otherwise, temporary impairment losses are charged to other comprehensive income (loss).
In estimating credit or other-than-temporary impairment losses, management considers a variety of factors including (1) the financial condition and near-term prospects of the credit, including credit rating of the security and the underlying tenant and an estimate of the likelihood, amount and expected timing of any default, (2) whether the Company expects to hold the investment for a period of time sufficient to allow for anticipated recovery in fair value, (3) the length of time and the extent to which the fair value has been below cost, (4) current market conditions, (5) expected cash flows from the underlying collateral and an estimate of underlying collateral values, and (6) subordination levels within the securitization pool. These estimates are highly subjective and could differ materially from actual results. From the period the Company acquired the CMBS through December 31, 2014, the Company had no other-than-temporary impairment losses.
F-30
AMERICAN REALTY CAPITAL PROPERTIES, INC. AND ARC PROPERTIES OPERATING PARTNERSHIP, L.P.
NOTES TO CONSOLIDATED FINANCIAL STATEMENTS
December 31, 2014 – (Continued)
Deferred Financing Costs
Deferred financing costs represent commitment fees, legal fees and other costs associated with obtaining commitments for financing. These costs are amortized to interest expense over the terms of the respective financing agreements using the effective interest method. Unamortized deferred financing costs are written off when the associated debt is refinanced or repaid before maturity. Costs incurred in seeking financial transactions that do not close are expensed in the period in which it is determined the financing will not close. As of December 31, 2014 and 2013, the Company had $126.2 million and $84.7 million, respectively, of deferred financing costs net of accumulated amortization. During the year ended December 31, 2014, the Company wrote off $64.2 million of deferred financing costs upon execution of the various credit facility amendments and on financing arrangements that did not close, primarily the Barclays Facility, as defined in Note 13 – Other Debt, which is included in interest expense, net in the accompanying consolidated statement of operations. In addition, the Company wrote off $6.6 million upon early repayment of various mortgages which is included in extinguishment of debt, net in the accompanying consolidated statement of operations.
Convertible Debt
On July 29, 2013, the Company issued $300.0 million of Convertible Senior Notes due 2018 (the “2018 Notes”) and, pursuant to an over-allotment exercise by the underwriters of such 2018 Notes offering, issued an additional $10.0 million of its 2018 Notes on August 1, 2013. On December 10, 2013, the Company issued an additional $287.5 million of the 2018 Notes through a reopening of the 2018 Notes indenture agreement. Also on December 10, 2013, the Company issued $402.5 million of Convertible Senior Notes due 2020 (the “2020 Notes”) (the 2020 Notes, collectively with the 2018 Notes, the “Convertible Notes”). The 2018 Notes mature on August 1, 2018 and the 2020 Notes mature on December 15, 2020. The Convertible Notes are convertible into cash or shares of the Company’s common stock at the Company’s option. In accordance with U.S GAAP, the notes are accounted for as a liability with a separate equity component recorded for the conversion option. A liability was recorded for the Convertible Notes on the issuance date at fair value based on a discounted cash flow analysis using current market rates for debt instruments with similar terms. The difference between the initial proceeds from the Convertible Notes and the estimated fair value of the debt instruments resulted in a debt discount, with an offset recorded to additional paid-in capital representing the equity component. The debt discount is being amortized to interest expense over the expected lives of the Convertible Notes.
Derivative Instruments
The Company may use derivative financial instruments to hedge all or a portion of the interest rate risk associated with its borrowings. Certain of the techniques used to hedge exposure to interest rate fluctuations may also be used to protect against declines in the market value of assets that result from general trends in debt markets. The principal objective of such agreements is to minimize the risks and/or costs associated with the Company’s operating and financial structure as well as to hedge specific anticipated transactions.
The Company records all derivatives on the consolidated balance sheets at fair value. The accounting for changes in the fair value of derivatives depends on the intended use of the derivative, whether the Company has elected to designate a derivative in a hedging relationship and apply hedge accounting and whether the hedging relationship has satisfied the criteria necessary to apply hedge accounting. Derivatives designated and qualifying as a hedge of the exposure to changes in the fair value of an asset, liability, or firm commitment attributable to a particular risk, such as interest rate risk, are considered fair value hedges. Derivatives designated and qualifying as a hedge of the exposure to variability in expected future cash flows, or other types of forecasted transactions, are considered cash flow hedges. Derivatives may also be designated as hedges of the foreign currency exposure of a net investment in a foreign operation. Hedge accounting generally provides for the matching of the timing of gain or loss recognition on the hedging instrument with the recognition of the changes in the fair value of the hedged asset or liability that are attributable to the hedged risk in a fair value hedge or the earnings effect of the hedged forecasted transactions in a cash flow hedge. The Company may enter into derivative contracts that are intended to economically hedge certain of its risk, even though hedge accounting does not apply or the Company elects not to apply hedge accounting.
The accounting for subsequent changes in the fair value of these derivatives depends on whether each has been designed and qualifies for hedge accounting treatment. If the Company elects not to apply hedge accounting treatment, any changes in the fair value of these derivative instruments is recognized immediately in gains (losses) on derivative instruments in the consolidated statements of operations and comprehensive loss. If the derivative is designated and qualifies for hedge accounting treatment the change in the estimated fair value of the derivative is recorded in other comprehensive income (loss) to the extent that it is effective. Any ineffective portion of a derivative’s change in fair value will be immediately recognized in earnings.
F-31
AMERICAN REALTY CAPITAL PROPERTIES, INC. AND ARC PROPERTIES OPERATING PARTNERSHIP, L.P.
NOTES TO CONSOLIDATED FINANCIAL STATEMENTS
December 31, 2014 – (Continued)
Share Repurchase Programs
ARCT III’s and ARCT IV’s boards of directors had adopted Share Repurchase Programs (the “ARCT III SRP” and the “ARCT IV SRP”, respectively, and collectively, the “SRPs”) that enabled stockholders to offer their shares to ARCT III and ARCT IV, respectively, for repurchase in limited circumstances. The SRPs permitted investors to sell their shares back to ARCT III or ARCT IV, as applicable, after they had held them for at least one year, subject to the significant conditions and limitations described below.
When a stockholder requested repurchases and the repurchases were approved by ARCT III’s or ARCT IV’s board of directors, as applicable, it reclassified such obligation from equity to a liability based on the settlement value of the obligation. The following table reflects the number of shares repurchased for the years ended December 31, 2013 and 2012. During the year ended December 31, 2014, the Company did not repurchase any shares of common stock under the share repurchase program.
| Number of Requests | Number of Shares | Average Price per Share | |||||||
| 2012 | 75 | 180,744 | $ | 10.07 | |||||
| 2013 | 11 | 4,956 | 24.98 | ||||||
| Cumulative repurchase requests as of December 31, 2014 | 86 | 185,700 | $ | 10.47 | |||||
Upon the ARCT III Merger, the ARCT III SRP was terminated. Upon the ARCT IV Merger, the ARCT IV SRP was terminated.
Upon the closing of the ARCT III Merger, on February 28, 2013, 29.2 million shares, or 16.5% of the then-outstanding shares of ARCT III’s common stock, were paid in cash at $12.00 per share, which is equivalent to 27.7 million shares of the Company’s common stock based on the ARCT III Exchange Ratio. In addition, 148.1 million shares of ARCT III’s common stock were converted to shares of the ARCP’s common stock at the ARCT III Exchange Ratio, resulting in an additional 140.7 million shares of the ARCP’s common stock outstanding after the exchange. On August 20, 2013, ARCP’s board of directors reauthorized its $250.0 million share repurchase program, which was originally authorized in February 2013.
Revenue Recognition
Upon the acquisition of real estate, certain properties will have leases where minimum rent payments change during the term of the lease. The Company will record rental revenue for the full term of each lease on a straight-line basis. When the Company acquires a property, the term of existing leases is considered to commence as of the acquisition date for the purposes of this calculation. Cost recoveries from tenants are included in tenant reimbursement income in the period the related costs are incurred, as applicable.
The Company’s revenues, which are derived primarily from rental income, include rents that each tenant pays in accordance with the terms of each lease reported on a straight-line basis over the initial term of the lease. Since many of the leases provide for rental increases at specified intervals, straight-line basis accounting requires the Company to record a receivable, and include in revenues, unbilled rent receivables that the Company will only receive if the tenant makes all rent payments required through the expiration of the initial term of the lease. Straight-line rent receivables are included in prepaid expenses and other assets on the consolidated balance sheets. See Note 10 – Deferred Costs and Other Assets, Net. The Company defers the revenue related to lease payments received from tenants in advance of their due dates. As of December 31, 2014 and 2013, the Company had $57.8 million and $20.4 million, respectively, of deferred rental income, which is included in deferred rent and other liabilities on the consolidated balance sheets.
The Company continually reviews receivables related to rent and unbilled rent receivables and determines collectability by taking into consideration the tenant’s payment history, the financial condition of the tenant, business conditions in the industry in which the tenant operates and economic conditions in the area in which the property is located. In the event that the collectability of a receivable is in doubt, the Company will record an increase in the allowance for uncollectible accounts or record a direct write-off of the receivable in the consolidated statements of operations and comprehensive loss. As of December 31, 2014 and December 31, 2013, the Company recorded an allowance for uncollectible accounts of $2.5 million and $187,000, respectively.
Contingent Rental Income
The Company owns certain properties that have associated leases that require the tenant to pay contingent rental income based on a percentage of the tenant’s sales after the achievement of certain sales thresholds, which may be monthly, quarterly or annual targets. As a lessor, the Company defers the recognition of contingent rental income until the specified target that triggered the contingent rental income is achieved, or until such sales upon which percentage rent is based are known.
F-32
AMERICAN REALTY CAPITAL PROPERTIES, INC. AND ARC PROPERTIES OPERATING PARTNERSHIP, L.P.
NOTES TO CONSOLIDATED FINANCIAL STATEMENTS
December 31, 2014 – (Continued)
Offering and Related Costs
Offering and related costs include costs incurred in connection with the Company’s issuance of common stock. These costs include, but are not limited to, (i) legal, accounting, printing, mailing and filing fees, (ii) escrow related fees and (iii) reimbursement to the dealer manager for amounts they paid to reimburse the due diligence expenses of broker-dealers.
Program Development Costs
The Company pays for organization, registration and offering expenses associated with the sale of common stock of the Managed REITs. The reimbursement of these expenses by the Managed REITs is limited to a certain percentage of the proceeds raised from their offerings, in accordance with their respective advisory agreements and charters. Such expenses paid by the Company on behalf of the Managed REITs in excess of these limits that are expected to be collected are recorded as program development costs. The Company assesses the collectability of the program development costs, considering the offering period and historical and forecasted sales of shares under the Managed REITs’ respective offerings and reserves for any balances considered not collectible. The Company reserved $13.1 million of such costs as of December 31, 2014. Program development costs are included in deferred costs and other assets, net in the accompanying consolidated balance sheets.
Acquisition Related Expenses and Merger and Other Non-routine Transaction Related Expenses
All direct costs incurred as a result of a business combination are classified as acquisition costs or merger and other non-routine transaction costs and expensed as incurred. Acquisition related expenses include legal and other transaction related costs incurred in connection with self-originated acquisitions including purchases of portfolios. In addition, indirect costs, such as internal salaries, that are tracked and documented in a manner that clearly indicates that the activities driving the cost directly relate to activities necessary to complete, or effect, a business combination are classified as acquisition related expenses. Similar costs incurred in relation to mergers with entities under common control (which are not accounted for as acquisitions) are included in the caption “merger and other non-routine transactions.” Other non-routine transaction costs are also presented within the line item merger and other non-routine transactions in the consolidated statements of operations and comprehensive loss.
Merger and other non-routine transaction related expenses include the following costs (amounts in thousands):
| Year Ended December 31, | ||||||||||||
| 2014 | 2013 | 2012 | ||||||||||
| Merger related costs: | ||||||||||||
| Strategic advisory services | $ | 35,765 | $ | 62,332 | $ | — | ||||||
| Transfer taxes | 5,109 | 8,931 | — | |||||||||
| Legal fees and expenses | 5,464 | 15,081 | 2,603 | |||||||||
| Personnel costs and other reimbursements | 751 | 3,612 | — | |||||||||
| Multi-tenant spin-off | 7,450 | — | — | |||||||||
| Other fees and expenses | 1,676 | 8,450 | — | |||||||||
| Other non-routine costs: | ||||||||||||
| Post-transaction support services | 14,251 | 4,000 | ||||||||||
| Subordinated distribution fee | 78,244 | 98,360 | — | |||||||||
| Audit Committee Investigation and related litigation | 17,660 | — | — | |||||||||
| Furniture, fixtures and equipment | 14,085 | 5,800 | — | |||||||||
| Legal fees and expenses | 8,325 | 950 | — | |||||||||
| Personnel costs and other reimbursements | 2,718 | 2,546 | — | |||||||||
| Other fees and expenses | 9,016 | 481 | — | |||||||||
| Total | $ | 200,514 | $ | 210,543 | $ | 2,603 | ||||||
Due from Affiliates
The Company receives or may be entitled to receive compensation and reimbursement for services primarily relating to the Managed REITs’ offerings and the investment, management, financing and disposition of their respective assets. Refer to Note 20 – Related Party Transactions and Arrangements for further explanation.
F-33
AMERICAN REALTY CAPITAL PROPERTIES, INC. AND ARC PROPERTIES OPERATING PARTNERSHIP, L.P.
NOTES TO CONSOLIDATED FINANCIAL STATEMENTS
December 31, 2014 – (Continued)
Equity-based Compensation
The Company has an equity-based incentive award plan for non-executive directors, officers, other employees and independent contractors who are providing services to the Company, as applicable, and a non-executive director restricted share plan, which are accounted for under the guidance for share-based payments. The expense for such awards is recognized over the vesting period or when the requirements for exercise of the award have been met. See Note 19 – Equity-based Compensation for additional information on these plans.
Per Share Data
Income (loss) per basic share of common stock is calculated by dividing net income (loss) less dividends on unvested restricted stock and dividends on preferred shares by the weighted-average number of shares of common stock issued and outstanding during such period. Diluted income (loss) per share of common stock considers the effect of potentially dilutive shares of common stock outstanding during the period. As the Company has the ability and intent to settle all outstanding convertible debt in cash, the Company has excluded the if-converted shares from its calculation of diluted shares.
Reportable Segments
The Company has concluded that it has two reportable segments as it has organized its operations into two segments for management and internal financial reporting purposes, REI and Cole Capital. The identification and aggregation of reportable segments requires the Company’s management to exercise certain judgments. Refer to Note 5 – Segment Reporting for further information.
Revenue Recognition – Cole Capital
Revenue consists of securities sales commissions and dealer manager fees, real estate acquisition fees, property management fees, advisory fees, asset management fees and performance fees for services relating to the Managed REITs’ offerings and the investment and management of their respective assets, in accordance with the respective advisory and dealer manager agreements. The Company records revenue related to acquisition fees, securities sales commissions and dealer manager fees upon completion of a transaction and advisory, asset and property management fees as services are performed. The Company is also reimbursed for certain costs incurred in providing these services. Securities sales commission and dealer manager reimbursements are recorded as revenue as the expenses are incurred. Other reimbursements are recorded as revenue when reimbursements are reasonably assured.
Income Taxes
ARCP currently qualifies and has elected to be taxed as a REIT for federal income tax purposes under Sections 856 through 860 of the Internal Revenue Code. As a REIT, except as discussed below, ARCP generally is not subject to federal income tax on taxable income that it distributes to its stockholders so long as it distributes at least 90% of its annual taxable income (computed without regard to the dividends paid deduction and excluding net capital gains). REITs are subject to a number of other organizational and operational requirements. Even if ARCP maintains its qualification for taxation as a REIT, it may be subject to certain state and local taxes on its income and property, federal income taxes on certain income and excise taxes on its undistributed income.
The Operating Partnership is classified as a partnership for federal income tax purposes. As a partnership, the Operating Partnership is not a taxable entity for federal income tax purposes. Instead, each partner in the Operating Partnership is required to take into account its allocable share of the Operating Partnership’s income, gains, losses, deductions, and credits for each taxable year. However, the Operating Partnership may be subject to certain state and local taxes on its income and property.
As of December 31, 2014, the Operating Partnership and ARCP had no material uncertain income tax positions. The tax years subsequent to and including the fiscal year ended December 31, 2010 remain open to examination by the major taxing jurisdictions to which the Operating Partnership, ARCP, ARCT III and ARCT IV are subject.
Under the LPA, the Operating Partnership is to conduct business in such a manner as to permit ARCP at all times to qualify as a REIT.
The Company conducts substantially all of its Cole Capital business operations through a TRS. A TRS is a subsidiary of a REIT that is subject to corporate federal, state and local income taxes, as applicable. The Company’s use of a TRS enables it to engage in certain business activities while complying with the REIT qualification requirements and to retain any income generated by these businesses for reinvestment without the requirement to distribute those earnings. The Company conducts all of its business in the United States and Canada and, as a result, it files income tax returns in the U.S. federal jurisdiction, Canadian federal
F-34
AMERICAN REALTY CAPITAL PROPERTIES, INC. AND ARC PROPERTIES OPERATING PARTNERSHIP, L.P.
NOTES TO CONSOLIDATED FINANCIAL STATEMENTS
December 31, 2014 – (Continued)
jurisdiction and various state and local jurisdictions. Certain of the Company’s inter-company transactions that have been eliminated in consolidation for financial accounting purposes are also subject to taxation.
The Company provides for income taxes in accordance with current authoritative accounting and tax guidance. The tax expense or benefit related to significant, unusual or extraordinary items is recognized in the quarter in which those items occur. In addition, the effect of changes in enacted tax laws, rates or tax status is recognized in the quarter in which the change occurs. The accounting estimates used to compute the provision for income taxes may change as new events occur, additional information is obtained or the tax environment changes.
In conjunction with the acquisition of the Red Lobster Portfolio, the Company entered into a reverse section 1031 like-kind exchange agreement with a third party intermediary. The exchange agreement is for a maximum of 180 days and allows the Company, for tax purposes, to defer gains on the sale of other properties sold within this period. Until the earlier of termination of the exchange agreement or 180 days after the first acquisition date, the third party intermediary is the legal owner of each property, although the Company controls the activities that most significantly impact each property and retains all of the economic benefits and risks associated with each property. Each property is held by the third party intermediary in a variable interest entity for which the Company is the primary beneficiary. Accordingly, the Company consolidates these properties and their operations even during the period they are held by the third party intermediary. As of December 31, 2014, none of the Red Lobster properties were held by the third party intermediary, as the reverse section 1031 like-kind exchange agreement was completed on October 17, 2014.
Repurchase Agreements
In certain circumstances, the Company may obtain financing through a repurchase agreement. The Company evaluates the initial transfer of a financial instrument and the related repurchase agreement for sale accounting treatment. In instances where the Company maintains effective control over the transferred securities, the Company accounts for the transaction as a secured borrowing and, accordingly, both the securities and related repurchase agreement payable are recorded separately in the accompanying consolidated balance sheets in investment securities, at fair value and other debt, net, respectively. In instances where the Company does not maintain effective control over the transferred securities, the Company accounts for the transaction as a sale of securities for proceeds consisting of cash and a forward purchase contract.
Recent Accounting Pronouncements
In April 2014, the U.S. Financial Accounting Standards Board (“FASB”) issued Accounting Standards Update, (“ASU”) No. 2014-08 Presentation of Financial Statements (Topic 205) and Property, Plant, and Equipment (Topic 360): Reporting Discontinued Operations and Disclosures of Disposals of Components of an Entity (“ASU 2014-08”), which amends the reporting requirements for discontinued operations by updating the definition of a discontinued operation to be a component of an entity that represents a strategic shift that has (or will have) a major effect on an entity’s operations and financial results, resulting in fewer disposals that qualify for discontinued operations reporting. The pronouncement also requires expanded disclosures for discontinued operations. The Company adopted ASU 2014-08 effective January 1, 2014. Beginning with the first quarter of 2014, the results of operations for all properties sold and properties classified as held for sale that do not meet the criteria to qualify as a discontinued operation and were not previously reported in discontinued operations for the year ended December 31, 2013 are presented within income from continuing operations on the accompanying consolidated statements of income.
In May 2014, FASB issued ASU No. 2014-09, Revenue from Contracts with Customers (“ASU 2014-09“), which supersedes the revenue recognition requirements in Revenue Recognition (Topic 605), and requires an entity to recognize revenue in a way that depicts the transfer of promised goods or services to customers in an amount that reflects the consideration to which the entity expects to be entitled to in exchange for those goods or services. ASU 2014-09 is effective for fiscal years, and interim periods within those years, beginning after December 15, 2016, and is to be applied retrospectively, with early application not permitted. The Company is currently evaluating the impact of the new standard on its financial statements.
In August 2014, the FASB issued ASU No. 2014-15, Disclosure of Uncertainties about an Entity’s Ability to Continue as a Going Concern (“ASU 2014-15”), which requires management to assess an entity’s ability to continue as a going concern, and to provide related footnote disclosures in certain circumstances. ASU 2014-15 is effective for fiscal years, and interim periods within those years, beginning after December 15, 2016, with early application permitted. The Company does not believe ASU 2014-15, when effective, will have a material impact on the Company’s consolidated financial statements because the Company currently does not have any conditions that give rise to substantial doubt about its ability to continue as a going concern.
In February 2015, the FASB issued ASU No. 2015-02, Consolidation (Topic 810): Amendments to the Consolidation Analysis (“ASU 2015-02”), which eliminates the deferral of FAS 167 and makes changes to both the variable interest model and the voting model. These changes will require re-evaluation of certain entities for consolidation and will require the Company to revise its
F-35
AMERICAN REALTY CAPITAL PROPERTIES, INC. AND ARC PROPERTIES OPERATING PARTNERSHIP, L.P.
NOTES TO CONSOLIDATED FINANCIAL STATEMENTS
December 31, 2014 – (Continued)
documentation regarding the consolidation or deconsolidation of such entities. ASU 2015-02 is effective for fiscal years, and interim periods within those years, beginning after December 15, 2015, and is to be applied retrospectively, with early adoption permitted. The Company is currently evaluating the impact of the new standard on its financial statements.
Note 4 – Acquisitions of CapLease, Cole and CCPT
CapLease Acquisition
On November 5, 2013 (the “CapLease Acquisition Date”), the Company completed the CapLease Merger, an acquisition of a REIT that primarily owned and managed a diversified portfolio of single-tenant commercial real estate properties subject to long-term leases, the majority of which were net leases to high credit quality tenants, by acquiring 100% of the outstanding common stock and voting interests of CapLease. The acquisition was accounted for using the acquisition method of accounting in accordance with ASC 805, Business Combinations. The Company’s consolidated financial statements include the results of operations of CapLease subsequent to the CapLease Acquisition Date.
The purchase price includes a cash payment of $920.7 million, which was funded by the Company through additional borrowings under its revolving credit facility and the credit facility assumed from CapLease. See Note 13 – Other Debt and Note 14 – Credit Facilities.
The purchase price for the acquisition was allocated to assets acquired and liabilities assumed based on their estimated fair value. The following table summarizes the estimated fair values of the assets acquired and liabilities assumed at the CapLease Acquisition Date (in thousands). The measurement period adjustments did not have a significant impact on the Company’s consolidated statement of operations in any period; therefore, the Company has not retrospectively adjusted its financial statements.
Amounts Previously Recognized as of the CapLease Acquisition Date (1) | Measurement Period Adjustments | Adjusted Amounts Recognized as of the CapLease Acquisition Date | |||||||||||
| Fair value of consideration given- cash | $ | 920,697 | $ | — | $ | 920,697 | |||||||
| Identifiable assets acquired at fair value: | |||||||||||||
| Land | 235,843 | — | 235,843 | ||||||||||
| Buildings, fixtures and improvements | 1,596,481 | — | 1,596,481 | ||||||||||
| Land and construction in process | 12,352 | — | 12,352 | ||||||||||
| Acquired intangible lease assets | 191,964 | — | 191,964 | ||||||||||
| Total real estate investments | 2,036,640 | — | 2,036,640 | ||||||||||
| Cash and cash equivalents | 41,799 | — | 41,799 | ||||||||||
| Investment securities | 60,730 | — | 60,730 | ||||||||||
| Loans held for investment | 26,457 | — | 26,457 | ||||||||||
| Restricted cash | 29,119 | — | 29,119 | ||||||||||
| Deferred costs and other assets, net | 21,574 | — | 21,574 | ||||||||||
| Total identifiable assets purchased | 2,216,319 | — | 2,216,319 | ||||||||||
F-36
AMERICAN REALTY CAPITAL PROPERTIES, INC. AND ARC PROPERTIES OPERATING PARTNERSHIP, L.P.
NOTES TO CONSOLIDATED FINANCIAL STATEMENTS
December 31, 2014 – (Continued)
Amounts Previously Recognized as of the CapLease Acquisition Date (1) | Measurement Period Adjustments | Adjusted Amounts Recognized as of the CapLease Acquisition Date | |||||||||||
| Identifiable liabilities assumed at fair value: | |||||||||||||
| Mortgage notes payable | $ | 1,037,510 | $ | (27,339 | ) | $ | 1,010,171 | ||||||
| Secured credit facility | 121,000 | — | 121,000 | ||||||||||
| Other debt | 114,208 | — | 114,208 | ||||||||||
| Below-market leases | 57,058 | — | 57,058 | ||||||||||
| Derivative liabilities | 158 | — | 158 | ||||||||||
| Accounts payable and accrued expenses | 49,291 | — | 49,291 | ||||||||||
| Deferred rent, derivative and other liabilities | 8,619 | — | 8,619 | ||||||||||
| Total liabilities assumed | 1,387,844 | (27,339 | ) | 1,360,505 | |||||||||
| Non-controlling interests | 567 | — | 567 | ||||||||||
| Goodwill | 92,789 | (27,339 | ) | 65,450 | |||||||||
| Net identifiable assets acquired by Company | $ | 827,908 | $ | 27,339 | $ | 855,247 | |||||||
____________________________________
| (1) | As reported in Amendment No. 2 to the Company’s Annual Report on Form 10-K/A for the year ended December 31, 2013 filed with the SEC on March 2, 2015 (the “Amended 10-K”). |
During the three months ended December 31, 2014, the Company completed the fair value analysis of the NIH Loan, as defined in Note 12 – Mortgage Notes Payable. The Company initially recorded a premium of $2.9 million for the NIH Loan in the previously reported purchase price allocation. Based upon further analysis, the Company concluded that the fair value of the NIH Loan was $30.4 million, resulting in a discount of $24.5 million. As such the Company decreased the fair value of the mortgage debt assumed by $27.3 million with a corresponding adjustment to goodwill.
The fair value of real estate investments and below-market leases have been estimated by the Company with the assistance of third-party valuation firms. The estimated fair values of these assets and liabilities total $2.0 billion and $57.1 million, respectively.
The ascribed value of the non-controlling interest has been estimated based on the fair value at the acquisition date of the percentage ownership of The Woodlands, Texas development activity not held by the Company. See Note 7 – Real Estate Investments for further information on this development project.
The fair values of the remaining CapLease assets and liabilities have been calculated in accordance with the Company’s policy on purchase price allocation, as discussed in Note 3 – Summary of Significant Accounting Policies.
Goodwill of $92.8 million has been assigned to the REI segment. The goodwill recognized is attributed to the enhancement of the Company’s year-round rental revenue stream, expected synergies and the assembled work force at CapLease.
The unaudited pro forma information in Note 7 – Real Estate Investments is presented as if CapLease had been included in the consolidated results of the Company for the years ended December 31, 2014 and 2013.
Cole Acquisition
On February 7, 2014, ARCP completed its acquisition of Cole, as discussed in Note 2 – Mergers and Significant Acquisitions and Sales. The Company accounted for the Cole Merger as a business combination under the acquisition method of accounting. Therefore, the Company’s consolidated financial statements include the results of operations of Cole subsequent to the Cole Acquisition Date.
F-37
AMERICAN REALTY CAPITAL PROPERTIES, INC. AND ARC PROPERTIES OPERATING PARTNERSHIP, L.P.
NOTES TO CONSOLIDATED FINANCIAL STATEMENTS
December 31, 2014 – (Continued)
Fair Value of Consideration Transferred
The fair value of the consideration transferred at the Cole Acquisition Date totaled $7.5 billion and consisted of the following (in thousands):
| As of Cole Acquisition Date | |||
| Fair value of consideration transferred: | |||
| Cash | $ | 181,775 | |
| Common stock | 7,285,868 | ||
| Total consideration transferred | $ | 7,467,643 | |
The fair value of the 520.8 million shares of ARCP’s common stock issued, excluding those common shares transferred to former Cole executives, was determined based on the closing market price of ARCP’s common stock on the Cole Acquisition Date. In accordance with the LPA, the Operating Partnership issued a corresponding number of General Partner OP Units to ARCP when shares of ARCP’s common stock were issued to former stockholders of Cole.
Allocation of Consideration
The consideration transferred pursuant to the Cole Merger Agreement was allocated to the assets acquired and liabilities assumed for the REI segment and Cole Capital, based upon their estimated fair values as of the Cole Acquisition Date. The following table summarizes the estimated fair values of the assets acquired and liabilities assumed, including all measurement period adjustments, at the Cole Acquisition Date (in thousands). The measurement period adjustments did not have a significant impact on the Company’s consolidated statement of operations in any period; therefore, the Company has not retrospectively adjusted its financial statements.
REI Segment (As initially recorded) | Cole Capital (As initially recorded) | Measurement Period Adjustments | Cole Capital (As Adjusted) | Total as of Cole Acquisition Date | ||||||||||||||||
| Identifiable assets acquired at fair value: | ||||||||||||||||||||
| Land | $ | 1,737,839 | $ | — | $ | — | $ | — | $ | 1,737,839 | ||||||||||
| Buildings, fixtures and improvements | 5,901,827 | — | — | — | 5,901,827 | |||||||||||||||
| Acquired intangible lease assets | 1,324,217 | — | — | — | 1,324,217 | |||||||||||||||
| Total real estate investments | 8,963,883 | — | — | — | 8,963,883 | |||||||||||||||
| Investment in unconsolidated entities | 100,659 | 3,307 | — | 3,307 | 103,966 | |||||||||||||||
| Investment securities, at fair value | 151,197 | — | — | — | 151,197 | |||||||||||||||
| Loans held for investment, net | 72,326 | — | — | — | 72,326 | |||||||||||||||
| Cash and cash equivalents | 129,552 | 20,413 | — | 20,413 | 149,965 | |||||||||||||||
| Restricted cash | 15,704 | — | — | — | 15,704 | |||||||||||||||
| Intangible assets | — | 385,368 | (80,368 | ) | 305,000 | 305,000 | ||||||||||||||
| Deferred costs and other assets | 43,774 | 50,893 | — | 50,893 | 94,667 | |||||||||||||||
| Due from affiliates | — | 3,301 | — | 3,301 | 3,301 | |||||||||||||||
| Total identifiable assets acquired | 9,477,095 | 463,282 | (80,368 | ) | 382,914 | 9,860,009 | ||||||||||||||
F-38
AMERICAN REALTY CAPITAL PROPERTIES, INC. AND ARC PROPERTIES OPERATING PARTNERSHIP, L.P.
NOTES TO CONSOLIDATED FINANCIAL STATEMENTS
December 31, 2014 – (Continued)
REI Segment (As initially recorded) | Cole Capital (As initially recorded) | Measurement Period Adjustments | Cole Capital (As Adjusted) | Total as of Cole Acquisition Date | ||||||||||||||||
| Identifiable liabilities assumed at fair value: | ||||||||||||||||||||
| Mortgage notes payable, net | $ | 2,706,585 | $ | — | $ | — | $ | — | $ | 2,706,585 | ||||||||||
| Credit facilities | 1,309,000 | — | — | — | 1,309,000 | |||||||||||||||
| Other debt | 49,013 | — | — | — | 49,013 | |||||||||||||||
| Below-market lease liabilities | 212,433 | — | — | — | 212,433 | |||||||||||||||
| Accounts payable and accrued expenses | 87,628 | 54,615 | — | 54,615 | 142,243 | |||||||||||||||
| Deferred rent, derivative and other liabilities | 67,841 | 167,458 | (30,741 | ) | 136,717 | 204,558 | ||||||||||||||
| Dividends payable | 6,271 | — | — | — | 6,271 | |||||||||||||||
| Due to affiliates | — | 44 | — | 44,242 | 44,242 | |||||||||||||||
| Total liabilities assumed | 4,438,771 | 222,117 | (30,741 | ) | 191,376 | 4,630,147 | ||||||||||||||
| Non-controlling interests | 24,766 | — | — | — | 24,766 | |||||||||||||||
| Net identifiable assets acquired | 5,013,558 | 241,165 | (49,627 | ) | 191,538 | 5,205,096 | ||||||||||||||
| Goodwill | 1,654,085 | 558,835 | 49,627 | 608,462 | 2,262,547 | |||||||||||||||
| Net assets acquired | $ | 6,667,643 | $ | 800,000 | $ | — | $ | 800,000 | $ | 7,467,643 | ||||||||||
During the three months ended December 31, 2014, the Company completed its fair value analysis of the management and advisory contracts with the Managed REITs. As a result of the updated analysis, certain assumptions used in the fair value calculation changed, including the discount rate and expected cash flows from the Managed REITs for liquidation events. These changes resulted in a decrease in the fair value of the management and advisory contracts and related deferred tax liability of $80.4 million and $30.7 million, respectively, and an increase of $49.6 million to goodwill as of the Cole Acquisition Date.
The fair values of real estate investments, including acquired lease intangibles, and below-market lease liabilities allocated to the REI segment have been estimated by the Company with the assistance of a third party valuation firm. Based on the analysis received to date, the estimated fair values of these assets and liabilities total $9.0 billion and $212.4 million, respectively. The recorded values represent the estimated fair values related to such assets and liabilities. Upon completion of the analysis, including a review of the appraisals and assessment of current market rates, changes to the estimated fair values may result.
The intangible assets acquired primarily consist of management and advisory contracts that the Company has with the Managed REITs and are subject to an estimated useful life of approximately four years. The Company recorded $68.5 million of amortization expense for the period from the Cole Acquisition Date through December 31, 2014. As of December 31, 2014, the Company recorded an impairment loss on the management and advisory contracts of $86.4 million. In connection with the impairment, the Company adjusted the estimated the remaining life of the contracts to five years. As such, the estimated amortization expense for each of the next five years is $35.1 million.
Goodwill of $1.7 billion has been assigned to the REI segment. The goodwill recognized is attributed to the enhancement of the Company’s year-round rental revenue stream, realized and expected synergies, the impact of the merger on lowering the Company’s cost of capital, as well as the benefits of critical mass, improved portfolio diversification and enhanced access to capital markets. Goodwill of $608.5 million has been assigned to Cole Capital. The goodwill is primarily supported by management’s belief that Cole Capital brings an established management platform with numerous strategic benefits including growth from new income streams and the ability to offer new products. None of the goodwill is expected to be deductible for income tax purposes.
The fair value of the remaining Cole assets and liabilities have been calculated in accordance with the Company’s policy on purchase price allocation, as disclosed in Note 3 – Summary of Significant Accounting Policies.
The amounts of revenue and net income related to Cole property acquisitions and Cole Capital included in the accompanying consolidated statements of operations from the Cole Acquisition Date to the period ended December 31, 2014 was $814.8 million and $47.3 million respectively.
The unaudited pro forma information in Note 7 – Real Estate Investments are presented as if Cole had been included in the consolidated results of the Company for the entire periods ended December 31, 2014 and 2013.
F-39
AMERICAN REALTY CAPITAL PROPERTIES, INC. AND ARC PROPERTIES OPERATING PARTNERSHIP, L.P.
NOTES TO CONSOLIDATED FINANCIAL STATEMENTS
December 31, 2014 – (Continued)
CCPT Acquisition
On May 19, 2014, the Company completed its acquisition of CCPT, as discussed in Note 2 – Mergers and Significant Acquisitions and Sales. The Company accounted for the CCPT Merger as a business combination under the acquisition method of accounting. Therefore, the Company’s consolidated financial statements include the results of operations of CCPT subsequent to the CCPT Acquisition Date.
Fair Value of Consideration Transferred
The Company is in the process of gathering certain additional information in order to finalize its assessment of the fair value of the consideration transferred; thus, the fair values of currently recorded assets and liabilities are subject to change. The estimated fair value of the consideration transferred at the CCPT Acquisition Date totaled $73.2 million, which was paid in cash. The acquisition was funded by the Company through additional borrowings under its revolving credit facility.
Allocation of Consideration
The consideration transferred pursuant to the CCPT Merger Agreement was allocated to the assets acquired and liabilities assumed based upon their preliminary estimated fair values as of the CCPT Acquisition Date. The Company is in the process of gathering certain additional information in order to finalize its assessment of the fair value of certain intangible assets; thus, the provisional measurements of intangible assets and goodwill are subject to change. Such post-closing adjustments are customary in nature in accordance with ASC 805, Business Combinations. The following table summarizes the estimated fair values of the assets acquired and liabilities assumed by segment at the CCPT Acquisition Date (in thousands):
| May 19, 2014 (Preliminary) | |||
| Identifiable assets acquired at fair value: | |||
| Land | $ | 28,258 | |
| Buildings, fixtures and improvements | 113,296 | ||
| Acquired intangible lease assets | 17,960 | ||
| Total real estate investments | 159,514 | ||
| Cash and cash equivalents | 167 | ||
| Restricted cash | 2,420 | ||
| Prepaid expenses and other assets | 297 | ||
| Total identifiable assets acquired | 162,398 | ||
| Identifiable liabilities assumed at fair value: | |||
| Mortgage notes payable | 85,286 | ||
| Unsecured credit facility | 800 | ||
| Accounts payable and accrued expenses | 443 | ||
| Below-market lease liability | 1,752 | ||
| Due to affiliates | 568 | ||
| Deferred rent and other liabilities | 390 | ||
| Total liabilities assumed | 89,239 | ||
| Net identifiable assets acquired | $ | 73,159 | |
The fair value of real estate investments, including acquired lease intangibles, and below-market lease liabilities have been estimated by the Company with the assistance of a third party valuation firm. Based on a preliminary analysis received to date, the estimated fair value of these assets and liabilities total $159.5 million and $1.8 million, respectively. The recorded values represent the estimated fair values related to such assets and liabilities. Upon completion of the analysis, including a review of the appraisals and assessment of current market rates, changes to the estimated fair values may result.
The fair value of the remaining CCPT assets and liabilities have been calculated in accordance with the Company’s policy on purchase price allocation, as disclosed in the Amended 10-K.
F-40
AMERICAN REALTY CAPITAL PROPERTIES, INC. AND ARC PROPERTIES OPERATING PARTNERSHIP, L.P.
NOTES TO CONSOLIDATED FINANCIAL STATEMENTS
December 31, 2014 – (Continued)
The amounts of revenue and net loss related to CCPT property acquisitions included in the accompanying consolidated statements of operations from the CCPT Acquisition Date to the period ended December 31, 2014 were $8.2 million and $1.8 million, respectively.
The unaudited pro forma information in Note 7 – Real Estate Investments are presented as if CCPT had been included in the consolidated results of the Company for the year ended December 31, 2014 and 2013.
Note 5 – Segment Reporting
The Company operates in two segments, REI and Cole Capital.
REI – Through its REI segment, the Company acquires, owns and operates primarily single-tenant, freestanding commercial real estate properties primarily subject to net leases with high credit quality tenants. As of December 31, 2014, the Company owned 4,648 properties comprising 103.1 million square feet of single- and multi-tenant retail and commercial space located in 49 states, the District of Columbia, Puerto Rico, and Canada, which include properties owned through consolidated joint ventures. The rentable space at these properties was 99.3% leased with a weighted average remaining lease term of 11.8 years. In addition, as of December 31, 2014, the Company owned 10 commercial mortgage-backed securities (“CMBS”), 14 loans held for investment and, through the Unconsolidated Joint Ventures, had interests in six properties comprising 1.6 million rentable square feet of commercial and retail space.
Cole Capital – Cole Capital is contractually responsible for managing the Managed REITs’ affairs on a day-to-day basis, identifying and making acquisitions and investments on the Managed REITs’ behalf and recommending to each of the Managed REIT’s respective board of directors an approach for providing investors with liquidity. Cole Capital serves as the dealer manager and distributes shares of common stock for certain Managed REITs and advises them regarding offerings, manages relationships with participating broker-dealers and financial advisors and provides assistance in connection with compliance matters relating to the offerings. Cole Capital receives compensation and reimbursement for services relating to the Managed REITs’ offerings and the investment, management, financing and disposition of their respective assets, as applicable. Cole Capital also develops new REIT offerings, including obtaining regulatory approvals from the U.S. Securities and Exchange Commission (the “SEC”), the Financial Industry Regulatory Authority, Inc. (“FINRA”) and various blue sky jurisdictions for such offerings.
The Company allocates certain operating expenses, such as audit and legal fees, board of director fees, employee related costs and benefits and general overhead expenses between its operating segments. The following tables present a summary of the comparative financial results and total assets for each business segment (in thousands):
| Year Ended December 31, | ||||||||||||
| 2014 | 2013 | 2012 | ||||||||||
| REI: | ||||||||||||
| Revenues: | ||||||||||||
| Rental income | $ | 1,271,574 | $ | 310,508 | $ | 65,262 | ||||||
| Direct financing lease income | 3,603 | 2,244 | — | |||||||||
| Operating expense reimbursements | 100,522 | 16,571 | 1,945 | |||||||||
| Total real estate investment revenues | 1,375,699 | 329,323 | 67,207 | |||||||||
| Operating expenses: | ||||||||||||
| Acquisition related | 35,469 | 76,113 | 45,070 | |||||||||
| Merger and other non-routine transactions | 198,545 | 210,543 | 2,603 | |||||||||
| Property operating | 137,741 | 23,616 | 3,522 | |||||||||
| Management fees to affiliates | 13,888 | 17,462 | 212 | |||||||||
| General and administrative | 83,574 | 123,172 | 5,458 | |||||||||
| Depreciation and amortization | 844,743 | 210,976 | 40,957 | |||||||||
| Impairment of real estate | 100,547 | 3,346 | — | |||||||||
| Total operating expenses | 1,414,507 | 665,228 | 97,822 | |||||||||
| Operating loss | (38,808 | ) | (335,905 | ) | (30,615 | ) | ||||||
F-41
AMERICAN REALTY CAPITAL PROPERTIES, INC. AND ARC PROPERTIES OPERATING PARTNERSHIP, L.P.
NOTES TO CONSOLIDATED FINANCIAL STATEMENTS
December 31, 2014 – (Continued)
| Year Ended December 31, | ||||||||||||
| 2014 | 2013 | 2012 | ||||||||||
| Other (expense) income: | ||||||||||||
| Interest expense, net | $ | (452,648 | ) | $ | (105,548 | ) | $ | (11,856 | ) | |||
| Extinguishment of debt, net | (21,869 | ) | — | — | ||||||||
| Other income, net | 80,636 | 3,824 | 979 | |||||||||
| Loss on derivative instruments, net | (10,570 | ) | (67,946 | ) | — | |||||||
| Loss on held for sale assets and disposition of properties, net | (277,031 | ) | — | — | ||||||||
| Loss on sale of investments in affiliates | — | (411 | ) | — | ||||||||
| Gain (loss) on sale of investments | 6,357 | (1,795 | ) | — | ||||||||
| Total other expenses, net | (675,125 | ) | (171,876 | ) | (10,877 | ) | ||||||
| Net loss from continuing operations | (713,933 | ) | (507,781 | ) | (41,492 | ) | ||||||
| Discontinued operations: | ||||||||||||
| Loss from operations of held for sale assets | — | (34 | ) | (145 | ) | |||||||
| Loss on held for sale properties | — | — | (600 | ) | ||||||||
| Net loss from discontinued operations | — | (34 | ) | (745 | ) | |||||||
| Net loss | $ | (713,933 | ) | $ | (507,815 | ) | $ | (42,237 | ) | |||
| Cole Capital: | ||||||||||||
| Revenues: | ||||||||||||
| Dealer manager and distribution fees, selling commissions and offering reimbursements | $ | 87,109 | $ | — | $ | — | ||||||
| Transaction service fees | 60,672 | — | — | |||||||||
| Management fees and reimbursements | 55,777 | — | — | |||||||||
| Total Cole Capital revenues | 203,558 | — | — | |||||||||
| Operating expenses: | ||||||||||||
| Cole Capital reallowed fees and commissions | 66,228 | — | — | |||||||||
| Acquisition related | 3,362 | — | — | |||||||||
| Merger and other non-routine transactions | 1,969 | — | — | |||||||||
| General and administrative expenses | 91,167 | — | — | |||||||||
| Depreciation and amortization | 71,260 | — | — | |||||||||
| Impairments of intangible assets | 309,444 | — | — | |||||||||
| Total operating expenses | 543,430 | — | — | |||||||||
| Total other income | 42,893 | — | — | |||||||||
| Net loss | $ | (296,979 | ) | $ | — | $ | — | |||||
| Total Company: | ||||||||||||
| Total revenues | $ | 1,579,257 | $ | 329,323 | $ | 67,207 | ||||||
| Total operating expenses | $ | 1,957,937 | $ | 665,228 | $ | 97,822 | ||||||
| Total other expense | $ | (632,232 | ) | $ | (171,876 | ) | $ | (10,877 | ) | |||
| Loss from continuing operations | $ | (1,010,912 | ) | $ | (507,781 | ) | $ | (41,492 | ) | |||
| Loss from discontinued operations | $ | — | $ | (34 | ) | $ | (745 | ) | ||||
| Net loss | $ | (1,010,912 | ) | $ | (507,815 | ) | $ | (42,237 | ) | |||
F-42
AMERICAN REALTY CAPITAL PROPERTIES, INC. AND ARC PROPERTIES OPERATING PARTNERSHIP, L.P.
NOTES TO CONSOLIDATED FINANCIAL STATEMENTS
December 31, 2014 – (Continued)
| Total Assets | |||||||
| December 31, 2014 | December 31, 2013 | ||||||
| REI | $ | 19,821,440 | $ | 7,809,083 | |||
| Cole Capital | 693,699 | — | |||||
| Total Company | $ | 20,515,139 | $ | 7,809,083 | |||
Note 6 – Goodwill and Other Intangibles
In connection with the Caplease Merger and Cole Merger, the Company recorded goodwill as a result of the merger consideration exceeding the net assets acquired. No goodwill was recorded on the CCPT Acquisition. The goodwill recorded on the Cole Merger was allocated between the Company’s two reporting units, the REI segment and Cole Capital segment. See Note 4 – Acquisitions of CapLease, Cole and CCPT for further detail of the various mergers.
The following table summarizes the Company’s goodwill activity during the years ended December 31, 2014 and 2013 by segment (in thousands):
| REI Segment | Cole Capital | Consolidated | ||||||||||
| Balance as of January 1, 2013 | $ | — | $ | — | $ | — | ||||||
| Caplease Merger | 92,789 | — | 92,789 | |||||||||
| Balance as of December 31, 2013 | 92,789 | — | 92,789 | |||||||||
Cole Merger (1) | 1,654,085 | 558,835 | 2,212,920 | |||||||||
| Measurement period adjustments | (27,339 | ) | 49,627 | 22,288 | ||||||||
Goodwill allocated to dispositions (2) | (210,139 | ) | — | (210,139 | ) | |||||||
Impairment (3) | — | (223,064 | ) | (223,064 | ) | |||||||
| Balance as of December 31, 2014 | $ | 1,509,396 | $ | 385,398 | $ | 1,894,794 | ||||||
_______________________________________________
(1) Goodwill recognized from the Cole Merger was assigned to the REI segment and Cole Capital based on the excess consideration paid over the fair value of the assets and liabilities acquired and assumed in each segment. Refer to Note 4 – Acquisitions of CapLease, Cole and CCPT for further discussion.
| (2) | Goodwill allocated to the cost basis of properties sold or classified as held for sale is included in loss on held for sale assets and disposition of properties, net, in the consolidated statement of operations. |
(3) The Cole Capital reporting segment impairment was recognized during the three months ended December 31, 2014.
In making estimates of fair values for purposes of allocating purchase price, the Company utilizes a number of sources, including independent appraisals that may be obtained in connection with the acquisition or financing of the respective property and other market data. The Company also considers information obtained about each property as a result of its pre-acquisition due diligence, as well as subsequent marketing and leasing activities, in estimating the fair value of the tangible and intangible assets acquired and intangible liabilities assumed.
Intangible lease assets and liabilities of the Company consist of the following as of December 31, 2014 and 2013 (amounts in thousands, except weighted-average remaining life):
| Weighted-Average Remaining Life | December 31, | |||||||||
| 2014 | 2013 | |||||||||
| Intangible lease assets: | ||||||||||
| In-place leases, net accumulated amortization of $236,096 and $60,753, respectively | 12.7 | $ | 1,816,508 | $ | 689,109 | |||||
| Leasing commissions, net of accumulated amortization of $505 and $155, respectively | 6.7 | 4,205 | 227 | |||||||
| Above-market leases, net of accumulated amortization of $22,471 and $658, respectively | 15.3 | 355,269 | 8,693 | |||||||
| Total intangible lease assets, net | 2,175,982 | 698,029 | ||||||||
F-43
AMERICAN REALTY CAPITAL PROPERTIES, INC. AND ARC PROPERTIES OPERATING PARTNERSHIP, L.P.
NOTES TO CONSOLIDATED FINANCIAL STATEMENTS
December 31, 2014 – (Continued)
| Weighted-Average Remaining Life | December 31, | |||||||||
| 2014 | 2013 | |||||||||
| Intangible lease liabilities: | ||||||||||
| Below-market leases, net of accumulated amortization of $19,123 and $715, respectively | 13.8 | $ | 317,838 | $ | 77,169 | |||||
The following table provides the projected amortization expense and adjustments to rental income related to the intangible lease assets and liabilities for the next five years as of December 31, 2014 (amounts in thousands):
| 2015 | 2016 | 2017 | 2018 | 2019 | ||||||||||||||||
| In-place leases: | ||||||||||||||||||||
| Total to be included in amortization expense | $ | 195,682 | $ | 182,450 | $ | 165,900 | $ | 151,892 | $ | 142,032 | ||||||||||
| Leasing Commissions | ||||||||||||||||||||
| Total to be included in amortization expense | $ | 445 | $ | 472 | $ | 459 | $ | 351 | $ | 327 | ||||||||||
| Above-market lease assets: | ||||||||||||||||||||
| Total to be deducted from rental income | $ | 27,129 | $ | 26,978 | $ | 26,598 | $ | 26,016 | $ | 24,033 | ||||||||||
| Below-market lease liabilities: | ||||||||||||||||||||
| Total to be included in rental income | $ | (28,881 | ) | $ | (22,752 | ) | $ | (22,608 | ) | $ | (22,276 | ) | $ | (21,532 | ) | |||||
Note 7 – Real Estate Investments
Excluding the Cole Merger, the ARCT IV Merger and the CCPT Merger, the Company acquired interests in 1,107 commercial properties, including 31 land parcels, for an aggregate purchase price of $3.8 billion during the year ended December 31, 2014 (the “2014 Acquisitions”). During the year ended December 31, 2013, the Company acquired the interests in 1,739 commercial properties, excluding the ARCT III Merger and Caplease Merger for an aggregate purchase price of $3.5 billion. The Company is in the process of obtaining and reviewing the final third party appraisals for some of the 2014 Acquisitions and, as such, the fair values of the related assets acquired and liabilities assumed during the year ended December 31, 2014 are provisionally allocated. The following table presents the preliminary allocation of the fair values of the assets acquired and liabilities assumed during the periods presented (dollar amounts in thousands):
| Year Ended December 31, | ||||||||
| 2014 | 2013 | |||||||
| Real estate investments, at cost: | ||||||||
| Land | $ | 808,930 | $ | 883,491 | ||||
| Buildings, fixtures and improvements | 2,505,409 | 2,311,211 | ||||||
| Total tangible assets | 3,314,339 | 3,194,702 | ||||||
| Acquired intangible assets: | ||||||||
| In-place leases | 545,389 | 334,839 | ||||||
| Above-market leases | 112,484 | 12,317 | ||||||
| Assumed intangible liabilities: | ||||||||
| Below-market leases | (107,185 | ) | (21,446 | ) | ||||
| Fair value adjustment of assumed notes payable | (23,589 | ) | — | |||||
| Total purchase price of assets acquired, net | 3,841,438 | 3,520,412 | ||||||
| Notes payable assumed | (301,532 | ) | — | |||||
| Cash paid for acquired real estate investments | $ | 3,539,906 | $ | 3,520,412 | ||||
| Number of properties acquired | 1,107 | 1,739 | ||||||
The following table presents unaudited pro forma information as if all of the 2014 Acquisitions and the Cole Merger, ARCT IV Merger and CCPT Merger, as discussed in Note 2 – Mergers and Significant Acquisitions and Sales, were completed on January 1, 2013 for each period presented below. These amounts have been calculated after applying the Company’s accounting policies and adjusting the results of acquisitions to reflect the additional depreciation and amortization and interest expense that would have been charged had the acquisitions occurred on January 1, 2013. Additionally, the unaudited pro forma net loss attributable
F-44
AMERICAN REALTY CAPITAL PROPERTIES, INC. AND ARC PROPERTIES OPERATING PARTNERSHIP, L.P.
NOTES TO CONSOLIDATED FINANCIAL STATEMENTS
December 31, 2014 – (Continued)
to stockholders was adjusted to exclude acquisition related expenses of $38.8 million and $76.1 million for the year ended December 31, 2014 and 2013, respectively, and merger and other non-routine transaction related expenses of $200.5 million and $210.5 million for the year ended December 31, 2014 and 2013, respectively (in thousands).
| Year Ended December 31, | ||||||||
| 2014 | 2013 | |||||||
| (Unaudited) | (Unaudited) | |||||||
| Pro forma revenues | $ | 1,853,014 | $ | 1,585,511 | ||||
| Pro forma net income (loss) attributable to stockholders | $ | (606,549 | ) | $ | (478,093 | ) | ||
Future Lease Payments
The following table presents future minimum base rental cash payments due to the Company over the next five years and thereafter. These amounts exclude contingent rent payments, as applicable, that may be collected from certain tenants based on provisions related to sales thresholds and increases in annual rent based on exceeding certain economic indexes among other items (in thousands):
Future Minimum Operating Lease Base Rent Payments | Future Minimum Direct Financing Lease Payments(1) | |||||||
| 2015 | 1,245,051 | $ | 4,757 | |||||
| 2016 | 1,239,590 | 4,674 | ||||||
| 2017 | 1,207,816 | 4,273 | ||||||
| 2018 | 1,171,135 | 3,183 | ||||||
| 2019 | 1,130,291 | 2,397 | ||||||
| Thereafter | 10,050,096 | 7,915 | ||||||
| Total | $ | 16,043,979 | $ | 27,199 | ||||
____________________________________
(1) 40 properties are subject to direct financing leases and, therefore, revenue is recognized as direct financing lease income on the discounted cash flows of the lease payments. Amounts reflected are the cash rent on these respective properties.
Investment in Direct Financing Leases, Net
The components of the Company’s net investment in direct financing leases as of December 31, 2014 and December 31, 2013 are as follows (in thousands):
| December 31, 2014 | December 31, 2013 | |||||||
| Future minimum lease payments receivable | $ | 27,199 | $ | 33,729 | ||||
| Unguaranteed residual value of property | 39,852 | 46,172 | ||||||
| Unearned income | (10,975 | ) | (13,789 | ) | ||||
| Net investment in direct financing leases | $ | 56,076 | $ | 66,112 | ||||
Development Activities
During the year ended December 31, 2014, the Company acquired 31 land parcels upon which single-tenant commercial properties will be developed. Based on budgeted construction costs, the remaining costs to complete the buildings is estimated to be $18.4 million in aggregate. The land acquired for an aggregate amount of $12.4 million is included in the accompanying consolidated balance sheet. Of the 31 land parcels acquired during the year ended December 31, 2014, the Company completed 11 of the development projects and placed them in service. In addition, through the CapLease Merger, the Company acquired one land parcel during 2013 to develop an office building, which was completed during the year ended December 31, 2014.
F-45
AMERICAN REALTY CAPITAL PROPERTIES, INC. AND ARC PROPERTIES OPERATING PARTNERSHIP, L.P.
NOTES TO CONSOLIDATED FINANCIAL STATEMENTS
December 31, 2014 – (Continued)
Tenant Concentration
As of December 31, 2014, Red Lobster represents 11.6% of consolidated annualized rental income. As of December 31, 2013, there were no tenants exceeding 10% of consolidated annualized rental income. Annualized rental income for net leases is rental income as of the period reported, which includes the effect of tenant concessions such as free rent, as applicable.
Geographic Concentration
For the year ended December 31, 2014 and 2013, properties located in Texas represented 12.7% and 10.7% of consolidated annualized rental income, respectively.
Note 8 – Investment Securities, at Fair Value
Investment securities are considered available-for-sale and, therefore, increases or decreases in the fair value of these investments are recorded in accumulated other comprehensive income (loss) as a component of equity on the consolidated balance sheets unless the securities are considered to be other-than-temporarily impaired at which time the losses are reclassified to expense.
The following tables detail the unrealized gains and losses on investment securities as of December 31, 2014 and December 31, 2013 (in thousands):
| December 31, 2014 | ||||||||||||||||
| Amortized Cost | Gross Unrealized Gains | Gross Unrealized Losses | Fair Value | |||||||||||||
| CMBS | $ | 56,459 | $ | 2,207 | $ | (20 | ) | $ | 58,646 | |||||||
| December 31, 2013 | ||||||||||||||||
| Amortized Cost | Gross Unrealized Gains | Gross Unrealized Losses | Fair Value | |||||||||||||
| Investments in real estate fund | $ | 1,589 | $ | — | $ | (105 | ) | $ | 1,484 | |||||||
| CMBS | 60,452 | 498 | (367 | ) | 60,583 | |||||||||||
| Total | $ | 62,041 | $ | 498 | $ | (472 | ) | $ | 62,067 | |||||||
CMBS
In connection with the Cole Merger, the Company acquired 15 CMBS with an estimated aggregate fair value of $151.2 million as of the Cole Acquisition Date. On September 29, 2014, the Company sold the 15 CMBS acquired in the Cole Merger for proceeds of $158.0 million, and recorded a gain of $6.2 million which is included in Gain (loss) on sale of investments in the accompanying consolidated statements of operations. In connection with the sale, the Company settled the outstanding repurchase agreements that were secured by a portion of the CMBS. See Note 13 – Other Debt for further discussion on the repurchase agreements. As of December 31, 2014 and December 31, 2013, the Company owned 10 CMBS with an estimated aggregate fair value of $58.6 million and $60.6 million, respectively.
The scheduled maturity of the Company’s CMBS as of December 31, 2014 is as follows (in thousands):
| December 31, 2014 | ||||||||
| Amortized Cost | Fair Value | |||||||
| Due within one year | $ | — | $ | — | ||||
| Due after one year through five years | 945 | 969 | ||||||
| Due after five years through 10 years | 48,661 | 50,814 | ||||||
| Due after 10 years | 6,853 | 6,863 | ||||||
| $ | 56,459 | $ | 58,646 | |||||
Investment in Real Estate Fund
Prior to September 30, 2014, the Company had investments in a real estate fund that is sponsored by an affiliate of the Former Manager and which invests primarily in equity securities of other publicly-traded REITs. This investment was accounted for under the equity method of accounting because the Company had significant influence but not control. During the year ended December 31,
F-46
AMERICAN REALTY CAPITAL PROPERTIES, INC. AND ARC PROPERTIES OPERATING PARTNERSHIP, L.P.
NOTES TO CONSOLIDATED FINANCIAL STATEMENTS
December 31, 2014 – (Continued)
2014, the Company sold the investments and recorded a gain on the sale of the securities of $178,000, which is included in the gain (loss) on sale of investments in the accompanying consolidated statements of operations.
Note 9 – Loans Held for Investment
During the year ended December 31, 2014, in connection with the Cole Merger, the Company acquired two mortgage notes receivable, each of which is secured by an office building. The mortgage notes had a fair value of $72.3 million as of the Cole Acquisition Date. During the year ended December 31, 2014, the third party borrower paid off the remaining balance of the two notes receivable acquired in connection with the Cole Merger, in full, for a total payment of $71.8 million, which includes accrued interest and a $0.5 million fee in lieu of a prepayment premium, which is included in other income, net in the accompanying consolidated statement of operations. Upon repayment, the Company wrote off the remaining unamortized premium of $0.4 million, which is included in other income, net in the accompanying consolidated statement of operations. The Company also purchased two additional mortgage loans during the year ended December 31, 2014 for $3.0 million.
In addition, in connection with the RCAP settlement, as discussed in Note 20 – Related Party Transactions and Arrangements, RCAP issued a $15.3 million unsecured note to the OP that bears interest at 8.0% per annum and matures on March 31, 2017 (the “RCAP Promissory Note”). The RCAP Promissory Note requires principal payments of $7.7 million on March 31, 2016 and $3.8 million on September 30, 2016 and the remaining balance is due at maturity. RCAP may elect to prepay the RCAP Promissory Note at par any time prior to maturity.
As of December 31, 2014 and 2013, the Company owned 14 and 12 loans held for investment, respectively. As of December 31, 2014, the loans had a carrying value of $42.1 million and carried interest rates ranging from 5.11% to 7.24%. The fair value adjustment is being amortized to interest expense in the consolidated statements of operations over the term of the loan, using the effective interest method.
The Company’s loan portfolio is comprised primarily of fully amortizing or nearly fully amortizing first mortgage loans on commercial real estate leased to a single tenant. Therefore, the Company’s monitoring of the credit quality of its loans held for investment is focused primarily on an analysis of the tenant, including review of tenant credit ratings (including changes in ratings) and other measures of tenant credit quality, trends in the tenant’s industry and general economic conditions and an analysis of measures of collateral coverage, such as an estimate of the loan’s loan-to-value (“LTV”) ratio (principal amount outstanding divided by estimated value of the property) and its remaining term until maturity. As of December 31, 2014 and 2013, the Company had no reserve for loan loss.
Note 10 – Deferred Costs and Other Assets, Net
Deferred costs and other assets, net consisted of the following as of December 31, 2014 and December 31, 2013 (in thousands):
___________________________________
| December 31, 2014 | December 31, 2013 (3) | |||||||
| Deferred costs, net | $ | 126,202 | $ | 84,746 | ||||
Accounts receivable, net (1) | 66,021 | 16,254 | ||||||
| Straight-line rent receivable | 89,355 | 19,010 | ||||||
| Prepaid expenses | 15,171 | 43,801 | ||||||
Leasehold improvements, property and equipment, net (2) | 21,351 | 531 | ||||||
| Restricted escrow deposits | 34,339 | 101,813 | ||||||
| Deferred tax asset and tax receivable | 15,924 | — | ||||||
| Program development costs, net | 12,871 | — | ||||||
| Derivative assets, at fair value | 5,509 | 9,189 | ||||||
| Other assets | 3,179 | 5,317 | ||||||
| $ | 389,922 | $ | 280,661 | |||||
| (1) | Allowance for doubtful accounts was $2.5 million and $0.2 million as of December 31, 2014 and December 31, 2013, respectively. |
| (2) | Amortization expense for leasehold improvements totaled $1.3 million and $7,000 for the years ended December 31, 2014 and December 31, 2013, respectively. Accumulated amortization was $1.2 million and $7,000 as of December 31, 2014 and December 31, 2013, respectively. Depreciation expense for property and equipment totaled $1.6 million and $5,000 for the |
F-47
AMERICAN REALTY CAPITAL PROPERTIES, INC. AND ARC PROPERTIES OPERATING PARTNERSHIP, L.P.
NOTES TO CONSOLIDATED FINANCIAL STATEMENTS
December 31, 2014 – (Continued)
years ended December 31, 2014 and December 31, 2013, respectively. Accumulated depreciation was $2.4 million and $5,000 as of December 31, 2014 and December 31, 2013, respectively.
(3) December 31, 2013 line items have been broken out since the previously filed presentation to conform with current presentation and provide detailed balances relating to derivative assets, prepaid expenses, and deferred costs.
Note 11 – Fair Value of Financial Instruments
The Company determines fair value based on quoted prices when available or through the use of alternative approaches, such as discounting the expected cash flows using market interest rates commensurate with the credit quality and duration of the investment. The guidance defines three levels of inputs that may be used to measure fair value:
Level 1 – Quoted prices in active markets for identical assets and liabilities that the reporting entity has the ability to access at the measurement date.
Level 2 – Inputs other than quoted prices included within Level 1 that are observable for the asset and liability or can be corroborated with observable market data for substantially the entire contractual term of the asset or liability.
Level 3 – Unobservable inputs that reflect the entity’s own assumptions about the assumptions that market participants would use in the pricing of the asset or liability and are consequently not based on market activity, but rather through particular valuation techniques.
The determination of where an asset or liability falls in the hierarchy requires significant judgment and considers factors specific to the asset or liability. In instances where the determination of the fair value measurement is based on inputs from different levels of the fair value hierarchy, the level in the fair value hierarchy within which the entire fair value measurement falls is based on the lowest level input that is significant to the fair value measurement in its entirety. The Company evaluates its hierarchy disclosures each quarter and depending on various factors, it is possible that an asset or liability may be classified differently from quarter to quarter. However, the Company expects that changes in classifications between levels will be infrequent.
Although the Company has determined that the majority of the inputs used to value its derivatives fall within Level 2 of the fair value hierarchy, the credit valuation adjustments associated with those derivatives utilize Level 3 inputs, such as estimates of current credit spreads to evaluate the likelihood of default by the Company and its counterparties. However, as of December 31, 2014 and 2013, the Company has assessed the significance of the impact of the credit valuation adjustments on the overall valuation of its derivative positions and has determined that the credit valuation adjustments are not significant to the overall valuation of the Company’s derivatives. As a result, the Company has determined that its derivative valuations in their entirety are classified in Level 2 of the fair value hierarchy.
During the year ended December 31, 2014, real estate assets with a carrying amount of $199.5 million related to 16 properties were deemed to be impaired and their carrying amounts were reduced to their estimated fair values, resulting in impairment charges of $100.5 million. During the year ended December 31, 2013, real estate assets with a carrying amount of $4.5 million related to two properties were deemed to be impaired, resulting in impairment charges of $3.3 million. Impairment charges for the years ended 2014 and 2013 are included in impairments on the consolidated statements of operations.
The Company’s estimated fair values of its real estate assets were primarily based upon an income approach utilizing a present value technique to discount the expected cash flows using market participant assumptions for market rent and terminal values, which are considered to be Level 3 inputs, or based upon recent comparable sales transactions, which are considered to be Level 2 inputs. The aggregate fair value of impaired real estate assets for the year ended December 31, 2014 and December 31, 2013 was $99.0 million and $1.2 million, respectively.
F-48
AMERICAN REALTY CAPITAL PROPERTIES, INC. AND ARC PROPERTIES OPERATING PARTNERSHIP, L.P.
NOTES TO CONSOLIDATED FINANCIAL STATEMENTS
December 31, 2014 – (Continued)
The following tables present information about the Company’s assets and liabilities measured at fair value on a recurring basis as of December 31, 2014 and December 31, 2013, aggregated by the level in the fair value hierarchy within which those instruments fall (in thousands):
| Level 1 | Level 2 | Level 3 | Balance as of December 31, 2014 | |||||||||||||
| Assets: | ||||||||||||||||
| CMBS | $ | — | $ | — | $ | 58,646 | $ | 58,646 | ||||||||
| Interest rate swap assets | — | 5,509 | — | 5,509 | ||||||||||||
| Total assets | $ | — | $ | 5,509 | $ | 58,646 | $ | 64,155 | ||||||||
| Liabilities: | ||||||||||||||||
| Interest rate swap liabilities | $ | — | $ | (7,384 | ) | $ | — | $ | (7,384 | ) | ||||||
| Level 1 | Level 2 | Level 3 | Balance as of December 31, 2013 | |||||||||||||
| Assets: | ||||||||||||||||
| Investments in real estate fund | $ | — | $ | 1,484 | $ | — | $ | 1,484 | ||||||||
| CMBS | — | — | 60,583 | 60,583 | ||||||||||||
| Interest rate swap assets | — | 9,189 | — | 9,189 | ||||||||||||
| Total assets | $ | — | $ | 10,673 | $ | 60,583 | $ | 71,256 | ||||||||
| Liabilities: | ||||||||||||||||
| Interest rate swap liabilities | $ | — | $ | (1,719 | ) | $ | — | $ | (1,719 | ) | ||||||
| Series D Preferred Stock embedded derivative | — | — | (16,736 | ) | (16,736 | ) | ||||||||||
| Total liabilities | $ | — | $ | (1,719 | ) | $ | (16,736 | ) | $ | (18,455 | ) | |||||
CMBS – The fair values of the Company’s CMBS are valued using broker quotations, collateral values, subordination levels and liquidity of the individual securities.
Derivatives – The valuation of derivative instruments is determined using a discounted cash flow analysis on the expected cash flows of each derivative. This analysis reflects the contractual terms of the derivatives, including the period to maturity, as well as observable market-based inputs, including interest rate curves and implied volatilities. In addition, credit valuation adjustments are incorporated into the fair values to account for the Company’s potential nonperformance risk and the performance risk of the counterparties.
Series D Preferred Stock embedded derivative – The valuation of this derivative instrument was determined using a binomial option pricing model. Key inputs in the model include the expected term, risk-free interest rate, volatility and dividend yield.
The fair value of short-term financial instruments such as cash and cash equivalents, restricted cash, due to affiliates and accounts payable approximate their carrying value on the accompanying consolidated balance sheets due to their short-term nature and are classified as Level 1 under the fair value hierarchy.
A review of the fair value hierarchy classification is conducted on a quarterly basis. Changes in the type of inputs may result in a reclassification for certain assets. There were no transfers between Level 1 and Level 2 or Level 3 of the fair value hierarchy during the year ended December 31, 2014.
F-49
AMERICAN REALTY CAPITAL PROPERTIES, INC. AND ARC PROPERTIES OPERATING PARTNERSHIP, L.P.
NOTES TO CONSOLIDATED FINANCIAL STATEMENTS
December 31, 2014 – (Continued)
The following are reconciliations of the changes in instruments with Level 3 inputs in the fair value hierarchy for the years ended December 31, 2014 and 2013(in thousands):
| CMBS | Series D Preferred Stock Embedded Derivative | Contingent Consideration Arrangements | Total | |||||||||||||
| Balance, December 31, 2012 | $ | — | $ | — | $ | — | $ | — | ||||||||
| Fair value at purchase/issuance | 60,730 | (18,692 | ) | — | 42,038 | |||||||||||
| Dispositions | (278 | ) | — | — | (278 | ) | ||||||||||
| Changes in fair value included in net loss | 131 | 1,956 | — | 2,087 | ||||||||||||
| Balance, December 31, 2013 | 60,583 | (16,736 | ) | — | 43,847 | |||||||||||
| Total gains and losses: | ||||||||||||||||
| Unrealized gain included in other comprehensive income, net | 8,731 | — | — | 8,731 | ||||||||||||
| Changes in fair value included in net loss | — | (13,594 | ) | 3,292 | (10,302 | ) | ||||||||||
| Purchases, issuances, settlements and amortization: | ||||||||||||||||
| Fair value at purchase/issuance | 151,197 | — | (3,606 | ) | 147,591 | |||||||||||
| Dispositions | (158,637 | ) | — | (158,637 | ) | |||||||||||
| Principal payments received | (3,505 | ) | — | — | (3,505 | ) | ||||||||||
| Amortization included in net loss | 277 | — | — | 277 | ||||||||||||
| Payment | — | — | 314 | 314 | ||||||||||||
| Redemption of Series D | — | 30,330 | — | 30,330 | ||||||||||||
| Balance, December 31, 2014 | $ | 58,646 | $ | — | $ | — | $ | 58,646 | ||||||||
The fair values of the Company’s financial instruments that are not reported at fair value on the consolidated balance sheets are reported below (dollar amounts in thousands):
| Level | Carrying Amount at December 31, 2014 | Fair Value at December 31, 2014 | Carrying Amount at December 31, 2013 | Fair Value at December 31, 2013 | ||||||||||||||
| Assets: | ||||||||||||||||||
| Loans held for investment | 3 | $ | 42,106 | $ | 42,645 | $ | 26,279 | $ | 26,435 | |||||||||
| Liabilities: | ||||||||||||||||||
| Mortgage notes payable, net | 3 | $ | 3,759,935 | $ | 3,883,341 | $ | 1,301,114 | $ | 1,305,823 | |||||||||
| Corporate bonds, net | 3 | 2,546,499 | 2,709,845 | — | — | |||||||||||||
| Convertible debt, net | 3 | 977,521 | 1,088,069 | 972,490 | 976,629 | |||||||||||||
| Credit facilities | 3 | 3,184,000 | 3,145,884 | 1,969,800 | 1,843,145 | |||||||||||||
| Other Debt | 3 | 45,826 | 47,688 | 104,804 | 228,399 | |||||||||||||
| Total liabilities | $ | 10,513,781 | $ | 10,874,827 | $ | 4,348,208 | $ | 4,353,996 | ||||||||||
Loans held for investment – The fair value of the Company’s fixed-rate loan portfolio is estimated with a discounted cash flow analysis, utilizing scheduled cash flows and discount rates estimated by management to approximate those that a willing buyer and seller might use.
Credit facilities – Management believes that the stated interest rates (which float based on short-term interest rates) approximate market rates. As such, the fair values of these obligations are estimated to be equal to the outstanding principal amounts.
Convertible notes, mortgage notes payable and secured term loan – The fair value of mortgages payable on real estate investments and the secured term loan is estimated by an independent third party using a discounted cash flow analysis, based on management’s estimates of market interest rates.
F-50
AMERICAN REALTY CAPITAL PROPERTIES, INC. AND ARC PROPERTIES OPERATING PARTNERSHIP, L.P.
NOTES TO CONSOLIDATED FINANCIAL STATEMENTS
December 31, 2014 – (Continued)
Trust preferred notes – The fair value of the Company’s other long-term debt is estimated using a discounted cash flow analysis, based on management’s estimates of market interest rates.
Note 12 – Mortgage Notes Payable
The Company’s mortgage notes payable consist of the following as of December 31, 2014 and December 31, 2013 (dollar amounts in thousands):
| Encumbered Properties | Outstanding Loan Amount | Weighted Average Effective Interest Rate (1) | Weighted Average Maturity (2) | |||||||||
| December 31, 2014 | 776 | $ | 3,689,795 | 4.88 | % | 6.18 | ||||||
| December 31, 2013 | 177 | $ | 1,258,661 | 3.42 | % | 3.41 | ||||||
____________________________________
| (1) | Mortgage notes payable primarily have fixed rates or are fixed by way of interest rate swap arrangements. Effective interest rates range from 2.75% to 7.20% at December 31, 2014 and 1.83% to 6.28% at December 31, 2013. |
| (2) | Weighted-average remaining years until maturity as of December 31, 2014 and December 31, 2013, respectively. |
In conjunction with the various mergers and portfolio acquisitions, as described in Note 2 – Mergers and Significant Acquisitions and Sales, aggregate net premiums totaling $137.4 million were recorded upon the assumption of the mortgages for above-market interest rates. Amortization of these net premiums is recorded as a reduction to interest expense over the remaining term of the respective mortgages using the effective-interest method. As of December 31, 2014, there was $70.1 million in unamortized net premiums included in mortgage notes payable, net on the consolidated balance sheet.
The following table summarizes the scheduled aggregate principal repayments subsequent to December 31, 2014 (in thousands):
| Year | Total | |||
| 2015 | 163,821 | |||
| 2016 | 250,658 | |||
| 2017 | 457,903 | |||
| 2018 | 221,105 | |||
| 2019 | 297,146 | |||
| Thereafter | 2,299,162 | |||
| Total | $ | 3,689,795 | ||
The Company’s mortgage loan agreements generally require restrictions on corporate guarantees and the maintenance of financial covenants including maintenance of certain financial ratios (such as specified debt to equity and debt service coverage ratios). As of December 31, 2014, the Company believes it was in compliance with the debt covenants under the mortgage loan agreements.
During the year ended December 31, 2014, the Company repaid or sold $1.6 billion of mortgage notes payable, including notes that were subject to interest rate swap agreements. In connection with the debt repayments, the Company paid prepayment fees totaling $35.9 million for the year ended December 31, 2014, which are included in extinguishment of debt, net in the accompanying consolidated statements of operations. In addition, the Company paid $11.4 million during the year ended December 31, 2014 for the settlement of interest rate swaps that were associated with certain mortgage notes, which approximated the fair value of the interest rate swaps. The Company wrote off the deferred financing costs and net premiums associated with these mortgages, which resulted in a gain of $18.3 million during the year ended December 31, 2014, which is included in extinguishment of debt, net in the accompanying consolidated statements of operations. The mortgages repaid during the year ended December 31, 2014 had a weighted average remaining interest rate of 4.72% and a weighted average remaining term of 4.06 years.
National Institute of Health
The Company acquired an office building in Bethesda, Maryland occupied by the National Institute of Health (“NIH”) with a fair value approximating $40.0 million on November 5, 2013 as part of the Caplease Merger. The office building secures a mortgage loan that had an outstanding balance of $53.8 million as of December 31, 2014 (the “NIH Loan”). On November 1,
F-51
AMERICAN REALTY CAPITAL PROPERTIES, INC. AND ARC PROPERTIES OPERATING PARTNERSHIP, L.P.
NOTES TO CONSOLIDATED FINANCIAL STATEMENTS
December 31, 2014 – (Continued)
2013, NIH substantially vacated the building resulting in a shortfall between the rental cash inflows and the debt service payments. Due to this shortfall, the Company elected to stop making the debt service payments on the NIH Loan which resulted in the lender placing the loan in default on June 12, 2014.
Subsequent to December 31, 2014, the property went to a foreclosure auction. On January 13, 2015, a Substitute Trustees’ Deed was filed with the Clerk’s Office of Montgomery County, Maryland and the foreclosure sale was ratified by the court. As a result of the ratification, the Company forfeited its rights to the property and was relieved of its obligation on the NIH Loan. A gain is expected to be recorded in 2015.
Note 13 – Other Debt
Corporate Bond Offering
On February 6, 2014, the OP issued, in a private offering, $2.55 billion aggregate principal amount of senior unsecured notes consisting of $1.3 billion aggregate principal amount of 2.00% senior notes due February 6, 2017 (the “2017 Notes”), $750.0 million aggregate principal amount of 3.00% senior notes due February 6, 2019 (the “2019 Notes”) and $500.0 million aggregate principal amount of 4.60% senior notes due February 6, 2024 (the “2024 Notes,” and, together with the 2017 Notes and 2019 Notes, the “Notes”). The Notes are guaranteed by ARCP. The OP may redeem all or a part of any series of the Notes at any time at its option at the redemption prices set forth in the indenture governing the Notes, plus accrued and unpaid interest on the principal amount of the Notes of such series being redeemed to, but excluding, the applicable redemption date. With respect to the 2019 Notes and the 2024 Notes, if such Notes are redeemed on or after January 6, 2019 with respect to the 2019 Notes, or November 6, 2023 with respect to the 2024 Notes, the redemption price will equal 100% of the principal amount of the Notes of the applicable series to be redeemed, plus accrued and unpaid interest on the amount being redeemed to, but excluding, the applicable redemption date. In conjunction with this bond offering, aggregate discounts totaling $4.2 million were recorded. As of December 31, 2014, the unamortized net discount totaled $3.5 million.
On September 12, 2014, the OP commenced an offer to exchange the 2017 Notes, 2019 Notes and 2024 Notes for new $1.3 billion aggregate principal amount of 2.00% senior notes due 2017 (the “Exchange 2017 Notes”), new $750.0 million aggregate principal amount of 3.00% senior notes due 2019 (the “Exchange 2019 Notes”) and new $500.0 million aggregate principal amount of 4.60% senior notes due 2024 (the “Exchange 2024 Notes,” and, together with the Exchange 2017 Notes and Exchange 2019 Notes, the “Exchange Notes”). The terms of the Exchange Notes are substantially similar to the terms of the Notes except that the Exchange Notes are registered under the Securities Act of 1933 and are freely transferable. The exchange offer closed on October 16, 2014, with 100% of the Notes exchanged for Exchanged Notes.
Convertible Senior Note Offering
Effective July 29, 2013, the Operating Partnership issued to the General Partner $300.0 million of the 3.00% Convertible Senior Notes due 2018 and issued an additional $10.0 million of such notes on August 1, 2013 (collectively, the “Original 2018 Notes”). Effective December 10, 2013, the OP issued an additional $287.5 million of the notes when ARCP conducted a reopening of the Original 2018 Notes indenture agreement (the “Reopened 2018 Notes,” together with the Original 2018 Notes, the “2018 Notes”). The 2018 Notes mature on August 1, 2018. Such issuances were identical to ARCP’s registered issuances of the same amount of notes to various purchasers in a public offering. The fair value of the Original 2018 Notes and Reopened 2018 Notes was determined at issuance to be $299.6 million and $282.1 million, respectively, resulting in a debt discount of $10.4 million and $5.4 million, respectively, with an offset recorded for the General Partner to additional paid-in capital and for the Operating Partnership to partners’ equity, both representing the equity component of the notes for the conversion options. The discount is being amortized to interest expense over the expected lives of the 2018 Notes. As of December 31, 2014, the carrying value of the Original 2018 Notes and Reopened 2018 Notes was $302.6 million and $283.3 million, respectively. In connection with any permissible conversion election made by the holders of the identical convertible notes issued by ARCP, the General Partner may elect to convert the 2018 Notes into cash, General Partner OP Units or a combination thereof, in limited circumstances prior to February 1, 2018 and may convert the 2018 Notes at any time into such consideration on or after February 1, 2018. The initial conversion rate was 59.805 General Partner OP Units per $1,000 principal amount of 2018 Notes and is now 60.5997.
Effective December 10, 2013, the Operating Partnership issued to the General Partner $402.5 million of 3.75% Convertible Senior Notes due 2020 (the “2020 Notes”). The 2020 Notes mature on December 15, 2020. Such issuance was identical to ARCP’s registered issuance of the same amount of notes to various purchasers in a public offering. The fair value of the 2020 Notes was determined at issuance to be $389.7 million, resulting in a debt discount of $12.8 million with an offset recorded for the General Partner to additional paid-in capital and for the Operating Partnership to partners’ equity, both representing the equity component of the notes for the conversion options. The discount is being amortized to interest expense over the expected life of the 2020
F-52
AMERICAN REALTY CAPITAL PROPERTIES, INC. AND ARC PROPERTIES OPERATING PARTNERSHIP, L.P.
NOTES TO CONSOLIDATED FINANCIAL STATEMENTS
December 31, 2014 – (Continued)
Notes. As of December 31, 2014, the carrying value of the 2020 Notes was $391.6 million. In connection with any permissible conversion election made by the holders of the identical convertible notes issued by ARCP, the General Partner may elect to convert the 2020 Notes into cash, General OP Units or a combination thereof, in limited circumstances prior to June 15, 2020 and may convert the 2020 Notes at any time into such consideration on or after June 15, 2020. The initial conversion rate was 66.0262 General Partner OP Units per $1,000 principal amount of 2020 Notes and is now 66.7249.
The remaining unamortized discount for the 2018 Notes and 2020 Notes totaled $22.5 million as of December 31, 2014.
Secured Term Loan
As part of the CapLease Merger, the Company assumed a secured term loan from KBC Bank, N.V. with a principal balance of $59.8 million and a fair value of $60.7 million at the CapLease Acquisition Date. The Company recorded a premium of $0.8 million upon the assumption of the term loan in Other debt, net on the consolidated balance sheet. The interest coupon on the loan is fixed at 5.81% annually until the loan matures in January 2018. The loan is non-recourse to the Company, subject to limited non-recourse exceptions. The secured term loan provides for monthly payments of both principal and interest. During the year ended December 31, 2014, the Company made principal payments of $12.9 million. The scheduled principal repayments subsequent to December 31, 2014 are $11.9 million, $12.5 million, $7.7 million and $13.3 million for the years ended December 31, 2015, 2016, 2017 and 2018, respectively. The premium is being amortized to interest expense on the consolidated statements of operations over the life of the secured term loan. As of December 31, 2014, the unamortized premium is $0.5 million. As of December 31, 2014, the carrying value of the secured term loan was $45.3 million, which is included in other debt, net in the accompanying consolidated balance sheets.
Amounts related to the secured term loan as of December 31, 2014 were as follows (in thousands):
| Borrowings | Collateral Carrying Value | |||||||
| Loans held for investment | $ | 12,453 | $ | 23,103 | ||||
| Intercompany mortgage loans on CapLease properties | 3,903 | 11,207 | ||||||
| CMBS | 28,968 | 43,624 | ||||||
| $ | 45,324 | $ | 77,934 | |||||
Future Minimum Repayments
The following table summarizes the scheduled aggregate principal repayments of our corporate bonds, convertible notes and secured term note subsequent to December 31, 2014 (amounts in thousands):
| Principal Repayment | ||||
| 2015 | 11,862 | |||
| 2016 | 12,516 | |||
| 2017 | 1,307,680 | |||
| 2018 | 610,767 | |||
| 2019 | 750,000 | |||
| Thereafter | 902,500 | |||
| $ | 3,595,325 | |||
Repayments and Termination of Other Debt
Trust Preferred Notes
As part of the CapLease Merger, the Company assumed $30.9 million in aggregate principal amount of fixed/floating rate preferred notes with a fair value of $26.5 million at the CapLease Acquisition Date. The Company recorded a discount of $4.4 million upon the assumption of the notes in Other debt, net on the consolidated balance sheet. On July 30, 2014, the Company redeemed the notes at par. Upon redemption, the Company wrote off $4.4 million of the remaining unamortized discount to extinguishment of debt, net in the consolidated statement of operations.
F-53
AMERICAN REALTY CAPITAL PROPERTIES, INC. AND ARC PROPERTIES OPERATING PARTNERSHIP, L.P.
NOTES TO CONSOLIDATED FINANCIAL STATEMENTS
December 31, 2014 – (Continued)
Senior Notes
As part of the CapLease Merger, the Company assumed $19.2 million of senior notes (the “Senior Notes”) that bore interest at an annual interest rate of 7.50%, payable semi-annually on April 1 and October 1, with a fair value of $19.3 million at the CapLease Acquisition Date. The Company recorded a premium of $0.1 million upon the assumption of the Senior Notes in other debt, net on the consolidated balance sheet. On July 14, 2014, the Company redeemed the $19.2 million outstanding on the Senior Notes at par. Upon redemption, the Company wrote off $0.1 million of the remaining unamortized premium to extinguishment of debt, net in the consolidated statement of operations.
Repurchase Agreements
As part of the Cole Merger, the Company assumed $49.0 million of repurchase agreements secured by a portion of the Company’s CMBS portfolio. On September 29, 2014, in connection with the sale of CMBS securities, as discussed in Note 8 – Investment Securities, at Fair Value, the company settled all outstanding Repurchase Agreements at par with proceeds from the sale.
Barclay’s Facility
As of December 31, 2013, the Company had available commitments from Barclays Bank PLC, and other committed parties, for up to $2.1 billion in senior secured term loans (the “Barclays Facility”) which, if funded, would have been available to fund cash amounts payable in connection with the Cole Merger. The Barclays Facility was terminated upon the issuance of the senior unsecured notes in February 2014. In connection with the termination, the Company recorded $32.6 million as amortization of deferred financing costs associated with the Barclays Facility, which is included in interest expense, net in the accompanying consolidated statements of operations.
Note 14 – Credit Facilities
Senior Unsecured Credit Facility
The General Partner, as guarantor, and the OP, as borrower, are parties to an unsecured credit facility with Wells Fargo, National Association, as administrative agent and other lenders party thereto (the “Credit Facility”).
On June 30, 2014, the General Partner, as guarantor, and the OP, as borrower, entered into an amended and restated credit agreement (the “Credit Agreement”), which increased the available borrowings, extended the term and decreased the interest rates associated with the Credit Facility, prior to the execution of the Credit Agreement. The Company accepted commitments from 20 financial institutions totaling $4.6 billion for the Credit Facility. The Credit Facility was initially comprised of a $1.2 billion term loan facility (with a delayed draw component equal to $200.0 million), a $3.3 billion revolving credit facility, inclusive of a $250.0 million multi-currency revolving facility (all of which can be borrowed in dollars, at the Company’s discretion). The Credit Facility included an accordion feature, which, if exercised in full, allowed the Company to increase the aggregate commitments under the Credit Facility to $6.0 billion, subject to the receipt of such additional commitments and the satisfaction of certain customary conditions. Subsequent to the Credit Agreement date, the Company accepted an additional $50.0 million commitment on the revolving credit facility from one of the original 20 financial institutions, bringing the total Credit Facility commitments to $4.65 billion.
The revolving credit facility generally bears interest at an annual rate of LIBOR plus from 1.00% to 1.80% or Base Rate plus 0.00% to 0.80% (based upon ARCP’s then current credit rating). “Base Rate” is defined as the highest of the prime rate, the federal funds rate plus 0.50% or a floating rate based on one month LIBOR, determined on a daily basis. The term loan facility generally bears interest at an annual rate of LIBOR plus 1.15% to 2.05%, or Base Rate plus 0.15% to 1.05% (based upon ARCP’s then current credit rating). The Loans were initially priced with an applicable margin of 1.35% in the case of LIBOR revolving loans and 1.60% in the case of LIBOR term loans. In addition, the Credit Agreement provides the flexibility for interest rate auctions, pursuant to which, at the Company’s election, the Company may request that lenders make competitive bids to provide revolving loans, which competitive bids may be at pricing levels that differ from the foregoing interest rates.
The Credit Agreement provides for monthly interest payments under the Credit Facility. In the event of default, at the election of the majority of the lenders (or automatically upon a bankruptcy event of default with respect to the OP or ARCP), the commitments of the lenders under the Credit Facility terminate, and payment of any unpaid amounts in respect of the Credit Facility is accelerated. The revolving credit facility and the term loan facility both terminate on June 30, 2018, in each case, unless extended in accordance with the terms of the Credit Agreement. The Credit Agreement provides for a one-year extension option with respect to each of the revolving credit facility and the term loan facility, exercisable at the Company’s election and subject to certain customary
F-54
AMERICAN REALTY CAPITAL PROPERTIES, INC. AND ARC PROPERTIES OPERATING PARTNERSHIP, L.P.
NOTES TO CONSOLIDATED FINANCIAL STATEMENTS
December 31, 2014 – (Continued)
conditions, as well as certain customary “amend and extend” provisions. At any time, upon timely notice by the OP and subject to any breakage fees, the OP may prepay borrowings under the Credit Facility (subject to certain limitations applicable to the prepayment of any loans obtained through an interest rate auction, as described above). The OP incurs a fee equal to 0.15% to 0.25% per annum (based upon ARCP’s then current credit rating) multiplied by the commitments (whether or not utilized) in respect of the dollar revolving credit facility and the multi-currency credit facility. The OP incurs an unused fee of 0.25% per annum on the unused amount of the delayed draw term loan commitments. In addition, the OP incurs customary administrative agent, letter of credit issuance, letter of credit fronting, extension and other fees.
The Credit Facility requires restrictions on corporate guarantees, as well as the maintenance of financial covenants, including the maintenance of certain financial ratios (such as specified debt to equity and debt service coverage ratios) and the maintenance of a minimum net worth.
In connection with the Credit Agreement, the Company expensed $3.9 million of unamortized deferred financing costs incurred in connection with the original Credit Facility, which is included in interest expense, net in the accompanying consolidated unaudited statements of operations. During the fourth quarter of 2014, the Company repaid $1.2 billion outstanding on the revolving credit facility with proceeds from the sale of the Multi-Tenant Portfolio.
On November 12, 2014, the Company entered into a consent, waiver and amendment (the “Amendment”) with its lenders under the Credit Facility to extend the date of delivery of the Company’s third quarter 2014 financial statements and certain other financial deliverables until the earlier of five days following the date the Company filed with the SEC its third quarter 2014 10-Q and January 5, 2015. As part of the Amendment, the Company agreed to reduce the maximum amount of indebtedness available under the Credit Facility from $4.65 billion to $4.0 billion. Additionally, until the third quarter 2014 financial statements and a restatement of the Company’s financial statements for the fiscal year ended December 31, 2013 were filed with the SEC, the maximum principal amount of indebtedness outstanding under the Credit Facility was temporarily reduced to $3.6 billion.
On December 23, 2014, ARCP and the OP, as the borrower, entered into a Consent and Waiver Agreement (the “Consent and Waiver”) with respect to the Credit Agreement, as amended. The Consent and Waiver, among other things, (i) provided for a further extension of the date for the delivery of the Company’s third quarter 2014 financial statements and certain other financial deliverables that the Company agreed to provide under the Amendment, until the earlier of March 2, 2015 and 45 days following the receipt of a notice of breach or default from the applicable trustee or the requisite percentage of holders under ARCP’s and the OP’s respective indentures, (ii) provided an extension from the lenders for the delivery of the Company’s full-year 2014 audited financial statements until the earlier of the fifth day after the date that the Company files its Annual Report on Form 10-K with the SEC for the fiscal year ended December 31, 2014 and March 31, 2015, (iii) permanently reduced the maximum amount of indebtedness under the Credit Agreement to $3.6 billion, including the reduction of commitments under the undrawn term loan commitments and the Company’s revolving facilities as well as the elimination of the $25 million swingline facility, (iv) provided that until the date that all required financial deliverables have been delivered, no further loans or letters of credit would be requested under the Credit Agreement, as amended, by the Company, other than in accordance with the cash flow forecast provided by the Company to the lenders thereunder and that neither the Company nor the OP would pay any dividends on, or make any other Restricted Payment (as defined in the Credit Agreement) on, its respective common equity and (v) provided that the Company would provide additional financial and other information to the lenders from time to time. In connection with the Amendment and Consent and Waiver, the Company agreed to pay certain customary fees to the consenting lenders and agreed to reimburse certain customary expenses of the arrangers. On February 20, 2015, we entered into a third consent (the “Third Consent”) to clarify the required financial deliverables due to the lenders.
As of December 31, 2014, the outstanding balance on the Credit Facility was $3.2 billion, of which $2.2 billion bore a floating interest rate of 1.95% at December 31, 2014. The remaining outstanding balance on the Credit Facility of $1.0 billion is fixed through the use of derivative instruments used to hedge interest rate volatility. Including the spread, which can vary based on ARCP’s credit rating, the interest rate on this portion was 3.28% at December 31, 2014. As of December 31, 2014, a maximum of $416.0 million was available to the OP for future borrowings, subject to borrowing availability. The credit facility matures on June 30, 2018.
Repayment of Previous Credit Facilities
As part of the ARCT IV Merger, the Company assumed a $800.0 million senior unsecured credit facility with various lenders, with Regions Bank acting as the administrative agent (the “ARCT IV Credit Facility”). As of the date of the ARCT IV Merger, there was $760.0 million outstanding under the ARCT IV Credit Facility, which consisted of a $300.0 million term loan facility and $460.0 million under the revolving credit facility. In connection with the ARCT IV Merger, the Company prepaid all of its loans pursuant to, and terminated all commitments available under, the ARCT IV Credit Facility.
F-55
AMERICAN REALTY CAPITAL PROPERTIES, INC. AND ARC PROPERTIES OPERATING PARTNERSHIP, L.P.
NOTES TO CONSOLIDATED FINANCIAL STATEMENTS
December 31, 2014 – (Continued)
As part of the CapLease Merger, the Company assumed an unsecured credit facility with Wells Fargo, National Association, which had commitments of up to $150.0 million. In February 2014, such credit facility was amended and certain modifications were made to the terms of the agreement (the “CapLease Credit Facility”). On June 6, 2014, the Company repaid the outstanding balance of $150.0 million and terminated the credit facility agreement. No prepayment premium or penalty was paid in connection with the termination of the CapLease Credit Facility.
On February 28, 2013, the Company repaid all of the outstanding borrowings under its previous senior secured revolving credit facility in the amount of $124.6 million and the credit agreement for such facility was terminated. The average interest rate on the borrowings during the period the balance was outstanding was 3.11%. On February 14, 2013, simultaneous with entering into the Credit Facility, the Company terminated its then effective unsecured credit facility agreement, which had been unused.
Note 15 – Derivatives and Hedging Activities
Risk Management Objective of Using Derivatives
The Company may use derivative financial instruments, including interest rate swaps, caps, options, floors and other interest rate derivative contracts, to hedge all or a portion of the interest rate risk associated with its borrowings. The principal objective of such arrangements is to minimize the risks and/or costs associated with the Company’s operating and financial structure as well as to hedge specific anticipated transactions. The Company does not intend to utilize derivatives for speculative or other purposes other than interest rate risk management. The use of derivative financial instruments carries certain risks, including the risk that the counterparties to these contractual arrangements are not able to perform under the agreements. To mitigate this risk, the Company only enters into derivative financial instruments with counterparties with high credit ratings and with major financial institutions with which the Company and its affiliates may also have other financial relationships. The Company does not anticipate that any of the counterparties will fail to meet their obligations.
Cash Flow Hedges of Interest Rate Risk
The Company’s objectives in using interest rate derivatives are to add stability to interest expense and to manage its exposure to interest rate movements. To accomplish this objective, the Company primarily uses interest rate swaps and collars as part of its interest rate risk management strategy. Interest rate swaps designated as cash flow hedges involve the receipt of variable-rate amounts from a counterparty in exchange for the Company making fixed-rate payments over the life of the agreements without exchange of the underlying notional amount. Interest rate collars designated as cash flow hedges involve the receipt of variable-rate amounts if interest rates rise above the cap strike rate on the contract and payments of variable-rate amounts if interest rates fall below the floor strike rate on the contract.
The effective portion of changes in the fair value of derivatives designated and that qualify as cash flow hedges is recorded in accumulated other comprehensive income and is subsequently reclassified into earnings in the period that the hedged forecasted transaction affects earnings. During the year ended December 31, 2014, such derivatives were used to hedge the variable cash flows associated with variable-rate debt. The ineffective portion of the change in fair value of the derivatives is recognized directly in earnings.
Amounts reported in accumulated other comprehensive income related to derivatives will be reclassified to interest expense as interest payments are made on the Company’s variable-rate debt. During the next 12 months, the Company estimates that an additional $9.4 million will be reclassified from other comprehensive income as an increase to interest expense.
As of December 31, 2014, the Company had the following outstanding interest rate derivatives that were designated as cash flow hedges of interest rate risk (dollar amounts in thousands):
| Interest Rate Derivative | Number of Instruments | Notional Amount | ||||
| Interest rate swaps | 17 | $ | 1,249,004 | |||
The table below presents the fair value of the Company’s derivative financial instruments as well as their classification on the consolidated balance sheets as of December 31, 2014 and December 31, 2013 (in thousands):
| Derivatives Designated as Hedging Instruments | Balance Sheet Location | December 31, 2014 | December 31, 2013 | |||||||
| Interest rate products | Deferred costs and other assets, net | $ | 4,941 | $ | 9,189 | |||||
| Interest rate products | Deferred rent, derivative and other liabilities | $ | (7,384 | ) | $ | (1,719 | ) | |||
F-56
AMERICAN REALTY CAPITAL PROPERTIES, INC. AND ARC PROPERTIES OPERATING PARTNERSHIP, L.P.
NOTES TO CONSOLIDATED FINANCIAL STATEMENTS
December 31, 2014 – (Continued)
The table below details the location in the financial statements of the gain or loss recognized on interest rate derivatives designated as cash flow hedges for the year ended December 31, 2014 and 2013, respectively (in thousands):
| Year Ended December 31, | ||||||||
| 2014 | 2013 | |||||||
| Derivatives in Cash Flow Hedging Relationships | ||||||||
| Amount of (loss) gain recognized in accumulated other comprehensive income on interest rate derivatives (effective portion) | $ | (16,448 | ) | $ | 6,946 | |||
| Amount of loss reclassified from accumulated other comprehensive income into income as interest expense (effective portion) | $ | 9,446 | $ | 4,535 | ||||
| Amount of gain (loss) recognized in income on derivative (ineffective portion, reclassifications of missed forecasted transactions and amounts excluded from effectiveness testing) | $ | (371 | ) | $ | (79 | ) | ||
In January 2014, the Company entered into an interest rate lock agreement with a notional amount of $250.0 million (the “Treasury Lock Agreement”). The Treasury Lock Agreement, which had an original maturity date of February 12, 2014, was entered into to hedge part of the Company's interest rate exposure associated with the variability in future cash flows attributable to changes in the 10-year U.S. treasury rates related to the planned issuance of debt securities in conjunction with the Cole Merger. In connection with the Company's bond offering in February 2014, the Company settled the Treasury Lock Agreement, which was accounted for as cash flow hedge, for $3.9 million, which was recorded to other comprehensive loss and will be amortized into earnings over the ten year term of the Treasury Lock. The Company amortized $0.1 million into interest expense for the year ended December 31, 2014 related to the Treasury Lock.
Derivatives Not Designated as Hedging Instruments
Derivatives not designated as hedges are not speculative and are used to manage the Company’s exposure to interest rate movements and other identified risks but do not meet the requirements to be classified as hedging instruments. Changes in the fair value of derivatives not designated in hedging relationships are recorded directly in earnings and were a loss of $10.6 million for the year ended December 31, 2014. The Company recorded a loss of $67.9 million for the year ended December 31, 2013 relating to the contingent value rights.
As of December 31, 2014, the Company had the following outstanding interest rate derivative that was not designated as a qualifying hedging relationship (in thousands):
| Interest Rate Derivative | Number of Instruments | Notional Amount | ||||
| Interest rate swap | 1 | $ | 51,400 | |||
The table below presents the fair value of the Company’s derivate financial instruments not designated as hedges as well as their classification on the consolidated balance sheets as of December 31, 2014 and December 31, 2013 (in thousands):
| Derivatives Not Designated as Hedging Instruments | Balance Sheet Location | December 31, 2014 | December 31, 2013 | |||||||
| Interest rate products | Deferred costs and other assets, net | $ | 568 | $ | — | |||||
| Series D Preferred Stock embedded derivative | Deferred rent, derivative and other liabilities | $ | — | $ | (16,736 | ) | ||||
The Series D Preferred Stock was redeemed on September 2, 2014. Refer to Note 18 – Preferred and Common Stock and OP Units for further discussion.
F-57
AMERICAN REALTY CAPITAL PROPERTIES, INC. AND ARC PROPERTIES OPERATING PARTNERSHIP, L.P.
NOTES TO CONSOLIDATED FINANCIAL STATEMENTS
December 31, 2014 – (Continued)
Tabular Disclosure of Offsetting Derivatives
The table below details a gross presentation, the effects of offsetting and a net presentation of the Company’s derivatives as of December 31, 2014 and December 31, 2013. The net amounts of derivative assets or liabilities can be reconciled to the tabular disclosure of fair value. The tabular disclosure of fair value provides the location that derivative assets and liabilities are presented on the consolidated balance sheets (in thousands).
| Offsetting of Derivative Assets and Liabilities | ||||||||||||||||||||||||||||||||
| Gross Amounts of Recognized Assets | Gross Amounts of Recognized Liabilities | Gross Amounts Offset in the Consolidated Balance Sheets | Net Amounts of Assets Presented in the Consolidated Balance Sheets | Net Amounts of Liabilities Presented in the Consolidated Balance Sheets | Financial Instruments | Cash Collateral Received | Net Amount | |||||||||||||||||||||||||
| December 31, 2014 | $ | 5,509 | $ | (7,384 | ) | $ | — | $ | 5,509 | $ | (7,384 | ) | $ | — | $ | — | $ | (1,875 | ) | |||||||||||||
| December 31, 2013 | $ | 9,189 | $ | (18,455 | ) | $ | — | $ | 9,189 | $ | (18,455 | ) | $ | — | $ | — | $ | (9,266 | ) | |||||||||||||
Credit-risk-related Contingent Features
The Company has agreements with each of its derivative counterparties that contain a provision where, if the Company either defaults or is capable of being declared in default on any of its indebtedness, then the Company could also be declared in default on its derivative obligations.
As of December 31, 2014, the fair value of the interest rate derivatives in a net liability position, including accrued interest but excluding any adjustment for nonperformance risk related to these agreements, was $9.1 million. As of December 31, 2014, the Company has not posted any collateral related to these agreements and was not in breach of any agreement provisions. If the Company had breached any of these provisions, it could have been required to settle its obligations under the agreements at their aggregate termination value of $9.1 million at December 31, 2014.
Note 16 – Accounts Payable and Accrued Expenses
Accounts payable and accrued expenses consisted of the following as of December 31, 2014 and December 31, 2013 (in thousands):
| December 31, 2014 | December 31, 2013 | |||||||
| Accrued other | $ | 58,807 | $ | 34,407 | ||||
| Accrued interest | 56,558 | 14,189 | ||||||
| Accrued real estate taxes | 37,633 | 24,658 | ||||||
| Accounts payable | 10,027 | 5,887 | ||||||
| Accrued merger costs | — | 651,430 | ||||||
| $ | 163,025 | $ | 730,571 | |||||
Note 17 – Commitments and Contingencies
Litigation
In the ordinary course of business, the Company may become subject to litigation or claims. There are no material legal proceedings pending or known to be contemplated against the Company, except as follows:
Regulatory Investigations and Litigation Relating to the Audit Committee Investigation
On October 29, 2014, the Company filed a Current Report on Form 8-K (the “October 29 8-K”) reporting the Audit Committee’s conclusion, based on the preliminary findings of its investigation, that certain previously issued consolidated financial statements of the Company, including those included in the Company’s Annual Report on Form 10-K for the year ended December 31, 2013 and Quarterly Reports on Form 10-Q for the quarters ended March 31, 2014 and June 30, 2014, and related financial information should no longer be relied upon. Prior to that filing, the Audit Committee previewed for the SEC the information contained in the filing. Subsequent to that filing, the SEC provided notice that it had commenced a formal investigation and issued subpoenas calling for the production of various documents. In addition, the United States Attorney’s Office for the Southern District of New
F-58
AMERICAN REALTY CAPITAL PROPERTIES, INC. AND ARC PROPERTIES OPERATING PARTNERSHIP, L.P.
NOTES TO CONSOLIDATED FINANCIAL STATEMENTS
December 31, 2014 – (Continued)
York contacted counsel for the Audit Committee and counsel for the Company with respect to this matter, and the Secretary of the Commonwealth of Massachusetts issued a subpoena calling for the production of various documents. The Audit Committee and the Company are cooperating with these regulators in their investigations.
As discussed below, the Company and certain of its current and former directors and officers have been named as defendants in a number of lawsuits filed in response to the October 29 8-K, including class actions, derivative actions, and individual actions under the federal securities laws and state common and corporate laws in both federal and state courts in New York and Maryland.
Between October 30, 2014 and January 20, 2015, the Company and its current and former officers and directors (in addition to the Company’s underwriters for certain of the Company’s securities offerings) were named as defendants in ten putative securities class action complaints in the United States District Court for the Southern District of New York (the “SDNY Actions”): Ciraulu v. American Realty Capital, Inc., et al., No. 14-cv-8659 (AKH); Priever v. American Realty Capital Properties, Inc., et al., No. 14-cv-8668 (AKH); Rubinstein v. American Realty Capital Properties, Inc., et al., No. 14-cv-8669 (AKH); Patton v. American Realty Capital Properties, Inc., et al., No. 14-cv-8671 (AKH); Edwards v. American Realty Capital Properties, Inc., et al., No. 14-cv-8721 (AKH); Harris v. American Realty Capital Properties, Inc., et al., No. 14-cv-8740 (AKH); Abadi v. American Realty Capital Properties, Inc., et al., No. 14-cv-9006 (AKH); City of Tampa General Employees Retirement Fund v. American Realty Capital Properties, Inc., et al., No. 14-cv-10134 (AKH); Teachers Insurance and Annuity Association of America v. American Realty Capital Properties, Inc., et al., No. 15-cv-0421 (AKH); and New York City Employees Retirement System v. American Realty Capital Properties, Inc., et al., No. 15-cv-0422 (AKH). At a February 10, 2015 status conference, the court, among other things, consolidated the SDNY Actions under the caption In re American Realty Capital Properties, Inc. Litigation, No. 15-MC-00040 (AKH) (the “SDNY Consolidated Securities Class Action”), appointed a lead plaintiff, and designated the complaint filed in Teachers Insurance and Annuity Association of America v. American Realty Capital Properties, Inc., et al., No. 15-cv-0421 (AKH) as the operative complaint in the SDNY Consolidated Securities Class Action. The consolidated class action complaint asserts claims for violations of Sections 11, 12(a)(2) and 15 of the Securities Act of 1933 and Sections 10(b), 14(a) and 20(a) of the Securities Exchange Act of 1934 and Rules 10b-5 and 14a-9 promulgated thereunder, arising out of allegedly false and misleading statements in connection with the purchase or sale of the Company’s securities. The proposed class period runs from May 6, 2013 to October 29, 2014. On March 17, 2015, the court entered an order setting deadlines of April 17, 2015 for the lead plaintiff in the SDNY Consolidated Securities Class Action to file an amended complaint and May 29, 2015 for the Company and defendants to file motions to dismiss.
In addition, on November 25, 2014, the Company and certain of its current and former officers and directors were named as defendants in a putative securities class action filed in the Circuit Court for Baltimore County, Maryland, captioned Wunsch v. American Realty Capital Properties, Inc., et al., No. 03-C-14-012816 (the “Maryland Securities Action”). On December 23, 2014, the Company removed the Maryland Securities Action to the United States District Court for the District of Maryland (Northern Division), under the caption Wunsch v. American Realty Capital Properties, Inc., et al., No. 14-cv-4007 (ELH), and seeks to transfer the action to the United States District Court for the Southern District of New York. The Maryland Securities Action asserts claims for violations of Sections 11 and 15 of the Securities Act of 1933, arising out of allegedly false and misleading statements made in connection with the Company’s securities issued in connection with the Cole Merger. The Company is not yet required to respond to the complaint in the Maryland Securities Action.
Between November 17, 2014 and February 2, 2015, six shareholder derivative actions, purportedly in the name and for the benefit of the Company, were filed against certain of the Company’s current and former officers and directors in the United States District Court for the Southern District of New York (the “SDNY Derivative Actions”): Michelle Graham Turner 1995 Revocable Trust v. Schorsch, et al., No. 14-cv-9140 (AKH); Froehner v. Schorsch, et al., No. 14-cv-9444 (AKH); Serafin v. Schorsch, et al., No. 14-cv-9672 (AKH); Hopkins v. Schorsch, et al., No. 15-cv-262 (AKH); Appolito v. Schorsch, et al., No. 15-cv-644 (AKH); and The Joel and Robin Staadecker Living Trust v. Schorsch, et al., No. 15-cv-768 (AKH). In addition, between December 30, 2014 and January 16, 2015, the Company and certain of its current and former officers and directors were named as defendants in two shareholder derivative actions filed in the Circuit Court for Baltimore City, Maryland (the “Maryland Derivative Actions”): Meloche v. Schorsch, et al., No. 24-C-14-008210 and Botifoll v. Schorsch, et al., No. 24-C-15-000245. In addition, on January 29, 2015, the Company and certain of its current directors, amongst others, were named as defendants in a shareholder derivative action filed in the Supreme Court of the State of New York, captioned Fran Kosky Roth IRA v. Rendell, et al., No. 15-650269 (the “New York Derivative Action,” and together with the SDNY Derivative Actions and the Maryland Derivative Actions, the “Derivative Actions”). On February 9, 2015 and February 20, 2015, three plaintiffs who filed SDNY Derivative Actions-Appolito, Hopkins and The Joel and Robin Staadecker Living Trust-voluntarily dismissed their actions without prejudice. The Derivative Actions seek money damages and other relief on behalf of the Company for, among other things, alleged breaches of fiduciary duty, abuse of control, gross mismanagement and unjust enrichment in connection with the alleged conduct underlying the claims asserted in the securities actions and negligence and breach of contract. At a February 10, 2015 status conference, the court
F-59
AMERICAN REALTY CAPITAL PROPERTIES, INC. AND ARC PROPERTIES OPERATING PARTNERSHIP, L.P.
NOTES TO CONSOLIDATED FINANCIAL STATEMENTS
December 31, 2014 – (Continued)
consolidated the SDNY Derivative Actions under the caption Serafin v. Schorsch, et al., No. 14-cv-9672 (AKH) (the “SDNY Consolidated Derivative Action”) and directed the plaintiffs to file a consolidated amended complaint by March 10, 2015. On February 18, 2015, the parties to the New York Derivative Action entered into a stipulation setting a deadline of April 20, 2015 for the Company and defendants to respond to the complaint in the action. On March 10, 2015, the plaintiffs in the SDNY Consolidated Derivative Action filed a consolidated amended complaint. The Company and defendants are required to file motions to dismiss the consolidated amended complaint in the SDNY Consolidated Derivative Action by April 3, 2015. On March 18, 2015, the parties to the Maryland Derivative Actions entered into a stipulation providing for, among other things, the consolidation of those actions. The Company and defendants are not yet required to respond to the complaints in the Maryland Derivative Actions.
On December 18, 2014, a former employee, Lisa McAlister, filed a defamation action against the Company and certain of its former officers and directors in the Supreme Court for the State of New York, captioned McAlister v. American Realty Capital Properties, Inc., et al., No. 14-162499. The complaint sought, among other things, compensatory and punitive damages and alleged that the October 29 8-K falsely blamed plaintiff for improper accounting and financial reporting practices. On January 26, 2015, the Company and the other defendants filed motions to dismiss plaintiff’s complaint. Subsequently, Ms. McAlister dismissed this action without prejudice.
On January 7, 2015, Ms. McAlister also filed a complaint, No. 2-4173-15-016, with the Occupational Safety and Health Administration of the United States Department of Labor. The complaint seeks, among other things, compensatory and punitive damages and asserts claims for wrongful termination of employment for allegedly reporting concerns relating to alleged improper accounting practices by the Company. Ms. McAlister has withdrawn the complaint without prejudice.
On January 15, 2015, the Company and certain of its former directors and officers were named as defendants in an individual securities fraud action filed in the United States District Court for the Southern District of New York, captioned Jet Capital Master Fund, L.P. v. American Realty Capital Properties, Inc., et al., No. 15-cv-307 (AKH) (the “Jet Capital Action”). The Jet Capital Action seeks money damages and asserts claims for alleged violations of Sections 10(b), 18 and 20(a) of the Securities Exchange Act of 1934 and Rule 10b-5 promulgated thereunder, as well as common law fraud under New York law in connection with the purchase of the Company’s securities. The Company and defendants are required to respond to the complaint in the Jet Capital Action on the same schedule set by the court for the SDNY Consolidated Securities Class Action.
On February 20, 2015, the Company, certain of its current and former directors and officers, and ARC Properties Operating Partnership L.P. (in addition to several other individuals and entities) were named as defendants in an individual securities fraud action filed in the United States District Court for the Southern District of New York, captioned Twin Securities, Inc. v. American Realty Capital Properties, Inc., et al., No. 15-cv-1291 (the “Twin Securities Action”). The Twin Securities Action seeks money damages and asserts claims for alleged violations of Sections 10(b), 14(a), 18, and 20(a) of the Securities Exchange Act of 1934 and Rules 10b-5 and 14a-9 promulgated thereunder, Sections 11, 12(a)(2), and 15 of the Securities Act of 1933, as well as common law fraud under New York law in connection with the purchase of the Company’s securities. The Company and defendants are not yet required to respond to the complaint in the Twin Securities Action.
ARCT III Litigation Matters
After the announcement of the ARCT III Merger Agreement on December 17, 2012, Randell Quaal filed a putative class action lawsuit on January 30, 2013 against the Company, the OP, ARCT III, ARCT III OP, the members of the board of directors of ARCT III and certain subsidiaries of the Company in the Supreme Court of the State of New York. The plaintiff alleges, among other things, that the board of ARCT III breached its fiduciary duties in connection with the transactions contemplated under the ARCT III Merger Agreement. In February 2013, the parties agreed to a memorandum of understanding regarding settlement of all claims asserted on behalf of the alleged class of ARCT III stockholders. In connection with the settlement contemplated by that memorandum of understanding, the class action and all claims asserted therein will be dismissed, subject to court approval. The proposed settlement terms required ARCT III to make certain additional disclosures related to the ARCT III Merger, which were included in a Current Report on Form 8-K filed by ARCT III with the SEC on February 21, 2013. The memorandum of understanding also added that the parties will enter into a stipulation of settlement, which will be subject to customary conditions, including confirmatory discovery and court approval following notice to ARCT III’s stockholders. If the parties enter into a stipulation of settlement, a hearing will be scheduled at which the court will consider the fairness, reasonableness and adequacy of the settlement. There can be no assurance that the parties will ultimately enter into a stipulation of settlement, that the court will approve any proposed settlement, or that any eventual settlement will be under the same terms as those contemplated by the memorandum of understanding, therefore any losses that may be incurred to settle this matter are not determinable.
F-60
AMERICAN REALTY CAPITAL PROPERTIES, INC. AND ARC PROPERTIES OPERATING PARTNERSHIP, L.P.
NOTES TO CONSOLIDATED FINANCIAL STATEMENTS
December 31, 2014 – (Continued)
CapLease Litigation Matters
Since the announcement of the CapLease Merger Agreement on May 28, 2013, the following lawsuits have been filed:
On May 28, 2013, Jacquelyn Mizani filed a putative class action lawsuit in the Supreme Court for the State of New York against the Company, the OP, Safari Acquisition LLC, CapLease, CapLease LP, CLF OP General Partner, LLC and the members of the CapLease board of directors (the “Mizani Action”). The complaint alleges, among other things, that the merger agreement at issue was the product of breaches of fiduciary duty by the CapLease directors because the proposed merger transaction (the “CapLease Transaction”) purportedly does not provide for full and fair value for the CapLease shareholders, the CapLease Transaction allegedly was not the result of a competitive bidding process, the merger agreement allegedly contains coercive deal protection measures and the merger agreement and the CapLease Transaction purportedly were approved as a result of improper self-dealing by certain defendants who would receive certain alleged employment compensation benefits and continued employment pursuant to the merger agreement. The complaint also alleges that CapLease, the Company, the OP and Safari Acquisition LLC aided and abetted the CapLease directors’ alleged breaches of fiduciary duty.
On July 3, 2013, Fred Carach filed a putative class action and derivative lawsuit in the Supreme Court for the State of New York against the Company, the OP, Safari Acquisition LLC, CapLease, CapLease LP, CLF OP General Partner, LLC and the members of the CapLease board of directors (the “Carach Action”). The complaint alleges, among other things, that the merger agreement was the product of breaches of fiduciary duty by the CapLease directors because the merger purportedly does not provide for full and fair value for the CapLease shareholders, the CapLease Transaction allegedly was not the result of a competitive bidding process, the merger agreement allegedly contains coercive deal protection measures and the merger agreement and the CapLease Transaction purportedly were approved as a result of improper self-dealing by certain defendants who would receive certain alleged employment compensation benefits and continued employment pursuant to the merger agreement. The complaint also alleges that with respect to the Registration Statement and draft joint proxy statement issued in connection with the proposed CapLease Transaction on July 2, 2013, that disclosures made therein were insufficient or otherwise improper. The complaint also alleges that CapLease LP, CLF OP General Partner, LLC, the Company, the OP and Safari Acquisition LLC aided and abetted the CapLease directors’ alleged breaches of fiduciary duty.
On June 25, 2013, Dewey Tarver filed a putative class action and derivative lawsuit in the Circuit Court for Baltimore City against the Company, the OP, Safari Acquisition LLC, CapLease, CapLease LP, CLF OP General Partner, LLC and the members of the CapLease board of directors (the “Tarver Action”). The complaint alleges, among other things, that the merger agreement was the product of breaches of fiduciary duty by the CapLease directors because the CapLease Transaction purportedly does not provide for full and fair value for the CapLease shareholders, the CapLease Transaction allegedly was not the result of a competitive bidding process, the merger agreement allegedly contains coercive deal protection measures and the merger agreement and the CapLease Transaction purportedly were approved as a result of improper self-dealing by certain defendants who would receive certain alleged employment compensation benefits and continued employment pursuant to the merger agreement. The complaint also alleges that CapLease, CapLease LP, CLF OP General Partner, LLC, the Company, the OP and Safari Acquisition, LLC aided and abetted the CapLease directors’ alleged breaches of fiduciary duty.
Counsel who filed each of these three cases reached an agreement with each other as to who will serve as lead plaintiff and lead plaintiffs’ counsel in the cases and where they will be prosecuted. Thus, on August 9, 2013, counsel in the Tarver Action filed a motion for stay in the Baltimore Court, informing the court that they had agreed to join and participate in the prosecution of the Mizani and Carach Actions in the New York Court. The Defendants consented to the stay of the Tarver Action in the Baltimore Court, and on September 5, 2013, Judge Pamela J. White issued an order granting that stay. Consequently, there has been no subsequent activity in the Baltimore Court in the Tarver Action. Also on August 9, 2013, all counsel involved in the Mizani and Carach Actions filed a joint stipulation in the New York Court, reflecting agreement among all parties that the Mizani and Carach Actions should be consolidated (jointly, “the Consolidated Actions”) and setting out a schedule for early motion practice in response to the complaints filed (the “Consolidation Stipulation”). Pursuant to the Consolidation Stipulation, an amended complaint was also filed in the New York court on August 9, 2013 and was designated as the operative complaint in the Consolidated Actions (“Operative Complaint”). Pursuant to the Consolidation Stipulation, all Defendants filed a motion to dismiss all claims asserted in the Operative Complaint on September 23, 2013. Plaintiffs’ response was due on or before November 7, 2013. On November 7, 2013, Plaintiffs filed a motion seeking leave to file a second amended complaint, which the Defendants opposed. On March 24, 2014, Plaintiffs’ counsel in the Consolidated Actions dismissed those claims without prejudice. Consequently, only the Tarver Action currently remains pending among these cases, although it remains stayed.
F-61
AMERICAN REALTY CAPITAL PROPERTIES, INC. AND ARC PROPERTIES OPERATING PARTNERSHIP, L.P.
NOTES TO CONSOLIDATED FINANCIAL STATEMENTS
December 31, 2014 – (Continued)
On October 8, 2013, John Poling filed a putative class action lawsuit in the Circuit Court for Baltimore City against the Company, the OP, Safari Acquisition LLC, CapLease, CapLease LP, CLF OP General Partner, LLC and the members of the CapLease board of directors (the “Poling Action”). The complaint alleges that the merger agreement breaches the terms of the CapLease 8.375% Series B Cumulative Redeemable Preferred Stock (“Series B”) and the terms of the 7.25% Series C Cumulative Redeemable Preferred Stock (“Series C”) and is in violation of the Series B Articles Supplementary and the Series C Articles Supplementary. The Complaint alleges claims for breach of contract and breach of fiduciary duty against the CapLease entities and the CapLease board of directors. The complaint also alleges that the Company, the OP and Safari Acquisition, LLC aided and abetted CapLease and the CapLease directors’ alleged breach of contract and breach of fiduciary duty.
On November 13, 2013, all counsel involved in the Poling Action filed a joint stipulation, reflecting agreement among all parties concerning a schedule for early motion practice in response to the complaint filed (the “Scheduling Stipulation”). Pursuant to the Scheduling Stipulation, all Defendants filed a motion to dismiss all claims asserted in the Operative Complaint on December 20, 2013. Plaintiff has filed an opposition to that motion, which remains pending.
Cole Litigation Matters
Three putative class action and/or derivative lawsuits, which were filed in March and April 2013, assert claims for breach of fiduciary duty, abuse of control, corporate waste, unjust enrichment, aiding and abetting breach of fiduciary duty and other claims relating to the merger between a wholly owned subsidiary of Cole and Cole Holdings Corporation, pursuant to which Cole became a self-managed REIT. On October 22, 2013, the Circuit Court for Baltimore City granted all defendants’ motion to dismiss with prejudice the action pending before the court, but the plaintiffs appealed that dismissal. On July 31, 2014, plaintiffs dismissed the pending appeal based on an agreement by defendants to reimburse plaintiffs in the amount of $100,000. The other two lawsuits, which also purport to assert shareholder class action claims under the Securities Act of 1933, as amended (the “Securities Act”), are pending in the United States District Court for the District of Arizona. Defendants filed a motion to dismiss both complaints on January 10, 2014. Subsequently, both of those lawsuits have been stayed by the Court pursuant to a joint request made by all parties pending final approval of the consolidated Baltimore Cole Merger Actions described below.
To date, eleven lawsuits have been filed in connection with the Cole Merger. Two of these suits - Wunsch v. Cole, et al. (“Wunsch”), No. 13-CV-2186, and Sobon v. Cole, et al. (“Sobon”) - were filed as putative class actions on October 25, 2013 and November 18, 2013, respectively, in the U.S. District Court for the District of Arizona. Between October 30, 2013 and November 14, 2013, eight other putative stockholder class action or derivative lawsuits were filed in the Circuit Court for Baltimore City, Maryland, captioned as: (i) Operman v. Cole, et al. (“Operman”); (ii) Branham v. Cole, et al. (“Branham”); (iii) Wilfong v. Cole, et al. (“Wilfong”); (iv) Polage v. Cole, et al. (“Polage”); (v) Corwin v. Cole, et al. (“Corwin”); (vi) Green v. Cole, et al. (“Green”); (vii) Flynn v. Cole, et al. (“Flynn”) and (viii) Morgan v. Cole, et al. (“Morgan”). All of these lawsuits name the Company, Cole and Cole’s board of directors as defendants; Wunsch, Sobon, Branham, Wilfong, Flynn, Green, Morgan and Polage also name CREInvestments, LLC, a Maryland limited liability company and a wholly-owned subsidiary of the Cole, as a defendant. All of the named plaintiffs claim to be Cole stockholders and purport to represent all holders of Cole’s stock. Each complaint generally alleges that the individual defendants breached fiduciary duties owed to plaintiff and the other public stockholders of Cole in connection with the Cole Merger, and that certain entity defendants aided and abetted those breaches. The breach of fiduciary duty claims asserted include claims that the Cole Merger did not provide for full and fair value for the Cole shareholders, that the Cole Merger was the product of an “inadequate sale process,” that the Cole Merger Agreement contained coercive deal protection measures and that the Cole Merger Agreement and the Cole Merger were approved as a result of or in a manner which facilitates improper self-dealing by certain defendants. In addition, the Flynn, Corwin, Green, Wilfong, Polage and Branham lawsuits claim that the individual defendants breached their duty of candor to shareholders and the Branham and Polage lawsuits assert claims derivatively against the individual defendants for their alleged breach of fiduciary duties owed to Cole. The Polage lawsuit also asserts derivative claims for waste of corporate assets and unjust enrichment. The Wunsch and Sobon lawsuits also assert claims against Cole and the individual defendants under Section 14(a) of the Securities Exchange Act of 1934, as amended (the “Exchange Act”), based on allegations that the proxy materials omitted to disclose allegedly material information, and a claim against the individual defendants under Section 20(a) of the Exchange Act bNumberased on the same allegations. Among other remedies, the complaints seek unspecified money damages, costs and attorneys’ fees.
In January 2014, the parties to the eight lawsuits filed in the Circuit Court for Baltimore City, Maryland (the “consolidated Baltimore Cole Merger Actions”) entered into a memorandum of understanding regarding settlement of all claims asserted on behalf of the alleged class of Cole stockholders. In connection with the settlement contemplated by that memorandum of understanding, the class action and all claims asserted therein would be dismissed, subject to court approval. The proposed settlement terms required Cole to make certain additional disclosures related to the Cole Merger, which were included in a Current Report on Form 8-K filed by Cole with the SEC on January 14, 2014. The memorandum of understanding also contemplated that the parties would enter into a stipulation of settlement, subject to customary conditions, including confirmatory discovery and court
F-62
AMERICAN REALTY CAPITAL PROPERTIES, INC. AND ARC PROPERTIES OPERATING PARTNERSHIP, L.P.
NOTES TO CONSOLIDATED FINANCIAL STATEMENTS
December 31, 2014 – (Continued)
approval following notice to Cole’s stockholders. The Sobon lawsuit was voluntarily dismissed on February 3, 2014.
On August 14, 2014, the parties in the consolidated Baltimore Merger Actions executed a Stipulation and Release and Agreement of Compromise and Settlement (the “Settlement Stipulation”). The parties in the consolidated Baltimore Merger Actions submitted the Settlement Stipulation, along with related filings, for approval by the Maryland court on August 18, 2014. On August 25, 2014, the Baltimore Circuit Court entered an Order on Preliminary Approval of Derivative and Class Action Settlement and Class Action Certification and scheduled a final settlement hearing in the consolidated Baltimore Merger Actions.
The defendants in the consolidated Baltimore Merger Actions mailed a Notice of Pendency of Derivative and Class Action (the “Class Notice”) to the Cole stockholders on October 7, 2014, following the court’s preliminary approval of the parties’ Settlement Stipulation. On December 3, 2014, the parties in the consolidated Baltimore Merger Actions executed an Amended Stipulation and Release and Agreement of Compromise and Settlement (the “Amended Stipulation”) modifying the Stipulation. A final settlement hearing in the consolidated Baltimore Merger Actions was held on December 12, 2014, and on January 13, 2015, the Baltimore Circuit Court issued an order approving the settlement pursuant to the terms of the Amended Stipulation. Two objectors have since filed a notice of appeal of the settlement order. Following court approval of the settlement of the consolidated Baltimore Merger Actions, the Wunsch case was dismissed voluntarily on January 21, 2015.
On December 27, 2013, Realistic Partners filed a putative class action lawsuit against the Company and the members of its board of directors in the Supreme Court for the State of New York. Cole was later added as a defendant also. The plaintiff alleges, among other things, that the board of the Company breached its fiduciary duties in connection with the transactions contemplated under the Cole Merger Agreement and that Cole aided and abetted those breaches. In January 2014, the parties entered into a memorandum of understanding regarding settlement of all claims asserted on behalf of the alleged class of the Company’s stockholders. In connection with the settlement contemplated by that memorandum of understanding, the class action and all claims asserted therein will be dismissed, subject to court approval. The proposed settlement terms required the Company to make certain additional disclosures related to the Cole Merger, which were included in a Current Report on Form 8-K filed by the Company with the SEC on January 17, 2014. The memorandum of understanding also contemplated that the parties will enter into a stipulation of settlement, which will be subject to customary conditions, including confirmatory discovery and court approval following notice to the Company’s stockholders. If the parties enter into a stipulation of settlement, a hearing will be scheduled at which the court will consider the fairness, reasonableness and adequacy of the settlement. There can be no assurance that the parties will ultimately enter into a stipulation of settlement, that the court will approve any proposed settlement, or that any eventual settlement will be under the same terms as those contemplated by the memorandum of understanding, therefore any losses that may be incurred to settle this matter are not determinable.
Contractual Lease Obligations
The following table reflects the minimum base rental cash payments due from the Company over the next five years and thereafter for certain ground and office lease obligations (in thousands):
Future Minimum Base Rent Payments | ||||
| 2015 | $ | 24,093 | ||
| 2016 | 22,880 | |||
| 2017 | 22,014 | |||
| 2018 | 19,958 | |||
| 2019 | 72,316 | |||
| Thereafter | 213,344 | |||
| Total | $ | 374,605 | ||
Purchase Commitments
Cole Capital enters into purchase and sale agreements and deposits funds into escrow towards the purchase of such acquisitions, some of which are expected to be assigned to one of the Managed REITs at or prior to the closing of the respective acquisition. As of December 31, 2014, Cole Capital was a party to 51 purchase and sale agreements with unaffiliated third-party sellers to purchase a 100% interest in 192 properties, subject to meeting certain criteria, for an aggregate purchase price of $1.0 billion, exclusive of closing costs. As of December 31, 2014, Cole Capital had $29.8 million of property escrow deposits held by escrow agents in connection with these future property acquisitions, which may be forfeited if the transactions are not completed under
F-63
AMERICAN REALTY CAPITAL PROPERTIES, INC. AND ARC PROPERTIES OPERATING PARTNERSHIP, L.P.
NOTES TO CONSOLIDATED FINANCIAL STATEMENTS
December 31, 2014 – (Continued)
certain circumstances. During the year ended December 31, 2014, Cole Capital forfeited $0.4 million of property escrow deposits, which are included in acquisition related expenses on the consolidated statement of operations. Cole Capital will be reimbursed by the assigned Managed REIT for amounts escrowed when it acquires a property.
Environmental Matters
In connection with the ownership and operation of real estate, the Company may potentially be liable for costs and damages related to environmental matters. The Company has not been notified by any governmental authority of any non-compliance, liability or other claim, and is not aware of any other environmental condition, in each case, that it believes will have a material adverse effect on the results of operations.
Note 18 – Preferred and Common Stock and OP Units
Series D and Series E Preferred Stock and Preferred Units
On September 12, 2013, the General Partner’s board of directors unanimously approved the issuance of Series D Cumulative Convertible Preferred Stock (“Series D Preferred Stock”) and the issuance of Series E Cumulative Preferred Stock (“Series E Preferred Stock”). Concurrently, the Operating Partnership was approved to issue to the General Partner Series D Cumulative Convertible Preferred Units (“Series D Preferred Units”) and Series E Cumulative Preferred Units (“Series E Preferred Units”), if applicable.
On September 15, 2013, the General Partner entered into definitive purchase agreements pursuant to which it agreed to issue Series D Preferred Stock and common stock to certain institutional holders, necessitating that the Operating Partnership concurrently issue to the General Partner Series D Preferred Units and General Partner OP Units promptly following the close of the CapLease Merger. Pursuant to the definitive purchase agreements, the General Partner issued approximately 21.7 million shares of Series D Preferred Stock and 15.1 million shares of ARCP common stock for gross proceeds of $288.0 million and $186.0 million, respectively, on November 12, 2013. The Operating Partnership concurrently issued 21.7 million Series D Preferred Units and 15.1 million General Partner OP Units to the General Partner. The Series D Preferred Stock and Series D Preferred Units pay dividends at the rate of 5.81% per annum on their face amount of $13.59 per share (equivalent to $0.79 per share on an annualized basis). The Company redeemed all outstanding Series D Preferred Stock and Units on September 2, 2014 for $316.1 million in cash.
As the holders of Series D Preferred Stock were entitled to receive liquidation preferences that other equity holders were not entitled to, the Company classified the Series D Preferred Stock as temporary equity. At the date of issuance, the fair value of the Series D Preferred Stock was $269.3 million.
Prior to redemption, the General Partner had concluded that the conversion option qualified as a derivative and should be bifurcated from the host instrument. At issuance, the conversion option had a fair value of $18.7 million. As of December 31, 2013, the fair value of the conversion option was $16.7 million. The Company recorded a loss of $13.6 million upon redemption of the conversion option in gain (loss) on derivative instruments, net in the consolidated statements of operations for the year ended December 31, 2014.
As of December 31, 2014, there were no issued shares of Series D Preferred Stock and no authorized and issued shares of Series E Preferred Stock. Therefore, no equivalent units were issued and outstanding at the Operating Partnership.
Series F Preferred Stock and Series F Preferred Units
On October 6, 2013, in connection with the modification to the ARCT IV Merger, the General Partner’s board of directors unanimously approved the issuance of Series F Preferred Stock. Upon consummation of the ARCT IV Merger on January 3, 2014, 42.2 million shares of Series F Preferred Stock were issued to ARCT IV shareholders, resulting in the Operating Partnership concurrently issuing 42.2 million General Partner Series F Preferred Units to the General Partner, and 0.7 million Limited Partner Series F Preferred Units to the ARCT IV OP Unit holders. Subsequent to original issuance and through December 31, 2014, 0.6 million Limited Partner Series F Preferred Units were converted into an equivalent number of the General Partner’s Series F Preferred Stock. Concurrently, 0.6 million General Partner Series F Preferred Units were issued to the General Partner. As of December 31, 2014, there were 42.8 million shares of Series F Preferred Stock and 86.9 million Series F OP Units issued and outstanding.
The Series F Preferred Units contain the same terms as the Series F Preferred Stock. Therefore, the Series F Preferred Stock/Units will pay cumulative cash dividends at the rate of 6.70% per annum on their liquidation preference of $25.00 per share/unit
F-64
AMERICAN REALTY CAPITAL PROPERTIES, INC. AND ARC PROPERTIES OPERATING PARTNERSHIP, L.P.
NOTES TO CONSOLIDATED FINANCIAL STATEMENTS
December 31, 2014 – (Continued)
(equivalent to $1.675 per share/unit on an annual basis). The Series F Preferred Stock is not redeemable by the Company before the fifth anniversary of the date on which such Series F Preferred Stock is issued (the “Initial Redemption Date”), except under circumstances intended to preserve the General Partner’s status as a REIT for federal and/or state income tax purposes and except upon the occurrence of a change of control. On and after the Initial Redemption Date, the Company may, at its option, redeem shares of the Series F Preferred Stock, in whole or from time to time in part, at a redemption price of $25.00 per share plus, subject to exceptions, any accrued and unpaid dividends thereon to the date fixed for redemption. The shares of Series F Preferred Stock have no stated maturity, are not subject to any sinking fund or mandatory redemption and will remain outstanding indefinitely unless the Company redeems or otherwise repurchases them or they become convertible and are converted into General Partner’s common stock or General Partner OP Units (or, if applicable, alternative consideration). The Series F Preferred Stock of the General Partner trades on the NASDAQ under the symbol “ARCPP.”
Increases in Authorized Common Stock
On December 9, 2013, the Company filed articles of amendment to its charter to increase the number of authorized shares of common stock to 1.5 billion shares.
Offerings
On August 1, 2012, the General Partner filed a $500.0 million universal shelf registration statement and a resale registration statement with the SEC. Each registration statement became effective on August 17, 2012. As of December 31, 2014, the General Partner had issued 2.1 million shares of common stock and no other securites under the universal shelf registration statement. Concurrently with the General Partner’s issuance of the 2.1 million shares of common stock referenced above, the Operating Partnership issued 2.1 million General Partner OP Units to the General Partner. The resale registration statement, as amended, registered the resale of up to 1,882,248 shares of ARCP’s common stock issued in connection with any future conversion of certain currently outstanding restricted shares, preferred stock or Limited Partner OP Units.
In January 2013, the General Partner commenced its “at the market” equity offering program (“ATM”) in which it could from time to time, offer and sell shares of its common stock having aggregate offering proceeds of up to $60.0 million. The shares would be issued pursuant to the General Partner’s universal shelf registration statement. For each share of common stock the General Partner sold under the ATM, the Operating Partnership would issue a corresponding General Partner OP Unit to the General Partner.
On March 14, 2013, the General Partner filed a universal automatic shelf registration statement that was automatically declared effective and achieved well-known seasoned issuer (“WKSI”) status. As a result of the delayed filing of certain of the General Partner’s periodic reports with the SEC, it is not currently eligible to register the offer and sale of securities using a Form S-3 shelf registration statement and, therefore, are not eligible to use such WKSI shelf registration statement or the $500.0 million universal shelf registration statement described above, and the General Partner will not become eligible until it has timely filed certain periodic reports required under the Securities Exchange Act of 1934, as amended, for 12 consecutive calendar months.
On May 28, 2014, the General Partner closed on a public offering of 138.0 million shares of ARCP common stock at a price of $12.00 per share. The net proceeds to ARCP were $1.6 billion after deducting underwriting discounts, commissions and offering-related expenses. Concurrently, the Operating Partnership issued the General Partner 138.0 million General Partner OP Units.
The following are the Company’s equity offerings of common stock and the gross proceeds of the equity offerings for each year since the Company’s initial public offering (dollars, in millions):
| Type of offering | Closing Date | Number of Shares(1) | Gross Proceeds | ||||||
| IPO | September 7, 2011 | 5,574,131 | $ | 67.4 | |||||
| Follow-on offering | November 2, 2011 | 1,497,924 | 15.8 | ||||||
| Underwriters’ over-allotment | November 7, 2011 | 74,979 | 0.8 | ||||||
Total - Year end December 31, 2011(2) | 7,147,034 | $ | 84.0 | ||||||
| Follow-on offering | June 18, 2012 | 3,250,000 | $ | 30.3 | |||||
| Underwriters’ over-allotment | July 9, 2012 | 487,500 | 4.6 | ||||||
Total - Year end December 31, 2012(3) | 3,737,500 | $ | 34.9 | ||||||
F-65
AMERICAN REALTY CAPITAL PROPERTIES, INC. AND ARC PROPERTIES OPERATING PARTNERSHIP, L.P.
NOTES TO CONSOLIDATED FINANCIAL STATEMENTS
December 31, 2014 – (Continued)
| Type of offering | Closing Date | Number of Shares(1) | Gross Proceeds | ||||||
| Registered follow on-offering | January 29, 2013 | 2,070,000 | $ | 26.7 | |||||
| ATM | January 1 - September 30, 2013 | 553,300 | 8.9 | ||||||
| Private placement offering | June 7, 2013 | 29,411,764 | 455.0 | ||||||
| Private placement offering | November 12, 2013 | 15,126,498 | 186.0 | ||||||
Total - Year end December 31, 2013(4) | 47,161,562 | $ | 676.6 | ||||||
| Public Offering | May 28, 2014 | 138,000,000 | $ | 1,590.0 | |||||
| 138,000,000 | $ | 1,590.0 | |||||||
_______________________________________________
(1) Excludes 140.7 million shares of common stock that were issued to the stockholders of ARCT III’s common stock in conjunction with the ARCT III Merger.
(2) Excludes 9.8 million shares of common stock that were issued by ARCT III for gross proceeds of $102.2 million.
(3) Excludes 155.7 million and 5.4 million shares of common stock that were issued by ARCT III and ARCT IV, respectively, for gross proceeds of $1.6 billion and $255.0 million, respectively, prior to their acquisitions by ARCP.
(4) Excludes 31.0 million shares of common stock that were issued to ARCT IV stockholders in connection with the ARCT IV Merger.
Common Stock Dividends
In October 2011, the Company began paying common dividends on the 15th day of each month to stockholders/unitholders of record on the eighth day of such month. On October 23, 2013, the board of directors of ARCP authorized an annualized common dividend per share of $1.00, which became effective February 7, 2014. In connection with the amendments to the Credit Facility, the Company agreed to suspend payment of dividends on its common stock until it complied with certain financial statement delivery and other information requirements.
| Dividend Increase Declaration Date | Annualized Dividend Per Share | Effective Date | ||
| September 7, 2011 | $0.875 | October 9, 2011 | ||
| February 27, 2012 | $0.880 | March 9, 2012 | ||
| March 16, 2012 | $0.885 | June 9, 2012 | ||
| June 27, 2012 | $0.890 | September 9, 2012 | ||
| September 30, 2012 | $0.895 | November 9, 2012 | ||
| November 29, 2012 | $0.900 | February 9, 2013 | ||
| March 17, 2013 | $0.910 | June 8, 2013 | ||
| May 28, 2013 | $0.940 | December 8, 2013 (1) | ||
| October 23, 2013 | $1.000 | February 7, 2014 (2) | ||
_______________________________________________
| (1) | The dividend increase became effective at the closing of the CapLease Merger, which was consummated on November 5, 2013. |
| (2) | The dividend increase was contingent upon, and became effective with, the closing of the Cole Merger, which was consummated on February 7, 2014. |
Common Stock Repurchases
On August 20, 2013, ARCP’s board of directors reauthorized its $250.0 million share repurchase program, which was originally authorized in February 2013. During the year ended December 31, 2014, ARCP did not repurchase any shares of common stock under the share repurchase program.
F-66
AMERICAN REALTY CAPITAL PROPERTIES, INC. AND ARC PROPERTIES OPERATING PARTNERSHIP, L.P.
NOTES TO CONSOLIDATED FINANCIAL STATEMENTS
December 31, 2014 – (Continued)
Under ARCP’s equity compensation plans, individuals have the option to have ARCP repurchase shares upon vesting in order to satisfy the minimum federal and state tax withholding obligations. During the year ended December 31, 2014, ARCP repurchased 551,664 of shares to satisfy the federal and state tax withholding on behalf of employees.
Note 19 – Equity-based Compensation
Equity Plan
The General Partner has adopted the American Realty Capital Properties, Inc. Equity Plan (the “Equity Plan”), which provides for the grant of stock options, stock appreciation rights, restricted shares of common stock, restricted stock units, dividend equivalent rights and other stock-based awards to the General Partner’s and its affiliates’ non-executive directors, officers and other employees and advisors or consultants who are providing services to the General Partner or its affiliates. For each share awarded under the Equity Plan, the Operating Partnership issues a General Partner OP Unit to the General Partner with identical terms.
The General Partner authorized and reserved a total number of shares equal to 10.0% of the total number of issued and outstanding shares of common stock (on a fully diluted basis assuming the redemption of all OP Units for shares of common stock) to be issued at any time under the Equity Plan for equity incentive awards excluding an initial grant of 167,400 shares to the Former Manager in connection with the IPO, all of which were vested as of December 31, 2014. As of December 31, 2014, the General Partner had awarded 7,677,715 shares under the Equity Plan, of which 2,781,571 shares had been forfeited upon the resignations of certain senior executives during the fourth quarter. In accordance with the LPA, the Operating Partnership issued an equal number of General Partner OP Units to ARCP when the General Partner awarded shares under the Equity Plan.
The fair value of restricted common stock awards awarded to employees under the Equity Plan is generally determined on the grant date using the closing stock price on NASDAQ that day and is expensed over the requisite service period. The fair value of restricted common stock awarded to non-employees under the Equity Plan is measured based upon the fair value of goods or services received or the equity instruments granted, whichever is more reliably determinable and is expensed in full at the date of grant.
Director Stock Plan
The General Partner has adopted a Non-Executive Director Stock Plan (the “Director Stock Plan”), which provides for the grant of restricted shares of common stock to each of the General Partner’s non-executive directors. Awards of restricted stock will vest in accordance with the award agreements, which generally provide for ratable vesting over a five-year period following the date of grant. The awards of restricted stock provide for “distribution equivalents” with respect to this restricted stock, whether or not vested, at the same time and in the same amounts as distributions are paid to the stockholders. At December 31, 2014, a total of 99,000 shares of common stock was reserved for issuance under the Director Stock Plan. As of December 31, 2014, the General Partner had awarded 45,000 shares under the Director Stock Plan. In accordance with the LPA, the Operating Partnership issued an equal number of General Partner OP Units to ARCP when the General Partner awarded shares under the Director Stock Plan.
The fair value of restricted common stock awards, as well as the underlying General Partner OP Units, under the Director Stock Plan is determined on the grant date using the closing stock price on NASDAQ that day.
ARCT IV Restricted Share Plan
ARCT IV had an employee and director incentive restricted share plan (the “RSP”), which provided for the automatic grant of 1,333 restricted shares of common stock to each of its independent directors without any further action by ARCT IV’s board of directors or its stockholders on the date of initial election to the board of directors and on the date of each annual stockholder’s meeting thereafter. Restricted stock issued to independent directors vested over a five-year period following the date of grant in increments of 20% per annum. The RSP provided ARCT IV with the ability to grant awards of restricted shares to its directors, officers and employees (if ARCT IV ever had employees), employees of the ARCT IV Advisor and its affiliates, employees of entities that provided services to ARCT IV, directors of the ARCT IV Advisor or of entities that provided services to ARCT IV, certain consultants to ARCT IV and the ARCT IV Advisor and its affiliates or to entities that provided services to ARCT IV.
Immediately prior to the effective time of the ARCT IV Merger, each then-outstanding share of ARCT IV restricted stock fully vested. All shares of ARCT IV common stock then-outstanding as a result of the full vesting of shares of ARCT IV restricted stock, and the satisfaction of any applicable withholding taxes, received shares of the Company’s common stock based on the ARCT IV Exchange Ratio. Concurrently, for each share of ARCP common stock issued, the Operating Partnership issued a General Partner OP Unit to the General Partner.
F-67
AMERICAN REALTY CAPITAL PROPERTIES, INC. AND ARC PROPERTIES OPERATING PARTNERSHIP, L.P.
NOTES TO CONSOLIDATED FINANCIAL STATEMENTS
December 31, 2014 – (Continued)
The following table details the restricted shares activity within the Equity Plan and Director Stock Plan during the years ended December 31, 2014, 2013, and 2012:
Restricted Share Awards:
| Equity Plan | RSP and Director Stock Plan | |||||||||||||
Number of Restricted Common Shares | Weighted-Average Issue Price | Number of Restricted Common Shares | Weighted-Average Issue Price | |||||||||||
| Awarded January 1, 2012 | 167,400 | 12.50 | 14,700 | 11.50 | ||||||||||
| Granted | 93,683 | 10.65 | 30,634 | 10.45 | ||||||||||
| Forfeited | (1,174 | ) | 10.65 | (13,650 | ) | 11.54 | ||||||||
| Awarded December 31, 2012 | 259,909 | $ | 11.84 | 31,684 | $ | 10.47 | ||||||||
| Granted | 932,527 | 13.82 | 20,768 | 14.58 | ||||||||||
| Forfeited | (1,085 | ) | 12.85 | (3,000 | ) | 12.99 | ||||||||
| Awarded December 31, 2013 | 1,191,351 | $ | 13.39 | 49,452 | $ | 12.04 | ||||||||
| Granted | 6,484,105 | 13.09 | 3,000 | 13.99 | ||||||||||
| Forfeited | (3,055,546 | ) | 12.65 | — | — | |||||||||
| Awarded December 31, 2014 | 4,619,910 | $ | 13.46 | 52,452 | $ | 12.15 | ||||||||
Unvested Restricted Share Awards:
| Equity Plan | Director Stock Plan | |||||||||||||
Shares of Restricted Common Stock | Weighted-Average Issue Price | Shares of Restricted Common Stock | Weighted-Average Issue Price | |||||||||||
| Unvested, January 1, 2012 | 139,500 | 12.50 | 14,700 | 11.50 | ||||||||||
| Granted | 93,683 | 10.65 | 30,634 | 10.45 | ||||||||||
| Vested | (59,556 | ) | 12.38 | (2,370 | ) | 11.88 | ||||||||
| Forfeited | (1,174 | ) | 10.65 | (13,650 | ) | 11.54 | ||||||||
| Unvested, December 31, 2012 | 172,453 | $ | 11.55 | 29,314 | $ | 10.35 | ||||||||
| Granted | 932,527 | 13.82 | 20,768 | 14.58 | ||||||||||
| Vested | (172,453 | ) | 11.55 | (28,207 | ) | 11.03 | ||||||||
| Forfeited | (1,085 | ) | 12.85 | (3,000 | ) | 12.99 | ||||||||
| Unvested, December 31, 2013 | 931,442 | $ | 13.82 | 18,875 | $ | 13.52 | ||||||||
| Granted | 6,484,105 | 13.09 | 3,000 | 13.99 | ||||||||||
| Vested | (1,675,939 | ) | 13.11 | (21,875 | ) | 13.58 | ||||||||
| Forfeited | (3,055,546 | ) | 12.65 | — | — | |||||||||
| Unvested, December 31, 2014 | 2,684,062 | $ | 13.84 | — | $ | — | ||||||||
For the years ended December 31, 2014, 2013, and 2012, compensation expense, excluding an outperformance bonus expense related to the OPP, for restricted shares was $31.7 million, $8.0 million, and $1.2 million, respectively, which is recorded in general and administrative expense in the accompanying consolidated statement of operations.
Compensation expense for the year ended December 31, 2014 includes $11.4 million of compensation expense recorded for 0.8 million restricted shares granted to affiliates.
On October 1, 2014, the Company awarded a former executive 165,838 shares of common stock that were not subject to any vesting requirements. As such, the Company expensed $2.0 million related to these shares during the three months ended December 31, 2014. On December 15, 2014, the former executive resigned from the Company and agreed to return the shares awarded on October 1, 2014 resulting in the Company recording income of $1.5 million which is included in other income, net in the accompanying consolidated statement of operations.
F-68
AMERICAN REALTY CAPITAL PROPERTIES, INC. AND ARC PROPERTIES OPERATING PARTNERSHIP, L.P.
NOTES TO CONSOLIDATED FINANCIAL STATEMENTS
December 31, 2014 – (Continued)
Multi-Year Outperformance Plan
Upon consummation of the ARCT III Merger, the Company entered into the 2013 Advisor Multi-Year Outperformance Agreement (the “OPP”) with the Former Manager, whereby the Former Manager was able to earn compensation upon the attainment of stockholder value creation targets.
Under the OPP, the Company’s Former Manager was granted 8,241,101 long-term incentive plan units of the OP (“LTIP Units”), which could be earned or forfeited based on the General Partner’s total return to stockholders (including both share price appreciation and common stock distributions) (“Total Return”) for the three-year period that commenced on December 11, 2012.
Pursuant to previous authorization of the General Partner’s board of directors, as a result of the termination of the Management Agreement, all 8,241,101 LTIP Units became fully earned, vested and convertible into OP Units upon the consummation of the Company’s transition to self-management on January 8, 2014 and were converted into OP Units on such date.
During the years ended December 31, 2014 and 2013, the Operating Partnership recorded expense of $1.6 million and $92.3 million for the LTIP Units under the OPP, which is recorded in general and administrative expense in the accompanying consolidated statements of operations. As of December 31, 2014, all LTIP Units under the OPP were earned and $93.9 million of the expense has been allocated to the non-controlling interest on the consolidated balance sheet.
2014 Multi-Year Outperformance Plan
On October 3, 2013, the General Partner’s board of directors approved a multi-year outperformance plan (the “New OPP”), which became effective upon the General Partner’s transition to self-management, which occurred on January 8, 2014. Under the New OPP, individual agreements were entered into between the General Partner and the participants selected by the General Partner’s board of directors (the “Participants”) that set forth the Participant’s participation percentage in the New OPP and the number of LTIP Units of the OP subject to the award (“OPP Agreements”). Under the New OPP and the OPP Agreements, the Participants were eligible to earn performance-based bonus awards equal to the Participant’s participation percentage of a pool that is funded up to a maximum award opportunity (the “New OPP Cap”) of approximately 5% of the General Partner’s equity market capitalization at the time of the approval of the New OPP (“the Initial Market Cap”).
In October 2013, the Compensation Committee approved an aggregate award pool to be measured by the General Partner’s market capitalization as of the date of such approval; however, the OPP was definitively documented to measure market capitalization on a pro forma basis as of the General Partner’s transition to self-management (including the pro forma impact of various transactions expected to be consummated prior to the General Partner’s transition to self-management on January 8, 2014), which was calculated in December 2013. After the Audit Committee’s and new management’s review of the OPP, it was determined that the Compensation Committee’s intention in respect of the OPP was that the maximum award pool opportunity (the “2014 OPP Cap”) should have been $120.0 million.
Subject to the New OPP Cap, the pool was to equal an amount to be determined based on the General Partner’s level of achievement of total return to stockholders, including both share price appreciation and common stock distributions (“Total Return”), as measured against an absolute hurdle and against a peer group of companies for a three-year performance period that commenced on October 1, 2013 (the “Performance Period”), with valuation dates on which a portion of the LTIP Units up to a specified amount of the New OPP Cap could be earned on the last day of each 12-month period during the Performance Period (each an “Annual Period”) and the initial 24-month period of the Performance Period (the “Interim Period”), as follows:
| Performance Period | Annual Period | Interim Period | ||||
Absolute Component: 4% of any excess Total Return attained above an absolute hurdle measured from the beginning of such period: | 21% | 7% | 14% | |||
Relative Component: 4% of any excess Total Return attained above the median Total Return for the performance period of the Peer Group(1), subject to a ratable sliding scale factor as follows based on achievement of cumulative Total Return measured from the beginning of such period: | ||||||
| • | 100% will be earned if cumulative Total Return achieved is at least: | 18% | 6% | 12% | ||
| • | 50% will be earned if a cumulative Total Return achieved is: | 0% | 0% | 0% | ||
| • | 0% will be earned if cumulative Total Return achieved is less than: | 0% | 0% | 0% | ||
| • | a percentage from 50% to 100% calculated by linear interpolation will be earned if cumulative Total Return achieved is if between: | 0% - 18% | 0% - 6% | 0%- 12% | ||
F-69
AMERICAN REALTY CAPITAL PROPERTIES, INC. AND ARC PROPERTIES OPERATING PARTNERSHIP, L.P.
NOTES TO CONSOLIDATED FINANCIAL STATEMENTS
December 31, 2014 – (Continued)
____________________________________
(1) The “Peer Group” was comprised of the following companies: EPR Properties; Getty Realty Corporation; Lexington Realty Trust; National Retail Properties, Inc.; Realty Income Corporation; and Spirit Realty Capital, Inc.
The New OPP provided for early calculation and vesting of the award in the event of a change in control of the General Partner, prior to the end of the Performance Period. The Participants were entitled to receive a tax gross-up in the event that any amounts paid to the Participant under the New OPP constitute “parachute payments” as defined in Section 280G of the Code. The LTIP Units granted under the New OPP represented units of equity ownership in the OP that were structured as a profits interest therein. Subject to the Participant’s continued service through each vesting date, one-third of any earned LTIP Units would vest on October 1, 2016, October 1, 2017 and October 1, 2018, respectively. The Participants were entitled to receive distributions on their LTIP Units to the extent provided for in the LPA, as amended from time to time.
During the three months ended December 31, 2014, all of the Participants of the New OPP departed from the Company and forfeited all interests they had in the New OPP. As such, no expenses were recorded for the New OPP for the year ended December 31, 2014. As of December 31, 2014, the Company had recorded a total payable for distributions on LTIP units related to the OPP and the New OPP of $6.9 million.
Note 20 – Related Party Transactions and Arrangements
The Company, ARCT III and ARCT IV have incurred commissions, fees and expenses payable to the Former Manager and its affiliates including Realty Capital Securities, LLC (“RCS”), RCS Advisory Services, LLC (“RCS Advisory”), ARC, ARC Advisory Services, LLC (“ARC Advisory”), American Realty Capital Advisors III (the “ARCT III Advisor”), American Realty Capital Advisors IV, LLC (“the ARCT IV Advisor”), American National Stock Transfer, LLC (“ANST”) and ARC Real Estate Partners, LLC (“ARC Real Estate”). References throughout this Note 20 – Related Party Transactions and Arrangements to expenses incurred by ARCT III or ARCT IV are to expenses incurred before their acquisitions by the Company on February 28, 2013 and January 3, 2014, respectively. As of December 31, 2014, the Former Manager and its affiliates were no longer affiliated with the Company, as a result of officers and directors resigning from control positions in December 2014.
The Audit Committee Investigation identified certain payments made by the Company to the Former Manager and its affiliates that were not sufficiently documented or that otherwise warrant scrutiny. As described below, the Company has recovered consideration valued at $8.5 million in respect of certain such payments. The Company is considering whether it has a right to seek recovery for any other such payments and, if so, its alternatives for seeking recovery. No asset has been recognized in the accompanying consolidated financial statements related to any potential recovery.
The following table summarizes the related party fees and expenses incurred by the Company, ARCT III and ARCT IV by category and the aggregate amounts contained in such categories for the periods presented (in thousands):
| Year Ended December 31, | ||||||||||||
| 2014 | 2013 | 2012 | ||||||||||
| Related party transactions: | ||||||||||||
| Expenses and capitalized costs: | ||||||||||||
| Financing fees and reimbursements | $ | — | $ | 14,277 | $ | 3,350 | ||||||
| Offering related costs | 2,150 | 161,796 | 211,391 | |||||||||
| Acquisition related expenses | 1,652 | 37,564 | 28,656 | |||||||||
| Merger and other non-routine transactions | 137,778 | 156,146 | — | |||||||||
| Management fees to affiliates | 13,888 | 17,462 | 212 | |||||||||
| General and administrative expenses | 16,089 | 103,206 | 826 | |||||||||
| Indirect affiliate expenses | 10,975 | 68 | — | |||||||||
| Total expenses and capitalized costs | $ | 182,532 | $ | 490,519 | $ | 244,435 | ||||||
| Cole Capital revenues: | ||||||||||||
| Cole Capital offering related revenue | 87,109 | — | — | |||||||||
| Cole Capital operating revenue | 116,449 | — | — | |||||||||
| Total Cole Capital revenues | $ | 203,558 | $ | — | $ | — | ||||||
The following sections below further expand on the summarized related party transactions listed above.
F-70
AMERICAN REALTY CAPITAL PROPERTIES, INC. AND ARC PROPERTIES OPERATING PARTNERSHIP, L.P.
NOTES TO CONSOLIDATED FINANCIAL STATEMENTS
December 31, 2014 – (Continued)
Financing Fees and Reimbursements
During the years ended December 31, 2013 and 2012, the Company, ARCT III and ARCT IV paid the Former Manager, the ARCT III Advisor and the ARCT IV Advisor, respectively, financing coordination fees of $14.3 million and $3.4 million, respectively, which are equal to 0.75% of the aggregate amount available under any secured mortgage financing or refinancing that the Company, ARCT III or ARCT IV, respectively, obtained and used for the acquisition of properties that were arranged by the Former Manager, ARCT III Advisor or ARCT IV Advisor, respectively. The financing fees were payable in cash at the closing of each financing. In conjunction with the closing of the ARCT III Merger, it was agreed that these coordination fees would no longer be paid by the Company to the Former Manager. No such coordination fees were incurred during the year ended December 31, 2014. Financing coordination fees and reimbursements are included in deferred costs and other assets, net in the accompanying consolidated balance sheets.
Offering Related Costs
The Company, ARCT III and ARCT IV recorded commissions, fees and offering cost reimbursements as shown in the table below for services provided to the Company, ARCT III and ARCT IV, as applicable, by affiliates of the Former Manager during the periods indicated (in thousands):
| Year Ended December 31, | ||||||||||||
| 2014 | 2013 | 2012 | ||||||||||
| Offering related costs: | ||||||||||||
| Commissions and fees | $ | — | $ | 148,232 | $ | 184,384 | ||||||
| Offering costs and other reimbursements | 2,150 | 13,564 | 27,007 | |||||||||
| Total | $ | 2,150 | $ | 161,796 | $ | 211,391 | ||||||
RCS served as the dealer-manager of the ARCT III IPO and the ARCT IV IPO. RCS received fees and compensation in connection with the sale of ARCT III’s and ARCT IV’s common stock in the respective IPOs. RCS received a selling commission of 7% of gross offering proceeds before reallowance of commissions earned by participating broker-dealers in each of the IPOs. RCS received 3% of the gross proceeds from the sale of common stock, before reallowance to participating broker-dealers, as a dealer manager fee in each of the IPOs. In addition, ARCT III and ARCT IV reimbursed the ARCT III Advisor, the ARCT IV Advisor and RCS, as applicable, for services relating to the ARCT III IPO and the ARCT IV IPO during 2013 and 2012. During the year ended December 31, 2014, the Company incurred costs for services relating to the Company’s ATM equity program and common stock offering. Offering related costs are included in offering costs, commissions and dealer manager fees in the accompanying consolidated statements of changes in equity.
Acquisition Related Expenses
During the year ended December 31, 2014, the Company paid a fee of $1.0 million (equal to 0.25% of the contract purchase price) to RCS for strategic advisory services related to its acquisition of certain properties in the Fortress Portfolio and $0.6 million (equal to 0.25% of the contract purchase price) to RCS related to its acquisition of certain properties in the Inland Portfolio. During the year ended December 31, 2014, the Company paid a fee of $0.1 million to RCS related to its acquisition of certain properties in the Inland Portfolio.
Separate from acquisition fees related to the acquisition of certain properties in the GE Capital Portfolio discussed below, the Company, ARCT III and ARCT IV paid acquisition fees to the Former Manager and its affiliates equal to 1.0% of the contract purchase price, inclusive of indebtedness, of each property acquired by the Company, ARCT III or ARCT IV, as applicable. The Company, ARCT III and ARCT IV additionally reimbursed certain expenses as permitted under the advisory agreements. These fees and reimbursements (as applicable), totaled $12.3 million and $28.7 million during the years ended December 31, 2013 and 2012, respectively. The Company and ARCT III were no longer required to pay these fees as of the ARCT III Merger, except for those properties in the Company’s acquisition pipeline as of that date. ARCT IV incurred these fees throughout 2013. No such fees were incurred by the Company during the year ended December 31, 2014.
During the year ended December 31, 2013, the Company paid a fee of $1.9 million (equal to 0.25% of the contract purchase price) to RCS and reimbursed expenses of $6.1 million to ARC related to its acquisition of certain properties in the GE Capital Portfolio. No such fees were incurred by the Company during the year ended December 31, 2014.
F-71
AMERICAN REALTY CAPITAL PROPERTIES, INC. AND ARC PROPERTIES OPERATING PARTNERSHIP, L.P.
NOTES TO CONSOLIDATED FINANCIAL STATEMENTS
December 31, 2014 – (Continued)
During the year ended December 31, 2013, ARCT IV incurred and paid a fee of $3.5 million (equal to 0.25% of the contract price) to RCS and also paid an acquisition fee of $13.8 million to the Former Manager and its affiliates related to its acquisition of certain properties in the GE Capital Portfolio.
Merger and Other Non-routine Transactions
The Company, ARCT III and ARCT IV incurred fees and expenses payable to the Former Manager and its affiliates for services related to mergers and other non-routine transactions, as discussed below. These fees are included in merger and other non-routine transactions in the accompanying consolidated statements of operations. The table below shows fees and expenses attributable to each merger and other non-routine transaction for the year ended December 31, 2014 (in thousands).
| Year Ended December 31, 2014 | ||||||||||||||||||||
| ARCT IV Merger | Internalization | Cole Merger | Multi-tenant Spin Off | Total | ||||||||||||||||
| Merger related costs: | ||||||||||||||||||||
| Strategic advisory services | $ | 8,400 | $ | — | $ | 17,115 | $ | 1,750 | $ | 27,265 | ||||||||||
| Personnel costs and other reimbursements | — | — | 72 | — | 72 | |||||||||||||||
| Other non-routine transactions: | ||||||||||||||||||||
| Subordinated distribution fees | 78,244 | — | — | — | 78,244 | |||||||||||||||
| Furniture, fixtures and equipment | 5,800 | 10,000 | — | — | 15,800 | |||||||||||||||
| Other fees and expenses | — | — | 2,900 | — | 2,900 | |||||||||||||||
| Personnel costs and other reimbursements | 417 | — | 1,728 | — | 2,145 | |||||||||||||||
| Post-transaction support services | 1,352 | 10,000 | — | — | 11,352 | |||||||||||||||
| Total | $ | 94,213 | $ | 20,000 | $ | 21,815 | $ | 1,750 | $ | 137,778 | ||||||||||
The tables below shows fees and expenses attributable to each merger and other non-routine transaction during the year ended December 31, 2013, (in thousands):
| ARCT III Merger | ARCT IV Merger | CapLease Merger | Cole Merger | Other | Total | |||||||||||||||||||
| Merger related costs: | ||||||||||||||||||||||||
| Strategic advisory services | $ | — | $ | 16,075 | $ | 5,563 | $ | 14,215 | $ | 243 | $ | 36,096 | ||||||||||||
| Legal fees and expenses | 126 | 500 | 3,000 | — | 40 | 3,666 | ||||||||||||||||||
| Personnel costs and other reimbursements | 522 | 2,137 | 567 | 169 | 178 | 3,573 | ||||||||||||||||||
| Other fees and expenses | — | 640 | 250 | — | — | 890 | ||||||||||||||||||
| Other non-routine transactions: | ||||||||||||||||||||||||
| Subordinated distribution fees | 98,360 | — | — | — | — | 98,360 | ||||||||||||||||||
| Furniture, fixtures and equipment | 5,800 | — | — | — | — | 5,800 | ||||||||||||||||||
| Legal fees and expenses | 950 | — | — | — | — | 950 | ||||||||||||||||||
| Personnel costs and other reimbursements | — | 1,107 | — | 1,463 | 109 | 2,679 | ||||||||||||||||||
| Post-transaction support services | 2,000 | 2,000 | — | — | — | 4,000 | ||||||||||||||||||
| Other fees and expenses | — | — | 132 | — | — | 132 | ||||||||||||||||||
| Total | $ | 107,758 | $ | 22,459 | $ | 9,512 | $ | 15,847 | $ | 570 | $ | 156,146 | ||||||||||||
No expenses payable to affiliates of the Former Manager relating to mergers or other non-routine transactions were incurred during the year ended December 31, 2012.
Merger Related Costs
ARCT III Merger
The Company and ARCT III incurred and paid $0.3 million to ARC Advisory and $0.4 million to RCS Advisory for expense reimbursements in connection with the ARCT III Merger during the year ended December 31, 2013.
F-72
AMERICAN REALTY CAPITAL PROPERTIES, INC. AND ARC PROPERTIES OPERATING PARTNERSHIP, L.P.
NOTES TO CONSOLIDATED FINANCIAL STATEMENTS
December 31, 2014 – (Continued)
ARCT IV Merger
The Company entered into an agreement with RCS under which RCS agreed to provide strategic and financial advisory services to the Company in connection with the ARCT IV Merger. The Company paid $7.7 million (equal to 0.25% of the transaction value) upon the consummation of the ARCT IV Merger and reimbursed out of pocket expenses of $0.6 million pursuant to this agreement during the year ended December 31, 2013.
The Company entered into an agreement with RCS, RCS Advisory and ANST under which they agreed to provide financial advisory and information agent services in connection with the ARCT IV Merger and the related proxy solicitation seeking approval from the Company’s stockholders in connection with such merger. The agreement provided that these services included facilitation of the preparation, distribution and accumulation of proxy materials, stockholder, analyst and financial advisor communications and consultation on materials and communications made to the public and regulatory agencies regarding the ARCT IV Merger. However, effective October 6, 2013 pursuant to the first amendment to the ARCT IV Merger Agreement, a vote by they Company’s stockholders was no longer required. The Company paid $0.6 million in fees pursuant to this agreement during the year ended December 31, 2013.
ARCT IV entered into an agreement with RCS under which RCS agreed to provide strategic and financial advisory services to assist ARCT IV with its alternatives for a potential liquidity event. ARCT IV paid $7.7 million (equal to 0.25% of the transaction value) upon the consummation of the ARCT IV Merger and reimbursed out of pocket expenses of $0.8 million during the year ended December 31, 2013.
ARCT IV entered into an agreement with ARC Advisory and RCS Advisory under which they agreed to provide legal support services up to the date that ARCT IV entered into the ARCT IV Merger Agreement. ARCT IV paid $0.5 million in fees pursuant to this agreement during the year ended December 31, 2013.
ARCT IV entered into an agreement with RCS, RCS Advisory, and ANST under which they agreed to provide advisory and information agent services in connection with the ARCT IV Merger and the related proxy solicitation seeking approval of such merger by ARCT IV’s stockholders. The agreement provided that these services included facilitation of the preparation, distribution and accumulation of proxy materials, stockholder, analyst and financial advisor communications and consultation on materials and communications made to the public and regulatory agencies regarding the ARCT IV Merger. ARCT IV paid $0.8 million in fees and reimbursed $0.2 million of expenses pursuant to this agreement during the year ended December 31, 2013.
The Company and ARCT IV incurred and paid $0.5 million to RCS Advisory for expense reimbursements in connection with the ARCT IV Merger during the year ended December 31, 2013.
Pursuant to ARCT IV’s advisory agreement with the ARCT IV Advisor, ARCT IV agreed to pay the ARCT IV Advisor a brokerage commission on the sale of property in connection with the ARCT IV Merger. No fees were incurred under this agreement during the year ended December 31, 2013. The Company paid $8.4 million as a brokerage commission, pursuant to the advisory agreement during the year ended December 31, 2014.
Cole Merger
The Company entered into an agreement with RCS under which RCS agreed to provide strategic and financial advisory services to the Company in connection with the Cole Merger. The Company agreed to pay a fee equal to 0.25% of the transaction value upon the consummation of the transaction and reimburse out of pocket expenses. The Company incurred and recognized $14.2 million in expense from this agreement in each year ended December 31, 2014 and 2013.
Pursuant to the Transaction Management Services Agreement, dated December 9, 2013, the Company and the OP agreed to pay RCS Advisory an aggregate fee of $2.9 million in connection with providing the following services: transaction management support related to the Cole Merger up to the date of the Transaction Management Services Agreement and ongoing transaction management support, marketing support, due diligence coordination and event coordination up to the date of the termination of the Transaction Management Services Agreement. The Transaction Management Services Agreement expired on the consummation of the Company’s transition to self-management on January 8, 2014. The Company paid RCS Advisory $2.9 million thereunder on January 8, 2014.
F-73
AMERICAN REALTY CAPITAL PROPERTIES, INC. AND ARC PROPERTIES OPERATING PARTNERSHIP, L.P.
NOTES TO CONSOLIDATED FINANCIAL STATEMENTS
December 31, 2014 – (Continued)
CapLease Merger
The Company entered into an agreement with RCS under which RCS agreed to provide strategic and financial advisory services to the Company in connection with the CapLease Merger. The Company paid a fee equal to 0.25% of the transaction value and reimbursed out of pocket expenses. The Company incurred and paid $5.6 million in fees pursuant to this agreement during the year ended December 31, 2013. The Company incurred and paid an additional $0.2 million to ARC Advisory and $3.6 million to RCS Advisory for expense reimbursements in connection with the CapLease Merger during the year ended December 31, 2013.
Multi-tenant Spin-off
The Company entered into an agreement with RCS, under which RCS agreed to provide strategic and financial advisory services to the Company in connection with the MT Spin-off. During the year ended December 31, 2014, the Company incurred $1.8 million of such fees, which are included in merger and other non-routine transactions in the accompanying consolidated statement of operations for the year ended December 31, 2014.
Other Non-routine Transactions
ARCT III Merger Subordinated Distribution Fee
On February 28, 2013, the OP entered into a Contribution and Exchange Agreement (the “ARCT III Contribution and Exchange Agreement”) with the ARCT III OP and the ARCT III Special Limited Partner, the holder of the special limited partner interest in the ARCT III OP. The ARCT III Special Limited Partner was entitled to receive certain distributions from the ARCT III OP, including a subordinated distribution of net sales proceeds resulting from an “investment liquidity event” (as defined in the agreement of limited partnership of the ARCT III OP). The ARCT III Merger constituted an “investment liquidity event,” due to the attainment of the 6.0% performance hurdle and the return to ARCT III’s stockholders in addition to their initial investment. Pursuant to the ARCT III Contribution and Exchange Agreement, the ARCT III Special Limited Partner contributed its interest in the ARCT III OP, inclusive of the $98.4 million subordinated distribution proceeds received, to the ARCT III OP in exchange for 7.6 million ARCT III OP Units. Upon consummation of the ARCT III Merger, these ARCT III OP Units were immediately converted into 7.3 million OP Units after application of the ARCT III Exchange Ratio. The Company recorded an expense of $98.4 million during the year ended December 31, 2013 in connection with this transaction. In conjunction with the ARCT III Merger Agreement, the ARCT III Special Limited Partner agreed to hold its OP Units for a minimum of one year before converting them into shares of Company common stock.
ARCT IV Merger Subordinated Distribution
On January 3, 2014, the OP entered into a Contribution and Exchange Agreement (the “ARCT IV Contribution and Exchange Agreement”) with the ARCT IV OP, ARCT IV Special Limited Partner and ARC Real Estate. The ARCT IV Special Limited Partner was entitled to receive certain distributions from the ARCT IV OP, including the subordinated distribution of net sales proceeds resulting from an “investment liquidity event” (as defined in the agreement of limited partnership of the ARCT IV OP). The ARCT IV Merger constituted an “investment liquidity event,” due to the attainment of the 6.0% performance hurdle and the return to ARCT IV’s stockholders of $358.3 million in addition to their initial investment. Pursuant to the ARCT IV Contribution and Exchange Agreement, the ARCT IV Special Limited Partner contributed its interest in the ARCT IV OP, inclusive of the $78.2 million of subordinated distribution proceeds received, to the ARCT IV OP in exchange for 2.8 million ARCT IV OP Units. Upon consummation of the ARCT IV Merger, these ARCT IV OP Units were immediately converted into 6.7 million OP Units after application the ARCT IV Exchange Ratio. In conjunction with the ARCT IV Merger Agreement, the ARCT IV Special Limited Partner agreed to hold its OP Units for a minimum of two years before converting them into shares of the Company’s common stock.
Furniture, Fixtures and Equipment and Other Assets
The Company entered into three agreements with affiliates of the Former Manager and the Former Manager (the “Sellers”), as applicable, pursuant to which, concurrently with the closing of the ARCT III Merger and the ARCT IV Merger and the Company’s transition to self-management, the Sellers sold the OP certain FF&E and other assets used by the Sellers in connection with managing the property level business and operations and accounting functions of the Company and the OP. The Company incurred and recorded $15.8 million and $5.8 million to purchase the FF&E during the year ended December 31, 2014 and 2013, respectively. The Company has concluded that there was no evidence of the receipt and it could not support the value of the FF&E and other assets. As such, the Company has expensed the amount originally capitalized and recognized the expense in merger and other non-routine transaction-related expense.
F-74
AMERICAN REALTY CAPITAL PROPERTIES, INC. AND ARC PROPERTIES OPERATING PARTNERSHIP, L.P.
NOTES TO CONSOLIDATED FINANCIAL STATEMENTS
December 31, 2014 – (Continued)
Other Fees and Expenses
In connection with the closing of the Cole Merger, the Company paid $2.9 million to RCS Advisory during the year ended December 31, 2014. No such expenses were incurred during the years ended December 31, 2013 or 2012.
Legal Fees and Expenses
On December 12, 2012, ARCT III and the OP entered into a legal services reimbursement agreement with ARC Advisory to provide legal support services through the date of the ARCT III Merger. ARCT III incurred expenses of $0.5 million in connection with this agreement in 2013. Additional expenses of $0.5 million were paid to ARC Advisory during 2013 as reimbursement for litigation services.
Post-Transaction Support Services
ARCT III entered into an agreement with ARC Advisory under which ARC Advisory agreed to provide support services including legal, accounting, marketing, human resources and information technology, among other services, until the earlier of the ARCT III Merger closing date or one year (and an agreed upon period of up to 60 days following the ARCT III Merger). ARCT III paid $2.0 million in fees pursuant to this agreement during the year ended December 31, 2013. No expense was incurred during the year ended December 31, 2014 in connection with this agreement.
ARCT IV entered into an agreement with ARC Advisory and RCS Advisory under which they agreed to provide support services including legal, accounting, marketing, human resources and information technology, among other services, until the earlier of the ARCT IV Merger closing date or one year (and an agreed upon period of up to 60 days following the ARCT IV Merger). ARCT IV incurred $2.0 million in expenses pursuant to this agreement during the year ended December 31, 2013.
In connection with its entry into the ARCT IV Merger agreement, ARCT IV agreed to pay additional asset management fees. which totaled $1.3 million net of credits received from affiliates during the year ended December 31, 2014. No such fees were incurred during the year ended December 31, 2013.
Pursuant to the Amendment and Acknowledgment of Termination of Amended and Restated Management Agreement entered into as of January 8, 2014, the Former Manager agreed to provide certain transition services including accounting support, acquisition support, investor relations support, public relations support, human resources and administration, general human resources duties, payroll services, benefits services, insurance and risk management, information technology, telecommunications and Internet and services relating to office supplies. Pursuant to this agreement, the Company paid $10.0 million to the Former Manager on January 8, 2014. This arrangement was in effect for a 60-day term beginning on January 8, 2014.
Personnel Costs and Other Reimbursements
The Company, ARCT III and ARCT IV incurred expenses of and paid, $2.5 million to RCS Advisory and $0.2 million to ANST for personnel costs and reimbursements in connection with non-recurring transactions.
Management Fees to Affiliates
The Company, ARCT III and ARCT IV recorded fees and reimbursements as shown in the table below for services provided by the Former Manager and its affiliates related to the operations of the Company, ARCT III and ARCT IV during the periods indicated (in thousands):
| Year Ended December 31, | ||||||||||||
| 2014 | 2013 | 2012 | ||||||||||
| Management fees to affiliates: | ||||||||||||
| Base management fees | $ | — | $ | 4,969 | $ | 212 | ||||||
| Asset management fees | 13,888 | 11,693 | — | |||||||||
| Property management fees | — | 800 | — | |||||||||
| Total | $ | 13,888 | $ | 17,462 | $ | 212 | ||||||
Base Management Fees to the Former Manager
Prior to the termination of the amended and restated management agreement, the Company paid the Former Manager an annual base management fee equal to 0.50% per annum of average unadjusted book value of the Company’s real estate assets, calculated
F-75
AMERICAN REALTY CAPITAL PROPERTIES, INC. AND ARC PROPERTIES OPERATING PARTNERSHIP, L.P.
NOTES TO CONSOLIDATED FINANCIAL STATEMENTS
December 31, 2014 – (Continued)
and payable monthly in advance, for the value of assets up to $3.0 billion and 0.40% per annum for the unadjusted book value of assets over $3.0 billion. The management fee was generally payable in cash; however in lieu of cash, on January 21, 2014, the Former Manager agreed to settle all outstanding balances in stock, resulting in the Company issuing 388,461 shares of common stock to the Former Manager. Prior to the ARCT III Merger, the Former Manager was entitled to an annual base management fee equal to 0.50% per annum for the unadjusted book value of assets with no asset threshold limitations. The Company incurred expenses of $5.0 million and $0.2 million that were not waived during the years ended December 31, 2013 and 2012, respectively. The Former Manager waived the portion of its management fee in excess of certain net income thresholds related to the Company’s operations during certain periods in 2013 and 2012. These waived fees totaled $6.1 million and $1.8 million during the years ended December 31, 2013 and 2012, respectively. No such fees were incurred or waived during the year ended December 31, 2014.
Asset Management Fees
ARCT III
Until July 1, 2012, the ARCT III Advisor was entitled to an asset management fee of 0.75% per annum from ARCT III equal to the cost of its assets (cost includes the purchase price, acquisition expenses, capital expenditures and other customarily capitalized costs, but excludes acquisition fees) plus costs and expenses incurred by the ARCT III Advisor in providing asset management services. However, the asset management fee was to be reduced by any amounts payable to ARCT III’s property manager as an oversight fee, such that the aggregate of the asset management fee and the oversight fee did not exceed 0.75% per annum of the cost of ARCT III’s assets plus costs and expenses incurred by the ARCT III Advisor in providing asset management services. Prior to July 1, 2012, this fee was payable in monthly installments at the discretion of ARCT III’s board of directors in cash, common stock or restricted stock grants, or any combination thereof. Asset management fees for the year ended December 31, 2013 are included in management fees to affiliates in the accompanying consolidated statements of operations and comprehensive loss for the year ended December 31, 2013. These asset management fees for the year ended December 31, 2012 were waived.
Effective July 1, 2012, as payment for asset management fee, ARCT III issued (subject to periodic approval by its board of directors) to the ARCT III Advisor performance-based restricted partnership units of the ARCT III OP designated as “ARCT III Class B units,” which were intended to be profits interests and to vest, and no longer be subject to forfeiture, at such time as: (x) the value of the ARCT III OP’s assets plus all distributions that equaled or exceeded the total amount of capital contributed by investors plus a 6.0% cumulative, pre-tax, non-compounded annual return thereon (the “economic hurdle”); and (y) a liquidity event had occurred.
The ARCT III Advisor received distributions on unvested ARCT III Class B units equal to the distribution rate received on ARCT III common stock. In 2012, the ARCT III board of directors approved the issuance of 145,022 ARCT III Class B units to the ARCT III Advisor for asset management services it provided. In 2013, the ARCT III board of directors approved issuance of an additional 603,599 ARCT III Class B units to the ARCT III Advisor for asset management services it provided. As of December 31, 2012, ARCT III did not consider achievement of the performance condition to be probable as the shareholder vote for the ARCT III Merger, which would allow vesting of these ARCT III Class B Units, was not completed. The performance condition related to these ARCT III Class B units was satisfied upon the completion of the ARCT III Merger and as a result a $9.4 million expense was recorded during the year ended December 31, 2013. The 748,621 ARCT III Class B units converted into ARCT III OP Units, which converted on a one-to-one basis, into 711,190 OP Units after the application of the ARCT III Exchange Ratio.
In connection with a 60-day extension of the advisory agreement which was executed in order to facilitate the smooth transition of advisory services following the consummation of the ARCT III Merger, the Company incurred and paid additional asset management fees of $2.3 million during 2013. No fees were incurred during the year ended December 31, 2014.
ARCT IV
In connection with the asset management services provided by the ARCT IV Advisor, ARCT IV issued (subject to periodic approval by ARCT IV’s board of directors) to the ARCT IV Advisor performance-based restricted partnership units of the ARCT IV OP designated as “ARCT IV Class B Units,” which were intended to be profit interests and to vest, and no longer be subject to forfeiture, at such time as: (x) the value of the ARCT IV OP’s assets plus all distributions that equaled or exceeded the total amount of capital contributed by investors plus a 6.0% cumulative, pre-tax, non-compounded annual return thereon (the “economic hurdle”); (y) any one of the following occurs: (1) the termination of the advisory agreement by an affirmative vote of a majority of the Company’s independent directors without cause; (2) a listing; or (3) another liquidity event; and (z) the ARCT IV Advisor was still providing advisory services to ARCT IV.
The calculation of the ARCT IV asset management fees was equal to: (i) 0.1875% of the cost of ARCT IV’s assets; divided by (ii) the value of one share of ARCT IV common stock as of the last day of such calendar quarter. When approved by the board of
F-76
AMERICAN REALTY CAPITAL PROPERTIES, INC. AND ARC PROPERTIES OPERATING PARTNERSHIP, L.P.
NOTES TO CONSOLIDATED FINANCIAL STATEMENTS
December 31, 2014 – (Continued)
directors, the ARCT IV Class B Units were issued to the ARCT IV Advisor quarterly in arrears pursuant to the terms of the ARCT IV OP agreement. During the year ended December 31, 2013, ARCT IV’s board of directors approved the issuance of 492,483 ARCT IV Class B Units to the ARCT IV Advisor in connection with this arrangement. As of December 31, 2013, ARCT IV did not consider achievement of the performance condition to be probable and no expense was recorded at that time. The ARCT IV Advisor received distributions on unvested ARCT IV Class B Units equal to the distribution rate received on the ARCT IV common stock. The performance condition related to the 498,857 ARCT IV Class B Units, which includes units issued for the period of January 1, 2014 through the ARCT IV Merger Date, was satisfied upon the completion of the ARCT IV Merger. These ARCT IV Class B Units immediately converted into OP Units at the 2.3961 exchange ratio and the Company recorded an expense of $13.9 million based on the fair value of the ARCT IV Class B Units at that time. No additional expense was recorded during the year ended December 31, 2014.
Property Management Fees
ARCT III also agreed to pay an affiliate of ARC, unless it contracted with a third party, a property management fee of up to 2% of gross revenues from ARCT III’s stand-alone single-tenant net leased properties and 4% of gross revenues from its multi-tenant properties, plus, in each case, market-based leasing commissions applicable to the geographic location of the property. ARCT III also agreed to reimbursed the affiliate for property level expenses. If ARCT III contracted directly with third parties for such services, it paid them customary market fees and paid the affiliated property manager an oversight fee of up to 1% of the gross revenues of the property managed. Property management fees of $0.8 million are recorded in management fees to affiliates in the accompanying consolidated statements of operations for the year ended December 31, 2013. No property management fees were incurred during the year ended December 31, 2014.
Quarterly Incentive Fee
Prior to the termination of the amended and restated management agreement as a result of internalization, the Company was required to pay the Former Manager a quarterly incentive fee, calculated based on 20% of the excess of annualized core earnings (as defined in the management agreement with the Former Manager) over the weighted-average number of shares multiplied by the weighted-average price per share of common stock. One half of each quarterly installment of the incentive fee would be payable in shares of common stock. The remainder of the incentive fee would be payable in cash. No incentive fees were incurred or paid for the years ended December 31, 2014, 2013 or 2012.
General and Administrative Expenses
The Company, ARCT III and ARCT IV recorded general and administrative expenses as shown in the table below for services provided by the Former Manager and its affiliates related to the operations of the Company, ARCT III and ARCT IV during the periods indicated (in thousands):
| Year Ended December 31, | ||||||||||||
| 2014 | 2013 | 2012 | ||||||||||
| General and administrative expenses: | ||||||||||||
| Advisory fees and reimbursements | $ | 2,015 | $ | 5,602 | $ | 826 | ||||||
| Equity awards | 14,074 | 97,604 | — | |||||||||
| Total | $ | 16,089 | $ | 103,206 | $ | 826 | ||||||
Advisory fees and reimbursements
The Company, ARCT III and ARCT IV agreed to certain fees and reimbursement during the years ended December 31, 2014, 2013, and 2012, to the Former Manager and its affiliates, as applicable, for their out-of-pocket costs, including without limitation, legal fees and expenses, due diligence fees and expenses, other third party fees and expenses, costs of appraisals, travel expenses, nonrefundable option payments and deposits on properties not acquired, accounting fees and expenses, title insurance premiums and other closing costs, personnel costs and miscellaneous expenses relating to the selection, acquisition and due diligence of properties or general operation of the Company. During the years ended December 31, 2014, 2013, and 2012, these expenses totaled $2.0 million, $5.6 million, and $0.8 million, respectively.
F-77
AMERICAN REALTY CAPITAL PROPERTIES, INC. AND ARC PROPERTIES OPERATING PARTNERSHIP, L.P.
NOTES TO CONSOLIDATED FINANCIAL STATEMENTS
December 31, 2014 – (Continued)
Equity Awards
Upon consummation of the ARCT III Merger, the Company entered into the OPP with its Former Manager. The OPP gave the Former Manager the opportunity to earn compensation upon the attainment of certain stockholder value creation targets. The Company recorded an expense of $32.7 million for the valuation of the award through December 31, 2013 and an additional expense of $59.6 million due to the accelerated vesting of the OPP. This total expense of $92.3 million is included in general and administrative expenses in the accompanying consolidated statements of operations during the year ended December 31, 2013. Additionally, during the year ended December 31, 2014, $1.6 million was recorded to general and administrative as equity-based compensation relating to the change in total return to stockholders used in computing the number of LTIP units earned between December 31, 2013 and January 8, 2014.
As a result of the ARCT III Merger, certain restricted shares held by employees of affiliates of the Former Manager were fully vested. This expense of $2.0 million is included in general and administrative expense in the accompanying consolidated statement of operations during the year ended December 31, 2013. During the years ended December 31, 2013 and 2012, the Company granted 620,000 and 93,683 restricted share awards to employees of affiliates of the Former Manager as compensation for certain services, respectively. These were three separate grants and the grant date fair values for these issuances were $1.0 million in June 2012, $4.5 million in February 2013 and $4.4 million in July 2013, respectively.
Separately, as a result of the ARCT III Merger and the termination of the Management Agreement with the Former Manager, certain restricted shares held by employees of affiliates of the Former Manager were fully vested. This aggregate expense of $5.3 million is included in general and administrative expense in the accompanying consolidated statements of operations for the year ended December 31, 2013.
During the year ended December 31, 2014, the Company granted 796,075 restricted stock awards to employees of affiliates of the Former Manager as compensation for certain services and 87,702 restricted stock awards to two directors who are affiliates of the Former Manager. The grant date fair value of the awards of $12.5 million was recorded in general and administrative expenses in the accompanying consolidated statements of operations.
Indirect Affiliate Expenses
The Company incurred fees and expenses payable to the Company’s affiliates or payable to a third party on behalf of the Company’s affiliates for amenities related to certain buildings, as explained below. These expenses are depicted in the table below for the periods indicated (in thousands):
| Year Ended December 31, | ||||||||||||
| 2014 | 2013 | 2012 | ||||||||||
| Indirect affiliate expenses: | ||||||||||||
| Audrain building | $ | 8,724 | $ | 68 | $ | — | ||||||
| ANST office build-out | 462 | — | — | |||||||||
| New York (405 Park) office | 1,659 | — | — | |||||||||
| Dresher, PA office | 92 | — | — | |||||||||
| North Carolina office | 38 | — | — | |||||||||
| Total | $ | 10,975 | $ | 68 | $ | — | ||||||
Audrain Building
During the year ended December 31, 2013, a wholly owned subsidiary of ARC Real Estate purchased a historic building in Newport, Rhode Island (“Audrain”) with plans to renovate the second floor to serve as offices for certain executives of the Company, the Former Manager and its affiliates. The Former Manager requested that invoices relating to the second floor renovation and tenant improvements and all building operating expenses either be reimbursed by the Company to ARC Advisory or be paid directly to the contractors and vendors. During the year ended December 31, 2013, the Company paid $27,000 for architectural costs relating to the renovation directly to a third party. During the year ended December 31, 2014, the Company paid $8.7 million for tenant improvements and furniture and fixtures relating to the renovation directly to the third parties.
F-78
AMERICAN REALTY CAPITAL PROPERTIES, INC. AND ARC PROPERTIES OPERATING PARTNERSHIP, L.P.
NOTES TO CONSOLIDATED FINANCIAL STATEMENTS
December 31, 2014 – (Continued)
In addition, on October 4, 2013, the Company entered into a lease agreement with the subsidiary of ARC Real Estate for a term of 15 years with annual base rent of $0.4 million requiring monthly payments beginning on that date. As there were tenants occupying the building when it was purchased, these tenants subleased their premises from the Company until their leases terminated. During the years ended December 31, 2014 and 2013, the Company incurred and paid $0.3 million and $0.1 million, respectively, for base rent, which was partially offset by $17,000 and $55,000 of rental revenue received from the subtenants during the years ended December 31, 2014 and 2013, respectively.
As a result of findings of the investigation conducted by the Audit Committee, the Company terminated this lease agreement and was reimbursed for the tenant improvement and furniture costs incurred by the Company, totaling $8.5 million, during the year ended December 31, 2014. Reimbursement was made by delivery and retirement of 916,423 OP Units held by an affiliate of the Former Manager. The Company never moved into or occupied the building.
ANST Office Build-out
During the year ended December 31, 2014, as a result of the Cole Merger, the Company worked to develop a partnership with ANST to better service clients and shareholders more efficiently, as well as create more career opportunities for the employees. Plans were made to move ANST to part of the Cole Capital office building in 2014. In order to accommodate the ANST employees, the Cole Capital office building was to be remodeled. During the year ended December 31, 2014, the Company paid $0.5 million directly to third parties for leasehold improvements and furniture and fixtures relating to the renovation.
Subsequently, ANST never moved into the building. The Company is considering its options with regard to recovery of such payments, although no decisions have been made at this time. No asset has been recognized in the financial statements related to any potential recovery.
New York (405 Park) Office
During the year ended December 31, 2014, the Company paid $0.6 million to ARC Advisory for rent related to the New York (405 Park) office where certain of the Company’s employees shared office space with an affiliate of the Former Manager. In addition, the Company paid $1.1 million directly to third parties for leasehold improvements and furniture and fixtures. The Company paid no rent or leasehold improvements to ARC related to the New York office during the years ended December 31, 2013 or 2012.
Additional Related Party Transactions
The following related party transactions were not included in the tables above.
Tax Protection Agreement
The Company is party to a tax protection agreement with ARC Real Estate, which contributed its 100% indirect ownership interests in 63 of the Company’s properties to the Operating Partnership in the formation transactions related to the Company’s IPO. Pursuant to the tax protection agreement, the Company has agreed to indemnify ARC Real Estate for its tax liabilities (plus an additional amount equal to the taxes incurred as a result of such indemnity payment) attributable to its built-in gain, as of the closing of the formation transactions, with respect to its interests in the contributed properties (other than two vacant properties contributed), if the Company sells, conveys, transfers or otherwise disposes of all or any portion of these interests in a taxable transaction on or prior to September 6, 2021. The sole and exclusive rights and remedies of ARC Real Estate under the tax protection agreement will be a claim against the Operating Partnership for ARC Real Estate’s tax liabilities as calculated in the tax protection agreement, and ARC Real Estate shall not be entitled to pursue a claim for specific performance or bring a claim against any person that acquires a protected party from the Operating Partnership in violation of the tax protection agreement.
Investment from the ARCT III Special Limited Partner
In connection with the ARCT III Merger, the ARCT III Special Limited Partner invested $0.8 million in the ARCT III OP and was subsequently issued 56,797 OP Units in respect thereof upon the closing of the ARCT III Merger after giving effect to the ARCT III Exchange Ratio. This investment is included in non-controlling interests in the accompanying consolidated balance sheets.
Investment from the ARCT IV Special Limited Partner
In connection with the ARCT IV Merger, the ARCT IV Special Limited Partner invested $0.8 million in the ARCT IV OP and was subsequently issued 79,870 OP Units in respect thereof upon the closing of the ARCT III Merger after giving effect to the ARCT III Exchange Ratio. This investment is included in non-controlling interests in the accompanying consolidated balance sheets.
F-79
AMERICAN REALTY CAPITAL PROPERTIES, INC. AND ARC PROPERTIES OPERATING PARTNERSHIP, L.P.
NOTES TO CONSOLIDATED FINANCIAL STATEMENTS
December 31, 2014 – (Continued)
Investment in an Affiliate of the Former Manager
During the year ended December 31, 2013, the Company invested $10.0 million in a real estate fund advised by an affiliate of the Former Manager, American Real Estate Income Fund, which invests primarily in equity securities of other publicly traded REITs, and subsequently reinvested dividends totaling $0.1 million in the fund. During the fourth quarter of 2013, the Company sold a portion of such investments with an original cost of $8.5 million at a loss of $0.4 million resulting in a remaining investment of $1.5 million as of December 31, 2013. As of December 31, 2014, the Company sold substantially all of its investment, with a remaining investment value of less than $0.1 million.
Ownership by Affiliates of the Former Manager and Employees of Affiliates of the Former Manager
Certain affiliates of the Former Manager and certain employees of affiliates of the Former Manger own shares of ARCP’s common stock, shares of unvested restricted common stock, OP Units and LTIP Units. As of December 31, 2014 and December 31, 2013, 2.66% and 4.37%, respectively, of the total equity units issued by ARCP and the OP were owned by affiliates of the Former Manager and certain employees of affiliates of the Former Manger.
Due to Affiliates
Due to affiliates, as reported in the accompanying consolidated balance sheets, is comprised of the following amounts discussed above (in thousands):
| Year Ended December 31, | ||||||||
| 2014 | 2013 | |||||||
| Due to affiliates: | ||||||||
| Offering related costs | $ | — | $ | 220 | ||||
| Merger and other non-routine transactions | — | 38,645 | ||||||
| Management fees to affiliates | — | 4,969 | ||||||
| General and administrative | — | 59,600 | ||||||
| Managed REITs and other | 559 | — | ||||||
| Total | $ | 559 | $ | 103,434 | ||||
Cole Capital
Cole Capital is contractually responsible for managing the Managed REITs’ affairs on a day-to-day basis, identifying and making acquisitions and investments on the Managed REITs’ behalf, and recommending to each of the Managed REIT’s respective board of directors an approach for providing investors with liquidity. In addition, the Company distributes the shares of common stock for certain Managed REITs and advises them regarding offerings, manages relationships with participating broker-dealers and financial advisors and provides assistance in connection with compliance matters relating to the offerings. The Company receives compensation and reimbursement for services relating to the Managed REITs’ offerings and the investment, management and disposition of their respective assets, as applicable.
Cole Capital Offering Related Revenue
The Company generally receives a selling commission of up to 7.0% of gross offering proceeds related to the sale of shares of CCPT IV, CCIT II and CCPT V common stock in their primary offerings, before reallowance of commissions earned by participating broker-dealers. The Company has and intends to continue to reallow 100% of selling commissions earned to participating broker-dealers. In addition, the Company generally receives 2.0% of gross offering proceeds in the primary offerings, before reallowance to participating broker-dealers, as a dealer manager fee in connection with the sale of CCPT IV, CCIT II and CCPT V shares of common stock. The Company, in its sole discretion, may reallow all or a portion of its dealer manager fee to such participating broker-dealers as a marketing and due diligence expense reimbursement, based on factors such as the volume of shares sold by such participating broker-dealers and the amount of marketing support provided by such participating broker-dealers. No selling commissions or dealer manager fees are paid to the Company or other broker-dealers with respect to shares sold under the respective Managed REIT’s distribution reinvestment plans, under which the stockholders may elect to have distributions reinvested in additional shares.
In connection with the sale of INAV shares of common stock, the Company receives an asset-based dealer manager fee that is payable in arrears on a monthly basis and accrues daily in an amount equal to (i) 1/365th of 0.55% of the net asset value (“NAV”)
F-80
AMERICAN REALTY CAPITAL PROPERTIES, INC. AND ARC PROPERTIES OPERATING PARTNERSHIP, L.P.
NOTES TO CONSOLIDATED FINANCIAL STATEMENTS
December 31, 2014 – (Continued)
for Wrap Class shares of common stock (“W Shares”) for such day, (ii) 1/365th of 0.55% of the NAV for Advisor Class shares of common stock (“A Shares”) for such day and (iii) 1/365th of 0.25%of the NAV for Institutional Class shares of common stock (“I Shares”) for such day. The Company, in its sole discretion, may reallow a portion of its dealer-manager fee received on W Shares, A Shares and I Shares to participating broker-dealers. In addition, the Company receives a selling commission on A Shares sold in the primary offering of up to 3.75% of the offering price per share for A Shares. The Company has and intends to continue to reallow 100% of selling commissions earned to participating broker-dealers. The Company also receives an asset-based distribution fee for A Shares that is payable in arrears on a monthly basis and accrues daily in an amount equal to 1/365th of 0.50% of the NAV for A Shares for such day. The Company, in its sole discretion, may reallow a portion of the distribution fee to participating broker-dealers. No selling commissions are paid to the Company or other broker-dealers with respect to W Shares or I Shares or on shares of any class of INAV common stock sold pursuant to INAV’s distribution reinvestment plan, under which the stockholders may elect to have distributions reinvested in additional shares, and no distribution fees are paid to the Company or other broker-dealers with respect to W Shares or I Shares.
All other organization and offering expenses associated with the sale of the Managed REITs’ common stock (excluding selling commissions, if applicable, and the dealer manager fee) are paid for in advance by the Company and subject to reimbursement by the Managed REITs, up to certain limits per the respective advisory agreement. The organization and offering expenses incurred by the Company which are subject to reimbursement include costs which are paid to affiliates. As these costs are incurred, they are recorded as reimbursement revenue, up to the respective limit, and are included in dealer manager fees, selling commissions and offering reimbursements in the financial results for Cole Capital in Note 5 – Segment Reporting. Expenses paid on behalf of the Managed REITs in excess of these limits that are expected to be collected are recorded as program development costs. As of December 31, 2014, the Company had $12.9 million of organization and offering costs paid on behalf of the Managed REITs in excess of the limits that have not been reimbursed, which are expected to be reimbursed by the Managed REITs as they raise additional proceeds from the respective offering. The program development costs are included in deferred costs and other assets, net in the accompanying consolidated unaudited balance sheets.
The Company recorded commissions, fees and expense reimbursements as shown in the table below for services provided to the Managed REITs (as described above) during the period from the Cole Acquisition Date to December 31, 2014 (in thousands). As the Company did not commence operations for Cole Capital until the Cole Acquisition Date, comparative financial data is not presented for the year ended December 31, 2013.
| Period from the Cole Acquisition Date to December 31, 2014 | ||||||||||||||||||||||||
| CCPT IV | CCPT V | CCIT | CCIT II | INAV | Total | |||||||||||||||||||
| Offering: | ||||||||||||||||||||||||
| Selling commission revenue | $ | 29,113 | $ | 11,534 | $ | (4 | ) | $ | 15,817 | $ | 562 | $ | 57,022 | |||||||||||
| Selling commissions reallowance expense | 29,113 | 11,534 | (4 | ) | 15,817 | 562 | 57,022 | |||||||||||||||||
| Dealer manager and distribution fee revenue | 8,771 | 3,403 | (1 | ) | 4,806 | 555 | 17,534 | |||||||||||||||||
| Dealer manager fees reallowance expense | 4,971 | 1,794 | (1 | ) | 2,357 | 49 | 9,170 | |||||||||||||||||
| Other expense reimbursement revenue | 3,748 | 3,475 | — | 4,844 | 486 | 12,553 | ||||||||||||||||||
Cole Capital Operating Revenue
The Company earns acquisition fees related to the acquisition, development or construction of properties on behalf of certain of the Managed REITs. In addition, the Company is reimbursed for acquisition expenses incurred in the process of acquiring properties up to certain limits per the respective advisory agreement. The Company is not reimbursed for personnel costs in connection with services for which it receives acquisition fees or real estate commissions. In addition, the Company may earn disposition fees related to the sale of one or more properties, including those held indirectly through joint ventures, on behalf of a Managed REIT. Acquisition and disposition fees and reimbursements, as applicable, are included in transaction service fees in the financial results for Cole Capital in Note 5 – Segment Reporting.
F-81
AMERICAN REALTY CAPITAL PROPERTIES, INC. AND ARC PROPERTIES OPERATING PARTNERSHIP, L.P.
NOTES TO CONSOLIDATED FINANCIAL STATEMENTS
December 31, 2014 – (Continued)
The Company earns advisory and asset and property management fees from certain Managed REITs and other affiliates. In addition, the Company may be reimbursed for expenses incurred in providing advisory and asset and property management services, subject to certain limitations. In connection with services provided by the Company related to the origination or refinancing of any debt financing obtained by certain Managed REITs that is used to acquire properties or to make other permitted investments, or that is assumed, directly or indirectly, in connection with the acquisition of properties, the Company is reimbursed for financing expenses incurred, subject to certain limitations. Advisory fees, asset and property management fees and reimbursements of expenses are included in management fees and reimbursements in the financial results for Cole Capital in Note 5 – Segment Reporting.
The Company recorded fees and expense reimbursements as shown in the table below for services provided primarily to the Managed REITs (as described above) during the period from the Cole Acquisition Date to year ended December 31, 2014 (in thousands). As the Company did not commence operations for Cole Capital until the Cole Acquisition Date, comparative financial data is not presented for the year ended December 31, 2013.
| Period from the Cole Acquisition Date to December 31, 2014 | |||||||||||||||||||||||
| CCPT IV | CCPT V | CCIT | CCIT II | INAV | Other | ||||||||||||||||||
| Operations: | |||||||||||||||||||||||
| Acquisition fee revenue | $ | 35,253 | $ | 7,705 | 4,943 | $ | 12,525 | $ | — | $ | 246 | ||||||||||||
| Asset management fee revenue | — | — | — | — | — | 900 | |||||||||||||||||
| Property management and leasing fee revenue | — | — | — | — | — | 877 | |||||||||||||||||
| Operating expense reimbursement revenue | 6,574 | 2,543 | 2,931 | 598 | 448 | — | |||||||||||||||||
| Advisory and performance fee revenue | 19,915 | 629 | 16,933 | 1,493 | 1,936 | — | |||||||||||||||||
Investment in the Managed REITs
As of December 31, 2014, the Company owned aggregate equity investments of $3.9 million in the Managed REITs, which is included in investment in unconsolidated entities in the accompanying consolidated balance sheet. The table below presents certain information related to the Company’s investments in the Managed REITs as of December 31, 2014 (carrying amount in thousands):
| December 31, 2014 | |||||||
| Managed REIT | % of Outstanding Shares Owned | Carrying Amount of Investment | |||||
| CCPT IV | 0.01 | % | $ | 131 | |||
| CCPT V | 1.69 | % | 1,888 | ||||
| CCIT | 0.01 | % | 74 | ||||
| CCIT II | 1.20 | % | 1,644 | ||||
| INAV | 0.19 | % | 153 | ||||
| $ | 3,890 | ||||||
Unconsummated Sale of Cole Capital to RCAP
On October 1, 2014, the Company announced that it had entered into the purchase agreement, pursuant to which RCAP would acquire Cole Capital for at least $700.0 million. As part of the transaction, the Company would be entitled to an earn-out of up to an additional $130.0 million based upon Cole Capital’s 2015 earnings before income taxes, depreciation and amortization. On November 3, 2014, the Company received notice from RCAP purporting to terminate the agreement. On December 4, 2014, the Company issued a press release announcing that it had entered into a settlement agreement with RCAP that resolved their dispute relating to the agreement.
The settlement included: $42.7 million in cash paid by RCAP to the Company; a $15.3 million unsecured note issued by RCAP to the Company; and a release of the Company from its obligation to pay $2.0 million to RCAP for services performed in relation to the 2014 common stock offering. This settlement is included in other income, net in the accompanying consolidated statement of operations. The $42.7 million in cash included a $10.0 million payment already delivered to the Company by RCAP in connection with the Agreement. See Note 9 – Loans Held for Investment for further discussion on the note. In addition, the Company and
F-82
AMERICAN REALTY CAPITAL PROPERTIES, INC. AND ARC PROPERTIES OPERATING PARTNERSHIP, L.P.
NOTES TO CONSOLIDATED FINANCIAL STATEMENTS
December 31, 2014 – (Continued)
RCAP have agreed to terminate, unwind or otherwise discontinue all agreements, arrangements and understandings between the two parties and any of their respective subsidiaries.
Due from Affiliates
As of December 31, 2014, $86.1 million was expected to be collected from affiliates, including balances from the Managed REITs lines of credits, as well as balances for services provided by the Company and expenses subject to reimbursement by the Managed REITs in accordance with their respective advisory and property management agreements and was included in due from affiliates on the accompanying consolidated balance sheet. In connection with the Cole Merger, the Company acquired a revolving line of credit agreement that provides for $10.0 million of available borrowings to CCIT II. During the year ended December 31, 2014, the Company entered into a revolving line of credit agreement that provides for $10.0 million of available borrowings to CCPT V. The CCIT II and CCPT V line of credit agreements each bear an interest rate equal to the one-month LIBOR plus 2.20% and mature in January 2015 and March 2015, respectively. In addition, during the year ended December 31, 2014, the Company increased the available borrowings under the revolving lines of credit for both CCPT V and CCIT II to $60.0 million. During the year ended December 31, 2014, CCIT II and CCPT V borrowed $30.0 million and $20.0 million, respectively, on their lines of credit. These amounts remained outstanding as of December 31, 2014 and are included in due from affiliates in the accompanying consolidated balance sheets. No amounts were due from affiliates as of December 31, 2013.
Note 21 – Net Loss Per Share/Unit
The General Partner’s unvested shares of restricted stock contain non-forfeitable rights to dividends and are considered to be participating securities in accordance with GAAP and, therefore, are included in the computation of earnings per share under the two-class method. Under the two-class computation method, net losses are not allocated to participating securities unless the holder of the security has a contractual obligation to share in the losses. The unvested restricted stock is not allocated losses as the awards do not have a contractual obligation to share in losses of ARCP. The two-class method is an earnings allocation formula that determines earnings per share for each class of common shares and participating securities according to dividends declared (or accumulated) and participation rights in undistributed earnings.
Net Loss Per Share
The following is a summary of the basic and diluted net loss per share computation for ARCP for the year ended December 31, 2014, 2013 and 2012 (dollar amounts in thousands, except for share and per share data):
| Year Ended December 31, | ||||||||||||
| 2014 | 2013 | 2012 | ||||||||||
| Net loss from continuing operations attributable to the Company | $ | (977,185 | ) | $ | (491,466 | ) | $ | (40,961 | ) | |||
| Net loss from discontinued operations attributable to common stockholders | — | (33 | ) | (691 | ) | |||||||
| Net loss attributable to the Company | (977,185 | ) | (491,499 | ) | (41,652 | ) | ||||||
| Less: dividends to preferred shares and participating securities | 104,057 | 3,631 | 368 | |||||||||
| Net loss attributable to common stockholders | $ | (1,081,242 | ) | $ | (495,130 | ) | $ | (42,020 | ) | |||
| Weighted average number of common shares outstanding - basic and diluted | 793,150,098 | 205,341,431 | 103,306,366 | |||||||||
| Basic and diluted net loss per share from continuing operations attributable to common stockholders | $ | (1.36 | ) | $ | (2.41 | ) | $ | (0.40 | ) | |||
| Basic and diluted net loss per share from discontinued operations attributable to common stockholders | $ | — | $ | — | $ | (0.01 | ) | |||||
| Basic and diluted net loss per share attributable to common stockholders | $ | (1.36 | ) | $ | (2.41 | ) | $ | (0.41 | ) | |||
As of December 31, 2014, 23,763,797 OP Units outstanding, which are convertible to an equal number of shares of its common stock and 2,684,062 shares of unvested restricted stock outstanding were excluded from the calculation of diluted net loss per share as the effect would have been antidilutive.
Net Loss Per Unit
The following is a summary of the basic and diluted net loss per unit computation for the OP for the year ended December 31, 2014, 2013 and 2012 (dollar amounts in thousands, except for unit and per unit data):
F-83
AMERICAN REALTY CAPITAL PROPERTIES, INC. AND ARC PROPERTIES OPERATING PARTNERSHIP, L.P.
NOTES TO CONSOLIDATED FINANCIAL STATEMENTS
December 31, 2014 – (Continued)
| Year Ended December 31, | ||||||||||||
| 2014 | 2013 | 2012 | ||||||||||
| Net loss from continuing operations attributable to the Operating Partnership | $ | (1,010,912 | ) | $ | (507,781 | ) | $ | (41,492 | ) | |||
| Net loss from discontinued operations attributable to the Operating Partnership | — | (34 | ) | (745 | ) | |||||||
| Net loss attributable to the Operating Partnership | (1,010,912 | ) | (507,815 | ) | (42,237 | ) | ||||||
| Less: dividends to preferred units and participating securities | 104,057 | 3,631 | 368 | |||||||||
| Net loss attributable to common unitholders | $ | (1,114,969 | ) | $ | (511,446 | ) | $ | (42,605 | ) | |||
| Weighted average number of common shares outstanding - basic and diluted | 817,883,937 | 214,352,289 | 104,083,222 | |||||||||
| Basic and diluted net loss from continuing operations per unit attributable to common unitholders | $ | (1.36 | ) | $ | (2.39 | ) | $ | (0.40 | ) | |||
| Basic and diluted net loss from discontinued operations per unit attributable to common unitholders | $ | — | $ | — | $ | (0.01 | ) | |||||
| Basic and diluted net loss per unit attributable to common unitholders | $ | (1.36 | ) | $ | (2.39 | ) | $ | (0.41 | ) | |||
As of December 31, 2014, 2,684,062 shares of unvested restricted units outstanding were excluded from the calculation of diluted net loss per unit as the effect would have been anti-dilutive.
Note 22 – Property Dispositions
During the year ended December 31, 2014, the Company disposed of 45 single-tenant properties, 65 multi-tenant properties, and one billboard for an aggregate gross sales price of $2.1 billion (the “2014 Property Dispositions”). There were no properties disposed of during the year ended December 31, 2013. No disposition fees were paid to affiliates in connection with the sale of the 2014 Property Dispositions and the Company has no continuing involvement with these properties. As of December 31, 2014, two properties were classified as held for sale. As of December 31, 2013, the Company classified one property as held for sale, which has been presented as discontinued operations on the Company’s consolidated statements of operations.
Multi-tenant Shopping Center Portfolio Sale
On June 11, 2014, the OP, through indirect subsidiaries, entered into an agreement of purchase and sale with (the “Blackstone/DDR Joint Venture”), a joint venture between Blackstone and DDR Corp., by which the Blackstone/DDR Joint Venture agreed to purchase 67 multi-tenant properties and nine single-tenant properties and the adjacent land and related properties. The properties to be sold pursuant to such agreement were the same properties that the Company had previously intended to spin off into an externally managed, NASDAQ-traded REIT, American Realty Capital Centers, Inc. In light of the Company’s entry into such agreement, it abandoned its previously contemplated spin-off.
On October 17, 2014, the Company completed the final sale of a portfolio consisting of 64 multi-tenant properties and seven single-tenant properties (the “Multi-tenant Portfolio”) to the Blackstone/DDR Joint Venture for $1.9 billion to the Joint Venture Blackstone and DDR. Additionally, the Company entered into a letter of intent with an unrelated third party to sell five multi-tenant properties for $52.3 million bringing total expected sale proceeds to $2.0 billion. The transaction aimed to simplify the Company’s business model, allowing it to focus solely on its single-tenant, net lease investments. The disposition to Blackstone and DDR provided $1.3 billion of net proceeds, of which $1.2 billion were used to reduce the Company’s leverage by paying down the Company’s line of credit. In connection with the sale, $542.8 million of secured mortgage debt was either repaid or assumed by the Blackstone/DDR Joint Venture, providing the Company with $1.3 billion in net proceeds and resulting in a net loss on sale of $262.0 million, which includes the write-off of $195.5 million of goodwill allocated to the cost basis of the Multi-tenant Portfolio.
As the sale does not represent a change in strategic direction for the Company and will not have a significant effect on the operations or financial results of the Company, the operating results of the Multi-tenant Portfolio are not classified as discontinued operations for any periods presented. However, the Company has determined that the Multi-tenant Portfolio is an individually significant component of the Company.
F-84
AMERICAN REALTY CAPITAL PROPERTIES, INC. AND ARC PROPERTIES OPERATING PARTNERSHIP, L.P.
NOTES TO CONSOLIDATED FINANCIAL STATEMENTS
December 31, 2014 – (Continued)
The following table summarizes the operating income from continued operations of the Multi-Tenant Portfolio for the year ended December 31, 2014 and 2013 (in thousands):
| Year Ended December 31, | ||||||||
| 2014 | 2013 | |||||||
| Total revenue | $ | 122,522 | $ | — | ||||
| Total expenses | (123,776 | ) | — | |||||
| Income from assets held for sale | $ | (1,254 | ) | $ | — | |||
Note 23 – Income Taxes
As a REIT, the General Partner generally is not subject to federal income tax, with the exception of its TRS. However, the General Partner, including its TRS, and the Operating Partnership are still subject to certain state and local income taxes in the various jurisdictions in which they operate.
Based on the above, Cole Capital’s business, substantially all of which is conducted through a TRS, recognized a benefit of $40.6 million for the year ended December 31, 2014, which is included in other income, net in the accompanying consolidated statement of operations. No provision or benefit for income taxes was recognized for the year ended December 31, 2013 as the Company did not commence operations for Cole Capital until the Cole Acquisition Date. The difference in the benefit from income taxes reflected in the consolidated statements of operations as compared to the benefit calculated at the statutory federal income tax rate is primarily attributable to various permanent differences and state and local income taxes.
The components of the benefit from income taxes for the year ended December 31, 2014 are as follows:
| Current | ||||
| Federal | $ | 6,305 | ||
| State | 948 | |||
| Total | 7,253 | |||
| Deferred | ||||
| Federal | 28,968 | |||
| State | 4,356 | |||
| Total | 33,324 | |||
| Total benefit from income taxes | $ | 40,577 | ||
The components of the net deferred tax assets (liabilities) as of December 31, 2014, which are included in the accompanying consolidated balance sheet as follows:
| Intangible assets | $ | (55,910 | ) | |
| Accrued compensation | 4,038 | |||
| Fixed assets | (5,513 | ) | ||
| Program development costs | 5,014 | |||
| Equity-based compensation | 1,965 | |||
| Deferred lease liability | 146 | |||
| Accrued rent | 174 | |||
| Total net deferred tax liability | $ | (50,086 | ) | |
The REI segment recognized state income and franchise tax expense during the years ended December 31, 2014 and 2013 of $7.3 million and $2.2 million, respectively.
F-85
AMERICAN REALTY CAPITAL PROPERTIES, INC. AND ARC PROPERTIES OPERATING PARTNERSHIP, L.P.
NOTES TO CONSOLIDATED FINANCIAL STATEMENTS
December 31, 2014 – (Continued)
The Company had no unrecognized tax benefits as of or during the year ended December 31, 2014 and 2013. Any interest and penalties related to unrecognized tax benefits would be recognized within the provision for income taxes in the accompanying consolidated statements of operations. The Company files income tax returns in the U.S. federal jurisdiction, various U.S. state jurisdictions and various Canadian jurisdictions, and is subject to routine examinations by the respective tax authorities. With few exceptions, the Company is no longer subject to federal or state examinations by tax authorities for years before 2010.
Note 24 – Quarterly Results (Unaudited)
Presented below is a summary of the unaudited quarterly financial information for the year ended December 31, 2014 for ARCP (in thousands, except share and per share amounts):
| Quarters Ended | ||||||||||||||||
| March 31, 2014 | June 30, 2014 | September 30, 2014 | December 31, 2014 | |||||||||||||
| Revenues | $ | 321,154 | $ | 382,178 | $ | 457,118 | $ | 418,807 | ||||||||
| Net loss attributable to the Company | (291,444 | ) | (54,720 | ) | (280,398 | ) | (350,623 | ) | ||||||||
| Less: dividends to preferred shares and participating securities | 23,432 | 23,291 | 37,643 | 19,691 | ||||||||||||
| Net loss attributable to the common stockholders | $ | (314,876 | ) | $ | (78,011 | ) | $ | (318,041 | ) | $ | (370,314 | ) | ||||
| Weighted-average shares outstanding - basic and diluted | 547,470,457 | 815,406,408 | 902,096,102 | 902,528,464 | ||||||||||||
Basic and diluted net loss per share attributable to common stockholders (1) | $ | (0.58 | ) | $ | (0.10 | ) | $ | (0.35 | ) | $ | (0.41 | ) | ||||
_______________________________________________
(1) | The sum of the quarterly net loss per share amounts do not agree to the full year net loss per share amounts. We calculate net loss per share based on the weighted-average number of outstanding shares during the reporting period. The average number of shares fluctuates throughout the year and can therefore produce a full year result that does not agree to the sum of the individual quarters. |
Presented below is a summary of the unaudited quarterly financial information for the year ended December 31, 2014 for the OP (in thousands, except unit and per unit amounts):
| Quarters Ended | ||||||||||||||||
| March 31, 2014 | June 30, 2014 | September 30, 2014 | December 31, 2014 | |||||||||||||
| Revenues | $ | 321,154 | $ | 382,178 | $ | 457,118 | $ | 418,807 | ||||||||
| Net loss attributable to the unitholders | (305,648 | ) | (56,870 | ) | (288,202 | ) | (360,038 | ) | ||||||||
| Less: dividends to preferred units and participating securities | 23,432 | 23,291 | 37,643 | 19,691 | ||||||||||||
| Net loss attributable to the unitholders | $ | (329,080 | ) | $ | (80,161 | ) | $ | (325,845 | ) | $ | (379,729 | ) | ||||
| Weighted-average units outstanding - basic and diluted | 572,457,009 | 840,184,663 | 926,801,361 | 926,999,843 | ||||||||||||
Basic and diluted net loss per unit attributable to common unitholders (1) | $ | (0.57 | ) | $ | (0.10 | ) | $ | (0.35 | ) | $ | (0.41 | ) | ||||
_______________________________________________
(1) | The sum of the quarterly net loss per unit amounts do not agree to the full year net loss per unit amounts. We calculate net loss per unit based on the weighted-average number of outstanding unit during the reporting period. The average number of units fluctuates throughout the year and can therefore produce a full year result that does not agree to the sum of the individual quarters. |
F-86
AMERICAN REALTY CAPITAL PROPERTIES, INC. AND ARC PROPERTIES OPERATING PARTNERSHIP, L.P.
NOTES TO CONSOLIDATED FINANCIAL STATEMENTS
December 31, 2014 – (Continued)
Presented below is a summary of the unaudited quarterly financial information for the year ended December 31, 2013 for ARCP (in thousands, except share and per share amounts):
| Quarters Ended | ||||||||||||||||
| March 31, 2013 | June 30, 2013 | September 30, 2013 | December 31, 2013 | |||||||||||||
| Revenues | $ | 42,897 | $ | 54,945 | $ | 95,255 | $ | 136,226 | ||||||||
| Net loss attributable to the Company | (143,880 | ) | (69,603 | ) | (80,201 | ) | (197,815 | ) | ||||||||
| Less: dividends to preferred shares and participating securities | 193 | 233 | 199 | 3,006 | ||||||||||||
| Net loss attributable to the common stockholders | $ | (144,073 | ) | $ | (69,836 | ) | $ | (80,400 | ) | $ | (200,821 | ) | ||||
| Weighted-average shares outstanding - basic and diluted | 167,847,516 | 198,956,355 | 221,707,934 | 231,969,433 | ||||||||||||
Basic and diluted net loss per share attributable to common stockholders (1) | $ | (0.86 | ) | $ | (0.35 | ) | $ | (0.36 | ) | $ | (0.87 | ) | ||||
(1) | The sum of the quarterly net loss per share amounts do not agree to the full year net loss per share amounts. We calculate net loss per share based on the weighted-average number of outstanding shares during the reporting period. The average number of shares fluctuates throughout the year and can therefore produce a full year result that does not agree to the sum of the individual quarters. |
Presented below is a summary of the unaudited quarterly financial information for the year ended December 31, 2013 for the OP (in thousands, except unit and per unit amounts):
| Quarters Ended | ||||||||||||||||
| March 31, 2013 | June 30, 2013 | September 30, 2013 | December 31, 2013 | |||||||||||||
| Revenues | $ | 42,235 | $ | 54,945 | $ | 95,255 | $ | 136,226 | ||||||||
| Net loss from continuing operations attributable to unitholders | (145,937 | ) | (72,311 | ) | (83,450 | ) | (206,083 | ) | ||||||||
| Net (loss) income from discontinued operations attributable to unitholders | (2 | ) | 36 | 96 | (150 | ) | ||||||||||
| Net loss attributable to the unitholders | (145,939 | ) | (72,275 | ) | (83,354 | ) | (206,233 | ) | ||||||||
| Less: dividends to preferred shares and participating securities | 193 | 233 | 199 | 3,006 | ||||||||||||
| Net loss attributable to the unitholders | $ | (146,132 | ) | $ | (72,508 | ) | $ | (83,553 | ) | $ | (209,239 | ) | ||||
| Weighted-average units outstanding - basic and diluted | 172,351,898 | 209,408,106 | 231,682,236 | 242,467,964 | ||||||||||||
Basic and diluted net loss per unit attributable to common unitholders (1) | $ | (0.85 | ) | $ | (0.35 | ) | $ | (0.36 | ) | $ | (0.86 | ) | ||||
(1) | The sum of the quarterly net loss per unit amounts do not agree to the full year net loss per unit amounts. We calculate net loss per unit based on the weighted-average number of outstanding unit during the reporting period. The average number of units fluctuates throughout the year and can therefore produce a full year result that does not agree to the sum of the individual quarters. |
Note 25 – Subsequent Events
The following events occurred subsequent to December 31, 2014:
Completion of Acquisition of Assets
The following table presents certain information about the properties that the Company acquired from December 31, 2014 to March 27, 2015 (dollar amounts and square footage in thousands):
F-87
AMERICAN REALTY CAPITAL PROPERTIES, INC. AND ARC PROPERTIES OPERATING PARTNERSHIP, L.P.
NOTES TO CONSOLIDATED FINANCIAL STATEMENTS
December 31, 2014 – (Continued)
| No. of Buildings | Square Feet | Base Purchase Price (1) | ||||||||
| Total Portfolio – December 31, 2014 | 4,648 | 103,149 | $ | 17,849,621 | ||||||
| Acquisitions, net of disposals | 5 | (1,137 | ) | (286,112 | ) | |||||
| Total portfolio – March 27, 2015 | 4,653 | 102,012 | $ | 17,563,509 | ||||||
____________________________________
| (1) | Contract purchase price, excluding acquisition and transaction related costs. |
Agreement in Principle with Senior Noteholder Group; Receipt of Notice of Default from Trustee for Convertible Notes
On January 22, 2015, the Company announced that it had entered into an agreement in principle with an ad hoc group of holders (the “Senior Noteholder Group”), which the Company had been advised then represented a majority of the aggregate principal amounts outstanding of each of the 2.00% senior notes due 2017, the 3.00% senior notes due 2019 and the 4.60% senior notes due 2024, which, in each case, were issued by the OP, of which the Company is the sole general partner, and guaranteed by the Company under an Indenture, dated February 6, 2014 (the “Indenture”), by and among the OP, U.S. Bank National Association, as trustee, and the guarantors named therein. Pursuant to such agreement, the Senior Noteholder Group agreed not to issue a notice of default, prior to March 3, 2015, for the Company’s failure to timely deliver a 10-Q for the third quarter of 2014 (the “Third Quarter 10-Q”) containing financial information required to be included therein in respect of the OP, which is required to be delivered pursuant to the terms of the Indenture. In exchange, the Company agreed to sign a confidentiality agreement with the Senior Noteholder Group’s counsel and pay reasonable and documented fees and out-of-pocket expenses of such counsel up to $300,000. Furthermore, the parties agreed that in the event a notice of default related to our failure to timely deliver such third quarter 2014 financial statements is issued by the senior noteholders on or after March 3, 2015, the 60 day cure period set forth in the Indenture would be reduced by one day for each day after January 19, 2015 that such notice of default is given. Such agreement was subsequently definitively documented and a supplement to the Indenture was entered into on February 9, 2015. The agreement was reached after the ad hoc group organized recently and directed counsel to the Senior Noteholder Group to engage in discussions with the Company regarding the terms of a possible resolution in response to our failure to timely deliver such third quarter 2014 financial information regarding the OP. The Company and the OP filed the Third Quarter 10-Q containing the required financial information with the SEC on March 2, 2015.
The Company announced on January 22, 2015 that it received at its Phoenix, Arizona corporate office notice (the “Notice”) from the trustee under the indentures (the “Convertible Indentures”) governing each of the 2018 Notes and the 2020 Notes (collectively, the “Convertible Notes”) of the Company’s failure to timely deliver our Third Quarter 10-Q, which was required to be delivered pursuant to the terms of the Convertible Indentures. Subsequent to the Company’s announcement, the Company learned that it also received the Notice on January 16, 2015, at an address in New York City that was formerly the Company’s principal place of business. Pursuant to the terms of the Convertible Indentures, the Company had 60 days following its receipt of a notice of default to deliver the required financial statements, after which such failure would become an event of default under each of the Convertible Indentures.
Management and Board of Directors Changes
On March 10, 2015, the Company’s board of directors appointed Glenn J. Rufrano to serve as the Company’s new Chief Executive Officer and a director, effective April 1, 2015. Additionally, effective April 1, 2015, with the departure of two directors and subject to the board of directors’ recruitment process, the board of directors will consist of Mr. Rufrano, William G. Stanley, Thomas A. Andruskevich and Bruce D. Frank. The board of directors is in the process of recruiting a non-executive Chairman of the Board and two other new independent directors. Mr. Stanley will continue to serve as Interim Chairman of the Board until the appointment of the new non-executive Chairman of the Board.
F-88
Real Estate and Accumulated Depreciation
Schedule III
December 31, 2014
(in thousands)
| Initial Costs | Costs Capitalized Subsequent to Acquisition | Gross Amount Carried at December 31, 2014 (1) (2) | ||||||||||||||||||||||||||||||
| Property | City | State | Encumbrances at December 31, 2014 | Land | Buildings, Fixtures and Improvements | Accumulated Depreciation (3) (4) | Date Acquired | Date of Construction | ||||||||||||||||||||||||
| 24 Hour Fitness | Woodlands | TX | $ | — | $ | 2,690 | $ | 7,463 | $ | — | $ | 10,153 | $ | 754 | 9/24/2013 | 2002 | ||||||||||||||||
| 7-Eleven | Sarasota | FL | — | 1,312 | 1,312 | — | 2,624 | 157 | 11/19/2012 | 2000 | ||||||||||||||||||||||
| 7-Eleven | Gloucester | VA | — | 144 | 578 | — | 722 | 66 | 12/24/2012 | 1985 | ||||||||||||||||||||||
| 7-Eleven | Hampton | VA | — | 69 | 624 | — | 693 | 72 | 12/24/2012 | 1986 | ||||||||||||||||||||||
| 7-Eleven | Hampton | VA | — | 161 | 644 | — | 805 | 74 | 12/24/2012 | 1959 | ||||||||||||||||||||||
| AAA | Oklahoma City | OK | — | 3,638 | 32,567 | — | 36,205 | 1,443 | 2/7/2014 | 2009 | ||||||||||||||||||||||
| Aaron Rents | Oneonta | AL | 613 | 205 | 1,080 | — | 1,285 | 53 | 2/7/2014 | 2008 | ||||||||||||||||||||||
| Aaron Rents | Oxford | AL | — | 278 | 748 | — | 1,026 | 34 | 2/7/2014 | 1989 | ||||||||||||||||||||||
| Aaron Rents | Valley | AL | 409 | 141 | 827 | — | 968 | 38 | 2/7/2014 | 2009 | ||||||||||||||||||||||
| Aaron Rents | El Dorado | AR | — | 238 | 743 | — | 981 | 38 | 2/7/2014 | 2000 | ||||||||||||||||||||||
| Aaron Rents | Springdale | AR | 624 | 513 | 916 | — | 1,429 | 46 | 2/7/2014 | 2009 | ||||||||||||||||||||||
| Aaron Rents | Auburndale | FL | 2,646 | 1,351 | 5,127 | — | 6,478 | 246 | 2/7/2014 | 2009 | ||||||||||||||||||||||
| Aaron Rents | Pensacola | FL | — | 159 | 924 | — | 1,083 | 43 | 2/7/2014 | 1979 | ||||||||||||||||||||||
| Aaron Rents | Statesboro | GA | — | 351 | 1,163 | — | 1,514 | 55 | 2/7/2014 | 2008 | ||||||||||||||||||||||
| Aaron Rents | Indianapolis | IN | — | 235 | 1,071 | — | 1,306 | 49 | 2/7/2014 | 1998 | ||||||||||||||||||||||
| Aaron Rents | Lafayette | IN | 549 | 404 | 652 | — | 1,056 | 37 | 2/7/2014 | 1989 | ||||||||||||||||||||||
| Aaron Rents | Mansura | LA | — | 81 | 497 | — | 578 | 26 | 2/7/2014 | 2000 | ||||||||||||||||||||||
| Aaron Rents | Minden | LA | — | 323 | 1,043 | — | 1,366 | 58 | 2/7/2014 | 2008 | ||||||||||||||||||||||
| Aaron Rents | Battle Creek | MI | — | 286 | 843 | — | 1,129 | 40 | 2/7/2014 | 1995 | ||||||||||||||||||||||
| Aaron Rents | Benton Harbor | MI | — | 217 | 924 | — | 1,141 | 44 | 2/7/2014 | 1997 | ||||||||||||||||||||||
| Aaron Rents | Redford | MI | 434 | 125 | 698 | — | 823 | 38 | 2/7/2014 | 1972 | ||||||||||||||||||||||
| Aaron Rents | Kennett | MO | 319 | 203 | 473 | — | 676 | 25 | 2/7/2014 | 1999 | ||||||||||||||||||||||
| Aaron Rents | Greenwood | MS | — | 156 | 967 | — | 1,123 | 48 | 2/19/2014 | 2006 | ||||||||||||||||||||||
| Aaron Rents | Magnolia | MS | 1,472 | 287 | 2,791 | — | 3,078 | 123 | 2/7/2014 | 2000 | ||||||||||||||||||||||
| Aaron Rents | Charlotte | NC | 579 | 308 | 1,201 | — | 1,509 | 54 | 2/7/2014 | 1994 | ||||||||||||||||||||||
| Aaron Rents | Bowling Green | OH | 564 | 326 | 928 | — | 1,254 | 47 | 2/7/2014 | 2009 | ||||||||||||||||||||||
| Aaron Rents | Kent | OH | 614 | 245 | 1,080 | — | 1,325 | 56 | 2/7/2014 | 1999 | ||||||||||||||||||||||
| Aaron Rents | North Olmsted | OH | 449 | 218 | 753 | — | 971 | 40 | 2/7/2014 | 1960 | ||||||||||||||||||||||
F-89
| Initial Costs | Costs Capitalized Subsequent to Acquisition | Gross Amount Carried at December 31, 2014 (1) (2) | ||||||||||||||||||||||||||||||
| Property | City | State | Encumbrances at December 31, 2014 | Land | Buildings, Fixtures and Improvements | Accumulated Depreciation (3) (4) | Date Acquired | Date of Construction | ||||||||||||||||||||||||
| Aaron Rents | Shawnee | OK | — | 303 | 1,135 | — | 1,438 | 56 | 2/7/2014 | 2008 | ||||||||||||||||||||||
| Aaron Rents | Bloomsburg | PA | 400 | 224 | 856 | — | 1,080 | 39 | 2/7/2014 | 1996 | ||||||||||||||||||||||
| Aaron Rents | Meadville | PA | — | 237 | 1,224 | — | 1,461 | 58 | 2/7/2014 | 1994 | ||||||||||||||||||||||
| Aaron Rents | Columbia | SC | — | 575 | 1,010 | — | 1,585 | 47 | 2/7/2014 | 1977 | ||||||||||||||||||||||
| Aaron Rents | Marion | SC | 319 | 100 | 685 | — | 785 | 32 | 2/7/2014 | 2008 | ||||||||||||||||||||||
| Aaron Rents | Chattanooga | TN | — | 480 | 1,075 | — | 1,555 | 45 | 2/7/2014 | 1989 | ||||||||||||||||||||||
| Aaron Rents | Copperas Cove | TX | — | 423 | 1,341 | — | 1,764 | 62 | 2/7/2014 | 2007 | ||||||||||||||||||||||
| Aaron Rents | Haltom City | TX | — | 858 | 1,024 | — | 1,882 | 52 | 2/7/2014 | 2008 | ||||||||||||||||||||||
| Aaron Rents | Humble | TX | — | 548 | 1,146 | — | 1,694 | 54 | 2/7/2014 | 2008 | ||||||||||||||||||||||
| Aaron Rents | Killeen | TX | — | 815 | 3,244 | — | 4,059 | 151 | 2/7/2014 | 1981 | ||||||||||||||||||||||
| Aaron Rents | Kingsville | TX | 599 | 345 | 1,040 | — | 1,385 | 48 | 2/7/2014 | 2009 | ||||||||||||||||||||||
| Aaron Rents | Livingston | TX | — | 173 | 1,498 | — | 1,671 | 70 | 2/7/2014 | 2008 | ||||||||||||||||||||||
| Aaron Rents | Mexia | TX | — | 126 | 1,186 | — | 1,312 | 56 | 2/7/2014 | 2007 | ||||||||||||||||||||||
| Aaron Rents | Mission | TX | 549 | 324 | 954 | — | 1,278 | 44 | 2/7/2014 | 2009 | ||||||||||||||||||||||
| Aaron Rents | Odessa | TX | — | 99 | 768 | — | 867 | 37 | 2/7/2014 | 2006 | ||||||||||||||||||||||
| Aaron Rents | Pasadena | TX | — | 444 | 1,231 | — | 1,675 | 58 | 2/7/2014 | 2009 | ||||||||||||||||||||||
| Aaron Rents | Port Lavaca | TX | — | 160 | 1,274 | — | 1,434 | 60 | 2/7/2014 | 2007 | ||||||||||||||||||||||
| Aaron Rents | Texas City | TX | — | 275 | 2,156 | — | 2,431 | 100 | 2/7/2014 | 2008 | ||||||||||||||||||||||
| Aaron Rents | Richmond | VA | — | 508 | 1,435 | — | 1,943 | 76 | 2/7/2014 | 1988 | ||||||||||||||||||||||
| Abbott Laboratories | Waukegan | IL | — | 4,734 | 21,319 | — | 26,053 | 1,304 | 11/5/2013 | 1980 | ||||||||||||||||||||||
| Abbott Laboratories | Columbus | OH | — | 800 | 11,385 | — | 12,185 | 821 | 11/5/2013 | 1980 | ||||||||||||||||||||||
| Abuelo's | Rogers | AR | — | 825 | 2,296 | — | 3,121 | 203 | 6/27/2013 | 2003 | ||||||||||||||||||||||
| Academy Sports | Mobile | AL | — | 1,311 | 7,431 | — | 8,742 | 402 | 11/1/2013 | 2012 | ||||||||||||||||||||||
| Academy Sports | Montgomery | AL | — | 1,869 | 6,385 | — | 8,254 | 324 | 2/7/2014 | 2009 | ||||||||||||||||||||||
| Academy Sports | Fayetteville | AR | 7,290 | 1,900 | 7,601 | — | 9,501 | 1,090 | 12/28/2012 | 2012 | ||||||||||||||||||||||
| Academy Sports | Dalton | GA | 4,965 | 998 | 5,656 | — | 6,654 | 745 | 2/20/2013 | 2012 | ||||||||||||||||||||||
| Academy Sports | Bossier City | LA | — | 2,906 | 6,555 | — | 9,461 | 305 | 2/7/2014 | 2008 | ||||||||||||||||||||||
| Academy Sports | Smyrna | TN | — | 2,109 | 8,434 | — | 10,543 | 456 | 11/1/2013 | 2012 | ||||||||||||||||||||||
F-90
| Initial Costs | Costs Capitalized Subsequent to Acquisition | Gross Amount Carried at December 31, 2014 (1) (2) | ||||||||||||||||||||||||||||||
| Property | City | State | Encumbrances at December 31, 2014 | Land | Buildings, Fixtures and Improvements | Accumulated Depreciation (3) (4) | Date Acquired | Date of Construction | ||||||||||||||||||||||||
| Academy Sports | Austin | TX | 5,044 | 4,216 | 8,755 | — | 12,971 | 347 | 2/7/2014 | 1988 | ||||||||||||||||||||||
| Academy Sports | Fort Worth | TX | — | 2,072 | 8,329 | — | 10,401 | 334 | 2/7/2014 | 2009 | ||||||||||||||||||||||
| Academy Sports | Killeen | TX | 3,320 | 2,779 | 5,321 | — | 8,100 | 227 | 2/7/2014 | 2009 | ||||||||||||||||||||||
| Academy Sports | Laredo | TX | — | 2,782 | 8,111 | — | 10,893 | 338 | 2/7/2014 | 2008 | ||||||||||||||||||||||
| Advance Auto Parts | Birmingham | AL | — | 455 | 373 | — | 828 | 39 | 2/28/2013 | 1997 | ||||||||||||||||||||||
| Advance Auto Parts | Birmingham | AL | — | 330 | 494 | — | 824 | 52 | 2/28/2013 | 1999 | ||||||||||||||||||||||
| Advance Auto Parts | Calera | AL | — | 723 | 723 | — | 1,446 | 83 | 12/27/2012 | 2008 | ||||||||||||||||||||||
| Advance Auto Parts | Dothan | AL | — | 326 | 326 | — | 652 | 37 | 12/31/2012 | 1997 | ||||||||||||||||||||||
| Advance Auto Parts | Enterprise | AL | — | 280 | 420 | — | 700 | 48 | 12/31/2012 | 1995 | ||||||||||||||||||||||
| Advance Auto Parts | Opelika | AL | — | 289 | 1,156 | — | 1,445 | 111 | 4/24/2013 | 2013 | ||||||||||||||||||||||
| Advance Auto Parts | Brooklyn | CT | — | 324 | 1,429 | — | 1,753 | 9 | 11/7/2014 | 2006 | ||||||||||||||||||||||
| Advance Auto Parts | Bonita Springs | FL | 1,561 | 1,219 | 1,552 | — | 2,771 | 78 | 2/7/2014 | 2007 | ||||||||||||||||||||||
| Advance Auto Parts | Lehigh Acres | FL | 1,425 | 379 | 2,016 | — | 2,395 | 92 | 2/7/2014 | 2008 | ||||||||||||||||||||||
| Advance Auto Parts | Albany | GA | — | 210 | 629 | — | 839 | 72 | 12/31/2012 | 1995 | ||||||||||||||||||||||
| Advance Auto Parts | Cairo | GA | — | 140 | 326 | — | 466 | 37 | 12/31/2012 | 1993 | ||||||||||||||||||||||
| Advance Auto Parts | Hazlehurst | GA | — | 113 | 451 | — | 564 | 52 | 12/31/2012 | 1998 | ||||||||||||||||||||||
| Advance Auto Parts | Hinesville | GA | — | 352 | 430 | — | 782 | 49 | 12/31/2012 | 1994 | ||||||||||||||||||||||
| Advance Auto Parts | Perry | GA | — | 209 | 487 | — | 696 | 56 | 12/31/2012 | 1994 | ||||||||||||||||||||||
| Advance Auto Parts | Thomasville | GA | — | 251 | 377 | — | 628 | 43 | 12/31/2012 | 1997 | ||||||||||||||||||||||
| Advance Auto Parts | Auburn | IN | 802 | 337 | 1,347 | — | 1,684 | 211 | 3/29/2012 | 2007 | ||||||||||||||||||||||
| Advance Auto Parts | Bedford | IN | 760 | 100 | 1,386 | — | 1,486 | 62 | 2/7/2014 | 2007 | ||||||||||||||||||||||
| Advance Auto Parts | Clinton | IN | — | 182 | 729 | — | 911 | 63 | 6/5/2013 | 2004 | ||||||||||||||||||||||
| Advance Auto Parts | Fort Wayne | IN | — | 193 | 450 | — | 643 | 47 | 2/28/2013 | 1998 | ||||||||||||||||||||||
| Advance Auto Parts | Fort Wayne | IN | — | 200 | 371 | — | 571 | 39 | 2/28/2013 | 1998 | ||||||||||||||||||||||
| Advance Auto Parts | Franklin | IN | 738 | 511 | 1,256 | — | 1,767 | 55 | 2/7/2014 | 2010 | ||||||||||||||||||||||
| Advance Auto Parts | Mishawaka | IN | — | 429 | 1,373 | — | 1,802 | 61 | 2/7/2014 | 2007 | ||||||||||||||||||||||
| Advance Auto Parts | Richmond | IN | — | 377 | 1,616 | — | 1,993 | 71 | 2/7/2014 | 2007 | ||||||||||||||||||||||
| Advance Auto Parts | Salina | KS | — | 195 | 782 | — | 977 | 75 | 4/30/2013 | 2006 | ||||||||||||||||||||||
F-91
| Initial Costs | Costs Capitalized Subsequent to Acquisition | Gross Amount Carried at December 31, 2014 (1) (2) | ||||||||||||||||||||||||||||||
| Property | City | State | Encumbrances at December 31, 2014 | Land | Buildings, Fixtures and Improvements | Accumulated Depreciation (3) (4) | Date Acquired | Date of Construction | ||||||||||||||||||||||||
| Advance Auto Parts | Barbourville | KY | — | 194 | 1,098 | — | 1,292 | 105 | 4/15/2013 | 2006 | ||||||||||||||||||||||
| Advance Auto Parts | Bardstown | KY | — | 272 | 1,090 | — | 1,362 | 125 | 12/10/2012 | 2005 | ||||||||||||||||||||||
| Advance Auto Parts | Brandenburg | KY | — | 186 | 742 | — | 928 | 85 | 12/10/2012 | 2005 | ||||||||||||||||||||||
| Advance Auto Parts | Crestwood | KY | 1,030 | 400 | 1,546 | — | 1,946 | 67 | 2/7/2014 | 2009 | ||||||||||||||||||||||
| Advance Auto Parts | Florence | KY | — | 550 | 1,280 | — | 1,830 | 59 | 2/7/2014 | 2008 | ||||||||||||||||||||||
| Advance Auto Parts | Frankfort | KY | — | 833 | 1,034 | — | 1,867 | 46 | 2/7/2014 | 2007 | ||||||||||||||||||||||
| Advance Auto Parts | Georgetown | KY | — | 510 | 1,323 | — | 1,833 | 56 | 2/7/2014 | 2007 | ||||||||||||||||||||||
| Advance Auto Parts | Hardinsburg | KY | — | 94 | 845 | — | 939 | 97 | 12/10/2012 | 2007 | ||||||||||||||||||||||
| Advance Auto Parts | Inez | KY | — | 130 | 1,174 | — | 1,304 | 157 | 8/22/2012 | 2010 | ||||||||||||||||||||||
| Advance Auto Parts | Leitchfield | KY | — | 104 | 939 | — | 1,043 | 108 | 12/10/2012 | 2005 | ||||||||||||||||||||||
| Advance Auto Parts | Louisville | KY | 740 | 336 | 1,289 | — | 1,625 | 56 | 2/7/2014 | 2009 | ||||||||||||||||||||||
| Advance Auto Parts | West Liberty | KY | — | 249 | 996 | — | 1,245 | 96 | 4/15/2013 | 2006 | ||||||||||||||||||||||
| Advance Auto Parts | Rayne | LA | — | 122 | 490 | — | 612 | 45 | 5/21/2013 | 2000 | ||||||||||||||||||||||
| Advance Auto Parts | Brownstown | MI | — | 482 | 1,760 | — | 2,242 | 77 | 2/7/2014 | 2008 | ||||||||||||||||||||||
| Advance Auto Parts | Caro | MI | — | 117 | 665 | — | 782 | 117 | 11/23/2011 | 2002 | ||||||||||||||||||||||
| Advance Auto Parts | Charlotte | MI | — | 123 | 697 | — | 820 | 122 | 11/23/2011 | 2002 | ||||||||||||||||||||||
| Advance Auto Parts | Flint | MI | — | 133 | 534 | — | 667 | 94 | 11/23/2011 | 2002 | ||||||||||||||||||||||
| Advance Auto Parts | Grand Rapids | MI | 657 | 368 | 1,296 | — | 1,664 | 55 | 2/7/2014 | 2008 | ||||||||||||||||||||||
| Advance Auto Parts | Howell | MI | 830 | 439 | 1,471 | — | 1,910 | 64 | 2/7/2014 | 2008 | ||||||||||||||||||||||
| Advance Auto Parts | Livonia | MI | — | 210 | 643 | — | 853 | 109 | 12/12/2011 | 2003 | ||||||||||||||||||||||
| Advance Auto Parts | Manistee | MI | — | 348 | 1,043 | — | 1,391 | 100 | 4/15/2013 | 2007 | ||||||||||||||||||||||
| Advance Auto Parts | Monroe | MI | — | 548 | 1,434 | — | 1,982 | 63 | 2/7/2014 | 2007 | ||||||||||||||||||||||
| Advance Auto Parts | Romulus | MI | — | 422 | 1,568 | — | 1,990 | 71 | 2/7/2014 | 2007 | ||||||||||||||||||||||
| Advance Auto Parts | Sault Ste. Marie | MI | — | 75 | 671 | — | 746 | 118 | 11/23/2011 | 2003 | ||||||||||||||||||||||
| Advance Auto Parts | South Lyon | MI | — | 402 | 1,607 | — | 2,009 | 70 | 2/7/2014 | 2008 | ||||||||||||||||||||||
| Advance Auto Parts | Tecumseh | MI | — | 281 | 1,214 | — | 1,495 | 39 | 5/27/2014 | 2009 | ||||||||||||||||||||||
| Advance Auto Parts | Washington Twnshp | MI | — | 645 | 1,711 | — | 2,356 | 76 | 2/7/2014 | 2008 | ||||||||||||||||||||||
| Advance Auto Parts | Ypsilanti | MI | — | 85 | 483 | — | 568 | 85 | 11/23/2011 | 2002 | ||||||||||||||||||||||
F-92
| Initial Costs | Costs Capitalized Subsequent to Acquisition | Gross Amount Carried at December 31, 2014 (1) (2) | ||||||||||||||||||||||||||||||
| Property | City | State | Encumbrances at December 31, 2014 | Land | Buildings, Fixtures and Improvements | Accumulated Depreciation (3) (4) | Date Acquired | Date of Construction | ||||||||||||||||||||||||
| Advance Auto Parts | Tupelo | MS | — | 258 | 427 | — | 685 | 25 | 2/20/2014 | 1998 | ||||||||||||||||||||||
| Advance Auto Parts | Candler | NC | — | 399 | 1,202 | — | 1,601 | 54 | 2/7/2014 | 2012 | ||||||||||||||||||||||
| Advance Auto Parts | Charlotte | NC | — | 723 | 883 | — | 1,606 | 41 | 2/7/2014 | 2001 | ||||||||||||||||||||||
| Advance Auto Parts | Eden | NC | — | 320 | 746 | — | 1,066 | 61 | 7/16/2013 | 2004 | ||||||||||||||||||||||
| Advance Auto Parts | Granite Falls | NC | — | 251 | 1,005 | — | 1,256 | 134 | 8/9/2012 | 2010 | ||||||||||||||||||||||
| Advance Auto Parts | Rocky Mount | NC | — | 348 | 836 | — | 1,184 | 44 | 2/21/2014 | 2005 | ||||||||||||||||||||||
| Advance Auto Parts | Lakewood | NJ | — | 750 | 1,750 | — | 2,500 | 233 | 8/22/2012 | 2010 | ||||||||||||||||||||||
| Advance Auto Parts | Woodbury | NJ | — | 446 | 1,784 | — | 2,230 | 255 | 6/20/2012 | 2007 | ||||||||||||||||||||||
| Advance Auto Parts | Bethel | OH | 730 | 234 | 1,305 | — | 1,539 | 58 | 2/7/2014 | 2008 | ||||||||||||||||||||||
| Advance Auto Parts | Canton | OH | 660 | 443 | 1,206 | — | 1,649 | 57 | 2/7/2014 | 2008 | ||||||||||||||||||||||
| Advance Auto Parts | Dayton | OH | — | 470 | 1,349 | — | 1,819 | 62 | 2/7/2014 | 2007 | ||||||||||||||||||||||
| Advance Auto Parts | Delaware | OH | 730 | 502 | 1,274 | — | 1,776 | 58 | 2/7/2014 | 2008 | ||||||||||||||||||||||
| Advance Auto Parts | Eaton | OH | — | 157 | 471 | — | 628 | 41 | 6/13/2013 | 1987 | ||||||||||||||||||||||
| Advance Auto Parts | Franklin | OH | — | 218 | 873 | — | 1,091 | 116 | 8/9/2012 | 1984 | ||||||||||||||||||||||
| Advance Auto Parts | Holland | OH | 668 | 131 | 1,453 | — | 1,584 | 64 | 2/7/2014 | 2008 | ||||||||||||||||||||||
| Advance Auto Parts | Massillon | OH | — | 218 | 1,987 | — | 2,205 | 89 | 2/7/2014 | 2007 | ||||||||||||||||||||||
| Advance Auto Parts | Salem | OH | 660 | 267 | 1,147 | — | 1,414 | 51 | 2/7/2014 | 2009 | ||||||||||||||||||||||
| Advance Auto Parts | Springfield | OH | — | 461 | 1,075 | — | 1,536 | 123 | 12/31/2012 | 2005 | ||||||||||||||||||||||
| Advance Auto Parts | Toledo | OH | 639 | 116 | 1,375 | — | 1,491 | 60 | 2/7/2014 | 2009 | ||||||||||||||||||||||
| Advance Auto Parts | Twinsburg | OH | 639 | 486 | 1,004 | — | 1,490 | 46 | 2/7/2014 | 2009 | ||||||||||||||||||||||
| Advance Auto Parts | Van Wert | OH | — | 33 | 630 | — | 663 | 55 | 6/13/2013 | 1995 | ||||||||||||||||||||||
| Advance Auto Parts | Vermilion | OH | — | 337 | 1,079 | — | 1,416 | 51 | 2/7/2014 | 2006 | ||||||||||||||||||||||
| Advance Auto Parts | Warren | OH | 405 | 83 | 745 | — | 828 | 113 | 4/12/2012 | 2003 | ||||||||||||||||||||||
| Advance Auto Parts | Oklahoma City | OK | — | 208 | 1,178 | — | 1,386 | 157 | 8/9/2012 | 2007 | ||||||||||||||||||||||
| Advance Auto Parts | Sapulpa | OK | 704 | 362 | 1,300 | — | 1,662 | 55 | 2/7/2014 | 2007 | ||||||||||||||||||||||
| Advance Auto Parts | Chambersburg | PA | — | 553 | 830 | — | 1,383 | 87 | 2/28/2013 | 1997 | ||||||||||||||||||||||
| Advance Auto Parts | Selinsgrove | PA | — | 99 | 891 | — | 990 | 77 | 6/3/2013 | 2003 | ||||||||||||||||||||||
| Advance Auto Parts | Titusville | PA | — | 207 | 1,172 | — | 1,379 | 134 | 12/12/2012 | 2010 | ||||||||||||||||||||||
F-93
| Initial Costs | Costs Capitalized Subsequent to Acquisition | Gross Amount Carried at December 31, 2014 (1) (2) | ||||||||||||||||||||||||||||||
| Property | City | State | Encumbrances at December 31, 2014 | Land | Buildings, Fixtures and Improvements | Accumulated Depreciation (3) (4) | Date Acquired | Date of Construction | ||||||||||||||||||||||||
| Advance Auto Parts | Chapin | SC | — | 395 | 922 | — | 1,317 | 132 | 6/20/2012 | 2007 | ||||||||||||||||||||||
| Advance Auto Parts | Chesterfield | SC | — | 131 | 745 | — | 876 | 106 | 6/27/2012 | 2008 | ||||||||||||||||||||||
| Advance Auto Parts | Greenwood | SC | 411 | 210 | 630 | — | 840 | 99 | 3/9/2012 | 1995 | ||||||||||||||||||||||
| Advance Auto Parts | Rock Hill | SC | — | 506 | 915 | — | 1,421 | 41 | 2/7/2014 | 1995 | ||||||||||||||||||||||
| Advance Auto Parts | Sweetwater | TN | — | 360 | 839 | — | 1,199 | 100 | 11/29/2012 | 2006 | ||||||||||||||||||||||
| Advance Auto Parts | Alton | TX | — | 169 | 958 | — | 1,127 | 119 | 10/18/2012 | 2006 | ||||||||||||||||||||||
| Advance Auto Parts | Deer Park | TX | — | 295 | 1,507 | — | 1,802 | 65 | 2/7/2014 | 2008 | ||||||||||||||||||||||
| Advance Auto Parts | Houston | TX | 800 | 343 | 1,029 | — | 1,372 | 190 | 9/30/2011 | 2006 | ||||||||||||||||||||||
| Advance Auto Parts | Houston | TX | 800 | 248 | 991 | — | 1,239 | 183 | 9/30/2011 | 2006 | ||||||||||||||||||||||
| Advance Auto Parts | Houston | TX | — | 837 | 685 | — | 1,522 | 91 | 8/21/2012 | 2007 | ||||||||||||||||||||||
| Advance Auto Parts | Houston | TX | — | 285 | 1,405 | — | 1,690 | 61 | 2/7/2014 | 2006 | ||||||||||||||||||||||
| Advance Auto Parts | Houston | TX | — | 225 | 1,293 | — | 1,518 | 56 | 2/7/2014 | 2008 | ||||||||||||||||||||||
| Advance Auto Parts | Houston | TX | — | 189 | 1,666 | — | 1,855 | 71 | 2/7/2014 | 2008 | ||||||||||||||||||||||
| Advance Auto Parts | Humble | TX | — | 420 | 1,404 | — | 1,824 | 61 | 2/7/2014 | 2007 | ||||||||||||||||||||||
| Advance Auto Parts | Huntsville | TX | — | 327 | 1,278 | — | 1,605 | 55 | 2/7/2014 | 2008 | ||||||||||||||||||||||
| Advance Auto Parts | Kingwood | TX | — | 419 | 1,392 | — | 1,811 | 60 | 2/7/2014 | 2009 | ||||||||||||||||||||||
| Advance Auto Parts | Lubbock | TX | — | 265 | 1,259 | — | 1,524 | 55 | 2/7/2014 | 2008 | ||||||||||||||||||||||
| Advance Auto Parts | Pasadena | TX | — | 382 | 1,146 | — | 1,528 | 158 | 7/6/2012 | 2008 | ||||||||||||||||||||||
| Advance Auto Parts | Spring | TX | — | 388 | 1,616 | — | 2,004 | 66 | 2/7/2014 | 2007 | ||||||||||||||||||||||
| Advance Auto Parts | Webster | TX | — | 385 | 1,452 | — | 1,837 | 63 | 2/7/2014 | 2008 | ||||||||||||||||||||||
| Advance Auto Parts | Appleton | WI | — | 498 | 1,228 | — | 1,726 | 56 | 2/7/2014 | 2007 | ||||||||||||||||||||||
| Advance Auto Parts | Fort Atkinson | WI | — | 353 | 824 | — | 1,177 | 64 | 8/26/2013 | 2004 | ||||||||||||||||||||||
| Advance Auto Parts | Janesville | WI | 939 | 299 | 1,695 | — | 1,994 | 75 | 2/7/2014 | 2007 | ||||||||||||||||||||||
| Advance Auto Parts | Kenosha | WI | — | 569 | 465 | — | 1,034 | 47 | 3/13/2013 | 2004 | ||||||||||||||||||||||
| Advance Auto Parts | Milwaukee | WI | — | 610 | 1,473 | — | 2,083 | 65 | 2/7/2014 | 2008 | ||||||||||||||||||||||
| Advance Auto Parts | St. Mary's | WV | — | 309 | 928 | — | 1,237 | 106 | 12/28/2012 | 2007 | ||||||||||||||||||||||
F-94
| Initial Costs | Costs Capitalized Subsequent to Acquisition | Gross Amount Carried at December 31, 2014 (1) (2) | ||||||||||||||||||||||||
| Property | City | State | Encumbrances at December 31, 2014 | Land | Buildings, Fixtures and Improvements | Accumulated Depreciation (3) (4) | Date Acquired | Date of Construction | ||||||||||||||||||
| Aetna Life Insurance | Fresno | CA | 16,043 | 3,405 | 22,343 | — | 25,748 | 1,400 | 11/5/2013 | 1969 | ||||||||||||||||
| AGCO | Duluth | GA | 8,600 | 3,503 | 14,842 | — | 18,345 | 559 | 2/7/2014 | 1999 | ||||||||||||||||
| Albertson's | Lake Havasu City | AZ | 3,552 | 1,275 | 5,396 | — | 6,671 | 278 | 2/7/2014 | 2003 | ||||||||||||||||
| Albertson's | Mesa | AZ | 3,034 | 1,944 | 4,145 | — | 6,089 | 206 | 2/7/2014 | 1997 | ||||||||||||||||
| Albertson's | Phoenix | AZ | 3,500 | 2,456 | 4,628 | — | 7,084 | 228 | 2/7/2014 | 1998 | ||||||||||||||||
| Albertson's | Scottsdale | AZ | 5,672 | 2,872 | 7,943 | — | 10,815 | 394 | 2/7/2014 | 1991 | ||||||||||||||||
| Albertson's | Tucson | AZ | 5,430 | 2,710 | 7,704 | — | 10,414 | 384 | 2/7/2014 | 2000 | ||||||||||||||||
| Albertson's | Tucson | AZ | 2,721 | 1,642 | 3,587 | — | 5,229 | 184 | 2/7/2014 | 1994 | ||||||||||||||||
| Albertson's | Yuma | AZ | 4,395 | 1,574 | 6,452 | — | 8,026 | 323 | 2/7/2014 | 2003 | ||||||||||||||||
| Albertson's | Denver | CO | 3,840 | 2,058 | 5,286 | — | 7,344 | 257 | 2/7/2014 | 2002 | ||||||||||||||||
| Albertson's | Durango | CO | 3,770 | 3,520 | 3,404 | — | 6,924 | 178 | 2/7/2014 | 1993 | ||||||||||||||||
| Albertson's | Fort Collins | CO | 4,328 | 1,288 | 6,612 | — | 7,900 | 326 | 2/7/2014 | 1996 | ||||||||||||||||
| Albertson's | Alexandria | LA | 4,110 | 1,423 | 6,024 | — | 7,447 | 310 | 2/7/2014 | 1990 | ||||||||||||||||
| Albertson's | Baton Rouge | LA | 4,731 | 1,711 | 7,061 | — | 8,772 | 359 | 2/7/2014 | 1991 | ||||||||||||||||
| Albertson's | Baton Rouge | LA | 3,931 | 1,681 | 5,673 | — | 7,354 | 290 | 2/7/2014 | 1992 | ||||||||||||||||
| Albertson's | Baton Rouge | LA | 5,425 | 1,932 | 7,836 | — | 9,768 | 404 | 2/7/2014 | 1985 | ||||||||||||||||
| Albertson's | Bossier City | LA | 3,599 | 1,949 | 5,125 | — | 7,074 | 255 | 2/7/2014 | 1988 | ||||||||||||||||
| Albertson's | Lafayette | LA | 5,380 | 1,556 | 7,926 | — | 9,482 | 413 | 2/7/2014 | 2000 | ||||||||||||||||
| Albertson's | Albuquerque | NM | 4,500 | 2,834 | 3,682 | — | 6,516 | 251 | 2/7/2014 | 1997 | ||||||||||||||||
| Albertson's | Albuquerque | NM | 4,410 | 2,950 | 3,388 | — | 6,338 | 236 | 2/7/2014 | 1978 | ||||||||||||||||
| Albertson's | Clovis | NM | 3,927 | 769 | 4,865 | — | 5,634 | 283 | 2/7/2014 | 1984 | ||||||||||||||||
| Albertson's | Farmington | NM | 2,566 | 1,442 | 2,505 | — | 3,947 | 160 | 2/7/2014 | 2002 | ||||||||||||||||
| Albertson's | Las Cruces | NM | — | 1,588 | 5,719 | — | 7,307 | 358 | 2/7/2014 | 1997 | ||||||||||||||||
| Albertson's | Los Lunas | NM | 4,083 | 1,105 | 4,770 | — | 5,875 | 287 | 2/7/2014 | 1991 | ||||||||||||||||
| Albertson's | Silver City | NM | 3,560 | 591 | 3,824 | — | 4,415 | 248 | 2/7/2014 | 1982 | ||||||||||||||||
| Albertson's | Abilene | TX | 3,981 | 1,187 | 6,373 | — | 7,560 | 314 | 2/7/2014 | 1984 | ||||||||||||||||
| Albertson's | Arlington | TX | 4,206 | 1,714 | 6,560 | — | 8,274 | 323 | 2/7/2014 | 2002 | ||||||||||||||||
| Albertson's | EL Paso | TX | 4,438 | 1,375 | 6,447 | — | 7,822 | 329 | 2/7/2014 | 1978 | ||||||||||||||||
F-95
| Initial Costs | Costs Capitalized Subsequent to Acquisition | Gross Amount Carried at December 31, 2014 (1) (2) | ||||||||||||||||||||||||
| Property | City | State | Encumbrances at December 31, 2014 | Land | Buildings, Fixtures and Improvements | Accumulated Depreciation (3) (4) | Date Acquired | Date of Construction | ||||||||||||||||||
| Albertson's | Fort Worth | TX | 3,553 | 2,146 | 4,678 | — | 6,824 | 243 | 2/7/2014 | 2000 | ||||||||||||||||
| Albertson's | Fort Worth | TX | 4,740 | 1,833 | 7,311 | — | 9,144 | 355 | 2/7/2014 | 2004 | ||||||||||||||||
| Albertson's | Fort Worth | TX | 3,149 | 1,833 | 4,528 | — | 6,361 | 227 | 2/7/2014 | 2002 | ||||||||||||||||
| Albertson's | Fort Worth | TX | 3,840 | 1,174 | 6,255 | — | 7,429 | 298 | 2/7/2014 | 1988 | ||||||||||||||||
| Albertson's | Midland | TX | 5,640 | 1,002 | 9,885 | — | 10,887 | 479 | 2/7/2014 | 1984 | ||||||||||||||||
| Albertson's | Odessa | TX | 5,080 | 947 | 8,867 | — | 9,814 | 424 | 2/7/2014 | 1985 | ||||||||||||||||
| Albertson's | Weatherford | TX | 3,934 | 1,820 | 5,771 | — | 7,591 | 289 | 2/7/2014 | 2001 | ||||||||||||||||
| Ale House | Orlando | FL | — | 270 | 3,668 | — | 3,938 | 307 | 6/27/2013 | 1995 | ||||||||||||||||
| Ale House | Orlando | FL | — | 290 | 3,647 | — | 3,937 | 305 | 6/27/2013 | 1995 | ||||||||||||||||
| Ale House | St. Petersburg | FL | — | 930 | 3,116 | — | 4,046 | 261 | 6/27/2013 | 1995 | ||||||||||||||||
| Aliberto's Mexican Food | Holbrook | AZ | — | 32 | 96 | — | 128 | 8 | 6/27/2013 | 1981 | ||||||||||||||||
| Allied Oil & Gas | Pleasanton | TX | — | 328 | 4,804 | — | 5,132 | 67 | 9/25/2014 | 2014 | ||||||||||||||||
| Allied Power Group | Houston | TX | — | 1,659 | 13,161 | — | 14,820 | 493 | 6/12/2014 | 2009 | ||||||||||||||||
| Allstate Insurance | Charlotte | NC | 18,518 | 5,106 | 13,270 | — | 18,376 | — | 11/5/2013 | 1973 | ||||||||||||||||
| Allstate Insurance | Roanoke | VA | 19,715 | 1,182 | 4,819 | — | 6,001 | — | 11/5/2013 | 1970 | ||||||||||||||||
| Amazon | West Columbia | SC | — | 3,112 | 53,103 | — | 56,215 | 2,237 | 2/7/2014 | 2012 | ||||||||||||||||
| Amazon | Charleston | TN | 38,500 | 2,678 | 50,880 | — | 53,558 | 2,120 | 2/7/2014 | 2011 | ||||||||||||||||
| Amazon | Chattanooga | TN | 40,800 | 1,995 | 54,332 | — | 56,327 | 2,318 | 2/7/2014 | 2011 | ||||||||||||||||
| Amcor Rigid Plastics USA, Inc | Alhambra | CA | — | 7,143 | 8,730 | — | 15,873 | 1,043 | 1/24/2013 | 1966 | ||||||||||||||||
| AMEC plc | Houston | TX | — | 2,524 | 30,398 | — | 32,922 | 1,721 | 11/5/2013 | 1998 | ||||||||||||||||
| Amega West | West Alexander | PA | — | 117 | 1,787 | — | 1,904 | 46 | 6/12/2014 | 2010 | ||||||||||||||||
| Amega West | Midland | TX | — | 591 | 379 | — | 970 | 10 | 6/12/2014 | 1979 | ||||||||||||||||
| Ameriprise | Ashwaubenon | WI | 10,998 | 751 | 14,260 | — | 15,011 | 1,347 | 1/25/2013 | 2000 | ||||||||||||||||
| AON | Glenview | IL | 52,594 | 14,014 | 73,359 | 5 | 87,378 | 4,491 | 11/5/2013 | 1975 | ||||||||||||||||
| AON | Lincolnshire | IL | 92,517 | 5,336 | 124,777 | — | 130,113 | 14,168 | 11/16/2012 | 1998 | ||||||||||||||||
| APL Logistics, Inc. | Coloma | MI | 10,017 | 1,929 | 9,319 | — | 11,248 | 787 | 2/21/2014 | 1965 | ||||||||||||||||
| Apollo Group | Phoenix | AZ | — | 16,896 | 142,208 | — | 159,104 | 5,270 | 2/7/2014 | 2008 | ||||||||||||||||
| Apple Market | St. Joseph | MO | — | 639 | 1,638 | — | 2,277 | 67 | 3/28/2014 | 1981 | ||||||||||||||||
F-96
| Initial Costs | Costs Capitalized Subsequent to Acquisition | Gross Amount Carried at December 31, 2014 (1) (2) | ||||||||||||||||||||||||
| Property | City | State | Encumbrances at December 31, 2014 | Land | Buildings, Fixtures and Improvements | Accumulated Depreciation (3) (4) | Date Acquired | Date of Construction | ||||||||||||||||||
| Applebee's | Auburn | AL | — | 1,155 | 1,732 | — | 2,887 | 150 | 7/31/2013 | 1993 | ||||||||||||||||
| Applebee's | Oxford | AL | — | 1,162 | 2,157 | — | 3,319 | 170 | 8/30/2013 | 1995 | ||||||||||||||||
| Applebee's | Phenix City | AL | — | 1,488 | 2,232 | — | 3,720 | 194 | 7/31/2013 | 1999 | ||||||||||||||||
| Applebee's | West Memphis | AR | — | 388 | 1,536 | — | 1,924 | 80 | 2/7/2014 | 2006 | ||||||||||||||||
| Applebee's | Arvada | CO | — | 754 | 1,760 | — | 2,514 | 153 | 7/31/2013 | 1996 | ||||||||||||||||
| Applebee's | Brighton | CO | — | 657 | 1,972 | — | 2,629 | 171 | 7/31/2013 | 1998 | ||||||||||||||||
| Applebee's | Colorado Springs | CO | — | 499 | 1,996 | — | 2,495 | 173 | 7/31/2013 | 1995 | ||||||||||||||||
| Applebee's | Colorado Springs | CO | — | 629 | 1,888 | — | 2,517 | 164 | 7/31/2013 | 1994 | ||||||||||||||||
| Applebee's | Greeley | CO | — | 559 | 2,235 | — | 2,794 | 194 | 7/31/2013 | 1995 | ||||||||||||||||
| Applebee's | Northglenn | CO | — | 578 | 1,734 | — | 2,312 | 150 | 7/31/2013 | 1993 | ||||||||||||||||
| Applebee's | Pueblo | CO | — | 752 | 2,257 | — | 3,009 | 185 | 8/30/2013 | 1998 | ||||||||||||||||
| Applebee's | Pueblo | CO | — | 960 | 2,879 | — | 3,839 | 250 | 7/31/2013 | 1998 | ||||||||||||||||
| Applebee's | Thornton | CO | — | 681 | 2,043 | — | 2,724 | 167 | 8/30/2013 | 1994 | ||||||||||||||||
| Applebee's | Bradenton | FL | — | 2,475 | 3,713 | — | 6,188 | 322 | 7/31/2013 | 1994 | ||||||||||||||||
| Applebee's | Brandon | FL | — | 2,453 | 3,647 | — | 6,100 | 322 | 6/27/2013 | 1997 | ||||||||||||||||
| Applebee's | Crestview | FL | — | 943 | 1,752 | — | 2,695 | 152 | 7/31/2013 | 2000 | ||||||||||||||||
| Applebee's | Crystal River | FL | — | 1,328 | 2,467 | — | 3,795 | 214 | 7/31/2013 | 2001 | ||||||||||||||||
| Applebee's | Davenport | FL | — | 1,506 | 4,517 | — | 6,023 | 392 | 7/31/2013 | 2007 | ||||||||||||||||
| Applebee's | Inverness | FL | — | 1,977 | 2,965 | — | 4,942 | 257 | 7/31/2013 | 2000 | ||||||||||||||||
| Applebee's | Lakeland | FL | — | 1,283 | 2,383 | — | 3,666 | 207 | 7/31/2013 | 1997 | ||||||||||||||||
| Applebee's | Lakeland | FL | — | 1,959 | 3,638 | — | 5,597 | 316 | 7/31/2013 | 2000 | ||||||||||||||||
| Applebee's | Largo | FL | — | 2,334 | 3,501 | — | 5,835 | 304 | 7/31/2013 | 1995 | ||||||||||||||||
| Applebee's | New Port Richey | FL | — | 1,695 | 3,147 | — | 4,842 | 273 | 7/31/2013 | 1998 | ||||||||||||||||
| Applebee's | Plant City | FL | — | 2,079 | 2,869 | — | 4,948 | 254 | 6/27/2013 | 2001 | ||||||||||||||||
| Applebee's | Riverview | FL | — | 1,849 | 3,434 | — | 5,283 | 298 | 7/31/2013 | 2006 | ||||||||||||||||
| Applebee's | St. Petersburg | FL | — | 2,329 | 3,493 | — | 5,822 | 303 | 7/31/2013 | 1994 | ||||||||||||||||
| Applebee's | Temple Terrace | FL | — | 2,396 | 3,594 | — | 5,990 | 312 | 7/31/2013 | 1993 | ||||||||||||||||
| Applebee's | Valrico | FL | — | 1,202 | 3,274 | — | 4,476 | 289 | 6/27/2013 | 1998 | ||||||||||||||||
| Applebee's | Wesley Chapel | FL | — | 3,272 | 3,272 | — | 6,544 | 284 | 7/31/2013 | 2000 | ||||||||||||||||
| Applebee's | Winter Haven | FL | — | 2,130 | 2,603 | — | 4,733 | 226 | 7/31/2013 | 1999 | ||||||||||||||||
F-97
| Initial Costs | Costs Capitalized Subsequent to Acquisition | Gross Amount Carried at December 31, 2014 (1) (2) | ||||||||||||||||||||||||
| Property | City | State | Encumbrances at December 31, 2014 | Land | Buildings, Fixtures and Improvements | Accumulated Depreciation (3) (4) | Date Acquired | Date of Construction | ||||||||||||||||||
| Applebee's | Augusta | GA | — | 1,254 | 2,329 | — | 3,583 | 202 | 7/31/2013 | 1987 | ||||||||||||||||
| Applebee's | Dublin | GA | — | 1,171 | 1,431 | — | 2,602 | 124 | 7/31/2013 | 1998 | ||||||||||||||||
| Applebee's | Evans | GA | — | 1,426 | 2,649 | — | 4,075 | 230 | 7/31/2013 | 2004 | ||||||||||||||||
| Applebee's | Milledgeville | GA | — | 1,174 | 1,761 | — | 2,935 | 153 | 7/31/2013 | 1999 | ||||||||||||||||
| Applebee's | Savannah | GA | — | 1,329 | 2,468 | — | 3,797 | 214 | 7/31/2013 | 1994 | ||||||||||||||||
| Applebee's | Clinton | IA | — | 490 | 1,184 | — | 1,674 | 99 | 6/27/2013 | 1995 | ||||||||||||||||
| Applebee's | Fort Dodge | IA | — | — | 1,363 | — | 1,363 | 114 | 6/27/2013 | 1995 | ||||||||||||||||
| Applebee's | Marshalltown | IA | — | 660 | 1,175 | — | 1,835 | 98 | 6/27/2013 | 1995 | ||||||||||||||||
| Applebee's | Mason City | IA | — | 340 | 1,495 | — | 1,835 | 125 | 6/27/2013 | 1995 | ||||||||||||||||
| Applebee's | Muscatine | IA | — | 330 | 1,266 | — | 1,596 | 106 | 6/27/2013 | 1995 | ||||||||||||||||
| Applebee's | Boise | ID | — | 948 | 1,761 | — | 2,709 | 153 | 7/31/2013 | 1998 | ||||||||||||||||
| Applebee's | Garden City | ID | — | 628 | 2,512 | — | 3,140 | 205 | 8/30/2013 | 2003 | ||||||||||||||||
| Applebee's | Nampa | ID | — | 729 | 2,915 | — | 3,644 | 253 | 7/31/2013 | 2000 | ||||||||||||||||
| Applebee's | Pocatello | ID | — | 612 | 1,837 | — | 2,449 | 159 | 7/31/2013 | 1998 | ||||||||||||||||
| Applebee's | Marion | IL | — | 855 | 1,527 | — | 2,382 | 84 | 2/7/2014 | 1998 | ||||||||||||||||
| Applebee's | Sterling | IL | — | 390 | 1,291 | — | 1,681 | 108 | 6/27/2013 | 1995 | ||||||||||||||||
| Applebee's | Swansea | IL | — | 727 | 1,741 | — | 2,468 | 93 | 2/7/2014 | 1998 | ||||||||||||||||
| Applebee's | Newton | KS | — | 504 | 1,569 | — | 2,073 | 139 | 6/27/2013 | 1998 | ||||||||||||||||
| Applebee's | Hopkinsville | KY | — | 460 | 1,265 | — | 1,725 | 106 | 6/27/2013 | 1995 | ||||||||||||||||
| Applebee's | Fall River | MA | — | 275 | 1,558 | — | 1,833 | 135 | 7/31/2013 | 1994 | ||||||||||||||||
| Applebee's | Adrian | MI | — | 407 | 2,351 | — | 2,758 | 126 | 2/7/2014 | 1995 | ||||||||||||||||
| Applebee's | Kalamazoo | MI | — | 575 | 2,644 | — | 3,219 | 124 | 2/7/2014 | 1994 | ||||||||||||||||
| Applebee's | Farmington | MO | — | 574 | 2,242 | — | 2,816 | 119 | 2/7/2014 | 1999 | ||||||||||||||||
| Applebee's | Joplin | MO | — | 754 | 1,829 | — | 2,583 | 105 | 2/7/2014 | 1994 | ||||||||||||||||
| Applebee's | Rolla | MO | — | 671 | 2,272 | — | 2,943 | 121 | 2/7/2014 | 1997 | ||||||||||||||||
| Applebee's | St. Charles | MO | — | 781 | 1,075 | — | 1,856 | 31 | 6/23/2014 | 1990 | ||||||||||||||||
| Applebee's | Horn Lake | MS | — | 584 | 1,642 | — | 2,226 | 85 | 2/7/2014 | 2005 | ||||||||||||||||
| Applebee's | Ocean Springs | MS | — | 673 | 1,708 | — | 2,381 | 151 | 6/27/2013 | 2000 | ||||||||||||||||
F-98
| Initial Costs | Costs Capitalized Subsequent to Acquisition | Gross Amount Carried at December 31, 2014 (1) (2) | ||||||||||||||||||||||||
| Property | City | State | Encumbrances at December 31, 2014 | Land | Buildings, Fixtures and Improvements | Accumulated Depreciation (3) (4) | Date Acquired | Date of Construction | ||||||||||||||||||
| Applebee's | Alamogordo | NM | — | 271 | 2,438 | — | 2,709 | 199 | 8/30/2013 | 2000 | ||||||||||||||||
| Applebee's | Hobbs | NM | — | 600 | 3,401 | — | 4,001 | 295 | 7/31/2013 | 2002 | ||||||||||||||||
| Applebee's | Rio Rancho | NM | — | 645 | 3,654 | — | 4,299 | 317 | 7/31/2013 | 1995 | ||||||||||||||||
| Applebee's | Roswell | NM | — | 405 | 2,295 | — | 2,700 | 199 | 7/31/2013 | 1998 | ||||||||||||||||
| Applebee's | North Canton | OH | — | 152 | 838 | — | 990 | 74 | 6/27/2013 | 1992 | ||||||||||||||||
| Applebee's | Clackamas | OR | — | 901 | 2,103 | — | 3,004 | 182 | 7/31/2013 | 1997 | ||||||||||||||||
| Applebee's | Gresham | OR | — | 853 | 2,560 | — | 3,413 | 209 | 8/30/2013 | 2004 | ||||||||||||||||
| Applebee's | Lake Oswego | OR | — | 1,352 | 1,652 | — | 3,004 | 143 | 7/31/2013 | 1993 | ||||||||||||||||
| Applebee's | Roseburg | OR | — | 717 | 1,673 | — | 2,390 | 137 | 8/30/2013 | 2000 | ||||||||||||||||
| Applebee's | Tualatin | OR | — | 1,116 | 2,072 | — | 3,188 | 180 | 7/31/2013 | 2002 | ||||||||||||||||
| Applebee's | Chambersburg | PA | — | 591 | 2,416 | — | 3,007 | 113 | 2/7/2014 | 1995 | ||||||||||||||||
| Applebee's | Greenville | SC | — | 600 | 2,166 | — | 2,766 | 181 | 6/27/2013 | 1995 | ||||||||||||||||
| Applebee's | Antioch | TN | — | 470 | 878 | — | 1,348 | 73 | 6/27/2013 | 1995 | ||||||||||||||||
| Applebee's | Bartlett | TN | — | 315 | 2,201 | — | 2,516 | 110 | 2/7/2014 | 2005 | ||||||||||||||||
| Applebee's | Clarksville | TN | — | 570 | 1,729 | — | 2,299 | 145 | 6/27/2013 | 1995 | ||||||||||||||||
| Applebee's | Columbia | TN | — | 590 | 1,823 | — | 2,413 | 152 | 6/27/2013 | 1995 | ||||||||||||||||
| Applebee's | Cookeville | TN | — | 410 | 1,128 | — | 1,538 | 94 | 6/27/2013 | 1995 | ||||||||||||||||
| Applebee's | Hermitage | TN | — | 530 | 1,491 | — | 2,021 | 125 | 6/27/2013 | 1995 | ||||||||||||||||
| Applebee's | Lebanon | TN | — | 460 | 1,120 | — | 1,580 | 94 | 6/27/2013 | 1995 | ||||||||||||||||
| Applebee's | Madison | TN | — | 460 | 772 | — | 1,232 | 65 | 6/27/2013 | 1995 | ||||||||||||||||
| Applebee's | Corpus Christi | TX | — | 563 | 2,926 | — | 3,489 | 259 | 6/27/2013 | 2000 | ||||||||||||||||
| Applebee's | Edinburg | TX | — | 898 | 2,058 | — | 2,956 | 182 | 6/27/2013 | 2006 | ||||||||||||||||
| Applebee's | McAllen | TX | — | 1,114 | 1,988 | — | 3,102 | 176 | 6/27/2013 | 1993 | ||||||||||||||||
| Applebee's | New Braunfels | TX | — | 566 | 1,486 | — | 2,052 | 131 | 6/27/2013 | 1995 | ||||||||||||||||
| Applebee's | San Antonio | TX | — | 732 | 1,796 | — | 2,528 | 159 | 6/27/2013 | 2003 | ||||||||||||||||
| Applebee's | Tyler | TX | — | 696 | 2,904 | — | 3,600 | 149 | 2/7/2014 | 1990 | ||||||||||||||||
| Applebee's | Norton | VA | — | 848 | 433 | — | 1,281 | 53 | 2/7/2014 | 2006 | ||||||||||||||||
| Applebee's | Wytheville | VA | — | 564 | 923 | — | 1,487 | 69 | 2/7/2014 | 2000 | ||||||||||||||||
| Applebee's | Richland | WA | — | 1,112 | 2,064 | — | 3,176 | 179 | 7/31/2013 | 2003 | ||||||||||||||||
| Applebee's | Vancouver | WA | — | 791 | 1,846 | — | 2,637 | 151 | 8/30/2013 | 2001 | ||||||||||||||||
| Applebee's | Vancouver | WA | — | 718 | 1,675 | — | 2,393 | 145 | 7/31/2013 | 2001 | ||||||||||||||||
| Apria Healthcare | Indianapolis | IN | 3,987 | 981 | 3,922 | — | 4,903 | 190 | 5/19/2014 | 1993 | ||||||||||||||||
F-99
| Initial Costs | Costs Capitalized Subsequent to Acquisition | Gross Amount Carried at December 31, 2014 (1) (2) | ||||||||||||||||||||||||
| Property | City | State | Encumbrances at December 31, 2014 | Land | Buildings, Fixtures and Improvements | Accumulated Depreciation (3) (4) | Date Acquired | Date of Construction | ||||||||||||||||||
| Arby's | Alexander City | AL | — | 527 | 401 | — | 928 | 34 | 6/27/2013 | 1999 | ||||||||||||||||
| Arby's | Arab | AL | — | 40 | 887 | — | 927 | 72 | 6/27/2013 | 1995 | ||||||||||||||||
| Arby's | Guntersville | AL | — | 142 | 503 | — | 645 | 43 | 6/27/2013 | 1995 | ||||||||||||||||
| Arby's | Hampton Cove | AL | — | 310 | 986 | — | 1,296 | 80 | 6/27/2013 | 1995 | ||||||||||||||||
| Arby's | Mobile | AL | — | 460 | 685 | — | 1,145 | 58 | 6/27/2013 | 1986 | ||||||||||||||||
| Arby's | Bullhead City | AZ | — | 550 | — | — | 550 | — | 6/27/2013 | 1999 | ||||||||||||||||
| Arby's | Fountain Hills | AZ | — | 241 | 597 | — | 838 | 51 | 6/27/2013 | 1994 | ||||||||||||||||
| Arby's | Phoenix | AZ | — | 559 | 618 | — | 1,177 | 53 | 6/27/2013 | 1995 | ||||||||||||||||
| Arby's | Prescott | AZ | — | 404 | 750 | — | 1,154 | 58 | 7/31/2013 | 1986 | ||||||||||||||||
| Arby's | Sacramento | CA | — | 520 | 195 | — | 715 | 16 | 6/27/2013 | 1995 | ||||||||||||||||
| Arby's | Arvada | CO | — | 190 | 1,465 | — | 1,655 | 118 | 6/27/2013 | 1995 | ||||||||||||||||
| Arby's | Apopka | FL | — | 464 | 697 | — | 1,161 | 54 | 7/31/2013 | 1985 | ||||||||||||||||
| Arby's | Merritt Island | FL | — | 297 | 552 | — | 849 | 42 | 7/31/2013 | 1984 | ||||||||||||||||
| Arby's | Orange Park | FL | — | 420 | 1,256 | — | 1,676 | 101 | 6/27/2013 | 1995 | ||||||||||||||||
| Arby's | Orlando | FL | — | 251 | 585 | — | 836 | 45 | 7/31/2013 | 1985 | ||||||||||||||||
| Arby's | Rockledge | FL | — | 381 | 571 | — | 952 | 44 | 7/31/2013 | 1984 | ||||||||||||||||
| Arby's | Atlanta | GA | — | 1,207 | 987 | — | 2,194 | 76 | 7/31/2013 | 1984 | ||||||||||||||||
| Arby's | Canton | GA | — | 370 | 1,200 | — | 1,570 | 97 | 6/27/2013 | 1995 | ||||||||||||||||
| Arby's | Douglasville | GA | — | 370 | 1,692 | — | 2,062 | 137 | 6/27/2013 | 1995 | ||||||||||||||||
| Arby's | Kennesaw | GA | — | 583 | 840 | — | 1,423 | 72 | 6/27/2013 | 1984 | ||||||||||||||||
| Arby's | Richmond Hill | GA | — | 430 | 755 | — | 1,185 | 65 | 6/27/2013 | 1984 | ||||||||||||||||
| Arby's | Savannah | GA | — | 293 | 293 | — | 586 | 23 | 7/31/2013 | 1985 | ||||||||||||||||
| Arby's | Suwanee | GA | — | 370 | 1,561 | — | 1,931 | 126 | 6/27/2013 | 1995 | ||||||||||||||||
| Arby's | Toccoa | GA | — | 185 | 227 | — | 412 | 17 | 7/31/2013 | 1998 | ||||||||||||||||
| Arby's | Mount Vernon | IL | — | 911 | 764 | — | 1,675 | 65 | 6/27/2013 | 1999 | ||||||||||||||||
| Arby's | Avon | IN | — | 500 | 812 | — | 1,312 | 66 | 6/27/2013 | 1995 | ||||||||||||||||
| Arby's | Fort Wayne | IN | — | 529 | 647 | — | 1,176 | 50 | 7/31/2013 | 1987 | ||||||||||||||||
| Arby's | Indianapolis | IN | — | 530 | 1,236 | — | 1,766 | 100 | 6/27/2013 | 1995 | ||||||||||||||||
| Arby's | Indianapolis | IN | — | 370 | 1,130 | — | 1,500 | 91 | 6/27/2013 | 1995 | ||||||||||||||||
| Arby's | New Albany | IN | — | 456 | 470 | — | 926 | 40 | 6/27/2013 | 2005 | ||||||||||||||||
F-100
| Initial Costs | Costs Capitalized Subsequent to Acquisition | Gross Amount Carried at December 31, 2014 (1) (2) | ||||||||||||||||||||||||
| Property | City | State | Encumbrances at December 31, 2014 | Land | Buildings, Fixtures and Improvements | Accumulated Depreciation (3) (4) | Date Acquired | Date of Construction | ||||||||||||||||||
| Arby's | New Albany | IN | — | 325 | 465 | — | 790 | 40 | 6/27/2013 | 1995 | ||||||||||||||||
| Arby's | Scottsburg | IN | — | 526 | 445 | — | 971 | 38 | 6/27/2013 | 1989 | ||||||||||||||||
| Arby's | Winchester | IN | — | 341 | 511 | — | 852 | 39 | 7/31/2013 | 1988 | ||||||||||||||||
| Arby's | Kansas City | KS | — | 280 | 364 | — | 644 | 29 | 6/27/2013 | 1995 | ||||||||||||||||
| Arby's | Salina | KS | — | 540 | 300 | — | 840 | 24 | 6/27/2013 | 1995 | ||||||||||||||||
| Arby's | Topeka | KS | — | 270 | 433 | — | 703 | 35 | 6/27/2013 | 1995 | ||||||||||||||||
| Arby's | Hopkinsville | KY | — | 432 | 528 | — | 960 | 41 | 7/31/2013 | 1985 | ||||||||||||||||
| Arby's | Louisville | KY | — | 336 | 625 | — | 961 | 72 | 5/30/2013 | 1979 | ||||||||||||||||
| Arby's | Alexandria | LA | — | 82 | 245 | — | 327 | 19 | 7/31/2013 | 1985 | ||||||||||||||||
| Arby's | Alma | MI | — | 380 | 408 | — | 788 | 33 | 6/27/2013 | 1995 | ||||||||||||||||
| Arby's | Chesterfield | MI | — | 210 | 841 | — | 1,051 | 68 | 6/27/2013 | 1995 | ||||||||||||||||
| Arby's | Davison | MI | — | 420 | 631 | — | 1,051 | 51 | 6/27/2013 | 1995 | ||||||||||||||||
| Arby's | Flint | MI | — | 110 | 1,422 | — | 1,532 | 115 | 6/27/2013 | 1995 | ||||||||||||||||
| Arby's | Flint | MI | — | 230 | 1,428 | — | 1,658 | 115 | 6/27/2013 | 1995 | ||||||||||||||||
| Arby's | Grandville | MI | — | 1,133 | 755 | — | 1,888 | 58 | 7/31/2013 | 1982 | ||||||||||||||||
| Arby's | Midland | MI | — | 340 | 753 | — | 1,093 | 61 | 6/27/2013 | 1995 | ||||||||||||||||
| Arby's | Pontiac | MI | — | 180 | 962 | — | 1,142 | 78 | 6/27/2013 | 1995 | ||||||||||||||||
| Arby's | Port Huron | MI | — | 210 | 868 | — | 1,078 | 70 | 6/27/2013 | 1995 | ||||||||||||||||
| Arby's | Saginaw | MI | — | 310 | 1,110 | — | 1,420 | 90 | 6/27/2013 | 1995 | ||||||||||||||||
| Arby's | South Haven | MI | — | 260 | 573 | — | 833 | 46 | 6/27/2013 | 1995 | ||||||||||||||||
| Arby's | Walker | MI | — | 360 | 1,002 | — | 1,362 | 81 | 6/27/2013 | 1995 | ||||||||||||||||
| Arby's | Wyoming | MI | — | 1,513 | 648 | — | 2,161 | 50 | 7/31/2013 | 1970 | ||||||||||||||||
| Arby's | Corinth | MS | — | 753 | 429 | — | 1,182 | 37 | 6/27/2013 | 1984 | ||||||||||||||||
| Arby's | Fayetteville | NC | — | 420 | 2,001 | — | 2,421 | 162 | 6/27/2013 | 1995 | ||||||||||||||||
| Arby's | Greensboro | NC | — | 300 | 906 | — | 1,206 | 73 | 6/27/2013 | 1995 | ||||||||||||||||
| Arby's | Greenville | NC | — | 310 | 681 | — | 991 | 55 | 6/27/2013 | 1995 | ||||||||||||||||
| Arby's | Jonesville | NC | — | 350 | 908 | — | 1,258 | 73 | 6/27/2013 | 1995 | ||||||||||||||||
| Arby's | Kernersville | NC | — | 280 | 774 | — | 1,054 | 63 | 6/27/2013 | 1995 | ||||||||||||||||
F-101
| Initial Costs | Costs Capitalized Subsequent to Acquisition | Gross Amount Carried at December 31, 2014 (1) (2) | ||||||||||||||||||||||||
| Property | City | State | Encumbrances at December 31, 2014 | Land | Buildings, Fixtures and Improvements | Accumulated Depreciation (3) (4) | Date Acquired | Date of Construction | ||||||||||||||||||
| Arby's | Kinston | NC | — | 350 | 832 | — | 1,182 | 67 | 6/27/2013 | 1995 | ||||||||||||||||
| Arby's | Lexington | NC | — | 360 | 873 | — | 1,233 | 71 | 6/27/2013 | 1995 | ||||||||||||||||
| Arby's | Lexington | NC | — | 484 | 504 | — | 988 | 43 | 6/27/2013 | 1987 | ||||||||||||||||
| Arby's | Omaha | NE | — | 359 | — | — | 359 | — | 7/31/2013 | 1984 | ||||||||||||||||
| Arby's | Albuquerque | NM | — | 216 | 246 | — | 462 | 21 | 6/27/2013 | 1987 | ||||||||||||||||
| Arby's | Clovis | NM | — | 91 | 518 | — | 609 | 44 | 6/27/2013 | 1982 | ||||||||||||||||
| Arby's | Las Vegas | NM | — | 236 | 236 | — | 472 | 18 | 7/31/2013 | 1985 | ||||||||||||||||
| Arby's | Rochester | NY | — | 128 | 384 | — | 512 | 30 | 7/31/2013 | 1985 | ||||||||||||||||
| Arby's | Columbus | OH | — | 400 | 1,155 | — | 1,555 | 93 | 6/27/2013 | 1995 | ||||||||||||||||
| Arby's | Middlefield | OH | — | 379 | 388 | — | 767 | 33 | 6/27/2013 | 1988 | ||||||||||||||||
| Arby's | Reynoldsburg | OH | — | 370 | 945 | — | 1,315 | 76 | 6/27/2013 | 1995 | ||||||||||||||||
| Arby's | Willard | OH | — | 230 | 599 | — | 829 | 48 | 6/27/2013 | 1995 | ||||||||||||||||
| Arby's | Allentown | PA | — | 600 | 1,652 | — | 2,252 | 133 | 6/27/2013 | 1995 | ||||||||||||||||
| Arby's | Carlisle | PA | — | 200 | 472 | — | 672 | 38 | 6/27/2013 | 1995 | ||||||||||||||||
| Arby's | Erie | PA | — | 188 | 552 | — | 740 | 47 | 6/27/2013 | 1966 | ||||||||||||||||
| Arby's | Hanover | PA | — | 400 | 921 | — | 1,321 | 74 | 6/27/2013 | 1995 | ||||||||||||||||
| Arby's | Myrtle Beach | SC | — | 370 | 1,132 | — | 1,502 | 91 | 6/27/2013 | 1995 | ||||||||||||||||
| Arby's | Chattanooga | TN | — | 201 | 469 | — | 670 | 36 | 7/31/2013 | 1998 | ||||||||||||||||
| Arby's | Memphis | TN | — | 449 | 835 | — | 1,284 | 64 | 7/31/2013 | 1998 | ||||||||||||||||
| Arby's | Amarillo | TX | — | 260 | 627 | — | 887 | 51 | 6/27/2013 | 1995 | ||||||||||||||||
| Arby's | Schertz | TX | — | 499 | 748 | — | 1,247 | 58 | 7/31/2013 | 1996 | ||||||||||||||||
| Ashley Furniture | Jeffersontown | KY | — | 1,966 | 2,368 | — | 4,334 | 49 | 9/26/2014 | 1970 | ||||||||||||||||
| AT&T | Schaumburg | IL | — | 2,364 | 9,305 | — | 11,669 | 162 | 9/24/2014 | 1989 | ||||||||||||||||
| AT&T | Dallas | TX | — | 2,564 | 23,987 | 1,828 | 28,379 | — | 2/7/2014 | 2001 | ||||||||||||||||
| AT&T | Richardson | TX | 11,780 | 1,891 | 31,118 | — | 33,009 | 1,765 | 11/5/2013 | 1986 | ||||||||||||||||
| AT&T | Atlanta | GA | 124,300 | 26,739 | 209,765 | — | 236,504 | 8,268 | 2/7/2014 | 2001 | ||||||||||||||||
| Auto Pawn | Columbus | GA | — | 170 | — | — | 170 | — | 6/27/2013 | 1987 | ||||||||||||||||
| AutoZone | Chicago | IL | — | 698 | 1,047 | — | 1,745 | 100 | 4/30/2013 | 1995 | ||||||||||||||||
F-102
| Initial Costs | Costs Capitalized Subsequent to Acquisition | Gross Amount Carried at December 31, 2014 (1) (2) | ||||||||||||||||||||||||
| Property | City | State | Encumbrances at December 31, 2014 | Land | Buildings, Fixtures and Improvements | Accumulated Depreciation (3) (4) | Date Acquired | Date of Construction | ||||||||||||||||||
| AutoZone | Yorkville | IL | — | 383 | 1,534 | — | 1,917 | 52 | 5/19/2014 | 2006 | ||||||||||||||||
| AutoZone | Pearl River | LA | 719 | 239 | 1,193 | — | 1,432 | 56 | 2/7/2014 | 2007 | ||||||||||||||||
| AutoZone | Hernando | MS | — | 141 | 833 | — | 974 | 35 | 2/7/2014 | 2003 | ||||||||||||||||
| AutoZone | Blanchester | OH | 535 | 341 | 838 | — | 1,179 | 39 | 2/7/2014 | 2008 | ||||||||||||||||
| AutoZone | Hamilton | OH | 814 | 507 | 1,283 | — | 1,790 | 59 | 2/7/2014 | 2008 | ||||||||||||||||
| AutoZone | Hartville | OH | 614 | 197 | 1,156 | — | 1,353 | 53 | 2/7/2014 | 2008 | ||||||||||||||||
| AutoZone | Mt. Orab | OH | 679 | 258 | 1,219 | — | 1,477 | 55 | 2/7/2014 | 2009 | ||||||||||||||||
| AutoZone | Trenton | OH | 504 | 306 | 812 | — | 1,118 | 37 | 2/7/2014 | 2008 | ||||||||||||||||
| AutoZone | Rapid City | SD | 571 | 375 | 969 | — | 1,344 | 43 | 2/7/2014 | 2008 | ||||||||||||||||
| AutoZone | Nashville | TN | 861 | 555 | 1,270 | — | 1,825 | 58 | 2/7/2014 | 2009 | ||||||||||||||||
| Bahama Breeze | Pittsburgh | PA | — | 1,590 | 1,753 | — | 3,343 | 29 | 7/28/2014 | 2004 | ||||||||||||||||
| Bahama Breeze | Memphis | TN | — | 2,370 | 1,313 | — | 3,683 | 19 | 7/28/2014 | 1998 | ||||||||||||||||
| Bandana's Bar-B-Q Restaurant | Collinsville | IL | — | 340 | 627 | — | 967 | 52 | 6/27/2013 | 1995 | ||||||||||||||||
| Bandana's Bar-B-Q Restaurant | Arnold | MO | — | 460 | 433 | — | 893 | 36 | 6/27/2013 | 1995 | ||||||||||||||||
| Bandana's Bar-B-Q Restaurant | Fenton | MO | — | 470 | 314 | — | 784 | 26 | 8/30/2013 | 1986 | ||||||||||||||||
| Bank of America | Merced | CA | — | 512 | 2,195 | — | 2,707 | 123 | 1/8/2014 | 1980 | ||||||||||||||||
| Bank of America | Asheville | NC | — | 383 | 195 | — | 578 | 11 | 1/8/2014 | 1993 | ||||||||||||||||
| Bank of America | Charlotte | NC | — | 62 | 642 | — | 704 | 35 | 1/8/2014 | 1983 | ||||||||||||||||
| Bank of America | Grants Pass | OR | — | 393 | 2,979 | — | 3,372 | 163 | 1/8/2014 | 1963 | ||||||||||||||||
| Banner Life Insurance | Urbana | MD | 19,600 | 2,733 | 31,483 | — | 34,216 | 1,278 | 2/7/2014 | 2011 | ||||||||||||||||
| Baxter International | Bloomington | IN | — | 1,310 | 8,216 | — | 9,526 | 564 | 11/5/2013 | 1995 | ||||||||||||||||
| Beall's | Lakeland | FL | — | 2,033 | 4,809 | — | 6,842 | 128 | 7/16/2014 | 2006 | ||||||||||||||||
| Becton, Dickinson and Company | San Antonio | TX | 9,882 | 1,666 | 19,092 | — | 20,758 | 1,045 | 11/5/2013 | 2008 | ||||||||||||||||
| Bed Bath & Beyond | Stockton | CA | 40,278 | 2,761 | 52,454 | — | 55,215 | 7,599 | 8/17/2012 | 2003 | ||||||||||||||||
| Benihana | Anchorage | AK | — | 1,391 | 1,877 | — | 3,268 | 104 | 2/7/2014 | 1998 | ||||||||||||||||
| Benihana | Miami Beach | FL | — | 3,775 | 433 | — | 4,208 | 36 | 2/7/2014 | 1972 | ||||||||||||||||
| Benihana | Stuart | FL | — | 1,661 | 1,917 | — | 3,578 | 110 | 2/7/2014 | 1976 | ||||||||||||||||
| Benihana | Alpharetta | GA | — | 1,151 | 1,485 | — | 2,636 | 41 | 2/7/2014 | 2003 | ||||||||||||||||
F-103
| Initial Costs | Costs Capitalized Subsequent to Acquisition | Gross Amount Carried at December 31, 2014 (1) (2) | ||||||||||||||||||||||||
| Property | City | State | Encumbrances at December 31, 2014 | Land | Buildings, Fixtures and Improvements | Accumulated Depreciation (3) (4) | Date Acquired | Date of Construction | ||||||||||||||||||
| Benihana | Schaumburg | IL | — | 2,319 | 1,396 | — | 3,715 | 81 | 2/7/2014 | 1992 | ||||||||||||||||
| Benihana | Wheeling | IL | — | 1,896 | 1,273 | — | 3,169 | 46 | 2/7/2014 | 2001 | ||||||||||||||||
| Benihana | Farmington Hills | MI | — | 2,025 | 2,049 | — | 4,074 | 130 | 2/7/2014 | 2012 | ||||||||||||||||
| Benihana | Maple Grove | MN | — | 1,319 | 2,604 | — | 3,923 | 143 | 2/7/2014 | 2006 | ||||||||||||||||
| Benihana | Dallas | TX | — | 2,988 | 1,275 | — | 4,263 | 83 | 2/7/2014 | 1975 | ||||||||||||||||
| Best Buy | Montgomery | AL | 3,148 | 1,370 | 5,749 | — | 7,119 | 284 | 2/7/2014 | 2003 | ||||||||||||||||
| Best Buy | Coral Springs | FL | — | 2,715 | 4,843 | — | 7,558 | 263 | 2/7/2014 | 1993 | ||||||||||||||||
| Best Buy | Bourbonnais | IL | — | 1,724 | 5,156 | — | 6,880 | 281 | 2/7/2014 | 1991 | ||||||||||||||||
| Best Buy | Indianapolis | IN | — | 665 | 4,775 | — | 5,440 | 228 | 2/7/2014 | 2009 | ||||||||||||||||
| Best Buy | Richmond | IN | — | 549 | 4,429 | — | 4,978 | 216 | 2/7/2014 | 2011 | ||||||||||||||||
| Best Buy | Marquette | MI | — | 836 | 4,207 | — | 5,043 | 224 | 2/7/2014 | 2010 | ||||||||||||||||
| Best Buy | Norton Shores | MI | — | 1,568 | 4,099 | — | 5,667 | 195 | 2/7/2014 | 2001 | ||||||||||||||||
| Best Buy | Southaven | MS | — | 2,045 | 4,318 | — | 6,363 | 222 | 2/7/2014 | 2007 | ||||||||||||||||
| Best Buy | Tupelo | MS | 2,533 | 484 | 1,934 | — | 2,418 | 74 | 5/19/2014 | 2005 | ||||||||||||||||
| Best Buy | Pineville | NC | — | 1,818 | 7,970 | — | 9,788 | 381 | 2/7/2014 | 1994 | ||||||||||||||||
| Best Buy | Kenosha | WI | — | 1,925 | 5,503 | — | 7,428 | 262 | 2/7/2014 | 2008 | ||||||||||||||||
| BHC Marketing | The Woodlands | TX | — | 4,724 | 40,332 | 2 | 45,058 | 2,166 | 11/5/2013 | 2009 | ||||||||||||||||
| Big Lots | Chester | VA | — | 335 | 3,373 | — | 3,708 | 179 | 2/24/2014 | 2013 | ||||||||||||||||
| Big O Tires | Phoenix | AZ | 782 | 206 | 1,367 | — | 1,573 | 60 | 2/7/2014 | 2010 | ||||||||||||||||
| Big O Tires | Los Lunas | NM | — | 316 | 1,265 | — | 1,581 | 187 | 6/1/2012 | 2006 | ||||||||||||||||
| Bi-Lo's Grocery | Greenwood | SC | — | 533 | 4,212 | — | 4,745 | 203 | 2/7/2014 | 1999 | ||||||||||||||||
| Bi-Lo's Grocery | Mt Pleasant | SC | — | 4,093 | 8,594 | — | 12,687 | 417 | 2/7/2014 | 2003 | ||||||||||||||||
| BJ's Wholesale Club | Boynton Beach | FL | — | 5,569 | 10,931 | — | 16,500 | 501 | 2/7/2014 | 2001 | ||||||||||||||||
| BJ's Wholesale Club | Jacksonville | FL | — | 5,929 | 16,348 | — | 22,277 | 656 | 2/7/2014 | 2003 | ||||||||||||||||
| BJ's Wholesale Club | Pembroke Pines | FL | 8,446 | 5,104 | 7,661 | — | 12,765 | 364 | 2/7/2014 | 1997 | ||||||||||||||||
| BJ's Wholesale Club | Greenfield | MA | 8,416 | 2,168 | 14,002 | — | 16,170 | 538 | 2/7/2014 | 1997 | ||||||||||||||||
| BJ's Wholesale Club | Leominster | MA | — | 3,585 | 21,344 | — | 24,929 | 815 | 2/7/2014 | 1993 | ||||||||||||||||
| BJ's Wholesale Club | Uxbridge | MA | 12,645 | 5,538 | 36,445 | — | 41,983 | 1,284 | 2/7/2014 | 2006 | ||||||||||||||||
F-104
| Initial Costs | Costs Capitalized Subsequent to Acquisition | Gross Amount Carried at December 31, 2014 (1) (2) | ||||||||||||||||||||||||
| Property | City | State | Encumbrances at December 31, 2014 | Land | Buildings, Fixtures and Improvements | Accumulated Depreciation (3) (4) | Date Acquired | Date of Construction | ||||||||||||||||||
| BJ's Wholesale Club | California | MD | — | 6,882 | 10,196 | — | 17,078 | 458 | 2/7/2014 | 2003 | ||||||||||||||||
| BJ's Wholesale Club | Westminster | MD | 13,978 | 6,516 | 13,860 | — | 20,376 | 615 | 2/7/2014 | 2001 | ||||||||||||||||
| BJ's Wholesale Club | Auburn | ME | — | 2,674 | 16,510 | — | 19,184 | 611 | 2/7/2014 | 1995 | ||||||||||||||||
| BJ's Wholesale Club | Portsmouth | NH | — | 4,216 | 25,454 | — | 29,670 | 940 | 2/7/2014 | 1993 | ||||||||||||||||
| BJ's Wholesale Club | Deptford | NJ | 11,004 | 6,558 | 12,490 | — | 19,048 | 497 | 2/7/2014 | 1995 | ||||||||||||||||
| BJ's Wholesale Club | North Canton | OH | 6,787 | 456 | 8,668 | — | 9,124 | 1,142 | 2/20/2013 | 1998 | ||||||||||||||||
| BJ's Wholesale Club | Lancaster | PA | 13,621 | 3,400 | 16,782 | — | 20,182 | 718 | 2/7/2014 | 1996 | ||||||||||||||||
| Black Angus | Dublin | CA | — | 620 | 2,467 | — | 3,087 | 206 | 6/27/2013 | 1995 | ||||||||||||||||
| Black Meg 43 | Copperas Cove | TX | — | 151 | 151 | — | 302 | 13 | 6/27/2013 | 1979 | ||||||||||||||||
| Bob's Stores | Randolph | MA | — | 2,840 | 6,826 | — | 9,666 | 461 | 11/5/2013 | 1965 | ||||||||||||||||
| Bojangles | Winder | GA | — | 645 | 1,198 | — | 1,843 | 207 | 7/30/2012 | 2011 | ||||||||||||||||
| Bojangles | Biscoe | NC | — | 247 | 986 | — | 1,233 | 148 | 11/29/2012 | 2010 | ||||||||||||||||
| Bojangles | Boone | NC | — | 278 | 833 | — | 1,111 | 144 | 7/27/2012 | 1980 | ||||||||||||||||
| Bojangles | Denver | NC | — | 1,013 | 1,881 | — | 2,894 | 145 | 7/31/2013 | 1997 | ||||||||||||||||
| Bojangles | Dobson | NC | — | 251 | 1,004 | — | 1,255 | 174 | 7/30/2012 | 2010 | ||||||||||||||||
| Bojangles | Hickory | NC | — | 749 | 1,789 | — | 2,538 | 153 | 6/27/2013 | 1973 | ||||||||||||||||
| Bojangles | Indian trail | NC | — | 655 | 1,217 | — | 1,872 | 211 | 7/27/2012 | 2011 | ||||||||||||||||
| Bojangles | Morganton | NC | — | 566 | 1,321 | — | 1,887 | 229 | 7/27/2012 | 2010 | ||||||||||||||||
| Bojangles | Roanoke Rapids | NC | — | 442 | 1,032 | — | 1,474 | 179 | 7/27/2012 | 2011 | ||||||||||||||||
| Bojangles | Southport | NC | — | 505 | 1,179 | — | 1,684 | 204 | 7/30/2012 | 2011 | ||||||||||||||||
| Bojangles | Statesville | NC | — | 646 | 1,937 | — | 2,583 | 149 | 7/31/2013 | 1988 | ||||||||||||||||
| Bojangles | Taylorsville | NC | — | 436 | 1,108 | — | 1,544 | 95 | 6/27/2013 | 1987 | ||||||||||||||||
| Bojangles | Troutman | NC | — | 718 | 1,077 | — | 1,795 | 92 | 10/10/2013 | 2012 | ||||||||||||||||
| Bojangles | Chapin | SC | — | 577 | 1,071 | — | 1,648 | 179 | 8/9/2012 | 2009 | ||||||||||||||||
| Bojangles | Clinton | SC | — | 397 | 926 | — | 1,323 | 160 | 7/27/2012 | 2009 | ||||||||||||||||
| Bojangles | Fountain Inn | SC | — | 287 | 1,150 | — | 1,437 | 98 | 10/10/2013 | 2012 | ||||||||||||||||
| Bojangles | Greenwood | SC | — | 440 | 1,320 | — | 1,760 | 174 | 2/28/2013 | 1995 | ||||||||||||||||
| Bojangles | Moncks Corner | SC | — | 505 | 1,179 | — | 1,684 | 176 | 11/29/2012 | 2010 | ||||||||||||||||
| Bojangles | Walterboro | SC | — | 454 | 1,363 | — | 1,817 | 204 | 11/29/2012 | 2010 | ||||||||||||||||
F-105
| Initial Costs | Costs Capitalized Subsequent to Acquisition | Gross Amount Carried at December 31, 2014 (1) (2) | ||||||||||||||||||||||||
| Property | City | State | Encumbrances at December 31, 2014 | Land | Buildings, Fixtures and Improvements | Accumulated Depreciation (3) (4) | Date Acquired | Date of Construction | ||||||||||||||||||
| Bonefish Grill | Lakeland | FL | — | 750 | 1,897 | — | 2,647 | 101 | 2/7/2014 | 2003 | ||||||||||||||||
| Bonefish Grill | Independence | OH | — | 895 | 2,252 | — | 3,147 | 124 | 2/7/2014 | 2006 | ||||||||||||||||
| Bonefish Grill | Gainesville | VA | — | 751 | 1,325 | — | 2,076 | 105 | 2/7/2014 | 2004 | ||||||||||||||||
| Boston Market | Indianapolis | IN | — | 930 | — | — | 930 | — | 6/27/2013 | 1995 | ||||||||||||||||
| Boston Market | Indianapolis | IN | — | 410 | 1,070 | — | 1,480 | 87 | 6/27/2013 | 1995 | ||||||||||||||||
| Boston Market | Fayetteville | NC | — | 460 | 1,520 | — | 1,980 | 123 | 6/27/2013 | 1995 | ||||||||||||||||
| Boston Market | Raleigh | NC | — | 280 | 1,015 | — | 1,295 | 82 | 6/27/2013 | 1995 | ||||||||||||||||
| Brangus Steakhouse | Jasper | AL | — | 140 | 219 | — | 359 | 18 | 6/27/2013 | 1995 | ||||||||||||||||
| Supercuts | Panama City Beach | FL | 8,050 | 3,827 | 13,859 | — | 17,686 | 589 | 2/7/2014 | 1995 | ||||||||||||||||
| Brew City Paintball | Brookfield | WI | 1,352 | 50 | 84 | — | 134 | 8 | 2/21/2014 | 1967 | ||||||||||||||||
| Bridgestone Tire | Kansas City | MO | — | 651 | 1,954 | — | 2,605 | 184 | 5/31/2013 | 2008 | ||||||||||||||||
| BRK Brands | Aurora | IL | 3,628 | 1,057 | 4,448 | �� | — | 5,505 | 266 | 2/21/2014 | 1995 | |||||||||||||||
| Bruegger's Bagels | Iowa City | IA | — | 40 | 379 | — | 419 | 31 | 6/27/2013 | 1995 | ||||||||||||||||
| Bruegger's Bagels | Durham | NC | — | 312 | 728 | — | 1,040 | 56 | 7/31/2013 | 1926 | ||||||||||||||||
| Bruegger's Bagels | Raleigh | NC | — | 230 | 654 | — | 884 | 53 | 6/27/2013 | 1995 | ||||||||||||||||
| Buca di Beppo Italian | Wheeling | IL | — | 450 | 1,272 | — | 1,722 | 106 | 6/27/2013 | 1995 | ||||||||||||||||
| Buca di Beppo Italian | Westlake | OH | — | 370 | 887 | — | 1,257 | 74 | 6/27/2013 | 1995 | ||||||||||||||||
| Bucho's Mexican Food | Bolingbrook | IL | — | 470 | 137 | — | 607 | 12 | 6/27/2013 | 1992 | ||||||||||||||||
| Buffalo Wild Wings | Langhorne | PA | — | 815 | 815 | — | 1,630 | 71 | 7/31/2013 | 1999 | ||||||||||||||||
| Bunge North America | Fort Worth | TX | 6,262 | 1,100 | 8,433 | — | 9,533 | 512 | 11/5/2013 | 2005 | ||||||||||||||||
| Burger King | Anchorage | AK | — | 427 | 489 | — | 916 | 42 | 6/27/2013 | 1982 | ||||||||||||||||
| Burger King | Andalusia | AL | — | 181 | 1,025 | — | 1,206 | 79 | 7/31/2013 | 2000 | ||||||||||||||||
| Burger King | Atmore | AL | — | 181 | 723 | — | 904 | 56 | 7/31/2013 | 2000 | ||||||||||||||||
| Burger King | Brewton | AL | — | 307 | 920 | — | 1,227 | 71 | 7/31/2013 | 1993 | ||||||||||||||||
| Burger King | Dothan | AL | — | 628 | 1,167 | — | 1,795 | 90 | 7/31/2013 | 1983 | ||||||||||||||||
| Burger King | Dothan | AL | — | 594 | 1,104 | — | 1,698 | 85 | 7/31/2013 | 1999 | ||||||||||||||||
| Burger King | Enterprise | AL | — | 437 | 655 | — | 1,092 | 50 | 7/31/2013 | 1985 | ||||||||||||||||
| Burger King | Evergreen | AL | — | 172 | 689 | — | 861 | 53 | 7/31/2013 | 1997 | ||||||||||||||||
F-106
| Initial Costs | Costs Capitalized Subsequent to Acquisition | Gross Amount Carried at December 31, 2014 (1) (2) | ||||||||||||||||||||||||
| Property | City | State | Encumbrances at December 31, 2014 | Land | Buildings, Fixtures and Improvements | Accumulated Depreciation (3) (4) | Date Acquired | Date of Construction | ||||||||||||||||||
| Burger King | Monroeville | AL | — | 325 | 604 | — | 929 | 46 | 7/31/2013 | 1997 | ||||||||||||||||
| Burger King | Opp | AL | — | 214 | 857 | — | 1,071 | 66 | 7/31/2013 | 1994 | ||||||||||||||||
| Burger King | Troy | AL | — | 461 | 1,383 | — | 1,844 | 106 | 7/31/2013 | 1984 | ||||||||||||||||
| Burger King | Sierra Vista | AZ | — | 260 | 1,041 | — | 1,301 | 80 | 7/31/2013 | 1994 | ||||||||||||||||
| Burger King | Tucson | AZ | — | 300 | 1,307 | — | 1,607 | 106 | 6/27/2013 | 1995 | ||||||||||||||||
| Burger King | Denver | CO | — | 872 | 1,242 | — | 2,114 | 106 | 6/27/2013 | 1994 | ||||||||||||||||
| Burger King | Clearwater | FL | — | 981 | 591 | — | 1,572 | 50 | 6/27/2013 | 1980 | ||||||||||||||||
| Burger King | Defuniak Springs | FL | — | 362 | 1,087 | — | 1,449 | 84 | 7/31/2013 | 1989 | ||||||||||||||||
| Burger King | Largo | FL | — | 683 | 412 | — | 1,095 | 35 | 6/27/2013 | 1984 | ||||||||||||||||
| Burger King | Niceville | FL | — | 598 | 399 | — | 997 | 31 | 7/31/2013 | 1994 | ||||||||||||||||
| Burger King | Panama City | FL | — | 319 | 956 | — | 1,275 | 74 | 7/31/2013 | 1998 | ||||||||||||||||
| Burger King | Springfield | FL | — | 324 | 971 | — | 1,295 | 75 | 7/31/2013 | 1995 | ||||||||||||||||
| Burger King | Tallahassee | FL | — | 720 | 720 | — | 1,440 | 55 | 7/31/2013 | 1998 | ||||||||||||||||
| Burger King | Tallahassee | FL | — | 843 | 454 | — | 1,297 | 35 | 7/31/2013 | 1980 | ||||||||||||||||
| Burger King | Alpharetta | GA | — | 635 | 865 | — | 1,500 | 74 | 6/27/2013 | 1998 | ||||||||||||||||
| Burger King | Alpharetta | GA | — | 1,128 | 977 | — | 2,105 | 83 | 6/27/2013 | 1993 | ||||||||||||||||
| Burger King | Alpharetta | GA | — | 795 | 943 | — | 1,738 | 81 | 6/27/2013 | 1997 | ||||||||||||||||
| Burger King | Alpharetta | GA | — | 501 | 1,219 | — | 1,720 | 104 | 6/27/2013 | 2001 | ||||||||||||||||
| Burger King | Atlanta | GA | — | 380 | 499 | — | 879 | 40 | 6/27/2013 | 1995 | ||||||||||||||||
| Burger King | Augusta | GA | — | 693 | 2,080 | — | 2,773 | 160 | 7/31/2013 | 1986 | ||||||||||||||||
| Burger King | Bainbridge | GA | — | 347 | 1,042 | — | 1,389 | 80 | 7/31/2013 | 1998 | ||||||||||||||||
| Burger King | Cairo | GA | — | 245 | 981 | — | 1,226 | 75 | 7/31/2013 | 1997 | ||||||||||||||||
| Burger King | Fort Oglethorpe | GA | — | 170 | 2,175 | — | 2,345 | 176 | 6/27/2013 | 1995 | ||||||||||||||||
| Burger King | Marietta | GA | — | 350 | 916 | — | 1,266 | 74 | 6/27/2013 | 1995 | ||||||||||||||||
| Burger King | Martinez | GA | — | 909 | 1,350 | — | 2,259 | 115 | 6/27/2013 | 1998 | ||||||||||||||||
| Burger King | Roswell | GA | — | 495 | 1,156 | — | 1,651 | 89 | 7/31/2013 | 1998 | ||||||||||||||||
| Burger King | Thomson | GA | — | 748 | 876 | — | 1,624 | 75 | 6/27/2013 | 1988 | ||||||||||||||||
| Burger King | Valdosta | GA | — | 564 | 376 | — | 940 | 29 | 7/31/2013 | 1987 | ||||||||||||||||
F-107
| Initial Costs | Costs Capitalized Subsequent to Acquisition | Gross Amount Carried at December 31, 2014 (1) (2) | ||||||||||||||||||||||||
| Property | City | State | Encumbrances at December 31, 2014 | Land | Buildings, Fixtures and Improvements | Accumulated Depreciation (3) (4) | Date Acquired | Date of Construction | ||||||||||||||||||
| Burger King | Des Moines | IA | — | 1,160 | 949 | — | 2,109 | 73 | 7/31/2013 | 1987 | ||||||||||||||||
| Burger King | Perry | IA | — | 557 | 680 | — | 1,237 | 52 | 7/31/2013 | 1997 | ||||||||||||||||
| Burger King | Red Oak | IA | — | 334 | 1,002 | — | 1,336 | 77 | 7/31/2013 | 1988 | ||||||||||||||||
| Burger King | Shenandoah | IA | — | 313 | 582 | — | 895 | 45 | 7/31/2013 | 1988 | ||||||||||||||||
| Burger King | Stuart | IA | — | 607 | 911 | — | 1,518 | 70 | 7/31/2013 | 1997 | ||||||||||||||||
| Burger King | Chicago | IL | — | 580 | 1,413 | — | 1,993 | 114 | 6/27/2013 | 1995 | ||||||||||||||||
| Burger King | Chicago Ridge | IL | — | 431 | 684 | — | 1,115 | 58 | 6/27/2013 | 1998 | ||||||||||||||||
| Burger King | Harvey | IL | — | 403 | 507 | — | 910 | 43 | 6/27/2013 | 1995 | ||||||||||||||||
| Burger King | Maywood | IL | — | 860 | 1,051 | — | 1,911 | 81 | 7/31/2013 | 2003 | ||||||||||||||||
| Burger King | Palatine | IL | — | 352 | 426 | — | 778 | 36 | 6/27/2013 | 1995 | ||||||||||||||||
| Burger King | Pontiac | IL | — | 151 | 616 | — | 767 | 53 | 6/27/2013 | 1991 | ||||||||||||||||
| Burger King | Springfield | IL | — | 354 | 677 | — | 1,031 | 58 | 6/27/2013 | 1995 | ||||||||||||||||
| Burger King | Cedar Lake | IN | — | 327 | 374 | — | 701 | 32 | 6/27/2013 | 1986 | ||||||||||||||||
| Burger King | Gary | IN | — | 544 | 606 | — | 1,150 | 52 | 6/27/2013 | 1987 | ||||||||||||||||
| Burger King | Highland | IN | — | 410 | 992 | — | 1,402 | 80 | 6/27/2013 | 1995 | ||||||||||||||||
| Burger King | Madisonville | KY | — | 550 | 1,067 | — | 1,617 | 86 | 6/27/2013 | 1995 | ||||||||||||||||
| Burger King | Cut Off | LA | — | 726 | 1,088 | — | 1,814 | 84 | 7/31/2013 | 1990 | ||||||||||||||||
| Burger King | Gonzales | LA | — | 380 | 465 | — | 845 | 36 | 7/31/2013 | 1990 | ||||||||||||||||
| Burger King | Lake Charles | LA | — | 456 | 456 | — | 912 | 35 | 7/31/2013 | 1980 | ||||||||||||||||
| Burger King | Lake Charles | LA | — | 610 | 746 | — | 1,356 | 57 | 7/31/2013 | 1990 | ||||||||||||||||
| Burger King | Metairie | LA | — | 728 | 392 | — | 1,120 | 30 | 7/31/2013 | 1990 | ||||||||||||||||
| Burger King | Opelousas | LA | — | 964 | 964 | — | 1,928 | 74 | 7/31/2013 | 1978 | ||||||||||||||||
| Burger King | Raceland | LA | — | 356 | 533 | — | 889 | 41 | 7/31/2013 | 2000 | ||||||||||||||||
| Burger King | Amesbury | MA | — | 835 | 1,217 | — | 2,052 | 104 | 6/27/2013 | 1977 | ||||||||||||||||
| Burger King | Springfield | MA | — | 983 | 516 | — | 1,499 | 44 | 6/27/2013 | 1974 | ||||||||||||||||
| Burger King | Caribou | ME | — | 770 | 440 | — | 1,210 | 36 | 6/27/2013 | 1995 | ||||||||||||||||
| Burger King | Belding | MI | — | 221 | 411 | — | 632 | 32 | 7/31/2013 | 1994 | ||||||||||||||||
| Burger King | Detroit | MI | — | 614 | 331 | — | 945 | 25 | 7/31/2013 | 1988 | ||||||||||||||||
F-108
| Initial Costs | Costs Capitalized Subsequent to Acquisition | Gross Amount Carried at December 31, 2014 (1) (2) | ||||||||||||||||||||||||
| Property | City | State | Encumbrances at December 31, 2014 | Land | Buildings, Fixtures and Improvements | Accumulated Depreciation (3) (4) | Date Acquired | Date of Construction | ||||||||||||||||||
| Burger King | Grand Rapids | MI | — | 490 | 545 | — | 1,035 | 44 | 6/27/2013 | 1995 | ||||||||||||||||
| Burger King | Grand Rapids | MI | — | 260 | 780 | — | 1,040 | 63 | 6/27/2013 | 1995 | ||||||||||||||||
| Burger King | Grand Rapids | MI | — | 346 | 807 | — | 1,153 | 62 | 7/31/2013 | 1985 | ||||||||||||||||
| Burger King | Holland | MI | — | 420 | 707 | — | 1,127 | 57 | 6/27/2013 | 1995 | ||||||||||||||||
| Burger King | Hudsonville | MI | — | 451 | 676 | — | 1,127 | 52 | 7/31/2013 | 1988 | ||||||||||||||||
| Burger King | Jenison | MI | — | 233 | 349 | — | 582 | 27 | 7/31/2013 | 1994 | ||||||||||||||||
| Burger King | Kingsford | MI | — | 53 | 1,015 | — | 1,068 | 78 | 7/31/2013 | 1983 | ||||||||||||||||
| Burger King | L'Anse | MI | — | 32 | 616 | — | 648 | 47 | 7/31/2013 | 1999 | ||||||||||||||||
| Burger King | Menominee | MI | — | 494 | 604 | — | 1,098 | 47 | 7/31/2013 | 1986 | ||||||||||||||||
| Burger King | Sparta | MI | — | 640 | 570 | — | 1,210 | 46 | 6/27/2013 | 1995 | ||||||||||||||||
| Burger King | Spring Lake | MI | — | 341 | 512 | — | 853 | 39 | 7/31/2013 | 1994 | ||||||||||||||||
| Burger King | Walker | MI | — | 305 | 711 | — | 1,016 | 55 | 7/31/2013 | 1973 | ||||||||||||||||
| Burger King | Walled Lake | MI | — | 470 | 433 | — | 903 | 35 | 6/27/2013 | 1995 | ||||||||||||||||
| Burger King | Warren | MI | — | 248 | 745 | — | 993 | 57 | 7/31/2013 | 1987 | ||||||||||||||||
| Burger King | Hastings | MN | — | 328 | 608 | — | 936 | 47 | 7/31/2013 | 1990 | ||||||||||||||||
| Burger King | Kansas CIty | MO | — | 444 | 1,036 | — | 1,480 | 80 | 7/31/2013 | 1984 | ||||||||||||||||
| Burger King | Brandon | MS | — | 649 | 1,513 | — | 2,162 | 129 | 6/27/2013 | 1981 | ||||||||||||||||
| Burger King | Clarksdale | MS | — | 865 | 865 | — | 1,730 | 67 | 7/31/2013 | 1988 | ||||||||||||||||
| Burger King | Cleveland | MS | — | 688 | 1,606 | — | 2,294 | 124 | 7/31/2013 | 1985 | ||||||||||||||||
| Burger King | Greenville | MS | — | 573 | 1,337 | — | 1,910 | 103 | 7/31/2013 | 2004 | ||||||||||||||||
| Burger King | Greenville | MS | — | 351 | 820 | — | 1,171 | 63 | 7/31/2013 | 1993 | ||||||||||||||||
| Burger King | Greenwood | MS | — | 692 | 1,038 | — | 1,730 | 80 | 7/31/2013 | 1988 | ||||||||||||||||
| Burger King | Grenada | MS | — | 536 | 805 | — | 1,341 | 62 | 7/31/2013 | 1989 | ||||||||||||||||
| Burger King | Natchez | MS | — | 225 | 674 | — | 899 | 52 | 7/31/2013 | 1973 | ||||||||||||||||
| Burger King | Philadelphia | MS | — | 402 | 939 | — | 1,341 | 72 | 7/31/2013 | 1993 | ||||||||||||||||
| Burger King | Yazoo City | MS | — | 489 | 909 | — | 1,398 | 70 | 7/31/2013 | 1993 | ||||||||||||||||
| Burger King | Apex | NC | — | 366 | 324 | — | 690 | 28 | 6/27/2013 | 1992 | ||||||||||||||||
| Burger King | Asheville | NC | — | 728 | 595 | — | 1,323 | 46 | 7/31/2013 | 1982 | ||||||||||||||||
F-109
| Initial Costs | Costs Capitalized Subsequent to Acquisition | Gross Amount Carried at December 31, 2014 (1) (2) | ||||||||||||||||||||||||
| Property | City | State | Encumbrances at December 31, 2014 | Land | Buildings, Fixtures and Improvements | Accumulated Depreciation (3) (4) | Date Acquired | Date of Construction | ||||||||||||||||||
| Burger King | Chadbourn | NC | — | 353 | 797 | — | 1,150 | 68 | 6/27/2013 | 1999 | ||||||||||||||||
| Burger King | Charlotte | NC | — | 1,105 | 1,372 | — | 2,477 | 117 | 6/27/2013 | 1997 | ||||||||||||||||
| Burger King | Claremont | NC | — | 646 | 646 | — | 1,292 | 55 | 6/27/2013 | 2000 | ||||||||||||||||
| Burger King | Clinton | NC | — | 494 | 801 | — | 1,295 | 68 | 6/27/2013 | 1999 | ||||||||||||||||
| Burger King | Dunn | NC | — | 328 | 268 | — | 596 | 21 | 7/31/2013 | 1989 | ||||||||||||||||
| Burger King | Durham | NC | — | 170 | 352 | — | 522 | 28 | 6/27/2013 | 1995 | ||||||||||||||||
| Burger King | Rockingham | NC | — | 430 | 1,171 | — | 1,601 | 95 | 6/27/2013 | 1995 | ||||||||||||||||
| Burger King | Wilmington | NC | — | 573 | 870 | — | 1,443 | 74 | 6/27/2013 | 1999 | ||||||||||||||||
| Burger King | Blair | NE | — | 272 | 1,087 | — | 1,359 | 84 | 7/31/2013 | 1987 | ||||||||||||||||
| Burger King | Wahoo | NE | — | 196 | 1,109 | — | 1,305 | 85 | 7/31/2013 | 1990 | ||||||||||||||||
| Burger King | Dover | NH | — | 1,159 | 952 | — | 2,111 | 81 | 6/27/2013 | 1970 | ||||||||||||||||
| Burger King | Nashua | NH | — | 655 | 655 | — | 1,310 | 50 | 7/31/2013 | 2008 | ||||||||||||||||
| Burger King | Edison | NJ | — | 480 | 1,075 | — | 1,555 | 87 | 6/27/2013 | 1995 | ||||||||||||||||
| Burger King | Manahawkin | NJ | — | 310 | 748 | — | 1,058 | 60 | 6/27/2013 | 1995 | ||||||||||||||||
| Burger King | Elko | NV | — | 260 | 1,001 | — | 1,261 | 81 | 6/27/2013 | 1995 | ||||||||||||||||
| Burger King | Albany | NY | — | 330 | 850 | — | 1,180 | 69 | 6/27/2013 | 1995 | ||||||||||||||||
| Burger King | Central Square | NY | — | 500 | 1,189 | — | 1,689 | 96 | 6/27/2013 | 1995 | ||||||||||||||||
| Burger King | Cohoes | NY | — | 270 | 563 | — | 833 | 46 | 6/27/2013 | 1995 | ||||||||||||||||
| Burger King | East Greenbush | NY | — | 404 | 269 | — | 673 | 23 | 6/27/2013 | 1980 | ||||||||||||||||
| Burger King | Hamburg | NY | — | 403 | 383 | — | 786 | 33 | 6/27/2013 | 1974 | ||||||||||||||||
| Burger King | Irondequoit | NY | — | 988 | 659 | — | 1,647 | 51 | 7/31/2013 | 1980 | ||||||||||||||||
| Burger King | Montgomery | NY | — | 480 | 1,042 | — | 1,522 | 84 | 6/27/2013 | 1995 | ||||||||||||||||
| Burger King | Schenectady | NY | — | 380 | 936 | — | 1,316 | 76 | 6/27/2013 | 1995 | ||||||||||||||||
| Burger King | Syracuse | NY | — | 606 | 606 | — | 1,212 | 47 | 7/31/2013 | 1986 | ||||||||||||||||
| Burger King | Cincinnati | OH | — | 353 | 824 | — | 1,177 | 63 | 7/31/2013 | 1969 | ||||||||||||||||
| Burger King | Dayton | OH | — | 569 | 466 | — | 1,035 | 36 | 7/31/2013 | 1990 | ||||||||||||||||
| Burger King | Mansfield | OH | — | 191 | 766 | — | 957 | 59 | 7/31/2013 | 1985 | ||||||||||||||||
| Burger King | New Philadelphia | OH | — | 419 | 779 | — | 1,198 | 60 | 7/31/2013 | 1986 | ||||||||||||||||
F-110
| Initial Costs | Costs Capitalized Subsequent to Acquisition | Gross Amount Carried at December 31, 2014 (1) (2) | ||||||||||||||||||||||||
| Property | City | State | Encumbrances at December 31, 2014 | Land | Buildings, Fixtures and Improvements | Accumulated Depreciation (3) (4) | Date Acquired | Date of Construction | ||||||||||||||||||
| Burger King | Willoughby | OH | — | 410 | 1,005 | — | 1,415 | 81 | 6/27/2013 | 1995 | ||||||||||||||||
| Burger King | Ardmore | OK | — | 270 | 1,023 | — | 1,293 | 83 | 6/27/2013 | 1995 | ||||||||||||||||
| Burger King | Corvallis | OR | — | 170 | 195 | — | 365 | 16 | 6/27/2013 | 1995 | ||||||||||||||||
| Burger King | Roseburg | OR | — | 350 | 886 | — | 1,236 | 72 | 6/27/2013 | 1995 | ||||||||||||||||
| Burger King | Harrisburg | PA | — | 619 | 412 | — | 1,031 | 32 | 7/31/2013 | 1985 | ||||||||||||||||
| Burger King | Old Forge | PA | — | 390 | 905 | — | 1,295 | 73 | 6/27/2013 | 1995 | ||||||||||||||||
| Burger King | Gaffney | SC | — | 370 | 880 | — | 1,250 | 71 | 6/27/2013 | 1995 | ||||||||||||||||
| Burger King | Greenville | SC | — | 420 | 571 | — | 991 | 46 | 6/27/2013 | 1995 | ||||||||||||||||
| Burger King | North Augusta | SC | — | 256 | 1,451 | — | 1,707 | 112 | 7/31/2013 | 1985 | ||||||||||||||||
| Burger King | North Augusta | SC | — | 450 | 1,050 | — | 1,500 | 81 | 7/31/2013 | 1985 | ||||||||||||||||
| Burger King | Chattanooga | TN | — | 740 | 1,591 | — | 2,331 | 129 | 6/27/2013 | 1995 | ||||||||||||||||
| Burger King | Chattanooga | TN | — | 637 | 955 | — | 1,592 | 74 | 7/31/2013 | 1985 | ||||||||||||||||
| Burger King | Gallatin | TN | — | 199 | 463 | — | 662 | 36 | 7/31/2013 | 1984 | ||||||||||||||||
| Burger King | Austin | TX | — | 666 | 999 | — | 1,665 | 85 | 6/27/2013 | 1998 | ||||||||||||||||
| Burger King | Cleburne | TX | — | 300 | 603 | — | 903 | 49 | 6/27/2013 | 1995 | ||||||||||||||||
| Burger King | Laredo | TX | — | 684 | 1,026 | — | 1,710 | 79 | 7/31/2013 | 2002 | ||||||||||||||||
| Burger King | Texas City | TX | — | 421 | 782 | — | 1,203 | 60 | 7/31/2013 | 1984 | ||||||||||||||||
| Burger King | Spanaway | WA | — | 509 | 1,628 | — | 2,137 | 139 | 6/27/2013 | 1997 | ||||||||||||||||
| Burger King | Germantown | WI | — | 644 | 1,300 | — | 1,944 | 111 | 6/27/2013 | 1986 | ||||||||||||||||
| Burger King | Marshfield | WI | — | 232 | 885 | — | 1,117 | 76 | 6/27/2013 | 1986 | ||||||||||||||||
| Burger King | Rhinelander | WI | — | 260 | 606 | — | 866 | 47 | 7/31/2013 | 1986 | ||||||||||||||||
| Burger King | Weston | WI | — | 329 | 718 | — | 1,047 | 61 | 6/27/2013 | 1987 | ||||||||||||||||
| Burger King | Bluefield | WV | — | 210 | 1,163 | — | 1,373 | 94 | 6/27/2013 | 1995 | ||||||||||||||||
| Burnie Bistro's | Clearwater | FL | — | 25 | 14 | — | 39 | 1 | 7/31/2013 | 1987 | ||||||||||||||||
F-111
| Initial Costs | Costs Capitalized Subsequent to Acquisition | Gross Amount Carried at December 31, 2014 (1) (2) | ||||||||||||||||||||||||
| Property | City | State | Encumbrances at December 31, 2014 | Land | Buildings, Fixtures and Improvements | Accumulated Depreciation (3) (4) | Date Acquired | Date of Construction | ||||||||||||||||||
| Cactus Wellhead | Williston | ND | — | 72 | 3,735 | — | 3,807 | 73 | 7/24/2014 | 2011 | ||||||||||||||||
| Cactus Wellhead | DuBois | PA | — | 129 | 2,542 | — | 2,671 | 61 | 6/12/2014 | 2012 | ||||||||||||||||
| Cactus Wellhead | Center | TX | — | 115 | 1,886 | — | 2,001 | 45 | 6/12/2014 | 2011 | ||||||||||||||||
| Cactus Wellhead | Pleasanton | TX | — | 144 | 2,908 | — | 3,052 | 71 | 6/12/2014 | 2011 | ||||||||||||||||
| Cadbury Holdings | Whippany | NJ | — | 2,767 | 38,018 | — | 40,785 | 2,054 | 11/5/2013 | 2004 | ||||||||||||||||
| Caleb Brett USA | Deer Park | TX | 2,937 | 588 | 3,210 | — | 3,798 | 141 | 2/21/2014 | 1995 | ||||||||||||||||
| California Pizza Kitchen | Paradise Valley | AZ | — | 2,285 | 1,480 | — | 3,765 | 86 | 2/7/2014 | 1994 | ||||||||||||||||
| California Pizza Kitchen | Alpharetta | GA | — | 1,279 | 3,249 | — | 4,528 | 170 | 2/7/2014 | 1994 | ||||||||||||||||
| California Pizza Kitchen | Atlanta | GA | — | 2,307 | 1,857 | — | 4,164 | 105 | 2/7/2014 | 1993 | ||||||||||||||||
| California Pizza Kitchen | Schaumburg | IL | — | 1,180 | 3,179 | — | 4,359 | 167 | 2/7/2014 | 1995 | ||||||||||||||||
| California Pizza Kitchen | Grapevine | TX | — | 1,544 | 2,250 | — | 3,794 | 120 | 2/7/2014 | 1994 | ||||||||||||||||
| Canon Solutions America, Inc. | Itasca | IL | 10,061 | 3,102 | 10,922 | 10 | 14,034 | 266 | 2/21/2014 | 1974 | ||||||||||||||||
| Capital Region Minority Supplier Development Council | Silver Spring | MD | — | — | 188 | 2,378 | 2,566 | — | 11/5/2013 | 1972 | ||||||||||||||||
| CapNet Securities | Houston | TX | 19,525 | 2,356 | 36,347 | — | 38,703 | 1,993 | 11/5/2013 | 2009 | ||||||||||||||||
| Captain D's | Statesboro | GA | — | 350 | 401 | — | 751 | 32 | 6/27/2013 | 1995 | ||||||||||||||||
| Captain D's | Florence | KY | — | 248 | 325 | — | 573 | 28 | 6/27/2013 | 1981 | ||||||||||||||||
| Captain D's | Southaven | MS | — | 270 | 564 | — | 834 | 46 | 6/27/2013 | 1995 | ||||||||||||||||
| Captain D's | Memphis | TN | — | 230 | 338 | — | 568 | 27 | 6/27/2013 | 1995 | ||||||||||||||||
| Captain D's | Dallas | TX | — | 160 | 535 | — | 695 | 43 | 6/27/2013 | 1995 | ||||||||||||||||
| Captain D's | Duncanville | TX | — | 295 | 246 | — | 541 | 21 | 6/27/2013 | 1982 | ||||||||||||||||
| Captain D's | Grand Prairie | TX | — | 260 | 338 | — | 598 | 27 | 6/27/2013 | 1995 | ||||||||||||||||
| Cargill | Blair | NE | 2,515 | 627 | 4,989 | — | 5,616 | 194 | 2/7/2014 | 2009 | ||||||||||||||||
| Caribou Coffee | Grosse Pointe Woods | MI | — | 140 | 1,046 | — | 1,186 | 85 | 6/27/2013 | 1995 | ||||||||||||||||
| Carlos O’Kelley’s Mexican Café | Mason City | IA | — | 290 | 1,255 | — | 1,545 | 105 | 6/27/2013 | 1995 | ||||||||||||||||
| Carlos O’Kelley’s Mexican Café | Bloomington | IL | — | 270 | 1,375 | — | 1,645 | 115 | 6/27/2013 | 1995 | ||||||||||||||||
| Carl's Jr. | Purcell | OK | — | 77 | 513 | — | 590 | 44 | 6/27/2013 | 1980 | ||||||||||||||||
| CarMax | Henderson | NV | — | 8,542 | 10,396 | — | 18,938 | 509 | 2/7/2014 | 2002 | ||||||||||||||||
| CarMax | Austin | TX | 9,900 | 5,461 | 16,940 | — | 22,401 | 746 | 2/7/2014 | 2004 | ||||||||||||||||
| Carmike Cinemas | Athens | GA | 5,403 | 3,056 | 6,638 | — | 9,694 | 317 | 2/21/2014 | 1999 | ||||||||||||||||
| Carrabba's | Scottsdale | AZ | — | 1,350 | 1,847 | — | 3,197 | 72 | 2/7/2014 | 2000 | ||||||||||||||||
| Carrabba's | Louisville | CO | — | 1,083 | 1,400 | — | 2,483 | 73 | 2/7/2014 | 2000 | ||||||||||||||||
| Carrabba's | Tampa | FL | — | 1,650 | 2,085 | — | 3,735 | 113 | 2/7/2014 | 1994 | ||||||||||||||||
F-112
| Initial Costs | Costs Capitalized Subsequent to Acquisition | Gross Amount Carried at December 31, 2014 (1) (2) | ||||||||||||||||||||||||
| Property | City | State | Encumbrances at December 31, 2014 | Land | Buildings, Fixtures and Improvements | Accumulated Depreciation (3) (4) | Date Acquired | Date of Construction | ||||||||||||||||||
| Carrabba's | Duluth | GA | — | 836 | 2,881 | — | 3,717 | 152 | 2/7/2014 | 2004 | ||||||||||||||||
| Carrabba's | Bowie | MD | — | 1,429 | 1,036 | — | 2,465 | 101 | 2/7/2014 | 2003 | ||||||||||||||||
| Carrabba's | Brooklyn | OH | — | 1,187 | 2,212 | — | 3,399 | 111 | 2/7/2014 | 2002 | ||||||||||||||||
| Carrabba's | Washington Twnshp | OH | — | 906 | 1,859 | — | 2,765 | 102 | 2/7/2014 | 2001 | ||||||||||||||||
| Carrabba's | Columbia | SC | — | 1,159 | 2,164 | — | 3,323 | 112 | 2/7/2014 | 2000 | ||||||||||||||||
| Carrabba's | Johnson City | TN | — | 771 | 2,536 | — | 3,307 | 143 | 2/7/2014 | 2003 | ||||||||||||||||
| Casa Del Rio | Wadsworth | OH | — | 130 | 389 | — | 519 | 34 | 7/31/2013 | 1971 | ||||||||||||||||
| Cashland | Celina | OH | — | 108 | 132 | — | 240 | 11 | 7/31/2013 | 1995 | ||||||||||||||||
| Castle Dental | Murfreesboro | TN | — | 256 | 256 | — | 512 | 22 | 7/31/2013 | 1996 | ||||||||||||||||
| Cequent Trailer Products | Mosinee | WI | 4,334 | 1,799 | 4,635 | — | 6,434 | 204 | 2/21/2014 | 1992 | ||||||||||||||||
| Chappala Mexican Restaurant | Nampa | ID | — | 473 | 692 | — | 1,165 | 61 | 6/27/2013 | 1998 | ||||||||||||||||
| Charleston's | Carmel | IN | — | 140 | 3,016 | — | 3,156 | 252 | 6/27/2013 | 1995 | ||||||||||||||||
| Charter Fitness | Glendale Heights | IL | 4,661 | 1,019 | 3,926 | — | 4,945 | 200 | 2/21/2014 | 1987 | ||||||||||||||||
| Check City | Taylorsville | UT | — | 180 | 953 | — | 1,133 | 80 | 6/27/2013 | 1995 | ||||||||||||||||
| Checkers | Huntsville | AL | — | 689 | — | — | 689 | — | 6/27/2013 | 1995 | ||||||||||||||||
| Checkers | Hollywood | FL | — | 160 | 2,220 | — | 2,380 | 186 | 6/27/2013 | 1995 | ||||||||||||||||
| Checkers | Jacksonville | FL | — | 731 | 1,096 | — | 1,827 | 84 | 7/31/2013 | 1993 | ||||||||||||||||
| Checkers | Lauderhill | FL | — | 280 | 1,951 | — | 2,231 | 163 | 6/27/2013 | 1995 | ||||||||||||||||
| Checkers | Miami | FL | — | 621 | — | — | 621 | — | 7/31/2013 | 1993 | ||||||||||||||||
| Checkers | Orlando | FL | — | 1,033 | — | — | 1,033 | — | 7/31/2013 | 1995 | ||||||||||||||||
| Checkers | Plantation | FL | — | 220 | 1,461 | — | 1,681 | 122 | 6/27/2013 | 1995 | ||||||||||||||||
| Checkers | Tampa | FL | — | 736 | — | — | 736 | — | 6/27/2013 | 1995 | ||||||||||||||||
| Checkers | Fayetteville | GA | — | 681 | — | — | 681 | — | 6/27/2013 | 1995 | ||||||||||||||||
| Chedder's Casual Cafe | Brandon | FL | — | 860 | 3,071 | — | 3,931 | 271 | 6/27/2013 | 2003 | ||||||||||||||||
| Chedder's Casual Cafe | Bolingbrook | IL | — | 1,344 | 1,760 | — | 3,104 | 156 | 6/27/2013 | 1997 | ||||||||||||||||
| Chedder's Casual Cafe | Lubbock | TX | — | 1,053 | 2,345 | — | 3,398 | 207 | 6/27/2013 | 1997 | ||||||||||||||||
| Chevy's | Miami | FL | — | 1,455 | 783 | — | 2,238 | 68 | 7/31/2013 | 1995 | ||||||||||||||||
| Chevy's | Greenbelt | MD | — | 530 | 2,399 | — | 2,929 | 201 | 6/27/2013 | 1995 | ||||||||||||||||
| Chevy's | Lake Oswego | OR | — | 590 | 1,693 | — | 2,283 | 142 | 6/27/2013 | 1995 | ||||||||||||||||
| Chicago Bridge & Iron | Baton Rouge | LA | — | 1,695 | 12,360 | — | 14,055 | 450 | 3/28/2014 | 2006 | ||||||||||||||||
| Chicago Steak & Lemonade | Louisville | KY | — | 195 | 18 | — | 213 | 2 | 6/27/2013 | 1980 | ||||||||||||||||
| Chicago Style Gyros | Nashville | TN | — | 201 | 134 | — | 335 | 10 | 7/31/2013 | 1986 | ||||||||||||||||
F-113
| Initial Costs | Costs Capitalized Subsequent to Acquisition | Gross Amount Carried at December 31, 2014 (1) (2) | ||||||||||||||||||||||||
| Property | City | State | Encumbrances at December 31, 2014 | Land | Buildings, Fixtures and Improvements | Accumulated Depreciation (3) (4) | Date Acquired | Date of Construction | ||||||||||||||||||
| Children's Courtyard | Grand Prairie | TX | — | 367 | 1,055 | — | 1,422 | 50 | 2/7/2014 | 1999 | ||||||||||||||||
| Childtime Childcare | Modesto | CA | — | 280 | 1,524 | — | 1,804 | 70 | 2/7/2014 | 1988 | ||||||||||||||||
| Childtime Childcare | Bedford | OH | — | 111 | 852 | — | 963 | 43 | 2/7/2014 | 1979 | ||||||||||||||||
| Childtime Childcare | Oklahoma City | OK | — | 124 | 796 | — | 920 | 40 | 2/7/2014 | 1985 | ||||||||||||||||
| Childtime Childcare | Oklahoma City | OK | — | 108 | 793 | — | 901 | 38 | 2/7/2014 | 1986 | ||||||||||||||||
| Chilis | Fayetteville | AR | — | 1,370 | 1,714 | — | 3,084 | 143 | 6/27/2013 | 1995 | ||||||||||||||||
| Chilis | Boise | ID | — | 400 | 751 | — | 1,151 | 63 | 6/27/2013 | 1995 | ||||||||||||||||
| Chilis | East Peoria | IL | — | 1,023 | 2,347 | — | 3,370 | 207 | 6/27/2013 | 2003 | ||||||||||||||||
| Chilis | Flanders | NJ | 1,508 | 1,402 | 842 | — | 2,244 | 71 | 2/7/2014 | 2003 | ||||||||||||||||
| Chilis | Mt. Laurel | NJ | 1,447 | 1,332 | 1,792 | — | 3,124 | 65 | 2/7/2014 | 2004 | ||||||||||||||||
| Chilis | Amarillo | TX | — | 811 | 1,893 | — | 2,704 | 164 | 7/31/2013 | 1984 | ||||||||||||||||
| Chilis | Riverdale | UT | — | 800 | 899 | — | 1,699 | 75 | 6/27/2013 | 1995 | ||||||||||||||||
| Chilis | Cheyenne | WY | — | 270 | 815 | — | 1,085 | 68 | 6/27/2013 | 1995 | ||||||||||||||||
| China 1 | Bay City | TX | — | 229 | 124 | — | 353 | 10 | 7/31/2013 | 1985 | ||||||||||||||||
| China Buffet | Alvin | TX | — | 110 | 299 | — | 409 | 26 | 6/27/2013 | 1982 | ||||||||||||||||
| China Buffet | Angleton | TX | — | 127 | 272 | — | 399 | 24 | 6/27/2013 | 1982 | ||||||||||||||||
| China King | Belen | NM | — | 94 | 94 | — | 188 | 8 | 6/27/2013 | 1980 | ||||||||||||||||
| Chipper's Grill | Streator | IL | — | 190 | 255 | — | 445 | 21 | 6/27/2013 | 1995 | ||||||||||||||||
| Church's Chicken | Atmore | AL | — | 144 | 574 | — | 718 | 44 | 7/31/2013 | 1976 | ||||||||||||||||
| Church's Chicken | Bay Minette | AL | — | 134 | 757 | — | 891 | 58 | 7/31/2013 | 2003 | ||||||||||||||||
| Church's Chicken | Flomaton | AL | — | 173 | 518 | — | 691 | 40 | 7/31/2013 | 1981 | ||||||||||||||||
| Church's Chicken | Jackson | AL | — | 127 | 719 | — | 846 | 55 | 7/31/2013 | 1982 | ||||||||||||||||
| Church's Chicken | Orlando | FL | — | 254 | 380 | — | 634 | 29 | 7/31/2013 | 1984 | ||||||||||||||||
| Church's Chicken | Augusta | GA | — | 178 | 533 | — | 711 | 41 | 7/31/2013 | 1981 | ||||||||||||||||
| Church's Chicken | Augusta | GA | — | 256 | 597 | — | 853 | 46 | 7/31/2013 | 1976 | ||||||||||||||||
| Church's Chicken | Augusta | GA | — | 178 | 414 | — | 592 | 32 | 7/31/2013 | 1978 | ||||||||||||||||
| Church's Chicken | Augusta | GA | — | 196 | 458 | — | 654 | 35 | 7/31/2013 | 1984 | ||||||||||||||||
| Church's Chicken | Bowling Green | KY | — | 100 | 156 | — | 256 | 13 | 6/27/2013 | 1984 | ||||||||||||||||
| Church's Chicken | Anderson | SC | — | 647 | 277 | — | 924 | 21 | 7/31/2013 | 1981 | ||||||||||||||||
| Church's Chicken | Charleston | SC | — | 421 | 344 | — | 765 | 26 | 7/31/2013 | 1973 | ||||||||||||||||
| Church's Chicken | Charleston | SC | — | 500 | 167 | — | 667 | 13 | 7/31/2013 | 1979 | ||||||||||||||||
| Church's Chicken | Columbia | SC | — | 437 | 437 | — | 874 | 34 | 7/31/2013 | 1978 | ||||||||||||||||
F-114
| Initial Costs | Costs Capitalized Subsequent to Acquisition | Gross Amount Carried at December 31, 2014 (1) (2) | ||||||||||||||||||||||||
| Property | City | State | Encumbrances at December 31, 2014 | Land | Buildings, Fixtures and Improvements | Accumulated Depreciation (3) (4) | Date Acquired | Date of Construction | ||||||||||||||||||
| Church's Chicken | Columbia | SC | — | 231 | 428 | — | 659 | 33 | 7/31/2013 | 1977 | ||||||||||||||||
| Church's Chicken | Greenville | SC | — | 280 | 342 | — | 622 | 26 | 7/31/2013 | 1970 | ||||||||||||||||
| Church's Chicken | Greenville | SC | — | 254 | 472 | — | 726 | 36 | 7/31/2013 | 2009 | ||||||||||||||||
| Church's Chicken | Greenville | SC | — | 325 | 487 | — | 812 | 37 | 7/31/2013 | 1984 | ||||||||||||||||
| Church's Chicken | Greenwood | SC | — | 188 | 349 | — | 537 | 27 | 7/31/2013 | 2002 | ||||||||||||||||
| Church's Chicken | North Charleston | SC | — | 302 | 302 | — | 604 | 23 | 7/31/2013 | 1976 | ||||||||||||||||
| Church's Chicken | North Charleston | SC | — | 407 | 407 | — | 814 | 31 | 7/31/2013 | 1977 | ||||||||||||||||
| Church's Chicken | Orangeburg | SC | — | 407 | 271 | — | 678 | 21 | 7/31/2013 | 1985 | ||||||||||||||||
| Church's Chicken | Spartanburg | SC | — | 411 | 274 | — | 685 | 21 | 7/31/2013 | 1972 | ||||||||||||||||
| Church's Chicken | Spartanburg | SC | — | 350 | 525 | — | 875 | 40 | 7/31/2013 | 1978 | ||||||||||||||||
| Church's Chicken | Nashville | TN | — | 186 | 186 | — | 372 | 14 | 7/31/2013 | 1980 | ||||||||||||||||
| Cigna | Phoenix | AZ | — | 6,194 | 16,215 | — | 22,409 | 682 | 2/7/2014 | 2012 | ||||||||||||||||
| Cigna | Plano | TX | — | 10,036 | 42,676 | — | 52,712 | 1,815 | 2/7/2014 | 2009 | ||||||||||||||||
| Cimarex Energy | Tulsa | OK | 29,954 | 1,253 | 70,274 | 974 | 72,501 | 3,714 | 11/5/2013 | 1995 | ||||||||||||||||
| CineMagic Theatre | Rochester | MN | — | 677 | 2,706 | — | 3,383 | 95 | 5/19/2014 | 2002 | ||||||||||||||||
| Circle K | Phoenix | AZ | — | 344 | 1,377 | — | 1,721 | 203 | 5/4/2012 | 1986 | ||||||||||||||||
| Circle K | Martinez | GA | — | 348 | 813 | — | 1,161 | 108 | 8/28/2012 | 2003 | ||||||||||||||||
| Circle K | Martinez | GA | — | 293 | 329 | — | 622 | 7 | 9/26/2014 | 1993 | ||||||||||||||||
| Circle K | Thomson | GA | — | 637 | 340 | — | 977 | 8 | 9/26/2014 | 1990 | ||||||||||||||||
| Circle K | Akron | OH | — | 675 | 1,254 | — | 1,929 | 161 | 9/27/2012 | 1996 | ||||||||||||||||
| Citizens Bank | Colchester | CT | — | 185 | 1,049 | — | 1,234 | 129 | 9/28/2012 | 2012 | ||||||||||||||||
| Citizens Bank | Deep River | CT | — | 453 | 1,812 | — | 2,265 | 223 | 9/28/2012 | 1851 | ||||||||||||||||
| Citizens Bank | East Hampton | CT | 765 | 312 | 935 | — | 1,247 | 136 | 4/26/2012 | 1984 | ||||||||||||||||
| Citizens Bank | East Lyme | CT | — | 258 | 1,032 | — | 1,290 | 127 | 9/28/2012 | 1972 | ||||||||||||||||
| Citizens Bank | Hamden | CT | — | 581 | 475 | — | 1,056 | 58 | 9/28/2012 | 1995 | ||||||||||||||||
| Citizens Bank | Higganum | CT | 631 | 171 | 971 | — | 1,142 | 276 | 8/1/2010 | 1995 | ||||||||||||||||
| Citizens Bank | Montville | CT | — | 413 | 2,342 | — | 2,755 | 288 | 9/28/2012 | 1984 | ||||||||||||||||
| Citizens Bank | New London | CT | — | 94 | 534 | — | 628 | 152 | 8/1/2010 | 1995 | ||||||||||||||||
| Citizens Bank | Stonington | CT | — | 190 | 1,079 | — | 1,269 | 133 | 9/28/2012 | 1984 | ||||||||||||||||
| Citizens Bank | Stonington | CT | — | 104 | 937 | — | 1,041 | 102 | 12/14/2012 | 1982 | ||||||||||||||||
| Citizens Bank | Lewes | DE | — | 102 | 916 | — | 1,018 | 92 | 2/22/2013 | 1968 | ||||||||||||||||
| Citizens Bank | Smyrna | DE | 674 | 183 | 1,036 | — | 1,219 | 286 | 8/1/2010 | 1995 | ||||||||||||||||
F-115
| Initial Costs | Costs Capitalized Subsequent to Acquisition | Gross Amount Carried at December 31, 2014 (1) (2) | ||||||||||||||||||||||||
| Property | City | State | Encumbrances at December 31, 2014 | Land | Buildings, Fixtures and Improvements | Accumulated Depreciation (3) (4) | Date Acquired | Date of Construction | ||||||||||||||||||
| Citizens Bank | Wilmington | DE | 431 | 250 | 464 | — | 714 | 67 | 4/26/2012 | 1950 | ||||||||||||||||
| Citizens Bank | Wilmington | DE | 366 | 299 | 299 | — | 598 | 43 | 4/26/2012 | 1967 | ||||||||||||||||
| Citizens Bank | Alsip | IL | — | 226 | 1,280 | — | 1,506 | 364 | 8/1/2010 | 1981 | ||||||||||||||||
| Citizens Bank | Calumet City | IL | 334 | 168 | 393 | — | 561 | 57 | 4/26/2012 | 1975 | ||||||||||||||||
| Citizens Bank | Chicago | IL | 172 | 189 | 81 | — | 270 | 12 | 4/26/2012 | 1990 | ||||||||||||||||
| Citizens Bank | Chicago | IL | — | 267 | 1,511 | — | 1,778 | 430 | 8/1/2010 | 1923 | ||||||||||||||||
| Citizens Bank | Chicago | IL | — | 191 | 1,082 | — | 1,273 | 308 | 8/1/2010 | 1979 | ||||||||||||||||
| Citizens Bank | Chicago Heights | IL | — | 182 | 1,637 | — | 1,819 | 172 | 1/24/2013 | 1996 | ||||||||||||||||
| Citizens Bank | Elmwood Park | IL | — | 431 | 2,441 | — | 2,872 | 660 | 8/1/2010 | 1984 | ||||||||||||||||
| Citizens Bank | Evergreen Park | IL | — | 167 | 944 | — | 1,111 | 269 | 8/1/2010 | 1984 | ||||||||||||||||
| Citizens Bank | Lyons | IL | — | 214 | 1,212 | — | 1,426 | 345 | 8/1/2010 | 1959 | ||||||||||||||||
| Citizens Bank | Olympia Fields | IL | 1,292 | 426 | 1,704 | — | 2,130 | 247 | 4/26/2012 | 1974 | ||||||||||||||||
| Citizens Bank | Orland Hills | IL | 2,646 | 1,253 | 2,327 | — | 3,580 | 255 | 12/14/2012 | 1995 | ||||||||||||||||
| Citizens Bank | Westchester | IL | — | 366 | 853 | — | 1,219 | 86 | 2/22/2013 | 1986 | ||||||||||||||||
| Citizens Bank | Wilmington | IL | — | 330 | 1,872 | — | 2,202 | 496 | 8/1/2010 | 1966 | ||||||||||||||||
| Citizens Bank | Dorchester | MA | 485 | 386 | 386 | — | 772 | 56 | 4/26/2012 | 1960 | ||||||||||||||||
| Citizens Bank | Ludlow | MA | — | 810 | 540 | — | 1,350 | 66 | 9/28/2012 | 1995 | ||||||||||||||||
| Citizens Bank | Malden | MA | — | 488 | 596 | — | 1,084 | 73 | 9/28/2012 | 1920 | ||||||||||||||||
| Citizens Bank | Malden | MA | 1,697 | 484 | 1,935 | — | 2,419 | 238 | 9/28/2012 | 1988 | ||||||||||||||||
| Citizens Bank | Medford | MA | 1,194 | 589 | 1,094 | — | 1,683 | 134 | 9/28/2012 | 1938 | ||||||||||||||||
| Citizens Bank | Milton | MA | 2,244 | 619 | 2,476 | — | 3,095 | 271 | 12/14/2012 | 1968 | ||||||||||||||||
| Citizens Bank | New Bedford | MA | — | 297 | 694 | — | 991 | 85 | 9/28/2012 | 1983 | ||||||||||||||||
| Citizens Bank | Randolph | MA | 1,383 | 480 | 1,439 | — | 1,919 | 177 | 9/28/2012 | 1979 | ||||||||||||||||
| Citizens Bank | Somerville | MA | — | 561 | 561 | — | 1,122 | 69 | 9/28/2012 | 1940 | ||||||||||||||||
| Citizens Bank | South Dennis | MA | — | — | 1,294 | — | 1,294 | 142 | 12/14/2012 | 1986 | ||||||||||||||||
| Citizens Bank | Springfield | MA | — | 187 | 747 | — | 934 | 65 | 5/10/2013 | 1975 | ||||||||||||||||
| Citizens Bank | Tewksbury | MA | 813 | 266 | 1,063 | — | 1,329 | 154 | 4/26/2012 | 1998 | ||||||||||||||||
| Citizens Bank | Wilbraham | MA | 458 | 148 | 591 | — | 739 | 86 | 4/26/2012 | 1967 | ||||||||||||||||
| Citizens Bank | Winthrop | MA | — | 390 | 724 | — | 1,114 | 89 | 9/28/2012 | 1974 | ||||||||||||||||
| Citizens Bank | Woburn | MA | — | 350 | 816 | — | 1,166 | 89 | 12/14/2012 | 1991 | ||||||||||||||||
| Citizens Bank | Clinton Township | MI | — | 574 | 3,250 | — | 3,824 | 930 | 8/1/2010 | 1970 | ||||||||||||||||
F-116
| Initial Costs | Costs Capitalized Subsequent to Acquisition | Gross Amount Carried at December 31, 2014 (1) (2) | ||||||||||||||||||||||||
| Property | City | State | Encumbrances at December 31, 2014 | Land | Buildings, Fixtures and Improvements | Accumulated Depreciation (3) (4) | Date Acquired | Date of Construction | ||||||||||||||||||
| Citizens Bank | Dearborn | MI | — | 434 | 2,461 | — | 2,895 | 652 | 8/1/2010 | 1977 | ||||||||||||||||
| Citizens Bank | Dearborn | MI | — | 385 | 2,184 | — | 2,569 | 579 | 8/1/2010 | 1974 | ||||||||||||||||
| Citizens Bank | Detroit | MI | — | 112 | 636 | — | 748 | 183 | 8/1/2010 | 1958 | ||||||||||||||||
| Citizens Bank | Detroit | MI | — | 204 | 1,159 | — | 1,363 | 334 | 8/1/2010 | 1956 | ||||||||||||||||
| Citizens Bank | Farmington | MI | — | 303 | 707 | — | 1,010 | 77 | 12/14/2012 | 1962 | ||||||||||||||||
| Citizens Bank | Grosse Pointe | MI | — | 410 | 2,322 | — | 2,732 | 652 | 8/1/2010 | 1975 | ||||||||||||||||
| Citizens Bank | Harper Woods | MI | — | 207 | 1,171 | — | 1,378 | 337 | 8/1/2010 | 1982 | ||||||||||||||||
| Citizens Bank | Highland Park | MI | — | 150 | 848 | — | 998 | 244 | 8/1/2010 | 1967 | ||||||||||||||||
| Citizens Bank | Lathrup Village | MI | — | 283 | 1,602 | — | 1,885 | 456 | 8/1/2010 | 1980 | ||||||||||||||||
| Citizens Bank | Livonia | MI | — | 261 | 1,476 | — | 1,737 | 425 | 8/1/2010 | 1959 | ||||||||||||||||
| Citizens Bank | Richmond | MI | — | 168 | 951 | — | 1,119 | 274 | 8/1/2010 | 1980 | ||||||||||||||||
| Citizens Bank | Southfield | MI | — | 283 | 1,605 | — | 1,888 | 459 | 8/1/2010 | 1975 | ||||||||||||||||
| Citizens Bank | St. Clair Shores | MI | — | 309 | 1,748 | — | 2,057 | 503 | 8/1/2010 | 1960 | ||||||||||||||||
| Citizens Bank | Troy | MI | — | 312 | 935 | — | 1,247 | 102 | 12/14/2012 | 1980 | ||||||||||||||||
| Citizens Bank | Utica | MI | — | 376 | 2,133 | — | 2,509 | 599 | 8/1/2010 | 1982 | ||||||||||||||||
| Citizens Bank | Warren | MI | — | 178 | 1,009 | — | 1,187 | 287 | 8/1/2010 | 1963 | ||||||||||||||||
| Citizens Bank | Keene | NH | 1,885 | 132 | 2,511 | — | 2,643 | 275 | 12/14/2012 | 1900 | ||||||||||||||||
| Citizens Bank | Manchester | NH | — | 640 | 782 | — | 1,422 | 96 | 9/28/2012 | 1941 | ||||||||||||||||
| Citizens Bank | Manchester | NH | — | — | 1,568 | — | 1,568 | 172 | 12/14/2012 | 1995 | ||||||||||||||||
| Citizens Bank | Ossipee | NH | 269 | 176 | 264 | — | 440 | 38 | 4/26/2012 | 1980 | ||||||||||||||||
| Citizens Bank | Pelham | NH | 280 | 113 | 340 | — | 453 | 49 | 4/26/2012 | 1983 | ||||||||||||||||
| Citizens Bank | Pittsfield | NH | — | 160 | 908 | — | 1,068 | 258 | 8/1/2010 | 1976 | ||||||||||||||||
| Citizens Bank | Rollinsford | NH | — | 78 | 444 | — | 522 | 126 | 8/1/2010 | 1977 | ||||||||||||||||
| Citizens Bank | Salem | NH | — | 328 | 1,312 | — | 1,640 | 144 | 12/14/2012 | 1980 | ||||||||||||||||
| Citizens Bank | Haddon Heights | NJ | — | 316 | 948 | — | 1,264 | 74 | 7/23/2013 | 1965 | ||||||||||||||||
| Citizens Bank | Marlton | NJ | 781 | 444 | 825 | — | 1,269 | 120 | 4/26/2012 | 1988 | ||||||||||||||||
| Citizens Bank | Albany | NY | 823 | 232 | 1,315 | — | 1,547 | 348 | 8/1/2010 | 1960 | ||||||||||||||||
| Citizens Bank | Amherst | NY | 881 | 238 | 1,348 | — | 1,586 | 364 | 8/1/2010 | 1965 | ||||||||||||||||
F-117
| Initial Costs | Costs Capitalized Subsequent to Acquisition | Gross Amount Carried at December 31, 2014 (1) (2) | ||||||||||||||||||||||||
| Property | City | State | Encumbrances at December 31, 2014 | Land | Buildings, Fixtures and Improvements | Accumulated Depreciation (3) (4) | Date Acquired | Date of Construction | ||||||||||||||||||
| Citizens Bank | East Aurora | NY | 599 | 162 | 919 | — | 1,081 | 248 | 8/1/2010 | 1996 | ||||||||||||||||
| Citizens Bank | Greene | NY | 768 | 216 | 1,227 | — | 1,443 | 325 | 8/1/2010 | 1981 | ||||||||||||||||
| Citizens Bank | Johnstown | NY | 578 | 163 | 923 | — | 1,086 | 245 | 8/1/2010 | 1973 | ||||||||||||||||
| Citizens Bank | Port Jervis | NY | 531 | 143 | 811 | — | 954 | 224 | 8/1/2010 | 1995 | ||||||||||||||||
| Citizens Bank | Rochester | NY | 616 | 166 | 943 | — | 1,109 | 255 | 8/1/2010 | 1962 | ||||||||||||||||
| Citizens Bank | Schenectady | NY | 1,036 | 292 | 1,655 | — | 1,947 | 439 | 8/1/2010 | 1974 | ||||||||||||||||
| Citizens Bank | Vails Gate | NY | 1,008 | 284 | 1,610 | — | 1,894 | 427 | 8/1/2010 | 1995 | ||||||||||||||||
| Citizens Bank | Whitesboro | NY | 463 | 130 | 739 | — | 869 | 196 | 8/1/2010 | 1995 | ||||||||||||||||
| Citizens Bank | Alliance | OH | — | 204 | 1,156 | — | 1,360 | 335 | 8/1/2010 | 1972 | ||||||||||||||||
| Citizens Bank | Bedford | OH | 533 | 175 | 699 | — | 874 | 101 | 4/26/2012 | 2005 | ||||||||||||||||
| Citizens Bank | Boardman | OH | — | 280 | 1,589 | — | 1,869 | 460 | 8/1/2010 | 1984 | ||||||||||||||||
| Citizens Bank | Broadview Heights | OH | — | 201 | 1,140 | — | 1,341 | 314 | 8/1/2010 | 1982 | ||||||||||||||||
| Citizens Bank | Brunswick | OH | — | 186 | 1,057 | — | 1,243 | 306 | 8/1/2010 | 2004 | ||||||||||||||||
| Citizens Bank | Cleveland | OH | — | 239 | 1,357 | — | 1,596 | 393 | 8/1/2010 | 1973 | ||||||||||||||||
| Citizens Bank | Cleveland | OH | — | 210 | 1,190 | — | 1,400 | 345 | 8/1/2010 | 1950 | ||||||||||||||||
| Citizens Bank | Cleveland | OH | — | 182 | 1,031 | — | 1,213 | 299 | 8/1/2010 | 1930 | ||||||||||||||||
| Citizens Bank | Fairlawn | OH | 1,885 | 511 | 2,045 | — | 2,556 | 224 | 12/14/2012 | 1979 | ||||||||||||||||
| Citizens Bank | Lakewood | OH | — | 196 | 1,111 | — | 1,307 | 294 | 8/1/2010 | 1985 | ||||||||||||||||
| Citizens Bank | Louisville | OH | — | 191 | 1,080 | — | 1,271 | 313 | 8/1/2010 | 1960 | ||||||||||||||||
| Citizens Bank | Massillon | OH | — | 287 | 1,624 | — | 1,911 | 470 | 8/1/2010 | 1995 | ||||||||||||||||
| Citizens Bank | Massillon | OH | — | 212 | 1,202 | — | 1,414 | 348 | 8/1/2010 | 1958 | ||||||||||||||||
| Citizens Bank | Mentor | OH | — | 178 | 1,011 | — | 1,189 | 288 | 8/1/2010 | 1976 | ||||||||||||||||
| Citizens Bank | Northfield | OH | — | 317 | 1,797 | — | 2,114 | 511 | 8/1/2010 | 1969 | ||||||||||||||||
| Citizens Bank | Parma | OH | 608 | 248 | 744 | — | 992 | 108 | 4/26/2012 | 1972 | ||||||||||||||||
| Citizens Bank | Parma | OH | — | 475 | 581 | — | 1,056 | 64 | 12/14/2012 | 1971 | ||||||||||||||||
| Citizens Bank | Parma Heights | OH | — | 426 | 638 | — | 1,064 | 70 | 12/14/2012 | 1957 | ||||||||||||||||
| Citizens Bank | Rocky River | OH | — | 283 | 1,602 | — | 1,885 | 424 | 8/1/2010 | 1972 | ||||||||||||||||
| Citizens Bank | South Russell | OH | — | 106 | 957 | — | 1,063 | 105 | 12/14/2012 | 1981 | ||||||||||||||||
F-118
| Initial Costs | Costs Capitalized Subsequent to Acquisition | Gross Amount Carried at December 31, 2014 (1) (2) | ||||||||||||||||||||||||
| Property | City | State | Encumbrances at December 31, 2014 | Land | Buildings, Fixtures and Improvements | Accumulated Depreciation (3) (4) | Date Acquired | Date of Construction | ||||||||||||||||||
| Citizens Bank | Wadsworth | OH | — | 158 | 893 | — | 1,051 | 259 | 8/1/2010 | 1960 | ||||||||||||||||
| Citizens Bank | Willoughby | OH | — | 395 | 2,239 | — | 2,634 | 637 | 8/1/2010 | 1920 | ||||||||||||||||
| Citizens Bank | Aliquippa | PA | — | 138 | 782 | — | 920 | 86 | 12/14/2012 | 1953 | ||||||||||||||||
| Citizens Bank | Allison Park | PA | — | 314 | 733 | — | 1,047 | 90 | 9/28/2012 | 1972 | ||||||||||||||||
| Citizens Bank | Altoona | PA | — | 153 | 459 | — | 612 | 50 | 12/14/2012 | 1971 | ||||||||||||||||
| Citizens Bank | Ambridge | PA | 762 | 215 | 1,217 | — | 1,432 | 322 | 8/1/2010 | 1925 | ||||||||||||||||
| Citizens Bank | Ashley | PA | — | 225 | 675 | — | 900 | 74 | 12/14/2012 | 1928 | ||||||||||||||||
| Citizens Bank | Beaver Falls | PA | — | 138 | 553 | — | 691 | 68 | 9/28/2012 | 1995 | ||||||||||||||||
| Citizens Bank | Butler | PA | — | 286 | 1,144 | — | 1,430 | 125 | 12/14/2012 | 1966 | ||||||||||||||||
| Citizens Bank | Camp Hill | PA | — | 430 | 645 | — | 1,075 | 71 | 12/14/2012 | 1971 | ||||||||||||||||
| Citizens Bank | Carlisle | PA | 468 | 234 | 546 | — | 780 | 79 | 4/26/2012 | 1960 | ||||||||||||||||
| Citizens Bank | Carnegie | PA | — | 73 | 1,396 | — | 1,469 | 153 | 12/14/2012 | 1920 | ||||||||||||||||
| Citizens Bank | Dallas | PA | — | 213 | 1,205 | — | 1,418 | 148 | 9/28/2012 | 1949 | ||||||||||||||||
| Citizens Bank | Dillsburg | PA | — | 232 | 926 | — | 1,158 | 101 | 12/14/2012 | 1935 | ||||||||||||||||
| Citizens Bank | Drexel Hill | PA | — | 266 | 1,064 | — | 1,330 | 116 | 12/14/2012 | 1950 | ||||||||||||||||
| Citizens Bank | Erie | PA | — | 168 | 671 | — | 839 | 73 | 12/14/2012 | 1954 | ||||||||||||||||
| Citizens Bank | Ford City | PA | — | 89 | 802 | — | 891 | 88 | 12/14/2012 | 1975 | ||||||||||||||||
| Citizens Bank | Glenside | PA | 1,257 | 343 | 1,370 | — | 1,713 | 119 | 5/22/2013 | 1958 | ||||||||||||||||
| Citizens Bank | Greensburg | PA | — | 45 | 861 | — | 906 | 94 | 12/14/2012 | 1957 | ||||||||||||||||
| Citizens Bank | Grove City | PA | 323 | 292 | 239 | — | 531 | 35 | 4/26/2012 | 1977 | ||||||||||||||||
| Citizens Bank | Grove City | PA | 506 | 41 | 782 | — | 823 | 114 | 4/26/2012 | 1920 | ||||||||||||||||
| Citizens Bank | Harrisburg | PA | 560 | 512 | 419 | — | 931 | 61 | 4/26/2012 | 1967 | ||||||||||||||||
| Citizens Bank | Havertown | PA | — | 219 | 875 | — | 1,094 | 107 | 9/28/2012 | 2003 | ||||||||||||||||
| Citizens Bank | Highspire | PA | — | 216 | 649 | — | 865 | 71 | 12/14/2012 | 1974 | ||||||||||||||||
| Citizens Bank | Homestead | PA | — | 202 | 807 | — | 1,009 | 99 | 9/28/2012 | 1960 | ||||||||||||||||
| Citizens Bank | Kingston | PA | — | 404 | 943 | — | 1,347 | 103 | 12/14/2012 | 1977 | ||||||||||||||||
| Citizens Bank | Kittanning | PA | — | 56 | 1,060 | — | 1,116 | 116 | 12/14/2012 | 1889 | ||||||||||||||||
| Citizens Bank | Kutztown | PA | 490 | 81 | 725 | — | 806 | 102 | 5/11/2012 | 1974 | ||||||||||||||||
F-119
| Initial Costs | Costs Capitalized Subsequent to Acquisition | Gross Amount Carried at December 31, 2014 (1) (2) | ||||||||||||||||||||||||
| Property | City | State | Encumbrances at December 31, 2014 | Land | Buildings, Fixtures and Improvements | Accumulated Depreciation (3) (4) | Date Acquired | Date of Construction | ||||||||||||||||||
| Citizens Bank | Lancaster | PA | 555 | 368 | 552 | — | 920 | 80 | 4/26/2012 | 1965 | ||||||||||||||||
| Citizens Bank | Lancaster | PA | — | 383 | 468 | — | 851 | 57 | 9/28/2012 | 1967 | ||||||||||||||||
| Citizens Bank | Latrobe | PA | — | 148 | 591 | — | 739 | 65 | 12/14/2012 | 1969 | ||||||||||||||||
| Citizens Bank | Lititz | PA | 458 | 37 | 708 | — | 745 | 103 | 4/26/2012 | 1923 | ||||||||||||||||
| Citizens Bank | Lower Burrell | PA | — | 180 | 722 | — | 902 | 79 | 12/14/2012 | 1980 | ||||||||||||||||
| Citizens Bank | Matamoras | PA | — | 509 | 946 | — | 1,455 | 103 | 12/14/2012 | 1920 | ||||||||||||||||
| Citizens Bank | Mechanicsburg | PA | 1,620 | 288 | 2,590 | — | 2,878 | 318 | 9/28/2012 | 1900 | ||||||||||||||||
| Citizens Bank | Mercer | PA | — | 105 | 314 | — | 419 | 34 | 12/14/2012 | 1964 | ||||||||||||||||
| Citizens Bank | Milford | PA | — | 513 | 769 | — | 1,282 | 84 | 12/14/2012 | 1981 | ||||||||||||||||
| Citizens Bank | Monesson | PA | 703 | 198 | 1,123 | — | 1,321 | 298 | 8/1/2010 | 1930 | ||||||||||||||||
| Citizens Bank | Mount Lebanon | PA | 1,577 | 215 | 1,939 | — | 2,154 | 238 | 9/28/2012 | 1960 | ||||||||||||||||
| Citizens Bank | Mountain Top | PA | — | 111 | 631 | — | 742 | 69 | 12/14/2012 | 1980 | ||||||||||||||||
| Citizens Bank | Munhall | PA | 232 | 191 | 191 | — | 382 | 28 | 4/26/2012 | 1973 | ||||||||||||||||
| Citizens Bank | Narberth | PA | 1,491 | 420 | 2,381 | — | 2,801 | 631 | 8/1/2010 | 1935 | ||||||||||||||||
| Citizens Bank | New Stanton | PA | 581 | 330 | 612 | — | 942 | 89 | 4/26/2012 | 1975 | ||||||||||||||||
| Citizens Bank | Oakmont | PA | — | 199 | 1,127 | — | 1,326 | 123 | 12/14/2012 | 1967 | ||||||||||||||||
| Citizens Bank | Oil City | PA | — | 110 | 623 | — | 733 | 68 | 12/14/2012 | 1965 | ||||||||||||||||
| Citizens Bank | Philadelphia | PA | 565 | 184 | 735 | — | 919 | 107 | 4/26/2012 | 1904 | ||||||||||||||||
| Citizens Bank | Philadelphia | PA | — | 127 | 722 | — | 849 | 79 | 12/14/2012 | 1920 | ||||||||||||||||
| Citizens Bank | Philadelphia | PA | — | 266 | 1,065 | — | 1,331 | 117 | 12/14/2012 | 1971 | ||||||||||||||||
| Citizens Bank | Pitcairn | PA | — | 46 | 867 | — | 913 | 95 | 12/14/2012 | 1985 | ||||||||||||||||
| Citizens Bank | Pittsburgh | PA | — | 215 | 1,219 | — | 1,434 | 150 | 9/28/2012 | 1970 | ||||||||||||||||
| Citizens Bank | Pittsburgh | PA | — | 256 | 767 | — | 1,023 | 94 | 9/28/2012 | 1970 | ||||||||||||||||
| Citizens Bank | Pittsburgh | PA | — | 185 | 1,051 | — | 1,236 | 115 | 12/14/2012 | 1960 | ||||||||||||||||
| Citizens Bank | Pittsburgh | PA | — | 389 | 1,168 | — | 1,557 | 128 | 12/14/2012 | 1940 | ||||||||||||||||
| Citizens Bank | Pittsburgh | PA | — | 146 | 2,770 | — | 2,916 | 303 | 12/14/2012 | 1900 | ||||||||||||||||
| Citizens Bank | Pittsburgh | PA | 2,262 | 470 | 2,661 | — | 3,131 | 291 | 12/14/2012 | 1979 | ||||||||||||||||
| Citizens Bank | Pittsburgh | PA | 1,244 | 516 | 1,204 | — | 1,720 | 132 | 12/14/2012 | 1970 | ||||||||||||||||
F-120
| Initial Costs | Costs Capitalized Subsequent to Acquisition | Gross Amount Carried at December 31, 2014 (1) (2) | ||||||||||||||||||||||||
| Property | City | State | Encumbrances at December 31, 2014 | Land | Buildings, Fixtures and Improvements | Accumulated Depreciation (3) (4) | Date Acquired | Date of Construction | ||||||||||||||||||
| Citizens Bank | Pittsburgh | PA | — | 206 | 1,852 | — | 2,058 | 203 | 12/14/2012 | 1923 | ||||||||||||||||
| Citizens Bank | Pittsburgh | PA | 918 | 196 | 1,110 | — | 1,306 | 121 | 12/14/2012 | 1980 | ||||||||||||||||
| Citizens Bank | Pittsburgh | PA | — | 255 | 1,019 | — | 1,274 | 111 | 12/14/2012 | 1970 | ||||||||||||||||
| Citizens Bank | Pittsburgh | PA | — | 268 | 2,413 | — | 2,681 | 264 | 12/14/2012 | 1970 | ||||||||||||||||
| Citizens Bank | Reading | PA | — | 269 | 1,524 | — | 1,793 | 139 | 4/12/2013 | 1904 | ||||||||||||||||
| Citizens Bank | Reading | PA | — | 267 | 802 | — | 1,069 | 88 | 12/14/2012 | 1970 | ||||||||||||||||
| Citizens Bank | Shippensburg | PA | 345 | 143 | 429 | — | 572 | 62 | 4/26/2012 | 1985 | ||||||||||||||||
| Citizens Bank | Slovan | PA | 205 | 217 | 117 | — | 334 | 17 | 4/26/2012 | 1975 | ||||||||||||||||
| Citizens Bank | State College | PA | 452 | 256 | 475 | — | 731 | 69 | 4/26/2012 | 1966 | ||||||||||||||||
| Citizens Bank | Temple | PA | — | 268 | 626 | — | 894 | 77 | 9/28/2012 | 1936 | ||||||||||||||||
| Citizens Bank | Turtle Creek | PA | — | 308 | 923 | — | 1,231 | 113 | 9/28/2012 | 1970 | ||||||||||||||||
| Citizens Bank | Tyrone | PA | — | 146 | 583 | — | 729 | 64 | 12/14/2012 | 1967 | ||||||||||||||||
| Citizens Bank | Upper Darby | PA | — | 411 | 617 | — | 1,028 | 67 | 12/14/2012 | 1966 | ||||||||||||||||
| Citizens Bank | Verona | PA | 549 | 264 | 616 | — | 880 | 89 | 4/26/2012 | 1972 | ||||||||||||||||
| Citizens Bank | Warrendale | PA | — | 611 | 916 | — | 1,527 | 100 | 12/14/2012 | 1981 | ||||||||||||||||
| Citizens Bank | West Grove | PA | 544 | 181 | 725 | — | 906 | 105 | 4/26/2012 | 1880 | ||||||||||||||||
| Citizens Bank | West Hazleton | PA | — | 279 | 2,509 | — | 2,788 | 308 | 9/28/2012 | 1900 | ||||||||||||||||
| Citizens Bank | Wexford | PA | — | 180 | 719 | — | 899 | 79 | 12/14/2012 | 1975 | ||||||||||||||||
| Citizens Bank | York | PA | 581 | 337 | 626 | — | 963 | 91 | 4/26/2012 | 1955 | ||||||||||||||||
| Citizens Bank | Coventry | RI | — | 559 | 559 | — | 1,118 | 69 | 9/28/2012 | 1968 | ||||||||||||||||
| Citizens Bank | Cranston | RI | — | 411 | 1,234 | — | 1,645 | 135 | 12/14/2012 | 1967 | ||||||||||||||||
| Citizens Bank | East Greenwich | RI | — | 227 | 680 | — | 907 | 74 | 12/14/2012 | 1959 | ||||||||||||||||
| Citizens Bank | Johnston | RI | — | 343 | 1,030 | — | 1,373 | 127 | 9/28/2012 | 1972 | ||||||||||||||||
| Citizens Bank | N. Providence | RI | 1,445 | 200 | 1,800 | — | 2,000 | 197 | 12/31/2012 | 1971 | ||||||||||||||||
| Citizens Bank | N. Providence | RI | — | 223 | 892 | — | 1,115 | 98 | 12/14/2012 | 1971 | ||||||||||||||||
| Citizens Bank | Providence | RI | — | 300 | 899 | — | 1,199 | 98 | 12/14/2012 | 1960 | ||||||||||||||||
| Citizens Bank | Rumford | RI | — | 352 | 654 | — | 1,006 | 72 | 12/14/2012 | 1977 | ||||||||||||||||
| Citizens Bank | Wakefield | RI | — | 517 | 959 | — | 1,476 | 118 | 9/28/2012 | 1976 | ||||||||||||||||
F-121
| Initial Costs | Costs Capitalized Subsequent to Acquisition | Gross Amount Carried at December 31, 2014 (1) (2) | ||||||||||||||||||||||||
| Property | City | State | Encumbrances at December 31, 2014 | Land | Buildings, Fixtures and Improvements | Accumulated Depreciation (3) (4) | Date Acquired | Date of Construction | ||||||||||||||||||
| Citizens Bank | Warren | RI | — | 328 | 609 | — | 937 | 75 | 9/28/2012 | 1980 | ||||||||||||||||
| Citizens Bank | Warwick | RI | — | 1,570 | 5,030 | — | 6,600 | 346 | 9/24/2013 | 1969 | ||||||||||||||||
| Citizens Bank | Warwick | RI | — | 1,870 | 8,828 | — | 10,698 | 602 | 9/24/2013 | 1995 | ||||||||||||||||
| Citizens Bank | Middlebury | VT | — | 363 | 544 | — | 907 | 60 | 12/14/2012 | 1969 | ||||||||||||||||
| Citizens Bank | Poultney | VT | — | 149 | 847 | — | 996 | 233 | 8/1/2010 | 1860 | ||||||||||||||||
| Citizens Bank | St. Albans | VT | — | 141 | 798 | — | 939 | 220 | 8/1/2010 | 1989 | ||||||||||||||||
| Citizens Bank | White River Junction | VT | — | 183 | 1,039 | — | 1,222 | 286 | 8/1/2010 | 1975 | ||||||||||||||||
| City Buffet | Alexander City | AL | — | 292 | 331 | — | 623 | 27 | 6/27/2013 | 1988 | ||||||||||||||||
| Coborn's Liquor Store | Stanley | ND | — | 1,163 | 5,037 | — | 6,200 | 226 | 2/21/2014 | 2014 | ||||||||||||||||
| Coborn's Liquor Store | Tioga | ND | — | 1,065 | 4,581 | — | 5,646 | 110 | 6/26/2014 | 2014 | ||||||||||||||||
| Comcast | Englewood | CO | — | 1,490 | 5,060 | — | 6,550 | 303 | 11/5/2013 | 1999 | ||||||||||||||||
| Commonwealth Foundation | Silver Spring | MD | — | — | 180 | 3,257 | 3,437 | — | 11/5/2013 | 1971 | ||||||||||||||||
| Community Bank | Lake Mary | FL | — | 1,230 | 1,504 | — | 2,734 | 97 | 10/1/2013 | 1990 | ||||||||||||||||
| Community Bank | Whitehall | NY | 375 | 106 | 600 | — | 706 | 159 | 8/1/2011 | 1995 | ||||||||||||||||
| CompUSA | Arlington | TX | 1,770 | 2,437 | 1,467 | — | 3,904 | 88 | 2/7/2014 | 1992 | ||||||||||||||||
| ConAgra Foods | Omaha | NE | — | 6,451 | 30,697 | — | 37,148 | 749 | 3/28/2014 | 1989 | ||||||||||||||||
| ConAgra Foods | Milton | PA | 16,245 | 5,656 | 27,242 | — | 32,898 | 1,116 | 2/7/2014 | 1991 | ||||||||||||||||
| Conn's | Austin | TX | 2,814 | 740 | 2,958 | — | 3,698 | 102 | 5/19/2014 | 2002 | ||||||||||||||||
| Conn's | Austin | TX | 2,894 | 658 | 2,631 | 350 | 3,639 | 93 | 5/19/2014 | 2002 | ||||||||||||||||
| Conn's | Hurst | TX | 1,531 | 497 | 1,990 | — | 2,487 | 71 | 5/19/2014 | 1999 | ||||||||||||||||
| Cooper Tire & Rubber | Franklin | IN | 16,620 | 4,438 | 33,994 | — | 38,432 | 2,333 | 11/5/2013 | 2009 | ||||||||||||||||
| Cost Plus | La Quinta | CA | — | 1,211 | 4,786 | — | 5,997 | 225 | 2/7/2014 | 2007 | ||||||||||||||||
| County of Yolo, CA | Woodland | CA | 10,332 | 2,640 | 13,681 | — | 16,321 | 731 | 11/5/2013 | 2001 | ||||||||||||||||
| Cowboy's Express | Monticello | AR | — | 43 | 36 | — | 79 | 3 | 6/27/2013 | 1982 | ||||||||||||||||
F-122
| Initial Costs | Costs Capitalized Subsequent to Acquisition | Gross Amount Carried at December 31, 2014 (1) (2) | ||||||||||||||||||||||||
| Property | City | State | Encumbrances at December 31, 2014 | Land | Buildings, Fixtures and Improvements | Accumulated Depreciation (3) (4) | Date Acquired | Date of Construction | ||||||||||||||||||
| Cracker Barrel | Braselton | GA | 2,935 | 1,294 | 2,403 | — | 3,697 | 360 | 11/13/2012 | 2005 | ||||||||||||||||
| Cracker Barrel | Bremen | GA | 2,677 | 1,012 | 2,361 | — | 3,373 | 353 | 11/13/2012 | 2006 | ||||||||||||||||
| Cracker Barrel | Columbus | GA | — | 912 | 3,153 | — | 4,065 | 161 | 2/7/2014 | 2003 | ||||||||||||||||
| Cracker Barrel | Greensboro | NC | — | 1,632 | 2,495 | — | 4,127 | 132 | 2/7/2014 | 2005 | ||||||||||||||||
| Cracker Barrel | Mebane | NC | 2,514 | 1,106 | 2,054 | — | 3,160 | 307 | 11/13/2012 | 2004 | ||||||||||||||||
| Cracker Barrel | Rocky Mount | NC | — | 1,274 | 2,334 | — | 3,608 | 127 | 2/7/2014 | 2006 | ||||||||||||||||
| Cracker Barrel | Fort Mill | SC | — | 1,301 | 2,721 | — | 4,022 | 145 | 2/7/2014 | 2006 | ||||||||||||||||
| Cracker Barrel | Piedmont | SC | — | 1,630 | 2,927 | — | 4,557 | 156 | 2/7/2014 | 2005 | ||||||||||||||||
| Cracker Barrel | Abilene | TX | — | 1,374 | 2,933 | — | 4,307 | 157 | 2/7/2014 | 2005 | ||||||||||||||||
| Cracker Barrel | San Antonio | TX | — | 1,725 | 3,005 | — | 4,730 | 151 | 2/7/2014 | 2005 | ||||||||||||||||
| Cracker Barrel | Sherman | TX | — | 557 | 3,744 | — | 4,301 | 191 | 2/7/2014 | 2007 | ||||||||||||||||
| Cracker Barrel | Bristol | VA | — | 1,241 | 1,703 | — | 2,944 | 110 | 2/7/2014 | 2006 | ||||||||||||||||
| Cracker Barrel | Emporia | VA | 2,435 | 972 | 2,267 | — | 3,239 | 339 | 11/13/2012 | 2004 | ||||||||||||||||
| Cracker Barrel | Waynesboro | VA | — | 1,536 | 1,489 | — | 3,025 | 117 | 2/7/2014 | 2004 | ||||||||||||||||
| Cracker Barrel | Woodstock | VA | 2,262 | 928 | 2,164 | — | 3,092 | 324 | 11/13/2012 | 2005 | ||||||||||||||||
| Crest Production Services | Pleasanton | TX | — | 519 | 7,949 | — | 8,468 | 343 | 6/12/2014 | 2013 | ||||||||||||||||
| Crozer-Keystone Health | Ridley Park | PA | 1,970 | — | 6,114 | — | 6,114 | 343 | 11/5/2013 | 1976 | ||||||||||||||||
| Cuco Mexican | Circleville | OH | — | 140 | 142 | — | 282 | 3 | 6/27/2013 | 1986 | ||||||||||||||||
| CVS | Enterprise | AL | 4,348 | 1,475 | 3,184 | — | 4,659 | 76 | 7/24/2014 | 2014 | ||||||||||||||||
| CVS | Hoover | AL | — | 1,239 | 2,890 | — | 4,129 | 282 | 5/31/2013 | 2003 | ||||||||||||||||
| CVS | Meridianville | AL | 1,990 | 1,045 | 3,057 | — | 4,102 | 163 | 2/7/2014 | 2008 | ||||||||||||||||
| CVS | Selma | AL | 2,682 | 767 | 2,126 | — | 2,893 | 50 | 7/24/2014 | 2014 | ||||||||||||||||
| CVS | Lake Havasu City | AZ | — | 824 | 5,029 | — | 5,853 | 241 | 2/7/2014 | 2008 | ||||||||||||||||
| CVS | Oro Valley | AZ | 4,321 | 1,646 | 2,980 | — | 4,626 | 72 | 7/24/2014 | 2013 | ||||||||||||||||
| CVS | Peoria | AZ | 4,676 | 1,715 | 3,600 | — | 5,315 | 105 | 7/24/2014 | 2014 | ||||||||||||||||
| CVS | Phoenix | AZ | 5,025 | 1,511 | 4,533 | — | 6,044 | 329 | 10/1/2013 | 2012 | ||||||||||||||||
| CVS | Phoenix | AZ | 3,015 | 901 | 2,704 | — | 3,605 | 196 | 10/1/2013 | 2012 | ||||||||||||||||
| CVS | Phoenix | AZ | — | 1,812 | 6,320 | — | 8,132 | 305 | 2/7/2014 | 2008 | ||||||||||||||||
| CVS | Tucson | AZ | 4,781 | 1,900 | 3,842 | — | 5,742 | 92 | 7/24/2014 | 2013 | ||||||||||||||||
| CVS | City of Industry | CA | 2,500 | 1,224 | 3,202 | — | 4,426 | 147 | 2/7/2014 | 2009 | ||||||||||||||||
| CVS | Fresno | CA | 5,045 | 1,890 | 4,409 | — | 6,299 | 320 | 10/1/2013 | 2012 | ||||||||||||||||
| CVS | Fullerton | CA | 8,430 | 5,827 | 3,504 | — | 9,331 | 84 | 7/24/2014 | 2007 | ||||||||||||||||
F-123
| Initial Costs | Costs Capitalized Subsequent to Acquisition | Gross Amount Carried at December 31, 2014 (1) (2) | ||||||||||||||||||||||||
| Property | City | State | Encumbrances at December 31, 2014 | Land | Buildings, Fixtures and Improvements | Accumulated Depreciation (3) (4) | Date Acquired | Date of Construction | ||||||||||||||||||
| CVS | Menifee | CA | 5,218 | 1,709 | 4,559 | — | 6,268 | 109 | 7/24/2014 | 2013 | ||||||||||||||||
| CVS | Oroville | CA | 5,029 | 1,073 | 4,516 | — | 5,589 | 132 | 7/24/2014 | 2013 | ||||||||||||||||
| CVS | Palmdale | CA | 5,226 | 2,493 | 4,630 | — | 7,123 | 336 | 10/1/2013 | 2012 | ||||||||||||||||
| CVS | Sacramento | CA | 4,724 | 2,163 | 4,016 | — | 6,179 | 291 | 10/1/2013 | 2012 | ||||||||||||||||
| CVS | Norwich | CT | 5,454 | 1,998 | 5,995 | — | 7,993 | 435 | 10/1/2013 | 2011 | ||||||||||||||||
| CVS | Dover | DE | 2,046 | 4,081 | — | — | 4,081 | — | 2/7/2014 | 2010 | ||||||||||||||||
| CVS | Lewes | DE | 5,412 | 2,595 | 3,459 | — | 6,054 | 83 | 7/24/2014 | 2013 | ||||||||||||||||
| CVS | Auburndale | FL | 1,565 | 1,418 | 2,038 | — | 3,456 | 100 | 2/7/2014 | 1999 | ||||||||||||||||
| CVS | Boca Raton | FL | 2,625 | — | 3,560 | — | 3,560 | 192 | 2/7/2014 | 2009 | ||||||||||||||||
| CVS | Ft. Myers | FL | 3,025 | 2,335 | 3,502 | — | 5,837 | 189 | 2/7/2014 | 2009 | ||||||||||||||||
| CVS | Gulf Breeze | FL | 1,079 | 545 | — | — | 545 | — | 2/7/2014 | 2009 | ||||||||||||||||
| CVS | Jacksonville | FL | 3,715 | 2,240 | 4,323 | — | 6,563 | 215 | 2/7/2014 | 2009 | ||||||||||||||||
| CVS | Lake Wales | FL | 1,625 | 1,128 | 2,502 | — | 3,630 | 123 | 2/7/2014 | 1999 | ||||||||||||||||
| CVS | Lakeland | FL | 2,258 | 587 | 2,347 | — | 2,934 | 170 | 10/1/2013 | 2012 | ||||||||||||||||
| CVS | Naples | FL | 2,675 | — | 4,164 | — | 4,164 | 204 | 2/7/2014 | 2009 | ||||||||||||||||
| CVS | New Port Richey | FL | 1,670 | 1,149 | 2,966 | — | 4,115 | 144 | 2/7/2014 | 2004 | ||||||||||||||||
| CVS | St. Augustine | FL | — | 1,264 | 3,674 | — | 4,938 | 182 | 2/7/2014 | 2008 | ||||||||||||||||
| CVS | St. Cloud | FL | 2,626 | 1,534 | 1,875 | — | 3,409 | 192 | 4/12/2013 | 2002 | ||||||||||||||||
| CVS | Alpharetta | GA | — | 572 | 858 | — | 1,430 | 118 | 9/28/2012 | 1994 | ||||||||||||||||
| CVS | Athens | GA | — | 1,282 | 4,546 | — | 5,828 | 230 | 2/7/2014 | 2009 | ||||||||||||||||
| CVS | Macon | GA | 2,702 | 1,079 | 2,457 | — | 3,536 | 59 | 7/24/2014 | 2013 | ||||||||||||||||
| CVS | Manchester | GA | 3,130 | 824 | 2,734 | — | 3,558 | 65 | 7/24/2014 | 2013 | ||||||||||||||||
| CVS | Ringgold | GA | 1,948 | 1,346 | 2,939 | — | 4,285 | 157 | 2/7/2014 | 2007 | ||||||||||||||||
| CVS | Statesboro | GA | 4,320 | 998 | 3,581 | — | 4,579 | 86 | 7/24/2014 | 2013 | ||||||||||||||||
| CVS | Stockbridge | GA | — | 855 | 1,283 | — | 2,138 | 144 | 2/28/2013 | 1998 | ||||||||||||||||
| CVS | Vidalia | GA | — | 368 | 1,105 | — | 1,473 | 152 | 9/28/2012 | 2000 | ||||||||||||||||
| CVS | Des Moines | IA | 4,065 | 1,135 | 3,356 | — | 4,491 | 81 | 7/24/2014 | 2014 | ||||||||||||||||
| CVS | Cary | IL | 4,343 | 1,800 | 3,071 | — | 4,871 | 74 | 7/24/2014 | 2009 | ||||||||||||||||
| CVS | Chicago | IL | — | 1,029 | 6,346 | — | 7,375 | 304 | 2/7/2014 | 2009 | ||||||||||||||||
| CVS | Dolton | IL | — | 580 | 5,298 | — | 5,878 | 247 | 2/7/2014 | 2008 | ||||||||||||||||
| CVS | Mendota | IL | 4,030 | 1,418 | 3,051 | — | 4,469 | 73 | 7/24/2014 | 2013 | ||||||||||||||||
| CVS | Northbrook | IL | 25,155 | 3,471 | 41,765 | — | 45,236 | 1,685 | 2/7/2014 | 1980 | ||||||||||||||||
F-124
| Initial Costs | Costs Capitalized Subsequent to Acquisition | Gross Amount Carried at December 31, 2014 (1) (2) | ||||||||||||||||||||||||
| Property | City | State | Encumbrances at December 31, 2014 | Land | Buildings, Fixtures and Improvements | Accumulated Depreciation (3) (4) | Date Acquired | Date of Construction | ||||||||||||||||||
| CVS | Westville | IL | 2,912 | 525 | 2,773 | — | 3,298 | 66 | 7/24/2014 | 2013 | ||||||||||||||||
| CVS | Brazil | IN | — | 419 | 2,456 | — | 2,875 | 129 | 2/24/2014 | 1997 | ||||||||||||||||
| CVS | Brookville | IN | 3,306 | 906 | 2,463 | — | 3,369 | 59 | 7/24/2014 | 2014 | ||||||||||||||||
| CVS | Edinburgh | IN | — | 420 | 1,530 | — | 1,950 | 82 | 2/24/2014 | 1998 | ||||||||||||||||
| CVS | Evansville | IN | 1,850 | 227 | 3,060 | — | 3,287 | 149 | 2/7/2014 | 2000 | ||||||||||||||||
| CVS | Fort Wayne | IN | 4,092 | 2,021 | 2,543 | — | 4,564 | 74 | 7/24/2014 | 2014 | ||||||||||||||||
| CVS | Franklin | IN | — | 310 | 2,787 | — | 3,097 | 467 | 3/29/2012 | 1999 | ||||||||||||||||
| CVS | Mishawaka | IN | 2,258 | 409 | 4,532 | — | 4,941 | 224 | 2/7/2014 | 2007 | ||||||||||||||||
| CVS | Tipton | IN | — | 311 | 1,726 | — | 2,037 | 92 | 2/24/2014 | 1998 | ||||||||||||||||
| CVS | Emporia | KS | 3,978 | 544 | 3,834 | — | 4,378 | 91 | 7/24/2014 | 2014 | ||||||||||||||||
| CVS | Junction City | KS | 3,087 | 524 | 2,967 | — | 3,491 | 72 | 7/24/2014 | 2014 | ||||||||||||||||
| CVS | Lawrence | KS | 2,908 | 837 | 4,392 | — | 5,229 | 216 | 2/7/2014 | 2009 | ||||||||||||||||
| CVS | Wichita | KS | 3,759 | 1,645 | 2,451 | — | 4,096 | 59 | 7/24/2014 | 2014 | ||||||||||||||||
| CVS | Elizabethtown | KY | 4,281 | 1,309 | 3,337 | — | 4,646 | 97 | 7/24/2014 | 2014 | ||||||||||||||||
| CVS | Baton Rouge | LA | 3,932 | 1,395 | 2,899 | — | 4,294 | 70 | 7/24/2014 | 2014 | ||||||||||||||||
| CVS | Bossier City | LA | 3,996 | 1,671 | 2,715 | — | 4,386 | 66 | 7/24/2014 | 2013 | ||||||||||||||||
| CVS | Mandeville | LA | 4,020 | 2,385 | 2,915 | — | 5,300 | 211 | 10/1/2013 | 2012 | ||||||||||||||||
| CVS | Metairie | LA | 4,121 | 1,895 | 3,519 | — | 5,414 | 255 | 10/1/2013 | 2012 | ||||||||||||||||
| CVS | Metairie | LA | 7,046 | 3,435 | 4,134 | — | 7,569 | 97 | 7/24/2014 | 2013 | ||||||||||||||||
| CVS | New Orleans | LA | 3,719 | 2,439 | 2,439 | — | 4,878 | 177 | 10/1/2013 | 2012 | ||||||||||||||||
| CVS | Slidell | LA | 4,355 | 1,142 | 4,568 | — | 5,710 | 331 | 10/1/2013 | 2012 | ||||||||||||||||
| CVS | Slidell | LA | 4,861 | 1,789 | 3,447 | — | 5,236 | 83 | 7/24/2014 | 2014 | ||||||||||||||||
| CVS | Hingham | MA | 5,695 | 1,873 | 5,619 | — | 7,492 | 407 | 10/1/2013 | 2012 | ||||||||||||||||
| CVS | Lawrence | MA | 6,567 | 3,726 | 3,548 | — | 7,274 | 84 | 7/24/2014 | 2012 | ||||||||||||||||
| CVS | Malden | MA | 5,360 | 1,757 | 5,271 | — | 7,028 | 382 | 10/1/2013 | 2012 | ||||||||||||||||
| CVS | Detroit | MI | — | 270 | 2,427 | — | 2,697 | 273 | 2/28/2013 | 1999 | ||||||||||||||||
| CVS | Harper Woods | MI | — | 499 | 2,829 | — | 3,328 | 318 | 2/28/2013 | 1999 | ||||||||||||||||
| CVS | Minneapolis | MN | — | 266 | 4,693 | — | 4,959 | 206 | 2/7/2014 | 2009 | ||||||||||||||||
| CVS | Branson | MO | 4,190 | 493 | 4,200 | — | 4,693 | 101 | 7/24/2014 | 2013 | ||||||||||||||||
| CVS | Cape Girardeau | MO | 4,404 | 1,417 | 3,416 | — | 4,833 | 82 | 7/24/2014 | 2014 | ||||||||||||||||
| CVS | Hannibal | MO | 3,871 | 598 | 3,329 | — | 3,927 | 80 | 7/24/2014 | 2014 | ||||||||||||||||
| CVS | Independence | MO | 2,092 | 780 | 3,121 | — | 3,901 | 114 | 5/19/2014 | 2000 | ||||||||||||||||
F-125
| Initial Costs | Costs Capitalized Subsequent to Acquisition | Gross Amount Carried at December 31, 2014 (1) (2) | ||||||||||||||||||||||||
| Property | City | State | Encumbrances at December 31, 2014 | Land | Buildings, Fixtures and Improvements | Accumulated Depreciation (3) (4) | Date Acquired | Date of Construction | ||||||||||||||||||
| CVS | O'Fallon | MO | 5,344 | 3,116 | 2,713 | — | 5,829 | 65 | 7/24/2014 | 2012 | ||||||||||||||||
| CVS | Rolla | MO | 3,474 | 752 | 3,039 | — | 3,791 | 88 | 7/24/2014 | 2013 | ||||||||||||||||
| CVS | Sikeston | MO | 2,791 | 1,057 | 2,101 | — | 3,158 | 51 | 7/24/2014 | 2013 | ||||||||||||||||
| CVS | St. Joseph | MO | 3,015 | 1,022 | 3,067 | — | 4,089 | 222 | 10/1/2013 | 2012 | ||||||||||||||||
| CVS | St. Louis | MO | 4,058 | 1,858 | 2,559 | — | 4,417 | 61 | 7/24/2014 | 2013 | ||||||||||||||||
| CVS | Hattiesburg | MS | 4,404 | 1,840 | 3,141 | — | 4,981 | 92 | 7/24/2014 | 2013 | ||||||||||||||||
| CVS | Southaven | MS | 3,030 | 1,849 | 3,217 | — | 5,066 | 187 | 2/7/2014 | 2009 | ||||||||||||||||
| CVS | Southaven | MS | 4,270 | 1,281 | 4,100 | — | 5,381 | 234 | 2/7/2014 | 2009 | ||||||||||||||||
| CVS | Beaufort | NC | 2,781 | 378 | 3,404 | — | 3,782 | 247 | 10/1/2013 | 2011 | ||||||||||||||||
| CVS | Charlotte | NC | — | 1,185 | 2,176 | — | 3,361 | 102 | 2/7/2014 | 2008 | ||||||||||||||||
| CVS | Eden | NC | — | 836 | 1,450 | — | 2,286 | 72 | 2/7/2014 | 1998 | ||||||||||||||||
| CVS | Erwin | NC | 2,607 | 657 | 2,227 | — | 2,884 | 53 | 7/24/2014 | 2013 | ||||||||||||||||
| CVS | Kernersville | NC | — | 960 | 1,313 | — | 2,273 | 64 | 2/7/2014 | 1998 | ||||||||||||||||
| CVS | Sanford | NC | 2,870 | 1,260 | 2,087 | — | 3,347 | 50 | 7/24/2014 | 2013 | ||||||||||||||||
| CVS | Weaverville | NC | 3,098 | 1,998 | 4,307 | — | 6,305 | 228 | 2/7/2014 | 2009 | ||||||||||||||||
| CVS | Whiteville | NC | — | 637 | 2,546 | — | 3,183 | 91 | 5/19/2014 | 2004 | ||||||||||||||||
| CVS | Norfolk | NE | 4,176 | 720 | 3,960 | — | 4,680 | 95 | 7/24/2014 | 2013 | ||||||||||||||||
| CVS | Cherry Hill | NJ | — | 2,255 | — | — | 2,255 | — | 2/7/2014 | 2011 | ||||||||||||||||
| CVS | Edison | NJ | — | 3,318 | — | — | 3,318 | — | 2/7/2014 | 2008 | ||||||||||||||||
| CVS | Lawrenceville | NJ | 5,170 | 2,674 | 6,412 | — | 9,086 | 311 | 2/7/2014 | 2009 | ||||||||||||||||
| CVS | Albuquerque | NM | 3,719 | 975 | 3,899 | — | 4,874 | 283 | 10/1/2013 | 2011 | ||||||||||||||||
| CVS | Albuquerque | NM | 3,920 | 1,029 | 4,118 | — | 5,147 | 299 | 10/1/2013 | 2011 | ||||||||||||||||
| CVS | Las Cruces | NM | 4,925 | 1,295 | 5,178 | — | 6,473 | 375 | 10/1/2013 | 2012 | ||||||||||||||||
| CVS | North Las Vegas | NV | 3,268 | 1,374 | 3,207 | — | 4,581 | 457 | 8/22/2012 | 2004 | ||||||||||||||||
| CVS | Sparks | NV | — | 486 | 5,894 | — | 6,380 | 293 | 2/7/2014 | 2009 | ||||||||||||||||
| CVS | Gloversville | NY | 3,382 | 402 | 3,419 | — | 3,821 | 83 | 7/24/2014 | 2013 | ||||||||||||||||
| CVS | Henrietta | NY | — | 965 | 1,180 | — | 2,145 | 150 | 11/8/2012 | 1997 | ||||||||||||||||
| CVS | Mineola | NY | 2,280 | — | 5,120 | — | 5,120 | 240 | 2/7/2014 | 2008 | ||||||||||||||||
| CVS | Waterville | NY | 2,252 | 73 | 2,276 | — | 2,349 | 54 | 7/24/2014 | 1966 | ||||||||||||||||
| CVS | Bowling Green | OH | 3,532 | 1,718 | 2,387 | — | 4,105 | 57 | 7/24/2014 | 2013 | ||||||||||||||||
| CVS | Green | OH | 3,436 | 1,380 | 2,556 | — | 3,936 | 75 | 7/24/2014 | 2013 | ||||||||||||||||
| CVS | Ironton | OH | 2,871 | 1,083 | 2,183 | — | 3,266 | 53 | 7/24/2014 | 2011 | ||||||||||||||||
F-126
| Initial Costs | Costs Capitalized Subsequent to Acquisition | Gross Amount Carried at December 31, 2014 (1) (2) | ||||||||||||||||||||||||
| Property | City | State | Encumbrances at December 31, 2014 | Land | Buildings, Fixtures and Improvements | Accumulated Depreciation (3) (4) | Date Acquired | Date of Construction | ||||||||||||||||||
| CVS | Toledo | OH | 4,200 | 2,170 | 2,739 | — | 4,909 | 66 | 7/24/2014 | 2013 | ||||||||||||||||
| CVS | Warren | OH | — | 560 | 1,622 | — | 2,182 | 79 | 2/7/2014 | 2008 | ||||||||||||||||
| CVS | Claremore | OK | 5,148 | 2,154 | 3,408 | — | 5,562 | 81 | 7/24/2014 | 2014 | ||||||||||||||||
| CVS | Duncan | OK | 3,327 | 1,085 | 2,723 | — | 3,808 | 65 | 7/24/2014 | 2013 | ||||||||||||||||
| CVS | Durant | OK | 2,760 | 881 | 2,902 | — | 3,783 | 69 | 7/24/2014 | 2013 | ||||||||||||||||
| CVS | Edmond | OK | 3,087 | 1,040 | 2,862 | — | 3,902 | 69 | 7/24/2014 | 2014 | ||||||||||||||||
| CVS | Enid | OK | 4,233 | 873 | 3,523 | — | 4,396 | 84 | 7/24/2014 | 2014 | ||||||||||||||||
| CVS | Muskogee | OK | 4,130 | 1,562 | 3,089 | — | 4,651 | 74 | 7/24/2014 | 2014 | ||||||||||||||||
| CVS | Oklahoma City | OK | — | 569 | 1,609 | — | 2,178 | 75 | 2/7/2014 | 1996 | ||||||||||||||||
| CVS | The Village | OK | 3,425 | 520 | 4,730 | — | 5,250 | 232 | 2/7/2014 | 2009 | ||||||||||||||||
| CVS | Tulsa | OK | 2,446 | 950 | 2,216 | — | 3,166 | 161 | 10/1/2013 | 2010 | ||||||||||||||||
| CVS | Freeland | PA | 982 | 122 | 1,096 | — | 1,218 | 156 | 8/8/2012 | 2004 | ||||||||||||||||
| CVS | Mechanicsburg | PA | 3,582 | 1,155 | 3,465 | — | 4,620 | 442 | 11/29/2012 | 2008 | ||||||||||||||||
| CVS | New Castle | PA | 1,562 | 412 | 2,337 | — | 2,749 | 310 | 10/31/2012 | 1999 | ||||||||||||||||
| CVS | Shippensburg | PA | 1,859 | 351 | 1,988 | — | 2,339 | 224 | 2/8/2013 | 2002 | ||||||||||||||||
| CVS | Titusville | PA | — | 670 | 683 | — | 1,353 | 70 | 2/7/2014 | 1998 | ||||||||||||||||
| CVS | Towanda | PA | 878 | — | 877 | — | 877 | 90 | 4/24/2013 | 2003 | ||||||||||||||||
| CVS | Tunkhannock | PA | 4,972 | 1,167 | 4,014 | — | 5,181 | 97 | 7/24/2014 | 2014 | ||||||||||||||||
| CVS | Anderson | SC | — | 623 | 1,389 | — | 2,012 | 66 | 2/7/2014 | 1998 | ||||||||||||||||
| CVS | Cayce | SC | — | 1,750 | 2,701 | — | 4,451 | 147 | 2/7/2014 | 2009 | ||||||||||||||||
| CVS | Columbia | SC | 2,278 | — | 2,811 | — | 2,811 | 246 | 7/2/2013 | 2006 | ||||||||||||||||
| CVS | Greenville | SC | — | 169 | 1,520 | — | 1,689 | 171 | 2/28/2013 | 1997 | ||||||||||||||||
| CVS | Greenville | SC | — | 1,108 | 1,816 | — | 2,924 | 93 | 2/7/2014 | 1998 | ||||||||||||||||
| CVS | Liberty | SC | 3,444 | 1,416 | 2,390 | — | 3,806 | 57 | 7/24/2014 | 2014 | ||||||||||||||||
| CVS | Piedmont | SC | — | 836 | 1,206 | — | 2,042 | 56 | 2/7/2014 | 1998 | ||||||||||||||||
| CVS | Greeneville | TN | 3,331 | 1,492 | 2,280 | — | 3,772 | 66 | 7/24/2014 | 2013 | ||||||||||||||||
| CVS | Jackson | TN | 3,082 | 1,209 | 2,822 | — | 4,031 | 205 | 10/1/2013 | 2012 | ||||||||||||||||
| CVS | Knoxville | TN | 2,613 | 1,190 | 2,210 | — | 3,400 | 160 | 10/1/2013 | 2011 | ||||||||||||||||
| CVS | Knoxville | TN | 4,215 | 2,378 | 2,242 | — | 4,620 | 53 | 7/24/2014 | 2014 | ||||||||||||||||
| CVS | Nashville | TN | — | 203 | 1,148 | — | 1,351 | 158 | 9/28/2012 | 1996 | ||||||||||||||||
F-127
| Initial Costs | Costs Capitalized Subsequent to Acquisition | Gross Amount Carried at December 31, 2014 (1) (2) | ||||||||||||||||||||||||
| Property | City | State | Encumbrances at December 31, 2014 | Land | Buildings, Fixtures and Improvements | Accumulated Depreciation (3) (4) | Date Acquired | Date of Construction | ||||||||||||||||||
| CVS | Anna | TX | 4,177 | 628 | 3,881 | — | 4,509 | 93 | 7/24/2014 | 2014 | ||||||||||||||||
| CVS | Brownsville | TX | — | 704 | 4,938 | — | 5,642 | 241 | 2/7/2014 | 2009 | ||||||||||||||||
| CVS | Canyon Lake | TX | 3,390 | 423 | 3,275 | — | 3,698 | 78 | 7/24/2014 | 2014 | ||||||||||||||||
| CVS | Celina | TX | 3,820 | 917 | 3,332 | — | 4,249 | 80 | 7/24/2014 | 2014 | ||||||||||||||||
| CVS | Converse | TX | 3,538 | 1,390 | 3,243 | — | 4,633 | 235 | 10/1/2013 | 2011 | ||||||||||||||||
| CVS | Corpus Christi | TX | 3,509 | 1,484 | 2,323 | — | 3,807 | 56 | 7/24/2014 | 2014 | ||||||||||||||||
| CVS | Donna | TX | 4,017 | 800 | 3,481 | — | 4,281 | 84 | 7/24/2014 | 2014 | ||||||||||||||||
| CVS | Dumas | TX | 2,312 | 846 | 2,537 | — | 3,383 | 184 | 10/1/2013 | 2011 | ||||||||||||||||
| CVS | Duncanville | TX | 2,087 | 670 | 2,681 | — | 3,351 | 99 | 5/19/2014 | 2000 | ||||||||||||||||
| CVS | Edinburg | TX | — | 1,179 | 3,060 | — | 4,239 | 157 | 2/7/2014 | 2008 | ||||||||||||||||
| CVS | Elsa | TX | 2,814 | 915 | 2,744 | — | 3,659 | 199 | 10/1/2013 | 2011 | ||||||||||||||||
| CVS | Ft . Worth | TX | 4,147 | 2,453 | 3,679 | — | 6,132 | 267 | 10/1/2013 | 2011 | ||||||||||||||||
| CVS | Gainesville | TX | 2,215 | 341 | 3,334 | — | 3,675 | 158 | 2/7/2014 | 2003 | ||||||||||||||||
| CVS | Lago Vista | TX | — | 1,183 | 4,731 | — | 5,914 | 169 | 5/19/2014 | 2005 | ||||||||||||||||
| CVS | Pflugerville | TX | 3,887 | 1,371 | 2,855 | — | 4,226 | 68 | 7/24/2014 | 2014 | ||||||||||||||||
| CVS | Port Aransas | TX | 4,666 | 1,882 | 3,073 | — | 4,955 | 74 | 7/24/2014 | 2014 | ||||||||||||||||
| CVS | Rowlett | TX | 5,614 | 1,166 | 4,442 | — | 5,608 | 106 | 7/24/2014 | 2014 | ||||||||||||||||
| CVS | San Antonio | TX | 3,806 | 1,996 | 2,993 | — | 4,989 | 217 | 10/1/2013 | 2011 | ||||||||||||||||
| CVS | San Antonio | TX | 4,422 | 2,034 | 3,778 | — | 5,812 | 274 | 10/1/2013 | 2011 | ||||||||||||||||
| CVS | San Antonio | TX | 2,660 | 868 | 2,605 | — | 3,473 | 189 | 10/1/2013 | 2012 | ||||||||||||||||
| CVS | San Antonio | TX | 3,879 | 1,316 | 2,887 | — | 4,203 | 70 | 7/24/2014 | 2014 | ||||||||||||||||
| CVS | San Juan | TX | 2,345 | 610 | 2,441 | — | 3,051 | 177 | 10/1/2013 | 2012 | ||||||||||||||||
| CVS | Sherman | TX | — | 336 | 4,045 | — | 4,381 | 185 | 2/7/2014 | 1999 | ||||||||||||||||
| CVS | Roy | UT | 4,639 | 1,255 | 3,711 | — | 4,966 | 88 | 7/24/2014 | 2013 | ||||||||||||||||
| CVS | Sandy | UT | 4,461 | 1,327 | 3,480 | — | 4,807 | 83 | 7/24/2014 | 1999 | ||||||||||||||||
| CVS | Hardy | VA | 2,035 | 686 | 2,059 | — | 2,745 | 201 | 5/16/2013 | 2005 | ||||||||||||||||
| CVS | Lynchburg | VA | 1,748 | 914 | 2,987 | — | 3,901 | 148 | 2/7/2014 | 1999 | ||||||||||||||||
| CVS | Madison Heights | VA | 1,592 | 1,015 | 2,589 | — | 3,604 | 127 | 2/7/2014 | 1997 | ||||||||||||||||
| CVS | Norfolk | VA | 2,399 | 697 | 2,789 | — | 3,486 | 202 | 10/1/2013 | 2011 | ||||||||||||||||
| CVS | Portsmouth | VA | 3,367 | 1,230 | 3,690 | — | 4,920 | 268 | 10/1/2013 | 2012 | ||||||||||||||||
| CVS | Portsmouth | VA | 6,195 | 2,171 | 4,508 | — | 6,679 | 108 | 7/24/2014 | 2014 | ||||||||||||||||
| CVS | Roanoke | VA | 2,269 | 825 | 2,474 | — | 3,299 | 179 | 10/1/2013 | 2011 | ||||||||||||||||
F-128
| Initial Costs | Costs Capitalized Subsequent to Acquisition | Gross Amount Carried at December 31, 2014 (1) (2) | ||||||||||||||||||||||||
| Property | City | State | Encumbrances at December 31, 2014 | Land | Buildings, Fixtures and Improvements | Accumulated Depreciation (3) (4) | Date Acquired | Date of Construction | ||||||||||||||||||
| CVS | Virginia Beach | VA | 3,114 | 683 | 3,868 | — | 4,551 | 280 | 10/1/2013 | 2012 | ||||||||||||||||
| CVS | Williamsburg | VA | 4,115 | 907 | 5,137 | — | 6,044 | 372 | 10/1/2013 | 2011 | ||||||||||||||||
| CVS | Berlin | VT | 4,330 | 1,456 | 3,349 | — | 4,805 | 82 | 7/24/2014 | 2014 | ||||||||||||||||
| CVS | Morgantown | WV | 5,051 | 2,631 | 2,964 | — | 5,595 | 71 | 7/24/2014 | 2013 | ||||||||||||||||
| Dahl's | Des Moines | IA | — | 628 | 3,947 | — | 4,575 | 193 | 2/7/2014 | 1947 | ||||||||||||||||
| Dahl's | Des Moines | IA | — | 1,163 | 1,649 | — | 2,812 | 82 | 2/7/2014 | 1959 | ||||||||||||||||
| Dahl's | Des Moines | IA | — | 2,871 | 11,761 | — | 14,632 | 562 | 2/7/2014 | 2011 | ||||||||||||||||
| Dahl's | Johnston | IA | — | 3,202 | 6,644 | — | 9,846 | 326 | 2/7/2014 | 2000 | ||||||||||||||||
| Dairy Queen | Mauldin | SC | — | 133 | — | — | 133 | — | 6/27/2013 | 1995 | ||||||||||||||||
| Dairy Queen | Alto | TX | — | 50 | 110 | — | 160 | 9 | 6/27/2013 | 1995 | ||||||||||||||||
| Dairy Queen | Pineland | TX | — | 40 | 120 | — | 160 | 10 | 6/27/2013 | 1995 | ||||||||||||||||
| Dairy Queen | Silsbee | TX | — | 60 | 100 | — | 160 | 8 | 6/27/2013 | 1995 | ||||||||||||||||
| Dairy Queen | Woodville | TX | — | 98 | 65 | — | 163 | 5 | 7/31/2013 | 1980 | ||||||||||||||||
| DaVita Dialysis | Osceola | AR | — | 137 | 1,232 | — | 1,369 | 104 | 3/28/2013 | 2009 | ||||||||||||||||
| DaVita Dialysis | Casselberry | FL | — | 392 | 2,320 | — | 2,712 | 96 | 2/7/2014 | 2007 | ||||||||||||||||
| DaVita Dialysis | Palatka | FL | — | 207 | 1,173 | — | 1,380 | 85 | 6/5/2013 | 2013 | ||||||||||||||||
| DaVita Dialysis | Sanford | FL | — | 530 | 2,793 | — | 3,323 | 108 | 2/7/2014 | 2005 | ||||||||||||||||
| DaVita Dialysis | Augusta | GA | — | 118 | 1,818 | — | 1,936 | 62 | 2/7/2014 | 2000 | ||||||||||||||||
| DaVita Dialysis | Douglasville | GA | — | 119 | 1,858 | — | 1,977 | 64 | 2/7/2014 | 2001 | ||||||||||||||||
| DaVita Dialysis | Ft. Wayne | IN | — | 394 | 2,963 | — | 3,357 | 106 | 2/7/2014 | 2008 | ||||||||||||||||
| DaVita Dialysis | Hiawatha | KS | — | 69 | 1,302 | — | 1,371 | 99 | 5/30/2013 | 2012 | ||||||||||||||||
| DaVita Dialysis | New Orleans | LA | — | 511 | 2,237 | — | 2,748 | 27 | 9/30/2014 | 2010 | ||||||||||||||||
| DaVita Dialysis | Allen Park | MI | — | 209 | 1,885 | — | 2,094 | 208 | 12/31/2012 | 1955 | ||||||||||||||||
| DaVita Dialysis | Grand Rapids | MI | — | 215 | 1,794 | — | 2,009 | 70 | 2/7/2014 | 1997 | ||||||||||||||||
| DaVita Dialysis | Clinton | MO | — | 128 | 896 | — | 1,024 | 38 | 2/26/2014 | 2003 | ||||||||||||||||
| DaVita Dialysis | St. Pauls | NC | — | 138 | 1,246 | — | 1,384 | 81 | 8/2/2013 | 2006 | ||||||||||||||||
| DaVita Dialysis | Lawrenceville | NJ | — | 633 | 2,757 | — | 3,390 | 106 | 2/7/2014 | 2009 | ||||||||||||||||
| DaVita Dialysis | Akron | OH | — | 312 | 1,994 | — | 2,306 | 72 | 3/31/2014 | 1932 | ||||||||||||||||
| DaVita Dialysis | Cincinnati | OH | — | 219 | 878 | — | 1,097 | 74 | 3/28/2013 | 2008 | ||||||||||||||||
| DaVita Dialysis | Georgetown | OH | — | 125 | 706 | — | 831 | 59 | 3/28/2013 | 2009 | ||||||||||||||||
| DaVita Dialysis | Willow Grove | PA | — | 311 | 3,886 | — | 4,197 | 139 | 2/7/2014 | 1989 | ||||||||||||||||
| DaVita Dialysis | Hartsville | SC | — | 126 | 1,136 | — | 1,262 | 87 | 5/30/2013 | 2013 | ||||||||||||||||
F-129
| Initial Costs | Costs Capitalized Subsequent to Acquisition | Gross Amount Carried at December 31, 2014 (1) (2) | ||||||||||||||||||||||||
| Property | City | State | Encumbrances at December 31, 2014 | Land | Buildings, Fixtures and Improvements | Accumulated Depreciation (3) (4) | Date Acquired | Date of Construction | ||||||||||||||||||
| DaVita Dialysis | Beeville | TX | — | 99 | 1,879 | — | 1,978 | 208 | 12/31/2012 | 1979 | ||||||||||||||||
| DaVita Dialysis | Federal Way | WA | 17,751 | 1,929 | 22,357 | — | 24,286 | 2,961 | 11/21/2012 | 2000 | ||||||||||||||||
| DC Sports Bar & Steakhouse | Eunice | LA | — | 500 | 262 | — | 762 | 22 | 6/27/2013 | 1995 | ||||||||||||||||
| Del Monte | Lathrop | CA | — | — | 41,318 | — | 41,318 | 2,835 | 11/5/2013 | 1993 | ||||||||||||||||
| Dell Perot Systems | Lincoln | NE | — | 2,812 | 25,566 | — | 28,378 | 1,048 | 2/7/2014 | 2009 | ||||||||||||||||
| Denny's | Albemarle | NC | — | 483 | 457 | — | 940 | 40 | 6/27/2013 | 1995 | ||||||||||||||||
| Denny's | Mesa | AZ | — | 1,089 | 891 | — | 1,980 | 77 | 7/31/2013 | 1994 | ||||||||||||||||
| Denny's | Peoria | AZ | — | 310 | 457 | — | 767 | 40 | 6/27/2013 | 1995 | ||||||||||||||||
| Denny's | Phoenix | AZ | — | 825 | 1,237 | — | 2,062 | 107 | 7/31/2013 | 2005 | ||||||||||||||||
| Denny's | Scottsdale | AZ | — | 736 | 491 | — | 1,227 | 43 | 7/31/2013 | 1980 | ||||||||||||||||
| Denny's | Tempe | AZ | — | 378 | 245 | — | 623 | 113 | 6/27/2013 | 1980 | ||||||||||||||||
| Denny's | Tempe | AZ | — | 1,567 | 844 | — | 2,411 | 73 | 7/31/2013 | 1995 | ||||||||||||||||
| Denny's | Winter Springs | FL | — | 550 | 1,668 | — | 2,218 | 139 | 6/27/2013 | 1995 | ||||||||||||||||
| Denny's | Idaho Falls | ID | — | 196 | 432 | — | 628 | 105 | 6/27/2013 | 1995 | ||||||||||||||||
| Denny's | Merriam | KS | — | 390 | 1,150 | — | 1,540 | 96 | 6/27/2013 | 1995 | ||||||||||||||||
| Denny's | Topeka | KS | — | 630 | 446 | — | 1,076 | 37 | 6/27/2013 | 1995 | ||||||||||||||||
| Denny's | Bloomington | MN | — | 1,184 | — | — | 1,184 | — | 7/31/2013 | 1995 | ||||||||||||||||
| Denny's | Branson | MO | — | 620 | 2,209 | — | 2,829 | 185 | 6/27/2013 | 1995 | ||||||||||||||||
| Denny's | Kansas City | MO | — | 750 | 686 | — | 1,436 | 57 | 6/27/2013 | 1995 | ||||||||||||||||
| Denny's | N. Kansas City | MO | — | 630 | 937 | — | 1,567 | 78 | 6/27/2013 | 1995 | ||||||||||||||||
| Denny's | Sedalia | MO | — | 500 | 783 | — | 1,283 | 65 | 6/27/2013 | 1995 | ||||||||||||||||
| Denny's | Black Mountain | NC | — | 210 | 505 | — | 715 | 42 | 6/27/2013 | 1995 | ||||||||||||||||
| Denny's | Mooresville | NC | — | 250 | 841 | — | 1,091 | 70 | 6/27/2013 | 1995 | ||||||||||||||||
| Denny's | Henrietta | NY | — | 361 | 241 | — | 602 | 21 | 7/31/2013 | 1970 | ||||||||||||||||
| Denny's | Watertown | NY | — | 330 | 1,107 | — | 1,437 | 93 | 6/27/2013 | 1995 | ||||||||||||||||
| Denny's | Dover | OH | — | 610 | — | — | 610 | — | 6/27/2013 | 1970 | ||||||||||||||||
| Denny's | Fremont | OH | — | 320 | 975 | — | 1,295 | 82 | 6/27/2013 | 1995 | ||||||||||||||||
| Denny's | Marion | OH | — | 115 | 390 | — | 505 | 34 | 6/27/2013 | 1989 | ||||||||||||||||
| Denny's | Ontario | OR | — | 240 | 1,067 | — | 1,307 | 89 | 6/27/2013 | 1995 | ||||||||||||||||
| Denny's | Columbia | SC | — | 490 | 1,115 | — | 1,605 | 93 | 6/27/2013 | 1995 | ||||||||||||||||
| Denny's | Greenville | SC | — | 570 | 554 | — | 1,124 | 46 | 6/27/2013 | 1995 | ||||||||||||||||
| Denny's | Spartanburg | SC | — | 656 | 353 | — | 1,009 | 31 | 7/31/2013 | 1991 | ||||||||||||||||
F-130
| Initial Costs | Costs Capitalized Subsequent to Acquisition | Gross Amount Carried at December 31, 2014 (1) (2) | ||||||||||||||||||||||||
| Property | City | State | Encumbrances at December 31, 2014 | Land | Buildings, Fixtures and Improvements | Accumulated Depreciation (3) (4) | Date Acquired | Date of Construction | ||||||||||||||||||
| Denny's | Pasadena | TX | — | 500 | 1,316 | — | 1,816 | 110 | 6/27/2013 | 1995 | ||||||||||||||||
| Dick's Sporting Goods | Fort Gratiot | MI | — | 722 | 7,743 | — | 8,465 | 379 | 2/7/2014 | 2010 | ||||||||||||||||
| Dick's Sporting Goods | Moore | OK | — | 1,243 | 10,426 | — | 11,669 | 502 | 2/7/2014 | 2012 | ||||||||||||||||
| Dick's Sporting Goods | Charleston | SC | — | 3,733 | 5,025 | — | 8,758 | 255 | 2/7/2014 | 2005 | ||||||||||||||||
| Dick's Sporting Goods | Jackson | TN | — | 1,346 | 6,106 | — | 7,452 | 297 | 2/7/2014 | 2007 | ||||||||||||||||
| DJO, LLC | Vista | CA | — | 3,732 | 16,868 | — | 20,600 | 900 | 8/15/2014 | 2006 | ||||||||||||||||
| Dollar General | Andalusia | AL | — | 317 | 914 | — | 1,231 | 11 | 7/24/2014 | 2014 | ||||||||||||||||
| Dollar General | Birmingham | AL | — | 156 | 882 | — | 1,038 | 126 | 6/6/2012 | 2012 | ||||||||||||||||
| Dollar General | Bremen | AL | — | 59 | 1,017 | — | 1,076 | 18 | 9/29/2014 | 2014 | ||||||||||||||||
| Dollar General | Butler | AL | — | 338 | 1,093 | — | 1,431 | 49 | 3/28/2014 | 2014 | ||||||||||||||||
| Dollar General | Childersburg | AL | — | 328 | 986 | — | 1,314 | 49 | 2/7/2014 | 2013 | ||||||||||||||||
| Dollar General | Chunchula | AL | — | 174 | 697 | — | 871 | 106 | 4/26/2012 | 2012 | ||||||||||||||||
| Dollar General | Cullman | AL | — | 331 | 780 | — | 1,111 | 35 | 3/28/2014 | 2013 | ||||||||||||||||
| Dollar General | Cullman | AL | — | 221 | 861 | — | 1,082 | 13 | 9/26/2014 | 2014 | ||||||||||||||||
| Dollar General | Frisco City | AL | — | 121 | 836 | — | 957 | 41 | 2/26/2014 | 2014 | ||||||||||||||||
| Dollar General | Gardendale | AL | — | 142 | 805 | — | 947 | 107 | 8/9/2012 | 2012 | ||||||||||||||||
| Dollar General | Hartselle | AL | — | 473 | 983 | — | 1,456 | 49 | 2/7/2014 | 2013 | ||||||||||||||||
| Dollar General | Headland | AL | — | 387 | 1,091 | — | 1,478 | 19 | 8/13/2014 | 2014 | ||||||||||||||||
| Dollar General | Mobile | AL | — | 207 | 1,039 | — | 1,246 | 51 | 2/7/2014 | 2013 | ||||||||||||||||
| Dollar General | Moulton | AL | — | 517 | 1,207 | — | 1,724 | 184 | 4/26/2012 | 2012 | ||||||||||||||||
| Dollar General | Mt. Vernon | AL | — | 260 | 1,402 | — | 1,662 | 69 | 2/7/2014 | 2013 | ||||||||||||||||
| Dollar General | Ohatchee | AL | — | 97 | 942 | — | 1,039 | 31 | 4/17/2014 | 2014 | ||||||||||||||||
| Dollar General | Phenix City | AL | — | 267 | 929 | — | 1,196 | 45 | 2/7/2014 | 2012 | ||||||||||||||||
| Dollar General | Phenix City | AL | — | 386 | 1,104 | — | 1,490 | 55 | 2/7/2014 | 2013 | ||||||||||||||||
| Dollar General | Red Level | AL | 300 | 120 | 680 | — | 800 | 122 | 10/31/2011 | 2010 | ||||||||||||||||
| Dollar General | Sylacauga | AL | — | 120 | 968 | — | 1,088 | 47 | 2/7/2014 | 2013 | ||||||||||||||||
| Dollar General | Tarrant | AL | 697 | 217 | 869 | — | 1,086 | 148 | 12/12/2011 | 2011 | ||||||||||||||||
| Dollar General | Troy | AL | — | 67 | 963 | — | 1,030 | 47 | 2/7/2014 | 2013 | ||||||||||||||||
| Dollar General | Tuscaloosa | AL | 300 | 133 | 756 | — | 889 | 129 | 12/30/2011 | 2011 | ||||||||||||||||
| Dollar General | Vance | AL | — | 191 | 731 | — | 922 | 33 | 3/28/2014 | 2014 | ||||||||||||||||
| Dollar General | Ash Flat | AR | — | 44 | 132 | — | 176 | 19 | 6/19/2012 | 1997 | ||||||||||||||||
| Dollar General | Batesville | AR | — | 32 | 285 | — | 317 | 23 | 7/25/2013 | 1998 | ||||||||||||||||
F-131
| Initial Costs | Costs Capitalized Subsequent to Acquisition | Gross Amount Carried at December 31, 2014 (1) (2) | ||||||||||||||||||||||||
| Property | City | State | Encumbrances at December 31, 2014 | Land | Buildings, Fixtures and Improvements | Accumulated Depreciation (3) (4) | Date Acquired | Date of Construction | ||||||||||||||||||
| Dollar General | Batesville | AR | — | 42 | 374 | — | 416 | 31 | 7/25/2013 | 1999 | ||||||||||||||||
| Dollar General | Beebe | AR | — | 51 | 478 | — | 529 | 38 | 7/25/2013 | 1999 | ||||||||||||||||
| Dollar General | Bella Vista | AR | — | 129 | 302 | — | 431 | 53 | 11/10/2011 | 2005 | ||||||||||||||||
| Dollar General | Bergman | AR | — | 113 | 639 | — | 752 | 88 | 7/2/2012 | 2011 | ||||||||||||||||
| Dollar General | Blytheville | AR | — | 30 | 285 | — | 315 | 23 | 7/25/2013 | 2000 | ||||||||||||||||
| Dollar General | Carlisle | AR | — | 13 | 245 | — | 258 | 43 | 11/10/2011 | 2005 | ||||||||||||||||
| Dollar General | Des Arc | AR | — | 56 | 508 | — | 564 | 42 | 7/25/2013 | 1999 | ||||||||||||||||
| Dollar General | Dumas | AR | — | 46 | 412 | — | 458 | 34 | 7/25/2013 | 2000 | ||||||||||||||||
| Dollar General | Flippin | AR | — | 53 | 64 | — | 117 | 9 | 6/19/2012 | 1994 | ||||||||||||||||
| Dollar General | Gassville | AR | — | 54 | 325 | — | 379 | 26 | 7/25/2013 | 1999 | ||||||||||||||||
| Dollar General | Green Forest | AR | — | 52 | 303 | — | 355 | 52 | 11/10/2011 | 2005 | ||||||||||||||||
| Dollar General | Higden | AR | — | 52 | 469 | — | 521 | 38 | 7/25/2013 | 1995 | ||||||||||||||||
| Dollar General | Lake Village | AR | — | 64 | 362 | — | 426 | 30 | 7/25/2013 | 1995 | ||||||||||||||||
| Dollar General | Lepanto | AR | — | 43 | 389 | — | 432 | 32 | 7/25/2013 | 1995 | ||||||||||||||||
| Dollar General | Little Rock | AR | — | 73 | 412 | — | 485 | 34 | 7/25/2013 | 1995 | ||||||||||||||||
| Dollar General | Marvell | AR | — | 40 | 364 | — | 404 | 29 | 7/25/2013 | 1995 | ||||||||||||||||
| Dollar General | Maynard | AR | — | 73 | 654 | — | 727 | 75 | 12/4/2012 | 1995 | ||||||||||||||||
| Dollar General | McGehee | AR | — | 25 | 228 | — | 253 | 19 | 7/25/2013 | 1998 | ||||||||||||||||
| Dollar General | Quitman | AR | — | 45 | 426 | — | 471 | 34 | 7/25/2013 | 2001 | ||||||||||||||||
| Dollar General | Searcy | AR | — | 29 | 263 | — | 292 | 22 | 7/25/2013 | 1998 | ||||||||||||||||
| Dollar General | Tuckerman | AR | — | 49 | 280 | — | 329 | 23 | 7/25/2013 | 1999 | ||||||||||||||||
| Dollar General | White Hall | AR | — | 43 | 388 | — | 431 | 32 | 7/25/2013 | 1999 | ||||||||||||||||
| Dollar General | Wooster | AR | — | 74 | 664 | — | 738 | 76 | 12/4/2012 | 1995 | ||||||||||||||||
| Dollar General | Grand Ridge | FL | 300 | 76 | 684 | — | 760 | 117 | 12/30/2011 | 2010 | ||||||||||||||||
| Dollar General | Lakeland | FL | — | 413 | 1,810 | — | 2,223 | 87 | 2/7/2014 | 2012 | ||||||||||||||||
| Dollar General | Molino | FL | 400 | 178 | 1,007 | — | 1,185 | 181 | 10/31/2011 | 2011 | ||||||||||||||||
| Dollar General | Palatka | FL | — | 113 | 1,196 | — | 1,309 | 42 | 5/7/2014 | 2013 | ||||||||||||||||
| Dollar General | Panama City | FL | — | 139 | 312 | — | 451 | 39 | 6/19/2012 | 1987 | ||||||||||||||||
| Dollar General | Guyton | GA | — | 213 | 852 | — | 1,065 | 74 | 6/3/2013 | 2011 | ||||||||||||||||
| Dollar General | Lyerly | GA | — | 251 | 992 | — | 1,243 | 48 | 2/7/2014 | 2012 | ||||||||||||||||
| Dollar General | Shiloh | GA | — | 150 | 743 | — | 893 | 19 | 8/13/2014 | 2014 | ||||||||||||||||
| Dollar General | Thomaston | GA | — | 308 | 972 | — | 1,280 | 48 | 2/7/2014 | 2013 | ||||||||||||||||
F-132
| Initial Costs | Costs Capitalized Subsequent to Acquisition | Gross Amount Carried at December 31, 2014 (1) (2) | ||||||||||||||||||||||||
| Property | City | State | Encumbrances at December 31, 2014 | Land | Buildings, Fixtures and Improvements | Accumulated Depreciation (3) (4) | Date Acquired | Date of Construction | ||||||||||||||||||
| Dollar General | Cedar Falls | IA | — | 96 | 862 | — | 958 | 67 | 8/28/2013 | 2013 | ||||||||||||||||
| Dollar General | Center Point | IA | — | 136 | 772 | — | 908 | 89 | 12/31/2012 | 2012 | ||||||||||||||||
| Dollar General | Chariton | IA | — | 165 | 934 | — | 1,099 | 125 | 8/31/2012 | 2012 | ||||||||||||||||
| Dollar General | Eagle Grove | IA | — | 100 | 902 | — | 1,002 | 74 | 7/9/2013 | 2013 | ||||||||||||||||
| Dollar General | Estherville | IA | — | 226 | 903 | — | 1,129 | 112 | 10/25/2012 | 2012 | ||||||||||||||||
| Dollar General | Hampton | IA | 593 | 188 | 751 | — | 939 | 121 | 2/1/2012 | 2012 | ||||||||||||||||
| Dollar General | Lake Mills | IA | 511 | 81 | 728 | — | 809 | 118 | 2/1/2012 | 2012 | ||||||||||||||||
| Dollar General | Nashua | IA | — | 136 | 768 | — | 904 | 99 | 9/6/2012 | 2012 | ||||||||||||||||
| Dollar General | Ottumwa | IA | — | 143 | 812 | — | 955 | 89 | 1/31/2013 | 2012 | ||||||||||||||||
| Dollar General | Altamont | IL | 531 | 211 | 844 | — | 1,055 | 132 | 3/9/2012 | 2012 | ||||||||||||||||
| Dollar General | Carthage | IL | — | 48 | 908 | — | 956 | 121 | 8/31/2012 | 2012 | ||||||||||||||||
| Dollar General | DeSoto | IL | — | 138 | 784 | — | 922 | 79 | 3/26/2013 | 2013 | ||||||||||||||||
| Dollar General | Fairbury | IL | — | 96 | 867 | — | 963 | 75 | 6/7/2013 | 2013 | ||||||||||||||||
| Dollar General | Galatia | IL | — | 87 | 1,008 | — | 1,095 | 19 | 7/29/2014 | 2014 | ||||||||||||||||
| Dollar General | Henry | IL | — | 104 | 934 | — | 1,038 | 85 | 5/23/2013 | 2013 | ||||||||||||||||
| Dollar General | Jacksonville | IL | — | 145 | 823 | — | 968 | 110 | 8/31/2012 | 2012 | ||||||||||||||||
| Dollar General | Jonesboro | IL | — | 77 | 309 | — | 386 | 54 | 11/10/2011 | 2007 | ||||||||||||||||
| Dollar General | Lexington | IL | — | 100 | 899 | — | 999 | 116 | 9/21/2012 | 2012 | ||||||||||||||||
| Dollar General | Mackinaw | IL | — | 149 | 1,011 | — | 1,160 | 50 | 2/25/2014 | 2013 | ||||||||||||||||
| Dollar General | Mahomet | IL | — | 292 | 877 | — | 1,169 | 68 | 8/22/2013 | 2013 | ||||||||||||||||
| Dollar General | Marion | IL | — | 153 | 867 | — | 1,020 | 112 | 9/24/2012 | 1995 | ||||||||||||||||
| Dollar General | Minonk | IL | — | 56 | 1,034 | — | 1,090 | 20 | 7/2/2014 | 2014 | ||||||||||||||||
| Dollar General | Mount Morris | IL | — | 97 | 877 | — | 974 | 101 | 12/17/2012 | 2012 | ||||||||||||||||
| Dollar General | Park Forest | IL | — | 390 | 1,036 | — | 1,426 | 16 | 8/1/2014 | 2013 | ||||||||||||||||
| Dollar General | Pittsburg | IL | — | 97 | 915 | — | 1,012 | 41 | 3/31/2014 | 2014 | ||||||||||||||||
| Dollar General | Rockford | IL | — | 464 | 597 | — | 1,061 | 14 | 6/18/2014 | 2014 | ||||||||||||||||
| Dollar General | Roodhouse | IL | — | 207 | 829 | — | 1,036 | 95 | 12/31/2012 | 1995 | ||||||||||||||||
| Dollar General | Savanna | IL | — | 273 | 1,093 | — | 1,366 | 125 | 12/31/2012 | 2012 | ||||||||||||||||
F-133
| Initial Costs | Costs Capitalized Subsequent to Acquisition | Gross Amount Carried at December 31, 2014 (1) (2) | ||||||||||||||||||||||||
| Property | City | State | Encumbrances at December 31, 2014 | Land | Buildings, Fixtures and Improvements | Accumulated Depreciation (3) (4) | Date Acquired | Date of Construction | ||||||||||||||||||
| Dollar General | South Pekin | IL | — | 104 | 933 | — | 1,037 | 72 | 8/14/2013 | 2013 | ||||||||||||||||
| Dollar General | Bainbridge | IN | — | 131 | 765 | — | 896 | 11 | 9/22/2014 | 2010 | ||||||||||||||||
| Dollar General | Medaryville | IN | — | 96 | 914 | — | 1,010 | 28 | 7/31/2014 | 2014 | ||||||||||||||||
| Dollar General | Monroeville | IN | 486 | 112 | 636 | — | 748 | 109 | 12/22/2011 | 2011 | ||||||||||||||||
| Dollar General | Porter | IN | — | 243 | 995 | — | 1,238 | 18 | 5/29/2014 | 2014 | ||||||||||||||||
| Dollar General | Rensselaer | IN | — | 111 | 957 | — | 1,068 | 21 | 7/30/2014 | 2014 | ||||||||||||||||
| Dollar General | Richland | IN | — | 156 | 887 | — | 1,043 | 18 | 4/30/2014 | 2014 | ||||||||||||||||
| Dollar General | Schneider | IN | — | 124 | 1,010 | — | 1,134 | 14 | 9/17/2014 | 2014 | ||||||||||||||||
| Dollar General | Auburn | KS | — | 42 | 801 | — | 843 | 107 | 8/31/2012 | 2009 | ||||||||||||||||
| Dollar General | Caney | KS | — | 31 | 178 | — | 209 | 25 | 6/19/2012 | 1995 | ||||||||||||||||
| Dollar General | Cottonwood Falls | KS | — | 89 | 802 | — | 891 | 107 | 8/31/2012 | 2009 | ||||||||||||||||
| Dollar General | Erie | KS | — | 42 | 790 | — | 832 | 105 | 8/31/2012 | 2009 | ||||||||||||||||
| Dollar General | Garden City | KS | — | 136 | 771 | — | 907 | 103 | 8/31/2012 | 2010 | ||||||||||||||||
| Dollar General | Harper | KS | — | 91 | 818 | — | 909 | 109 | 8/31/2012 | 2009 | ||||||||||||||||
| Dollar General | Humboldt | KS | — | 44 | 828 | — | 872 | 110 | 8/31/2012 | 2010 | ||||||||||||||||
| Dollar General | Kingman | KS | — | 142 | 804 | — | 946 | 107 | 8/31/2012 | 2010 | ||||||||||||||||
| Dollar General | Medicine Lodge | KS | — | 40 | 765 | — | 805 | 102 | 8/31/2012 | 2010 | ||||||||||||||||
| Dollar General | Minneapolis | KS | — | 43 | 816 | — | 859 | 109 | 8/31/2012 | 2010 | ||||||||||||||||
| Dollar General | Pomona | KS | — | 42 | 796 | — | 838 | 106 | 8/31/2012 | 2010 | ||||||||||||||||
| Dollar General | Sedan | KS | — | 42 | 792 | — | 834 | 106 | 8/31/2012 | 2009 | ||||||||||||||||
| Dollar General | Syracuse | KS | — | 43 | 817 | — | 860 | 109 | 8/31/2012 | 2010 | ||||||||||||||||
| Dollar General | Berea | KY | — | 138 | 781 | — | 919 | 71 | 5/30/2013 | 2012 | ||||||||||||||||
| Dollar General | Coldiron | KY | — | 187 | 747 | — | 934 | 68 | 5/30/2013 | 2013 | ||||||||||||||||
| Dollar General | East Bernstadt | KY | — | 141 | 799 | — | 940 | 73 | 5/30/2013 | 2012 | ||||||||||||||||
| Dollar General | Eubank | KY | — | 137 | 775 | — | 912 | 71 | 5/30/2013 | 2013 | ||||||||||||||||
| Dollar General | Monticello | KY | — | 251 | 867 | — | 1,118 | 34 | 4/25/2014 | 2012 | ||||||||||||||||
| Dollar General | Nancy | KY | — | 81 | 733 | — | 814 | 112 | 4/26/2012 | 2011 | ||||||||||||||||
| Dollar General | Whitesburg | KY | — | 211 | 845 | — | 1,056 | 77 | 5/30/2013 | 2012 | ||||||||||||||||
F-134
| Initial Costs | Costs Capitalized Subsequent to Acquisition | Gross Amount Carried at December 31, 2014 (1) (2) | ||||||||||||||||||||||||
| Property | City | State | Encumbrances at December 31, 2014 | Land | Buildings, Fixtures and Improvements | Accumulated Depreciation (3) (4) | Date Acquired | Date of Construction | ||||||||||||||||||
| Dollar General | Bastrop | LA | — | 148 | 838 | — | 986 | 69 | 7/1/2013 | 2013 | ||||||||||||||||
| Dollar General | Choudrant | LA | 300 | 83 | 745 | — | 828 | 120 | 2/6/2012 | 2011 | ||||||||||||||||
| Dollar General | Converse | LA | — | 84 | 756 | — | 840 | 97 | 9/26/2012 | 2012 | ||||||||||||||||
| Dollar General | Doyline | LA | — | 88 | 793 | — | 881 | 95 | 11/27/2012 | 2012 | ||||||||||||||||
| Dollar General | Gardner | LA | 457 | 138 | 784 | — | 922 | 123 | 3/8/2012 | 2012 | ||||||||||||||||
| Dollar General | Grambling | LA | — | 597 | 719 | — | 1,316 | 37 | 2/7/2014 | 2012 | ||||||||||||||||
| Dollar General | Jonesville | LA | — | 103 | 929 | — | 1,032 | 120 | 9/27/2012 | 2012 | ||||||||||||||||
| Dollar General | Keithville | LA | — | 83 | 750 | — | 833 | 104 | 7/26/2012 | 2012 | ||||||||||||||||
| Dollar General | Lake Charles | LA | — | 102 | 919 | — | 1,021 | 148 | 2/29/2012 | 2012 | ||||||||||||||||
| Dollar General | Lake Charles | LA | — | 406 | 770 | — | 1,176 | 38 | 2/7/2014 | 2012 | ||||||||||||||||
| Dollar General | Mangham | LA | 300 | 40 | 759 | — | 799 | 123 | 2/6/2012 | 2011 | ||||||||||||||||
| Dollar General | Mount Hermon | LA | 400 | 94 | 842 | — | 936 | 136 | 2/6/2012 | 2009 | ||||||||||||||||
| Dollar General | New Iberia | LA | — | 315 | 736 | — | 1,051 | 112 | 4/26/2012 | 2011 | ||||||||||||||||
| Dollar General | Patterson | LA | — | 259 | 1,035 | — | 1,294 | 157 | 4/26/2012 | 2011 | ||||||||||||||||
| Dollar General | Richwood | LA | 400 | 97 | 869 | — | 966 | 140 | 2/6/2012 | 2011 | ||||||||||||||||
| Dollar General | Sarepta | LA | — | 131 | 743 | — | 874 | 99 | 8/9/2012 | 2011 | ||||||||||||||||
| Dollar General | St. Martinville | LA | — | 175 | 1,028 | — | 1,203 | 51 | 2/7/2014 | 2012 | ||||||||||||||||
| Dollar General | Thibodaux | LA | — | 234 | 1,146 | — | 1,380 | 57 | 2/7/2014 | 2012 | ||||||||||||||||
| Dollar General | West Monroe | LA | — | 153 | 869 | — | 1,022 | 136 | 3/9/2012 | 1995 | ||||||||||||||||
| Dollar General | Zachary | LA | — | 248 | 743 | — | 991 | 113 | 4/26/2012 | 2011 | ||||||||||||||||
| Dollar General | Adams | MA | — | 254 | 1,016 | — | 1,270 | 69 | 10/10/2013 | 2012 | ||||||||||||||||
| Dollar General | Bangor | MI | — | 173 | 691 | — | 864 | 95 | 7/10/2012 | 2012 | ||||||||||||||||
| Dollar General | Bronson | MI | — | 97 | 436 | — | 533 | 19 | 8/6/2014 | 1965 | ||||||||||||||||
| Dollar General | Cadillac | MI | 467 | 187 | 747 | — | 934 | 117 | 3/16/2012 | 2012 | ||||||||||||||||
| Dollar General | Camden | MI | — | 138 | 781 | — | 919 | 82 | 2/27/2013 | 2013 | ||||||||||||||||
| Dollar General | Carleton | MI | 445 | 222 | 666 | — | 888 | 104 | 3/16/2012 | 2011 | ||||||||||||||||
| Dollar General | Covert | MI | — | 37 | 704 | — | 741 | 94 | 8/30/2012 | 2012 | ||||||||||||||||
| Dollar General | Durand | MI | 455 | 181 | 726 | — | 907 | 107 | 5/18/2012 | 2012 | ||||||||||||||||
F-135
| Initial Costs | Costs Capitalized Subsequent to Acquisition | Gross Amount Carried at December 31, 2014 (1) (2) | ||||||||||||||||||||||||
| Property | City | State | Encumbrances at December 31, 2014 | Land | Buildings, Fixtures and Improvements | Accumulated Depreciation (3) (4) | Date Acquired | Date of Construction | ||||||||||||||||||
| Dollar General | East Jordan | MI | — | 125 | 709 | — | 834 | 98 | 7/10/2012 | 2012 | ||||||||||||||||
| Dollar General | Flint | MI | 416 | 83 | 743 | — | 826 | 110 | 5/18/2012 | 2012 | ||||||||||||||||
| Dollar General | Flint | MI | — | 91 | 820 | — | 911 | 102 | 10/31/2012 | 2012 | ||||||||||||||||
| Dollar General | Gaylord | MI | — | 172 | 687 | — | 859 | 95 | 7/10/2012 | 2012 | ||||||||||||||||
| Dollar General | Iron River | MI | — | 86 | 777 | — | 863 | 104 | 8/30/2012 | 2012 | ||||||||||||||||
| Dollar General | Manchester | MI | — | 213 | 853 | — | 1,066 | 90 | 2/27/2013 | 2013 | ||||||||||||||||
| Dollar General | Manistique | MI | — | 155 | 876 | — | 1,031 | 92 | 2/27/2013 | 2012 | ||||||||||||||||
| Dollar General | Melvindale | MI | — | 242 | 967 | — | 1,209 | 138 | 6/26/2012 | 2012 | ||||||||||||||||
| Dollar General | Mount Morris | MI | — | 110 | 988 | — | 1,098 | 104 | 2/27/2013 | 2012 | ||||||||||||||||
| Dollar General | Negaunee | MI | — | 87 | 779 | — | 866 | 104 | 8/30/2012 | 2012 | ||||||||||||||||
| Dollar General | Rapid City | MI | — | 179 | 716 | — | 895 | 75 | 2/27/2013 | 2012 | ||||||||||||||||
| Dollar General | Romulus | MI | — | 199 | 794 | — | 993 | 84 | 2/27/2013 | 2011 | ||||||||||||||||
| Dollar General | Roscommon | MI | — | 87 | 781 | — | 868 | 104 | 8/30/2012 | 2012 | ||||||||||||||||
| Dollar General | Wakefield | MI | — | 88 | 794 | — | 882 | 91 | 12/19/2012 | 2012 | ||||||||||||||||
| Dollar General | Albert Lea | MN | — | 223 | 551 | — | 774 | 16 | 5/30/2014 | 1960 | ||||||||||||||||
| Dollar General | Annandale | MN | — | 212 | 848 | — | 1,060 | 65 | 8/2/2013 | 2013 | ||||||||||||||||
| Dollar General | Barnesville | MN | — | 86 | 841 | — | 927 | 41 | 2/26/2014 | 2014 | ||||||||||||||||
| Dollar General | Cohasset | MN | — | 87 | 964 | — | 1,051 | 34 | 5/2/2014 | 2013 | ||||||||||||||||
| Dollar General | Ely | MN | — | 174 | 944 | — | 1,118 | 19 | 4/30/2014 | 2014 | ||||||||||||||||
| Dollar General | Hawley | MN | — | 89 | 803 | — | 892 | 55 | 10/16/2013 | 2013 | ||||||||||||||||
| Dollar General | Melrose | MN | — | 96 | 863 | — | 959 | 99 | 12/17/2012 | 2012 | ||||||||||||||||
| Dollar General | Milaca | MN | — | 102 | 916 | — | 1,018 | 66 | 9/24/2013 | 2013 | ||||||||||||||||
| Dollar General | Montgomery | MN | — | 87 | 783 | — | 870 | 90 | 12/17/2012 | 2012 | ||||||||||||||||
| Dollar General | Olivia | MN | — | 98 | 884 | — | 982 | 97 | 1/31/2013 | 2012 | ||||||||||||||||
| Dollar General | Pequot Lakes | MN | — | 155 | 880 | — | 1,035 | 68 | 8/22/2013 | 2013 | ||||||||||||||||
| Dollar General | Richmond | MN | — | 96 | 836 | — | 932 | 41 | 2/20/2014 | 2014 | ||||||||||||||||
| Dollar General | Roseau | MN | — | 143 | 808 | — | 951 | 55 | 10/30/2013 | 2013 | ||||||||||||||||
| Dollar General | Rush City | MN | — | 126 | 716 | — | 842 | 99 | 7/25/2012 | 2012 | ||||||||||||||||
F-136
| Initial Costs | Costs Capitalized Subsequent to Acquisition | Gross Amount Carried at December 31, 2014 (1) (2) | ||||||||||||||||||||||||
| Property | City | State | Encumbrances at December 31, 2014 | Land | Buildings, Fixtures and Improvements | Accumulated Depreciation (3) (4) | Date Acquired | Date of Construction | ||||||||||||||||||
| Dollar General | Springfield | MN | — | 88 | 795 | — | 883 | 91 | 12/26/2012 | 2012 | ||||||||||||||||
| Dollar General | Staples | MN | — | 150 | 848 | — | 998 | 62 | 9/4/2013 | 2013 | ||||||||||||||||
| Dollar General | Virginia | MN | — | 147 | 831 | — | 978 | 91 | 1/14/2013 | 2012 | ||||||||||||||||
| Dollar General | Appleton City | MO | — | 22 | 124 | — | 146 | 22 | 11/10/2011 | 2004 | ||||||||||||||||
| Dollar General | Ash Grove | MO | — | 35 | 315 | — | 350 | 55 | 11/10/2011 | 2006 | ||||||||||||||||
| Dollar General | Ashland | MO | — | 70 | 398 | — | 468 | 70 | 11/10/2011 | 2006 | ||||||||||||||||
| Dollar General | Aurora | MO | — | 98 | 881 | — | 979 | 93 | 2/28/2013 | 2013 | ||||||||||||||||
| Dollar General | Auxvasse | MO | 300 | 72 | 650 | — | 722 | 114 | 11/22/2011 | 2011 | ||||||||||||||||
| Dollar General | Belton | MO | — | 105 | 948 | — | 1,053 | 127 | 8/3/2012 | 2012 | ||||||||||||||||
| Dollar General | Berkeley | MO | — | 132 | 748 | — | 880 | 93 | 10/9/2012 | 2012 | ||||||||||||||||
| Dollar General | Bernie | MO | — | 35 | 314 | — | 349 | 55 | 11/10/2011 | 2007 | ||||||||||||||||
| Dollar General | Billings | MO | — | 139 | 790 | — | 929 | 54 | 10/17/2013 | 2013 | ||||||||||||||||
| Dollar General | Bloomfield | MO | — | 23 | 215 | — | 238 | 37 | 11/10/2011 | 2005 | ||||||||||||||||
| Dollar General | Cardwell | MO | — | 89 | 805 | — | 894 | 107 | 8/24/2012 | 2012 | ||||||||||||||||
| Dollar General | Carterville | MO | — | 10 | 192 | — | 202 | 34 | 11/10/2011 | 2004 | ||||||||||||||||
| Dollar General | Caruthersville | MO | — | 98 | 878 | — | 976 | 113 | 9/27/2012 | 2012 | ||||||||||||||||
| Dollar General | Caulfield | MO | — | 139 | 789 | — | 928 | 91 | 12/31/2012 | 2012 | ||||||||||||||||
| Dollar General | Clarkton | MO | — | 19 | 354 | — | 373 | 62 | 11/10/2011 | 2007 | ||||||||||||||||
| Dollar General | Clever | MO | — | 136 | 542 | — | 678 | 77 | 6/19/2012 | 2010 | ||||||||||||||||
| Dollar General | Conway | MO | 300 | 37 | 694 | — | 731 | 122 | 11/22/2011 | 2011 | ||||||||||||||||
| Dollar General | De Soto | MO | — | 101 | 912 | — | 1,013 | 96 | 2/14/2013 | 2013 | ||||||||||||||||
| Dollar General | Diamond | MO | — | 44 | 175 | — | 219 | 31 | 11/10/2011 | 2005 | ||||||||||||||||
| Dollar General | Doolittle | MO | — | 137 | 778 | — | 915 | 60 | 8/2/2013 | 2013 | ||||||||||||||||
| Dollar General | Eagle Rock | MO | — | 133 | 786 | — | 919 | 39 | 2/26/2014 | 2014 | ||||||||||||||||
| Dollar General | Edina | MO | — | 127 | 722 | — | 849 | 93 | 9/13/2012 | 2012 | ||||||||||||||||
| Dollar General | Eldon | MO | — | 52 | 986 | — | 1,038 | 104 | 2/14/2013 | 2013 | ||||||||||||||||
| Dollar General | Ellsinore | MO | — | 30 | 579 | — | 609 | 102 | 11/10/2011 | 2010 | ||||||||||||||||
| Dollar General | Gower | MO | — | 118 | 668 | — | 786 | 89 | 8/31/2012 | 2012 | ||||||||||||||||
F-137
| Initial Costs | Costs Capitalized Subsequent to Acquisition | Gross Amount Carried at December 31, 2014 (1) (2) | ||||||||||||||||||||||||
| Property | City | State | Encumbrances at December 31, 2014 | Land | Buildings, Fixtures and Improvements | Accumulated Depreciation (3) (4) | Date Acquired | Date of Construction | ||||||||||||||||||
| Dollar General | Hallsville | MO | — | 29 | 263 | — | 292 | 46 | 11/10/2011 | 2004 | ||||||||||||||||
| Dollar General | Hawk Point | MO | — | 177 | 709 | — | 886 | 95 | 8/24/2012 | 2012 | ||||||||||||||||
| Dollar General | Humansville | MO | — | 69 | 277 | — | 346 | 40 | 6/19/2012 | 2007 | ||||||||||||||||
| Dollar General | Jennings | MO | — | 445 | 826 | — | 1,271 | 114 | 7/13/2012 | 2012 | ||||||||||||||||
| Dollar General | Joplin | MO | — | 144 | 816 | — | 960 | 52 | 11/12/2013 | 2013 | ||||||||||||||||
| Dollar General | Kansas City | MO | — | 313 | 731 | — | 1,044 | 94 | 9/21/2012 | 2012 | ||||||||||||||||
| Dollar General | King City | MO | 300 | 33 | 625 | — | 658 | 110 | 11/22/2011 | 2010 | ||||||||||||||||
| Dollar General | Laurie | MO | — | 102 | 918 | — | 1,020 | 58 | 11/15/2013 | 2013 | ||||||||||||||||
| Dollar General | Lawson | MO | — | 29 | 162 | — | 191 | 29 | 11/10/2011 | 2003 | ||||||||||||||||
| Dollar General | Lebanon | MO | — | 177 | 708 | — | 885 | 91 | 9/24/2012 | 2012 | ||||||||||||||||
| Dollar General | Lebanon | MO | — | 278 | 835 | — | 1,113 | 107 | 9/21/2012 | 2012 | ||||||||||||||||
| Dollar General | Lexington | MO | — | 149 | 846 | — | 995 | 61 | 9/13/2013 | 2013 | ||||||||||||||||
| Dollar General | Licking | MO | 300 | 76 | 688 | — | 764 | 121 | 11/22/2011 | 2010 | ||||||||||||||||
| Dollar General | Lilbourn | MO | — | 62 | 554 | — | 616 | 97 | 11/10/2011 | 2010 | ||||||||||||||||
| Dollar General | Lonedell | MO | — | 208 | 833 | — | 1,041 | 80 | 4/26/2013 | 2013 | ||||||||||||||||
| Dollar General | Malden | MO | — | 108 | 974 | — | 1,082 | 75 | 8/2/2013 | 2013 | ||||||||||||||||
| Dollar General | Marble Hill | MO | — | 104 | 935 | — | 1,039 | 120 | 9/11/2012 | 2012 | ||||||||||||||||
| Dollar General | Marionville | MO | — | 89 | 797 | — | 886 | 99 | 10/31/2012 | 2012 | ||||||||||||||||
| Dollar General | Marthasville | MO | 300 | 41 | 782 | — | 823 | 126 | 2/1/2012 | 2011 | ||||||||||||||||
| Dollar General | Maysville | MO | 300 | 107 | 607 | — | 714 | 109 | 10/31/2011 | 2010 | ||||||||||||||||
| Dollar General | Morehouse | MO | — | 87 | 783 | — | 870 | 101 | 9/7/2012 | 2012 | ||||||||||||||||
F-138
| Initial Costs | Costs Capitalized Subsequent to Acquisition | Gross Amount Carried at December 31, 2014 (1) (2) | ||||||||||||||||||||||||
| Property | City | State | Encumbrances at December 31, 2014 | Land | Buildings, Fixtures and Improvements | Accumulated Depreciation (3) (4) | Date Acquired | Date of Construction | ||||||||||||||||||
| Dollar General | New Haven | MO | — | 176 | 702 | — | 878 | 107 | 4/27/2012 | 2012 | ||||||||||||||||
| Dollar General | Oak Grove | MO | — | 27 | 106 | — | 133 | 15 | 6/19/2012 | 1999 | ||||||||||||||||
| Dollar General | Oran | MO | 419 | 83 | 747 | — | 830 | 117 | 3/30/2012 | 2012 | ||||||||||||||||
| Dollar General | Osceola | MO | — | 93 | 835 | — | 928 | 88 | 2/19/2013 | 2012 | ||||||||||||||||
| Dollar General | Ozark | MO | 474 | 190 | 758 | — | 948 | 115 | 4/27/2012 | 2012 | ||||||||||||||||
| Dollar General | Ozark | MO | — | 149 | 842 | — | 991 | 108 | 9/24/2012 | 2012 | ||||||||||||||||
| Dollar General | Pacific | MO | — | 151 | 853 | — | 1,004 | 122 | 6/6/2012 | 2012 | ||||||||||||||||
| Dollar General | Palmyra | MO | — | 40 | 225 | — | 265 | 32 | 6/19/2012 | 2003 | ||||||||||||||||
| Dollar General | Plattsburg | MO | — | 44 | 843 | — | 887 | 112 | 8/9/2012 | 2012 | ||||||||||||||||
| Dollar General | Qulin | MO | — | 30 | 573 | — | 603 | 101 | 11/10/2011 | 2009 | ||||||||||||||||
| Dollar General | Robertsville | MO | — | 131 | 744 | — | 875 | 99 | 8/24/2012 | 2011 | ||||||||||||||||
| Dollar General | Rocky Mount | MO | — | 88 | 789 | — | 877 | 105 | 8/31/2012 | 2012 | ||||||||||||||||
| Dollar General | Rolla | MO | — | 209 | 835 | — | 1,044 | 65 | 8/21/2013 | 2013 | ||||||||||||||||
| Dollar General | Savannah | MO | — | 270 | 811 | — | 1,081 | 63 | 8/23/2013 | 2013 | ||||||||||||||||
| Dollar General | Sedadia | MO | — | 273 | 637 | — | 910 | 82 | 9/7/2012 | 2012 | ||||||||||||||||
| Dollar General | Senath | MO | — | 61 | 552 | — | 613 | 79 | 6/19/2012 | 2010 | ||||||||||||||||
| Dollar General | Seneca | MO | — | 47 | 189 | — | 236 | 27 | 6/19/2012 | 1962 | ||||||||||||||||
| Dollar General | Shelbina | MO | — | 101 | 911 | — | 1,012 | 83 | 5/22/2013 | 2013 | ||||||||||||||||
| Dollar General | Sikeston | MO | 555 | 56 | 1,056 | — | 1,112 | 170 | 2/24/2012 | 2011 | ||||||||||||||||
| Dollar General | Sikeston | MO | — | 144 | 819 | — | 963 | 109 | 8/24/2012 | 2012 | ||||||||||||||||
| Dollar General | Springfield | MO | — | 378 | 702 | — | 1,080 | 100 | 6/14/2012 | 2012 | ||||||||||||||||
| Dollar General | St. Clair | MO | 400 | 220 | 879 | — | 1,099 | 150 | 12/30/2011 | 1995 | ||||||||||||||||
| Dollar General | St. James | MO | — | 81 | 244 | — | 325 | 35 | 6/19/2012 | 1999 | ||||||||||||||||
| Dollar General | St. Louis | MO | — | 372 | 692 | — | 1,064 | 92 | 8/31/2012 | 2012 | ||||||||||||||||
| Dollar General | St. Louis | MO | — | 260 | 606 | — | 866 | 78 | 9/26/2012 | 2012 | ||||||||||||||||
| Dollar General | Stanberry | MO | 300 | 111 | 629 | — | 740 | 110 | 11/22/2011 | 2010 | ||||||||||||||||
| Dollar General | Steele | MO | — | 31 | 598 | — | 629 | 105 | 11/10/2011 | 2009 | ||||||||||||||||
| Dollar General | Strafford | MO | — | 51 | 471 | — | 522 | 81 | 11/10/2011 | 2009 | ||||||||||||||||
| Dollar General | Vienna | MO | 394 | 78 | 704 | — | 782 | 114 | 2/24/2012 | 2011 | ||||||||||||||||
F-139
| Initial Costs | Costs Capitalized Subsequent to Acquisition | Gross Amount Carried at December 31, 2014 (1) (2) | ||||||||||||||||||||||||
| Property | City | State | Encumbrances at December 31, 2014 | Land | Buildings, Fixtures and Improvements | Accumulated Depreciation (3) (4) | Date Acquired | Date of Construction | ||||||||||||||||||
| Dollar General | West Plains | MO | — | 90 | 769 | — | 859 | 38 | 2/20/2014 | 2014 | ||||||||||||||||
| Dollar General | Willow Springs | MO | — | 24 | 213 | — | 237 | 30 | 6/19/2012 | 2002 | ||||||||||||||||
| Dollar General | Windsor | MO | — | 86 | 829 | — | 915 | 41 | 2/20/2014 | 2014 | ||||||||||||||||
| Dollar General | Winona | MO | — | 52 | 155 | — | 207 | 22 | 6/19/2012 | 2001 | ||||||||||||||||
| Dollar General | Edwards | MS | 300 | 75 | 671 | — | 746 | 115 | 12/30/2011 | 2011 | ||||||||||||||||
| Dollar General | Greenville | MS | 300 | 82 | 739 | — | 821 | 126 | 12/30/2011 | 2011 | ||||||||||||||||
| Dollar General | Hickory | MS | — | 77 | 692 | — | 769 | 96 | 7/2/2012 | 2011 | ||||||||||||||||
| Dollar General | Jackson | MS | — | 198 | 793 | — | 991 | 102 | 9/27/2012 | 2011 | ||||||||||||||||
| Dollar General | Meridian | MS | — | 178 | 713 | — | 891 | 92 | 9/13/2012 | 2011 | ||||||||||||||||
| Dollar General | Meridian | MS | — | 40 | 754 | — | 794 | 97 | 9/13/2012 | 2011 | ||||||||||||||||
| Dollar General | Moorhead | MS | 356 | 107 | 606 | — | 713 | 89 | 5/1/2012 | 2011 | ||||||||||||||||
| Dollar General | Natchez | MS | — | 166 | 664 | — | 830 | 95 | 6/12/2012 | 2012 | ||||||||||||||||
| Dollar General | Soso | MS | 385 | 116 | 658 | — | 774 | 100 | 4/12/2012 | 2011 | ||||||||||||||||
| Dollar General | Stonewall | MS | — | 116 | 655 | — | 771 | 90 | 7/2/2012 | 2011 | ||||||||||||||||
| Dollar General | Stringer | MS | — | 116 | 655 | — | 771 | 91 | 7/2/2012 | 2011 | ||||||||||||||||
| Dollar General | Walnut Grove | MS | 300 | 71 | 641 | — | 712 | 110 | 12/30/2011 | 2011 | ||||||||||||||||
| Dollar General | Edenton | NC | — | 240 | 1,025 | — | 1,265 | 51 | 2/28/2014 | 2013 | ||||||||||||||||
| Dollar General | Fayetteville | NC | 300 | 216 | 647 | — | 863 | 105 | 2/6/2012 | 2011 | ||||||||||||||||
| Dollar General | Hendersonville | NC | — | 360 | 1,034 | — | 1,394 | 51 | 2/7/2014 | 2013 | ||||||||||||||||
| Dollar General | Hickory | NC | — | 89 | 804 | — | 893 | 107 | 8/13/2012 | 2012 | ||||||||||||||||
| Dollar General | Morganton | NC | — | 472 | 1,108 | — | 1,580 | 55 | 2/7/2014 | 2013 | ||||||||||||||||
| Dollar General | Ocean Isle Beach | NC | 400 | 341 | 633 | — | 974 | 102 | 2/6/2012 | 2011 | ||||||||||||||||
| Dollar General | Tryon | NC | — | 139 | 789 | — | 928 | 105 | 8/13/2012 | 2012 | ||||||||||||||||
| Dollar General | Vass | NC | 300 | 226 | 528 | — | 754 | 85 | 2/6/2012 | 2011 | ||||||||||||||||
| Dollar General | Farmington | NM | — | 269 | 807 | — | 1,076 | 104 | 9/6/2012 | 2012 | ||||||||||||||||
| Dollar General | Farmington | NM | — | 224 | 898 | — | 1,122 | 74 | 7/11/2013 | 2013 | ||||||||||||||||
| Dollar General | Modena | NY | — | 249 | 996 | — | 1,245 | 68 | 10/10/2013 | 2012 | ||||||||||||||||
F-140
| Initial Costs | Costs Capitalized Subsequent to Acquisition | Gross Amount Carried at December 31, 2014 (1) (2) | ||||||||||||||||||||||||
| Property | City | State | Encumbrances at December 31, 2014 | Land | Buildings, Fixtures and Improvements | Accumulated Depreciation (3) (4) | Date Acquired | Date of Construction | ||||||||||||||||||
| Dollar General | Fairfield | OH | — | 131 | 1,272 | — | 1,403 | 59 | 2/7/2014 | 2013 | ||||||||||||||||
| Dollar General | Forest | OH | 300 | 76 | 681 | — | 757 | 123 | 10/31/2011 | 2010 | ||||||||||||||||
| Dollar General | Gratis | OH | — | 161 | 1,042 | — | 1,203 | 52 | 2/18/2014 | 2013 | ||||||||||||||||
| Dollar General | Greenfield | OH | 400 | 110 | 986 | — | 1,096 | 159 | 2/23/2012 | 2011 | ||||||||||||||||
| Dollar General | Hicksville | OH | — | 156 | 1,490 | — | 1,646 | 70 | 2/7/2014 | 2012 | ||||||||||||||||
| Dollar General | Loudonville | OH | — | 236 | 945 | — | 1,181 | 135 | 6/6/2012 | 2012 | ||||||||||||||||
| Dollar General | Lowell | OH | — | 157 | 1,114 | — | 1,271 | 53 | 2/7/2014 | 2012 | ||||||||||||||||
| Dollar General | Lucasville | OH | — | 223 | 893 | — | 1,116 | 132 | 5/16/2012 | 2012 | ||||||||||||||||
| Dollar General | New Charlisle | OH | — | 215 | 860 | — | 1,075 | 119 | 7/10/2012 | 2012 | ||||||||||||||||
| Dollar General | New Matamoras | OH | 300 | 123 | 696 | — | 819 | 125 | 10/31/2011 | 2010 | ||||||||||||||||
| Dollar General | Payne | OH | 300 | 81 | 729 | — | 810 | 131 | 10/31/2011 | 2010 | ||||||||||||||||
| Dollar General | Pemberville | OH | — | 146 | 1,059 | — | 1,205 | 51 | 2/7/2014 | 2012 | ||||||||||||||||
| Dollar General | Pleasant City | OH | 300 | 131 | 740 | — | 871 | 133 | 10/31/2011 | 2010 | ||||||||||||||||
| Dollar General | Sandusky | OH | — | 210 | 1,700 | — | 1,910 | 80 | 2/7/2014 | 2012 | ||||||||||||||||
| Dollar General | Toledo | OH | — | 252 | 1,149 | — | 1,401 | 54 | 2/7/2014 | 2012 | ||||||||||||||||
| Dollar General | Wheelersburg | OH | — | 395 | 1,132 | — | 1,527 | 56 | 2/25/2014 | 1925 | ||||||||||||||||
| Dollar General | Broken Bow | OK | — | 331 | 1,325 | — | 1,656 | 40 | 5/19/2014 | 2012 | ||||||||||||||||
| Dollar General | Calera | OK | — | 136 | 770 | — | 906 | 103 | 8/31/2012 | 2010 | ||||||||||||||||
| Dollar General | Commerce | OK | — | 38 | 341 | — | 379 | 60 | 11/10/2011 | 2006 | ||||||||||||||||
| Dollar General | Hartshorne | OK | — | 100 | 898 | — | 998 | 120 | 8/31/2012 | 2010 | ||||||||||||||||
| Dollar General | Lexington | OK | — | 85 | 761 | — | 846 | 102 | 8/31/2012 | 2010 | ||||||||||||||||
| Dollar General | Maud | OK | — | 76 | 688 | — | 764 | 92 | 8/31/2012 | 2010 | ||||||||||||||||
| Dollar General | Maysville | OK | — | 41 | 785 | — | 826 | 105 | 8/31/2012 | 2010 | ||||||||||||||||
| Dollar General | Ponca City | OK | — | 145 | 1,161 | — | 1,306 | 54 | 2/7/2014 | 2012 | ||||||||||||||||
| Dollar General | Rush Spring | OK | — | 87 | 779 | — | 866 | 104 | 8/31/2012 | 2010 | ||||||||||||||||
| Dollar General | Sand Springs | OK | — | 143 | 811 | — | 954 | 59 | 9/3/2013 | 2013 | ||||||||||||||||
| Dollar General | Sand Springs | OK | — | 43 | 819 | — | 862 | 59 | 9/3/2013 | 2013 | ||||||||||||||||
| Dollar General | Sand Springs | OK | — | 198 | 791 | — | 989 | 57 | 9/3/2013 | 2012 | ||||||||||||||||
| Dollar General | Tahlequah | OK | — | 123 | 1,101 | — | 1,224 | 51 | 2/7/2014 | 2012 | ||||||||||||||||
F-141
| Initial Costs | Costs Capitalized Subsequent to Acquisition | Gross Amount Carried at December 31, 2014 (1) (2) | ||||||||||||||||||||||||
| Property | City | State | Encumbrances at December 31, 2014 | Land | Buildings, Fixtures and Improvements | Accumulated Depreciation (3) (4) | Date Acquired | Date of Construction | ||||||||||||||||||
| Dollar General | Wagoner | OK | — | 31 | 1,076 | — | 1,107 | 50 | 2/7/2014 | 2012 | ||||||||||||||||
| Dollar General | Pleasantville | PA | — | 163 | 941 | — | 1,104 | 42 | 3/24/2014 | 2013 | ||||||||||||||||
| Dollar General | Sykesville | PA | — | 68 | 1,075 | — | 1,143 | 48 | 3/24/2014 | 2013 | ||||||||||||||||
| Dollar General | Wattsburg | PA | — | 96 | 1,031 | — | 1,127 | 46 | 3/24/2014 | 2014 | ||||||||||||||||
| Dollar General | Holly Hill | SC | 1,983 | 259 | 2,333 | — | 2,592 | 235 | 3/6/2013 | 2013 | ||||||||||||||||
| Dollar General | West Union | SC | — | 46 | 868 | — | 914 | 71 | 7/3/2013 | 2011 | ||||||||||||||||
| Dollar General | Doyle | TN | — | 75 | 679 | — | 754 | 91 | 8/22/2012 | 2012 | ||||||||||||||||
| Dollar General | Manchester | TN | — | 114 | 646 | — | 760 | 89 | 7/26/2012 | 2012 | ||||||||||||||||
| Dollar General | McMinnville | TN | — | 120 | 679 | — | 799 | 94 | 7/12/2012 | 2012 | ||||||||||||||||
| Dollar General | Pleasant Hill | TN | 300 | 39 | 747 | — | 786 | 128 | 12/30/2011 | 2011 | ||||||||||||||||
| Dollar General | Academy | TX | — | 122 | 693 | — | 815 | 105 | 4/27/2012 | 2012 | ||||||||||||||||
| Dollar General | Adkins | TX | — | 157 | 889 | — | 1,046 | 102 | 12/31/2012 | 2012 | ||||||||||||||||
| Dollar General | Amarillo | TX | — | 97 | 877 | — | 974 | 68 | 8/13/2013 | 2013 | ||||||||||||||||
| Dollar General | Amarillo | TX | — | 153 | 866 | — | 1,019 | 67 | 8/2/2013 | 2013 | ||||||||||||||||
| Dollar General | Amarillo | TX | — | 198 | 794 | — | 992 | 65 | 7/11/2013 | 2013 | ||||||||||||||||
| Dollar General | Avinger | TX | — | 44 | 830 | — | 874 | 64 | 8/8/2013 | 2013 | ||||||||||||||||
| Dollar General | Beeville | TX | — | 90 | 810 | — | 900 | 97 | 11/19/2012 | 2012 | ||||||||||||||||
| Dollar General | Belton | TX | — | 89 | 804 | — | 893 | 85 | 2/28/2013 | 2013 | ||||||||||||||||
| Dollar General | Blessing | TX | — | 83 | 745 | — | 828 | 85 | 12/18/2012 | 2012 | ||||||||||||||||
| Dollar General | Boling | TX | — | 92 | 831 | — | 923 | 64 | 8/13/2013 | 2013 | ||||||||||||||||
| Dollar General | Brookeland | TX | — | 93 | 840 | — | 933 | 65 | 8/15/2013 | 2013 | ||||||||||||||||
| Dollar General | Bryan | TX | — | 148 | 840 | — | 988 | 108 | 9/14/2012 | 2012 | ||||||||||||||||
| Dollar General | Bryan | TX | — | 193 | 772 | — | 965 | 99 | 9/14/2012 | 2012 | ||||||||||||||||
| Dollar General | Bryan | TX | — | 185 | 740 | — | 925 | 99 | 8/31/2012 | 2009 | ||||||||||||||||
| Dollar General | Buchanan Dam | TX | 562 | 145 | 820 | — | 965 | 106 | 9/28/2012 | 2012 | ||||||||||||||||
| Dollar General | Canyon Lake | TX | — | 149 | 843 | — | 992 | 105 | 10/12/2012 | 2012 | ||||||||||||||||
| Dollar General | Cedar Creek | TX | — | 291 | 680 | — | 971 | 81 | 11/16/2012 | 2012 | ||||||||||||||||
| Dollar General | Como | TX | 386 | 76 | 683 | — | 759 | 104 | 4/20/2012 | 2012 | ||||||||||||||||
F-142
| Initial Costs | Costs Capitalized Subsequent to Acquisition | Gross Amount Carried at December 31, 2014 (1) (2) | ||||||||||||||||||||||||
| Property | City | State | Encumbrances at December 31, 2014 | Land | Buildings, Fixtures and Improvements | Accumulated Depreciation (3) (4) | Date Acquired | Date of Construction | ||||||||||||||||||
| Dollar General | Corpus Christi | TX | — | 270 | 809 | — | 1,079 | 93 | 12/26/2012 | 2012 | ||||||||||||||||
| Dollar General | Diana | TX | — | 186 | 743 | — | 929 | 57 | 8/27/2013 | 2013 | ||||||||||||||||
| Dollar General | Dickinson | TX | — | 87 | 786 | — | 873 | 101 | 9/25/2012 | 2012 | ||||||||||||||||
| Dollar General | Donna | TX | — | 136 | 768 | — | 904 | 99 | 9/11/2012 | 2012 | ||||||||||||||||
| Dollar General | Donna | TX | — | 200 | 799 | — | 999 | 99 | 10/12/2012 | 2012 | ||||||||||||||||
| Dollar General | Donna | TX | — | 145 | 820 | — | 965 | 90 | 1/31/2013 | 2012 | ||||||||||||||||
| Dollar General | Edinburg | TX | — | 136 | 769 | — | 905 | 99 | 9/7/2012 | 2012 | ||||||||||||||||
| Dollar General | Edinburg | TX | — | 102 | 914 | — | 1,016 | 75 | 7/16/2013 | 2013 | ||||||||||||||||
| Dollar General | Elmendorf | TX | — | 94 | 847 | — | 941 | 105 | 10/23/2012 | 2012 | ||||||||||||||||
| Dollar General | Ganado | TX | — | 95 | 857 | — | 952 | 66 | 8/13/2013 | 2013 | ||||||||||||||||
| Dollar General | Gladewater | TX | — | 184 | 736 | — | 920 | 98 | 8/31/2012 | 2009 | ||||||||||||||||
| Dollar General | Gordonville | TX | 384 | 38 | 717 | — | 755 | 109 | 4/20/2012 | 2012 | ||||||||||||||||
| Dollar General | Kyle | TX | — | 132 | 747 | — | 879 | 96 | 9/26/2012 | 2012 | ||||||||||||||||
| Dollar General | Kyle | TX | — | 101 | 910 | — | 1,011 | 53 | 12/6/2013 | 2013 | ||||||||||||||||
| Dollar General | La Marque | TX | — | 102 | 917 | — | 1,019 | 122 | 8/31/2012 | 2010 | ||||||||||||||||
| Dollar General | Lacy Lakeview | TX | — | 146 | 826 | — | 972 | 99 | 11/16/2012 | 2012 | ||||||||||||||||
| Dollar General | Laredo | TX | — | 253 | 758 | — | 1,011 | 105 | 7/31/2012 | 2012 | ||||||||||||||||
| Dollar General | Lubbock | TX | — | 267 | 801 | — | 1,068 | 107 | 8/31/2012 | 2010 | ||||||||||||||||
| Dollar General | Lubbock | TX | — | 199 | 796 | — | 995 | 61 | 8/28/2013 | 2013 | ||||||||||||||||
| Dollar General | Lubbock | TX | — | 148 | 841 | — | 989 | 77 | 5/16/2013 | 2013 | ||||||||||||||||
| Dollar General | Lubbock | TX | — | 41 | 825 | — | 866 | 41 | 2/20/2014 | 2014 | ||||||||||||||||
| Dollar General | Lyford | TX | 300 | 80 | 724 | — | 804 | 124 | 12/30/2011 | 2010 | ||||||||||||||||
| Dollar General | Lytle | TX | — | 243 | 971 | — | 1,214 | 66 | 10/30/2013 | 2013 | ||||||||||||||||
| Dollar General | Mercedes | TX | — | 215 | 859 | — | 1,074 | 66 | 8/2/2013 | 2013 | ||||||||||||||||
| Dollar General | Mission | TX | — | 158 | 894 | — | 1,052 | 90 | 3/27/2013 | 2013 | ||||||||||||||||
| Dollar General | Moody | TX | — | 41 | 781 | — | 822 | 68 | 6/11/2013 | 2013 | ||||||||||||||||
| Dollar General | Morgans Point | TX | — | 145 | 821 | — | 966 | 106 | 9/13/2012 | 2012 | ||||||||||||||||
| Dollar General | Mount Pleasant | TX | — | 214 | 858 | — | 1,072 | 114 | 8/31/2012 | 2009 | ||||||||||||||||
F-143
| Initial Costs | Costs Capitalized Subsequent to Acquisition | Gross Amount Carried at December 31, 2014 (1) (2) | ||||||||||||||||||||||||
| Property | City | State | Encumbrances at December 31, 2014 | Land | Buildings, Fixtures and Improvements | Accumulated Depreciation (3) (4) | Date Acquired | Date of Construction | ||||||||||||||||||
| Dollar General | New Braunfels | TX | — | 205 | 818 | — | 1,023 | 109 | 8/31/2012 | 2012 | ||||||||||||||||
| Dollar General | New Braunfels | TX | — | 95 | 855 | — | 950 | 90 | 2/14/2013 | 2013 | ||||||||||||||||
| Dollar General | New Braunfels | TX | — | 156 | 883 | — | 1,039 | 60 | 10/30/2013 | 2013 | ||||||||||||||||
| Dollar General | Orange | TX | — | 277 | 1,150 | — | 1,427 | 52 | 2/7/2014 | 2012 | ||||||||||||||||
| Dollar General | Poteet | TX | 400 | 96 | 864 | — | 960 | 156 | 10/31/2011 | 2010 | ||||||||||||||||
| Dollar General | Presidio | TX | — | 72 | 1,370 | — | 1,442 | 138 | 3/28/2013 | 2013 | ||||||||||||||||
| Dollar General | Progreso | TX | 400 | 169 | 957 | — | 1,126 | 173 | 10/31/2011 | 2010 | ||||||||||||||||
| Dollar General | Rio Grande City | TX | 300 | 137 | 779 | — | 916 | 140 | 10/31/2011 | 2010 | ||||||||||||||||
| Dollar General | Rio Grande City | TX | 514 | 163 | 652 | — | 815 | 105 | 2/1/2012 | 2011 | ||||||||||||||||
| Dollar General | Roma | TX | 500 | 253 | 1,010 | — | 1,263 | 182 | 10/31/2011 | 2010 | ||||||||||||||||
| Dollar General | San Antonio | TX | — | 252 | 756 | — | 1,008 | 94 | 10/22/2012 | 2012 | ||||||||||||||||
| Dollar General | San Antonio | TX | — | 222 | 888 | — | 1,110 | 110 | 10/22/2012 | 2012 | ||||||||||||||||
| Dollar General | San Antonio | TX | — | 163 | 926 | — | 1,089 | 98 | 2/14/2013 | 2013 | ||||||||||||||||
| Dollar General | San Antonio | TX | — | 271 | 812 | — | 1,083 | 74 | 5/23/2013 | 2013 | ||||||||||||||||
| Dollar General | San Antonio | TX | — | 239 | 956 | — | 1,195 | 96 | 3/11/2013 | 2013 | ||||||||||||||||
| Dollar General | San Antonio | TX | — | 220 | 880 | — | 1,100 | 72 | 7/9/2013 | 2013 | ||||||||||||||||
| Dollar General | San Antonio | TX | — | 333 | 776 | — | 1,109 | 60 | 8/13/2013 | 2013 | ||||||||||||||||
| Dollar General | San Benito | TX | — | 202 | 807 | — | 1,009 | 62 | 8/23/2013 | 2013 | ||||||||||||||||
| Dollar General | San Juan | TX | — | 169 | 956 | — | 1,125 | 60 | 11/15/2013 | 2013 | ||||||||||||||||
| Dollar General | Silsbee | TX | — | 43 | 810 | — | 853 | 112 | 7/6/2012 | 2012 | ||||||||||||||||
| Dollar General | Skidmore | TX | — | 90 | 811 | — | 901 | 85 | 2/14/2013 | 2013 | ||||||||||||||||
| Dollar General | Sullivan City | TX | — | 165 | 876 | — | 1,041 | 43 | 2/26/2014 | 2014 | ||||||||||||||||
| Dollar General | Texarkana | TX | — | 136 | 772 | — | 908 | 52 | 10/25/2013 | 2013 | ||||||||||||||||
| Dollar General | Troy | TX | — | 93 | 841 | — | 934 | 108 | 9/12/2012 | 2012 | ||||||||||||||||
| Dollar General | Tyler | TX | — | 219 | 875 | — | 1,094 | 117 | 8/31/2012 | 2010 | ||||||||||||||||
| Dollar General | Tyler | TX | — | 602 | 956 | — | 1,558 | 48 | 2/7/2014 | 2013 | ||||||||||||||||
| Dollar General | Victoria | TX | — | 91 | 817 | — | 908 | 90 | 1/31/2013 | 2013 | ||||||||||||||||
| Dollar General | Vidor | TX | — | — | 1,182 | — | 1,182 | 53 | 2/7/2014 | 2012 | ||||||||||||||||
| Dollar General | Waco | TX | — | 192 | 767 | — | 959 | 102 | 8/31/2012 | 2012 | ||||||||||||||||
| Dollar General | Weslaco | TX | — | 215 | 862 | — | 1,077 | 111 | 9/24/2012 | 2012 | ||||||||||||||||
| Dollar General | Weslaco | TX | — | 205 | 822 | — | 1,027 | 56 | 10/16/2013 | 2013 | ||||||||||||||||
F-144
| Initial Costs | Costs Capitalized Subsequent to Acquisition | Gross Amount Carried at December 31, 2014 (1) (2) | ||||||||||||||||||||||||
| Property | City | State | Encumbrances at December 31, 2014 | Land | Buildings, Fixtures and Improvements | Accumulated Depreciation (3) (4) | Date Acquired | Date of Construction | ||||||||||||||||||
| Dollar General | Burkeville | VA | — | 160 | 906 | — | 1,066 | 134 | 5/8/2012 | 2012 | ||||||||||||||||
| Dollar General | Chesterfield | VA | 400 | 242 | 726 | — | 968 | 117 | 2/6/2012 | 2011 | ||||||||||||||||
| Dollar General | Danville | VA | 300 | 155 | 621 | — | 776 | 100 | 2/6/2012 | 2011 | ||||||||||||||||
| Dollar General | Hopewell | VA | 500 | 584 | 713 | — | 1,297 | 115 | 2/6/2012 | 2011 | ||||||||||||||||
| Dollar General | Hot Springs | VA | 400 | 283 | 661 | — | 944 | 107 | 2/6/2012 | 2011 | ||||||||||||||||
| Dollar General | Mellen | WI | 300 | 79 | 711 | — | 790 | 122 | 12/30/2011 | 2011 | ||||||||||||||||
| Dollar General | Minong | WI | 300 | 38 | 727 | — | 765 | 124 | 12/30/2011 | 2011 | ||||||||||||||||
| Dollar General | Solon Springs | WI | 300 | 76 | 685 | — | 761 | 117 | 12/30/2011 | 2011 | ||||||||||||||||
| Dollar General | Chelyan | WV | — | 273 | 1,092 | — | 1,365 | 79 | 9/27/2013 | 2013 | ||||||||||||||||
| Dollar General | Cowen | WV | — | 196 | 783 | — | 979 | 86 | 1/16/2013 | 2012 | ||||||||||||||||
| Dollar General | Elkview | WV | — | 274 | 823 | — | 1,097 | 64 | 8/2/2013 | 2013 | ||||||||||||||||
| Dollar General | McMechen | WV | — | 91 | 819 | — | 910 | 90 | 1/9/2013 | 2012 | ||||||||||||||||
| Dollar General | Millwood | WV | — | 98 | 881 | — | 979 | 72 | 7/2/2013 | 2013 | ||||||||||||||||
| Dollar General | Oceana | WV | — | 317 | 1,023 | — | 1,340 | 10 | 11/20/2014 | #N/A | ||||||||||||||||
| Dollar General | Powhatan Point | WV | — | 138 | 784 | — | 922 | 64 | 7/2/2013 | 2014 | ||||||||||||||||
| Dollar Tree | Chiefland | FL | — | 322 | 1,123 | — | 1,445 | 50 | 3/31/2014 | 2013 | ||||||||||||||||
| DoPaco | St. Charles | IL | 7,789 | 1,700 | 8,000 | — | 9,700 | 470 | 2/21/2014 | 1993 | ||||||||||||||||
| DoPaco | Kinston | NC | 8,930 | 569 | 8,307 | — | 8,876 | 464 | 2/21/2014 | 1995 | ||||||||||||||||
| Dragon China Buffet | Carlsbad | NM | — | 208 | 104 | — | 312 | 9 | 6/27/2013 | 1995 | ||||||||||||||||
| Dunkin Donuts/Baskin-Robbins | Dearborn Heights | MI | — | 230 | 846 | — | 1,076 | 68 | 6/27/2013 | 1995 | ||||||||||||||||
| Earhart Corporate Center | Ann Arbor | MI | 28,818 | 3,520 | 39,639 | — | 43,159 | 2,122 | 11/5/2013 | 2006 | ||||||||||||||||
| East Supreme Buffet | Whitehall | PA | — | 384 | 372 | — | 756 | 16 | 6/27/2013 | 1997 | ||||||||||||||||
| Eegee's | Tucson | AZ | — | 357 | 436 | — | 793 | 34 | 7/31/2013 | 1990 | ||||||||||||||||
| Einstein Bros. Bagels | Dearborn | MI | — | 190 | 724 | — | 914 | 59 | 6/27/2013 | 1995 | ||||||||||||||||
| El Chico | Killeen | TX | — | 534 | 992 | — | 1,526 | 86 | 7/31/2013 | 1993 | ||||||||||||||||
| El Tapatio Mexican Restaurant | Page | AZ | — | 170 | 133 | — | 303 | 12 | 6/27/2013 | 1988 | ||||||||||||||||
| Elite Production Services | Cuero | TX | — | 127 | 982 | — | 1,109 | 24 | 6/25/2014 | 2014 | ||||||||||||||||
| EMC Corporation | Bedford | MA | 51,400 | 16,594 | 75,137 | — | 91,731 | 3,043 | 2/7/2014 | 2001 | ||||||||||||||||
F-145
| Initial Costs | Costs Capitalized Subsequent to Acquisition | Gross Amount Carried at December 31, 2014 (1) (2) | ||||||||||||||||||||||||
| Property | City | State | Encumbrances at December 31, 2014 | Land | Buildings, Fixtures and Improvements | Accumulated Depreciation (3) (4) | Date Acquired | Date of Construction | ||||||||||||||||||
| Emdeon Business Services | Nashville | TN | 4,700 | 688 | 10,417 | — | 11,105 | 382 | 2/7/2014 | 2010 | ||||||||||||||||
| Encana Oil & Gas | Plano | TX | 66,000 | 2,493 | 95,231 | — | 97,724 | 3,460 | 2/7/2014 | 2012 | ||||||||||||||||
| Energy Maintenance Services US | Pasadena | TX | — | 393 | 2,878 | — | 3,271 | 70 | 6/12/2014 | 2011 | ||||||||||||||||
| Entegra Fastener Corporation | Wood Dale | IL | 4,665 | 1,508 | 6,937 | — | 8,445 | 153 | 2/21/2014 | 1988 | ||||||||||||||||
| Evans Exchange | Evans | GA | 6,730 | 3,452 | 9,821 | — | 13,273 | 450 | 2/7/2014 | 2009 | ||||||||||||||||
| Exelis | Herndon | VA | — | 1,384 | 53,584 | — | 54,968 | 2,928 | 11/5/2013 | 1999 | ||||||||||||||||
| Experian | Schaumburg | IL | — | 5,935 | 26,003 | — | 31,938 | 1,065 | 2/7/2014 | 1986 | ||||||||||||||||
| Express Energy Services | Pleasanton | TX | — | 413 | 5,541 | — | 5,954 | 134 | 6/12/2014 | 2012 | ||||||||||||||||
| Express Scripts | Berkeley | MO | 22,620 | 5,706 | 32,333 | — | 38,039 | 5,651 | 1/25/2012 | 2011 | ||||||||||||||||
| Exterran Energy Solutions | Fort Worth | TX | — | 1,360 | 5,704 | — | 7,064 | 91 | 9/5/2014 | 2011 | ||||||||||||||||
| Falcon Valley Shopping Center | Lenexa | KS | 6,375 | 2,081 | 11,323 | — | 13,404 | 530 | 2/7/2014 | 1995 | ||||||||||||||||
| Family Dollar | Bessemer | AL | — | 295 | 1,301 | — | 1,596 | 35 | 6/16/2014 | 2014 | ||||||||||||||||
| Family Dollar | Camden | AL | — | 137 | 851 | — | 988 | 28 | 5/29/2014 | 2014 | ||||||||||||||||
| Family Dollar | Grove Hill | AL | — | 144 | 741 | — | 885 | 14 | 7/24/2014 | 2013 | ||||||||||||||||
| Family Dollar | Hayneville | AL | — | 172 | 722 | — | 894 | 26 | 5/7/2014 | 2013 | ||||||||||||||||
| Family Dollar | Hoover | AL | — | 368 | 1,153 | — | 1,521 | 19 | 8/29/2014 | 2014 | ||||||||||||||||
| Family Dollar | Huntsville | AL | — | 476 | 1,092 | — | 1,568 | 17 | 8/29/2014 | 2014 | ||||||||||||||||
| Family Dollar | Jemison | AL | 757 | 143 | 997 | — | 1,140 | 49 | 2/7/2014 | 2011 | ||||||||||||||||
| Family Dollar | Marion | AL | — | 247 | 780 | — | 1,027 | 15 | 7/30/2014 | 2014 | ||||||||||||||||
| Family Dollar | Millbrook | AL | — | 316 | 1,052 | — | 1,368 | 18 | 8/28/2014 | 2013 | ||||||||||||||||
| Family Dollar | Montgomery | AL | — | 218 | 847 | — | 1,065 | 14 | 8/28/2014 | 2013 | ||||||||||||||||
| Family Dollar | Montgomery | AL | 959 | 533 | 936 | — | 1,469 | 47 | 2/7/2014 | 2010 | ||||||||||||||||
| Family Dollar | Wilmer | AL | — | 221 | 791 | — | 1,012 | 26 | 5/29/2014 | 2014 | ||||||||||||||||
| Family Dollar | EL DORADO | AR | — | 151 | 806 | — | 957 | 16 | 8/28/2014 | 1988 | ||||||||||||||||
| Family Dollar | El Dorado | AR | 663 | 49 | 1,003 | — | 1,052 | 46 | 2/7/2014 | 2002 | ||||||||||||||||
| Family Dollar | Hot Springs | AR | — | 247 | 845 | — | 1,092 | 40 | 2/7/2014 | 2011 | ||||||||||||||||
| Family Dollar | Jacksonville | AR | 571 | 155 | 758 | — | 913 | 35 | 2/7/2014 | 2002 | ||||||||||||||||
| Family Dollar | Little Rock | AR | 467 | 125 | 629 | — | 754 | 29 | 2/7/2014 | 2002 | ||||||||||||||||
F-146
| Initial Costs | Costs Capitalized Subsequent to Acquisition | Gross Amount Carried at December 31, 2014 (1) (2) | ||||||||||||||||||||||||
| Property | City | State | Encumbrances at December 31, 2014 | Land | Buildings, Fixtures and Improvements | Accumulated Depreciation (3) (4) | Date Acquired | Date of Construction | ||||||||||||||||||
| Family Dollar | Ash Fork | AZ | — | 123 | 1,015 | — | 1,138 | 17 | 8/28/2014 | 2013 | ||||||||||||||||
| Family Dollar | Avondale | AZ | 974 | 603 | 882 | — | 1,485 | 44 | 2/7/2014 | 2002 | ||||||||||||||||
| Family Dollar | Casa Grande | AZ | — | 454 | 313 | — | 767 | 18 | 2/7/2014 | 2003 | ||||||||||||||||
| Family Dollar | Coolidge | AZ | 603 | 126 | 785 | — | 911 | 38 | 2/7/2014 | 2000 | ||||||||||||||||
| Family Dollar | Duncan | AZ | — | 98 | 895 | — | 993 | 15 | 8/28/2014 | 2013 | ||||||||||||||||
| Family Dollar | Fort Mohave | AZ | — | 302 | 571 | — | 873 | 30 | 2/7/2014 | 2001 | ||||||||||||||||
| Family Dollar | GOLDEN VALLEY | AZ | — | 110 | 772 | — | 882 | 16 | 8/28/2014 | 2001 | ||||||||||||||||
| Family Dollar | Guadalupe | AZ | — | 400 | 584 | — | 984 | 30 | 2/7/2014 | 2004 | ||||||||||||||||
| Family Dollar | Mohave Valley | AZ | — | 302 | 281 | — | 583 | 16 | 2/7/2014 | 2003 | ||||||||||||||||
| Family Dollar | PHOENIX | AZ | — | 303 | 712 | — | 1,015 | 14 | 8/28/2014 | 2004 | ||||||||||||||||
| Family Dollar | Phoenix | AZ | — | 416 | 1,229 | — | 1,645 | 20 | 8/28/2014 | 2013 | ||||||||||||||||
| Family Dollar | Phoenix | AZ | — | 1,109 | 767 | — | 1,876 | 41 | 2/7/2014 | 2003 | ||||||||||||||||
| Family Dollar | Phoenix | AZ | 1,040 | 504 | 1,079 | — | 1,583 | 54 | 2/7/2014 | 2003 | ||||||||||||||||
| Family Dollar | Dacano | CO | 757 | 155 | 959 | — | 1,114 | 48 | 2/7/2014 | 2003 | ||||||||||||||||
| Family Dollar | Fort Lupton | CO | 916 | 154 | 1,180 | — | 1,334 | 59 | 2/7/2014 | 1961 | ||||||||||||||||
| Family Dollar | Rangeley | CO | 323 | 66 | 593 | — | 659 | 87 | 5/4/2012 | 2010 | ||||||||||||||||
| Family Dollar | New Britain | CT | — | 484 | 1,280 | — | 1,764 | 13 | 10/14/2014 | 2013 | ||||||||||||||||
| Family Dollar | Altha | FL | — | 126 | 727 | — | 853 | 37 | 2/7/2014 | 2011 | ||||||||||||||||
| Family Dollar | Anthony | FL | — | 242 | 1,037 | — | 1,279 | 13 | 10/30/2014 | 2014 | ||||||||||||||||
| Family Dollar | Apopka | FL | 1,127 | 518 | 1,402 | — | 1,920 | 64 | 2/7/2014 | 2011 | ||||||||||||||||
| Family Dollar | Auburndale | FL | — | 314 | 951 | — | 1,265 | 16 | 8/28/2014 | 2013 | ||||||||||||||||
| Family Dollar | Belleview | FL | — | 332 | 829 | — | 1,161 | 39 | 2/7/2014 | 2013 | ||||||||||||||||
| Family Dollar | Beverly Hills | FL | — | 409 | 965 | — | 1,374 | 16 | 8/28/2014 | 2013 | ||||||||||||||||
| Family Dollar | Bonita Springs | FL | — | 672 | 918 | — | 1,590 | 47 | 2/7/2014 | 2013 | ||||||||||||||||
| Family Dollar | Bristol | FL | 631 | 202 | 727 | — | 929 | 37 | 2/7/2014 | 2011 | ||||||||||||||||
| Family Dollar | Bunnell | FL | — | 188 | 936 | — | 1,124 | 16 | 8/28/2014 | 2013 | ||||||||||||||||
| Family Dollar | Cape Coral | FL | — | 675 | 1,190 | — | 1,865 | 53 | 3/5/2014 | 2013 | ||||||||||||||||
| Family Dollar | Citra | FL | — | 47 | 1,038 | — | 1,085 | 17 | 8/28/2014 | 2013 | ||||||||||||||||
F-147
| Initial Costs | Costs Capitalized Subsequent to Acquisition | Gross Amount Carried at December 31, 2014 (1) (2) | ||||||||||||||||||||||||
| Property | City | State | Encumbrances at December 31, 2014 | Land | Buildings, Fixtures and Improvements | Accumulated Depreciation (3) (4) | Date Acquired | Date of Construction | ||||||||||||||||||
| Family Dollar | Clearwater | FL | — | 425 | 1,006 | — | 1,431 | 16 | 8/22/2014 | 2014 | ||||||||||||||||
| Family Dollar | Deland | FL | 1,057 | 492 | 1,293 | — | 1,785 | 60 | 2/7/2014 | 2011 | ||||||||||||||||
| Family Dollar | Deltona | FL | 686 | 171 | 1,074 | — | 1,245 | 47 | 2/7/2014 | 2004 | ||||||||||||||||
| Family Dollar | Deltona | FL | 1,042 | 206 | 1,578 | — | 1,784 | 71 | 2/7/2014 | 2011 | ||||||||||||||||
| Family Dollar | Fort Meade | FL | 417 | 211 | 606 | — | 817 | 26 | 2/7/2014 | 2000 | ||||||||||||||||
| Family Dollar | Fort Myers | FL | 973 | 189 | 1,344 | — | 1,533 | 63 | 2/7/2014 | 2002 | ||||||||||||||||
| Family Dollar | Fountain | FL | — | 202 | 825 | — | 1,027 | 14 | 8/28/2014 | 2014 | ||||||||||||||||
| Family Dollar | Gainesville | FL | 1,002 | 423 | 1,263 | — | 1,686 | 58 | 2/7/2014 | 2011 | ||||||||||||||||
| Family Dollar | Graceville | FL | — | 367 | 810 | — | 1,177 | 33 | 4/30/2014 | 2013 | ||||||||||||||||
| Family Dollar | Jacksonville | FL | 1,028 | 271 | 1,121 | — | 1,392 | 50 | 2/7/2014 | 2011 | ||||||||||||||||
| Family Dollar | Jacksonville | FL | 789 | 545 | 1,173 | — | 1,718 | 54 | 2/7/2014 | 2008 | ||||||||||||||||
| Family Dollar | Kissimmee | FL | 970 | 643 | 1,071 | — | 1,714 | 48 | 2/7/2014 | 2011 | ||||||||||||||||
| Family Dollar | Lake Alfred | FL | — | 484 | 1,006 | — | 1,490 | — | 12/23/2014 | 2014 | ||||||||||||||||
| Family Dollar | Lake City | FL | 622 | 186 | 872 | — | 1,058 | 40 | 2/7/2014 | 2011 | ||||||||||||||||
| Family Dollar | Lake Panasoffkee | FL | — | 237 | 696 | — | 933 | 31 | 3/25/2014 | 2013 | ||||||||||||||||
| Family Dollar | Lakeland | FL | 732 | 339 | 785 | — | 1,124 | 39 | 2/7/2014 | 2003 | ||||||||||||||||
| Family Dollar | Largo | FL | — | 844 | 962 | — | 1,806 | 48 | 2/7/2014 | 2013 | ||||||||||||||||
| Family Dollar | Middleburg | FL | — | 274 | 822 | — | 1,096 | 71 | 6/4/2013 | 2008 | ||||||||||||||||
| Family Dollar | Milton | FL | 644 | 544 | 683 | — | 1,227 | 29 | 2/7/2014 | 2010 | ||||||||||||||||
| Family Dollar | Mulberry | FL | — | 131 | 1,156 | — | 1,287 | 19 | 8/28/2014 | 2013 | ||||||||||||||||
| Family Dollar | OCALA | FL | — | 108 | 816 | — | 924 | 15 | 8/28/2014 | 2005 | ||||||||||||||||
| Family Dollar | Ocala | FL | — | 344 | 1,251 | — | 1,595 | 57 | 2/7/2014 | 2006 | ||||||||||||||||
| Family Dollar | Ocala | FL | 968 | 554 | 984 | — | 1,538 | 48 | 2/7/2014 | 2011 | ||||||||||||||||
| Family Dollar | Okeechobee | FL | 894 | 655 | 580 | — | 1,235 | 34 | 2/7/2014 | 2011 | ||||||||||||||||
| Family Dollar | Orlando | FL | — | 349 | 1,294 | — | 1,643 | 21 | 8/28/2014 | 2014 | ||||||||||||||||
| Family Dollar | Orlando | FL | — | 291 | 1,286 | — | 1,577 | 21 | 8/28/2014 | 2013 | ||||||||||||||||
| Family Dollar | Ormond Beach | FL | — | 573 | 860 | — | 1,433 | 74 | 6/4/2013 | 2008 | ||||||||||||||||
| Family Dollar | Ormond Beach | FL | — | 675 | 1,152 | — | 1,827 | 53 | 2/7/2014 | 2011 | ||||||||||||||||
F-148
| Initial Costs | Costs Capitalized Subsequent to Acquisition | Gross Amount Carried at December 31, 2014 (1) (2) | ||||||||||||||||||||||||
| Property | City | State | Encumbrances at December 31, 2014 | Land | Buildings, Fixtures and Improvements | Accumulated Depreciation (3) (4) | Date Acquired | Date of Construction | ||||||||||||||||||
| Family Dollar | Oviedo | FL | — | 469 | 848 | — | 1,317 | 42 | 2/19/2014 | 2013 | ||||||||||||||||
| Family Dollar | Palatka | FL | — | 316 | 1,054 | — | 1,370 | 42 | 4/25/2014 | 2014 | ||||||||||||||||
| Family Dollar | Pembroke Park | FL | 1,141 | 656 | 944 | — | 1,600 | 51 | 2/7/2014 | 2006 | ||||||||||||||||
| Family Dollar | Pensacola | FL | — | 69 | 1,085 | — | 1,154 | 17 | 8/28/2014 | 2013 | ||||||||||||||||
| Family Dollar | Pensacola | FL | 559 | 146 | 907 | — | 1,053 | 39 | 2/7/2014 | 2003 | ||||||||||||||||
| Family Dollar | Plant City | FL | — | 279 | 1,040 | — | 1,319 | 47 | 2/7/2014 | 2004 | ||||||||||||||||
| Family Dollar | Plant City | FL | 1,173 | 712 | 1,113 | — | 1,825 | 55 | 2/7/2014 | 2005 | ||||||||||||||||
| Family Dollar | Sebring | FL | — | 492 | 1,063 | — | 1,555 | 25 | 6/24/2014 | 2014 | ||||||||||||||||
| Family Dollar | St Petersburg | FL | 1,093 | 690 | 1,000 | — | 1,690 | 50 | 2/7/2014 | 2011 | ||||||||||||||||
| Family Dollar | Tallahassee | FL | — | 632 | 871 | — | 1,503 | 45 | 2/7/2014 | 2011 | ||||||||||||||||
| Family Dollar | Tampa | FL | 1,005 | 531 | 1,062 | — | 1,593 | 51 | 2/7/2014 | 2008 | ||||||||||||||||
| Family Dollar | Tampa | FL | 1,168 | 773 | 1,057 | — | 1,830 | 52 | 2/7/2014 | 2011 | ||||||||||||||||
| Family Dollar | Tampa | FL | — | 552 | 792 | — | 1,344 | 38 | 2/7/2014 | 2013 | ||||||||||||||||
| Family Dollar | Winter Haven | FL | — | 534 | 942 | — | 1,476 | 10 | 8/8/2014 | 2014 | ||||||||||||||||
| Family Dollar | Zellwood | FL | — | 272 | 1,005 | — | 1,277 | 16 | 8/22/2014 | 2014 | ||||||||||||||||
| Family Dollar | Abbeville | GA | — | 163 | 768 | — | 931 | 20 | 5/29/2014 | 2014 | ||||||||||||||||
| Family Dollar | Acworth | GA | — | 489 | 901 | — | 1,390 | 16 | 8/28/2014 | 2013 | ||||||||||||||||
| Family Dollar | ALMA | GA | — | 79 | 954 | — | 1,033 | 16 | 8/28/2014 | 1982 | ||||||||||||||||
| Family Dollar | Claxton | GA | — | 322 | 665 | — | 987 | 24 | 5/14/2014 | 2014 | ||||||||||||||||
| Family Dollar | Cordele | GA | — | 136 | 1,049 | — | 1,185 | 31 | 4/30/2014 | 2014 | ||||||||||||||||
| Family Dollar | Fayetteville | GA | — | 217 | 1,203 | — | 1,420 | 8 | 11/20/2014 | 2014 | ||||||||||||||||
| Family Dollar | Helena | GA | — | 242 | 790 | — | 1,032 | 39 | 2/19/2014 | 2013 | ||||||||||||||||
| Family Dollar | Jeffersonville | GA | — | 153 | 926 | — | 1,079 | 15 | 8/15/2014 | 2014 | ||||||||||||||||
| Family Dollar | Lenox | GA | — | 90 | 809 | — | 899 | 97 | 11/9/2012 | 2012 | ||||||||||||||||
| Family Dollar | Lindale | GA | — | 227 | 966 | — | 1,193 | 17 | 8/28/2014 | 2014 | ||||||||||||||||
| Family Dollar | Macon | GA | — | 300 | 893 | — | 1,193 | 15 | 8/28/2014 | 2013 | ||||||||||||||||
| Family Dollar | Macon | GA | 673 | 230 | 851 | — | 1,081 | 41 | 2/7/2014 | 2011 | ||||||||||||||||
| Family Dollar | Marietta | GA | — | 366 | 749 | — | 1,115 | 37 | 2/19/2014 | 2013 | ||||||||||||||||
F-149
| Initial Costs | Costs Capitalized Subsequent to Acquisition | Gross Amount Carried at December 31, 2014 (1) (2) | ||||||||||||||||||||||||
| Property | City | State | Encumbrances at December 31, 2014 | Land | Buildings, Fixtures and Improvements | Accumulated Depreciation (3) (4) | Date Acquired | Date of Construction | ||||||||||||||||||
| Family Dollar | Marietta | GA | — | 582 | 1,126 | — | 1,708 | 19 | 8/28/2014 | 2013 | ||||||||||||||||
| Family Dollar | Omega | GA | — | 167 | 716 | — | 883 | 32 | 3/12/2014 | 2013 | ||||||||||||||||
| Family Dollar | Richland | GA | — | 125 | 859 | — | 984 | 15 | 8/28/2014 | 2014 | ||||||||||||||||
| Family Dollar | Riverdale | GA | — | 310 | 1,188 | — | 1,498 | 15 | 9/26/2014 | 2014 | ||||||||||||||||
| Family Dollar | Vienna | GA | — | 62 | 721 | — | 783 | 32 | 3/12/2014 | 2013 | ||||||||||||||||
| Family Dollar | Des Moines | IA | — | 152 | 863 | — | 1,015 | 67 | 8/30/2013 | 1995 | ||||||||||||||||
| Family Dollar | Des Moines | IA | 822 | 411 | 871 | — | 1,282 | 43 | 2/7/2014 | 2003 | ||||||||||||||||
| Family Dollar | Fort Dodge | IA | 408 | 152 | 449 | — | 601 | 23 | 2/7/2014 | 2002 | ||||||||||||||||
| Family Dollar | Arco | ID | — | 76 | 684 | — | 760 | 88 | 9/18/2012 | 2012 | ||||||||||||||||
| Family Dollar | Homedale | ID | 973 | 59 | 1,387 | — | 1,446 | 67 | 2/7/2014 | 2006 | ||||||||||||||||
| Family Dollar | Kimberly | ID | — | 219 | 657 | — | 876 | 63 | 4/10/2013 | 2013 | ||||||||||||||||
| Family Dollar | Lombard | IL | — | 1,008 | 543 | — | 1,551 | 32 | 12/12/2013 | 1967 | ||||||||||||||||
| Family Dollar | Mount Vernon | IL | — | 117 | 1,050 | — | 1,167 | 86 | 7/11/2013 | 2012 | ||||||||||||||||
| Family Dollar | Pulaski | IL | — | 31 | 588 | — | 619 | 67 | 12/31/2012 | 2012 | ||||||||||||||||
| Family Dollar | University Park | IL | — | 295 | 688 | — | 983 | 47 | 10/29/2013 | 2013 | ||||||||||||||||
| Family Dollar | Brookston | IN | — | 126 | 715 | — | 841 | 89 | 10/1/2012 | 2012 | ||||||||||||||||
| Family Dollar | Indianapolis | IN | 613 | 375 | 707 | — | 1,082 | 31 | 2/7/2014 | 2003 | ||||||||||||||||
| Family Dollar | Lake Village | IN | — | 154 | 752 | — | 906 | 58 | 4/30/2014 | 2013 | ||||||||||||||||
| Family Dollar | Mitchell | IN | — | 101 | 1,119 | — | 1,220 | 19 | 8/28/2014 | 2014 | ||||||||||||||||
| Family Dollar | Princeton | IN | 526 | 300 | 486 | — | 786 | 25 | 2/7/2014 | 2000 | ||||||||||||||||
| Family Dollar | Seymour | IN | — | 238 | 764 | — | 1,002 | 38 | 2/7/2014 | 2003 | ||||||||||||||||
| Family Dollar | Terre Haute | IN | 394 | 235 | 427 | — | 662 | 21 | 2/7/2014 | 2011 | ||||||||||||||||
F-150
| Initial Costs | Costs Capitalized Subsequent to Acquisition | Gross Amount Carried at December 31, 2014 (1) (2) | ||||||||||||||||||||||||
| Property | City | State | Encumbrances at December 31, 2014 | Land | Buildings, Fixtures and Improvements | Accumulated Depreciation (3) (4) | Date Acquired | Date of Construction | ||||||||||||||||||
| Family Dollar | Greensburg | KS | — | 80 | 718 | — | 798 | 52 | 9/9/2013 | 2012 | ||||||||||||||||
| Family Dollar | Kansas City | KS | — | 290 | 1,170 | — | 1,460 | — | 3/14/2014 | 1995 | ||||||||||||||||
| Family Dollar | Kansas City | KS | — | 352 | 1,026 | — | 1,378 | — | 3/17/2014 | 1995 | ||||||||||||||||
| Family Dollar | Kansas City | KS | 982 | 154 | 1,367 | — | 1,521 | 65 | 2/7/2014 | 2002 | ||||||||||||||||
| Family Dollar | Topeka | KS | — | 177 | 1,405 | — | 1,582 | 69 | 2/7/2014 | 2004 | ||||||||||||||||
| Family Dollar | Wichita | KS | — | 216 | 1,035 | — | 1,251 | 17 | 8/28/2014 | 2013 | ||||||||||||||||
| Family Dollar | Bowling Green | KY | — | 334 | 951 | — | 1,285 | 16 | 8/28/2014 | 2013 | ||||||||||||||||
| Family Dollar | Carlisle | KY | — | 157 | 871 | — | 1,028 | 15 | 8/28/2014 | 2014 | ||||||||||||||||
| Family Dollar | Garrison | KY | — | 134 | 737 | — | 871 | 38 | 2/20/2014 | 2012 | ||||||||||||||||
| Family Dollar | Rockholds | KY | — | 121 | 988 | — | 1,109 | 17 | 8/28/2014 | 2014 | ||||||||||||||||
| Family Dollar | Abbeville | LA | 740 | 141 | 949 | — | 1,090 | 47 | 2/7/2014 | 2005 | ||||||||||||||||
| Family Dollar | Alexandria | LA | 458 | 168 | 579 | — | 747 | 28 | 2/7/2014 | 2005 | ||||||||||||||||
| Family Dollar | Arcadia | LA | — | 51 | 704 | — | 755 | 37 | 2/20/2014 | 2010 | ||||||||||||||||
| Family Dollar | Avondale | LA | — | 381 | 1,255 | — | 1,636 | 21 | 8/28/2014 | 2013 | ||||||||||||||||
| Family Dollar | Baton Rouge | LA | — | 377 | 716 | — | 1,093 | 36 | 2/7/2014 | 2003 | ||||||||||||||||
| Family Dollar | Chalmette | LA | — | 751 | 615 | — | 1,366 | 91 | 5/3/2012 | 2011 | ||||||||||||||||
| Family Dollar | Farmerville | LA | 722 | 110 | 968 | — | 1,078 | 47 | 2/7/2014 | 2003 | ||||||||||||||||
| Family Dollar | Kentwood | LA | 683 | 117 | 877 | — | 994 | 44 | 2/7/2014 | 2003 | ||||||||||||||||
| Family Dollar | New Orleans | LA | 1,146 | 547 | 1,252 | — | 1,799 | 60 | 2/7/2014 | 2005 | ||||||||||||||||
| Family Dollar | Shreveport | LA | 892 | 177 | 1,177 | — | 1,354 | 57 | 2/7/2014 | 2005 | ||||||||||||||||
| Family Dollar | Tickfaw | LA | — | 181 | 543 | — | 724 | 85 | 3/30/2012 | 2011 | ||||||||||||||||
| Family Dollar | Westwego | LA | — | 332 | 1,052 | — | 1,384 | 18 | 8/28/2014 | 2013 | ||||||||||||||||
| Family Dollar | Lynn | MA | 1,222 | 400 | 1,547 | — | 1,947 | 73 | 2/7/2014 | 2003 | ||||||||||||||||
| Family Dollar | Barryton | MI | — | 32 | 599 | — | 631 | 69 | 12/18/2012 | 2012 | ||||||||||||||||
| Family Dollar | Birch Run | MI | — | 81 | 729 | — | 810 | 60 | 7/11/2013 | 1950 | ||||||||||||||||
| Family Dollar | Brooklyn | MI | — | 150 | 634 | — | 784 | 32 | 2/7/2014 | 2002 | ||||||||||||||||
| Family Dollar | Burton | MI | 866 | 131 | 1,164 | — | 1,295 | 57 | 2/7/2014 | 2003 | ||||||||||||||||
| Family Dollar | Detroit | MI | — | 130 | 1,169 | — | 1,299 | 139 | 11/27/2012 | 2011 | ||||||||||||||||
| Family Dollar | Detroit | MI | — | 106 | 956 | — | 1,062 | 87 | 5/2/2013 | 1964 | ||||||||||||||||
| Family Dollar | DETROIT | MI | — | 110 | 1,051 | — | 1,161 | 18 | 8/28/2014 | 2005 | ||||||||||||||||
| Family Dollar | Flint | MI | — | 162 | 1,027 | — | 1,189 | 55 | 2/26/2014 | 2014 | ||||||||||||||||
| Family Dollar | Hudson | MI | 833 | 108 | 1,020 | — | 1,128 | 53 | 2/7/2014 | 2005 | ||||||||||||||||
F-151
| Initial Costs | Costs Capitalized Subsequent to Acquisition | Gross Amount Carried at December 31, 2014 (1) (2) | ||||||||||||||||||||||||
| Property | City | State | Encumbrances at December 31, 2014 | Land | Buildings, Fixtures and Improvements | Accumulated Depreciation (3) (4) | Date Acquired | Date of Construction | ||||||||||||||||||
| Family Dollar | Jackson | MI | — | 93 | 525 | — | 618 | 38 | 9/12/2013 | 2007 | ||||||||||||||||
| Family Dollar | Kentwood | MI | 739 | 389 | 919 | — | 1,308 | 41 | 2/7/2014 | 2001 | ||||||||||||||||
| Family Dollar | Monroe | MI | — | 243 | 1,061 | — | 1,304 | 18 | 8/28/2014 | 2013 | ||||||||||||||||
| Family Dollar | Newaygo | MI | 689 | 317 | 677 | — | 994 | 35 | 2/7/2014 | 2002 | ||||||||||||||||
| Family Dollar | Pontiac | MI | 962 | 136 | 1,249 | — | 1,385 | 62 | 2/7/2014 | 2003 | ||||||||||||||||
| Family Dollar | Remus | MI | — | 49 | 992 | — | 1,041 | 56 | 1/2/2014 | 2012 | ||||||||||||||||
| Family Dollar | Saginaw | MI | — | 164 | 1,086 | — | 1,250 | 55 | 2/7/2014 | 2003 | ||||||||||||||||
| Family Dollar | Tustin | MI | — | 33 | 633 | — | 666 | 73 | 12/18/2012 | 1995 | ||||||||||||||||
| Family Dollar | Crosby | MN | — | 49 | 928 | — | 977 | 76 | 7/11/2013 | 1985 | ||||||||||||||||
| Family Dollar | Ely | MN | — | 231 | 1,008 | — | 1,239 | 51 | 2/27/2014 | 2014 | ||||||||||||||||
| Family Dollar | International Falls | MN | — | 32 | 608 | — | 640 | 44 | 9/30/2013 | 1966 | ||||||||||||||||
| Family Dollar | St. Peter | MN | 409 | 93 | 566 | — | 659 | 26 | 2/7/2014 | 1960 | ||||||||||||||||
| Family Dollar | Berkeley | MO | 969 | 179 | 1,391 | — | 1,570 | 64 | 2/7/2014 | 2003 | ||||||||||||||||
| Family Dollar | Kansas City | MO | 683 | 277 | 812 | — | 1,089 | 39 | 2/7/2014 | 2003 | ||||||||||||||||
| Family Dollar | Kansas City | MO | 1,211 | 119 | 1,705 | — | 1,824 | 82 | 2/7/2014 | 2004 | ||||||||||||||||
| Family Dollar | Kansas City | MO | 970 | 142 | 1,338 | — | 1,480 | 64 | 2/7/2014 | 2004 | ||||||||||||||||
| Family Dollar | Marble Hill | MO | — | 38 | 719 | — | 757 | 56 | 8/29/2013 | 2013 | ||||||||||||||||
| Family Dollar | St Louis | MO | — | 168 | 671 | — | 839 | 102 | 4/2/2012 | 2006 | ||||||||||||||||
| Family Dollar | St Louis | MO | 972 | 215 | 1,357 | — | 1,572 | 63 | 2/7/2014 | 2003 | ||||||||||||||||
| Family Dollar | St Louis | MO | — | 258 | 1,310 | — | 1,568 | 61 | 2/7/2014 | 2003 | ||||||||||||||||
| Family Dollar | St. Louis | MO | — | 445 | 1,038 | — | 1,483 | 129 | 10/23/2012 | 2012 | ||||||||||||||||
| Family Dollar | St. Louis | MO | — | 215 | 1,219 | — | 1,434 | 117 | 4/30/2013 | 1995 | ||||||||||||||||
| Family Dollar | St. Louis | MO | — | 445 | 1,039 | — | 1,484 | 119 | 12/14/2012 | 2012 | ||||||||||||||||
| Family Dollar | Bassfield | MS | — | 96 | 752 | — | 848 | 39 | 2/19/2014 | 2013 | ||||||||||||||||
| Family Dollar | Biloxi | MS | 434 | 310 | 575 | — | 885 | 90 | 3/30/2012 | 2012 | ||||||||||||||||
| Family Dollar | Canton | MS | — | 210 | 1,142 | — | 1,352 | 19 | 8/28/2014 | 2013 | ||||||||||||||||
| Family Dollar | Carriere | MS | 399 | 200 | 599 | — | 799 | 94 | 3/30/2012 | 2012 | ||||||||||||||||
| Family Dollar | D'Iberville | MS | — | 241 | 561 | — | 802 | 83 | 5/21/2012 | 2012 | ||||||||||||||||
| Family Dollar | DREW | MS | — | 11 | 1,039 | — | 1,050 | 21 | 8/28/2014 | 1989 | ||||||||||||||||
| Family Dollar | Greenville | MS | — | 125 | 872 | — | 997 | 43 | 2/7/2014 | 2011 | ||||||||||||||||
| Family Dollar | Gulfport | MS | 411 | 209 | 626 | — | 835 | 92 | 5/21/2012 | 2012 | ||||||||||||||||
| Family Dollar | Gulfport | MS | — | 270 | 629 | — | 899 | 81 | 9/20/2012 | 2012 | ||||||||||||||||
F-152
| Initial Costs | Costs Capitalized Subsequent to Acquisition | Gross Amount Carried at December 31, 2014 (1) (2) | ||||||||||||||||||||||||
| Property | City | State | Encumbrances at December 31, 2014 | Land | Buildings, Fixtures and Improvements | Accumulated Depreciation (3) (4) | Date Acquired | Date of Construction | ||||||||||||||||||
| Family Dollar | Gulfport | MS | — | 218 | 654 | — | 872 | 78 | 11/15/2012 | 2012 | ||||||||||||||||
| Family Dollar | Gulfport | MS | — | 312 | 1,237 | — | 1,549 | 61 | 2/7/2014 | 2007 | ||||||||||||||||
| Family Dollar | Hattiesburg | MS | — | 225 | 674 | — | 899 | 74 | 1/30/2013 | 2012 | ||||||||||||||||
| Family Dollar | Horn Lake | MS | — | 225 | 676 | — | 901 | 90 | 8/22/2012 | 2012 | ||||||||||||||||
| Family Dollar | Kiln | MS | — | 106 | 650 | — | 756 | 78 | 11/14/2012 | 2012 | ||||||||||||||||
| Family Dollar | Laurel | MS | — | 225 | 723 | — | 948 | 38 | 2/19/2014 | 2013 | ||||||||||||||||
| Family Dollar | NATCHEZ | MS | — | 289 | 749 | — | 1,038 | 17 | 8/28/2014 | 1982 | ||||||||||||||||
| Family Dollar | Okolona | MS | — | 64 | 578 | — | 642 | 80 | 7/31/2012 | 2012 | ||||||||||||||||
| Family Dollar | Pearl | MS | — | 342 | 1,001 | — | 1,343 | 16 | 8/28/2014 | 2013 | ||||||||||||||||
| Family Dollar | Philadelphia | MS | — | 53 | 897 | — | 950 | 15 | 8/28/2014 | 2014 | ||||||||||||||||
| Family Dollar | Winona | MS | — | 146 | 585 | — | 731 | 81 | 7/31/2012 | 2012 | ||||||||||||||||
| Family Dollar | Anaconda | MT | — | 164 | 1,058 | — | 1,222 | 16 | 9/30/2014 | 2014 | ||||||||||||||||
| Family Dollar | Ennis | MT | — | — | — | 1,098 | 1,098 | — | 6/4/2014 | 2014 | ||||||||||||||||
| Family Dollar | Three Forks | MT | — | — | — | 448 | 448 | — | 8/20/2014 | 2014 | ||||||||||||||||
| Family Dollar | Whitehall | MT | — | — | — | 1,103 | 1,103 | — | 4/1/2014 | 1995 | ||||||||||||||||
| Family Dollar | Asheboro | NC | — | 251 | 932 | — | 1,183 | 16 | 8/28/2014 | 2014 | ||||||||||||||||
| Family Dollar | Boiling Springs | NC | — | 322 | 767 | — | 1,089 | 12 | 8/28/2014 | 2013 | ||||||||||||||||
| Family Dollar | Burlington | NC | — | 291 | 694 | — | 985 | 12 | 8/28/2014 | 2012 | ||||||||||||||||
| Family Dollar | Charlotte | NC | — | 352 | 985 | — | 1,337 | 39 | 4/15/2014 | 2014 | ||||||||||||||||
| Family Dollar | Charlotte | NC | — | 490 | 1,066 | — | 1,556 | 20 | 7/2/2014 | 2014 | ||||||||||||||||
| Family Dollar | Ellerbe | NC | — | 225 | 781 | — | 1,006 | 25 | 5/29/2014 | 2014 | ||||||||||||||||
| Family Dollar | Fayetteville | NC | — | 267 | 682 | — | 949 | 31 | 3/14/2014 | 2013 | ||||||||||||||||
| Family Dollar | Hickory | NC | — | 215 | 785 | — | 1,000 | 13 | 8/28/2014 | 2014 | ||||||||||||||||
| Family Dollar | Hiddenite | NC | — | 221 | 832 | — | 1,053 | 14 | 8/28/2014 | 2013 | ||||||||||||||||
| Family Dollar | Liberty | NC | — | 243 | 802 | — | 1,045 | 14 | 8/28/2014 | 2013 | ||||||||||||||||
| Family Dollar | Lumberton | NC | — | 151 | 603 | — | 754 | 44 | 9/11/2013 | 1995 | ||||||||||||||||
| Family Dollar | Lumberton | NC | — | 146 | 1,013 | — | 1,159 | 23 | 6/20/2014 | 2014 | ||||||||||||||||
| Family Dollar | Mint Hill | NC | — | 412 | 992 | — | 1,404 | 22 | 6/25/2014 | 2014 | ||||||||||||||||
| Family Dollar | Parkton | NC | — | 164 | 894 | — | 1,058 | 12 | 9/19/2014 | 2014 | ||||||||||||||||
| Family Dollar | Raeford | NC | — | 428 | 900 | — | 1,328 | 36 | 4/17/2014 | 2014 | ||||||||||||||||
| Family Dollar | Raeford | NC | — | 185 | 935 | — | 1,120 | 30 | 5/29/2014 | 2014 | ||||||||||||||||
| Family Dollar | Troy | NC | — | 341 | 621 | — | 962 | 15 | 6/17/2014 | 2014 | ||||||||||||||||
F-153
| Initial Costs | Costs Capitalized Subsequent to Acquisition | Gross Amount Carried at December 31, 2014 (1) (2) | ||||||||||||||||||||||||
| Property | City | State | Encumbrances at December 31, 2014 | Land | Buildings, Fixtures and Improvements | Accumulated Depreciation (3) (4) | Date Acquired | Date of Construction | ||||||||||||||||||
| Family Dollar | Fort Yates | ND | 581 | 126 | 715 | — | 841 | 119 | 1/31/2012 | 2010 | ||||||||||||||||
| Family Dollar | New Town | ND | 734 | 105 | 942 | — | 1,047 | 156 | 1/31/2012 | 2011 | ||||||||||||||||
| Family Dollar | Rolla | ND | 575 | 83 | 749 | — | 832 | 125 | 1/31/2012 | 2010 | ||||||||||||||||
| Family Dollar | Madison | NE | 537 | 37 | 703 | — | 740 | 120 | 12/30/2011 | 2011 | ||||||||||||||||
| Family Dollar | Omaha | NE | — | 196 | 1,334 | — | 1,530 | — | 3/17/2014 | 1995 | ||||||||||||||||
| Family Dollar | Omaha | NE | — | 141 | 1,159 | — | 1,300 | — | 4/1/2014 | 1995 | ||||||||||||||||
| Family Dollar | Rushville | NE | — | 125 | 499 | — | 624 | 48 | 4/26/2013 | 2007 | ||||||||||||||||
| Family Dollar | Lancaster | NH | — | 456 | 1,294 | — | 1,750 | — | 12/12/2014 | 1989 | ||||||||||||||||
| Family Dollar | Stratford | NJ | — | 378 | 1,511 | — | 1,889 | — | 12/31/2014 | 2014 | ||||||||||||||||
| Family Dollar | Alamorgordo | NM | 524 | 161 | 675 | — | 836 | 31 | 2/7/2014 | 2001 | ||||||||||||||||
| Family Dollar | Belen | NM | — | — | — | 1,069 | 1,069 | — | 4/2/2014 | 2014 | ||||||||||||||||
| Family Dollar | Chimayo | NM | — | 158 | 632 | — | 790 | 70 | 1/30/2013 | 2009 | ||||||||||||||||
| Family Dollar | Cloudcroft | NM | — | 184 | 1,344 | — | 1,528 | — | 4/1/2014 | 1995 | ||||||||||||||||
| Family Dollar | Clovis | NM | 657 | 119 | 854 | — | 973 | 41 | 2/7/2014 | 2004 | ||||||||||||||||
| Family Dollar | Gallup | NM | — | 221 | 1,366 | — | 1,587 | 69 | 2/7/2014 | 2007 | ||||||||||||||||
| Family Dollar | Hernandez | NM | 1,152 | 140 | 1,434 | — | 1,574 | 73 | 2/7/2014 | 2008 | ||||||||||||||||
| Family Dollar | Logan | NM | — | — | — | 678 | 678 | — | 8/1/2014 | In Progress | ||||||||||||||||
| Family Dollar | Lovington | NM | — | 54 | 722 | — | 776 | 16 | 6/30/2014 | 2014 | ||||||||||||||||
| Family Dollar | Mountainair | NM | — | 84 | 752 | — | 836 | 104 | 7/16/2012 | 2011 | ||||||||||||||||
| Family Dollar | Roswell | NM | 766 | 140 | 953 | — | 1,093 | 47 | 2/7/2014 | 2004 | ||||||||||||||||
| Family Dollar | Springer | NM | — | — | — | 1,286 | 1,286 | — | 4/1/2014 | 2014 | ||||||||||||||||
| Family Dollar | Battle Mountain | NV | — | 116 | 1,431 | — | 1,547 | 69 | 2/7/2014 | 2009 | ||||||||||||||||
| Family Dollar | Carlin | NV | — | 99 | 895 | — | 994 | 65 | 9/13/2013 | 2012 | ||||||||||||||||
| Family Dollar | Cold Springs | NV | — | 217 | 869 | — | 1,086 | 63 | 9/13/2013 | 2013 | ||||||||||||||||
| Family Dollar | Hawthorne | NV | 471 | 191 | 764 | — | 955 | 109 | 6/1/2012 | 2012 | ||||||||||||||||
| Family Dollar | Las Vegas | NV | 876 | 689 | 612 | — | 1,301 | 35 | 2/7/2014 | 2005 | ||||||||||||||||
| Family Dollar | Lovelock | NV | 457 | 185 | 742 | — | 927 | 109 | 5/4/2012 | 2012 | ||||||||||||||||
| Family Dollar | Silver Spring | NV | — | 202 | 808 | — | 1,010 | 104 | 9/21/2012 | 2012 | ||||||||||||||||
| Family Dollar | Wells | NV | 415 | 84 | 755 | — | 839 | 111 | 5/11/2012 | 2011 | ||||||||||||||||
| Family Dollar | Altona | NY | — | 94 | 923 | — | 1,017 | 48 | 2/21/2014 | 2014 | ||||||||||||||||
| Family Dollar | Chateaugay | NY | — | 133 | 910 | — | 1,043 | 47 | 2/20/2014 | 2014 | ||||||||||||||||
| Family Dollar | Cincinnatus | NY | — | 287 | 862 | — | 1,149 | 50 | 12/30/2013 | 2013 | ||||||||||||||||
F-154
| Initial Costs | Costs Capitalized Subsequent to Acquisition | Gross Amount Carried at December 31, 2014 (1) (2) | ||||||||||||||||||||||||
| Property | City | State | Encumbrances at December 31, 2014 | Land | Buildings, Fixtures and Improvements | Accumulated Depreciation (3) (4) | Date Acquired | Date of Construction | ||||||||||||||||||
| Family Dollar | Hoosick Falls | NY | — | 181 | 724 | — | 905 | 69 | 4/26/2013 | 2013 | ||||||||||||||||
| Family Dollar | Penn Yan | NY | 525 | 23 | 760 | — | 783 | 36 | 2/7/2014 | 2003 | ||||||||||||||||
| Family Dollar | Sodus | NY | — | 54 | 1,441 | — | 1,495 | 51 | 5/7/2014 | 2013 | ||||||||||||||||
| Family Dollar | Bethel | OH | 852 | 139 | 1,099 | — | 1,238 | 55 | 2/7/2014 | 2005 | ||||||||||||||||
| Family Dollar | Canal Winchester | OH | — | 218 | 1,116 | — | 1,334 | 18 | 8/28/2014 | 2012 | ||||||||||||||||
| Family Dollar | Canton | OH | 460 | 93 | 766 | — | 859 | 36 | 2/7/2014 | 2002 | ||||||||||||||||
| Family Dollar | Cincinnati | OH | — | 221 | 1,055 | — | 1,276 | 19 | 8/28/2014 | 2001 | ||||||||||||||||
| Family Dollar | Cleveland | OH | 1,079 | 39 | 1,614 | — | 1,653 | 76 | 2/7/2014 | 2003 | ||||||||||||||||
| Family Dollar | Cleveland | OH | 1,370 | 216 | 1,818 | — | 2,034 | 89 | 2/7/2014 | 1994 | ||||||||||||||||
| Family Dollar | Cortland | OH | — | 188 | 963 | — | 1,151 | 17 | 8/28/2014 | 2013 | ||||||||||||||||
| Family Dollar | Dayton | OH | — | 107 | 899 | — | 1,006 | 20 | 8/28/2014 | 1940 | ||||||||||||||||
| Family Dollar | Dayton | OH | — | 129 | 618 | — | 747 | 13 | 8/28/2014 | 2002 | ||||||||||||||||
| Family Dollar | Hamilton | OH | — | 131 | 1,215 | — | 1,346 | 20 | 8/28/2014 | 2013 | ||||||||||||||||
| Family Dollar | Jackson Center | OH | — | 97 | 764 | — | 861 | 22 | 4/28/2014 | 1989 | ||||||||||||||||
| Family Dollar | Loveland | OH | 798 | 179 | 986 | — | 1,165 | 49 | 2/7/2014 | 2002 | ||||||||||||||||
| Family Dollar | Middleton | OH | 660 | 137 | 869 | — | 1,006 | 42 | 2/7/2014 | 2001 | ||||||||||||||||
| Family Dollar | Toledo | OH | — | 306 | 917 | — | 1,223 | 97 | 2/25/2013 | 2012 | ||||||||||||||||
| Family Dollar | Toledo | OH | — | 226 | 905 | — | 1,131 | 74 | 7/11/2013 | 1942 | ||||||||||||||||
| Family Dollar | Warren | OH | — | 170 | 681 | — | 851 | 88 | 9/11/2012 | 2012 | ||||||||||||||||
| Family Dollar | DURANT | OK | — | 164 | 1,223 | — | 1,387 | 21 | 8/28/2014 | 2000 | ||||||||||||||||
| Family Dollar | El Reno | OK | — | — | — | 908 | 908 | — | 3/17/2014 | 1995 | ||||||||||||||||
| Family Dollar | Geary | OK | — | — | — | 215 | 215 | — | 12/31/2014 | In Progress | ||||||||||||||||
| Family Dollar | Keota | OK | — | 279 | 872 | — | 1,151 | — | 4/16/2014 | 2014 | ||||||||||||||||
| Family Dollar | Kingston | OK | — | 28 | 660 | — | 688 | 30 | 2/7/2014 | 2000 | ||||||||||||||||
| Family Dollar | Oklahoma City | OK | — | — | — | 899 | 899 | — | 7/31/2014 | In Progress | ||||||||||||||||
| Family Dollar | Oklahoma City | OK | — | 390 | 990 | — | 1,380 | 17 | 8/28/2014 | 2013 | ||||||||||||||||
| Family Dollar | Porum | OK | — | — | — | 385 | 385 | — | 10/30/2014 | In Progress | ||||||||||||||||
| Family Dollar | Poteau | �� | OK | — | — | — | 779 | 779 | — | 9/11/2014 | In Progress | |||||||||||||||
| Family Dollar | Stilwell | OK | 562 | 40 | 768 | — | 808 | 128 | 1/6/2012 | 2011 | ||||||||||||||||
| Family Dollar | Tulsa | OK | 536 | 220 | 878 | — | 1,098 | 121 | 7/30/2012 | 2012 | ||||||||||||||||
| Family Dollar | Broad Top | PA | — | 196 | 954 | — | 1,150 | 25 | 5/30/2014 | 2013 | ||||||||||||||||
F-155
| Initial Costs | Costs Capitalized Subsequent to Acquisition | Gross Amount Carried at December 31, 2014 (1) (2) | ||||||||||||||||||||||||
| Property | City | State | Encumbrances at December 31, 2014 | Land | Buildings, Fixtures and Improvements | Accumulated Depreciation (3) (4) | Date Acquired | Date of Construction | ||||||||||||||||||
| Family Dollar | Abbeville | SC | — | 146 | 734 | — | 880 | 20 | 5/23/2014 | 2014 | ||||||||||||||||
| Family Dollar | Columbia | SC | — | 429 | 719 | — | 1,148 | 32 | 3/12/2014 | 2014 | ||||||||||||||||
| Family Dollar | Estill | SC | — | 244 | 757 | — | 1,001 | 18 | 6/4/2014 | 2014 | ||||||||||||||||
| Family Dollar | Lancaster | SC | — | 249 | 725 | — | 974 | 13 | 8/28/2014 | 2013 | ||||||||||||||||
| Family Dollar | Manning | SC | — | 313 | 960 | — | 1,273 | 13 | 9/30/2014 | 2014 | ||||||||||||||||
| Family Dollar | McCormick | SC | — | 167 | 791 | — | 958 | 32 | 4/30/2014 | 2014 | ||||||||||||||||
| Family Dollar | Newberry | SC | — | 231 | 935 | — | 1,166 | 42 | 3/27/2014 | 2013 | ||||||||||||||||
| Family Dollar | St. Matthews | SC | — | 175 | 828 | — | 1,003 | 12 | 9/3/2014 | 2014 | ||||||||||||||||
| Family Dollar | Woodruff | SC | — | 229 | 1,125 | — | 1,354 | 18 | 8/28/2014 | 2010 | ||||||||||||||||
| Family Dollar | Blackhawk | SD | — | 115 | 585 | — | 700 | 10 | 8/6/2014 | 2006 | ||||||||||||||||
| Family Dollar | Custer | SD | — | 32 | 617 | — | 649 | 53 | 6/14/2013 | 1995 | ||||||||||||||||
| Family Dollar | Lemmon | SD | — | — | — | 678 | 678 | — | 7/16/2014 | 2014 | ||||||||||||||||
| Family Dollar | Martin | SD | 584 | 85 | 764 | — | 849 | 127 | 1/31/2012 | 2010 | ||||||||||||||||
| Family Dollar | Parker | SD | — | 117 | 828 | — | 945 | — | 4/23/2014 | 2014 | ||||||||||||||||
| Family Dollar | Tyndall | SD | — | — | — | 736 | 736 | — | 8/26/2014 | In Progress | ||||||||||||||||
| Family Dollar | Harrison | TN | — | 74 | 420 | — | 494 | 34 | 7/23/2013 | 2006 | ||||||||||||||||
| Family Dollar | Lexington | TN | — | 323 | 838 | — | 1,161 | 14 | 8/28/2014 | 2013 | ||||||||||||||||
| Family Dollar | Memphis | TN | — | 248 | 1,039 | — | 1,287 | 50 | 2/7/2014 | 2004 | ||||||||||||||||
| Family Dollar | Memphis | TN | 638 | 215 | 811 | — | 1,026 | 39 | 2/7/2014 | 2003 | ||||||||||||||||
| Family Dollar | Memphis | TN | 1,251 | 376 | 1,508 | — | 1,884 | 74 | 2/7/2014 | 2005 | ||||||||||||||||
| Family Dollar | Memphis | TN | 973 | 336 | 1,156 | — | 1,492 | 56 | 2/7/2014 | 2003 | ||||||||||||||||
| Family Dollar | NASHVILLE | TN | — | 334 | 1,275 | — | 1,609 | 23 | 8/28/2014 | 1976 | ||||||||||||||||
| Family Dollar | Piney Flats | TN | — | 200 | 953 | — | 1,153 | 16 | 8/28/2014 | 2014 | ||||||||||||||||
| Family Dollar | Alton | TX | — | 134 | 908 | — | 1,042 | 15 | 8/28/2014 | 2013 | ||||||||||||||||
| Family Dollar | Arlington | TX | — | — | — | 756 | 756 | — | 4/1/2014 | 1995 | ||||||||||||||||
| Family Dollar | Avinger | TX | — | 40 | 761 | — | 801 | 94 | 10/22/2012 | 2012 | ||||||||||||||||
| Family Dollar | Beaumont | TX | — | 215 | 1,511 | — | 1,726 | 65 | 2/7/2014 | 2003 | ||||||||||||||||
| Family Dollar | Beaumont | TX | — | 235 | 810 | — | 1,045 | 38 | 2/7/2014 | 2003 | ||||||||||||||||
| Family Dollar | Beaumont | TX | 654 | 225 | 806 | — | 1,031 | 38 | 2/7/2014 | 2003 | ||||||||||||||||
| Family Dollar | Blooming Grove | TX | — | 70 | 753 | — | 823 | 13 | 8/28/2014 | 2014 | ||||||||||||||||
F-156
| Initial Costs | Costs Capitalized Subsequent to Acquisition | Gross Amount Carried at December 31, 2014 (1) (2) | ||||||||||||||||||||||||
| Property | City | State | Encumbrances at December 31, 2014 | Land | Buildings, Fixtures and Improvements | Accumulated Depreciation (3) (4) | Date Acquired | Date of Construction | ||||||||||||||||||
| Family Dollar | Brazoria | TX | — | 216 | 966 | — | 1,182 | 45 | 2/7/2014 | 2002 | ||||||||||||||||
| Family Dollar | Broaddus | TX | — | — | — | 1,072 | 1,072 | — | 4/1/2014 | 1995 | ||||||||||||||||
| Family Dollar | Caldwell | TX | — | 138 | 552 | — | 690 | 81 | 5/29/2012 | 2012 | ||||||||||||||||
| Family Dollar | Centerville | TX | — | 226 | 679 | — | 905 | 49 | 9/10/2013 | 2013 | ||||||||||||||||
| Family Dollar | Chireno | TX | — | 50 | 943 | — | 993 | 108 | 12/10/2012 | 2012 | ||||||||||||||||
| Family Dollar | Clarendon | TX | — | 83 | 749 | — | 832 | 54 | 9/17/2013 | 2013 | ||||||||||||||||
| Family Dollar | Cockrell Hill | TX | 970 | 369 | 1,156 | — | 1,525 | 55 | 2/7/2014 | 2002 | ||||||||||||||||
| Family Dollar | Converse | TX | 409 | 148 | 469 | — | 617 | 23 | 2/7/2014 | 2003 | ||||||||||||||||
| Family Dollar | Dallas | TX | 627 | 292 | 676 | — | 968 | 34 | 2/7/2014 | 2004 | ||||||||||||||||
| Family Dollar | Dickinson | TX | 681 | 182 | 876 | — | 1,058 | 42 | 2/7/2014 | 2010 | ||||||||||||||||
| Family Dollar | Donna | TX | — | 194 | 855 | — | 1,049 | 15 | 8/28/2014 | 2013 | ||||||||||||||||
| Family Dollar | Eagle Lake | TX | — | 100 | 566 | — | 666 | 78 | 7/6/2012 | 2012 | ||||||||||||||||
| Family Dollar | Etoile | TX | — | 45 | 850 | — | 895 | 66 | 8/6/2013 | 2013 | ||||||||||||||||
| Family Dollar | Floydada | TX | 520 | 36 | 681 | — | 717 | 116 | 12/30/2011 | 2010 | ||||||||||||||||
| Family Dollar | Fort Worth | TX | — | — | — | 670 | 670 | — | 6/6/2014 | 1995 | ||||||||||||||||
| Family Dollar | Fort Worth | TX | — | — | — | 562 | 562 | — | 11/3/2014 | In Progress | ||||||||||||||||
| Family Dollar | Houston | TX | — | 174 | 696 | — | 870 | 67 | 4/26/2013 | 1995 | ||||||||||||||||
| Family Dollar | Houston | TX | 886 | 297 | 1,081 | — | 1,378 | 51 | 2/7/2014 | 2002 | ||||||||||||||||
| Family Dollar | Houston | TX | — | 565 | 1,223 | — | 1,788 | 59 | 2/7/2014 | 2009 | ||||||||||||||||
| Family Dollar | Houston | TX | — | 138 | 1,052 | — | 1,190 | 49 | 2/7/2014 | 2002 | ||||||||||||||||
| Family Dollar | Houston | TX | — | 128 | 769 | — | 897 | 34 | 2/7/2014 | 2002 | ||||||||||||||||
| Family Dollar | Houston | TX | 911 | 277 | 1,144 | — | 1,421 | 54 | 2/7/2014 | 2002 | ||||||||||||||||
| Family Dollar | Houston | TX | 920 | 1,355 | 95 | — | 1,450 | 8 | 2/7/2014 | 1981 | ||||||||||||||||
| Family Dollar | Jacksonville | TX | — | 195 | 1,003 | — | 1,198 | 46 | 3/21/2014 | 2014 | ||||||||||||||||
| Family Dollar | Kerens | TX | 365 | 73 | 658 | — | 731 | 106 | 2/29/2012 | 2011 | ||||||||||||||||
| Family Dollar | La Pryor | TX | — | 74 | 817 | — | 891 | 14 | 8/28/2014 | 2013 | ||||||||||||||||
| Family Dollar | Leander | TX | 557 | 355 | 489 | — | 844 | 24 | 2/7/2014 | 2004 | ||||||||||||||||
| Family Dollar | Lovelady | TX | — | 82 | 740 | — | 822 | 74 | 3/27/2013 | 1995 | ||||||||||||||||
F-157
| Initial Costs | Costs Capitalized Subsequent to Acquisition | Gross Amount Carried at December 31, 2014 (1) (2) | ||||||||||||||||||||||||
| Property | City | State | Encumbrances at December 31, 2014 | Land | Buildings, Fixtures and Improvements | Accumulated Depreciation (3) (4) | Date Acquired | Date of Construction | ||||||||||||||||||
| Family Dollar | Lufkin | TX | 1,153 | 198 | 1,600 | — | 1,798 | 75 | 2/7/2014 | 2004 | ||||||||||||||||
| Family Dollar | Marshall | TX | — | 85 | 662 | — | 747 | 33 | 2/7/2014 | 2001 | ||||||||||||||||
| Family Dollar | McAllen | TX | — | 445 | 896 | — | 1,341 | 15 | 8/28/2014 | 2013 | ||||||||||||||||
| Family Dollar | McAllen | TX | 857 | 219 | 1,093 | — | 1,312 | 52 | 2/7/2014 | 2004 | ||||||||||||||||
| Family Dollar | Mesquite | TX | — | — | — | 1,353 | 1,353 | — | 5/2/2014 | 1995 | ||||||||||||||||
| Family Dollar | Mesquite | TX | — | — | — | 765 | 765 | — | 9/5/2014 | In Progress | ||||||||||||||||
| Family Dollar | Mesquite | TX | — | — | — | 782 | 782 | — | 9/11/2014 | In Progress | ||||||||||||||||
| Family Dollar | Mexia | TX | — | 112 | 495 | — | 607 | 25 | 2/7/2014 | 2000 | ||||||||||||||||
| Family Dollar | Noonday | TX | 625 | 103 | 895 | — | 998 | 42 | 2/7/2014 | 2004 | ||||||||||||||||
| Family Dollar | Oakhurst | TX | — | 36 | 683 | — | 719 | 78 | 12/12/2012 | 2012 | ||||||||||||||||
| Family Dollar | Oakwood | TX | — | 133 | 752 | — | 885 | 48 | 11/20/2013 | 2013 | ||||||||||||||||
| Family Dollar | Ore City | TX | — | 27 | 744 | — | 771 | 13 | 8/28/2014 | 2013 | ||||||||||||||||
| Family Dollar | Palestine | TX | 671 | 120 | 914 | — | 1,034 | 44 | 2/7/2014 | 2000 | ||||||||||||||||
| Family Dollar | Pharr | TX | 969 | 219 | 1,253 | — | 1,472 | 60 | 2/7/2014 | 2002 | ||||||||||||||||
| Family Dollar | Plano | TX | — | 468 | 869 | — | 1,337 | 67 | 8/1/2013 | 2013 | ||||||||||||||||
| Family Dollar | Port Arthur | TX | 1,044 | 178 | 1,452 | — | 1,630 | 68 | 2/7/2014 | 2005 | ||||||||||||||||
| Family Dollar | Raymondville | TX | 542 | 117 | 707 | — | 824 | 34 | 2/7/2014 | 2002 | ||||||||||||||||
| Family Dollar | Refugio | TX | — | 110 | 982 | — | 1,092 | 16 | 8/28/2014 | 2013 | ||||||||||||||||
| Family Dollar | Rio Grande | TX | — | 133 | 1,284 | — | 1,417 | 61 | 2/7/2014 | 2003 | ||||||||||||||||
| Family Dollar | Robstown | TX | 550 | 44 | 852 | — | 896 | 39 | 2/7/2014 | 2003 | ||||||||||||||||
| Family Dollar | Royse City | TX | 972 | 411 | 1,078 | — | 1,489 | 52 | 2/7/2014 | 2002 | ||||||||||||||||
| Family Dollar | Sabinal | TX | — | 35 | 952 | — | 987 | 16 | 8/28/2014 | 2013 | ||||||||||||||||
| Family Dollar | San Angelo | TX | 891 | 232 | 1,118 | — | 1,350 | 54 | 2/7/2014 | 2011 | ||||||||||||||||
| Family Dollar | San Antonio | TX | 800 | 198 | 1,018 | — | 1,216 | 49 | 2/7/2014 | 2002 | ||||||||||||||||
| Family Dollar | San Antonio | TX | 864 | 299 | 1,039 | — | 1,338 | 49 | 2/7/2014 | 2004 | ||||||||||||||||
| Family Dollar | San Antonio | TX | 598 | 260 | 653 | — | 913 | 32 | 2/7/2014 | 2004 | ||||||||||||||||
| Family Dollar | San Antonio | TX | 506 | 211 | 567 | — | 778 | 27 | 2/7/2014 | 2004 | ||||||||||||||||
| Family Dollar | San Antonio | TX | 728 | 214 | 911 | — | 1,125 | 43 | 2/7/2014 | 2004 | ||||||||||||||||
F-158
| Initial Costs | Costs Capitalized Subsequent to Acquisition | Gross Amount Carried at December 31, 2014 (1) (2) | ||||||||||||||||||||||||
| Property | City | State | Encumbrances at December 31, 2014 | Land | Buildings, Fixtures and Improvements | Accumulated Depreciation (3) (4) | Date Acquired | Date of Construction | ||||||||||||||||||
| Family Dollar | San Antonio | TX | 1,143 | 117 | 1,619 | — | 1,736 | 76 | 2/7/2014 | 2004 | ||||||||||||||||
| Family Dollar | San Benito | TX | 598 | 132 | 772 | — | 904 | 37 | 2/7/2014 | 2004 | ||||||||||||||||
| Family Dollar | San Diego | TX | 602 | 55 | 855 | — | 910 | 41 | 2/7/2014 | 2004 | ||||||||||||||||
| Family Dollar | Seadrift | TX | — | 51 | 832 | — | 883 | 14 | 8/28/2014 | 2013 | ||||||||||||||||
| Family Dollar | Somerville | TX | — | 131 | 743 | — | 874 | 85 | 12/31/2012 | 1995 | ||||||||||||||||
| Family Dollar | SONORA | TX | — | 49 | 548 | — | 597 | 12 | 8/28/2014 | 2001 | ||||||||||||||||
| Family Dollar | Tyler | TX | 416 | 132 | 554 | — | 686 | 26 | 2/7/2014 | 2003 | ||||||||||||||||
| Family Dollar | Victoria | TX | — | 441 | 144 | — | 585 | 9 | 2/7/2014 | 2003 | ||||||||||||||||
| Family Dollar | Waco | TX | 440 | 125 | 544 | — | 669 | 26 | 2/7/2014 | 2001 | ||||||||||||||||
| Family Dollar | Weatherford | TX | — | 218 | 1,057 | — | 1,275 | — | 4/8/2014 | 2014 | ||||||||||||||||
| Family Dollar | Beaver | UT | 646 | 107 | 913 | — | 1,020 | 44 | 2/7/2014 | 2007 | ||||||||||||||||
| Family Dollar | Bristol | VA | 608 | 104 | 837 | — | 941 | 42 | 2/7/2014 | 1978 | ||||||||||||||||
| Family Dollar | Gretna | VA | — | 131 | 744 | — | 875 | 61 | 7/2/2013 | 2012 | ||||||||||||||||
| Family Dollar | Hopewell | VA | — | 430 | 987 | — | 1,417 | 50 | 2/26/2014 | 2014 | ||||||||||||||||
| Family Dollar | Petersburg | VA | 948 | 142 | 1,209 | — | 1,351 | 61 | 2/7/2014 | 2003 | ||||||||||||||||
| Family Dollar | Stuart | VA | — | 204 | 750 | — | 954 | 16 | 4/18/2014 | 2013 | ||||||||||||||||
| Family Dollar | Wirtz | VA | — | 148 | 919 | — | 1,067 | 16 | 8/28/2014 | 2013 | ||||||||||||||||
| Family Dollar | Green Bay | WI | — | 304 | 1,072 | — | 1,376 | 52 | 2/7/2014 | 2011 | ||||||||||||||||
| Family Dollar | Markesan | WI | — | 92 | 831 | — | 923 | 49 | 12/12/2013 | 2013 | ||||||||||||||||
| Family Dollar | Mayville | WI | — | 128 | 1,023 | — | 1,151 | 51 | 2/26/2014 | 2014 | ||||||||||||||||
| Family Dollar | Milwaukee | WI | 970 | 161 | 1,397 | — | 1,558 | 65 | 2/7/2014 | 2003 | ||||||||||||||||
| Family Dollar | Thorp | WI | — | 90 | 810 | — | 900 | 63 | 8/30/2013 | 2013 | ||||||||||||||||
| Family Dollar | Webster | WI | — | 43 | 808 | — | 851 | 66 | 7/11/2013 | 2013 | ||||||||||||||||
| Family Dollar | Alderson | WV | — | 166 | 663 | — | 829 | 54 | 7/11/2013 | 2012 | ||||||||||||||||
| Family Dollar | Kemmerer | WY | — | 45 | 853 | — | 898 | 90 | 2/22/2013 | 2013 | ||||||||||||||||
| Family Dollar | Mountain View | WY | — | 44 | 838 | — | 882 | 61 | 9/13/2013 | 2013 | ||||||||||||||||
| Family Dollar | Torrington | WY | — | 72 | 645 | — | 717 | 59 | 5/9/2013 | 1995 | ||||||||||||||||
| Family Fare Supermarket | Battle Creek | MI | — | 1,393 | 7,950 | — | 9,343 | 388 | 2/7/2014 | 2010 | ||||||||||||||||
F-159
| Initial Costs | Costs Capitalized Subsequent to Acquisition | Gross Amount Carried at December 31, 2014 (1) (2) | ||||||||||||||||||||||||
| Property | City | State | Encumbrances at December 31, 2014 | Land | Buildings, Fixtures and Improvements | Accumulated Depreciation (3) (4) | Date Acquired | Date of Construction | ||||||||||||||||||
| Famous Dave's | Eden Prairie | MN | — | 824 | 549 | — | 1,373 | 48 | 7/31/2013 | 1995 | ||||||||||||||||
| Famous Dave's | Independence | MO | — | 620 | 422 | — | 1,042 | 35 | 6/27/2013 | 1995 | ||||||||||||||||
| Farmers Insurance | Simi Valley | CA | 25,620 | 5,158 | 12,614 | — | 17,772 | — | 11/5/2013 | 1982 | ||||||||||||||||
| Farmers Insurance | Mercer Island | WA | 28,763 | 24,285 | 28,210 | — | 52,495 | 1,558 | 11/5/2013 | 1982 | ||||||||||||||||
| Fazoli's | Carmel | IN | — | 427 | 522 | — | 949 | 40 | 7/31/2013 | 1986 | ||||||||||||||||
| Fazoli's | Appleton | WI | — | 705 | — | — | 705 | — | 7/31/2013 | 1995 | ||||||||||||||||
| FedEx | Homewood | AL | — | 522 | 779 | — | 1,301 | 67 | 6/27/2013 | 2000 | ||||||||||||||||
| FedEx | Lowell | AR | — | 396 | 7,521 | — | 7,917 | 822 | 3/15/2013 | 2007 | ||||||||||||||||
| FedEx | Tempe | AZ | — | 2,914 | 12,300 | — | 15,214 | 336 | 6/25/2014 | 2004 | ||||||||||||||||
| FedEx | Yuma | AZ | 1,296 | — | 2,076 | — | 2,076 | 280 | 10/17/2012 | 2011 | ||||||||||||||||
| FedEx | Chico | CA | — | 308 | 2,776 | — | 3,084 | 360 | 11/9/2012 | 2006 | ||||||||||||||||
| FedEx | Commerce City | CO | 20,394 | 6,556 | 26,224 | — | 32,780 | 4,466 | 3/20/2012 | 2007 | ||||||||||||||||
| FedEx | Melbourne | FL | — | 159 | 1,433 | — | 1,592 | 127 | 7/26/2013 | 2001 | ||||||||||||||||
| FedEx | Albany | GA | — | 195 | 3,711 | — | 3,906 | 274 | 10/11/2013 | 2013 | ||||||||||||||||
| FedEx | Des Moines | IA | 1,318 | 733 | 1,361 | 144 | 2,238 | 142 | 4/18/2013 | 1986 | ||||||||||||||||
| FedEx | Ottumwa | IA | 1,658 | 205 | 2,552 | 2,749 | 5,506 | 344 | 10/30/2012 | 2012 | ||||||||||||||||
| FedEx | Waterloo | IA | 1,867 | 152 | 2,882 | — | 3,034 | 315 | 3/22/2013 | 2006 | ||||||||||||||||
| FedEx | Effingham | IL | 7,040 | 1,875 | 14,827 | — | 16,702 | 613 | 2/7/2014 | 2008 | ||||||||||||||||
| FedEx | Kankakee | IL | — | 195 | 1,103 | — | 1,298 | 177 | 5/31/2012 | 2003 | ||||||||||||||||
| FedEx | Mt Vernon | IL | — | 222 | 1,259 | — | 1,481 | 202 | 5/31/2012 | 1998 | ||||||||||||||||
| FedEx | Quincy | IL | 1,514 | 371 | 2,101 | — | 2,472 | 294 | 9/28/2012 | 2012 | ||||||||||||||||
| FedEx | Evansville | IN | — | 665 | 2,661 | — | 3,326 | 426 | 5/31/2012 | 1998 | ||||||||||||||||
| FedEx | Kokomo | IN | 2,296 | 186 | 3,541 | — | 3,727 | 603 | 3/16/2012 | 2012 | ||||||||||||||||
| FedEx | Lafayette | IN | 2,230 | 768 | 4,128 | — | 4,896 | 166 | 2/7/2014 | 2008 | ||||||||||||||||
| FedEx | Independence | KS | 1,406 | 114 | 2,166 | — | 2,280 | 292 | 10/30/2012 | 2012 | ||||||||||||||||
| FedEx | Hazard | KY | 2,625 | 215 | 4,085 | — | 4,300 | 571 | 9/28/2012 | 2012 | ||||||||||||||||
| FedEx | London | KY | — | 191 | 1,081 | — | 1,272 | 173 | 5/31/2012 | 2003 | ||||||||||||||||
| FedEx | London | KY | — | 350 | 3,151 | — | 3,501 | 232 | 10/11/2013 | 2013 | ||||||||||||||||
F-160
| Initial Costs | Costs Capitalized Subsequent to Acquisition | Gross Amount Carried at December 31, 2014 (1) (2) | ||||||||||||||||||||||||
| Property | City | State | Encumbrances at December 31, 2014 | Land | Buildings, Fixtures and Improvements | Accumulated Depreciation (3) (4) | Date Acquired | Date of Construction | ||||||||||||||||||
| FedEx | Bossier City | LA | — | 295 | 6,223 | — | 6,518 | 271 | 2/7/2014 | 2009 | ||||||||||||||||
| FedEx | Grand Rapids | MI | 4,800 | 1,797 | 7,189 | — | 8,986 | 1,115 | 6/14/2012 | 2012 | ||||||||||||||||
| FedEx | Port Huron | MI | — | 125 | 1,121 | — | 1,246 | 111 | 5/31/2013 | 2003 | ||||||||||||||||
| FedEx | Roseville | MN | 6,073 | 1,462 | 8,282 | — | 9,744 | 1,074 | 11/30/2012 | 2012 | ||||||||||||||||
| FedEx | Columbia | MO | — | 1,402 | 7,794 | — | 9,196 | 110 | 9/30/2014 | 2007 | ||||||||||||||||
| FedEx | McComb | MS | — | 548 | 3,268 | — | 3,816 | 130 | 2/7/2014 | 2008 | ||||||||||||||||
| FedEx | Butte | MT | 5,060 | 403 | 7,653 | 2,678 | 10,734 | 1,537 | 9/27/2011 | 2001 | ||||||||||||||||
| FedEx | Greenville | NC | 4,669 | 363 | 6,903 | — | 7,266 | 1,211 | 2/22/2012 | 2006 | ||||||||||||||||
| FedEx | Belmont | NH | 1,786 | 265 | 2,386 | — | 2,651 | 443 | 12/29/2011 | 1991 | ||||||||||||||||
| FedEx | Wendover | NV | — | 262 | 1,483 | — | 1,745 | 170 | 2/25/2013 | 2012 | ||||||||||||||||
| FedEx | Winnemucca | NV | — | 280 | 1,585 | — | 1,865 | 181 | 2/25/2013 | 2012 | ||||||||||||||||
| FedEx | Blauvelt | NY | 26,100 | 14,420 | 26,779 | — | 41,199 | 4,424 | 4/5/2012 | 2012 | ||||||||||||||||
| FedEx | Marcy | NY | — | 339 | 5,795 | — | 6,134 | 98 | 9/5/2014 | 2006 | ||||||||||||||||
| FedEx | Montgomery | NY | — | 3,582 | 20,071 | — | 23,653 | 1,083 | 2/26/2014 | 2003 | ||||||||||||||||
| FedEx | Plattsburg | NY | 2,614 | 801 | 3,982 | — | 4,783 | 187 | 2/7/2014 | 2008 | ||||||||||||||||
| FedEx | Chillicothe | OH | — | 143 | 1,284 | — | 1,427 | 206 | 5/31/2012 | 2000 | ||||||||||||||||
| FedEx | Lebanon | OH | 6,034 | 1,492 | 8,452 | — | 9,944 | 709 | 8/26/2013 | 2013 | ||||||||||||||||
| FedEx | Northwood | OH | 2,410 | 674 | 5,497 | — | 6,171 | 223 | 2/7/2014 | 1998 | ||||||||||||||||
| FedEx | Tulsa | OK | 5,840 | 458 | 8,695 | — | 9,153 | 1,525 | 2/22/2012 | 2008 | ||||||||||||||||
| FedEx | Tulsa | OK | — | 1,476 | 18,054 | — | 19,530 | 872 | 3/31/2014 | 1999 | ||||||||||||||||
| FedEx | Mount Pleasant | PA | — | 454 | 1,912 | 21 | 2,387 | 300 | 5/31/2012 | 2001 | ||||||||||||||||
| FedEx | Tinicum | PA | — | — | 32,180 | — | 32,180 | 2,699 | 8/15/2013 | 2013 | ||||||||||||||||
| FedEx | Rapid City | SD | 1,868 | 305 | 2,741 | — | 3,046 | 341 | 12/21/2012 | 2007 | ||||||||||||||||
| FedEx | Blountville | TN | 3,700 | 562 | 5,056 | — | 5,618 | 887 | 2/3/2012 | 2009 | ||||||||||||||||
| FedEx | Humboldt | TN | 2,930 | 239 | 4,543 | — | 4,782 | 681 | 7/11/2012 | 2008 | ||||||||||||||||
| FedEx | Bryan | TX | — | 1,422 | 4,763 | — | 6,185 | 528 | 6/15/2012 | 1995 | ||||||||||||||||
| FedEx | Dublin | VA | — | 683 | 3,164 | 1,796 | 5,643 | 132 | 2/7/2014 | 2009 | ||||||||||||||||
| FedEx | Omak | WA | 1,023 | 252 | 1,425 | — | 1,677 | 199 | 9/27/2012 | 2012 | ||||||||||||||||
| FedEx | Wenatchee | WA | 1,630 | 266 | 2,393 | — | 2,659 | 335 | 9/27/2012 | 1995 | ||||||||||||||||
| FedEx | Parkersburg | WV | 2,379 | 193 | 3,671 | — | 3,864 | 513 | 9/20/2012 | 2012 | ||||||||||||||||
| FedEx | Riverton | WY | — | 431 | 1,006 | — | 1,437 | 74 | 10/23/2013 | 2013 | ||||||||||||||||
F-161
| Initial Costs | Costs Capitalized Subsequent to Acquisition | Gross Amount Carried at December 31, 2014 (1) (2) | ||||||||||||||||||||||||
| Property | City | State | Encumbrances at December 31, 2014 | Land | Buildings, Fixtures and Improvements | Accumulated Depreciation (3) (4) | Date Acquired | Date of Construction | ||||||||||||||||||
| Fire Mountain Buffet | Cullman | AL | — | 847 | 2,390 | — | 3,237 | 128 | 2/7/2014 | 1996 | ||||||||||||||||
| Fire Mountain Buffet | Tuscaloosa | AL | — | 244 | 1,306 | — | 1,550 | 76 | 1/8/2014 | 2001 | ||||||||||||||||
| Fire Mountain Buffet | Searcy | AR | — | 231 | 1,286 | — | 1,517 | 75 | 1/8/2014 | 1998 | ||||||||||||||||
| Fire Mountain Buffet | Bossier City | LA | — | 1,168 | 2,594 | — | 3,762 | 144 | 2/7/2014 | 2004 | ||||||||||||||||
| Fire Mountain Buffet | Hagerstown | MD | — | 244 | 1,306 | — | 1,550 | 76 | 1/8/2014 | 2001 | ||||||||||||||||
| Fire Mountain Buffet | West Plains | MO | — | 249 | 1,313 | — | 1,562 | 77 | 1/8/2014 | 1997 | ||||||||||||||||
| Fire Mountain Buffet | Horn Lake | MS | — | 925 | 2,463 | — | 3,388 | 134 | 2/7/2014 | 1995 | ||||||||||||||||
| Fire Mountain Buffet | Beaver Falls | PA | — | 243 | 1,304 | — | 1,547 | 76 | 1/8/2014 | 2004 | ||||||||||||||||
| Fire Mountain Buffet | Mechanicsburg | PA | — | 253 | 1,319 | — | 1,572 | 78 | 1/8/2014 | 1995 | ||||||||||||||||
| Fire Mountain Buffet | Summerville | SC | — | 245 | 1,308 | — | 1,553 | 76 | 1/8/2014 | 1997 | ||||||||||||||||
| Fire Mountain Buffet | Charleston | WV | — | 243 | 1,305 | — | 1,548 | 76 | 1/8/2014 | 2000 | ||||||||||||||||
| First Bank | Pinellas Park | FL | — | 630 | 1,470 | — | 2,100 | 95 | 10/1/2013 | 1980 | ||||||||||||||||
| Fleming's Steakhouse | Englewood | CO | — | 1,152 | 3,055 | — | 4,207 | 162 | 2/7/2014 | 2004 | ||||||||||||||||
| Flint Energy Technologies | Rhome | TX | — | 284 | 1,752 | — | 2,036 | 30 | 9/19/2014 | 2014 | ||||||||||||||||
| Flip It Bakery & Deli | Washington | DC | — | 338 | 84 | — | 422 | 6 | 7/31/2013 | 1985 | ||||||||||||||||
| FMC Corp. | Mechanicsville | PA | 3,991 | 2,108 | 3,315 | — | 5,423 | 227 | 2/21/2014 | 1996 | ||||||||||||||||
| Folsom Gateway II | Folsom | CA | 21,600 | 10,314 | 27,983 | — | 38,297 | 1,236 | 2/7/2014 | 2006 | ||||||||||||||||
| Food Lion | Moyock | NC | — | 1,269 | 2,950 | — | 4,219 | 156 | 2/7/2014 | 1999 | ||||||||||||||||
| Forum Energy Technology | Guthrie | OK | — | 393 | 1,305 | — | 1,698 | 34 | 6/25/2014 | 1979 | ||||||||||||||||
| Forum Energy Technology | Gainesville | TX | — | 123 | 6,019 | — | 6,142 | 149 | 6/25/2014 | 2008 | ||||||||||||||||
| Forum Energy Technology | Gainesville | TX | — | 158 | — | — | 158 | 1 | 6/25/2014 | 1995 | ||||||||||||||||
| Fresenius Medical Care | Fairhope | AL | — | — | 2,035 | — | 2,035 | 139 | 7/8/2013 | 2006 | ||||||||||||||||
| Fresenius Medical Care | Foley | AL | — | 287 | 2,580 | — | 2,867 | 177 | 7/8/2013 | 2009 | ||||||||||||||||
| Fresenius Medical Care | Mobile | AL | — | 278 | 2,505 | — | 2,783 | 172 | 7/8/2013 | 2009 | ||||||||||||||||
| Fresenius Medical Care | DeFuniak Springs | FL | — | 115 | 2,180 | — | 2,295 | 149 | 7/8/2013 | 2008 | ||||||||||||||||
| Fresenius Medical Care | Aurora | IL | 2,294 | 287 | 2,584 | — | 2,871 | 299 | 7/13/2012 | 1996 | ||||||||||||||||
| Fresenius Medical Care | Chicago | IL | — | 588 | 1,764 | — | 2,352 | 204 | 7/31/2012 | 1960 | ||||||||||||||||
| Fresenius Medical Care | Waukegan | IL | — | 94 | 1,792 | — | 1,886 | 207 | 7/31/2012 | 1980 | ||||||||||||||||
F-162
| Initial Costs | Costs Capitalized Subsequent to Acquisition | Gross Amount Carried at December 31, 2014 (1) (2) | ||||||||||||||||||||||||
| Property | City | State | Encumbrances at December 31, 2014 | Land | Buildings, Fixtures and Improvements | Accumulated Depreciation (3) (4) | Date Acquired | Date of Construction | ||||||||||||||||||
| Fresenius Medical Care | Peru | IN | — | 69 | 1,305 | — | 1,374 | 156 | 6/27/2012 | 1982 | ||||||||||||||||
| Fresenius Medical Care | Bossier City | LA | — | 120 | 682 | — | 802 | 63 | 1/30/2013 | 2008 | ||||||||||||||||
| Fresenius Medical Care | Caro | MI | — | 92 | 1,744 | — | 1,836 | 208 | 6/5/2012 | 1995 | ||||||||||||||||
| Fresenius Medical Care | Jackson | MI | 1,948 | 137 | 2,603 | — | 2,740 | 311 | 6/5/2012 | 1995 | ||||||||||||||||
| Fresenius Medical Care | Albemarle | NC | — | 139 | 1,253 | — | 1,392 | 101 | 4/30/2013 | 2008 | ||||||||||||||||
| Fresenius Medical Care | Angiers | NC | — | 203 | 1,152 | — | 1,355 | 93 | 4/30/2013 | 2012 | ||||||||||||||||
| Fresenius Medical Care | Asheboro | NC | 2,373 | 323 | 2,903 | — | 3,226 | 233 | 4/30/2013 | 2012 | ||||||||||||||||
| Fresenius Medical Care | Clinton | NC | — | 139 | 2,655 | — | 2,794 | 192 | 6/28/2013 | 1995 | ||||||||||||||||
| Fresenius Medical Care | Fairmont | NC | — | 201 | 1,819 | — | 2,020 | 131 | 6/28/2013 | 2002 | ||||||||||||||||
| Fresenius Medical Care | Fayetteville | NC | — | 420 | 2,379 | — | 2,799 | 172 | 6/28/2013 | 1995 | ||||||||||||||||
| Fresenius Medical Care | Fayetteville | NC | — | 134 | 2,551 | — | 2,685 | 185 | 6/28/2013 | 2004 | ||||||||||||||||
| Fresenius Medical Care | Fayetteville | NC | — | 178 | 3,379 | — | 3,557 | 245 | 6/28/2013 | 1999 | ||||||||||||||||
| Fresenius Medical Care | Lumberton | NC | — | 117 | 2,216 | — | 2,333 | 161 | 6/28/2013 | 1986 | ||||||||||||||||
| Fresenius Medical Care | Pembroke | NC | — | 81 | 1,547 | — | 1,628 | 112 | 6/28/2013 | 2009 | ||||||||||||||||
| Fresenius Medical Care | Red Springs | NC | — | 101 | 1,913 | — | 2,014 | 139 | 6/28/2013 | 2000 | ||||||||||||||||
| Fresenius Medical Care | Roseboro | NC | — | 74 | 1,404 | — | 1,478 | 102 | 6/28/2013 | 2010 | ||||||||||||||||
| Fresenius Medical Care | St. Pauls | NC | — | 73 | 1,389 | — | 1,462 | 101 | 6/28/2013 | 2008 | ||||||||||||||||
| Fresenius Medical Care | Taylorsville | NC | — | 275 | 1,099 | — | 1,374 | 88 | 4/30/2013 | 2011 | ||||||||||||||||
| Fresenius Medical Care | Warsaw | NC | — | 75 | 1,428 | — | 1,503 | 143 | 11/13/2012 | 2003 | ||||||||||||||||
| Fresenius Medical Care | Kings Mills | OH | — | 399 | 598 | — | 997 | 72 | 6/5/2012 | 1995 | ||||||||||||||||
| Fresenius Medical Care | Dallas | TX | — | 377 | 1,132 | — | 1,509 | 100 | 2/28/2013 | 1958 | ||||||||||||||||
| Front Range Community College | Longmont | CO | — | 407 | 2,428 | — | 2,835 | 145 | 1/8/2014 | 1987 | ||||||||||||||||
| Front Range Community College | Longmont | CO | — | 1,150 | 9,067 | — | 10,217 | 539 | 1/8/2014 | 1988 | ||||||||||||||||
| Furr's | Garland | TX | — | 1,529 | 3,715 | — | 5,244 | 328 | 6/27/2013 | 2008 | ||||||||||||||||
| Gainesville Fuel | Cleburne | TX | — | 70 | — | — | 70 | — | 6/25/2014 | 2009 | ||||||||||||||||
| Gander Mountain | Houston | TX | — | 2,640 | 10,559 | — | 13,199 | 359 | 5/19/2014 | 2004 | ||||||||||||||||
| Garden Ridge | Stockbridge | GA | — | 2,057 | 8,967 | — | 11,024 | 429 | 2/7/2014 | 1998 | ||||||||||||||||
| GE Aviation | Auburn | AL | 24,133 | 1,627 | 30,920 | — | 32,547 | 3,466 | 11/21/2012 | 1995 | ||||||||||||||||
F-163
| Initial Costs | Costs Capitalized Subsequent to Acquisition | Gross Amount Carried at December 31, 2014 (1) (2) | ||||||||||||||||||||||||
| Property | City | State | Encumbrances at December 31, 2014 | Land | Buildings, Fixtures and Improvements | Accumulated Depreciation (3) (4) | Date Acquired | Date of Construction | ||||||||||||||||||
| GE Engine | Winfield | KS | — | 1,078 | 5,087 | — | 6,165 | 553 | 5/6/2014 | 1951 | ||||||||||||||||
| General Electric | Longmont | CO | — | 1,402 | 15,640 | — | 17,042 | 957 | 1/8/2014 | 1993 | ||||||||||||||||
| General Mills | Geneva | IL | 16,555 | 7,457 | 22,371 | — | 29,828 | 3,582 | 5/23/2012 | 1998 | ||||||||||||||||
| General Mills | Fort Wayne | IN | — | 2,533 | 48,130 | — | 50,663 | 6,484 | 10/18/2012 | 2012 | ||||||||||||||||
| General Service Administration | Birmingham | AL | — | 1,400 | 8,830 | — | 10,230 | 568 | 11/5/2013 | 2005 | ||||||||||||||||
| General Service Administration | Mobile | AL | — | 268 | 5,095 | — | 5,363 | 712 | 6/19/2012 | 1995 | ||||||||||||||||
| General Service Administration | North Birmingham | AL | — | 2,982 | 19,982 | — | 22,964 | 1,306 | 11/5/2013 | 2005 | ||||||||||||||||
| General Service Administration | Springerville | AZ | — | 148 | 2,810 | — | 2,958 | 380 | 7/2/2012 | 2006 | ||||||||||||||||
| General Service Administration | Craig | CO | 583 | 129 | 1,159 | — | 1,288 | 194 | 12/30/2011 | 1995 | ||||||||||||||||
| General Service Administration | Cocoa | FL | 500 | 253 | 1,435 | 17 | 1,705 | 240 | 12/13/2011 | 1995 | ||||||||||||||||
| General Service Administration | Stuart | FL | — | 900 | 3,600 | — | 4,500 | 553 | 3/5/2012 | 2011 | ||||||||||||||||
| General Service Administration | Grangeville | ID | 2,100 | 317 | 6,023 | — | 6,340 | 925 | 3/5/2012 | 2007 | ||||||||||||||||
| General Service Administration | Kansas City | KS | 15,464 | 4,264 | 29,678 | — | 33,942 | 1,863 | 11/5/2013 | 2003 | ||||||||||||||||
| General Service Administration | Springfield | MO | — | 131 | 2,489 | — | 2,620 | 359 | 5/15/2012 | 2011 | ||||||||||||||||
| General Service Administration | Albany | NY | 10,137 | 2,470 | 11,836 | 19 | 14,325 | 839 | 11/5/2013 | 1995 | ||||||||||||||||
| General Service Administration | Freeport | NY | — | 843 | 3,372 | — | 4,215 | 549 | 1/10/2012 | 1995 | ||||||||||||||||
| General Service Administration | Plattsburgh | NY | — | 508 | 4,572 | — | 5,080 | 639 | 6/19/2012 | 2008 | ||||||||||||||||
| General Service Administration | Warren | PA | — | 341 | 3,114 | — | 3,455 | 437 | 6/19/2012 | 2008 | ||||||||||||||||
| General Service Administration | Ponce | PR | — | 1,780 | 9,313 | — | 11,093 | 862 | 11/5/2013 | 1995 | ||||||||||||||||
| General Service Administration | Austin | TX | — | 1,570 | 3,057 | — | 4,627 | 253 | 11/5/2013 | 2005 | ||||||||||||||||
| General Service Administration | Fort Worth | TX | — | 477 | 4,294 | — | 4,771 | 619 | 5/9/2012 | 2010 | ||||||||||||||||
| General Service Administration | Gloucester | VA | — | 287 | 1,628 | — | 1,915 | 228 | 6/20/2012 | 1995 | ||||||||||||||||
| Genlyte Thomas Group, LLC. | Franklin Park | IL | 4,561 | 958 | 3,176 | — | 4,134 | 77 | 2/21/2014 | 1969 | ||||||||||||||||
| Giant Eagle | Gahanna | OH | — | 3,549 | 16,736 | — | 20,285 | 691 | 2/7/2014 | 2002 | ||||||||||||||||
| Giant Eagle | Lancaster | OH | — | 2,210 | 15,649 | — | 17,859 | 628 | 2/7/2014 | 2008 | ||||||||||||||||
| Glen's Market | Manistee | MI | — | 294 | 6,694 | — | 6,988 | 307 | 2/7/2014 | 2009 | ||||||||||||||||
| Globe Energy Services | Hobbs | NM | — | 358 | 1,129 | — | 1,487 | 33 | 6/12/2014 | 2013 | ||||||||||||||||
| Globe Energy Services | Big Springs | TX | — | 426 | 599 | — | 1,025 | 18 | 6/25/2014 | 2012 | ||||||||||||||||
F-164
| Initial Costs | Costs Capitalized Subsequent to Acquisition | Gross Amount Carried at December 31, 2014 (1) (2) | ||||||||||||||||||||||||
| Property | City | State | Encumbrances at December 31, 2014 | Land | Buildings, Fixtures and Improvements | Accumulated Depreciation (3) (4) | Date Acquired | Date of Construction | ||||||||||||||||||
| Globe Energy Services | Levelland | TX | — | 42 | 1,887 | — | 1,929 | 54 | 6/25/2014 | 1997 | ||||||||||||||||
| Globe Energy Services | Midland | TX | — | 1,063 | 528 | — | 1,591 | 16 | 6/12/2014 | 2009 | ||||||||||||||||
| Globe Energy Services | Midland | TX | — | 1,013 | 968 | — | 1,981 | 25 | 6/12/2014 | 2010 | ||||||||||||||||
| Globe Energy Services | Monahans | TX | — | 50 | 538 | — | 588 | 16 | 6/12/2014 | 2011 | ||||||||||||||||
| Globe Energy Services | Odessa | TX | — | 104 | 1,259 | — | 1,363 | 30 | 6/25/2014 | 1963 | ||||||||||||||||
| Globe Energy Services | Odessa | TX | — | 500 | 3,891 | — | 4,391 | 227 | 6/12/2014 | 1963 | ||||||||||||||||
| Globe Energy Services | San Angelo | TX | — | 821 | 1,658 | — | 2,479 | 43 | 6/12/2014 | 2012 | ||||||||||||||||
| Globe Energy Services | Snyder | TX | — | 466 | 588 | — | 1,054 | 18 | 6/12/2014 | 2005 | ||||||||||||||||
| Globe Energy Services | Snyder | TX | — | 174 | 1,189 | — | 1,363 | 29 | 6/12/2014 | 1975 | ||||||||||||||||
| GM Financial | Arlington | TX | 24,943 | 7,901 | 35,553 | — | 43,454 | 2,217 | 11/5/2013 | 1998 | ||||||||||||||||
| GoFrac, LLC | Weatherford | TX | — | 102 | 3,386 | — | 3,488 | 185 | 6/12/2014 | 2011 | ||||||||||||||||
| Golden Corral | Gilbert | AZ | — | 871 | 2,910 | — | 3,781 | 257 | 6/27/2013 | 2006 | ||||||||||||||||
| Golden Corral | Goodyear | AZ | — | 686 | 1,939 | — | 2,625 | 171 | 6/27/2013 | 2006 | ||||||||||||||||
| Golden Corral | Surprise | AZ | — | 1,258 | 4,068 | — | 5,326 | 360 | 6/27/2013 | 2007 | ||||||||||||||||
| Golden Corral | Bakersfield | CA | — | 2,664 | 2,078 | — | 4,742 | 120 | 2/7/2014 | 2011 | ||||||||||||||||
| Golden Corral | Jacksonville | FL | — | 1,033 | 1,084 | — | 2,117 | 96 | 6/27/2013 | 1997 | ||||||||||||||||
| Golden Corral | Jacksonville | FL | — | 1,721 | 2,629 | — | 4,350 | 232 | 6/27/2013 | 1999 | ||||||||||||||||
| Golden Corral | Palatka | FL | — | 853 | 1,048 | — | 1,901 | 93 | 6/27/2013 | 1997 | ||||||||||||||||
| Golden Corral | Albany | GA | — | 460 | 1,863 | — | 2,323 | 156 | 6/27/2013 | 1995 | ||||||||||||||||
| Golden Corral | Brunswick | GA | — | 390 | 2,093 | — | 2,483 | 175 | 6/27/2013 | 1995 | ||||||||||||||||
| Golden Corral | Stockbridge | GA | — | 422 | 2,391 | — | 2,813 | 184 | 7/31/2013 | 1987 | ||||||||||||||||
| Golden Corral | Council Bluffs | IA | — | 1,140 | 1,460 | — | 2,600 | 122 | 6/27/2013 | 1995 | ||||||||||||||||
| Golden Corral | Clarksville | IN | — | 1,061 | 1,344 | — | 2,405 | 90 | 2/7/2014 | 2002 | ||||||||||||||||
| Golden Corral | Evansville | IN | — | 670 | 2,707 | — | 3,377 | 226 | 6/27/2013 | 1995 | ||||||||||||||||
| Golden Corral | Evansville | IN | — | 640 | 944 | — | 1,584 | 79 | 6/27/2013 | 1995 | ||||||||||||||||
| Golden Corral | Fort Wayne | IN | — | 820 | 1,935 | — | 2,755 | 162 | 6/27/2013 | 1995 | ||||||||||||||||
| Golden Corral | Kokomo | IN | — | 780 | 2,107 | — | 2,887 | 176 | 6/27/2013 | 1995 | ||||||||||||||||
| Golden Corral | Richmond | IN | — | 728 | 723 | — | 1,451 | 42 | 2/7/2014 | 2002 | ||||||||||||||||
F-165
| Initial Costs | Costs Capitalized Subsequent to Acquisition | Gross Amount Carried at December 31, 2014 (1) (2) | ||||||||||||||||||||||||
| Property | City | State | Encumbrances at December 31, 2014 | Land | Buildings, Fixtures and Improvements | Accumulated Depreciation (3) (4) | Date Acquired | Date of Construction | ||||||||||||||||||
| Golden Corral | Emporia | KS | — | 403 | 941 | — | 1,344 | 72 | 7/31/2013 | 1997 | ||||||||||||||||
| Golden Corral | Wichita | KS | — | 560 | 1,306 | — | 1,866 | 100 | 7/31/2013 | 2000 | ||||||||||||||||
| Golden Corral | Elizabethtown | KY | — | 760 | 2,753 | — | 3,513 | 230 | 6/27/2013 | 1995 | ||||||||||||||||
| Golden Corral | Henderson | KY | — | 600 | 1,586 | — | 2,186 | 133 | 6/27/2013 | 1995 | ||||||||||||||||
| Golden Corral | Louisville | KY | — | 1,020 | 1,173 | — | 2,193 | 62 | 2/7/2014 | 2001 | ||||||||||||||||
| Golden Corral | Nicholasville | KY | — | 435 | 2,040 | — | 2,475 | 59 | 6/11/2014 | 2001 | ||||||||||||||||
| Golden Corral | Blue Springs | MO | — | 810 | 1,346 | — | 2,156 | 113 | 6/27/2013 | 1995 | ||||||||||||||||
| Golden Corral | Independence | MO | — | 1,425 | 2,437 | — | 3,862 | 130 | 2/7/2014 | 2010 | ||||||||||||||||
| Golden Corral | Flowood | MS | — | 680 | 2,730 | — | 3,410 | 228 | 6/27/2013 | 1995 | ||||||||||||||||
| Golden Corral | Aberdeen | NC | — | 690 | 1,566 | — | 2,256 | 131 | 6/27/2013 | 1995 | ||||||||||||||||
| Golden Corral | Burlington | NC | — | 840 | 2,319 | — | 3,159 | 194 | 6/27/2013 | 1995 | ||||||||||||||||
| Golden Corral | Hickory | NC | — | 260 | 2,658 | — | 2,918 | 222 | 6/27/2013 | 1995 | ||||||||||||||||
| Golden Corral | Bellevue | NE | — | 520 | 1,433 | — | 1,953 | 120 | 6/27/2013 | 1995 | ||||||||||||||||
| Golden Corral | Lincoln | NE | — | 300 | 2,930 | — | 3,230 | 245 | 6/27/2013 | 1995 | ||||||||||||||||
| Golden Corral | Farmington | NM | — | 270 | 3,174 | — | 3,444 | 265 | 6/27/2013 | 1995 | ||||||||||||||||
| Golden Corral | Roswell | NM | — | 203 | 600 | — | 803 | 53 | 6/27/2013 | 2000 | ||||||||||||||||
| Golden Corral | Akron | OH | — | 640 | 2,133 | — | 2,773 | 99 | 2/7/2014 | 2003 | ||||||||||||||||
| Golden Corral | Beavercreek | OH | — | 713 | 1,858 | — | 2,571 | 83 | 2/7/2014 | 2000 | ||||||||||||||||
| Golden Corral | Canton | OH | — | 647 | 2,135 | — | 2,782 | 105 | 2/7/2014 | 2002 | ||||||||||||||||
| Golden Corral | Cincinnati | OH | — | 694 | 2,066 | — | 2,760 | 100 | 2/7/2014 | 1999 | ||||||||||||||||
| Golden Corral | Cleveland | OH | — | 1,109 | 2,315 | — | 3,424 | 104 | 2/7/2014 | 2004 | ||||||||||||||||
| Golden Corral | Columbus | OH | — | 770 | 2,476 | — | 3,246 | 207 | 6/27/2013 | 1995 | ||||||||||||||||
| Golden Corral | Dayton | OH | — | 579 | 1,429 | — | 2,008 | 70 | 2/7/2014 | 2000 | ||||||||||||||||
| Golden Corral | Dayton | OH | — | 774 | 2,766 | — | 3,540 | 132 | 2/7/2014 | 2002 | ||||||||||||||||
| Golden Corral | Elyria | OH | — | 1,167 | 1,599 | — | 2,766 | 73 | 2/7/2014 | 2004 | ||||||||||||||||
| Golden Corral | Fairfield | OH | — | 859 | 1,135 | — | 1,994 | 54 | 2/7/2014 | 1999 | ||||||||||||||||
| Golden Corral | Grove City | OH | — | 926 | 1,859 | — | 2,785 | 86 | 2/7/2014 | 2007 | ||||||||||||||||
| Golden Corral | Northfield | OH | — | 947 | 1,061 | — | 2,008 | 47 | 2/7/2014 | 2004 | ||||||||||||||||
F-166
| Initial Costs | Costs Capitalized Subsequent to Acquisition | Gross Amount Carried at December 31, 2014 (1) (2) | ||||||||||||||||||||||||
| Property | City | State | Encumbrances at December 31, 2014 | Land | Buildings, Fixtures and Improvements | Accumulated Depreciation (3) (4) | Date Acquired | Date of Construction | ||||||||||||||||||
| Golden Corral | Ontario | OH | — | 616 | 2,412 | — | 3,028 | 117 | 2/7/2014 | 2004 | ||||||||||||||||
| Golden Corral | Springfield | OH | — | 619 | 1,142 | — | 1,761 | 51 | 2/7/2014 | 2000 | ||||||||||||||||
| Golden Corral | Toledo | OH | — | 838 | 3,333 | — | 4,171 | 150 | 2/7/2014 | 2004 | ||||||||||||||||
| Golden Corral | Zanesville | OH | — | 487 | 2,030 | — | 2,517 | 179 | 6/27/2013 | 2002 | ||||||||||||||||
| Golden Corral | Midwest City | OK | — | 1,175 | 1,708 | — | 2,883 | 151 | 6/27/2013 | 1991 | ||||||||||||||||
| Golden Corral | Norman | OK | — | 345 | 2,107 | — | 2,452 | 186 | 6/27/2013 | 1994 | ||||||||||||||||
| Golden Corral | Tulsa | OK | — | 280 | 3,890 | — | 4,170 | 325 | 6/27/2013 | 1995 | ||||||||||||||||
| Golden Corral | Monroeville | PA | — | 1,647 | 849 | — | 2,496 | 29 | 2/7/2014 | 1982 | ||||||||||||||||
| Golden Corral | Rock Hill | SC | — | 320 | 2,130 | — | 2,450 | 178 | 6/27/2013 | 1995 | ||||||||||||||||
| Golden Corral | Cookeville | TN | — | 800 | 1,937 | — | 2,737 | 162 | 6/27/2013 | 1995 | ||||||||||||||||
| Golden Corral | Baytown | TX | — | 596 | 1,788 | — | 2,384 | 138 | 7/31/2013 | 1998 | ||||||||||||||||
| Golden Corral | Brownsville | TX | — | 604 | 2,302 | — | 2,906 | 203 | 6/27/2013 | 1995 | ||||||||||||||||
| Golden Corral | College Station | TX | — | 1,265 | 1,718 | — | 2,983 | 152 | 6/27/2013 | 1990 | ||||||||||||||||
| Golden Corral | Harlingen | TX | — | 832 | 3,037 | — | 3,869 | 268 | 6/27/2013 | 1990 | ||||||||||||||||
| Golden Corral | Houston | TX | — | 1,147 | 2,447 | — | 3,594 | 216 | 6/27/2013 | 1995 | ||||||||||||||||
| Golden Corral | San Angelo | TX | — | 644 | 1,702 | — | 2,346 | 85 | 2/7/2014 | 2012 | ||||||||||||||||
| Golden Corral | Spring | TX | — | 3,342 | 1,207 | — | 4,549 | 75 | 2/7/2014 | 2011 | ||||||||||||||||
| Golden Corral | Texarkana | TX | — | 758 | 3,031 | — | 3,789 | 233 | 7/31/2013 | 2001 | ||||||||||||||||
| Golden Corral | Bristol | VA | — | 750 | 2,276 | — | 3,026 | 190 | 6/27/2013 | 1995 | ||||||||||||||||
| Golden Corral | Rock Springs | WY | — | 354 | 90 | — | 444 | 8 | 6/27/2013 | 1995 | ||||||||||||||||
| Gold's Gym | Broken Arrow | OK | — | 1,661 | 6,565 | — | 8,226 | 328 | 2/7/2014 | 2009 | ||||||||||||||||
| Goodfire BBQ | San Antonio | TX | — | 350 | 341 | — | 691 | 29 | 6/27/2013 | 1995 | ||||||||||||||||
F-167
| Initial Costs | Costs Capitalized Subsequent to Acquisition | Gross Amount Carried at December 31, 2014 (1) (2) | ||||||||||||||||||||||||
| Property | City | State | Encumbrances at December 31, 2014 | Land | Buildings, Fixtures and Improvements | Accumulated Depreciation (3) (4) | Date Acquired | Date of Construction | ||||||||||||||||||
| Goodyear | Cumming | GA | — | 534 | 2,516 | — | 3,050 | 111 | 2/7/2014 | 2010 | ||||||||||||||||
| Goodyear | Cumming | GA | — | 1,085 | 1,915 | — | 3,000 | 89 | 2/7/2014 | 2010 | ||||||||||||||||
| Goodyear | McDonough | GA | 11,995 | 1,797 | 21,264 | — | 23,061 | 1,259 | 1/8/2014 | 1995 | ||||||||||||||||
| Goodyear | Stockbridge | GA | 14,603 | 1,222 | 32,119 | — | 33,341 | 1,965 | 1/8/2014 | 1995 | ||||||||||||||||
| Goodyear | DeKalb | IL | 21,905 | 4,476 | 44,516 | — | 48,992 | 2,722 | 1/8/2014 | 1999 | ||||||||||||||||
| Goodyear | Lockbourne | OH | 14,290 | 3,107 | 28,868 | — | 31,975 | 1,691 | 1/8/2014 | 1998 | ||||||||||||||||
| Goodyear | York | PA | 24,825 | 1,980 | 53,396 | — | 55,376 | 3,091 | 1/8/2014 | 2001 | ||||||||||||||||
| Goodyear | Columbia | SC | — | 656 | 2,077 | — | 2,733 | 93 | 2/7/2014 | 2010 | ||||||||||||||||
| Goodyear | Corpus Christi | TX | — | 753 | 1,737 | — | 2,490 | 76 | 2/7/2014 | 2008 | ||||||||||||||||
| Goodyear | Terrell | TX | 16,689 | 2,516 | 34,804 | — | 37,320 | 2,125 | 1/8/2014 | 1998 | ||||||||||||||||
| Grandy's | Hobbs | NM | — | 815 | — | — | 815 | — | 6/27/2013 | 1995 | ||||||||||||||||
| Grandy's | Ardmore | OK | — | 454 | — | — | 454 | — | 6/27/2013 | 1995 | ||||||||||||||||
| Grandy's | Moore | OK | — | 320 | 428 | — | 748 | 36 | 6/27/2013 | 1995 | ||||||||||||||||
| Grandy's | Oklahoma City | OK | — | 260 | 380 | — | 640 | 32 | 6/27/2013 | 1995 | ||||||||||||||||
| Grandy's | Oklahoma City | OK | — | 320 | 289 | — | 609 | 24 | 6/27/2013 | 1995 | ||||||||||||||||
| Grandy's | Abilene | TX | — | 803 | — | — | 803 | — | 6/27/2013 | 1995 | ||||||||||||||||
| Grandy's | Arlington | TX | — | 734 | — | — | 734 | — | 6/27/2013 | 1995 | ||||||||||||||||
| Grandy's | Carrollton | TX | — | 773 | — | — | 773 | — | 6/27/2013 | 1995 | ||||||||||||||||
| Grandy's | Carrollton | TX | — | 847 | — | — | 847 | — | 6/27/2013 | 1986 | ||||||||||||||||
| Grandy's | Dallas | TX | — | 725 | — | — | 725 | — | 7/31/2013 | 1981 | ||||||||||||||||
| Grandy's | Dallas | TX | — | 357 | — | — | 357 | — | 7/31/2013 | 1984 | ||||||||||||||||
| Grandy's | Fort Worth | TX | — | 777 | — | — | 777 | — | 6/27/2013 | 1995 | ||||||||||||||||
| Grandy's | Fort Worth | TX | — | 811 | — | — | 811 | — | 6/27/2013 | 1985 | ||||||||||||||||
| Grandy's | Garland | TX | — | 623 | — | — | 623 | — | 6/27/2013 | 1980 | ||||||||||||||||
| Grandy's | Garland | TX | — | 859 | — | — | 859 | — | 6/27/2013 | 1985 | ||||||||||||||||
| Grandy's | Greenville | TX | — | 847 | — | — | 847 | — | 7/31/2013 | 1979 | ||||||||||||||||
| Grandy's | Irving | TX | — | 871 | — | — | 871 | — | 6/27/2013 | 1983 | ||||||||||||||||
| Grandy's | Lancaster | TX | — | 780 | — | — | 780 | — | 6/27/2013 | 1984 | ||||||||||||||||
F-168
| Initial Costs | Costs Capitalized Subsequent to Acquisition | Gross Amount Carried at December 31, 2014 (1) (2) | ||||||||||||||||||||||||
| Property | City | State | Encumbrances at December 31, 2014 | Land | Buildings, Fixtures and Improvements | Accumulated Depreciation (3) (4) | Date Acquired | Date of Construction | ||||||||||||||||||
| Grandy's | Lubbock | TX | — | 694 | — | — | 694 | — | 6/27/2013 | 1979 | ||||||||||||||||
| Grandy's | Mesquite | TX | — | 871 | — | — | 871 | — | 6/27/2013 | 1983 | ||||||||||||||||
| Grandy's | Plano | TX | — | 871 | — | — | 871 | — | 6/27/2013 | 1980 | ||||||||||||||||
| Great Clips | Lombard | IL | — | 84 | 100 | — | 184 | 9 | 6/27/2013 | 1973 | ||||||||||||||||
| Greene's Energy Group | Broussard | LA | — | 455 | 6,022 | — | 6,477 | 127 | 6/12/2014 | 1980 | ||||||||||||||||
| Habanero's Mexican Grill | Hueytown | AL | — | 60 | 639 | — | 699 | 53 | 6/27/2013 | 1995 | ||||||||||||||||
| Hanesbrands | Rural Hall | NC | 18,100 | 1,798 | 41,214 | — | 43,012 | 1,425 | 2/7/2014 | 1992 | ||||||||||||||||
| Hanesbrands | Rural Hall | NC | 17,990 | 1,082 | 22,565 | — | 23,647 | 2,911 | 12/21/2012 | 1989 | ||||||||||||||||
| Hardee's | Morrilton | AR | — | 175 | 937 | — | 1,112 | 41 | 3/28/2014 | 1986 | ||||||||||||||||
| Hardee's | Jacksonville | FL | — | 875 | 583 | — | 1,458 | 45 | 7/31/2013 | 1993 | ||||||||||||||||
| Hardee's | Pace | FL | — | 419 | 435 | — | 854 | 37 | 6/27/2013 | 1991 | ||||||||||||||||
| Hardee's | Williston | FL | — | 395 | 553 | — | 948 | 47 | 6/27/2013 | 1992 | ||||||||||||||||
| Hardee's | Alma | GA | — | 80 | 502 | — | 582 | 41 | 6/27/2013 | 1995 | ||||||||||||||||
| Hardee's | Bremen | GA | — | 129 | 518 | — | 647 | 40 | 7/31/2013 | 1980 | ||||||||||||||||
| Hardee's | Brunswick | GA | — | 200 | 494 | — | 694 | 40 | 6/27/2013 | 1995 | ||||||||||||||||
| Hardee's | Canton | GA | — | 488 | 539 | — | 1,027 | 46 | 6/27/2013 | 1983 | ||||||||||||||||
| Hardee's | Claxton | GA | — | 170 | 469 | — | 639 | 38 | 6/27/2013 | 1995 | ||||||||||||||||
| Hardee's | Glennville | GA | — | 170 | 450 | — | 620 | 36 | 6/27/2013 | 1995 | ||||||||||||||||
| Hardee's | Hazlehurst | GA | — | 300 | 263 | — | 563 | 21 | 6/27/2013 | 1995 | ||||||||||||||||
| Hardee's | Metter | GA | — | 230 | 369 | — | 599 | 30 | 6/27/2013 | 1995 | ||||||||||||||||
| Hardee's | Richmond Hill | GA | — | 390 | 149 | — | 539 | 12 | 6/27/2013 | 1995 | ||||||||||||||||
| Hardee's | Savannah | GA | — | 130 | 456 | — | 586 | 37 | 6/27/2013 | 1995 | ||||||||||||||||
| Hardee's | Swainsboro | GA | — | 470 | 107 | — | 577 | 9 | 6/27/2013 | 1995 | ||||||||||||||||
| Hardee's | Vidalia | GA | — | 220 | 377 | — | 597 | 31 | 6/27/2013 | 1995 | ||||||||||||||||
| Hardee's | Mount Vernon | IA | — | 320 | 480 | — | 800 | 41 | 6/27/2013 | 1987 | ||||||||||||||||
| Hardee's | Belleville | IL | — | 269 | 467 | — | 736 | 40 | 6/27/2013 | 1987 | ||||||||||||||||
| Hardee's | Indian Trail | NC | — | 777 | 553 | — | 1,330 | 42 | 6/27/2013 | 1992 | ||||||||||||||||
| Hardee's | Old Fort | NC | — | 300 | 904 | — | 1,204 | 73 | 6/27/2013 | 1995 | ||||||||||||||||
F-169
| Initial Costs | Costs Capitalized Subsequent to Acquisition | Gross Amount Carried at December 31, 2014 (1) (2) | ||||||||||||||||||||||||
| Property | City | State | Encumbrances at December 31, 2014 | Land | Buildings, Fixtures and Improvements | Accumulated Depreciation (3) (4) | Date Acquired | Date of Construction | ||||||||||||||||||
| Hardee's | Sparta | NC | — | 372 | 346 | — | 718 | 30 | 6/27/2013 | 1983 | ||||||||||||||||
| Hardee's | Akron | OH | — | 207 | 483 | — | 690 | 37 | 7/31/2013 | 1990 | ||||||||||||||||
| Hardee's | Jefferson | OH | — | 242 | 363 | — | 605 | 28 | 7/31/2013 | 1989 | ||||||||||||||||
| Hardee's | Minerva | OH | — | 214 | 321 | — | 535 | 25 | 7/31/2013 | 1990 | ||||||||||||||||
| Hardee's | Seville | OH | — | 151 | 454 | — | 605 | 35 | 7/31/2013 | 1989 | ||||||||||||||||
| Hardee's | Aiken | SC | — | 220 | 450 | — | 670 | 36 | 6/27/2013 | 1995 | ||||||||||||||||
| Hardee's | Chapin | SC | — | 380 | 741 | — | 1,121 | 60 | 6/27/2013 | 1995 | ||||||||||||||||
| Hardee's | Chester | SC | — | 586 | 563 | — | 1,149 | 18 | 7/31/2013 | 1994 | ||||||||||||||||
| Hardee's | Bloomingdale | TN | — | 270 | 844 | — | 1,114 | 68 | 6/27/2013 | 1995 | ||||||||||||||||
| Hardee's | Clinton | TN | — | 390 | 893 | — | 1,283 | 72 | 6/27/2013 | 1995 | ||||||||||||||||
| Hardee's | Crossville | TN | — | 300 | 689 | — | 989 | 56 | 6/27/2013 | 1995 | ||||||||||||||||
| Hardee's | Erwin | TN | — | 346 | 406 | — | 752 | 35 | 6/27/2013 | 1982 | ||||||||||||||||
| Hardee's | Morristown | TN | — | 353 | 431 | — | 784 | 33 | 7/31/2013 | 1991 | ||||||||||||||||
| Hardee's | Springfield | TN | — | 343 | 515 | — | 858 | 40 | 7/31/2013 | 1990 | ||||||||||||||||
| Hardee's | Beaver | WV | — | 217 | 318 | — | 535 | 27 | 6/27/2013 | 2008 | ||||||||||||||||
| Hardee's / Red Burrito | Attalla | AL | — | 220 | 896 | — | 1,116 | 72 | 6/27/2013 | 1995 | ||||||||||||||||
| Harley Davidson | Round Rock | TX | — | 1,688 | 9,563 | — | 11,251 | 830 | 7/31/2013 | 2008 | ||||||||||||||||
| Harps Grocery | Cabot | AR | — | 270 | 4,664 | — | 4,934 | 223 | 2/7/2014 | 2014 | ||||||||||||||||
| Harps Grocery | Haskell | AR | — | 499 | 3,281 | — | 3,780 | 155 | 2/7/2014 | 2012 | ||||||||||||||||
| Harps Grocery | Hot Springs | AR | — | 592 | 4,353 | — | 4,945 | 204 | 2/7/2014 | 2013 | ||||||||||||||||
| Harps Grocery | Hot Springs | AR | — | 839 | 4,486 | — | 5,325 | 200 | 2/7/2014 | 2013 | ||||||||||||||||
| Harps Grocery | Searcy | AR | — | 705 | 4,159 | — | 4,864 | 189 | 2/7/2014 | 2008 | ||||||||||||||||
| Harps Grocery | West Fork | AR | — | 635 | 4,708 | — | 5,343 | 215 | 2/7/2014 | 2013 | ||||||||||||||||
| Harps Grocery | Poplar Bluff | MO | — | 572 | 2,991 | — | 3,563 | 7 | 2/21/2014 | 2014 | ||||||||||||||||
| Harps Grocery | Inola | OK | — | 130 | 3,387 | — | 3,517 | 80 | 3/5/2014 | 2014 | ||||||||||||||||
| Harris Teeter | Durham | NC | 1,910 | 3,239 | — | — | 3,239 | — | 2/7/2014 | 2009 | ||||||||||||||||
| Hartford Ins. | Santee | CA | 11,910 | 2,400 | 7,312 | — | 9,712 | 436 | 2/21/2014 | 1995 | ||||||||||||||||
| Harvey's Grill & Bar | Saginaw | MI | — | 230 | 647 | — | 877 | 57 | 6/27/2013 | 1997 | ||||||||||||||||
F-170
| Initial Costs | Costs Capitalized Subsequent to Acquisition | Gross Amount Carried at December 31, 2014 (1) (2) | ||||||||||||||||||||||||
| Property | City | State | Encumbrances at December 31, 2014 | Land | Buildings, Fixtures and Improvements | Accumulated Depreciation (3) (4) | Date Acquired | Date of Construction | ||||||||||||||||||
| Hash House A-Go-Go Restaurant | Las Vegas | NV | — | 580 | 1,347 | — | 1,927 | 113 | 6/27/2013 | 1995 | ||||||||||||||||
| Hayden's Grill & Bar | Canton | MI | — | 160 | 693 | — | 853 | 61 | 6/27/2013 | 1995 | ||||||||||||||||
| Healthnow | Buffalo | NY | 42,500 | 2,569 | 89,399 | — | 91,968 | 3,132 | 2/7/2014 | 2007 | ||||||||||||||||
| HH Gregg | Joliet | IL | — | 1,834 | 1,585 | — | 3,419 | 94 | 2/7/2014 | 2011 | ||||||||||||||||
| HH Gregg | Merrillville | IN | — | 511 | 4,768 | — | 5,279 | 235 | 2/7/2014 | 2011 | ||||||||||||||||
| HH Gregg | Chesterfield | MO | — | 1,537 | 4,123 | — | 5,660 | 204 | 2/7/2014 | 2012 | ||||||||||||||||
| HH Gregg | North Fayette | PA | — | 1,990 | 2,700 | — | 4,690 | 118 | 2/7/2014 | 1999 | ||||||||||||||||
| HH Gregg | North Charleston | SC | — | 2,193 | 4,636 | — | 6,829 | 231 | 2/7/2014 | 2008 | ||||||||||||||||
| Hobby Lobby | Avon | IN | — | 1,439 | 5,855 | — | 7,294 | 255 | 2/7/2014 | 2007 | ||||||||||||||||
| Hobby Lobby | Kannapolis | NC | — | 1,929 | 4,227 | — | 6,156 | 192 | 2/7/2014 | 2004 | ||||||||||||||||
| Hobby Lobby | Columbia | TN | — | 951 | 2,467 | — | 3,418 | 124 | 2/26/2014 | 1986 | ||||||||||||||||
| Hobby Lobby | Logan | UT | — | 2,683 | 3,079 | — | 5,762 | 152 | 2/7/2014 | 2008 | ||||||||||||||||
| Holy Cross Hospital | Silver Spring | MD | — | 637 | 7,375 | 4,424 | 12,436 | — | 11/5/2013 | 1972 | ||||||||||||||||
| Home Depot | Tolleson | AZ | — | 6,607 | 23,772 | — | 30,379 | 1,004 | 2/7/2014 | 2010 | ||||||||||||||||
| Home Depot | Tucson | AZ | — | 6,251 | — | — | 6,251 | — | 2/7/2014 | 2005 | ||||||||||||||||
| Home Depot | San Diego | CA | 6,650 | 12,518 | — | — | 12,518 | — | 2/7/2014 | 1998 | ||||||||||||||||
| Home Depot | Evans | GA | — | 4,583 | — | — | 4,583 | — | 2/7/2014 | 2009 | ||||||||||||||||
| Home Depot | Kennesaw | GA | — | 1,809 | 12,331 | — | 14,140 | 497 | 2/7/2014 | 2012 | ||||||||||||||||
| Home Depot | Slidell | LA | 1,996 | 5,131 | — | — | 5,131 | — | 2/7/2014 | 1998 | ||||||||||||||||
| Home Depot | Las Vegas | NV | — | 7,907 | — | — | 7,907 | — | 2/7/2014 | 1998 | ||||||||||||||||
| Home Depot | Columbia | SC | — | 2,911 | 15,463 | — | 18,374 | 4,000 | 11/9/2009 | 2009 | ||||||||||||||||
| Home Depot | Odessa | TX | — | 1,599 | — | — | 1,599 | — | 2/7/2014 | 1998 | ||||||||||||||||
| Home Depot | Winchester | VA | — | 3,955 | 18,405 | — | 22,360 | 949 | 2/7/2014 | 2008 | ||||||||||||||||
| Home Town Buffet | Oxnard | CA | — | 195 | 1,044 | — | 1,239 | 61 | 1/8/2014 | 1998 | ||||||||||||||||
| Home Town Buffet | Rialto | CA | — | 265 | 1,261 | — | 1,526 | 77 | 1/8/2014 | 1998 | ||||||||||||||||
| Home Town Buffet | San Marcos | CA | — | 195 | 1,044 | — | 1,239 | 61 | 1/8/2014 | 1997 | ||||||||||||||||
| Home Town Buffet | Santa Maria | CA | — | 191 | 1,006 | — | 1,197 | 29 | 1/8/2014 | 2002 | ||||||||||||||||
| Home Town Buffet | Santee | CA | — | 265 | 1,261 | — | 1,526 | 79 | 1/8/2014 | 1995 | ||||||||||||||||
F-171
| Initial Costs | Costs Capitalized Subsequent to Acquisition | Gross Amount Carried at December 31, 2014 (1) (2) | ||||||||||||||||||||||||
| Property | City | State | Encumbrances at December 31, 2014 | Land | Buildings, Fixtures and Improvements | Accumulated Depreciation (3) (4) | Date Acquired | Date of Construction | ||||||||||||||||||
| Home Town Buffet | Newark | DE | — | 177 | 1,129 | — | 1,306 | 39 | 1/8/2014 | 1983 | ||||||||||||||||
| Home Town Buffet | Peoria | IL | — | 195 | 1,013 | — | 1,208 | 66 | 1/8/2014 | 2000 | ||||||||||||||||
| Home Town Buffet | Deptford | NJ | — | 195 | 1,044 | — | 1,239 | 61 | 1/8/2014 | 2005 | ||||||||||||||||
| Home Town Buffet | Philadelphia | PA | — | 195 | 1,044 | — | 1,239 | 28 | 1/8/2014 | 1997 | ||||||||||||||||
| Home Town Buffet | El Paso | TX | — | 246 | 1,248 | — | 1,494 | 75 | 1/8/2014 | 1995 | ||||||||||||||||
| Home Town Buffet | Union Gap | WA | — | 253 | 1,320 | — | 1,573 | 78 | 1/8/2014 | 2002 | ||||||||||||||||
| Hooley House Sports Pub | Brooklyn | OH | — | 291 | 321 | — | 612 | 28 | 6/27/2013 | 2000 | ||||||||||||||||
| Houlihan's | Plymouth Meeting | PA | — | 870 | 2,015 | — | 2,885 | 168 | 6/27/2013 | 1995 | ||||||||||||||||
| Huntington National Bank | Conneaut | OH | — | 205 | 477 | — | 682 | 31 | 10/1/2013 | 1971 | ||||||||||||||||
| Huntington National Bank | Jefferson | OH | — | 255 | 765 | — | 1,020 | 50 | 10/1/2013 | 1963 | ||||||||||||||||
| Hy-Vee | Vermillion | SD | 2,922 | 409 | 3,684 | — | 4,093 | 442 | 4/8/2013 | 1986 | ||||||||||||||||
| IEA, Inc. | Kenosha | WI | 7,282 | 2,280 | 2,358 | — | 4,638 | 235 | 2/21/2014 | 1997 | ||||||||||||||||
| IFM Efectors | Malvern | PA | — | — | — | 5,937 | 5,937 | — | 8/20/2014 | 2014 | ||||||||||||||||
| Igloo | Katy | TX | — | 5,617 | 38,470 | — | 44,087 | 1,555 | 2/7/2014 | 2004 | ||||||||||||||||
| IHOP | Auburn | AL | — | 1,111 | 933 | — | 2,044 | 83 | 6/27/2013 | 1998 | ||||||||||||||||
| IHOP | Homewood | AL | — | 610 | 1,762 | — | 2,372 | 147 | 6/27/2013 | 1995 | ||||||||||||||||
| IHOP | Montgomery | AL | — | 941 | — | — | 941 | — | 6/27/2013 | 1998 | ||||||||||||||||
| IHOP | Castle Rock | CO | — | 320 | 2,334 | — | 2,654 | 195 | 6/27/2013 | 1995 | ||||||||||||||||
| IHOP | Greeley | CO | — | 120 | 1,538 | — | 1,658 | 129 | 6/27/2013 | 1995 | ||||||||||||||||
| IHOP | Pueblo | CO | — | 330 | 1,589 | — | 1,919 | 133 | 6/27/2013 | 1995 | ||||||||||||||||
| IHOP | Stockbridge | GA | — | 580 | 2,091 | — | 2,671 | 175 | 6/27/2013 | 1995 | ||||||||||||||||
| IHOP | Bossier City | LA | — | 541 | 1,342 | — | 1,883 | 119 | 6/27/2013 | 1998 | ||||||||||||||||
| IHOP | Natchitoches | LA | — | 750 | 89 | — | 839 | 7 | 6/27/2013 | 1995 | ||||||||||||||||
| IHOP | Roseville | MI | — | 340 | 1,071 | — | 1,411 | 90 | 6/27/2013 | 1995 | ||||||||||||||||
| IHOP | Warren | MI | — | 605 | 830 | — | 1,435 | 73 | 6/27/2013 | 1996 | ||||||||||||||||
| IHOP | Kansas City | MO | — | 630 | 1,002 | — | 1,632 | 84 | 6/27/2013 | 1995 | ||||||||||||||||
| IHOP | Southaven | MS | — | 350 | 2,108 | — | 2,458 | 176 | 6/27/2013 | 1995 | ||||||||||||||||
| IHOP | Poughkeepsie | NY | — | 430 | 1,129 | — | 1,559 | 94 | 6/27/2013 | 1995 | ||||||||||||||||
F-172
| Initial Costs | Costs Capitalized Subsequent to Acquisition | Gross Amount Carried at December 31, 2014 (1) (2) | ||||||||||||||||||||||||
| Property | City | State | Encumbrances at December 31, 2014 | Land | Buildings, Fixtures and Improvements | Accumulated Depreciation (3) (4) | Date Acquired | Date of Construction | ||||||||||||||||||
| IHOP | Greenville | SC | — | 610 | 1,551 | — | 2,161 | 130 | 6/27/2013 | 1995 | ||||||||||||||||
| IHOP | Clarksville | TN | — | 530 | 1,346 | — | 1,876 | 113 | 6/27/2013 | 1995 | ||||||||||||||||
| IHOP | Memphis | TN | — | 750 | 2,009 | — | 2,759 | 168 | 6/27/2013 | 1995 | ||||||||||||||||
| IHOP | Murfreesboro | TN | — | 600 | 1,687 | — | 2,287 | 141 | 6/27/2013 | 1995 | ||||||||||||||||
| IHOP | Baytown | TX | — | 698 | 1,297 | — | 1,995 | 100 | 7/31/2013 | 1998 | ||||||||||||||||
| IHOP | Corpus Christi | TX | — | 1,176 | — | — | 1,176 | — | 7/31/2013 | 1995 | ||||||||||||||||
| IHOP | Fort Worth | TX | — | 560 | 1,879 | — | 2,439 | 157 | 6/27/2013 | 1995 | ||||||||||||||||
| IHOP | Houston | TX | — | 760 | 2,462 | — | 3,222 | 206 | 6/27/2013 | 1995 | ||||||||||||||||
| IHOP | Killeen | TX | — | 380 | 1,028 | — | 1,408 | 86 | 6/27/2013 | 1995 | ||||||||||||||||
| IHOP | Lake Jackson | TX | — | 370 | 2,018 | — | 2,388 | 169 | 6/27/2013 | 1995 | ||||||||||||||||
| IHOP | Leon Valley | TX | — | 650 | 2,055 | — | 2,705 | 172 | 6/27/2013 | 1995 | ||||||||||||||||
| IHOP | Auburn | WA | — | 780 | 1,878 | — | 2,658 | 157 | 6/27/2013 | 1995 | ||||||||||||||||
| Indi's Fast Food | Louisville | KY | — | 292 | 157 | — | 449 | 12 | 7/31/2013 | 1972 | ||||||||||||||||
| Ingersoll Rand | Annandale | NJ | — | 1,367 | 14,223 | 33 | 15,623 | 983 | 4/30/2014 | 1999 | ||||||||||||||||
| Ingram Micro | Amherst | NY | — | 4,107 | 20,347 | — | 24,454 | 622 | 6/25/2014 | 1986 | ||||||||||||||||
| Invensys Systems | Foxboro | MA | 43,700 | — | — | 32,650 | 32,650 | 240 | 6/27/2014 | 1965 | ||||||||||||||||
| Invesco Holding Company | Denver | CO | — | 12,648 | 66,398 | — | 79,046 | 4,100 | 11/5/2013 | 2001 | ||||||||||||||||
| Iron Chef Super Buffet | Kissimmee | FL | — | 297 | 127 | — | 424 | 10 | 7/31/2013 | 2000 | ||||||||||||||||
| Iron Mountain | Columbus | OH | — | 405 | 3,642 | — | 4,047 | 509 | 9/28/2012 | 1954 | ||||||||||||||||
| Iron Mountain | Mohnton | PA | — | 197 | 6,152 | — | 6,349 | 137 | 7/2/2014 | 1979 | ||||||||||||||||
| IRS Gateway Center | Covington | KY | — | 3,120 | 80,689 | — | 83,809 | 1,842 | 6/5/2014 | 1994 | ||||||||||||||||
F-173
| Initial Costs | Costs Capitalized Subsequent to Acquisition | Gross Amount Carried at December 31, 2014 (1) (2) | ||||||||||||||||||||||||
| Property | City | State | Encumbrances at December 31, 2014 | Land | Buildings, Fixtures and Improvements | Accumulated Depreciation (3) (4) | Date Acquired | Date of Construction | ||||||||||||||||||
| Irving Oil | Belfast | ME | — | 339 | 698 | — | 1,037 | 38 | 2/7/2014 | 1997 | ||||||||||||||||
| Irving Oil | Bethel | ME | — | 182 | 331 | — | 513 | 19 | 2/7/2014 | 1990 | ||||||||||||||||
| Irving Oil | Boothbay Harbor | ME | — | 413 | 550 | — | 963 | 32 | 2/7/2014 | 1993 | ||||||||||||||||
| Irving Oil | Caribou | ME | — | 187 | 404 | — | 591 | 22 | 2/7/2014 | 1990 | ||||||||||||||||
| Irving Oil | Fort Kent | ME | — | 358 | 352 | — | 710 | 23 | 2/7/2014 | 1973 | ||||||||||||||||
| Irving Oil | Kennebunk | ME | — | 469 | 541 | — | 1,010 | 33 | 2/7/2014 | 1980 | ||||||||||||||||
| Irving Oil | Lincoln | ME | — | 360 | 360 | — | 720 | 20 | 2/7/2014 | 1994 | ||||||||||||||||
| Irving Oil | Orono | ME | — | 228 | 272 | — | 500 | 15 | 2/7/2014 | 1984 | ||||||||||||||||
| Irving Oil | Saco | ME | — | 619 | 222 | — | 841 | 18 | 2/7/2014 | 1995 | ||||||||||||||||
| Irving Oil | Skowhegan | ME | — | 541 | 492 | — | 1,033 | 31 | 2/7/2014 | 1988 | ||||||||||||||||
| Irving Oil | Conway | NH | — | 173 | 525 | — | 698 | 27 | 2/7/2014 | 2004 | ||||||||||||||||
| Irving Oil | Dover | NH | — | 380 | 717 | — | 1,097 | 38 | 2/7/2014 | 1988 | ||||||||||||||||
| Irving Oil | Rochester | NH | — | 290 | 747 | — | 1,037 | 39 | 2/7/2014 | 1970 | ||||||||||||||||
| Irving Oil | Dummerston | VT | — | 185 | 353 | — | 538 | 22 | 2/7/2014 | 1993 | ||||||||||||||||
| Irving Oil | Rutland | VT | — | 249 | 220 | — | 469 | 12 | 2/7/2014 | 1984 | ||||||||||||||||
| Irving Oil | Westminster | VT | — | 108 | 437 | — | 545 | 24 | 2/7/2014 | 1990 | ||||||||||||||||
| Jack in the Box | Avondale | AZ | — | 110 | 2,237 | — | 2,347 | 181 | 6/27/2013 | 1995 | ||||||||||||||||
| Jack in the Box | Chandler | AZ | — | 450 | 1,447 | — | 1,897 | 117 | 6/27/2013 | 1995 | ||||||||||||||||
| Jack in the Box | Folsom | CA | — | 280 | 2,423 | — | 2,703 | 196 | 6/27/2013 | 1995 | ||||||||||||||||
| Jack in the Box | Fresno | CA | — | 190 | 1,810 | — | 2,000 | 146 | 6/27/2013 | 1995 | ||||||||||||||||
| Jack in the Box | Sacramento | CA | — | 476 | 1,110 | — | 1,586 | 85 | 7/31/2013 | 1991 | ||||||||||||||||
| Jack in the Box | West Sacramento | CA | — | 590 | 1,710 | — | 2,300 | 138 | 6/27/2013 | 1995 | ||||||||||||||||
| Jack in the Box | Burley | ID | — | 240 | 1,430 | — | 1,670 | 116 | 6/27/2013 | 1995 | ||||||||||||||||
| Jack in the Box | Moscow | ID | — | 350 | 1,110 | — | 1,460 | 90 | 6/27/2013 | 1995 | ||||||||||||||||
| Jack in the Box | Belleville | IL | — | 200 | 966 | — | 1,166 | 78 | 6/27/2013 | 1995 | ||||||||||||||||
| Jack in the Box | Walker | LA | — | 543 | 1,196 | — | 1,739 | 102 | 6/27/2013 | 2001 | ||||||||||||||||
| Jack in the Box | Florissant | MO | — | 502 | 1,515 | — | 2,017 | 122 | 6/27/2013 | 1995 | ||||||||||||||||
| Jack in the Box | St. Louis | MO | — | 420 | 1,494 | — | 1,914 | 121 | 6/27/2013 | 1995 | ||||||||||||||||
| Jack in the Box | Las Vegas | NV | — | 680 | 1,533 | — | 2,213 | 124 | 6/27/2013 | 1995 | ||||||||||||||||
F-174
| Initial Costs | Costs Capitalized Subsequent to Acquisition | Gross Amount Carried at December 31, 2014 (1) (2) | ||||||||||||||||||||||||
| Property | City | State | Encumbrances at December 31, 2014 | Land | Buildings, Fixtures and Improvements | Accumulated Depreciation (3) (4) | Date Acquired | Date of Construction | ||||||||||||||||||
| Jack in the Box | Salem | OR | — | 580 | 1,301 | — | 1,881 | 105 | 6/27/2013 | 1995 | ||||||||||||||||
| Jack in the Box | Tigard | OR | — | 620 | 1,361 | — | 1,981 | 110 | 6/27/2013 | 1995 | ||||||||||||||||
| Jack in the Box | Arlington | TX | — | 420 | 1,325 | — | 1,745 | 107 | 6/27/2013 | 1995 | ||||||||||||||||
| Jack in the Box | Arlington | TX | — | 420 | 1,365 | — | 1,785 | 110 | 6/27/2013 | 1995 | ||||||||||||||||
| Jack in the Box | Cleburne | TX | — | 291 | 1,647 | — | 1,938 | 127 | 7/31/2013 | 2000 | ||||||||||||||||
| Jack in the Box | Corinth | TX | — | 400 | 1,416 | — | 1,816 | 114 | 6/27/2013 | 1995 | ||||||||||||||||
| Jack in the Box | Farmers Branch | TX | — | 460 | 1,640 | — | 2,100 | 133 | 6/27/2013 | 1995 | ||||||||||||||||
| Jack in the Box | Fort Worth | TX | — | 490 | 1,702 | — | 2,192 | 138 | 6/27/2013 | 1995 | ||||||||||||||||
| Jack in the Box | Georgetown | TX | — | 600 | 1,508 | — | 2,108 | 122 | 6/27/2013 | 1995 | ||||||||||||||||
| Jack in the Box | Granbury | TX | — | 380 | 1,449 | — | 1,829 | 117 | 6/27/2013 | 1995 | ||||||||||||||||
| Jack in the Box | Grand Prairie | TX | — | 600 | 1,856 | — | 2,456 | 150 | 6/27/2013 | 1995 | ||||||||||||||||
| Jack in the Box | Grapevine | TX | — | 470 | 1,344 | — | 1,814 | 109 | 6/27/2013 | 1995 | ||||||||||||||||
| Jack in the Box | Gun Barrel City | TX | — | 300 | 961 | — | 1,261 | 78 | 6/27/2013 | 1995 | ||||||||||||||||
| Jack in the Box | Houston | TX | — | 460 | 1,437 | — | 1,897 | 116 | 6/27/2013 | 1995 | ||||||||||||||||
| Jack in the Box | Houston | TX | — | 390 | 1,172 | — | 1,562 | 95 | 6/27/2013 | 1995 | ||||||||||||||||
| Jack in the Box | Houston | TX | — | 330 | 1,845 | — | 2,175 | 149 | 6/27/2013 | 1995 | ||||||||||||||||
| Jack in the Box | Houston | TX | — | 410 | 1,621 | — | 2,031 | 131 | 6/27/2013 | 1995 | ||||||||||||||||
| Jack in the Box | Houston | TX | — | 450 | 1,396 | — | 1,846 | 113 | 6/27/2013 | 1995 | ||||||||||||||||
| Jack in the Box | Hutchins | TX | — | 330 | 1,363 | — | 1,693 | 110 | 6/27/2013 | 1995 | ||||||||||||||||
| Jack in the Box | Kingswood | TX | — | 430 | 955 | — | 1,385 | 77 | 6/27/2013 | 1995 | ||||||||||||||||
| Jack in the Box | Lufkin | TX | — | 440 | 1,544 | — | 1,984 | 125 | 6/27/2013 | 1995 | ||||||||||||||||
| Jack in the Box | Lufkin | TX | — | 450 | 1,563 | — | 2,013 | 126 | 6/27/2013 | 1995 | ||||||||||||||||
| Jack in the Box | Mesquite | TX | — | 560 | 1,652 | — | 2,212 | 134 | 6/27/2013 | 1995 | ||||||||||||||||
| Jack in the Box | Missouri City | TX | — | 451 | 837 | — | 1,288 | 64 | 7/31/2013 | 1991 | ||||||||||||||||
| Jack in the Box | Nacogdoches | TX | — | 340 | 1,320 | — | 1,660 | 107 | 6/27/2013 | 1995 | ||||||||||||||||
| Jack in the Box | Orange | TX | — | 270 | 1,661 | — | 1,931 | 134 | 6/27/2013 | 1995 | ||||||||||||||||
| Jack in the Box | Port Arthur | TX | — | 460 | 1,405 | — | 1,865 | 114 | 6/27/2013 | 1995 | ||||||||||||||||
| Jack in the Box | Rockwall | TX | — | 450 | 1,275 | — | 1,725 | 103 | 6/27/2013 | 1995 | ||||||||||||||||
F-175
| Initial Costs | Costs Capitalized Subsequent to Acquisition | Gross Amount Carried at December 31, 2014 (1) (2) | ||||||||||||||||||||||||
| Property | City | State | Encumbrances at December 31, 2014 | Land | Buildings, Fixtures and Improvements | Accumulated Depreciation (3) (4) | Date Acquired | Date of Construction | ||||||||||||||||||
| Jack in the Box | San Antonio | TX | — | 400 | 1,244 | — | 1,644 | 101 | 6/27/2013 | 1995 | ||||||||||||||||
| Jack in the Box | San Antonio | TX | — | 470 | 1,256 | — | 1,726 | 101 | 6/27/2013 | 1995 | ||||||||||||||||
| Jack in the Box | San Antonio | TX | — | 350 | 1,249 | — | 1,599 | 101 | 6/27/2013 | 1995 | ||||||||||||||||
| Jack in the Box | Spring | TX | — | 570 | 1,340 | — | 1,910 | 108 | 6/27/2013 | 1995 | ||||||||||||||||
| Jack in the Box | Spring | TX | — | 450 | 1,487 | — | 1,937 | 120 | 6/27/2013 | 1995 | ||||||||||||||||
| Jack in the Box | Texas City | TX | — | 454 | 844 | — | 1,298 | 72 | 6/27/2013 | 1991 | ||||||||||||||||
| Jack in the Box | Tyler | TX | — | 450 | 1,025 | — | 1,475 | 83 | 6/27/2013 | 1995 | ||||||||||||||||
| Jack in the Box | Weatherford | TX | — | 480 | 1,329 | — | 1,809 | 107 | 6/27/2013 | 1995 | ||||||||||||||||
| Jack in the Box | Enumclaw | WA | — | 380 | 1,238 | — | 1,618 | 100 | 6/27/2013 | 1995 | ||||||||||||||||
| Jiffy Lube | Houston | TX | — | 423 | 1,037 | — | 1,460 | 28 | 6/9/2014 | 2008 | ||||||||||||||||
| Jo-Ann's | Shakopee | MN | — | 994 | 1,807 | — | 2,801 | 79 | 2/7/2014 | 2012 | ||||||||||||||||
| Joe's Crab Shack | Lilburn | GA | — | 800 | 1,917 | — | 2,717 | 160 | 6/27/2013 | 1995 | ||||||||||||||||
| Joe's Crab Shack | Houston | TX | — | 900 | 1,749 | — | 2,649 | 146 | 6/27/2013 | 1995 | ||||||||||||||||
| John Deere | Davenport | IA | — | 1,161 | 22,052 | — | 23,213 | 3,531 | 5/31/2012 | 2003 | ||||||||||||||||
| Johnny Carinos | Rogers | AR | — | 997 | 2,540 | — | 3,537 | 225 | 6/27/2013 | 2001 | ||||||||||||||||
| Johnny Carinos | Columbus | IN | — | 809 | 1,888 | — | 2,697 | 154 | 8/30/2013 | 2004 | ||||||||||||||||
| Johnny Carinos | Muncie | IN | — | 540 | 2,160 | — | 2,700 | 177 | 8/30/2013 | 2003 | ||||||||||||||||
| Johnny Carinos | Amarillo | TX | — | 993 | 2,317 | — | 3,310 | 201 | 7/31/2013 | 2001 | ||||||||||||||||
| Johnny Carinos | Grand Prairie | TX | — | 997 | 2,327 | — | 3,324 | 202 | 7/31/2013 | 2001 | ||||||||||||||||
| Johnny Carinos | Houston | TX | — | 1,328 | 2,656 | — | 3,984 | 235 | 6/27/2013 | 2002 | ||||||||||||||||
| Johnny Carinos | Midland | TX | — | 998 | 2,329 | — | 3,327 | 202 | 7/31/2013 | 2000 | ||||||||||||||||
| Johnny Carinos | San Angelo | TX | — | 769 | 2,306 | — | 3,075 | 200 | 7/31/2013 | 2005 | ||||||||||||||||
| Johnson Controls | Pinellas Park | FL | 16,200 | 4,538 | 23,842 | — | 28,380 | 1,636 | 11/5/2013 | 2001 | ||||||||||||||||
| Kaiser Permanente | Cupertino | CA | — | 14,236 | 42,708 | — | 56,944 | 4,157 | 2/20/2013 | 1969 | ||||||||||||||||
| Katun Corp. | Davenport | IA | — | 454 | 7,485 | — | 7,939 | 200 | 5/6/2014 | 1993 | ||||||||||||||||
| Kentucky Fried Chicken | Bloomington | IL | — | 576 | 1,466 | — | 2,042 | 125 | 6/27/2013 | 2004 | ||||||||||||||||
| Kentucky Fried Chicken | Charleston | IL | — | 282 | 1,514 | — | 1,796 | 129 | 6/27/2013 | 2003 | ||||||||||||||||
| Kentucky Fried Chicken | Decatur | IL | — | 276 | 1,619 | — | 1,895 | 138 | 6/27/2013 | 2001 | ||||||||||||||||
F-176
| Initial Costs | Costs Capitalized Subsequent to Acquisition | Gross Amount Carried at December 31, 2014 (1) (2) | ||||||||||||||||||||||||
| Property | City | State | Encumbrances at December 31, 2014 | Land | Buildings, Fixtures and Improvements | Accumulated Depreciation (3) (4) | Date Acquired | Date of Construction | ||||||||||||||||||
| Kentucky Fried Chicken | Mattoon | IL | — | 113 | 1,019 | — | 1,132 | 78 | 7/31/2013 | 1973 | ||||||||||||||||
| Kentucky Fried Chicken | Rockford | IL | — | 201 | 1,142 | — | 1,343 | 88 | 7/31/2013 | 1995 | ||||||||||||||||
| Kentucky Fried Chicken | Springfield | IL | — | 267 | 1,068 | — | 1,335 | 82 | 7/31/2013 | 1987 | ||||||||||||||||
| Kentucky Fried Chicken | Springfield | IL | — | 212 | 1,203 | — | 1,415 | 93 | 7/31/2013 | 1987 | ||||||||||||||||
| Kentucky Fried Chicken | Crawfordsville | IN | — | 159 | 1,068 | — | 1,227 | 91 | 6/27/2013 | 1979 | ||||||||||||||||
| Kentucky Fried Chicken | Franklin | IN | — | 205 | 1,375 | — | 1,580 | 118 | 6/27/2013 | 1976 | ||||||||||||||||
| Kentucky Fried Chicken | Greenwood | IN | — | 339 | 1,405 | — | 1,744 | 120 | 6/27/2013 | 1976 | ||||||||||||||||
| Kentucky Fried Chicken | Burnsville | MN | — | 267 | 267 | — | 534 | 21 | 7/31/2013 | 1988 | ||||||||||||||||
| Kentucky Fried Chicken | Deming | NM | — | 220 | 691 | — | 911 | 56 | 6/27/2013 | 1995 | ||||||||||||||||
| Kentucky Fried Chicken | Las Cruces | NM | — | 270 | 498 | — | 768 | 40 | 6/27/2013 | 1995 | ||||||||||||||||
| Kentucky Fried Chicken | Warren | OH | — | 426 | 640 | — | 1,066 | 49 | 7/31/2013 | 1987 | ||||||||||||||||
| Kentucky Fried Chicken | New Kensington | PA | — | 324 | 487 | — | 811 | 37 | 7/31/2013 | 1967 | ||||||||||||||||
| Kentucky Fried Chicken | Greenville | TX | — | 119 | 585 | — | 704 | 50 | 6/27/2013 | 1988 | ||||||||||||||||
| Kentucky Fried Chicken | Appleton | WI | — | 350 | 874 | — | 1,224 | 71 | 6/27/2013 | 1995 | ||||||||||||||||
| Kentucky Fried Chicken / A&W | Granite City | IL | — | 102 | 1,083 | — | 1,185 | 93 | 6/27/2013 | 1987 | ||||||||||||||||
| Kentucky Fried Chicken / A&W | Allison Park | PA | — | 246 | 683 | — | 929 | 58 | 6/27/2013 | 1978 | ||||||||||||||||
| Kentucky Fried Chicken / A&W | Germantown | WI | — | 368 | 913 | — | 1,281 | 78 | 6/27/2013 | 1989 | ||||||||||||||||
| Kentucky Fried Chicken / A&W | Green Bay | WI | — | 208 | 1,022 | — | 1,230 | 87 | 6/27/2013 | 1986 | ||||||||||||||||
| Kentucky Fried Chicken / A&W | Milwaukee | WI | — | 396 | 773 | — | 1,169 | 66 | 6/27/2013 | 1991 | ||||||||||||||||
| Kentucky Fried Chicken / A&W | Milwaukee | WI | — | 281 | 795 | — | 1,076 | 68 | 6/27/2013 | 1992 | ||||||||||||||||
| Kentucky Fried Chicken / A&W | Milwaukee | WI | — | 89 | 750 | — | 839 | 64 | 6/27/2013 | 1989 | ||||||||||||||||
| Kentucky Fried Chicken / A&W | Milwaukee | WI | — | 197 | 975 | — | 1,172 | 83 | 6/27/2013 | 1991 | ||||||||||||||||
| Kentucky Fried Chicken / A&W | Milwaukee | WI | — | 138 | 924 | — | 1,062 | 79 | 6/27/2013 | 1992 | ||||||||||||||||
| Kentucky Fried Chicken / A&W | South Milwaukee | WI | — | 197 | 695 | — | 892 | 59 | 6/27/2013 | 1993 | ||||||||||||||||
| Kentucky Fried Chicken / A&W | Wauwatosa | WI | — | 135 | 615 | — | 750 | 53 | 6/27/2013 | 1992 | ||||||||||||||||
| Kentucky Fried Chicken / A&W | West Bend | WI | — | 185 | 705 | — | 890 | 60 | 6/27/2013 | 1972 | ||||||||||||||||
| Ker's WingHouse Bar and Grill | Brandon | FL | — | 340 | 654 | — | 994 | 55 | 6/27/2013 | 1995 | ||||||||||||||||
| Ker's WingHouse Bar and Grill | Clearwater | FL | — | 550 | 627 | — | 1,177 | 52 | 6/27/2013 | 1995 | ||||||||||||||||
F-177
| Initial Costs | Costs Capitalized Subsequent to Acquisition | Gross Amount Carried at December 31, 2014 (1) (2) | ||||||||||||||||||||||||
| Property | City | State | Encumbrances at December 31, 2014 | Land | Buildings, Fixtures and Improvements | Accumulated Depreciation (3) (4) | Date Acquired | Date of Construction | ||||||||||||||||||
| Kettle Restaurant | College Station | TX | — | 225 | 249 | — | 474 | 22 | 6/27/2013 | 1981 | ||||||||||||||||
| Kettle Restaurant | San Antonio | TX | — | 168 | 206 | — | 374 | 16 | 7/31/2013 | 1965 | ||||||||||||||||
| Key Bank | Spencerport | NY | — | 59 | 1,112 | — | 1,171 | 92 | 6/5/2013 | 1960 | ||||||||||||||||
| Key Bank | Berea | OH | — | 234 | 1,326 | — | 1,560 | 86 | 10/1/2013 | 1958 | ||||||||||||||||
| Kirklands | Wilmington | NC | — | 1,127 | 1,061 | — | 2,188 | 50 | 2/7/2014 | 2004 | ||||||||||||||||
| Kohl's | Monrovia | CA | 8,700 | 8,052 | 7,891 | — | 15,943 | 348 | 2/7/2014 | 1982 | ||||||||||||||||
| Kohl's | Tavares | FL | 4,670 | 4,173 | — | — | 4,173 | — | 2/7/2014 | 2008 | ||||||||||||||||
| Kohl's | Fort Dodge | IA | — | 1,431 | 3,109 | — | 4,540 | 137 | 2/7/2014 | 2011 | ||||||||||||||||
| Kohl's | Salina | KS | — | 964 | 5,009 | — | 5,973 | 198 | 2/7/2014 | 2009 | ||||||||||||||||
| Kohl's | Howell | MI | 7,705 | 547 | 10,399 | — | 10,946 | 1,309 | 3/28/2013 | 2003 | ||||||||||||||||
| Kohl's | Saginaw | MI | — | 1,110 | 6,932 | — | 8,042 | 272 | 2/7/2014 | 2011 | ||||||||||||||||
| Kohl's | Columbia | SC | — | 1,532 | 14,561 | — | 16,093 | 545 | 2/7/2014 | 2007 | ||||||||||||||||
| Kohl's | Spartanburg | SC | — | 2,984 | 5,842 | — | 8,826 | 246 | 2/7/2014 | 2006 | ||||||||||||||||
| Kohl's | Brownsville | TX | — | 2,756 | 3,423 | — | 6,179 | 152 | 2/7/2014 | 2007 | ||||||||||||||||
| Kohl's | McAllen | TX | 3,591 | 1,286 | 7,321 | — | 8,607 | 298 | 2/7/2014 | 2005 | ||||||||||||||||
| Kohl's | Onalaska | WI | 3,550 | 1,903 | 6,971 | — | 8,874 | 279 | 2/7/2014 | 1992 | ||||||||||||||||
| Kohl's | Rice Lake | WI | — | 1,268 | 7,788 | — | 9,056 | 308 | 2/7/2014 | 2011 | ||||||||||||||||
| Kroger | Calhoun | GA | — | — | 6,279 | — | 6,279 | 353 | 11/5/2013 | 1996 | ||||||||||||||||
| Kroger | Lithonia | GA | — | — | 6,250 | — | 6,250 | 351 | 11/5/2013 | 1995 | ||||||||||||||||
| Kroger | Suwanee | GA | — | — | 7,574 | — | 7,574 | 425 | 11/5/2013 | 1995 | ||||||||||||||||
| Kroger | Suwanee | GA | — | — | 7,691 | — | 7,691 | 432 | 11/5/2013 | 1993 | ||||||||||||||||
| Kroger | Frankfort | KY | — | — | 5,794 | — | 5,794 | 325 | 11/5/2013 | 1995 | ||||||||||||||||
| Kroger | Georgetown | KY | — | — | 6,742 | — | 6,742 | 379 | 11/5/2013 | 1995 | ||||||||||||||||
| Kroger | Madisonville | KY | — | — | 5,715 | — | 5,715 | 321 | 11/5/2013 | 1996 | ||||||||||||||||
| Kroger | Murray | KY | — | — | 6,165 | — | 6,165 | 346 | 11/5/2013 | 1995 | ||||||||||||||||
| Kroger | Owensboro | KY | — | — | 6,073 | — | 6,073 | 341 | 11/5/2013 | 1996 | ||||||||||||||||
| Kroger | Franklin | TN | — | — | 7,782 | — | 7,782 | 437 | 11/5/2013 | 1996 | ||||||||||||||||
| Kroger | Knoxville | TN | — | — | 7,642 | — | 7,642 | 429 | 11/5/2013 | 1996 | ||||||||||||||||
F-178
| Initial Costs | Costs Capitalized Subsequent to Acquisition | Gross Amount Carried at December 31, 2014 (1) (2) | ||||||||||||||||||||||||
| Property | City | State | Encumbrances at December 31, 2014 | Land | Buildings, Fixtures and Improvements | Accumulated Depreciation (3) (4) | Date Acquired | Date of Construction | ||||||||||||||||||
| Krystal | Greenville | AL | — | 195 | 1,147 | — | 1,342 | 93 | 6/27/2013 | 1995 | ||||||||||||||||
| Krystal | Huntsville | AL | — | 348 | 811 | — | 1,159 | 98 | 4/23/2013 | 1960 | ||||||||||||||||
| Krystal | Huntsville | AL | — | 352 | 654 | — | 1,006 | 79 | 4/23/2013 | 1971 | ||||||||||||||||
| Krystal | Huntsville | AL | — | 305 | 712 | — | 1,017 | 77 | 6/10/2013 | 1985 | ||||||||||||||||
| Krystal | Montgomery | AL | — | 259 | 1,036 | — | 1,295 | 167 | 9/21/2012 | 1964 | ||||||||||||||||
| Krystal | Montgomery | AL | — | 560 | 829 | — | 1,389 | 67 | 6/27/2013 | 1995 | ||||||||||||||||
| Krystal | Montgomery | AL | — | 303 | 562 | — | 865 | 68 | 4/23/2013 | 1962 | ||||||||||||||||
| Krystal | Montgomery | AL | — | 502 | 613 | — | 1,115 | 74 | 4/23/2013 | 1962 | ||||||||||||||||
| Krystal | Phenix City | AL | — | 366 | 1,465 | — | 1,831 | 236 | 9/21/2012 | 1980 | ||||||||||||||||
| Krystal | Scottsboro | AL | — | 20 | 1,157 | — | 1,177 | 94 | 6/27/2013 | 1995 | ||||||||||||||||
| Krystal | Tuscaloosa | AL | — | 206 | 1,165 | — | 1,371 | 188 | 9/21/2012 | 1976 | ||||||||||||||||
| Krystal | Valley | AL | — | 297 | 694 | — | 991 | 83 | 4/23/2013 | 1979 | ||||||||||||||||
| Krystal | Vestavia Hills | AL | — | 342 | 513 | — | 855 | 62 | 4/23/2013 | 1995 | ||||||||||||||||
| Krystal | Jacksonville | FL | — | 574 | 574 | — | 1,148 | 93 | 9/21/2012 | 1990 | ||||||||||||||||
| Krystal | Orlando | FL | — | 372 | 372 | — | 744 | 60 | 9/21/2012 | 1994 | ||||||||||||||||
| Krystal | Orlando | FL | — | 669 | 446 | — | 1,115 | 72 | 9/21/2012 | 1995 | ||||||||||||||||
| Krystal | Plant City | FL | — | 355 | 533 | — | 888 | 86 | 9/21/2012 | 2012 | ||||||||||||||||
| Krystal | St. Augustine | FL | — | 411 | 411 | — | 822 | 66 | 9/21/2012 | 2012 | ||||||||||||||||
| Krystal | Albany | GA | — | 309 | 721 | — | 1,030 | 116 | 9/21/2012 | 1962 | ||||||||||||||||
| Krystal | Atlanta | GA | — | 166 | 664 | — | 830 | 107 | 9/21/2012 | 1973 | ||||||||||||||||
| Krystal | Augusta | GA | — | 365 | 851 | — | 1,216 | 137 | 9/21/2012 | 1979 | ||||||||||||||||
| Krystal | Columbus | GA | — | 622 | 934 | — | 1,556 | 151 | 9/21/2012 | 1977 | ||||||||||||||||
| Krystal | Decatur | GA | — | 94 | 533 | — | 627 | 86 | 9/21/2012 | 1965 | ||||||||||||||||
| Krystal | East Point | GA | — | 221 | 664 | — | 885 | 103 | 10/26/2012 | 1984 | ||||||||||||||||
| Krystal | Macon | GA | — | 325 | 759 | — | 1,084 | 123 | 9/21/2012 | 1962 | ||||||||||||||||
| Krystal | Milledgeville | GA | — | 261 | 609 | — | 870 | 98 | 9/21/2012 | 2011 | ||||||||||||||||
| Krystal | Snellville | GA | — | 466 | 466 | — | 932 | 75 | 9/21/2012 | 1981 | ||||||||||||||||
| Krystal | Corinth | MS | — | 279 | 652 | — | 931 | 78 | 4/23/2013 | 2007 | ||||||||||||||||
F-179
| Initial Costs | Costs Capitalized Subsequent to Acquisition | Gross Amount Carried at December 31, 2014 (1) (2) | ||||||||||||||||||||||||
| Property | City | State | Encumbrances at December 31, 2014 | Land | Buildings, Fixtures and Improvements | Accumulated Depreciation (3) (4) | Date Acquired | Date of Construction | ||||||||||||||||||
| Krystal | Gulfport | MS | — | 215 | 861 | — | 1,076 | 139 | 9/21/2012 | 2011 | ||||||||||||||||
| Krystal | Jackson | MS | — | 285 | 1,140 | — | 1,425 | 184 | 9/21/2012 | 1978 | ||||||||||||||||
| Krystal | Jackson | MS | — | 198 | 1,120 | — | 1,318 | 181 | 9/21/2012 | 1983 | ||||||||||||||||
| Krystal | Pearl | MS | — | 426 | 638 | — | 1,064 | 103 | 9/21/2012 | 1976 | ||||||||||||||||
| Krystal | Chattanooga | TN | — | 336 | 784 | — | 1,120 | 126 | 9/21/2012 | 2010 | ||||||||||||||||
| Krystal | Chattanooga | TN | — | 186 | 328 | — | 514 | 11 | 6/27/2013 | 1995 | ||||||||||||||||
| Krystal | Chattanooga | TN | — | 440 | 659 | — | 1,099 | 79 | 4/23/2013 | 1983 | ||||||||||||||||
| Krystal | Knoxville | TN | — | 369 | 246 | — | 615 | 40 | 9/21/2012 | 1970 | ||||||||||||||||
| Krystal | Lawrenceburg | TN | — | 304 | 709 | — | 1,013 | 85 | 4/23/2013 | 1980 | ||||||||||||||||
| Krystal | Memphis | TN | — | 257 | 1,029 | — | 1,286 | 124 | 4/23/2013 | 1975 | ||||||||||||||||
| Krystal | Memphis | TN | — | 181 | 723 | — | 904 | 87 | 4/23/2013 | 1972 | ||||||||||||||||
| Krystal | Murfreesboro | TN | — | 465 | 698 | — | 1,163 | 84 | 4/23/2013 | 2008 | ||||||||||||||||
| Kum & Go | Bentonville | AR | — | 587 | 1,370 | — | 1,957 | 164 | 11/20/2012 | 2009 | ||||||||||||||||
| Kum & Go | Lowell | AR | — | 774 | 1,437 | — | 2,211 | 172 | 11/20/2012 | 2009 | ||||||||||||||||
| Kum & Go | Paragould | AR | — | 708 | 2,123 | — | 2,831 | 273 | 9/28/2012 | 2012 | ||||||||||||||||
| Kum & Go | Rogers | AR | — | 668 | 1,559 | — | 2,227 | 186 | 11/20/2012 | 2008 | ||||||||||||||||
| Kum & Go | Sherwood | AR | — | 866 | 1,609 | — | 2,475 | 207 | 9/28/2012 | 2012 | ||||||||||||||||
| Kum & Go | Fountain | CO | — | 1,131 | 1,696 | — | 2,827 | 194 | 12/24/2012 | 2012 | ||||||||||||||||
| Kum & Go | Monument | CO | — | 1,192 | 1,457 | — | 2,649 | 167 | 12/24/2012 | 2012 | ||||||||||||||||
| Kum & Go | Muscatine | IA | — | 794 | 1,853 | — | 2,647 | 212 | 12/27/2012 | 2012 | ||||||||||||||||
| Kum & Go | Ottumwa | IA | — | 586 | 1,368 | — | 1,954 | 163 | 11/20/2012 | 1998 | ||||||||||||||||
| Kum & Go | Sloan | IA | — | 447 | 2,162 | — | 2,609 | 120 | 2/7/2014 | 2008 | ||||||||||||||||
| Kum & Go | Story City | IA | — | 223 | 2,089 | — | 2,312 | 103 | 2/7/2014 | 2006 | ||||||||||||||||
| Kum & Go | Tipton | IA | — | 507 | 1,945 | — | 2,452 | 113 | 2/7/2014 | 2008 | ||||||||||||||||
| Kum & Go | Waukee | IA | — | 1,280 | 1,280 | — | 2,560 | 129 | 3/28/2013 | 2012 | ||||||||||||||||
| Kum & Go | West Branch | IA | — | 219 | 1,089 | — | 1,308 | 53 | 2/7/2014 | 1997 | ||||||||||||||||
| Kum & Go | Joplin | MO | — | 218 | 782 | — | 1,000 | 51 | 2/11/2014 | 1987 | ||||||||||||||||
| Kum & Go | Joplin | MO | — | 314 | 1,610 | — | 1,924 | 81 | 2/11/2014 | 1984 | ||||||||||||||||
F-180
| Initial Costs | Costs Capitalized Subsequent to Acquisition | Gross Amount Carried at December 31, 2014 (1) (2) | ||||||||||||||||||||||||
| Property | City | State | Encumbrances at December 31, 2014 | Land | Buildings, Fixtures and Improvements | Accumulated Depreciation (3) (4) | Date Acquired | Date of Construction | ||||||||||||||||||
| Kum & Go | Joplin | MO | — | 127 | 300 | — | 427 | 20 | 2/11/2014 | 1973 | ||||||||||||||||
| Kum & Go | Joplin | MO | — | 205 | 594 | — | 799 | 39 | 2/11/2014 | 1986 | ||||||||||||||||
| Kum & Go | Neosho | MO | — | 504 | 1,144 | — | 1,648 | 58 | 2/11/2014 | 1997 | ||||||||||||||||
| Kum & Go | Tioga | ND | — | 318 | 2,863 | — | 3,181 | 342 | 11/8/2012 | 2012 | ||||||||||||||||
| Kum & Go | Muskogee | OK | — | 423 | 1,691 | — | 2,114 | 139 | 7/22/2013 | 2013 | ||||||||||||||||
| Kum & Go | Muskogee | OK | — | 97 | 973 | — | 1,070 | 14 | 9/30/2014 | 1999 | ||||||||||||||||
| Kum & Go | Cheyenne | WY | — | 411 | 2,327 | — | 2,738 | 267 | 12/27/2012 | 2012 | ||||||||||||||||
| Kum & Go | Gillette | WY | — | 878 | 2,048 | — | 2,926 | 177 | 6/28/2013 | 2013 | ||||||||||||||||
| L.A. Fitness | Avondale | AZ | — | 2,253 | 9,040 | — | 11,293 | 428 | 2/7/2014 | 2006 | ||||||||||||||||
| L.A. Fitness | Glendale | AZ | 3,193 | 2,177 | 7,568 | — | 9,745 | 388 | 2/7/2014 | 2005 | ||||||||||||||||
| L.A. Fitness | Marana | AZ | — | 1,284 | 8,322 | — | 9,606 | 410 | 2/7/2014 | 2011 | ||||||||||||||||
| L.A. Fitness | Highland | CA | 4,700 | 2,274 | 8,673 | — | 10,947 | 454 | 2/7/2014 | 2009 | ||||||||||||||||
| L.A. Fitness | Broadview | IL | — | 3,345 | 8,763 | — | 12,108 | 420 | 2/7/2014 | 2010 | ||||||||||||||||
| L.A. Fitness | Oswego | IL | — | 3,163 | 8,749 | — | 11,912 | 437 | 2/7/2014 | 2008 | ||||||||||||||||
| L.A. Fitness | Carmel | IN | — | 1,457 | 9,562 | — | 11,019 | 453 | 2/7/2014 | 2008 | ||||||||||||||||
| L.A. Fitness | Indianapolis | IN | — | 1,279 | 8,970 | — | 10,249 | 425 | 2/7/2014 | 2009 | ||||||||||||||||
| L.A. Fitness | Oakdale | MN | 4,749 | 2,315 | 8,315 | — | 10,630 | 411 | 2/7/2014 | 2009 | ||||||||||||||||
| L.A. Fitness | Edmond | OK | — | 962 | 6,916 | — | 7,878 | 276 | 3/31/2014 | 2014 | ||||||||||||||||
| L.A. Fitness | Easton | PA | — | 938 | 10,600 | — | 11,538 | 505 | 2/7/2014 | 1979 | ||||||||||||||||
| L.A. Fitness | Dallas | TX | 4,712 | 2,629 | 10,413 | — | 13,042 | 469 | 2/7/2014 | 2008 | ||||||||||||||||
| L.A. Fitness | Denton | TX | 3,960 | 1,888 | 9,568 | — | 11,456 | 444 | 2/7/2014 | 2009 | ||||||||||||||||
| L.A. Fitness | Duncanville | TX | — | 1,538 | 10,023 | — | 11,561 | 457 | 2/7/2014 | 2007 | ||||||||||||||||
| L.A. Fitness | Spring | TX | — | 1,970 | 9,290 | — | 11,260 | 430 | 2/7/2014 | 2006 | ||||||||||||||||
| Lakeshore Crossing | Gainesville | GA | 4,400 | 2,789 | 6,845 | — | 9,634 | 305 | 2/7/2014 | 1995 | ||||||||||||||||
| Lamons Metal Gasket Co | Houston | TX | 6,372 | 1,821 | 7,562 | — | 9,383 | 318 | 2/21/2014 | 1999 | ||||||||||||||||
| Large Private Company | Columbia | SC | — | 1,875 | 19,591 | — | 21,466 | 947 | 11/5/2013 | 2014 | ||||||||||||||||
| Leeann Chin | Blaine | MN | — | 480 | 528 | — | 1,008 | 43 | 6/27/2013 | 1995 | ||||||||||||||||
| Leeann Chin | Chanhassen | MN | — | 450 | 763 | — | 1,213 | 62 | 6/27/2013 | 1995 | ||||||||||||||||
F-181
| Initial Costs | Costs Capitalized Subsequent to Acquisition | Gross Amount Carried at December 31, 2014 (1) (2) | ||||||||||||||||||||||||
| Property | City | State | Encumbrances at December 31, 2014 | Land | Buildings, Fixtures and Improvements | Accumulated Depreciation (3) (4) | Date Acquired | Date of Construction | ||||||||||||||||||
| Leeann Chin | Golden Valley | MN | — | 270 | 776 | — | 1,046 | 63 | 6/27/2013 | 1995 | ||||||||||||||||
| Lee's Famous Recipe Chicken | Florissant | MO | — | 306 | 560 | — | 866 | 48 | 6/27/2013 | 1984 | ||||||||||||||||
| Lee's Famous Recipe Chicken | St. Ann | MO | — | 187 | 571 | — | 758 | 49 | 6/27/2013 | 1984 | ||||||||||||||||
| Lee's Famous Recipe Chicken | St. Louis | MO | — | 107 | 874 | — | 981 | 75 | 6/27/2013 | 1984 | ||||||||||||||||
| Logan's Roadhouse | Huntsville | AL | — | 520 | 4,797 | — | 5,317 | 401 | 6/27/2013 | 1995 | ||||||||||||||||
| Logan's Roadhouse | Fayetteville | AR | — | 1,570 | 2,182 | — | 3,752 | 182 | 6/27/2013 | 1995 | ||||||||||||||||
| Logan's Roadhouse | Hattiesburg | MS | — | 890 | 4,012 | — | 4,902 | 335 | 6/27/2013 | 1995 | ||||||||||||||||
| Logan's Roadhouse | Owasso | OK | — | 1,449 | 2,173 | — | 3,622 | 189 | 7/31/2013 | 2006 | ||||||||||||||||
| Logan's Roadhouse | Clarksville | TN | — | 1,010 | 4,424 | — | 5,434 | 370 | 6/27/2013 | 1995 | ||||||||||||||||
| Logan's Roadhouse | Cleveland | TN | — | 890 | 3,902 | — | 4,792 | 326 | 6/27/2013 | 1995 | ||||||||||||||||
| Logan's Roadhouse | Mt. Juliet | TN | — | 1,366 | 2,538 | — | 3,904 | 220 | 7/31/2013 | 2006 | ||||||||||||||||
| Logan's Roadhouse | El Paso | TX | — | 320 | 4,731 | — | 5,051 | 396 | 6/27/2013 | 1995 | ||||||||||||||||
| Long John Silver's / A&W | Merced | CA | — | 174 | 695 | — | 869 | 53 | 7/31/2013 | 1982 | ||||||||||||||||
| Long John Silver's / A&W | Collinsville | IL | — | 220 | 940 | — | 1,160 | 80 | 6/27/2013 | 2006 | ||||||||||||||||
| Long John Silver's / A&W | Fairview Heights | IL | — | 258 | 525 | — | 783 | 45 | 6/27/2013 | 1976 | ||||||||||||||||
| Long John Silver's / A&W | Jacksonville | IL | — | 171 | 431 | — | 602 | 37 | 6/27/2013 | 1978 | ||||||||||||||||
| Long John Silver's / A&W | Litchfield | IL | — | 194 | 996 | — | 1,190 | 85 | 6/27/2013 | 1986 | ||||||||||||||||
| Long John Silver's / A&W | Marion | IL | — | 305 | 1,059 | — | 1,364 | 91 | 6/27/2013 | 1983 | ||||||||||||||||
| Long John Silver's / A&W | Mount Carmel | IL | — | 105 | 484 | — | 589 | 41 | 6/27/2013 | 1977 | ||||||||||||||||
| Long John Silver's / A&W | Vandalia | IL | — | 101 | 484 | — | 585 | 41 | 6/27/2013 | 1976 | ||||||||||||||||
| Long John Silver's / A&W | West Frankfort | IL | — | 244 | 996 | — | 1,240 | 85 | 6/27/2013 | 1977 | ||||||||||||||||
| Long John Silver's / A&W | Wood River | IL | — | 251 | 314 | — | 565 | 27 | 6/27/2013 | 1975 | ||||||||||||||||
| Long John Silver's / A&W | Garden City | KS | — | 120 | 530 | — | 650 | 45 | 6/27/2013 | 1978 | ||||||||||||||||
| Long John Silver's / A&W | Hays | KS | — | 160 | 624 | — | 784 | 53 | 6/27/2013 | 1994 | ||||||||||||||||
| Long John Silver's / A&W | Kansas City | MO | — | 389 | 722 | — | 1,111 | 56 | 7/31/2013 | 1995 | ||||||||||||||||
| Long John Silver's / A&W | Neosho | MO | — | 93 | 261 | — | 354 | 6 | 7/31/2013 | 1994 | ||||||||||||||||
| Long John Silver's / A&W | Asheville | NC | — | 586 | 693 | — | 1,279 | 59 | 6/27/2013 | 1992 | ||||||||||||||||
| Long John Silver's / A&W | Alamogordo | NM | — | 160 | 574 | — | 734 | 46 | 6/27/2013 | 1995 | ||||||||||||||||
F-182
| Initial Costs | Costs Capitalized Subsequent to Acquisition | Gross Amount Carried at December 31, 2014 (1) (2) | ||||||||||||||||||||||||
| Property | City | State | Encumbrances at December 31, 2014 | Land | Buildings, Fixtures and Improvements | Accumulated Depreciation (3) (4) | Date Acquired | Date of Construction | ||||||||||||||||||
| Long John Silver's / A&W | Albuquerque | NM | — | 227 | 680 | — | 907 | 52 | 7/31/2013 | 1975 | ||||||||||||||||
| Long John Silver's / A&W | Clovis | NM | — | 210 | 705 | — | 915 | 4 | 6/27/2013 | 1995 | ||||||||||||||||
| Long John Silver's / A&W | Las Cruces | NM | — | 242 | 565 | — | 807 | 44 | 7/31/2013 | 1975 | ||||||||||||||||
| Long John Silver's / A&W | Englewood | OH | — | 547 | — | — | 547 | — | 6/27/2013 | 1974 | ||||||||||||||||
| Long John Silver's / A&W | Fairborn | OH | — | 103 | 300 | — | 403 | 26 | 6/27/2013 | 1976 | ||||||||||||||||
| Long John Silver's / A&W | Marion | OH | — | 182 | 389 | — | 571 | 9 | 6/27/2013 | 1994 | ||||||||||||||||
| Long John Silver's / A&W | Johnstown | PA | — | 389 | 906 | — | 1,295 | 62 | 7/31/2013 | 1995 | ||||||||||||||||
| Long John Silver's / A&W | Penn Hills | PA | — | 438 | 656 | — | 1,094 | 51 | 7/31/2013 | 1993 | ||||||||||||||||
| Long John Silver's / A&W | Jackson | TN | — | 264 | 323 | — | 587 | 25 | 7/31/2013 | 1995 | ||||||||||||||||
| Long John Silver's / A&W | Arlington | TX | — | 365 | 537 | — | 902 | 46 | 6/27/2013 | 1993 | ||||||||||||||||
| Long John Silver's / A&W | Austin | TX | — | 459 | 477 | — | 936 | 41 | 6/27/2013 | 1993 | ||||||||||||||||
| Long John Silver's / A&W | Cleburne | TX | — | 205 | 380 | — | 585 | 29 | 7/31/2013 | 1986 | ||||||||||||||||
| Long John Silver's / A&W | Irving | TX | — | 522 | 512 | — | 1,034 | 6 | 6/27/2013 | 1995 | ||||||||||||||||
| Long John Silver's / KFC | Green Bay | WI | — | 748 | 563 | — | 1,311 | 48 | 6/27/2013 | 1978 | ||||||||||||||||
| Long John Silver's / Taco Bell | Ashtabula | OH | — | 440 | 1,640 | — | 2,080 | 133 | 6/27/2013 | 1995 | ||||||||||||||||
| Longhorn Steakhouse | Tampa | FL | — | 370 | 1,852 | — | 2,222 | 155 | 6/27/2013 | 1995 | ||||||||||||||||
| Los Tios Mexican Restaurant | Dalton | OH | — | 18 | 30 | — | 48 | 3 | 6/27/2013 | 1990 | ||||||||||||||||
| Lowe's | Jonesboro | AR | 5,699 | 2,101 | 8,405 | — | 10,506 | 253 | 5/19/2014 | 1994 | ||||||||||||||||
| Lowe's | Denver | CO | — | 11,953 | — | — | 11,953 | — | 2/7/2014 | 2009 | ||||||||||||||||
| Lowe's | Burlington | IA | — | 2,775 | 8,191 | — | 10,966 | 324 | 2/7/2014 | 1996 | ||||||||||||||||
| Lowe's | Florence | KY | — | 4,814 | 10,189 | — | 15,003 | 424 | 2/7/2014 | 1997 | ||||||||||||||||
| Lowe's | New Orleans | LA | 15,051 | 10,315 | 20,728 | — | 31,043 | 1,164 | 11/5/2013 | 2005 | ||||||||||||||||
| Lowe's | Sanford | ME | 4,672 | 4,045 | — | — | 4,045 | — | 2/7/2014 | 2009 | ||||||||||||||||
| Lowe's | Windham | ME | 7,930 | 12,640 | — | — | 12,640 | — | 6/3/2013 | 2006 | ||||||||||||||||
| Lowe's | Benton Harbor | MI | — | 1,011 | 7,851 | — | 8,862 | 310 | 3/17/2014 | 1994 | ||||||||||||||||
| Lowe's | Kansas City | MO | — | 3,729 | — | — | 3,729 | — | 2/7/2014 | 2009 | ||||||||||||||||
| Lowe's | Ticonderoga | NY | 4,345 | 1,812 | — | — | 1,812 | — | 2/7/2014 | 2009 | ||||||||||||||||
| Lowe's | West Carrollton | OH | 6,375 | 2,864 | 9,883 | — | 12,747 | 387 | 2/7/2014 | 1994 | ||||||||||||||||
| Lowe's | Columbia | SC | — | 5,485 | — | — | 5,485 | — | 2/7/2014 | 1994 | ||||||||||||||||
F-183
| Initial Costs | Costs Capitalized Subsequent to Acquisition | Gross Amount Carried at December 31, 2014 (1) (2) | ||||||||||||||||||||||||
| Property | City | State | Encumbrances at December 31, 2014 | Land | Buildings, Fixtures and Improvements | Accumulated Depreciation (3) (4) | Date Acquired | Date of Construction | ||||||||||||||||||
| Lowe's | Texas City | TX | 6,566 | 2,313 | 9,253 | — | 11,566 | 392 | 5/19/2014 | 1995 | ||||||||||||||||
| Lube Stop | Akron | OH | — | 79 | 287 | — | 366 | 5 | 9/2/2014 | 1988 | ||||||||||||||||
| Lube Stop | Akron | OH | — | 135 | 761 | — | 896 | 13 | 9/2/2014 | 1995 | ||||||||||||||||
| Lube Stop | Akron | OH | — | 205 | 1,043 | — | 1,248 | 17 | 9/2/2014 | 1992 | ||||||||||||||||
| Lube Stop | Bedford Heights | OH | — | 156 | 529 | — | 685 | 10 | 9/2/2014 | 1986 | ||||||||||||||||
| Lube Stop | Cleveland | OH | — | 127 | 559 | — | 686 | 9 | 9/2/2014 | 1988 | ||||||||||||||||
| Lube Stop | Fairview Park | OH | — | 205 | 179 | — | 384 | 6 | 9/2/2014 | 1988 | ||||||||||||||||
| Lube Stop | Lakewood | OH | — | 205 | 765 | — | 970 | 13 | 9/2/2014 | 1993 | ||||||||||||||||
| Lube Stop | Mayfield Heights | OH | — | 201 | 430 | — | 631 | 8 | 9/2/2014 | 1988 | ||||||||||||||||
| Lube Stop | Medina | OH | — | 135 | 414 | — | 549 | 8 | 9/2/2014 | 1995 | ||||||||||||||||
| Lube Stop | N. Barberton | OH | — | 140 | 502 | — | 642 | 8 | 9/2/2014 | 1998 | ||||||||||||||||
| Lube Stop | Painesville | OH | — | 276 | 208 | — | 484 | 6 | 9/2/2014 | 1988 | ||||||||||||||||
| Lube Stop | Parma | OH | — | 124 | 390 | — | 514 | 6 | 7/31/2014 | 1986 | ||||||||||||||||
| Lube Stop | Parma | OH | — | 306 | 502 | — | 808 | 10 | 9/2/2014 | 1986 | ||||||||||||||||
| Lube Stop | Seven Hills | OH | — | 182 | 201 | — | 383 | 5 | 9/2/2014 | 1987 | ||||||||||||||||
| Lube Stop | Solon | OH | — | 233 | 487 | — | 720 | 9 | 9/2/2014 | 1992 | ||||||||||||||||
| Lube Stop | South Euclid | OH | — | 109 | 561 | — | 670 | 8 | 9/2/2014 | 1986 | ||||||||||||||||
| Lube Stop | Stow | OH | — | 230 | 132 | — | 362 | 4 | 9/2/2014 | 1988 | ||||||||||||||||
| Lube Stop | Westlake | OH | — | 85 | 525 | — | 610 | 7 | 9/2/2014 | 1999 | ||||||||||||||||
| Lube Stop | Willoughby | OH | — | 168 | 425 | — | 593 | 7 | 9/2/2014 | 1986 | ||||||||||||||||
| Lumber Liquidators | Saginaw | MI | — | 287 | 502 | — | 789 | 17 | 5/28/2014 | 2000 | ||||||||||||||||
F-184
| Initial Costs | Costs Capitalized Subsequent to Acquisition | Gross Amount Carried at December 31, 2014 (1) (2) | ||||||||||||||||||||||||
| Property | City | State | Encumbrances at December 31, 2014 | Land | Buildings, Fixtures and Improvements | Accumulated Depreciation (3) (4) | Date Acquired | Date of Construction | ||||||||||||||||||
| Macaroni Grill | Flanders | NJ | 915 | 1,468 | 883 | — | 2,351 | 40 | 2/7/2014 | 2003 | ||||||||||||||||
| Macaroni Grill | W. Windsor | NJ | 1,043 | 1,307 | 1,498 | — | 2,805 | 64 | 2/7/2014 | 1998 | ||||||||||||||||
| Mattress Firm | Daphne | AL | — | 528 | 1,233 | — | 1,761 | 84 | 10/1/2013 | 2013 | ||||||||||||||||
| Mattress Firm | Dothan | AL | — | 406 | 1,217 | — | 1,623 | 111 | 5/14/2013 | 2013 | ||||||||||||||||
| Mattress Firm | Rogers | AR | — | 321 | 1,284 | — | 1,605 | 135 | 2/6/2013 | 2012 | ||||||||||||||||
| Mattress Firm | Destin | FL | — | 693 | 1,287 | — | 1,980 | 111 | 6/5/2013 | 2013 | ||||||||||||||||
| Mattress Firm | Melbourne | FL | — | 405 | 1,237 | — | 1,642 | 58 | 2/7/2014 | 2011 | ||||||||||||||||
| Mattress Firm | Tallahassee | FL | — | 924 | 1,386 | — | 2,310 | 127 | 5/14/2013 | 2013 | ||||||||||||||||
| Mattress Firm | Boise | ID | — | 335 | 1,339 | — | 1,674 | 141 | 2/22/2013 | 2013 | ||||||||||||||||
| Mattress Firm | Garden City | ID | — | 492 | 1,305 | — | 1,797 | 58 | 2/26/2014 | 2003 | ||||||||||||||||
| Mattress Firm | Fairview Heights | IL | — | 231 | 958 | — | 1,189 | 50 | 2/7/2014 | 1977 | ||||||||||||||||
| Mattress Firm | Columbus | IN | — | 157 | 891 | — | 1,048 | 106 | 11/6/2012 | 1964 | ||||||||||||||||
| Mattress Firm | Evansville | IN | — | 117 | 2,227 | — | 2,344 | 235 | 2/11/2013 | 1995 | ||||||||||||||||
| Mattress Firm | Goshen | IN | — | 211 | 1,555 | — | 1,766 | 63 | 3/20/2014 | 2013 | ||||||||||||||||
| Mattress Firm | Mishawaka | IN | — | 375 | 1,500 | — | 1,875 | 123 | 7/30/2013 | 2013 | ||||||||||||||||
| Mattress Firm | South Bend | IN | — | 289 | 2,445 | — | 2,734 | 110 | 2/24/2014 | 2013 | ||||||||||||||||
| Mattress Firm | Bowling Green | KY | — | 648 | 973 | — | 1,621 | 93 | 4/25/2013 | 2012 | ||||||||||||||||
| Mattress Firm | Lafayette | LA | 1,194 | — | 1,251 | — | 1,251 | 114 | 5/2/2013 | 1995 | ||||||||||||||||
| Mattress Firm | Flint | MI | — | 467 | 1,323 | — | 1,790 | 23 | 8/19/2014 | 2014 | ||||||||||||||||
| Mattress Firm | Flint | MI | — | 409 | 1,164 | — | 1,573 | 12 | 10/3/2014 | 2014 | ||||||||||||||||
| Mattress Firm | Goldsboro | NC | — | 349 | 1,385 | — | 1,734 | 37 | 5/29/2014 | 2014 | ||||||||||||||||
| Mattress Firm | Greenville | NC | — | 1,085 | 1,085 | — | 2,170 | 124 | 12/12/2012 | 2012 | ||||||||||||||||
| Mattress Firm | Raleigh | NC | — | 1,091 | 1,091 | — | 2,182 | 140 | 9/28/2012 | 1997 | ||||||||||||||||
| Mattress Firm | Wilmington | NC | — | 412 | 1,257 | — | 1,669 | 127 | 3/29/2013 | 2013 | ||||||||||||||||
| Mattress Firm | Wilson | NC | — | 373 | 692 | — | 1,065 | 89 | 9/28/2012 | 2012 | ||||||||||||||||
| Mattress Firm | Painesville | OH | — | 437 | 1,318 | — | 1,755 | 29 | 7/10/2014 | 2014 | ||||||||||||||||
| Mattress Firm | Florence | SC | — | 398 | 929 | — | 1,327 | 107 | 12/7/2012 | 2012 | ||||||||||||||||
| Mattress Firm | Rock Hill | SC | — | 385 | 898 | — | 1,283 | 69 | 8/21/2013 | 2008 | ||||||||||||||||
| Mattress Firm | Knoxville | TN | — | 586 | 1,088 | — | 1,674 | 109 | 3/19/2013 | 2012 | ||||||||||||||||
F-185
| Initial Costs | Costs Capitalized Subsequent to Acquisition | Gross Amount Carried at December 31, 2014 (1) (2) | ||||||||||||||||||||||||
| Property | City | State | Encumbrances at December 31, 2014 | Land | Buildings, Fixtures and Improvements | Accumulated Depreciation (3) (4) | Date Acquired | Date of Construction | ||||||||||||||||||
| Mattress Firm | Nederland | TX | — | 311 | 1,245 | — | 1,556 | 160 | 9/26/2012 | 1997 | ||||||||||||||||
| Mattress Firm | Bountiful | UT | — | 736 | 1,367 | — | 2,103 | 157 | 12/31/2012 | 2012 | ||||||||||||||||
| Mattress Firm | Spokane | WA | — | 409 | 1,685 | — | 2,094 | 164 | 4/4/2013 | 2013 | ||||||||||||||||
| Mattress Firm | Spokane | WA | — | 511 | 1,582 | — | 2,093 | 162 | 3/28/2013 | 2013 | ||||||||||||||||
| McAlisters | Murfreesboro | TN | — | 310 | 720 | — | 1,030 | 60 | 6/27/2013 | 1995 | ||||||||||||||||
| McAlisters | Sherman | TX | — | 563 | 1,223 | — | 1,786 | 44 | 5/16/2014 | 2013 | ||||||||||||||||
| McAlisters | Waco | TX | — | 429 | 791 | — | 1,220 | 39 | 3/27/2014 | 2000 | ||||||||||||||||
| McDonald's | Scotland Neck | NC | — | 320 | — | — | 320 | — | 6/27/2013 | 2005 | ||||||||||||||||
| MedAssets | Plano | TX | — | 10,432 | 45,650 | — | 56,082 | 1,777 | 2/7/2014 | 2013 | ||||||||||||||||
| Melrose Park Center | Melrose Park | IL | — | 6,143 | 10,515 | — | 16,658 | 460 | 2/7/2014 | 2006 | ||||||||||||||||
| Mercer Well Services | Cleburne | TX | — | 262 | 369 | — | 631 | 10 | 6/25/2014 | 2008 | ||||||||||||||||
| Merrill Lynch | Hopewell | NJ | 74,250 | 17,619 | 108,349 | — | 125,968 | 4,949 | 2/7/2014 | 2001 | ||||||||||||||||
| Metals USA | Horicon | WI | 3,674 | 754 | 6,104 | — | 6,858 | 334 | 2/21/2014 | 1996 | ||||||||||||||||
| Metro PCS | Richardson | TX | 8,107 | 1,292 | 19,606 | — | 20,898 | 1,137 | 11/5/2013 | 1986 | ||||||||||||||||
| Mezcal Mexican Restaurant | Grafton | OH | — | 64 | 191 | — | 255 | 17 | 7/31/2013 | 1990 | ||||||||||||||||
| Michael's | Aliso Viejo | CA | 39,332 | 18,724 | 31,970 | 5 | 50,699 | 1,795 | 11/5/2013 | 1995 | ||||||||||||||||
| Michael's | Lafayette | LA | — | 1,831 | 3,631 | — | 5,462 | 188 | 2/7/2014 | 2011 | ||||||||||||||||
| Michelin | Louisville | KY | — | 1,120 | 7,763 | — | 8,883 | 533 | 11/5/2013 | 2011 | ||||||||||||||||
| Millennium Chemicals | Glen Burnie | MD | 13,695 | 2,127 | 23,198 | — | 25,325 | 962 | 2/21/2014 | 1984 | ||||||||||||||||
| Miraca Life Sciences | Irving | TX | — | 3,237 | 37,297 | — | 40,534 | 1,358 | 4/28/2014 | 1997 | ||||||||||||||||
| Monro Muffler | Lewiston | ME | — | 279 | 1,115 | — | 1,394 | 105 | 5/10/2013 | 1976 | ||||||||||||||||
| Monro Muffler | Waukesha | WI | — | 228 | 684 | — | 912 | 58 | 7/23/2013 | 2002 | ||||||||||||||||
| Monterey's Tex Mex | Tulsa | OK | — | 135 | 406 | — | 541 | 35 | 7/31/2013 | 2001 | ||||||||||||||||
| Mo's Irish Pub Restaurant | Wauwatosa | WI | — | 550 | 818 | — | 1,368 | 68 | 6/27/2013 | 1995 | ||||||||||||||||
| MotoMart | St. Charles | MO | — | 1,085 | 1,980 | — | 3,065 | 107 | 2/7/2014 | 2009 | ||||||||||||||||
| Mrs. Baird's | Dallas | TX | — | 453 | 4,077 | — | 4,530 | 611 | 7/11/2012 | 2002 | ||||||||||||||||
| MS Energy Service | Midland | TX | — | 1,165 | 948 | — | 2,113 | 26 | 6/12/2014 | 2012 | ||||||||||||||||
| My Dentist | Chickasha | OK | — | 100 | 186 | — | 286 | 16 | 6/27/2013 | 1995 | ||||||||||||||||
| N/A - Billboard | Memphis | TN | — | 33 | — | — | 33 | — | 7/31/2013 | 1995 | ||||||||||||||||
F-186
| Initial Costs | Costs Capitalized Subsequent to Acquisition | Gross Amount Carried at December 31, 2014 (1) (2) | ||||||||||||||||||||||||
| Property | City | State | Encumbrances at December 31, 2014 | Land | Buildings, Fixtures and Improvements | Accumulated Depreciation (3) (4) | Date Acquired | Date of Construction | ||||||||||||||||||
| N/A - Billboard | Memphis | TN | — | 63 | — | — | 63 | — | 7/31/2013 | 1995 | ||||||||||||||||
| N/A - Billboard | Memphis | TN | — | 73 | — | — | 73 | — | 7/31/2013 | 1995 | ||||||||||||||||
| N/A - Billboard | Memphis | TN | — | 90 | — | — | 90 | — | 7/31/2013 | 1995 | ||||||||||||||||
| N/A - License Agreement | Winter Springs | FL | — | 734 | — | — | 734 | — | 7/31/2013 | 1995 | ||||||||||||||||
| N/A - Parking Lot | Kingston | PA | — | 29 | — | — | 29 | — | 6/27/2013 | 1995 | ||||||||||||||||
| National Institute of Health | Bethesda | MD | 53,798 | 8,536 | 31,879 | — | 40,415 | 1,972 | 2/7/2014 | 1989 | ||||||||||||||||
| National Tire & Battery | St. Louis | MO | — | 756 | 924 | — | 1,680 | 118 | 10/31/2012 | 1998 | ||||||||||||||||
| National Tire & Battery | Bellevue | TN | 799 | 603 | 1,373 | — | 1,976 | 60 | 2/7/2014 | 1978 | ||||||||||||||||
| Native New Yorker | Glendale | AZ | — | 254 | 420 | — | 674 | 36 | 6/27/2013 | 1998 | ||||||||||||||||
| Natural Grocers | Salem | OR | — | 1,339 | 3,886 | — | 5,225 | 183 | 2/7/2014 | 2013 | ||||||||||||||||
| Nestle Holdings | Breinigsville | PA | — | — | 66,948 | — | 66,948 | 4,594 | 11/5/2013 | 1994 | ||||||||||||||||
| NGL Energy Partners LP | Omaha | NE | — | — | 10,225 | 1,169 | 11,394 | 1,709 | 11/5/2013 | 1980 | ||||||||||||||||
| Nomac Drilling | Houston | TX | — | 369 | 2,669 | — | 3,038 | 67 | 6/12/2014 | 2012 | ||||||||||||||||
| Northern Tool & Equipment | Ocala | FL | 1,650 | 1,693 | 2,727 | — | 4,420 | 128 | 2/7/2014 | 2008 | ||||||||||||||||
| Northrop Grumman | El Segundo | CA | — | 15,935 | 67,908 | — | 83,843 | 1,780 | 6/27/2014 | 1972 | ||||||||||||||||
| NTW | Morrow | GA | — | 397 | 1,586 | — | 1,983 | 234 | 6/5/2012 | 1992 | ||||||||||||||||
| O'Charley's | Dalton | GA | — | 406 | 1,817 | — | 2,223 | 161 | 6/27/2013 | 1993 | ||||||||||||||||
| O'Charley's | Tucker | GA | — | 1,037 | 866 | — | 1,903 | 77 | 6/27/2013 | 1993 | ||||||||||||||||
| Old Country Buffet | Mesa | AZ | — | 191 | 1,007 | — | 1,198 | 62 | 1/8/2014 | 1999 | ||||||||||||||||
| Old Country Buffet | Burbank | CA | — | 246 | 1,309 | — | 1,555 | 76 | 1/8/2014 | 2001 | ||||||||||||||||
| Old Country Buffet | Fresno | CA | — | 326 | 1,306 | — | 1,632 | 77 | 1/8/2014 | 2003 | ||||||||||||||||
| Old Country Buffet | Gilroy | CA | — | 249 | 986 | — | 1,235 | 57 | 1/8/2014 | 2002 | ||||||||||||||||
| Old Country Buffet | Lynwood | CA | — | 245 | 1,308 | — | 1,553 | 76 | 1/8/2014 | 2002 | ||||||||||||||||
| Old Country Buffet | Rancho Cucamonga | CA | — | 230 | 1,208 | — | 1,438 | 75 | 1/8/2014 | 1998 | ||||||||||||||||
| Old Country Buffet | San Luis Obispo | CA | — | 195 | 1,013 | — | 1,208 | 66 | 1/8/2014 | 2000 | ||||||||||||||||
| Old Country Buffet | Vacaville | CA | — | 195 | 1,044 | — | 1,239 | 61 | 1/8/2014 | 2000 | ||||||||||||||||
| Old Country Buffet | Littleton | CO | — | 196 | 1,014 | — | 1,210 | 63 | 1/8/2014 | 1995 | ||||||||||||||||
| Old Country Buffet | Davie | FL | — | 193 | 1,009 | — | 1,202 | 61 | 1/8/2014 | 1989 | ||||||||||||||||
| Old Country Buffet | Coon Rapids | MN | — | 1,611 | 2,188 | — | 3,799 | 115 | 2/7/2014 | 2003 | ||||||||||||||||
F-187
| Initial Costs | Costs Capitalized Subsequent to Acquisition | Gross Amount Carried at December 31, 2014 (1) (2) | ||||||||||||||||||||||||
| Property | City | State | Encumbrances at December 31, 2014 | Land | Buildings, Fixtures and Improvements | Accumulated Depreciation (3) (4) | Date Acquired | Date of Construction | ||||||||||||||||||
| Old Country Buffet | Dickson City | PA | — | 262 | 1,257 | — | 1,519 | 80 | 1/8/2014 | 2004 | ||||||||||||||||
| Old Country Buffet | Downingtown | PA | — | 264 | 1,261 | — | 1,525 | 78 | 1/8/2014 | 1997 | ||||||||||||||||
| Old Country Buffet | Lancaster | PA | — | 225 | 1,202 | — | 1,427 | 77 | 1/8/2014 | 1998 | ||||||||||||||||
| Olive Garden | Edmonton | AB | — | 2,870 | 452 | — | 3,322 | 9 | 7/28/2014 | 1990 | ||||||||||||||||
| Olive Garden | Edmonton | AB | — | 2,946 | 461 | — | 3,407 | 9 | 7/28/2014 | 1990 | ||||||||||||||||
| Olive Garden | Flagstaff | AZ | — | 875 | 455 | — | 1,330 | 8 | 7/28/2014 | 1996 | ||||||||||||||||
| Olive Garden | Altamonte Springs | FL | — | 699 | 4,023 | — | 4,722 | 57 | 7/28/2014 | 2006 | ||||||||||||||||
| Olive Garden | Leesburg | FL | — | 692 | 1,837 | — | 2,529 | 25 | 7/28/2014 | 1990 | ||||||||||||||||
| Olive Garden | Port Charlotte | FL | — | 1,454 | 4,156 | — | 5,610 | 51 | 7/28/2014 | 1990 | ||||||||||||||||
| Olive Garden | Winnipeg | MB | — | 1,640 | 1,444 | — | 3,084 | 20 | 7/28/2014 | 1989 | ||||||||||||||||
| Olive Garden | Salisbury | MD | — | 1,171 | 3,144 | — | 4,315 | 40 | 7/28/2014 | 1995 | ||||||||||||||||
| Olive Garden | Cary | NC | — | 1,545 | 6,603 | — | 8,148 | 79 | 7/28/2014 | 1992 | ||||||||||||||||
| Olive Garden | Oklahoma City | OK | — | 819 | 4,053 | — | 4,872 | 50 | 7/28/2014 | 1991 | ||||||||||||||||
| Olive Garden | Langhorne | PA | — | 970 | 3,717 | — | 4,687 | 46 | 7/28/2014 | 1996 | ||||||||||||||||
| Olive Garden | Pittsburgh | PA | — | 1,560 | 1,422 | — | 2,982 | 24 | 7/28/2014 | 2003 | ||||||||||||||||
| Olive Garden | Houston | TX | — | 973 | 2,902 | — | 3,875 | 37 | 7/28/2014 | 1994 | ||||||||||||||||
| Olive Garden | Chesapeake | VA | — | 1,382 | 2,252 | — | 3,634 | 30 | 7/28/2014 | 1991 | ||||||||||||||||
| Olive Garden | Manassas | VA | — | 1,965 | 2,585 | — | 4,550 | 33 | 7/28/2014 | 1993 | ||||||||||||||||
| Olive Garden | Silverdale | WA | — | 1,752 | 2,015 | — | 3,767 | 27 | 7/28/2014 | 1993 | ||||||||||||||||
| Olive Garden | Morgantown | WV | — | 1,765 | 2,199 | — | 3,964 | 37 | 7/28/2014 | 2006 | ||||||||||||||||
| Omnipoint Communication | Indianapolis | IN | 49,838 | 5,770 | 64,073 | — | 69,843 | 5,116 | 5/9/2013 | 2000 | ||||||||||||||||
| On the Border | Rogers | AR | 950 | 655 | 1,500 | — | 2,155 | 83 | 2/7/2014 | 2002 | ||||||||||||||||
| On the Border | Mesa | AZ | 1,804 | 2,090 | 1,534 | — | 3,624 | 85 | 2/7/2014 | 1998 | ||||||||||||||||
| On the Border | Peoria | AZ | 1,562 | 2,129 | 1,352 | — | 3,481 | 69 | 2/7/2014 | 1998 | ||||||||||||||||
| On the Border | Alpharetta | GA | — | 1,771 | 1,842 | — | 3,613 | 102 | 2/7/2014 | 1997 | ||||||||||||||||
| On the Border | Buford | GA | — | 1,786 | 1,506 | — | 3,292 | 84 | 2/7/2014 | 2001 | ||||||||||||||||
| On the Border | Naperville | IL | — | 2,549 | 1,414 | — | 3,963 | 92 | 2/7/2014 | 1997 | ||||||||||||||||
| On the Border | West Springfield | MA | 2,000 | 413 | 4,173 | — | 4,586 | 218 | 2/7/2014 | 1995 | ||||||||||||||||
| On the Border | Auburn Hills | MI | — | 1,355 | 2,745 | — | 4,100 | 141 | 2/7/2014 | 1999 | ||||||||||||||||
F-188
| Initial Costs | Costs Capitalized Subsequent to Acquisition | Gross Amount Carried at December 31, 2014 (1) (2) | ||||||||||||||||||||||||
| Property | City | State | Encumbrances at December 31, 2014 | Land | Buildings, Fixtures and Improvements | Accumulated Depreciation (3) (4) | Date Acquired | Date of Construction | ||||||||||||||||||
| On the Border | Novi | MI | — | 444 | 3,176 | — | 3,620 | 158 | 2/7/2014 | 1997 | ||||||||||||||||
| On the Border | Kansas City | MO | 1,454 | 1,743 | 1,039 | — | 2,782 | 71 | 2/7/2014 | 1997 | ||||||||||||||||
| On the Border | Lees Summit | MO | 1,200 | 1,647 | 1,008 | — | 2,655 | 67 | 2/7/2014 | 2002 | ||||||||||||||||
| On the Border | Concord Mills | NC | — | 1,903 | 1,456 | — | 3,359 | 90 | 2/7/2014 | 2000 | ||||||||||||||||
| On the Border | Mount Laurel | NJ | 713 | 1,446 | 1,938 | — | 3,384 | 107 | 2/7/2014 | 2004 | ||||||||||||||||
| On the Border | W. Windsor | NJ | 2,432 | 1,489 | 1,703 | — | 3,192 | 124 | 2/7/2014 | 1998 | ||||||||||||||||
| On the Border | Columbus | OH | 1,925 | 1,594 | 1,558 | — | 3,152 | 100 | 2/7/2014 | 1997 | ||||||||||||||||
| On the Border | Oklahoma City | OK | — | 859 | 2,310 | — | 3,169 | 129 | 2/7/2014 | 1996 | ||||||||||||||||
| On the Border | Tulsa | OK | — | 740 | 2,956 | — | 3,696 | 161 | 2/7/2014 | 1995 | ||||||||||||||||
| On the Border | Burleson | TX | — | 891 | 2,844 | — | 3,735 | 153 | 2/7/2014 | 2000 | ||||||||||||||||
| On the Border | College Station | TX | — | 2,218 | 1,471 | — | 3,689 | 81 | 2/7/2014 | 1997 | ||||||||||||||||
| On the Border | Denton | TX | — | 1,419 | 2,012 | — | 3,431 | 111 | 2/7/2014 | 2002 | ||||||||||||||||
| On the Border | Desoto | TX | — | 751 | 3,207 | — | 3,958 | 166 | 2/7/2014 | 1998 | ||||||||||||||||
| On the Border | Ft. Worth | TX | — | 1,222 | 2,991 | — | 4,213 | 156 | 2/7/2014 | 1999 | ||||||||||||||||
| On the Border | Garland | TX | — | 1,065 | 1,692 | — | 2,757 | 91 | 2/7/2014 | 2007 | ||||||||||||||||
| On the Border | Lubbock | TX | — | 375 | 3,679 | — | 4,054 | 185 | 2/7/2014 | 1994 | ||||||||||||||||
| On the Border | Rockwall | TX | — | 693 | 3,244 | — | 3,937 | 158 | 2/7/2014 | 1999 | ||||||||||||||||
| On the Border | Woodbridge | VA | — | 1,799 | 899 | — | 2,698 | 100 | 2/7/2014 | 1998 | ||||||||||||||||
| O'Reilly Auto Parts | Oneonta | AL | — | 81 | 460 | — | 541 | 61 | 8/2/2012 | 2000 | ||||||||||||||||
| O'Reilly Auto Parts | Louisville | KY | — | 573 | 794 | — | 1,367 | 38 | 2/7/2014 | 2011 | ||||||||||||||||
| O'Reilly Auto Parts | Breaux Bridge | LA | — | 139 | 738 | — | 877 | 36 | 2/7/2014 | 2009 | ||||||||||||||||
| O'Reilly Auto Parts | Central | LA | — | 104 | 915 | — | 1,019 | 42 | 2/7/2014 | 2010 | ||||||||||||||||
| O'Reilly Auto Parts | La Place | LA | — | 342 | 819 | — | 1,161 | 39 | 2/7/2014 | 2008 | ||||||||||||||||
| O'Reilly Auto Parts | New Roads | LA | — | 175 | 737 | — | 912 | 36 | 2/7/2014 | 2008 | ||||||||||||||||
| O'Reilly Auto Parts | Ravenna | OH | — | 144 | 1,137 | — | 1,281 | 52 | 2/7/2014 | 2010 | ||||||||||||||||
| O'Reilly Auto Parts | Willard | OH | — | 137 | 877 | — | 1,014 | 39 | 2/7/2014 | 2011 | ||||||||||||||||
| O'Reilly Auto Parts | Highlands | TX | 485 | 281 | 813 | — | 1,094 | 35 | 2/7/2014 | 2010 | ||||||||||||||||
| O'Reilly Auto Parts | Houston | TX | 560 | 340 | 895 | — | 1,235 | 38 | 2/7/2014 | 2010 | ||||||||||||||||
| O'Reilly Auto Parts | San Antonio | TX | 703 | 439 | 1,030 | — | 1,469 | 45 | 2/7/2014 | 2010 | ||||||||||||||||
F-189
| Initial Costs | Costs Capitalized Subsequent to Acquisition | Gross Amount Carried at December 31, 2014 (1) (2) | ||||||||||||||||||||||||
| Property | City | State | Encumbrances at December 31, 2014 | Land | Buildings, Fixtures and Improvements | Accumulated Depreciation (3) (4) | Date Acquired | Date of Construction | ||||||||||||||||||
| O'Reilly Auto Parts | Christiansburg | VA | 646 | 562 | 793 | — | 1,355 | 35 | 2/7/2014 | 2010 | ||||||||||||||||
| O'Reilly Auto Parts | Laramie | WY | — | 144 | 1,297 | — | 1,441 | 161 | 10/12/2012 | 1999 | ||||||||||||||||
| Outback Steakhouse | Fort Smith | AR | — | 841 | 1,996 | — | 2,837 | 111 | 2/7/2014 | 1999 | ||||||||||||||||
| Outback Steakhouse | Centennial | CO | — | 1,378 | 1,397 | — | 2,775 | 79 | 2/7/2014 | 1996 | ||||||||||||||||
| Outback Steakhouse | Jacksonville | FL | — | 770 | 2,261 | — | 3,031 | 112 | 2/7/2014 | 2001 | ||||||||||||||||
| Outback Steakhouse | Sebring | FL | — | 981 | 1,695 | — | 2,676 | 95 | 2/7/2014 | 2001 | ||||||||||||||||
| Outback Steakhouse | Fort Wayne | IN | — | 733 | 984 | — | 1,717 | 92 | 2/7/2014 | 2000 | ||||||||||||||||
| Outback Steakhouse | Lexington | KY | — | 1,077 | 2,139 | — | 3,216 | 115 | 2/7/2014 | 2002 | ||||||||||||||||
| Outback Steakhouse | Baton Rouge | LA | — | 742 | 1,272 | — | 2,014 | 68 | 2/7/2014 | 2001 | ||||||||||||||||
| Outback Steakhouse | Southgate | MI | — | 787 | 2,742 | — | 3,529 | 140 | 2/7/2014 | 1994 | ||||||||||||||||
| Outback Steakhouse | Lees Summit | MO | — | 901 | 620 | — | 1,521 | 38 | 2/7/2014 | 1999 | ||||||||||||||||
| Outback Steakhouse | Garner | NC | — | 1,088 | 1,817 | — | 2,905 | 99 | 2/7/2014 | 2004 | ||||||||||||||||
| Outback Steakhouse | Las Cruces | NM | — | 536 | 1,549 | — | 2,085 | 81 | 2/7/2014 | 2000 | ||||||||||||||||
| Outback Steakhouse | Boardman Township | OH | — | 575 | 2,742 | — | 3,317 | 143 | 2/7/2014 | 1995 | ||||||||||||||||
| Outback Steakhouse | Independence | OH | — | 901 | 2,268 | — | 3,169 | 98 | 2/7/2014 | 2006 | ||||||||||||||||
| Outback Steakhouse | Pittsburgh | PA | — | 1,370 | 932 | — | 2,302 | 74 | 2/7/2014 | 1995 | ||||||||||||||||
| Outback Steakhouse | Conroe | TX | — | 959 | 2,063 | — | 3,022 | 99 | 2/7/2014 | 2001 | ||||||||||||||||
| Outback Steakhouse | Houston | TX | — | 964 | 2,321 | — | 3,285 | 112 | 2/7/2014 | 1998 | ||||||||||||||||
| Outback Steakhouse | McAllen | TX | — | 835 | 443 | — | 1,278 | 24 | 2/7/2014 | 1999 | ||||||||||||||||
| Outback Steakhouse | Colonial Heights | VA | — | 1,297 | 746 | — | 2,043 | 99 | 2/7/2014 | 2000 | ||||||||||||||||
| Outback Steakhouse | Newport News | VA | — | 600 | 1,356 | — | 1,956 | 120 | 2/7/2014 | 1993 | ||||||||||||||||
| Outback Steakhouse | Winchester | VA | — | 704 | 1,310 | — | 2,014 | 128 | 2/7/2014 | 2006 | ||||||||||||||||
| Owens & Minor | Cleveland | OH | — | 755 | 6,077 | — | 6,832 | 96 | 9/30/2014 | 2014 | ||||||||||||||||
| Owens Corning | Newark | OH | — | 725 | 13,013 | — | 13,738 | 518 | 2/7/2014 | 2007 | ||||||||||||||||
| Owens Corning | Wichita Falls | TX | — | 231 | 847 | — | 1,078 | 31 | 6/12/2014 | 1972 | ||||||||||||||||
F-190
| Initial Costs | Costs Capitalized Subsequent to Acquisition | Gross Amount Carried at December 31, 2014 (1) (2) | ||||||||||||||||||||||||
| Property | City | State | Encumbrances at December 31, 2014 | Land | Buildings, Fixtures and Improvements | Accumulated Depreciation (3) (4) | Date Acquired | Date of Construction | ||||||||||||||||||
| Pantry Gas & Convenience | Montgomery | AL | — | 526 | 1,228 | — | 1,754 | 141 | 12/31/2012 | 1998 | ||||||||||||||||
| Pantry Gas & Convenience | Charlotte | NC | — | 1,332 | 1,332 | — | 2,664 | 153 | 12/31/2012 | 2004 | ||||||||||||||||
| Pantry Gas & Convenience | Charlotte | NC | — | 1,667 | 417 | — | 2,084 | 48 | 12/31/2012 | 1982 | ||||||||||||||||
| Pantry Gas & Convenience | Charlotte | NC | — | 1,191 | 1,787 | — | 2,978 | 205 | 12/31/2012 | 1987 | ||||||||||||||||
| Pantry Gas & Convenience | Charlotte | NC | — | 1,070 | 1,308 | — | 2,378 | 150 | 12/31/2012 | 1997 | ||||||||||||||||
| Pantry Gas & Convenience | Conover | NC | — | 1,144 | 936 | — | 2,080 | 107 | 12/31/2012 | 1998 | ||||||||||||||||
| Pantry Gas & Convenience | Cornelius | NC | — | 1,847 | 2,258 | — | 4,105 | 259 | 12/31/2012 | 1999 | ||||||||||||||||
| Pantry Gas & Convenience | Lincolnton | NC | — | 1,766 | 2,159 | — | 3,925 | 248 | 12/31/2012 | 2000 | ||||||||||||||||
| Pantry Gas & Convenience | Matthews | NC | — | 980 | 1,819 | — | 2,799 | 209 | 12/31/2012 | 1987 | ||||||||||||||||
| Pantry Gas & Convenience | Thomasville | NC | — | 1,175 | 1,436 | — | 2,611 | 165 | 12/31/2012 | 2000 | ||||||||||||||||
| Pantry Gas & Convenience | Fort Mill | SC | — | 1,311 | 1,967 | — | 3,278 | 226 | 12/31/2012 | 1988 | ||||||||||||||||
| Pearson Education | Lebanon | IN | 24,632 | 4,535 | 25,685 | — | 30,220 | 1,492 | 2/21/2014 | 1997 | ||||||||||||||||
| Pearson Education | Lawrence | KS | 14,936 | 2,548 | 18,057 | — | 20,605 | 1,056 | 11/5/2013 | 1997 | ||||||||||||||||
| Penske | Bedford | OH | — | 183 | — | — | 183 | — | 6/27/2013 | 1995 | ||||||||||||||||
| Petco | Lake Charles | LA | 2,145 | 690 | 4,072 | ��� | 4,762 | 173 | 2/7/2014 | 2008 | ||||||||||||||||
| Petco | Dardenne Prairie | MO | — | 806 | 3,024 | — | 3,830 | 126 | 2/7/2014 | 2009 | ||||||||||||||||
| PetSmart | Phoenix | AZ | 51,250 | 7,308 | 97,510 | 36 | 104,854 | 3,521 | 2/7/2014 | 1997 | ||||||||||||||||
| PetSmart | Merced | CA | — | 1,729 | 4,194 | — | 5,923 | 179 | 2/7/2014 | 1993 | ||||||||||||||||
| PetSmart | Redding | CA | — | 1,312 | 4,133 | — | 5,445 | 191 | 2/7/2014 | 1989 | ||||||||||||||||
| PetSmart | Westlake Village | CA | — | 3,406 | 5,017 | — | 8,423 | 204 | 2/7/2014 | 1998 | ||||||||||||||||
| PetSmart | Boca Raton | FL | — | 3,514 | 4,912 | — | 8,426 | 215 | 2/7/2014 | 2001 | ||||||||||||||||
| PetSmart | Lake Mary | FL | — | 2,430 | 2,556 | — | 4,986 | 113 | 2/7/2014 | 1997 | ||||||||||||||||
| PetSmart | Plantation | FL | — | 965 | 5,302 | — | 6,267 | 221 | 2/7/2014 | 2001 | ||||||||||||||||
| PetSmart | Tallahassee | FL | — | 1,468 | 1,387 | — | 2,855 | 64 | 2/7/2014 | 1998 | ||||||||||||||||
| PetSmart | Evanston | IL | — | 1,120 | 6,007 | — | 7,127 | 244 | 2/7/2014 | 2001 | ||||||||||||||||
| PetSmart | Braintree | MA | — | 2,805 | 8,398 | — | 11,203 | 332 | 2/7/2014 | 1996 | ||||||||||||||||
| PetSmart | Oxon Hill | MD | — | 1,722 | 4,389 | — | 6,111 | 184 | 2/7/2014 | 1998 | ||||||||||||||||
| PetSmart | Flint | MI | — | 606 | 3,839 | — | 4,445 | 160 | 2/7/2014 | 1996 | ||||||||||||||||
| PetSmart | Parma | OH | — | 1,288 | 3,527 | — | 4,815 | 147 | 2/7/2014 | 1996 | ||||||||||||||||
| PetSmart | Dallas | TX | — | 470 | 6,089 | — | 6,559 | 238 | 2/7/2014 | 1998 | ||||||||||||||||
F-191
| Initial Costs | Costs Capitalized Subsequent to Acquisition | Gross Amount Carried at December 31, 2014 (1) (2) | ||||||||||||||||||||||||
| Property | City | State | Encumbrances at December 31, 2014 | Land | Buildings, Fixtures and Improvements | Accumulated Depreciation (3) (4) | Date Acquired | Date of Construction | ||||||||||||||||||
| PetSmart | Southlake | TX | — | 1,063 | 7,093 | — | 8,156 | 283 | 2/7/2014 | 1998 | ||||||||||||||||
| Physicians Immediate Care | Aurora | IL | — | 1,043 | 1,346 | — | 2,389 | 68 | 2/7/2014 | 2003 | ||||||||||||||||
| Physicians Immediate Care | Glendale Heights | IL | — | 487 | 2,256 | — | 2,743 | 107 | 2/7/2014 | 1997 | ||||||||||||||||
| Physicians Immediate Care | New Lenox | IL | — | 535 | 1,884 | — | 2,419 | 91 | 2/7/2014 | 2011 | ||||||||||||||||
| Physicians Immediate Care | Plainfield | IL | — | 590 | 1,747 | — | 2,337 | 84 | 2/7/2014 | 2011 | ||||||||||||||||
| Physicians Immediate Care | Mishawaka | IN | — | 252 | 1,351 | — | 1,603 | 71 | 2/7/2014 | 2013 | ||||||||||||||||
| Pier 1 Imports | Victoria | TX | — | 457 | 1,767 | — | 2,224 | 85 | 2/7/2014 | 2011 | ||||||||||||||||
| Pilot Flying J | Carnesville | GA | — | 1,867 | 7,466 | — | 9,333 | 1,056 | 1/31/2013 | 2000 | ||||||||||||||||
| Pizza Hut | Lambertville | MI | — | 110 | 6 | — | 116 | — | 7/31/2013 | 1995 | ||||||||||||||||
| Pizza Hut/WingStreet | Mobile | AL | — | 127 | 276 | — | 403 | 24 | 6/27/2013 | 1974 | ||||||||||||||||
| Pizza Hut/WingStreet | Page | AZ | — | 66 | 263 | — | 329 | 20 | 7/31/2013 | 1977 | ||||||||||||||||
| Pizza Hut/WingStreet | Cooper City | FL | — | 320 | 466 | — | 786 | 39 | 6/27/2013 | 1995 | ||||||||||||||||
| Pizza Hut/WingStreet | Marathon | FL | — | 530 | 187 | — | 717 | 16 | 6/27/2013 | 1995 | ||||||||||||||||
| Pizza Hut/WingStreet | Monticello | FL | — | 115 | 195 | — | 310 | 17 | 6/27/2013 | 1987 | ||||||||||||||||
| Pizza Hut/WingStreet | Ashburn | GA | — | 102 | 233 | — | 335 | 20 | 6/27/2013 | 1988 | ||||||||||||||||
| Pizza Hut/WingStreet | Dawson | GA | — | 131 | 274 | — | 405 | 23 | 6/27/2013 | 1987 | ||||||||||||||||
| Pizza Hut/WingStreet | EATONTON | GA | — | 353 | 353 | — | 706 | 27 | 7/31/2013 | 1988 | ||||||||||||||||
| Pizza Hut/WingStreet | GREENSBORO | GA | — | 569 | 465 | — | 1,034 | 36 | 7/31/2013 | 1989 | ||||||||||||||||
| Pizza Hut/WingStreet | JACKSON | GA | — | 673 | 735 | — | 1,408 | 63 | 6/27/2013 | 1987 | ||||||||||||||||
| Pizza Hut/WingStreet | Tucker | GA | — | 192 | 288 | — | 480 | 22 | 7/31/2013 | 1974 | ||||||||||||||||
| Pizza Hut/WingStreet | Aurora | IL | — | 281 | 522 | — | 803 | 40 | 7/31/2013 | 1983 | ||||||||||||||||
| Pizza Hut/WingStreet | Downers Grove | IL | — | 504 | 616 | — | 1,120 | 47 | 7/31/2013 | 1985 | ||||||||||||||||
| Pizza Hut/WingStreet | Louisville | KY | — | 539 | 499 | — | 1,038 | 43 | 6/27/2013 | 1975 | ||||||||||||||||
| Pizza Hut/WingStreet | Lafayette | LA | — | 68 | 271 | — | 339 | 23 | 6/27/2013 | 1990 | ||||||||||||||||
| Pizza Hut/WingStreet | Salisbury | MD | — | 245 | 734 | — | 979 | 56 | 7/31/2013 | 1983 | ||||||||||||||||
| Pizza Hut/WingStreet | Adrian | MI | — | 265 | — | — | 265 | — | 6/27/2013 | 1995 | ||||||||||||||||
| Pizza Hut/WingStreet | Ann Arbor | MI | — | 119 | 367 | — | 486 | 31 | 6/27/2013 | 1991 | ||||||||||||||||
| Pizza Hut/WingStreet | Dearborn | MI | — | 284 | 528 | — | 812 | 41 | 7/31/2013 | 1977 | ||||||||||||||||
| Pizza Hut/WingStreet | Detroit | MI | — | 501 | 612 | — | 1,113 | 47 | 7/31/2013 | 1984 | ||||||||||||||||
| Pizza Hut/WingStreet | Detroit | MI | — | 105 | 421 | — | 526 | 32 | 7/31/2013 | 1986 | ||||||||||||||||
F-192
| Initial Costs | Costs Capitalized Subsequent to Acquisition | Gross Amount Carried at December 31, 2014 (1) (2) | ||||||||||||||||||||||||
| Property | City | State | Encumbrances at December 31, 2014 | Land | Buildings, Fixtures and Improvements | Accumulated Depreciation (3) (4) | Date Acquired | Date of Construction | ||||||||||||||||||
| Pizza Hut/WingStreet | Monroe | MI | — | 220 | — | — | 220 | — | 6/27/2013 | 1995 | ||||||||||||||||
| Pizza Hut/WingStreet | Bozeman | MT | — | 150 | 343 | — | 493 | 29 | 6/27/2013 | 1995 | ||||||||||||||||
| Pizza Hut/WingStreet | Glasgow | MT | — | 120 | 217 | — | 337 | 18 | 6/27/2013 | 1995 | ||||||||||||||||
| Pizza Hut/WingStreet | Livingston | MT | — | 130 | 245 | — | 375 | 21 | 6/27/2013 | 1995 | ||||||||||||||||
| Pizza Hut/WingStreet | East Syracuse | NY | — | 137 | 185 | — | 322 | 16 | 6/27/2013 | 1978 | ||||||||||||||||
| Pizza Hut/WingStreet | Elmira | NY | — | 199 | 370 | — | 569 | 28 | 7/31/2013 | 1975 | ||||||||||||||||
| Pizza Hut/WingStreet | Nedrow | NY | — | 55 | 80 | — | 135 | 7 | 6/27/2013 | 1979 | ||||||||||||||||
| Pizza Hut/WingStreet | Rochester | NY | — | 62 | 62 | — | 124 | 5 | 7/31/2013 | 1989 | ||||||||||||||||
| Pizza Hut/WingStreet | Wellsville | NY | — | 123 | 368 | — | 491 | 28 | 7/31/2013 | 1978 | ||||||||||||||||
| Pizza Hut/WingStreet | Bowling Green | OH | — | 141 | 262 | — | 403 | 20 | 7/31/2013 | 1979 | ||||||||||||||||
| Pizza Hut/WingStreet | Cleveland | OH | — | 87 | 175 | — | 262 | 15 | 6/27/2013 | 1995 | ||||||||||||||||
| Pizza Hut/WingStreet | Defiance | OH | — | 114 | 197 | — | 311 | 17 | 6/27/2013 | 1977 | ||||||||||||||||
| Pizza Hut/WingStreet | Delaware | OH | — | 270 | 721 | — | 991 | 62 | 6/27/2013 | 1975 | ||||||||||||||||
| Pizza Hut/WingStreet | Marietta | OH | — | 104 | 193 | — | 297 | 15 | 7/31/2013 | 1986 | ||||||||||||||||
| Pizza Hut/WingStreet | Middleburg Heights | OH | — | 128 | 156 | — | 284 | 12 | 7/31/2013 | 1985 | ||||||||||||||||
| Pizza Hut/WingStreet | North Olmsted | OH | — | 122 | 153 | — | 275 | 13 | 6/27/2013 | 1977 | ||||||||||||||||
| Pizza Hut/WingStreet | Norwalk | OH | — | 77 | 115 | — | 192 | 9 | 7/31/2013 | 1977 | ||||||||||||||||
| Pizza Hut/WingStreet | Sandusky | OH | — | 140 | 171 | — | 311 | 13 | 7/31/2013 | 1982 | ||||||||||||||||
| Pizza Hut/WingStreet | Strongsville | OH | — | 74 | 108 | — | 182 | 9 | 6/27/2013 | 1977 | ||||||||||||||||
| Pizza Hut/WingStreet | Toledo | OH | — | 58 | 173 | — | 231 | 15 | 6/27/2013 | 1978 | ||||||||||||||||
| Pizza Hut/WingStreet | Oklahoma City | OK | — | 268 | 268 | — | 536 | 21 | 7/31/2013 | 1984 | ||||||||||||||||
| Pizza Hut/WingStreet | Shamokin | PA | — | 54 | 217 | — | 271 | 17 | 7/31/2013 | 1995 | ||||||||||||||||
| Pizza Hut/WingStreet | Batesburg | SC | — | 261 | 484 | — | 745 | 37 | 7/31/2013 | 1987 | ||||||||||||||||
| Pizza Hut/WingStreet | BISHOPVILLE | SC | — | 365 | 365 | — | 730 | 28 | 7/31/2013 | 1987 | ||||||||||||||||
| Pizza Hut/WingStreet | Cheraw | SC | — | 415 | 507 | — | 922 | 39 | 7/31/2013 | 1984 | ||||||||||||||||
| Pizza Hut/WingStreet | Columbia | SC | — | 881 | 588 | — | 1,469 | 45 | 7/31/2013 | 1977 | ||||||||||||||||
| Pizza Hut/WingStreet | Edgefield | SC | — | 221 | 410 | — | 631 | 32 | 7/31/2013 | 1986 | ||||||||||||||||
| Pizza Hut/WingStreet | Laurens | SC | — | 454 | 371 | — | 825 | 29 | 7/31/2013 | 1989 | ||||||||||||||||
| Pizza Hut/WingStreet | Pageland | SC | — | 344 | 420 | — | 764 | 32 | 7/31/2013 | 1999 | ||||||||||||||||
| Pizza Hut/WingStreet | Saluda | SC | — | 346 | 346 | — | 692 | 27 | 7/31/2013 | 1995 | ||||||||||||||||
F-193
| Initial Costs | Costs Capitalized Subsequent to Acquisition | Gross Amount Carried at December 31, 2014 (1) (2) | ||||||||||||||||||||||||
| Property | City | State | Encumbrances at December 31, 2014 | Land | Buildings, Fixtures and Improvements | Accumulated Depreciation (3) (4) | Date Acquired | Date of Construction | ||||||||||||||||||
| Pizza Hut/WingStreet | Santee | SC | — | 371 | 248 | — | 619 | 19 | 7/31/2013 | 1972 | ||||||||||||||||
| Pizza Hut/WingStreet | St. George | SC | — | 367 | 245 | — | 612 | 19 | 7/31/2013 | 1980 | ||||||||||||||||
| Pizza Hut/WingStreet | West Columbia | SC | — | 507 | 415 | — | 922 | 32 | 7/31/2013 | 1980 | ||||||||||||||||
| Pizza Hut/WingStreet | Box Elder | SD | — | 68 | 217 | — | 285 | 19 | 6/27/2013 | 1985 | ||||||||||||||||
| Pizza Hut/WingStreet | Knoxville | TN | — | 300 | 546 | — | 846 | 46 | 6/27/2013 | 1995 | ||||||||||||||||
| Pizza Hut/WingStreet | Red Bank | TN | — | 215 | 323 | — | 538 | 25 | 7/31/2013 | 1975 | ||||||||||||||||
| Pizza Hut/WingStreet | Abilene | TX | — | 549 | 449 | — | 998 | 35 | 7/31/2013 | 1980 | ||||||||||||||||
| Pizza Hut/WingStreet | Abilene | TX | — | 397 | 170 | — | 567 | 13 | 7/31/2013 | 1976 | ||||||||||||||||
| Pizza Hut/WingStreet | Amarillo | TX | — | 339 | 1,016 | — | 1,355 | 78 | 7/31/2013 | 1976 | ||||||||||||||||
| Pizza Hut/WingStreet | Amarillo | TX | — | 254 | 1,015 | — | 1,269 | 78 | 7/31/2013 | 1980 | ||||||||||||||||
| Pizza Hut/WingStreet | Ballinger | TX | — | 34 | 109 | — | 143 | 9 | 6/27/2013 | 1978 | ||||||||||||||||
| Pizza Hut/WingStreet | Coleman | TX | — | 69 | 391 | — | 460 | 30 | 7/31/2013 | 1975 | ||||||||||||||||
| Pizza Hut/WingStreet | Crystal City | TX | — | 148 | 453 | — | 601 | 39 | 6/27/2013 | 1981 | ||||||||||||||||
| Pizza Hut/WingStreet | Fort Stockton | TX | — | 252 | 1,007 | — | 1,259 | 77 | 7/31/2013 | 2008 | ||||||||||||||||
| Pizza Hut/WingStreet | Midland | TX | — | 414 | 506 | — | 920 | 39 | 7/31/2013 | 1975 | ||||||||||||||||
| Pizza Hut/WingStreet | Midland | TX | — | 506 | 619 | — | 1,125 | 48 | 7/31/2013 | 1978 | ||||||||||||||||
| Pizza Hut/WingStreet | Monahans | TX | — | 361 | 671 | — | 1,032 | 52 | 7/31/2013 | 1979 | ||||||||||||||||
| Pizza Hut/WingStreet | Odessa | TX | — | 456 | 847 | — | 1,303 | 65 | 7/31/2013 | 1976 | ||||||||||||||||
| Pizza Hut/WingStreet | Odessa | TX | — | 588 | 882 | — | 1,470 | 68 | 7/31/2013 | 1972 | ||||||||||||||||
| Pizza Hut/WingStreet | Odessa | TX | — | 572 | 572 | — | 1,144 | 44 | 7/31/2013 | 1976 | ||||||||||||||||
| Pizza Hut/WingStreet | Odessa | TX | — | 627 | 766 | — | 1,393 | 59 | 7/31/2013 | 1979 | ||||||||||||||||
| Pizza Hut/WingStreet | Odessa | TX | — | 457 | 685 | — | 1,142 | 53 | 7/31/2013 | 1976 | ||||||||||||||||
| Pizza Hut/WingStreet | Pecos | TX | — | 387 | 719 | — | 1,106 | 55 | 7/31/2013 | 1974 | ||||||||||||||||
| Pizza Hut/WingStreet | San Angelo | TX | — | 214 | 641 | — | 855 | 49 | 7/31/2013 | 1977 | ||||||||||||||||
| Pizza Hut/WingStreet | San Angelo | TX | — | 268 | 624 | — | 892 | 48 | 7/31/2013 | 1980 | ||||||||||||||||
| Pizza Hut/WingStreet | San Angelo | TX | — | 237 | 552 | — | 789 | 42 | 7/31/2013 | 1975 | ||||||||||||||||
| Pizza Hut/WingStreet | Seminole | TX | — | 53 | 301 | — | 354 | 23 | 7/31/2013 | 1977 | ||||||||||||||||
| Pizza Hut/WingStreet | Stamford | TX | — | 38 | 115 | — | 153 | 9 | 7/31/2013 | 1995 | ||||||||||||||||
| Pizza Hut/WingStreet | Sweetwater | TX | — | 77 | 435 | — | 512 | 33 | 7/31/2013 | 1995 | ||||||||||||||||
| Pizza Hut/WingStreet | Cedar City | UT | — | 52 | 361 | — | 413 | 31 | 6/27/2013 | 1978 | ||||||||||||||||
F-194
| Initial Costs | Costs Capitalized Subsequent to Acquisition | Gross Amount Carried at December 31, 2014 (1) (2) | ||||||||||||||||||||||||
| Property | City | State | Encumbrances at December 31, 2014 | Land | Buildings, Fixtures and Improvements | Accumulated Depreciation (3) (4) | Date Acquired | Date of Construction | ||||||||||||||||||
| Pizza Hut/WingStreet | Kanab | UT | — | 52 | 210 | — | 262 | 16 | 7/31/2013 | 1989 | ||||||||||||||||
| Pizza Hut/WingStreet | Ashland | VA | — | 589 | 1,093 | — | 1,682 | 84 | 7/31/2013 | 1989 | ||||||||||||||||
| Pizza Hut/WingStreet | Bedford | VA | — | 548 | 670 | — | 1,218 | 52 | 7/31/2013 | 1977 | ||||||||||||||||
| Pizza Hut/WingStreet | Chester | VA | — | 473 | 1,104 | — | 1,577 | 85 | 7/31/2013 | 1983 | ||||||||||||||||
| Pizza Hut/WingStreet | Christiansburg | VA | — | 494 | 918 | — | 1,412 | 71 | 7/31/2013 | 1982 | ||||||||||||||||
| Pizza Hut/WingStreet | Clifton Forge | VA | — | 287 | 861 | — | 1,148 | 66 | 7/31/2013 | 1978 | ||||||||||||||||
| Pizza Hut/WingStreet | Colonial Heights | VA | — | 311 | 311 | — | 622 | 24 | 7/31/2013 | 1991 | ||||||||||||||||
| Pizza Hut/WingStreet | Front Royal | VA | — | 191 | 287 | — | 478 | 22 | 7/31/2013 | 1973 | ||||||||||||||||
| Pizza Hut/WingStreet | Hampton | VA | — | 641 | 345 | — | 986 | 27 | 7/31/2013 | 1977 | ||||||||||||||||
| Pizza Hut/WingStreet | Hopewell | VA | — | 707 | 864 | — | 1,571 | 66 | 7/31/2013 | 1985 | ||||||||||||||||
| Pizza Hut/WingStreet | Newport News | VA | — | 394 | 591 | — | 985 | 45 | 7/31/2013 | 1969 | ||||||||||||||||
| Pizza Hut/WingStreet | Newport News | VA | — | 394 | 591 | — | 985 | 45 | 7/31/2013 | 1970 | ||||||||||||||||
| Pizza Hut/WingStreet | Petersburg | VA | — | 378 | 701 | — | 1,079 | 54 | 7/31/2013 | 1979 | ||||||||||||||||
| Pizza Hut/WingStreet | Richmond | VA | — | 666 | 814 | — | 1,480 | 63 | 7/31/2013 | 1978 | ||||||||||||||||
| Pizza Hut/WingStreet | Richmond | VA | — | 311 | 311 | — | 622 | 24 | 7/31/2013 | 1991 | ||||||||||||||||
| Pizza Hut/WingStreet | Abbotsford | WI | — | 159 | 195 | — | 354 | 15 | 7/31/2013 | 1980 | ||||||||||||||||
| Pizza Hut/WingStreet | Antigo | WI | — | 45 | 252 | — | 297 | 19 | 7/31/2013 | 1997 | ||||||||||||||||
| Pizza Hut/WingStreet | Clintonville | WI | — | 208 | 69 | — | 277 | 5 | 7/31/2013 | 1978 | ||||||||||||||||
| Pizza Hut/WingStreet | Eagle River | WI | — | 28 | 159 | — | 187 | 12 | 7/31/2013 | 1991 | ||||||||||||||||
| Pizza Hut/WingStreet | Hayward | WI | — | 51 | 205 | — | 256 | 16 | 7/31/2013 | 1993 | ||||||||||||||||
| Pizza Hut/WingStreet | Merrill | WI | — | 83 | 531 | — | 614 | 26 | 7/31/2013 | 1980 | ||||||||||||||||
| Pizza Hut/WingStreet | Neillsville | WI | — | 35 | 106 | — | 141 | 8 | 7/31/2013 | 1995 | ||||||||||||||||
| Pizza Hut/WingStreet | Plover | WI | — | 85 | 199 | — | 284 | 15 | 7/31/2013 | 1995 | ||||||||||||||||
| Pizza Hut/WingStreet | Schofield | WI | — | 106 | 196 | — | 302 | 15 | 7/31/2013 | 1987 | ||||||||||||||||
| Pizza Hut/WingStreet | Stevens Point | WI | — | 130 | 390 | — | 520 | 30 | 7/31/2013 | 1995 | ||||||||||||||||
| Pizza Hut/WingStreet | Tomahawk | WI | — | 35 | 81 | — | 116 | 6 | 7/31/2013 | 1986 | ||||||||||||||||
| Pizza Hut/WingStreet | Waupaca | WI | — | 61 | 91 | — | 152 | 7 | 7/31/2013 | 1991 | ||||||||||||||||
| Pizza Hut/WingStreet | Beckley | WV | — | 160 | 131 | — | 291 | 10 | 7/31/2013 | 1977 | ||||||||||||||||
| Pizza Hut/WingStreet | Cross Lanes | WV | — | 122 | 149 | — | 271 | 11 | 7/31/2013 | 1977 | ||||||||||||||||
| Pizza Hut/WingStreet | Huntington | WV | — | 190 | 4 | — | 194 | — | 7/31/2013 | 1995 | ||||||||||||||||
F-195
| Initial Costs | Costs Capitalized Subsequent to Acquisition | Gross Amount Carried at December 31, 2014 (1) (2) | ||||||||||||||||||||||||
| Property | City | State | Encumbrances at December 31, 2014 | Land | Buildings, Fixtures and Improvements | Accumulated Depreciation (3) (4) | Date Acquired | Date of Construction | ||||||||||||||||||
| Pizza Hut/WingStreet | Hurricane | WV | — | 126 | 188 | — | 314 | 14 | 7/31/2013 | 1978 | ||||||||||||||||
| Pizza Hut/WingStreet | Ronceverte | WV | — | 66 | 162 | — | 228 | 14 | 6/27/2013 | 1978 | ||||||||||||||||
| PLS Check Cashers | Mesa | AZ | — | 187 | 759 | — | 946 | 47 | 2/7/2014 | 2006 | ||||||||||||||||
| PLS Check Cashers | Phoenix | AZ | — | 288 | 677 | — | 965 | 39 | 2/7/2014 | 2006 | ||||||||||||||||
| PLS Check Cashers | Tucson | AZ | — | 264 | 800 | — | 1,064 | 51 | 2/7/2014 | 2005 | ||||||||||||||||
| PLS Check Cashers | Compton | CA | — | 475 | 107 | — | 582 | 16 | 2/7/2014 | 2005 | ||||||||||||||||
| PLS Check Cashers | Calumet Park | IL | — | 306 | 1,003 | — | 1,309 | 61 | 2/7/2014 | 2005 | ||||||||||||||||
| PLS Check Cashers | Chicago | IL | — | 451 | 127 | — | 578 | 19 | 2/7/2014 | 2001 | ||||||||||||||||
| PLS Check Cashers | Dallas | TX | — | 197 | 1,356 | — | 1,553 | 66 | 2/7/2014 | 1983 | ||||||||||||||||
| PLS Check Cashers | Dallas | TX | — | 169 | 1,180 | — | 1,349 | 58 | 2/7/2014 | 2003 | ||||||||||||||||
| PLS Check Cashers | Fort Worth | TX | — | 187 | 1,473 | — | 1,660 | 69 | 2/7/2014 | 2003 | ||||||||||||||||
| PLS Check Cashers | Grand Prairie | TX | — | 385 | 1,056 | — | 1,441 | 51 | 2/7/2014 | 1971 | ||||||||||||||||
| PLS Check Cashers | Houston | TX | — | 158 | 1,293 | — | 1,451 | 57 | 2/7/2014 | 2005 | ||||||||||||||||
| PLS Check Cashers | Mesquite | TX | — | 261 | 1,388 | — | 1,649 | 73 | 2/7/2014 | 2006 | ||||||||||||||||
| PLS Check Cashers | Kenosha | WI | — | 190 | 693 | — | 883 | 37 | 2/7/2014 | 2005 | ||||||||||||||||
| PNC Bank | Woodbury | NJ | — | 465 | 2,633 | — | 3,098 | 144 | 1/8/2014 | 1971 | ||||||||||||||||
| PNC Bank | Cincinnati | OH | — | 195 | 538 | — | 733 | 30 | 1/8/2014 | 1979 | ||||||||||||||||
| Pollo Tropical | Davie | FL | — | 280 | 1,490 | — | 1,770 | 120 | 6/27/2013 | 1995 | ||||||||||||||||
| Pollo Tropical | Fort Lauderdale | FL | — | 190 | 1,242 | — | 1,432 | 100 | 6/27/2013 | 1995 | ||||||||||||||||
| Pollo Tropical | Lake Worth | FL | — | 280 | 1,182 | — | 1,462 | 96 | 6/27/2013 | 1995 | ||||||||||||||||
| Ponderosa | Scottsburg | IN | — | 430 | 141 | — | 571 | 12 | 6/27/2013 | 1985 | ||||||||||||||||
| Ponderosa | Massena | NY | — | 190 | 570 | — | 760 | 49 | 7/31/2013 | 1995 | ||||||||||||||||
| Ponderosa | Indiana | PA | — | 676 | 1,255 | — | 1,931 | 109 | 7/31/2013 | 2000 | ||||||||||||||||
F-196
| Initial Costs | Costs Capitalized Subsequent to Acquisition | Gross Amount Carried at December 31, 2014 (1) (2) | ||||||||||||||||||||||||
| Property | City | State | Encumbrances at December 31, 2014 | Land | Buildings, Fixtures and Improvements | Accumulated Depreciation (3) (4) | Date Acquired | Date of Construction | ||||||||||||||||||
| Popeyes | Brandon | FL | — | 776 | 961 | — | 1,737 | 82 | 6/27/2013 | 1978 | ||||||||||||||||
| Popeyes | Carol City | FL | — | 423 | 1,090 | — | 1,513 | 58 | 1/8/2014 | 1979 | ||||||||||||||||
| Popeyes | Jacksonville | FL | — | 781 | 955 | — | 1,736 | 73 | 7/31/2013 | 1955 | ||||||||||||||||
| Popeyes | Lakeland | FL | — | 830 | 830 | — | 1,660 | 64 | 7/31/2013 | 1999 | ||||||||||||||||
| Popeyes | Miami | FL | — | 220 | 330 | — | 550 | 25 | 7/31/2013 | 1962 | ||||||||||||||||
| Popeyes | Orlando | FL | — | 782 | 955 | — | 1,737 | 74 | 7/31/2013 | 2004 | ||||||||||||||||
| Popeyes | Pensacola | FL | — | 301 | 673 | — | 974 | 36 | 1/8/2014 | 2001 | ||||||||||||||||
| Popeyes | Starke | FL | — | 380 | — | — | 380 | — | 6/27/2013 | 1995 | ||||||||||||||||
| Popeyes | Tampa | FL | — | 216 | 508 | — | 724 | 27 | 1/8/2014 | 1981 | ||||||||||||||||
| Popeyes | Tampa | FL | — | 673 | 1,065 | — | 1,738 | 91 | 6/27/2013 | 1976 | ||||||||||||||||
| Popeyes | Winter Haven | FL | — | 484 | 1,001 | — | 1,485 | 86 | 6/27/2013 | 1976 | ||||||||||||||||
| Popeyes | Thomasville | GA | — | 110 | 705 | — | 815 | 57 | 6/27/2013 | 1995 | ||||||||||||||||
| Popeyes | Valdosta | GA | — | 240 | 599 | — | 839 | 48 | 6/27/2013 | 1995 | ||||||||||||||||
| Popeyes | Baton Rouge | LA | — | 323 | 394 | — | 717 | 30 | 7/31/2013 | 1999 | ||||||||||||||||
| Popeyes | Bayou Vista | LA | — | 375 | 709 | — | 1,084 | 61 | 6/27/2013 | 1985 | ||||||||||||||||
| Popeyes | Eunice | LA | — | 382 | 891 | — | 1,273 | 69 | 7/31/2013 | 1986 | ||||||||||||||||
| Popeyes | Franklin | LA | — | 283 | 538 | — | 821 | 46 | 6/27/2013 | 1985 | ||||||||||||||||
| Popeyes | Lafayette | LA | — | 434 | 899 | — | 1,333 | 77 | 6/27/2013 | 1993 | ||||||||||||||||
| Popeyes | Lafayette | LA | — | 473 | 901 | — | 1,374 | 77 | 6/27/2013 | 1996 | ||||||||||||||||
| Popeyes | Marksville | LA | — | 487 | 1,129 | — | 1,616 | 96 | 6/27/2013 | 1987 | ||||||||||||||||
| Popeyes | Ferguson | MO | — | 128 | 383 | — | 511 | 29 | 7/31/2013 | 1984 | ||||||||||||||||
| Popeyes | St. Louis | MO | — | 248 | 460 | — | 708 | 39 | 6/27/2013 | 1959 | ||||||||||||||||
| Popeyes | St. Louis | MO | — | 288 | 431 | — | 719 | 33 | 7/31/2013 | 1978 | ||||||||||||||||
| Popeyes | Greenville | MS | — | 513 | 977 | — | 1,490 | 83 | 6/27/2013 | 1984 | ||||||||||||||||
| Popeyes | Grenada | MS | — | 77 | 458 | — | 535 | 24 | 1/8/2014 | 2007 | ||||||||||||||||
| Popeyes | Omaha | NE | — | 343 | 515 | — | 858 | 40 | 7/31/2013 | 1996 | ||||||||||||||||
| Popeyes | Omaha | NE | — | 264 | 615 | — | 879 | 47 | 7/31/2013 | 1985 | ||||||||||||||||
| Popeyes | Austin | TX | — | 1,216 | 533 | — | 1,749 | 46 | 6/27/2013 | 1996 | ||||||||||||||||
F-197
| Initial Costs | Costs Capitalized Subsequent to Acquisition | Gross Amount Carried at December 31, 2014 (1) (2) | ||||||||||||||||||||||||
| Property | City | State | Encumbrances at December 31, 2014 | Land | Buildings, Fixtures and Improvements | Accumulated Depreciation (3) (4) | Date Acquired | Date of Construction | ||||||||||||||||||
| Popeyes | Channelview | TX | — | 220 | 401 | — | 621 | 32 | 6/27/2013 | 1995 | ||||||||||||||||
| Popeyes | Houston | TX | — | 300 | 244 | — | 544 | 20 | 6/27/2013 | 1995 | ||||||||||||||||
| Popeyes | Houston | TX | — | 190 | 452 | — | 642 | 37 | 6/27/2013 | 1995 | ||||||||||||||||
| Popeyes | Houston | TX | — | 295 | 241 | — | 536 | 19 | 7/31/2013 | 1976 | ||||||||||||||||
| Popeyes | Houston | TX | — | 111 | 166 | — | 277 | 13 | 7/31/2013 | 1976 | ||||||||||||||||
| Popeyes | Houston | TX | — | 278 | 227 | — | 505 | 17 | 7/31/2013 | 1978 | ||||||||||||||||
| Popeyes | Nederland | TX | — | 445 | 668 | — | 1,113 | 51 | 7/31/2013 | 1988 | ||||||||||||||||
| Popeyes | Orange | TX | — | 456 | 847 | — | 1,303 | 65 | 7/31/2013 | 1984 | ||||||||||||||||
| Popeyes | Port Arthur | TX | — | 408 | 589 | — | 997 | 50 | 6/27/2013 | 1984 | ||||||||||||||||
| Popeyes | Newport News | VA | — | 381 | 217 | — | 598 | 19 | 6/27/2013 | 2002 | ||||||||||||||||
| Popeyes | Portsmouth | VA | — | 369 | 230 | — | 599 | 20 | 6/27/2013 | 2002 | ||||||||||||||||
| Price Rite | Rochester | NY | 3,080 | 569 | 3,594 | — | 4,163 | 526 | 9/27/2012 | 1965 | ||||||||||||||||
| Procter & Gamble | Fort Wayne | IN | — | — | 26,409 | — | 26,409 | 1,812 | 11/5/2013 | 1994 | ||||||||||||||||
| Publix | Birmingham | AL | — | 934 | 6,377 | — | 7,311 | 300 | 2/7/2014 | 2004 | ||||||||||||||||
| Pulte Mortgage | Englewood | CO | — | 2,563 | 22,026 | — | 24,589 | 1,246 | 11/5/2013 | 2009 | ||||||||||||||||
| Qdoba Mexican Grill | Flint | MI | — | 110 | 990 | — | 1,100 | 125 | 3/29/2013 | 2006 | ||||||||||||||||
| Qdoba Mexican Grill | Grand Blanc | MI | — | 165 | 935 | — | 1,100 | 118 | 3/29/2013 | 2006 | ||||||||||||||||
| Quaker Steak & Lube | Fredericksburg | VA | — | 446 | 2,071 | — | 2,517 | 87 | 4/23/2014 | 1999 | ||||||||||||||||
| Quincy's Family Steakhouse | Monroe | NC | — | 560 | 458 | — | 1,018 | 40 | 7/31/2013 | 1978 | ||||||||||||||||
| RaceTrac | Bessemer | AL | — | 761 | 2,624 | — | 3,385 | 126 | 2/7/2014 | 2003 | ||||||||||||||||
| RaceTrac | Mobile | AL | — | 580 | 1,317 | — | 1,897 | 63 | 2/7/2014 | 1998 | ||||||||||||||||
| RaceTrac | Bellview | FL | — | 684 | 3,831 | — | 4,515 | 190 | 2/7/2014 | 2007 | ||||||||||||||||
| RaceTrac | Jacksonville | FL | — | 1,065 | 2,863 | — | 3,928 | 154 | 2/7/2014 | 2011 | ||||||||||||||||
| RaceTrac | Leesburg | FL | — | 1,188 | 2,711 | — | 3,899 | 147 | 2/7/2014 | 2007 | ||||||||||||||||
| RaceTrac | Atlanta | GA | — | 1,025 | 1,511 | — | 2,536 | 77 | 2/7/2014 | 2004 | ||||||||||||||||
| RaceTrac | Denton | TX | — | 1,030 | 2,645 | — | 3,675 | 121 | 2/7/2014 | 2003 | ||||||||||||||||
| RaceTrac | Houston | TX | — | 1,209 | 1,204 | — | 2,413 | 56 | 2/7/2014 | 1995 | ||||||||||||||||
| RaceTrac | Houston | TX | — | 1,203 | 1,509 | — | 2,712 | 71 | 2/7/2014 | 1997 | ||||||||||||||||
F-198
| Initial Costs | Costs Capitalized Subsequent to Acquisition | Gross Amount Carried at December 31, 2014 (1) (2) | ||||||||||||||||||||||||
| Property | City | State | Encumbrances at December 31, 2014 | Land | Buildings, Fixtures and Improvements | Accumulated Depreciation (3) (4) | Date Acquired | Date of Construction | ||||||||||||||||||
| Rally's | Indianapolis | IN | — | 210 | 1,514 | — | 1,724 | 122 | 6/27/2013 | 1995 | ||||||||||||||||
| Rally's | Indianapolis | IN | — | 1,168 | — | — | 1,168 | — | 7/31/2013 | 2005 | ||||||||||||||||
| Rally's | Indianapolis | IN | — | 1,168 | — | — | 1,168 | — | 7/31/2013 | 2005 | ||||||||||||||||
| Rally's | Kokomo | IN | — | 290 | 548 | — | 838 | 44 | 6/27/2013 | 1995 | ||||||||||||||||
| Rally's | Muncie | IN | — | 310 | 1,196 | — | 1,506 | 97 | 6/27/2013 | 1995 | ||||||||||||||||
| Rally's | Harvey | LA | — | 420 | 870 | — | 1,290 | 70 | 6/27/2013 | 1995 | ||||||||||||||||
| Rally's | New Orleans | LA | — | 450 | 1,691 | — | 2,141 | 137 | 6/27/2013 | 1995 | ||||||||||||||||
| Rally's | New Orleans | LA | — | 220 | 1,018 | — | 1,238 | 82 | 6/27/2013 | 1995 | ||||||||||||||||
| Rally's | Hamtramck | MI | — | 230 | 1,020 | — | 1,250 | 82 | 6/27/2013 | 1995 | ||||||||||||||||
| Rancho Grande Grill | Andalusia | AL | — | 94 | 251 | — | 345 | 22 | 6/27/2013 | 2004 | ||||||||||||||||
| Razoo's Cajun Cafe | Lewisville | TX | — | 780 | 1,503 | — | 2,283 | 126 | 6/27/2013 | 1995 | ||||||||||||||||
| RealTime Logic | Colorado Springs | CO | — | 1,100 | 8,932 | — | 10,032 | 742 | 5/9/2014 | 2005 | ||||||||||||||||
| Reckitt Benckiser | Chester | NJ | 5,500 | 886 | 7,972 | — | 8,858 | 914 | 8/16/2012 | 2006 | ||||||||||||||||
| Red Lobster | Edmonton | AB | — | 2,360 | 555 | — | 2,915 | 16 | 7/28/2014 | 1990 | ||||||||||||||||
| Red Lobster | Edmonton | AB | — | 2,585 | 450 | — | 3,035 | 16 | 7/28/2014 | 1990 | ||||||||||||||||
| Red Lobster | Auburn | AL | — | 850 | 1,032 | — | 1,882 | 20 | 7/28/2014 | 1991 | ||||||||||||||||
| Red Lobster | Birmingham | AL | — | — | 741 | — | 741 | 19 | 7/28/2014 | 1972 | ||||||||||||||||
| Red Lobster | Decatur | AL | — | 1,100 | 686 | — | 1,786 | 19 | 7/28/2014 | 1993 | ||||||||||||||||
| Red Lobster | Dothan | AL | — | 726 | 1,244 | — | 1,970 | 22 | 7/28/2014 | 1979 | ||||||||||||||||
| Red Lobster | Florence | AL | — | 974 | 908 | — | 1,882 | 22 | 7/28/2014 | 1990 | ||||||||||||||||
| Red Lobster | Gadsden | AL | — | 1,135 | 1,764 | — | 2,899 | 24 | 7/28/2014 | 1981 | ||||||||||||||||
| Red Lobster | Huntsville | AL | — | 1,098 | 2,330 | — | 3,428 | 33 | 7/28/2014 | 1975 | ||||||||||||||||
| Red Lobster | Mobile | AL | — | 1,150 | 830 | — | 1,980 | 13 | 7/28/2014 | 1971 | ||||||||||||||||
| Red Lobster | Montgomery | AL | — | 1,034 | 1,413 | — | 2,447 | 25 | 7/28/2014 | 1983 | ||||||||||||||||
| Red Lobster | Tuscaloosa | AL | — | 685 | 1,125 | — | 1,810 | 21 | 7/28/2014 | 1980 | ||||||||||||||||
| Red Lobster | Vestavia Hills | AL | — | 1,257 | 1,417 | — | 2,674 | 21 | 7/28/2014 | 1972 | ||||||||||||||||
| Red Lobster | Fayetteville | AR | — | 1,135 | 1,248 | — | 2,383 | 19 | 7/28/2014 | 1984 | ||||||||||||||||
| Red Lobster | Fort Smith | AR | — | 1,643 | 1,228 | — | 2,871 | 23 | 7/28/2014 | 1980 | ||||||||||||||||
F-199
| Initial Costs | Costs Capitalized Subsequent to Acquisition | Gross Amount Carried at December 31, 2014 (1) (2) | ||||||||||||||||||||||||
| Property | City | State | Encumbrances at December 31, 2014 | Land | Buildings, Fixtures and Improvements | Accumulated Depreciation (3) (4) | Date Acquired | Date of Construction | ||||||||||||||||||
| Red Lobster | Hot Springs | AR | — | 928 | 1,593 | — | 2,521 | 31 | 7/28/2014 | 1994 | ||||||||||||||||
| Red Lobster | Jonesboro | AR | — | 1,518 | 1,834 | — | 3,352 | 36 | 7/28/2014 | 2011 | ||||||||||||||||
| Red Lobster | Little Rock | AR | — | 1,942 | 725 | — | 2,667 | 16 | 7/28/2014 | 1977 | ||||||||||||||||
| Red Lobster | North Little Rock | AR | — | 999 | 1,906 | — | 2,905 | 30 | 7/28/2014 | 1981 | ||||||||||||||||
| Red Lobster | Pine Bluff | AR | — | 226 | 1,194 | — | 1,420 | 26 | 7/28/2014 | 1995 | ||||||||||||||||
| Red Lobster | Rogers | AR | — | 1,398 | 2,069 | — | 3,467 | 36 | 7/28/2014 | 2008 | ||||||||||||||||
| Red Lobster | Chandler | AZ | — | — | 252 | — | 252 | 19 | 7/28/2014 | 2000 | ||||||||||||||||
| Red Lobster | Flagstaff | AZ | — | 891 | 514 | — | 1,405 | 19 | 7/28/2014 | 1996 | ||||||||||||||||
| Red Lobster | Gilbert | AZ | — | — | 460 | — | 460 | 23 | 7/28/2014 | 2007 | ||||||||||||||||
| Red Lobster | Mesa | AZ | — | 525 | 977 | — | 1,502 | 22 | 7/28/2014 | 1993 | ||||||||||||||||
| Red Lobster | Mesa | AZ | — | 792 | 502 | — | 1,294 | 14 | 7/28/2014 | 1982 | ||||||||||||||||
| Red Lobster | Peoria | AZ | — | 1,385 | 445 | — | 1,830 | 13 | 7/28/2014 | 1982 | ||||||||||||||||
| Red Lobster | Phoenix | AZ | — | 1,038 | 350 | — | 1,388 | 11 | 7/28/2014 | 1982 | ||||||||||||||||
| Red Lobster | Surprise | AZ | — | — | 565 | — | 565 | 26 | 7/28/2014 | 2003 | ||||||||||||||||
| Red Lobster | Tucson | AZ | — | — | 676 | — | 676 | 26 | 7/28/2014 | 2009 | ||||||||||||||||
| Red Lobster | Yuma | AZ | — | 499 | 916 | — | 1,415 | 23 | 7/28/2014 | 1992 | ||||||||||||||||
| Red Lobster | Bakersfield | CA | — | — | 731 | — | 731 | 30 | 7/28/2014 | 2003 | ||||||||||||||||
| Red Lobster | Chico | CA | — | 717 | 1,146 | — | 1,863 | 25 | 7/28/2014 | 1994 | ||||||||||||||||
| Red Lobster | Chula Vista | CA | — | — | 1,671 | — | 1,671 | 38 | 7/28/2014 | 1988 | ||||||||||||||||
| Red Lobster | Citrus Heights | CA | — | 649 | 2,160 | — | 2,809 | 30 | 7/30/2014 | 1982 | ||||||||||||||||
| Red Lobster | Fremont | CA | — | 1,638 | 564 | — | 2,202 | 13 | 7/28/2014 | 1984 | ||||||||||||||||
| Red Lobster | Fresno | CA | — | 863 | 1,995 | — | 2,858 | 33 | 7/28/2014 | 1992 | ||||||||||||||||
| Red Lobster | Inglewood | CA | — | — | 2,211 | — | 2,211 | 57 | 7/28/2014 | 2007 | ||||||||||||||||
| Red Lobster | Modesto | CA | — | 1,079 | 1,770 | — | 2,849 | 26 | 7/30/2014 | 1982 | ||||||||||||||||
| Red Lobster | Oceanside | CA | — | — | 1,529 | — | 1,529 | 37 | 7/28/2014 | 2010 | ||||||||||||||||
| Red Lobster | Ontario | CA | — | 1,304 | 2,238 | — | 3,542 | 35 | 7/28/2014 | 2003 | ||||||||||||||||
| Red Lobster | Palm Desert | CA | — | 1,132 | 1,321 | — | 2,453 | 28 | 7/28/2014 | 2012 | ||||||||||||||||
| Red Lobster | Palmdale | CA | — | 900 | 1,871 | — | 2,771 | 27 | 7/28/2014 | 1992 | ||||||||||||||||
F-200
| Initial Costs | Costs Capitalized Subsequent to Acquisition | Gross Amount Carried at December 31, 2014 (1) (2) | ||||||||||||||||||||||||
| Property | City | State | Encumbrances at December 31, 2014 | Land | Buildings, Fixtures and Improvements | Accumulated Depreciation (3) (4) | Date Acquired | Date of Construction | ||||||||||||||||||
| Red Lobster | Riverside | CA | — | 914 | 2,459 | — | 3,373 | 35 | 7/28/2014 | 1988 | ||||||||||||||||
| Red Lobster | Sacramento | CA | — | 1,772 | 1,215 | — | 2,987 | 19 | 7/28/2014 | 1983 | ||||||||||||||||
| Red Lobster | San Bernardino | CA | — | 838 | 1,870 | — | 2,708 | 31 | 7/28/2014 | 1988 | ||||||||||||||||
| Red Lobster | San Bruno | CA | — | — | 1,611 | — | 1,611 | 51 | 7/28/2014 | 1992 | ||||||||||||||||
| Red Lobster | San Diego | CA | — | — | 1,113 | — | 1,113 | 54 | 7/28/2014 | 1988 | ||||||||||||||||
| Red Lobster | San Jose | CA | — | 2,258 | 1,056 | — | 3,314 | 20 | 7/28/2014 | 1986 | ||||||||||||||||
| Red Lobster | Stockton | CA | — | 219 | 2,362 | — | 2,581 | 33 | 7/28/2014 | 1983 | ||||||||||||||||
| Red Lobster | Torrance | CA | — | 1,850 | 1,579 | — | 3,429 | 25 | 7/28/2014 | 1988 | ||||||||||||||||
| Red Lobster | Valencia | CA | — | — | 841 | — | 841 | 42 | 7/28/2014 | 1988 | ||||||||||||||||
| Red Lobster | Victorville | CA | — | 1,061 | 1,995 | — | 3,056 | 30 | 7/28/2014 | 1992 | ||||||||||||||||
| Red Lobster | Visalia | CA | — | 1,063 | 1,296 | — | 2,359 | 25 | 7/28/2014 | 1994 | ||||||||||||||||
| Red Lobster | Colorado Springs | CO | — | — | 1,512 | — | 1,512 | 36 | 7/28/2014 | 2004 | ||||||||||||||||
| Red Lobster | Denver | CO | — | 721 | 2,088 | — | 2,809 | 35 | 7/30/2014 | 2008 | ||||||||||||||||
| Red Lobster | Fort Collins | CO | — | 828 | 1,360 | — | 2,188 | 25 | 7/28/2014 | 1983 | ||||||||||||||||
| Red Lobster | Greeley | CO | — | 1,094 | 1,119 | — | 2,213 | 21 | 7/28/2014 | 1990 | ||||||||||||||||
| Red Lobster | Lakewood | CO | — | 1,221 | 1,416 | — | 2,637 | 26 | 7/30/2014 | 1983 | ||||||||||||||||
| Red Lobster | Littleton | CO | — | 1,441 | 1,521 | — | 2,962 | 22 | 7/30/2014 | 1975 | ||||||||||||||||
| Red Lobster | Longmont | CO | — | 810 | 1,311 | — | 2,121 | 26 | 7/28/2014 | 2000 | ||||||||||||||||
| Red Lobster | Northglenn | CO | — | 1,059 | 2,314 | — | 3,373 | 33 | 7/28/2014 | 1982 | ||||||||||||||||
| Red Lobster | Pueblo | CO | — | 707 | 2,156 | — | 2,863 | 34 | 7/28/2014 | 1990 | ||||||||||||||||
| Red Lobster | Wheat Ridge | CO | — | 1,064 | 1,790 | — | 2,854 | 25 | 7/28/2014 | 1974 | ||||||||||||||||
| Red Lobster | Bridgeport | CT | — | — | 323 | — | 323 | 19 | 7/28/2014 | 1996 | ||||||||||||||||
| Red Lobster | Danbury | CT | — | — | 159 | — | 159 | 15 | 7/28/2014 | 1996 | ||||||||||||||||
| Red Lobster | Wethersfield | CT | — | 1,043 | 1,797 | — | 2,840 | 29 | 7/28/2014 | 1992 | ||||||||||||||||
| Red Lobster | Dover | DE | — | 667 | 1,841 | — | 2,508 | 31 | 7/28/2014 | 1991 | ||||||||||||||||
| Red Lobster | Newark | DE | — | — | 1,515 | — | 1,515 | 46 | 7/28/2014 | 2006 | ||||||||||||||||
| Red Lobster | Talleyville | DE | — | 1,201 | 1,877 | — | 3,078 | 32 | 7/28/2014 | 1991 | ||||||||||||||||
| Red Lobster | Altamonte Springs | FL | — | 1,212 | 1,674 | — | 2,886 | 28 | 7/28/2014 | 1986 | ||||||||||||||||
F-201
| Initial Costs | Costs Capitalized Subsequent to Acquisition | Gross Amount Carried at December 31, 2014 (1) (2) | ||||||||||||||||||||||||
| Property | City | State | Encumbrances at December 31, 2014 | Land | Buildings, Fixtures and Improvements | Accumulated Depreciation (3) (4) | Date Acquired | Date of Construction | ||||||||||||||||||
| Red Lobster | Boynton Beach | FL | — | — | 1,631 | — | 1,631 | 44 | 7/28/2014 | 2008 | ||||||||||||||||
| Red Lobster | Brandon | FL | — | 1,361 | 3,603 | — | 4,964 | 49 | 7/28/2014 | 1987 | ||||||||||||||||
| Red Lobster | Clearwater | FL | — | 1,239 | 1,619 | — | 2,858 | 25 | 7/28/2014 | 1982 | ||||||||||||||||
| Red Lobster | Clermont | FL | — | 929 | 1,305 | — | 2,234 | 28 | 7/28/2014 | 2008 | ||||||||||||||||
| Red Lobster | Coral Springs | FL | — | 1,696 | 1,622 | — | 3,318 | 27 | 7/28/2014 | 1982 | ||||||||||||||||
| Red Lobster | Daytona | FL | — | 732 | 1,668 | — | 2,400 | 24 | 7/28/2014 | 1974 | ||||||||||||||||
| Red Lobster | Fort Lauderdale | FL | — | 2,091 | 1,042 | — | 3,133 | 17 | 7/28/2014 | 1971 | ||||||||||||||||
| Red Lobster | Fort Myers | FL | — | 1,062 | 2,217 | — | 3,279 | 29 | 7/28/2014 | 1973 | ||||||||||||||||
| Red Lobster | Fort Pierce | FL | — | 618 | 1,491 | — | 2,109 | 29 | 7/28/2014 | 1995 | ||||||||||||||||
| Red Lobster | Gainesville | FL | — | 1,236 | 1,880 | — | 3,116 | 25 | 7/28/2014 | 1974 | ||||||||||||||||
| Red Lobster | Hialeah | FL | — | 2,706 | 375 | — | 3,081 | 11 | 7/28/2014 | 1977 | ||||||||||||||||
| Red Lobster | Hollywood | FL | — | — | 2,282 | — | 2,282 | 63 | 7/28/2014 | 2003 | ||||||||||||||||
| Red Lobster | Jacksonville | FL | — | 761 | 1,565 | — | 2,326 | 27 | 7/28/2014 | 1983 | ||||||||||||||||
| Red Lobster | Jacksonville | FL | — | 1,336 | 1,434 | — | 2,770 | 29 | 7/28/2014 | 2008 | ||||||||||||||||
| Red Lobster | Jensen Beach | FL | — | 1,740 | 923 | — | 2,663 | 21 | 7/28/2014 | 1989 | ||||||||||||||||
| Red Lobster | Kissimmee | FL | — | — | 1,364 | — | 1,364 | 47 | 7/28/2014 | 2002 | ||||||||||||||||
| Red Lobster | Kissimmee | FL | — | 1,006 | 1,573 | — | 2,579 | 24 | 7/28/2014 | 1987 | ||||||||||||||||
| Red Lobster | Kissimmee | FL | — | 696 | 2,092 | — | 2,788 | 30 | 7/28/2014 | 1973 | ||||||||||||||||
| Red Lobster | Lake Worth | FL | — | 714 | 1,952 | — | 2,666 | 31 | 7/28/2014 | 1982 | ||||||||||||||||
| Red Lobster | Lakeland | FL | — | 1,200 | 2,823 | — | 4,023 | 35 | 7/28/2014 | 1968 | ||||||||||||||||
| Red Lobster | Leesburg | FL | — | 721 | 1,262 | — | 1,983 | 25 | 7/28/2014 | 1990 | ||||||||||||||||
| Red Lobster | Melbourne | FL | — | 1,049 | 2,346 | — | 3,395 | 34 | 7/28/2014 | 1982 | ||||||||||||||||
| Red Lobster | Merritt Island | FL | — | 747 | 1,926 | — | 2,673 | 27 | 7/28/2014 | 1973 | ||||||||||||||||
| Red Lobster | Miami | FL | — | — | 1,062 | — | 1,062 | 43 | 7/28/2014 | 2003 | ||||||||||||||||
| Red Lobster | Miami | FL | — | 3,093 | 365 | — | 3,458 | 14 | 7/28/2014 | 1985 | ||||||||||||||||
F-202
| Initial Costs | Costs Capitalized Subsequent to Acquisition | Gross Amount Carried at December 31, 2014 (1) (2) | ||||||||||||||||||||||||
| Property | City | State | Encumbrances at December 31, 2014 | Land | Buildings, Fixtures and Improvements | Accumulated Depreciation (3) (4) | Date Acquired | Date of Construction | ||||||||||||||||||
| Red Lobster | Ocala | FL | — | 860 | 2,480 | — | 3,340 | 35 | 7/28/2014 | 1982 | ||||||||||||||||
| Red Lobster | Orange Park | FL | — | 982 | 2,033 | — | 3,015 | 31 | 7/30/2014 | 1980 | ||||||||||||||||
| Red Lobster | Orlando | FL | — | — | 1,188 | — | 1,188 | 45 | 7/28/2014 | 1989 | ||||||||||||||||
| Red Lobster | Orlando | FL | — | 644 | 1,695 | — | 2,339 | 24 | 7/28/2014 | 1970 | ||||||||||||||||
| Red Lobster | Orlando | FL | — | 1,728 | 1,899 | — | 3,627 | 27 | 7/28/2014 | 1974 | ||||||||||||||||
| Red Lobster | Orlando | FL | — | 979 | 2,039 | — | 3,018 | 35 | 7/28/2014 | 2001 | ||||||||||||||||
| Red Lobster | Orlando | FL | — | 3,189 | 670 | — | 3,859 | 16 | 7/28/2014 | 1985 | ||||||||||||||||
| Red Lobster | Orlando | FL | — | 1,373 | 1,571 | — | 2,944 | 25 | 7/30/2014 | 1980 | ||||||||||||||||
| Red Lobster | Panama City | FL | — | — | 1,515 | — | 1,515 | 40 | 7/28/2014 | 1976 | ||||||||||||||||
| Red Lobster | Pembroke Pines | FL | — | 479 | 3,126 | — | 3,605 | 46 | 7/28/2014 | 1987 | ||||||||||||||||
| Red Lobster | Pensacola | FL | — | 588 | 2,507 | — | 3,095 | 32 | 7/28/2014 | 1971 | ||||||||||||||||
| Red Lobster | Plantation | FL | — | 1,975 | 1,733 | — | 3,708 | 30 | 7/28/2014 | 1989 | ||||||||||||||||
| Red Lobster | Port Charlotte | FL | — | 1,476 | 1,516 | — | 2,992 | 28 | 7/28/2014 | 1990 | ||||||||||||||||
| Red Lobster | Sanford | FL | — | 1,682 | 1,252 | — | 2,934 | 18 | 7/28/2014 | 1973 | ||||||||||||||||
| Red Lobster | Sebring | FL | — | 1,003 | 1,487 | — | 2,490 | 26 | 7/28/2014 | 1992 | ||||||||||||||||
| Red Lobster | Spring Hill | FL | — | 863 | 2,219 | — | 3,082 | 35 | 7/28/2014 | 1994 | ||||||||||||||||
| Red Lobster | Tampa | FL | — | 1,399 | 1,023 | — | 2,422 | 23 | 7/28/2014 | 2002 | ||||||||||||||||
| Red Lobster | Tampa | FL | — | 1,399 | 2,465 | — | 3,864 | 35 | 7/28/2014 | 1981 | ||||||||||||||||
| Red Lobster | West Palm Beach | FL | — | 992 | 2,390 | — | 3,382 | 33 | 7/28/2014 | 1971 | ||||||||||||||||
| Red Lobster | Winter Haven | FL | — | 1,055 | 2,217 | — | 3,272 | 29 | 7/28/2014 | 1972 | ||||||||||||||||
| Red Lobster | Athens | GA | — | 669 | 2,027 | — | 2,696 | 27 | 7/28/2014 | 1971 | ||||||||||||||||
| Red Lobster | Atlanta | GA | — | 963 | 4,346 | — | 5,309 | 55 | 7/28/2014 | 1975 | ||||||||||||||||
| Red Lobster | Augusta | GA | — | 877 | 1,301 | — | 2,178 | 20 | 7/28/2014 | 1971 | ||||||||||||||||
| Red Lobster | Augusta | GA | — | 857 | 1,985 | — | 2,842 | 31 | 7/30/2014 | 1982 | ||||||||||||||||
| Red Lobster | Austell | GA | — | — | 1,092 | — | 1,092 | 32 | 7/28/2014 | 2001 | ||||||||||||||||
| Red Lobster | Buford | GA | — | 1,315 | 2,638 | — | 3,953 | 42 | 7/28/2014 | 2000 | ||||||||||||||||
| Red Lobster | Canton | GA | — | 596 | 1,647 | — | 2,243 | 31 | 7/30/2014 | 2000 | ||||||||||||||||
| Red Lobster | Cartersville | GA | — | 594 | 1,386 | — | 1,980 | 26 | 7/28/2014 | 1996 | ||||||||||||||||
| Red Lobster | Columbus | GA | — | 956 | 1,957 | — | 2,913 | 34 | 7/28/2014 | 2005 | ||||||||||||||||
F-203
| Initial Costs | Costs Capitalized Subsequent to Acquisition | Gross Amount Carried at December 31, 2014 (1) (2) | ||||||||||||||||||||||||
| Property | City | State | Encumbrances at December 31, 2014 | Land | Buildings, Fixtures and Improvements | Accumulated Depreciation (3) (4) | Date Acquired | Date of Construction | ||||||||||||||||||
| Red Lobster | Conyers | GA | — | 549 | 3,144 | — | 3,693 | 48 | 7/28/2014 | 2000 | ||||||||||||||||
| Red Lobster | Dalton | GA | — | 775 | 2,045 | — | 2,820 | 32 | 7/28/2014 | 1995 | ||||||||||||||||
| Red Lobster | Decatur | GA | — | 1,102 | 1,873 | — | 2,975 | 27 | 7/28/2014 | 1973 | ||||||||||||||||
| Red Lobster | Douglasville | GA | — | 1,356 | 1,161 | — | 2,517 | 23 | 7/28/2014 | 1991 | ||||||||||||||||
| Red Lobster | Dublin | GA | — | 379 | 1,315 | — | 1,694 | 26 | 7/28/2014 | 1993 | ||||||||||||||||
| Red Lobster | Duluth | GA | — | 970 | 2,693 | — | 3,663 | 39 | 7/28/2014 | 1984 | ||||||||||||||||
| Red Lobster | Gainesville | GA | — | 989 | 1,561 | — | 2,550 | 25 | 7/28/2014 | 1992 | ||||||||||||||||
| Red Lobster | Jonesboro | GA | — | 1,049 | 1,678 | — | 2,727 | 24 | 7/28/2014 | 1972 | ||||||||||||||||
| Red Lobster | Kennesaw | GA | — | 1,382 | 1,802 | — | 3,184 | 29 | 7/28/2014 | 1987 | ||||||||||||||||
| Red Lobster | Macon | GA | — | 662 | 1,908 | — | 2,570 | 25 | 7/28/2014 | 1972 | ||||||||||||||||
| Red Lobster | McDonough | GA | — | 792 | 2,365 | — | 3,157 | 39 | 7/28/2014 | 2003 | ||||||||||||||||
| Red Lobster | Newnan | GA | — | 1,063 | 1,547 | — | 2,610 | 29 | 7/28/2014 | 1999 | ||||||||||||||||
| Red Lobster | Perry | GA | — | 351 | 1,839 | — | 2,190 | 32 | 7/28/2014 | 1996 | ||||||||||||||||
| Red Lobster | Rome | GA | — | 961 | 911 | — | 1,872 | 18 | 7/28/2014 | 1979 | ||||||||||||||||
| Red Lobster | Roswell | GA | — | 2,358 | 354 | — | 2,712 | 11 | 7/28/2014 | 1981 | ||||||||||||||||
| Red Lobster | Savannah | GA | — | 475 | 2,236 | — | 2,711 | 31 | 7/28/2014 | 1971 | ||||||||||||||||
| Red Lobster | Smyrna | GA | — | 1,090 | 1,677 | — | 2,767 | 27 | 7/28/2014 | 1983 | ||||||||||||||||
| Red Lobster | Snellville | GA | — | 887 | 2,223 | — | 3,110 | 35 | 7/28/2014 | 1992 | ||||||||||||||||
| Red Lobster | Tucker | GA | — | — | 1,718 | — | 1,718 | 45 | 7/28/2014 | 1973 | ||||||||||||||||
| Red Lobster | Valdosta | GA | — | 758 | 1,358 | — | 2,116 | 26 | 7/28/2014 | 1991 | ||||||||||||||||
| Red Lobster | Ames | IA | — | 789 | 1,133 | — | 1,922 | 25 | 7/28/2014 | 1995 | ||||||||||||||||
| Red Lobster | Cedar Rapids | IA | — | — | 495 | — | 495 | 27 | 7/28/2014 | 1981 | ||||||||||||||||
| Red Lobster | Davenport | IA | — | 619 | 2,896 | — | 3,515 | 40 | 7/28/2014 | 1975 | ||||||||||||||||
| Red Lobster | Waterloo | IA | — | 708 | 1,723 | — | 2,431 | 27 | 7/28/2014 | 1979 | ||||||||||||||||
| Red Lobster | West Des Moines | IA | — | 1,033 | 2,358 | — | 3,391 | 34 | 7/28/2014 | 1975 | ||||||||||||||||
| Red Lobster | Boise | ID | — | — | 714 | — | 714 | 28 | 7/28/2014 | 1988 | ||||||||||||||||
| Red Lobster | Coeur D'Alene | ID | — | 1,173 | 1,464 | — | 2,637 | 28 | 7/28/2014 | 1996 | ||||||||||||||||
| Red Lobster | Pocatello | ID | — | — | 773 | — | 773 | 44 | 7/28/2014 | 1994 | ||||||||||||||||
| Red Lobster | Alton | IL | — | 1,251 | 1,854 | — | 3,105 | �� | 29 | 7/28/2014 | 1983 | |||||||||||||||
F-204
| Initial Costs | Costs Capitalized Subsequent to Acquisition | Gross Amount Carried at December 31, 2014 (1) (2) | ||||||||||||||||||||||||
| Property | City | State | Encumbrances at December 31, 2014 | Land | Buildings, Fixtures and Improvements | Accumulated Depreciation (3) (4) | Date Acquired | Date of Construction | ||||||||||||||||||
| Red Lobster | Aurora | IL | — | 1,598 | 782 | — | 2,380 | 15 | 7/28/2014 | 1979 | ||||||||||||||||
| Red Lobster | Bloomingdale | IL | — | 1,165 | 1,309 | — | 2,474 | 22 | 7/28/2014 | 1981 | ||||||||||||||||
| Red Lobster | Champaign | IL | — | 673 | 2,647 | — | 3,320 | 37 | 7/28/2014 | 1975 | ||||||||||||||||
| Red Lobster | Chicago | IL | — | 1,064 | 2,422 | — | 3,486 | 34 | 7/28/2014 | 1980 | ||||||||||||||||
| Red Lobster | Danville | IL | — | 253 | 1,580 | — | 1,833 | 30 | 7/28/2014 | 1991 | ||||||||||||||||
| Red Lobster | Downers Grove | IL | — | 1,694 | 1,854 | — | 3,548 | 31 | 7/30/2014 | 1990 | ||||||||||||||||
| Red Lobster | Fairview Heights | IL | — | — | 1,806 | — | 1,806 | 85 | 7/28/2014 | 1972 | ||||||||||||||||
| Red Lobster | Forsyth | IL | — | — | 1,083 | — | 1,083 | 34 | 7/28/2014 | 1975 | ||||||||||||||||
| Red Lobster | Gurnee | IL | — | 1,735 | 2,286 | — | 4,021 | 33 | 7/28/2014 | 1980 | ||||||||||||||||
| Red Lobster | Joliet | IL | — | 850 | 2,438 | — | 3,288 | 38 | 7/28/2014 | 1991 | ||||||||||||||||
| Red Lobster | Marion | IL | — | 399 | 2,399 | — | 2,798 | 39 | 7/28/2014 | 1992 | ||||||||||||||||
| Red Lobster | Matteson | IL | — | 962 | 2,212 | — | 3,174 | 31 | 7/28/2014 | 1976 | ||||||||||||||||
| Red Lobster | Norridge | IL | — | — | 929 | — | 929 | 48 | 7/28/2014 | 1979 | ||||||||||||||||
| Red Lobster | Oak Lawn | IL | — | 1,825 | 2,316 | — | 4,141 | 32 | 7/28/2014 | 1975 | ||||||||||||||||
| Red Lobster | Orland Park | IL | — | 1,046 | 2,489 | — | 3,535 | 36 | 7/28/2014 | 1980 | ||||||||||||||||
| Red Lobster | Peru | IL | — | 339 | 1,169 | — | 1,508 | 24 | 7/28/2014 | 1995 | ||||||||||||||||
| Red Lobster | Rockford | IL | — | 1,104 | 1,901 | — | 3,005 | 29 | 7/30/2014 | 1976 | ||||||||||||||||
| Red Lobster | Schaumburg | IL | — | — | 665 | — | 665 | 24 | 7/28/2014 | 1976 | ||||||||||||||||
| Red Lobster | Springfield | IL | — | 1,205 | 1,253 | — | 2,458 | 22 | 7/28/2014 | 1977 | ||||||||||||||||
| Red Lobster | West Dundee | IL | — | 197 | 2,195 | — | 2,392 | 32 | 7/28/2014 | 1982 | ||||||||||||||||
| Red Lobster | Anderson | IN | — | 813 | 1,272 | — | 2,085 | 22 | 7/28/2014 | 1982 | ||||||||||||||||
| Red Lobster | Avon | IN | — | — | 864 | — | 864 | 35 | 7/28/2014 | 2001 | ||||||||||||||||
| Red Lobster | Columbus | IN | — | 615 | 1,435 | — | 2,050 | 27 | 7/28/2014 | 1991 | ||||||||||||||||
| Red Lobster | Elkhart | IN | — | 616 | 1,657 | — | 2,273 | 31 | 9/19/2014 | 1993 | ||||||||||||||||
| Red Lobster | Evansville | IN | — | 587 | 3,357 | — | 3,944 | 45 | 7/28/2014 | 1972 | ||||||||||||||||
| Red Lobster | Fort Wayne | IN | — | 567 | 2,985 | — | 3,552 | 40 | 7/28/2014 | 1973 | ||||||||||||||||
| Red Lobster | Indianapolis | IN | — | 1,152 | 1,813 | — | 2,965 | 26 | 7/28/2014 | 1973 | ||||||||||||||||
| Red Lobster | Kokomo | IN | — | 394 | 1,835 | — | 2,229 | 28 | 7/28/2014 | 1980 | ||||||||||||||||
| Red Lobster | Lafayette | IN | — | 335 | 2,484 | — | 2,819 | 35 | 7/28/2014 | 1975 | ||||||||||||||||
F-205
| Initial Costs | Costs Capitalized Subsequent to Acquisition | Gross Amount Carried at December 31, 2014 (1) (2) | ||||||||||||||||||||||||
| Property | City | State | Encumbrances at December 31, 2014 | Land | Buildings, Fixtures and Improvements | Accumulated Depreciation (3) (4) | Date Acquired | Date of Construction | ||||||||||||||||||
| Red Lobster | Merrillville | IN | — | 568 | 3,197 | — | 3,765 | 43 | 7/28/2014 | 1979 | ||||||||||||||||
| Red Lobster | Michigan City | IN | — | 330 | 2,233 | — | 2,563 | 35 | 7/28/2014 | 1992 | ||||||||||||||||
| Red Lobster | Mishawaka | IN | — | 593 | 2,205 | — | 2,798 | 32 | 7/28/2014 | 1974 | ||||||||||||||||
| Red Lobster | Muncie | IN | — | 627 | 1,427 | — | 2,054 | 19 | 7/28/2014 | 1975 | ||||||||||||||||
| Red Lobster | Richmond | IN | — | 371 | 1,416 | — | 1,787 | 28 | 7/28/2014 | 1996 | ||||||||||||||||
| Red Lobster | Terre Haute | IN | — | 1,066 | 2,640 | — | 3,706 | 36 | 7/28/2014 | 1972 | ||||||||||||||||
| Red Lobster | Olathe | KS | — | 1,266 | 920 | — | 2,186 | 24 | 7/28/2014 | 1996 | ||||||||||||||||
| Red Lobster | Topeka | KS | — | 754 | 2,211 | — | 2,965 | 31 | 7/28/2014 | 1972 | ||||||||||||||||
| Red Lobster | Wichita | KS | — | 726 | 1,677 | — | 2,403 | 29 | 7/28/2014 | 1986 | ||||||||||||||||
| Red Lobster | Wichita | KS | — | 1,113 | 1,916 | — | 3,029 | 31 | 7/28/2014 | 1982 | ||||||||||||||||
| Red Lobster | Elizabethtown | KY | — | 866 | 401 | — | 1,267 | 18 | 7/28/2014 | 2003 | ||||||||||||||||
| Red Lobster | Florence | KY | — | 601 | 2,811 | — | 3,412 | 37 | 7/28/2014 | 1978 | ||||||||||||||||
| Red Lobster | Lexington | KY | — | — | 1,094 | — | 1,094 | 34 | 7/28/2014 | 2011 | ||||||||||||||||
| Red Lobster | Lexington | KY | — | 1,237 | 1,897 | — | 3,134 | 28 | 7/30/2014 | 1976 | ||||||||||||||||
| Red Lobster | Louisville | KY | — | 893 | 1,350 | — | 2,243 | 26 | 7/28/2014 | 1991 | ||||||||||||||||
| Red Lobster | Owensboro | KY | — | 815 | 1,485 | — | 2,300 | 26 | 7/28/2014 | 1982 | ||||||||||||||||
| Red Lobster | Paducah | KY | — | 864 | 1,770 | — | 2,634 | 31 | 7/30/2014 | 1990 | ||||||||||||||||
| Red Lobster | Richmond | KY | — | 968 | 880 | — | 1,848 | 21 | 7/28/2014 | 1993 | ||||||||||||||||
| Red Lobster | St. Matthews | KY | — | 1,640 | 1,841 | — | 3,481 | 27 | 7/28/2014 | 1972 | ||||||||||||||||
| Red Lobster | Baton Rouge | LA | — | — | 1,535 | — | 1,535 | 42 | 7/28/2014 | 2011 | ||||||||||||||||
| Red Lobster | Bossier City | LA | — | 600 | 2,053 | — | 2,653 | 35 | 7/28/2014 | 1993 | ||||||||||||||||
| Red Lobster | Monroe | LA | — | 455 | 2,022 | — | 2,477 | 34 | 7/28/2014 | 1991 | ||||||||||||||||
| Red Lobster | Winnipeg | MB | — | 1,664 | 489 | — | 2,153 | 17 | 7/28/2014 | 1989 | ||||||||||||||||
| Red Lobster | Annapolis | MD | — | — | 644 | — | 644 | 20 | 7/28/2014 | 1985 | ||||||||||||||||
| Red Lobster | Columbia | MD | — | 1,623 | 1,161 | — | 2,784 | 25 | 7/28/2014 | 1995 | ||||||||||||||||
| Red Lobster | Frederick | MD | — | — | 319 | — | 319 | 21 | 7/28/2014 | 1997 | ||||||||||||||||
| Red Lobster | Gaithersburg | MD | — | 1,378 | 1,653 | — | 3,031 | 25 | 7/28/2014 | 1977 | ||||||||||||||||
| Red Lobster | Hagerstown | MD | — | 1,044 | 1,755 | — | 2,799 | 30 | 7/28/2014 | 1992 | ||||||||||||||||
| Red Lobster | Hanover | MD | — | 1,399 | 1,904 | — | 3,303 | 36 | 7/28/2014 | 2011 | ||||||||||||||||
F-206
| Initial Costs | Costs Capitalized Subsequent to Acquisition | Gross Amount Carried at December 31, 2014 (1) (2) | ||||||||||||||||||||||||
| Property | City | State | Encumbrances at December 31, 2014 | Land | Buildings, Fixtures and Improvements | Accumulated Depreciation (3) (4) | Date Acquired | Date of Construction | ||||||||||||||||||
| Red Lobster | Lanham | MD | — | — | 455 | — | 455 | 22 | 7/28/2014 | 1980 | ||||||||||||||||
| Red Lobster | Owings Mills | MD | — | — | 229 | — | 229 | 14 | 7/28/2014 | 1989 | ||||||||||||||||
| Red Lobster | Salisbury | MD | — | 1,070 | 1,868 | — | 2,938 | 33 | 7/28/2014 | 1992 | ||||||||||||||||
| Red Lobster | Suitland | MD | — | 1,090 | 3,112 | — | 4,202 | 41 | 7/28/2014 | 1975 | ||||||||||||||||
| Red Lobster | Ann Arbor | MI | — | 657 | 2,505 | — | 3,162 | 36 | 7/28/2014 | 1978 | ||||||||||||||||
| Red Lobster | Battle Creek | MI | — | 202 | 1,827 | — | 2,029 | 29 | 7/28/2014 | 1979 | ||||||||||||||||
| Red Lobster | Bay City | MI | — | 168 | 1,620 | — | 1,788 | 30 | 7/28/2014 | 1993 | ||||||||||||||||
| Red Lobster | Dearborn Heights | MI | — | 822 | 2,156 | — | 2,978 | 31 | 7/28/2014 | 1975 | ||||||||||||||||
| Red Lobster | Flint | MI | — | 505 | 2,266 | — | 2,771 | 33 | 7/28/2014 | 1976 | ||||||||||||||||
| Red Lobster | Fort Gratiot | MI | — | 250 | 1,611 | — | 1,861 | 32 | 7/28/2014 | 2002 | ||||||||||||||||
| Red Lobster | Grandville | MI | — | 1,055 | 1,479 | — | 2,534 | 31 | 7/28/2014 | 2001 | ||||||||||||||||
| Red Lobster | Jackson | MI | — | 235 | 2,174 | — | 2,409 | 32 | 7/28/2014 | 1976 | ||||||||||||||||
| Red Lobster | Kentwood | MI | — | 819 | 1,606 | — | 2,425 | 25 | 7/28/2014 | 1975 | ||||||||||||||||
| Red Lobster | Lansing | MI | — | — | 1,534 | — | 1,534 | 41 | 7/28/2014 | 1976 | ||||||||||||||||
| Red Lobster | Livonia | MI | — | 635 | 1,824 | — | 2,459 | 31 | 7/28/2014 | 1987 | ||||||||||||||||
| Red Lobster | Madison Heights | MI | — | 756 | 2,527 | — | 3,283 | 36 | 7/28/2014 | 1974 | ||||||||||||||||
| Red Lobster | Marquette | MI | — | 300 | 1,731 | — | 2,031 | 32 | 7/28/2014 | 1993 | ||||||||||||||||
| Red Lobster | Mt. Pleasant | MI | — | 508 | 1,346 | — | 1,854 | 27 | 7/28/2014 | 1993 | ||||||||||||||||
| Red Lobster | Muskegon | MI | — | 386 | 2,028 | — | 2,414 | 32 | 7/28/2014 | 1982 | ||||||||||||||||
| Red Lobster | Novi | MI | — | 2,061 | 1,847 | — | 3,908 | 30 | 7/28/2014 | 1983 | ||||||||||||||||
| Red Lobster | Portage | MI | — | 396 | 2,496 | — | 2,892 | 35 | 7/28/2014 | 1975 | ||||||||||||||||
| Red Lobster | Saginaw | MI | — | 335 | 1,961 | — | 2,296 | 29 | 7/28/2014 | 1975 | ||||||||||||||||
| Red Lobster | Southgate | MI | — | 611 | 2,531 | — | 3,142 | 40 | 7/28/2014 | 1990 | ||||||||||||||||
| Red Lobster | Sterling Heights | MI | — | 759 | 3,215 | — | 3,974 | 46 | 7/28/2014 | 1985 | ||||||||||||||||
| Red Lobster | Traverse City | MI | — | 1,036 | 1,121 | — | 2,157 | 25 | 7/28/2014 | 1996 | ||||||||||||||||
| Red Lobster | Warren | MI | — | 349 | 2,656 | — | 3,005 | 37 | 7/28/2014 | 1975 | ||||||||||||||||
| Red Lobster | Westland | MI | — | 478 | 2,551 | — | 3,029 | 36 | 7/28/2014 | 1975 | ||||||||||||||||
| Red Lobster | Blaine | MN | — | 1,325 | 1,896 | — | 3,221 | 28 | 7/28/2014 | 1980 | ||||||||||||||||
| Red Lobster | Burnsville | MN | — | 1,222 | 2,381 | — | 3,603 | 32 | 7/30/2014 | 1980 | ||||||||||||||||
F-207
| Initial Costs | Costs Capitalized Subsequent to Acquisition | Gross Amount Carried at December 31, 2014 (1) (2) | ||||||||||||||||||||||||
| Property | City | State | Encumbrances at December 31, 2014 | Land | Buildings, Fixtures and Improvements | Accumulated Depreciation (3) (4) | Date Acquired | Date of Construction | ||||||||||||||||||
| Red Lobster | Golden Valley | MN | — | 1,136 | 1,365 | — | 2,501 | 20 | 7/28/2014 | 1975 | ||||||||||||||||
| Red Lobster | Mankato | MN | — | 867 | 1,642 | — | 2,509 | 31 | 7/28/2014 | 1993 | ||||||||||||||||
| Red Lobster | Maple Grove | MN | — | 963 | 1,901 | — | 2,864 | 33 | 7/28/2014 | 2001 | ||||||||||||||||
| Red Lobster | Maplewood | MN | — | 1,196 | 1,359 | — | 2,555 | 22 | 7/28/2014 | 1983 | ||||||||||||||||
| Red Lobster | Oakdale | MN | — | 697 | 2,157 | — | 2,854 | 32 | 7/28/2014 | 1989 | ||||||||||||||||
| Red Lobster | Rochester | MN | — | — | 1,674 | — | 1,674 | 39 | 7/28/2014 | 1987 | ||||||||||||||||
| Red Lobster | Roseville | MN | — | 1,291 | 1,298 | — | 2,589 | 19 | 7/28/2014 | 1975 | ||||||||||||||||
| Red Lobster | St. Cloud | MN | — | 760 | 2,770 | — | 3,530 | 40 | 7/28/2014 | 1990 | ||||||||||||||||
| Red Lobster | Branson | MO | — | 1,496 | 1,074 | — | 2,570 | 17 | 7/30/2014 | 2000 | ||||||||||||||||
| Red Lobster | Bridgeton | MO | — | 1,128 | 2,003 | — | 3,131 | 30 | 7/28/2014 | 1973 | ||||||||||||||||
| Red Lobster | Cape Girardeau | MO | — | 1,412 | 1,103 | — | 2,515 | 25 | 7/28/2014 | 1994 | ||||||||||||||||
| Red Lobster | Chesterfield | MO | — | — | 1,762 | — | 1,762 | 51 | 7/28/2014 | 1973 | ||||||||||||||||
| Red Lobster | Crestwood | MO | — | 518 | 1,466 | — | 1,984 | 23 | 7/28/2014 | 1975 | ||||||||||||||||
| Red Lobster | Independence | MO | — | 1,122 | 1,883 | — | 3,005 | 27 | 7/28/2014 | 1973 | ||||||||||||||||
| Red Lobster | Jefferson City | MO | — | 593 | 1,092 | — | 1,685 | 20 | 7/28/2014 | 1995 | ||||||||||||||||
| Red Lobster | Joplin | MO | — | 1,119 | 1,492 | — | 2,611 | 25 | 7/30/2014 | 1981 | ||||||||||||||||
| Red Lobster | Lee's Summit | MO | — | 1,408 | 1,424 | — | 2,832 | 31 | 7/28/2014 | 2010 | ||||||||||||||||
| Red Lobster | Springfield | MO | — | — | 1,510 | — | 1,510 | 62 | 7/28/2014 | 1972 | ||||||||||||||||
| Red Lobster | St. Joseph | MO | — | 1,023 | 1,002 | — | 2,025 | 18 | 7/28/2014 | 1979 | ||||||||||||||||
| Red Lobster | St. Peters | MO | — | — | 1,543 | — | 1,543 | 64 | 7/28/2014 | 1976 | ||||||||||||||||
| Red Lobster | St.Louis | MO | — | 1,387 | 2,662 | — | 4,049 | 36 | 7/28/2014 | 1972 | ||||||||||||||||
| Red Lobster | Hattiesburg | MS | — | 457 | 1,478 | — | 1,935 | 29 | 7/30/2014 | 1996 | ||||||||||||||||
| Red Lobster | Jackson | MS | — | 1,128 | 2,851 | — | 3,979 | 40 | 7/28/2014 | 1977 | ||||||||||||||||
| Red Lobster | Meridian | MS | — | — | 872 | — | 872 | 29 | 7/28/2014 | 1996 | ||||||||||||||||
| Red Lobster | Southaven | MS | — | 668 | 2,640 | — | 3,308 | 35 | 7/28/2014 | 1972 | ||||||||||||||||
| Red Lobster | Tupelo | MS | — | 626 | 1,703 | — | 2,329 | 31 | 7/30/2014 | 1994 | ||||||||||||||||
| Red Lobster | Billings | MT | — | 1,005 | 2,436 | — | 3,441 | 40 | 7/28/2014 | 1993 | ||||||||||||||||
F-208
| Initial Costs | Costs Capitalized Subsequent to Acquisition | Gross Amount Carried at December 31, 2014 (1) (2) | ||||||||||||||||||||||||
| Property | City | State | Encumbrances at December 31, 2014 | Land | Buildings, Fixtures and Improvements | Accumulated Depreciation (3) (4) | Date Acquired | Date of Construction | ||||||||||||||||||
| Red Lobster | Asheville | NC | — | 544 | 2,865 | — | 3,409 | 40 | 7/28/2014 | 1980 | ||||||||||||||||
| Red Lobster | Burlington | NC | — | 1,208 | 403 | — | 1,611 | 20 | 7/28/2014 | 2011 | ||||||||||||||||
| Red Lobster | Cary | NC | — | 1,933 | 1,118 | — | 3,051 | 24 | 7/28/2014 | 1992 | ||||||||||||||||
| Red Lobster | Concord | NC | — | — | 1,506 | — | 1,506 | 49 | 7/28/2014 | 2002 | ||||||||||||||||
| Red Lobster | Fayetteville | NC | — | 675 | 2,908 | — | 3,583 | 37 | 7/28/2014 | 1978 | ||||||||||||||||
| Red Lobster | Greensboro | NC | — | 1,372 | 1,785 | — | 3,157 | 26 | 7/28/2014 | 1972 | ||||||||||||||||
| Red Lobster | Greenville | NC | — | 1,139 | 846 | — | 1,985 | 21 | 7/28/2014 | 1991 | ||||||||||||||||
| Red Lobster | Hickory | NC | — | 630 | 1,660 | — | 2,290 | 26 | 7/28/2014 | 1989 | ||||||||||||||||
| Red Lobster | Jacksonville | NC | — | 1,006 | 1,050 | — | 2,056 | 25 | 7/28/2014 | 1995 | ||||||||||||||||
| Red Lobster | Matthews | NC | — | 1,949 | 495 | — | 2,444 | 21 | 7/28/2014 | 2012 | ||||||||||||||||
| Red Lobster | Pineville | NC | — | 1,314 | 2,510 | — | 3,824 | 38 | 7/28/2014 | 1992 | ||||||||||||||||
| Red Lobster | Raleigh | NC | — | 946 | 2,183 | — | 3,129 | 30 | 7/28/2014 | 1983 | ||||||||||||||||
| Red Lobster | Rocky Mount | NC | — | 795 | 1,005 | — | 1,800 | 23 | 7/28/2014 | 1991 | ||||||||||||||||
| Red Lobster | Winston-Salem | NC | — | 1,679 | 610 | — | 2,289 | 13 | 7/28/2014 | 1972 | ||||||||||||||||
| Red Lobster | Bismarck | ND | — | 831 | 3,321 | — | 4,152 | 45 | 7/28/2014 | 1990 | ||||||||||||||||
| Red Lobster | Fargo | ND | — | 888 | 2,933 | — | 3,821 | 41 | 7/28/2014 | 1981 | ||||||||||||||||
| Red Lobster | Grand Forks | ND | — | 876 | 1,694 | — | 2,570 | 31 | 7/28/2014 | 1992 | ||||||||||||||||
| Red Lobster | Kearney | NE | — | 678 | 1,109 | — | 1,787 | 25 | 7/28/2014 | 1996 | ||||||||||||||||
| Red Lobster | Lincoln | NE | — | — | 254 | — | 254 | 13 | 7/28/2014 | 1977 | ||||||||||||||||
| Red Lobster | Omaha | NE | — | 933 | 1,075 | — | 2,008 | 19 | 7/28/2014 | 1974 | ||||||||||||||||
| Red Lobster | Cherry Hill | NJ | — | — | 2,274 | — | 2,274 | 70 | 7/28/2014 | 1984 | ||||||||||||||||
| Red Lobster | Delran | NJ | — | 887 | 1,671 | — | 2,558 | 29 | 7/28/2014 | 1988 | ||||||||||||||||
| Red Lobster | Deptford | NJ | — | — | 1,608 | — | 1,608 | 53 | 7/28/2014 | 1991 | ||||||||||||||||
| Red Lobster | East Brunswick | NJ | — | 1,323 | 1,959 | — | 3,282 | 29 | 7/28/2014 | 1979 | ||||||||||||||||
| Red Lobster | Lawrenceville | NJ | — | 976 | 1,992 | — | 2,968 | 29 | 7/28/2014 | 1977 | ||||||||||||||||
| Red Lobster | Oakhurst | NJ | — | 1,112 | 1,521 | — | 2,633 | 23 | 7/28/2014 | 1977 | ||||||||||||||||
| Red Lobster | Vineland | NJ | — | — | 1,779 | — | 1,779 | 43 | 7/28/2014 | 1995 | ||||||||||||||||
| Red Lobster | Albuquerque | NM | — | 1,025 | 2,092 | — | 3,117 | 38 | 7/28/2014 | 2002 | ||||||||||||||||
| Red Lobster | Clovis | NM | — | — | 318 | — | 318 | 18 | 7/28/2014 | 1995 | ||||||||||||||||
| Red Lobster | Farmington | NM | — | 855 | 2,287 | — | 3,142 | 37 | 7/28/2014 | 1992 | ||||||||||||||||
F-209
| Initial Costs | Costs Capitalized Subsequent to Acquisition | Gross Amount Carried at December 31, 2014 (1) (2) | ||||||||||||||||||||||||
| Property | City | State | Encumbrances at December 31, 2014 | Land | Buildings, Fixtures and Improvements | Accumulated Depreciation (3) (4) | Date Acquired | Date of Construction | ||||||||||||||||||
| Red Lobster | Las Cruces | NM | — | 1,107 | 1,400 | — | 2,507 | 27 | 7/28/2014 | 1991 | ||||||||||||||||
| Red Lobster | Roswell | NM | — | 354 | 1,248 | — | 1,602 | 26 | 7/30/2014 | 1994 | ||||||||||||||||
| Red Lobster | Santa Fe | NM | — | 876 | 1,440 | — | 2,316 | 28 | 7/30/2014 | 1990 | ||||||||||||||||
| Red Lobster | Henderson | NV | — | 803 | 2,361 | — | 3,164 | 40 | 7/28/2014 | 2001 | ||||||||||||||||
| Red Lobster | Las Vegas | NV | — | 547 | 2,653 | — | 3,200 | 39 | 7/30/2014 | 1982 | ||||||||||||||||
| Red Lobster | Reno | NV | — | 841 | 2,133 | — | 2,974 | 36 | 7/28/2014 | 1990 | ||||||||||||||||
| Red Lobster | Amherst | NY | — | 1,344 | 1,271 | — | 2,615 | 24 | 7/28/2014 | 1980 | ||||||||||||||||
| Red Lobster | Amherst | NY | — | 991 | 2,779 | — | 3,770 | 42 | 7/28/2014 | 1981 | ||||||||||||||||
| Red Lobster | Brooklyn | NY | — | — | 5,897 | — | 5,897 | 160 | 7/28/2014 | 2003 | ||||||||||||||||
| Red Lobster | Buffalo | NY | — | 1,161 | 1,386 | — | 2,547 | 27 | 7/28/2014 | 1986 | ||||||||||||||||
| Red Lobster | Colonie | NY | — | 1,014 | 3,500 | — | 4,514 | 48 | 7/28/2014 | 1976 | ||||||||||||||||
| Red Lobster | Henrietta | NY | — | 956 | 2,934 | — | 3,890 | 42 | 7/28/2014 | 1976 | ||||||||||||||||
| Red Lobster | Hicksville | NY | — | — | 870 | — | 870 | 29 | 7/28/2014 | 1982 | ||||||||||||||||
| Red Lobster | Liverpool | NY | — | 900 | 2,088 | — | 2,988 | 31 | 7/28/2014 | 1975 | ||||||||||||||||
| Red Lobster | Nanuet | NY | — | 2,533 | 767 | — | 3,300 | 15 | 7/28/2014 | 1980 | ||||||||||||||||
| Red Lobster | Poughkeepsie | NY | — | 1,987 | 669 | — | 2,656 | 15 | 7/28/2014 | 1981 | ||||||||||||||||
| Red Lobster | Rochester | NY | — | 756 | 2,122 | — | 2,878 | 35 | 7/28/2014 | 1985 | ||||||||||||||||
| Red Lobster | Ronkonkoma | NY | — | — | 1,109 | — | 1,109 | 37 | 7/28/2014 | 2005 | ||||||||||||||||
| Red Lobster | Stony Brook | NY | — | 2,176 | 923 | — | 3,099 | 15 | 7/28/2014 | 1976 | ||||||||||||||||
| Red Lobster | Valley Stream | NY | — | — | 1,417 | — | 1,417 | 48 | 7/28/2014 | 1983 | ||||||||||||||||
| Red Lobster | Vestal | NY | — | 1,027 | 2,255 | — | 3,282 | 33 | 7/28/2014 | 1976 | ||||||||||||||||
| Red Lobster | Watertown | NY | — | 807 | 1,586 | — | 2,393 | 31 | 7/28/2014 | 1993 | ||||||||||||||||
| Red Lobster | Yonkers | NY | — | — | 894 | — | 894 | 31 | 7/28/2014 | 2012 | ||||||||||||||||
| Red Lobster | Akron | OH | — | — | 1,398 | — | 1,398 | 44 | 7/28/2014 | 1981 | ||||||||||||||||
| Red Lobster | Beavercreek | OH | — | 551 | 2,334 | — | 2,885 | 38 | 7/28/2014 | 1994 | ||||||||||||||||
| Red Lobster | Canton | OH | — | 398 | 2,596 | — | 2,994 | 35 | 7/28/2014 | 1974 | ||||||||||||||||
| Red Lobster | Cincinnati | OH | — | 799 | 1,915 | — | 2,714 | 26 | 7/28/2014 | 1974 | ||||||||||||||||
| Red Lobster | Cincinnati | OH | — | 510 | 2,877 | — | 3,387 | 37 | 7/28/2014 | 1974 | ||||||||||||||||
| Red Lobster | Cincinnati | OH | — | 1,484 | 1,687 | — | 3,171 | 24 | 7/28/2014 | 1977 | ||||||||||||||||
| Red Lobster | Cincinnati | OH | — | 365 | 2,344 | — | 2,709 | 32 | 7/28/2014 | 1980 | ||||||||||||||||
F-210
| Initial Costs | Costs Capitalized Subsequent to Acquisition | Gross Amount Carried at December 31, 2014 (1) (2) | ||||||||||||||||||||||||
| Property | City | State | Encumbrances at December 31, 2014 | Land | Buildings, Fixtures and Improvements | Accumulated Depreciation (3) (4) | Date Acquired | Date of Construction | ||||||||||||||||||
| Red Lobster | Columbus | OH | — | — | 1,100 | — | 1,100 | 39 | 7/28/2014 | 2002 | ||||||||||||||||
| Red Lobster | Columbus | OH | — | 728 | 1,717 | — | 2,445 | 26 | 7/28/2014 | 1981 | ||||||||||||||||
| Red Lobster | Columbus | OH | — | 787 | 2,123 | — | 2,910 | 29 | 7/28/2014 | 1973 | ||||||||||||||||
| Red Lobster | Cuyahoga Falls | OH | — | 306 | 2,511 | — | 2,817 | 34 | 7/28/2014 | 1974 | ||||||||||||||||
| Red Lobster | Dublin | OH | — | — | 873 | — | 873 | 27 | 7/28/2014 | 1990 | ||||||||||||||||
| Red Lobster | Lancaster | OH | — | 737 | 1,570 | — | 2,307 | 27 | 7/28/2014 | 1991 | ||||||||||||||||
| Red Lobster | Lima | OH | — | 843 | 658 | — | 1,501 | 19 | 7/28/2014 | 1991 | ||||||||||||||||
| Red Lobster | Mansfield | OH | — | 335 | 1,697 | — | 2,032 | 25 | 7/28/2014 | 1977 | ||||||||||||||||
| Red Lobster | Maumee | OH | — | 505 | 2,067 | — | 2,572 | 31 | 7/28/2014 | 1974 | ||||||||||||||||
| Red Lobster | Mentor | OH | — | 651 | 2,129 | — | 2,780 | 31 | 7/30/2014 | 1977 | ||||||||||||||||
| Red Lobster | Miamisburg | OH | — | 612 | 2,615 | — | 3,227 | 33 | 7/28/2014 | 1974 | ||||||||||||||||
| Red Lobster | New Philadelphia | OH | — | 232 | 1,349 | — | 1,581 | 26 | 7/28/2014 | 1991 | ||||||||||||||||
| Red Lobster | Niles | OH | — | — | 1,799 | — | 1,799 | 49 | 7/28/2014 | 1982 | ||||||||||||||||
| Red Lobster | North Olmsted | OH | — | — | 2,291 | — | 2,291 | 54 | 7/28/2014 | 1974 | ||||||||||||||||
| Red Lobster | Parma | OH | — | 466 | 2,156 | — | 2,622 | 30 | 7/28/2014 | 1975 | ||||||||||||||||
| Red Lobster | Sandusky | OH | — | 1,290 | 1,126 | — | 2,416 | 22 | 7/30/2014 | 1986 | ||||||||||||||||
| Red Lobster | Springfield | OH | — | 526 | 1,345 | — | 1,871 | 27 | 7/28/2014 | 1996 | ||||||||||||||||
| Red Lobster | St. Clairsville | OH | — | — | 853 | — | 853 | 42 | 7/28/2014 | 1997 | ||||||||||||||||
| Red Lobster | Toledo | OH | — | 732 | 2,112 | — | 2,844 | 32 | 7/28/2014 | 1974 | ||||||||||||||||
| Red Lobster | Wooster | OH | — | 200 | 1,205 | — | 1,405 | 25 | 7/28/2014 | 1995 | ||||||||||||||||
| Red Lobster | Youngstown | OH | — | 214 | 2,477 | — | 2,691 | 36 | 7/28/2014 | 1982 | ||||||||||||||||
| Red Lobster | Zanesville | OH | — | 729 | 1,205 | — | 1,934 | 22 | 7/28/2014 | 1992 | ||||||||||||||||
| Red Lobster | Lawton | OK | — | 478 | 1,760 | — | 2,238 | 28 | 7/28/2014 | 1981 | ||||||||||||||||
| Red Lobster | Muskogee | OK | — | 399 | 1,707 | — | 2,106 | 31 | 7/28/2014 | 1995 | ||||||||||||||||
| Red Lobster | Norman | OK | — | 341 | 2,569 | — | 2,910 | 36 | 7/28/2014 | 1982 | ||||||||||||||||
| Red Lobster | Oklahoma City | OK | — | 610 | 2,681 | — | 3,291 | 36 | 7/28/2014 | 1980 | ||||||||||||||||
| Red Lobster | Oklahoma City | OK | — | 623 | 2,000 | — | 2,623 | 28 | 7/28/2014 | 1977 | ||||||||||||||||
| Red Lobster | Oklahoma City | OK | — | 800 | 1,960 | — | 2,760 | 31 | 7/28/2014 | 1991 | ||||||||||||||||
| Red Lobster | Shawnee | OK | — | 437 | 1,744 | — | 2,181 | 29 | 7/28/2014 | 1995 | ||||||||||||||||
| Red Lobster | Tulsa | OK | — | 847 | 2,084 | — | 2,931 | 30 | 7/28/2014 | 1976 | ||||||||||||||||
F-211
| Initial Costs | Costs Capitalized Subsequent to Acquisition | Gross Amount Carried at December 31, 2014 (1) (2) | ||||||||||||||||||||||||
| Property | City | State | Encumbrances at December 31, 2014 | Land | Buildings, Fixtures and Improvements | Accumulated Depreciation (3) (4) | Date Acquired | Date of Construction | ||||||||||||||||||
| Red Lobster | Tulsa | OK | — | 599 | 2,285 | — | 2,884 | 36 | 7/28/2014 | 1987 | ||||||||||||||||
| Red Lobster | Barrie | ON | — | 1,815 | 317 | — | 2,132 | 14 | 7/28/2014 | 1986 | ||||||||||||||||
| Red Lobster | Brampton | ON | — | 1,249 | 1,396 | — | 2,645 | 24 | 7/28/2014 | 1986 | ||||||||||||||||
| Red Lobster | Burlington | ON | — | 1,884 | 1,652 | — | 3,536 | 27 | 7/28/2014 | 1985 | ||||||||||||||||
| Red Lobster | Kitchener | ON | — | 1,397 | 554 | — | 1,951 | 17 | 7/28/2014 | 1986 | ||||||||||||||||
| Red Lobster | London | ON | — | 1,502 | 649 | — | 2,151 | 18 | 7/28/2014 | 1986 | ||||||||||||||||
| Red Lobster | Niagara Falls | ON | — | 1,094 | 1,402 | — | 2,496 | 26 | 7/28/2014 | 1986 | ||||||||||||||||
| Red Lobster | Oshawa | ON | — | 955 | 775 | — | 1,730 | 16 | 7/28/2014 | 1986 | ||||||||||||||||
| Red Lobster | Ottawa | ON | — | 1,686 | 938 | — | 2,624 | 18 | 7/28/2014 | 1986 | ||||||||||||||||
| Red Lobster | Scarborough | ON | — | 2,910 | 1,260 | — | 4,170 | 22 | 7/28/2014 | 1985 | ||||||||||||||||
| Red Lobster | Sudbury | ON | — | 1,149 | 645 | — | 1,794 | 19 | 7/28/2014 | 1989 | ||||||||||||||||
| Red Lobster | Windsor | ON | — | 870 | 648 | — | 1,518 | 18 | 7/28/2014 | 1983 | ||||||||||||||||
| Red Lobster | Medford | OR | — | 2,212 | 394 | — | 2,606 | 16 | 7/28/2014 | 1991 | ||||||||||||||||
| Red Lobster | Salem | OR | — | 1,132 | 1,391 | — | 2,523 | 27 | 7/28/2014 | 1993 | ||||||||||||||||
| Red Lobster | Bartonsville | PA | — | — | 2,389 | — | 2,389 | 57 | 7/28/2014 | 2010 | ||||||||||||||||
| Red Lobster | Chambersburg | PA | — | 694 | 1,212 | — | 1,906 | 25 | 7/28/2014 | 1991 | ||||||||||||||||
| Red Lobster | Du Bois | PA | — | 317 | 981 | — | 1,298 | 22 | 7/28/2014 | 1995 | ||||||||||||||||
| Red Lobster | Erie | PA | — | 600 | 1,800 | — | 2,400 | 27 | 7/28/2014 | 1987 | ||||||||||||||||
| Red Lobster | Greensburg | PA | — | 748 | 2,432 | — | 3,180 | 35 | 7/28/2014 | 1989 | ||||||||||||||||
| Red Lobster | Hanover | PA | — | 446 | 1,870 | — | 2,316 | 33 | 7/28/2014 | 1995 | ||||||||||||||||
| Red Lobster | Hermitage | PA | — | 904 | 1,523 | — | 2,427 | 28 | 7/28/2014 | 1993 | ||||||||||||||||
| Red Lobster | Johnstown | PA | — | 789 | 1,799 | — | 2,588 | 31 | 7/28/2014 | 1993 | ||||||||||||||||
| Red Lobster | King of Prussia | PA | — | 1,112 | 2,246 | — | 3,358 | 37 | 7/28/2014 | 1996 | ||||||||||||||||
| Red Lobster | Lancaster | PA | — | — | 2,968 | — | 2,968 | 60 | 7/28/2014 | 1977 | ||||||||||||||||
| Red Lobster | Langhorne | PA | — | 979 | 2,735 | — | 3,714 | 43 | 7/28/2014 | 1996 | ||||||||||||||||
| Red Lobster | Mechanicsburg | PA | — | 676 | 2,656 | — | 3,332 | 37 | 7/28/2014 | 1976 | ||||||||||||||||
| Red Lobster | Monroeville | PA | — | 913 | 1,924 | — | 2,837 | 26 | 7/28/2014 | 1977 | ||||||||||||||||
| Red Lobster | Philadelphia | PA | — | — | 1,902 | — | 1,902 | 41 | 7/28/2014 | 1977 | ||||||||||||||||
| Red Lobster | Pittsburgh | PA | — | — | 1,379 | — | 1,379 | 44 | 7/28/2014 | 1976 | ||||||||||||||||
| Red Lobster | Pittsburgh | PA | — | 1,352 | 1,190 | — | 2,542 | 19 | 7/28/2014 | 1977 | ||||||||||||||||
F-212
| Initial Costs | Costs Capitalized Subsequent to Acquisition | Gross Amount Carried at December 31, 2014 (1) (2) | ||||||||||||||||||||||||
| Property | City | State | Encumbrances at December 31, 2014 | Land | Buildings, Fixtures and Improvements | Accumulated Depreciation (3) (4) | Date Acquired | Date of Construction | ||||||||||||||||||
| Red Lobster | Pittsburgh | PA | — | 1,641 | 1,096 | — | 2,737 | 19 | 7/28/2014 | 1987 | ||||||||||||||||
| Red Lobster | Pottstown | PA | — | — | 1,115 | — | 1,115 | 58 | 7/28/2014 | 1995 | ||||||||||||||||
| Red Lobster | Scranton | PA | — | — | 1,563 | — | 1,563 | 56 | 7/28/2014 | 2001 | ||||||||||||||||
| Red Lobster | Springfield | PA | — | 1,571 | 2,344 | — | 3,915 | 37 | 7/28/2014 | 1983 | ||||||||||||||||
| Red Lobster | State College | PA | — | — | 1,026 | — | 1,026 | 48 | 7/28/2014 | 1999 | ||||||||||||||||
| Red Lobster | Washington | PA | — | — | 694 | — | 694 | 21 | 7/28/2014 | 1976 | ||||||||||||||||
| Red Lobster | Whitehall | PA | — | — | 2,155 | — | 2,155 | 71 | 7/28/2014 | 1977 | ||||||||||||||||
| Red Lobster | Aiken | SC | — | 780 | 1,247 | — | 2,027 | 24 | 7/28/2014 | 1991 | ||||||||||||||||
| Red Lobster | Columbia | SC | — | — | 918 | — | 918 | 29 | 7/28/2014 | 1980 | ||||||||||||||||
| Red Lobster | Florence | SC | — | 779 | 1,506 | — | 2,285 | 28 | 7/28/2014 | 1990 | ||||||||||||||||
| Red Lobster | Myrtle Beach | SC | — | — | 462 | — | 462 | 25 | 7/28/2014 | 2006 | ||||||||||||||||
| Red Lobster | Myrtle Beach | SC | — | 1,162 | 1,038 | — | 2,200 | 24 | 7/28/2014 | 1995 | ||||||||||||||||
| Red Lobster | North Charleston | SC | — | 862 | 1,702 | — | 2,564 | 27 | 7/28/2014 | 1978 | ||||||||||||||||
| Red Lobster | Spartanburg | SC | — | — | 1,136 | — | 1,136 | 28 | 7/28/2014 | 1973 | ||||||||||||||||
| Red Lobster | Sumter | SC | — | 988 | 1,117 | — | 2,105 | 25 | 7/28/2014 | 1995 | ||||||||||||||||
| Red Lobster | Regina | SK | — | 1,698 | 548 | — | 2,246 | 17 | 7/28/2014 | 1989 | ||||||||||||||||
| Red Lobster | Saskatoon | SK | — | 1,579 | 1,359 | — | 2,938 | 26 | 7/28/2014 | 1990 | ||||||||||||||||
| Red Lobster | Chattanooga | TN | — | 1,419 | 1,188 | — | 2,607 | 19 | 7/28/2014 | 1980 | ||||||||||||||||
| Red Lobster | Chattanooga | TN | — | 1,548 | 2,575 | — | 4,123 | 33 | 7/28/2014 | 1972 | ||||||||||||||||
| Red Lobster | Clarksville | TN | — | 543 | 2,223 | — | 2,766 | 34 | 7/28/2014 | 1990 | ||||||||||||||||
| Red Lobster | Cookeville | TN | — | 532 | 1,205 | — | 1,737 | 23 | 7/28/2014 | 1995 | ||||||||||||||||
| Red Lobster | Franklin | TN | — | 1,660 | 757 | — | 2,417 | 18 | 7/30/2014 | 1992 | ||||||||||||||||
| Red Lobster | Jackson | TN | — | 822 | 1,427 | — | 2,249 | 28 | 7/28/2014 | 1995 | ||||||||||||||||
| Red Lobster | Johnson City | TN | — | 1,223 | 1,552 | — | 2,775 | 26 | 7/28/2014 | 1981 | ||||||||||||||||
| Red Lobster | Knoxville | TN | — | 1,149 | 1,720 | — | 2,869 | 26 | 7/28/2014 | 1972 | ||||||||||||||||
| Red Lobster | Knoxville | TN | — | 1,503 | 1,383 | — | 2,886 | 23 | 7/28/2014 | 1978 | ||||||||||||||||
| Red Lobster | Madison | TN | — | 1,074 | 2,028 | — | 3,102 | 27 | 7/28/2014 | 1972 | ||||||||||||||||
| Red Lobster | Memphis | TN | — | 1,293 | 1,710 | — | 3,003 | 29 | 7/28/2014 | 1984 | ||||||||||||||||
| Red Lobster | Memphis | TN | — | 1,602 | 2,290 | — | 3,892 | 31 | 7/28/2014 | 1972 | ||||||||||||||||
| Red Lobster | Mt. Juliet | TN | — | 1,227 | 773 | — | 2,000 | 22 | 7/28/2014 | 2009 | ||||||||||||||||
F-213
| Initial Costs | Costs Capitalized Subsequent to Acquisition | Gross Amount Carried at December 31, 2014 (1) (2) | ||||||||||||||||||||||||
| Property | City | State | Encumbrances at December 31, 2014 | Land | Buildings, Fixtures and Improvements | Accumulated Depreciation (3) (4) | Date Acquired | Date of Construction | ||||||||||||||||||
| Red Lobster | Murfreesboro | TN | — | 1,205 | 873 | — | 2,078 | 19 | 7/28/2014 | 1992 | ||||||||||||||||
| Red Lobster | Sevierville | TN | — | — | 1,062 | — | 1,062 | 40 | 7/28/2014 | 2002 | ||||||||||||||||
| Red Lobster | Abilene | TX | — | 209 | 1,976 | — | 2,185 | 30 | 7/30/2014 | 1980 | ||||||||||||||||
| Red Lobster | Amarillo | TX | — | 590 | 2,342 | — | 2,932 | 33 | 7/28/2014 | 1976 | ||||||||||||||||
| Red Lobster | Arlington | TX | — | 738 | 3,253 | — | 3,991 | 44 | 7/28/2014 | 1989 | ||||||||||||||||
| Red Lobster | Austin | TX | — | 1,060 | 2,091 | — | 3,151 | 30 | 7/28/2014 | 1974 | ||||||||||||||||
| Red Lobster | Austin | TX | — | 1,172 | 1,275 | — | 2,447 | 19 | 7/28/2014 | 1981 | ||||||||||||||||
| Red Lobster | Baytown | TX | — | 537 | 1,255 | — | 1,792 | 22 | 7/28/2014 | 1984 | ||||||||||||||||
| Red Lobster | Beaumont | TX | — | 610 | 604 | — | 1,214 | 13 | 7/30/2014 | 1976 | ||||||||||||||||
| Red Lobster | Brownsville | TX | — | 427 | 1,638 | — | 2,065 | 29 | 7/28/2014 | 1990 | ||||||||||||||||
| Red Lobster | Burleson | TX | — | — | 356 | — | 356 | 21 | 7/28/2014 | 2003 | ||||||||||||||||
| Red Lobster | College Station | TX | — | — | 643 | — | 643 | 22 | 7/28/2014 | 1983 | ||||||||||||||||
| Red Lobster | Conroe | TX | — | — | 557 | — | 557 | 25 | 7/28/2014 | 2011 | ||||||||||||||||
| Red Lobster | Corpus Christi | TX | — | 1,246 | 2,325 | — | 3,571 | 33 | 7/28/2014 | 1975 | ||||||||||||||||
| Red Lobster | Dallas | TX | — | 1,025 | 2,298 | — | 3,323 | 32 | 7/28/2014 | 1973 | ||||||||||||||||
| Red Lobster | Denton | TX | — | 832 | 2,044 | — | 2,876 | 35 | 7/28/2014 | 1991 | ||||||||||||||||
| Red Lobster | Duncanville | TX | — | 361 | 2,658 | — | 3,019 | 36 | 7/28/2014 | 1974 | ||||||||||||||||
| Red Lobster | El Paso | TX | — | — | 414 | — | 414 | 23 | 7/28/2014 | 1976 | ||||||||||||||||
| Red Lobster | El Paso | TX | — | — | 883 | — | 883 | 29 | 7/28/2014 | 2008 | ||||||||||||||||
| Red Lobster | El Paso | TX | — | 721 | 1,825 | — | 2,546 | 29 | 7/28/2014 | 1982 | ||||||||||||||||
| Red Lobster | Fort Worth | TX | — | — | 239 | — | 239 | 13 | 7/28/2014 | 1982 | ||||||||||||||||
| Red Lobster | Frisco | TX | — | 1,676 | 1,339 | — | 3,015 | 27 | 7/30/2014 | 2001 | ||||||||||||||||
| Red Lobster | Greenville | TX | — | 206 | 1,688 | — | 1,894 | 30 | 7/28/2014 | 1995 | ||||||||||||||||
F-214
| Initial Costs | Costs Capitalized Subsequent to Acquisition | Gross Amount Carried at December 31, 2014 (1) (2) | ||||||||||||||||||||||||
| Property | City | State | Encumbrances at December 31, 2014 | Land | Buildings, Fixtures and Improvements | Accumulated Depreciation (3) (4) | Date Acquired | Date of Construction | ||||||||||||||||||
| Red Lobster | Houston | TX | — | — | 398 | — | 398 | 22 | 7/28/2014 | 1974 | ||||||||||||||||
| Red Lobster | Houston | TX | — | 960 | 1,833 | — | 2,793 | 28 | 7/28/2014 | 1981 | ||||||||||||||||
| Red Lobster | Humble | TX | — | — | 1,087 | — | 1,087 | 31 | 7/28/2014 | 1980 | ||||||||||||||||
| Red Lobster | Irving | TX | — | 1,240 | 1,667 | — | 2,907 | 24 | 7/30/2014 | 1973 | ||||||||||||||||
| Red Lobster | Katy | TX | — | 1,439 | 896 | — | 2,335 | 22 | 7/28/2014 | 2001 | ||||||||||||||||
| Red Lobster | Killeen | TX | — | 732 | 1,935 | — | 2,667 | 32 | 7/28/2014 | 1991 | ||||||||||||||||
| Red Lobster | Lake Jackson | TX | — | 393 | 1,190 | — | 1,583 | 21 | �� | 7/28/2014 | 1984 | |||||||||||||||
| Red Lobster | Laredo | TX | — | — | 819 | — | 819 | 33 | 7/28/2014 | 2003 | ||||||||||||||||
| Red Lobster | Lewisville | TX | — | 1,087 | 1,626 | — | 2,713 | 24 | 7/28/2014 | 1973 | ||||||||||||||||
| Red Lobster | Longview | TX | — | 324 | 2,625 | — | 2,949 | 38 | 7/28/2014 | 1981 | ||||||||||||||||
| Red Lobster | Lubbock | TX | — | 1,103 | 1,494 | — | 2,597 | 24 | 7/28/2014 | 1976 | ||||||||||||||||
| Red Lobster | Lufkin | TX | — | 15 | 1,732 | — | 1,747 | 32 | 7/28/2014 | 1996 | ||||||||||||||||
| Red Lobster | McAllen | TX | — | 1,175 | 2,280 | — | 3,455 | 34 | 7/28/2014 | 1981 | ||||||||||||||||
| Red Lobster | McAllen | TX | — | 960 | 1,647 | — | 2,607 | 33 | 7/28/2014 | 2010 | ||||||||||||||||
| Red Lobster | Mesquite | TX | — | 649 | 3,200 | — | 3,849 | 45 | 7/28/2014 | 1986 | ||||||||||||||||
| Red Lobster | N. Richland Hills | TX | — | 493 | 2,889 | — | 3,382 | 40 | 7/28/2014 | 1978 | ||||||||||||||||
| Red Lobster | Odessa | TX | — | 731 | 3,129 | — | 3,860 | 43 | 7/28/2014 | 1976 | ||||||||||||||||
| Red Lobster | Pasadena | TX | — | 675 | 928 | — | 1,603 | 16 | 7/28/2014 | 1978 | ||||||||||||||||
| Red Lobster | Plano | TX | — | 1,340 | 2,058 | — | 3,398 | 30 | 7/28/2014 | 1981 | ||||||||||||||||
| Red Lobster | Round Rock | TX | — | 1,335 | 1,763 | — | 3,098 | 33 | 7/28/2014 | 2001 | ||||||||||||||||
| Red Lobster | San Angelo | TX | — | 512 | 3,433 | — | 3,945 | 48 | 7/28/2014 | 1984 | ||||||||||||||||
| Red Lobster | San Antonio | TX | — | — | 963 | — | 963 | 23 | 7/28/2014 | 1974 | ||||||||||||||||
| Red Lobster | San Antonio | TX | — | 1,369 | 459 | — | 1,828 | 20 | 7/28/2014 | 2010 | ||||||||||||||||
| Red Lobster | San Antonio | TX | — | 474 | 1,491 | — | 1,965 | 25 | 7/28/2014 | 1984 | ||||||||||||||||
| Red Lobster | San Antonio | TX | — | 994 | 2,151 | — | 3,145 | 30 | 7/28/2014 | 1975 | ||||||||||||||||
| Red Lobster | San Antonio | TX | — | 789 | 1,793 | — | 2,582 | 36 | 7/28/2014 | 2008 | ||||||||||||||||
| Red Lobster | San Antonio | TX | — | 1,592 | 588 | — | 2,180 | 15 | 7/28/2014 | 1985 | ||||||||||||||||
| Red Lobster | San Marcos | TX | — | 713 | 979 | — | 1,692 | 22 | 7/28/2014 | 1996 | ||||||||||||||||
F-215
| Initial Costs | Costs Capitalized Subsequent to Acquisition | Gross Amount Carried at December 31, 2014 (1) (2) | ||||||||||||||||||||||||
| Property | City | State | Encumbrances at December 31, 2014 | Land | Buildings, Fixtures and Improvements | Accumulated Depreciation (3) (4) | Date Acquired | Date of Construction | ||||||||||||||||||
| Red Lobster | Shenandoah | TX | — | 740 | 1,578 | — | 2,318 | 25 | 7/28/2014 | 1981 | ||||||||||||||||
| Red Lobster | Sherman | TX | — | 675 | 1,923 | — | 2,598 | 34 | 7/28/2014 | 1990 | ||||||||||||||||
| Red Lobster | Sugar Land | TX | — | — | 708 | — | 708 | 22 | 7/28/2014 | 1981 | ||||||||||||||||
| Red Lobster | Texarkana | TX | — | 73 | 2,148 | — | 2,221 | 34 | 7/28/2014 | 1986 | ||||||||||||||||
| Red Lobster | Tyler | TX | — | 884 | 1,755 | — | 2,639 | 28 | 7/28/2014 | 1982 | ||||||||||||||||
| Red Lobster | Victoria | TX | — | 478 | 1,905 | — | 2,383 | 30 | 7/28/2014 | 1984 | ||||||||||||||||
| Red Lobster | Webster | TX | — | 909 | 1,907 | — | 2,816 | 29 | 7/28/2014 | 1982 | ||||||||||||||||
| Red Lobster | Wichita Falls | TX | — | 345 | 1,706 | — | 2,051 | 27 | 7/28/2014 | 1980 | ||||||||||||||||
| Red Lobster | Layton | UT | — | 1,577 | 1,333 | — | 2,910 | 28 | 7/28/2014 | 1993 | ||||||||||||||||
| Red Lobster | Murray | UT | — | 1,391 | 2,367 | — | 3,758 | 39 | 7/28/2014 | 1992 | ||||||||||||||||
| Red Lobster | Orem | UT | — | 1,246 | 1,346 | — | 2,592 | 29 | 7/28/2014 | 2001 | ||||||||||||||||
| Red Lobster | Saint George | UT | — | 797 | 1,387 | — | 2,184 | 28 | 7/28/2014 | 1996 | ||||||||||||||||
| Red Lobster | Alexandria | VA | — | 1,516 | 1,991 | — | 3,507 | 28 | 7/28/2014 | 1977 | ||||||||||||||||
| Red Lobster | Bristol | VA | — | 816 | 1,175 | — | 1,991 | 24 | 7/28/2014 | 2005 | ||||||||||||||||
| Red Lobster | Charlottesville | VA | — | — | 1,021 | — | 1,021 | 28 | 7/28/2014 | 1986 | ||||||||||||||||
| Red Lobster | Chesapeake | VA | — | 1,262 | 1,374 | — | 2,636 | 23 | 7/28/2014 | 1992 | ||||||||||||||||
| Red Lobster | Christiansburg | VA | — | 447 | 1,657 | — | 2,104 | 31 | 7/28/2014 | 1996 | ||||||||||||||||
| Red Lobster | Colonial Heights | VA | — | 1,095 | 1,409 | — | 2,504 | 28 | 7/28/2014 | 1993 | ||||||||||||||||
| Red Lobster | Fairfax | VA | — | 2,163 | 425 | — | 2,588 | 10 | 7/28/2014 | 1977 | ||||||||||||||||
| Red Lobster | Fredericksburg | VA | — | 1,088 | 1,971 | — | 3,059 | 33 | 7/28/2014 | 1991 | ||||||||||||||||
| Red Lobster | Harrisonburg | VA | — | 465 | 1,369 | — | 1,834 | 28 | 7/28/2014 | 1993 | ||||||||||||||||
| Red Lobster | Lynchburg | VA | — | 983 | 1,378 | — | 2,361 | 25 | 7/28/2014 | 1982 | ||||||||||||||||
| Red Lobster | Manassas | VA | — | 1,800 | 941 | — | 2,741 | 21 | 7/28/2014 | 1993 | ||||||||||||||||
| Red Lobster | Midlothian | VA | — | — | 655 | — | 655 | 30 | 7/28/2014 | 2003 | ||||||||||||||||
| Red Lobster | Newport News | VA | — | 952 | 1,536 | — | 2,488 | 25 | 7/28/2014 | 1976 | ||||||||||||||||
| Red Lobster | Richmond | VA | — | 992 | 1,729 | — | 2,721 | 32 | 7/28/2014 | 2009 | ||||||||||||||||
| Red Lobster | Richmond | VA | — | 1,344 | 1,517 | — | 2,861 | 25 | 7/28/2014 | 1978 | ||||||||||||||||
| Red Lobster | Sterling | VA | — | — | 646 | — | 646 | 29 | 7/28/2014 | 2001 | ||||||||||||||||
F-216
| Initial Costs | Costs Capitalized Subsequent to Acquisition | Gross Amount Carried at December 31, 2014 (1) (2) | ||||||||||||||||||||||||
| Property | City | State | Encumbrances at December 31, 2014 | Land | Buildings, Fixtures and Improvements | Accumulated Depreciation (3) (4) | Date Acquired | Date of Construction | ||||||||||||||||||
| Red Lobster | Virginia Beach | VA | — | 1,039 | 1,692 | — | 2,731 | 26 | 7/28/2014 | 1975 | ||||||||||||||||
| Red Lobster | Virginia Beach | VA | — | 820 | 1,805 | — | 2,625 | 29 | 7/28/2014 | 1981 | ||||||||||||||||
| Red Lobster | Williamsburg | VA | — | 1,064 | 1,096 | — | 2,160 | 24 | 7/28/2014 | 1993 | ||||||||||||||||
| Red Lobster | Winchester | VA | — | — | 357 | — | 357 | 21 | 7/28/2014 | 2006 | ||||||||||||||||
| Red Lobster | Woodbridge | VA | — | 1,052 | 2,096 | — | 3,148 | 33 | 7/28/2014 | 1989 | ||||||||||||||||
| Red Lobster | Kelso | WA | — | 550 | 1,573 | — | 2,123 | 28 | 7/28/2014 | 1994 | ||||||||||||||||
| Red Lobster | Kennewick | WA | — | 1,421 | 1,451 | — | 2,872 | 28 | 7/28/2014 | 1992 | ||||||||||||||||
| Red Lobster | Lynnwood | WA | — | 1,325 | 2,174 | — | 3,499 | 35 | 7/28/2014 | 1990 | ||||||||||||||||
| Red Lobster | Olympia | WA | — | — | 596 | — | 596 | 34 | 7/28/2014 | 1995 | ||||||||||||||||
| Red Lobster | Silverdale | WA | — | 1,661 | 501 | — | 2,162 | 17 | 7/28/2014 | 1993 | ||||||||||||||||
| Red Lobster | Spokane | WA | — | — | 1,427 | — | 1,427 | 40 | 7/28/2014 | 2009 | ||||||||||||||||
| Red Lobster | Vancouver | WA | — | 1,360 | 1,833 | — | 3,193 | 30 | 7/28/2014 | 1989 | ||||||||||||||||
| Red Lobster | Ashwaubenon | WI | — | 1,270 | 1,116 | — | 2,386 | 20 | 7/28/2014 | 1975 | ||||||||||||||||
| Red Lobster | Eau Claire | WI | — | 527 | 1,534 | — | 2,061 | 28 | 7/28/2014 | 1982 | ||||||||||||||||
| Red Lobster | Greenfield | WI | — | 1,823 | 1,673 | — | 3,496 | 25 | 7/28/2014 | 1975 | ||||||||||||||||
| Red Lobster | La Crosse | WI | — | 1,087 | 965 | — | 2,052 | 23 | 7/28/2014 | 1991 | ||||||||||||||||
| Red Lobster | Madison | WI | — | 2,186 | 1,220 | — | 3,406 | 23 | 7/28/2014 | 1983 | ||||||||||||||||
| Red Lobster | Mt. Pleasant | WI | — | 856 | 1,773 | — | 2,629 | 36 | 7/28/2014 | 2012 | ||||||||||||||||
| Red Lobster | Wauwatosa | WI | — | 1,524 | 997 | — | 2,521 | 18 | 7/28/2014 | 1975 | ||||||||||||||||
| Red Lobster | Charleston | WV | — | — | 1,100 | — | 1,100 | 40 | 7/28/2014 | 2003 | ||||||||||||||||
| Red Lobster | Huntington | WV | — | 344 | 2,552 | — | 2,896 | 39 | 7/28/2014 | 1985 | ||||||||||||||||
| Red Lobster | Morgantown | WV | — | 1,252 | 1,477 | — | 2,729 | 30 | 7/28/2014 | 2009 | ||||||||||||||||
| Red Lobster | Parkersburg | WV | — | 654 | 1,447 | — | 2,101 | 29 | 7/28/2014 | 1994 | ||||||||||||||||
| Red Lobster | Casper | WY | — | 1,014 | 1,337 | — | 2,351 | 31 | 7/28/2014 | 2011 | ||||||||||||||||
| Red Lobster | Cheyenne | WY | — | 1,514 | 640 | — | 2,154 | 11 | 7/28/2014 | 1992 | ||||||||||||||||
| Red Oak Village | San Marcos | TX | 12,480 | 5,287 | 20,357 | — | 25,644 | 915 | 2/7/2014 | 2006 | ||||||||||||||||
| Reef Services, LLC | Gainesville | TX | — | 86 | 285 | — | 371 | 7 | 6/25/2014 | 2009 | ||||||||||||||||
| Rite Aid | Talladega | AL | — | 377 | 1,311 | — | 1,688 | 76 | 1/8/2014 | 1997 | ||||||||||||||||
F-217
| Initial Costs | Costs Capitalized Subsequent to Acquisition | Gross Amount Carried at December 31, 2014 (1) (2) | ||||||||||||||||||||||||
| Property | City | State | Encumbrances at December 31, 2014 | Land | Buildings, Fixtures and Improvements | Accumulated Depreciation (3) (4) | Date Acquired | Date of Construction | ||||||||||||||||||
| Rite Aid | Bear | DE | — | 851 | 2,702 | — | 3,553 | 160 | 1/8/2014 | 1999 | ||||||||||||||||
| Rite Aid | Tucker | GA | — | 793 | 1,419 | — | 2,212 | 82 | 1/8/2014 | 1996 | ||||||||||||||||
| Rite Aid | Jeffersonville | IN | — | 824 | 2,472 | — | 3,296 | 315 | 11/30/2012 | 2008 | ||||||||||||||||
| Rite Aid | Lawrenceburg | KY | — | 567 | 2,267 | — | 2,834 | 289 | 11/30/2012 | 2008 | ||||||||||||||||
| Rite Aid | Lexington | KY | — | — | 1,943 | — | 1,943 | 248 | 11/30/2012 | 2007 | ||||||||||||||||
| Rite Aid | Paris | KY | — | 743 | 2,228 | — | 2,971 | 284 | 11/30/2012 | 2008 | ||||||||||||||||
| Rite Aid | Scottsville | KY | — | 153 | 2,904 | — | 3,057 | 370 | 11/30/2012 | 2007 | ||||||||||||||||
| Rite Aid | Stanford | KY | — | 152 | 2,886 | — | 3,038 | 368 | 11/30/2012 | 2009 | ||||||||||||||||
| Rite Aid | Adams | MA | — | 300 | 1,200 | — | 1,500 | 105 | 7/30/2013 | 1958 | ||||||||||||||||
| Rite Aid | Bangor | ME | 2,256 | 724 | 2,896 | — | 3,620 | 107 | 5/19/2014 | 1998 | ||||||||||||||||
| Rite Aid | Buxton | ME | 1,399 | 413 | 1,650 | — | 2,063 | 62 | 5/19/2014 | 1997 | ||||||||||||||||
| Rite Aid | Dover-foxcroft | ME | — | 256 | 2,659 | — | 2,915 | 158 | 1/8/2014 | 1999 | ||||||||||||||||
| Rite Aid | Fort Fairfield | ME | — | 117 | 1,821 | — | 1,938 | 109 | 1/8/2014 | 1998 | ||||||||||||||||
| Rite Aid | Fort Kent | ME | — | 387 | 2,064 | — | 2,451 | 120 | 1/8/2014 | 1999 | ||||||||||||||||
| Rite Aid | Van Buren | ME | — | 115 | 1,720 | — | 1,835 | 103 | 1/8/2014 | 1998 | ||||||||||||||||
| Rite Aid | Bay City | MI | — | 463 | 1,629 | — | 2,092 | 48 | 6/24/2014 | 1996 | ||||||||||||||||
| Rite Aid | Burton | MI | — | 128 | 2,541 | — | 2,669 | 224 | 7/26/2013 | 1999 | ||||||||||||||||
| Rite Aid | West Branch | MI | — | 418 | 1,280 | — | 1,698 | 41 | 6/23/2014 | 1996 | ||||||||||||||||
| Rite Aid | Burlington | NC | — | 973 | 2,726 | — | 3,699 | 162 | 1/8/2014 | 2000 | ||||||||||||||||
| Rite Aid | Wilson | NC | — | 573 | 1,337 | — | 1,910 | 117 | 7/30/2013 | 2002 | ||||||||||||||||
| Rite Aid | Bristol | NH | — | 395 | 1,461 | — | 1,856 | 88 | 1/8/2014 | 1997 | ||||||||||||||||
| Rite Aid | Winchester | NH | — | 343 | 1,868 | — | 2,211 | 111 | 1/8/2014 | 1998 | ||||||||||||||||
| Rite Aid | Cheektowaga | NY | — | 436 | 3,466 | — | 3,902 | 173 | 2/7/2014 | 2000 | ||||||||||||||||
| Rite Aid | Genoa | OH | — | 405 | 1,845 | — | 2,250 | 107 | 1/8/2014 | 1998 | ||||||||||||||||
| Rite Aid | Lima | OH | — | 576 | 2,304 | — | 2,880 | 294 | 11/13/2012 | 2006 | ||||||||||||||||
| Rite Aid | Louisville | OH | — | 576 | 3,266 | — | 3,842 | 433 | 10/31/2012 | 2008 | ||||||||||||||||
| Rite Aid | Marion | OH | — | 508 | 2,877 | — | 3,385 | 367 | 11/13/2012 | 2006 | ||||||||||||||||
| Rite Aid | St. Marys | OH | — | 581 | 2,322 | — | 2,903 | 83 | 5/19/2014 | 2005 | ||||||||||||||||
F-218
| Initial Costs | Costs Capitalized Subsequent to Acquisition | Gross Amount Carried at December 31, 2014 (1) (2) | ||||||||||||||||||||||||
| Property | City | State | Encumbrances at December 31, 2014 | Land | Buildings, Fixtures and Improvements | Accumulated Depreciation (3) (4) | Date Acquired | Date of Construction | ||||||||||||||||||
| Rite Aid | Warren | OH | 2,031 | 668 | 2,670 | — | 3,338 | 98 | 5/19/2014 | 1999 | ||||||||||||||||
| Rite Aid | Wheelersburg | OH | 1,199 | 361 | 1,444 | — | 1,805 | 54 | 5/19/2014 | 1998 | ||||||||||||||||
| Rite Aid | Meadville | PA | — | 193 | 2,521 | — | 2,714 | 146 | 1/8/2014 | 1999 | ||||||||||||||||
| Rite Aid | Philadelphia | PA | 2,082 | 633 | 2,531 | — | 3,164 | 94 | 5/19/2014 | 1999 | ||||||||||||||||
| Rite Aid | Spartanburg | SC | — | 894 | 3,575 | — | 4,469 | 128 | 5/19/2014 | 2004 | ||||||||||||||||
| Rite Aid | Travelers Rest | SC | — | 882 | 3,527 | — | 4,409 | 126 | 5/19/2014 | 2005 | ||||||||||||||||
| Rite Aid | Memphis | TN | — | 266 | 1,062 | — | 1,328 | 40 | 5/19/2014 | 2000 | ||||||||||||||||
| Rite Aid | Murfreesboro | TN | 1,496 | 454 | 1,817 | — | 2,271 | 65 | 5/19/2014 | 1999 | ||||||||||||||||
| Rite Aid | Hayes | VA | — | 812 | 3,247 | — | 4,059 | 116 | 5/19/2014 | 2005 | ||||||||||||||||
| Rite Aid | Huntington | WV | — | 964 | 2,250 | — | 3,214 | 287 | 11/30/2012 | 2008 | ||||||||||||||||
| Road Ranger | Winnebago | IL | — | 707 | 3,202 | — | 3,909 | 162 | 2/7/2014 | 1998 | ||||||||||||||||
| Rockwell Collins | Sterling | VA | — | 4,285 | 29,802 | — | 34,087 | 754 | 6/30/2014 | 2011 | ||||||||||||||||
| Ross | Highlands Ranch | CO | 3,475 | 2,850 | 4,795 | — | 7,645 | 214 | 2/7/2014 | 2007 | ||||||||||||||||
| Rubbermaid | Winfield | KS | — | 819 | 15,555 | — | 16,374 | 2,016 | 11/28/2012 | 2012 | ||||||||||||||||
| Rubbermaid | Winfield | KS | 12,725 | 1,056 | 20,060 | — | 21,116 | 3,314 | 4/25/2012 | 2008 | ||||||||||||||||
| Rubbermaid | Bowling Green | OH | — | 714 | 13,564 | — | 14,278 | 1,207 | 7/29/2013 | 2013 | ||||||||||||||||
| Rubbermaid | Brimfield | OH | — | 1,552 | 29,495 | — | 31,047 | 3,523 | 1/31/2013 | 2012 | ||||||||||||||||
| Ruby Tuesday | Colorado Springs | CO | — | 480 | 809 | — | 1,289 | 68 | 6/27/2013 | 1995 | ||||||||||||||||
| Ruby Tuesday | Dillon | CO | — | 400 | 1,628 | — | 2,028 | 136 | 6/27/2013 | 1995 | ||||||||||||||||
| Ruby Tuesday | Bartow | FL | — | 270 | 1,916 | — | 2,186 | 160 | 6/27/2013 | 1995 | ||||||||||||||||
| Ruby Tuesday | Orlando | FL | — | 1,286 | — | — | 1,286 | — | 7/31/2013 | 1998 | ||||||||||||||||
| Ruby Tuesday | London | KY | — | 370 | 1,493 | — | 1,863 | 125 | 6/27/2013 | 1995 | ||||||||||||||||
| Ruby Tuesday | Somerset | KY | — | 480 | 1,120 | — | 1,600 | 94 | 6/27/2013 | 1995 | ||||||||||||||||
| Ryan's Buffet | Jasper | AL | — | 577 | 2,545 | — | 3,122 | 141 | 2/7/2014 | 2000 | ||||||||||||||||
| Ryan's Buffet | Prattville | AL | — | 1,038 | 1,802 | — | 2,840 | 106 | 2/7/2014 | 1997 | ||||||||||||||||
| Ryan's Buffet | Columbus | GA | — | 1,307 | 2,529 | — | 3,836 | 147 | 2/7/2014 | 2002 | ||||||||||||||||
| Ryan's Buffet | Commerce | GA | — | 962 | 1,470 | — | 2,432 | 90 | 2/7/2014 | 1996 | ||||||||||||||||
| Ryan's Buffet | Rome | GA | — | 831 | 1,848 | — | 2,679 | 103 | 2/7/2014 | 1983 | ||||||||||||||||
F-219
| Initial Costs | Costs Capitalized Subsequent to Acquisition | Gross Amount Carried at December 31, 2014 (1) (2) | ||||||||||||||||||||||||
| Property | City | State | Encumbrances at December 31, 2014 | Land | Buildings, Fixtures and Improvements | Accumulated Depreciation (3) (4) | Date Acquired | Date of Construction | ||||||||||||||||||
| Ryan's Buffet | Owensboro | KY | — | 1,244 | 1,656 | — | 2,900 | 99 | 2/7/2014 | 1997 | ||||||||||||||||
| Ryan's Buffet | Paducah | KY | — | 1,121 | 1,443 | — | 2,564 | 87 | 2/7/2014 | 1995 | ||||||||||||||||
| Ryan's Buffet | Pearl | MS | — | 1,058 | 1,857 | — | 2,915 | 109 | 2/7/2014 | 2000 | ||||||||||||||||
| Ryan's Buffet | Asheville | NC | — | 1,261 | 2,204 | — | 3,465 | 128 | 2/7/2014 | 1996 | ||||||||||||||||
| Ryan's Buffet | Lexington | SC | — | 244 | 1,307 | — | 1,551 | 76 | 1/8/2014 | 1998 | ||||||||||||||||
| Ryan's Buffet | Sevierville | TN | — | 1,443 | 430 | — | 1,873 | 37 | 2/7/2014 | 2003 | ||||||||||||||||
| Ryan's Buffet | Texas City | TX | — | 614 | 3,351 | — | 3,965 | 162 | 2/7/2014 | 2002 | ||||||||||||||||
| Ryan's Buffet | Beckley | WV | — | 1,248 | 2,258 | — | 3,506 | 133 | 2/7/2014 | 1995 | ||||||||||||||||
| Ryan's Buffet | Clarksburg | WV | — | — | 1,639 | — | 1,639 | 88 | 1/8/2014 | 2001 | ||||||||||||||||
| Sakura Tepanyaki Steakhouse | Orem | UT | — | 340 | 658 | — | 998 | 55 | 6/27/2013 | 1995 | ||||||||||||||||
| Saltwater Willy's | Grapevine | TX | — | 572 | 868 | — | 1,440 | 77 | 6/27/2013 | 1999 | ||||||||||||||||
| Sam's Club | Hoover | AL | — | 2,253 | 9,606 | — | 11,859 | 412 | 2/7/2014 | 1989 | ||||||||||||||||
| Sam's Club | Colorado Springs | CO | — | 3,347 | 12,652 | — | 15,999 | 534 | 2/7/2014 | 1998 | ||||||||||||||||
| Sam's Club | Douglasville | GA | — | 1,701 | 11,052 | — | 12,753 | 435 | 2/7/2014 | 1999 | ||||||||||||||||
| Sam's Southern Eatery | Kennesaw | GA | — | 210 | 46 | — | 256 | 4 | 6/27/2013 | 1995 | ||||||||||||||||
| Santa Rosa Commons | Pace | FL | 13,000 | 4,447 | 21,884 | — | 26,331 | 936 | 2/7/2014 | 2008 | ||||||||||||||||
| Schlotzsky's | Colorado Springs | CO | — | 530 | 530 | — | 1,060 | 45 | 6/27/2013 | 1997 | ||||||||||||||||
| Schlotzsky's | Louisville | KY | — | 321 | 342 | — | 663 | 29 | 6/27/2013 | 1998 | ||||||||||||||||
| Schmitz & Schmitz | Gainesville | TX | — | 29 | 1,950 | — | 1,979 | 40 | 6/25/2014 | 1930 | ||||||||||||||||
| Scotts Company | Orrville | OH | — | 278 | 2,502 | — | 2,780 | 350 | 9/28/2012 | 1950 | ||||||||||||||||
| Scotts Company | Orrville | OH | — | 611 | 1,134 | — | 1,745 | 170 | 7/30/2012 | 1950 | ||||||||||||||||
| Scotts Company | Orrville | OH | — | 609 | 11,576 | — | 12,185 | 1,736 | 7/30/2012 | 2006 | ||||||||||||||||
| SCP Distributors | North Little Rock | AR | — | 258 | 1,665 | — | 1,923 | 11 | 11/20/2014 | 2006 | ||||||||||||||||
| SCP Distributors | Knoxville | TN | — | 251 | 900 | — | 1,151 | 10 | 11/20/2014 | 2012 | ||||||||||||||||
| Sedwick Claims Management Services | Dublin | OH | — | 945 | 8,520 | — | 9,465 | 222 | 6/26/2014 | 1997 | ||||||||||||||||
F-220
| Initial Costs | Costs Capitalized Subsequent to Acquisition | Gross Amount Carried at December 31, 2014 (1) (2) | ||||||||||||||||||||||||
| Property | City | State | Encumbrances at December 31, 2014 | Land | Buildings, Fixtures and Improvements | Accumulated Depreciation (3) (4) | Date Acquired | Date of Construction | ||||||||||||||||||
| Select Energy Services | Damascus | AR | — | 530 | 800 | — | 1,330 | 36 | 6/12/2014 | 2009 | ||||||||||||||||
| Select Energy Services | Frierson | LA | — | 260 | 4,954 | — | 5,214 | 120 | 6/12/2014 | 2010 | ||||||||||||||||
| Select Energy Services | Alderson | OK | — | 260 | 1,150 | — | 1,410 | 35 | 6/12/2014 | 2008 | ||||||||||||||||
| Select Energy Services | Big Wells | TX | — | 353 | 1,820 | — | 2,173 | 45 | 6/12/2014 | 2011 | ||||||||||||||||
| Select Energy Services | Chireno | TX | — | 388 | 5,470 | — | 5,858 | 132 | 6/25/2014 | 2011 | ||||||||||||||||
| Select Energy Services | Cleburne | TX | — | 154 | 2,333 | — | 2,487 | 57 | 6/25/2014 | 2008 | ||||||||||||||||
| Select Energy Services | Dilley | TX | — | 308 | 1,416 | — | 1,724 | 36 | 6/25/2014 | 2012 | ||||||||||||||||
| Select Energy Services | Odessa | TX | — | 460 | 1,998 | — | 2,458 | 54 | 6/25/2014 | 1982 | ||||||||||||||||
| Senor Panchos | Orrville | OH | — | 99 | 176 | — | 275 | 16 | 6/27/2013 | 1990 | ||||||||||||||||
| Shale Tank Truck | Cleburne | TX | — | 476 | 547 | — | 1,023 | 15 | 6/25/2014 | 2007 | ||||||||||||||||
| Shale Tank Truck | Midland | TX | — | 757 | 939 | — | 1,696 | 26 | 6/25/2014 | 2012 | ||||||||||||||||
| Shaw's Supermarket | Plymouth | MA | — | 1,440 | 3,361 | — | 4,801 | 639 | 4/18/2012 | 1995 | ||||||||||||||||
| Sherwin-Williams | Angola | IN | 616 | 249 | 996 | — | 1,245 | 34 | 5/19/2014 | 2001 | ||||||||||||||||
| Sherwin-Williams | Muskegon | MI | — | 187 | 1,524 | — | 1,711 | 71 | 2/7/2014 | 2008 | ||||||||||||||||
| Sherwin-Williams | Ashtabula | OH | 432 | 176 | 704 | — | 880 | 19 | 5/19/2014 | 2003 | ||||||||||||||||
| Sherwin-Williams | Boardman | OH | 533 | 206 | 825 | — | 1,031 | 22 | 5/19/2014 | 2003 | ||||||||||||||||
| Shoney's | Gadsden | AL | — | 220 | 707 | — | 927 | 59 | 6/27/2013 | 1995 | ||||||||||||||||
| Shoney's | Oxford | AL | — | 670 | 25 | — | 695 | 2 | 6/27/2013 | 1995 | ||||||||||||||||
| Shoney's | Elizabethtown | KY | — | 450 | 465 | — | 915 | 39 | 6/27/2013 | 1995 | ||||||||||||||||
| Shoney's | Grayson | KY | — | 420 | 406 | — | 826 | 34 | 6/27/2013 | 1995 | ||||||||||||||||
| Shoney's | Grenada | MS | — | 270 | 809 | — | 1,079 | 62 | 7/31/2013 | 1995 | ||||||||||||||||
| Shoney's | Hattiesburg | MS | — | 730 | 618 | — | 1,348 | 52 | 6/27/2013 | 1995 | ||||||||||||||||
| Shoney's | Jackson | MS | — | 360 | 572 | — | 932 | 48 | 6/27/2013 | 1995 | ||||||||||||||||
| Shoney's | Columbia | SC | — | 446 | 545 | — | 991 | 42 | 7/31/2013 | 1985 | ||||||||||||||||
| Shoney's | Summerville | SC | — | 350 | 800 | — | 1,150 | 67 | 6/27/2013 | 1995 | ||||||||||||||||
| Shoney's | West Columbia | SC | — | 392 | 262 | — | 654 | 20 | 7/31/2013 | 1977 | ||||||||||||||||
| Shoney's | Cookeville | TN | — | 510 | 760 | — | 1,270 | 64 | 6/27/2013 | 1995 | ||||||||||||||||
| Shoney's | Lawrenceburg | TN | — | 330 | 873 | — | 1,203 | 73 | 6/27/2013 | 1995 | ||||||||||||||||
F-221
| Initial Costs | Costs Capitalized Subsequent to Acquisition | Gross Amount Carried at December 31, 2014 (1) (2) | ||||||||||||||||||||||||
| Property | City | State | Encumbrances at December 31, 2014 | Land | Buildings, Fixtures and Improvements | Accumulated Depreciation (3) (4) | Date Acquired | Date of Construction | ||||||||||||||||||
| Shoney's | Charleston | WV | — | 190 | 543 | — | 733 | 45 | 6/27/2013 | 1995 | ||||||||||||||||
| Shoney's | Lewisburg | WV | — | 110 | 642 | — | 752 | 54 | 6/27/2013 | 1995 | ||||||||||||||||
| Shoney's | Princeton | WV | — | 90 | 593 | — | 683 | 50 | 6/27/2013 | 1995 | ||||||||||||||||
| Shoney's | Ripley | WV | — | 200 | 599 | — | 799 | 50 | 6/27/2013 | 1995 | ||||||||||||||||
| Shopko | L’Anse | MI | — | 382 | 1,736 | — | 2,118 | 64 | 5/13/2014 | 2009 | ||||||||||||||||
| Sierra Pines II | The Woodlands | TX | 6,793 | 5,219 | 19,196 | — | 24,415 | 58 | 11/17/2014 | 2014 | ||||||||||||||||
| Smokey Bones | Morrow | GA | — | 390 | 2,184 | — | 2,574 | 183 | 6/27/2013 | 1995 | ||||||||||||||||
| Smokey Bones | Pittsburgh | PA | — | 1,490 | 390 | — | 1,880 | 15 | 7/28/2014 | 2000 | ||||||||||||||||
| Snowflake Donut Shop | Gun Barrel City | TX | — | 241 | 383 | 4 | 628 | 33 | 6/27/2013 | 2008 | ||||||||||||||||
| Sonic Drive-In | Crystal River | FL | — | 107 | 322 | — | 429 | 25 | 7/31/2013 | 2008 | ||||||||||||||||
| Sonic Drive-In | Mulberry | FL | — | 165 | 298 | — | 463 | 25 | 6/27/2013 | 2004 | ||||||||||||||||
| Sonic Drive-In | Spring Hill | FL | — | 79 | 252 | — | 331 | 22 | 6/27/2013 | 2003 | ||||||||||||||||
| Sonic Drive-In | Wadesboro | NC | — | 137 | 266 | — | 403 | 23 | 6/27/2013 | 2007 | ||||||||||||||||
| Sonny's Real Pit BBQ | Venice | FL | — | 338 | 507 | — | 845 | 44 | 7/31/2013 | 1978 | ||||||||||||||||
| Sonny's Real Pit BBQ | Athens | GA | — | 460 | 1,280 | — | 1,740 | 107 | 6/27/2013 | 1995 | ||||||||||||||||
| Sonny's Real Pit BBQ | Conyers | GA | — | 450 | 663 | — | 1,113 | 55 | 6/27/2013 | 1995 | ||||||||||||||||
| Sonny's Real Pit BBQ | Marietta | GA | — | 290 | 1,772 | — | 2,062 | 148 | 6/27/2013 | 1995 | ||||||||||||||||
| Sovereign Bank | Linden | NJ | — | 601 | 2,329 | — | 2,930 | 125 | 1/8/2014 | 1945 | ||||||||||||||||
| Sovereign Bank | Kennett Square | PA | — | 837 | 2,412 | — | 3,249 | 130 | 1/8/2014 | 1963 | ||||||||||||||||
| Spaghetti Warehouse | Marietta | GA | — | 800 | 276 | — | 1,076 | 23 | 6/27/2013 | 1995 | ||||||||||||||||
| Spaghetti Warehouse | Aurora | IL | — | 480 | 805 | — | 1,285 | 67 | 6/27/2013 | 1995 | ||||||||||||||||
| Spaghetti Warehouse | Elk Grove Village | IL | — | 550 | 299 | — | 849 | 25 | 6/27/2013 | 1995 | ||||||||||||||||
| Spaghetti Warehouse | Oklahoma City | OK | — | 570 | 1,193 | — | 1,763 | 100 | 6/27/2013 | 1995 | ||||||||||||||||
| Spaghetti Warehouse | Tulsa | OK | — | 530 | 1,174 | — | 1,704 | 98 | 6/27/2013 | 1995 | ||||||||||||||||
| Spaghetti Warehouse | Memphis | TN | — | 100 | 283 | — | 383 | 24 | 6/27/2013 | 1995 | ||||||||||||||||
| Spaghetti Warehouse | Arlington | TX | — | 630 | 1,400 | — | 2,030 | 117 | 6/27/2013 | 1995 | ||||||||||||||||
| Spaghetti Warehouse | Dallas | TX | — | 810 | 1,656 | — | 2,466 | 138 | 6/27/2013 | 1995 | ||||||||||||||||
| Spaghetti Warehouse | Houston | TX | — | 980 | 2,284 | — | 3,264 | 191 | 6/27/2013 | 1995 | ||||||||||||||||
F-222
| Initial Costs | Costs Capitalized Subsequent to Acquisition | Gross Amount Carried at December 31, 2014 (1) (2) | ||||||||||||||||||||||||
| Property | City | State | Encumbrances at December 31, 2014 | Land | Buildings, Fixtures and Improvements | Accumulated Depreciation (3) (4) | Date Acquired | Date of Construction | ||||||||||||||||||
| Spaghetti Warehouse | Plano | TX | — | 540 | 1,060 | — | 1,600 | 89 | 6/27/2013 | 1995 | ||||||||||||||||
| Spaghetti Warehouse | San Antonio | TX | — | 1,140 | 1,434 | — | 2,574 | 120 | 6/27/2013 | 1995 | ||||||||||||||||
| Sports Wings | Sumter | SC | — | 73 | 109 | — | 182 | 8 | 7/31/2013 | 1988 | ||||||||||||||||
| Sprouts | Centennial | CO | — | 1,581 | 6,394 | — | 7,975 | 318 | 2/7/2014 | 2009 | ||||||||||||||||
| St. Luke's Urgent Care | Creve Coeur | MO | — | 1,644 | 4,497 | — | 6,141 | 231 | 2/7/2014 | 2010 | ||||||||||||||||
| Staples | Pensacola | FL | — | 1,539 | 3,354 | — | 4,893 | 135 | 2/7/2014 | 2010 | ||||||||||||||||
| Staples | Helena | MT | — | 1,159 | 2,452 | — | 3,611 | 105 | 2/7/2014 | 2012 | ||||||||||||||||
| Staples | Houston | TX | 1,815 | 1,169 | 3,192 | — | 4,361 | 129 | 2/7/2014 | 2008 | ||||||||||||||||
| Steak 'n Shake | Tampa | FL | — | 951 | — | — | 951 | — | 7/31/2013 | 1999 | ||||||||||||||||
| Stearns Crossing | Bartlett | IL | 7,060 | 4,437 | 5,970 | 2 | 10,409 | 371 | 2/7/2014 | 1999 | ||||||||||||||||
| Stop & Shop | Levittown | PA | 13,076 | 4,716 | 9,955 | — | 14,671 | 559 | 11/5/2013 | 1995 | ||||||||||||||||
| Stop & Shop | Cranston | RI | — | 4,309 | — | — | 4,309 | — | 2/7/2014 | 2011 | ||||||||||||||||
| Stripes | Portales | NM | — | 306 | 2,595 | — | 2,901 | 138 | 2/7/2014 | 2010 | ||||||||||||||||
| Stripes | Andrews | TX | — | 406 | 2,302 | — | 2,708 | 242 | 2/15/2013 | 2008 | ||||||||||||||||
| Stripes | Brady | TX | — | 203 | 3,205 | — | 3,408 | 156 | 2/7/2014 | 2007 | ||||||||||||||||
| Stripes | Brownsville | TX | — | 613 | 3,195 | — | 3,808 | 160 | 2/7/2014 | 2007 | ||||||||||||||||
| Stripes | Carrizo Springs | TX | — | 496 | 2,526 | — | 3,022 | 138 | 2/7/2014 | 2010 | ||||||||||||||||
| Stripes | Corpus Christi | TX | — | 681 | 2,047 | — | 2,728 | 104 | 2/7/2014 | 2007 | ||||||||||||||||
| Stripes | Corpus Christi | TX | — | 1,011 | 3,125 | — | 4,136 | 157 | 2/7/2014 | 2007 | ||||||||||||||||
| Stripes | Corpus Christi | TX | — | 803 | 3,109 | — | 3,912 | 156 | 2/7/2014 | 2007 | ||||||||||||||||
| Stripes | Eagle Pass | TX | — | 762 | 2,453 | — | 3,215 | 125 | 2/7/2014 | 2009 | ||||||||||||||||
| Stripes | Edinburg | TX | — | 1,286 | 1,546 | — | 2,832 | 80 | 2/7/2014 | 1999 | ||||||||||||||||
| Stripes | Edinburg | TX | — | 488 | 2,499 | — | 2,987 | 135 | 2/7/2014 | 2007 | ||||||||||||||||
| Stripes | Edinburg | TX | — | 450 | 2,818 | — | 3,268 | 127 | 2/7/2014 | 2007 | ||||||||||||||||
| Stripes | Fort Stockton | TX | — | 1,237 | 3,812 | — | 5,049 | 224 | 2/7/2014 | 2010 | ||||||||||||||||
| Stripes | Haskell | TX | — | 143 | 2,554 | — | 2,697 | 135 | 2/7/2014 | 2010 | ||||||||||||||||
| Stripes | Houston | TX | — | 1,204 | 2,069 | — | 3,273 | 102 | 2/7/2014 | 2007 | ||||||||||||||||
| Stripes | La Feria | TX | — | 219 | 1,970 | — | 2,189 | 208 | 2/15/2013 | 2008 | ||||||||||||||||
F-223
| Initial Costs | Costs Capitalized Subsequent to Acquisition | Gross Amount Carried at December 31, 2014 (1) (2) | ||||||||||||||||||||||||
| Property | City | State | Encumbrances at December 31, 2014 | Land | Buildings, Fixtures and Improvements | Accumulated Depreciation (3) (4) | Date Acquired | Date of Construction | ||||||||||||||||||
| Stripes | Laredo | TX | — | 581 | 2,367 | — | 2,948 | 127 | 2/7/2014 | 2010 | ||||||||||||||||
| Stripes | Laredo | TX | — | 626 | 2,338 | — | 2,964 | 128 | 2/7/2014 | 2010 | ||||||||||||||||
| Stripes | Midland | TX | — | 1,098 | 4,857 | — | 5,955 | 242 | 2/7/2014 | 2006 | ||||||||||||||||
| Stripes | Mission | TX | — | 742 | 550 | — | 1,292 | 26 | 2/7/2014 | 1986 | ||||||||||||||||
| Stripes | Mission | TX | — | 1,007 | 3,178 | — | 4,185 | 149 | 2/7/2014 | 2003 | ||||||||||||||||
| Stripes | Odessa | TX | — | 301 | 2,895 | — | 3,196 | 146 | 2/7/2014 | 2011 | ||||||||||||||||
| Stripes | Odessa | TX | — | 803 | 3,596 | — | 4,399 | 261 | 2/7/2014 | 1998 | ||||||||||||||||
| Stripes | Pharr | TX | — | 281 | 2,531 | — | 2,812 | 267 | 2/15/2013 | 1995 | ||||||||||||||||
| Stripes | Ranchito | TX | — | 498 | 2,671 | — | 3,169 | 133 | 2/7/2014 | 2010 | ||||||||||||||||
| Stripes | Rio Hondo | TX | — | 293 | 2,640 | — | 2,933 | 278 | 2/15/2013 | 2008 | ||||||||||||||||
| Stripes | San Angelo | TX | — | 772 | 4,025 | — | 4,797 | 201 | 2/7/2014 | 1997 | ||||||||||||||||
| Stripes | �� | San Angelo | TX | — | 1,006 | 3,277 | — | 4,283 | 164 | 2/7/2014 | 2007 | |||||||||||||||
| Subway | Knoxville | TN | — | 160 | 349 | — | 509 | 28 | 6/27/2013 | 1995 | ||||||||||||||||
| Sun Trust Bank | Coral Springs | FL | — | 654 | 1,525 | — | 2,179 | 140 | 4/12/2013 | 1996 | ||||||||||||||||
| Sun Trust Bank | Destin | FL | — | 572 | 1,717 | — | 2,289 | 157 | 4/12/2013 | 1998 | ||||||||||||||||
| Sun Trust Bank | Dunedin | FL | — | 479 | 1,917 | — | 2,396 | 184 | 3/22/2013 | 1995 | ||||||||||||||||
| Sun Trust Bank | Dunnellon | FL | — | 82 | 463 | — | 545 | 44 | 3/22/2013 | 1980 | ||||||||||||||||
| Sun Trust Bank | Hudson | FL | — | 448 | 1,345 | — | 1,793 | 129 | 3/22/2013 | 1995 | ||||||||||||||||
| Sun Trust Bank | Kissimmee | FL | — | 1,167 | 778 | — | 1,945 | 71 | 4/12/2013 | 1981 | ||||||||||||||||
| Sun Trust Bank | Lake Wales | FL | — | 671 | 671 | — | 1,342 | 64 | 3/22/2013 | 1988 | ||||||||||||||||
| Sun Trust Bank | Lakeland | FL | — | 598 | 1,110 | — | 1,708 | 102 | 4/12/2013 | 1988 | ||||||||||||||||
| Sun Trust Bank | Melbourne | FL | — | 464 | 1,392 | — | 1,856 | 127 | 4/12/2013 | 1987 | ||||||||||||||||
| Sun Trust Bank | Miami | FL | — | 1,393 | 1,140 | — | 2,533 | 104 | 4/12/2013 | 1982 | ||||||||||||||||
| Sun Trust Bank | North Port | FL | — | 460 | 1,381 | — | 1,841 | 133 | 3/22/2013 | 1982 | ||||||||||||||||
| Sun Trust Bank | Orlando | FL | — | 805 | 1,208 | — | 2,013 | 111 | 4/12/2013 | 1988 | ||||||||||||||||
| Sun Trust Bank | Palm Harbor | FL | — | 535 | 1,249 | — | 1,784 | 114 | 4/12/2013 | 1994 | ||||||||||||||||
| Sun Trust Bank | Pensacola | FL | — | 886 | 725 | — | 1,611 | 66 | 4/12/2013 | 1979 | ||||||||||||||||
| Sun Trust Bank | Plant City | FL | — | 751 | 1,753 | — | 2,504 | 168 | 3/22/2013 | 2000 | ||||||||||||||||
F-224
| Initial Costs | Costs Capitalized Subsequent to Acquisition | Gross Amount Carried at December 31, 2014 (1) (2) | ||||||||||||||||||||||||
| Property | City | State | Encumbrances at December 31, 2014 | Land | Buildings, Fixtures and Improvements | Accumulated Depreciation (3) (4) | Date Acquired | Date of Construction | ||||||||||||||||||
| Sun Trust Bank | Port Orange | FL | — | 590 | 1,095 | — | 1,685 | 105 | 3/22/2013 | 1989 | ||||||||||||||||
| Sun Trust Bank | Port Orange | FL | — | 563 | 1,314 | — | 1,877 | 126 | 3/22/2013 | 1982 | ||||||||||||||||
| Sun Trust Bank | S. Daytona Beach | FL | — | 592 | 1,099 | — | 1,691 | 101 | 4/12/2013 | 1985 | ||||||||||||||||
| Sun Trust Bank | Tallahassee | FL | — | 828 | 1,933 | — | 2,761 | 177 | 4/12/2013 | 1991 | ||||||||||||||||
| Sun Trust Bank | West Palm Beach | FL | — | 1,026 | 1,026 | — | 2,052 | 98 | 3/22/2013 | 1981 | ||||||||||||||||
| Sun Trust Bank | Atlanta | GA | — | 1,018 | 1,527 | — | 2,545 | 140 | 4/12/2013 | 1965 | ||||||||||||||||
| Sun Trust Bank | Atlanta | GA | — | 1,435 | 478 | — | 1,913 | 44 | 4/12/2013 | 1970 | ||||||||||||||||
| Sun Trust Bank | Bowdon | GA | — | 416 | 1,247 | — | 1,663 | 120 | 3/22/2013 | 1900 | ||||||||||||||||
| Sun Trust Bank | Dunwoody | GA | — | 1,784 | 1,460 | — | 3,244 | 140 | 3/22/2013 | 1972 | ||||||||||||||||
| Sun Trust Bank | Jesup | GA | — | 184 | 1,657 | — | 1,841 | 159 | 3/22/2013 | 1964 | ||||||||||||||||
| Sun Trust Bank | Roswell | GA | — | 1,425 | 950 | — | 2,375 | 87 | 4/12/2013 | 1988 | ||||||||||||||||
| Sun Trust Bank | St. Simons Island | GA | — | 1,363 | 734 | — | 2,097 | 70 | 3/22/2013 | 1975 | ||||||||||||||||
| Sun Trust Bank | Annapolis | MD | — | 2,653 | 2,170 | — | 4,823 | 170 | 7/23/2013 | 1976 | ||||||||||||||||
| Sun Trust Bank | Ellicott City | MD | — | 1,728 | 931 | — | 2,659 | 89 | 3/22/2013 | 1975 | ||||||||||||||||
| Sun Trust Bank | Frederick | MD | — | 991 | 991 | — | 1,982 | 91 | 4/26/2013 | 1880 | ||||||||||||||||
| Sun Trust Bank | Waldorf | MD | — | 523 | 2,962 | — | 3,485 | 284 | 3/22/2013 | 1964 | ||||||||||||||||
| Sun Trust Bank | Belmont | NC | — | 616 | 924 | — | 1,540 | 89 | 3/22/2013 | 1970 | ||||||||||||||||
| Sun Trust Bank | Burlington | NC | — | 446 | 545 | — | 991 | 50 | 4/12/2013 | 1995 | ||||||||||||||||
| Sun Trust Bank | Carrboro | NC | — | 512 | 512 | — | 1,024 | 47 | 4/12/2013 | 1980 | ||||||||||||||||
| Sun Trust Bank | Concord | NC | — | 707 | 707 | — | 1,414 | 65 | 4/12/2013 | 1988 | ||||||||||||||||
| Sun Trust Bank | Durham | NC | — | 747 | 1,388 | — | 2,135 | 127 | 4/12/2013 | 1973 | ||||||||||||||||
| Sun Trust Bank | Greensboro | NC | — | 403 | 748 | — | 1,151 | 68 | 4/12/2013 | 1962 | ||||||||||||||||
| Sun Trust Bank | Lexington | NC | — | 447 | 831 | — | 1,278 | 76 | 4/12/2013 | 2001 | ||||||||||||||||
| Sun Trust Bank | Matthews | NC | — | 382 | 382 | — | 764 | 37 | 3/22/2013 | 1971 | ||||||||||||||||
| Sun Trust Bank | Mocksville | NC | — | 978 | 2,933 | — | 3,911 | 282 | 3/22/2013 | 2000 | ||||||||||||||||
| Sun Trust Bank | Monroe | NC | — | 204 | 1,837 | — | 2,041 | 168 | 4/12/2013 | 1920 | ||||||||||||||||
| Sun Trust Bank | Oakboro | NC | — | 360 | 540 | — | 900 | 42 | 7/23/2013 | 1970 | ||||||||||||||||
| Sun Trust Bank | Raleigh | NC | — | 658 | 658 | — | 1,316 | 63 | 3/22/2013 | 1977 | ||||||||||||||||
F-225
| Initial Costs | Costs Capitalized Subsequent to Acquisition | Gross Amount Carried at December 31, 2014 (1) (2) | ||||||||||||||||||||||||
| Property | City | State | Encumbrances at December 31, 2014 | Land | Buildings, Fixtures and Improvements | Accumulated Depreciation (3) (4) | Date Acquired | Date of Construction | ||||||||||||||||||
| Sun Trust Bank | Yadkinville | NC | — | 200 | 371 | — | 571 | 34 | 4/12/2013 | 1975 | ||||||||||||||||
| Sun Trust Bank | Zebulon | NC | — | 515 | 630 | — | 1,145 | 60 | 3/22/2013 | 1972 | ||||||||||||||||
| Sun Trust Bank | Anderson | SC | — | 574 | 1,065 | — | 1,639 | 102 | 3/22/2013 | 1998 | ||||||||||||||||
| Sun Trust Bank | Belton | SC | — | 473 | 578 | — | 1,051 | 53 | 4/12/2013 | 1967 | ||||||||||||||||
| Sun Trust Bank | Travelers Rest | SC | — | 746 | 746 | — | 1,492 | 68 | 4/12/2013 | 1995 | ||||||||||||||||
| Sun Trust Bank | Chattanooga | TN | — | 223 | 1,263 | — | 1,486 | 121 | 3/22/2013 | 1953 | ||||||||||||||||
| Sun Trust Bank | La Vergne | TN | — | 171 | 209 | — | 380 | 20 | 3/22/2013 | 1985 | ||||||||||||||||
| Sun Trust Bank | Madison | TN | — | 286 | 1,143 | — | 1,429 | 110 | 3/22/2013 | 1953 | ||||||||||||||||
| Sun Trust Bank | Nashville | TN | — | 567 | 305 | — | 872 | 24 | 7/23/2013 | 1954 | ||||||||||||||||
| Sun Trust Bank | Nashville | TN | — | 1,598 | 1,308 | — | 2,906 | 120 | 4/12/2013 | 1992 | ||||||||||||||||
| Sun Trust Bank | Nashville | TN | — | 613 | 613 | — | 1,226 | 56 | 4/12/2013 | 1970 | ||||||||||||||||
| Sun Trust Bank | Cheriton | VA | — | 90 | 510 | — | 600 | 49 | 3/22/2013 | 1975 | ||||||||||||||||
| Sun Trust Bank | Lynchburg | VA | — | 251 | 466 | — | 717 | 45 | 3/22/2013 | 1973 | ||||||||||||||||
| Sun Trust Bank | Norfolk | VA | — | 656 | 437 | — | 1,093 | 40 | 4/12/2013 | 1990 | ||||||||||||||||
| Sun Trust Bank | Petersburg | VA | — | 102 | 306 | — | 408 | 28 | 4/12/2013 | 1975 | ||||||||||||||||
| Sun Trust Bank | Richmond | VA | — | 277 | 416 | — | 693 | 40 | 3/22/2013 | 1959 | ||||||||||||||||
| Sun Trust Bank | Richmond | VA | — | 224 | 2,012 | — | 2,236 | 184 | 4/12/2013 | 1909 | ||||||||||||||||
| Sun Trust Bank | Rocky Mount | VA | — | 265 | 1,504 | — | 1,769 | 131 | 5/22/2013 | 1961 | ||||||||||||||||
| Sunbelt Rental | Mabelvale | AR | — | 240 | 894 | — | 1,134 | 24 | 6/4/2014 | 2006 | ||||||||||||||||
| Sunbelt Rental | Memphis | TN | — | 365 | 929 | — | 1,294 | 17 | 9/26/2014 | 1995 | ||||||||||||||||
| Sunoco | Merritt Island | FL | — | 540 | 2,162 | — | 2,702 | 59 | 5/19/2014 | 2009 | ||||||||||||||||
| Sunset Valley Homestead | Sunset Valley | TX | 17,441 | 14,283 | 28,351 | — | 42,634 | 1,253 | 2/7/2014 | 2007 | ||||||||||||||||
| Superior Energy Services | Gainesville | TX | — | 284 | 10,475 | — | 10,759 | 718 | 7/24/2014 | 1982 | ||||||||||||||||
| Sweet Tomato | Coral Springs | FL | — | 790 | 1,625 | — | 2,415 | 136 | 6/27/2013 | 1995 | ||||||||||||||||
| Synovus Bank | Tampa | FL | — | 985 | 2,298 | — | 3,283 | 251 | 12/31/2012 | 1959 | ||||||||||||||||
| Sysmex | Lincolnshire | IL | 22,500 | 4,143 | 36,987 | — | 41,130 | 1,577 | 2/7/2014 | 2010 | ||||||||||||||||
F-226
| Initial Costs | Costs Capitalized Subsequent to Acquisition | Gross Amount Carried at December 31, 2014 (1) (2) | ||||||||||||||||||||||||
| Property | City | State | Encumbrances at December 31, 2014 | Land | Buildings, Fixtures and Improvements | Accumulated Depreciation (3) (4) | Date Acquired | Date of Construction | ||||||||||||||||||
| Taco Bell | Albertville | AL | — | 419 | 778 | — | 1,197 | 60 | 7/31/2013 | 1995 | ||||||||||||||||
| Taco Bell | Anniston | AL | — | 80 | 609 | — | 689 | 52 | 6/27/2013 | 2000 | ||||||||||||||||
| Taco Bell | Cullman | AL | — | 375 | 1,053 | — | 1,428 | 90 | 6/27/2013 | 1995 | ||||||||||||||||
| Taco Bell | Daphne | AL | — | 180 | 1,278 | — | 1,458 | 103 | 6/27/2013 | 1995 | ||||||||||||||||
| Taco Bell | Dora | AL | — | 348 | 813 | — | 1,161 | 63 | 7/31/2013 | 1995 | ||||||||||||||||
| Taco Bell | Foley | AL | — | 360 | 1,460 | — | 1,820 | 118 | 6/27/2013 | 1995 | ||||||||||||||||
| Taco Bell | Hartselle | AL | — | 378 | 781 | — | 1,159 | 67 | 6/27/2013 | 1995 | ||||||||||||||||
| Taco Bell | Jasper | AL | — | 445 | 814 | — | 1,259 | 70 | 6/27/2013 | 1995 | ||||||||||||||||
| Taco Bell | Mobile | AL | — | 160 | 1,973 | — | 2,133 | 159 | 6/27/2013 | 1995 | ||||||||||||||||
| Taco Bell | Pensacola | AL | — | 140 | 1,897 | — | 2,037 | 153 | 6/27/2013 | 1995 | ||||||||||||||||
| Taco Bell | SaraLand | AL | — | 150 | 1,063 | — | 1,213 | 86 | 6/27/2013 | 1995 | ||||||||||||||||
| Taco Bell | Warrior | AL | — | 364 | 675 | — | 1,039 | 52 | 7/31/2013 | 1995 | ||||||||||||||||
| Taco Bell | Winfield | AL | — | 278 | 834 | — | 1,112 | 64 | 7/31/2013 | 1995 | ||||||||||||||||
| Taco Bell | Corona | CA | — | 306 | 1,138 | — | 1,444 | 97 | 6/27/2013 | 1990 | ||||||||||||||||
| Taco Bell | Fairfield | CA | — | 500 | 1,327 | — | 1,827 | 113 | 6/27/2013 | 1985 | ||||||||||||||||
| Taco Bell | Fontana | CA | — | 524 | 1,016 | — | 1,540 | 87 | 6/27/2013 | 1992 | ||||||||||||||||
| Taco Bell | Montclair | CA | — | 322 | 900 | — | 1,222 | 77 | 6/27/2013 | 1996 | ||||||||||||||||
| Taco Bell | Moreno Valley | CA | — | 367 | 998 | — | 1,365 | 85 | 6/27/2013 | 1992 | ||||||||||||||||
| Taco Bell | Rancho Cucamonga | CA | — | 415 | 1,210 | — | 1,625 | 103 | 6/27/2013 | 1992 | ||||||||||||||||
| Taco Bell | Rubidoux | CA | — | 415 | 1,223 | — | 1,638 | 104 | 6/27/2013 | 1992 | ||||||||||||||||
| Taco Bell | Suisun City | CA | — | 355 | 1,419 | — | 1,774 | 109 | 7/31/2013 | 1986 | ||||||||||||||||
| Taco Bell | Vacaville | CA | — | 522 | 1,513 | — | 2,035 | 129 | 6/27/2013 | 1985 | ||||||||||||||||
| Taco Bell | Vacaville | CA | — | 1,184 | 1,375 | — | 2,559 | 117 | 6/27/2013 | 1994 | ||||||||||||||||
| Taco Bell | Jacksonville | FL | — | 440 | 1,167 | — | 1,607 | 94 | 6/27/2013 | 1995 | ||||||||||||||||
| Taco Bell | Jacksonville | FL | — | 340 | 1,383 | — | 1,723 | 112 | 6/27/2013 | 1995 | ||||||||||||||||
| Taco Bell | Augusta | GA | — | 220 | 1,292 | — | 1,512 | 104 | 6/27/2013 | 1995 | ||||||||||||||||
| Taco Bell | Hephzibah | GA | — | 330 | 930 | — | 1,260 | 75 | 6/27/2013 | 1995 | ||||||||||||||||
| Taco Bell | Jesup | GA | — | 230 | 715 | — | 945 | 58 | 6/27/2013 | 1995 | ||||||||||||||||
| Taco Bell | Kennesaw | GA | — | 162 | 601 | — | 763 | 51 | 6/27/2013 | 1984 | ||||||||||||||||
| Taco Bell | Waycross | GA | — | 170 | 1,115 | — | 1,285 | 90 | 6/27/2013 | 1995 | ||||||||||||||||
| Taco Bell | Marion | IN | — | 496 | 921 | — | 1,417 | 71 | 7/31/2013 | 1994 | ||||||||||||||||
| Taco Bell | North Corbin | KY | — | 139 | 1,082 | — | 1,221 | 92 | 6/27/2013 | 1995 | ||||||||||||||||
F-227
| Initial Costs | Costs Capitalized Subsequent to Acquisition | Gross Amount Carried at December 31, 2014 (1) (2) | ||||||||||||||||||||||||
| Property | City | State | Encumbrances at December 31, 2014 | Land | Buildings, Fixtures and Improvements | Accumulated Depreciation (3) (4) | Date Acquired | Date of Construction | ||||||||||||||||||
| Taco Bell | Detroit | MI | — | 124 | 704 | — | 828 | 54 | 7/31/2013 | 1989 | ||||||||||||||||
| Taco Bell | St. Louis | MO | — | 190 | 1,951 | — | 2,141 | 132 | 6/27/2013 | 1995 | ||||||||||||||||
| Taco Bell | Wentzville | MO | — | 410 | 1,168 | — | 1,578 | 94 | 6/27/2013 | 1995 | ||||||||||||||||
| Taco Bell | Brunswick | OH | — | 400 | 1,267 | — | 1,667 | 102 | 6/27/2013 | 1995 | ||||||||||||||||
| Taco Bell | Dayton | OH | — | 129 | 732 | — | 861 | 56 | 7/31/2013 | 1995 | ||||||||||||||||
| Taco Bell | Hilliard | OH | — | 424 | 787 | — | 1,211 | 61 | 7/31/2013 | 1991 | ||||||||||||||||
| Taco Bell | Marysville | OH | — | 412 | 618 | — | 1,030 | 48 | 7/31/2013 | 1992 | ||||||||||||||||
| Taco Bell | Moraine | OH | — | 87 | 148 | — | 235 | 15 | 6/27/2013 | 1995 | ||||||||||||||||
| Taco Bell | North Olmstead | OH | — | 390 | 904 | — | 1,294 | 73 | 6/27/2013 | 1995 | ||||||||||||||||
| Taco Bell | Pickerington | OH | — | 470 | 705 | — | 1,175 | 54 | 7/31/2013 | 1991 | ||||||||||||||||
| Taco Bell | Westerville | OH | — | 354 | 827 | — | 1,181 | 64 | 7/31/2013 | 1992 | ||||||||||||||||
| Taco Bell | Kingston | TN | — | 280 | 714 | — | 994 | 58 | 6/27/2013 | 1995 | ||||||||||||||||
| Taco Bell | Dallas | TX | — | 400 | 1,225 | — | 1,625 | 99 | 6/27/2013 | 1995 | ||||||||||||||||
| Taco Bell / KFC | Texarkana | AR | — | 111 | 630 | — | 741 | 49 | 7/31/2013 | 1980 | ||||||||||||||||
| Taco Bell / KFC | Dolton | IL | — | 167 | 946 | — | 1,113 | 73 | 7/31/2013 | 1975 | ||||||||||||||||
| Taco Bell / KFC | Elmhurst | IL | — | 242 | 969 | — | 1,211 | 75 | 7/31/2013 | 1990 | ||||||||||||||||
| Taco Bell / KFC | Hazel Crest | IL | — | 153 | 1,376 | — | 1,529 | 106 | 7/31/2013 | 1982 | ||||||||||||||||
| Taco Bell / KFC | Homewood | IL | — | 660 | 1,541 | — | 2,201 | 119 | 7/31/2013 | 1992 | ||||||||||||||||
| Taco Bell / KFC | Matteson | IL | — | 399 | 2,259 | — | 2,658 | 174 | 7/31/2013 | 1973 | ||||||||||||||||
| Taco Bell / KFC | Oak Forest | IL | — | 185 | 1,047 | — | 1,232 | 81 | 7/31/2013 | 1955 | ||||||||||||||||
| Taco Bell / KFC | Westchester | IL | — | 238 | 952 | — | 1,190 | 73 | 7/31/2013 | 1973 | ||||||||||||||||
| Taco Bell / KFC | Crawfordsville | IN | — | 234 | 934 | — | 1,168 | 72 | 7/31/2013 | 1991 | ||||||||||||||||
| Taco Bell / KFC | Frankfort | IN | — | 99 | 893 | — | 992 | 69 | 7/31/2013 | 1985 | ||||||||||||||||
| Taco Bell / KFC | Hartford City | IN | — | 99 | 889 | — | 988 | 68 | 7/31/2013 | 1978 | ||||||||||||||||
| Taco Bell / KFC | Kokomo | IN | — | 199 | 798 | — | 997 | 61 | 7/31/2013 | 1993 | ||||||||||||||||
| Taco Bell / KFC | Lafayette | IN | — | 304 | 912 | — | 1,216 | 70 | 7/31/2013 | 1990 | ||||||||||||||||
| Taco Bell / KFC | Lebanon | IN | — | 337 | 1,348 | — | 1,685 | 104 | 7/31/2013 | 1983 | ||||||||||||||||
| Taco Bell / KFC | Noblesville | IN | — | 363 | 545 | — | 908 | 42 | 7/31/2013 | 2005 | ||||||||||||||||
| Taco Bell / KFC | Tipton | IN | — | 104 | 936 | — | 1,040 | 72 | 7/31/2013 | 1998 | ||||||||||||||||
| Taco Bell / KFC | Minden | LA | — | 274 | 639 | — | 913 | 49 | 7/31/2013 | 1995 | ||||||||||||||||
| Taco Bell / KFC | Shreveport | LA | — | 343 | 514 | — | 857 | 40 | 7/31/2013 | 1995 | ||||||||||||||||
| Taco Bell / KFC | Shreveport | LA | — | 616 | 753 | — | 1,369 | 58 | 7/31/2013 | 1995 | ||||||||||||||||
F-228
| Initial Costs | Costs Capitalized Subsequent to Acquisition | Gross Amount Carried at December 31, 2014 (1) (2) | ||||||||||||||||||||||||
| Property | City | State | Encumbrances at December 31, 2014 | Land | Buildings, Fixtures and Improvements | Accumulated Depreciation (3) (4) | Date Acquired | Date of Construction | ||||||||||||||||||
| Taco Bell / KFC | Shreveport | LA | — | 427 | 522 | — | 949 | 40 | 7/31/2013 | 1997 | ||||||||||||||||
| Taco Bell / KFC | Shreveport | LA | — | 352 | 528 | — | 880 | 41 | 7/31/2013 | 1998 | ||||||||||||||||
| Taco Bell / KFC | Dunkirk | NY | — | 800 | 978 | — | 1,778 | 75 | 7/31/2013 | 2000 | ||||||||||||||||
| Taco Bell / KFC | Geneva | NY | — | 569 | 695 | — | 1,264 | 53 | 7/31/2013 | 1999 | ||||||||||||||||
| Taco Bell / KFC | Canonsburg | PA | — | 176 | 1,586 | — | 1,762 | 122 | 7/31/2013 | 1996 | ||||||||||||||||
| Taco Bell / KFC | Pittsburgh | PA | — | 180 | 269 | — | 449 | 17 | 10/1/2013 | 1995 | ||||||||||||||||
| Taco Bell / KFC | Mount Pleasant | TX | — | 106 | 952 | — | 1,058 | 73 | 7/31/2013 | 1992 | ||||||||||||||||
| Taco Bell / KFC | New Boston | TX | — | 125 | 1,127 | — | 1,252 | 87 | 7/31/2013 | 1995 | ||||||||||||||||
| Taco Bell / KFC | Green Bay | WI | — | 470 | 574 | — | 1,044 | 44 | 7/31/2013 | 1986 | ||||||||||||||||
| Taco Bell / KFC | Milwaukee | WI | — | 533 | 1,055 | — | 1,588 | 90 | 6/27/2013 | 1978 | ||||||||||||||||
| Taco Bell / KFC | Benwood | WV | — | 123 | 287 | — | 410 | 18 | 10/1/2013 | 1995 | ||||||||||||||||
| Taco Bell / Pizza Hut | Dallas | TX | — | 420 | 1,582 | — | 2,002 | 128 | 6/27/2013 | 1995 | ||||||||||||||||
| Taco Bueno | Hutchinson | KS | — | 561 | 841 | — | 1,402 | 65 | 7/31/2013 | 2000 | ||||||||||||||||
| Taco Bueno | Belton | MO | — | 476 | 701 | — | 1,177 | 60 | 6/27/2013 | 2006 | ||||||||||||||||
| Taco Bueno | Springfield | MO | — | 753 | 753 | — | 1,506 | 58 | 7/31/2013 | 2006 | ||||||||||||||||
| Taco Bueno | Arlington | TX | — | 597 | 895 | — | 1,492 | 69 | 7/31/2013 | 2000 | ||||||||||||||||
| Taco Bueno | Frisco | TX | — | 601 | 577 | — | 1,178 | 49 | 6/27/2013 | 2000 | ||||||||||||||||
| Taco Bueno | Lubbock | TX | — | 228 | 561 | — | 789 | 48 | 6/27/2013 | 2000 | ||||||||||||||||
| Taco Bueno | N. Richland Hills | TX | — | 423 | 567 | — | 990 | 48 | 6/27/2013 | 2000 | ||||||||||||||||
| Taco Bueno | Waco | TX | — | 595 | 892 | — | 1,487 | 69 | 7/31/2013 | 1995 | ||||||||||||||||
| Taco Bueno | Waco | TX | — | 595 | 893 | — | 1,488 | 69 | 7/31/2013 | 2000 | ||||||||||||||||
| Taco Cabana | Austin | TX | — | 700 | 2,105 | — | 2,805 | 170 | 6/27/2013 | 1995 | ||||||||||||||||
| Taco Cabana | Pasadena | TX | — | 420 | 1,420 | — | 1,840 | 115 | 6/27/2013 | 1995 | ||||||||||||||||
| Taco Cabana | San Antonio | TX | — | 600 | 1,955 | — | 2,555 | 158 | 6/27/2013 | 1995 | ||||||||||||||||
| Taco Cabana | San Antonio | TX | — | 500 | 1,740 | — | 2,240 | 141 | 6/27/2013 | 1995 | ||||||||||||||||
| Taco Cabana | San Antonio | TX | — | 280 | 1,695 | — | 1,975 | 137 | 6/27/2013 | 1995 | ||||||||||||||||
| Taco Cabana | San Antonio | TX | — | 500 | 1,766 | — | 2,266 | 143 | 6/27/2013 | 1995 | ||||||||||||||||
| Taco Cabana | Schertz | TX | — | 520 | 1,408 | — | 1,928 | 114 | 6/27/2013 | 1995 | ||||||||||||||||
| Talbots | Hingham | MA | 23,363 | 3,009 | 27,080 | — | 30,089 | 2,123 | 5/24/2013 | 1980 | ||||||||||||||||
| Talbots | Lakeville | MA | 22,509 | 6,302 | 25,209 | — | 31,511 | 2,499 | 5/17/2013 | 1987 | ||||||||||||||||
| TCF Bank | Crystal | MN | — | 640 | 642 | — | 1,282 | 50 | 6/27/2013 | 1995 | ||||||||||||||||
| TD Bank | Falmouth | ME | 19,608 | 4,057 | 23,689 | — | 27,746 | 2,064 | 3/18/2013 | 2002 | ||||||||||||||||
F-229
| Initial Costs | Costs Capitalized Subsequent to Acquisition | Gross Amount Carried at December 31, 2014 (1) (2) | ||||||||||||||||||||||||
| Property | City | State | Encumbrances at December 31, 2014 | Land | Buildings, Fixtures and Improvements | Accumulated Depreciation (3) (4) | Date Acquired | Date of Construction | ||||||||||||||||||
| Teva Pharmaceuticals | Malvern | PA | — | 2,666 | 40,981 | — | 43,647 | 2,199 | 11/5/2013 | 1999 | ||||||||||||||||
| Texas Roadhouse | Cedar Rapids | IA | — | 430 | 2,194 | — | 2,624 | 183 | 6/27/2013 | 1995 | ||||||||||||||||
| Texas Roadhouse | Ammon | ID | — | 490 | 1,206 | — | 1,696 | 101 | 6/27/2013 | 1995 | ||||||||||||||||
| Texas Roadhouse | Shively | KY | — | 540 | 2,055 | — | 2,595 | 172 | 6/27/2013 | 1995 | ||||||||||||||||
| Texas Roadhouse | Concord | NC | — | 650 | 2,130 | — | 2,780 | 178 | 6/27/2013 | 1995 | ||||||||||||||||
| Texas Roadhouse | Gastonia | NC | — | 570 | 1,544 | — | 2,114 | 129 | 6/27/2013 | 1995 | ||||||||||||||||
| Texas Roadhouse | Hickory | NC | — | 580 | 1,831 | — | 2,411 | 153 | 6/27/2013 | 1995 | ||||||||||||||||
| Texas Roadhouse | Dickson City | PA | — | 640 | 1,897 | — | 2,537 | 159 | 6/27/2013 | 1995 | ||||||||||||||||
| Texas Roadhouse | College Station | TX | — | 670 | 2,299 | — | 2,969 | 192 | 6/27/2013 | 1995 | ||||||||||||||||
| Texas Roadhouse | Grand Prairie | TX | — | 780 | 1,867 | — | 2,647 | 156 | 6/27/2013 | 1995 | ||||||||||||||||
| Texas Roadhouse | Kenosha | WI | — | 1,061 | 1,835 | — | 2,896 | 162 | 6/27/2013 | 2001 | ||||||||||||||||
| TGI Fridays | Royal Palm Beach | FL | — | 1,530 | 1,530 | — | 3,060 | 133 | 7/31/2013 | 2001 | ||||||||||||||||
| TGI Fridays | Ann Arbor | MI | — | 547 | 1,640 | — | 2,187 | 142 | 7/31/2013 | 1998 | ||||||||||||||||
| TGI Fridays | Kentwood | MI | — | 281 | 2,533 | — | 2,814 | 220 | 7/31/2013 | 1983 | ||||||||||||||||
| TGI Fridays | Novi | MI | — | 1,042 | 1,042 | — | 2,084 | 90 | 7/31/2013 | 1994 | ||||||||||||||||
| TGI Fridays | Rochester | MN | — | 1,347 | 1,102 | — | 2,449 | 96 | 7/31/2013 | 1993 | ||||||||||||||||
| TGI Fridays | Bismarck | ND | — | 1,038 | 1,928 | — | 2,966 | 167 | 7/31/2013 | 2000 | ||||||||||||||||
| TGI Fridays | Blasdell | NY | — | 1,215 | 1,913 | — | 3,128 | 169 | 6/27/2013 | 2000 | ||||||||||||||||
| TGI Fridays | Homestead | PA | — | 970 | 3,455 | — | 4,425 | 289 | 6/27/2013 | 1995 | ||||||||||||||||
| TGI Fridays | Warwick | RI | — | 1,228 | 2,775 | — | 4,003 | 245 | 6/27/2013 | 1983 | ||||||||||||||||
| The Fresh Market | Winston-Salem | NC | — | 196 | 4,562 | — | 4,758 | 190 | 2/7/2014 | 2007 | ||||||||||||||||
| The Italian Villa | Grand Island | NY | — | 38 | 101 | — | 139 | 9 | 6/27/2013 | 1979 | ||||||||||||||||
| The Medicines Co. | Parsippany | NJ | 27,700 | 5,150 | 50,051 | — | 55,201 | 2,027 | 2/7/2014 | 2009 | ||||||||||||||||
| The Shoppes at Port Arthur | Port Arthur | TX | 8,077 | 3,331 | 14,992 | — | 18,323 | 656 | 2/7/2014 | 2008 | ||||||||||||||||
| The UPS Store | Elizabethtown | KY | — | 1,460 | 10,336 | 720 | 12,516 | 861 | 9/24/2013 | 2001 | ||||||||||||||||
| The Vitamin Shoppe | Evergreen Park | IL | — | 476 | 1,427 | — | 1,903 | 137 | 4/19/2013 | 2012 | ||||||||||||||||
| The Vitamin Shoppe | Ashland | VA | — | 2,399 | 19,663 | — | 22,062 | 1,349 | 11/5/2013 | 2013 | ||||||||||||||||
| Thorntons Oil | Bloomington | IL | — | 1,184 | 733 | — | 1,917 | 43 | 2/7/2014 | 1992 | ||||||||||||||||
| Thorntons Oil | Franklin Park | IL | — | 1,403 | 1,882 | — | 3,285 | 98 | 2/7/2014 | 1989 | ||||||||||||||||
| Thorntons Oil | Joliet | IL | — | 953 | 2,539 | — | 3,492 | 132 | 2/7/2014 | 2000 | ||||||||||||||||
| Thorntons Oil | Oaklawn | IL | — | 1,203 | 898 | — | 2,101 | 51 | 2/7/2014 | 1994 | ||||||||||||||||
| Thorntons Oil | Ottawa | IL | — | 565 | 2,003 | — | 2,568 | 107 | 2/7/2014 | 2006 | ||||||||||||||||
F-230
| Initial Costs | Costs Capitalized Subsequent to Acquisition | Gross Amount Carried at December 31, 2014 (1) (2) | ||||||||||||||||||||||||
| Property | City | State | Encumbrances at December 31, 2014 | Land | Buildings, Fixtures and Improvements | Accumulated Depreciation (3) (4) | Date Acquired | Date of Construction | ||||||||||||||||||
| Thorntons Oil | Plainfield | IL | — | 862 | 1,338 | — | 2,200 | 74 | 2/7/2014 | 1995 | ||||||||||||||||
| Thorntons Oil | Roselle | IL | — | 661 | 2,194 | — | 2,855 | 110 | 2/7/2014 | 1996 | ||||||||||||||||
| Thorntons Oil | South Elgin | IL | — | 1,239 | 1,688 | — | 2,927 | 96 | 2/7/2014 | 1995 | ||||||||||||||||
| Thorntons Oil | Springfield | IL | — | 926 | 2,514 | — | 3,440 | 147 | 2/7/2014 | 1994 | ||||||||||||||||
| Thorntons Oil | Summit | IL | — | 2,233 | 109 | — | 2,342 | 7 | 2/7/2014 | 2000 | ||||||||||||||||
| Thorntons Oil | Waukegan | IL | — | 875 | 1,421 | — | 2,296 | 75 | 2/7/2014 | 1999 | ||||||||||||||||
| Thorntons Oil | Westmont | IL | — | 760 | 3,069 | — | 3,829 | 153 | 2/7/2014 | 1997 | ||||||||||||||||
| Thorntons Oil | Clarksville | IN | — | 1,319 | 687 | — | 2,006 | 43 | 2/7/2014 | 2005 | ||||||||||||||||
| Thorntons Oil | Edinburgh | IN | — | 685 | 1,505 | — | 2,190 | 80 | 2/7/2014 | 1996 | ||||||||||||||||
| Thorntons Oil | Evansville | IN | — | 467 | 1,479 | — | 1,946 | 79 | 2/7/2014 | 1987 | ||||||||||||||||
| Thorntons Oil | Evansville | IN | — | 602 | 1,398 | — | 2,000 | 75 | 2/7/2014 | 1990 | ||||||||||||||||
| Thorntons Oil | Jeffersonville | IN | — | 1,233 | 1,533 | — | 2,766 | 87 | 2/7/2014 | 1995 | ||||||||||||||||
| Thorntons Oil | Terre Haute | IN | — | 732 | 1,829 | — | 2,561 | 100 | 2/7/2014 | 1995 | ||||||||||||||||
| Thorntons Oil | Henderson | KY | — | 659 | 3,271 | — | 3,930 | 170 | 2/7/2014 | 1971 | ||||||||||||||||
| Thorntons Oil | Henderson | KY | — | 483 | 1,778 | — | 2,261 | 85 | 2/7/2014 | 2007 | ||||||||||||||||
| Thorntons Oil | Louisville | KY | — | 637 | 1,680 | — | 2,317 | 79 | 2/7/2014 | 1994 | ||||||||||||||||
| Thorntons Oil | Shelbyville | KY | — | 299 | 2,036 | — | 2,335 | 102 | 2/7/2014 | 1991 | ||||||||||||||||
| Thorntons Oil | Galloway | OH | — | 547 | 1,550 | — | 2,097 | 79 | 2/7/2014 | 1998 | ||||||||||||||||
| Tiffany & Co. | Parsippany | NJ | — | 2,248 | 81,081 | — | 83,329 | 5,564 | 11/5/2013 | 1997 | ||||||||||||||||
| Tilted Kilt | Hendersonville | TN | — | 310 | 763 | — | 1,073 | 64 | 6/27/2013 | 1995 | ||||||||||||||||
| Time Warner Cable | Milwaukee | WI | 19,687 | 3,081 | 22,512 | — | 25,593 | 1,464 | 11/5/2013 | 2001 | ||||||||||||||||
| Tire Kingdom | Auburndale | FL | 1,205 | 609 | 1,571 | — | 2,180 | 75 | 2/7/2014 | 2010 | ||||||||||||||||
| Tire Kingdom | Dublin | OH | 717 | 373 | 1,119 | — | 1,492 | 176 | 4/30/2012 | 2003 | ||||||||||||||||
| Tire Kingdom | Greenville | SC | — | 499 | 1,367 | — | 1,866 | 63 | 3/28/2014 | 1997 | ||||||||||||||||
| Tire Warehouse | Fitchburg | MA | — | 203 | 704 | — | 907 | 61 | 6/27/2013 | 1982 | ||||||||||||||||
| Tire Warehouse | Bangor | ME | — | 289 | 1,400 | — | 1,689 | 121 | 6/27/2013 | 1977 | ||||||||||||||||
| Tires Plus | Duluth | GA | — | 777 | 1,259 | — | 2,036 | 65 | 2/21/2014 | 2001 | ||||||||||||||||
| TitleMax | Gainesville | GA | — | 221 | 270 | — | 491 | 23 | 7/31/2013 | 2007 | ||||||||||||||||
| TJ Maxx | Philadelphia | PA | — | 9,889 | 84,953 | — | 94,842 | 5,830 | 11/5/2013 | 2001 | ||||||||||||||||
| T-Mobile | Nashville | TN | — | 1,190 | 15,847 | — | 17,037 | 948 | 11/5/2013 | 2002 | ||||||||||||||||
| Tommy Addison's | Edgewood | FL | — | 366 | 447 | — | 813 | 39 | 7/31/2013 | 2003 | ||||||||||||||||
| Toys R Us | Coral Springs | FL | — | 4,264 | 5,289 | — | 9,553 | 233 | 2/7/2014 | 2010 | ||||||||||||||||
F-231
| Initial Costs | Costs Capitalized Subsequent to Acquisition | Gross Amount Carried at December 31, 2014 (1) (2) | ||||||||||||||||||||||||
| Property | City | State | Encumbrances at December 31, 2014 | Land | Buildings, Fixtures and Improvements | Accumulated Depreciation (3) (4) | Date Acquired | Date of Construction | ||||||||||||||||||
| Tractor Supply | Oneonta | AL | — | 359 | 1,438 | — | 1,797 | 117 | 4/18/2013 | 1983 | ||||||||||||||||
| Tractor Supply | Summerdale | AL | 1,210 | 276 | 2,470 | — | 2,746 | 97 | 2/7/2014 | 2010 | ||||||||||||||||
| Tractor Supply | Tuscaloosa | AL | — | 746 | 1,979 | — | 2,725 | 77 | 2/7/2014 | 2012 | ||||||||||||||||
| Tractor Supply | Little Rock | AR | 1,500 | 930 | 2,035 | — | 2,965 | 79 | 2/7/2014 | 2009 | ||||||||||||||||
| Tractor Supply | Auburn | CA | — | 1,175 | 2,901 | — | 4,076 | 116 | 2/7/2014 | 2012 | ||||||||||||||||
| Tractor Supply | Dixon | CA | 2,962 | 1,619 | 4,044 | — | 5,663 | 164 | 2/7/2014 | 2007 | ||||||||||||||||
| Tractor Supply | Jackson | CA | — | 1,209 | 3,640 | — | 4,849 | 140 | 2/7/2014 | 2012 | ||||||||||||||||
| Tractor Supply | Los Banos | CA | 3,469 | 1,213 | 3,638 | — | 4,851 | 325 | 2/28/2013 | 2009 | ||||||||||||||||
| Tractor Supply | Middletown | DE | — | 1,487 | 3,293 | — | 4,780 | 124 | 2/7/2014 | 2007 | ||||||||||||||||
| Tractor Supply | Mims | FL | — | 310 | 2,787 | — | 3,097 | 161 | 10/10/2013 | 2012 | ||||||||||||||||
| Tractor Supply | Bainbridge | GA | — | 687 | 2,445 | — | 3,132 | 91 | 2/7/2014 | 2008 | ||||||||||||||||
| Tractor Supply | Rincon | GA | — | 978 | 2,016 | — | 2,994 | 76 | 2/7/2014 | 2007 | ||||||||||||||||
| Tractor Supply | Alton | IL | 1,403 | 565 | 3,062 | — | 3,627 | 116 | 2/7/2014 | 2008 | ||||||||||||||||
| Tractor Supply | Mishawaka | IN | — | 620 | 2,683 | — | 3,303 | 103 | 2/7/2014 | 2011 | ||||||||||||||||
| Tractor Supply | Sellersburg | IN | 1,433 | 762 | 2,146 | — | 2,908 | 85 | 2/7/2014 | 2010 | ||||||||||||||||
| Tractor Supply | St. John | IN | 2,247 | 1,715 | 3,397 | — | 5,112 | 139 | 2/7/2014 | 2007 | ||||||||||||||||
| Tractor Supply | Lawrence | KS | 1,377 | 361 | 2,637 | — | 2,998 | 103 | 2/7/2014 | 2010 | ||||||||||||||||
| Tractor Supply | Topeka | KS | 1,678 | 446 | 1,785 | — | 2,231 | 65 | 5/19/2014 | 2006 | ||||||||||||||||
| Tractor Supply | Glasgow | KY | — | 453 | 1,812 | — | 2,265 | 64 | 5/19/2014 | 2005 | ||||||||||||||||
| Tractor Supply | Grayson | KY | — | 540 | 2,709 | — | 3,249 | 106 | 2/7/2014 | 2011 | ||||||||||||||||
| Tractor Supply | Paducah | KY | — | 393 | 1,574 | — | 1,967 | 57 | 5/19/2014 | 1995 | ||||||||||||||||
| Tractor Supply | Gray | LA | 2,049 | 550 | 2,202 | — | 2,752 | 249 | 8/7/2012 | 2011 | ||||||||||||||||
| Tractor Supply | Belchertown | MA | 1,823 | 1,148 | 3,179 | — | 4,327 | 129 | 2/7/2014 | 2009 | ||||||||||||||||
| Tractor Supply | Millbury | MA | — | 806 | 3,094 | — | 3,900 | 77 | 6/26/2014 | 2013 | ||||||||||||||||
| Tractor Supply | Southwick | MA | 2,428 | 1,601 | 3,583 | — | 5,184 | 144 | 2/7/2014 | 2008 | ||||||||||||||||
| Tractor Supply | Augusta | ME | 1,423 | 530 | 2,756 | — | 3,286 | 111 | 2/7/2014 | 2009 | ||||||||||||||||
| Tractor Supply | Jonesville | MI | — | 267 | 2,364 | — | 2,631 | 93 | 3/28/2014 | 2005 | ||||||||||||||||
| Tractor Supply | Negaunee | MI | — | 488 | 1,953 | — | 2,441 | 237 | 6/12/2012 | 2010 | ||||||||||||||||
F-232
| Initial Costs | Costs Capitalized Subsequent to Acquisition | Gross Amount Carried at December 31, 2014 (1) (2) | ||||||||||||||||||||||||
| Property | City | State | Encumbrances at December 31, 2014 | Land | Buildings, Fixtures and Improvements | Accumulated Depreciation (3) (4) | Date Acquired | Date of Construction | ||||||||||||||||||
| Tractor Supply | Jefferson City | MO | 1,125 | 490 | 1,877 | — | 2,367 | 73 | 2/7/2014 | 2009 | ||||||||||||||||
| Tractor Supply | Nixa | MO | 1,346 | 476 | 2,040 | — | 2,516 | 81 | 2/7/2014 | 2009 | ||||||||||||||||
| Tractor Supply | Sedalia | MO | 1,090 | 480 | 1,782 | — | 2,262 | 72 | 2/7/2014 | 2010 | ||||||||||||||||
| Tractor Supply | Troy | MO | 1,286 | 730 | 2,587 | — | 3,317 | 99 | 2/7/2014 | 2009 | ||||||||||||||||
| Tractor Supply | Union | MO | 1,403 | 589 | 3,012 | — | 3,601 | 112 | 2/7/2014 | 2008 | ||||||||||||||||
| Tractor Supply | Franklin | NC | 1,480 | 434 | 2,629 | — | 3,063 | 103 | 2/7/2014 | 2009 | ||||||||||||||||
| Tractor Supply | Murphy | NC | 1,402 | 990 | 2,090 | — | 3,080 | 85 | 2/7/2014 | 2010 | ||||||||||||||||
| Tractor Supply | Plaistow | NH | — | 638 | 2,552 | — | 3,190 | 147 | 10/10/2013 | 2012 | ||||||||||||||||
| Tractor Supply | Plymouth | NH | 2,074 | 424 | 2,430 | — | 2,854 | 243 | 11/29/2012 | 2011 | ||||||||||||||||
| Tractor Supply | Allentown | NJ | 2,710 | 697 | 3,949 | — | 4,646 | 557 | 1/27/2012 | 2008 | ||||||||||||||||
| Tractor Supply | Sicklerville | NJ | — | 1,931 | 4,302 | — | 6,233 | 163 | 2/7/2014 | 2009 | ||||||||||||||||
| Tractor Supply | Farmington | NM | — | 1,091 | 2,194 | — | 3,285 | 87 | 3/28/2014 | 2012 | ||||||||||||||||
| Tractor Supply | Roswell | NM | — | 947 | 2,181 | — | 3,128 | 86 | 2/7/2014 | 2009 | ||||||||||||||||
| Tractor Supply | Silver City | NM | — | 716 | 2,380 | — | 3,096 | 94 | 3/28/2014 | 2012 | ||||||||||||||||
| Tractor Supply | Macedon | NY | — | 168 | 1,591 | — | 1,759 | 56 | 4/29/2014 | 1992 | ||||||||||||||||
| Tractor Supply | Hamilton | OH | 931 | 675 | 1,472 | — | 2,147 | 83 | 2/7/2014 | 1975 | ||||||||||||||||
| Tractor Supply | Wauseon | OH | 1,374 | 931 | 2,128 | — | 3,059 | 88 | 2/7/2014 | 2007 | ||||||||||||||||
| Tractor Supply | Chickasha | OK | — | 599 | 2,056 | — | 2,655 | 84 | 3/28/2014 | 2014 | ||||||||||||||||
| Tractor Supply | Glenpool | OK | 1,180 | 359 | 2,447 | — | 2,806 | 94 | 2/7/2014 | 2009 | ||||||||||||||||
| Tractor Supply | Stillwater | OK | 1,205 | 205 | 2,715 | — | 2,920 | 103 | 2/7/2014 | 2009 | ||||||||||||||||
| Tractor Supply | Gibsonia | PA | 1,648 | 1,044 | 2,778 | — | 3,822 | 110 | 2/7/2014 | 2009 | ||||||||||||||||
| Tractor Supply | Columbia | SC | — | 952 | 2,222 | — | 3,174 | 83 | 2/7/2014 | 2011 | ||||||||||||||||
| Tractor Supply | Irmo | SC | — | 725 | 2,171 | — | 2,896 | 85 | 2/7/2014 | 2009 | ||||||||||||||||
| Tractor Supply | Ballinger | TX | 1,248 | 476 | 2,477 | — | 2,953 | 92 | 2/7/2014 | 2010 | ||||||||||||||||
| Tractor Supply | Del Rio | TX | — | 927 | 2,044 | — | 2,971 | 78 | 2/7/2014 | 2009 | ||||||||||||||||
| Tractor Supply | Edinburg | TX | — | 768 | 3,163 | — | 3,931 | 117 | 2/7/2014 | 2009 | ||||||||||||||||
| Tractor Supply | Kenedy | TX | 1,220 | 309 | 2,372 | — | 2,681 | 88 | 2/7/2014 | 2010 | ||||||||||||||||
| Tractor Supply | Pearsall | TX | 1,199 | 318 | 2,551 | — | 2,869 | 95 | 2/7/2014 | 2009 | ||||||||||||||||
F-233
| Initial Costs | Costs Capitalized Subsequent to Acquisition | Gross Amount Carried at December 31, 2014 (1) (2) | ||||||||||||||||||||||||
| Property | City | State | Encumbrances at December 31, 2014 | Land | Buildings, Fixtures and Improvements | Accumulated Depreciation (3) (4) | Date Acquired | Date of Construction | ||||||||||||||||||
| Tractor Supply | Rio Grande | TX | — | 469 | 1,095 | — | 1,564 | 133 | 6/19/2012 | 1993 | ||||||||||||||||
| Tractor Supply | Woodstock | VA | — | 524 | 2,098 | — | 2,622 | 72 | 5/19/2014 | 2004 | ||||||||||||||||
| Trader Joe's | Sarasota | FL | — | 1,646 | 5,416 | — | 7,062 | 250 | 2/7/2014 | 2012 | ||||||||||||||||
| Trader Joe's | Lexington | KY | — | 2,287 | 3,795 | — | 6,082 | 183 | 2/7/2014 | 2012 | ||||||||||||||||
| Tumbleweed | Terre Haute | IN | — | 434 | 1,303 | — | 1,737 | 113 | 7/31/2013 | 1997 | ||||||||||||||||
| Tumbleweed | Louisville | KY | — | 468 | 1,404 | — | 1,872 | 122 | 7/31/2013 | 2001 | ||||||||||||||||
| Tumbleweed | Mayesville | KY | — | 353 | 823 | — | 1,176 | 71 | 7/31/2013 | 2000 | ||||||||||||||||
| Tumbleweed | Owensboro | KY | — | 355 | 1,420 | — | 1,775 | 123 | 7/31/2013 | 1997 | ||||||||||||||||
| Tumbleweed | Bellefontaine | OH | — | 234 | 938 | — | 1,172 | 81 | 7/31/2013 | 1999 | ||||||||||||||||
| Tumbleweed | Springfield | OH | — | 549 | 1,280 | — | 1,829 | 111 | 7/31/2013 | 1998 | ||||||||||||||||
| Tumbleweed | Wooster | OH | — | 342 | 799 | — | 1,141 | 69 | 7/31/2013 | 1997 | ||||||||||||||||
| Tumbleweed | Zanesville | OH | — | 639 | 1,491 | — | 2,130 | 129 | 7/31/2013 | 1998 | ||||||||||||||||
| Tutor Time | Downingtown | PA | — | 205 | 2,788 | — | 2,993 | 127 | 2/7/2014 | 1998 | ||||||||||||||||
| Tutor Time | Austin | TX | — | 417 | 1,861 | — | 2,278 | 89 | 2/7/2014 | 2000 | ||||||||||||||||
| Ulta Salon | Jonesboro | AR | — | 742 | 2,289 | — | 3,031 | 95 | 2/7/2014 | 2013 | ||||||||||||||||
| Ulta Salon | Fort Gratiot | MI | — | 164 | 2,083 | — | 2,247 | 89 | 2/7/2014 | 2012 | ||||||||||||||||
| Ulta Salon | Jackson | TN | 1,454 | 547 | 2,123 | — | 2,670 | 90 | 2/7/2014 | 2010 | ||||||||||||||||
| United Technologies | Bradenton | FL | 10,050 | 2,692 | 17,973 | — | 20,665 | 670 | 2/7/2014 | 2004 | ||||||||||||||||
| University Plaza | Flagstaff | AZ | — | 4,727 | 18,087 | — | 22,814 | 1,015 | 2/7/2014 | 1982 | ||||||||||||||||
| US Bank | Fayetteville | NC | — | 608 | 1,741 | — | 2,349 | 73 | 2/7/2014 | 2012 | ||||||||||||||||
| US Bank | Garfield Height | OH | — | 165 | 1,016 | — | 1,181 | 59 | 1/8/2014 | 1958 | ||||||||||||||||
| USG Corporation | Libertyville | IL | 14,807 | 2,593 | 10,284 | — | 12,877 | 420 | 2/21/2014 | 1965 | ||||||||||||||||
| VA Clinic | Oceanside | CA | 27,750 | 9,489 | 33,812 | — | 43,301 | 1,354 | 2/7/2014 | 2010 | ||||||||||||||||
| Vacant | Ottawa | IL | 1,768 | 376 | — | — | 376 | — | 2/21/2014 | 1995 | ||||||||||||||||
| Vacant | Greensboro | NC | 8,597 | 1,020 | — | — | 1,020 | — | 2/21/2014 | 1995 | ||||||||||||||||
| Vacant | Richfield | OH | 10,065 | 1,414 | — | — | 1,414 | — | 2/21/2014 | 1995 | ||||||||||||||||
| Vacant | Virginia Beach | VA | 959 | 934 | — | — | 934 | — | 2/21/2014 | 1997 | ||||||||||||||||
| Vanguard Car Rental | College Park | GA | 8,625 | 1,561 | 6,244 | — | 7,805 | 256 | 5/19/2014 | 2002 | ||||||||||||||||
F-234
| Initial Costs | Costs Capitalized Subsequent to Acquisition | Gross Amount Carried at December 31, 2014 (1) (2) | ||||||||||||||||||||||||
| Property | City | State | Encumbrances at December 31, 2014 | Land | Buildings, Fixtures and Improvements | Accumulated Depreciation (3) (4) | Date Acquired | Date of Construction | ||||||||||||||||||
| Velox Insurance | Woodstock | GA | — | 155 | 127 | — | 282 | 11 | 7/31/2013 | 1988 | ||||||||||||||||
| Verizon Wireless | Statesville | NC | — | 207 | 459 | — | 666 | 40 | 6/27/2013 | 1993 | ||||||||||||||||
| Volusia Square | Daytona Beach | FL | 16,557 | 4,598 | 28,511 | — | 33,109 | 1,415 | 2/7/2014 | 1986 | ||||||||||||||||
| Waffle House | Cocoa | FL | — | 150 | 279 | — | 429 | 21 | 7/31/2013 | 1986 | ||||||||||||||||
| Waffle House | Roanoke | VA | — | 176 | 327 | — | 503 | 25 | 7/31/2013 | 1987 | ||||||||||||||||
| Walgreens | Birmingham | AL | 1,560 | 996 | 3,005 | — | 4,001 | 158 | 2/7/2014 | 1999 | ||||||||||||||||
| Walgreens | Wetumpka | AL | 2,362 | 547 | 3,102 | — | 3,649 | 535 | 2/22/2012 | 2007 | ||||||||||||||||
| Walgreens | Kingman | AZ | 2,997 | 669 | 5,726 | — | 6,395 | 278 | 2/7/2014 | 2009 | ||||||||||||||||
| Walgreens | Peoria | AZ | — | 837 | 1,953 | — | 2,790 | 220 | 2/27/2013 | 1996 | ||||||||||||||||
| Walgreens | Phoenix | AZ | — | 1,037 | 1,927 | — | 2,964 | 207 | 3/26/2013 | 1999 | ||||||||||||||||
| Walgreens | Tucson | AZ | — | 1,234 | 5,143 | — | 6,377 | 249 | 2/7/2014 | 2003 | ||||||||||||||||
| Walgreens | Tucson | AZ | 2,910 | 1,406 | 3,571 | — | 4,977 | 177 | 2/7/2014 | 2004 | ||||||||||||||||
| Walgreens | Coalinga | CA | 2,800 | 396 | 3,568 | — | 3,964 | 687 | 10/11/2011 | 2008 | ||||||||||||||||
| Walgreens | Lancaster | CA | 2,719 | 859 | 4,246 | — | 5,105 | 225 | 2/7/2014 | 2009 | ||||||||||||||||
| Walgreens | Boulder | CO | — | 898 | 3,198 | — | 4,096 | 154 | 3/31/2014 | 2000 | ||||||||||||||||
| Walgreens | Castle Rock | CO | 3,953 | 1,581 | 3,689 | — | 5,270 | 323 | 7/11/2013 | 2002 | ||||||||||||||||
| Walgreens | Denver | CO | 3,350 | — | 4,050 | — | 4,050 | 354 | 7/2/2013 | 2008 | ||||||||||||||||
| Walgreens | Pueblo | CO | — | 519 | 2,971 | — | 3,490 | 146 | 2/7/2014 | 2003 | ||||||||||||||||
| Walgreens | Orlando | FL | — | 1,007 | 1,869 | — | 2,876 | 145 | 9/30/2013 | 1996 | ||||||||||||||||
| Walgreens | Acworth | GA | — | 1,583 | 2,940 | — | 4,523 | 345 | 1/25/2013 | 2012 | ||||||||||||||||
| Walgreens | Decatur | GA | — | 1,746 | 3,337 | — | 5,083 | 163 | 2/7/2014 | 2001 | ||||||||||||||||
| Walgreens | Grayson | GA | 2,720 | 947 | 3,748 | — | 4,695 | 181 | 2/7/2014 | 2004 | ||||||||||||||||
| Walgreens | Union City | GA | — | 909 | 3,841 | — | 4,750 | 185 | 2/7/2014 | 2005 | ||||||||||||||||
| Walgreens | Warner Robins | GA | — | 1,099 | 3,069 | — | 4,168 | 155 | 2/7/2014 | 2007 | ||||||||||||||||
| Walgreens | Dubuque | IA | — | 638 | 3,905 | — | 4,543 | 187 | 2/7/2014 | 2008 | ||||||||||||||||
| Walgreens | Muscatine | IA | — | 676 | 3,243 | — | 3,919 | 159 | 2/7/2014 | 2001 | ||||||||||||||||
| Walgreens | Twin Falls | ID | 2,432 | 1,156 | 3,896 | — | 5,052 | 197 | 2/7/2014 | 2009 | ||||||||||||||||
| Walgreens | Cahokia | IL | 1,595 | 394 | 1,577 | — | 1,971 | 68 | 5/19/2014 | 1994 | ||||||||||||||||
F-235
| Initial Costs | Costs Capitalized Subsequent to Acquisition | Gross Amount Carried at December 31, 2014 (1) (2) | ||||||||||||||||||||||||
| Property | City | State | Encumbrances at December 31, 2014 | Land | Buildings, Fixtures and Improvements | Accumulated Depreciation (3) (4) | Date Acquired | Date of Construction | ||||||||||||||||||
| Walgreens | Chicago | IL | — | 1,212 | 2,829 | — | 4,041 | 332 | 1/30/2013 | 1999 | ||||||||||||||||
| Walgreens | Chicago | IL | — | 1,617 | 3,003 | — | 4,620 | 353 | 1/30/2013 | 1995 | ||||||||||||||||
| Walgreens | Chicago | IL | — | 952 | 3,235 | — | 4,187 | 155 | 2/7/2014 | 2003 | ||||||||||||||||
| Walgreens | Chicago | IL | — | 911 | 4,830 | — | 5,741 | 226 | 2/7/2014 | 2000 | ||||||||||||||||
| Walgreens | Loves Park | IL | — | 943 | 3,528 | — | 4,471 | 169 | 2/7/2014 | 2008 | ||||||||||||||||
| Walgreens | Machesney Park | IL | — | 822 | 3,727 | — | 4,549 | 183 | 2/7/2014 | 2008 | ||||||||||||||||
| Walgreens | Matteson | IL | 2,450 | 416 | 4,070 | — | 4,486 | 187 | 2/7/2014 | 2008 | ||||||||||||||||
| Walgreens | South Elgin | IL | 2,260 | 1,710 | 3,208 | — | 4,918 | 160 | 2/7/2014 | 2002 | ||||||||||||||||
| Walgreens | St. Charles | IL | 2,030 | 1,472 | 3,262 | — | 4,734 | 156 | 2/7/2014 | 2002 | ||||||||||||||||
| Walgreens | Anderson | IN | 2,717 | 807 | 3,227 | — | 4,034 | 476 | 7/31/2012 | 2001 | ||||||||||||||||
| Walgreens | Lafayette | IN | 2,350 | 626 | 4,183 | — | 4,809 | 181 | 2/7/2014 | 2008 | ||||||||||||||||
| Walgreens | South Bend | IN | 3,120 | 1,240 | 5,015 | — | 6,255 | 251 | 2/7/2014 | 2006 | ||||||||||||||||
| Walgreens | Lawrence | KS | 1,609 | 588 | 2,351 | — | 2,939 | 96 | 5/19/2014 | 1992 | ||||||||||||||||
| Walgreens | Olathe | KS | — | 1,258 | 3,774 | — | 5,032 | 330 | 7/25/2013 | 2002 | ||||||||||||||||
| Walgreens | Wichita | KS | — | 385 | 4,286 | — | 4,671 | 207 | 2/7/2014 | 2000 | ||||||||||||||||
| Walgreens | Frankfort | KY | 2,935 | 911 | 3,643 | — | 4,554 | 628 | 2/8/2012 | 2006 | ||||||||||||||||
| Walgreens | Madisonville | KY | — | 1,085 | 2,857 | — | 3,942 | 147 | 2/7/2014 | 2007 | ||||||||||||||||
| Walgreens | Shereveport | LA | 2,638 | 619 | 3,509 | — | 4,128 | 605 | 2/22/2012 | 2003 | ||||||||||||||||
| Walgreens | Framingham | MA | 3,046 | 2,103 | 4,770 | — | 6,873 | 227 | 2/7/2014 | 2007 | ||||||||||||||||
| Walgreens | Baltimore | MD | — | 1,185 | 2,764 | — | 3,949 | 228 | 8/6/2013 | 2000 | ||||||||||||||||
| Walgreens | Brooklyn Park | MD | — | 1,416 | 4,160 | — | 5,576 | 197 | 2/7/2014 | 2008 | ||||||||||||||||
| Walgreens | Augusta | ME | 3,156 | 1,648 | 5,146 | — | 6,794 | 261 | 2/7/2014 | 2007 | ||||||||||||||||
| Walgreens | Clarkston | MI | — | 2,768 | 3,197 | — | 5,965 | 158 | 2/7/2014 | 2000 | ||||||||||||||||
| Walgreens | Clinton | MI | — | 1,463 | 3,413 | — | 4,876 | 435 | 11/13/2012 | 2002 | ||||||||||||||||
| Walgreens | Dearborn Heights | MI | — | 190 | 3,605 | — | 3,795 | 370 | 4/1/2013 | 1998 | ||||||||||||||||
| Walgreens | Eastpointe | MI | — | 668 | 2,672 | — | 3,340 | 474 | 1/19/2012 | 1998 | ||||||||||||||||
| Walgreens | Lincoln Park | MI | 5,494 | 1,041 | 5,896 | — | 6,937 | 870 | 7/31/2012 | 2007 | ||||||||||||||||
| Walgreens | Livonia | MI | — | 261 | 2,350 | — | 2,611 | 241 | 4/1/2013 | 1998 | ||||||||||||||||
F-236
| Initial Costs | Costs Capitalized Subsequent to Acquisition | Gross Amount Carried at December 31, 2014 (1) (2) | ||||||||||||||||||||||||
| Property | City | State | Encumbrances at December 31, 2014 | Land | Buildings, Fixtures and Improvements | Accumulated Depreciation (3) (4) | Date Acquired | Date of Construction | ||||||||||||||||||
| Walgreens | Stevensville | MI | 3,100 | 855 | 3,420 | — | 4,275 | 641 | 11/28/2011 | 2007 | ||||||||||||||||
| Walgreens | Troy | MI | — | — | 1,896 | — | 1,896 | 232 | 12/12/2012 | 2000 | ||||||||||||||||
| Walgreens | Warren | MI | — | 748 | 2,991 | — | 3,739 | 381 | 11/21/2012 | 1999 | ||||||||||||||||
| Walgreens | North Mankato | MN | 2,530 | 1,748 | 3,604 | — | 5,352 | 180 | 2/7/2014 | 2008 | ||||||||||||||||
| Walgreens | Country Club Hill | MO | — | 997 | 4,204 | — | 5,201 | 190 | 2/7/2014 | 2009 | ||||||||||||||||
| Walgreens | Independence | MO | — | 1,122 | 3,816 | — | 4,938 | 188 | 2/7/2014 | 2001 | ||||||||||||||||
| Walgreens | Columbia | MS | 3,091 | 452 | 4,072 | — | 4,524 | 499 | 12/21/2012 | 2011 | ||||||||||||||||
| Walgreens | Greenwood | MS | 2,423 | 561 | 3,181 | — | 3,742 | 549 | 2/22/2012 | 2007 | ||||||||||||||||
| Walgreens | Jackson | MS | — | 983 | 2,996 | — | 3,979 | 164 | 2/18/2014 | 1998 | ||||||||||||||||
| Walgreens | Cape Carteret | NC | 2,400 | 919 | 3,087 | — | 4,006 | 151 | 2/7/2014 | 2008 | ||||||||||||||||
| Walgreens | Durham | NC | 2,871 | 1,441 | 3,581 | — | 5,022 | 195 | 2/7/2014 | 2010 | ||||||||||||||||
| Walgreens | Durham | NC | 2,849 | 2,201 | 2,923 | — | 5,124 | 173 | 2/7/2014 | 2008 | ||||||||||||||||
| Walgreens | Fayetteville | NC | — | 860 | 4,263 | — | 5,123 | 233 | 2/7/2014 | 2009 | ||||||||||||||||
| Walgreens | Laurinburg | NC | — | 355 | 3,577 | — | 3,932 | 185 | 2/26/2014 | 2013 | ||||||||||||||||
| Walgreens | Leland | NC | 2,472 | 1,226 | 3,681 | — | 4,907 | 185 | 2/7/2014 | 2008 | ||||||||||||||||
| Walgreens | Rocky Mount | NC | 2,995 | 1,105 | 4,046 | — | 5,151 | 224 | 2/7/2014 | 2009 | ||||||||||||||||
| Walgreens | Wilmington | NC | — | 941 | 4,057 | — | 4,998 | 215 | 2/7/2014 | 2010 | ||||||||||||||||
| Walgreens | Winterville | NC | 3,030 | 578 | 5,322 | — | 5,900 | 274 | 2/7/2014 | 2009 | ||||||||||||||||
| Walgreens | North Platte | NE | — | 935 | 4,292 | — | 5,227 | 216 | 2/7/2014 | 2009 | ||||||||||||||||
| Walgreens | Omaha | NE | 2,580 | 1,316 | 4,122 | — | 5,438 | 205 | 2/7/2014 | 2009 | ||||||||||||||||
| Walgreens | Papillion | NE | — | 1,239 | 3,212 | — | 4,451 | 157 | 2/7/2014 | 2009 | ||||||||||||||||
| Walgreens | Maplewood | NJ | 4,700 | 1,071 | 6,071 | — | 7,142 | 1,138 | 11/18/2011 | 2011 | ||||||||||||||||
| Walgreens | Albuquerque | NM | — | 1,173 | 2,287 | — | 3,460 | 114 | 2/7/2014 | 1996 | ||||||||||||||||
| Walgreens | Las Vegas | NV | 6,566 | 1,528 | 6,114 | — | 7,642 | 963 | 5/30/2012 | 2009 | ||||||||||||||||
| Walgreens | Las Vegas | NV | — | 700 | 2,801 | — | 3,501 | 287 | 4/30/2013 | 2001 | ||||||||||||||||
| Walgreens | Lockport | NY | — | 2,358 | 2,301 | — | 4,659 | 98 | 4/21/2014 | 1998 | ||||||||||||||||
| Walgreens | Staten Island | NY | 3,081 | — | 3,984 | — | 3,984 | 767 | 10/5/2011 | 2007 | ||||||||||||||||
| Walgreens | Watertown | NY | — | 2,937 | 2,664 | — | 5,601 | 134 | 2/7/2014 | 2006 | ||||||||||||||||
F-237
| Initial Costs | Costs Capitalized Subsequent to Acquisition | Gross Amount Carried at December 31, 2014 (1) (2) | ||||||||||||||||||||||||
| Property | City | State | Encumbrances at December 31, 2014 | Land | Buildings, Fixtures and Improvements | Accumulated Depreciation (3) (4) | Date Acquired | Date of Construction | ||||||||||||||||||
| Walgreens | Akron | OH | 1,683 | 664 | 1,548 | — | 2,212 | 151 | 5/31/2013 | 1994 | ||||||||||||||||
| Walgreens | Bryan | OH | 2,842 | 219 | 4,154 | — | 4,373 | 717 | 2/22/2012 | 2007 | ||||||||||||||||
| Walgreens | Cleveland | OH | 1,372 | 472 | 1,890 | — | 2,362 | 69 | 5/19/2014 | 1994 | ||||||||||||||||
| Walgreens | Cleveland | OH | 2,692 | 743 | 4,757 | — | 5,500 | 239 | 2/7/2014 | 2008 | ||||||||||||||||
| Walgreens | Eaton | OH | 3,068 | 398 | 3,586 | — | 3,984 | 547 | 6/27/2012 | 2008 | ||||||||||||||||
| Walgreens | Liberty Township | OH | — | 920 | 4,330 | — | 5,250 | 213 | 2/7/2014 | 2011 | ||||||||||||||||
| Walgreens | Medina | OH | — | 820 | 4,585 | — | 5,405 | 217 | 2/7/2014 | 2001 | ||||||||||||||||
| Walgreens | New Albany | OH | — | 919 | 3,424 | — | 4,343 | 162 | 2/7/2014 | 2006 | ||||||||||||||||
| Walgreens | Xenia | OH | — | 537 | 4,799 | — | 5,336 | 235 | 2/7/2014 | 2009 | ||||||||||||||||
| Walgreens | Chickasha | OK | — | 347 | 4,200 | — | 4,547 | 201 | 2/7/2014 | 2007 | ||||||||||||||||
| Walgreens | Edmond | OK | 2,240 | 697 | 4,288 | — | 4,985 | 210 | 2/7/2014 | 2000 | ||||||||||||||||
| Walgreens | Stillwater | OK | — | 368 | 4,368 | — | 4,736 | 212 | 2/7/2014 | 2000 | ||||||||||||||||
| Walgreens | Tahlequah | OK | 2,940 | 647 | 3,664 | — | 4,311 | 431 | 1/2/2013 | 2008 | ||||||||||||||||
| Walgreens | Tulsa | OK | — | 1,147 | 2,904 | — | 4,051 | 142 | 2/7/2014 | 2001 | ||||||||||||||||
| Walgreens | Aibonito Pueblo | PR | 5,695 | 1,855 | 5,566 | — | 7,421 | 598 | 3/5/2013 | 2012 | ||||||||||||||||
| Walgreens | Las Piedras | PR | 5,293 | 1,726 | 5,179 | — | 6,905 | 531 | 4/3/2013 | 1995 | ||||||||||||||||
| Walgreens | Anderson | SC | 2,705 | 835 | 3,342 | — | 4,177 | 576 | 2/8/2012 | 2006 | ||||||||||||||||
| Walgreens | Easley | SC | 3,685 | 1,206 | 3,617 | — | 4,823 | 552 | 6/27/2012 | 2007 | ||||||||||||||||
| Walgreens | Fort Mill | SC | 2,272 | 1,300 | 2,760 | — | 4,060 | 151 | 2/7/2014 | 2010 | ||||||||||||||||
| Walgreens | Goose Creek | SC | — | 1,190 | 3,827 | — | 5,017 | 200 | 2/7/2014 | 2009 | ||||||||||||||||
| Walgreens | Greenville | SC | 3,991 | 1,313 | 3,940 | — | 5,253 | 601 | 6/27/2012 | 2006 | ||||||||||||||||
| Walgreens | Lancaster | SC | 2,980 | 1,941 | 3,526 | — | 5,467 | 196 | 2/7/2014 | 2009 | ||||||||||||||||
| Walgreens | Myrtle Beach | SC | — | — | 2,077 | — | 2,077 | 379 | 12/29/2011 | 2001 | ||||||||||||||||
| Walgreens | N. Charleston | SC | 3,380 | 1,320 | 3,081 | — | 4,401 | 470 | 6/27/2012 | 2007 | ||||||||||||||||
| Walgreens | Spearfish | SD | — | 1,116 | 4,158 | — | 5,274 | 205 | 2/7/2014 | 2008 | ||||||||||||||||
| Walgreens | Bartlett | TN | — | 2,358 | 2,194 | — | 4,552 | 106 | 2/7/2014 | 2001 | ||||||||||||||||
| Walgreens | Cordova | TN | 2,254 | 1,005 | 2,345 | — | 3,350 | 299 | 11/9/2012 | 2002 | ||||||||||||||||
| Walgreens | Memphis | TN | 2,418 | 896 | 2,687 | — | 3,583 | 356 | 10/2/2012 | 2003 | ||||||||||||||||
| Walgreens | Anthony | TX | — | 644 | 4,369 | — | 5,013 | 202 | 2/7/2014 | 2008 | ||||||||||||||||
F-238
| Initial Costs | Costs Capitalized Subsequent to Acquisition | Gross Amount Carried at December 31, 2014 (1) (2) | ||||||||||||||||||||||||
| Property | City | State | Encumbrances at December 31, 2014 | Land | Buildings, Fixtures and Improvements | Accumulated Depreciation (3) (4) | Date Acquired | Date of Construction | ||||||||||||||||||
| Walgreens | Baytown | TX | 2,480 | 953 | 4,299 | — | 5,252 | 207 | 2/7/2014 | 2009 | ||||||||||||||||
| Walgreens | Brownwood | TX | — | 868 | 4,718 | — | 5,586 | 227 | 2/7/2014 | 2008 | ||||||||||||||||
| Walgreens | Denton | TX | — | 1,184 | 3,726 | — | 4,910 | 179 | 2/7/2014 | 2009 | ||||||||||||||||
| Walgreens | Houston | TX | 1,604 | 491 | 1,965 | — | 2,456 | 83 | 5/19/2014 | 1993 | ||||||||||||||||
| Walgreens | Fredericksburg | VA | — | 2,320 | 3,789 | — | 6,109 | 212 | 2/7/2014 | 2008 | ||||||||||||||||
| Walgreens | Portsmouth | VA | 1,916 | 730 | 3,311 | — | 4,041 | 224 | 11/5/2013 | 1998 | ||||||||||||||||
| Walgreens | Roanoke | VA | — | 842 | 4,051 | — | 4,893 | 202 | 2/7/2014 | 2009 | ||||||||||||||||
| Walgreens | Appleton | WI | 1,880 | 975 | 3,047 | — | 4,022 | 150 | 2/7/2014 | 2008 | ||||||||||||||||
| Walgreens | Appleton | WI | 2,736 | 1,198 | 4,344 | — | 5,542 | 216 | 2/7/2014 | 2008 | ||||||||||||||||
| Walgreens | Beloit | WI | 2,184 | 721 | 3,653 | — | 4,374 | 183 | 2/7/2014 | 2008 | ||||||||||||||||
| Walgreens | Janesville | WI | — | 1,039 | 5,315 | — | 6,354 | 261 | 2/7/2014 | 2008 | ||||||||||||||||
| Walgreens | Janesville | WI | 2,235 | 593 | 4,009 | — | 4,602 | 196 | 2/7/2014 | 2010 | ||||||||||||||||
| Walgreens | La Crosse | WI | — | 1,335 | 3,800 | — | 5,135 | 189 | 2/7/2014 | 2009 | ||||||||||||||||
| Walgreens | Bridgeport | WV | — | 1,315 | 3,176 | — | 4,491 | 165 | 2/18/2014 | 2011 | ||||||||||||||||
| Wal-Mart | Riverside | CA | 55,000 | 14,163 | 71,926 | — | 86,089 | 3,326 | 2/7/2014 | 2011 | ||||||||||||||||
| Wal-Mart | Pueblo | CO | 8,250 | 2,586 | 12,512 | — | 15,098 | 627 | 2/7/2014 | 1998 | ||||||||||||||||
| Wal-Mart | Douglasville | GA | — | 3,559 | 17,588 | — | 21,147 | 818 | 2/7/2014 | 1999 | ||||||||||||||||
| Wal-Mart | Valdosta | GA | — | 3,909 | 9,447 | — | 13,356 | 453 | 2/7/2014 | 1998 | ||||||||||||||||
| Wal-Mart | Cary | NC | — | 2,314 | 5,550 | — | 7,864 | 262 | 2/7/2014 | 2005 | ||||||||||||||||
| Wal-Mart | Albuquerque | NM | — | 10,991 | — | — | 10,991 | — | 2/7/2014 | 2008 | ||||||||||||||||
| Wal-Mart | Las Vegas | NV | — | 11,499 | — | — | 11,499 | — | 2/7/2014 | 2002 | ||||||||||||||||
| Wal-Mart | Las Vegas | NV | — | 17,038 | — | — | 17,038 | — | 2/7/2014 | 2001 | ||||||||||||||||
| Wal-Mart | Lancaster | SC | — | 2,714 | 11,677 | — | 14,391 | 560 | 2/7/2014 | 1999 | ||||||||||||||||
| Wal-Mart | Oneida | TN | — | 1,803 | 8,580 | — | 10,383 | 401 | 2/7/2014 | 1999 | ||||||||||||||||
| WaWa | Gap | PA | — | 561 | 5,054 | — | 5,615 | 236 | 2/7/2014 | 2004 | ||||||||||||||||
| WaWa | Portsmouth | VA | 1,241 | 1,573 | — | — | 1,573 | — | 2/7/2014 | 2008 | ||||||||||||||||
| Weir Oil and Gas | Williston | ND | — | 273 | 6,232 | — | 6,505 | 148 | 6/25/2014 | 2012 | ||||||||||||||||
| Wells Fargo | Bristol | PA | — | 114 | 81 | — | 195 | 6 | 1/8/2014 | 1818 | ||||||||||||||||
| Wells Fargo | Lebanon | PA | — | 80 | 435 | — | 515 | 24 | 1/8/2014 | 1995 | ||||||||||||||||
F-239
| Initial Costs | Costs Capitalized Subsequent to Acquisition | Gross Amount Carried at December 31, 2014 (1) (2) | ||||||||||||||||||||||||
| Property | City | State | Encumbrances at December 31, 2014 | Land | Buildings, Fixtures and Improvements | Accumulated Depreciation (3) (4) | Date Acquired | Date of Construction | ||||||||||||||||||
| Wells Fargo | Hillsboro | OR | 13,500 | 10,480 | 19,287 | — | 29,767 | 741 | 2/7/2014 | 1978 | ||||||||||||||||
| Wendy's | Indianapolis | IN | — | 102 | 227 | — | 329 | 15 | 6/27/2013 | 1995 | ||||||||||||||||
| Wendy's | Anniston | AL | — | 454 | 591 | — | 1,045 | 50 | 6/27/2013 | 1976 | ||||||||||||||||
| Wendy's | Auburn | AL | — | 718 | 1,334 | — | 2,052 | 103 | 7/31/2013 | 2000 | ||||||||||||||||
| Wendy's | Birmingham | AL | — | 562 | 990 | — | 1,552 | 85 | 6/27/2013 | 2005 | ||||||||||||||||
| Wendy's | Homewood | AL | — | 995 | — | — | 995 | — | 6/27/2013 | 1995 | ||||||||||||||||
| Wendy's | Phenix City | AL | — | 529 | 1,178 | — | 1,707 | 101 | 6/27/2013 | 1999 | ||||||||||||||||
| Wendy's | Arkadelphia | AR | — | 225 | 633 | — | 858 | 54 | 6/27/2013 | 1990 | ||||||||||||||||
| Wendy's | Batesville | AR | — | 155 | 878 | — | 1,033 | 68 | 7/31/2013 | 1995 | ||||||||||||||||
| Wendy's | Benton | AR | — | 478 | 1,018 | — | 1,496 | 87 | 6/27/2013 | 1993 | ||||||||||||||||
| Wendy's | Bentonville | AR | — | 648 | 708 | — | 1,356 | 60 | 6/27/2013 | 1993 | ||||||||||||||||
| Wendy's | Bryant | AR | — | 529 | 575 | — | 1,104 | 49 | 6/27/2013 | 1995 | ||||||||||||||||
| Wendy's | Cabot | AR | — | 524 | 707 | — | 1,231 | 60 | 6/27/2013 | 1991 | ||||||||||||||||
| Wendy's | Conway | AR | — | 478 | 594 | — | 1,072 | 51 | 6/27/2013 | 1985 | ||||||||||||||||
| Wendy's | Conway | AR | — | 482 | 833 | — | 1,315 | 71 | 6/27/2013 | 1994 | ||||||||||||||||
| Wendy's | El Dorado | AR | — | 413 | 1,151 | — | 1,564 | 98 | 6/27/2013 | 1975 | ||||||||||||||||
| Wendy's | Fayetteville | AR | — | 408 | 830 | — | 1,238 | 71 | 6/27/2013 | 1994 | ||||||||||||||||
| Wendy's | Fayetteville | AR | — | 463 | 463 | — | 926 | 36 | 7/31/2013 | 1989 | ||||||||||||||||
| Wendy's | Fort Smith | AR | — | 195 | 1,186 | — | 1,381 | 101 | 6/27/2013 | 1995 | ||||||||||||||||
| Wendy's | Fort Smith | AR | — | 63 | 1,016 | — | 1,079 | 87 | 6/27/2013 | 1995 | ||||||||||||||||
| Wendy's | Hot Springs | AR | — | 593 | 395 | — | 988 | 30 | 7/31/2013 | 1974 | ||||||||||||||||
| Wendy's | Little Rock | AR | — | 278 | 878 | — | 1,156 | 75 | 6/27/2013 | 1976 | ||||||||||||||||
| Wendy's | Little Rock | AR | — | 762 | 258 | — | 1,020 | 22 | 6/27/2013 | 1977 | ||||||||||||||||
| Wendy's | Little Rock | AR | — | 990 | 623 | — | 1,613 | 53 | 6/27/2013 | 1982 | ||||||||||||||||
| Wendy's | Little Rock | AR | — | 605 | 463 | — | 1,068 | 40 | 6/27/2013 | 1987 | ||||||||||||||||
| Wendy's | Little Rock | AR | — | 501 | 501 | — | 1,002 | 39 | 7/31/2013 | 1983 | ||||||||||||||||
| Wendy's | Little Rock | AR | — | 773 | 773 | — | 1,546 | 60 | 7/31/2013 | 1994 | ||||||||||||||||
| Wendy's | Little Rock | AR | — | 532 | 650 | — | 1,182 | 50 | 7/31/2013 | 1978 | ||||||||||||||||
| Wendy's | North Little Rock | AR | — | 420 | 551 | — | 971 | 47 | 6/27/2013 | 1978 | ||||||||||||||||
F-240
| Initial Costs | Costs Capitalized Subsequent to Acquisition | Gross Amount Carried at December 31, 2014 (1) (2) | ||||||||||||||||||||||||
| Property | City | State | Encumbrances at December 31, 2014 | Land | Buildings, Fixtures and Improvements | Accumulated Depreciation (3) (4) | Date Acquired | Date of Construction | ||||||||||||||||||
| Wendy's | Pine Bluff | AR | — | 105 | 433 | — | 538 | 37 | 6/27/2013 | 1978 | ||||||||||||||||
| Wendy's | Pine Bluff | AR | — | 221 | 1,022 | — | 1,243 | 87 | 6/27/2013 | 1989 | ||||||||||||||||
| Wendy's | Rogers | AR | — | 579 | 912 | — | 1,491 | 78 | 6/27/2013 | 1995 | ||||||||||||||||
| Wendy's | Russellville | AR | — | 356 | 638 | — | 994 | 54 | 6/27/2013 | 1985 | ||||||||||||||||
| Wendy's | Searcy | AR | — | 247 | 905 | — | 1,152 | 77 | 6/27/2013 | 1978 | ||||||||||||||||
| Wendy's | Springdale | AR | — | 323 | 896 | — | 1,219 | 77 | 6/27/2013 | 1994 | ||||||||||||||||
| Wendy's | Springdale | AR | — | 410 | 821 | — | 1,231 | 70 | 6/27/2013 | 1995 | ||||||||||||||||
| Wendy's | Stuttgart | AR | — | 67 | 1,038 | — | 1,105 | 89 | 6/27/2013 | 2001 | ||||||||||||||||
| Wendy's | Van Buren | AR | — | 197 | 748 | — | 945 | 64 | 6/27/2013 | 1994 | ||||||||||||||||
| Wendy's | Payson | AZ | — | 679 | 829 | — | 1,508 | 64 | 7/31/2013 | 1986 | ||||||||||||||||
| Wendy's | Atascadero | CA | — | 230 | 1,009 | — | 1,239 | 82 | 6/27/2013 | 1995 | ||||||||||||||||
| Wendy's | Camarillo | CA | — | 320 | 2,253 | — | 2,573 | 182 | 6/27/2013 | 1995 | ||||||||||||||||
| Wendy's | Paso Robles | CA | — | 150 | 1,603 | — | 1,753 | 130 | 6/27/2013 | 1995 | ||||||||||||||||
| Wendy's | Groton | CT | — | 1,099 | 900 | — | 1,999 | 69 | 7/31/2013 | 1978 | ||||||||||||||||
| Wendy's | North Haven | CT | — | 729 | 610 | — | 1,339 | 52 | 6/27/2013 | 1980 | ||||||||||||||||
| Wendy's | Norwich | CT | — | 703 | 937 | — | 1,640 | 80 | 6/27/2013 | 1980 | ||||||||||||||||
| Wendy's | Orange | CT | — | 1,343 | 1,641 | — | 2,984 | 126 | 7/31/2013 | 1995 | ||||||||||||||||
| Wendy's | Cocoa | FL | — | 249 | 567 | — | 816 | 48 | 6/27/2013 | 1979 | ||||||||||||||||
| Wendy's | Indialantic | FL | — | 592 | 614 | — | 1,206 | 52 | 6/27/2013 | 1985 | ||||||||||||||||
| Wendy's | Lake Wales | FL | — | 975 | 1,462 | — | 2,437 | 112 | 7/31/2013 | 1999 | ||||||||||||||||
| Wendy's | Lynn Haven | FL | — | 446 | 852 | — | 1,298 | 73 | 6/27/2013 | 1995 | ||||||||||||||||
| Wendy's | Melbourne | FL | — | 550 | 681 | — | 1,231 | 58 | 6/27/2013 | 1993 | ||||||||||||||||
| Wendy's | Merritt Island | FL | — | 720 | 589 | — | 1,309 | 45 | 7/31/2013 | 1990 | ||||||||||||||||
| Wendy's | New Smyrna Beach | FL | — | 476 | 394 | — | 870 | 34 | 6/27/2013 | 1982 | ||||||||||||||||
| Wendy's | Ormond Beach | FL | — | 626 | 561 | — | 1,187 | 48 | 6/27/2013 | 1994 | ||||||||||||||||
| Wendy's | Ormond Beach | FL | — | 503 | 503 | — | 1,006 | 39 | 7/31/2013 | 1984 | ||||||||||||||||
| Wendy's | Panama City | FL | — | 461 | 529 | — | 990 | 45 | 6/27/2013 | 1984 | ||||||||||||||||
| Wendy's | Panama City | FL | — | 445 | 837 | — | 1,282 | 71 | 6/27/2013 | 1987 | ||||||||||||||||
| Wendy's | Port Orange | FL | — | 695 | 569 | — | 1,264 | 44 | 7/31/2013 | 1996 | ||||||||||||||||
F-241
| Initial Costs | Costs Capitalized Subsequent to Acquisition | Gross Amount Carried at December 31, 2014 (1) (2) | ||||||||||||||||||||||||
| Property | City | State | Encumbrances at December 31, 2014 | Land | Buildings, Fixtures and Improvements | Accumulated Depreciation (3) (4) | Date Acquired | Date of Construction | ||||||||||||||||||
| Wendy's | South Daytona | FL | — | 531 | 432 | — | 963 | 37 | 6/27/2013 | 1980 | ||||||||||||||||
| Wendy's | Starke | FL | — | 383 | 419 | — | 802 | 36 | 6/27/2013 | 1995 | ||||||||||||||||
| Wendy's | Tallahassee | FL | — | 952 | 514 | — | 1,466 | 44 | 6/27/2013 | 1986 | ||||||||||||||||
| Wendy's | Tallahassee | FL | — | 855 | 505 | — | 1,360 | 43 | 6/27/2013 | 1986 | ||||||||||||||||
| Wendy's | Titusville | FL | — | 528 | 239 | — | 767 | 20 | 6/27/2013 | 1978 | ||||||||||||||||
| Wendy's | Titusville | FL | — | 415 | 761 | — | 1,176 | 65 | 6/27/2013 | 1984 | ||||||||||||||||
| Wendy's | Titusville | FL | — | 414 | 770 | — | 1,184 | 59 | 7/31/2013 | 1996 | ||||||||||||||||
| Wendy's | Albany | GA | — | 414 | 1,656 | — | 2,070 | 127 | 7/31/2013 | 1995 | ||||||||||||||||
| Wendy's | Albany | GA | — | 383 | 748 | — | 1,131 | 33 | 3/26/2014 | 1999 | ||||||||||||||||
| Wendy's | Austell | GA | — | 383 | 506 | — | 889 | 43 | 6/27/2013 | 1994 | ||||||||||||||||
| Wendy's | Brunswick | GA | — | 306 | 435 | — | 741 | 37 | 6/27/2013 | 1985 | ||||||||||||||||
| Wendy's | Columbus | GA | — | 701 | 1,787 | — | 2,488 | 153 | 6/27/2013 | 1999 | ||||||||||||||||
| Wendy's | Columbus | GA | — | 743 | 1,185 | — | 1,928 | 101 | 6/27/2013 | 1988 | ||||||||||||||||
| Wendy's | Columbus | GA | — | 478 | 2,209 | — | 2,687 | 189 | 6/27/2013 | 2003 | ||||||||||||||||
| Wendy's | Columbus | GA | — | 223 | 1,380 | — | 1,603 | 61 | 3/26/2014 | 1982 | ||||||||||||||||
| Wendy's | Douglasville | GA | — | 605 | 776 | — | 1,381 | 66 | 6/27/2013 | 1993 | ||||||||||||||||
| Wendy's | Eastman | GA | — | 258 | 473 | — | 731 | 40 | 6/27/2013 | 1996 | ||||||||||||||||
| Wendy's | Fairburn | GA | — | 1,076 | 1,316 | — | 2,392 | 101 | 7/31/2013 | 2002 | ||||||||||||||||
| Wendy's | Hogansville | GA | — | 240 | 1,359 | — | 1,599 | 105 | 7/31/2013 | 1985 | ||||||||||||||||
| Wendy's | Lithia Springs | GA | — | 668 | 774 | — | 1,442 | 66 | 6/27/2013 | 1988 | ||||||||||||||||
| Wendy's | Morrow | GA | — | 755 | 922 | — | 1,677 | 71 | 7/31/2013 | 1990 | ||||||||||||||||
| Wendy's | Savannah | GA | — | 720 | 720 | — | 1,440 | 55 | 7/31/2013 | 2001 | ||||||||||||||||
| Wendy's | Sharpsburg | GA | — | 649 | 1,299 | — | 1,948 | 111 | 6/27/2013 | 2002 | ||||||||||||||||
| Wendy's | Smyrna | GA | — | 693 | 416 | — | 1,109 | 36 | 6/27/2013 | 1990 | ||||||||||||||||
| Wendy's | Stockbridge | GA | — | 480 | 558 | — | 1,038 | 48 | 6/27/2013 | 1987 | ||||||||||||||||
| Wendy's | Bourbonnais | IL | — | 346 | 1,039 | — | 1,385 | 80 | 7/31/2013 | 1993 | ||||||||||||||||
| Wendy's | Joliet | IL | — | 642 | 963 | — | 1,605 | 74 | 7/31/2013 | 1977 | ||||||||||||||||
| Wendy's | Kankakee | IL | — | 250 | 1,419 | — | 1,669 | 109 | 7/31/2013 | 2005 | ||||||||||||||||
| Wendy's | Mokena | IL | — | 665 | 997 | — | 1,662 | 77 | 7/31/2013 | 1992 | ||||||||||||||||
F-242
| Initial Costs | Costs Capitalized Subsequent to Acquisition | Gross Amount Carried at December 31, 2014 (1) (2) | ||||||||||||||||||||||||
| Property | City | State | Encumbrances at December 31, 2014 | Land | Buildings, Fixtures and Improvements | Accumulated Depreciation (3) (4) | Date Acquired | Date of Construction | ||||||||||||||||||
| Wendy's | Normal | IL | — | 443 | 991 | — | 1,434 | 43 | 3/26/2014 | 1985 | ||||||||||||||||
| Wendy's | Anderson | IN | — | 872 | 736 | — | 1,608 | 63 | 6/27/2013 | 1978 | ||||||||||||||||
| Wendy's | Anderson | IN | — | 859 | 708 | — | 1,567 | 60 | 6/27/2013 | 1978 | ||||||||||||||||
| Wendy's | Anderson | IN | — | 505 | 757 | — | 1,262 | 58 | 7/31/2013 | 1995 | ||||||||||||||||
| Wendy's | Anderson | IN | — | 584 | 713 | — | 1,297 | 55 | 7/31/2013 | 1976 | ||||||||||||||||
| Wendy's | Avon | IN | — | 538 | 407 | — | 945 | 29 | 2/7/2014 | 1990 | ||||||||||||||||
| Wendy's | Avon | IN | — | 638 | 330 | — | 968 | 31 | 2/7/2014 | 1999 | ||||||||||||||||
| Wendy's | Carmel | IN | — | 736 | 211 | — | 947 | 16 | 2/7/2014 | 1980 | ||||||||||||||||
| Wendy's | Carmel | IN | — | 915 | 178 | — | 1,093 | 20 | 2/7/2014 | 2001 | ||||||||||||||||
| Wendy's | Connersville | IN | — | 324 | 1,298 | — | 1,622 | 100 | 7/31/2013 | 1989 | ||||||||||||||||
| Wendy's | Fishers | IN | — | 855 | 147 | — | 1,002 | 17 | 2/7/2014 | 1999 | ||||||||||||||||
| Wendy's | Fishers | IN | — | 761 | 229 | — | 990 | 21 | 2/7/2014 | 2012 | ||||||||||||||||
| Wendy's | Greenfield | IN | — | 429 | 214 | — | 643 | 17 | 2/7/2014 | 1980 | ||||||||||||||||
| Wendy's | Indianapolis | IN | — | 751 | 212 | — | 963 | 20 | 2/7/2014 | 1993 | ||||||||||||||||
| Wendy's | Lebanon | IN | — | 1,265 | 108 | — | 1,373 | 15 | 2/7/2014 | 1979 | ||||||||||||||||
| Wendy's | Noblesville | IN | — | 590 | 42 | — | 632 | 4 | 2/7/2014 | 1988 | ||||||||||||||||
| Wendy's | Pendleton | IN | — | 448 | 895 | — | 1,343 | 76 | 6/27/2013 | 2005 | ||||||||||||||||
| Wendy's | Richmond | IN | — | 735 | 1,716 | — | 2,451 | 132 | 7/31/2013 | 1989 | ||||||||||||||||
| Wendy's | Richmond | IN | — | 661 | 992 | — | 1,653 | 76 | 7/31/2013 | 1989 | ||||||||||||||||
| Wendy's | Benton | KY | — | 252 | 926 | — | 1,178 | 41 | 3/26/2014 | 2001 | ||||||||||||||||
| Wendy's | Louisville | KY | — | 834 | 1,379 | — | 2,213 | 118 | 6/27/2013 | 2001 | ||||||||||||||||
| Wendy's | Louisville | KY | — | 532 | 1,221 | — | 1,753 | 104 | 6/27/2013 | 1998 | ||||||||||||||||
| Wendy's | Louisville | KY | — | 857 | 1,421 | — | 2,278 | 121 | 6/27/2013 | 2000 | ||||||||||||||||
| Wendy's | Mayfield | KY | — | 242 | 779 | — | 1,021 | 34 | 3/26/2014 | 1986 | ||||||||||||||||
| Wendy's | Baton Rouge | LA | — | 316 | 782 | — | 1,098 | 67 | 6/27/2013 | 1998 | ||||||||||||||||
| Wendy's | Minden | LA | — | 182 | 936 | — | 1,118 | 80 | 6/27/2013 | 2001 | ||||||||||||||||
F-243
| Initial Costs | Costs Capitalized Subsequent to Acquisition | Gross Amount Carried at December 31, 2014 (1) (2) | ||||||||||||||||||||||||||||||
| Property | City | State | Encumbrances at December 31, 2014 | Land | Buildings, Fixtures and Improvements | Accumulated Depreciation (3) (4) | Date Acquired | Date of Construction | ||||||||||||||||||||||||
| Wendy's | Worcester | MA | — | 370 | 1,288 | — | 1,658 | 104 | 6/27/2013 | 1995 | ||||||||||||||||||||||
| Wendy's | Baltimore | MD | — | 760 | 802 | — | 1,562 | 69 | 6/27/2013 | 1995 | ||||||||||||||||||||||
| Wendy's | Baltimore | MD | — | 904 | 1,036 | — | 1,940 | 89 | 6/27/2013 | 2002 | ||||||||||||||||||||||
| Wendy's | Landover | MD | — | 340 | 267 | — | 607 | 23 | 6/27/2013 | 1978 | ||||||||||||||||||||||
| Wendy's | Pasadena | MD | — | 1,049 | 1,902 | — | 2,951 | 162 | 6/27/2013 | 1997 | ||||||||||||||||||||||
| Wendy's | Salisbury | MD | — | 370 | 1,299 | — | 1,669 | 105 | 6/27/2013 | 1995 | ||||||||||||||||||||||
| Wendy's | Suitland | MD | — | 332 | 275 | — | 607 | 23 | 6/27/2013 | 1979 | ||||||||||||||||||||||
| Wendy's | Madison Heights | MI | — | 198 | 725 | — | 923 | 62 | 6/27/2013 | 1998 | ||||||||||||||||||||||
| Wendy's | Picayune | MS | — | 437 | 1,032 | — | 1,469 | 45 | 3/26/2014 | 1983 | ||||||||||||||||||||||
| Wendy's | Creedmoor | NC | — | 533 | 663 | — | 1,196 | 57 | 6/27/2013 | 1995 | ||||||||||||||||||||||
| Wendy's | Kinston | NC | — | 491 | 1,159 | — | 1,650 | 41 | 5/1/2014 | 2004 | ||||||||||||||||||||||
| Wendy's | Bellevue | NE | — | 338 | 484 | — | 822 | 41 | 6/27/2013 | 1981 | ||||||||||||||||||||||
| Wendy's | Eatontown | NJ | — | 651 | 796 | — | 1,447 | 61 | 7/31/2013 | 1987 | ||||||||||||||||||||||
| Wendy's | Millville | NJ | — | 373 | 1,169 | — | 1,542 | 100 | 6/27/2013 | 1994 | ||||||||||||||||||||||
| Wendy's | Henderson | NV | — | 933 | 842 | — | 1,775 | 48 | 2/7/2014 | 1997 | ||||||||||||||||||||||
| Wendy's | Henderson | NV | — | 882 | 457 | — | 1,339 | 26 | 2/7/2014 | 1999 | ||||||||||||||||||||||
| Wendy's | Henderson | NV | — | 785 | 508 | — | 1,293 | 31 | 2/7/2014 | 2000 | ||||||||||||||||||||||
| Wendy's | Las Vegas | NV | — | 397 | 589 | — | 986 | 29 | 2/7/2014 | 1976 | ||||||||||||||||||||||
| Wendy's | Las Vegas | NV | — | 919 | 562 | — | 1,481 | 33 | 2/7/2014 | 1976 | ||||||||||||||||||||||
| Wendy's | Las Vegas | NV | — | 789 | 583 | — | 1,372 | 29 | 2/7/2014 | 1984 | ||||||||||||||||||||||
| Wendy's | Las Vegas | NV | — | 724 | 458 | — | 1,182 | 27 | 2/7/2014 | 1986 | ||||||||||||||||||||||
| Wendy's | Las Vegas | NV | — | 915 | 724 | — | 1,639 | 40 | 2/7/2014 | 1991 | ||||||||||||||||||||||
| Wendy's | Las Vegas | NV | — | 633 | 392 | — | 1,025 | 20 | 2/7/2014 | 1994 | ||||||||||||||||||||||
| Wendy's | Auburn | NY | — | 465 | 1,085 | — | 1,550 | 83 | 7/31/2013 | 1977 | ||||||||||||||||||||||
| Wendy's | Binghamton | NY | — | 293 | 879 | — | 1,172 | 68 | 7/31/2013 | 1978 | ||||||||||||||||||||||
| Wendy's | Corning | NY | — | 191 | 1,717 | — | 1,908 | 132 | 7/31/2013 | 1996 | ||||||||||||||||||||||
| Wendy's | Cortland | NY | — | 635 | 952 | — | 1,587 | 73 | 7/31/2013 | 1984 | ||||||||||||||||||||||
| Wendy's | Endicott | NY | — | 313 | 1,253 | — | 1,566 | 96 | 7/31/2013 | 1987 | ||||||||||||||||||||||
| Wendy's | Fulton | NY | — | 392 | 1,181 | — | 1,573 | 52 | 3/26/2014 | 1980 | ||||||||||||||||||||||
| Wendy's | Horseheads | NY | — | 72 | 1,369 | — | 1,441 | 105 | 7/31/2013 | 1982 | ||||||||||||||||||||||
| Wendy's | Liverpool | NY | — | 530 | 864 | — | 1,394 | 27 | 3/26/2014 | 1980 | ||||||||||||||||||||||
| Wendy's | Oswego | NY | — | 190 | 645 | — | 835 | 28 | 3/26/2014 | 1986 | ||||||||||||||||||||||
F-244
| Initial Costs | Costs Capitalized Subsequent to Acquisition | Gross Amount Carried at December 31, 2014 (1) (2) | ||||||||||||||||||||||||||||||
| Property | City | State | Encumbrances at December 31, 2014 | Land | Buildings, Fixtures and Improvements | Accumulated Depreciation (3) (4) | Date Acquired | Date of Construction | ||||||||||||||||||||||||
| Wendy's | Owego | NY | — | 101 | 1,915 | — | 2,016 | 147 | 7/31/2013 | 1989 | ||||||||||||||||||||||
| Wendy's | Vestal | NY | — | 488 | 878 | — | 1,366 | 28 | 3/26/2014 | 1995 | ||||||||||||||||||||||
| Wendy's | Belpre | OH | — | 297 | 1,195 | — | 1,492 | 52 | 3/26/2014 | 2000 | ||||||||||||||||||||||
| Wendy's | Bowling Green | OH | — | 502 | 932 | — | 1,434 | 72 | 7/31/2013 | 1994 | ||||||||||||||||||||||
| Wendy's | Brookville | OH | — | 448 | 1,072 | — | 1,520 | 47 | 3/26/2014 | 1984 | ||||||||||||||||||||||
| Wendy's | Buckeye Lake | OH | — | 864 | 877 | — | 1,741 | 75 | 6/27/2013 | 2000 | ||||||||||||||||||||||
| Wendy's | Centerville | OH | — | 615 | 1,434 | — | 2,049 | 110 | 7/31/2013 | 1997 | ||||||||||||||||||||||
| Wendy's | Cincinnati | OH | — | 939 | 1,408 | — | 2,347 | 108 | 7/31/2013 | 1980 | ||||||||||||||||||||||
| Wendy's | Dayton | OH | — | 723 | 1,343 | — | 2,066 | 103 | 7/31/2013 | 1977 | ||||||||||||||||||||||
| Wendy's | Dayton | OH | — | 304 | 1,264 | — | 1,568 | 55 | 3/26/2014 | 1974 | ||||||||||||||||||||||
| Wendy's | Dayton | OH | — | 288 | 813 | — | 1,101 | 36 | 3/26/2014 | 1985 | ||||||||||||||||||||||
| Wendy's | Dayton | OH | — | 342 | 848 | — | 1,190 | 37 | 3/26/2014 | 1973 | ||||||||||||||||||||||
| Wendy's | Dayton | OH | — | 274 | 1,029 | — | 1,303 | 47 | 3/26/2014 | 2004 | ||||||||||||||||||||||
| Wendy's | Dayton | OH | — | 286 | 869 | — | 1,155 | 38 | 3/26/2014 | 1977 | ||||||||||||||||||||||
| Wendy's | Dayton | OH | — | 258 | 838 | — | 1,096 | 37 | 3/26/2014 | 1985 | ||||||||||||||||||||||
| Wendy's | Eaton | OH | — | 207 | 1,084 | — | 1,291 | 32 | 3/26/2014 | 1993 | ||||||||||||||||||||||
| Wendy's | Englewood | OH | — | 261 | 924 | — | 1,185 | 41 | 3/26/2014 | 1976 | ||||||||||||||||||||||
| Wendy's | Fairborn | OH | — | 629 | 1,468 | — | 2,097 | 113 | 7/31/2013 | 1999 | ||||||||||||||||||||||
| Wendy's | Fairborn | OH | — | 604 | 1,408 | — | 2,012 | 108 | 7/31/2013 | 1992 | ||||||||||||||||||||||
| Wendy's | Fairborn | OH | — | 271 | 828 | — | 1,099 | 36 | 3/26/2014 | 1975 | ||||||||||||||||||||||
| Wendy's | Fairfield | OH | — | 794 | 971 | — | 1,765 | 75 | 7/31/2013 | 1981 | ||||||||||||||||||||||
| Wendy's | Hamilton | OH | — | 655 | 1,848 | — | 2,503 | 158 | 6/27/2013 | 2001 | ||||||||||||||||||||||
| Wendy's | Hamilton | OH | — | 697 | 1,295 | — | 1,992 | 100 | 7/31/2013 | 1974 | ||||||||||||||||||||||
| Wendy's | Hamilton | OH | — | 908 | 1,362 | — | 2,270 | 105 | 7/31/2013 | 2002 | ||||||||||||||||||||||
| Wendy's | Hillsboro | OH | — | 291 | 1,408 | — | 1,699 | 120 | 6/27/2013 | 1985 | ||||||||||||||||||||||
| Wendy's | Lancaster | OH | — | 552 | 1,025 | — | 1,577 | 79 | 7/31/2013 | 1984 | ||||||||||||||||||||||
| Wendy's | Miamisburg | OH | — | 888 | 1,086 | — | 1,974 | 84 | 7/31/2013 | 1995 | ||||||||||||||||||||||
| Wendy's | Middletown | OH | — | 755 | 1,133 | — | 1,888 | 87 | 7/31/2013 | 1995 | ||||||||||||||||||||||
| Wendy's | Middletown | OH | — | 752 | 920 | — | 1,672 | 71 | 7/31/2013 | 1995 | ||||||||||||||||||||||
| Wendy's | Middletown | OH | — | 494 | 1,481 | — | 1,975 | 114 | 7/31/2013 | 1977 | ||||||||||||||||||||||
| Wendy's | Saint Bernard | OH | — | 432 | 1,009 | — | 1,441 | 78 | 7/31/2013 | 1985 | ||||||||||||||||||||||
| Wendy's | Springboro | OH | — | 891 | 1,336 | — | 2,227 | 103 | 7/31/2013 | 1982 | ||||||||||||||||||||||
F-245
| Initial Costs | Costs Capitalized Subsequent to Acquisition | Gross Amount Carried at December 31, 2014 (1) (2) | ||||||||||||||||||||||||||||||
| Property | City | State | Encumbrances at December 31, 2014 | Land | Buildings, Fixtures and Improvements | Accumulated Depreciation (3) (4) | Date Acquired | Date of Construction | ||||||||||||||||||||||||
| Wendy's | Swanton | OH | — | 430 | 1,233 | — | 1,663 | 100 | 6/27/2013 | 1995 | ||||||||||||||||||||||
| Wendy's | Sylvania | OH | — | 300 | 799 | — | 1,099 | 65 | 6/27/2013 | 1995 | ||||||||||||||||||||||
| Wendy's | West Carrollton | OH | — | 708 | 865 | — | 1,573 | 67 | 7/31/2013 | 1979 | ||||||||||||||||||||||
| Wendy's | West Chester | OH | — | 944 | 772 | — | 1,716 | 59 | 7/31/2013 | 1982 | ||||||||||||||||||||||
| Wendy's | West Chester | OH | — | 616 | 924 | — | 1,540 | 71 | 7/31/2013 | 2005 | ||||||||||||||||||||||
| Wendy's | Whitehall | OH | — | 716 | 863 | — | 1,579 | 74 | 6/27/2013 | 1983 | ||||||||||||||||||||||
| Wendy's | Wintersville | OH | — | 621 | 1,450 | — | 2,071 | 112 | 7/31/2013 | 1977 | ||||||||||||||||||||||
| Wendy's | Edmond | OK | — | 791 | 697 | — | 1,488 | 32 | 3/27/2014 | 1979 | ||||||||||||||||||||||
| Wendy's | Enid | OK | — | 158 | 893 | — | 1,051 | 69 | 7/31/2013 | 2003 | ||||||||||||||||||||||
| Wendy's | Ponca City | OK | — | 529 | 983 | — | 1,512 | 76 | 7/31/2013 | 1979 | ||||||||||||||||||||||
| Wendy's | The Dalles | OR | — | 200 | 802 | — | 1,002 | 62 | 7/31/2013 | 1994 | ||||||||||||||||||||||
| Wendy's | Sayre | PA | — | 372 | 1,115 | — | 1,487 | 86 | 7/31/2013 | 1994 | ||||||||||||||||||||||
| Wendy's | Anderson | SC | — | 734 | 897 | — | 1,631 | 69 | 7/31/2013 | 1995 | ||||||||||||||||||||||
| Wendy's | Columbia | SC | — | 1,368 | — | — | 1,368 | — | 6/27/2013 | 1995 | ||||||||||||||||||||||
| Wendy's | Columbia | SC | — | 425 | 438 | — | 863 | 37 | 6/27/2013 | 1993 | ||||||||||||||||||||||
| Wendy's | Greenville | SC | — | 516 | 631 | — | 1,147 | 49 | 7/31/2013 | 1975 | ||||||||||||||||||||||
| Wendy's | N. Myrtle Beach | SC | — | 463 | 861 | — | 1,324 | 66 | 7/31/2013 | 1983 | ||||||||||||||||||||||
| Wendy's | Spartanburg | SC | — | 699 | 572 | — | 1,271 | 44 | 7/31/2013 | 1977 | ||||||||||||||||||||||
| Wendy's | Brentwood | TN | — | 339 | 1,356 | — | 1,695 | 104 | 7/31/2013 | 1982 | ||||||||||||||||||||||
| Wendy's | Crossville | TN | — | 190 | 760 | — | 950 | 58 | 7/31/2013 | 1978 | ||||||||||||||||||||||
| Wendy's | Knoxville | TN | — | 330 | 1,161 | — | 1,491 | 94 | 6/27/2013 | 1995 | ||||||||||||||||||||||
| Wendy's | Knoxville | TN | — | 330 | 1,132 | — | 1,462 | 91 | 6/27/2013 | 1995 | ||||||||||||||||||||||
| Wendy's | Manchester | TN | — | 245 | 1,390 | — | 1,635 | 107 | 7/31/2013 | 1984 | ||||||||||||||||||||||
| Wendy's | Mcminnville | TN | — | 255 | 1,443 | — | 1,698 | 111 | 7/31/2013 | 2010 | ||||||||||||||||||||||
| Wendy's | Memphis | TN | — | 227 | 530 | — | 757 | 41 | 7/31/2013 | 1980 | ||||||||||||||||||||||
| Wendy's | Millington | TN | — | 380 | 1,208 | — | 1,588 | 98 | 6/27/2013 | 1995 | ||||||||||||||||||||||
| Wendy's | Murfreesboro | TN | — | 586 | 1,088 | — | 1,674 | 84 | 7/31/2013 | 1983 | ||||||||||||||||||||||
| Wendy's | Nashville | TN | — | 592 | 1,100 | — | 1,692 | 85 | 7/31/2013 | 1983 | ||||||||||||||||||||||
| Wendy's | Nashville | TN | — | 328 | 1,313 | — | 1,641 | 101 | 7/31/2013 | 1983 | ||||||||||||||||||||||
| Wendy's | Arlington | TX | — | 1,322 | 1,546 | — | 2,868 | 132 | 6/27/2013 | 1994 | ||||||||||||||||||||||
| Wendy's | Corpus Christi | TX | — | 646 | 1,199 | — | 1,845 | 92 | 7/31/2013 | 1987 | ||||||||||||||||||||||
| Wendy's | El Paso | TX | — | 630 | 1,889 | — | 2,519 | 145 | 7/31/2013 | 1996 | ||||||||||||||||||||||
F-246
| Initial Costs | Costs Capitalized Subsequent to Acquisition | Gross Amount Carried at December 31, 2014 (1) (2) | ||||||||||||||||||||||||||||||
| Property | City | State | Encumbrances at December 31, 2014 | Land | Buildings, Fixtures and Improvements | Accumulated Depreciation (3) (4) | Date Acquired | Date of Construction | ||||||||||||||||||||||||
| Wendy's | Kingwood | TX | — | 304 | 1,724 | — | 2,028 | 133 | 7/31/2013 | 2001 | ||||||||||||||||||||||
| Wendy's | San Antonio | TX | — | 268 | 630 | — | 898 | 54 | 6/27/2013 | 1985 | ||||||||||||||||||||||
| Wendy's | San Antonio | TX | — | 320 | 320 | — | 640 | 27 | 6/27/2013 | 1985 | ||||||||||||||||||||||
| Wendy's | San Antonio | TX | — | 410 | 451 | — | 861 | 39 | 6/27/2013 | 1987 | ||||||||||||||||||||||
| Wendy's | San Antonio | TX | — | 707 | 603 | — | 1,310 | 28 | 2/7/2014 | 1990 | ||||||||||||||||||||||
| Wendy's | San Antonio | TX | — | 633 | 1,388 | — | 2,021 | 60 | 2/7/2014 | 1992 | ||||||||||||||||||||||
| Wendy's | San Antonio | TX | — | 1,007 | 546 | — | 1,553 | 27 | 2/7/2014 | 1995 | ||||||||||||||||||||||
| Wendy's | San Antonio | TX | — | 703 | 45 | — | 748 | 4 | 2/7/2014 | 2000 | ||||||||||||||||||||||
| Wendy's | San Antonio | TX | — | 788 | 45 | — | 833 | 4 | 2/7/2014 | 2003 | ||||||||||||||||||||||
| Wendy's | San Marcos | TX | — | 714 | 1,024 | — | 1,738 | 47 | 2/7/2014 | 2002 | ||||||||||||||||||||||
| Wendy's | Schertz | TX | — | 793 | 109 | — | 902 | 6 | 2/7/2014 | 1994 | ||||||||||||||||||||||
| Wendy's | Selma | TX | — | 841 | 117 | — | 958 | 6 | 2/7/2014 | 2003 | ||||||||||||||||||||||
| Wendy's | Springs | TX | — | 217 | 266 | — | 483 | 20 | 7/31/2013 | 1987 | ||||||||||||||||||||||
| Wendy's | Bluefield | VA | — | 450 | 1,927 | — | 2,377 | 156 | 6/27/2013 | 1995 | ||||||||||||||||||||||
| Wendy's | Christiansburg | VA | — | 416 | 624 | — | 1,040 | 48 | 7/31/2013 | 1980 | ||||||||||||||||||||||
| Wendy's | Dublin | VA | — | 384 | 1,402 | — | 1,786 | 120 | 6/27/2013 | 1993 | ||||||||||||||||||||||
| Wendy's | Emporia | VA | — | 631 | 1,424 | — | 2,055 | 122 | 6/27/2013 | 1994 | ||||||||||||||||||||||
| Wendy's | Hayes | VA | — | 304 | 859 | — | 1,163 | 73 | 6/27/2013 | 1992 | ||||||||||||||||||||||
| Wendy's | Hillsville | VA | — | 324 | 973 | — | 1,297 | 75 | 7/31/2013 | 2001 | ||||||||||||||||||||||
| Wendy's | Lebanon | VA | — | 431 | 1,006 | — | 1,437 | 77 | 7/31/2013 | 1983 | ||||||||||||||||||||||
| Wendy's | Mechanicsville | VA | — | 521 | 704 | — | 1,225 | 60 | 6/27/2013 | 1989 | ||||||||||||||||||||||
| Wendy's | Midlothian | VA | — | 230 | 1,300 | — | 1,530 | 105 | 6/27/2013 | 1995 | ||||||||||||||||||||||
| Wendy's | North Tazewell | VA | — | 124 | 560 | — | 684 | 48 | 6/27/2013 | 1980 | ||||||||||||||||||||||
| Wendy's | Pounding Mill | VA | — | 296 | 1,404 | — | 1,700 | 120 | 6/27/2013 | 2004 | ||||||||||||||||||||||
| Wendy's | South Hill | VA | — | 313 | �� | 976 | — | 1,289 | 83 | 6/27/2013 | 1995 | |||||||||||||||||||||
| Wendy's | Woodbridge | VA | — | 1,193 | 1,598 | — | 2,791 | 137 | 6/27/2013 | 1996 | ||||||||||||||||||||||
| Wendy's | Woodbridge | VA | — | 521 | 615 | — | 1,136 | 53 | 6/27/2013 | 1978 | ||||||||||||||||||||||
| Wendy's | Wytheville | VA | — | 598 | 897 | — | 1,495 | 69 | 7/31/2013 | 2003 | ||||||||||||||||||||||
| Wendy's | Bellingham | WA | — | 502 | 477 | — | 979 | 24 | 2/7/2014 | 1994 | ||||||||||||||||||||||
| Wendy's | Bothell | WA | — | 687 | 292 | — | 979 | 11 | 2/7/2014 | 2004 | ||||||||||||||||||||||
| Wendy's | Burlington | WA | — | 425 | 806 | — | 1,231 | 69 | 6/27/2013 | 1994 | ||||||||||||||||||||||
| Wendy's | Port Angeles | WA | — | 422 | 503 | — | 925 | 42 | 2/7/2014 | 1980 | ||||||||||||||||||||||
F-247
| Initial Costs | Costs Capitalized Subsequent to Acquisition | Gross Amount Carried at December 31, 2014 (1) (2) | ||||||||||||||||||||||||||||||
| Property | City | State | Encumbrances at December 31, 2014 | Land | Buildings, Fixtures and Improvements | Accumulated Depreciation (3) (4) | Date Acquired | Date of Construction | ||||||||||||||||||||||||
| Wendy's | Redmond | WA | — | 969 | 123 | — | 1,092 | 4 | 2/7/2014 | 1977 | ||||||||||||||||||||||
| Wendy's | Silverdale | WA | — | 808 | 201 | — | 1,009 | 28 | 2/7/2014 | 1995 | ||||||||||||||||||||||
| Wendy's | Beloit | WI | — | 1,138 | 931 | — | 2,069 | 72 | 7/31/2013 | 2002 | ||||||||||||||||||||||
| Wendy's | Fitchburg | WI | — | 662 | 1,230 | — | 1,892 | 95 | 7/31/2013 | 2003 | ||||||||||||||||||||||
| Wendy's | Germantown | WI | — | 419 | 1,257 | — | 1,676 | 97 | 7/31/2013 | 1989 | ||||||||||||||||||||||
| Wendy's | Greenfield | WI | — | 487 | 1,137 | — | 1,624 | 87 | 7/31/2013 | 2001 | ||||||||||||||||||||||
| Wendy's | Janesville | WI | — | 647 | 971 | — | 1,618 | 75 | 7/31/2013 | 1991 | ||||||||||||||||||||||
| Wendy's | Kenosha | WI | — | 322 | 1,290 | — | 1,612 | 99 | 7/31/2013 | 1984 | ||||||||||||||||||||||
| Wendy's | Kenosha | WI | — | 965 | 1,447 | — | 2,412 | 111 | 7/31/2013 | 1986 | ||||||||||||||||||||||
| Wendy's | Madison | WI | — | 454 | 1,362 | — | 1,816 | 105 | 7/31/2013 | 1998 | ||||||||||||||||||||||
| Wendy's | Milwaukee | WI | — | 810 | 810 | — | 1,620 | 62 | 7/31/2013 | 1979 | ||||||||||||||||||||||
| Wendy's | Milwaukee | WI | — | 338 | 1,351 | — | 1,689 | 104 | 7/31/2013 | 1985 | ||||||||||||||||||||||
| Wendy's | Milwaukee | WI | — | 436 | 1,016 | — | 1,452 | 78 | 7/31/2013 | 1983 | ||||||||||||||||||||||
| Wendy's | New Berlin | WI | — | 903 | 739 | — | 1,642 | 57 | 7/31/2013 | 1983 | ||||||||||||||||||||||
| Wendy's | Oak Creek | WI | — | 577 | 1,347 | — | 1,924 | 104 | 7/31/2013 | 1999 | ||||||||||||||||||||||
| Wendy's | Sheboygan | WI | — | 676 | 1,014 | — | 1,690 | 78 | 7/31/2013 | 1995 | ||||||||||||||||||||||
| Wendy's | West Allis | WI | — | 583 | 1,083 | — | 1,666 | 83 | 7/31/2013 | 1984 | ||||||||||||||||||||||
| Wendy's | Beaver | WV | — | 290 | 1,156 | — | 1,446 | 93 | 6/27/2013 | 1995 | ||||||||||||||||||||||
| Wendy's | Bridgeport | WV | — | 273 | 818 | — | 1,091 | 63 | 7/31/2013 | 1984 | ||||||||||||||||||||||
| Wendy's | Buckhannon | WV | — | 157 | 890 | — | 1,047 | 68 | 7/31/2013 | 1987 | ||||||||||||||||||||||
| Wendy's | Clarksburg | WV | — | 277 | 1,181 | — | 1,458 | 52 | 3/26/2014 | 1980 | ||||||||||||||||||||||
| Wendy's | Fairmont | WV | — | 224 | 1,119 | — | 1,343 | 96 | 6/27/2013 | 1983 | ||||||||||||||||||||||
| Wendy's | Parkersburg | WV | — | 295 | 885 | — | 1,180 | 68 | 7/31/2013 | 1979 | ||||||||||||||||||||||
| Wendy's | Parkersburg | WV | — | 311 | 1,243 | — | 1,554 | 96 | 7/31/2013 | 1977 | ||||||||||||||||||||||
| Wendy's | Parkersburg | WV | — | 241 | 964 | — | 1,205 | 74 | 7/31/2013 | 1996 | ||||||||||||||||||||||
| Wendy's | Ripley | WV | — | 273 | 871 | — | 1,144 | 74 | 6/27/2013 | 1984 | ||||||||||||||||||||||
| Wendy's | Saint Marys | WV | — | 69 | 1,322 | — | 1,391 | 102 | 7/31/2013 | 2001 | ||||||||||||||||||||||
| Wendy's | Vienna | WV | — | 301 | 702 | — | 1,003 | 54 | 7/31/2013 | 1976 | ||||||||||||||||||||||
| West Fork Roadhouse | Youngstown | OH | — | 139 | 232 | — | 371 | 20 | 6/27/2013 | 1976 | ||||||||||||||||||||||
| West Marine | Anchorage | AK | — | 1,220 | 2,531 | — | 3,751 | 106 | 3/31/2014 | 1995 | ||||||||||||||||||||||
| West Marine | Fort Lauderdale | FL | — | 4,337 | 9,052 | — | 13,389 | 377 | 2/7/2014 | 2011 | ||||||||||||||||||||||
| West Marine | Harrison Township | MI | — | 452 | 2,092 | — | 2,544 | 121 | 2/7/2014 | 2009 | ||||||||||||||||||||||
F-248
| Initial Costs | Costs Capitalized Subsequent to Acquisition | Gross Amount Carried at December 31, 2014 (1) (2) | ||||||||||||||||||||||||||||||
| Property | City | State | Encumbrances at December 31, 2014 | Land | Buildings, Fixtures and Improvements | Accumulated Depreciation (3) (4) | Date Acquired | Date of Construction | ||||||||||||||||||||||||
| West Marine | Deltaville | VA | — | 425 | 2,409 | — | 2,834 | 333 | 7/31/2012 | 2012 | ||||||||||||||||||||||
| Whataburger | Edna | TX | — | 290 | 869 | — | 1,159 | 67 | 7/31/2013 | 1986 | ||||||||||||||||||||||
| Whataburger | El Campo | TX | — | 693 | 1,013 | — | 1,706 | 87 | 6/27/2013 | 1986 | ||||||||||||||||||||||
| Whataburger | Ingleside | TX | — | 1,106 | 474 | — | 1,580 | 36 | 7/31/2013 | 1986 | ||||||||||||||||||||||
| Whataburger | Lubbock | TX | — | 432 | 647 | — | 1,079 | 50 | 7/31/2013 | 1992 | ||||||||||||||||||||||
| White Transfer & Storage | Clarion | IA | 3,141 | 450 | 1,458 | — | 1,908 | 322 | 2/21/2014 | 1997 | ||||||||||||||||||||||
| Whole Foods | Hinsdale | IL | 5,709 | 5,499 | 7,389 | — | 12,888 | 374 | 2/7/2014 | 1999 | ||||||||||||||||||||||
| Willbros Group, Inc. | Tulsa | OK | — | 2,239 | 6,375 | — | 8,614 | 143 | 6/25/2014 | 1982 | ||||||||||||||||||||||
| Williams Fried Chicken | Garland | TX | — | 265 | 137 | — | 402 | 12 | 6/27/2013 | 1983 | ||||||||||||||||||||||
| Williams Sonoma | Olive Branch | MS | 28,350 | 2,330 | 44,266 | — | 46,596 | 6,413 | 8/10/2012 | 2001 | ||||||||||||||||||||||
| Winn-Dixie | Jacksonville | FL | 63,240 | 4,360 | 82,835 | — | 87,195 | 7,009 | 4/24/2013 | 2000 | ||||||||||||||||||||||
| Wirtz Beverage | Hartland | WI | 5,805 | 1,927 | 3,899 | — | 5,826 | 184 | 2/21/2014 | 2000 | ||||||||||||||||||||||
| Worrior Energy Services | Midland | TX | — | 508 | 816 | — | 1,324 | 22 | 6/25/2014 | 2012 | ||||||||||||||||||||||
| Zebb's | Amherst | NY | — | 150 | 1,347 | — | 1,497 | 117 | 7/31/2013 | 1994 | ||||||||||||||||||||||
| Zebb's | New Hartford | NY | — | 122 | 1,095 | — | 1,217 | 95 | 7/31/2013 | 1970 | ||||||||||||||||||||||
| Zebb's | Orchard Park | NY | — | 69 | 1,320 | — | 1,389 | 115 | 7/31/2013 | 2000 | ||||||||||||||||||||||
| Zebb's | Rochester | NY | — | 126 | 1,137 | — | 1,263 | 99 | 7/31/2013 | 1990 | ||||||||||||||||||||||
| Z'Tejas | Austin | TX | — | 837 | 1,797 | — | 2,634 | 159 | 6/27/2013 | 1998 | ||||||||||||||||||||||
| $ | 3,689,795 | $ | 3,472,298 | $ | 12,307,759 | $ | 77,450 | $ | 15,857,507 | $ | 775,050 | |||||||||||||||||||||
_______________________________________________
| (1) | Intangible lease assets, net of accumulated amortization of $2.2 billion are not reflected in the table above. |
| (2) | The tax basis of aggregate land, buildings and improvements as of December 31, 2014 was $16.1 billion. |
| (3) | The accumulated depreciation column excludes $259.1 million of amortization associated with acquired intangible lease assets. |
| (4) | Depreciation is computed using the straight-line method over the estimated useful lives of up to 40 years for buildings, five to 15 years for building fixtures and improvements. |
The following is a reconciliation of the gross real estate activity for the years ended December 31, 2014, 2013 and 2012 (amounts in thousands):
| Years Ended December 31, | ||||||||||||
| 2014 | 2013 | 2012 | ||||||||||
| Balance, beginning of year | $ | 6,699,547 | $ | 1,684,115 | $ | 187,549 | ||||||
| Additions: | ||||||||||||
| Acquisitions | 11,095,559 | 5,019,135 | 1,496,566 | |||||||||
| Improvements | 114,070 | — | — | |||||||||
| Deductions: | ||||||||||||
| Dispositions | (1,945,186 | ) | — | — | ||||||||
| Impairments | (105,367 | ) | (3,703 | ) | — | |||||||
| Reclassified to assets held for sale | (1,116 | ) | — | — | ||||||||
| Balance, end of year | $ | 15,857,507 | $ | 6,699,547 | $ | 1,684,115 | ||||||
F-249
The following is a reconciliation of the accumulated depreciation for the years ended December 31, 2014, 2013 and 2012 (amounts in thousands):
| Years Ended December 31, | ||||||||||||
| 2014 | 2013 | 2012 | ||||||||||
| Balance, beginning of year | $ | 205,712 | $ | 45,050 | $ | 12,062 | ||||||
| Additions: | ||||||||||||
| Depreciation expense | 628,340 | 160,662 | 32,988 | |||||||||
| Deductions: | ||||||||||||
| Dispositions | (49,377 | ) | — | — | ||||||||
| Impairments | (9,625 | ) | — | — | ||||||||
| Balance, end of year | $ | 775,050 | $ | 205,712 | $ | 45,050 | ||||||
F-250
AMERICAN REALTY CAPITAL PROPERTIES, INC. AND ARC PROPERTIES OPERATING PARTNERSHIP, L.P.
SCHEDULE IV- MORTGAGE LOANS HELD FOR INVESTMENT
December 31, 2014
(In thousands)
| Description | Location | Interest Rate | Final Maturity Date | Periodic Payment Terms | Prior Liens | Face Amount of Mortgages | Carrying Amount of Mortgages | Principal Amount of Loans Subject to Delinquent Principal or Interest | ||||||||||||||
| Long-Term Mortgage Loans | ||||||||||||||||||||||
| Bank Of America, N.A. | Mt. Airy, MD | 6.42% | 12/1/2026 | P&I | N/A | $ | 2,856 | $ | 3,172 | $ | — | |||||||||||
| CVS Caremark Corporation | Evansville, IN | 6.22% | 1/1/2033 | P&I | N/A | 2,850 | 3,162 | — | ||||||||||||||
| CVS Caremark Corporation | Greensboro, GA | 6.52% | 1/1/2030 | P&I | N/A | 1,092 | 1,234 | — | ||||||||||||||
| CVS Caremark Corporation | Shelby Twp., MI | 5.98% | 1/1/2031 | P&I | N/A | 2,173 | 2,362 | — | ||||||||||||||
| Koninklijke Ahold, N.V. | Bensalem, PA | 7.24% | 5/1/2020 | P&I | N/A | 1,903 | 2,142 | — | ||||||||||||||
| Lowes Companies, Inc. | Framingham, MA | N/A | 9/1/2031 | (1) | N/A | 5,741 | 1,561 | — | ||||||||||||||
| Walgreen Co. | Dallas, TX | 6.46% | 12/1/2029 | P&I | N/A | 2,747 | 3,093 | — | ||||||||||||||
| Walgreen Co. | Nacogdoches, TX | 6.8% | 9/1/2030 | P&I | N/A | 2,983 | 3,420 | — | ||||||||||||||
| Walgreen Co. | Rosemead, CA | 6.26% | 12/1/2029 | P&I | N/A | 4,206 | 4,678 | — | ||||||||||||||
| Abbot Laboratories | Waukegan, IL | 5.11% | 8/1/2015 | P&I | N/A | 273 | 273 | — | ||||||||||||||
| TJX | Philadelphia, PA | 5.57% | 3/1/2016 | P&I | N/A | 1,536 | 1,536 | — | ||||||||||||||
| $ | 28,360 | $ | 26,633 | $ | — | |||||||||||||||||
| Corporate Credit Notes | ||||||||||||||||||||||
| Federal Express Corporation | Bellingham, WA | 5.78% | 3/1/2015 | P&I | N/A | $ | 17 | $ | 17 | $ | — | |||||||||||
| Lowes Companies, Inc. | N. Windham, ME | 5.28% | 9/1/2015 | P&I | N/A | 113 | 113 | — | ||||||||||||||
| Walgreen Co. | Jefferson City, TN | 5.49% | 5/1/2015 | P&I | N/A | 42 | 43 | — | ||||||||||||||
| $ | 172 | $ | 173 | $ | — | |||||||||||||||||
| Total | $ | 28,532 | $ | 26,806 | $ | — | ||||||||||||||||
_______________________________________________
(1) Zero coupon rate with balloon payment due at maturity.
| Carrying Amount of Mortgages | ||||
| Balance - December 31, 2013 | $ | 26,279 | ||
| Additions during the year: | ||||
| Acquired in Cole Merger | 72,326 | |||
| Investments in mortgage notes | 2,952 | |||
| Deductions during the year: | ||||
| Principal payments received on loan investments | (74,109 | ) | ||
| Amortization of unearned discounts and premiums | (642 | ) | ||
| Balance - December 31, 2014 | $ | 26,806 | ||
F-251