united states
securities and exchange commission
washington, d.c. 20549
form n-csr
certified shareholder report of registered management
investment companies
Investment Company Act File Number 811-22599
American Real Estate Income Fund
(Exact name of registrant as specified in charter)
405 Park Avenue, 14th Floor, New York, New York 10022
(Address of principal executive offices) (Zip code)
John H. Grady, President, Treasurer and Secretary, Trustee and Chairman of the Board
405 Park Avenue, 14th Floor, New York, NY 10022
(Name and address of agent for service)
Registrant’s telephone number, including area code: 212-415-6500
Date of fiscal year end: 3/31
Date of reporting period: 3/31/15
Item 1. Reports to Shareholders.
Dear Investor:
We are pleased to provide you with a report on the American Real Estate Income Fund (the “Fund”) for the period ended March 31, 2015. This report includes financial statements for the Fund, as reviewed by our independent auditor. You will also find commentary on the Fund’s performance compiled by its portfolio managers, along with an assessment of the market environment that the Fund operated in over the past year. We trust that you will find this information helpful and informative.
We invite you to ask questions of us or your financial advisor about your Fund investment or any of the investment options we manage.
Thank you for your investment.
Sincerely,
John H. Grady
President, Treasurer and Secretary
May 2015
Portfolio Manager’s Commentary
Since the inception of trading on October 1, 2014, the American Real Estate Income Fund (the “Fund”) has operated in an environment that has provided many opportunities across the real estate space, as the United States Federal Reserve tries to transition from accommodative monetary policy to a much anticipated increase in interest rates. As the economic recovery continues at a slower pace the continued push back of the liftoff in rates has played an important role in the volatility in traded real estate while underlying real estate fundamentals continue to improve.
In particular, the Fund took advantage of a selloff in listed REITs in the fourth quarter of 2014 by investing the bulk of its assets in listed REIT securities. This allowed the Fund to participate in the significant rally in REITs in the fourth quarter of 2014. Given that one third of the portfolio was invested in non-listed REITs that do not price on a daily basis, the Fund underperformed the various listed REIT indices. In January of 2015 as listed REIT valuations became extended, Fund management took a defensive position and sold about 30% of the listed REIT holdings and left the majority of this in cash. Listed REITs have continued to sell off through the remainder of the first quarter as interest rates rose and the yield curve steepened in anticipation of Fed interest rate increases. While underlying REIT fundamentals remain strong, the Fund has begun moving capital back to the non-listed space to take advantage of reduced volatility and higher income.
As of March 31, 2015, the Fund’s allocation between listed and non-listed REITs was as follows:
| Sector Allocation | % of Net Assets |
| Listed | 50.9% |
| Non-Listed | 37.6% |
| Cash | 11.5% |
| Total | 100.0% |
The top industry/sector concentration across the Fund was Mortgage REITs at 21.0% of net assets, followed by Office (17.0%), Healthcare (12.0%), and Shopping Centers (7.0%). The complete sector breakout across all asset allocations is as follows:
| Sector Allocation | % of Net Assets |
| Mortgage | 21.0% |
| Office | 17.0% |
| Healthcare | 12.0% |
| Shopping Centers | 7.0% |
| Lodging | 6.0% |
| Triple-Net | 6.0% |
| Apartments | 5.0% |
| Storage | 3.5% |
| Malls | 3.0% |
| BDC | 3.0% |
| Other | 5.0% |
| Cash & Cash Equivalents | 11.5% |
| Total | 100.0% |
At quarter-end, Starwood Property Trust represented the Fund’s top holding at 4.7% of net assets, followed by Apollo Commercial (4.6%), Hannon Armstrong (4.5%) and Northstar Healthcare Income (4.5%). A complete list of the Fund’s top 10 holdings, excluding short-term investments, as of March 31, 2015, is presented as follows:*
| | | | | | | |
| Investment | | Sector | | % of Net Assets | |
| Starwood Property Trust | | Mortgage REITs | | | 4.7% | |
| Apollo Commercial | | Mortgage REITs | | | 4.6% | |
| Hannon Armstrong | | Other | | | 4.5% | |
| Northstar Healthcare Income | | Healthcare | | | 4.5% | |
| Northstar Real Estate II | | Mortgage REITs | | | 4.2% | |
| Boston Properties Inc. | | Office | | | 3.6% | |
| Carter Validus Mission Critical | | Healthcare | | | 3.3% | |
| Steadfast Apartment | | Apartments | | | 3.2% | |
| KBS REIT III | | Office | | | 3.2% | |
| ARC Global Trust II | | Triple-Net | | | 3.0% | |
| | | | | | 38.8% | |
*Holdings are subject to change without notice.
Once again, we thank you for your support and confidence in the Fund.
| American Real Estate Income Fund Portfolio Review (Unaudited) March 31, 2015 |
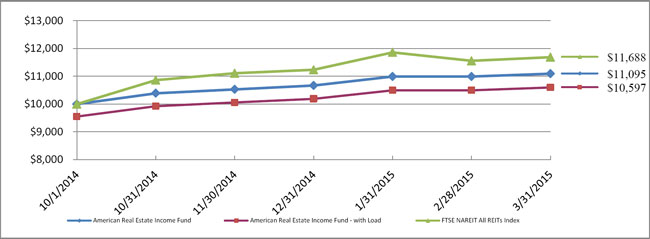
The Fund’s performance figures* for the period ended March 31, 2015, compared to its benchmark:
| | | | Since Inception1 |
| American Real Estate Income Fund | | | 10.95 | % |
| American Real Estate Income Fund with load** | | | 5.97 | % |
FTSE/NAREIT All Equity REITs Index2 | | | 16.88 | % |
*The performance data quoted here represents past performance. Current performance may be lower or higher than the performance data quoted above. Investment return and principal value will fluctuate, so that shares, when redeemed, may be worth more or less than their original cost. The returns shown do not reflect the deduction of taxes that a shareholder would pay on Fund distributions or on the redemptions of Fund shares. Past performance is no guarantee of future results. The Fund’s total annual operating expense is 4.36% per the prospectus dated September 9, 2014.
** American Real Estate Income Fund with load total return is calculated using the maximum sales charge of 6.00%.
| 1 Inception of the Fund is May 5, 2014; the commencement of operations and start of performance is October 1, 2014. |
| 2 The FTSE/NAREIT All Equity REITs Index is a market capitalization weighted return index of all U.S. REITs that exceed minimum liquidity criteria concerning market cap, shares outstanding, trading volume and per share market price. Investors cannot invest directly in an index or benchmark. |
Comparison of the Change in Value of a $10,000 Investment
| Holdings by Type of Investment | | | % of Net Assets |
| Public Non-Traded Real Estate Investment Trusts | | | 34.9 | % |
| REITS - Mortgage | | | 13.3 | % |
| REITS - Office Property | | | 8.9 | % |
| REITS - Shopping Centers | | | 6.9 | % |
| Diversified Financial Services | | | 4.5 | % |
| REITS - Warehouse/Industrial | | | 4.4 | % |
| REITS - Health Care | | | 3.6 | % |
| REITS - Hotels | | | 3.1 | % |
| REITS - Regional Malls | | | 3.0 | % |
| Public Non-Traded Business Development Company | | | 2.7 | % |
| Other Industries | | | 3.2 | % |
| Other/Cash & Equivalents | | | 11.5 | % |
| | | | 100.0 | % |
Please refer to the Schedule of Investments in this Annual Report for detailed analysis of the Fund’s Holdings.
| American Real Estate Income Fund Schedule of Investments March 31, 2015 |
| Shares | | | | | Value | |
| | | COMMON STOCK - 50.9 % | | | | |
| | | DIVERSIFIED FINANCIAL SERVICES - 4.5 % | | | | |
| 14,000 | | Hannon Armstrong Sustainable Infrastructure Capital, Inc. - REIT | | $ | 255,920 | |
| | | | | | | |
| | | REAL ESTATE - MANAGEMENT - 0.9 % | | | | |
| 755 | | WP Carey, Inc. | | | 51,340 | |
| | | | | | | |
| | | REITS - APARTMENTS - 1.8 % | | | | |
| 1,300 | | Camden Property Trust | | | 101,569 | |
| | | | | | | |
| | | REITS - HEALTH CARE - 3.6 % | | | | |
| 2,000 | | Health Care REIT, Inc. | | | 154,720 | |
| 1,800 | | Healthcare Trust of America, Inc. | | | 50,148 | |
| | | | | | 204,868 | |
| | | REITS - HOTELS - 3.1 % | | | | |
| 2,300 | | Chesapeake Lodging Trust | | | 77,809 | |
| 3,200 | | RLJ Lodging Trust | | | 100,192 | |
| | | | | | 178,001 | |
| | | REITS - MORTGAGE - 13.3 % | | | | |
| 15,300 | | Apollo Commercial Real Estate Finance, Inc. | | | 262,854 | |
| 1,800 | | Blackstone Mortgage Trust, Inc. | | | 51,066 | |
| 9,500 | | Northstart Realty Finance Corp. | | | 172,140 | |
| 11,100 | | Starwood Property Trust, Inc. | | | 269,730 | |
| | | | | | 755,790 | |
| | | REITS - OFFICE PROPERTY - 8.9 % | | | | |
| 1,175 | | Alexandria Real Estate Equities, Inc. | | | 115,197 | |
| 1,470 | | Boston Properties, Inc. | | | 206,506 | |
| 1,900 | | Corporate Office Properties Trust | | | 55,822 | |
| 3,600 | | Liberty Property Trust | | | 128,520 | |
| | | | | | 506,045 | |
| | | REITS - REGIONAL MALLS - 3.0 % | | | | |
| 3,100 | | General Growth Properties, Inc. | | | 91,605 | |
| 400 | | Simon Property Group, Inc. | | | 78,256 | |
| | | | | | 169,861 | |
| | | REITS - SHOPPING CENTERS - 6.9 % | | | | |
| 8,580 | | Developers Diversified Realty | | | 159,760 | |
| 9,440 | | Excel Trust, Inc. | | | 132,348 | |
| 6,500 | | Retail Properties of America, Inc. - Cl. A | | | 104,195 | |
| | | | | | 396,303 | |
| | | REITS - STORAGE - 0.5 % | | | | |
| 300 | | Sovran Self Storage, Inc. | | | 28,182 | |
| | | | | | | |
| | | REITS - WAREHOUSE/INDUSTRIAL - 4.4 % | | | | |
| 1,250 | | DCT Industrial Trust, Inc. | | | 43,325 | |
| 7,200 | | Duke Realty Corp. | | | 156,744 | |
| 1,200 | | Prologis, Inc. | | | 52,272 | |
| | | | | | 252,341 | |
| | | | | | | |
| | | TOTAL COMMON STOCK (Cost - $2,708,875) | | | 2,900,220 | |
See accompanying notes to financial statements.
American Real Estate Income Fund Schedule of Investments (Continued) March 31, 2015 |
| Shares | | | | | Value | |
| | | PUBLIC NON-TRADED BUSINESS DEVELOPMENT COMPANY - 2.7 % | | | | |
| 14,683 | | Business Development Corp.of America + #* | | $ | 153,000 | |
| | | TOTAL PUBLIC NON-TRADED BUSINESS DEVELOPMENT COMPANY (Cost - $153,000) | | | | |
| | | | | | | |
| | | PUBLIC NON-TRADED REAL ESTATE INVESTMENT TRUSTS - 34.9 % | | | | |
| 7,458 | | ARC Global Trust II + #* | | | 173,400 | |
| 7,196 | | ARC Hospitality Trust, Inc. + #* | | | 167,300 | |
| 4,495 | | American Realty Capital NYCREIT, Inc. + #* | | | 104,500 | |
| 6,581 | | ARC Realty Finance Trust, Inc. + #* | | | 153,000 | |
| 20,515 | | Carter Validus MC REIT II Class A + # | | | 190,789 | |
| 18,645 | | Cole Office & Industrial REIT, Inc. + # | | | 173,400 | |
| 18,631 | | KBS REIT III, Inc. + # | | | 180,912 | |
| 27,312 | | NorthStar Health Care Income, Inc. + # | | | 254,000 | |
| 26,021 | | NorthStar Real Estate Income II, Inc. + # | | | 242,000 | |
| 13,204 | | Steadfast Apartment REIT + # | | | 184,200 | |
| 18,065 | | Strategic Storage Trust II, Inc. + # | | | 168,000 | |
| | | TOTAL PUBLIC NON-TRADED REAL ESTATE INVESTMENT TRUSTS (Cost - $1,953,283) | | | 1,991,501 | |
| | | | | | | |
| | | SHORT-TERM INVESTMENTS - 7.4 % | | | | |
| 247,623 | | BlackRock Liquidity Funds T-Fund Portfolio, 0.01% ^ | | | 247,623 | |
| 173,536 | | Dreyfus Cash Management, Institutional Class, 0.03% ^ | | | 173,536 | |
| | | TOTAL SHORT-TERM INVESTMENTS (Cost - $421,159) | | | 421,159 | |
| | | | | | | |
| | | TOTAL INVESTMENTS - 95.9 % (Cost - $5,236,317) (a) | | $ | 5,465,880 | |
| | | OTHER ASSETS LESS LIABILITIES - 4.1 % | | | 234,377 | |
| | | NET ASSETS - 100.0% | | $ | 5,700,257 | |
^ Rate shown represents the rate at March 31, 2015, is subject to change and resets daily.
+ Illiquid security. Total illiquid securities represent 37.62% of net assets as of March 31, 2015.
# Market Value estimated using Fair Valuation Procedures adopted by the Board of Trustees. Total of such securities is $2,144,501 or 37.62% of net assets.
* Investments in Public Non-Traded Real Estate Investment Trusts and Business Development Companies which are sponsored, organized or managed by AR Capital, LLC, an affiliate of the Sub-Adviser.
REIT - Real Estate Investment Trust
(a) Represents cost for financial reporting purposes. Aggregate cost for federal income tax purposes is $5,236,317 and differs from market value by net unrealized appreciation (depreciation) of securities as follows:
| Unrealized appreciation: | | $ | 258,754 | |
| Unrealized depreciation: | | | (29,191 | ) |
| Net unrealized appreciation: | | $ | 229,563 | |
See accompanying notes to financial statements.
| American Real Estate Income Fund |
| Statement Of Assets and Liabilities |
| March 31, 2015 |
| ASSETS | | | | |
| Investment securities: | | | | |
| At cost | | $ | 5,236,317 | |
| At value | | $ | 5,465,880 | |
| Interest receivable | | | 41,076 | |
| Receivable due from Adviser | | | 251,789 | |
| Deferred offering costs | | | 37,816 | |
| Prepaid expenses and other assets | | | 36,131 | |
| TOTAL ASSETS | | | 5,832,692 | |
| LIABILITIES | | | | |
| Shareholder servicing fees payable | | | 1,243 | |
| Payable for administration fees | | | 2,591 | |
| Payable for fund accounting fees | | | 2,049 | |
| Payable to transfer agent | | | 1,322 | |
| Trustee fees | | | 11,010 | |
| Accrued expenses and other liabilities | | | 114,220 | |
| TOTAL LIABILITIES | | | 132,435 | |
| NET ASSETS | | $ | 5,700,257 | |
| | | | | |
| NET ASSETS CONSIST OF: | | | | |
| Paid in capital | | $ | 5,257,995 | |
| Accumulated net realized gain from investments | | | 212,699 | |
| Net unrealized appreciation on investments | | | 229,563 | |
| NET ASSETS | | $ | 5,700,257 | |
| | | | | |
| NET ASSET VALUE PER SHARE: | | | | |
| Net Assets | | $ | 5,700,257 | |
| Shares of beneficial interest outstanding [$0 par value, 100,000,000 shares authorized] | | | 522,169 | |
| Net asset value (Net Assets ÷ Shares Outstanding) and redemption price per share | | $ | 10.92 | |
| Maximum offering price per share (maximum sales charge of 6.00%) | | $ | 11.62 | |
See accompanying notes to financial statements.
| American Real Estate Income Fund |
| Statement of Operations |
For the Period Ended March 31, 2015 (1) |
| INVESTMENT INCOME | | | | |
| Dividends | | $ | 60,579 | |
| Interest | | | 138 | |
| TOTAL INVESTMENT INCOME | | | 60,717 | |
| EXPENSES | | | | |
| Investment advisory fees | | | 29,994 | |
| Offering costs | | | 415,976 | |
| Trustees fees and expenses | | | 113,510 | |
| Legal fees | | | 75,183 | |
| Professional fees | | | 36,746 | |
| Compliance officer fees | | | 34,952 | |
| Audit fees | | | 21,500 | |
| Administrative services fees | | | 15,552 | |
| Registration fees | | | 14,942 | |
| Accounting services fees | | | 12,465 | |
| Insurance expense | | | 10,499 | |
| Transfer agent fees | | | 7,572 | |
| Custodian fees | | | 6,979 | |
| Shareholder servicing | | | 6,817 | |
| Printing and postage expenses | | | 3,485 | |
| Other expenses | | | 2,276 | |
| TOTAL EXPENSES | | | 808,448 | |
| | | | | |
| Less: Fees waived/reimbursed by the Adviser | | | (740,280 | ) |
| | | | | |
| NET EXPENSES | | | 68,168 | |
| | | | | |
| NET INVESTMENT LOSS | | | (7,451 | ) |
| REALIZED AND UNREALIZED GAIN | | | | |
| Net realized gain from: | | | | |
| Investments | | | 308,782 | |
| Net change in unrealized appreciation of: | | | | |
| Investments | | | 229,563 | |
| | | | | |
| NET REALIZED AND UNREALIZED GAIN ON INVESTMENTS | | | 538,345 | |
| | | | | |
| NET INCREASE IN NET ASSETS RESULTING FROM OPERATIONS | | $ | 530,894 | |
(1) Inception of the Fund is May 5, 2014; the commencement of operations and start of performance is October 1, 2014.
See accompanying notes to financial statements.
| American Real Estate Income Fund |
| Statement of Changes in Net Assets |
| | | Period Ended | |
| | | March 31, 2015 (1) | |
| FROM OPERATIONS | | | |
| Net investment loss | | $ | (7,451 | ) |
| Net realized gain from investments | | | 308,782 | |
| Net change in unrealized appreciation on investments | | | 229,563 | |
| Net increse in net assets resulting from operations | | | 530,894 | |
| | | | | |
| DISTRIBUTIONS TO SHAREHOLDERS | | | | |
| From net investment income | | | (88,632 | ) |
| Net decrease in net assets resulting from distributions to shareholders | | | (88,632 | ) |
| | | | | |
| FROM SHARES OF BENEFICIAL INTEREST | | | | |
| Proceeds from shares sold | | | 5,042,064 | |
| Net asset value of shares issued in reinvestment of distributions | | | 88,632 | |
| Net increase in net assets from shares of beneficial interest | | | 5,130,696 | |
| Contribution of Capital from Adviser | | | 27,299 | |
| | | | | |
| NET INCREASE IN NET ASSETS | | | 5,600,257 | |
| | | | | |
| NET ASSETS | | | | |
| Beginning of Period | | | 100,000 | |
| End of Period* | | $ | 5,700,257 | |
| *Includes undistributed net investment income of: | | $ | — | |
| | | | | |
| SHARE ACTIVITY | | | | |
| Shares Sold | | | 503,963 | |
| Shares Reinvested | | | 8,206 | |
| Net increase in shares of beneficial interest outstanding | | | 512,169 | |
(1) Inception of the Fund is May 5, 2014; the commencement of operations and start of performance is October 1, 2014.
See accompanying notes to financial statements.
| American Real Estate Income Fund |
| Statement of Cash Flows |
For the Period Ended March 31, 2015 (1) |
| Cash flows from operating activities: | | | | |
| Net increase in net assets resulting from operations | | $ | 530,894 | |
| Adjustments to reconcile net increase in net assets resulting from operations to net cash used in operating activities: | | | | |
| Purchases of investments | | | (7,447,853 | ) |
| Purchase of short term investments, net | | | (421,159 | ) |
| Proceeds from sales of investments | | | 2,861,346 | |
| Net realized gain from investments | | | (308,782 | ) |
| Return of capital and capital gain distribution from REITs | | | 80,131 | |
| Net unrealized appreciation from investments | | | (229,563 | ) |
| | | | | |
| Changes in assets and liabilities | | | | |
| (Increase)/Decrease in assets: | | | | |
| Receivable from Investment Adviser | | | (251,789 | ) |
| Interest Receivable | | | (41,076 | ) |
| Deferred offering costs | | | (37,816 | ) |
| Prepaid Expenses and Other Assets | | | (36,131 | ) |
| Increase/(Decrease) in liabilities: | | | | |
| Payable for admistration fees | | | 2,591 | |
| Payable for fund accounting fees | | | 2,049 | |
| Trustee fees | | | 11,010 | |
| Payable to transfer agent | | | 1,322 | |
| Shareholder servicing fees payable | | | 1,243 | |
| Accrued expenses and other liabilities | | | 114,220 | |
| Net cash used in operating activities | | | (5,169,363 | ) |
| | | | | |
| Cash flows from financing activities: | | | | |
| Proceeds from shares sold | | | 5,042,064 | |
| Capital Contribution from Advisor | | | 27,299 | |
| Net cash provided by financing activities | | | 5,069,363 | |
| | | | | |
| Net decrease in cash | | | (100,000 | ) |
| Cash at beginning of period | | | 100,000 | |
| Cash at end of period | | $ | — | |
| | | | | |
| Supplemental disclosure of non-cash activity: | | | | |
| Non-cash financing activities not including herein consists of reinvestment of dividends | | $ | 88,632 | |
(1) Inception of the Fund is May 5, 2014; the commencement of operations and start of performance is October 1, 2014.
See accompanying notes to financial statements.
| American Real Estate Income Fund |
| Financial Highlights |
| Per Share Data and Ratios for a Share of Beneficial Interest Outstanding Throughout the Period |
| | | Period Ended | |
| | | March 31, 2015 (1) | |
| Net asset value, beginning of period | | $ | 10.00 | |
| | | | | |
| Activity from investment operations: | | | | |
| Net investment loss (2) | | | (0.01 | ) |
| Net realized and unrealized gain on investments | | | 1.10 | |
| Total from investment operations | | | 1.09 | |
| | | | | |
| Less distributions from: | | | | |
| Net investment income | | | (0.17 | ) |
| Total distributions | | | (0.17 | ) |
| | | | | |
| Net asset value, end of period | | $ | 10.92 | |
| | | | | |
| Total return (3,4,7) | | | 10.95 | % |
| | | | | |
| Net assets, at end of period (000s) | | $ | 5,700 | |
| | | | | |
| Ratio of gross expenses to average net assets (5,6) | | | 29.65 | % |
| Ratio of net expenses to average net assets (5) | | | 2.50 | % |
| Ratio of net investment income to average net assets (5) | | | (0.27 | )% |
| Portfolio Turnover Rate (4) | | | 66 | % |
| (1) | Inception of the Fund is May 5, 2014; the commencement of operations and start of performance is October 1, 2014. |
| (2) | Per share amounts calculated using the average shares method, which more appropriately presents the per share data for the period. |
| (3) | Total returns shown exclude the effect of applicable sales loads/redemption fees. If the Adviser did not reimburse/waive Fund expenses, total return would have been lower. |
| (4) | Not annualized. |
| (5) | Annualized. |
| (6) | Represents the ratio of expenses to average net assets absent fee waivers and/or expense reimbursements by the Adviser. |
| (7) | Had the Adviser not made a capital contribution, total return would have been 10.34% (Note 5). |
See accompanying notes to financial statements.
| American Real Estate Income Fund |
| Notes to Financial Statements |
| March 31, 2015 |
1. ORGANIZATION
American Real Estate Income Fund (the “Fund”) is registered under the Investment Company Act of 1940, as amended (the “1940 Act”), as a non-diversified, closed-end management investment company. The Fund was organized as a Delaware statutory trust on March 23, 2011, and did not have any operations from that date until January 3, 2014, other than those relating to organizational matters and registration of its shares under applicable securities law. The Funds inception date is May 5, 2014, and commencement of operations is October 1, 2014. The Fund’s investment objective is to generate income with capital appreciation as a secondary objective. The Fund will pursue this objective through an investment strategy that concentrates on investments in the real estate industry.
SEL Asset Management, LLC (the “Adviser”) serves as the Fund’s investment adviser and National Fund Advisors, LLC (the “Sub-Adviser”) serves as the Fund’s investment sub-adviser.
The Fund will engage in a continuous offering, up to a maximum of 100 million shares of beneficial interest, and will operate as an interval fund that will offer to make quarterly repurchases of shares at the Fund’s net asset value (“NAV”). The Fund’s initial offering price was $10.00 per share. The shares are offered subject to a maximum sales charge of 6.00% of the offering price. AR Capital, LLC, an affiliate of the Sub-Adviser, initially capitalized the Fund on January 3, 2014 at $10.00 per share. The sales charge was waived in the initial funding.
2. SUMMARY OF SIGNIFICANT ACCOUNTING POLICIES
The following is a summary of significant accounting policies followed by the Fund in the preparation of its financial statements. These policies are in conformity with accounting principles generally accepted in the United States of America (“GAAP”). The preparation of financial statements requires management to make estimates and assumptions that affect the reported amounts of assets and liabilities and disclosure of contingent assets and liabilities at the date of the financial statements and the reported amounts of income and expenses for the period. Actual results could differ from those estimates.
Security Valuation – Securities listed on an exchange are valued at the last reported sale price at the close of the regular trading session of the exchange on the business day the value is being determined, or in the case of securities listed on NASDAQ at the NASDAQ Official Closing Price (“NOCP”). In the absence of a sale, such securities shall be valued at the mean of the closing bid and asked prices for the day of valuation.
When price quotations for certain securities are not readily available, or if the available quotations are not believed to be reflective of market value by the Adviser, those securities will be valued at “fair value” as determined in good faith by the Adviser’s fair value team using procedures adopted by and under the supervision of the Fund’s Board of Trustees (the “Board”). There can be no assurance that the Fund could purchase or sell a portfolio security at the price used to calculate the Fund’s NAV and those differences could be material.
The Fund invests in some securities which are not traded and the fair value team has established a methodology for fair value of each type of security. Generally, REITs are publicly registered but not traded. When the REIT is in the public offering period, the Fund values the REIT at cost. The Fund generally purchases REITs at net asset value (“NAV”) or without a commission. However, start-up REITs amortize a significant portion of their start-up costs and therefore potentially carry additional risks that may impact valuation should a REIT be unable to raise sufficient capital and execute its business plan. As such, start-up REITs pose a greater risk than seasoned REITs because if they encounter going concern issues, they may see significant deviation in value from the fair value, cost basis approach as represented. Management is not aware of any information which would cause a change in cost basis valuation methodology currently being utilized for non-traded REITs in their offering period. Once a REIT closes to new investments, the Fund values the security based on the movement of an appropriate market index or traded comparable until the REIT issues an updated market valuation. Additionally, certain other non-publicly traded investments, including non-publicly traded business development companies, held by the Fund are valued based on the movement of an appropriate benchmark or company provided market valuation. The private investments are monitored for any independent audits of the security or impairments reported on the potential value of the security and the fair value is generally adjusted for depreciation in the case of hard assets. The Valuation Committee will meet frequently to discuss the valuation methodology and will adjust the value of a security if there is a public update to such valuation.
| American Real Estate Income Fund |
| Notes to Financial Statements (Continued) |
| March 31, 2015 |
The values assigned to fair valued investments are based on available information and do not necessarily represent amounts that might ultimately be realized, since such amounts depend on future developments inherent in long-term investments. Changes in the fair valuation of portfolio securities may be less frequent and of greater magnitude than changes in the price of portfolio securities valued at their last sale price, by an independent pricing service, or based on market quotations. Imprecision in estimating fair value can also impact the amount of unrealized appreciation or depreciation recorded for a particular portfolio security and differences in the assumptions used could result in a different determination of fair value, and those differences could be material.
The Fund utilizes various methods to measure the fair value of all of its investments on a recurring basis. GAAP establishes a hierarchy that prioritizes inputs to valuation methods. The three levels of input are:
Level 1 – Unadjusted quoted prices in active markets for identical assets and liabilities that the Fund has the ability to access.
Level 2 – Observable inputs other than quoted prices included in Level 1 that are observable for the asset or liability, either directly or indirectly. These inputs may include quoted prices for the identical instrument on an inactive market, prices for similar instruments, interest rates, prepayment speeds, credit risk, yield curves, default rates and similar data.
Level 3 – Unobservable inputs for the asset or liability, to the extent relevant observable inputs are not available, representing the Fund’s own assumptions about the assumptions a market participant would use in valuing the asset or liability, and would be based on the best information available.
The availability of observable inputs can vary from security to security and is affected by a wide variety of factors, including, for example, the type of security, whether the security is new and not yet established in the marketplace, the liquidity of markets, and other characteristics particular to the security. To the extent that valuation is based on models or inputs that are less observable or unobservable in the market, the determination of fair value requires more judgment. Accordingly, the degree of judgment exercised in determining fair value is greatest for instruments categorized in Level 3.
The inputs used to measure fair value may fall into different levels of the fair value hierarchy. In such cases, for disclosure purposes, the level in the fair value hierarchy within which the fair value measurement falls in its entirety, is determined based on the lowest level input that is significant to the fair value measurement in its entirety.
The inputs or methodology used for valuing securities are not necessarily an indication of the risk associated with investing in those securities. The following tables summarize the inputs used as of March 31, 2015, for the Fund’s assets and liabilities measured at fair value:
| Assets | | | Level 1 | | | | Level 2 | | | | Level 3 | | | | Total | |
| Common Stock | | | $ | 2,900,220 | | | | $ | — | | | | $ | — | | | | $ | 2,900,220 | |
| Public Non-Traded Business Development Company | | | | — | | | | | — | | | | | 153,000 | | | | | 153,000 | |
| Public Non-Traded Real Estate Investment Trusts | | | | — | | | | | — | | | | | 1,991,501 | | | | | 1,991,501 | |
| Short-Term Investments | | | | 421,159 | | | | | — | | | | | — | | | | | 421,159 | |
| Total Assets | | | $ | 3,321,379 | | | | $ | — | | | | $ | 2,144,501 | | | | $ | 5,465,880 | |
There were no transfers into or out of Level 1 and Level 2 during the current period presented. It is the Fund’s policy to record transfers into or out of Level 1 and Level 2 at the end of the period.
| American Real Estate Income Fund |
| Notes to Financial Statements (Continued) |
| March 31, 2015 |
The following is a reconciliation of assets in which Level 3 inputs were used in determining value:
| | | | Public Non-Traded | | | | |
| | | | Business Development | | | Public Non-Traded | |
| | | | Company | | | REIT | |
| Beginning Balance | | | $ | — | | | $ | — | |
| Total realized gain/(loss) | | | | — | | | | — | |
| Appreciation/(depreciation) | | | | — | | | | 1 | |
| Cost of Purchases | | | | 153,000 | | | | 1,991,500 | |
| Proceeds from Sales & Return of Capital | | | | — | | | | — | |
| Accrued Interest | | | | — | | | | — | |
| Net transfers in/out of Level 3 | | | | — | | | | — | |
| Ending Balance | | | $ | 153,000 | | | $ | 1,991,501 | |
Quantitative disclosures of unobservable inputs and assumptions used by the Fund are set forth below.
| Investment Type | | Fair Value | | | Techniques | | | Unobservable Input | |
| Public Non-Traded Business | | | | | | | | | | |
| Development Company | | $ | 153,000 | | | Cost | | | N/A | |
| | | | | | | | | | | |
| Public Non-Traded REITs | | $ | 1,991,501 | | | Cost | | | N/A | |
Security Transactions and Related Income – Security transactions are accounted for on trade date basis. Interest income is recognized on an accrual basis. Discounts are accreted and premiums are amortized on securities purchased over the lives of the respective securities. Dividend income is recorded on the ex-dividend date. Realized gains or losses from sales of securities are determined by comparing the identified cost of the security lot sold with the net sales proceeds.
Dividends and Distributions to Shareholders – Dividends from net investment income are declared and distributed quarterly. Distributable net realized capital gains are declared and distributed annually. Dividends from net investment income and distributions from net realized gains are recorded on ex dividend date and determined in accordance with federal income tax regulations, which may differ from GAAP. These “book/tax” differences are considered either temporary (i.e., deferred losses, capital loss carry forwards) or permanent in nature. To the extent these differences are permanent in nature, such amounts are reclassified within the composition of net assets based on their federal tax-basis treatment; temporary differences do not require reclassification.
Distributions received from investments in securities that represent a return of capital or capital gains are recorded as a reduction of cost of investment or as a realized gain, respectively. The calendar year-end amounts of ordinary income, capital gains, and return of capital included in distributions received from the Fund’s investments in real estate investment trusts (“REITs”) are reported to the Fund after the end of the calendar year; accordingly, the Fund estimates these amounts for accounting purposes until the characterization of REIT distributions is reported to the Fund after the end of the calendar year. Estimates are based on the most recent REIT distribution information available.
Federal Income Taxes – It is the Fund’s policy to qualify as a regulated investment company by complying with the provisions of the Internal Revenue Code that are applicable to regulated investment companies and to distribute substantially all of its taxable income and net realized gains to shareholders. Therefore, no federal income tax provision has been recorded.
The Fund recognizes the tax benefits of uncertain tax positions only where the position is “more likely than not” to be sustained assuming examination by tax authorities. Management has analyzed the Fund’s tax positions, and has concluded that no liability for unrecognized tax benefits should be recorded related to uncertain tax positions expected to be taken on returns filed for open tax year 2015. The Fund identifies its major tax jurisdictions as U.S. federal, and foreign jurisdictions
| American Real Estate Income Fund |
| Notes to Financial Statements (Continued) |
| March 31, 2015 |
where the Fund makes significant investments; however, the Fund is not aware of any tax positions for which it is reasonably possible that the total amounts of unrecognized tax benefits will change materially in the next twelve months.
Redemption Fee – For shares held for less than 91 days, the Fund will deduct a 2% redemption fee from the redemption amount if the shares are sold pursuant to the Fund’s quarterly repurchase program. Shares held longest will be treated as being repurchased first and shares held shortest as being repurchased last. The redemption fee does not apply to shares that were acquired through reinvestment of distributions. Shares held for 91 days or more are not subject to the 2% fee. Redemption fees are paid to the Fund directly and are designed to offset costs associated with fluctuations in Fund asset levels and cash flow caused by short-term shareholder trading.
Indemnification – The Fund indemnifies its officers and trustees for certain liabilities that may arise from the performance of their duties to the Fund. Additionally, in the normal course of business, the Fund enters into contracts that contain a variety of representations and warranties and which provide general indemnities. The Fund’s maximum exposure under these arrangements is unknown, as this would involve future claims that may be made against the Fund that have not yet occurred. However, based on experience, the risk of loss due to these warranties and indemnities appears to be remote.
3. INVESTMENT TRANSACTIONS
The cost of purchases and proceeds from the sale of securities, other than short-term investments, for the period ended March 31, 2015, amounted to $7,447,853 and $2,861,346, respectively.
4. ADVISORY FEE AND OTHER RELATED PARTY TRANSACTIONS
Advisory Fees – The Adviser is entitled to receive a monthly fee equal to the annual rate of 1.10% of the Fund’s average daily net assets. For the period ended March 31, 2015, the Adviser earned $29,994 in advisory fees.
Pursuant to a sub-advisory agreement between the Adviser and Sub-adviser, the Sub-Adviser is entitled to receive a monthly fee equal to the annual rate of 1.00% of the Fund’s average daily net assets attributable to that portion of the Fund’s portfolio that has been allocated to the Sub-Adviser by the Adviser. The Sub-Adviser’s fee will be paid by the Adviser out of the fee the Adviser receives from the Fund, and will not impact the Fund’s expenses.
The Adviser and the Fund have entered into an expense limitation and reimbursement agreement (the “Expense Limitation Agreement”) under which the Adviser has agreed contractually to waive its fees and to pay or absorb the direct, ordinary operating expenses of the Fund (including offering and organizational expenses, but excluding interest, brokerage commissions, acquired fund fees and expenses, and extraordinary expenses), to the extent that they exceed 2.50% per annum of the Fund’s average daily net assets (the “Expense Limitation”) through June 10, 2016. In addition, to the extent “Other Expenses” incurred by the Fund exceed 1.40%, such excess amount is payable by the Adviser. “Other Expenses” includes all expenses incurred by the Fund (including offering expenses and the amortized portion of the Fund’s initial organization expenses) except for management fees payable to the Adviser and shareholder servicing fees payable by the Fund and does not include interest, taxes, brokerage commissions, expenditures which are capitalized in accordance with GAAP, dividends payable on securities sold short and other expenses related to short sales, acquired fund fees and expensed, and extraordinary expenses not incurred in the ordinary course of the Fund’s business. In consideration of the Adviser’s agreement to limit the Fund’s expenses, the Fund has agreed to repay the Adviser in the amount of any fees waived and Fund expenses paid or absorbed. Any waiver or reimbursement of fees by the Adviser is subject to repayment by the Fund within the three fiscal years following the fiscal year in which such waiver or reimbursement occurred; provided, however, that (i) the Fund is able to make such repayment without exceeding the Expense Limitation in place at the time the fees being repaid were waived, and (ii) such repayment is approved by the Board. The Adviser waived and or reimbursed expenses on the Fund for the period ended March 31, 2015, in the amount of $652,699 which may be recaptured. The following amounts are subject to recapture by the Fund by the following dates:
| 3/31/2017 | | $ | 328,395 | |
| 3/31/2018 | | $ | 740,280 | |
| American Real Estate Income Fund |
| Notes to Financial Statements (Continued) |
| March 31, 2015 |
The Fund has adopted a Shareholder Services Plan (the “Plan”). The Plan provides that a monthly service and/or distribution fee is calculated by the Fund at an annual rate not to exceed 0.25% of the average daily net asset value of the Fund and is paid to Realty Capital Securities, LLC (the “Distributor”), an affiliate of the Sub-Adviser.
The Distributor acts as the Fund’s principal underwriter in a continuous public offering of the Fund’s shares. For the year ended March 31, 2015, the Distributor received $4,998 in underwriting commissions for sales of shares, of which $229 was retained by the principal underwriter or other affiliated broker-dealers.
Trustees - Each Trustee who is not an interested person of the Fund or the Adviser will receive a yearly retainer of $30,000, plus $2,000 for each board or board committee meeting the Trustee attends in person and a per meeting fee of $750 for each meeting the Trustee attends virtually and $1,500 for each meeting the Trustee attends by telephone, as well as reimbursement for any reasonable expenses incurred attending the meetings to be paid at the end of each calendar quarter. In addition, the chairperson of the audit committee receives a retainer of $2,500 for attendance at each meeting of the audit committee. No “interested persons” who serve as Trustees of the Fund will receive any compensation for their services as Trustees. None of the executive officers receive compensation from the Fund.
Pursuant to an agreement with Vigilant Compliance, LLC (“Vigilant”), an employee of Vigilant serves as the Chief Compliance Officer and Chief Financial Officer of the Fund. For the provision of these services, Vigilant receives compensation for these services. For the period ended March 31, 2015, the amounts accrued for payment to Vigilant for these services were $36,746 for Chief Compliance Officer and $34,952 for Chief Financial Officer. These amounts are shown in the Statement of Operations under “Compliance officer fees” and “Professional fees.”
Pursuant to a separate servicing agreement with RCS Advisory Services, LLC (“RCS”), the Administrator of the Fund and an affiliate of the Sub-Adviser and the Distributor, the Fund pays RCS customary fees for providing administration and fund accounting services to the Fund. RCS has entered into a contract with Gemini Fund Services (“GFS”) pursuant to which GFS serves as sub-administrator and provides sub-fund accounting services and performs many of the administrative services for the Trust. RCS pays Gemini from the fees received from the Fund. For the period ended March 31, 2015, $28,017 was accrued for payment to RCS as shown in the Fund’s Statement of Operations under “Administration services fees” and “Accounting services fees.”
Pursuant to a separate servicing agreement with American National Stock Transfer, LLC (“ANST”), ANST serves as the Transfer Agent for the Fund and is an affiliate of the Sub-Adviser, the Distributor and the Administrator. ANST has entered into an agreement with GFS to serve as sub-transfer agent to the Fund. ANST pays Gemini from the fees received from the Fund. For the period ended March 31, 2015, $7,572 was accrued for payment to ANST as shown in the Funds’ Statement of Operations under “Transfer agent fees.”
5. CAPITAL CONTRIBUTION FROM ADVISER
The Fund received a capital contribution in the amount of $27,299 from the Adviser related to excess expenses waived.
6. DISTRIBUTIONS TO SHAREHOLDERS ANDS TAX COMPONENTS OF CAPITAL
The tax character of fund distributions paid for the period ended March 31, 2015 was as follows:
| | | Fiscal Period Ended | |
| | | March 31, 2015 | |
| Ordinary Income | | $ | 88,632 | |
| American Real Estate Income Fund |
| Notes to Financial Statements (Continued) |
| March 31, 2015 |
As of March 31, 2015, the components of distributable earnings/(deficit) on a tax basis were as follows:
| Undistributed | | | Undistributed | | | Capital Loss | | | Other | | | Post October Loss | | | Unrealized | | | Total | |
| Ordinary | | | Long-Term | | | Carry | | | Book/Tax | | | and | | | Appreciation/ | | | Accumulated | |
| Income | | | Gains | | | Forwards | | | Differences | | | Late Year Loss | | | (Depreciation) | | | Earnings/(Deficits) | |
| $ | 194,612 | | | $ | 18,087 | | | $ | — | | | $ | — | | | $ | — | | | $ | 229,563 | | | $ | 442,262 | |
Permanent book and tax differences, primarily attributable to the reclassification of net operating losses and ordinary income distributions, resulted in reclassification for the period ended March 31, 2015 as follows:
| Paid | | | Undistributed | | | Accumulated | |
| In | | | Net Investment | | | Net Realized | |
| Capital | | | Income (Loss) | | | Gains (Loss) | |
| $ | — | | | $ | 96,083 | | | $ | (96,083 | ) |
7. BENEFICIAL OWNERSHIP
The beneficial ownership, either directly or indirectly, of more than 25% of the voting securities of a fund creates a presumption of control of the fund under Section 2(a)(9) of the 1940 Act. As of March 31, 2015 AR Capital LLC, an affiliate of the Sub-Adviser, owned 49%, and RCS Capital Corp., owned 49% of the Fund and may be deemed to control the Fund.
8. SUBSEQUENT EVENTS
Subsequent events after the balance sheet date have been evaluated through the date the financial statements were issued. The Fund completed a quarterly repurchase offer on April 22, 2015, and no shares were tendered. Other than the quarterly repurchase previously stated, management has concluded that there is no impact requiring adjustment or disclosure in the financial statements
REPORT OF INDEPENDENT REGISTERED PUBLIC ACCOUNTING FIRM
To the Board of Trustees and the Shareholders of
American Real Estate Income Fund
We have audited the accompanying statement of assets and liabilities of the American Real Estate Income Fund, including the schedule of investments, as of March 31, 2015, and the related statements of operations and changes in net assets and the financial highlights for the period October 1, 2014 (commencement of operations) to March 31, 2015. These financial statements and financial highlights are the responsibility of the Fund’s management. Our responsibility is to express an opinion on these financial statements and financial highlights based on our audit.
We conducted our audit in accordance with the standards of the Public Company Accounting Oversight Board (United States). Those standards require that we plan and perform the audit to obtain reasonable assurance about whether the financial statements and financial highlights are free of material misstatement. An audit includes examining, on a test basis, evidence supporting the amounts and disclosures in the financial statements. Our procedures included confirmation of securities owned as of March 31, 2015 by correspondence with the custodian and other appropriate parties. An audit also includes assessing the accounting principles used and significant estimates made by management, as well as evaluating the overall financial statement presentation. We believe that our audit provides a reasonable basis for our opinion.
In our opinion, the financial statements and financial highlights referred to above present fairly, in all material respects, the financial position of the American Real Estate Income Fund as of March 31, 2015, and the results of its operations, the changes in its net assets and its financial highlights for the period October 1, 2014 to March 31, 2015, in conformity with accounting principles generally accepted in the United States of America.
Philadelphia, Pennsylvania
May 29, 2015
| American Real Estate Income Fund |
| Expense Example (Unaudited) |
| March 31, 2015 |
As a shareholder of the American Real Estate Income Fund (the “Fund”), you incur two types of costs: (1) transaction costs, including sales charges (loads) on purchases, contingent deferred sales charges (CDSCs) and redemption fees; (2) ongoing costs, including management fees; distribution and/or service (12b-1) fees; and other Fund expenses. This example is intended to help you understand your ongoing costs (in dollars) of investing in the Fund and to compare these costs with the ongoing costs of investing in other mutual funds. The example is based on an investment of $1,000 invested at the beginning of the period and held for the entire period from October 1, 2014 through March 31, 2015.
Actual Expenses
The “Actual Expenses” line in the table below provides information about actual account values and actual expenses. You may use the information below, together with the amount you invested, to estimate the expenses that you paid over the period. Simply divide your account value by $1,000 (for example, an $8,600 account value divided by $1,000 = 8.6), then multiply the result by the number in the table under the heading entitled “Expenses Paid During the Period” to estimate the expenses you paid on your account during this period.
Hypothetical Example for Comparison Purposes
The “Hypothetical” line in the table below provides information about hypothetical account values and hypothetical expenses based on the Fund’s actual expense ratio and an assumed rate of return of 5% per year before expenses, which is not the Fund’s actual return. The hypothetical account values and expenses may not be used to estimate the actual ending account balances or expenses you paid for the period. You may use this information to compare this 5% hypothetical example with the 5% hypothetical examples that appear in the shareholder reports of other funds.
Please note that the expenses shown in the table are meant to highlight your ongoing costs only and do not reflect any transactional costs, such as redemption fees. Therefore, the table is useful in comparing ongoing costs only, and will not help you determine the relative total costs of owning different funds. In addition, if these transactional costs were included, your costs would have been higher.
| | | Beginning | | Annualized | | Ending | | Expenses | |
| | | Account | | Expense Ratio | | Account | | Paid During | |
| | | Value 10/01/14 | | For the Period | | Value 03/31/15 | | the Period* | |
| Actual | | | | | | | | | | | | | |
| | | $ | 1,000.00 | | | 2.50 | % | $ | 1,109.50 | | $ | 13.15 | |
| | | Beginning | | Annualized | | Ending | | Expenses | |
| | | Account | | Expense Ratio | | Account | | Paid During | |
| | | Value 10/01/14 | | For the Period | | Value 03/31/15 | | the Period* | |
| Hypothetical | | | | | | | | | | | | | |
| | | $ | 1,000.00 | | | 2.50 | % | $ | 1,012.47 | | $ | 12.54 | |
* Expenses are equal to the Fund’s annualized expense ratio multiplied by 182/365 to reflect the number of days in the period.
Consideration and Approval of Investment Advisory Agreement with Respect to the American Real Estate Income Fund
Approval of Investment Advisory Agreement
At a meeting held on January 7, 2014, (the “Meeting”), the Board of Trustees (the “Board”) of American Real Estate Income Fund (the “Trust”), including those Trustees who are not “interested persons” of the Trust (the “Independent Trustees”), as such term is defined under Section 2(a)(19) of the Investment Company Act of 1940, as amended, considered the approval of the investment advisory agreement (the “Agreement”) between SEL Asset Management, LLC (formerly, Carnegie Asset Management, LLC)(the “Adviser”) and the American Real Estate Income Fund (the “Fund”).
In connection with the Board’s consideration of the Agreement, the Board received written materials in advance of the Meeting, which included (i) information regarding: the nature and quality of the advisory services to be rendered, including the performance of the Fund relative to its stated objectives; (ii) the experience and qualifications of the Adviser’s personnel providing such services; (iii) the proposed advisory fee structure, the existence of any fee waivers, and the Fund’s anticipated expense ratios in relation to those of other investment companies having comparable investment policies and limitations; (iv) the fees charged by the Adviser to similar clients, including a comparison of the type and quality of services provided by, and the client-related expenses borne by, the Adviser; (v) the direct and indirect costs that may be incurred by the Adviser; and (vi) possible economies of scale arising from the Fund’s size and anticipated growth.
In its consideration of the approval of the Agreement for the Fund, the Board did not identify any single factor as controlling. Matters considered by the Board in connection with its approval of the Agreement included, among others, the following:
Nature, Extent and Quality of Services. The Trustees reviewed materials provided by the Adviser related to the proposed Agreement with the Trust, including a description of the services to be provided and manner in which investment decisions are to be made and executed, the proposed Agreement, an overview of the personnel that would perform services for the Fund, and a copy of the Adviser’s revised Form ADV.
In reaching their conclusions, the Trustees considered that the Adviser will be utilizing and delegating to a sub-adviser for certain aspects of management of the Fund’s portfolio, including that the Adviser will retain overall responsibility for the Fund’s specific allocations to real estate related investments that are not listed on a national securities exchange (“Non-Traded REITs”) and other liquid real-estate related investments that are listed on a national securities exchange (“Listed REITs”) and will be primarily responsible for selecting investments in Non-Traded REITs while delegating to a sub-adviser the responsibility for managing the portion of the Fund’s portfolio dedicated to Listed REITs and other liquid securities.
The Trustees considered that the Adviser’s portfolio management team was adequate to support the Adviser’s advisory services, noting that the Adviser is newly formed and does not presently manage any assets, however the Adviser’s investment team utilizes a sophisticated management discipline and manages in excess of $650 million under contracts with affiliated entities. The Trustees concluded that the Adviser had sufficient quality and depth of personnel, resources, investment methods essential to performing its duties under the proposed Agreement and that the nature, overall quality and extent of the management services to be provided by the Adviser to the Fund were satisfactory and reliable.
Performance. The Trustees considered that the Fund is newly formed and as such does not have a record of prior performance to submit at the Meeting. The Trustees considered the experience of the Adviser’s portfolio management team that the Adviser would be delegating the management of a portion of the Fund’s portfolio to a sub-adviser. The Trustees considered the track record of a registered open-end mutual fund account with similar investment objectives and strategies to those of the Fund, taking into account that open-end mutual funds are more restrictive than the Fund’s closed-end structure, and noted that the performance of such other account was adequate. The Trustees concluded that, based on the Adviser’s presentations and the professionalism, experience and qualifications of the portfolio management team, that the Adviser was expected to obtain an acceptable level of investment returns to shareholders.
Fees and Expenses. As to the costs of the services to be provided and profits to be realized by the Adviser, the Trustees discussed the comparison of management fees provided to them and reviewed the Fund’s advisory fee compared to a peer group of similar closed-end interval funds. The Board noted that proposed a 1.10% advisory fee was lower than the median of the peer group and approximate to the mean. The Trustees also considered that the Adviser will only retain a portion of the advisory fee equal to 0.10% of the Fund’s average daily net assets, with the remaining 1.00% payable to the Fund’s sub-adviser, and that the allocation of the advisory and sub-advisory fee in relation to the services rendered was reasonable. The Trustees concluded that the Adviser’s advisory fee was fair and reasonable.
Profitability. The Board considered the anticipated profits to be realized by the Adviser in connection with the operation of the Fund and whether the amount of profit is a fair entrepreneurial profit for the management of the Fund. The Board noted that any projection of profits is speculative at this time and as such, the Adviser’s expected level of profitability from its relationship with the Fund would not be excessive for the initial term of the Agreement.
Economies of Scale. The Board considered whether there will be economies of scale in respect of the management of the Fund. The Board considered that based on the anticipated size of the Fund for the initial term of the Agreement that economies of scale was not a relevant consideration at this time.
Conclusion. Having requested and received such information from the Adviser as the Trustees believed to be reasonably necessary to evaluate the terms of the proposed Agreement, and as assisted by the advice of counsel, the Trustees determined that approval of the Agreement for an initial term is in the best interests of the Fund and its future shareholders. In considering the Agreement, the Trustees did not identify any one factor as all important, but rather considered these factors collectively in light of surrounding circumstances.
Approval of Sub-Advisory Agreement
At the Meeting, the Board, including the Independent Trustees, also considered the approval a sub-advisory agreement (the “Sub-Advisory Agreement”) between the Adviser and National Fund Advisors, LLC (the “Sub-Adviser”), on behalf of the Fund.
In connection with the Board’s consideration of the Sub-Advisory Agreement, the Board received written materials in advance of the Meeting, which included information regarding: (i) the nature and quality of the sub-advisory services to be rendered, including the performance of the Fund relative to its stated objectives; (ii) the experience and qualifications of the sub-Adviser’s personnel providing such services; (iii) the Sub-Adviser’s compliance policies and procedures, including policies and procedures for personal securities transactions and (iv) performance information of the Fund as compared to similarly managed accounts of the Sub-Adviser.
In its consideration of the approval of the Sub-Advisory Agreement for the Fund, the Board did not identify any single factor as controlling. Matters considered by the Trustees in connection with its approval of the Sub-Advisory Agreement included, among others, the following:
Nature, Extent and Quality of Services. The Trustees reviewed materials provided by the Sub-Adviser related to the proposed Sub-Advisory Agreement, including a description of the services to be provided and manner in which investment decisions are to be made and executed, the proposed Sub-Advisory Agreement, an overview of the personnel that would perform services for the Fund, and a copy of the Sub-Adviser’s Form ADV. The Board examined the nature, extent and quality of the services to be provided by the Sub-Adviser to the Fund. The Trustees considered the experience and qualifications of the staff of the Sub-Adviser. With respect to the portfolio management of the Fund, the Trustees considered the allocation of portfolio management responsibility as between the Fund’s investment adviser and the Sub-Adviser, whereby the Sub-Adviser maintains responsibility for managing the portion of the Fund’s portfolio dedicated to Listed REITs and other liquid securities. The Trustees also considered that the Sub-Adviser serves as investment adviser to other open-end mutual funds that have similar investment objectives to that of the Fund. The Trustees then concluded that the Sub-Adviser has sufficient quality and depth of personnel, resources, investment methods and compliance policies and procedures essential to performing its duties under the Sub-Advisory Agreement and that the nature, overall quality and extent of the management services to be provided by the Sub-Adviser were satisfactory and reliable.
Performance. The Trustees considered that the Fund is newly formed and as such does not have a record of prior performance to submit at the Meeting. The Trustees considered the track record of a registered open-end mutual fund account with similar investment objectives and strategies those of the Fund advised by the Sub-Adviser, taking into account that open-end mutual funds are more restrictive than the Fund’s closed-end structure, and noted that the performance of such other account was adequate. The Trustees concluded that, based on the Sub-Adviser’s presentations and the professionalism, experience and qualifications of the portfolio management team, that the Sub-Adviser was expected to obtain an acceptable level of investment returns to shareholders.
Fees and Expenses. The Trustees then discussed the proposed fees to be paid to the Sub-Adviser. The Trustees considered that the Sub-Adviser’s fee of 1.00% of the Fund’s average daily net assets would be paid out of the advisory fee. The Trustees considered that based upon the Sub-Adviser’s development of the Fund’s investment strategy and the Sub-Adviser’s expected contribution to the Fund’s success and the quality and depth of the Sub-Adviser’s personnel and resources, the allocation of the portion of the advisory fee to the Sub-Adviser was reasonable and the sub-advisory fee were acceptable in light of the quality of the services the Funds expected to receive from the Sub-Adviser.
Profitability. The Trustees considered the anticipated profits to be realized by the Sub-Adviser in connection with the operation of the Fund, and whether the amount of profit is a fair profit for providing sub-advisory services to the Fund. The Trustees concluded that because of the Fund’s expected asset levels during the initial term of the Sub-Advisory Agreement, they were satisfied that the Sub-Adviser’s level of profitability from its relationship with the Fund would not be excessive.
Economies of Scale. The Trustees considered whether there will be economies of scale with respect to the management of the Fund for the initial term of the Sub-Advisory Agreement and whether there is potential for realization of any economies of scale. The Trustees concluded that at current and projected asset levels, economies of scale was not a relevant consideration at this time.
Conclusion. Having requested and received such information from Sub-Adviser as the Trustees believed to be reasonably necessary to evaluate the terms of the proposed Sub-Advisory Agreement, and as assisted by the advice of counsel, the Trustees determined that approval of the Sub-Advisory Agreement for an initial term is in the best interests of the Fund and its future shareholders. In considering the Sub-Advisory Agreement, the Trustees did not identify any one factor as all important, but rather considered these factors collectively in light of surrounding circumstances.
| American Real Estate Income Fund |
| Trustees and Officers (Unaudited) |
| March 31, 2015 |
Trustees
Following is a list of the trustees of the Trust and their principal occupation over the last five years.
| Independent Trustees | | | | | | | | |
| | | | | | | | | |
| | | | | | | Number of | | |
| | | | | | | Portfolios in | | Other |
| | | | | | | Fund | | Directorships |
| | | | | | | Complex*** | | held by Trustee |
| Name, Address* | | Position/Term | | Principal Occupation | | Overseen by | | During Last |
| and Age | | of Office** | | During the Past Five Years | | Trustee | | Five Years |
Robin A. Ferracone Age 61 | | Trustee Since May 2012 | | Chief Executive Officer, Farient Advisors, LLC (May 2007 to present). | | 1 | | American Realty Capital Trust V, Inc. from January 2013 to April 2013; American Realty Capital Daily Net Asset Value Trust, Inc. from May 2012 to present; American Realty Capital Properties, Inc. from October 2012 to February 2013. |
| | | | | | | | | |
Stanley R. Perla Age 71 | | Trustee Since May 2012 | | Certified Public Accountant (“CPA”) and Practice Development, Friedman LLP (May 2012 to present); CPA and Practice Development, Cornerstone Accounting Group, LLP (June 2011 to May 2012); CPA and Managing Partner, Cornerstone Accounting Group, LLP (June 2008 to May 2011); CPA and Director of Internal Audit, Vornado Realty Trust (July 2003 to May 2008). | | 1 | | American Realty Capital Hospitality Trust, Inc. from January 2014 to present; American Realty Capital Trust V, Inc. from April 2013 to present; American Realty Capital Daily Net Asset Value Trust, Inc. from March 2012 to April 2013; American Realty Capital Global Trust II, Inc. from August 2014 to present; Madison Harbor Balanced Strategies, Inc. from January 2004 to present; American Mortgage Acceptance Company from January 2004 to April 2010; GTJ REIT, Inc. from January 2013 to present. |
| American Real Estate Income Fund |
| Trustees and Officers (Unaudited) (Continued) |
| March 31, 2015 |
Interested Trustee
| | | | | | | Number of | | |
| | | | | | | Portfolios | | Other |
| | | | | | | in Fund | | Directorships |
| | | | | | | Complex*** | | held by Trustee |
| Name, Address* | | Position/Term | | Principal Occupation | | Overseen | | During Last |
| and Age | | of Office** | | During the Past Five Years | | by Trustee | | Five Years |
John H. Grady**** Age 53 | | Trustee and Chairman since 2015 | | President, Treasurer and Secretary, American Real Estate Income Fund from October 2012 to present; Chairman and Interested Trustee, Realty Capital Income Funds Trust from April 2015 to present; President, Realty Capital Income Funds Trust from 2013 to present; President, National Fund Advisors, LLC from October 2012 to present; President, American National Stock Transfer, LLC from October 2012 to September 2014; Chief Strategy and Risk Officer, RCS Capital Corporation from October 2014 to present; Chief Operating Officer, Realty Capital Securities from October 2012 to September 2014; Chief Compliance Officer, Business Development Corporation of America, from October 2012 to April 2015; Chief Compliance Officer, BDCA Adviser, LLC, from October 2012 to March 2015; General Counsel and Chief Operating Officer, Steben & Company (firm operated and distributed commodity pools using managed futures strategies), from December 2009 to September 2012. | | 5 | | Realty Capital Income Funds Trust from April 2015 to present. |
| * | The address for each trustee listed above is 405 Park Avenue, 14th Floor, New York, NY 10022. |
| ** | The term of office for each trustee listed above will continue indefinitely. |
| *** | The term “Fund Complex” refers to the ARC Income Funds. |
| **** | Mr. Grady is an “interested person” of the Fund, as such term is defined in the 1940 Act. |
| American Real Estate Income Fund |
| Trustees and Officers (Unaudited) (Continued) |
| March 31, 2015 |
| Officers |
| |
| Following is a list of executive officers of the Trust and their principal occupation over the last five years. |
| | | | | Principal Occupation |
| Name, Address* and Age | | Position/Term of Office** | | During the Past Five Years |
John H. Grady Age 53 | | President, Treasurer and Secretary | | Chairman and Trustee, American Real Estate Income Fund from April 2015 to present; Chairman and Interested Trustee, Realty Capital Income Funds Trust from April 2015 to present; President, Realty Capital Income Funds Trust from 2013 to present; President, National Fund Advisors, LLC from October 2012 to present; President, American National Stock Transfer, LLC from October 2012 to September 2014; Chief Strategy and Risk Officer, RCS Capital Corporation from October 2014 to present; Chief Operating Officer, Realty Capital Securities from October 2012 to September 2014; Chief Compliance Officer, Business Development Corporation of America, from October 2012 to April 2015; Chief Compliance Officer, BDCA Adviser, LLC, from October 2012 to March 2015; General Counsel and Chief Operating Officer, Steben & Company (firm operated and distributed commodity pools using managed futures strategies), from December 2009 to September 2012. |
| | | | | |
Mark Painter Age 33 | | Vice President | | Portfolio Manager, SEL Asset Management, LLC from February 2014 to present; Portfolio Manager, Stanley Laman Group, Ltd from July 2004 to present. |
| | | | | |
Christopher Pike Age 47 | | Vice President | | Vice President and Chief Investment Officer, National Fund Advisors, LLC from May 2012 to present; Director of Investment Research, American Realty Capital and Realty Capital Securities from August 2011to May 2012; Equity Research Analyst, Fagenson & Company, Inc. from December 2009 to Aug 2011; Equity Research Analyst, Merrill Lynch from March 2006 to December 2008. |
| | | | | |
Gerard Scarpati Age 59 | | Chief Financial Officer | | Director, Vigilant Compliance, LLC (an investment management services company) from February 2010 to present; consultant to investment industry from August 2004 to February 2010. |
| American Real Estate Income Fund |
| Trustees and Officers (Unaudited) (Continued) |
| March 31, 2015 |
| | | | | Principal Occupation |
| Name, Address* and Age | | Position/Term of Office** | | During the Past Five Years |
Robert Amweg Age 62 | | Chief Compliance Officer | | Compliance Director, Vigilant Compliance, LLC (an investment management services company) from August 2013 to present; Consultant to financial services industry from September 2012 to December 2014; and Chief Financial Officer and Chief Accounting Officer, Turner Investment from February 2007 to August 2012. |
| * | The address for each officer listed above is 405 Park Avenue, 14th Floor, New York, NY 10022. |
| ** | The term of office for each officer listed above will continue indefinitely. |
NOTICE OF PRIVACY POLICY & PRACTICES
Your privacy is important to the Fund. The Fund is committed to maintaining the confidentiality, integrity, and security of your personal information. When you provide personal information, the Fund believes that you should be aware of policies to protect the confidentiality of that information.
The Fund collects the following nonpublic personal information about you:
| • | Information the Fund receives from you on or in applications or other forms, correspondence, or conversations, including, but not limited to, your name, address, phone number, social security number, assets, income, and date of birth; and |
| | |
| • | Information about your transactions with us, our affiliates, or others, including, but not limited to, your account number and balance, payments history, parties to transactions, cost basis information, and other financial information. |
The Fund does not disclose any nonpublic personal information about its current or former shareholders to affiliated or nonaffiliated third parties, except as permitted by law. For example, the Fund is permitted by law to disclose all of the information it collects, as described above, to its transfer agent to process your transactions. Furthermore, the Fund restricts access to your nonpublic personal information to those persons who require such information to provide products or services to you. The Fund maintains physical, electronic, and procedural safeguards that comply with applicable federal and state standards to guard your nonpublic personal information.
In the event that you hold shares of the Fund through a financial intermediary, including, but not limited to, a broker-dealer, bank, or trust company, the privacy policy of your financial intermediary would govern how your nonpublic personal information would be shared with affiliated or non-affiliated third parties.
Adopted January 7, 2014
| Investment Adviser SEL Asset Management, LLC 1235 Westlakes Drive Suite 295 Berwyn, Pennsylvania 19312 Investment Sub-Adviser National Fund Advisors, LLC 405 Park Avenue New York, NY 10022 Administrator RCS Advisory Services, LLC 405 Park Avenue New York, NY 10022 |
Proxy Voting Policy. Information regarding how the Fund votes proxies relating to portfolio securities for the most recent period ended June 30, as well as a description of the policies and procedures that the Fund used to determine how to vote proxies is available without charge, upon request, by calling 1-866-271-9244 or by referring to the Securities and Exchange Commission’s (“SEC”) website at http://www.sec.gov. A description of the policies and procedures is also included in the Fund’s Statement of Additional Information, which is available on the SEC’s website at http://www.sec.gov. |
Portfolio Holdings. The Fund files its complete schedule of portfolio holdings with the SEC for the first and third quarters of each fiscal year on Form N-Q. Form N-Q is available on the SEC’s website at http://www.sec.gov and may be reviewed and copied at the SEC’s Public Reference Room in Washington, DC (1-800-SEC-0330). The information on Form N-Q is available without charge, upon request, by calling 1-866-271-9244.
Item 2. Code of Ethics.
| (a) | As of the end of the period covered by this report, American Real Estate Income Fund (“Registrant”) has adopted a code of ethics that applies to the Registrant’s principal executive and senior financial officers, or persons performing similar functions, pursuant to the Sarbanes-Oxley Act of 2002 (“Code of Ethics”).
|
| (c) | During the period covered by this report, no substantive amendments were made to the Code of Ethics.
|
| (d) | During the period covered by this report, the Registrant did not grant any waivers, including any implicit waivers, from any provision of the Code of Ethics.
|
| (f) | The Code of Ethics is attached hereto as Exhibit 12(a)(1). |
Item 3. Audit Committee Financial Expert.
(a) (1) The Board of Trustees of the Registrant (the “Board”) has determined that the Registrant has at least one Board member serving on the Audit Committee that possesses the attributes identified in Instruction 2(b) of Item 3 to Form N-CSR to qualify as an “audit committee financial expert.”
(2) Stanley Perla is the Registrant’s audit committee financial expert and is “independent” for purposes of Item 3(a)(2) to Form N-CSR.
Item 4. Principal Accountant Fees and Services.
| (a) | Audit Fees – The aggregate fees for the last two fiscal years billed by BBD, LLP, the Registrant’s independent registered public accounting firm (“BBD”) for professional services rendered for the audit of the Registrant’s annual financial statements and review of financial statements included in the Registrant’s annual report to shareholders were $16,000 for the fiscal year ended March 31, 2015 and not applicable for the fiscal year ended March 31, 2014.
|
| | | |
| (b) | Audit-Related Fees – The aggregate fees for the last two fiscal years billed by BBD for assurances and related services that are reasonably related to the performance of the audit or review of the Registrant’s financial statements and are not reported under Item 4(a) above were $2,000 for the fiscal year ended March 31, 2015 and not applicable for the fiscal year ended March 31, 2014. The services performed were in connection with the audit of the seed financial statements of the Registrant.
|
| (c) | Tax Fees – The aggregate fees for the last two fiscal years billed by BBD for professional services rendered for tax compliance, tax advice, and tax planning were $3,500 for the fiscal year ended March 31, 2015 and not applicable for the fiscal year ended March 31, 2014. The nature of the services comprising the tax fees was the review of the Registrant’s income tax returns and excise tax calculations.
|
| (d) | All Other Fees – There were no fees billed during the last two fiscal years by BBD for fees other than for the services reported in paragraphs (a) through (c) of this Item. |
| (e) | (1) Audit Committee Pre-Approval Policies and Procedures - The Registrant’s Audit Committee has adopted, and the Registrant’s Board has approved an Audit and Non-Audit Services Preapproval Policy (the “Policy”), which is intended to comply with Regulation S-X Rule 2-01, and sets forth guidelines and procedures to be followed by the Registrant when retaining the Auditor to perform audit-related services, tax services and other non-audit services. The Policy permits such services to be pre-approved in one of two ways: (1) pursuant to a general pre-approval (“General Pre-Approval”), or (2) pursuant to specific pre-approval (“Specific Pre- Approval”). Unless a type of service provided by the Auditor and the maximum estimated fees therefor has received General Pre-Approval, it will require Specific Pre-Approval by the Audit Committee. |
(2) All of the audit and tax services included in Items 4(b) through (d) above for the fiscal year ended March 31, 2015 were pre-approved by the Audit Committee pursuant to the Policy. There were no services included in Items 4(b) through (d) above that were approved by the Audit Committee pursuant to paragraph (c)(7)(i)(C) of Rule 2-01 of Regulation S-X.
Item 5. Audit Committee of Listed Companies.
Not applicable to nonlisted issuers.
Item 6. Investments.
The schedule of investments is included as part of the report to stockholders filed under Item 1 of this Form.
Item 7. Disclosure of Proxy Voting Policies and Procedures for Closed-End Management Investment Companies.
The Registrant’s Proxy Voting Policies and Procedures is attached hereto as Exhibit 12(c).
Item 8. Portfolio Managers of Closed-End Management Investment Companies.
(a)(1) Identification of Portfolio Manager(s) or Management Team Members and Description of Role of Portfolio Manager(s) or Management Team Members
The following tables provide biographical information about the portfolio managers who are primarily responsible for the day-to-day portfolio management of the Registrant as of June 11, 2015:
The Investment Adviser (SEL Asset Management, LLC)
| Portfolio Manager | Title | Length of Time of Service to Registrant | Business Experience During the Past 5 Years | Role of Portfolio Manager |
| Mark Painter | Vice President | Since 2014 | Portfolio Manager, SEL Asset Management, LLC from February 2014 to present; Portfolio Manager, Stanley Laman Group, Ltd from July 2004 to present. | Portfolio Management – Primary responsibility for overseeing the overall allocation of the Registrant’s portfolio and for managing the portion of the Registrant’s portfolio not allocated to National Fund Advisors, LLC (including investments in non-traded REITs and illiquid securities). |
The Sub-Adviser (National Fund Advisors, LLC)
| Portfolio Manager | Title | Length of Time of Service to Registrant | Business Experience During the Past 5 Years | Role of Portfolio Manager |
| Christopher Pike | Vice President | Since 2014 | Vice President and Chief Investment Officer, National Fund Advisors, LLC from May 2012 to present; Director of Investment Research, American Realty Capital and Realty Capital Securities from August 2011 to May 2012; Equity Research Analyst, Fagenson & Company, Inc. from December 2009 to Aug 2011. | Portfolio Management – Primary responsibility for managing the portion of the Registrant’s portfolio allocated to National Fund Advisors, LLC (including investments in listed REITs and CMBS). |
(a)(2) Other Accounts Managed by Portfolio Manager(s) or Management Team Member and Potential Conflicts of Interest
The following tables provide information about portfolios and accounts, other than the Registrant, for which the portfolio managers are primarily responsible for the day-to-day portfolio management as of March 31, 2015:
The Investment Adviser (SEL Asset Management, LLC)
| Name | Type of Accounts | Total Number of Accounts Managed | Total Assets | Number of Accounts Managed for Which Advisory Fees is Based on Performance | Total Assets for Which Advisory Fees is Based on Performance |
| Mark Painter | Registered Investment Companies | 1 | $700,000 | None | None |
| Other Pooled Investment Vehicles | 1 | $80,000,000 | None | None |
| Other Accounts | 916 | $718,000,000 | None | None |
The Sub-Adviser (National Fund Advisors, LLC)
| Name | Type of Accounts | Total Number of Accounts Managed | Total Assets | Number of Accounts Managed for Which Advisory Fees is Based on Performance | Total Assets for Which Advisory Fees is Based on Performance |
| Christopher Pike | Registered Investment Companies | 2 | $58,047,702.70 | None | None |
| Other Pooled Investment Vehicles | None | $0 | None | None |
| Other Accounts | 3 | $22,938,413.54 | None | None |
Potential Conflicts of Interests
The Investment Adviser (SEL Asset Management, LLC)
Mark Painter is responsible for managing other accounts, including registered investment companies, separate accounts and other pooled investment vehicles. He may manage separate accounts and other pooled investment vehicles that may have materially higher, lower or different fee arrangements than the Registrant and may in the future also be subject to performance-based fees. The side-by-side management of these separate accounts and/or pooled investment vehicles may raise potential conflicts of interest relating to cross trading and the allocation of investment opportunities. The investment adviser has a fiduciary responsibility to manage all client accounts in a fair and equitable manner. The investment adviser seeks to provide best execution of all securities transactions and to allocate investments to client accounts in a fair and timely manner. To this end, the investment adviser has developed policies and procedures designed to mitigate and manage the potential conflicts of interest that may arise from side-by-side management.
The Sub-Adviser (National Fund Advisors, LLC)
Christopher Pike is responsible for managing other accounts, including registered investment companies, separate accounts and other pooled investment vehicles. He may manage separate accounts and other pooled investment vehicles that may have materially higher, lower or different fee arrangements than the Registrant and may in the future also be subject to performance-based fees. The side-by-side management of these separate accounts and/or pooled investment vehicles may raise potential conflicts of interest relating to cross trading and the allocation of investment opportunities. The sub-adviser has a fiduciary responsibility to manage all client accounts in a fair and equitable manner. The sub-adviser seeks to provide best execution of all securities transactions and to allocate investments to client accounts in a fair and timely manner. To this end, the sub-adviser has developed policies and procedures designed to mitigate and manage the potential conflicts of interest that may arise from side-by-side management.
(a)(3) Compensation Structure of Portfolio Manager(s) or Management Team Members
The portfolio managers receive a salary, retirement plan benefits and discretionary bonuses from the investment adviser and/or the sub-adviser, as applicable.
(a)(4) Disclosure of Securities Ownership
The following tables set forth the dollar range of equity securities beneficially owned by each of the portfolio managers in the Registrant as of March 31, 2015:
The Investment Adviser (SEL Asset Management, LLC)
| Portfolio Manager | Dollar Range of Registrant Shares Beneficially Owned |
| Mark Painter | None |
The Sub-Adviser (National Fund Advisors, LLC)
| Portfolio Manager | Dollar Range of Registrant Shares Beneficially Owned |
| Christopher Pike | None |
(b) Not applicable.
Item 9. Purchases of Equity Securities by Closed-End Management Investment Company and Affiliated Purchasers.
| AR Capital, LLC Purchases of Equity Securities |
| Period | (a) Total Number of Shares (or Units) Purchased | (b) Average Price Paid per Share (or Unit) | (c) Total Number of Shares (or Units) Purchased as Part of Publicly Announced Plans or Programs (1,2,3) | (d) Maximum Number (or Approximate Dollar Value) of Shares (or Units) that May Yet Be Purchased Under the Plans or Programs |
| Month #1 (5/5/14 through 5/31/14) | 10,000 (4) | 10 | - | - |
| Month #5 (9/1/14 through 9/30/14) | 250,000 (5) | 10 | - | - |
| Month #8 (12/1/14 through 12/31/14) | 4,164 (6) | 11 | - | - |
| Total | 264,164 | 31 | - | - |
| RCS Capital Corporation Purchases of Equity Securities |
| Period | (a) Total Number of Shares (or Units) Purchased | (b) Average Price Paid per Share (or Unit) | (c) Total Number of Shares (or Units) Purchased as Part of Publicly Announced Plans or Programs(1,2,3) | (d) Maximum Number (or Approximate Dollar Value) of Shares (or Units) that May Yet Be Purchased Under the Plans or Programs |
| Month #5 (9/1/14 through 9/30/14) | 250,000 (5) | 10 | | |
| Month #8 (12/1/14 through 12/31/14) | 4,004 (6) | 11 | - | - |
| Total | 254,004 | 21 | - | - |
| (1) | An offer to repurchase shares was announced on September 9, 2014, and expired on September 30, 2014 for 25,505 shares which was 5% of the outstanding shares. |
| (2) | An offer to repurchase shares was announced on December 10, 2014, and expired on December 30, 2014 for 25,863 shares which was 5% of the outstanding shares. |
| (3) | An offer to repurchase shares was announced on March 23, 2015, and expired on April 22, 2015 for 26,108 shares which was 5% of the outstanding shares. |
| | (4) | Initial seed investment. |
| | (5) | Purchases made in open-market transaction. |
| | (6) | Dividend reinvestment. |
Item 10. Submission of Matters to a Vote of Security Holders.
None.
Item 11. Controls and Procedures.
| (a) | The Registrant’s principal executive and principal financial officers, or persons performing similar functions, have concluded that the Registrant’s disclosure controls and procedures (as defined in Rule 30a-3(c) under the 1940 Act are effective, as of a date within 90 days of the filing date of this report, based on the evaluation of these controls and procedures required by Rule 30a-3(b) under the 1940 Act and Rule 15d-15(b) under the Securities Exchange Act of 1934, as amended. |
| (b) | There were no changes in the Registrant’s internal control over financial reporting (as defined in Rule 30a-3(d) under the 1940 Act) that occurred during the period covered by this report that have materially affected, or are reasonably likely to materially affect, the Registrant’s internal control over financial reporting. |
Item 12. Exhibits.
(a)(1) Code of Ethics filed hereto in response to Item 2(f).
(a)(2) The certifications required by Rule 30a-2(a) of the 1940 Act are attached hereto.
(a)(3) No written solicitations to purchase securities under Rule 23c-1 under the 1940 Act were sent or given during the period covered by this report by or on behalf of the Registrant to ten or more persons.
| (b) | The certifications required by Rule 30a-2(b) of the 1940 Act and Section 906 of the Sarbanes-Oxley Act of 2002 are attached hereto. |
| (c) | The Registrant’s Proxy Voting Policies and Procedures is attached hereto in response to Item 7. |
SIGNATURES
Pursuant to the requirements of the Securities Exchange Act of 1934 and the Investment Company Act of 1940, the Registrant has duly caused this report to be signed on its behalf by the undersigned, thereunto duly authorized.
American Real Estate Income Fund Trust
By
/s/ John H. Grady
John H. Grady, President, Treasurer and Secretary, and Trustee and Chairman of the Board
Date June 11, 2015
Pursuant to the requirements of the Securities Exchange Act of 1934 and the Investment Company Act of 1940, this report has been signed below by the following persons on behalf of the Registrant and in the capacities and on the dates indicated.
By
/s/ John H. Grady
John H. Grady, President, Treasurer and Secretary and Trustee and Chairman of the Board
Date June 11, 2015
By
/s/ Gerard Scarpati
Gerard Scarpati, Chief Financial Officer
Date June 11, 2015