UNITED STATES
SECURITIES AND EXCHANGE COMMISSION
Washington, D.C. 20549
FORM 10-K
(Mark One)
| x | ANNUAL REPORT PURSUANT TO SECTION 13 OR 15(d) OF THE SECURITIES EXCHANGE ACT OF 1934 |
For the fiscal year ended December 31, 2012
or
| ¨ | TRANSITION REPORT PURSUANT TO SECTION 13 OR 15(d) OF THE SECURITIES EXCHANGE ACT OF 1934 |
For the transition period from to .
Commission File Number: 000-35180
Lumos Networks Corp.
(Exact name of registrant as specified in its charter)
| | |
| Delaware | | 80-0697274 |
(State or other jurisdiction of incorporation or organization) | | (I.R.S. Employer Identification No.) |
One Lumos Plaza, Waynesboro, Virginia 22980
(Address of principal executive offices) (Zip Code)
(540) 946-2000
(Registrant’s telephone number, including area code)
Securities registered pursuant to Section 12(b) of the Act:
| | |
Title of each class | | Name of each exchange on which registered |
| Common stock, $0.01 par value | | The NASDAQ Stock Market LLC |
Securities registered pursuant to Section 12(g) of the Act:
None
Indicate by check mark if the registrant is a well-known seasoned issuer, as defined in Rule 405 of the Securities Act. ¨ Yes x No
Indicate by check mark if the registrant is not required to file reports pursuant to Section 13 or Section 15(d) of the Act. ¨ Yes x No
Indicate by check mark whether the registrant (1) has filed all reports required to be filed by Section 13 or 15(d) of the Securities Exchange Act of 1934 during the preceding 12 months (or for such shorter period that the registrant was required to file such reports), and (2) has been subject to such filing requirements for the past 90 days. x Yes ¨ No
Indicate by check mark whether the registrant has submitted electronically and posted on its corporate Web site, if any, every Interactive Data File required to be submitted and posted pursuant to Rule 405 of Regulation S-T (§ 232.405 of this chapter) during the preceding 12 months (or for such shorter period that the registrant was required to submit and post such files). x Yes ¨ No
Indicate by check mark if disclosure of delinquent filers pursuant to Item 405 of Regulation S-K (§ 229.405 of this chapter) is not contained herein, and will not be contained, to the best of registrant’s knowledge, in definitive proxy or information statements incorporated by reference in Part III of this Form 10-K or any amendment to this Form 10-K. x
Indicate by check mark whether the registrant is a large accelerated filer, an accelerated filer, a non-accelerated filer or a smaller reporting company. See definitions of “large accelerated filer”, “accelerated filer” and “smaller reporting company” in Rule 12b-2 of the Exchange Act. (Check one):
|
| Large accelerated filer¨ Non-accelerated filer ¨ Accelerated filer x Smaller reporting company ¨ |
|
(Do not check if a smaller reporting company) |
Indicate by check mark whether the registrant is a shell company (as defined in Rule 12b-2 of the Act). ¨ Yes x No
As of June 30, 2012, the aggregate market value of the Registrant’s common stock was $144,687,102.
There were 21,553,947 shares of the registrant’s common stock outstanding as of the close of business on March 1, 2013.
DOCUMENTS INCORPORATED BY REFERENCE
| | |
Document | | Incorporated Into |
Proxy statement for the 2013 Annual Meeting of Stockholders | | Part III |
LUMOS NETWORKS CORP.
2012 ANNUAL REPORT ON FORM 10-K
TABLE OF CONTENTS
1
PART I
FORWARD-LOOKING STATEMENTS
Any statements contained in this report that are not statements of historical fact, including statements about our beliefs and expectations, are forward-looking statements and should be evaluated as such. The words “anticipates,” “believes,” “expects,” “intends,” “plans,” “estimates,” “targets,” “projects,” “should,” “may,” “will” and similar words and expressions are intended to identify forward-looking statements. These forward-looking statements are contained throughout this report, for example in “Business,” “Risk Factors,” and “Management’s Discussion and Analysis of Financial Condition and Results of Operations.” Such forward-looking statements reflect, among other things, our current expectations, plans and strategies, and anticipated financial results, all of which are subject to known and unknown risks, uncertainties and factors that may cause our actual results to differ materially from those expressed or implied by these forward-looking statements. Many of these risks are beyond our ability to control or predict. All forward-looking statements attributable to us or persons acting on our behalf are expressly qualified in their entirety by the cautionary statements contained throughout this report. Because of these risks, uncertainties and assumptions, you should not place undue reliance on these forward-looking statements. These risks and other factors include those listed under “Risk Factors” and elsewhere in this report. Furthermore, forward-looking statements speak only as of the date they are made. We do not undertake any obligation to update or review any forward-looking information, whether as a result of new information, future events or otherwise.
Item 1. Business.
Lumos Networks Overview
Lumos Networks Corp. (“Lumos Networks,” the “Company,” “we,” “us” or “our”) is a fiber-based network service provider in the Mid-Atlantic region. We utilize our 5,800 mile long-haul fiber network to provide data, broadband and voice services to enterprise, carrier and residential customers primarily in Virginia and West Virginia, and portions of Pennsylvania, Maryland, Ohio and Kentucky. Our mission is to leverage and expand our fiber assets in order to capture the growing demand for data and mobility services in both our existing and contiguous markets.
We became an independent, publicly traded company on October 31, 2011, as a result of our spin-off from NTELOS Holdings Corp. (“NTELOS”). On October 14, 2011, NTELOS announced a distribution date of October 31, 2011 for the spin-off of all of the issued and outstanding shares of common stock of Lumos Networks Corp., which operated NTELOS’s wireline operations (the “Business Separation”). Prior to and in connection with the Business Separation, following the market close on October 31, 2011, NTELOS effectuated a 1-for-2 reverse stock split (the “Reverse Stock Split”) of its shares of common stock. The spin-off of Lumos Networks was in the form of a tax-free stock distribution to NTELOS stockholders of record as of the close of business on October 24, 2011, the record date (the “Distribution”). On October 31, 2011, NTELOS distributed one share of Lumos Networks common stock for every share of NTELOS common stock outstanding, on a post-Reverse Stock Split basis. Our common stock has been publicly traded on The NASDAQ Stock Market LLC (“NASDAQ”) under the ticker symbol “LMOS” since November 1, 2011.
We conduct all of our business through our wholly-owned subsidiary Lumos Networks Operating Company and its subsidiaries. Our principal executive offices are located at One Lumos Plaza, Waynesboro, Virginia 22980. The telephone number at that address is (540) 946-2000.
Business Strategy
Our primary objective is to leverage and expand our fiber assets to capture the growing demand for data and mobility services amongst our enterprise and carrier customers in our marketplace. Our strategy is to (i) maximize the value of our 5,800 mile long-haul fiber optic network to expand the sale of data and IP-services to new and existing enterprise and government customers while maintaining a ratio of approximately 70% to 80% on-net traffic; (ii) leverage our fiber network to expand to new fiber to the cell site opportunities; (iii) utilize our fiber footprint and carrier relationships to expand our revenue in transport; (iv) continue to provide high quality customer service and a compelling value proposition; (v) continue to shift incremental resources from the declining legacy voice products into our faster growing and more profitable strategic data products in the Competitive segment of our business; (vi) use our “edge-out” strategy to expand into new adjacent geographic markets to further leverage our fiber network and growing offering of data services; and (vii) use our success-based investment strategy to improve capital efficiency and expand margins.
Our strategic data products, which provided approximately 50% of our total revenue in 2012 and represent the main growth opportunity and the key focal point of our strategy, include our enterprise data, carrier data, fiber to the cell site (“FTTC”) and IP services product lines. These businesses, in the aggregate, also typically carry higher margins than many of our other product lines. A majority of our capital expenditures and the focus of our sales force have more recently been and will continue to be dedicated to expanding revenue and profit from our strategic data products. We believe that a balanced split between enterprise and carrier revenue results in the most effective capital allocation and resulting profitability.
2
The remaining 50% of our total revenue in 2012 was generated from legacy voice and access products. These businesses, in the aggregate, require limited incremental capital or personnel investment and deliver reasonably predictable cash flows. It is our belief that revenue from these legacy businesses, in the aggregate, will continue to decline at an annual rate of approximately 15%. This decline is the expected result of regulatory actions taken to reduce intra-state tariffs, access line loss resulting from residential wireless substitution, technology changes, the effect of current economic conditions on businesses and product replacement by competitive voice service offerings from cable operators in our markets. Despite the declining revenues, it is expected that the cash flows from these businesses will continue to be a significant contributor to funding the capital expenditures required for our higher growth and higher margin strategic data businesses.
Two key tenets of our growth initiatives for our strategic data products are “edge-out” and “on-net” strategies. Our “edge-out” strategy involves expanding our fiber assets into new contiguous markets. As we “edge-out” into new markets, we are able to bring new enterprise customers and carrier customers and cell sites into our fiber networks as “on-net” customers, meaning they are connected to our network and we eliminate the need to lease access lines from competitive carriers’ networks. We have determined that maintaining a ratio of 70% to 80% of our traffic as “on-net” is the most effective revenue mix for our Company. As we continue to expand our fiber assets, we are creating a footprint that reaches new customers and allows us to carry their traffic on our network. The “on-net” strategy utilizes a facilities-based approach in order to integrate as much traffic as possible through our network, thereby increasing leverage and profitability.
Our success-based capital investment strategy involves maximizing capital expenditure efficiency by pursuing “on-net” and “near-net” customer opportunities and maintaining a balanced mix of enterprise and carrier business. With this focus, we believe that we can achieve our capital efficiency goals in 2013 for capital projects, in the aggregate, of greater than 15% annual return on investment, greater than 15% internal rate of return, a less than 4-year payback and a capital expenditure to revenue ratio of three or less. In 2012, approximately 75% of our funds committed to capital projects were for success-based projects, defined by us as near-term revenue generating projects, which were evenly split between enterprise and carrier customers. Our goal is to achieve a similar ratio of success-based projects to total capital expenditures again in 2013.
Essential to our business strategy are our enterprise sales teams who sell networking and data solutions to over 1,500 major business customers in the region. In 2012, we revamped our go-to-market enterprise strategy to focus more on selling longer-term secure networking and data solutions. These customized solutions include metro Ethernet, voice over Internet Protocol (“VoIP”), cloud services, long haul transport and co-location services. We have refocused our efforts away from smaller single unit enterprises and residential customers in order to focus resources on medium and larger-sized enterprises, preferably with multiple locations in our market to leverage our product offering and network footprint. We also are focused on our key enterprise verticals, which include health care, education, financial services and government.
We provide transport services to seven larger telecommunications providers who operate in our markets and we also provide FTTC backhaul solutions to 370 wireless cell sites in our markets, where our wireless carrier customers are upgrading to offer 4G LTE services. We more than doubled our number of FTTC sites in 2012, as compared to 2011, and we expect this figure to grow in 2013.
Business Segments
During 2012, we had two reportable business segments, which conduct the following principal activities:
| | • | | Competitive – this segment encompasses all of our strategic data products and services, including enterprise data, FTTC, carrier data and VoIP services, which are marketed primarily to enterprise customers through our competitive local exchange carrier (“CLEC”) and Internet Service Provider (“ISP”) operation and carrier operations. Our CLEC also provides voice services and generates access revenue in our markets. Our Competitive business constitutes approximately 75% of our total revenue and requires the significant majority of our capital investments. |
| | • | | Rural Local Exchange Carrier (“RLEC”) – this segment represents the remaining 25% of our business and offers wireline communications services to residential and enterprise customers in the western Virginia cities of Waynesboro and Covington, and portions of Alleghany, Augusta and Botetourt counties. |
For detailed financial information about our business segments, see Note 4 in Part II, Item 8. Financial Statements and Supplementary Data of this Annual Report on Form 10-K and for a detailed review of our financial performance and results of operations by business segment, see Part II, Item 7. Managements’ Discussion and Analysis of Financial Condition and Results of Operations of this Annual Report on Form 10-K.
Competitive
The Competitive segment of our business currently serves customers primarily in Virginia and West Virginia, and portions of Pennsylvania, Maryland, Ohio and Kentucky. We market and sell strategic data, legacy voice and access products and services primarily to business and carrier customers. Our strategic data product lines represented approximately 65% of our total revenue within the Competitive segment, with the remaining portion comprised of revenue from legacy voice and access products. Strategic data products are growing at a pace that significantly exceeds our other product lines and typically provide a higher profit margin. The objective of our Competitive segment is to leverage the ever increasing data bandwidth demands for our enterprise and carrier customers in our addressable markets.
3
As of December 31, 2012, we had over 1,500 major business customers. Overall, we operated approximately 110,000 CLEC lines, of which approximately 96% are business lines, and had approximately 40,000 broadband network connections in service. Revenues from the Competitive segment accounted for approximately 76%, 75% and 61% of our total revenue for the years ended December 31, 2012, 2011 and 2010, respectively. Pro forma to include the FiberNet acquisition for the year ended December 31, 2010, the Competitive segment accounted for approximately 73% of our total revenue.
Our competitive operations are based upon both our “edge-out” and “on-net” strategies that seek to expand into new markets by maximizing the use of our fiber assets while optimizing capital efficiency and profitability. In 2012, we began to re-deploy capital and personnel resources away from our declining legacy product lines (both voice and access, within our competitive and RLEC segments) towards our growth businesses within our strategic data product line and we expect this trend to continue into the future. Our “on-net” strategy utilizes a facilities-based approach that requires disciplined use of capital expenditures on success-based projects to grow our fiber assets and reach an increasing number of both enterprise and carrier customers.
In addition to the higher margins that are characteristic of on-net expansion, we have also been able to deliver other enterprise services, such as metro Ethernet transport as a direct result of on-net connectivity growth. We believe our dedication to the facilities-based strategy, combined with our commitment to customer service, will continue to attract large customers in our key vertical markets.
Within our carrier data business, we offer access to our approximate 5,800 mile long-haul fiber network, which provides connectivity to regional cities, carrier switches and cell sites across the Mid-Atlantic region. We also offer wireless backhaul services using our FTTC sites located near our fiber network. During 2012, we installed 222 FTTC sites for a total of 370 as of December 31, 2012. We are targeting to end 2013 with 550-600 FTTC installations. Through interconnections with other regional fiber networks, we were able to extend our network within Virginia and Western Pennsylvania and south to areas in north central North Carolina.
We have also invested in fiber-to-the-home, which passed approximately 16,500 homes as of December 31, 2012. The fiber network provides the foundation for IP-based video services, currently up to 300 Mbps high speed Internet services and will allow us to offer future high-bandwidth applications as they evolve.
RLEC
Our incumbent local exchange carrier business is conducted through two subsidiaries that qualify as RLECs under the Telecommunications Act. These two RLECs provide wireline communications services to residential and enterprise customers in the western Virginia cities of Waynesboro and Covington, and portions of Alleghany, Augusta and Botetourt counties. As of December 31, 2012, we operated approximately 31,200 RLEC telephone access lines, 4,500 of which are fiber-fed and have IPTV-based video services and broadband Internet access with speeds up to 300 Mbps (approximately 27% penetration of homes passed). We have increased our capabilities with video services over copper that is being targeted for more of the legacy base and we believe this service, in addition to our DSL services, will provide additional revenue opportunities by leveraging our existing copper assets.
In 2010, we received a federal broadband stimulus award to bring broadband services and infrastructure to Alleghany County, Virginia. The total project in Alleghany is expected to cost $16 million, 50% ($8 million) of which is being funded by a grant from the federal government. The project is required to be completed by September 30, 2015. We also finished 2012 with over 98% broadband capability in our RLEC markets. During 2012, we experienced declines in our access revenue within our RLEC segment and anticipate continuing declines primarily resulting from regulatory actions taken by applicable regulatory authorities as described in the Regulation section below and also due to network grooming by carriers.
Products and Services
We provide the following data and broadband services to our enterprise and carrier customers within the Competitive segment:
| | |
Metro Ethernet | | • Ethernet connectivity among multiple locations in the same city or region over our fiber optic network |
| |
| | • Fiber to the cell sites (“FTTC”), used by wireless carriers as backhaul |
| |
| | • Speeds ranging from 1.5 Mbps to 10 Gbps |
4
| | |
| IP Services | | • IP-enabled product offerings that combine voice and data services over a dedicated broadband facility utilizing VoIP protocols • Allows customers to dynamically allocate bandwidth to maximize voice and data transmissions • Enables advanced features such as simultaneous ring, remote office, business continuity and fixed mobile convergence • Product offerings include Integrated Access, IP Centrex, and IP Trunking |
High-capacity Private Line Service and Wavelength Services | | • High-capacity, non-switched facilities provided to end users and carriers for voice and data applications. Wavelength technology is a means to efficiently utilize fiber in broadband applications and provide high-capacity bandwidth |
| |
High-Speed DSL Access | | • DSL technology that enables a customer to receive high-speed Internet access through a copper telephone line at speeds up to 6 Mbps |
| |
Broadband XL | | • High speed Internet access over fiber available in portions of our RLEC markets at speeds up to 300 Mbps |
| |
Video | | • IPTV-based video services with 300 channels, including 67 high definition, video-on-demand and DVR capability • Available in new subdivisions and overbuild areas within the RLEC and in one area in each of Lynchburg, Harrisonburg and Staunton, Virginia • Media Headend Powered by Microsoft Mediaroom IPTV platform |
In addition to our data services, we offer the following voice services to our Competitive and RLEC customers:
| | |
Voice Service | | • Business and residential telephone local and long distance service including calling features |
| |
Primary Rate ISDN Services | | • High capacity connections between customers’ private branch exchange, or PBX, equipment and public switched telephone network |
Sales, Marketing and Customer Care
Sales.We serve our enterprise and carrier customers in the competitive space with our suite of fiber-based strategic data products, which include metro Ethernet, multiprotocol label switching (MPLS) , VPN and dedicated Internet access. We have continued to see increased demand for these products across our customer base, particularly as demand for data and mobility services grow. The mission for our sales team is to capitalize on this growing demand by offering customized solutions to our enterprise and carrier customers. Increasingly, the training of our sales force has been focused on moving upstream within our key vertical markets, which include healthcare, education, financial services and government. During 2012, we refined our sales approach and increased the role of our technical team in order to focus on selling long-term secure networking and data solutions.
In 2012, we added experienced leaders to our sales teams and in 2013 we continue to look to add talent to our sales teams opportunistically. Our overall strategy of incrementally shifting resources from the declining legacy voice and access business into our strategic data business also extends to our sales and sales engineering teams. In 2012, we began upgrading our sales technology and deploying mobile devices and applications to key sales people and sales engineers. We believe that the initiative to place mobile sales tools in the sales force will improve sales productivity and enhance the customer experience. We use Salesforce.com to manage our opportunities within all of our sales channels, and additional applications are in development for 2013 to include video conferencing, mapping, and contract execution, all customized on the mobile devices.
In 2013, we intend to enter two new key markets in Virginia and Western Pennsylvania, both of which are contiguous to our current footprint. We are working aggressively to prepare for these two regional launches and expect to compete for market share in our key enterprise verticals and for FTTC installations.
Marketing.Our marketing team is primarily focused on our strategic data business. We have built mapping tools for our website to provide detailed insight into our network footprint. Prospective customers can now go online and pin point their location in proximity to our fiber by typing in an address. We have also recently expanded our marketing department. We believe these actions have significantly upgraded our ability to target customers in key verticals in both our existing and “edge-out” markets that will help drive growth in 2013 and beyond.
5
Customer Care.We have continued to refine our customer care teams in support of the multiple touch points for our customers. This includes moving personnel to operations functions in support of a new service delivery team. In 2012, we rolled out a comprehensive “Platinum Care” program to serve our top strategic data clients with an even greater level of customer service. We take a team approach in support of these key clients with a dedicated toll free contact number and assigned personnel by account.
Our Network
We have developed a robust, flexible network allowing us to deliver advanced data, broadband and voice services to enterprise, carrier and residential customers primarily in Virginia and West Virginia, and portions of Pennsylvania, Maryland, Ohio and Kentucky.
Our integrated fiber transport network allows us to offer a suite of advanced data and voice services, including, but not limited to, multi-site networking, dedicated Internet and MEF certified Ethernet solutions, high-speed Internet and VoIP services. These are delivered via a network foundation of Cisco optical dense wave division multiplexing (DWDM) long haul network communications equipment to deliver high speed wavelength services directly to end customers or as infrastructure for the MPLS Ethernet and high-speed Internet backbone. Network-to-network interconnection points allow us to engage carrier partners to provide end to end service for enterprise and carrier customers.
Our local networks consist of central office digital switches, routers, loop carriers and virtual and physical colocations interconnected primarily with fiber and copper facilities. A mix of fiber optic and copper facilities connect our customers with the core network.
Our network operations center provides technical surveillance of our network using IBM-based network management systems.
Our objective is to leverage and expand our fiber assets in order to capture the growing demand for data and mobility services in both our existing and contiguous markets.
Competition
Our Competitive operations compete primarily with incumbent local exchange carriers (“ILECs”), broadband service providers, incumbent cable operators, and to a lesser extent, other CLECs. We also face competition from potential future market entrants. In the last year, we have seen increasing competition from the cable operators and ILECs for metro-Ethernet services to mid-size businesses.To be competitive, we position our company as a customer-focused and leading edge provider with a full portfolio of broadband and IP-based services and the theme that “our technology comes with people.”
As a result of the rapid growth in broadband traffic, we expect that our competition will increase from market entrants offering FTTC, metro Ethernet solutions and other high-speed data services, including DSL, cable and wireless access. Our competition includes:
| | • | | ILECs, including AT&T, Verizon, Frontier, Windstream and CenturyLink; |
| | • | | national CLECs with extensive fiber assets, including Level 3, Zayo and Time Warner Telecom; and |
| | • | | national and regional cable operators, including Comcast, Shentel, Cox, Time Warner and Suddenlink. |
As the RLEC for Waynesboro, Clifton Forge and Covington and portions of Alleghany, Augusta and Botetourt Counties, Virginia, we have competition from cable companies and are subject to competition from wireless carriers. A portion of residential customers moving into our service area do not purchase landline phone service. Although no CLECs have entered our incumbent markets to compete with us, it is possible that one or more may enter our markets. VoIP based carriers like Vonage could take voice customers from our RLECs using existing broadband connections (such as DSL or cable modem connections). To minimize potential competition in the RLEC markets, we offer fiber-to-the-home, high speed DSL, video over copper and a variety of bundled services for broadband, voice and video.
Employees
As of December 31, 2012, we employed 593 full-time and nine part-time employees. Of these employees, 67 are covered by a collective bargaining agreement that expires June 30, 2014. We believe that we have good relations with our employees.
Access to Public Filings
We routinely post important information on our website atwww.lumosnetworks.com.Information contained on our website is not incorporated by reference into this annual report on Form 10-K. We provide public access to our annual reports on Form 10-K, quarterly reports on Form 10-Q, current reports on Form 8-K, and amendments to these reports filed with the U.S. Securities and Exchange Commission (“SEC”) under the Securities Exchange Act of 1934. These documents may be accessed free of charge on our website at the following address: http://ir.lumosnetworks.com. These reports are available as soon as reasonably practicable after we electronically file such material with, or furnish it to, the SEC.
6
Regulation
The following summary does not describe all present and proposed federal and state legislation and regulations affecting the telecommunications industry. Some legislation and regulations are currently the subject of judicial proceedings, legislative hearings and administrative proposals which could change the manner in which this industry operates. Neither the outcome of any of these developments, nor their potential impact on us, can be predicted at this time. Regulation can change rapidly in the telecommunications industry, and such changes may have an adverse effect on us in the future. See “Risk Factors” elsewhere in this report.
Regulation Overview
Our communications services are subject to varying degrees of federal, state and local regulation. Under the federal Communications Act, the Federal Communications Commission (“FCC”) has jurisdiction over interstate and international common carrier services. Under the Telecommunications Act of 1996, the FCC has jurisdiction over certain aspects of local interconnection terms and rates between carriers.
In addition to FCC regulation, our communications services are regulated to different degrees by state public service commissions and by local authorities. Such local authorities have jurisdiction over public rights-of-way and video and telecommunications franchises.
Our operations are subject to various federal and state laws intended to protect the privacy of customers who subscribe to our services. The FCC has regulations that place restrictions on the permissible uses that we can make of customer-specific information, known as Customer Proprietary Network Information (“CPNI”), received from subscribers and that govern procedures for release of such information and the Federal Trade Commission’s “Red Flag” rules require that companies develop and implement written Identity Theft Prevention programs.
Many of the services we offer are unregulated or subject only to minimal regulation. Internet services are not considered to be common carrier services, although the regulatory treatment of certain Internet services, including VoIP services, is evolving and still uncertain. To date, the FCC has, among other things, directed providers of certain VoIP services to offer E-911 emergency calling capabilities to their subscribers, applied the requirements of the Communications Assistance for Law Enforcement Act, or CALEA, to these VoIP providers, determined that the VoIP providers are subject to federal universal service assessments and must pay access charges at interstate rates. The FCC has preempted states from exercising entry and related economic regulation of nomadic VoIP providers but the FCC has not preempted state regulation of fixed VoIP service commonly offered by cable operators.
Federal Regulation of Interconnection and Interexchange Services
The Communications Act requires all common carriers to interconnect on a non-discriminatory basis with other carriers, imposes additional requirements on incumbent local exchange carriers (such as our RLEC’s), and imposes even more comprehensive requirements on the largest ILECs. The large ILECs are required to provide to our CLECs and other competitors physical collocation to allow competitors to place qualifying equipment in ILEC central offices; to unbundle some of their services into unbundled network elements (“UNE”) at “forward looking” rates, permit resale of some of their services, provide access to poles, ducts, conduits and rights-of-way, and to establish reciprocal compensation for the transport and termination of local traffic. In order to obtain access to an ILEC network, a CLEC must negotiate an interconnection agreement or “opt-in” to an existing interconnection agreement. These agreements cover, among other items, reciprocal compensation rates and required UNEs. If the parties cannot agree on the terms of an interconnection agreement, the matter is submitted to the applicable state public utility commission or to the FCC, as appropriate, for binding arbitration. The obligations of the large ILECs to provide these network facilities and services are in flux and could be further altered or removed by new legislation, regulations or court order.
ILEC operating entities that serve fewer than 50,000 lines are defined as “rural telephone companies” under the Communications Act and are exempt from the additional requirements applicable to the large ILECs unless and until such exemption is removed by the state regulatory body. Each of our RLEC operations is considered separately and each has this RLEC exemption.
Access Charges and Universal Service
Intercarrier compensation includes regulated interstate and intrastate access charges that we and other ILECs and CLECs receive from long distance carriers for the origination and termination of long distance calls and reciprocal compensation that interconnected local carriers pay to each other for terminating interconnected local and wireless calls.
The FCC has reformed and continues to reform the structure of the federal access charge system. On November 18, 2011, the FCC released a significant order on access reform and USF reform and carriers are in the process of implementing the order. In the order, the FCC adopted a uniform national bill-and-keep framework (in which carriers do not collect or pay access charges or reciprocal compensation) as the ultimate end state for all telecommunications traffic exchanged with any local exchange carrier. Price Cap carriers will be at bill-and-keep in eight years and Rate-of-Return carriers will be at bill-and-keep in 11 years. Multiple parties appealed the FCC’s order. Those appeals were consolidated at the 10th Circuit Court of Appeals and briefing is ongoing.
In the initial phase of the transition to bill-and-keep, intrastate end office switching rates for terminating traffic, carrier common line charges on terminating traffic, and certain intrastate, transport rates associated with terminating traffic are to be brought to interstate rates “within two steps
7
by July 2013.” The first of these two steps was effective on July 1, 2012 and intrastate access charge rates were reduced by approximately half of the difference between intrastate and interstate terminating access charge rates. The FCC has issued a further Notice of Proposed Rulemaking to seek comment on, among other things, the treatment/transition for originating access and for the transport elements not included in the initial order. The second step, in which these terminating intrastate access rates will be brought to the interstate levels, will be effective on July 1, 2013.
The FCC order permitted ILECs to implement a new charge on end users to partially offset the loss in access charge revenues, the Access Recovery Charge (“ARC”), effective July 1, 2012. The maximum ARC for residential customers will be $3 per month after six years. Multi-line business customers will have their Subscriber Line Charge and ARC combined capped at $12.20 per line. In addition, RLECs will be able to recover a portion of lost access revenues from a new Connect America Fund (“CAF”).
In the order, the FCC also established an annual cap on the “high cost” portion of USF of $4.5 billion per year in each of the next six years. This $4.5 billion will be the sole funding source for the existing support mechanisms (high-cost loop, switching support, safety net, etc.); and for the CAF. The FCC has designated approximately $2 billion of the $4.5 billion annually from this fund for RLECs through 2017. Our RLECs began receiving payments from the CAF effective July 1, 2012.
The order also affects our Competitive operations. Our CLECs reduced their terminating intrastate access rates effective July 1, 2012 and will reduce those rates to match interstate rates effective July 1, 2013. In addition, our legacy FiberNet operations in West Virginia have been designated as an Eligible Telecommunications Carrier and receives USF funding. USF funding for CLECs, including FiberNet, decreased on July 1, 2012 by 20% and will decrease by 20% annually until completely eliminated.
Net Neutrality.The FCC in 2005 adopted a policy statement expressing its view that consumers are entitled to access lawful Internet content and to run applications and use services of their choice, subject to the needs of law enforcement and reasonable network management techniques. Following up on the policy statement, in 2010 the FCC adopted “net neutrality” rules, which it summarized as follows:
| | • | | Transparency.Fixed and mobile broadband providers must disclose the network management practices, performance characteristics, and terms and conditions of their broadband services. |
| | • | | No blocking. Fixed broadband providers may not block lawful content, applications, services or non-harmful devices; mobile broadband providers may not block lawful websites, or block applications that compete with their voice or video telephony services; and |
| | • | | No unreasonable discrimination. Fixed broadband providers may not unreasonably discriminate in transmitting lawful network traffic. |
The FCC’s net neutrality rules are the subject of an appeal in the D.C. Circuit Court of Appeals.
State Regulation of RLEC, CLEC and Interexchange Services
Most states require wireline telecommunications providers to obtain authority from state regulatory commissions prior to offering common carrier services. State regulatory commissions generally regulate RLEC rates for intrastate services and RLECs must file tariffs setting forth the terms, conditions and prices for their intrastate services. Our RLECs are subject to regulation in Virginia by the State Corporation Commission (“SCC”). In addition, the SCC establishes service quality requirements applicable to RLECs, including ours, and resolves disputes involving intrastate communications services.
In its 2010 session, the Virginia General Assembly enacted legislation requiring all Virginia local exchange carriers to eliminate carrier common line charges from their interstate access charges. For our two ILECs, the SCC approved the schedule for reducing and eliminating these charges beginning on January 1, 2012 and completely eliminating carrier common line charges by January 1, 2015. Elimination of intrastate terminating carrier common line charges is also part of the FCC’s access reform plan.
In Virginia and West Virginia, CLECs’ intrastate switched access charges are capped at the higher of the CLEC’s interstate switched access charge or the intrastate switched access charge of the ILEC (or the average of all ILECs) providing service in the territory served by the CLEC. We are certificated as a CLEC in Virginia, West Virginia, Pennsylvania, Maryland, Ohio and Kentucky. Although we file tariffs covering our CLEC services, our rates for such CLEC services generally fluctuate based on market conditions.
Local Government Authorizations
Certain governmental authorities require permits to open streets for construction and/or telecommunications franchises to install or expand facilities. Video franchises are also required for our video services. We obtain such permits and franchises as required. We hold video franchises in the City of Waynesboro, Botetourt County, City of Lynchburg, City of Staunton (for the Gypsy Hill Development only), Alleghany County, City of Covington, Town of Clifton Forge, and Town of Iron Gate. All of these are located in Virginia.
Retransmission Consent. Local television stations may require that a video provider obtain “retransmission consent” for carriage of the station’s signal, which can enable a popular local television station to obtain concessions from video providers for the right to carry the station’s signal.
8
RISK FACTORS
The following risk factors and other information included in this Form 10-K should be carefully considered. The risks and uncertainties described below are not the only ones we face. Additional risks and uncertainties not presently known to us or that we currently deem immaterial also may adversely impact our business operations. Our business, financial condition or results of operations could be materially adversely affected by any or all of these risks.
Risks Relating to Our Business
The telecommunications industry is generally characterized by rapid development, introduction of new technologies, substantial regulatory changes and intense competition, any of which could cause us to suffer price reductions, customer losses, reduced operating margins and/or loss of market share.
The telecommunications industry has been, and we believe will continue to be, characterized by several trends, including the following:
| | • | | rapid development and introduction of new technologies and services, such as VoIP, high speed data services, or other technologies; |
| | • | | substantial regulatory change due to the continuing efforts of the FCC to reform intercarrier compensation, to modify USF availability, and to limit availability of UNEs used by CLECs under the Telecommunications Act of 1996; |
| | • | | increased competition within established markets from current and new market entrants that may provide competing or alternative services; |
| | • | | an increase in mergers and strategic alliances that allow one telecommunications provider to offer increased services or access wider geographic markets; and |
| | • | | the blurring of traditional dividing lines between, and the bundling of, different services, such as local telephone, long distance, wireless, video, data and Internet services. |
We expect competition to intensify as a result of new competitors and the development of new technologies, products and services. Some or all of these trends may cause us to have to spend significantly more in capital expenditures than we currently anticipate in order to keep existing and to attract new customers. Many of our voice and data competitors, such as cable providers, wireless service providers, Internet access providers and long distance carriers have brand recognition, a national presence and financial, personnel, marketing and other resources that are significantly greater than ours. In addition, due to consolidation and strategic alliances within the telecommunications industry, we cannot predict the number of competitors that will emerge. Such increased competition from existing and new entities could lead to price reductions, loss of customers, reduced operating margins and/or loss of market share.
As competition develops and technology evolves, federal and state regulation of the telecommunications industry continues to change rapidly. We anticipate that this state of regulatory flux will persist in the future, as the FCC and state regulators respond to competitive, technological, and legislative developments by modifying their existing regulations or adopting new ones.
The enactment of adverse regulation or regulatory requirements may slow our growth and have a material adverse effect upon our business, results of operations and financial condition. For a discussion of recent developments in this area, see the “Regulation” section above.
Adverse economic conditions may harm our business.
Economic conditions may not improve or may decline further for the foreseeable future. Unfavorable economic conditions, including the recession and disruptions to the credit and financial markets, could cause customers to slow or delay spending. If demand for our services decreases, our revenues would be adversely affected and churn may increase. In addition, during challenging economic times our customers may face issues gaining timely access to sufficient credit, which may impair the ability of our customers to pay for services they have purchased. Any of the above could have a material effect on our business, financial position, results of operations and cash flows.
We are also susceptible to risks associated with the potential financial instability of the vendors and third parties on which we rely to provide services or to which we outsource certain functions. The same economic conditions that may affect our customers could also adversely affect vendors and third parties and lead to significant increases in prices, reduction in quality or the bankruptcy of our vendors or third parties upon which we rely. Any interruption in the services provided by our vendors or by third parties could adversely affect our business, financial position, results of operations and cash flows.
9
We may not be able to successfully implement our strategy and thereby sustain our revenue and cash flow growth.
We must grow our business and revenue in order to generate sufficient cash flow to fund our operating requirements. We have pursued several growth initiatives including:
| | • | | Increasing network investments in our core markets; |
| | • | | Investing in network expansion into new adjacent geographic markets; |
| | • | | Building fiber to wireless carrier cell sites; and |
| | • | | Launching new products and services that meet customers’ data and IP needs. |
Our ability to manage this expansion depends on many factors, including our ability to:
| | • | | Attract new customers and sell additional services to existing customers by effectively implementing our sales and marketing plans; |
| | • | | Complete customer installations in a timely manner to meet customer demands; |
| | • | | Successfully train our sales force to adapt to evolutionary demand for advanced data service; |
| | • | | Efficiently manage our capital expansion plans; |
| | • | | Manage increased competition from other data service providers in existing and new markets; and |
| | • | | Remain competitive with customer pricing and service expectations. |
Any significant impairment of our goodwill or intangible assets would lead to a decrease in our assets and a reduction in net operating performance.
As of December 31, 2012, we had goodwill and other intangible assets of approximately $135.2 million (approximately 26% of total assets), which amount is reflective of a reduction of approximately $65 million in 2011 in connection with asset impairment charges totaling $86 million. If the impact or the timing of ongoing regulatory reform actions are significantly different than what we anticipate or if there are other regulatory or operating changes to our business, we may be forced to record an additional impairment charge, which would lead to a decrease in the company’s assets and reduction in net income. We test goodwill and other indefinite lived intangible assets for impairment annually or whenever events or changes in circumstances indicate an impairment may have occurred. If the testing performed indicates that impairment has occurred, we are required to record an impairment charge for the difference between the carrying value of the goodwill or indefinite lived intangible asset and the implied fair value of the asset in the period in which the determination is made. The testing of goodwill and indefinite lived intangible assets for impairment requires us to make significant estimates about our future performance and cash flows, as well as other assumptions. These estimates can be affected by numerous factors, including changes in economic, industry or market conditions, changes in underlying business operations, future reporting unit operating performance, existing or new product market acceptance, changes in competition or changes in technologies. Any changes in key assumptions, or actual performance compared with those assumptions, about our business and our future prospects or other assumptions could affect the fair value of one or more of the indefinite-lived intangible assets or of the reporting units, resulting in an additional impairment charge.
Our rural telephone company subsidiaries are subject to several regulatory regimes and consequently face substantial regulatory burdens and uncertainties.
The SCC imposes service quality obligations on our rural telephone company subsidiaries and requires us to adhere to prescribed service quality standards, but many of our competitors are not subject to these standards. These standards measure the performance of various aspects of our business. If we fail to meet these standards, the SCC may impose fines or penalties or take other actions that may impact our revenues or increase our costs. The FCC may also impose fines and forfeitures for failure to comply with FCC rules and requirements.
Many of our competitors are unregulated or less heavily regulated than we are. For example, VoIP technology is used to carry voice communications services over a broadband Internet connection. The FCC has ruled that VoIP services are jurisdictionally interstate and that some VoIP arrangements (those not using the Public Switched Telephone Network) are not subject to regulation as telephone services. In 2006, the FCC expanded the base of USF contributions by extending universal service contribution obligations to providers of VoIP service interconnected to the Public Switched Telephone Network. The United States Supreme Court upheld the FCC’s ruling that cable broadband Internet services are not subject to common carrier telecommunications regulation.
Regulatory developments at the FCC and the Virginia SCC will reduce revenues that our rural telephone company and Competitive subsidiaries receive from access charges.
For the years ended December 31, 2012 and 2011, approximately $30.0 million and $33.0 million, respectively, of our rural telephone company subsidiaries’ revenues came from access charges a portion of which were paid to us by long distance carriers for originating and terminating calls in the areas we serve. These revenues are highly profitable for us.
10
The FCC has reformed and continues to reform the structure of the federal access charge system. On November 18, 2011, the FCC released a significant order on access reform and USF reform and carriers are in the process of implementing that order. In the order, the FCC adopted a uniform national bill-and-keep framework (in which carriers do not collect or pay access charges or reciprocal compensation) as the ultimate end state for all telecommunications traffic exchanged with any local exchange carrier. Price Cap carriers will be at bill-and-keep in eight years and Rate-of-Return carriers will be at bill-and-keep in 11 years. Multiple parties appealed the FCC’s order. Those appeals were consolidated at the 10th Circuit Court of Appeals and briefing is ongoing.
In the initial phase of the transition to bill-and-keep, intrastate end office switching rates for terminating traffic, carrier common line charges on terminating traffic, and certain intrastate, transport rates associated with terminating traffic are to be brought to interstate rates “within two steps by July 2013.”
The FCC order permitted ILECs to implement a new charge on end users to partially offset the loss in access charge revenues, the Access Recovery Charge (“ARC”), effective July 1, 2012. The maximum ARC for residential customers will be $3 per month after six years. Multi-line business customers will have their Subscriber Line Charge and ARC combined capped at $12.20 per line.
The order also affects our Competitive operations. Our CLECs reduced their terminating intrastate access rates effective July 1, 2012 and will reduce those rates to match interstate rates effective July 1, 2013 In addition, our legacy FiberNet operations in West Virginia have been designated as an Eligible Telecommunications Carrier and receives USF funding. USF funding for CLECs, including Fibernet, decreased on July 1, 2012 by 20% and will decrease by 20% annually until eliminated.
Regulatory developments at the FCC will reduce revenues that our rural telephone company subsidiaries receive from the federal Universal Service Fund, the Connect America Fund or other fund allocations.
For the years ended December 31, 2012 and 2011, we received approximately $4.3 million and $5.0 million, respectively, in payments from the federal Universal Service Fund in connection with our rural telephone company subsidiaries’ operations. Additionally, for the years ended December 31, 2012 and 2011, we received approximately $2.3 million (net) and $2.6 million (net), respectively, from other National Exchange Carrier Association, or NECA, pool distributions to compensate us for a portion of our interstate costs.
Our RLECs are able to recover a portion of lost access revenues from a new Connect America Fund (“CAF”). In 2012, we received approximately $3.1 million from the CAF. Regulatory changes could impact the amount and timing of the revenues received from these funds in the future.
We have substantial indebtedness, which could restrict our ability to pay dividends and have a negative impact on our financing options and liquidity position.
In connection with the Business Separation, we borrowed $340 million under a senior secured credit facility with certain financial institutions and used the proceeds to fund a working capital cash reserve and to pay $315 million to NTELOS Inc., a subsidiary of NTELOS. Our indebtedness under this facility ($311.0 million at December 31, 2012) carries interest expense of approximately $12 million annually.
Our indebtedness could adversely affect our financial health and business and future operations by, among other things:
| | • | | making it more difficult for us to satisfy our obligations with respect to our indebtedness; |
| | • | | increasing our vulnerability to adverse economic and industry conditions by making it more difficult for us to react quickly to changing conditions; |
| | • | | limiting our ability to obtain any additional financing we may need to operate, develop and expand our business; |
| | • | | requiring us to dedicate a substantial portion of any cash flows from operations to service our debt, which reduces the funds available for operations and future business opportunities; |
| | • | | potentially making us more highly leveraged than our competitors, which could potentially decrease our ability to compete in our industry; |
| | • | | exposing us to risks inherent in interest rate fluctuations because some of our borrowings are at variable rates of interest, which could result in higher interest expense in the event of increases in interest rates; and |
| | • | | limiting our flexibility in planning for, or reacting to, changes in our business, and the industry in which we operate. |
The ability to make payments on our debt will depend upon our future operating performance, which is subject to general economic and competitive conditions and to financial, business and other factors, many of which we cannot control. If the cash flows from our subsidiaries’ operating activities are insufficient to service our debt obligations, we may take actions, such as delaying or reducing capital expenditures, reducing or eliminating our quarterly cash dividend, attempting to restructure or refinance our debt, selling assets or operations or seeking additional equity capital. Any or all of these actions may not be sufficient to allow us to service our debt obligations. Further, we may be unable to take any of these actions on satisfactory terms, in a timely manner or at all.
11
Our senior secured credit facility imposes operating and financial restrictions, which may prevent us from capitalizing on business opportunities and taking some corporate actions.
Our senior secured credit facility imposes operating and financial restrictions on our subsidiaries. These restrictions generally:
| | • | | restrict our subsidiaries’ ability to incur additional indebtedness; |
| | • | | restrict our subsidiaries from entering into transactions with affiliates; |
| | • | | restrict our subsidiaries’ ability to consolidate, merge or sell all or substantially all of their assets; |
| | • | | impose financial covenants relating to the business of our subsidiaries, including leverage and interest coverage ratios; |
| | • | | require our subsidiaries to use a portion of “excess cash flow” (as defined in the debt agreement) to repay indebtedness if our leverage ratio exceeds specified levels; |
| | • | | restrict our subsidiaries’ ability to pay dividends or make advances to us, which will restrict our ability to pay dividends; and |
| | • | | restrict our subsidiaries’ ability to agree to liens on assets or agreements (such as leases). |
We cannot assure you that those covenants will not adversely affect our ability to pay dividends or repurchase stock, finance our future operations or capital needs or pursue available business opportunities. A breach of any of these covenants could result in a default with respect to the senior secured credit facility. If a default occurs, our indebtedness under the senior secured credit facility could be declared immediately due and payable. As a result of general economic conditions, conditions in the lending markets, the results of our business or for any other reason, we may elect or be required to amend or refinance our indebtedness, at or prior to maturity, or enter into additional agreements for senior indebtedness.
If interest rates increase, our net income could be negatively affected.
Our substantial debt exposes us to adverse changes in interest rates. We cannot predict whether interest rates for long term debt will increase, and thus, we cannot assure you that our future interest expense will not have a material adverse effect on our business, financial condition, operating results and cash flows. We did enter into interest rate hedges on 50% of the facility through 2015 in order to mitigate this exposure.
Lumos Networks and other industry participants are frequently involved in disputes over issues that, if decided adversely to us, could harm our financial and operational prospects.
We anticipate that we will continue to be subject to risks associated with the resolution of various disputes, lawsuits, arbitrations and proceedings affecting our business. These issues include the administration and enforcement of existing interconnection agreements and tariffs, the terms of new interconnection agreements, operating performance obligations and intercarrier compensation. We also may be included in proceedings and arbitrations before state and regulatory commissions, private arbitration organizations, and courts over many issues that will be important to our financial and operation success. While we believe we have adequate reserves for current disputes, the results of these disputes are inherently unpredictable.
Our Competitive operations face substantial competition and uncertainty relating to their interconnection agreements with the ILEC networks and Pole Attachment Agreements with ILECs and with electric utilities in the markets we serve.
Our Competitive operations compete primarily with incumbent local exchange carriers, or ILECs, including Verizon, Frontier Communications Corporation (“Frontier”) and CenturyLink, and, to a lesser extent, CLECs, including Level 3, Zayo, Windstream and Comcast, Cox and other cable companies. We will continue to face competition from other current and future market entrants.
We have interconnection agreements with the ILEC networks covering each market in which our Competitive operations serve. Based on customer growth and our assessment of growth opportunities in these markets, we purchase wholesale voice lines, data circuits and access to collocation facilities under these agreements. From time to time, we are required to negotiate amendments to, extensions of, or replacements for these agreements. Additionally, we may be required to negotiate new interconnection agreements in order to enter new markets in the future. We may not be able to successfully negotiate amendments to existing agreements, negotiate new interconnection agreements, renew our existing interconnection agreements, opt in to new agreements or successfully arbitrate replacement agreements for interconnection on terms and conditions acceptable to us. Our inability to do so would adversely affect our existing operations and opportunities to expand our Competitive business in existing and new markets. If rates became unfavorable or we could no longer access collocation facilities, we could be forced to alter our service delivery which could reduce our customer base. As the FCC modifies, changes and implements rules related to unbundling of ILEC network elements and collocation of competitive facilities at ILEC central offices, we generally have to renegotiate our interconnection agreements to implement those new or modified rules.
Under federal law, our Competitive operations have a right to use the poles, ducts, and conduits of investor-owned utilities (electric and telephone) at regulated rates for our cables, including fiber optic facilities. Some of the poles we use are exempt from federal regulation because they are owned by utility cooperatives and municipal entities. If the rates, terms and conditions imposed by utilities are unreasonable, or if the utilities do not allow us access to the poles, ducts, and conduits in a timely manner, our business, financial results or financial condition could suffer.
12
Our competitors have substantial business advantages over our Competitive operations, and we may not be able to compete successfully.
Verizon and other large ILECs such as Frontier and CenturyLink dominate the current market for business and consumer telecommunications services. These companies represent the dominant competition in much of our target service areas, and we expect this competition to intensify. The large ILECs have established brand names, can diversify their risks across markets nationwide, possess sufficient capital to upgrade existing and deploy new equipment, own their telephone lines and can bundle digital data services with their existing analog voice services and other services, such as long-distance, wireless and video services, to achieve economies of scale in serving customers. Moreover, the large ILECs are aggressively implementing “win-back” programs to regain access line customers lost to competitors and use bundled services to assist in those programs. We pose a competitive risk to the large ILECs that serve our Competitive markets and, as both our competitors and our suppliers, they have little motivation to respond in a timely manner to our requests or to assist in the enhancement of the services we provide to our Competitive customers.
We face substantial competition in our Internet and data services business and face regulatory uncertainty, each of which may adversely affect our business and results of operations.
We currently offer our Internet and data services in rural markets and face competition from other Internet and data service providers, including cable companies. The Internet industry is characterized by the absence of significant barriers to entry and rapid growth in Internet usage among customers. As a result, we expect that our competition will increase from market entrants offering high-speed data services, including DSL, cable and wireless access. Our competition includes cable modem services offered by cable providers; ILECs, such as Verizon, Frontier and CenturyLink in our Competitive territories; and local, regional and national ISPs, both wireline and wireless, including Zayo and Windstream. In addition, wireless carriers are offering 3G and 4G services for internet access.
Many of our competitors have financial resources, corporate backing, customer bases, marketing programs and brand names that are greater than ours. Additionally, competitors may charge less than we do for Internet services, causing us to reduce, or preventing us from raising, our fees.
Our rural local telephone company subsidiaries face substantial competition from competitors that are less heavily regulated than we are, which could increase our expenses or force us to lower prices, causing our revenues and operating results to decline.
As the rural local telephone companies for the western Virginia cities of Waynesboro and Covington, and portions of Alleghany, Augusta and Botetourt Counties, Virginia, we currently compete with a number of different providers, many of which are unregulated or less heavily regulated than we are. Our rural telephone company subsidiaries qualify as rural local telephone companies under the Telecommunications Act and are, therefore, exempt from many of the most burdensome obligations of the Telecommunications Act, such as the obligation to sell unbundled elements of our network to our competitors at “forward-looking” prices that the Telecommunications Act places on larger carriers. Nevertheless, our rural telephone company subsidiaries face significant competition, particularly from competitors that do not need to rely on access to our network to reach their customers.
Wireless carriers, cable companies and other VoIP providers are able to compete with our rural telephone company subsidiaries even though the “rural exemption” under the Telecommunications Act is in place. If our rural exemption were removed, CLECs could more easily enter our rural telephone company subsidiaries’ markets. Moreover, the regulatory environment governing wireline local operations has been, and we believe will likely continue to be, very liberal in its approach to promoting competition and network access.
Consistent with the experience of other rural telephone companies, our rural telephone company subsidiaries have experienced a reduction in access lines caused by, among other things, wireless competition, cable competition and business customer migration from Centrex services to IP-based and other PBX services using fewer lines. As penetration rates of these technologies increase in our markets, our revenues could decline. Our rural telephone company subsidiaries experienced a net loss of approximately 2,000 access lines in the year ended December 31, 2012, or 6.0% of our access lines served at the end of 2011. A continued net loss of access lines would impact our revenues and operating results.
Our rights to the use of fiber that are part of our network may be affected by the ability to continue long term contracts and the financial stability of our Indefeasible Rights to Use fiber providers.
As of December 31, 2012, approximately 83% of our approximately 5,800 mile long-haul fiber network is under long term leases or Indefeasible Rights to Use, or IRU, agreements that provide us access to fiber owned by other network providers. These agreements are generally long term, with less than 2% of the IRUs expiring within the next five years and none expiring in 2013. In these agreements, the network owner is responsible for network maintenance for which we pay such network owners. If our network provider under IRU agreements has financial troubles, it could adversely affect our costs, especially maintenance costs and ability to deliver service. We could also incur material expenses if we were required to relocate to alternative network assets.
13
If we cannot obtain and maintain necessary rights-of-way for our network, our operations may be interrupted and we would likely face increased costs.
We need to obtain and maintain the necessary rights-of-way for our network from governmental and quasi-governmental entities and third parties, such as railroads, utilities, state highway authorities, local governments, transit authorities and private landowners. We may not be successful in obtaining and maintaining these rights-of-way or obtaining them on acceptable terms. Some agreements relating to rights-of-way may be short-term or revocable at will, and we cannot be certain that we will continue to have access to existing rights-of-way after the governing agreements are terminated or expire. If any of our right-of-way agreements were terminated or could not be renewed, we may be forced to remove our network facilities from the affected areas, relocate or abandon our networks. This would interrupt our operations and force us to find alternative rights-of-way and make unexpected capital expenditures. In addition, our failure to maintain the necessary rights-of-way, franchises, easements, licenses and permits may result in an event of default under our credit agreement and may subject us to legal complaints or claims.
Losses or a decrease in usage from certain key customers may result in lower revenues or higher expenses.
We generated approximately 10% and 9% of our operating revenue from Verizon in the years ended December 31, 2012 and 2011, respectively. In addition, we have substantial business relationships with several other telecommunications carriers. Carriers in the aggregate accounted for approximately 38% of our operating revenues for each of the years ended December 31, 2012 and 2011. If we were to lose Verizon or one of these other customers, our revenues would decline, which could have a material adverse effect on our business, financial condition and operating results.
We may require additional capital to respond to customer demand and to competition, and if we fail to raise the capital or fail to have continued access to the capital required to fund our strategic growth plan, we may experience a material adverse effect on our business.
We require additional capital to fund our strategic growth plans and for general working capital needs. Our aggregate capital expenditures for 2012 were approximately $60 million, approximately 75% of which were for success-based customer and network expansion and the remaining 25% was for infrastructure upgrades, network sustainment and internal IT projects. We estimate that our capital expenditures for 2013 will be approximately $65 million to approximately $70 million.
Because of our intensely competitive market, we may be required to expand the technical requirements of our network or to build out additional areas within our territories that could result in increased capital expenditures. Any such unplanned capital expenditures may adversely affect our business, financial condition and operating results. If we are unable to obtain additional needed financing, it may prohibit us from making these capital expenditures or making other investments in our business, which could materially and adversely affect our results of operations by limiting our growth potential.
We rely on a limited number of key suppliers and vendors for timely supply of equipment and services relating to our network infrastructure. If these suppliers or vendors experience problems or favor our competitors, we could fail to obtain sufficient quantities of the products and services we require to operate our businesses successfully.
We depend on a limited number of suppliers and vendors for equipment and services relating to our network infrastructure. If these suppliers experience interruptions or other problems delivering these network components on a timely basis, our subscriber growth and operating results could suffer significantly. Our initial choice of a network infrastructure supplier can, where proprietary technology of the supplier is an integral component of the network, cause us effectively to be locked into one or a few suppliers for key network components. As a result, we have become reliant upon a limited number of network equipment manufacturers, including Alcatel-Lucent, Cisco Systems, Inc. and others. If alternative suppliers and vendors become necessary, we may not be able to obtain satisfactory and timely replacement supplies on economically attractive terms, or at all.
A system failure could cause delays or interruptions of service, which could cause us to lose customers.
To be successful, we must provide our customers reliable network service. Some of the risks to our network and infrastructure include: physical damage to outside plant facilities; power surges or outages; software defects; human error; disruptions beyond our control, including disruptions caused by terrorist activities or severe weather; and failures in operational support systems.
Network disruptions cause interruptions in service and reduced capacity for customers, either of which cause us to incur additional expenses and may cause us to lose customers.
We are dependent on third-party vendors for our information and billing systems. Any significant disruption in our relationship with these vendors could increase our cost and affect our operating efficiencies.
Sophisticated information and billing systems are vital to our ability to monitor and control costs, bill customers, process customer orders, provide customer service and achieve operating efficiencies. We currently rely on internal systems and third-party vendors to provide all of our information and processing systems. Some of our billing, customer service and management information systems have been developed by third parties and may not perform as anticipated or the third parties may experience interruptions or other problems delivering these systems. In addition, our plans for developing and implementing our information and billing systems rely to some extent on the delivery of products and services by third-party vendors. Our right to use these systems is dependent upon license agreements with third-party vendors. Some of these agreements are cancelable
14
by the vendor, and the cancellation or nonrenewable nature of these agreements could impair our ability to process customer information and/or bill our customers. Since we rely on third-party vendors to provide some of these services, any switch in vendors could be costly and affect operating efficiencies.
The implementation of our business strategy is dependent upon our ability to maintain, expand and update our information technology infrastructure in response to growth and changing business needs.
Our business relies on our data, billing and other operational and financial reporting and business systems. To effectively implement our business strategy, we will need to continue to maintain and, in some cases, make upgrades to modernize our information technology systems and infrastructure, which can be costly. Our inability to maintain, expand or upgrade our technology infrastructure could have adverse consequences, which could include service or billing interruptions, the diversion of critical resources and inhibiting our growth plans due to an inability to scale effectively.
If we fail to extend or renegotiate our collective bargaining agreements with our labor union when they expire, or if our unionized employees were to engage in a strike or other work stoppage, our business and operating results could be materially harmed.
We are a party to collective bargaining agreements with our labor union, which represented 67 employees as of December 31, 2012. Although we believe that relations with our employees are satisfactory, no assurance can be given that we will be able to successfully extend or renegotiate our collective bargaining agreements when they expire. If we fail to extend or renegotiate our collective bargaining agreements, if disputes with our union arise, or if our unionized workers engage in a strike or a work stoppage, we could experience a significant disruption of operations or incur higher ongoing labor costs, either of which could have an adverse effect to the business. Our collective bargaining agreement expires June 30, 2014.
If or when we lose a member or members of our senior management, our business may be adversely affected.
The success of our business is largely dependent on our senior management team, as well as on our ability to attract and retain other highly qualified technical and management personnel, including talented sales personnel.
We believe that there is, and will continue to be, intense competition for qualified personnel in the telecommunications industry, and we cannot assure you that we will be able to attract and retain the personnel necessary for the development of our business. The unexpected loss of key personnel or the failure to attract additional personnel as required could have a material adverse effect on our business, financial condition and operating results.
Unauthorized use of, or interference with, our network could disrupt service and increase our costs.
We may incur costs associated with the unauthorized use of our network including administrative and capital costs associated with detecting, monitoring and reducing the incidence of fraud. Fraudulent use of our network may impact interconnection costs, capacity costs, administrative costs, fraud prevention costs and payments to other carriers for fraudulent use.
Security breaches related to our physical facilities, computer networks, and informational databases may cause harm to our business and reputation and result in a loss of customers.
Our physical facilities and information systems may be vulnerable to physical break-ins, computer viruses, theft, attacks by hackers, or similar disruptive problems. If hackers gain improper access to our databases, they may be able to steal, publish, delete or modify confidential personal information concerning our subscribers. In addition, misuse of our customer information could result in more substantial harms perpetrated by third parties. This could damage our business and reputation, and result in a loss of customers.
Our future financial performance may be worse than the performance reflected in our historical financial information included in this annual report on Form 10-K.
Some of the historical financial information we have included in this annual report on Form 10-K does not reflect what our results of operations, financial position and cash flows would have been had we been an independent company during the periods presented or may not be indicative of what our results of operations, financial position and cash flows may be in the future as an independent company. This is primarily a result of the following four factors:
| | • | | Prior to the Business Separation, our business was operated by NTELOS as part of its broader corporate organization, rather than as an independent company. NTELOS or one of its affiliates performed various corporate functions for us, including, but not limited to, tax administration, treasury activities, accounting, information technology services, human resources, legal, ethics and compliance program administration, investor relations, certain governance functions (including internal audit) and external financial reporting. Our historical and pro forma financial statements reflect allocations of corporate expenses from NTELOS for these and similar functions. These allocations may be more or less than the comparable expenses we would have incurred had we operated as an independent, publicly-traded company; |
| | • | | Some or our historical financial information does not reflect the increased level of debt and the related increase in interest expense that we incurred as part of the Business Separation; |
15
| | • | | Prior to the Business Separation, we shared economies of scope and scale in costs, employees, vendor relationships and customer relationships with the other businesses of NTELOS. The short-term transition agreements that govern certain relationships between us and NTELOS may not capture all the benefits our business enjoyed as a result of being integrated with the other businesses of NTELOS. The loss of some or all of these benefits could have an adverse effect on our business, results of operations and financial condition; and |
| | • | | Other significant changes in our cost structure, management, financing and business operations as a result of our operation as a company separate from NTELOS could impact our financial performance. |
| | • | | Many of the services that were previously covered in transition services and other agreements with NTELOS, which were negotiated in the context of our separation from NTELOS while we were still part of NTELOS and, accordingly, may not reflect terms that would have been reached between unaffiliated parties, are now being provided internally or by unaffiliated third-parties or will be in the future. We expect that, in some instances, we are incurring or will incur higher costs in the future to obtain such services previously provided under the agreements with NTELOS. The amount and timing of when we incur such additional expenses may increase the variability of our earnings and cash flows. If we are unable to lower other expenses or increase revenues, these additional expenses also will lower our earnings and our cash flows. |
For these reasons, our future financial performance may be worse than the performance implied by the historical financial information we have presented in this annual report on Form 10-K.
For additional information about the past financial performance of our business and the basis of the presentation of the historical combined financial statements, see “Selected Combined Financial Data,” “Management’s Discussion and Analysis of Financial Condition and Results of Operations,” and the historical consolidated financial statements and the accompanying notes included elsewhere in this Form 10-K.
We may be unable to achieve some or all of the benefits that we expect to achieve from our separation from NTELOS or our separation from NTELOS could adversely affect our business and profitability due to our loss of NTELOS’s brand and reputation.
As an independent, publicly-traded company, we believe that our business has already benefited from and will continue to benefit from, among other things, allowing us to pursue the business strategies that best suit our long-term interests, to more efficiently develop and finance expansion plans, to appeal to a different investor base, to create effective incentives for our management and employees that are more closely tied to our business performance and to effectively advocate with respect to regulatory matters without internal corporate conflict. However, as a separate company from NTELOS, we may be more susceptible to market fluctuation and other adverse events. In addition, we may not be able to achieve some or all of the benefits that we expect to achieve as an independent company in the time we expect, if at all. For example, it is possible that investors and securities analysts will not place a greater value on our business as an independent company than on our business as a part of NTELOS.
Furthermore, as a business unit of NTELOS, we previously marketed our products and services using the “NTELOS” brand name and logo, and we believe the association with NTELOS provided us with goodwill among our customers due to NTELOS’s regionally recognized brands and perceived high-quality products and services. We may not be able to achieve or maintain comparable name recognition or status under our new “Lumos” brand, which could adversely affect our ability to attract and retain customers, resulting in reduced sales and revenues.
If the Distribution does not qualify as a tax-free transaction, tax could be imposed on NTELOS and we may be required to indemnify NTELOS for such tax.
If the Distribution were not to be tax-free to NTELOS, NTELOS would be required to recognize gain in an amount up to the fair market value of our common stock that NTELOS distributed on the distribution date.
Furthermore, events subsequent to the Distribution could cause NTELOS to recognize gain on the Distribution. For example, under Code Section 355(e), even minimal acquisitions of either our equity securities or NTELOS’s equity securities that are deemed to be part of a plan or a series of related transactions that include the Distribution could cause NTELOS to recognize gain on the Distribution.
Under the tax matters agreement entered into between NTELOS and us, we are generally required to indemnify NTELOS against any tax resulting from the Distribution to the extent that such tax resulted from any of the following events (among others): (1) an acquisition of all or a portion of our stock or assets, whether by merger or otherwise, (2) any negotiations, understandings, agreements or arrangements with respect to transactions or events that cause the Distribution to be treated as part of a plan pursuant to which one or more persons acquire, directly or indirectly, stock representing a 50% or greater interest in Lumos Networks, (3) certain other actions or failures to act by us, or (4) any breach by us of certain of our representations or undertakings. Our indemnification obligations to NTELOS and its subsidiaries, officers and directors are not limited by any maximum amount.
16
We are agreeing to certain restrictions to preserve the tax-free treatment of the Distribution to NTELOS, which may reduce our strategic and operating flexibility.
To preserve the tax-free treatment to NTELOS of the Distribution, under the tax matters agreement that we entered into with NTELOS, we are prohibited from taking or failing to take any action that prevents the Distribution and related transactions from being tax-free. Further, for the two-year period following the Distribution, we may be prohibited, except in specified circumstances, from: entering into any transaction resulting in the acquisition of 40% or more of our stock or 60% or more of our assets, whether by merger or otherwise; merging, consolidating or liquidating; issuing equity securities beyond certain thresholds; repurchasing our common stock; and ceasing to actively conduct our wireline business.
These restrictions may limit our ability to pursue strategic transactions or engage in new business or other transactions that may maximize the value of our business.
The agreements that we entered into with NTELOS may involve, or may appear to involve, conflicts of interest.
In connection with the Business Separation, we entered into certain agreements with NTELOS to provide a framework for our initial relationship with NTELOS following the Business Separation. We negotiated these agreements with NTELOS while we were still a wholly owned subsidiary of NTELOS. Accordingly, our executive officers and some of our directors were employees, officers or directors of NTELOS or its subsidiaries at the time of the negotiations and, as such, had an obligation to serve the interests of NTELOS and its subsidiaries. As a result, they could be viewed as having had a conflict of interest.
Certain of our officers and directors may have actual or potential conflicts of interest because of their cross officerships, directorships and stock ownership with NTELOS.
We continue to have overlap in directors with NTELOS, which may lead to conflicting interests. James A. Hyde, the Chief Executive Officer and President of NTELOS, is serving on our board of directors and served as our Chief Executive Officer from November 1, 2011 through April 26, 2012. Our board of directors also includes representatives of Quadrangle Capital Partners LLP and certain of its affiliates (“Quadrangle”) who are members of the board of directors of NTELOS. Mr. Hyde and the members of our board of directors who overlap with NTELOS have fiduciary duties to both NTELOS’s and our stockholders. These individuals may have actual or apparent conflicts of interest with respect to matters involving or affecting each company. This arrangement may also subject us to regulation under state and federal affiliated interest’s regulatory requirements.
Because of their current or former positions with NTELOS, certain of our directors and executive officers may continue to own shares of NTELOS common stock and the individual holdings may be significant for some of these individuals compared to their total assets. This ownership may create, or, may create the appearance of, conflicts of interest when these directors and officers are faced with decisions that could have different implications for NTELOS and Lumos Networks.
For example, potential conflicts of interest could arise in connection with the resolution of any dispute that may arise between us and NTELOS regarding the terms of the agreements governing the Business Separation and the relationship thereafter between the companies. Potential conflicts of interest could also arise if we enter into additional commercial arrangements with NTELOS in the future.
In connection with our separation from NTELOS, NTELOS will indemnify us for certain liabilities and we will indemnify NTELOS for certain liabilities. If we are required to indemnify NTELOS, we may need to divert cash to meet those obligations and our financial position could be negatively impacted. In the case of NTELOS’s indemnity, there can be no assurance that the indemnity will be sufficient to insure us against the full amount of such liabilities, or as to NTELOS’s ability to satisfy its indemnification obligations in the future.
Pursuant to the separation and distribution agreement and certain other agreements with NTELOS, NTELOS agreed to indemnify us from certain liabilities, and we agreed to indemnify NTELOS for certain liabilities, in each case for uncapped amounts. Indemnities that we may be required to provide NTELOS are not subject to any cap, may be significant and could negatively impact our business, particularly indemnities relating to our actions that could impact the tax-free nature of the Distribution. Third-parties could also seek to hold us responsible for any of the liabilities that NTELOS has agreed to retain. Further, there can be no assurance that the indemnity from NTELOS will be sufficient to protect us against the full amount of such liabilities, or that NTELOS will be able to fully satisfy its indemnification obligations. Moreover, even if we ultimately succeed in recovering from NTELOS any amounts for which we are held liable, we may be temporarily required to bear these losses ourselves. Each of these risks could negatively affect our business, results of operations and financial condition.
The Quadrangle entities continue to have significant influence over our business and could delay, deter or prevent a change of control, change in management or business combination that may not be beneficial to our stockholders and as a result, may depress the market price of our stock.
As of December 31, 2012, Quadrangle beneficially owns approximately 26% of our outstanding common stock. Additionally, in accordance with a shareholders agreement between Quadrangle and us, three of the eight directors that will serve on our board of directors are representatives or designees of Quadrangle. By virtue of such stock ownership and representation on the board of directors, Quadrangle will have a significant influence over day-to-day corporate and management policies and all matters submitted to our stockholders, including the election of the directors,
17
and may exercise significant control over our business, policies and affairs. Quadrangle’s interests as a stockholder may not always coincide with the interests of other stockholders. Additionally, such concentration of voting power could have the effect of delaying, deterring or preventing a change of control, change in management or business combination that might otherwise be beneficial to our stockholders and as a result, may depress the market price of our stock.
Our stock price may decline due to the large number of shares eligible for future sale.
Sales of substantial amounts of our common stock, or the possibility of such sales, may adversely affect the market price of our common stock. These sales may also make it more difficult for us to raise capital through the issuance of equity securities at a time and at a price we deem appropriate.
In our shareholders agreement with Quadrangle, we have granted Quadrangle the right to require us to register their shares of our common stock, representing approximately 5.7 million shares of our common stock. Accordingly, the number of shares subject to registration rights is substantial and the sale of these shares and any other shares with tag-along registration rights may have a negative impact on the market price for our common stock.
Provisions in our charter documents and the General Corporation Law of Delaware could discourage potential acquisition proposals, could delay, deter or prevent a change in control and could limit the price certain investors might be willing to pay for our common stock.
Certain provisions of the General Corporation Law of Delaware, the state in which we are organized, and our certificate of incorporation and bylaws may inhibit a change of control not approved by our board of directors or changes in the composition of our board of directors, which could result in the entrenchment of current management. These provisions include:
| | • | | advance notice requirements for stockholder proposals and director nominations; |
| | • | | limitations on the ability of stockholders to amend, alter or repeal our bylaws; |
| | • | | limitations on the removal of directors; |
| | • | | the inability of the stockholders to act by written consent; and |
| | • | | the authority of the board of directors to issue, without stockholder approval, preferred stock with such terms as the board of directors may determine and additional shares of our common stock. |
A portion of our current investor base may be required to sell our stock.
A portion of our common stock is held by index funds tied to broad stock indices in which we are included as a component. If at any time we are not included as a component in those indices, the corresponding index funds will likely be required to sell their shares of our common stock and the price of our common stock could be depressed by those sales.
We may not be able to pay dividends on our common stock in the future.
We intend to pay regular quarterly dividends on our common stock. However, any decision to declare future dividends will be made at the discretion of the board of directors and will depend on, among other things, our results of operations, cash requirements, investment opportunities, financial condition, contractual restrictions, and other factors that our board of directors may deem relevant. We are a holding company that does not operate any business of our own. As a result, we are dependent on cash dividends and distributions and other transfers from our subsidiaries to make dividend payments to our stockholders. Amounts that can be made available to us to pay cash dividends or repurchase stock are permitted by our credit agreement within the parameters of a restricted payment basket.
Our certificate of incorporation designates the Court of Chancery of the State of Delaware as the sole and exclusive forum for certain litigation that may be initiated by our stockholders, which could limit our stockholders’ ability to obtain a favorable judicial forum for disputes with the Company.
Our certificate of incorporation provides that, unless we consent in writing to the selection of an alternative forum, the Court of Chancery of the State of Delaware shall be the sole and exclusive forum for (i) any derivative action or proceeding brought on our behalf, (ii) any action asserting a claim of breach of fiduciary duty owed by any of our directors, officers or other employees or our stockholders, (iii) any action asserting a claim arising pursuant to any provision of the DGCL or our certificate of incorporation or bylaws, or (iv) any action asserting a claim governed by the internal affairs doctrine. Our certificate of incorporation further provides that any person or entity purchasing or acquiring any interest in shares of our capital stock shall be deemed to have notice of and to have consented to the provisions described above. This forum selection provision in our certificate of incorporation may limit our stockholders’ ability to obtain a favorable judicial forum for disputes with the Company.
18
| Item 1B. | Unresolved Staff Comments. |
None.
We are headquartered in Waynesboro, Virginia and own offices and facilities in a number of locations within our operating markets. We believe that our current facilities are adequate to meet our needs in our existing markets for the foreseeable future. The table below provides the location, description and approximate square footage of our material owned properties.
| | | | | | |
Location | | Property Description | | Approximate Square
Footage | |
Harrisonburg, VA | | Competitive POP | | | 2,500 | |
Troutville, VA | | Switch and Video Headend Building | | | 11,400 | |
Clifton Forge, VA | | Switch Building | | | 12,000 | |
Covington, VA | | Service Center | | | 13,000 | |
Waynesboro, VA | | Service Center | | | 20,000 | |
Daleville, VA | | Regional Operations Center | | | 21,000 | |
Covington, VA | | Switch Building | | | 32,000 | |
Waynesboro, VA | | Corporate Headquarters | | | 30,000 | |
Waynesboro, VA | | Switch Building | | | 33,920 | |
Daleville, VA | | Service Center | | | 9,400 | |
We also lease the following material properties:
| | • | | Our Charleston, West Virginia regional operations center (wireline switching) under a sub-lease from NTELOS Inc. for approximately 3,200 square feet of this space; |
| | • | | Our Charleston, West Virginia switch building under a lease agreement by and between Nelson Trust and FiberNet, LLC dated April 19, 2005; and |
| | • | | Our Charleston, West Virginia office and switch building under a lease agreement by and between Williams Land Company and Mountaineer Telecommunications, LLC dated April 12, 2005. |
Effective December 31, 2012, we terminated our lease agreements with The Layman Family, LLC for the Daleville, VA facility that had previously been used as our customer care facility and with Williams Land Company for the Charleston, WV office building and consolidated these operations with our other nearby facilities.
| Item 3. | Legal Proceedings. |
We are involved in routine litigation in the ordinary course of our business, including litigation involving disputes relating to our billings to other carriers for access to our network (see Note 13 in Part II, Item 8. Financial Statements and Supplementary Data). We do not believe that any pending or threatened litigation of which we are aware will have a material adverse effect on our financial condition, results of operations or cash flows.
| Item 4. | Mine Safety Disclosures. |
Not applicable.
19
PART II
| Item 5. | Market for Registrant’s Common Equity, Related Stockholder Matters and Issuer Purchases of Equity Securities. |
Market Information
Our common stock is traded on the NASDAQ Global Market under the symbol “LMOS.” On March 1, 2013, the last reported sale price for our common stock was $11.31 per share.
Our common stock has been traded on the NASDAQ Global Market under the symbol “LMOS” since November 1, 2011. Prior to that time, there was no established public trading market for our common stock. The following table sets forth the high and low prices per share of our common stock and the cash dividends declared per common share for each of the quarters in 2012 and for the fourth quarter of 2011, which correspond to our quarterly fiscal periods for financial reporting purposes:
| | | | | | | | | | | | |
| | | Stock Price per Share | | | Cash
Dividends
Declared
per
Common
Share | |
| | | High | | | Low | | |
2012: | | | | | | | | | | | | |
First Quarter | | $ | 18.18 | | | $ | 10.13 | | | $ | 0.14 | |
Second Quarter | | | 10.76 | | | | 7.65 | | | | 0.14 | |
Third Quarter | | | 9.86 | | | | 7.50 | | | | 0.14 | |
Fourth Quarter | | | 10.54 | | | | 7.61 | | | | 0.14 | |
| | | |
2011: | | | | | | | | | | | | |
Fourth Quarter | | $ | 17.99 | | | $ | 11.70 | | | $ | 0.14 | |
Stock Performance Graph
The following indexed line graph indicates our total return to stockholders from our initial public offering on November 1, 2011 (the first day our Common Stock began trading on the NASDAQ Global Market) to December 31, 2012, as compared to the total return for the NASDAQ Composite Index and the NASDAQ Telecommunications Index for the same period. The calculations in the graph assume that $100 was invested on November 1, 2011 in our Common Stock and each index and also assume dividend reinvestment.
Cumulative Total Shareholder Return
Lumos Networks, NASDAQ Composite Index
and NASDAQ Telecommunications Index
(11/1/11 – 12/31/12)
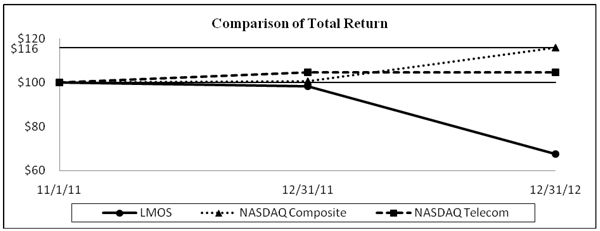
| | | | | | | | | | | | |
| | | November 1,
2011 | | | December 31,
2011 | | | December 31,
2012 | |
Lumos Networks Corp. | | $ | 100 | | | $ | 98 | | | $ | 67 | |
NASDAQ Composite Index | | $ | 100 | | | $ | 101 | | | $ | 116 | |
NASDAQ Telecommunications Index | | $ | 100 | | | $ | 105 | | | $ | 105 | |
20
Holders
There were approximately 3,300 holders of our common stock on March 1, 2013.
Dividends/Dividend Policy
We intend to continue to pay regular quarterly dividends on our common stock. Cash dividends of $0.14 per share were declared and paid for each of the four quarters in 2012. On February 27, 2013, our board of directors declared a dividend in the amount of $0.14 per share, which is to be paid on April 11, 2013 to stockholders of record on March 13, 2013. All decisions to declare dividends will be made at the discretion of the board of directors and will depend on, among other things, our results of operations, cash requirements, investment opportunities, financial condition, credit agreement and contractual restrictions and other factors that the board of directors may deem relevant. We are a holding company that does not operate any business of our own. As a result, we are dependent on cash dividends and distributions and other transfers from our subsidiaries to make dividend payments or to make other distributions to our stockholders. Amounts that can be made available to us to pay cash dividends will be permitted by our credit agreement within the parameters of a restricted payment basket.
Issuer Purchases of Equity Securities
The Company does not have a share repurchase program in effect. However, during the three months ended December 31, 2012, the Company repurchased 7,956 shares of Company stock for $0.1 million in connection with the vesting of certain restricted stock grants issued pursuant to the Company’s 2011 Equity and Cash Incentive Plan. The Company repurchased these shares from employee plan participants for settlement of tax withholding obligations.
The number of shares repurchased and the average price paid per share for each month in the three months ended December 31, 2012 are as follows:
| | | | | | | | | | | | | | | | |
Period | | (a)
Total Number of
Shares
Repurchased | | | (b)
Average Price Paid
per Share | | | (c)
Total Number of
Shares Repurchased
as Part of Publicly
Announced Plans or
Programs | | | (d)
Maximum Number
of Shares that May
Yet be Purchased
Under the Plans or
Programs | |
October 1, 2012 - October 31, 2012 | | | — | | | $ | — | | | | N/A | | | | N/A | |
November 1, 2012 - November 30, 2012 | | | — | | | $ | — | | | | N/A | | | | N/A | |
December 1, 2012 - December 31, 2012 | | | 7,956 | | | $ | 10.02 | | | | N/A | | | | N/A | |
| | | | | | | | | | | | | | | | |
| | | 7,956 | | | $ | 10.02 | | | | N/A | | | | | |
| | | | | | | | | | | | | | | | |
21
| Item 6. | Selected Financial Data |
SELECTED HISTORICAL FINANCIAL INFORMATION(6)
| | | | | | | | | | | | | | | | | | | | |
| | | Lumos Networks Corp.
Year Ended December 31, | |
(In thousands, except per share amounts) | | 2012 | | | 2011 | | | 2010 | | | 2009 | | | 2008 | |
Consolidated Statements of Operations Data: | | | | | | | | | | | | | | | | | | | | |
Operating Revenues | | $ | 206,871 | | | $ | 207,414 | | | $ | 145,964 | | | $ | 130,595 | | | $ | 128,806 | |
| | | | | |
Operating Expenses | | | | | | | | | | | | | | | | | | | | |
Cost of sales and services(1) (exclusive of items shown separately below) | | | 80,520 | | | | 78,484 | | | | 46,407 | | | | 40,158 | | | | 38,857 | |
Customer operations(1) | | | 21,886 | | | | 19,551 | | | | 13,243 | | | | 12,598 | | | | 13,112 | |
Corporate operations(1) (2) | | | 23,615 | | | | 16,251 | | | | 13,809 | | | | 8,582 | | | | 10,836 | |
Depreciation and amortization and accretion of asset retirement obligations | | | 39,008 | | | | 43,206 | | | | 31,376 | | | | 28,719 | | | | 27,033 | |
Asset impairment charges | | | — | | | | 86,295 | | | | — | | | | — | | | | — | |
Restructuring charges | | | 2,981 | | | | — | | | | — | | | | — | | | | — | |
Gain on settlements, net | | | (2,335 | ) | | | — | | | | — | | | | — | | | | — | |
| | | | | | | | | | | | | | | | | | | | |
| | | 165,675 | | | | 243,787 | | | | 104,835 | | | | 90,057 | | | | 89,838 | |
| | | | | | | | | | | | | | | | | | | | |
Operating Income (Loss) | | | 41,196 | | | | (36,373 | ) | | | 41,129 | | | | 40,538 | | | | 38,968 | |
| | | | | |
Other Income (Expense) | | | | | | | | | | | | | | | | | | | | |
Interest expense (3) | | | (11,921 | ) | | | (11,993 | ) | | | (5,752 | ) | | | (1,478 | ) | | | (1,393 | ) |
Loss on interest rate derivatives | | | (1,898 | ) | | | — | | | | — | | | | — | | | | — | |
Other income, net | | | 81 | | | | 105 | | | | 43 | | | | 105 | | | | 97 | |
| | | | | | | | | | | | | | | | | | | | |
| | | (13,738 | ) | | | (11,888 | ) | | | (5,709 | ) | | | (1,373 | ) | | | (1,296 | ) |
| | | | | | | | | | | | | | | | | | | | |
| | | 27,458 | | | | (48,261 | ) | | | 35,420 | | | | 39,165 | | | | 37,672 | |
Income Tax Expense (Benefit) | | | 11,010 | | | | (4,383 | ) | | | 14,477 | | | | 15,768 | | | | 14,887 | |
| | | | | | | | | | | | | | | | | | | | |
Net Income (Loss) | | | 16,448 | | | | (43,878 | ) | | | 20,943 | | | | 23,397 | | | | 22,785 | |
| | | | | |
Net Income Attributable to Noncontrolling Interests | | | (108 | ) | | | (52 | ) | | | (119 | ) | | | (39 | ) | | | (48 | ) |
| | | | | | | | | | | | | | | | | | | | |
Net Income (Loss) Attributable to Lumos Networks Corp. | | $ | 16,340 | | | $ | (43,930 | ) | | $ | 20,824 | | | $ | 23,358 | | | $ | 22,737 | |
| | | | | | | | | | | | | | | | | | | | |
| | | | | |
Basic and Diluted Earnings (Loss) per Common Share Attributable to Lumos Networks Corp. Stockholders (Pro Forma and Unaudited for 2011) | | | | | | | | | | | | | | | | | | | | |
Earnings (Loss) per Share - Basic(4) | | $ | 0.78 | | | $ | (2.11 | ) | | | | | | | | | | | | |
Earnings (Loss) per Share - Diluted(4) | | $ | 0.76 | | | $ | (2.11 | ) | | | | | | | | | | | | |
| | | | | |
Cash Dividends Declared per Share - Common Stock | | $ | 0.56 | | | $ | 0.14 | | | | | | | | | | | | | |
22
| | | | | | | | | | | | | | | | | | | | |
| | | As of December 31, | |
(In thousands) | | 2012 | | | 2011 | | | 2010 | | | 2009 | | | 2008 | |
Balance Sheet Data: | | | | | | | | | | | | | | | | | | | | |
Cash and cash equivalents | | $ | 2 | | | $ | 10,547 | | | $ | 489 | | | $ | 3 | | | $ | 3 | |
Property and equipment, net | | | 336,589 | | | | 299,958 | | | | 273,906 | | | | 203,239 | | | | 158,829 | |
Total assets | | | 513,162 | | | | 498,600 | | | | 540,793 | | | | 347,151 | | | | 350,299 | |
Total debt(5) | | | 312,225 | | | | 326,576 | | | | 180,721 | | | | 651 | | | | 546 | |
Stockholders’ equity attributable to Lumos Networks Corp. | | $ | 64,050 | | | $ | 52,383 | | | $ | 265,794 | | | $ | 272,681 | | | $ | 280,194 | |
| (1) | We record equity-based compensation expense related to our share-based awards. The following table shows the allocation of equity-based compensation expense to cost of sales and services, customer operations and corporate operations for the years ended December 31, 2012, 2011, 2010, 2009 and 2008. |
| | | | | | | | | | | | | | | | | | | | |
| | | Year Ended December 31, | |
(In thousands) | | 2012 | | | 2011 | | | 2010 | | | 2009 | | | 2008 | |
Cost of sales and services | | $ | 645 | | | $ | 314 | | | $ | 230 | | | $ | 148 | | | $ | 59 | |
Customer operations | | | 712 | | | | 419 | | | | 297 | | | | 143 | | | | 99 | |
Corporate operations | | | 2,555 | | | | 1,650 | | | | 1,002 | | | | 503 | | | | 423 | |
| | | | | | | | | | | | | | | | | | | | |
Equity-based compensation expense | | $ | 3,912 | | | $ | 2,383 | | | $ | 1,529 | | | $ | 794 | | | $ | 581 | |
| | | | | | | | | | | | | | | | | | | | |
| (2) | Corporate operations expense for 2010 includes $3.0 million of charges representing legal and professional fees related to the acquisition of FiberNet (Note 1 to our audited consolidated financial statements included herein). |
| (3) | Interest expense for 2012, 2011 and 2010 increased significantly from prior years as a result of the Allegheny asset acquisition on December 31, 2009 and the FiberNet purchase on December 1, 2010 (Note 1 to our audited consolidated financial statements included herein) which were financed by intercompany borrowings from NTELOS Inc., and as a result of the $340 million senior credit facility that was funded on October 31, 2011 (Note 5 to our audited consolidated financial statements included herein). |
| (4) | Basic loss per share for the year ended December 31, 2011 is computed by dividing net loss for the year by the weighted average number of common shares outstanding during the two month post-Business Separation period beginning November 1, 2011 and ending December 31, 2011. Diluted loss per share is calculated in a similar manner, but includes the dilutive effect of actual stock options and restricted shares outstanding as of December 31, 2011. Since these securities were anti-dilutive in 2011, they are excluded from the calculation of loss per share. Prior to the Business Separation, we did not have any common stock outstanding. |
| (5) | Of the total debt outstanding as of December 31, 2010, $178.6 million represented a long-term obligation to NTELOS Inc. This obligation was reflected as a long-term obligation as there was no current maturity. However, we settled this obligation with cash proceeds from a new long-term credit facility at the consummation of the Business Separation on October 31, 2011. The total debt outstanding as of December 31, 2011 includes $324.5 million from this credit facility (Note 5 to our audited consolidated financial statements included herein). |
| (6) | The financial statements of Lumos Networks for the period January 1, 2011 through October 31, 2011 and as of and for the years ended December 31, 2010, 2009 and 2008 have been adjusted to reflect certain corporate expenses, including equity-based compensation expense, of NTELOS which were not previously allocated to the NTELOS segments (see Note 3 to the audited consolidated financial statements included herein). These adjustments have been reflected beginning January 1, 2006. Equity attributable to Lumos Networks has not been adjusted to reflect these corporate expenses for periods prior to January 1, 2006. |
23
| Item 7. | Management’s Discussion and Analysis of Financial Condition and Results of Operations. |
You should read the following discussion of our financial condition in conjunction with our consolidated financial statements and the related notes included herein (Item 8). This discussion contains forward looking statements that involve risks and uncertainties. For additional information regarding some of these risks and uncertainties that affect our business and the industry in which we operate, please see “Risk Factors” and “Forward-Looking Statements” elsewhere in this report.
Overview
Lumos Networks is a fiber-based network service provider in the Mid-Atlantic region with a network of long-haul fiber, metro Ethernet and Ethernet rings located primarily in Virginia and West Virginia, and portions of Pennsylvania, Maryland, Ohio and Kentucky. We serve carrier, business and residential customers over our fiber network offering data, voice and IP services. Our principal products and services include metro Ethernet, which provides Ethernet connectivity among multiple locations in the same city or region over our fiber optic network, high-capacity private line and wavelength services, which provide a means to utilize fiber in broadband applications and provide high-capacity bandwidth, IP services and business and residential telephone local and long-distance services.
Our primary objective is to leverage our fiber assets to capture the continued rapid growth in demand for data and mobility services amongst our enterprise and carrier customers in the second and third-tier markets we serve. Central to our strategy is being first to the regional markets with advanced technology and products that are attractive to regional enterprise customers seeking high quality data and IP services and interconnection to data carriers in the region and to carriers with needs in our markets for transport and fiber to the cell site services.
Our overall strategy is to (i) maximize the value of our 5,800 mile long-haul fiber optic network to expand the sale of data and IP-services to new and existing enterprise and government customers while maintaining a ratio of approximately 70% to 80% on-net traffic; (ii) leverage our fiber network to expand to new fiber to the cell site opportunities; (iii) utilize our fiber footprint and carrier relationships to expand our revenue in transport; (iv) continue to provide high quality customer service and a compelling value proposition; (v) continue to shift incremental resources from the declining legacy voice products into our faster growing and more profitable strategic data products in the Competitive segment of our business; (vi) use our “edge-out” strategy to expand into new adjacent geographic markets to further leverage our fiber network and growing offering of data services; and (vii) use our success-based investment strategy to improve capital efficiency and expand margins.
Our strategic data products, which provided approximately 50% of our total revenue in 2012 and represent the main growth opportunity and the key focal point of our strategy, include our enterprise data, carrier data, fiber to the cell site (“FTTC”) and IP services product lines. These businesses, in the aggregate, also typically carry higher margins than many of our other product lines. A majority of our capital expenditures and the focus of our sales force have more recently been and will continue to be dedicated to expanding revenue and profit from our strategic data products. We believe that a balanced split between enterprise and carrier revenue results in the most effective capital allocation and resulting profitability.
The remaining 50% of our total revenue in 2012 was generated from legacy voice and access products. These businesses, in the aggregate, require limited incremental capital or personnel investment and deliver reasonably predictable cash flows. It is our belief that revenue from these legacy businesses, in the aggregate, will continue to decline at an annual rate of approximately 15%. This decline is the expected result of regulatory actions taken to reduce intra-state tariffs, access line loss resulting from residential wireless substitution, technology changes, the effect of current economic conditions on businesses and product replacement by competitive voice service offerings from cable operators in our markets. Despite the declining revenues, it is expected that the cash flows from these businesses will continue to be a significant contributor to funding the capital expenditures required for our higher growth and higher margin strategic data businesses.
Business Separation and Prior Acquisition
On October 14, 2011, NTELOS announced a distribution date of October 31, 2011 for the spin-off of all of the issued and outstanding shares of common stock of Lumos Networks, which operated NTELOS’s wireline operations. Prior to and in connection with the Business Separation, following the market close on October 31, 2011, NTELOS effectuated a 1-for-2 reverse stock split of its shares of common stock. The spin-off of Lumos Networks was in the form of a tax-free stock distribution to NTELOS’s stockholders of record as of the close of business on October 24, 2011, the record date. On October 31, 2011, NTELOS distributed one share of Lumos Networks common stock for every share of NTELOS common stock outstanding, on a post-Reverse Stock Split basis. We have been publicly traded on NASDAQ under the ticker symbol “LMOS” since November 1, 2011.
Financial data included in this Form 10-K reflects Lumos Networks as a standalone public company. Revenue includes services sold to the NTELOS wireless segment that was previously eliminated, which amounted to $6.6 million for the period January 1, 2011 through October 31, 2011 and $7.0 million for the year ended December 31, 2010. Expenses include items previously unallocated by NTELOS, inclusive of legal and professional fees, equity-based compensation expense and certain expenses related to acquisitions. These additional expenses for the period January 1, 2011 through October 31, 2011 totaled $2.6 million and for the year ended December 31, 2010 totaled $5.1 million (inclusive of $2.8 million of FiberNet acquisition costs).
24
On December 1, 2010, we closed on a purchase agreement with One Communications Corp. to acquire its FiberNet business for net cash consideration of approximately $163 million. The fiber optic network acquired in this transaction covers all of West Virginia and extends into surrounding areas in Ohio, Maryland, Pennsylvania, Virginia and Kentucky, and provided us with further diversity and density in several of our existing markets, particularly in West Virginia. The former FiberNet business offered retail voice and data services and transport and IP-based services primarily to regional retail and wholesale business customers.
Business Segments
During 2012, we had two reportable business segments: Competitive and RLEC.
Our Competitive business serves Virginia, West Virginia, and portions of Pennsylvania, Maryland, Kentucky and Ohio over an approximately 5,800 mile long haul fiber network as of December 31, 2012. Revenues from the Competitive segment accounted for approximately 76%, 74% and 61% of our total revenue for the years ended December 31, 2012, 2011 and 2010, respectively. Pro forma to include the FiberNet acquisition for the year ended December 31, 2010, the Competitive segment accounted for approximately 73% of our total revenue.
The Competitive segment derives revenue from three key product groups: strategic data, legacy voice and access. The products underlying strategic data are enterprise data, carrier data, fiber to the cell site and IP services. Strategic data products are sold primarily to enterprise customers and carrier customers and represent the main growth opportunity and the key focal point of our strategy. We market and sell these services primarily to business, government and carrier customers. Legacy voice and access revenues have and will continue to decline as a result of the continuing commoditization of legacy voice products, the increasing use of wireless devices and recent regulatory actions.
In 2012, we achieved sequential year-over-year revenue growth of 16.4% for our strategic data products, which represented approximately 50% of our total revenues for 2012. This growth was achieved primarily through increases in customer bandwidth demand, an approximate 14% increase in the number of on-net buildings and by more than doubling our fiber to the cell sites in 2012. We have added experienced sales resources to improve our market penetration and facilitate the sale of our data and IP-based services, including sales resources focused on obtaining long-term fiber to the cell site contracts with wireless carriers that are deploying 4G data services. These contracts will enable us to provide high speed transport from those sites to switching locations. We had fiber deployed to 148 towers at December 31, 2011 and we exited 2012 with fiber to 370 towers.
In addition to reallocating our sales resources to focus on growing data revenue by driving enterprise data and carrier data sales in our footprint, we also took certain cost reduction measures in 2012 intended to increase our ability to fund our capital investment in our data businesses. Specifically, in the fourth quarter of 2012, we completed a cost reduction plan that involved a reduction of approximately 10% of our workforce (primarily in our legacy businesses), consolidation of certain facilities and freezing the accumulation of benefits under certain postretirement plans. We incurred restructuring charges of $3.0 million in 2012 in connection with this plan, consisting of employee severance and termination benefits of $2.4 million and lease termination costs of $0.6 million (see Note 12 in Part II, Item 8. Financial Statements). We do not expect to incur additional costs in 2013 related to this plan.
The RLEC provides service to the rural Virginia cities of Waynesboro and Covington, and portions of Alleghany, Augusta and Botetourt counties. Within the RLEC footprint, we offer the same basic product sets as we do in the other markets. IP services are anchored by high speed broadband with 98% coverage and fiber-to-the-home, which passed approximately 16,500 homes as of December 31, 2012. The fiber network provides the foundation for IP-based video services, currently up to 20 Mbps high speed Internet services and will allow us to offer future high-bandwidth applications as they evolve. While the RLEC owns the fiber, the products are sold through the Competitive segment. The Competitive segment purchases basic fiber services from the RLEC but provides its own sales, customer service and customer equipment to these RLEC customers. The intercompany revenue is eliminated in our consolidated statements of operations. In addition to these wholesaling arrangements with the Competitive segment, for the year ended December 31, 2012, approximately $1.9 million of enterprise data services have been sold directly to RLEC customers which are currently included in legacy voice.
In the RLEC market, our fiber-to-the-home deployment reduces churn in the areas where it is offered. In 2010, we received a federal broadband stimulus award to bring broadband services and infrastructure to Alleghany County, Virginia. The total project is $16 million, of which 50% ($8 million) is being funded by the grant from the federal government. We commenced this project in 2010 and began offering higher speed broadband services in Alleghany County in the fourth quarter of 2010, and we have incurred $9.4 million of total project costs through December 31, 2012. The project is required to be completed by September 30, 2015.
As of December 31, 2012, we operated approximately 31,200 RLEC telephone access lines. We have experienced access line losses in each of the last three years due to cable competition, wireless substitution and the economic climate. We lost approximately 2,000 and 2,200 access lines during 2012 and 2011, respectively. These line losses, coupled with mid-year 2011 rate reductions as a result of our biennial tariff filing with the FCC for one of our RLECs, access reconfigurations and network grooming by carriers, contributed to a 4.1% and 9.2% decline in legacy voice and access revenues, respectively, in the RLEC segment, and a 7.3% decline in total RLEC revenues from 2011 to 2012.
We anticipate significant further access revenue declines in the RLEC segment as a result of recent actions taken by applicable regulatory authorities, principally the FCC and the SCC. On November 18, 2011, the FCC released an order comprehensively reforming its Universal Service
25
Fund and intercarrier compensation systems. In the order, the FCC determined that interstate and intrastate access charges, as well as local reciprocal compensation, should be eliminated entirely over time (seeAccess Charges and Universal Service in “Regulation”). These FCC pricing reductions commenced on July 1, 2012. However, a portion of the access revenue that we currently receive from carriers will be recovered through payments from the FCC’s newly created “Connect America Fund” (“CAF”) and from increases in charges to end user subscribers in the form of rate increases and the FCC’s newly created “Access Recovery Charge”. These new payments and revenues were also effective July 1, 2012. Access revenue also will continue to be negatively impacted by network grooming of carriers. Our combined RLEC revenues from access and the USF, including the CAF in 2012 (with the USF, the “cost recovery mechanisms”), was $30.0 million ($12.3 million of which was from intra-state access revenues and $5.9 million was from cost recovery mechanisms) for 2012 and $33.0 million ($18.7 million of which was from intra-state access revenues and $5.3 million was from cost recovery mechanisms) for 2011, as compared to access revenues of $36.8 million for 2010.
Excluding the impact of asset impairment charges of $86.3 million in 2011, our operating income margins were approximately 20%, 24% and 28% for the years ended December 31, 2012, 2011 and 2010, respectively. The decrease in the margin is primarily due to the RLEC access revenue reductions discussed above, combined with settlement of billing disputes and increased corporate expenses resulting from being an independent public company following the spin-off from NTELOS.
Market Risks
Many of the market risk factors described above which affected our results of operations in 2012 are expected to continue into 2013.
Operating Revenues
Our revenues are generated from the following categories:
| | • | | Competitive segment revenues, including revenues from three key product sets: strategic data, legacy voice and access. Strategic data includes the following products: enterprise data (dedicated internet, metro Ethernet, and private line), carrier data (transport and fiber to the cell site) and IP services (integrated access, DSL, broadband XL, and IP-based video). Legacy voice includes the following products: local lines, PRI, long distance and legacy dial-up Internet services. Access primarily includes switched access and reciprocal compensation. |
| | • | | RLEC segment revenues, including revenues from two key product sets: legacy voice (primarily local services and features, toll and directory advertising) and access. |
Operating Expenses
Our operating expenses are incurred from the following categories:
| | • | | cost of sales and services, including usage-based access charges, long distance and other direct costs incurred in accessing other telecommunications providers’ networks in order to provide telecommunication services to our end-user customers, leased facility expenses for connection to other carriers and engineering and repairs and maintenance expenses related to network property, plant and equipment; |
| | • | | customer operations expenses, including marketing, product management, product advertising, selling, billing, publication of regional telephone directories, customer care, directory services, customer retention and bad debt expenses; |
| | • | | corporate operations expenses, including taxes other than income, executive services, accounting, legal, purchasing, information technology, human resources and other general and administrative expenses, including earned bonuses and equity-based compensation expense related to stock and option instruments held by employees and non-employee directors, employee separation charges for certain former officers and amortization of actuarial losses related to retirement plans; |
| | • | | depreciation and amortization, including depreciable long-lived property, plant and equipment and amortization of intangible assets where applicable; |
| | • | | accretion of asset retirement obligations; |
| | • | | gain on settlements, net; and |
Adjusted EBITDA
Adjusted EBITDA, as defined by us, is net income (loss) attributable to Lumos Networks Corp. before interest, income taxes, depreciation and amortization, accretion of asset retirement obligations, net income attributable to noncontrolling interests, other income or expenses, equity based compensation charges, acquisition related charges, amortization of actuarial losses on retirement plans, employee separation charges, restructuring related charges, gain or loss on settlements and gain or loss on interest rate derivatives.
26
Adjusted EBITDA is a non-GAAP financial performance measure. It should not be considered in isolation, as an alternative to, or more meaningful than measures of financial performance determined in accordance with GAAP. Management believes that Adjusted EBITDA is a standard measure of operating performance and liquidity that is commonly reported in the telecommunications industry and provides relevant and useful information to investors for comparing performance period to period and for comparing financial performance of similar companies. Management utilizes Adjusted EBITDA internally to assess its ability to meet future capital expenditure and working capital requirements, to incur indebtedness if necessary, and to fund continued growth. Management also uses Adjusted EBITDA to evaluate the performance of its business for budget planning purposes and as factors in the Company’s employee compensation programs.
Note 4 – Disclosures About Segments of an Enterprise and Related Information, of the Notes to Consolidated Financial Statements provides a reconciliation of Adjusted EBITDA to Operating Income (Loss) for each of the Company’s reportable operating segments.
Other Income (Expenses)
Our other income (expenses) are generated (incurred) from interest expense on debt instruments and capital lease obligations, interest expense on accounts due to NTELOS (prior to the Business Separation), loss on interest rate derivatives and other income (expense), which includes interest income and fees, expenses related to our senior secured credit facility and, as appropriate, related charges or amortization of debt issuance fees.
Income Taxes
Our income tax expense and effective tax rate increases or decreases based upon changes in a number of factors, including our pre-tax income or loss, state minimum tax assessments and non-deductible expenses. Prior to the Business Separation, our income taxes were included in the NTELOS consolidated federal income tax return and certain unitary or consolidated state income tax returns of NTELOS. However, our income taxes were calculated and provided for on an “as if separate” tax return basis.
Noncontrolling Interests in Losses (Earnings) of Subsidiaries
We have an RLEC segment partnership with a 46.3% noncontrolling interest that owns certain signaling equipment and provides service to a number of small RLECs and to TNS (an inter-operability solution provider).
Results of Operations
Year ended December 31, 2012 compared to year ended December 31, 2011
Operating revenues decreased $0.5 million, or 0.3%, from 2011 to 2012 resulting from a decrease in RLEC segment revenues of $3.9 million, largely offset by an increase in Competitive revenues of $3.3 million. The increase in Competitive segment revenues was primarily driven by increased revenues from strategic data products, which increased $14.5 million, or 16.4%, from 2011 to 2012, offset by decreases in legacy voice and access revenue of $8.9 million and $2.2 million, respectively. The $3.9 million decline in RLEC segment revenues is due primarily to the loss of access lines described in the overview above, a biennial rate reduction as a result of our tariff filing with the FCC in mid-year 2011, reductions in intrastate access as part of the FCC’s access reform plan, access reconfigurations and network grooming by carriers. For further details regarding these revenue fluctuations, see “Operating Revenues” below.
Operating income increased $77.6 million from a loss of $36.4 million in 2011 to income of $41.2 million in 2012 due primarily to asset impairment charges of $86.3 million recorded in 2011. Excluding the 2011 asset impairment charges, operating income decreased $8.7 million from 2011 to 2012 due to increased operating expenses primarily due to increases in corporate expenses as a result of operating as an independent public company for the full year in 2012 combined with restructuring charges, employee separation charges and amortization of actuarial losses on benefit plans. Variances in the individual line items on the condensed combined statements of operations are described in the operating expenses section below.
Adjusted EBITDA was $88.9 million in 2012 compared with $96.9 million in 2011. The decrease in Adjusted EBITDA is directly attributable to the increase in operating expenses, as described above and in further detail below.
Net income attributable to Lumos Networks increased $60.3 million due in large part to the $86.3 million of asset impairment charges ($65.7 million net of tax) discussed above. Excluding the effects of the 2011 asset impairment charges, net income attributable to Lumos Networks decreased $5.5 million, or 25.2%, from 2011 to 2012 due to the $8.7 million decrease in operating income combined with a $1.9 million increase in interest and other expenses, offset by a reduction in income tax expense of $5.2 million.
27
OPERATING REVENUES
The following table identifies our external operating revenues by business segment for years ended December 31, 2012 and 2011:
| | | | | | | | | | | | | | | | |
| | | Year Ended
December 31, | | | | | | | |
(Dollars in thousands) | | 2012 | | | 2011 | | | $
Variance | | | %
Variance | |
Operating Revenues | | | | | | | | | | | | | | | | |
Competitive | | $ | 157,720 | | | $ | 154,397 | | | $ | 3,323 | | | | 2.2 | % |
RLEC | | | 49,151 | | | | 53,017 | | | | (3,866 | ) | | | (7.3 | )% |
| | | | | | | | | | | | | | | | |
Total Operating Revenues | | $ | 206,871 | | | $ | 207,414 | | | $ | (543 | ) | | | (0.3 | )% |
| | | | | | | | | | | | | | | | |
Revenues for 2012 decreased $0.5 million, or 0.3%, over 2011, as described by segment below.
| • | | Competitive Revenues. Competitive revenues increased $3.3 million, or 2.2%, from 2011 to 2012. This increase was driven by the $14.5 million increase in strategic data revenue as a result of increased revenue in all of the major product lines (enterprise data, carrier class data and IP services) due to increases in customer bandwidth demand, the number of on-net buildings and connections to wireless cell sites, offset by decreases of $8.9 million and $2.2 million in legacy voice and access revenues, respectively. |
| • | | RLEC Revenues. RLEC revenues decreased $3.9 million, or 7.3%, from 2011 to 2012 due to decreases of $0.8 million and $3.1 million in legacy voice and access revenues, respectively. |
The decrease in revenues from legacy voice and access products for both segments is partially attributable to access line loss. Access lines totaled approximately 31,200 as of December 31, 2012 and approximately 33,200 as of December 31, 2011, a 2,000 line decline. This access line loss is reflective of residential wireless substitution, the effect of current economic conditions on businesses and competitive voice service offerings from cable operators in our RLEC markets.
The following table identifies our external operating revenues grouped by major product families for the years ended December 31, 2012 and 2011:
| | | | | | | | | | | | | | | | |
| | | Year Ended | | | | | | | |
(Dollars in thousands) | | 2012 | | | 2011 | | | $
Variance | | | %
Variance | |
Operating Revenues | | | | | | | | | | | | | | | | |
Strategic Data: | | | | | | | | | | | | | | | | |
Enterprise data | | $ | 36,782 | | | $ | 33,131 | | | $ | 3,651 | | | | 11.0 | % |
Carrier data | | | 47,113 | | | | 37,649 | | | | 9,464 | | | | 25.1 | % |
IP Services | | | 18,743 | | | | 17,401 | | | | 1,342 | | | | 7.7 | % |
| | | | | | | | | | | | | | | | |
Total Strategic Data | | | 102,638 | | | | 88,181 | | | | 14,457 | | | | 16.4 | % |
Legacy Voice: | | | | | | | | | | | | | | | | |
Competitive | | | 45,466 | | | | 54,414 | | | | (8,948 | ) | | | (16.4 | )% |
RLEC | | | 19,223 | | | | 20,039 | | | | (816 | ) | | | (4.1 | )% |
| | | | | | | | | | | | | | | | |
Total Legacy Voice | | | 64,689 | | | | 74,453 | | | | (9,764 | ) | | | (13.1 | )% |
| | | | | | | | | | | | | | | | |
Access: | | | | | | | | | | | | | | | | |
Competitive | | | 9,616 | | | | 11,802 | | | | (2,186 | ) | | | (18.5 | )% |
RLEC | | | 29,928 | | | | 32,978 | | | | (3,050 | ) | | | (9.2 | )% |
| | | | | | | | | | | | | | | | |
Total Access | | | 39,544 | | | | 44,780 | | | | (5,236 | ) | | | (11.7 | )% |
| | | | | | | | | | | | | | | | |
Total Operating Revenues | | $ | 206,871 | | | $ | 207,414 | | | $ | (543 | ) | | | (0.3 | )% |
| | | | | | | | | | | | | | | | |
| | • | | Enterprise Data– The 11.0% increase noted in the table above was primarily driven by increased customer bandwidth demand and an increase in on-net buildings of 13.8% from 1,051 at December 31, 2011 to 1,196 at December 31, 2012. Revenue from our metro Ethernet product was the largest contributor, increasing $4.6 million. This was partially offset by declines in private line revenue which primarily relates to our designing metro Ethernet solutions to existing private line customers in situations where this is the optimal solution for our customer. |
| | • | | Carrier Data– The 25.1% increase in carrier data revenue was primarily attributable to (i) increases in transport revenues resulting from increases in traffic from existing customers and expansion of our network to reach new carrier customers and (ii) increases in FTTC revenue as a result of more than doubling our fiber connections to wireless cell sites, from 148 as of December 31, 2011 to 370 as of December 31, 2012, a large portion of which were connected late in the fourth quarter and therefore expected to contribute to revenue growth in the first quarter of 2013. |
| | • | | IP Services– The 7.7% increase in IP services revenue was primarily driven by increases in high speed fiber to the premises Internet and video services and other Voice over IP (“VoIP”) services partially offset by declines in the legacy DSL products. |
28
| • | | Legacy Voice.The 13.1% decline in legacy voice revenues was primarily due to the continuing churn from the commoditization of this product set, the increasing use of wireless devices and our shift in focus to VoIP (which is included in IP services revenue) and other strategic data products. |
| • | | Access.As noted in the overview section above, actions from regulatory authorities caused rate reductions beginning in July 2012 with further reductions occurring over the next few years, the effect of which is predicted to be more significant than experienced in prior years, particularly for the competitive access products. The 11.7% decrease in access revenues, as noted in the table above, is attributable to these factors coupled with other factors such as network grooming by carriers. |
OPERATING EXPENSES
The following table identifies our operating expenses by business segment, consistent with the table presenting operating revenues above, for the years ended December 31, 2012 and 2011:
| | | | | | | | | | | | | | | | |
| | | Year Ended | | | | | | | |
(Dollars in thousands) | | 2012 | | | 2011 | | | $
Variance | | | %
Variance | |
Operating Expenses | | | | | | | | | | | | | | | | |
Competitive | | $ | 100,002 | | | $ | 94,045 | | | $ | 5,957 | | | | 6.3 | % |
RLEC | | | 17,980 | | | | 16,429 | | | | 1,551 | | | | 9.4 | % |
| | | | | | | | | | | | | | | | |
Operating expenses, before depreciation and amortization and accretion of asset retirement obligations, asset impairment charges, equity-based compensation expense, acquisition related charges, Business Separation related charges, employee separation charges, restructuring charges, amortization of actuarial losses and gain on settlements, net | | | 117,982 | | | | 110,474 | | | | 7,508 | | | | 6.8 | % |
Depreciation and amortization and accretion of asset retirement obligations | | | 39,008 | | | | 43,206 | | | | (4,198 | ) | | | (9.7 | )% |
Asset impairment charges | | | — | | | | 86,295 | | | | (86,295 | ) | | | (100.0 | )% |
Equity-based compensation expense | | | 3,912 | | | | 2,383 | | | | 1,529 | | | | 64.2 | % |
Acquisition related charges | | | — | | | | 71 | | | | (71 | ) | | | (100.0 | )% |
Business Separation related charges | | | — | | | | 1,358 | | | | (1,358 | ) | | | (100.0 | )% |
Employee separation charges(1) | | | 2,346 | | | | — | | | | 2,346 | | | | 100.0 | % |
Restructuring charges (2) | | | 2,981 | | | | — | | | | 2,981 | | | | 100.0 | % |
Amortization of actuarial losses(3) | | | 1,781 | | | | — | | | | 1,781 | | | | 100.0 | % |
Gain on settlements, net(4) | | | (2,335 | ) | | | — | | | | (2,335 | ) | | | 100.0 | % |
| | | | | | | | | | | | | | | | |
Total Operating Expenses | | $ | 165,675 | | | $ | 243,787 | | | $ | (78,112 | ) | | | (32.0 | )% |
| | | | | | | | | | | | | | | | |
| (1) | In 2012, we recorded charges of $2.3 million related to the recognition of employee separation benefits which were provided for the in the employment agreements of two executive officers who left the Company in April and December 2012. These charges are included in corporate operations expense on the consolidated statement of operations. |
| (2) | In the fourth quarter of 2012, the Company completed a cost reduction plan involving an employee reduction-in-force, the consolidation of certain facilities and freezing of the accumulation of benefits under certain postretirement plans. Restructuring charges of $3.0 million were recognized in 2012 in connection with this plan (see Note 12 in Part II, Item 8. Financial Statements). |
| (3) | We received an allocated portion of the total benefits expenses from NTELOS Inc. for NTELOS’s pension and other postemployment retirement plans in which we participated during the periods prior to the Business Separation. The total allocated expense for the period January 1, 2011 through October 31, 2011 related to amortization of actuarial losses was not material. |
| (4) | We recognized a net pre-tax gain of approximately $2.3 million in 2012 in connection with the settlement of outstanding matters related to a prior acquisition and the settlement of an outstanding lawsuit (see Note 13 in Part II, Item 8. Financial Statements). |
29
The following describes our operating expenses by segment (as presented in the table above) and on a basis consistent with our presentation in the consolidated statement of operations.
| | • | | Competitive– The increase of $6.0 million was primarily driven by a $6.4 million increase in corporate and customer operations expenses which were allocated to the business segment (see discussion of customer operations expenses and corporate operations expenses below), as well as increases in other expenses such and repairs and maintenance and professional fees of $1.6 million and $0.6 million, respectively. Partially offsetting these net increases was a decrease in compensation and benefits for employees working directly for the Competitive segment of $0.5 million and an aggregate $2.1 million decrease in bad debt expense, rent expense and certain other direct operating costs such as access, contracted services and operating taxes. |
| | • | | RLEC– The increase of $1.6 million is attributable to generally the same factors as the Competitive segment ($2.0 million increase in corporate and customer operations expense allocations, partially offset by decreases in access costs, materials and supplies and other direct operating costs). |
COST OF SALES AND SERVICES – Cost of sales and services increased $2.0 million, or 2.6%, over 2011. The primary driver was increased repairs and maintenance costs of $1.9 million. Increases in contracted services and materials and supplies also contributed to the overall increase. These increases were partially offset by decreases in access costs and a net decrease in compensation and benefits and corporate expense allocations.
CUSTOMER OPERATIONS EXPENSES – Customer operations expenses increased $2.3 million, or 11.9%, over 2011 primarily due to increased compensation and benefits, including equity-based compensation expense and sales commissions. These increases were partially offset by a decrease in bad debt expense.
CORPORATE OPERATIONS EXPENSES – Corporate operations expense increased $7.4 million, or 45.3% over 2011 primarily as the result of increased corporate general and administrative costs from being an independent public company for the full year. Legal and professional fees, director fees, contracted services and insurance costs increased $3.8 million in the aggregate, primarily as a result of this. The increase in legal and professional fees is also due to legal services provided to settle several outstanding billing disputes during the year. The remainder of the increase is attributable to $2.3 million in employee separation charges and $1.8 million for amortization of actuarial losses on the pension and other postretirement benefit plans.
DEPRECIATION AND AMORTIZATION – Depreciation and amortization decreased $4.2 million, or 9.8%, over 2011. This decrease is attributable to a $4.2 million decrease in amortization expense related to customer intangibles for which amortization expense is escalated in the early years of the asset lives based on these assets’ estimated pattern of benefit.
ASSET IMPAIRMENT CHARGES – In 2011, we recorded asset impairment charges which totaled $86.3 million ($65.7 million after tax) in our RLEC segment related to the impairment of the RLEC franchise rights and goodwill ($65.4 million; $53.0 million after tax) and a $20.9 million ($12.7 million after tax) asset impairment charge related to the excess of carrying value over book value of the RLEC property, plant and equipment, customer intangible and trademarks. No asset impairment charges were recorded in 2012.
OTHER INCOME (EXPENSES)
Interest expense was $11.9 million for the year ended December 31, 2012, which was $0.1 million lower than our interest expense of $12.0 million for the year ended December 31, 2011. Interest expense for 2012 is primarily related to the $340 million credit facility drawn on October 31, 2011 a portion of which was used to pay off the obligation to NTELOS Inc. in connection with the Business Separation. Interest expense in 2011 is primarily related to interest charged by NTELOS for borrowings for the first ten months of the year and interest on the credit facility for the two-month period after the Business Separation. Under the terms of the credit facility we were required to enter into an interest rate hedge for three years on 50% of the term loans. In February 2012, we entered into a 3% interest rate cap for February 2012 through December 31, 2012 and a delayed interest rate swap agreement from December 31, 2012 through December 31, 2015. We recorded non-cash losses of $1.9 million associated with the mark-to-market accounting for these interest rate derivatives during the year ended December 31, 2012.
INCOME TAXES
Income tax expense (benefit) for the years ended December 31, 2012 and 2011 was $11.0 million and $(4.4) million, respectively, representing the statutory tax rate applied to pre-tax income and the effects of certain non-deductible charges. We expect our recurring non-deductible expenses to relate primarily to certain non-cash equity-based compensation. The non-deductible goodwill impairment charge in 2011 was the main driver for changes in income taxes from 2011 to 2012.
The Company has prior year unused net operating losses (“NOLs”) totaling $10.9 million as of December 31, 2012. The NOLs include $3.9 million that was assigned to the Company as a result of the Business Separation and are subject to an adjusted annual maximum limit due to the application of Section 382 of the Internal Revenue Code. The Company’s NOLs, if not utilized to reduce taxable income in future periods, will expire in varying amounts from 2023 through 2031. The Company believes that it is more likely than not that the results of future operations will generate sufficient taxable income to realize the deferred tax assets.
30
Year ended December 31, 2011 compared to year ended December 31, 2010
Operating revenues increased $61.5 million, or 42.1%, from 2010 to 2011 resulting from an increase in Competitive segment revenues of $65.9 million and partially offset by a decrease in RLEC revenues of $4.5 million. Pro forma to include FiberNet (which is included in the Competitive segment) for the year ended December 31, 2010, total operating revenues were $213.1 million, compared to $207.4 million for the year ended December 31, 2011, representing a decrease of $5.7 million.
Pro forma Competitive segment revenues decreased $0.8 million, or 0.5%, from 2010 to 2011 primarily from declines in voice and other products related to FiberNet operations, partially offset by increased revenues from enterprise data and carrier data services. As noted above, RLEC segment revenues declined $4.5 million from the prior year due primarily to the loss of access lines described in the overview above, a biennial reset (reduction) of our interstate access rates in the third quarter of 2011 and revenue reductions related to interexchange carrier network grooming.
Operating income decreased $77.5 million from income of $41.1 million in 2010 to a loss of $36.4 million in 2011 due primarily to $86.3 million of asset impairment charges recorded in 2011, as described in the overview section above. Excluding the 2011 asset impairment charges, operating income increased $8.8 million from 2010 to 2011 due to the $61.5 million increase in revenue discussed above, partially offset by an increase in operating expenses of $52.7 million. Operating expenses for 2011 include $58.9 million of operating expenses from FiberNet, while operating expenses for 2010 include $4.9 million of operating expenses from FiberNet, representing one month of expenses post-acquisition. Excluding the operating expenses from FiberNet and the aforementioned asset impairment charges, operating expenses were down 1.3% from 2010 to 2011. Variances in the individual line items on the condensed combined statements of operations are described in the operating expenses section below.
Adjusted EBITDA was $96.9 million in 2011 compared with $77.1 million in 2010. The increase in Adjusted EBITDA is attributable to the $61.5 million increase in revenues partially offset with a $41.6 million increase in operating expenses, as described in further detail below.
Net income attributable to Lumos Networks decreased $64.8 million due in large part to the $86.3 million of asset impairment charges ($65.7 million net of tax) discussed above. Excluding the effects of the 2011 asset impairment charges, net income attributable to Lumos Networks increased $0.9 million, or 4.5%, from 2010 to 2011 as the $8.8 million increase in operating income was primarily offset by (1) $6.2 million increase in interest expense related to the additional debt from NTELOS Inc. incurred in December 2010 to fund the FiberNet acquisition and interest related to our $340 million borrowing under our senior secured credit facility on October 31, 2011 in connection with the Business Separation (see Note 5 in Part II, Item 8. Financial Statements and Supplementary Data) and (2) $1.7 million increase in income tax expense.
OPERATING REVENUES
The following table identifies our external operating revenues by business segment for the years ended December 31, 2011 and 2010:
| | | | | | | | | | | | | | | | |
| | | Year Ended | | | | | | | |
(Dollars in thousands) | | 2011 | | | 2010 | | | $
Variance | | | %
Variance | |
Operating Revenues | | | | | | | | | | | | | | | | |
Competitive | | $ | 154,397 | | | $ | 88,471 | | | $ | 65,926 | | | | 74.5 | % |
RLEC | | | 53,017 | | | | 57,493 | | | | (4,476 | ) | | | (7.8 | )% |
| | | | | | | | | | | | | | | | |
Total Operating Revenues | | $ | 207,414 | | | $ | 145,964 | | | $ | 61,450 | | | | 42.1 | % |
| | | | | | | | | | | | | | | | |
Revenues for 2011 increased $61.5 million, or 42.1%, over 2010, with revenues from the Competitive segment increasing approximately 75% driven by the new revenues from FiberNet. Pro forma to include FiberNet for the year ended December 31, 2010, total revenues decreased by $5.6 million, or 2.6%, as described by segment below.
| • | | Competitive Revenues.Competitive revenues, pro forma to include FiberNet for year ended December 31, 2010, decreased $0.8 million, or 0.5%, from 2010 to 2011. This decrease was primarily due to a $7.5 million decline in voice and long distance revenues, principally associated with FiberNet, and a $2.6 million decline in other non-strategic revenues, including dial-up Internet and reciprocal compensation. These decreases were partially offset by increased revenues from Enterprise Data and Residential and Small Business Broadband services of $4.4 million over 2010 and a $4.9 million increase in wholesale revenues over 2010. |
| • | | RLEC Revenues.RLEC revenues decreased $4.8 million, or 8.4%, from 2010 to 2011 primarily due to decreased access and local service revenues resulting from a 6.3% decrease in access lines. Also contributing to the decrease was network grooming by our carrier customers with whom we interconnect and for whom we provide access services. Finally, on July 1, 2011, our interstate access rates were subject to a biennial reset (reduction), which resulted in a $1.2 million reduction in revenue during the second half of 2011. |
31
Access lines totaled approximately 33,200 as of December 31, 2011 and approximately 35,400 as of December 31, 2010, a 2,200 line decline. This access line loss is reflective of residential wireless substitution, the effect of current economic conditions on businesses and competitive voice service offerings from cable operators in our RLEC markets.
OPERATING EXPENSES
The following table identifies our operating expenses by business segment, consistent with the table presenting operating revenues above, for the years ended December 31, 2011 and 2010:
| | | | | | | | | | | | | | | | |
| | | Year Ended | | | | | | | |
(Dollars in thousands) | | 2011 | | | 2010 | | | $
Variance | | | %
Variance | |
Operating Expenses | | | | | | | | | | | | | | | | |
Competitive | | $ | 94,045 | | | $ | 51,155 | | | $ | 42,890 | | | | 83.8 | % |
RLEC | | | 16,429 | | | | 17,755 | | | | (1,326 | ) | | | (7.5 | )% |
| | | | | | | | | | | | | | | | |
Operating expenses, before depreciation and amortization and accretion of asset retirement obligations, asset impairment charges, equity-based compensation expense, acquisition related charges and Business Separation related charges | | | 110,474 | | | | 68,910 | | | | 41,564 | | | | 60.3 | % |
Depreciation and amortization and accretion of asset retirement obligations | | | 43,206 | | | | 31,376 | | | | 11,830 | | | | 37.7 | % |
Asset impairment charges | | | 86,295 | | | | — | | | | 86,295 | | | | 100.0 | % |
Equity-based compensation expense | | | 2,383 | | | | 1,529 | | | | 854 | | | | 55.9 | % |
Acquisition related charges | | | 71 | | | | 3,020 | | | | (2,949 | ) | | | (97.6 | )% |
Business Separation related charges | | | 1,358 | | | | — | | | | 1,358 | | | | 100.0 | % |
| | | | | | | | | | | | | | | | |
Total Operating Expenses | | $ | 243,787 | | | $ | 104,835 | | | $ | 138,952 | | | | 132.5 | % |
| | | | | | | | | | | | | | | | |
The following describes our operating expenses by segment and on a basis consistent with our financial statement presentation.
| | • | | Competitive– The increase noted in the table above was driven by a $42.7 million increase in expenses related to our FiberNet operations, which increase reflects the inclusion of FiberNet for the full twelve months of 2011 as opposed to one month in 2010 as a result of the acquisition of FiberNet in December 2010. |
| | • | | RLEC– The decrease of $1.3 million was driven primarily by a reduction in corporate expense allocations which have been shifted to the Competitive segment which is a reflection of the change in the relative sizes of the segments. |
COST OF SALES AND SERVICES – Cost of sales and services increased $32.1 million, or 69.1%, over 2010. FiberNet accounted for $31.5 million of this increase. Other expenses contributing to the net increase was access expense and compensation and benefits. We expect network expenses related to the original FiberNet customer base to decline due to churn of residential and other narrowband customers and as we groom this network by pruning leased facilities and by servicing more customers on our network to eliminate lease access expenses and improve the quality of the service.
CUSTOMER OPERATIONS EXPENSES – Customer operations expenses increased $6.3 million, or 47.6%, over 2010 primarily due to FiberNet. The remainder of the increase is primarily attributable to increased compensation and benefits, including equity-based compensation expense and sales commissions. These increases were partially offset by a decrease in directory expenses.
CORPORATE OPERATIONS EXPENSES – Corporate operations expense increased $2.4 million, or 17.7% over 2010. Included in this increase is an increase of $4.5 million in expenses related to FiberNet. Also included in the increase over 2010 are charges of $1.4 million incurred during 2011 related to the Business Separation, and increases in compensation and benefits, including equity-based compensation expense. Partially offsetting these increases was a decrease of $2.9 million from 2010 representing charges incurred during 2010 for the acquisition of FiberNet. Also decreasing from 2010 to 2011 were legal and professional fees allocated from NTELOS.
32
DEPRECIATION AND AMORTIZATION EXPENSES – Depreciation and amortization increased $11.7 million, or 37.4%, over 2010. This increase is primarily attributable to a $63.1 million increase in average depreciable assets (20%) due to the increase from the FiberNet acquisition and the $61.5 million of 2011 capital expenditures and a $6.8 million increase in amortization expense. The increases in amortization expense related to the addition of customer and other amortizable intangible assets from the FiberNet acquisition, a majority of the amortization expense for which is escalated in the early years of the asset lives based on these assets’ estimated pattern of benefit.
ASSET IMPAIRMENT CHARGES – In 2011, we recorded asset impairment charges which totaled $86.3 million ($65.7 million after tax) in its RLEC segment related to the impairment of the RLEC franchise rights and goodwill ($65.4 million; $53.0 million after tax) due to the aforementioned significant future access revenue decline related to interconnection carrier’s network grooming and the regulatory rate reform. Additionally, we recorded a $20.9 million ($12.7 million after tax) asset impairment charge related to the excess of carrying value over book value of the RLEC property, plant and equipment, customer intangible and trademarks on the date of the transfer.
OTHER INCOME (EXPENSES)
Interest expense for the years ended December 31, 2011 and 2010 was $12.0 million and $5.8 million, respectively, a $6.2 million, or 109%, increase. This increase was due primarily to the increase in the obligation to NTELOS Inc. on December 1, 2010 relating to the FiberNet acquisition and the $340 million new credit facility drawn on October 31, 2011, a portion of which was used to pay off the obligation to NTELOS Inc. in connection with the Business Separation.
INCOME TAXES
Income tax expense (benefit) for the years ended December 31, 2011 and 2010 was $(4.4) million and $14.5 million, respectively, representing the statutory tax rate applied to pre-tax income and the effects of certain non-deductible compensation.
33
Quarterly Results
The following table sets forth selected unaudited consolidated quarterly statement of operations data for each of the quarters in 2012 and 2011. This unaudited information has been prepared on substantially the same basis as our consolidated financial statements appearing elsewhere in this report and includes all adjustments (consisting of normal recurring adjustments) we believe necessary for a fair statement of the unaudited consolidated quarterly data. The unaudited consolidated quarterly statement of operations data should be read together with the consolidated financial statements and related notes thereto included elsewhere in this report. The results for any quarter are not necessarily indicative of results for any future period, and you should not rely on them as such.
| | | | | | | | | | | | | | | | | | | | | | | | | | | | | | | | |
Summary Operating Results (Unaudited) (In thousands, except per share amounts) | | December 31,
2012 | | | September 30,
2012 | | | June 30,
2012 | | | March 31,
2012 | | | December 31,
2011 | | | September 30,
2011 | | | June 30,
2011 | | | March 31,
2011 | |
Operating Revenues | | | | | | | | | | | | | | | | | | | | | | | | | | | | | | | | |
Competitive | | $ | 40,058 | | | $ | 39,778 | | | $ | 38,968 | | | $ | 38,916 | | | $ | 39,401 | | | $ | 38,494 | | | $ | 38,473 | | | $ | 38,389 | |
RLEC | | | 12,621 | | | | 12,199 | | | | 11,835 | | | | 12,496 | | | | 11,706 | | | | 13,107 | | | | 13,589 | | | | 14,255 | |
| | | | | | | | | | | | | | | | | | | | | | | | | | | | | | | | |
Total Operating Revenues | | | 52,679 | | | | 51,977 | | | | 50,803 | | | | 51,412 | | | | 51,107 | | | | 51,601 | | | | 52,062 | | | | 52,644 | |
| | | | | | | | |
Operating Expenses | | | | | | | | | | | | | | | | | | | | | | | | | | | | | | | | |
Competitive | | | 25,406 | | | | 25,338 | | | | 24,890 | | | | 24,368 | | | | 24,367 | | | | 22,764 | | | | 23,002 | | | | 23,912 | |
RLEC | | | 4,062 | | | | 4,358 | | | | 4,807 | | | | 4,753 | | | | 3,736 | | | | 4,190 | | | | 4,035 | | | | 4,468 | |
| | | | | | | | | | | | | | | | | | | | | | | | | | | | | | | | |
Operating expenses, before depreciation and amortization and accretion of asset retirement obligations, asset impairment charges, equity-based compensation expense, acquisition related charges, Business Separation related charges, employee separation charges, restructuring charges, amortization of actuarial losses, and gain on settlements, net | | | 29,468 | | | | 29,696 | | | | 29,697 | | | | 29,121 | | | | 28,103 | | | | 26,954 | | | | 27,037 | | | | 28,380 | |
Depreciation and amortization and accretion of asset retirement obligations | | | 11,242 | | | | 9,682 | | | | 8,834 | | | | 9,250 | | | | 10,217 | | | | 10,934 | | | | 11,025 | | | | 11,030 | |
Asset impairment charges | | | — | | | | — | | | | | | | | — | | | | 86,295 | | | | — | | | | — | | | | — | |
Equity-based compensation expense | | | 1,025 | | | | 1,099 | | | | 777 | | | | 1,011 | | | | 237 | | | | 784 | | | | 674 | | | | 688 | |
Acquisition related charges | | | — | | | | — | | | | — | | | | — | | | | 1 | | | | (10 | ) | | | 39 | | | | 41 | |
Business Separation related charges | | | — | | | | — | | | | — | | | | — | | | | 1,358 | | | | — | | | | — | | | | — | |
Employee separation charges | | | 271 | | | | 40 | | | | 2,035 | | | | — | | | | — | | | | — | | | | — | | | | — | |
Restructuring charges | | | 2,981 | | | | — | | | | — | | | | — | | | | — | | | | — | | | | — | | | | — | |
Amortization of actuarial losses | | | 445 | | | | 446 | | | | 445 | | | | 445 | | | | — | | | | — | | | | — | | | | — | |
Gain on settlements, net | | | — | | | | (2,335 | ) | | | — | | | | — | | | | — | | | | — | | | | — | | | | — | |
| | | | | | | | | | | | | | | | | | | | | | | | | | | | | | | | |
Total Operating Expenses | | | 45,432 | | | | 38,628 | | | | 41,788 | | | | 39,827 | | | | 126,211 | | | | 38,662 | | | | 38,775 | | | | 40,139 | |
| | | | | | | | | | | | | | | | | | | | | | | | | | | | | | | | |
| | | | | | | | |
Operating Income (Loss) | | | 7,247 | | | | 13,349 | | | | 9,015 | | | | 11,585 | | | | (75,104 | ) | | | 12,939 | | | | 13,287 | | | | 12,505 | |
| | | | | | | | |
Other Income (Expenses) | | | | | | | | | | | | | | | | | | | | | | | | | | | | | | | | |
Interest expense | | | (2,941 | ) | | | (3,064 | ) | | | (2,929 | ) | | | (2,987 | ) | | | (3,153 | ) | | | (2,559 | ) | | | (2,563 | ) | | | (3,718 | ) |
(Loss) gain on interest rate derivatives | | | (1,343 | ) | | | (263 | ) | | | (438 | ) | | | 146 | | | | — | | | | — | | | | — | | | | — | |
Other income (expense) | | | 26 | | | | 24 | | | | 23 | | | | 8 | | | | 32 | | | | 66 | | | | (7 | ) | | | 14 | |
| | | | | | | | | | | | | | | | | | | | | | | | | | | | | | | | |
Total Other Income (Expenses) | | | (4,258 | ) | | | (3,303 | ) | | | (3,344 | ) | | | (2,833 | ) | | | (3,121 | ) | | | (2,493 | ) | | | (2,570 | ) | | | (3,704 | ) |
| | | | | | | | | | | | | | | | | | | | | | | | | | | | | | | | |
| | | | | | | | |
Income (Loss) Before Income Taxes | | | 2,989 | | | | 10,046 | | | | 5,671 | | | | 8,752 | | | | (78,225 | ) | | | 10,446 | | | | 10,717 | | | | 8,801 | |
| | | | | | | | |
Income Tax Expense (Benefit) | | | 1,025 | | | | 3,589 | | | | 2,953 | | | | 3,443 | | | | (16,527 | ) | | | 4,249 | | | | 4,157 | | | | 3,738 | |
| | | | | | | | | | | | | | | | | | | | | | | | | | | | | | | | |
Net Income (Loss) | | | 1,964 | | | | 6,457 | | | | 2,718 | | | | 5,309 | | | | (61,698 | ) | | | 6,197 | | | | 6,560 | | | | 5,063 | |
Net (Income) Loss Attributable to Noncontrolling Interests | | | (28 | ) | | | (115 | ) | | | 57 | | | | (22 | ) | | | 35 | | | | (2 | ) | | | (37 | ) | | | (48 | ) |
| | | | | | | | | | | | | | | | | | | | | | | | | | | | | | | | |
Net Income (Loss) Attributable to Lumos Networks Corp. | | $ | 1,936 | | | $ | 6,342 | | | $ | 2,775 | | | $ | 5,287 | | | $ | (61,663 | ) | | $ | 6,195 | | | $ | 6,523 | | | $ | 5,015 | |
| | | | | | | | | | | | | | | | | | | | | | | | | | | | | | | | |
| | | | | | | | |
Basic and Diluted Earnings (Loss) per Common Share Attributable to Lumos Networks Corp. Stockholders (Pro Forma and Unaudited for 2011): | | | | | | | | | | | | | | | | | | | | | | | | | | | | | | | | |
| | | | | | | | |
Earnings (loss) per share - basic (1) | | $ | 0.09 | | | $ | 0.30 | | | $ | 0.13 | | | $ | 0.25 | | | $ | (2.96 | ) | | $ | 0.30 | | | $ | 0.31 | | | $ | 0.24 | |
Earnings (loss) per share - diluted(1) | | $ | 0.09 | | | $ | 0.30 | | | $ | 0.13 | | | $ | 0.25 | | | $ | (2.96 | ) | | $ | 0.30 | | | $ | 0.31 | | | $ | 0.24 | |
| | | | | | | | |
Weighted average shares outstanding - basic(1) | | | 21,047 | | | | 20,992 | | | | 20,942 | | | | 20,850 | | | | 20,815 | | | | 20,815 | | | | 20,815 | | | | 20,815 | |
Weighted average shares outstanding - diluted(1) | | | 21,517 | | | | 21,471 | | | | 21,398 | | | | 21,237 | | | | 20,815 | | | | 20,815 | | | | 20,815 | | | | 20,815 | |
| | | | | | | | |
Cash Dividends Declared per Share - Common Stock | | $ | 0.14 | | | $ | 0.14 | | | $ | 0.14 | | | $ | 0.14 | | | $ | 0.14 | | | $ | — | | | $ | — | | | $ | — | |
| (1) | Basic earnings (loss) per share for the quarter ended December 31, 2011 is computed by dividing net loss for the quarter by the weighted average number of common shares outstanding during the two month post-Business Separation period beginning November 1, 2011 and ending December 31, 2011. Diluted earnings (loss) per share is calculated in a similar manner, but includes the dilutive effect of actual stock options and restricted shares outstanding as of December 31, 2011. Since these securities are anti-dilutive, they are excluded from the calculation of earnings per share. Prior to the Business Separation, we did not have any common stock outstanding. |
34
Liquidity and Capital Resources
For the years ended December 31, 2012 and 2011, our working capital requirements, capital expenditures (excluding acquisitions) and cash dividends were funded by cash on hand and net cash provided from operating activities.
As of December 31, 2012, we had $394.8 million in aggregate long term liabilities, consisting of $304.3 million in borrowings under our Credit Facility ($311.0 million including the current portion) and $90.5 million in other long-term liabilities, inclusive of deferred income tax liabilities of $56.0 million, pension and other postretirement obligations of $30.4 million and other long-term liabilities of $4.1 million. Our credit agreement also includes a revolving credit facility of $60 million (the “Revolver”), approximately $56.5 million of which is available for our working capital requirements and other general corporate purposes as of December 31, 2012.
In addition to the Credit Facility, we have also entered into capital leases on vehicles and equipment with original lease terms of four to five years. In addition, we had $0.6 million of capital leases primarily on telephony equipment with the FiberNet acquisition, which were paid in full in the fourth quarter of 2012 in connection with a sale of the related assets. As of December 31, 2012, the total net present value of our future minimum lease payments is $1.2 million and the principal portion of these capital lease obligations is due as follows: $0.4 million in 2013, $0.3 million in 2014, $0.3 million in 2015, $0.2 million in 2016 and less than $0.1 million thereafter.
We have a maximum distributable amount under the terms of our credit agreement that can be used to make certain restricted payments including dividends. The distributable amount was initially set at $5 million on the date of funding and is increased every January 1st by the greater of $12 million or 75% of excess cash flow, as defined. Based on the excess cash flow calculation for the year ended December 31, 2012, the distributable amount was increased by $12 million on January 1, 2013. The distributable amount as of December 31, 2012 was $5.1 million.
Under the credit agreement governing the Credit Facility, we are also bound by certain financial covenants. Noncompliance with any one or more of the debt covenants may have an adverse effect on our financial condition or liquidity in the event such noncompliance cannot be cured or should we be unable to obtain a waiver from the lenders of the Credit Facility. As of December 31, 2012, we are in compliance with all of our debt covenants, and our ratios at December 31, 2012 are as follows:
| | | | |
| | | Actual | | Covenant Requirement at
December 31, 2012 |
Total debt outstanding to EBITDA (as defined in the credit agreement) | | 3.50 | | Not more than 4.00 |
Minimum interest coverage ratio | | 8.00 | | Not less than 3.25 |
During the year ended December 31, 2012, net cash provided by operating activities was $72.2 million. Net income during this period was $16.4 million which included $53.3 million of depreciation, amortization, deferred taxes and other non-cash charges (net). Total net changes in operating assets and liabilities provided $2.4 million. The principal changes in operating assets and liabilities from December 31, 2011 to December 31, 2012 were as follows: accounts receivable decreased $0.2 million; current assets increased $3.5 million; changes in income taxes provided $0.1 million; accounts payable and other current liabilities increased $5.6 million (primarily related to the $2.7 million of restructuring costs accrued at December 31, 2012 and increases in operating taxes of $1.2 million).
During the year ended December 31, 2011, net cash provided by operating activities was $82.9 million. Net loss during this period was $43.9 million which included $120.3 million of depreciation, amortization, asset impairment charges, deferred taxes and other non-cash charges (net). Total net changes in operating assets and liabilities provided $6.5 million. The principal changes in operating assets and liabilities from December 31, 2010 to December 31, 2011 were as follows: accounts receivable increased $2.1 million; current assets decreased $0.3 million; changes in income taxes provided $3.7 million; accounts payable and other current liabilities increased $5.0 million primarily related to the $3.0 million dividend that was payable as of December 31, 2011 and retirement benefit contributions and distributions totaled $0.5 million.
Our cash flows used in investing activities for the year ended December 31, 2012 were $56.3 million, of which approximately $59.9 million was used for the purchase of property and equipment, comprised of (i) $44.7 million for success-based customer and network expansion, (ii) $7.1 million for infrastructure upgrades and network sustainment, and (iii) $8.1 million for IT and facility related projects. Our net cash flows used in investing activities for the year ended December 31, 2012 also included proceeds on the sale of the assets of the former FiberNet managed services business of $0.8 million, $2.3 million received from Rural Utilities Service (“RUS”) for reimbursement of the grant portion of capital spent on the projects and the return of $2.3 million of the required pledged deposit, $1.4 million of capital spending on the RUS project for which RUS is obligated to reimburse us and $0.3 million used to purchase the Lumos Networks trade name (see Note 3 in Part II, Item 8. Financial Statements and Supplementary Data).
Our cash flows used in investing activities for the year ended December 31, 2011 were $62.8 million, of which approximately $61.5 million was used for the purchase of property and equipment comprised of (i) $18.9 million for the FiberNet network infrastructure and integration, (ii) $22.3 million for success-based customer and network expansion, (iii) $14.3 million for infrastructure upgrades and network sustainment, (iv) $3.7 million for expansion and upgrades related to the RUS grant, and (v) $2.3 million for IT and facilities renovations associated with the Business Separation. Our cash flows used in investing activities for the year ended
35
December 31, 2011 also included $1.0 million received from Rural Utilities Service (“RUS”) for reimbursement of the grant portion of capital spent on the projects and the return of a portion of the required pledged deposit and $2.2 million of capital spending on the RUS project for which RUS is obligated to reimburse us.
We currently expect capital expenditures for 2013 to be in the range of $65 million to $70 million. These capital expenditures will be targeted to leverage our extensive investment in our fiber network backbone and fiber rings with enterprise customer fiber builds, fiber to the cell site deployments and other wholesale revenue opportunities with attractive return on investment profiles. Additionally, we will provide normal network facility upgrades for our RLEC and Competitive operations, and fund fiber deployment in the RLEC territory related to an infrastructure upgrade to offer, among other services, continued deployment of fiber-to-the-home and growth in IPTV-based video subscribers and revenues. A portion of our capital expenditures for 2013 are also expected to be devoted to internal business system upgrades and enhancements.
Net cash used in financing activities for the year ended December 31, 2012 aggregated $26.4 million, which primarily represents the following:
| | • | | $11.5 million of repayments (net) under the revolving credit facility; |
| | • | | $2.0 million repayments on our Credit Facility; |
| | • | | $12.0 million used to pay cash dividends on our common stock; |
| | • | | $1.5 million payments under capital lease obligations; and |
| | • | | $0.6 million provided by other financing activities. |
Net cash used in financing activities for the year ended December 31, 2011 aggregated $10.1 million, which primarily represents the following:
| | • | | $340.0 million of proceeds from issuance of long-term debt; |
| | • | | $315.0 million paid to NTELOS Inc. associated with the Business Separation; |
| | • | | $14.4 million net repayments to NTELOS Inc. prior to the Business Separation; |
| | • | | $4.9 million used to pay debt issuance costs; |
| | • | | $15.5 million repayments on our Credit Facility; and |
| | • | | $0.3 million payments under capital lease obligations and $0.1 million of other financing activities. |
As of December 31, 2012, we had approximately $5.3 million in cash and restricted cash and negative working capital (current assets minus current liabilities) of approximately $17.3 million. All of the cash on hand at December 31, 2012 represents previously mentioned pledge deposits for our RUS grant. We have a swingline arrangement with our primary commercial bank which is part of the total $60 million revolving credit facility. This facility is automatically drawn on or paid down based on cash inflows and outflows from our master cash account which serves to minimize the cost of capital.
Our RLEC paid dividends of $14.1 million to NTELOS Inc., a subsidiary of NTELOS, in the year ended December 31, 2011 in accordance with the requirements of NTELOS Inc.’s senior secured credit facility. After the Business Separation, the RLEC is no longer a subsidiary of NTELOS Communications Inc. and began paying intercompany dividends to us in accordance with the Credit Facility. The RLEC paid $19.4 million of dividends to us during the year ended December 31, 2012, all of which were eliminated in consolidation.
As discussed previously in Regulation and this Management’s Discussion and Analysis, certain events and actions taken by the FCC and telecommunication carriers that we interconnect with are projected to have a significant negative impact on our future cash flows from the RLEC segment. However, we believe that the growth of our cash flows in the Competitive segment will offset the decline in the RLEC cash flows over time. With our focus on strategic data products, which comprised 65% of our Competitive segment revenues and 50% of total revenues for 2012, we expect to achieve year-over-year revenue growth in 2013, which will, in turn, contribute to our overall cash flow growth.
We expect that our cash flows from operations coupled with cash available from the Revolver are sufficient to satisfy our foreseeable working capital requirements, capital expenditures, dividend payments and debt service requirements for the next 12 months. However, if we determine to increase the level of success-based capital expenditures in support of enterprise and carrier data revenue growth, we will increase borrowings against our Revolver by more than originally anticipated and could seek additional financing. We may explore financing options in 2013. We cannot be sure that we can obtain additional financing on favorable terms, if at all. Additional equity financing may dilute our stockholders, and debt financing, if available, may restrict our ability to declare and pay dividends and raise future capital. If we are unable to obtain additional needed financing, it may prohibit us from making these capital expenditures or making other investments in our business, which could materially and adversely affect our results of operations by limiting our growth potential.
36
On February 23, 2012, our Board of Directors declared a quarterly cash dividend on our common stock in the amount of $0.14 per share, which was paid on April 12, 2012 to stockholders of record on March 14, 2012 and totaled $3.0 million. On April 26, 2012, our board of directors declared a quarterly dividend on our common stock in the amount of $0.14 per share, which was paid on July 12, 2012 to stockholders of record on June 14, 2012 and totaled $3.0 million. On August 2, 2012, our Board of Directors declared a quarterly dividend on our common stock in the amount of $0.14 per share, which was paid on October 12, 2012 to stockholders of record on September 14, 2012 and totaled $3.0 million. On November 1, 2012, our Board of Directors declared a quarterly dividend on our common stock in the amount of $0.14 per share, which was paid on January 11, 2013 to stockholders of record on December 14, 2012 and totaled $3.0 million. On February 27, 2013, our Board of Directors declared a quarterly cash dividend on our common stock in the amount of $0.14 per share, to be paid on April 11, 2013.
Under the tax matters agreement entered into between us and NTELOS, we are generally required to indemnify NTELOS against any tax resulting from the Distribution to the extent that such tax resulted from any of the following events (among others): (1) an acquisition of all or a portion of our stock or assets, whether by merger or otherwise, (2) any negotiations, understandings, agreements or arrangements with respect to transactions or events that cause the Distribution to be treated as part of a plan pursuant to which one or more persons acquire, directly or indirectly, stock representing a 50% or greater interest in Lumos Networks, (3) certain other actions or failures to act by us, or (4) any breach by us of certain of our representations or undertakings. Our indemnification obligations to NTELOS and its subsidiaries, officers and directors are not limited by any maximum amount.
Pursuant to the separation and distribution agreement and certain other agreements with NTELOS, NTELOS agreed to indemnify us from certain liabilities, and we agreed to indemnify NTELOS for certain liabilities.
After considering the cost to service the Credit Facility as well as fund the anticipated level of capital expenditures and fund other routine items such as income taxes, interest and scheduled principal payments, we anticipate that we will generate sufficient cash flow to enable us to pay a regular quarterly dividend. All decisions regarding the declaration and payment of dividends will be at the discretion of our board of directors and will be evaluated from time to time in light of our financial condition, earnings, growth prospects, funding requirements and restrictions under our credit agreement, applicable law and other factors our board deems relevant.
Contractual Obligations and Commercial Commitments
We have contractual obligations and commercial commitments that may affect our financial condition. The following table summarizes our significant contractual obligations and commercial commitments as of December 31, 2012:
| | | | | | | | | | | | | | | | | | | | |
| | | Payments Due by Period | |
(In thousands) | | Total(2) | | | Less than one
year | | | Two to three
years | | | Four to five
years | | | After five
years | |
Long-term debt obligations(1), (3) | | $ | 311,022 | | | $ | 7,500 | | | $ | 20,500 | | | $ | 283,022 | | | $ | — | |
Capital lease obligations(3) | | | 1,203 | | | | 400 | | | | 611 | | | | 193 | | | | — | |
Operating lease obligations | | | 5,376 | | | | 950 | | | | 1,525 | | | | 1,186 | | | | 1,715 | |
Purchase obligations | | $ | 6,621 | | | $ | 6,621 | | | $ | — | | | $ | — | | | $ | — | |
| (1) | Represents the borrowings under the Credit Facility (see Note 5 in Part II, Item 8. Financial Statements and Supplementary Data). |
| (2) | Excludes certain benefit obligation projected payments under our qualified and non-qualified pension and other post retirement benefit plans (see Note 11 in Part II, Item 8. Financial Statements and Supplementary Data). |
Off Balance Sheet Arrangements
We do not have any off balance sheet arrangements or financing activities with special purpose entities.
Critical Accounting Policies and Estimates
The fundamental objective of financial reporting is to provide useful information that allows a reader to comprehend our business activities. To aid in that understanding, management has identified our critical accounting policies for discussion herein. These policies have the potential to have a more significant impact on our financial statements, either because of the significance of the financial statement item to which they relate, or because they require judgment and estimation due to the uncertainty involved in measuring, at a specific point in time, events which are continuous in nature.
Principles of Consolidation
The consolidated financial statements include the accounts of the Company, Lumos Networks Operating Company, a wholly-owned subsidiary of the Company, and all of Lumos Networks Operating Company’s wholly-owned subsidiaries and those limited liability corporations where Lumos Networks Operating Company or certain of its subsidiaries, as managing member, exercised control. All significant intercompany accounts and transactions have been eliminated.
37
For all periods prior to the Business Separation on October 31, 2011, the consolidated financial statements principally represent the financial results reflected by NTELOS constituting the companies comprising the Competitive and RLEC wireline segments. These financial results as of and for the periods prior to the date of the Business Separation have been adjusted to reflect certain corporate expenses which were not previously allocated to the segments. These allocations primarily represent corporate support functions, including but not limited to accounting, human resources, information technology and executive management, as well as corporate legal and professional fees, including audit fees, and equity-based compensation expense related to equity-based awards granted to employees in corporate support functions. We believe that these costs would not have been materially different had they been calculated on a standalone basis. However, such expenses are not indicative of the actual level of expense and exclude certain expenses that would have been incurred by us if we had operated as an independent, publicly traded company nor are they comparable to the expenses incurred in 2012. As such, the financial information herein may not necessarily reflect our financial position, results of operations, and cash flows in the future or what it would have been had we been an independent, publicly traded company through October 31, 2011.
Revenue Recognition
We recognize revenue when services are rendered or when products are delivered, installed and functional, as applicable. Certain of our services require payment in advance of service performance. In such cases, we record a service liability at the time of billing and subsequently recognize revenue ratably over the service period. We bill customers certain transactional taxes on service revenues. These transactional taxes are not included in reported revenues as they are recognized as liabilities at the time customers are billed.
We earn revenue by providing services through access to and usage of our networks. Local service and airtime revenues are recognized as services are provided. Carrier data revenues are earned by providing switched access and other switched and dedicated services, including wireless roamer management, to other carriers. Revenues for equipment sales are recognized at the point of sale.
We periodically make claims for recovery of access charges on certain minutes of use terminated by us on behalf of other carriers. We recognize revenue in the period when it is determined that the amounts can be estimated and collection is reasonably assured.
Trade Accounts Receivable
We sell our services to business, residential and telecommunication carrier customers primarily in Virginia, West Virginia and in parts of Maryland, Pennsylvania, Ohio and Kentucky. We have credit and collection policies to maximize collection of trade receivables and we require deposits on certain sales. We maintain an allowance for doubtful accounts based on historical results, current and expected trends and changes in credit policies. Management believes the allowance adequately covers all anticipated losses with respect to trade receivables. Actual credit losses could differ from such estimates.
Property, Plant and Equipment and Other Long-Lived Assets (Excluding Goodwill and Indefinite-Lived Intangible Assets)
Property, plant and equipment, finite-lived intangible assets and long-term deferred charges are recorded at cost and are reviewed for impairment whenever events or changes in circumstances indicate that the carrying amount should be evaluated pursuant to the subsequent measurement guidance described in Financial Accounting Standards Board (“FASB”) Accounting Standards Codification (“ASC”) 360-10-35. Impairment is determined by comparing the carrying value of these long-lived assets to management’s best estimate of future undiscounted cash flows expected to result from the use of the assets. If the carrying value exceeds the estimated undiscounted cash flows, the excess of the asset’s carrying value over the estimated fair value is recorded as an impairment charge.
In 2011, the Company determined that the fair value of the RLEC segment assets, including property, plant and equipment and finite-lived intangible assets, was lower than the carrying value as a result of the revaluation of assets performed in connection with the Business Separation as of October 31, 2011. Accordingly, an impairment charge was recorded for $20.9 million ($12.7 million net of tax).
The Company believes that no impairment indicators exist as of December 31, 2012 that would require it to perform impairment testing for long-lived assets, including property, plant and equipment, long-term deferred charges and finite-lived intangible assets to be held and used.
Depreciation of property, plant and equipment is calculated on a straight-line basis over the estimated useful lives of the assets, which we review and update based on historical experiences and future expectations. Buildings are depreciated over a 50-year life and leasehold improvements, which are categorized in land and buildings, are depreciated over the shorter of the estimated useful lives or the remaining lease terms. Network plant and equipment are depreciated over various lives from 3 to 50 years, with a weighted average life of approximately 14 years. Furniture, fixtures and other equipment are depreciated over various lives from 2 to 24 years.
Goodwill and Indefinite-Lived Intangible Assets
Goodwill and franchise rights are considered to be indefinite-lived intangible assets. Indefinite-lived intangible assets are not subject to amortization but are instead tested for impairment annually or more frequently if an event indicates that the asset might be impaired. We assess the recoverability of indefinite-lived assets annually on October 1 and whenever adverse events or changes in circumstances indicate that impairment may have occurred.
38
We use a two-step process to test for goodwill impairment. Step one requires a determination of the fair value of each of the reporting units and, to the extent that this fair value of the reporting unit exceeds its carrying value (including goodwill), the step two calculation of implied fair value of goodwill is not required and no impairment loss is recognized. In testing for goodwill impairment, we utilize a combination of a discounted cash flow model and an analysis which allocates enterprise value to the reporting units. Our annual testing is performed as of October 1 of each year.
In 2011, we recorded a $65.4 million asset impairment charge ($53.0 million after tax) after concluding that both the RLEC goodwill and franchise rights intangible asset were fully impaired. We determined that there was no impairment of the Competitive segment goodwill in 2011.
In 2012, we adopted FASB Accounting Standards Update (“ASU”) 2011-08,Intangibles – Goodwill and Other (Topic 350): Testing Goodwill for Impairment, which permits an entity to take a qualitative approach to determining whether it is more likely than not that a reporting unit’s fair value is less than its carrying amount before applying the two-step quantitative goodwill impairment test promulgated by FASB ASC Topic 350. After a preliminary assessment of quantitative factors we elected not to use this option for our 2012 testing and applied the two-step quantitative process as described above. Based on the results of this annual impairment testing performed as of October 1, 2012, we determined that the fair value of the Competitive segment reporting unit substantially exceeds its carrying amount and that no impairment exists.
Pension Benefits and Retirement Benefits Other Than Pensions
We sponsor a non-contributory defined benefit pension plan (“Pension Plan”) covering all employees who meet eligibility requirements and were employed by NTELOS Inc. prior to October 1, 2003. The Pension Plan was closed to NTELOS Inc. employees hired on or after October 1, 2003. Pension benefits vest after five years of plan service and are based on years of service and an average of the five highest consecutive years of compensation subject to certain reductions if the employee retires before reaching age 65 and elects to receive the benefit prior to age 65.
Effective December 31, 2012, the Company froze the Pension Plan in conjunction with a cost reduction plan that was announced in mid-December 2012 and also included an employee reduction-in-force and consolidation of certain facilities. As such, no further benefits will be accrued by plan participants for services rendered after this date.
Sections 412 and 430 of the Internal Revenue Code and ERISA Sections 302 and 303 establish minimum funding requirements for defined benefit pension plans. The minimum required contribution is generally equal to the target normal cost plus the shortfall amortization installments for the current plan year and each of the six preceding plan years less any calculated credit balance. If plan assets (less calculated credits) are equal to or exceed the funding target, the minimum required contribution is the target normal cost reduced by the excess funding, but not below zero. Our policy is to make contributions to stay at or above the threshold required in order to prevent benefit restrictions and related additional notice requirements and is intended to provide for benefits to be paid in the future. Also, we have nonqualified pension plans that are accounted for similar to its Pension Plan.
We provide certain health care and life benefits for retired employees that meet eligibility requirements. We have two qualified nonpension postretirement benefit plans. The health care plan is contributory, with participants’ contributions adjusted annually. The life insurance plan is also contributory. These obligations, along with all of the pension plans and other post retirement benefit plans, are assumed by us. Eligibility for the life insurance plan is restricted to active pension participants age 50-64 as of January 5, 1994. Neither plan is eligible to employees hired after April 1993. The accounting for the plans anticipates that we will maintain a consistent level of cost sharing for the benefits with the retirees. Our share of the projected costs of benefits that will be paid after retirement is generally being accrued by charges to expense over the eligible employees’ service periods to the dates they are fully eligible for benefits.
We also sponsor a contributory defined contribution plan under Internal Revenue Code Section 401(k) for substantially all employees. Our policy is to match 100% of each participant’s annual contributions for contributions up to 1% of each participant’s annual compensation and 50% of each participant’s annual contributions up to an additional 5% of each participant’s annual compensation. Company contributions vest after two years of service. We fund our 401(k) matching contributions in shares of our common stock.
Income Taxes
Deferred income taxes are provided on an asset and liability method whereby deferred tax assets are recognized for deductible temporary differences and deferred tax liabilities are recognized for taxable temporary differences. Temporary differences are the differences between the reported amounts of assets and liabilities and their tax bases. Deferred tax assets and liabilities are adjusted for the effects of changes in tax laws and rates on the date of enactment. We accrue interest and penalties related to unrecognized tax benefits in interest expense and income tax expense, respectively. Prior to the Business Separation, our income taxes were included in the NTELOS consolidated federal income tax return and certain unitary or consolidated state income tax returns of NTELOS Holdings Corp. However, our income taxes were calculated and provided for on an “as if separate” tax return basis.
39
Recent Accounting Pronouncements
In May 2011, the FASB issued ASU 2011-04,Fair Value Measurement (Topic 820): Amendments to Achieve Common Fair Value Measurement and Disclosure Requirements in U.S. GAAP and IFRS. ASU No. 2011-04 was issued concurrently with IFRS 13,Fair Value Measurement, to provide largely identical guidance about fair value measurement and disclosure requirements. The new standards do not extend the use of fair value but, rather, provide guidance on how fair value should be applied where it already is required or permitted under IFRS or U.S. GAAP. For U.S. GAAP, most of the changes are clarifications of existing guidance or wording changes to align with IFRS 13. This ASU was effective for the Company as of January 1, 2012. This pronouncement did not have a material impact on our valuation techniques and related inputs.
In June 2011, the FASB issued ASU 2011-05,Comprehensive Income (Topic 220): Presentation of Comprehensive Income. This ASU increases the prominence of other comprehensive income in financial statements. Under this ASU, an entity has the option to present the components of net income and comprehensive income in either one or two consecutive financial statements. The ASU eliminates the option in U.S. GAAP to present other comprehensive income in the statement of changes in equity. An entity should apply this ASU retrospectively. This ASU was effective for the Company as of January 1, 2012. We have complied with the requirements of this pronouncement by providing a consolidated statement of comprehensive income (loss), which follows the consolidated statement of operations in this annual report on Form 10-K.
In September 2011, the FASB issued ASU 2011-08,Intangibles – Goodwill and Other (Topic 350): Testing Goodwill for Impairment. This ASU permits an entity to make a qualitative assessment of whether it is more likely than not that a reporting unit’s fair value is less than its carrying amount before applying the two-step goodwill impairment test. If an entity can support the conclusion that it is not more than likely than not that the fair value of a reporting unit is less than its carrying amount, it would not need to perform the two-step impairment test for that reporting unit. This ASU was effective for the Company as of January 1, 2012. We considered the provisions of this ASU during our annual goodwill impairment testing performed as of October 1, 2012, however there were no significant changes to our methods employed or the conclusions reached as a result of adopting this standard in 2012.
| Item 7A. | Quantitative and Qualitative Disclosures About Market Risk. |
We are exposed to market risks primarily related to interest rates. We paid the $177.1 million balance due to NTELOS Inc. on the effective date of the Business Separation (October 31, 2011) by entering into the $370 million post-Business Separation credit facility. As of December 31, 2012, $311.0 million was outstanding under our Credit Facility. As of December 31, 2012, we had a leverage ratio of 3.50:1.00 and an interest coverage ratio 8.00:1.00, both of which are favorable to any future covenant requirement. We have other fixed rate, long-term debt in the form of capital leases totaling $1.2 million as of December 31, 2012.
Under the terms of our Credit Facility, we were required to enter into an interest rate hedge for three years on 50% of the term loans (approximately $154 million). In February 2012, we entered into a 3% interest rate CAP for February 2012 through December 31, 2012 and a delayed interest rate swap agreement from December 31, 2012 through December 31, 2015 whereby we swap three-month LIBOR with a fixed rate of approximately 0.8% on 50% of the term loan balances outstanding. We will be exposed to interest rate risk on the remaining 50% of the term loan balances and 100% of the revolver outstanding balance. We do not purchase or hold any financial derivative instruments for trading purposes. We recorded losses of $1.9 million due to the change in the market value of the interest rate derivatives between inception in February 2012 and December 31, 2012.
At December 31, 2012, our financial assets in the combined balance sheets included unrestricted cash of less than $0.1 million. Other securities and investments totaled $0.5 million at December 31, 2012.
The following sensitivity analysis indicates the impact at December 31, 2012, on the fair value of certain financial instruments, which would be potentially subject to material market risks, assuming a ten percent increase and a ten percent decrease in the levels of our interest rates:
| | | | | | | | | | | | | | | | |
(In thousands) | | Book Value | | | Fair Value | | | Estimated fair value
assuming noted
decrease in market
pricing | | | Estimated fair value
assuming noted
increase in market
pricing | |
Credit Facility | | $ | 311,022 | | | $ | 320,739 | | | $ | 321,735 | | | $ | 319,722 | |
Capital lease obligations | | $ | 1,203 | | | $ | 1,203 | | | $ | 1,324 | | | $ | 1,083 | |
40
| Item 8. | Financial Statements and Supplementary Data. |
LUMOS NETWORKS CORP.
INDEX TO AUDITED CONSOLIDATED FINANCIAL STATEMENTS
41
Report of Independent Registered Public Accounting Firm
The Board of Directors and Stockholders
Lumos Networks Corp.:
We have audited the accompanying consolidated balance sheets of Lumos Networks Corp. (the Company) as of December 31, 2012 and 2011, and the related consolidated statements of operations, comprehensive income (loss), cash flows, and equity for each of the years in the three-year period ended December 31, 2012. These consolidated financial statements are the responsibility of the Company’s management. Our responsibility is to express an opinion on these consolidated financial statements based on our audits.
We conducted our audits in accordance with the standards of the Public Company Accounting Oversight Board (United States). Those standards require that we plan and perform the audit to obtain reasonable assurance about whether the financial statements are free of material misstatement. An audit includes examining, on a test basis, evidence supporting the amounts and disclosures in the financial statements. An audit also includes assessing the accounting principles used and significant estimates made by management, as well as evaluating the overall financial statement presentation. We believe that our audits provide a reasonable basis for our opinion.
In our opinion, the consolidated financial statements referred to above present fairly, in all material respects, the financial position of Lumos Networks Corp. as of December 31, 2012 and 2011, and the results of their operations and their cash flows for each of the years in the three-year period ended December 31, 2012, in conformity with U.S. generally accepted accounting principles.
We also have audited, in accordance with the standards of the Public Company Accounting Oversight Board (United States), the Company’s internal control over financial reporting as of December 31, 2012, based on criteria established inInternal Control – Integrated Framework issued by the Committee of Sponsoring Organizations of the Treadway Commission (COSO), and our report dated March 8, 2013 expressed an unqualified opinion on the effectiveness of the Company’s internal control over financial reporting.
|
| /s/ KPMG LLP |
|
| Richmond, Virginia |
| March 8, 2013 |
42
Report of Independent Registered Public Accounting Firm
The Board of Directors and Stockholders
Lumos Networks Corp.:
We have audited Lumos Networks Corp.’s internal control over financial reporting as of December 31, 2012, based on criteria established in Internal Control – Integrated Framework issued by the Committee of Sponsoring Organizations of the Treadway Commission (COSO). Lumos Networks Corp.’s management is responsible for maintaining effective internal control over financial reporting and for its assessment of the effectiveness of internal control over financial reporting, included in the accompanying Management’s Annual Report on Internal Control over Financial Reporting. Our responsibility is to express an opinion on the Company’s internal control over financial reporting based on our audit.
We conducted our audit in accordance with the standards of the Public Company Accounting Oversight Board (United States). Those standards require that we plan and perform the audit to obtain reasonable assurance about whether effective internal control over financial reporting was maintained in all material respects. Our audit included obtaining an understanding of internal control over financial reporting, assessing the risk that a material weakness exists, and testing and evaluating the design and operating effectiveness of internal control based on the assessed risk. Our audit also included performing such other procedures as we considered necessary in the circumstances. We believe that our audit provides a reasonable basis for our opinion.
A company’s internal control over financial reporting is a process designed to provide reasonable assurance regarding the reliability of financial reporting and the preparation of financial statements for external purposes in accordance with generally accepted accounting principles. A company’s internal control over financial reporting includes those policies and procedures that (1) pertain to the maintenance of records that, in reasonable detail, accurately and fairly reflect the transactions and dispositions of the assets of the company; (2) provide reasonable assurance that transactions are recorded as necessary to permit preparation of financial statements in accordance with generally accepted accounting principles, and that receipts and expenditures of the company are being made only in accordance with authorizations of management and directors of the company; and (3) provide reasonable assurance regarding prevention or timely detection of unauthorized acquisition, use, or disposition of the company’s assets that could have a material effect on the financial statements.
Because of its inherent limitations, internal control over financial reporting may not prevent or detect misstatements. In addition, projections of any evaluation of effectiveness to future periods are subject to the risk that controls may become inadequate because of changes in conditions, or that the degree of compliance with the policies or procedures may deteriorate.
In our opinion, Lumos Networks Corp. maintained, in all material respects, effective internal control over financial reporting as of December 31, 2012, based on criteria established inInternal Control – Integrated Framework issued by the Committee of Sponsoring Organizations of the Treadway Commission.
We also have audited, in accordance with the standards of the Public Company Accounting Oversight Board (United States), the consolidated balance sheets of Lumos Networks Corp. as of December 31, 2012 and 2011, and the related consolidated statements of operations, comprehensive income (loss), cash flows, and equity for each of the years in the three-year period ended December 31, 2012, and our report dated March 8, 2013 expressed an unqualified opinion on those consolidated financial statements.
|
| /s/ KPMG LLP |
|
| Richmond, Virginia |
| March 8, 2013 |
43
Consolidated Balance Sheets
Lumos Networks Corp.
| | | | | | | | |
(In thousands) | | December 31, 2012 | | | December 31, 2011 | |
Assets | | | | | | | | |
| | |
Current Assets | | | | | | | | |
Cash | | $ | 2 | | | $ | 10,547 | |
Restricted cash | | | 5,303 | | | | 7,554 | |
Accounts receivable, net of allowance of $1,822 ($2,822 in 2011) | | | 22,676 | | | | 23,555 | |
Other receivables | | | 2,400 | | | | 2,390 | |
Income tax receivable | | | 954 | | | | — | |
Prepaid expenses and other | | | 5,136 | | | | 2,278 | |
| | | | | | | | |
Total Current Assets | | | 36,471 | | | | 46,324 | |
| | | | | | | | |
| | |
Securities and Investments | | | 462 | | | | 128 | |
| | | | | | | | |
| | |
Property, Plant and Equipment | | | | | | | | |
Land and buildings | | | 19,489 | | | | 22,833 | |
Network plant and equipment | | | 419,176 | | | | 365,101 | |
Furniture, fixtures and other equipment | | | 22,070 | | | | 13,069 | |
| | | | | | | | |
Total in service | | | 460,735 | | | | 401,003 | |
Under construction | | | 19,764 | | | | 18,200 | |
| | | | | | | | |
| | |
| | | 480,499 | | | | 419,203 | |
Less accumulated depreciation | | | 143,910 | | | | 119,245 | |
| | | | | | | | |
| | |
Total Property, Plant and Equipment, net | | | 336,589 | | | | 299,958 | |
| | | | | | | | |
| | |
Other Assets | | | | | | | | |
Goodwill | | | 100,297 | | | | 100,297 | |
Other intangibles, less accumulated amortization of $72,876 ($61,742 in 2011) | | | 34,895 | | | | 45,696 | |
Deferred charges and other assets | | | 4,448 | | | | 6,197 | |
| | | | | | | | |
Total Other Assets | | | 139,640 | | | | 152,190 | |
| | | | | | | | |
| | |
Total Assets | | $ | 513,162 | | | $ | 498,600 | |
| | | | | | | | |
See accompanying Notes to Consolidated Financial Statements.
44
Consolidated Balance Sheets
Lumos Networks Corp.
| | | | | | | | |
(In thousands, except par value per share amounts) | | December 31, 2012 | | | December 31, 2011 | |
Liabilities and Equity | | | | | | | | |
| | |
Current Liabilities | | | | | | | | |
Current portion of long-term debt | | $ | 7,900 | | | $ | 2,679 | |
Accounts payable | | | 17,453 | | | | 12,432 | |
Dividends payable | | | 3,013 | | | | 2,980 | |
Advance billings and customer deposits | | | 13,527 | | | | 12,623 | |
Accrued compensation | | | 1,742 | | | | 2,832 | |
Accrued operating taxes | | | 3,838 | | | | 2,624 | |
Other accrued liabilities | | | 6,284 | | | | 3,262 | |
| | | | | | | | |
Total Current Liabilities | | | 53,757 | | | | 39,432 | |
| | | | | | | | |
| | |
Long-term Liabilities | | | | | | | | |
Long-term debt | | | 304,325 | | | | 323,897 | |
Retirement benefits | | | 30,413 | | | | 35,728 | |
Deferred income taxes | | | 55,956 | | | | 41,204 | |
Other long-term liabilities | | | 3,500 | | | | 5,028 | |
Income tax payable | | | 609 | | | | 484 | |
| | | | | | | | |
| | |
Total Long-term Liabilities | | | 394,803 | | | | 406,341 | |
| | | | | | | | |
| | |
Commitments and Contingencies | | | | | | | | |
| | |
Equity | | | | | | | | |
Preferred stock, par value $0.01 per share, authorized 100 shares, none issued | | | — | | | | — | |
Common stock, par value $0.01 per share, authorized 55,000 shares; 21,610 shares issued and 21,498 shares outstanding (21,235 shares issued and 21,170 shares outstanding in 2011) | | | 216 | | | | 212 | |
Additional paid in capital | | | 129,570 | | | | 126,427 | |
Treasury stock, 112 shares at cost (65 shares in 2011) | | | — | | | | — | |
Accumulated deficit | | | (53,060 | ) | | | (57,416 | ) |
Accumulated other comprehensive loss | | | (12,676 | ) | | | (16,840 | ) |
| | | | | | | | |
Total Lumos Networks Corp. Stockholders’ Equity | | | 64,050 | | | | 52,383 | |
Noncontrolling Interests | | | 552 | | | | 444 | |
| | | | | | | | |
| | |
Total Equity | | | 64,602 | | | | 52,827 | |
| | | | | | | | |
| | |
Total Liabilities and Equity | | $ | 513,162 | | | $ | 498,600 | |
| | | | | | | | |
See accompanying Notes to Consolidated Financial Statements.
45
Consolidated Statements of Operations
Lumos Networks Corp.
| | | | | | | | | | | | |
| | | Year Ended December 31, | |
(In thousands, except per share amounts) | | 2012 | | | 2011 | | | 2010 | |
| | | |
Operating Revenues | | $ | 206,871 | | | $ | 207,414 | | | $ | 145,964 | |
| | | |
Operating Expenses | | | | | | | | | | | | |
Cost of sales and services (exclusive of items shown separately below) | | | 80,520 | | | | 78,484 | | | | 46,407 | |
Customer operations | | | 21,886 | | | | 19,551 | | | | 13,243 | |
Corporate operations | | | 23,615 | | | | 16,251 | | | | 13,809 | |
Depreciation and amortization | | | 38,884 | | | | 43,090 | | | | 31,365 | |
Asset impairment charge | | | — | | | | 86,295 | | | | — | |
Accretion of asset retirement obligations | | | 124 | | | | 116 | | | | 11 | |
Restructuring charges | | | 2,981 | | | | — | | | | — | |
Gain on settlements, net | | | (2,335 | ) | | | — | | | | — | |
| | | | | | | | | | | | |
Total Operating Expenses, net | | | 165,675 | | | | 243,787 | | | | 104,835 | |
| | | | | | | | | | | | |
Operating Income (Loss) | | | 41,196 | | | | (36,373 | ) | | | 41,129 | |
| | | |
Other Income (Expenses) | | | | | | | | | | | | |
Interest expense | | | (11,921 | ) | | | (11,993 | ) | | | (5,752 | ) |
Loss on interest rate derivatives | | | (1,898 | ) | | | — | | | | — | |
Other income, net | | | 81 | | | | 105 | | | | 43 | |
| | | | | | | | | | | | |
Total Other Expenses, net | | | (13,738 | ) | | | (11,888 | ) | | | (5,709 | ) |
| | | | | | | | | | | | |
Income (Loss) Before Income Tax Expense | | | 27,458 | | | | (48,261 | ) | | | 35,420 | |
| | | |
Income Tax Expense (Benefit) | | | 11,010 | | | | (4,383 | ) | | | 14,477 | |
| | | | | | | | | | | | |
| | | |
Net Income (Loss) | | | 16,448 | | | | (43,878 | ) | | | 20,943 | |
| | | |
Net Income Attributable to Noncontrolling Interests | | | (108 | ) | | | (52 | ) | | | (119 | ) |
| | | | | | | | | | | | |
| | | |
Net Income (Loss) Attributable to Lumos Networks Corp. | | $ | 16,340 | | | $ | (43,930 | ) | | $ | 20,824 | |
| | | | | | | | | | | | |
|
Basic and Diluted Earnings (Loss) Per Common Share Attributable to Lumos Networks Corp. | |
(Pro Forma and Unaudited for 2011) | | | | | | | | | | | | |
| | | |
Earnings (loss) per share-basic | | $ | 0.78 | | | $ | (2.11 | ) | | | | |
Earnings (loss) per share-diluted | | $ | 0.76 | | | $ | (2.11 | ) | | | | |
| | | |
Weighted average shares outstanding - basic | | | 20,958 | | | | 20,815 | | | | | |
Weighted average shares outstanding - diluted | | | 21,407 | | | | 20,815 | | | | | |
| | | |
Cash Dividends Declared per Share - Common Stock | | $ | 0.56 | | | $ | 0.14 | | | | | |
See accompanying Notes to Consolidated Financial Statements.
46
Consolidated Statements of Comprehensive Income (Loss)
Lumos Networks Corp.
| | | | | | | | | | | | |
| | | Year Ended December 31, | |
(In thousands) | | 2012 | | | 2011 | | | 2010 | |
Net Income (Loss) | | $ | 16,448 | | | $ | (43,878 | ) | | $ | 20,943 | |
| | | |
Other Comprehensive Income (Loss), Net of Tax: | | | | | | | | | | | | |
| | | |
Net unrecognized gain (loss) from defined benefit plans, net of $1,958, $(1,813) and $0 of deferred income tax liability (asset) for the years ended December 31, 2012, 2011 and 2010, respectively | | | 3,076 | | | | (2,847 | ) | | | — | |
| | | |
Reclassification adjustment for amortization of unrealized loss from defined benefit plans included in net income, net of $693, $77 and $0 of deferred income tax asset for the years ended December 31, 2012, 2011 and 2010, respectively | | | 1,088 | | | | 120 | | | | — | |
| | | | | | | | | | | | |
| | | |
Other Comprehensive Income (Loss), Net of Tax | | | 4,164 | | | | (2,727 | ) | | | — | |
| | | | | | | | | | | | |
| | | |
Total Comprehensive Income (Loss) | | | 20,612 | | | | (46,605 | ) | | | 20,943 | |
| | | |
Less: Comprehensive Income Attributable to Noncontrolling Interests | | | (108 | ) | | | (52 | ) | | | (119 | ) |
| | | | | | | | | | | | |
| | | |
Comprehensive Income (Loss) Attributable to Lumos Networks Corp. | | $ | 20,504 | | | $ | (46,657 | ) | | $ | 20,824 | |
| | | | | | | | | | | | |
See accompanying Notes to Consolidated Financial Statements.
47
Consolidated Statements of Cash Flows
Lumos Networks Corp
| | | | | | | | | | | | |
| | | Year Ended December 31, | |
(In thousands) | | 2012 | | | 2011 | | | 2010 | |
Cash flows from operating activities | | | | | | | | | | | | |
Net income (loss) | | $ | 16,448 | | | $ | (43,878 | ) | | $ | 20,943 | |
Adjustments to reconcile net income (loss) to net cash provided by operating activities: | | | | | | | | | | | | |
Depreciation | | | 27,750 | | | | 27,703 | | | | 22,738 | |
Amortization | | | 11,134 | | | | 15,387 | | | | 8,627 | |
Accretion of asset retirement obligations | | | 124 | | | | 116 | | | | 11 | |
Asset impairment charge | | | — | | | | 86,295 | | | | — | |
Deferred income taxes | | | 10,514 | | | | (8,110 | ) | | | 3,463 | |
Loss on interest rate swap derivatives | | | 1,898 | | | | — | | | | — | |
Equity-based compensation expense | | | 3,912 | | | | 2,383 | | | | 1,529 | |
Amortization of loan origination costs | | | 812 | | | | 132 | | | | — | |
Gain on settlement | | | (3,035 | ) | | | — | | | | — | |
Retirement benefits, net of contributions and distributions | | | 665 | | | | (4,059 | ) | | | (2,156 | ) |
Excess tax benefits from share-based compensation | | | (428 | ) | | | — | | | | — | |
Changes in assets and liabilities from operations: | | | | | | | | | | | | |
Decrease (increase) in accounts receivable | | | 218 | | | | (2,082 | ) | | | 1,175 | |
(Increase) decrease in other current assets | | | (3,503 | ) | | | 297 | | | | (320 | ) |
Changes in income taxes | | | 99 | | | | 3,727 | | | | 593 | |
Increase in accounts payable | | | 1,946 | | | | 425 | | | | 901 | |
Increase in other current liabilities | | | 3,661 | | | | 4,572 | | | | 1,473 | |
| | | | | | | | | | | | |
Net cash provided by operating activities | | | 72,215 | | | | 82,908 | | | | 58,977 | |
| | | | | | | | | | | | |
| | | |
Cash flows from investing activities | | | | | | | | | | | | |
Purchases of property, plant and equipment | | | (59,881 | ) | | | (61,536 | ) | | | (40,254 | ) |
Broadband network expansion funded by stimulus grant | | | (1,351 | ) | | | (2,248 | ) | | | (692 | ) |
Proceeds from disposal of managed services business | | | 750 | | | | — | | | | — | |
Purchase of FiberNet, net of cash acquired of $221 and working capital and other adjustments of $6,440 | | | — | | | | — | | | | (162,283 | ) |
Change in restricted cash | | | 2,251 | | | | 508 | | | | (8,062 | ) |
Cash reimbursement received from broadband stimulus grant | | | 2,251 | | | | 508 | | | | — | |
Purchase of tradename asset | | | (333 | ) | | | — | | | | — | |
Other | | | (26 | ) | | | — | | | | — | |
| | | | | | | | | | | | |
Net cash used in investing activities | | | (56,339 | ) | | | (62,768 | ) | | | (211,291 | ) |
| | | | | | | | | | | | |
| | | |
Cash flows from financing activities | | | | | | | | | | | | |
Proceeds from issuance of long-term debt | | | — | | | | 310,000 | | | | — | |
Proceeds from issuance of revolving credit facility | | | — | | | | 30,000 | | | | — | |
Payment of debt issuance costs | | | — | | | | (4,854 | ) | | | — | |
Cash paid to NTELOS Inc. associated with the Business Separation | | | — | | | | (315,000 | ) | | | — | |
Payments on senior secured term loans | | | (2,000 | ) | | | (500 | ) | | | — | |
Payments on revolving credit facility | | | (11,478 | ) | | | (15,000 | ) | | | — | |
Cash dividends paid on common stock | | | (11,951 | ) | | | — | | | | — | |
(Payment to) borrowings from NTELOS Inc., net | | | — | | | | (14,357 | ) | | | 153,106 | |
Payments under capital lease obligations | | | (1,542 | ) | | | (317 | ) | | | (306 | ) |
Proceeds from employee stock purchase plan | | | 122 | | | | — | | | | — | |
Excess tax benefits from share-based compensation | | | 428 | | | | — | | | | — | |
Other | | | — | | | | (54 | ) | | | — | |
| | | | | | | | | | | | |
Net cash (used in) provided by financing activities | | | (26,421 | ) | | | (10,082 | ) | | | 152,800 | |
| | | | | | | | | | | | |
(Decrease) increase in cash | | | (10,545 | ) | | | 10,058 | | | | 486 | |
Cash: | | | | | | | | | | | | |
Beginning of period | | | 10,547 | | | | 489 | | | | 3 | |
| | | | | | | | | | | | |
| | | |
End of period | | $ | 2 | | | $ | 10,547 | | | $ | 489 | |
| | | | | | | | | | | | |
See accompanying Notes to Consolidated Financial Statements.
48
Consolidated Statements of Equity
Lumos Networks Corp.
| | | | | | | | | | | | | | | | | | | | | | | | | | | | | | | | | | | | | | | | | | | | |
(In thousands, except per
share amounts) | | Common
Shares | | | Treasury
Shares | | | Common
Stock | | | Additional
Paid-in
Capital | | | Treasury
Stock | | | Accumulated
Deficit | | | Accumulated
Other
Comprehensive
Loss | | | Business
Equity | | | Total Lumos
Networks Corp.
Stockholders’
Equity | | | Noncontrolling
Interests | | | Total
Equity | |
Balance, December 31, 2009 | | | — | | | | — | | | $ | — | | | $ | — | | | $ | — | | | $ | — | | | $ | — | | | $ | 272,681 | | | $ | 272,681 | | | $ | 273 | | | $ | 272,954 | |
Net income attributable to Lumos Networks Corp. | | | | | | | | | | | | | | | | | | | | | | | | | | | | | | | 20,824 | | | | 20,824 | | | | | | | | 20,824 | |
Equity-based compensation expense | | | | | | | | | | | | | | | | | | | | | | | | | | | | | | | 1,529 | | | | 1,529 | | | | | | | | 1,529 | |
Dividends paid to NTELOS Communications, Inc. | | | | | | | | | | | | | | | | | | | | | | | | | | | | | | | (29,240 | ) | | | (29,240 | ) | | | | | | | (29,240 | ) |
Net income attributable to noncontrolling interests | | | | | | | | | | | | | | | | | | | | | | | | | | | | | | | | | | | | | | | 119 | | | | 119 | |
| | | | | | | | | | | | | | | | | | | | | | | | | | | | | | | | | | | | | | | | | | | | |
| | | | | | | | | | | |
Balance, December 31, 2010 | | | — | | | | — | | | | — | | | | — | | | | — | | | | — | | | | — | | | | 265,794 | | | | 265,794 | | | | 392 | | | | 266,186 | |
| | | | | | | | | | | | | | | | | | | | | | | | | | | | | | | | | | | | | | | | | | | | |
Allocation of beginning of year business equity in connection with the Business Separation | | | | | | | | | | | | | | | 262,155 | | | | | | | | 3,639 | | | | | | | | (265,794 | ) | | | — | | | | | | | | — | |
Spin-off from NTELOS Holdings Corp. | | | 21,223 | | | | | | | | 212 | | | | (138,107 | ) | | | | | | | | | | | (14,113 | ) | | | | | | | (152,008 | ) | | | | | | | (152,008 | ) |
Net loss attributable to Lumos Networks Corp. | | | | | | | | | | | | | | | | | | | | | | | (43,930 | ) | | | | | | | | | | | (43,930 | ) | | | | | | | (43,930 | ) |
Other comprehensive loss, net of tax | | | | | | | | | | | | | | | | | | | | | | | | | | | (2,727 | ) | | | | | | | (2,727 | ) | | | | | | | (2,727 | ) |
Equity-based compensation expense | | | | | | | | | | | | | | | 1,694 | | | | | | | | | | | | | | | | | | | | 1,694 | | | | | | | | 1,694 | |
Restricted shares issued, shares issued through the employee stock purchase plan and 401(k) matching contributions and stock options exercised (net of shares reacquired through restricted stock forfeits) | | | 12 | | | | 65 | | | | | | | | 685 | | | | | | | | | | | | | | | | | | | | 685 | | | | | | | | 685 | |
Cash dividends declared ($0.14 per share) | | | | | | | | | | | | | | | | | | | | | | | (2,980 | ) | | | | | | | | | | | (2,980 | ) | | | | | | | (2,980 | ) |
Dividends paid to NTELOS Communications, Inc. | | | | | | | | | | | | | | | | | | | | | | | (14,145 | ) | | | | | | | | | | | (14,145 | ) | | | | | | | (14,145 | ) |
Net income attributable to noncontrolling interest | | | | | | | | | | | | | | | | | | | | | | | | | | | | | | | | | | | | | | | 52 | | | | 52 | |
| | | | | | | | | | | | | | | | | | | | | | | | | | | | | | | | | | | | | | | | | | | | |
| | | | | | | | | | | |
Balance, December 31, 2011 | | | 21,235 | | | | 65 | | | | 212 | | | | 126,427 | | | | — | | | | (57,416 | ) | | | (16,840 | ) | | | — | | | | 52,383 | | | | 444 | | | | 52,827 | |
| | | | | | | | | | | | | | | | | | | | | | | | | | | | | | | | | | | | | | | | | | | | |
Adjustments related to spin-off from NTELOS Holdings Corp. | | | | | | | | | | | | | | | (1,337 | ) | | | | | | | | | | | | | | | | | | | (1,337 | ) | | | | | | | (1,337 | ) |
Net income attributable to Lumos Networks Corp. | | | | | | | | | | | | | | | | | | | | | | | 16,340 | | | | | | | | | | | | 16,340 | | | | | | | | 16,340 | |
Other comprehensive income, net of tax | | | | | | | | | | | | | | | | | | | | | | | | | | | 4,164 | | | | | | | | 4,164 | | | | | | | | 4,164 | |
Equity-based compensation expense | | | | | | | | | | | | | | | 3,065 | | | | | | | | | | | | | | | | | | | | 3,065 | | | | | | | | 3,065 | |
Adjustments to excess tax benefit from stock-based compensation | | | | | | | | | | | | | | | 428 | | | | | | | | | | | | | | | | | | | | 428 | | | | | | | | 428 | |
Restricted shares issued, shares issued through the employee stock purchase plan, and 401(k) matching contributions (net of shares reacquired through restricted stock forfeits) | | | 375 | | | | 47 | | | | 4 | | | | 987 | | | | | | | | | | | | | | | | | | | | 991 | | | | | | | | 991 | |
Cash dividends declared ($0.56 per share) | | | | | | | | | | | | | | | | | | | | | | | (11,984 | ) | | | | | | | | | | | (11,984 | ) | | | | | | | (11,984 | ) |
Net income attributable to noncontrolling interests | | | | | | | | | | | | | | | | | | | | | | | | | | | | | | | | | | | — | | | | 108 | | | | 108 | |
| | | | | | | | | | | | | | | | | | | | | | | | | | | | | | | | | | | | | | | | | | | | |
| | | | | | | | | | | |
Balance, December 31, 2012 | | | 21,610 | | | | 112 | | | $ | 216 | | | $ | 129,570 | | | $ | — | | | $ | (53,060 | ) | | $ | (12,676 | ) | | $ | — | | | $ | 64,050 | | | $ | 552 | | | $ | 64,602 | |
| | | | | | | | | | | | | | | | | | | | | | | | | | | | | | | | | | | | | | | | | | | | |
See accompanying Notes to Consolidated Financial Statements.
49
Notes to Consolidated Financial Statements
Lumos Networks Corp.
Lumos Networks is a fiber-based network service provider in the Mid-Atlantic region with a network of long-haul fiber, metro Ethernet and Ethernet rings located primarily in Virginia and West Virginia, and portions of Pennsylvania, Maryland, Ohio and Kentucky. We serve carrier, business and residential customers over our fiber network offering data, voice and IP services. Our principal products and services include metro Ethernet, which provides Ethernet connectivity among multiple locations in the same city or region over our fiber optic network, high-capacity private line and wavelength services, which provide a means to efficiently utilize fiber in broadband applications and provide high-capacity bandwidth, IP services and business and residential telephone local and long-distance services.
On October 14, 2011, NTELOS Holdings Corp. (“NTELOS”) announced a distribution date of October 31, 2011 for the spin-off of all of the issued and outstanding shares of common stock of Lumos Networks, which operated NTELOS’s wireline operations (the “Business Separation”). Prior to and in connection with the Business Separation, following the market close on October 31, 2011, NTELOS effectuated a 1-for-2 reverse stock split (the “Reverse Stock Split”) of its shares of Common Stock, $0.01 par value. The spin-off of Lumos Networks was in the form of a tax-free stock distribution to NTELOS stockholders of record as of the close of business on October 24, 2011, the record date (the “Distribution”). On October 31, 2011, NTELOS distributed one share of Lumos Networks common stock for every share of NTELOS’s common stock outstanding, on a post-Reverse Stock Split basis.
On December 1, 2010, the Company acquired from One Communications Corp. (“OCC”) all of the membership interest of Mountaineer Telecommunication, LLC (hereinafter referred to as “FiberNet”) for net cash consideration at closing of $162.5 million. FiberNet is a facility-based Competitive Local Exchange Carrier (“CLEC”) headquartered in Charleston, West Virginia. FiberNet offers voice, data, and IP-based services in West Virginia and portions of Ohio, Maryland, Pennsylvania, Virginia and Kentucky and had approximately 30,000 customer accounts as of the acquisition date and has an extensive fiber network. The FiberNet network provides enhancements that add diversity and capacity to the Company’s combined network of approximately 5,800 route-miles and the increased density provides immediate access to more enterprise customers in new tier two and tier three markets. NTELOS Inc. funded the acquisition through a combination of a $125 million incremental term loan under its existing senior secured credit facility and cash on hand. The $162.5 million net cash outlay for this purchase transaction was funded by Lumos Networks through an increase to its intercompany obligation with NTELOS Inc., which obligation was settled on October 31, 2011 through the aforementioned $315 million cash payment to NTELOS. Under the terms of the purchase agreement, $5.0 million of the purchase price was put in escrow. All outstanding matter related to the acquisition have been settled between the parties and escrow funds released as of December 31, 2012. The Company finalized its acquisition accounting related to the purchase of FiberNet and recorded necessary purchase accounting adjustments prior to December 1, 2011.
In the fourth quarter of 2012, the Company sold the assets comprising the former managed services business of FiberNet to an unrelated third-party for a total purchase price of $1.0 million, $0.8 million of which was received in cash upon consummation of the sale and the remaining $0.2 million was placed in escrow in accordance with the terms of the agreement.
| Note 2. | Relationship with NTELOS |
In connection with the Business Separation, the Company entered into a series of agreements with NTELOS which are intended to govern the relationship between the Company and NTELOS going forward. These agreements include commercial service agreements, a separation and distribution agreement, an employee matters agreement, a tax matters agreement, intellectual property agreements and a transition services agreement. During the years ended December 31, 2012 and 2011, the net expense to the Company related to the transition services agreement was $1.5 million and $0.4 million, respectively. See Note 14 regarding related party transactions with NTELOS.
Under the tax matters agreement entered into between NTELOS and the Company, the Company is generally required to indemnify NTELOS against any tax resulting from the Distribution to the extent that such tax resulted from any of the following events (among others): (1) an acquisition of all or a portion of our stock or assets, whether by merger or otherwise, (2) any negotiations, understandings, agreements or arrangements with respect to transactions or events that cause the Distribution to be treated as part of a plan pursuant to which one or more persons acquire, directly or indirectly, stock representing a 50% or greater interest in Lumos Networks, (3) certain other actions or failures to act by the Company, or (4) any breach by the Company of certain of its representations or undertakings. The Company’s indemnification obligations to NTELOS and its subsidiaries, officers and directors are not limited by any maximum amount.
50
Pursuant to the separation and distribution agreement and certain other agreements with NTELOS, NTELOS agreed to indemnify the Company from certain liabilities, and the Company agreed to indemnify NTELOS for certain liabilities.
| Note 3. | Significant Accounting Policies |
Accounting Estimates
The preparation of consolidated financial statements in conformity with accounting principles generally accepted in the United States of America requires management to make estimates and assumptions that affect the reported amounts of assets and liabilities and disclosures of contingent assets and liabilities at the date of the financial statements and the reported amounts of revenues and expenses during the reporting periods. Actual results could differ from those estimates. Additionally, the financial information for 2011 and 2010 included herein may not necessarily reflect the Company’s financial position, results of operations and cash flows in the future or what the Company’s financial position, results of operations and cash flows would have been had Lumos Networks been an independent, publicly traded company prior to the Business Separation on October 31, 2011.
Principles of Consolidation
The consolidated financial statements include the accounts of the Company, Lumos Networks Operating Company, a wholly-owned subsidiary of the Company, and all of Lumos Networks Operating Company’s wholly-owned subsidiaries and those limited liability corporations where Lumos Networks Operating Company or certain of its subsidiaries, as managing member, exercised control. All significant intercompany accounts and transactions have been eliminated.
For all periods prior to the Business Separation on October 31, 2011, the consolidated financial statements principally represent the financial results reflected by NTELOS constituting the companies comprising the Competitive and RLEC wireline segments. These financial results as of and for the periods prior to the date of the Business Separation have been adjusted to reflect certain corporate expenses which were not previously allocated to the segments. These allocations primarily represent corporate support functions, including but not limited to accounting, human resources, information technology and executive management, as well as corporate legal and professional fees, including audit fees, and equity-based compensation expense related to equity-based awards granted to employees in corporate support functions and executive management. These additional expenses for the ten months ended October 31, 2011 were $2.6 million and for the year ended December 31, 2010 were $5.1 million (inclusive of $2.8 million of acquisition-related costs). The Company believes that these costs would not have been materially different had they been calculated on a standalone basis. However, such costs are not indicative of the actual level of expense and exclude certain expenses that would have been incurred by the Company if it had operated as an independent, publicly traded company nor are they comparable to the expenses incurred in 2012.
Revenue Recognition
The Company recognizes revenue when services are rendered or when products are delivered, installed and functional, as applicable. Certain services of the Company require payment in advance of service performance. In such cases, the Company records a service liability at the time of billing and subsequently recognizes revenue ratably over the service period. The Company bills customers certain transactional taxes on service revenues. These transactional taxes are not included in reported revenues as they are recognized as liabilities at the time customers are billed.
The Company earns revenue by providing services through access to and usage of its networks. Local service revenues are recognized as services are provided. Carrier data revenues are earned by providing switched access and other switched and dedicated services, including wireless roamer management, to other carriers. Revenues for equipment sales are recognized at the point of sale.
The Company periodically makes claims for recovery of access charges on certain minutes of use terminated by the Company on behalf of other carriers. The Company recognizes revenue in the period when it is determined that the amounts can be estimated and collection is reasonably assured.
Cash and Cash Equivalents
The Company considers its investment in all highly liquid debt instruments with an original maturity of three months or less to be cash equivalents. The Company places its temporary cash investments with high credit quality financial institutions with a maturity date of not greater than 90 days from acquisition and all are investments held by commercial banks. At times, such investments may be in excess of the FDIC insurance limit. At December 31, 2012 and 2011, the Company did not have any cash equivalents.
As of December 31, 2012, all of the Company’s cash was held in non-interest bearing deposit accounts. Total interest income related to cash was negligible for the years ended December 31, 2012, 2011 and 2010.
The Company utilizes a zero balance arrangement for its master cash account against a swingline facility that the Company has with its primary commercial bank. As of December 31, 2012, the Company reclassified its book overdraft related to this master cash account of $1.8 million to Accounts Payable on the consolidated balance sheet. The Company has classified this overdraft in cash flows from operating activities on the consolidated statement of cash flows for the year ended December 31, 2012.
51
Restricted Cash
During 2010, the Company received a federal broadband stimulus award to bring broadband services and infrastructure to Alleghany County, Virginia. The total project is $16.1 million, of which 50% (approximately $8 million) is being funded by a grant from the federal government. The project is expected to be completed before September 30, 2015. The Company was required to deposit 100% of its portion for the grant (approximately $8 million) into a pledged account in advance of any reimbursements, which can be drawn down ratably following the grant reimbursement approvals which are contingent on adherence to the program requirements. The Company received $2.3 million in the year ended December 31, 2012 and $0.5 million in 2011 for the reimbursable portion of the qualified recoverable expenditures to date. The Company has a $1.5 million receivable for the reimbursable portion of the qualified recoverable expenditures through December 31, 2012. At December 31, 2012, the Company’s pledged account balance was $5.3 million. This escrow account is a non-interest bearing account with the Company’s primary commercial bank.
Trade Accounts Receivable
The Company sells its services to commercial and residential end-users and to other communication carriers primarily in Virginia and West Virginia and portions of Maryland, Pennsylvania, Ohio and Kentucky. The Company has credit and collection policies to maximize collection of trade receivables and requires deposits on certain sales. The Company maintains an allowance for doubtful accounts based on historical results, current and expected trends and changes in credit policies. Management believes the allowance adequately covers all anticipated losses with respect to trade receivables. Actual credit losses could differ from such estimates. The Company includes bad debt expense in customer operations expense in the consolidated statements of operations. Bad debt expense for the years ended December 31, 2012, 2011 and 2010 was $0.6 million, $1.0 million and $0.3 million, respectively. The Company’s allowance for doubtful accounts was $1.8 million and $2.8 million as of December 31, 2012 and 2011, respectively.
Property, Plant and Equipment and Other Long-Lived Assets (Excluding Goodwill and Indefinite-Lived Intangible Assets)
Property, plant and equipment, finite-lived intangible assets and long-term deferred charges are recorded at cost and are reviewed for impairment whenever events or changes in circumstances indicate that the carrying amount should be evaluated pursuant to the subsequent measurement guidance described in Financial Accounting Standards Board (“FASB”) Accounting Standards Codification (“ASC”) 360-10-35. Impairment is determined by comparing the carrying value of these long-lived assets to management’s best estimate of future undiscounted cash flows expected to result from the use of the assets. If the carrying value exceeds the estimated undiscounted cash flows, the excess of the asset’s carrying value over the estimated fair value is recorded as an impairment charge.
In 2011, the Company determined that the fair value of the RLEC segment assets, including property, plant and equipment and finite-lived intangible assets, was lower than the carrying value as a result of the revaluation of assets performed in connection with the Business Separation as of October 31, 2011. An impairment charge was recorded for $20.9 million ($12.7 million net of tax), which is included in the line item “asset impairment charges” on the consolidated statement of operations for the year ended December 31, 2011. The allocation of the impairment charge was as follows:
| | | | |
(In thousands) | | 2011 | |
Property, plant and equipment | | $ | 16,032 | |
Customer intangible | | | 4,661 | |
Trademark | | | 164 | |
| | | | |
Total impairment | | $ | 20,857 | |
| | | | |
The Company believes that no impairment indicators exist as of December 31, 2012 that would require it to perform impairment testing for long-lived assets, including property, plant and equipment, long-term deferred charges and finite-lived intangible assets to be held and used.
Depreciation of property, plant and equipment is calculated on a straight-line basis over the estimated useful lives of the assets, which the Company reviews and updates based on historical experiences and future expectations. At December 31, 2012, the Company revised the useful lives of certain leasehold improvements as a result of the termination of a building lease. The Company recognized accelerated depreciation costs of $1.4 million in the fourth quarter of 2012 as a result of this change in estimate.
Intangibles with a finite life are classified as other intangibles on the consolidated balance sheets. At December 31, 2012 and 2011, other intangibles were comprised of the following:
| | | | | | | | | | | | | | | | | | |
| | | | | 2012 | | | 2011 | |
(Dollars in thousands) | | Estimated Life | | Gross
Amount | | | Accumulated
Amortization | | | Gross
Amount | | | Accumulated
Amortization | |
Customer relationships | | 3 to 15 yrs | | $ | 103,153 | | | $ | (69,734 | ) | | $ | 103,153 | | | $ | (59,286 | ) |
Trademarks | | 0.5 to 15 yrs | | | 3,518 | | | | (2,042 | ) | | | 3,186 | | | | (1,884 | ) |
Non-compete agreement | | 2 yrs | | | 1,100 | | | | (1,100 | ) | | | 1,100 | | | | (572 | ) |
| | | | | | | | | | | | | | | | | | |
Total | | | | $ | 107,771 | | | $ | (72,876 | ) | | $ | 107,439 | | | $ | (61,742 | ) |
| | | | | | | | | | | | | | | | | | |
52
The Company amortizes its finite-lived intangible assets using the straight-line method unless it determines that another systematic method is more appropriate. The amortization for certain customer relationship intangibles is being recognized using an accelerated amortization method based on the pattern of estimated earnings from these assets.
The estimated life of amortizable intangible assets is determined from the unique factors specific to each asset and the Company reviews and updates estimated lives based on current events and future expectations. The Company capitalizes costs incurred to renew or extend the term of a recognized intangible asset and amortizes such costs over the remaining life of the asset. No such costs were incurred during the years ended December 31, 2012, 2011 or 2010. Amortization expense for the years ended December 31, 2012, 2011 and 2010 was $11.1 million, $15.4 million and $8.6 million, respectively.
Amortization expense for the next five years is expected to be as follows:
| | | | | | | | | | | | |
(In thousands) | | Customer Relationships | | | Trademarks | | | Total | |
2013 | | $ | 9,665 | | | $ | 159 | | | $ | 9,824 | |
2014 | | | 9,028 | | | | 159 | | | | 9,187 | |
2015 | | | 4,648 | | | | 159 | | | | 4,807 | |
2016 | | | 2,416 | | | | 159 | | | | 2,575 | |
2017 | | | 2,097 | | | | 159 | | | | 2,256 | |
Goodwill and Indefinite-Lived Intangible Assets
Goodwill and franchise rights are considered to be indefinite-lived intangible assets. Indefinite-lived intangible assets are not subject to amortization but are instead tested for impairment annually or more frequently if an event indicates that the asset might be impaired. The Company policy is to assess the recoverability of indefinite-lived assets annually on October 1 and whenever adverse events or changes in circumstances indicate that impairment may have occurred.
The Company uses a two-step process to test for goodwill impairment. Step one requires a determination of the fair value of each of the reporting units and, to the extent that the fair value of the reporting unit exceeds its carrying value (including goodwill), the step two calculation of implied fair value of goodwill is not required and no impairment loss is recognized. In testing for goodwill impairment, the Company utilizes a combination of a discounted cash flow model and an analysis which allocates enterprise value to the reporting units.
In 2011, based on its ASC 360-10-35 testing, the Company determined that both the goodwill and the franchise rights for the RLEC segment were fully impaired. As a result, the Company recorded a $65.4 million asset impairment charge ($53.0 million after tax), which is included in the line item “asset impairment charges” on the consolidated statement of operations for the year ended December 31, 2012. The Company determined that there was no impairment of the Competitive segment goodwill in 2011 as the fair value of the reporting unit substantially exceeded its carrying value.
In 2012, the Company adopted FASB Accounting Standards Update (“ASU”) 2011-08,Intangibles – Goodwill and Other (Topic 350): Testing Goodwill for Impairment, which permits an entity to take a qualitative approach to determining whether it is more likely than not that a reporting unit’s fair value is less than its carrying amount before applying the two-step quantitative goodwill impairment test promulgated by FASB ASC Topic 350. After a preliminary assessment of quantitative factors the Company elected not to use this option for our 2012 testing and applied the two-step quantitative process as described above. Based on the results of this annual impairment testing performed as of October 1, 2012, the Company determined that the fair value of the Competitive segment reporting unit substantially exceeds its carrying amount and that no impairment exists.
53
The following table presents the activity in goodwill for the years ended December 31, 2012 and 2011.
| | | | | | | | | | | | | | | | | | | | | | | | |
| | | 2012 | | | 2011 | |
(In thousands) | | Gross
Goodwill | | | Accumulated
Impairment
Loss | | | Net
Goodwill | | | Gross
Goodwill | | | Accumulated
Impairment
Loss | | | Net
Goodwill | |
Beginning balance | | $ | 133,735 | | | $ | (33,438 | ) | | $ | 100,297 | | | $ | 133,735 | | | $ | — | | | $ | 133,735 | |
Impairment of goodwill in the RLEC segment | | | — | | | | — | | | | — | | | | — | | | | (33,438 | ) | | | (33,438 | ) |
| | | | | | | | | | | | | | | | | | | | | | | | |
Ending balance | | $ | 133,735 | | | $ | (33,438 | ) | | $ | 100,297 | | | $ | 133,735 | | | $ | (33,438 | ) | | $ | 100,297 | |
| | | | | | | | | | | | | | | | | | | | | | | | |
Accounting for Asset Retirement Obligations
An asset retirement obligation is evaluated and recorded as appropriate on assets for which the Company has a legal obligation to retire. The Company records a liability for an asset retirement obligation and the associated asset retirement cost at the time the underlying asset is acquired. Subsequent to the initial measurement of the asset retirement obligation, the obligation is adjusted at the end of each period to reflect the passage of time and changes in the estimated future cash flows underlying the obligation.
The Company enters into various facility co-location agreements and is subject to locality franchise ordinances. The Company constructs assets at these locations and, in accordance with the terms of many of these agreements, the Company is obligated to restore the premises to their original condition at the conclusion of the agreements, generally at the demand of the other party to these agreements. The Company recognizes the fair value of a liability for an asset retirement obligation and capitalizes that cost as part of the cost basis of the related asset, depreciating it over the useful life of the related asset.
Included in certain of the franchise ordinances under which the RLECs and CLECs operate are clauses that require the removal of the RLEC’s and CLEC’s equipment at the termination of the franchise agreement. The Company has not recognized an asset retirement obligation for these liabilities as the removal of the equipment is not estimable due to an indeterminable end date and the fact that the equipment is part of the public switched telephone network and it is not reasonable to assume the jurisdictions would require its removal.
The following table indicates the changes to the Company’s asset retirement obligation liability, which is included in other long-term liabilities, for the years ended December 31, 2012 and 2011:
| | | | | | | | |
(In thousands) | | 2012 | | | 2011 | |
Asset retirement obligations, beginning | | $ | 1,114 | | | $ | 1,070 | |
Additional asset retirement obligations recorded, net of adjustments in estimates | | | (2 | ) | | | (72 | ) |
Accretion of asset retirement obligations | | | 124 | | | | 116 | |
| | | | | | | | |
Asset retirement obligations, ending | | $ | 1,236 | | | $ | 1,114 | |
| | | | | | | | |
Deferred Financing Costs
The Company incurred and paid $4.9 million of issuance costs related to the $370 million post-Business Separation credit facility, which was funded in 2011. These costs were deferred and are being amortized over the life of the related debt instrument using the effective interest method (Note 5). No such costs were incurred in 2012.
Advertising Costs
The Company expenses advertising costs and marketing production costs as incurred (included within customer operations expenses in the consolidated statements of operations). Advertising expense for the years ended December 31, 2012, 2011 and 2010 was $1.1 million, $0.9 million and $0.5 million, respectively.
54
Pension Benefits and Retirement Benefits Other Than Pensions
The Company sponsors a non-contributory defined benefit pension plan (“Pension Plan”) that was established on the date of the Business Separation from NTELOS when the Company assumed its portion of the assets and liabilities for the pension benefits of its employees. The Pension Plan covers all employees who meet eligibility requirements and were employed by NTELOS prior to October 1, 2003. The Pension Plan was closed to employees hired by NTELOS on or after October 1, 2003. Pension benefits vest after five years of plan service and are based on years of service and an average of the five highest consecutive years of compensation subject to certain reductions if the employee retires before reaching age 65 and elects to receive the benefit prior to age 65. Effective December 31, 2012, the Company made the decision to freeze the Pension Plan. As such, no further benefits will be accrued by participants for services rendered beyond this date.
Sections 412 and 430 of the Internal Revenue Code and ERISA Sections 302 and 303 establish minimum funding requirements for defined benefit pension plans. The minimum required contribution is generally equal to the target normal cost plus the shortfall amortization installments for the current plan year and each of the six preceding plan years less any calculated credit balance. If plan assets (less calculated credits) are equal to or exceed the funding target, the minimum required contribution is the target normal cost reduced by the excess funding, but not below zero. The Company’s policy is to make contributions to stay at or above the threshold required in order to prevent benefit restrictions and related additional notice requirements and is intended to provide for benefits to be paid in the future. Also, Lumos Networks has nonqualified pension plans that are accounted for similar to its Pension Plan.
The Company also provides certain health care and life benefits for retired employees that meet eligibility requirements. The Company has two qualified nonpension postretirement benefit plans. The health care plan is contributory, with participants’ contributions adjusted annually. The life insurance plan is also contributory. These obligations, along with all of the pension plans and other post retirement benefit plans, are assumed by the Company. In connection with the Business Separation, NTELOS transferred the portion of the accumulated postretirement benefit obligation. Eligibility for the life insurance plan is restricted to active pension participants age 50-64 as of January 5, 1994. Neither plan is eligible to employees hired after April 1993. The accounting for the plans anticipates that the Company will maintain a consistent level of cost sharing for the benefits with the retirees. The Company’s share of the projected costs of benefits that will be paid after retirement is generally being accrued by charges to expense over the eligible employees’ service periods to the dates they are fully eligible for benefits.
The Company sponsors a contributory defined contribution plan under Internal Revenue Code Section 401(k) for substantially all employees. In connection with the Business Separation, NTELOS transferred to the Company’s 401(k) plan an amount equal to the account balances of the Company’s employees and former employees in NTELOS’s 401(k) plan. Each of the Company’s participating employees was credited for all service accrued with NTELOS prior to such transfer for all purposes under the Company’s 401(k) plan. The Company’s policy is to match 100% of each participant’s annual contributions for contributions up to 1% of each participant’s annual compensation and 50% of each participant’s annual contributions up to an additional 5% of each participant’s annual compensation. Company contributions vest after two years of service.
Operating Leases
The Company has operating leases for administrative office space and equipment, certain of which have renewal options. These leases, with few exceptions, provide for automatic renewal options and escalations that are either fixed or based on the consumer price index. Any rent abatements, along with rent escalations, are included in the computation of rent expense calculated on a straight-line basis over the lease term. The Company’s minimum lease term for most leases includes the initial non-cancelable term and at least one renewal period to the extent that the exercise of the related renewal option or options is reasonably assured. A renewal option or options is determined to be reasonably assured if failure to renew the leases imposes an in-substance economic penalty on the Company. Leasehold improvements are depreciated over the shorter of the assets’ useful life or the lease term, including renewal option periods that are reasonably assured.
Income Taxes
Deferred income taxes are provided on an asset and liability method whereby deferred tax assets are recognized for deductible temporary differences and deferred tax liabilities are recognized for taxable temporary differences. Temporary differences are the differences between the reported amounts of assets and liabilities and their tax bases. Deferred tax assets and liabilities are adjusted for the effects of changes in tax laws and rates on the date of enactment. The Company accrues interest and penalties related to unrecognized tax benefits in interest expense and income tax expense, respectively. Prior to the Business Separation, the Company’s income taxes were included in the NTELOS consolidated federal income tax return and certain unitary or consolidated state income tax returns of NTELOS Holdings Corp. However, the Company’s income taxes were calculated and provided for on an “as if separate” tax return basis.
Equity-based Compensation
The Company accounts for share-based employee compensation plans under FASB ASC 718,Stock Compensation. Equity-based compensation expense from share-based equity awards is recorded with an offsetting increase to additional paid-in capital on the consolidated balance sheet. For equity awards with only service conditions, the Company recognizes compensation cost on a straight-line basis over the requisite service period for the entire award.
55
Equity awards prior to the Business Separation were granted in NTELOS stock instruments and the related expense was allocated to the Company. Unvested NTELOS stock instruments were converted to commensurate Lumos Networks stock instruments in connection with and at the time of the Business Separation. The fair value of the common stock options granted during the years ended December 31, 2012, 2011 and 2010 was estimated at the respective measurement date using the Black-Scholes option-pricing model with assumptions related to risk-free interest rate, expected volatility, dividend yield and expected terms.
Total equity-based compensation expense related to all of the share-based awards (Note 9) for the years ended December 31, 2012, 2011 and 2010 and the Company’s 401(k) matching contributions was allocated as follows:
| | | | | | | | | | | | |
(In thousands) | | 2012 | | | 2011 | | | 2010 | |
Cost of sales and services | | $ | 645 | | | $ | 314 | | | $ | 230 | |
Customer operations | | | 712 | | | | 419 | | | | 297 | |
Corporate operations | | | 2,555 | | | | 1,650 | | | | 1,002 | |
| | | | | | | | | | | | |
Equity-based compensation expense | | $ | 3,912 | | | $ | 2,383 | | | $ | 1,529 | |
| | | | | | | | | | | | |
Future charges for equity-based compensation related to instruments outstanding at December 31, 2012 for the years 2013 through 2017 are estimated to be $2.1 million, $2.1 million, $1.2 million, $0.1 million and $0.1 million, respectively.
Pro Forma Earnings (Loss) per Share (Unaudited)
The Company computes earnings (loss) per share based on the weighted average number of shares of common stock and dilutive potential common shares equivalents outstanding. Prior to November 1, 2011, the Company did not have any common stock outstanding and therefore, pro forma earnings (loss) per share for 2011 is calculated based on the two month period beginning November 1, 2011 and ending December 31, 2011 and is not applicable for 2010.
Recent Accounting Pronouncements
In June 2011, the FASB issued ASU 2011-05,Comprehensive Income (Topic 220): Presentation of Comprehensive Income. This ASU increases the prominence of other comprehensive income in financial statements. Under this ASU, an entity has the option to present the components of net income and comprehensive income in either one or two consecutive financial statements. The ASU eliminates the option in U.S. GAAP to present other comprehensive income in the statement of changes in equity. An entity should apply this ASU retrospectively. This ASU was effective for the Company as of January 1, 2012. We have complied with the requirements of this pronouncement by providing a consolidated statement of comprehensive income (loss), which follows the consolidated statement of operations in this annual report on Form 10-K.
| Note 4. | Disclosures About Segments of an Enterprise and Related Information |
The Company manages its business with separate products and services in two segments as described below.
Competitive: The Company directly or indirectly owns approximately 5,800 long-haul miles of fiber optic network which it utilizes to provide broadband services to enterprise, carrier and residential customers primarily in Virginia and West Virginia and portions of Pennsylvania, Maryland and Kentucky. The Competitive segment derives revenue from three major product families: strategic data, legacy voice and access. Strategic data products include enterprise data (dedicated internet, metro Ethernet, and private line), carrier data (transport and fiber to the cell site) and IP services (integrated access, DSL, broadband XL, and IP-based video). Legacy voice includes local lines, PRI, long distance and legacy dial-up Internet services products. Access primarily includes switched access and reciprocal compensation. As noted in the RLEC section below, revenue and operating expenses from services sold in the RLEC service areas that relate to unregulated services are reported in the Competitive segment. The Competitive segment pays the RLEC tariff and prevailing market rates for these services, the revenue and expense of which are eliminated in consolidation.
RLEC: The Company has two RLEC businesses subject to the regulations of the State Corporation Commission of Virginia. These businesses serve several areas in western Virginia, are fully integrated and are managed as one consolidated operation. The RLEC segment derives revenue from two key product families: legacy voice (primarily local service and features, toll and directory advertising) and access. The RLEC also provides IP-based video services and high speed broadband Internet to customers in areas where it has deployed fiber to the home. Revenues and operating expenses related to video and Internet services are reported in the Competitive segment.
Revenues from Verizon accounted for approximately 10% of the Company’s total revenue for the year ended December 31, 2012 and 9% and 12% of the Company’s total revenue for the years ended December 31, 2011 and 2010, respectively. Revenue from Verizon was derived from RLEC and Competitive segments’ access products.
56
Summarized financial information concerning the Company’s reportable segments is shown in the following table.
| | | | | | | | | | | | | | | | |
(In thousands) | | Competitive | | | RLEC | | | Eliminations | | | Total | |
As of and for the year ended December 31, 2012 | | | | | | | | | | | | | | | | |
Operating revenues | | $ | 157,720 | | | $ | 49,151 | | | $ | — | | | $ | 206,871 | |
| | | | |
Intersegment revenues(1) | | | 967 | | | | 4,862 | | | | (5,829 | ) | | | — | |
| | | | |
Depreciation and amortization | | | 26,341 | | | | 12,543 | | | | — | | | | 38,884 | |
| | | | |
Operating income | | | 25,257 | | | | 15,939 | | | | — | | | | 41,196 | |
| | | | |
Adjusted EBITDA(2) | | | 57,718 | | | | 31,171 | | | | — | | | | 88,889 | |
| | | | |
Capital expenditures | | | 52,582 | | | | 7,299 | | | | — | | | | 59,881 | |
| | | | |
Goodwill | | | 100,297 | | | | — | | | | — | | | | 100,297 | |
| | | | |
Total assets | | $ | 402,249 | | | $ | 110,913 | | | $ | — | | | $ | 513,162 | |
| | | | | | | | | | | | | | | | |
(In thousands) | | Competitive | | | RLEC | | | Eliminations | | | Total | |
As of and for the year ended December 31, 2011 | | | | | | | | | | | | | | | | |
Operating revenues | | $ | 154,397 | | | $ | 53,017 | | | $ | — | | | $ | 207,414 | |
| | | | |
Intersegment revenues(1) | | | 644 | | | | 4,632 | | | | (5,276 | ) | | | — | |
| | | | |
Depreciation and amortization | | | 29,487 | | | | 13,603 | | | | — | | | | 43,090 | |
| | | | |
Operating income (loss) | | | 29,955 | | | | (66,328 | ) | | | — | | | | (36,373 | ) |
| | | | |
Adjusted EBITDA(2) | | | 62,098 | | | | 34,842 | | | | — | | | | 96,940 | |
| | | | |
Capital expenditures | | | 45,720 | | | | 15,816 | | | | — | | | | 61,536 | |
| | | | |
Goodwill | | | 100,297 | | | | — | | | | — | | | | 100,297 | |
| | | | |
Total assets | | $ | 355,979 | | | $ | 142,621 | | | $ | — | | | $ | 498,600 | |
| | | | | | | | | | | | | | | | |
(In thousands) | | Competitive | | | RLEC | | | Eliminations | | | Total | |
For the year ended December 31, 2010 | | | | | | | | | | | | | | | | |
Operating revenues | | $ | 88,471 | | | $ | 57,493 | | | $ | — | | | $ | 145,964 | |
| | | | |
Intersegment revenues(1) | | | 1,036 | | | | 4,254 | | | | (5,290 | ) | | | — | |
| | | | |
Depreciation and amortization | | | 17,263 | | | | 14,102 | | | | — | | | | 31,365 | |
| | | | |
Operating income | | | 16,208 | | | | 24,921 | | | | — | | | | 41,129 | |
| | | | |
Adjusted EBITDA(2) | | | 37,316 | | | | 39,738 | | | | — | | | | 77,054 | |
| | | | |
Capital expenditures | | $ | 27,950 | | | $ | 12,304 | | | $ | — | | | $ | 40,254 | |
| (1) | Intersegment revenues consist primarily of telecommunications services such as local exchange services, inter-city and local transport voice and data services, and leasing of various network elements. Intersegment revenues are primarily recorded at tariff and prevailing market rates. |
| (2) | The Company evaluates performance based upon Adjusted EBITDA, defined by the Company as net income (loss) attributable to Lumos Networks Corp. before interest, income taxes, depreciation and amortization, accretion of asset retirement obligations, net income attributable to noncontrolling interests, other income or expenses, equity based compensation charges, acquisition related charges, amortization of actuarial losses on retirement plans, employee separation charges, restructuring related charges, gain or loss on settlements and gain or loss on interest rate derivatives. |
57
The following table provides a reconciliation of operating income (loss) to Adjusted EBITDA by reportable segment, as defined by the Company, for the years ended December 31, 2012, 2011 and 2010:
| | | | | | | | | | | | |
(In thousands) | | Competitive | | | RLEC | | | Total | |
For the year ended December 31, 2012 | | | | | | | | | | | | |
Operating income | | $ | 25,257 | | | $ | 15,939 | | | $ | 41,196 | |
Depreciation and amortization and accretion of asset retirement obligations | | | 26,439 | | | | 12,569 | | | | 39,008 | |
| | | | | | | | | | | | |
Sub-total: | | | 51,696 | | | | 28,508 | | | | 80,204 | |
Amortization of actuarial losses | | | 1,336 | | | | 445 | | | | 1,781 | |
Equity based compensation | | | 2,895 | | | | 1,017 | | | | 3,912 | |
Employee separation charges(1) | | | 1,759 | | | | 587 | | | | 2,346 | |
Restructuring charges(2) | | | 1,784 | | | | 1,197 | | | | 2,981 | |
Gain on settlements, net(3) | | | (1,752 | ) | | | (583 | ) | | | (2,335 | ) |
| | | | | | | | | | | | |
Adjusted EBITDA | | $ | 57,718 | | | $ | 31,171 | | | $ | 88,889 | |
| | | | | | | | | | | | |
| | | | | | | | | | | | |
(In thousands) | | Competitive | | | RLEC | | | Total | |
For the year ended December 31, 2011 | | | | | | | | | | | | |
Operating income (loss) | | $ | 29,955 | | | $ | (66,328 | ) | | $ | (36,373 | ) |
Depreciation and amortization and accretion of asset retirement obligations | | | 29,579 | | | | 13,627 | | | | 43,206 | |
| | | | | | | | | | | | |
Sub-total: | | | 59,534 | | | | (52,701 | ) | | | 6,833 | |
Asset impairment charges | | | — | | | | 86,295 | | | | 86,295 | |
Equity based compensation | | | 1,474 | | | | 909 | | | | 2,383 | |
Business separation charges(4) | | | 1,019 | | | | 339 | | | | 1,358 | |
Acquisition related charges(5) | | | 71 | | | | — | | | | 71 | |
| | | | | | | | | | | | |
Adjusted EBITDA | | $ | 62,098 | | | $ | 34,842 | | | $ | 96,940 | |
| | | | | | | | | | | | |
| | | | | | | | | | | | |
(In thousands) | | Competitive | | | RLEC | | | Total | |
For the year ended December 31, 2010 | | | | | | | | | | | | |
Operating Income | | $ | 16,208 | | | $ | 24,921 | | | $ | 41,129 | |
Depreciation and amortization and accretion of asset retirement obligations | | | 17,272 | | | | 14,104 | | | | 31,376 | |
| | | | | | | | | | | | |
Sub-total: | | | 33,480 | | | | 39,025 | | | | 72,505 | |
Equity based compensation | | | 816 | | | | 713 | | | | 1,529 | |
Acquisition related charges(5) | | | 3,020 | | | | — | | | | 3,020 | |
| | | | | | | | | | | | |
Adjusted EBITDA | | $ | 37,316 | | | $ | 39,738 | | | $ | 77,054 | |
| | | | | | | | | | | | |
| (1) | Employee separation charges include employee separation benefits which were provided for in the separation agreements of two executive officers who left the Company in April and December 2012. These charges are included in corporate operations expense on the condensed consolidated statement of operations. |
| (2) | In the fourth quarter of 2012, the Company announced a cost reduction plan involving an employee reduction-in-force, consolidation of certain facilities and freezing benefits under certain postretirement plans. Restructuring charges of $3.0 million were recognized in 2012 in connection with this plan (Note 12). |
| (3) | The net pre-tax gain on settlements was recognized in the third quarter of 2012 in connection with the settlement of outstanding matters related to a prior acquisition and the settlement of an outstanding lawsuit (Note 13). |
| (4) | Business Separation charges include audit, legal and other professional fees incurred during the period related to the Company’s separation from NTELOS Holdings Corp. into a separate publicly traded company (Note 1). These charges are included in corporate operations expense on the statement of operations. |
| (5) | Acquisition related charges include legal and other professional fees incurred during 2010 and 2011 related to the Company’s acquisition of the FiberNet business from One Communications Corp., which closed on December 1, 2010. |
58
As of December 31, 2012 and 2011, the Company’s outstanding long-term debt consisted of the following:
| | | | | | | | |
(In thousands) | | 2012 | | | 2011 | |
Credit facility | | $ | 311,022 | | | $ | 324,500 | |
Capital lease obligations | | | 1,203 | | | | 2,076 | |
| | | | | | | | |
| | | 312,225 | | | | 326,576 | |
| | |
Less: current portion of long-term debt | | | 7,900 | | | | 2,679 | |
| | | | | | | | |
| | $ | 304,325 | | | $ | 323,897 | |
| | | | | | | | |
Credit Facility
On September 8, 2011, Lumos Networks Operating Company, a wholly-owned subsidiary of Lumos Networks, entered into a $370 million post-Business Separation credit facility (the “Credit Facility”). Funding under the Credit Facility occurred upon the effective date of the Business Separation, which was October 31, 2011. The Credit Facility consists of a $60 million senior secured five year revolving credit facility (the “Revolver”), $3.5 million of which was outstanding as of December 31, 2012; a $110 million senior secured five year amortizing term loan (the “Term Loan A”); and a $200 million senior secured six year amortizing term loan (the “Term Loan B”). The proceeds of the Credit Facility were made available to Lumos Networks Operating Company on the effective date of the Business Separation and were used to fund a working capital cash reserve at Lumos Networks and to pay $315 million to NTELOS Inc. (i) to settle with cash the intercompany debt owed to NTELOS as of the Business Separation date ($177.1 million) and, with the balance, (ii) to fund a mandatory repayment on NTELOS’s credit facility resulting from the Business Separation. Pricing of the Lumos Networks Operating Company credit facility is LIBOR plus 3.25% for the Revolver and the Term Loan A and LIBOR plus 3.50% for the Term Loan B. The Credit Facility does not require a minimum LIBOR rate. The Credit Facility is secured by a first priority pledge of substantially all property and assets of Lumos Networks Operating Company and all material subsidiaries, as guarantors, excluding the RLECs.
The Credit Facility includes various restrictions and conditions, including covenants relating to leverage and interest coverage ratio requirements. At December 31, 2012, Lumos Networks’ leverage ratio (as defined under the credit agreement) was 3.50:1.00 and its interest coverage ratio was 8.00:1.00. The Credit Facility requires that the leverage ratio not exceed 4.00:1.00 through September 30, 2014 (and 3.75:1.00 thereafter) and the interest coverage ratio not be less than 3.25:1:00. The Credit Facility also sets a maximum distributable amount that limits restricted payments, including the payment of dividends. The initial distributable amount was set at $5 million at the date of funding and, on January 1, 2012, the distributable amount was increased by $12 million. For each year thereafter the amount will be increased by the greater of $12 million or 75% of free cash flow (as defined under the credit agreement). Based on the excess cash flow calculation for the year ended December 31, 2012, the distributable amount was increased by $12 million on January 1, 2013. The distributable amount is reduced by any restricted payments including dividend payments. The distributable amount as of December 31, 2012 was $5.1 million.
Under the terms of the Credit Facility, the Company was required to enter into an interest rate hedge for three years on 50% of the term loans outstanding early in the first quarter of 2012. In February 2012, the Company entered into a 3% interest rate cap through December 31, 2012 and a delayed interest rate swap agreement from December 31, 2012 through December 31, 2015 whereby the Company swaps three-month LIBOR with a fixed rate of approximately 0.8%. The Company recognized a $1.9 million loss on derivative instruments as a result of changes in the fair value of the interest rate swap during the year ended December 31, 2012.
In connection with entering into the Credit Facility, the Company has deferred $4.9 million in debt issuance costs which are being amortized to interest expense over the life of the debt using the effective interest method. Amortization of these costs for the year ended December 31, 2012 was $0.8 million.
The Company receives patronage credits from CoBank and certain other of the Farm Credit System lending institutions (collectively referred to as “patronage banks”) which are not reflected in the interest rates above. The patronage banks hold a portion of the credit facility and are cooperative banks that are required to distribute their profits to their members. Patronage credits are calculated based on the patronage banks’ ownership percentage of the credit facility and are received by the Company as either a cash distribution or as equity in the patronage banks. The current patronage credit percentages are 65% in cash and 35% in equity. These credits are recorded in the consolidated statement of operations as an offset to interest expense. The Patronage credits for the year ended December 31, 2012 were $1.0 million.
The aggregate maturities of the Term Loan A and Term Loan B are $7.5 million per year in 2013 and 2014, $13.0 million in 2015, $90.0 million in 2016, $189.5 million in 2017. The revolver is payable in full in 2016.
The Company’s blended average interest rate on its long-term debt for the year ended December 31, 2012 was 3.79%.
Capital lease obligations
In addition to the long-term debt discussed above, the Company has entered into capital leases on vehicles with original lease terms of four to five years. In addition, the Company had $0.6 million of capital leases on telephony equipment assumed in a prior acquisition, which were paid in full in the fourth quarter of 2012 in connection with a sale of the related assets. At December 31, 2012, the carrying value and accumulated depreciation of these assets was $2.5 million and $1.4 million, respectively. As of December 31, 2012, the total net present value of the Company’s future minimum lease payments was $1.2 million. As of December 31, 2012, the principal portion of these capital lease obligations was due as follows: $0.4 million in 2013, $0.3 million in 2014, $0.3 million in 2015, $0.2 million in 2016 and less than $0.1 million thereafter.
59
| Note 6. | Supplementary Disclosures of Cash Flow Information |
The following information is presented as supplementary disclosures for the consolidated statements of cash flows for the years ended December 31, 2012, 2011 and 2010:
| | | | | | | | | | | | |
(In thousands) | | 2012 | | | 2011 | | | 2010 | |
Cash payments for: | | | | | | | | | | | | |
Interest (net of amounts capitalized) | | $ | 11,972 | | | $ | 2,261 | | | $ | 29 | |
Income taxes | | | 1,892 | | | | 87 | | | | 263 | |
Supplemental investing and financing activities: | | | | | | | | | | | | |
Additions to property and equipment included in accounts payable and other accrued liabilities | | | 6,621 | | | | 2,900 | | | | 2,492 | |
Borrowings under capital leases | | | 380 | | | | 990 | | | | 498 | |
Dividends paid through increase in borrowings from NTELOS Inc. | | | — | | | | 14,145 | | | | 29,240 | |
Dividend declared not paid | | $ | 3,013 | | | $ | 2,980 | | | $ | — | |
The amount of interest capitalized was $0.1 million, less than $0.1 million and $0.1 million for the years ended December 31, 2012, 2011 and 2010, respectively.
The net assets acquired by Lumos Networks in the Business Separation were effectively settled with the $315 million cash payment from Lumos Networks to NTELOS on October 31, 2011 (Note 2). Of this payment, $177.1 million represented the payoff of intercompany debt owed to NTELOS and the transfer of assets and liabilities between NTELOS and the subsidiaries of NTELOS that now comprise Lumos Networks.
| Note 7. | Financial Instruments |
The Company is exposed to market risks with respect to certain of the financial instruments that it holds. Cash, accounts receivable, accounts payable and accrued liabilities are reflected in the consolidated financial statements at cost which approximates fair value because of the short-term maturity of these instruments. The fair value of the senior credit facility was estimated based on an analysis of the forward-looking interest rates as of December 31, 2012, compared to the forward looking interest rates at inception, assuming no change in the credit profile of the Company or market demand for similar instruments. The Company’s valuation technique for this instrument is considered to be a level three fair value measurement within the fair value hierarchy described in FASB ASC 820. The fair values of the derivative instruments (Note 5) were derived based on quoted trading prices obtained from the administrative agents as of December 31, 2012. The Company’s valuation technique for these instruments is considered to be level two fair value measurements within the fair value hierarchy described in FASB ASC 820. The fair values of other financial instruments, if applicable, are based on quoted market prices or discounted cash flows based on current market conditions.
The following table indicates the difference between face amount, carrying amount and fair value of the Company’s financial instruments at December 31, 2012 and 2011.
| | | | | | | | | | | | |
(In thousands) | | Face Amount | | | Carrying
Amount | | | Fair Value | |
December 31, 2012 | | | | | | | | | | | | |
Financial assets: | | | | | | | | | | | | |
Cash | | $ | 2 | | | $ | 2 | | | $ | 2 | |
Long-term investments for which it is not practicable to estimate fair value | | | N/A | | | | 462 | | | | N/A | |
Financial liabilities: | | | | | | | | | | | | |
Senior credit facility | | | 311,022 | | | | 311,022 | | | | 320,739 | |
Capital lease obligations | | | 1,203 | | | | 1,203 | | | | 1,203 | |
Derivatives related to debt: | | | | | | | | | | | | |
Interest rate swap liability | | | 153,750 | * | | | 1,871 | | | | 1,871 | |
| | | |
December 31, 2011 | | | | | | | | | | | | |
Financial assets: | | | | | | | | | | | | |
Cash | | $ | 10,547 | | | $ | 10,547 | | | $ | 10,547 | |
Long-term investments for which it is not practicable to estimate fair value | | | N/A | | | | 128 | | | | N/A | |
Financial liabilities: | | | | | | | | | | | | |
Senior credit facility | | | 324,500 | | | | 324,500 | | | | 324,500 | |
Capital lease obligations | | $ | 2,076 | | | $ | 2,076 | | | $ | 2,076 | |
60
Of the long-term investments for which it is not practicable to estimate fair value in the table above, $0.4 million as of December 31, 2012 represents the Company’s investment in CoBank. This investment is primarily related to patronage distributions of restricted equity and is a required investment related to the portion of the credit facility loan held by CoBank. This investment is carried under the cost method.
| Note 8. | Stockholders’ Equity |
On February 27, 2013, the Company’s board of directors declared a quarterly dividend on its common stock in the amount of $0.14 per share, which is to be paid on April 11, 2013 to stockholders of record on March 13, 2013.
Prior to the Business Separation, the Company did not have any common stock outstanding. As such, basic loss per share for the year ended December 31, 2011 is computed on a pro forma basis by dividing net loss by the weighted average number of common shares outstanding during the two month post-Business Separation period beginning November 1, 2011 and ending December 31, 2011, as if such shares had been outstanding for the entire year. Diluted loss per share is calculated in a similar manner, but includes the dilutive effect of actual stock options and restricted shares outstanding as of December 31, 2011. Since these securities are anti-dilutive, they are excluded from the calculation of loss per share at December 31, 2011.
The computations of basic and diluted earnings per share for the year ended December 31, 2012 and the unaudited computation of pro forma basic and diluted loss per share for the year ended December 31, 2011 are as follows:
| | | | | | | | |
(In thousands) | | 2012 | | | Pro Forma
2011 (Unaudited) | |
Numerator: | | | | | | | | |
Income (loss) applicable to common shares for earnings-per-share computation | | $ | 16,340 | | | $ | (43,930 | ) |
| | | | | | | | |
| | |
Denominator: | | | | | | | | |
Total shares outstanding | | | 21,498 | | | | 21,170 | |
Less: unvested shares | | | (342 | ) | | | (352 | ) |
Less: effect of calculating weighted average shares | | | (198 | ) | | | (3 | ) |
| | | | | | | | |
Denominator for basic earnings per common share-weighted average shares outstanding | | | 20,958 | | | | 20,815 | |
Plus: weighted average unvested shares | | | 434 | | | | — | |
Plus: common stock equivalents of stock options outstanding | | | 15 | | | | — | |
| | | | | | | | |
Denominator for diluted earnings per common share-weighted average shares outstanding | | | 21,407 | | | | 20,815 | |
| | | | | | | | |
For the year ended December 31, 2012, the denominator for diluted earnings per common share excludes 1,546,900 shares related to stock options which would be antidilutive for the period. For the year ended December 31, 2011, the denominator for diluted loss per common share is equal to the denominator for basic loss per common share because the addition of unvested shares or other common stock equivalents would be anti-dilutive (416,417 at December 31, 2011).
The Company has an Equity and Cash Incentive Plan administered by the Compensation Committee of the Company’s board of directors, which permits the grant of long-term incentives to employees and non-employee directors, including stock options, stock appreciation rights, restricted stock awards, restricted stock units, incentive awards, other stock-based awards and dividend equivalents. The maximum number of shares of common stock available for awards under the Equity and Cash Incentive Plan is 4,000,000. As of December 31, 2012, 1,475,441 securities remained available for issuance under the Equity and Cash Incentive Plan. Upon the exercise of stock options or upon the grant of restricted stock under the Equity and Cash Incentive Plan, new common shares are issued.
61
The Company issued 863,004 stock options and 313,703 shares of restricted stock under the Equity and Cash Incentive Plan during the year ended December 31, 2012. The options issued under the Employee Equity and Cash Incentive Plan generally vest one-fourth annually beginning one year after the grant date for employees and generally cliff vest on the first anniversary of the grant date for non-employee directors. The restricted shares generally cliff vest on the third anniversary of the grant date for employees and generally cliff vest on the first anniversary of the grant date for non-employee directors. Dividend rights applicable to restricted stock are equivalent to the Company’s common stock.
Stock options must be granted under the Equity and Cash Incentive Plan at not less than 100% of fair value on the date of grant and have a maximum life of ten years from the date of grant. Options and other awards under the Equity and Cash Incentive Plan may be exercised in compliance with such requirements as determined by a committee of the board of directors. All options outstanding were issued at a strike price equal to or greater than the fair value on the date of grant.
The fair value of each option award is estimated on the grant date using the Black-Scholes option-pricing model and the assumptions noted in the table below. The risk-free rate is based on the zero-coupon U.S. Treasury rate in effect at the time of grant, with a term equal to the expected life of the options. The Company uses peer group and other publicly available market data to estimate volatility assumptions as the Company was not publicly traded until November 2011 and does not have an adequate trading history to estimate its actual volatility. The expected option life represents the period of time that the options granted are expected to be outstanding. The expected dividend yield is estimated based on the Company’s expected dividend yields at the date of the grant.
The weighted-average grant date fair value per share of stock options granted during the year ended December 31, 2012 was $2.34. The weighted-average grant date fair value per share of stock options granted subsequent to the Business Separation through December 31, 2011 was $3.95. The following weighted-average assumptions were used in estimating the grant date fair value of these awards:
| | | | | | | | |
| | | Year Ended
December 31, 2012 | | | November 1, 2011
through
December 31, 2011 | |
Risk-free interest rate | | | 1.40% | | | | 1.55% | |
Expected volatility | | | 43.42% | | | | 34.70% | |
Expected dividend yield | | | 5.77% | | | | 3.10% | |
Expected term | | | 7 years | | | | 7 years | |
The summary of the activity and status of the Company’s stock options for the years ended December 31, 2012 and 2011, is as follows:
| | | | | | | | | | | | | | | | |
(In thousands, except per share amounts) | | Shares | | | Weighted
Average Exercise
Price per Share | | | Weighted-
Average
Remaining
Contractual
Term | | | Aggregate
Intrinsic Value | |
Stock options outstanding at January 1, 2011 | | | — | | | $ | — | | | | | | | | | |
Converted options issued by the Company on the October 31, 2011 Business Separation date(1) | | | 1,464 | | | | 14.58 | | | | | | | | | |
Granted subsequent to the Business Separation | | | 21 | | | | 15.48 | | | | | | | | | |
Forfeited subsequent to the Business Separation | | | (137 | ) | | | 14.67 | | | | | | | | | |
| | | | | | | | | | | | | | | | |
Outstanding at December 31, 2011 | | | 1,348 | | | $ | 14.58 | | | | 7.8 years | | | $ | 1,022 | |
| | | | | | | | | | | | | | | | |
Granted during the period | | | 863 | | | | 9.79 | | | | | | | | | |
Exercised during the period | | | — | | | | — | | | | | | | | | |
Forfeited during the period | | | (287 | ) | | | 13.95 | | | | | | | | | |
Expired during the period | | | (210 | ) | | | 14.78 | | | | | | | | | |
| | | | | | | | | | | | | | | | |
Outstanding at December 31, 2012 | | | 1,714 | | | $ | 12.29 | | | | 7.6 years | | | $ | 1,002 | |
| | | | | | | | | | | | | | | | |
| | | | |
Exercisable at December 31, 2012 | | | 725 | | | $ | 13.97 | | | | 5.8 years | | | $ | 230 | |
| | | | | | | | | | | | | | | | |
Total outstanding, vested and expected to vest at December 31, 2012 | | | 1,576 | | | $ | 12.53 | | | | | | | $ | 849 | |
| | | | | | | | | | | | | | | | |
| (1) | Upon the Business Separation on October 31, 2011, all outstanding NTELOS stock options for the Company’s employees and non-employee directors were replaced with 1,463,819 Company stock options based on a formula designed to preserve the intrinsic value and fair value of the awards immediately prior to the Business Separation. The specific formula for the adjustment of the number of stock options and restricted stock and the strike price of the stock options was contained in the employee matters agreement that was executed on the date of separation. These awards had substantially the same terms and conditions as the NTELOS stock options and restricted stock awards that they replaced. |
62
No options were exercised during the year ended December 31, 2012 or during the period subsequent to the Business Separation through December 31, 2011. The total fair value of options that vested during the year ended December 31, 2012 was $1.1 million. The total fair value of options that vested subsequent to the Business Separation through December 31, 2011 was $0.1 million. As of December 31, 2012, there was $1.6 million of total unrecognized compensation cost related to unvested stock options, which is expected to be recognized over a weighted-average period of 3.6 years.
The summary of the activity and status of the Company’s restricted stock for the years ended December 31, 2012 and 2011, is as follows:
| | | | | | | | |
(In thousands, except per share amounts) | | Shares | | | Weighted Average
Grant Date Fair
Value per Share | |
Restricted stock outstanding at January 1, 2011 | | | — | | | $ | — | |
Converted restricted stock issued by the Company on the October 31, 2011 Business Separation date(1) | | | 410 | | | | 14.46 | |
Granted subsequent to the Business Separation | | | 7 | | | | 15.20 | |
Forfeited subsequent to the Business Separation | | | (65 | ) | | | 14.54 | |
| | | | | | | | |
Restricted stock outstanding at December 31, 2011 | | | 352 | | | $ | 14.46 | |
| | | | | | | | |
Granted during the period | | | 313 | | | | 10.16 | |
Vested during the period | | | (215 | ) | | | 12.91 | |
Forfeited during the period | | | (108 | ) | | | 13.92 | |
| | | | | | | | |
Restricted stock outstanding at December 31, 2012 | | | 342 | | | $ | 11.67 | |
| | | | | | | | |
| (1) | Upon the Business Separation on October 31, 2011, all outstanding NTELOS restricted stock awards for the Company’s employees and non-employee directors were replaced with 409,690 Company restricted stock awards based on a formula designed to preserve the intrinsic value and fair value of the awards immediately prior to the Business Separation. The specific formula for the adjustment of the number of stock options and restricted stock and the strike price of the stock options was contained in the employee matters agreement that was executed on the date of separation. These awards had substantially the same terms and conditions as the NTELOS stock options and restricted stock awards that they replaced. |
As of December 31, 2012, there was $2.3 million of total unrecognized compensation cost related to unvested restricted stock awards, which is expected to be recognized over a weighted-average period of 2.3 years. The fair value of the restricted stock is equal to the market value of common stock on the date of grant.
In addition to the Equity and Cash Incentive Plan discussed above, the Company has an employee stock purchase plan which commenced in November 2011 with 100,000 shares available. New common shares will be issued for purchases under this plan. Shares are priced at 85% of the closing price on the last trading day of the month and settle on the second business day of the following month. During the year ended December 31, 2012, 12,957 shares were issued under the employee stock purchase plan. During the period November 1, 2011 through December 31, 2011, 719 shares were issued under the employee stock purchase plan. Compensation expense associated with the employee stock purchase plan was less than $0.1 million for the year ended December 31, 2012. Compensation expense associated with the employee stock purchase plan was not material in the period November 1, 2011 through December 31, 2011.
63
The components of income tax expense (benefit) are as follows for the years ended December 31, 2012, 2011 and 2010:
| | | | | | | | | | | | |
(In thousands) | | 2012 | | | 2011 | | | 2010 | |
Current tax expense: | | | | | | | | | | | | |
Federal | | $ | — | | | $ | — | | | $ | 8,515 | |
State | | | 496 | | | | 3,727 | | | | 2,499 | |
| | | | | | | | | | | | |
Total current tax expense | | | 496 | | | | 3,727 | | | | 11,014 | |
| | | | | | | | | | | | |
| | | |
Deferred tax expense (benefit): | | | | | | | | | | | | |
Federal | | | 8,982 | | | | (3,657 | ) | | | 3,275 | |
State | | | 1,532 | | | | (4,453 | ) | | | 188 | |
| | | | | | | | | | | | |
Total deferred tax expense (benefit) | | | 10,514 | | | | (8,110 | ) | | | 3,463 | |
| | | | | | | | | | | | |
Total income tax expense (benefit) | | $ | 11,010 | | | $ | (4,383 | ) | | $ | 14,477 | |
| | | | | | | | | | | | |
Total income tax expense was different than an amount computed by applying the graduated statutory federal income tax rates to income before taxes. The reasons for the differences are as follows for the years ended December 31, 2012, 2011 and 2010:
| | | | | | | | | | | | |
(In thousands) | | 2012 | | | 2011 | | | 2010 | |
Computed tax expense (benefit) at statutory federal rate of 35% | | $ | 9,610 | | | $ | (16,891 | ) | | $ | 12,397 | |
Nondeductible goodwill impairment charge | | | — | | | | 11,703 | | | | — | |
Nondeductible compensation | | | 91 | | | | 637 | | | | 378 | |
Noncontrolling interests | | | (37 | ) | | | 18 | | | | (42 | ) |
State income taxes (benefits), net of federal income tax benefit (expense) | | | 1,318 | | | | (472 | ) | | | 1,746 | |
Other | | | 28 | | | | 622 | | | | (2 | ) |
| | | | | | | | | | | | |
Total income tax expense (benefit) | | $ | 11,010 | | | $ | (4,383 | ) | | $ | 14,477 | |
| | | | | | | | | | | | |
During 2012, the Company recognized a tax benefit of approximately $0.4 million in additional paid-in capital associated with the excess tax benefit realized by the Company related to stock compensation plans. The Company recognized a tax benefit of $2.7 million in accumulated other comprehensive income associated with the adjustments to various employee benefit plan liabilities for the year ended December 31, 2012 in accordance with FASB ASC 715. The amount recognized in accumulated other comprehensive income was $1.8 million for the post Business Separation period in 2011. Additionally, on the date of the Business Separation, in connection with the transfer of these underlying employee benefit plans, $9.0 million of the related NTELOS deferred tax benefit associated with the unrealized actuarial losses from these plans was transferred to the Company.
Net deferred income tax assets and liabilities consist of the following components as of December 31, 2012 and 2011:
| | | | | | | | |
(In thousands) | | 2012 | | | 2011 | |
Deferred income tax assets: | | | | | | | | |
Retirement benefits other than pension | | $ | 5,053 | | | $ | 5,349 | |
Pension and related plans | | | 6,228 | | | | 9,022 | |
Net operating loss | | | 4,346 | | | | 5,020 | |
Debt issuance and discount | | | — | | | | — | |
Accrued expenses | | | 4,146 | | | | 2,623 | |
Other | | | 1,379 | | | | 2,523 | |
| | | | | | | | |
| | | 21,152 | | | | 24,537 | |
| | | | | | | | |
Deferred income tax liabilities: | | | | | | | | |
Property and equipment | | | 67,493 | | | | 57,098 | |
Intangibles | | | 9,615 | | | | 8,643 | |
| | | | | | | | |
| | |
| | | 77,108 | | | | 65,741 | |
| | | | | | | | |
Net deferred income tax liability | | $ | 55,956 | | | $ | 41,204 | |
| | | | | | | | |
The Company has prior year unused net operating losses (“NOLs”) totaling $10.9 million as of December 31, 2012. The NOLs include $3.9 million that was assigned to the Company as a result of the Business Separation and are subject to an adjusted annual maximum limit due to the application of Section 382 of the Internal Revenue Code. The Company’s NOLs, if not utilized to reduce taxable income in future periods, will expire in varying amounts from 2023 through 2031. The Company believes that it is more likely than not that the results of future operations will generate sufficient taxable income to realize the deferred tax assets.
64
The Company recognizes interest related to unrecognized income tax benefits (“UTBs”) in interest expense and penalties on UTBs in income tax expense. A reconciliation of the change in the UTB balance for the years ended December 31, 2012 and 2010 is as follows:
| | | | | | | | |
(In thousands) | | 2012 | | | 2011 | |
Balance at beginning of year | | $ | 484 | | | $ | 500 | |
Additions for tax positions related to the current year | | | 82 | | | | — | |
Increases (reductions) for tax positions related to prior years | | | 43 | | | | (16 | ) |
| | | | | | | | |
| | $ | 609 | | | $ | 484 | |
| | | | | | | | |
While the Company believes it has adequately provided for all tax positions, amounts asserted by taxing authorities could be greater than its accrued position. Accordingly, additional provisions could be recorded in the future as revised estimates are made or the underlying matters are settled or otherwise resolved. In general, the tax years that remain open and subject to federal and state audit examinations are 2009-2011 and 2008-2011, respectively.
| Note 11. | Pension Plans and Other Postretirement Benefits |
The Company sponsors a non-contributory defined benefit pension plan (“Pension Plan”), as well as non-qualified pension plans and other postretirement benefit plans (“OPEBs”) for its eligible employees. The Company’s total periodic benefit cost recognized for all qualified and nonqualified pension and OPEBs plans was $2.2 million, $2.8 million and $2.4 million in 2012, 2011 and 2010, respectively. A portion of the costs for 2011 and 2010 were allocated to the Company by NTELOS, when its employees were participating in similar plans sponsored by NTELOS. Concurrent with the Business Separation, the Company established its own qualified and nonqualified pension plans and OPEBs for its employees. The Company initially measured the plans as of October 31, 2011 based on actual plan assets transferred to the Company effective upon the Business Separation and the actual plan participants and their respective accrued benefits. In addition to the transfer of the assets and obligations from these plans, the related unrealized actuarial losses from these plans as determined on the October 31, 2011 measurement date was transferred from NTELOS.
Effective December 31, 2012, the Company froze the accumulation of benefits under the Pension Plan and the supplemental executive retirement plan in conjunction with a cost reduction plan that was announced in mid-December 2012. As such, no further benefits will be accrued by plan participants for services rendered after this date under either of these plans.
The following tables provide a reconciliation of the changes in the qualified plans’ benefit obligations and fair value of assets and a statement of the funded status as of December 31, 2012 and 2011 and the classification of amounts recognized in the consolidated balance sheets:
| | | | | | | | | | | | | | | | |
| | | Defined Benefit Pension Plan | | | Other Postretirement Benefit Plans | |
(In thousands) | | Year Ended
December 31,
2012 | | | November 1, 2011
to December 31,
2011 | | | Year Ended
December 31,
2012 | | | November 1, 2011
to December 31,
2011 | |
Change in benefit obligations: | | | | | | | | | | | | | | | | |
Benefit obligations, beginning of period | | $ | 64,061 | | | $ | 60,181 | | | $ | 12,511 | | | $ | 12,157 | |
Service cost | | | 2,043 | | | | 312 | | | | 78 | | | | 12 | |
Interest cost | | | 2,698 | | | | 451 | | | | 525 | | | | 91 | |
Actuarial loss | | | 5,942 | | | | 3,528 | | | | 201 | | | | 318 | |
Benefits paid, net | | | (2,475 | ) | | | (411 | ) | | | (441 | ) | | | (67 | ) |
Curtailment gain | | | (8,519 | ) | | | — | | | | — | | | | — | |
Transfer | | | 761 | | | | — | | | | — | | | | — | |
| | | | | | | | | | | | | | | | |
| | | | |
Benefit obligations, end of period | | | 64,511 | | | | 64,061 | | | | 12,874 | | | | 12,511 | |
| | | | | | | | | | | | | | | | |
| | | | |
Change in plan assets: | | | | | | | | | | | | | | | | |
Fair value of plan assets, beginning of period | | | 45,109 | | | | 45,531 | | | | — | | | | — | |
Actual return on plan assets | | | 6,610 | | | | (11 | ) | | | — | | | | — | |
Employer contributions | | | 2,000 | | | | — | | | | 441 | | | | 67 | |
Benefits paid | | | (2,492 | ) | | | (411 | ) | | | (441 | ) | | | (67 | ) |
Transfer | | | 448 | | | | — | | | | — | | | | — | |
| | | | | | | | | | | | | | | | |
Fair value of plan assets, end of period | | | 51,675 | | | | 45,109 | | | | — | | | | — | |
| | | | | | | | | | | | | | | | |
| | | | |
Funded status: | | | | | | | | | | | | | | | | |
Total liability, end of period | | $ | 12,836 | | | $ | 18,952 | | | $ | 12,874 | | | $ | 12,511 | |
| | | | | | | | | | | | | | | | |
65
The accumulated benefit obligation for the defined benefit pension plan at December 31, 2012 and 2011 was $64.5 million and $56.5 million, respectively. The accumulated benefit obligation represents the present value of pension benefits based on service and salary earned to date. The benefit obligation indicated in the table above is the projected benefit obligation which represents the present value of pension benefits taking into account projected future service and salary increases. The projected benefit obligation is equal to the accumulated benefit obligation as of December 31, 2012 due to the Company’s freezing of benefits under the Plan effective as of this same date.
The Company has classified the projected amount to be paid in 2013 of $0.9 million related to the other postretirement benefit plans and the nonqualified pension plans (discussed below) in current liabilities under the caption “other accrued liabilities” on the Company’s consolidated balance sheets at December 31, 2012.
The following table provides the components of net periodic benefit cost for the plans for the year ended December 31, 2012 and the period November 1, 2011 to December 31, 2011:
| | | | | | | | | | | | | | | | |
| | | Defined Benefit Pension Plan | | | Other Postretirement Benefit Plans | |
(In thousands) | | Year Ended
December 31,
2012 | | | November 1, 2011
to December 31,
2011 | | | Year Ended
December 31,
2012 | | | November 1, 2011
to December 31,
2011 | |
Components of net periodic benefit cost: | | | | | | | | | | | | | | | | |
Service cost | | $ | 2,043 | | | $ | 312 | | | $ | 78 | | | $ | 12 | |
Interest cost | | | 2,698 | | | | 451 | | | | 525 | | | | 91 | |
Expected return on plan assets | | | (3,517 | ) | | | (571 | ) | | | — | | | | — | |
Amortization of loss | | | 1,481 | | | | 197 | | | | — | | | | — | |
| | | | | | | | | | | | | | | | |
Net periodic benefit cost | | $ | 2,705 | | | $ | 389 | | | $ | 603 | | | $ | 103 | |
| | | | | | | | | | | | | | | | |
Prior service costs are amortized on a straight-line basis over the average remaining service period of active participants. Gains and losses in excess of 10% of the greater of the benefit obligation and the market-related value of assets are amortized over the average remaining service period of active participants.
Unrecognized actuarial losses for the year ended December 31, 2012 were $2.9 million and $0.2 million for the defined benefit pension plan and the other postretirement benefit plans, respectively. A curtailment gain of $8.5 million was recognized as of December 31, 2012 in connection with the Company’s freezing of the defined benefit pension plan. The curtailment gain was recorded as an offset to unrecognized actuarial losses in accumulated other comprehensive income. The total amount of unrecognized actuarial losses recorded in accumulated other comprehensive loss at December 31, 2012 related to the defined benefit pension plan and the other postretirement benefit plans, respectively, was $10.3 million, net of a $6.5 million deferred tax asset, and $0.9 million, net of a $0.6 million deferred tax asset.
Unrecognized actuarial losses for the period November 1, 2011 through December 31, 2011 were $4.1 million and $0.3 million for the defined benefit pension plan and the other postretirement benefit plans, respectively. The total amount of unrecognized actuarial losses recorded in accumulated other comprehensive loss at December 31, 2011 related to these respective plans was $14.4 million, net of a $9.2 million deferred tax asset, and $0.8 million, net of a $0.5 million deferred tax asset.
The assumptions used in the measurements of the Company’s benefit obligations at December 31, 2012 and 2011 are shown in the following table:
| | | | | | | | | | | | | | | | |
| | | Defined Benefit Pension Plan | | | Other Postretirement Benefit Plans | |
| | | December 31,
2012 | | | December 31,
2011 | | | December 31,
2012 | | | December 31,
2011 | |
Discount rate | | | 3.85 | % | | | 4.30 | % | | | 3.85 | % | | | 4.30 | % |
Rate of compensation increase | | | 3.00 | % | | | 3.00 | % | | | N/A | | | | N/A | |
The assumptions used in the measurements of the Company’s net cost for the consolidated statement of operations for the year ended December 31, 2012 and for the period November 1, 2011 through December 31, 2011 are:
| | | | | | | | | | | | | | | | |
| | | Defined Benefit Pension Plan | | | Other Postretirement Benefit Plans | |
| | | Year Ended
December 31,
2012 | | | November 1, 2011
to December 31,
2011 | | | Year Ended
December 31,
2012 | | | November 1, 2011
to December 31,
2011 | |
Discount rate | | | 4.30 | % | | | 4.60 | % | | | 4.30 | % | | | 4.60 | % |
Expected return on plan assets | | | 7.75 | % | | | 7.75 | % | | | N/A | | | | N/A | |
Rate of compensation increase | | | 3.00 | % | | | 3.00 | % | | | N/A | | | | N/A | |
66
The Company reviews the assumptions noted in the above table annually or more frequently to reflect anticipated future changes in the underlying economic factors used to determine these assumptions. The discount rates assumed reflect the rate at which the Company could invest in high quality corporate bonds in order to settle future obligations. In doing so, the Company utilizes a Citigroup Pension Discount Curve applied against the Company’s estimated defined benefit payments to derive a blended rate. The Citigroup Pension Discount Curve is derived from over 350 Aa corporate bonds. The Company also compares this to a Moody’s ten year Aa bond index for reasonableness.
For measurement purposes, a 7.0% annual rate of increase in the per capita cost of covered health care benefits was assumed for 2013 for the obligation as of December 31, 2012. The rate was assumed to decrease one-half percent per year to a rate of 5.0% for 2017 and remain at that level thereafter.
Assumed health care cost trend rates have a significant effect on the amounts reported for the health care plans. The effect of a 1% change on the medical trend rate per future year, while holding all other assumptions constant, to the service and interest cost components of net periodic postretirement health care benefit costs and accumulated postretirement benefit obligation would be a $0.1 million increase and a $1.9 million increase, respectively, for a 1% increase in medical trend rate and a $0.1 million decrease and a $1.6 million decrease, respectively, for a 1% decrease in medical trend rate.
In developing the expected long-term rate of return assumption for the assets of the Defined Benefit Pension Plan, the Company evaluated input from its third party pension plan asset managers, including their review of asset class return expectations and long-term inflation assumptions. The Company also considered the related historical ten-year average asset return at December 31, 2012 as well as considering input from the Company’s third party pension plan asset managers.
The weighted average actual asset allocations by asset category and the fair value by asset category as of December 31, 2012 and 2011 were as follows:
| | | | | | | | | | | | | | | | |
(Dollars in thousands) | | December 31, 2012 | | | December 31, 2011 | |
Asset Category | | Actual Allocation | | | Fair Value | | | Actual Allocation | | | Fair Value | |
Large Cap Value | | | 32 | % | | $ | 16,395 | | | | 34 | % | | $ | 15,088 | |
Large Cap Blend | | | 16 | % | | | 8,169 | | | | 17 | % | | | 7,536 | |
Mid Cap Blend | | | 6 | % | | | 3,149 | | | | 6 | % | | | 2,846 | |
Small Cap Blend | | | 4 | % | | | 2,134 | | | | 4 | % | | | 1,896 | |
Foreign Stock - Large Cap | | | 7 | % | | | 3,696 | | | | 7 | % | | | 3,040 | |
Bond | | | 32 | % | | | 16,405 | | | | 29 | % | | | 13,281 | |
Cash and cash equivalents | | | 3 | % | | | 1,727 | | | | 3 | % | | | 1,422 | |
| | | | | | | | | | | | | | | | |
Total | | | 100 | % | | $ | 51,675 | | | | 100 | % | | $ | 45,109 | |
| | | | | | | | | | | | | | | | |
The actual and target allocation for plan assets is broadly defined and measured as follows:
| | | | | | | | | | | | |
| | | December 31, 2012 | | | December 31, 2011 | |
Asset Category | | Actual Allocation | | | Target Allocation | | | Actual Allocation | |
Equity securities | | | 65 | % | | | 65 | % | | | 67 | % |
Bond securities and cash equivalents | | | 35 | % | | | 35 | % | | | 33 | % |
| | | | | | | | | | | | |
Total | | | 100 | % | | | 100 | % | | | 100 | % |
| | | | | | | | | | | | |
It is the Company’s policy to invest pension plan assets in a diversified portfolio consisting of an array of asset classes. The investment risk of the assets is limited by appropriate diversification both within and between asset classes. The assets are primarily invested in investment funds that invest in a broad mix of publicly traded equities, bonds and cash equivalents (and fair value is based on quoted market prices (“level 1” input)). The allocation between equity and bonds is reset quarterly to the target allocations. Updates to the allocation are considered in the normal course and changes may be made when appropriate. The bond holdings consist of three bond funds split relatively evenly between these funds at December 31, 2012. At December 31, 2012, the Company believes that there are no material concentrations of risk within the portfolio of plan assets.
The assumed long term return noted above is the target long term return. Overall return, risk adjusted return, and management fees are assessed against a peer group and benchmark indices. Reporting on asset performance is provided quarterly and review meetings are held semi-annually. In addition to normal rebalancing to maintain an adequate cash reserve, projected cash flow needs of the plan are reviewed at least annually to ensure liquidity is properly managed.
67
The Company contributed $2.0 million to the pension plan in 2012. The Company does not expect to contribute to the pension plan in 2013. The Company expects the net periodic benefit cost for the defined benefit pension plan and the other postretirement benefit plans in 2013 to be income of $0.6 million (which includes $0.9 million of loss in other comprehensive income expected to be recognized as a component of net periodic benefit cost) and $0.6 million, respectively.
The following estimated future pension benefit payments and other postretirement benefit plan payments which reflect expected future service, as appropriate, are expected to be paid in the years indicated:
| | | | | | | | |
(In thousands) | | | | | | |
Year | | Defined Benefit
Pension Plan | | | Other Postretirement
Benefit Plans | |
2013 | | $ | 2,665 | | | $ | 553 | |
2014 | | | 2,696 | | | | 544 | |
2015 | | | 2,785 | | | | 533 | |
2016 | | | 2,937 | | | | 555 | |
2017 | | | 3,009 | | | | 583 | |
2018-2022 | | $ | 15,855 | | | $ | 3,159 | |
Other Benefit Plans
The Company has a supplemental executive retirement plan that was formed through transfer of benefit obligations of $2.5 million related to the Company’s employees or former employees from NTELOS in connection with the Business Separation. In addition, the transfer of the benefit obligation triggered the transfer of a gross unrealized loss of $1.0 million. Both the projected benefit obligation and the accumulated benefit obligation associated with this plan at December 31, 2012 were $4.8 million. Effective December 31, 2012, the Company decided to freeze the supplemental executive retirement plan. As such, no further benefits will be accrued by plan participants for services rendered after this date. In connection with this, a curtailment gain of $0.2 million was recorded at December 31, 2012 as an offset to unrecognized actuarial losses in accumulated other comprehensive income.
The projected benefit obligation and the accumulated benefit obligation associated with this plan at December 31, 2011 were $4.3 million and $2.5 million, respectively. The Company recognized $0.3 million and $0.2 million of expense from previously unrecognized loss related to the supplemental executive retirement plan during the year ended December 31, 2012 and the period November 1, 2011 through December 31, 2011, respectively. The total balance of unrecognized actuarial losses recorded in accumulated other comprehensive income at December 31, 2012 and 2011 related to this plan was $1.5 million, net of a $1.0 million deferred tax asset, and $1.6 million, net of a $1.0 million deferred tax asset, respectively.
The estimated future benefit payments are expected to be $0.3 million annually for each of the years 2013 through 2017 and $1.3 million in aggregate for the years 2018 through 2022.
The Company also has certain other nonqualified defined benefit pension plans assumed from a prior merger. The projected benefit obligation related to these plans at December 31, 2012 and 2011 was $0.5 million and $0.9 million, respectively, with expected future payments of $0.2 million in 2013 and $0.1 million or less thereafter. These nonqualified plans have no plan assets and are also closed to new participants.
The Company also sponsors a defined contribution 401(k) plan. The Company’s matching contributions to this plan were $0.8 million, $0.7 million and $0.5 million for the year ended December 31, 2012, 2011 and 2010, respectively. The Company funds its 401(k) matching contributions in shares of the Company’s common stock.
| Note 12. | Restructuring Charges |
In December 2012, the Company announced a cost reduction plan (the “Plan”), which involved closing or consolidating certain of its facilities, reducing its workforce and freezing benefits under both its defined benefit pension plan and its executive supplemental retirement plan.
68
The Company recognized a total of $3.0 million in restructuring costs related to these initiatives, including severance and separation costs of $2.4 million and lease termination costs of $0.6 million. The Plan was substantially completed as of December 31, 2012. Accordingly, the Company does not expect to incur additional costs associated with the plan in future periods. The following table provides a break-down of these costs by business segment for the year ended December 31, 2012:
| | | | | | | | | | | | |
| | | 2012 | |
(In thousands) | | Competitive | | | RLEC | | | Total | |
Employee severance and termination benefits | | $ | 1,426 | | | $ | 961 | | | $ | 2,387 | |
Lease termination costs | | | 358 | | | | 236 | | | | 594 | |
| | | | | | | | | | | | |
Total restructuring charges | | $ | 1,784 | | | $ | 1,197 | | | $ | 2,981 | |
| | | | | | | | | | | | |
A liability for restructuring charges in the amount of $2.7 million is included in the Company’s consolidated balance sheet as of December 31, 2012, related to employee termination costs and lease termination costs accrued but not yet paid. Below is a summary of the restructuring liability balance as of December 31, 2012:
| | | | | | | | | | | | |
(In thousands) | | Employee
Severance and
Termination
Benefits | | | Lease Termination
Costs | | | Total | |
Beginning balance at December 31, 2011 | | $ | — | | | $ | — | | | $ | — | |
Additions | | | 2,387 | | | | 594 | | | | 2,981 | |
Payments | | | — | | | | (290 | ) | | | (290 | ) |
| | | | | | | | | | | | |
Ending balance at December 31, 2012 | | $ | 2,387 | | | $ | 304 | | | $ | 2,691 | |
| | | | | | | | | | | | |
| Note 13. | Commitments and Contingencies |
Operating Leases
Rental expense for all operating leases for the years ended December 31, 2012, 2011 and 2010 was $3.5 million, $3.8 million and $2.2 million, respectively. The total amount committed under these lease agreements at December 31, 2012 is: $1.0 million in 2013, $0.8 million in 2014, $0.7 million in 2015, $0.6 million in 2016, $0.6 million in 2017 and $1.7 million for the years thereafter.
Other Commitments and Contingencies
The Company periodically makes claims or receives disputes and is involved in legal actions related to billings to other carriers for access to the Company’s network. The Company does not recognize revenue related to such matters until collection of the claims is reasonably assured. In addition to this, the Company periodically disputes access charges that are assessed by other companies with which the Company interconnects and is involved in other disputes and legal and tax proceedings and filings arising from normal business activities.
In September 2012, the Company settled an outstanding lawsuit related to access billings for a one-time payment of $3.0 million. The Company also settled all of its outstanding matters related to a prior acquisition that closed in December 2010. In connection with this, the Company recognized a $5.3 million pre-tax gain resulting from the transfer of a $3.0 million liability back to the seller and the seller agreeing to pay the Company $2.3 million. These settlements, which total $2.3 million in the aggregate, are recorded as “gain on settlements, net” on the consolidated statements of operations.
In addition to the lawsuit related to the access billings discussed above, the Company settled other access dispute billings to another carrier for $5.6 million, of which $4.7 million was reserved in 2011. The total impact from these settlements was a $1.5 million charge to revenue and a $1.0 million charge to operating expenses for the year ended December 31, 2012.
In February 2013, the Company received notice of a dispute from a carrier regarding billings for access services. Although the outcome of the dispute is difficult to determine at this early stage, the Company intends to vigorously contest and defend its position and believes that the possibility of an unfavorable outcome is remote. As such, no amounts have been recorded in the consolidated financial statements related to this dispute.
In October 2012, the Company was named as the defendant in a patent infringement case alleging that the Company’s communications networks, systems and components infringe three patents held by GlobeTecTrust LLC, the plaintiff. The amount of the claim has not been determined and the Company does not have sufficient information to assess the risk, if any, of an unfavorable outcome.
In addition to the matters described above, the Company is involved in routine litigation and disputes in the ordinary course of its business. While the results of litigation and disputes are inherently unpredictable, management does not expect that the ultimate costs to resolve these matters will have a material adverse effect on the Company’s consolidated financial position, results of operations or cash flows, and believes that adequate provision for any probable and estimable losses has been made in the Company’s condensed consolidated financial statements.
69
The Company has other purchase commitments relating to capital expenditures totaling $6.6 million as of December 31, 2012, which are expected to be satisfied during 2013.
In connection with the Business Separation, the Company entered into a series of agreements with NTELOS which are intended to govern the relationship between the Company and NTELOS going forward (Note 2), and within such agreements, the companies are required to indemnify each other regarding certain matters.
Specifically, under the tax matters agreement entered into between NTELOS and the Company, the Company is generally required to indemnify NTELOS against any tax resulting from the Distribution to the extent that such tax resulted from any of the following events (among others): (1) an acquisition of all or a portion of our stock or assets, whether by merger or otherwise, (2) any negotiations, understandings, agreements or arrangements with respect to transactions or events that cause the Distribution to be treated as part of a plan pursuant to which one or more persons acquire, directly or indirectly, stock representing a 50% or greater interest in Lumos Networks, (3) certain other actions or failures to act by the Company, or (4) any breach by the Company of certain of its representations or undertakings. The Company’s indemnification obligations to NTELOS and its subsidiaries, officers and directors are not limited by any maximum amount.
| Note 14. | Related Party Transactions |
Prior to the Business Separation on October 31, 2011, NTELOS Inc. provided a variety of administrative services to Lumos Networks. Costs of these services were allocated or charged to the Company based on either the actual costs incurred or NTELOS Inc.’s estimate of expenses relative to the services provided to other subsidiaries of NTELOS Inc. The Company believes that these allocations were made on a reasonable basis, and that receiving these services from NTELOS Inc. created cost efficiencies. Lumos Networks management believes that all historical costs of operations have been reflected in the consolidated statements of operations for each period presented, but these costs do not reflect the amount of actual costs the Company would have incurred had it been an independent, publicly traded company prior to October 31, 2011. These services and transactions included the following:
| | • | | Cash management and other treasury services; |
| | • | | Administrative services such as legal, regulatory, tax, employee benefit administration, internal audit, purchasing, accounting, information technology and human resources; |
| | • | | Equity-based compensation plan administration; and |
The amount of interest expense charged to the Company from NTELOS for borrowings accumulated through shared banking and treasury services for the period January 1, 2011 through October 31, 2011 and for the year ended December 31, 2010 was $9.5 million and $4.9 million, which is included in interest expense on the consolidated statements of operations for those periods.
Total general and administrative expenses allocated to the Company were $7.3 million and $8.0 million included in its consolidated statements of operations for the period January 1, 2011 through October 31, 2011 and for the year ended December 31, 2010, respectively, inclusive of certain corporate expenses which were not previously allocated to the segments (Note 2). Additionally, $2.8 million of acquisition related costs were allocated to the Company in 2010.
Total equity-based compensation expense related to all of the share-based awards granted to employees of Lumos Networks and allocated from NTELOS Inc. and NTELOS Inc.’s 401(k) matching contributions for employees of Lumos Networks totaled $2.4 million and $1.5 million for the years ended December 31, 2011 and 2010, respectively.
70
| Item 9. | Changes in and Disagreements with Accountants on Accounting and Financial Disclosure. |
None.
| Item 9A. | Controls and Procedures. |
Conclusion Regarding the Effectiveness of Disclosure Controls and Procedures
Under the supervision and with the participation of our management, including our principal executive officer and principal financial officer, we conducted an evaluation of the effectiveness of the design and operation of our disclosure controls and procedures, as defined in Rules 13a-15(e) and 15d-15(e) under the Securities Exchange Act of 1934, as amended (the “Exchange Act”), as of the end of the period covered by this report. Based on this evaluation, our principal executive officer and our principal financial officer concluded that, as of the end of the period covered by this report, our disclosure controls and procedures are effective to ensure that the information required to be disclosed by us in the reports that we file or submit under the Exchange Act, is recorded, processed, summarized and reported, within the time periods specified in the SEC’s rules and forms, and that such information is accumulated and communicated to our management, including our principal executive officer and our principal financial officer, as appropriate, to allow timely decisions regarding required disclosures.
Changes in Internal Control over Financial Reporting
There were no changes in our internal control over financial reporting (as such term is defined in Exchange Act Rule 13a-15(f)) that occurred during the three months ended December 31, 2012 that have materially affected, or are reasonably likely to materially affect, our internal control over financial reporting.
Management’s Report on Internal Control over Financial Reporting
Our management is responsible for establishing and maintaining adequate internal control over financial reporting as defined in Rules 13a-15(f) and 15(d)-15(f) under the Securities Exchange Act of 1934, as amended. Management, including our principal executive officer and principal financial officer, assessed the effectiveness of our internal control over financial reporting as of December 31, 2012 using the criteria set forth by the Committee of Sponsoring Organizations of the Treadway Commission (“COSO”) inInternal Control – Integrated Framework.Our management has concluded that our assessment provides reasonable assurance that, as of December 31, 2012, our internal control over financial reporting was effective.
Our independent registered public accounting firm, KPMG LLP, has issued an attestation report on our internal control over financial reporting as of December 31, 2012, which appears in Item 8 of this Annual Report on Form 10-K.
| Item 9B. | Other Information. |
None.
PART III
| Item 10. | Directors, Executive Officers and Corporate Governance. |
The information required by this item is incorporated herein by reference from the registrant’s definitive Proxy Statement for the Annual Meeting of Stockholders to be held on May 1, 2013 to be filed with the Commission pursuant to Regulation 14A.
We have adopted a Code of Business Conduct and Ethics pursuant to section 406 of the Sarbanes-Oxley Act. A copy of our Code of Business Conduct and Ethics is publicly available on our Company website at http://ir.lumosnetworks.com/govdocs.aspx?iid=4293608. The information contained on our website is not incorporated by reference into this Annual Report on Form 10-K.
| Item 11. | Executive Compensation. |
The information required by this item is incorporated herein by reference from the registrant’s definitive Proxy Statement for the Annual Meeting of Stockholders.
71
| Item 12. | Security Ownership of Certain Beneficial Owners and Management and Related Stockholder Matters. |
Securities Authorized for Issuance under Equity Compensation Plans
The following table sets forth information as of December 31, 2012 concerning the shares of common stock which are authorized for issuance under our equity compensation plans.
| | | | | | | | | | | | |
Plan Category | | Number of
Securities to
be Issued on
Exercise of
Outstanding
Options,
Warrants and
Rights
(a) | | | Weighted
Average
Exercise Price
of Outstanding
Options,
Warrants and
Rights
(b) | | | Number of Securities
Remaining Available for
Issuance Under Equity
Compensation Plans
(Excluding Securities
Reflected in Column (a))
(b) | |
Equity Compensation Plans Approved by Stockholders | | | | | | | | | | | | |
2011 Equity and Cash Incentive Plan | | | 1,714,216 | | | $ | 12.29 | | | | 1,475,441 | |
Employee Stock Purchase Plan | | | — | | | | — | | | | 86,324 | |
| | | |
Equity Compensation Plans Not Approved by Stockholders | | | — | | | | — | | | | — | |
| | | | | | | | | | | | |
Total | | | 1,714,216 | | | $ | 12.29 | | | | 1,561,765 | |
| | | | | | | | | | | | |
All other information required by this item is incorporated herein by reference from the registrant’s definitive Proxy Statement for the Annual Meeting of Stockholders.
| Item 13. | Certain Relationships and Related Transactions, and Director Independence. |
The information required by this item is incorporated herein by reference from the registrant’s definitive Proxy Statement for the Annual Meeting of Stockholders.
| Item 14. | Principal Accountant Fees and Services. |
The information required by this item is incorporated herein by reference from the registrant’s definitive Proxy Statement for the Annual Meeting of Stockholders.
PART IV
| Item 15. | Exhibits, Financial Statement Schedules. |
(a) The following documents are filed as a part of this Annual Report on Form 10-K:
(1) Consolidated Financial Statements
The consolidated financial statements required to be filed in the Annual Report on Form 10-K are listed in Item 8 hereof.
(2) Financial Statement Schedules
The following financial statement schedule is filed as part of this Annual Report on Form 10-K:
Schedule II – Valuation and Qualifying Accounts for each year of the three-year period ended December 31, 2012.
Schedules other than the one listed above are omitted either because they are not required or they are inapplicable.
(3) Exhibits
The exhibits on the accompanying Exhibits Index below are filed as part of, or incorporated by reference into, this Annual Report on Form 10-K.
72
EXHIBIT INDEX
| | |
Exhibit No. | | Description |
| |
| 2.1 (1) | | Separation and Distribution Agreement, dated as of October 31, 2011, by and between NTELOS Holdings Corp. and Lumos Networks Corp. |
| |
| 3.1 (1) | | Amended and Restated Certificate of Incorporation of Lumos Networks Corp. |
| |
| 3.2 (1) | | Amended and Restated Bylaws of Lumos Networks Corp. |
| |
| 4.1 (2) | | Form of Common Stock Certificate of Lumos Networks Corp. |
| |
| 4.2 (3) | | Shareholders Agreement, dated as of October 31, 2011, by and between Lumos Networks Corp. and the shareholders listed on the signature pages thereto |
| |
| 10.1 (3) | | Transition Services Agreement, dated as of October 31, 2011, by and between NTELOS Holdings Corp. and Lumos Networks Operating Company |
| |
| 10.2 (1) | | Employee Matters Agreement, dated as of October 31, 2011, by and between NTELOS Holdings Corp. and Lumos Networks Operating Company |
| |
| 10.3 (1) | | Tax Matters Agreement, dated as of October 31, 2011, by and between NTELOS Holdings Corp. and Lumos Networks Operating Company |
| |
| 10.4 (1) | | Trademark and Domain Name Assignment and License Agreement, dated as of October 31, 2011, by and among NTELOS Holdings Corp. and all of its controlled affiliates and Lumos Networks Corp. and other parties set forth in the agreement |
| |
| 10.5 (3) | | Software and Proprietary Information Agreement, dated as of October 31, 2011, between NTELOS Holdings Corp. and Lumos Networks Corp. |
| |
| 10.6 (1) | | Lumos Networks Corp. 2011 Equity and Cash Incentive Plan |
| |
| 10.7 (1) | | Lumos Networks Corp. 2011 Employee Stock Purchase Plan |
| |
| 10.8 (3) | | Credit Agreement, dated as of September 8, 2011, among Lumos Networks Operating Company, certain subsidiaries of the Borrower (as defined in the Credit Agreement) party thereto and the Lenders (as defined in the Credit Agreement) party thereto |
| |
| 10.9 (4) | | Employment Agreement, dated September 19, 2011, between Harold L. Covert and Lumos Networks Operating Company and Lumos Networks Corp. |
| |
| 10.10 (5) | | Agreement with Michael B. Moneymaker dated April 30, 2012 |
| |
| 10.11 (6) | | Employment Agreement, dated as of August 30, 2012, between Timothy G. Biltz and Lumos Networks Operating Company |
| |
| 10.12 (6) | | Form of performance vesting stock option award agreement, dated as of April 26, 2012, between Timothy G. Biltz and Lumos Networks Corp. |
| |
| 10.13 (6) | | Form of time vested stock option award agreement, dated as of April 26, 2012, between Timothy G. Biltz and Lumos Networks Corp. |
| |
| 10.14 (6) | | Form of restricted stock award agreement, dated as of April 26, 2012, between Timothy G. Biltz and Lumos Networks Corp. |
| |
| 10.15 (6) | | Employment Agreement, dated as of August 30, 2012, between David J. Keller and Lumos Networks Operating Company |
| |
| 10.16 (6) | | Employment Agreement, dated as of August 30, 2012, between Mary McDermott and Lumos Networks Operating Company |
| |
| 10.17 (7) | | Form of Stock Option Award |
| |
| 10.18 (7) | | Form of Restricted Stock Award – Non Officer |
| |
| 10.19 (7) | | Form of Restricted Stock Award – Officer |
| |
| 10.20 (7) | | Stock Option Award for James A. Hyde |
| |
| 10.21 (7) | | Restricted Stock Award for James A. Hyde |
| |
| 10.22 * | | Employment Agreement, dated as of May 29, 2012, between Joseph E. McCourt and Lumos Networks Operating Company |
| |
| 21.1 * | | Subsidiaries of Lumos Networks Corp. |
| |
| 23.1 * | | Report and Consent of KPMG LLP |
| |
| 31.1 * | | Certificate of Timothy G. Biltz, President and Chief Executive Officer pursuant to Rule 13a-14(a) |
| |
| 31.2 * | | Certificate of Harold L. Covert, Executive Vice President and Chief Financial Officer pursuant to Rule 13a-14(a) |
| |
| 32.1 * | | Certificate of Timothy G. Biltz, President and Chief Executive Officer pursuant to 18 U.S.C., Section 1350, as adopted pursuant to Section 906 of the Sarbanes-Oxley Act of 2002 |
| |
| 32.2 * | | Certificate of Harold L. Covert, Executive Vice President and Chief Financial Officer pursuant to 18 U.S.C., Section 1350, as adopted pursuant to Section 906 of the Sarbanes-Oxley Act of 2002 |
| |
| 101.INS * | | XBRL Instance Document. |
| |
| 101.SCH * | | XBRL Taxonomy Extension Schema Document. |
| |
| 101.CAL * | | XBRL Taxonomy Extension Calculation Linkbase Document. |
| |
| 101.DEF * | | XBRL Taxonomy Extension Definition Linkbase Document. |
| |
| 101.LAB * | | XBRL Taxonomy Extension Label Linkbase Document. |
| |
| 101.PRE * | | XBRL Taxonomy Extension Presentation Linkbase Document. |
| (1) | Filed as an exhibit to Current Report on Form 8-K filed November 4, 2011. |
| (2) | Filed as an exhibit to Amended Registration of Securities on Form 10-12B/A filed September 8, 2011. |
| (3) | Filed as an exhibit to Amended Registration of Securities on Form 10-12B/A filed August 9, 2011. |
| (4) | Filed as an exhibit to Amended Registration of Securities on Form 10-12B/A filed October 17, 2011. |
| (5) | Filed as an exhibit to Quarterly Report on Form 10-Q filed August 2, 2012. |
| (6) | Filed as an exhibit to Quarterly Report on Form 10-Q filed November 1, 2012. |
| (7) | Filed as an exhibit to Annual Report on Form 10-K filed March 23, 2012. |
73
Schedule II – Valuation and Qualifying Accounts
Lumos Networks Corp.
| | | | | | | | | | | | | | | | | | | | |
| | | | | | Additions | | | | | | | |
(In thousands) | | Balance at
Beginning of
Year | | | | | | Charged to
Other
Accounts | | | | | | | |
Description | | | Charged to
Expense | | | | Deductions | | | Balance at End
of Year | |
Year Ended December 31, 2012: | | | | | | | | | | | | | | | | | | | | |
Allowance for doubtful accounts | | $ | 2,822 | | | $ | 523 | | | $ | 368 | | | $ | (1,891 | ) | | $ | 1,822 | |
| | | | | |
Year Ended December 31, 2011: | | | | | | | | | | | | | | | | | | | | |
Allowance for doubtful accounts | | $ | 2,117 | | | $ | 316 | | | $ | 821 | | | $ | (432 | ) | | $ | 2,822 | |
| | | | | |
Year Ended December 31, 2010: | | | | | | | | | | | | | | | | | | | | |
Allowance for doubtful accounts | | $ | 1,153 | | | $ | 266 | | | $ | 1,203 | | | $ | (505 | ) | | $ | 2,117 | |
74
SIGNATURES
Pursuant to the requirements of Section 13 or 15(d) of the Securities Exchange Act of 1934, the registrant has duly caused this report on Annual Report on Form 10-K to be signed on its behalf by the undersigned thereunto duly authorized.
| | |
| Lumos Networks Corp. |
| |
| By: | | /s/ Timothy G. Biltz |
| Name: | | Timothy G. Biltz |
| Title: | | President and Chief Executive Officer |
| | | | |
Signature | | Title | | Date |
| | |
/s/ Timothy G. Biltz | | President and Chief Executive Officer, Director | | March 8, 2013 |
| Timothy G. Biltz | | (principal executive officer) | | |
| | |
/s/ Harold L. Covert Harold L. Covert | | Executive Vice President, Chief Financial Officer and Treasurer (principal financial officer and principal accounting officer) | | March 8, 2013 |
| | |
/s/ Steven G. Felsher | | Director | | March 8, 2013 |
| Steven G. Felsher | | | | |
| | |
/s/ Robert E. Guth | | Director | | March 8, 2013 |
| Robert E. Guth | | | | |
| | |
/s/ Michael Huber | | Director | | March 8, 2013 |
| Michael Huber | | | | |
| | |
/s/ James A. Hyde | | Director | | March 8, 2013 |
| James A. Hyde | | | | |
| | |
/s/ Julia B. North | | Director | | March 8, 2013 |
| Julia B. North | | | | |
| | |
/s/ Michael K. Robinson | | Director | | March 8, 2013 |
| Michael K. Robinson | | | | |
| | |
/s/ Jerry E. Vaughn | | Director | | March 8, 2013 |
| Jerry E. Vaughn | | | | |