UNITED STATES SECURITIES AND EXCHANGE COMMISSION
Washington, D.C. 20549
Form 10–K
☑ | ANNUAL REPORT PURSUANT TO SECTION 13 OR 15(d) OF THE SECURITIES EXCHANGE ACT OF 1934 |
For the fiscal year ended December 31, 2018
OR
☐ | TRANSITION REPORT PURSUANT TO SECTION 13 OR 15(d) OF THE SECURITIES EXCHANGE ACT OF 1934 |
For the transition period from to .
Commission File Number: 001-35364
AMPLIFY ENERGY CORP.
(Exact name of registrant as specified in its charter)
Delaware | | 82-1326219 |
(State or other jurisdiction of incorporation or organization) | | (I.R.S. Employer Identification No.) |
500 Dallas Street, Suite 1700, Houston, TX | | 77002 |
(Address of principal executive offices) | | (Zip Code) |
Registrant’s telephone number, including area code: (713) 490-8900
Securities registered pursuant to Section 12(b) of the Act: None
Securities registered pursuant to Section 12(g) of the Act: None
Indicate by check mark if the registrant is a well–known seasoned issuer, as defined in Rule 405 of the Securities Act. Yes ☐ No ☑
Indicate by check mark if the registrant is not required to file reports pursuant to Section 13 or Section 15(d) of the Act. Yes ☐ No ☑
Indicate by check mark whether the registrant (1) has filed all reports required to be filed by Section 13 or 15(d) of the Securities Exchange Act of 1934 during the preceding 12 months (or for such shorter period that the registrant was required to file such reports) and (2) has been subject to such filing requirements for the past 90 days. Yes ☑ No ☐
Indicate by check mark whether the registrant has submitted electronically every Interactive Data File required to be submitted pursuant to Rule 405 of Regulation S-T (§ 232.405 of this chapter) during the preceding 12 months (or for such shorter period that the registrant was required to submit such files). Yes ☑ No ☐
Indicate by check mark if disclosure of delinquent filers pursuant to Item 405 of Regulation S–K (§ 229.405 of this chapter) is not contained herein and will not be contained, to the best of registrant’s knowledge, in definitive proxy or information statements incorporated by reference in Part III of this Form 10-K or any amendment to this Form 10–K ☑
Indicate by check mark whether the registrant is a large accelerated filer, an accelerated filer, a non-accelerated filer, a smaller reporting company, or an emerging growth company. See definition of “large accelerated filer,” “accelerated filer,” “smaller reporting company” and “emerging growth company” in Rule 12b–2 of the Exchange Act.
Large accelerated filer | | ☐ | | Accelerated filer | | ☑ |
Non-accelerated filer | | ☐ | | Smaller reporting company | | ☐ |
Emerging growth company | | ☐ | | | | |
If an emerging growth company, indicate by check mark if the registrant has elected not to use the extended transition period for complying with any new or revised financial accounting standards provided pursuant to Section 13(a) of the Exchange Act. ☐
Indicate by check mark whether the registrant is a shell company (as defined in Rule 12b-2 of the Exchange Act) Yes ☐ No ☑
The aggregate market value of voting and non-voting common equity held by non-affiliates of the registrant was approximately $190.2 million on June 29, 2018, based on $11.00 per share, the last reported sales price of the shares on the OTCQX U.S. Premier marketplace on such date.
Indicate by check mark whether the registrant has filed all documents and reports required to be filed by Section 12, 13, or 15(d) of the Securities Exchange Act of 1934 subsequent to the distribution of securities under a plan confirmed by a court. Yes ☑ No ☐
As of February 28, 2019, the registrant had 22,141,804 outstanding shares of common stock, $0.0001 par value per share.
Documents Incorporated By Reference: Portions of the registrant’s definitive proxy statement relating to its 2019 Annual Meeting of Stockholders, which will be filed with the Securities and Exchange Commission within 120 days after December 31, 2018, are incorporated by reference to the extent set forth in Part III, Items 10-14 of this Form 10-K.
AMPLIFY ENERGY CORP.
TABLE OF CONTENTS
GLOSSARY OF OIL AND NATURAL GAS TERMS
3-D seismic: Geophysical data that depict the subsurface strata in three dimensions. 3-D seismic typically provides a more detailed and accurate interpretation of the subsurface strata than 2-D, or two-dimensional, seismic.
Analogous Reservoir: Analogous reservoirs, as used in resource assessments, have similar rock and fluid properties, reservoir conditions (depth, temperature and pressure) and drive mechanisms, but are typically at a more advanced stage of development than the reservoir of interest and thus may provide concepts to assist in the interpretation of more limited data and estimation of recovery. When used to support proved reserves, analogous reservoir refers to a reservoir that shares all of the following characteristics with the reservoir of interest: (i) the same geological formation (but not necessarily in pressure communication with the reservoir of interest); (ii) the same environment of deposition; (iii) similar geologic structure; and (iv) the same drive mechanism.
API Gravity: A system of classifying oil based on its specific gravity, whereby the greater the gravity, the lighter the oil.
Basin: A large depression on the earth’s surface in which sediments accumulate.
Bbl: One stock tank barrel, or 42 U.S. gallons liquid volume, used in reference to oil or other liquid hydrocarbons.
Bbl/d: One Bbl per day.
Bcfe: One billion cubic feet of natural gas equivalent.
Boe: One barrel of oil equivalent, calculated by converting natural gas to oil equivalent barrels at a ratio of six Mcf of natural gas to one Bbl of oil.
Boe/d: One Boe per day.
BOEM: Bureau of Ocean Energy Management.
BSEE: Bureau of Safety and Environmental Enforcement.
Btu: One British thermal unit, the quantity of heat required to raise the temperature of a one-pound mass of water by one degree Fahrenheit.
Deterministic Estimate: The method of estimating reserves or resources is called deterministic when a single value for each parameter (from the geoscience, engineering or economic data) in the reserves calculation is used in the reserves estimation procedure.
Developed Acreage: The number of acres which are allocated or assignable to producing wells or wells capable of production.
Development Project: A development project is the means by which petroleum resources are brought to the status of economically producible. As examples, the development of a single reservoir or field, an incremental development in a producing field or the integrated development of a group of several fields and associated facilities with a common ownership may constitute a development project.
Development Well: A well drilled within the proved area of an oil or natural gas reservoir to the depth of a stratigraphic horizon known to be productive.
Differential: An adjustment to the price of oil or natural gas from an established spot market price to reflect differences in the quality and/or location of oil or natural gas.
Dry Hole or Dry Well: A well found to be incapable of producing hydrocarbons in sufficient quantities such that proceeds from the sale of such production would exceed production expenses and taxes.
Economically Producible: The term economically producible, as it relates to a resource, means a resource which generates revenue that exceeds, or is reasonably expected to exceed, the costs of the operation. For this determination, the value of the products that generate revenue are determined at the terminal point of oil and natural gas producing activities.
Estimated Ultimate Recovery: Estimated ultimate recovery is the sum of reserves remaining as of a given date and cumulative production as of that date.
Exploitation: A development or other project which may target proven or unproven reserves (such as probable or possible reserves), but which generally has a lower risk than that associated with exploration projects.
Exploratory Well: A well drilled to find and produce oil and natural gas reserves not classified as proved, to find a new reservoir in a field previously found to be productive of oil or natural gas in another reservoir or to extend a known reservoir.
Field: An area consisting of a single reservoir or multiple reservoirs, all grouped on or related to the same individual geological structural feature and/or stratigraphic condition. The field name refers to the surface area, although it may refer to both the surface and the underground productive formations.
Gross Acres or Gross Wells: The total acres or wells, as the case may be, in which we have working interest.
ICE: Inter-Continental Exchange.
1
MBbl: One thousand Bbls.
MBbls/d: One thousand Bbls per day.
Mcf: One thousand cubic feet of natural gas.
MMBtu: One million British thermal units.
MMcf: One million cubic feet of natural gas.
MMcfe: One million cubic feet of natural gas equivalent.
MMcfe/d: One MMcfe per day.
Net Acres or Net Wells: Gross acres or wells, as the case may be, multiplied by our working interest ownership percentage.
Net Production: Production that is owned by us less royalties and production due others.
Net Revenue Interest: A working interest owner’s gross working interest in production less the royalty, overriding royalty, production payment and net profits interests.
NGLs: The combination of ethane, propane, butane and natural gasolines that when removed from natural gas become liquid under various levels of higher pressure and lower temperature.
NYMEX: New York Mercantile Exchange.
Oil: Oil and condensate.
Operator: The individual or company responsible for the exploration and/or production of an oil or natural gas well or lease.
Plugging and abandonment: Refers to the sealing off of fluids in the strata penetrated by a well so that the fluids from one stratum will not escape into another stratum or to the surface. Regulations of all states require plugging of abandoned wells.
Present value of future net revenues or PV-9: The estimated future gross revenue to be generated from the production of proved reserves, net of estimated production and future development and abandonment costs, using prices and costs in effect at the determination date, before income taxes, and without giving effect to non-property-related expenses, discounted to a present value using an annual discount rate of 9% in accordance with the guidelines of the U.S. Securities Exchange Commission (the “SEC”).
Present value of future net revenues or PV-10: The estimated future gross revenue to be generated from the production of proved reserves, net of estimated production and future development and abandonment costs, using prices and costs in effect at the determination date, before income taxes, and without giving effect to non-property-related expenses, discounted to a present value using an annual discount rate of 10% in accordance with the guidelines of the SEC.
Probabilistic Estimate: The method of estimation of reserves or resources is called probabilistic when the full range of values that could reasonably occur for each unknown parameter (from the geoscience and engineering data) is used to generate a full range of possible outcomes and their associated probabilities of occurrences.
Productive Well: A well that produces commercial quantities of hydrocarbons, exclusive of its capacity to produce at a reasonable rate of return.
Proved Developed Reserves: Proved reserves that can be expected to be recovered from existing wells with existing equipment and operating methods.
2
Proved Reserves: Those quantities of oil and natural gas, which, by analysis of geoscience and engineering data, can be estimated with reasonable certainty to be economically producible, from a given date forward, from known reservoirs and under existing economic conditions, operating methods and government regulations, prior to the time at which contracts providing the right to operate expire, unless evidence indicates that renewal is reasonably certain, regardless of whether deterministic or probabilistic methods are used for the estimation. The project to extract the hydrocarbons must have commenced, or the operator must be reasonably certain that it will commence the project, within a reasonable time. The area of the reservoir considered as proved includes (i) the area identified by drilling and limited by fluid contacts, if any, and (ii) adjacent undrilled portions of the reservoir that can, with reasonable certainty, be judged to be continuous with it and to contain economically producible oil or natural gas on the basis of available geoscience and engineering data. In the absence of data on fluid contacts, proved quantities in a reservoir are limited by the lowest known hydrocarbons, as seen in a well penetration, unless geoscience, engineering or performance data and reliable technology establishes a lower contact with reasonable certainty. Where direct observation from well penetrations has defined a highest known oil elevation and the potential exists for an associated natural gas cap, proved oil reserves may be assigned in the structurally higher portions of the reservoir only if geoscience, engineering, or performance data and reliable technology establish the higher contact with reasonable certainty. Reserves which can be produced economically through application of improved recovery techniques (including fluid injection) are included in the proved classification when (i) successful testing by a pilot project in an area of the reservoir with properties no more favorable than in the reservoir as a whole, the operation of an installed program in the reservoir, or an analogous reservoir or other evidence using reliable technology establishes the reasonable certainty of the engineering analysis on which the project or program was based; and (ii) the project has been approved for development by all necessary parties and entities, including governmental entities. Existing economic conditions include prices and costs at which economic producibility from a reservoir is to be determined. The price used is the average price during the twelve-month period prior to the ending date of the period covered by the report, determined as an unweighted arithmetic average of the first-day-of-the-month price for each month within such period, unless prices are defined by contractual arrangements, excluding escalations based upon future conditions.
Proved Undeveloped Reserves: Proved oil and natural gas reserves that are expected to be recovered from new wells on undrilled acreage or from existing wells where a relatively major expenditure is required for recompletion. Reserves on undrilled acreage are limited to those drilling units offsetting productive units that are reasonably certain of production when drilled. Proved reserves for other undrilled units can be claimed only where it can be demonstrated with certainty that there is continuity of production from the existing productive formation. Under no circumstances should estimates for proved undeveloped reserves be attributable to any acreage for which an application of fluid injection or other improved recovery technique is contemplated, unless such techniques have been proved effective by actual tests in the area and in the same reservoir.
Realized Price: The cash market price less all expected quality, transportation and demand adjustments.
Recompletion: The completion for production of an existing wellbore in another formation from that which the well has been previously completed.
Reliable Technology: Reliable technology is a grouping of one or more technologies (including computational methods) that has been field tested and has been demonstrated to provide reasonably certain results with consistency and repeatability in the formation being evaluated or in an analogous formation.
Reserve Life: A measure of the productive life of an oil and natural gas property or a group of properties, expressed in years. Reserve life is calculated by dividing proved reserve volumes at year-end by production volumes. In our calculation of reserve life, production volumes are adjusted, if necessary, to reflect property acquisitions and dispositions.
Reserves: Reserves are estimated remaining quantities of oil and natural gas and related substances anticipated to be economically producible, as of a given date, by application of development projects to known accumulations. In addition, there must exist, or there must be a reasonable expectation that there will exist, the legal right to produce or a revenue interest in the production, installed means of delivering oil and natural gas or related substances to market and all permits and financing required to implement the project. Reserves should not be assigned to adjacent reservoirs isolated by major, potentially sealing, faults until those reservoirs are penetrated and evaluated as economically producible. Reserves should not be assigned to areas that are clearly separated from a known accumulation by a non-productive reservoir (i.e., absence of reservoir, structurally low reservoir or negative test results). Such areas may contain prospective resources (i.e., potentially recoverable resources from undiscovered accumulations).
Reservoir: A porous and permeable underground formation containing a natural accumulation of producible oil and/or natural gas that is confined by impermeable rock or water barriers and is individual and separate from other reserves.
Resources: Resources are quantities of oil and natural gas estimated to exist in naturally occurring accumulations. A portion of the resources may be estimated to be recoverable and another portion may be considered unrecoverable. Resources include both discovered and undiscovered accumulations.
Spacing: The distance between wells producing from the same reservoir. Spacing is often expressed in terms of acres (e.g., 40-acre spacing) and is often established by regulatory agencies.
3
Standardized Measure: The present value of estimated future net revenue to be generated from the production of proved reserves, determined in accordance with the rules, regulations or standards established by the SEC and the Financial Accounting Standards Board (“FASB”) (using prices and costs in effect as of the date of estimation), less future development, production and income tax expenses and discounted at 10% per annum to reflect the timing of future net revenue. Future income taxes, if applicable, are computed by applying the statutory tax rate to the excess of pre-tax cash inflows over our tax basis in our oil and natural gas properties. Because our Predecessor was a limited partnership, it was generally not subject to federal or state income taxes and thus made no provision for federal or state income taxes in the calculation of standardized measure. Standardized measure does not give effect to derivative transactions.
Undeveloped Acreage: Lease acreage on which wells have not been drilled or completed to a point that would permit the production of commercial quantities of oil and natural gas regardless of whether such acreage contains proved reserves.
Wellbore: The hole drilled by the bit that is equipped for oil or natural gas production on a completed well. Also called well or borehole.
Working Interest: An interest in an oil and natural gas lease that gives the owner of the interest the right to drill for and produce oil and natural gas on the leased acreage and generally requires the owner to pay a share of the costs of drilling and production operations.
Workover: Operations on a producing well to restore or increase production.
WTI: West Texas Intermediate.
4
NAMES OF ENTITIES
As used in this Form 10-K, unless we indicate otherwise:
| • | “Amplify Energy” and “Successor” refer to Amplify Energy Corp., the successor reporting company of Memorial Production Partners LP, individually and collectively with its subsidiaries, as the context requires; |
| • | “Memorial Production Partners,” “MEMP,” and “Predecessor” refer to Memorial Production Partners LP, individually and collectively with its subsidiaries, as the context requires; |
| • | “Company,” “we,” “our,” “us” or like terms refer to Memorial Production Partners for the period prior to emergence from bankruptcy and to Amplify Energy for the period after emergence from bankruptcy; |
| • | “Predecessor’s general partner” and “MEMP GP” refer to Memorial Production Partners GP LLC, the Predecessor’s general partner; |
| • | “OLLC” refers to Amplify Energy Operating LLC, formerly known as Memorial Production Operating LLC, our wholly owned subsidiary through which we operate our properties; |
| • | “Memorial Resource” refers to Memorial Resource Development Corp., the former owner of the Predecessor’s general partner, and its subsidiaries; |
| • | “MRD LLC” refers to Memorial Resource Development LLC, which is the predecessor of Memorial Resource; |
| • | “Cinco Group” refers to (i) certain oil and natural gas properties and related assets primarily in the Permian Basin, East Texas and the Rockies owned by: (a) Boaz Energy, LLC, (b) Crown Energy Partners, LLC (“Crown”), (c) the Crown net profits overriding royalty interest and overriding royalty interest, (d) Propel Energy SPV LLC, together with its wholly owned subsidiary Propel Energy Services, LLC, (e) Stanolind Oil and Gas SPV LLC, (f) Tanos Energy, LLC, together with its wholly owned subsidiaries and (g) Prospect Energy, LLC and (ii) certain oil and natural gas properties in Jackson County, Texas owned by Memorial Resource. MEMP acquired substantially all of the Cinco Group on October 1, 2013 from: (x) Boaz Energy Partners, LLC, Crown Energy Partners Holdings, LLC, Propel Energy, LLC and Stanolind Oil and Gas LP, all of which were primarily owned by two of the Funds (defined below) and (y) MRD LLC; |
| • | “the previous owners” for accounting and financial reporting purposes refers collectively to: (a) certain oil and natural gas properties MEMP acquired from MRD LLC in April and May 2012 for periods after common control commenced through their respective acquisition dates, (b) Rise Energy Operating, LLC and its wholly owned subsidiaries (except for Rise Energy Operating, Inc.) from February 3, 2009 (inception) through the date of acquisition, (c) certain oil and natural gas properties and related assets in East Texas and North Louisiana that MEMP acquired in March 2013 (the “WHT Properties”) owned by WHT Energy Partners LLC from February 2, 2011 (inception) through the date of acquisition, (d) the Cinco Group and (e) certain oil and gas properties primarily located in the Joaquin Field in Shelby and Panola counties in East Texas and in Louisiana acquired from Memorial Resource in February 2015 (“Property Swap”) for periods after common control commenced through the date of acquisition; |
| • | “the Funds” refers collectively to Natural Gas Partners VIII, L.P., Natural Gas Partners IX, L.P. and NGP IX Offshore Holdings, L.P., which collectively controlled MRD Holdco LLC; and |
| • | “NGP” refers to Natural Gas Partners. |
5
FORWARD–LOOKING STATEMENTS
This Annual Report on Form 10-K contains forward-looking statements that are subject to a number of risks and uncertainties, many of which are beyond our control, which may include statements about our:
| • | acquisition and disposition strategy; |
| • | cash flows and liquidity; |
| • | ability to replace the reserves we produce through drilling; |
| • | oil and natural gas reserves; |
| • | realized oil, natural gas and NGL prices; |
| • | lease operating expense; |
| • | gathering, processing and transportation; |
| • | general and administrative expense; |
| • | future operating results; |
| • | ability to procure drilling and production equipment; |
| • | ability to procure oil field labor; |
| • | planned capital expenditures and the availability of capital resources to fund capital expenditures; |
| • | ability to access capital markets; |
| • | marketing of oil, natural gas and NGLs; |
| • | acts of God, fires, earthquakes, storms, floods, other adverse weather conditions, war, acts of terrorism, military operations or national emergency; |
| • | expectations regarding general economic conditions; |
| • | impact of the Tax Cuts and Jobs Act of 2017; |
| • | competition in the oil and natural gas industry; |
| • | effectiveness of risk management activities; |
| • | environmental liabilities; |
| • | counterparty credit risk; |
| • | expectations regarding governmental regulation and taxation; |
| • | expectations regarding developments in oil-producing and natural-gas producing countries; and |
| • | plans, objectives, expectations and intentions. |
6
All statements, other than statements of historical fact, included in this report are forward-looking statements. These forward-looking statements may be found in “Item 1. Business,” “Item 1A. Risk Factors,” “Item 7. Management’s Discussion and Analysis of Financial Condition and Results of Operations” and other items within this Annual Report on Form 10-K. In some cases, you can identify forward-looking statements by terminology such as “may,” “will,” “could,” “should,” “expect,” “plan,” “project,” “intend,” “anticipate,” “believe,” “estimate,” “predict,” “potential,” “pursue,” “target,” “outlook,” “continue,” the negative of such terms or other comparable terminology. These statements address activities, events or developments that we expect or anticipate will or may occur in the future, including things such as projections of results of operations, plans for growth, goals, future capital expenditures, competitive strengths, references to future intentions and other such references. These forward-looking statements involve risks and uncertainties. Important factors that could cause our actual results or financial condition to differ materially from those expressed or implied by forward-looking statements include, but are not limited to, the following risks and uncertainties:
| • | our results of evaluation and implementation of strategic alternatives; |
| • | risks related to a redetermination of the borrowing base under our senior secured reserve-based revolving credit facility; |
| • | our ability to access funds on acceptable terms, if at all, because of the terms and conditions governing our indebtedness, including financial covenants; |
| • | our ability to satisfy our debt obligations; |
| • | volatility in the prices for oil, natural gas and NGLs, including further or sustained declines in commodity prices; |
| • | the potential for additional impairments due to continuing or future declines in oil, natural gas and NGL prices; |
| • | the uncertainty inherent in estimating quantities of oil, natural gas and NGL reserves; |
| • | our substantial future capital requirements, which may be subject to limited availability of financing; |
| • | the uncertainty inherent in the development and production of oil and natural gas; |
| • | our need to make accretive acquisitions or substantial capital expenditures to maintain our declining asset base; |
| • | the existence of unanticipated liabilities or problems relating to acquired or divested businesses or properties; |
| • | potential acquisitions, including our ability to make acquisitions on favorable terms or to integrate acquired properties; |
| • | the consequences of changes we have made, or may make from time to time in the future, to our capital expenditure budget, including the impact of those changes on our production levels, reserves, results of operations and liquidity; |
| • | potential shortages of, or increased costs for, drilling and production equipment and supply materials for production, such as CO2; |
| • | potential difficulties in the marketing of oil and natural gas; |
| • | changes to the financial condition of counterparties; |
| • | uncertainties surrounding the success of our secondary and tertiary recovery efforts; |
| • | competition in the oil and natural gas industry; |
| • | general political and economic conditions, globally and in the jurisdictions in which we operate; |
| • | the impact of legislation and governmental regulations, including those related to climate change and hydraulic fracturing; |
| • | the risk that our hedging strategy may be ineffective or may reduce our income; |
| • | the cost and availability of insurance as well as operating risks that may not be covered by an effective indemnity or insurance; |
| • | actions of third-party co-owners of interest in properties in which we also own an interest; and |
| • | other risks and uncertainties described in “Item 1A. Risk Factors.” |
7
The forward-looking statements contained in this report are largely based on our expectations, which reflect estimates and assumptions made by our management. These estimates and assumptions reflect our best judgment based on currently known market conditions and other factors. Although we believe such estimates and assumptions to be reasonable, they are inherently uncertain and involve a number of risks and uncertainties that are beyond our control. In addition, management’s assumptions about future events may prove to be inaccurate. All readers are cautioned that the forward-looking statements contained in this report are not guarantees of future performance and we cannot assure any reader that such statements will be realized or that the events or circumstances described in any forward-looking statement will occur. Actual results may differ materially from those anticipated or implied in the forward-looking statements due to factors described in “Item 1A. Risk Factors” and elsewhere in this report. All forward-looking statements speak only as of the date of this report. We do not intend to update or revise any forward-looking statements as a result of new information, future events or otherwise. These cautionary statements qualify all forward-looking statements attributable to us or persons acting on our behalf.
8
PART I
References
When referring to Amplify Energy Corp. (also referred to as “Successor,” “Amplify Energy,” or the “Company”), the intent is to refer to Amplify Energy, a Delaware corporation, and its consolidated subsidiaries as a whole or on an individual basis, depending on the context in which the statements are made. Amplify Energy is the successor reporting company of Memorial Production Partners LP (“MEMP”) pursuant to Rule 15d-5 of the Securities Exchange Act of 1934, as amended (the “Exchange Act”). When referring to “Predecessor” or the “Company” in reference to the period prior to the emergence from bankruptcy, the intent is to refer to MEMP, the predecessor that was dissolved following the effective date of the Plan (as defined below) and its consolidated subsidiaries as a whole or on an individual basis, depending on the context in which the statements are made.
Overview
Amplify Energy is an independent oil and natural gas company engaged in the acquisition, development, exploitation and production of oil and natural gas properties. Our management evaluates performance based on one reportable business segment, as the economic environments are not different within the operation of our oil and natural gas properties. Our business activities are conducted through OLLC, our wholly owned subsidiary, and its wholly owned subsidiaries. Our assets consist primarily of producing oil and natural gas properties located in the Rockies, federal waters offshore Southern California, East Texas / North Louisiana and South Texas. Most of our oil and natural gas properties are located in large, mature oil and natural gas reservoirs. The Company’s properties consist primarily of operated and non-operated working interests in producing and undeveloped leasehold acreage and working interests in identified producing wells. As of December 31, 2018:
| • | Our total estimated proved reserves were approximately 841.1 Bcfe, of which approximately 50% were oil and 79% were classified as proved developed reserves; |
| • | We produced from 2,068 gross (1,125 net) producing wells across our properties, with an average working interest of 54% and the Company is the operator of record of the properties containing 92% of our total estimated proved reserves; and |
| • | Our average net production for the three months ended December 31, 2018 was 142.5 MMcfe/d, implying a reserve-to-production ratio of approximately 16 years. |
Amplify Energy was formed in March 2017 in connection with the reorganization of the Predecessor. The Predecessor was publicly traded from December 2011 to May 2017. As discussed further in “Item 7. Management’s Discussion and Analysis of Financial Condition and Results of Operations” and Note 2 of the Notes to the Consolidated Financial Statements included under “Item 8. Financial Statements and Supplementary Data”, on January 16, 2017 (the “Petition Date”), MEMP and certain of its subsidiaries (collectively with MEMP, the “Debtors”) filed voluntary petitions (the cases commenced thereby, the “Chapter 11 proceedings”) under Chapter 11 of Title 11 of the United States Code (the “Bankruptcy Code” or “Chapter 11”) in the U.S. Bankruptcy Court for the Southern District of Texas, Houston Division (the “Bankruptcy Court”). The Debtors’ Chapter 11 proceedings were jointly administered under the caption In re Memorial Production Partners LP, et al. (Case No. 17-30262). On April 14, 2017, the Bankruptcy Court entered an order (the “Confirmation Order”) approving the Second Amended Joint Plan of Reorganization of Memorial Production Partners LP and its affiliated Debtors, dated April 13, 2017 (as amended and supplemented, the “Plan”). On May 4, 2017, (the “Effective Date”), the Debtors satisfied the conditions to effectiveness of the Plan, the Plan became effective in accordance with its terms and the Company emerged from bankruptcy.
Recent Developments
Share Repurchase Program
On December 21, 2018, the Company’s board of directors authorized the repurchase of up to $25.0 million of the Company’s outstanding shares of common stock, with such repurchases to begin on or after January 9, 2019 (in accordance with the SEC’s regulations regarding issuer tender offers). In January and February 2019, the Company repurchased 42,583 shares of common stock at an average price of $8.63 for a total cost of approximately $0.4 million. At February 28, 2019, approximately $24.6 million remains available for share repurchases under the program.
Any share repurchases are subject to restrictions in the Company’s New Revolving Credit Facility (as defined below).
Tender Offer
On November 19, 2018, the Company’s board of directors announced the commencement of a tender offer to purchase up to 2,916,667 shares of the Company’s common stock. On December 19, 2018, upon the terms and subject to the conditions described in the Offer to Purchase dated November 19, 2018, as amended, the Company repurchased an aggregate of 2,916,667 shares of common stock at a price of $12.00 per share for a total cost of approximately $35.0 million (excluding fees and expenses relating to the tender offer).
9
New Revolving Credit Facility
On November 2, 2018, OLLC and Amplify Acquisitionco, Inc., our wholly owned subsidiaries, entered into a credit agreement (the “New Credit Agreement”) providing for a new $425.0 million reserve-based revolving credit facility (the “New Revolving Credit Facility”) with Bank of Montreal, as administrative agent and an issuer of letters of credit, and the other lenders and agents from time to time party thereto. The New Revolving Credit Facility matures on November 2, 2023.
The New Revolving Credit Facility is subject to a borrowing base with maximum loan value to be assigned to the PV-9 attributable to our oil and gas properties. The first scheduled redetermination will take place on or about April 1, 2019. The borrowing base will be redetermined semiannually on or around April 1st and October 1st, with one interim “wildcard” redetermination available between scheduled redeterminations. The initial borrowing base is $425.0 million.
See Note 11 of the Notes to the Consolidated Financial Statements included under “Item 8. Financial Statements and Supplementary Data” of this annual report for additional information.
Beta Decommissioning Trust Account
In October 2018, the Company received approximately $61.5 million from the trust account (the “Beta Decommissioning Trust Account”). In November 2018, the Company received an additional $1.0 million from the Beta Decommissioning Trust Account that had been withheld from the initial payment on October 5, 2018. The cash released to the Company’s balance sheet was made pursuant to an order of the Bankruptcy Court dated February 9, 2018, which allowed for the release of Beta cash subject to certain conditions that have since been satisfied. Following the cash release, Beta’s decommissioning obligations remain fully supported by A-rated surety bonds and $90 million of cash.
Properties
We engaged Ryder Scott Company, L.P. (“Ryder Scott”), our independent reserve engineers, to audit our reserves estimates for all of our estimated proved reserves (by volume) at December 31, 2018. The following table summarizes information, based on a reserve report prepared by our internal reserve engineers and audited by Ryder Scott (which we refer to as our “reserve report”), about our proved oil and natural gas reserves by geographic region as of December 31, 2018 and our average net production for the three months ended December 31, 2018:
| Estimated Net Proved Reserves | | | | | | | Average Net Production | | | Average | | | Producing Wells | |
| | | | | | | | | | | | | | | | | | | | | | | | | | | | | Reserve | | | | | | | | | |
| | | | | % Oil and | | | % Natural | | | % Proved | | | Standardized | | | | | | | % of | | | -to-Production | | | | | | | | | |
Region | Bcfe (1) | | | NGL | | | Gas | | | Developed | | | Measure (2) | | | MMcfe/d | | | Total | | | Ratio (3) | | | Gross | | | Net | |
| | | | | | | | | | | | | | | | | (in millions) | | | | | | | | | | | (Years) | | | | | | | | | |
East Texas/ North Louisiana | | 379 | | | 23% | | | 77% | | | 80% | | | $ | 318 | | | | 92.8 | | | 65% | | | | 11.2 | | | | 1,603 | | | | 900 | |
Rockies | | 284 | | | 100% | | | 0% | | | 86% | | | | 323 | | | | 24.8 | | | 17% | | | | 31.4 | | | | 144 | | | | 144 | |
California | | 149 | | | 100% | | | 0% | | | 68% | | | | 385 | | | | 18.5 | | | 13% | | | | 22.1 | | | | 59 | | | | 59 | |
South Texas (4) | | 29 | | | 89% | | | 11% | | | 52% | | | | 87 | | | | 6.4 | | | 5% | | | | 12.4 | | | | 262 | | | | 22 | |
Total | | 841 | | | 65% | | | 35% | | | 79% | | | $ | 1,113 | | | | 142.5 | | | 100% | | | | 16.2 | | | | 2,068 | | | | 1,125 | |
(1) | Determined using a ratio of six Mcf of natural gas to one Bbl of oil, condensate or NGLs based on an approximate energy equivalency. This is an energy content correlation and does not reflect a value or price relationship between the commodities. |
(2) | Standardized measure is calculated in accordance with Accounting Standards Codification, or ASC, Topic 932, Extractive Activities—Oil and Gas, and is calculated using SEC pricing, before market differentials, of $65.56/Bbl for crude oil and NGLs and $3.10/MMBtu for natural gas. |
(3) | The average reserve-to-production ratio is calculated by dividing estimated net proved reserves as of December 31, 2018 by the annualized average net production for the three months ended December 31, 2018. |
(4) | South Texas region properties include wells and properties in fields located primarily in the Eagle Ford and Eagleville as of December 31, 2018. |
Our Areas of Operation
East Texas / North Louisiana
Approximately 45% of our estimated proved reserves as of December 31, 2018 and approximately 65% of our average daily net production for the three months ended December 31, 2018 were located in the East Texas/ North Louisiana region. Our East Texas/ North Louisiana properties include wells and properties primarily located in the Joaquin, Carthage, Willow Springs and East Henderson fields in East Texas. Those properties collectively contained 379.1 Bcfe of estimated net proved reserves as of December 31, 2018 based on our reserve report and generated average net production of 92.8 MMcfe/d for the three months ended December 31, 2018.
10
Rockies
Approximately 34% of our estimated proved reserves as of December 31, 2018 and approximately 17% of our average daily net production for the three months ended December 31, 2018 were located in the Rockies region. Our Rockies properties include wells and properties primarily located in the Lost Soldier and Wertz fields in Wyoming at our Bairoil complex. Our Rockies properties contained 47.4 MMBbls of estimated net proved oil and NGLs reserves as of December 31, 2018 based on our reserve report and generated average net production of 24.8 MMcfe/d for the three months ended December 31, 2018.
Based on our reserve report, the Lost Soldier and Wertz field both contain more than 15% of our total estimated reserves. The following table summarizes production volumes from these fields for the periods presented:
| For the | | | Period from | | | | Period from | | | For the | |
| Year Ended | | | May 5, 2017 | | | | January 1, 2017 | | | Year Ended | |
| December 31, | | | through | | | | through | | | December 31, | |
| 2018 | | | December 31, 2017 | | | | May 4, 2017 | | | 2016 | |
Production Volumes: | | | | | | | | | | | | | | | | |
Oil (MBbls) | | 1,300 | | | | 879 | | | | | 439 | | | | 1,349 | |
NGLs (MBbls) | | 220 | | | | 151 | | | | | 84 | | | | 178 | |
Total (MBbls) | | 1,520 | | | | 1,030 | | | | | 523 | | | | 1,527 | |
Average net production (MBbls/d) | | 4.2 | | | | 4.2 | | | | | 4.2 | | | | 4.2 | |
California
Approximately 18% of our estimated proved reserves as of December 31, 2018 and approximately 13% of our average daily net production for the three months ended December 31, 2018 were located in federal waters offshore Southern California. These properties (the “Beta properties”) consist of: 100% of the working interests and currently an 75.2% average net revenue interest in three Pacific Outer Continental Shelf lease blocks (P-0300, P-0301 and P-0306), referred to as the Beta Unit, in the Beta Field located in federal waters approximately 11 miles offshore from the Port of Long Beach, California. Our Beta properties contained 24.8 MMBbls of estimated net proved oil reserves as of December 31, 2018 based on our reserve report. Oil and gas is produced from the Beta Unit via two production platforms, referred to as the Ellen and Eureka platforms, equipped with permanent drilling rigs and associated equipment systems. On a third platform, Elly, the oil, water and gas are separated and the oil is prepared for sale, while the gas is burned as fuel for power and the water is recycled back into the reservoir for pressure maintenance. Sales quality oil is then pumped from the Elly platform to the Beta pump station located onshore at the Port of Long Beach, California via a 16-inch diameter oil pipeline, which extends approximately 17.5 miles. Amplify Energy’s wholly owned subsidiary, San Pedro Bay Pipeline Company, owns and operates the pipeline system.
Based on our reserve report, the Beta field contains more than 15% of our total estimated reserves. The following table summarizes production volumes from this field for the periods presented:
| For the | | | Period from | | | | Period from | | | For the | |
| Year Ended | | | May 5, 2017 | | | | January 1, 2017 | | | Year Ended | |
| December 31, | | | through | | | | through | | | December 31, | |
| 2018 | | | December 31, 2017 | | | | May 4, 2017 | | | 2016 | |
Production Volumes: | | | | | | | | | | | | | | | | |
Oil (MBbls) | | 1,355 | | | | 1,022 | | | | | 486 | | | | 1,445 | |
Average net production (MBbls/d) | | 3.7 | | | | 4.2 | | | | | 3.9 | | | | 3.9 | |
Due to low oil and gas prices, the Beta leases were all granted royalty relief by the U.S. Department of Interior in July 2016. On our two primary producing leases, the royalty rate was reduced from 25% to 12.5%, and on our third lease, the royalty rate was reduced from 16.67% to 8.33%, for a weighted average of 12.4% overall. These royalty relief rates were to be suspended in months in which the trailing twelve-month weighted average NYMEX oil and Henry Hub gas price exceeds $55.16 per Boe which represented a 25% premium to the average realized price recognized by the Company during the qualification period. For the twelve-month period ended June 30, 2018, the twelve-month weighted average price exceeded the $55.16 threshold, which triggered the royalty rates on our leases to revert back to their pre-royalty relief levels effective as of May 31, 2018. The royalty relief will end in the event that the Company generates no benefit from the royalty relief rates for 12 consecutive months.
11
South Texas
Approximately 3% of our estimated proved reserves as of December 31, 2018 and approximately 5% of our average daily net production for the three months ended December 31, 2018 were located in the South Texas region. Our South Texas properties include wells and properties in fields located primarily in the Eagle Ford and Eagleville. Our South Texas properties contained 29.1 Bcfe of estimated net proved reserves as of December 31, 2018 based on our reserve report. Those properties collectively generated average net production of 6.4 MMcfe/d for the three months ended December 31, 2018. In May 2018, we closed a transaction to divest certain of our non-core assets located in South Texas (the “South Texas Divestiture”). Cash proceeds received from the South Texas Divestiture were approximately $17.1 million.
Our Oil and Natural Gas Data
Our Reserves
Internal Controls. Our proved reserves were estimated at the well or unit level and audited for reporting purposes by Ryder Scott, our independent reserve engineers. The Company maintains internal evaluations of our reserves in a secure reserve engineering database. Ryder Scott interacts with the Company’s internal petroleum engineers and geoscience professionals in each of our operating areas and with operating, accounting and marketing employees to obtain the necessary data for the reserves audit process. Reserves are reviewed and approved internally by our senior management on an annual basis and evaluated by our lender group on at least a semi-annual basis in connection with borrowing base redeterminations under our New Revolving Credit Facility. Our reserve estimates are audited by Ryder Scott at least annually.
Our internal professional staff works closely with Ryder Scott to ensure the integrity, accuracy and timeliness of data that is furnished to them for their reserve audit process. All of the reserve information maintained in our secure reserve engineering database is provided to the external engineers. In addition, we provide Ryder Scott other pertinent data, such as seismic information, geologic maps, well logs, production tests, material balance calculations, well performance data, operating procedures and relevant economic criteria. We make all requested information, as well as our pertinent personnel, available to the external engineers as part of their audit of our reserves.
Qualifications of Responsible Technical Persons
Internal Engineers. Tony Lopez and Christa Yin are the technical personnel at the Company primarily responsible for overseeing and providing oversight of the preparation of the reserves estimates with our third-party reserve engineers, who audit the internally prepared reserve report for our properties.
Mr. Lopez has 13 years of corporate reserve reporting experience. Most recently Mr. Lopez was Vice President of Acquisitions and Engineering for EnerVest, Ltd., where he managed the corporate reserve reporting process and the financial planning & analysis department. Prior to that, Mr. Lopez was Manager of Reservoir Engineering for EnerVest’s Eastern Division. Mr. Lopez is a graduate of West Virginia University and holds a B.S. in Petroleum and Natural Gas Engineering. Mr. Lopez is an active member of the Society of Petroleum Engineers.
Ms. Yin has been practicing petroleum engineering at the Company since March 2015 and has over 19 years of experience in the estimation and evaluation of reserves. From March 2014 to March 2015, she was employed by Tundra Oil and Gas, where she was responsible for analysis of acquisitions, generating development plans and managing reserves. From August 2011 to March 2014, she worked for HighMount Exploration & Production LLC as Manager of Acquisitions and Divestitures. From February 2005 to August 2011, Ms. Yin was employed by Tecpetrol, where she was responsible for generating development plans and managing and evaluating the reserves for the Gulf Coast region. From November 2003 to February 2005, Ms. Yin was employed by Marathon Oil Company where she was responsible for evaluating reserves and field development of various fields in Oklahoma. From June 1997 to November 2003, she held various positions which included the evaluation and estimation of reserves at Coastal Oil & Gas, which subsequently merged with El Paso Production Company. Ms. Yin is a graduate of Texas A&M University and holds a B.S. in Petroleum Engineering.
Ryder Scott Company, L.P. Ryder Scott is an independent oil and natural gas consulting firm. No director, officer, or key employee of Ryder Scott has any financial ownership in us or any of our affiliates. Ryder Scott’s compensation for the required investigations and preparation of its report is not contingent upon the results obtained and reported. Ryder Scott has not performed other work for us or any of our affiliates that would affect its objectivity. The audit of estimates of our proved reserves presented in the Ryder Scott reserve report were overseen by Timothy Wayne Smith.
Mr. Smith has been practicing consulting petroleum engineering at Ryder Scott since 2008. Before joining Ryder Scott, Mr. Smith served in a number of engineering positions with Wintershall Energy and Cities Service Oil Company. Mr. Smith is a Licensed Professional Engineer in the State of Texas with over 25 years of practical experience in the estimation and evaluation of petroleum reserves. He graduated from West Virginia University with a B.S. in Petroleum Engineering and from University of Phoenix with an M.B.A.
12
Mr. Smith meets or exceeds the education, training and experience requirements set forth in the Standards Pertaining to the Estimating and Auditing of Oil and Gas Reserves Information promulgated by the Society of Petroleum Engineers; he is proficient in applying industry standard practices to engineering and geoscience evaluations as well as applying SEC and other industry reserves definitions and guidelines.
Estimated Proved Reserves
The following table presents the estimated net proved oil and natural gas reserves attributable to our properties and the standardized measure associated with the estimated proved reserves attributable to our properties as of December 31, 2018, based on our internally prepared reserve report audited by Ryder Scott, our independent reserve engineers. The standardized measure shown in the table are not intended to represent the current market value of our estimated oil and natural gas reserves.
| Reserves | |
| Oil | | | Natural Gas | | | NGLs | | | Total | |
| (MBbls) | | | (MMcf) | | | (MBbls) | | | (MMcfe) (1) | |
Estimated Proved Reserves | | | | | | | | | | | | | | | |
Developed | | 54,147 | | | | 232,110 | | | | 17,324 | | | | 660,937 | |
Undeveloped | | 15,477 | | | | 61,849 | | | | 4,248 | | | | 180,200 | |
Total | | 69,624 | | | | 293,959 | | | | 21,572 | | | | 841,137 | |
| | | | | | | | | | | | | | | |
Proved developed reserves as a percentage of total proved reserves | | | | | | | | | | | | | | 79 | % |
| | | | | | | | | | | | | | | |
Standardized measure (in thousands) (2) | | | | | | | | | | | | | $ | 1,113 | |
| | | | | | | | | | | | | | | |
Oil and Natural Gas Prices (3) | | | | | | | | | | | | | | | |
Oil – WTI per Bbl | | | | | | | | | | | | | $ | 65.56 | |
Natural gas – Henry Hub per MMBtu | | | | | | | | | | | | | $ | 3.10 | |
| (1) | Determined using a ratio of six Mcf of natural gas to one Bbl of oil, condensate or NGLs based on an approximate energy equivalency. This is an energy content correlation and does not reflect a value or price relationship between the commodities. |
| (2) | Standardized measure is the present value of estimated future net revenues to be generated from the production of proved reserves, determined in accordance with the rules and regulations of the SEC without giving effect to non-property related expenses, such as general and administrative expenses, interest expense, or to depletion, depreciation and amortization. The future cash flows are discounted using an annual discount rate of 10%. Standardized measure does not give effect to derivative transactions. For a description of our commodity derivative contracts, see “Item 1. Business — Operations — Derivative Activities” as well as “Item 7. Management’s Discussion and Analysis of Financial Condition and Results of Operations — Commodity Derivative Contracts.” |
| (3) | Our estimated net proved reserves and related standardized measure were determined using 12-month trailing average oil and natural gas index prices, calculated as the unweighted arithmetic average for the first-day-of-the-month price for each month in effect as of the date of the estimate, without giving effect to derivative contracts, held constant throughout the life of the properties. These prices were adjusted by lease for quality, transportation fees, geographical differentials, marketing bonuses or deductions and other factors affecting the price received at the wellhead. |
The data in the table above represents estimates only. Oil and natural gas reserve engineering is inherently a subjective process of estimating underground accumulations of oil and natural gas that cannot be measured exactly. The accuracy of any reserve estimate is a function of the quality of available data and engineering and geological interpretation and judgment. Accordingly, reserve estimates may vary from the quantities of oil and natural gas that are ultimately recovered. For a discussion of risks associated with internal reserve estimates, see “Item 1A. Risk Factors — Risks Related to Our Business — Our estimated reserves and future production rates are based on many assumptions that may turn out to be inaccurate. Any material inaccuracies in our reserve estimates or underlying assumptions will materially affect the quantities and present value of our estimated reserves.”
Future prices received for production and costs may vary, perhaps significantly, from the prices and costs assumed for purposes of these estimates. The standardized measure shown above should not be construed as the current market value of our estimated oil and natural gas reserves. The 10% discount factor used to calculate standardized measure, which is required by the SEC and FASB, is not necessarily the most appropriate discount rate. The present value, no matter what discount rate is used, is materially affected by assumptions as to timing of future production, which may prove to be inaccurate.
Development of Proved Undeveloped Reserves
As of December 31, 2018, we had 180.2 Bcfe of proved undeveloped reserves comprised of 15.5 MMBbls of oil, 61.8 Bcfe of natural gas and 4.2 MMBbls of NGLs. None of our PUDs as of December 31, 2018 are scheduled to be developed on a date more than five years from the date the reserves were initially booked as PUDs. PUDs will be converted from undeveloped to developed as the applicable wells begin production.
Changes in PUDs that occurred during 2018 were due to:
| • | Downward performance and price revisions of 91 Bcfe; |
| • | Reclassifications of 18 Bcfe into proved developed reserves as wells are drilled, completed and turned to production; and |
13
| • | Reserve additions of 7 Bcfe. |
Approximately 6% (18 Bcfe) of our PUDs recorded as of December 31, 2017 were developed during the twelve months ended December 31, 2018. Total costs incurred to develop these PUDs were approximately $27.1 million, of which $11.7 million was incurred in fiscal year 2017 and $15.3 million was incurred in fiscal year 2018. In total, we incurred total capital expenditures of approximately $17.6 million during fiscal year 2018 developing PUDs, which includes $2.3 million associated with PUDs to be completed in 2019. As we continue to develop our properties and have more well production and completion data, we believe we will continue to realize cost savings and experience lower relative drilling and completion costs as we convert PUDs into proved developed reserves in the upcoming years. Based on our current expectations of our cash flows, we believe that we can fund the drilling of our current PUD inventory and our expansions in the next five years from our cash flow from operations and borrowings under our New Revolving Credit Facility. For a more detailed discussion of our liquidity position, see “Item 7. Management’s Discussion and Analysis of Financial Condition and Results of Operations — Liquidity and Capital Resources.”
Production, Revenue and Price History
For a description of our and the Predecessor’s historical production, revenues and average sales prices and per unit costs, see “Item 7. Management’s Discussion and Analysis of Financial Condition and Results of Operations — Results of Operations.”
The following tables summarize our average net production, average unhedged sales prices by product and average production costs (not including ad valorem and severance taxes) by geographic region for the year ended December 31, 2018, the period from May 5, 2017 through December 31, 2017, the period from January 1, 2017 through May 4, 2017 and the year ended December 31, 2016, respectively:
| For the Year Ended December 31, 2018 (Successor) | |
| Oil | | | NGLs | | | Natural Gas | | | Total | | | | | |
| | | | | Average | | | | | | | Average | | | | | | | Average | | | | | | | Average | | | Lease | |
| Production | | | Sales | | | Production | | | Sales | | | Production | | | Sales | | | Production | | | Sales | | | Operating | |
| Volumes | | | Price | | | Volumes | | | Price | | | Volumes | | | Price | | | Volumes | | | Price | | | Expense | |
| (MBbls) | | | ($/bbl) | | | (MBbls) | | | ($/bbl) | | | (MMcf) | | | ($/Mcf) | | | (MMcfe) | | | ($/Mcfe) | | | ($/Mcfe) | |
East Texas/ North Louisiana | | 293 | | | $ | 63.84 | | | | 1,156 | | | $ | 25.85 | | | | 26,972 | | | $ | 3.08 | | | | 35,662 | | | $ | 3.69 | | | $ | 0.72 | |
Rockies | | 1,300 | | | | 59.45 | | | | 220 | | | | 44.50 | | | | — | | | | — | | | | 9,120 | | | | 9.55 | | | | 5.01 | |
South Texas (1) | | 387 | | | | 68.58 | | | | 120 | | | | 23.14 | | | | 2,204 | | | | 2.42 | | | | 5,251 | | | | 6.61 | | | | 1.64 | |
California | | 1,355 | | | | 63.85 | | | | — | | | | — | | | | — | | | | — | | | | 8,133 | | | | 10.64 | | | | 4.24 | |
Total | | 3,335 | | | $ | 62.68 | | | | 1,496 | | | $ | 28.38 | | | | 29,176 | | | $ | 3.03 | | | | 58,166 | | | $ | 5.84 | | | $ | 1.97 | |
| | | | | | | | | | | | | | | | | | | | | | | | | | | | | | | | | | | |
Average net production (MMcfe/d) | | | | | | | | | | | | | | | | | | | | | | | | | | 159.4 | | | | | | | | | |
(1) | South Texas region properties include wells and properties in numerous fields located primarily in the Eagle Ford, Eagleville, NE Thompsonville, Laredo and East Seven Sisters fields. On May 30, 2018, we closed the South Texas Divestiture. The remaining properties in the South Texas region are located primarily in the Eagle Ford and Eagleville fields at December 31, 2018. |
| For the period from May 5, 2017 through December 31, 2017 (Successor) | |
| Oil | | | NGLs | | | Natural Gas | | | Total | | | | | |
| | | | | Average | | | | | | | Average | | | | | | | Average | | | | | | | Average | | | Lease | |
| Production | | | Sales | | | Production | | | Sales | | | Production | | | Sales | | | Production | | | Sales | | | Operating | |
| Volumes | | | Price | | | Volumes | | | Price | | | Volumes | | | Price | | | Volumes | | | Price | | | Expense | |
| (MBbls) | | | ($/bbl) | | | (MBbls) | | | ($/bbl) | | | (MMcf) | | | ($/Mcf) | | | (MMcfe) | | | ($/Mcfe) | | | ($/Mcfe) | |
East Texas/ North Louisiana | | 163 | | | $ | 50.31 | | | | 811 | | | $ | 22.40 | | | | 18,402 | | | $ | 3.06 | | | | 24,240 | | | $ | 3.41 | | | $ | 0.65 | |
Rockies | | 879 | | | | 45.52 | | | | 151 | | | | 34.77 | | | | — | | | | — | | | | 6,180 | | | | 7.32 | | | | 4.95 | |
South Texas | | 316 | | | | 50.88 | | | | 152 | | | | 22.37 | | | | 3,483 | | | | 2.84 | | | | 6,297 | | | | 4.67 | | | | 1.17 | |
California | | 1,022 | | | | 46.81 | | | | — | | | | — | | | | — | | | | — | | | | 6,133 | | | | 7.80 | | | | 3.38 | |
Total | | 2,380 | | | $ | 47.11 | | | | 1,114 | | | $ | 24.07 | | | | 21,885 | | | $ | 3.03 | | | | 42,850 | | | $ | 4.79 | | | $ | 1.74 | |
| | | | | | | | | | | | | | | | | | | | | | | | | | | | | | | | | | | |
Average net production (MMcfe/d) | | | | | | | | | | | | | | | | | | | | | | | | | | 177.8 | | | | | | | | | |
14
| For the period from January 1, 2017 through May 4, 2017 (Predecessor) | |
| Oil | | | NGLs | | | Natural Gas | | | Total | | | | | |
| | | | | Average | | | | | | | Average | | | | | | | Average | | | | | | | Average | | | Lease | |
| Production | | | Sales | | | Production | | | Sales | | | Production | | | Sales | | | Production | | | Sales | | | Operating | |
| Volumes | | | Price | | | Volumes | | | Price | | | Volumes | | | Price | | | Volumes | | | Price | | | Expense | |
| (MBbls) | | | ($/bbl) | | | (MBbls) | | | ($/bbl) | | | (MMcf) | | | ($/Mcf) | | | (MMcfe) | | | ($/Mcfe) | | | ($/Mcfe) | |
East Texas/ North Louisiana | | 149 | | | $ | 48.23 | | | | 456 | | | $ | 20.68 | | | | 10,708 | | | $ | 3.17 | | | | 14,345 | | | $ | 3.53 | | | $ | 0.54 | |
Rockies | | 440 | | | | 46.34 | | | | 86 | | | | 37.10 | | | | — | | | | — | | | | 3,155 | | | | 7.48 | | | | 5.04 | |
South Texas | | 129 | | | | 49.48 | | | | 74 | | | | 20.05 | | | | 1,703 | | | | 3.02 | | | | 2,919 | | | | 4.46 | | | | 1.18 | |
California | | 486 | | | | 44.77 | | | | — | | | | — | | | | — | | | | — | | | | 2,917 | | | | 7.46 | | | | 2.88 | |
Total | | 1,204 | | | $ | 46.28 | | | | 616 | | | $ | 22.90 | | | | 12,411 | | | $ | 3.15 | | | | 23,336 | | | $ | 4.67 | | | $ | 1.52 | |
| | | | | | | | | | | | | | | | | | | | | | | | | | | | | | | | | | | |
Average net production (MMcfe/d) | | | | | | | | | | | | | | | | | | | | | | | | | | 188.2 | | | | | | | | | |
| For the Year Ended December 31, 2016 (Predecessor) | |
| Oil | | | NGLs | | | Natural Gas | | | Total | | | | | |
| | | | | Average | | | | | | | Average | | | | | | | Average | | | | | | | Average | | | Lease | |
| Production | | | Sales | | | Production | | | Sales | | | Production | | | Sales | | | Production | | | Sales | | | Operating | |
| Volumes | | | Price | | | Volumes | | | Price | | | Volumes | | | Price | | | Volumes | | | Price | | | Expense | |
| (MBbls) | | | ($/bbl) | | | (MBbls) | | | ($/bbl) | | | (MMcf) | | | ($/Mcf) | | | (MMcfe) | | | ($/Mcfe) | | | ($/Mcfe) | |
East Texas/ North Louisiana | | 443 | | | $ | 39.48 | | | | 1,841 | | | $ | 13.64 | | | | 37,236 | | | $ | 2.45 | | | | 50,938 | | | $ | 2.62 | | | $ | 0.53 | |
Rockies | | 1,399 | | | | 37.94 | | | | 202 | | | | 22.02 | | | | 1,612 | | | | 1.73 | | | | 11,217 | | | | 5.38 | | | | 4.45 | |
South Texas | | 416 | | | | 39.24 | | | | 240 | | | | 14.95 | | | | 5,804 | | | | 2.29 | | | | 9,742 | | | | 3.41 | | | | 1.31 | |
California | | 1,445 | | | | 34.97 | | | | — | | | | — | | | | — | | | | — | | | | 8,672 | | | | 5.83 | | | | 3.62 | |
Permian | | 180 | | | | 33.39 | | | | — | | | | — | | | | 124 | | | | 2.54 | | | | 1,204 | | | | 5.25 | | | | 4.10 | |
Total | | 3,883 | | | $ | 36.94 | | | | 2,283 | | | $ | 14.52 | | | | 44,776 | | | $ | 2.40 | | | | 81,773 | | | $ | 3.47 | | | $ | 1.54 | |
| | | | | | | | | | | | | | | | | | | | | | | | | | | | | | | | | | | |
Average net production (MMcfe/d) | | | | | | | | | | | | | | | | | | | | | | | | | | 223.4 | | | | | | | | | |
Productive Wells
Productive wells consist of producing wells and wells capable of production, including natural gas wells awaiting pipeline connections to commence deliveries and oil wells awaiting connection to production facilities. Gross wells are the total number of producing wells in which we own an interest and net wells are the sum of our fractional working interests owned in gross wells. The following table sets forth information relating to the productive wells in which we owned a working interest as of December 31, 2018.
| Oil | | | Natural Gas | |
| Gross | | | Net | | | Gross | | | Net | |
Operated | | 224 | | | | 218 | | | | 971 | | | | 814 | |
Non-operated | | 288 | | | | 25 | | | | 585 | | | | 67 | |
Total | | 512 | | | | 243 | | | | 1,556 | | | | 881 | |
15
Developed Acreage
Acreage related to royalty, overriding royalty and other similar interests is excluded from this summary. As of December 31, 2018, substantially all of our leasehold acreage was held by production. The following table sets forth information as of December 31, 2018 relating to our leasehold acreage.
Region | Developed Acreage (1) | |
| Gross (2) | | | Net (3) | |
East Texas/ North Louisiana | | 220,405 | | | | 151,408 | |
South Texas (4) | | 14,167 | | | | 811 | |
Rockies | | 6,653 | | | | 6,653 | |
California | | 17,280 | | | | 17,280 | |
Total | | 258,505 | | | | 176,152 | |
| (1) | Developed acres are acres spaced or assigned to productive wells or wells capable of production. |
| (2) | A gross acre is an acre in which we own a working interest. The number of gross acres is the total number of acres in which we own a working interest. |
| (3) | A net acre is deemed to exist when the sum of our fractional ownership working interests in gross acres equals one. The number of net acres is the sum of the fractional working interests owned in gross acres expressed as whole numbers and fractions thereof. |
| (4) | South Texas region properties include wells and properties in fields located primarily in the Eagle Ford and Eagleville as of December 31, 2018. |
Undeveloped Acreage
The following table sets forth information as of December 31, 2018 relating to our undeveloped leasehold acreage (including the remaining terms of leases and concessions).
| Undeveloped | | | Net Acreage Subject to | |
Region | Acreage | | | Lease Expiration by Year | |
| Gross (1) | | | Net (2) | | | 2019 | | | 2020 | | | 2021 | |
East Texas/ North Louisiana | | 30,092 | | | | 17,286 | | | | 69 | | | | 219 | | | | 18 | |
Total | | 30,092 | | | | 17,286 | | | | 69 | | | | 219 | | | | 18 | |
| (1) | A gross acre is an acre in which we own a working interest. The number of gross acres is the total number of acres in which we own a working interest. |
| (2) | A net acre is deemed to exist when the sum of our fractional ownership working interests in gross acres equals one. The number of net acres is the sum of the fractional working interests owned in gross acres expressed as whole numbers and fractions thereof. |
Drilling Activities
Our drilling activities primarily consist of development wells. The following table sets forth information with respect to (i) wells drilled and completed during the periods indicated and (ii) wells drilled in a prior period but completed during the periods indicated. The information should not be considered indicative of future performance, nor should a correlation be assumed between the number of productive wells drilled, quantities of reserves found or economic value. At December 31, 2018, 20 gross (1.1 net) wells were in various stages of completion.
| Year Ended December 31, | |
| 2018 | | | 2017 | | | 2016 | |
| Gross | | | Net | | | Gross | | | Net | | | Gross | | | Net | |
Development wells: | | | | | | | | | | | | | | | | | | | | | | | |
Productive | | 17.0 | | | | 4.6 | | | | 25.0 | | | | 4.4 | | | | 23.0 | | | | 8.0 | |
Dry | | — | | | | — | | | | — | | | | — | | | | — | | | | — | |
Exploratory wells: | | | | | | | | | | | | | | | | | | | | | | | |
Productive | | — | | | | — | | | | — | | | | — | | | | — | | | | — | |
Dry | | — | | | | — | | | | — | | | | — | | | | — | | | | — | |
Total wells: | | | | | | | | | | | | | | | | | | | | | | | |
Productive | | 17.0 | | | | 4.6 | | | | 25.0 | | | | 4.4 | | | | 23.0 | | | | 8.0 | |
Dry | | — | | | | — | | | | — | | | | — | | | | — | | | | — | |
Total | | 17.0 | | | | 4.6 | | | | 25.0 | | | | 4.4 | | | | 23.0 | | | | 8.0 | |
Delivery Commitments
We have no commitments to deliver a fixed and determinable quantity of our oil or natural gas production in the near future under our existing sales contracts.
16
We have entered into a long-term gas gathering agreement associated with a certain portion of our East Texas production with a third party midstream service provider that has volumetric requirements. Information regarding our delivery commitments under this contract is contained in “Item 7. Management’s Discussion and Analysis of Financial Condition and Results of Operations — Contractual Obligations” and Note 17 of the Notes to Consolidated Financial Statements included under “Item 8. Financial Statements and Supplementary Data,” both contained herein.
Operations
General
As of December 31, 2018, the Company is the operator of record of properties containing 92% of our total estimated proved reserves. We design and manage the development, recompletion and/or workover operations, and supervise other operation and maintenance activities, for all of the wells we operate. We do not own the drilling rigs or other oil field services equipment used for drilling or maintaining wells on our onshore properties; independent contractors provide all the equipment and personnel associated with these activities. Our Beta platforms have permanent drilling systems in place.
Marketing and Major Customers
The following individual customers each accounted for 10% or more of our total reported revenues for the period indicated:
| Successor | | | | Predecessor | |
| For the | | | Period from | | | | Period from | | | For the | |
| Year Ended | | | May 5, 2017 | | | | January 1, 2017 | | | Year Ended | |
| December 31, | | | through | | | | through | | | December 31, | |
| 2018 | | | December 31, 2017 | | | | May 4, 2017 | | | 2016 | |
Major customers: | | | | | | | | | | | | | | | | |
Phillips 66 | 27% | | | 23% | | | | 19% | | | 19% | |
Sinclair Oil & Gas Company | 21% | | | 19% | | | | 20% | | | 16% | |
CIMA Energy | 10% | | | 11% | | | | n/a | | | n/a | |
BP America Production Company | n/a | | | 10% | | | | 10% | | | n/a | |
Royal Dutch Shell plc and subsidiaries | n/a | | | n/a | | | | n/a | | | 14% | |
The production sales agreements covering our properties contain customary terms and conditions for the oil and natural gas industry and provide for sales based on prevailing market prices. A majority of those agreements have terms that renew on a month-to-month basis until either party gives advance written notice of termination.
If we were to lose any one of our customers, the loss could temporarily delay production and sale of a portion of our oil and natural gas in the related producing region. If we were to lose any single customer, we believe we could identify a substitute customer to purchase the impacted production volumes. However, if one or more of our larger customers ceased purchasing oil or natural gas altogether and we were unable to replace them, the loss of any such customer could have a detrimental effect on our production volumes and revenues in general.
Title to Properties
We believe that we have satisfactory title to all of our producing properties in accordance with generally accepted industry standards. As is customary in the industry, in the case of undeveloped properties, often cursory investigation of record title is made at the time of lease acquisition. More thorough title investigations are customarily made before the consummation of an acquisition of producing properties and before commencement of drilling operations on undeveloped properties. Individual properties may be subject to burdens that we believe do not materially interfere with the use or affect the value of the properties. Burdens on properties may include customary royalty interests, liens incident to operating agreements and for current taxes, obligations or duties under applicable laws, development obligations under natural gas leases, or net profits interests.
Derivative Activities
We enter into commodity derivative contracts with unaffiliated third parties, generally lenders under our New Revolving Credit Facility or their affiliates, to achieve more predictable cash flows and to reduce our exposure to fluctuations in oil and natural gas prices. We intend to enter into commodity derivative contracts at times and on terms desired to maintain a portfolio of commodity derivative contracts covering at least 25% - 50% of our estimated production from total proved developed producing reserves over a one-to-three year period at any given point of time to satisfy the hedging covenants in our New Revolving Credit Facility and pursuant to our internal policies. We may, however, from time to time, hedge more or less than this approximate amount.
Periodically, we enter into interest rate swaps to mitigate exposure to market rate fluctuations by converting variable interest rates (such as those in our New Revolving Credit Facility) to fixed interest rates.
17
It is our policy to enter into derivative contracts only with creditworthy counterparties, which generally are financial institutions, deemed by management as competent and competitive market makers. Some of the lenders, or certain of their affiliates, under our New Revolving Credit Facility are counterparties to our derivative contracts. We will continue to evaluate the benefit of employing derivatives in the future. See “Item 7A. Quantitative and Qualitative Disclosures About Market Risk” for additional information.
Competition
We operate in a highly competitive environment for acquiring properties, leasing acreage, contracting for drilling equipment and securing trained personnel. Many of our competitors possess and employ financial, technical and personnel resources substantially greater than ours, which can be particularly important in the areas in which we operate. As a result, our competitors may be able to pay more for productive oil and natural gas properties and exploratory prospects, as well as evaluate, bid for and purchase a greater number of properties and prospects than our financial or personnel resources permit. Our ability to acquire additional properties and to find and develop reserves will depend on our ability to evaluate and select suitable properties and to consummate transactions in a highly competitive environment. In addition, there is substantial competition for capital available for investment in the oil and natural gas industry and many of our competitors have access to capital at a lower cost than that available to us.
Seasonal Nature of Business
The price we receive for our natural gas production is impacted by seasonal fluctuations in demand for natural gas. The demand for natural gas typically peaks during the coldest months and tapers off during the milder months, with a slight increase during the summer to meet the demands of electric generators. The weather during any particular season can affect this cyclical demand for natural gas. Seasonal anomalies such as mild winters or hot summers can lessen or intensify this fluctuation. In addition, certain natural gas users utilize natural gas storage facilities and purchase some of their anticipated winter requirements during the summer. This can also lessen seasonal demand fluctuations.
Hydraulic Fracturing
We use hydraulic fracturing as a means to maximize the productivity of almost every well that we drill and complete, except in our offshore wells. Hydraulic fracturing is a necessary part of the completion process because our properties are dependent upon our ability to effectively fracture the producing formations in order to produce at economic rates. Our proved non-producing and proved undeveloped reserves make up 29% of the proved reserves with approximately 60% of these requiring hydraulic fracturing as of December 31, 2018.
We believe we have followed and continue to substantially follow applicable industry standard practices and legal and regulatory requirements for groundwater protection in our operations which are subject to supervision by state and federal regulators (including the Bureau of Land Management (the “BLM”) on federal acreage). These protective measures include setting surface casing at a depth sufficient to protect fresh water zones as determined by regulatory agencies and cementing the well to create a permanent isolating barrier between the casing pipe and surrounding geological formations. This aspect of well design is intended to essentially eliminate a pathway for the fracturing fluid to contact any aquifers during the hydraulic fracturing operations. For recompletions of existing wells, the production casing is pressure tested prior to perforating the new completion interval.
Injection rates and pressures are monitored instantaneously and in real time at the surface during our hydraulic fracturing operations. Pressure is monitored on both the injection string and the immediate annulus to the injection string. Hydraulic fracturing operations would be shut down immediately if an abnormal change occurred to the injection pressure or annular pressure.
Certain state regulations require disclosure of the components in the solutions used in hydraulic fracturing operations. Approximately 99% of the hydraulic fracturing fluids we use are made up of water and sand. The remainder of the constituents in the fracturing fluid are managed and used in accordance with applicable requirements.
Hydraulic fracture stimulation requires the use of a significant volume of water. Upon flowback of the water, we dispose of it into approved disposal or injection wells. We currently do not discharge water to the surface.
For information regarding existing and proposed governmental regulations regarding hydraulic fracturing and related environmental matters, see “— Environmental, Occupational Health and Safety Matters and Regulations — Hydraulic Fracturing.”
Insurance
In accordance with customary industry practice, we maintain insurance against many, but not all, potential losses or liabilities arising from our operations and at costs that we believe to be economic. We regularly review our risks of loss and the cost and availability of insurance and revise our insurance accordingly. Our insurance does not cover every potential risk associated with our operations, including the potential loss of significant revenues. We can provide no assurance that our coverage will adequately protect us against liability from all potential consequences, damages and losses. We currently have insurance policies that include the following:
• Commercial General Liability; | • Oil Pollution Act Liability; |
• Primary Umbrella / Excess Liability; | • Pollution Legal Liability; |
• Property; | • Charterer’s Legal Liability; |
18
• Workers’ Compensation; | • Non-Owned Aircraft Liability; |
• Employer’s Liability; | • Automobile Liability; |
• Maritime Employer’s Liability; | • Directors & Officers Liability; |
• U.S. Longshore and Harbor Workers’; | • Employment Practices Liability; |
• Energy Package/Control of Well; | • Crime; and |
• Loss of Production Income (offshore only); | • Fiduciary. |
We continuously monitor regulatory changes and comments and consider their impact on the insurance market, along with and our overall risk profile. As necessary, we will adjust our risk and insurance program to provide protection at a level we consider appropriate, while weighing the cost of insurance against the potential and magnitude of disruption to our operations and cash flows. Changes in laws and regulations could lead to changes in underwriting standards, limitations on scope and amount of coverage, and higher premiums, including possible increases in liability caps for claims of damages from oil spills.
Environmental, Occupational Health and Safety Matters and Regulations
General
Our oil and natural gas development and production operations are subject to stringent and complex federal, state and local laws and regulations governing the discharge of materials into the environment, health and safety aspects of our operations, or otherwise relating to environmental protection. These laws and regulations impose numerous obligations applicable to our operations including the acquisition of a permit before conducting regulated drilling activities; the restriction of types, quantities and concentration of materials that can be released into the environment; the limitation or prohibition of drilling activities on certain lands lying within wilderness, wetlands, seismically active areas and other protected areas; the application of specific health and safety criteria addressing worker protection; and the imposition of substantial liabilities for pollution resulting from our operations. Numerous governmental authorities, such as the U.S. Environmental Protection Agency (“EPA”) and analogous state agencies, have the power to enforce compliance with these laws and regulations and the permits issued under them, often requiring difficult and costly compliance or corrective actions. Failure to comply with these laws and regulations may result in the assessment of sanctions, including administrative, civil or criminal penalties, the imposition of investigatory or remedial obligations, the suspension or revocation of necessary permits, licenses and authorizations, the requirement that additional pollution controls be installed and in some instances, the issuance of orders limiting or prohibiting some or all of our operations. In addition, we may experience delays in obtaining or be unable to obtain required permits, which may delay or interrupt our operations and limit our growth and revenue.
Under certain environmental laws that impose strict as well as joint and several liability, we may be required to remediate contaminated properties currently or formerly owned or operated by us or facilities of third parties that received waste generated by our operations regardless of whether such contamination resulted from the conduct of others or from consequences of our own actions that were in compliance with all applicable laws at the time those actions were taken. In addition, claims for damages to persons or property, including natural resources, may result from the environmental, health and safety impacts of our operations. Moreover, public interest in the protection of the environment has increased in recent years. The trend of more expansive and stringent environmental legislation and regulations applied to the crude oil and natural gas industry could continue, resulting in increased costs of doing business and consequently affecting profitability. To the extent laws are enacted or other governmental action is taken that restricts drilling or imposes more stringent and costly operating, waste handling, disposal and cleanup requirements, our business, prospects, financial condition or results of operations could be materially adversely affected.
The following is a summary of the more significant existing environmental, occupational health and safety laws and regulations to which our business operations are subject and for which compliance may have a material adverse impact on our capital expenditures, results of operations or financial position.
BOEM & BSEE
Our oil and gas operations associated with our Beta properties are conducted on offshore leases in federal waters. The Bureau of Ocean Energy Management (“BOEM”) and the Bureau of Safety and Environmental Enforcement (“BSEE”) have broad authority to regulate our oil and gas operations associated with our Beta properties.
BOEM is responsible for managing environmentally and economically responsible development of the nation’s offshore resources. Its functions include offshore leasing, resource evaluation, review and administration of oil and gas exploration and development plans, renewable energy development, National Environmental Policy Act analysis and environmental studies. Lessees must obtain BOEM approval for exploration, development and production plans prior to the commencement of offshore operations. In addition, approvals and permits are required from other agencies such as the U.S. Coast Guard, the EPA, U.S. Department of Transportation and the South Coast Air Quality Management District. BOEM generally requires that lessees have substantial net worth, post supplemental bonds or provide other acceptable assurances that the obligations will be met. In July 2016, BOEM issued updated guidance for determining if and when additional security is required for Outer Continental Shelf (“OCS”) leases, pipeline rights-of-way and rights-of-use and easement. The new criteria may require lessees or operators to take additional steps to demonstrate that they have the financial ability to carry out their obligations. In June 2017, BOEM announced that the implementation timeline would be extended, except in circumstances where there is a substantial risk of nonperformance of the interest holder’s obligations.
19
BSEE is responsible for safety and environmental oversight of offshore oil and gas operations. Its functions include the development and enforcement of safety and environmental regulations, permitting offshore exploration, development and production, inspections, offshore regulatory programs, oil spill response and newly formed training and environmental compliance programs. BSEE regulations require offshore production facilities and pipelines located on the OCS to meet stringent engineering and construction specifications, and BSEE has proposed and/or promulgated additional safety-related regulations concerning the design and operating procedures of these facilities and pipelines, including regulations to safeguard against or respond to well blowouts and other catastrophes. BSEE regulations also restrict the flaring or venting of natural gas, prohibit the flaring of liquid hydrocarbons and govern the plugging and abandonment of wells located offshore and the installation and removal of all fixed drilling and production facilities.
BOEM and BSEE have adopted regulations providing for enforcement actions, including civil penalties and lease forfeiture or cancellation for failure to comply with regulatory requirements for offshore operations. If we fail to pay royalties or comply with safety and environmental regulations, BOEM and BSEE may require that our operations on the Beta properties be suspended or terminated and we may be subject to civil or criminal liability.
In January 2016, BOEM and BSEE entered into a settlement agreement with environmental groups promising to study the potential environmental impacts of well-stimulation practices on the Pacific OCS, including hydraulic fracturing and acid well stimulation. The study was completed in May 2016, finding no significant impact from these activities, and BSEE resumed its review of permit applications involving hydraulic fracturing operations or acid well stimulation on the Pacific OCS. However, in November 2018, a federal court prohibited BOEM and BSEE from approving any plans or issuing permits involving hydraulic fracturing and/or acid well stimulation on the Pacific OCS. Although we do not use either hydraulic fracturing or acid stimulation routinely in connection with our operations on the Beta properties, delays in the approval or refusal of plans and issuance of permits by BOEM or BSEE because of staffing, economic, environmental, legal or other reasons (or other actions taken by BOEM or BSEE) could adversely affect our offshore operations. The requirements imposed by BOEM and BSEE regulations are frequently changed and subject to new interpretations.
Hazardous Substances and Waste Handling
Our operations are subject to environmental laws and regulations relating to the management and release of hazardous substances, solid and hazardous wastes and petroleum hydrocarbons. These laws generally regulate the generation, storage, treatment, transportation and disposal of solid and hazardous waste and may impose strict and, in some cases, joint and several liability for the investigation and remediation of affected areas where hazardous substances may have been released or disposed. The Comprehensive Environmental Response, Compensation and Liability Act, as amended (“CERCLA”), also referred to as the Superfund law and comparable state laws impose liability, without regard to fault or the legality of the original conduct, on certain classes of persons deemed “responsible parties.” These persons include current owners or operators of the site where a release of hazardous substances occurred, prior owners or operators that owned or operated the site at the time of the release or disposal of hazardous substances and companies that disposed or arranged for the disposal of the hazardous substances found at the site. Under CERCLA, these persons may be subject to strict and joint and several liability for the costs of cleaning up the hazardous substances that have been released into the environment, for damages to natural resources and for the costs of certain health studies. CERCLA also authorizes the EPA and, in some instances, third parties to act in response to threats to the public health or the environment and to seek to recover the costs they incur from the responsible classes of persons. It is not uncommon for neighboring landowners and other third parties to file common law-based claims for personal injury and property damage allegedly caused by hazardous substances or other pollutants released into the environment. Despite the “petroleum exclusion” of Section 101(14) of CERCLA, which currently encompasses natural gas, we may nonetheless handle hazardous substances within the meaning of CERCLA, or similar state statutes, in the course of our ordinary operations and as a result, may be jointly and severally liable under CERCLA for all or part of the costs required to clean up sites at which these hazardous substances have been released into the environment. Also, comparable state statutes may not contain a similar exemption for petroleum. In addition, we may have liability for releases of hazardous substances at our properties by prior owners or operators or other third parties.
The Oil Pollution Act of 1990 (“OPA”) is the primary federal law imposing oil spill liability. The OPA contains numerous requirements relating to the prevention of and response to petroleum releases into waters of the United States, including the requirement that operators of offshore facilities and certain onshore facilities near or crossing waterways must maintain certain significant levels of financial assurance to cover potential environmental cleanup and restoration costs. Under the OPA, strict, joint and several liability may be imposed on “responsible parties” for all containment and cleanup costs and certain other damages arising from a release, including, but not limited to, the costs of responding to a release of oil to surface waters and natural resource damages resulting from oil spills into or upon navigable waters, adjoining shorelines or in the exclusive economic zone of the United States. A “responsible party” includes the owner or operator of an onshore facility. The OPA establishes a liability limit for onshore facilities, but these liability limits may not apply if: a spill is caused by a party’s gross negligence or willful misconduct; the spill resulted from violation of a federal safety, construction or operating regulation; or a party fails to report a spill or to cooperate fully in a clean-up. We are also subject to analogous state statutes that impose liabilities with respect to oil spills. For example, the California Department of Fish and Wildlife’s Office of Oil Spill Prevention and Response have adopted oil-spill prevention regulations that overlap with federal regulations.
20
We also generate solid wastes, including hazardous wastes, which are subject to the requirements of the Resource Conservation and Recovery Act, as amended (“RCRA”), and comparable state statutes. Although RCRA regulates both solid and hazardous wastes, it imposes stringent requirements on the generation, storage, treatment, transportation and disposal of hazardous wastes. Certain petroleum production wastes are excluded from RCRA’s hazardous waste regulations. These wastes, instead, are regulated under RCRA’s less stringent solid waste provisions, state laws or other federal laws. It is possible that these wastes, which could include wastes currently generated during our operations, could be designated as “hazardous wastes” in the future and, therefore, be subject to more rigorous and costly disposal requirements. Indeed, legislation has been proposed from time to time in Congress to re-categorize certain oil and gas exploration and production wastes as “hazardous wastes.” Also, in December 2016, the EPA entered into a consent decree requiring it to review its regulation of oil and gas waste. The consent decree requires the EPA to propose a rulemaking no later than March 15, 2019, for revision of certain regulations pertaining to oil and gas wastes or to sign a determination that revision of the regulations is not necessary. If the EPA proposes revised oil and gas regulations, the consent decree requires that the EPA take final action following notice and comment rulemaking no later than July 15, 2021. Any such changes in the laws and regulations could have a material adverse effect on our maintenance capital expenditures and operating expenses.
It is possible that our oil and natural gas operations may require us to manage naturally occurring radioactive materials (“NORM”). NORM is present in varying concentrations in sub-surface formations, including hydrocarbon reservoirs, and may become concentrated in scale, film and sludge in equipment that comes in contact with crude oil and natural gas production and processing streams. Some states have enacted regulations governing the handling, treatment, storage and disposal of NORM.
Administrative, civil and criminal penalties can be imposed for failure to comply with waste handling requirements. We believe that we are in substantial compliance with the requirements of CERCLA, RCRA, OPA and related state and local laws and regulations, and that we hold all necessary and up-to-date permits, registrations and other authorizations required under such laws and regulations. Although we believe that the current costs of managing our wastes as they are presently classified are reflected in our budget, any legislative or regulatory reclassification of oil and natural gas exploration and production wastes could increase our costs to manage and dispose of such wastes.
Water Discharges and Other Waste Discharges & Spills
The Federal Water Pollution Control Act (also known as the Clean Water Act), the Safe Drinking Water Act (“SDWA”), the OPA and analogous state laws, impose restrictions and strict controls with respect to the unauthorized discharge of pollutants, including oil and hazardous substances, into navigable waters of the United States, as well as state waters. The discharge of pollutants into regulated waters is prohibited, except in accordance with the terms of a permit issued by the EPA or an analogous state agency. These laws and regulations also prohibit certain activity in wetlands unless authorized by a permit issued by the U.S. Army Corps of Engineers (“Corps”). In June 2015, the EPA and the Corps issued a rule to revise the definition of “waters of the United States” (“WOTUS”) for all Clean Water Act programs. In October 2015, the U.S. Court of Appeals for the Sixth Circuit stayed the rule revising the WOTUS definition nationwide pending further action of the court. In response to this decision, the EPA and the Corps resumed nationwide use of the agencies’ prior regulations defining the term “waters of the United States.” However, in January 2018, the U.S. Supreme Court ruled that the rule revising the WOTUS definition must first be reviewed in the federal district courts, which resulted in a withdrawal of the stay by the Sixth Circuit. In addition, the EPA has proposed to repeal the rule revising the WOTUS definition, and in January 2018, the EPA released a final rule that delays implementation of the rule revising the WOTUS definition until 2020 to allow time for the EPA to reconsider the definition of the term “waters of the United States.” Subsequent litigation in the federal district courts has resulted in patchwork application of the rule in some states, but not others. In December 2018, the EPA released revisions to the definition of WOTUS that would provide discrete categories of jurisdictional waters and tests for determining whether a particular waterbody meets any of those classifications. Several groups have already announced their intentions to challenge the proposed rule. To the extent the rule is enforced in jurisdictions in which we operate or a replacement rule expands the scope of the Clean Water Act’s jurisdiction, we could face increased costs and delays with respect to obtaining permits for dredge and fill activities in wetland areas.
The EPA has also adopted regulations requiring certain oil and natural gas exploration and production facilities to obtain individual permits or coverage under general permits for storm water discharges. Costs may be associated with the treatment of wastewater or developing and implementing storm water pollution prevention plans, as well as for monitoring and sampling the storm water runoff from certain of our facilities. Some states also maintain groundwater protection programs that require permits for discharges or operations that may impact groundwater conditions. The underground injection of fluids is subject to permitting and other requirements under state laws and regulation. Obtaining permits has the potential to delay the development of natural gas and oil projects. These same regulatory programs also limit the total volume of water that can be discharged, hence limiting the rate of development and require us to incur compliance costs.
21
These laws and any implementing regulations provide for administrative, civil and criminal penalties for any unauthorized discharges of oil and other substances in reportable quantities and may impose substantial potential liability for the costs of removal, remediation and damages. Pursuant to these laws and regulations, we may be required to obtain and maintain approvals or permits for the discharge of wastewater or storm water and the underground injection of fluids and are required to develop and implement spill prevention, control and countermeasure (“SPCC”) plans, in connection with on-site storage of significant quantities of oil. We maintain all required discharge permits necessary to conduct our operations and we believe we are in substantial compliance with their terms.
In addition, in some instances, the operation of underground injection wells for the disposal of waste has been alleged to cause earthquakes. For example, in February 2015, the EPA released a report with findings and recommendations related to public concern about induced seismic activity from disposal wells. The report recommends strategies for managing and minimizing the potential for significant injection-induced seismic events. In some jurisdictions, such issues have led to orders prohibiting continued injection or the suspension of drilling in certain wells identified as possible sources of seismic activity or resulted in stricter regulatory requirements relating to the location and operation of underground injection wells. For example, the Railroad Commission of Texas (the “Commission”) requires applicants for new disposal wells that will receive non-hazardous produced water and hydraulic fracturing flowback fluid to conduct seismic activity searches utilizing the U.S. Geological Survey, which are intended to determine the potential for earthquakes within a circular area of 100 square miles around a proposed, new disposal well. The Commission is authorized to modify, suspend or terminate a disposal well permit if scientific data indicates a disposal well is likely to contribute to seismic activity. The Commission is also considering new restrictions that could limit the volume and pressure of produced water injected into disposal wells. Any future orders or regulations addressing concerns about seismic activity from well injection in jurisdictions where we operate could affect or curtail our operations.
Hydraulic Fracturing
We use hydraulic fracturing extensively in our onshore operations, but not our offshore operations. Hydraulic fracturing is an essential and common practice in the oil and gas industry used to stimulate production of natural gas and/or oil from low permeability subsurface rock formations. Hydraulic fracturing involves using water, sand and certain chemicals to fracture the hydrocarbon-bearing rock formation to allow flow of hydrocarbons into the wellbore. While hydraulic fracturing has historically been regulated by state oil and natural gas commissions, the practice has become increasingly controversial in certain parts of the country, resulting in increased scrutiny and regulation. For example, the EPA has asserted federal regulatory authority over certain hydraulic-fracturing activities under the SDWA involving the use of diesel fuels and published permitting guidance in February 2014 addressing the use of diesel in fracturing operations. In addition, in May 2014, the EPA issued an advance notice of proposed rulemaking under the Toxic Substances Control Act (“TSCA”) relating to chemical substances and mixtures used in oil and natural gas exploration or production. Also, in June 2016, the EPA finalized wastewater pretreatment standards that prohibit onshore unconventional oil and natural gas extraction facilities from sending wastewater to publicly-owned treatment works; for certain facilities, compliance is required by August 2019. This pending restriction of disposal options for hydraulic fracturing waste and other changes to environmental requirements may result in increased costs. The EPA is also conducting a study of onshore conventional and unconventional oil and gas extraction wastewater management, and previously conducted a study of private wastewater treatment facilities, also known as centralized waste treatment (“CWT”) facilities, accepting oil and gas extraction wastewater.
In addition, in March 2015, the BLM published a final rule governing hydraulic fracturing on federal and Indian lands. The rule required public disclosure of chemicals used in hydraulic fracturing, implementation of a casing and cementing program, management of recovered fluids and submission to the BLM of detailed information about the proposed operation, including wellbore geology, the location of faults and fractures and the depths of all usable water. Following years of litigation, the BLM rescinded the rule in December 2017. However, several environmental groups and states have challenged the BLM’s rescission of the rule in ongoing litigation.
Several states have also adopted, or are considering adopting, regulations requiring the disclosure of the chemicals used in hydraulic fracturing and/or otherwise impose additional requirements for hydraulic fracturing activities. For example, in the Louisiana Department of Natural Resources has adopted rules requiring the public disclosure of the composition and volume of fracturing fluids used in hydraulic fracturing operations. Also, Texas requires oil and natural gas operators to disclose to the Railroad Commission of Texas and the public the chemicals used in the hydraulic fracturing process, as well as the total volume of water used. Texas has also imposed requirements for drilling, putting pipe down and cementing wells, and testing and reporting requirements. We believe that we follow applicable standard industry practices and legal requirements for groundwater protection in our hydraulic fracturing activities. Nonetheless, if new or more stringent federal, state, or local legal restrictions relating to the hydraulic fracturing process are adopted in areas where we operate, we could incur potentially significant added costs to comply with such requirements, experience delays or curtailment in the pursuit of exploration, development, or production activities, and perhaps even be precluded from drilling wells.
22
Certain governmental reviews have been conducted that focus on environmental aspects of hydraulic fracturing practices, which could lead to increased regulation. For example, in December 2016, the EPA released a study examining the potential for hydraulic fracturing activities to impact drinking water resources, finding that, under some circumstances, the use of water in hydraulic fracturing activities can impact drinking water resources. Other governmental agencies, including the U.S. Department of Energy, the U.S. Geological Survey, and the U.S. Government Accountability Office, have evaluated various other aspects of hydraulic fracturing. In addition, as discussed above, BOEM and BSEE completed a study in May 2016 regarding the potential environmental impacts of well-stimulation practices on the Pacific OCS. These studies could spur initiatives to further regulate hydraulic fracturing, and could ultimately make it more difficult or costly for us to perform fracturing and increase our costs of compliance and doing business.
A number of lawsuits and enforcement actions have been initiated across the country alleging that hydraulic fracturing practices have induced seismic activity and adversely impacted drinking water supplies, use of surface water, and the environment generally. Several states and municipalities have adopted, or are considering adopting, regulations that could restrict or prohibit hydraulic fracturing in certain circumstances. In the event state or local legal restrictions are adopted in areas where we are currently conducting, or in the future plan to conduct operations, we may incur additional costs to comply with such requirements that may be significant in nature, experience delays or curtailment in the pursuit of exploration, development, or production activities, and perhaps even be precluded from the drilling of wells. If new laws or regulations that significantly restrict hydraulic fracturing are adopted, such laws could make it more difficult or costly for us to perform fracturing to stimulate production from tight formations as well as make it easier for third parties opposing the hydraulic fracturing process to initiate legal proceedings based on allegations that specific chemicals used in the fracturing process could adversely affect groundwater.
In addition, if hydraulic fracturing is further regulated at the federal, state or local level, our fracturing activities could become subject to additional permitting and financial assurance requirements, more stringent construction specifications, increased monitoring, reporting and recordkeeping obligations, plugging and abandonment requirements and also to attendant permitting delays and potential increases in costs. For example, the U.S. Congress has from time to time considered legislation to amend the SDWA, including legislation that would repeal the exemption for hydraulic fracturing from the definition of “underground injection” and require federal permitting and regulatory control of hydraulic fracturing, as well as legislative proposals to require disclosure of the chemical constituents of the fluids used in the fracturing process. Such legislative changes could cause us to incur substantial compliance costs, and compliance or the consequences of any failure to comply by us could have a material adverse effect on our financial condition and results of operations. At this time, it is not possible to estimate the impact on our business of newly enacted or potential federal or state legislation governing hydraulic fracturing, and any of the above risks could impair our ability to manage our business and have a material adverse effect on our operations, cash flows and financial position.
Air Emissions
The federal Clean Air Act, as amended (“CAA”), and comparable state laws restrict the emission of air pollutants from many sources, including compressor stations, through the issuance of permits and the imposition of other requirements. These laws and regulations may require us to obtain pre-approval for the construction or modification of certain projects or facilities expected to produce or significantly increase air emissions, obtain and strictly comply with stringent air permit requirements or utilize specific equipment or technologies to control emissions of certain pollutants.
The New Source Performance Standards (“NSPS”) and National Emission Standards for Hazardous Air Pollutants (“NESHAP”) programs under the CAA impose specific requirements affecting the oil and gas industry for emissions from compressors, controllers, dehydrators, storage vessels, natural gas processing plants, completions and certain other equipment. Periodic review and revision of these rules by federal and state agencies may require changes to our operations, including possible installation of new equipment to control emissions. We continuously evaluate the effect of new rules on our business. For example, in May 2016, the EPA finalized rules to reduce methane and volatile organic compounds (“VOC”) emissions for certain new, modified and reconstructed equipment, processes and activities across the oil and natural gas sector; however, in September 2018, under a new administration, the EPA proposed amendments that would relax requirements of the rules. Similarly, in September 2018, the BLM issued a rule that relaxes or rescinds certain requirements of regulations it previously enacted to reduce methane emissions from venting, flaring, and leaks during oil and gas operations on public lands; the revised new rule has been challenged in ongoing litigation. In addition, in April 2018, a coalition of states filed a lawsuit in federal district court aiming to force the EPA to establish guidelines for limiting methane emissions from existing sources in the oil and natural gas sector; that lawsuit is pending. In May 2016, the EPA finalized rules regarding criteria for aggregating multiple small surface sites into a single source for air-quality permitting purposes applicable to the oil and gas industry. This rule could cause small facilities, on an aggregate basis, to be deemed a major source, thereby triggering more stringent air permitting requirements and cause major delays in construction, effectively depressing new development. The EPA also lowered the National Ambient Air Quality Standard (“NAAQS”) for ozone from 75 to 70 parts per billion in October 2015. State implementation of the revised NAAQS could result in stricter permitting requirements or delay and increased expenditures for air pollution control equipment or delay, or limit our ability to obtain permits, and result in increased expenditures for pollution control equipment. These standards, as well as any future laws and their implementing regulations, may require us to obtain pre-approval for the expansion or modification of existing facilities or the construction of new facilities expected to produce air emissions, impose stringent air permit requirements, or utilize specific equipment or technologies to control emissions. Compliance with such rules could result in significant costs, including increased capital expenditures and operating costs and could adversely impact our business.
23
The South Coast Air Quality Management District (“SCAQMD”) is a regulatory subdivision of the State of California and responsible for air pollution control from stationary sources within Orange County and designated portions of Los Angeles, Riverside, and San Bernardino Counties. Our Beta properties and associated facilities are subject to regulation by the SCAQMD.
We may be required to incur certain capital expenditures in the next few years for air pollution control equipment in connection with maintaining or obtaining operating permits addressing air emission related issues, which may have a material adverse effect on our operations. Obtaining permits also has the potential to delay the development of oil and natural gas projects and increase our costs of development, which costs could be significant. We believe that we currently are in substantial compliance with all air emissions regulations and that we hold all necessary and valid construction and operating permits for our current operations.
Regulation of “Greenhouse Gas” Emissions
In response to findings that emissions of carbon dioxide, methane and other greenhouse gases (“GHGs”) present an endangerment to public health and the environment, the EPA has adopted and implemented regulations to restrict emissions of GHGs under existing provisions of the CAA. For example, the EPA, as well as the BLM, have issued rules to reduce methane emissions from oil and natural gas production and processing operations, which regulations are discussed in more detail above under the caption “Air Emissions.” Several states are pursuing similar measures to regulate emissions of methane from new and existing sources within the oil and natural gas source category. In addition, the EPA has adopted regulations requiring the monitoring and annual reporting of GHG emissions from specified sources in the United States, including, among others, certain oil and natural gas production facilities, which include certain of our operations. The adoption and implementation of any regulations imposing reporting obligations on, or limiting emissions of GHGs from, our equipment and operations could require us to incur costs to reduce emissions of GHGs associated with our operations or could adversely affect demand for the oil and natural gas we produce. Such climate change regulatory and legislative initiatives could have a material adverse effect on our business, financial condition and results of operations.
While Congress has from time to time considered legislation to reduce emissions of GHGs, there has not been significant activity in the form of adopted legislation to reduce GHG emissions at the federal level in recent years. In the absence of such federal climate legislation, a number of states have taken legal measures to reduce emissions of greenhouse gases primarily through the planned development of greenhouse gas emission inventories and/or regional greenhouse gas cap and trade programs. In addition, on an international level, the United States was one of 175 countries to sign an international climate change agreement in Paris, France that requires member countries to set their own GHG emission reduction goals beginning in 2020. However, on June 1, 2017, President Trump announced that the United States will withdraw from the Paris Agreement, which withdrawal would not take place until November 2019. It is not clear what steps the Trump Administration plans to take to withdraw from the Paris Agreement, whether a new agreement can be negotiated, or what terms would be included in such an agreement. Various states and local governments have vowed to continue to enact regulations to achieve the goals of the Paris Agreement.
Restrictions on GHG emissions that may be imposed could adversely affect the oil and natural gas industry. Any GHG regulation could increase our costs of compliance by potentially delaying the receipt of permits and other regulatory approvals; requiring us to monitor emissions, install additional equipment or modify facilities to reduce GHG and other emissions; purchase emission credits; and utilize electric driven compression at facilities to obtain regulatory permits and approvals in a timely manner. While we are subject to certain federal GHG monitoring and reporting requirements, our operations are not adversely impacted by existing federal, state and local climate change initiatives and, at this time, it is not possible to accurately estimate how potential future laws or regulations addressing GHG emissions would impact our business.
In addition, claims have been made against certain energy companies alleging that GHG emissions from oil and natural gas operations constitute a public nuisance under federal and/or state common law. As a result, private individuals may seek to enforce environmental laws and regulations against us and could allege personal injury or property damages. While our business is not a party to any such litigation, we could be named in actions making similar allegations. An unfavorable ruling in any such case could adversely impact our business, financial condition and results of operations.
Moreover, any legislation or regulatory programs to reduce GHG emissions could increase the cost of consuming, and thereby reduce demand for, the oil and natural gas we produce. Consequently, legislation and regulatory programs to reduce emissions of GHGs could have an adverse effect on our business, financial condition and results of operations. Incentives to conserve energy or use alternative energy sources as a means of addressing climate change could also reduce demand for the oil and natural gas we produce. In addition, parties concerned about the potential effects of climate change have directed their attention at sources of funding for energy companies, which has resulted in certain financial institutions, funds and other sources of capital, restricting or eliminating their investment in oil and natural gas activities. Finally, it should be noted that most scientists have concluded that increasing concentrations of GHGs in the Earth’s atmosphere may produce climate changes that have significant physical effects, such as increased frequency and severity of storms, floods and other climatic events; if any such effects were to occur, they could have an adverse effect on our development and production operations.
24
National Environmental Policy Act
Oil and natural gas exploration and production activities on federal lands are subject to the National Environmental Policy Act (“NEPA”). NEPA requires federal agencies, including the U.S. Departments of Interior and Agriculture, to evaluate major agency actions having the potential to significantly impact the environment. In the course of such evaluations, an agency prepares an environmental assessment to evaluate the potential direct, indirect and cumulative impacts of a proposed project. If impacts are considered significant, the agency will prepare a more detailed environmental impact study that is made available for public review and comment. All of our current development and production activities, as well as proposed development plans, on federal lands, including those in the Pacific Ocean, require governmental permits that are subject to the requirements of NEPA. This environmental impact assessment process has the potential to delay the development of oil and natural gas projects. Authorizations under NEPA also are subject to protest, appeal or litigation, which can delay or halt projects.
Endangered Species Act
The federal Endangered Species Act (“ESA”) and analogous state statutes restrict activities that may adversely affect endangered and threatened species or their habitat. Similar protections are offered to migratory birds under the Migratory Bird Treaty Act. The designation of previously unidentified endangered or threatened species in areas where we operate could cause us to incur additional costs or become subject to operating delays, restrictions or bans. Numerous species have been listed or proposed for protected status in areas in which we currently, or could in the future, undertake operations. The presence of protected species in areas where we operate could impair our ability to timely complete or carry out those operations, lose leaseholds as we may not be permitted to timely commence drilling operations, cause us to incur increased costs arising from species protection measures, and, consequently, adversely affect our results of operations and financial position.
Occupational Safety and Health Act
We are also subject to the requirements of the federal Occupational Safety and Health Act (“OSHA”) and comparable state laws that regulate the protection of the health and safety of employees. In addition, OSHA’s hazard communication standard requires that information be maintained about hazardous materials used or produced in our operations and that this information be provided to employees, state and local government authorities and citizens. Other OSHA standards regulate specific worker safety aspects of our operations. For example, under a new OSHA standard limiting respirable silica exposure, the oil and gas industry must implement engineering controls and work practices to limit exposures below the new limits by June 2021. Failure to comply with OSHA requirements can lead to the imposition of penalties. We believe that our operations are in substantial compliance with the OSHA requirements.
Other Regulation of the Oil and Natural Gas Industry
The oil and natural gas industry is extensively regulated by numerous federal, state and local authorities. Legislation affecting the oil and natural gas industry is under constant review for amendment or expansion, frequently increasing the regulatory burden on our assets. Additionally, numerous departments and agencies, both federal and state, are authorized by statute to issue rules and regulations that are binding on the oil and natural gas industry and its individual members, some of which carry substantial penalties for failure to comply. Although the regulatory burden on the oil and natural gas industry increases our cost of doing business and, consequently, affects our profitability, these burdens generally do not affect us any differently or to any greater or lesser extent than they affect other companies in the oil and natural gas industry with similar types, quantities and locations of production.
Legislation continues to be introduced in Congress, and the development of regulations continues in the U.S. Department of Homeland Security and other agencies concerning the security of industrial facilities, including oil and natural gas facilities. Our operations may be subject to such laws and regulations. Presently, it is not possible to accurately estimate the costs we could incur to comply with any such facility security laws or regulations, but such expenditures could be substantial.
Drilling and Production
Our operations are subject to various types of regulation at federal, state and local levels. These types of regulation include requiring permits for the drilling of wells, drilling bonds and reports concerning operations. Most states, and some counties and municipalities, in which we operate also regulate one or more of the following:
| • | the method of drilling and casing wells; |
| • | the surface use and restoration of properties upon which wells are drilled; |
| • | the plugging and abandoning of wells; |
| • | transportation of materials and equipment to and from our well sites and facilities; |
| • | transportation and disposal of produced fluids and natural gas; and |
| • | notice to surface owners and other third parties. |
25
State laws regulate the size and shape of drilling and spacing units or proration units governing the pooling of oil and natural gas properties. Some states allow forced pooling or integration of tracts to facilitate exploration, while other states rely on voluntary pooling of lands and leases. In some instances, forced pooling or unitization may be implemented by third parties and may reduce our interest in the unitized properties. In addition, state conservation laws establish maximum rates of production from oil and natural gas wells, generally prohibit the venting or flaring of natural gas and impose requirements regarding the ratability of production. These laws and regulations may limit the amount of oil and natural gas we can produce from our wells or limit the number of wells or the locations at which we can drill. Moreover, each state generally imposes a production or severance tax with respect to the production and sale of oil, natural gas and NGLs within its jurisdiction.
Sale and Transportation of Gas and Oil
The Federal Energy Regulatory Commission (“FERC”) approves the construction of interstate gas pipelines and the rates and service conditions for the interstate transportation of gas, oil and other liquids by pipeline. Although the FERC does not regulate the production of gas, the FERC exercises regulatory authority over wholesale sales of gas in interstate commerce through the issuance of blanket marketing certificates that authorize the wholesale sale of gas at market rates and the imposition of a code of conduct on blanket marketing certificate holders that regulate certain affiliate interactions. The FERC does not regulate the sale of oil or petroleum products or the construction of oil or other liquids pipelines. The FERC also has oversight of the performance of wholesale natural gas markets, including the authority to facilitate price transparency and to prevent market manipulation. In furtherance of this authority, the FERC imposed an annual reporting requirement on all industry participants, including otherwise non-jurisdictional entities, engaged in wholesale physical natural gas sales and purchases in excess of a minimum level. The agency’s actions are intended to foster increased competition within all phases of the gas industry. To date, the FERC’s pro-competition policies have not materially affected our business or operations. It is unclear what impact, if any, future rules or increased competition within the gas industry will have on our gas sales efforts.
The FERC and other federal agencies, the U.S. Congress or state legislative bodies and regulatory agencies may consider additional proposals or proceedings that might affect the gas or oil industries. We cannot predict when or if these proposals will become effective or any effect they may have on our operations. We do not believe, however, that any of these proposals will affect us any differently than other gas producers with which we compete.
The Beta properties include the San Pedro Bay Pipeline Company, which owns and operates an offshore crude pipeline. This pipeline is subject to regulation by the FERC under the Interstate Commerce Act (“ICA”) and the Energy Policy Act of 1992. Tariff rates for liquids pipelines, which include both crude oil pipelines and refined products pipelines, must be just and reasonable and non-discriminatory. FERC regulations require that interstate oil pipeline transportation rates and terms of service be filed with the FERC and posted publicly. The FERC has established a formulaic methodology for petroleum pipelines to change their rates within prescribed ceiling levels that are tied to an inflation index. The FERC reviews the formula every five years. Effective July 1, 2016, the current index for the five-year period ending July 2021 is the producer price index for finished goods plus an adjustment factor of 1.23 percent. The San Pedro Bay Pipeline Company uses the indexing methodology to change its rates.
The Outer Continental Shelf Lands Act requires that all pipelines operating on or across the OCS provide open access, non-discriminatory transportation service. BOEM/BSEE has established formal and informal complaint procedures for shippers that believe that have been denied open and nondiscriminatory access to transportation on the OCS.
The U.S. Department of Transportation Pipeline and Hazardous Materials Safety Administration (“PHMSA”) regulates all pipeline transportation in or affecting interstate or foreign commerce, including pipeline facilities on the OCS. The San Pedro Bay pipeline is subject to regulation by the PHMSA. The PHMSA has also proposed additional regulations for gas pipeline safety. For example, in March 2016, the PHMSA proposed a rule that, if adopted, would expand integrity management requirements beyond high consequence areas (“HCAs”), which are areas where a release could have the most significant adverse consequences, including high-population areas, certain drinking water sources and unusually sensitive ecological areas, to apply to gas pipelines in newly defined “moderate consequence areas” that contain as few as five dwellings within the potential impact area. Many gas pipelines that were in place before 1970, and thus grandfathered from certain pressure testing obligations, would be required to be pressure tested to determine their maximum allowable operating pressures. Many gathering lines in rural areas that are currently not regulated at the federal level would also be covered by this proposal. More recently, in January 2017, the PHMSA finalized new regulations for hazardous liquid pipelines that significantly extend and expand the reach of certain PHMSA integrity management requirements (i.e., periodic assessments, repairs and leak detection), regardless of the pipeline’s proximity to an HCA. The final rule also requires all pipelines in or affecting an HCA to be capable of accommodating in-line inspection tools within the next 20 years. In addition, the final rule extends annual and accident reporting requirements to gravity lines and all gathering lines and also imposes inspection requirements on pipelines in areas affected by extreme weather events and natural disasters, such as hurricanes, landslides, floods, earthquakes, or other similar events that are likely to damage infrastructure. The timing for implementation of this rule is uncertain at this time due to the change in presidential administrations.
26
Moreover, effective April 2017, the PHMSA adopted new rules increasing the maximum administrative civil penalties for violation of the pipeline safety laws and regulations to up to $209,002 per violation per day and up to $2,090,022 for a related series of violations. The PHMSA has also issued a final rule applying safety regulations to certain rural low-stress hazardous liquid pipelines that were not covered previously by some of its safety regulation. Federal and state legislative and regulatory initiatives relating to pipeline safety that require the use of new or more stringent safety controls or result in more stringent enforcement of applicable legal requirements could subject us to increased capital costs, operational delays and costs of operation.
Anti-Market Manipulation Laws and Regulations
The FERC with respect to the purchase or sale of natural gas or the purchase or sale of transmission or transportation services subject to FERC jurisdiction and the Federal Trade Commission with respect to petroleum and petroleum products, operating under various statutes have each adopted anti-market manipulation regulations, which prohibit, among other things, fraud and price manipulation in the respective markets. These agencies hold substantial enforcement authority, including the ability to assess substantial civil penalties, to order repayment or disgorgement of profits and to recommend criminal penalties. Should we violate the anti-market manipulation laws and regulations, we could also be subject to related third party damage claims by, among others, sellers, royalty owners and taxing authorities.
Derivatives Regulation
Comprehensive financial reform legislation was signed into law by the President on July 21, 2010 (“Dodd-Frank Act”.) The legislation called for the Commodities Futures Trading Commission (“CFTC”) to regulate certain markets for derivative products, including over-the-counter (“OTC”) derivatives. The CFTC has issued several new relevant regulations and other rulemakings are pending at the CFTC, the product of which would are rules that implement the mandates in the new legislation to cause significant portions of derivatives markets to clear through clearinghouses. While some of these rules have been finalized, some have not and, as a result, the final form and timing of the implementation of the new regulatory regime affecting commodity derivatives remains uncertain.
In particular, on October 18, 2011, the CFTC adopted final rules under the establishing position limits for certain energy commodity futures and options contracts and economically equivalent swaps, futures and options. The position limit levels set the maximum amount of covered contracts that a trader may own or control separately or in combination, net long or short. The final rules also contained limited exemptions from position limits which would be phased in over time for certain bona fide hedging transactions and positions. The CFTC’s original position limits rule was challenged in court by two industry associations and was vacated and remanded by a federal district court. However, the CFTC proposed and revised new rules in November 2013 and December 2016, respectively, that would place limits on positions in certain core futures and equivalent swaps contracts for or linked to certain physical commodities, subject to exceptions for certain bona fide hedging transactions. The CFTC has sought comment on the position limits rule as reproposed, but these new position limit rules are not yet final and the impact of those provisions on us is uncertain at this time. The CFTC has withdrawn its appeal of the court order vacating the original position limits rule.
The legislation and new regulations may also require counterparties to our derivative instruments to spin off some of their derivatives activities to separate entities, which may not be as creditworthy as the current counterparties. The new legislation and any new regulations could significantly increase the cost of derivative contracts, materially alter the terms of derivative contracts, reduce the availability of derivatives to protect against risks we encounter, reduce our ability to monetize or restructure our existing derivative contracts, and increase our exposure to less creditworthy counterparties. If we reduce our use of derivatives as a result of the legislation and regulations, our results of operations may become more volatile and our cash flows may be less predictable, which could adversely affect our ability to plan for and fund capital expenditures and to generate sufficient cash flow to pay quarterly distributions at current levels or at all. Our revenues could be adversely affected if a consequence of the legislation and regulations is to lower commodity prices. Any of these consequences could have a material, adverse effect on us, our financial condition and our results of operations. Our use of derivative financial instruments does not eliminate our exposure to fluctuations in commodity prices and interest rates and has in the past and could in the future result in financial losses or reduce our income.
Our sales of oil and natural gas are also subject to anti-manipulation and anti-disruptive practices authority under the Commodity Exchange Act (“CEA”), as amended by the Dodd-Frank Act, and regulations promulgated thereunder by the CFTC. The CEA, as amended by the Dodd-Frank Act, prohibits any person from using or employing any manipulative or deceptive device in connection with any swap, or a contract of sale of any commodity, or for future delivery on such commodity, in contravention of the CFTC’s rules and regulations. The CEA, as amended by the Dodd-Frank Act, also prohibits knowingly delivering or causing to be delivered false or misleading or inaccurate reports concerning market information or conditions that affect or tend to affect the price of any commodity.
27
State Regulation
Various states regulate the drilling for, and the production, gathering and sale of, oil and natural gas, including imposing severance taxes and requirements for obtaining drilling permits. For example, the baseline Texas severance tax on oil and gas is 4.6% of the market value of oil produced and 7.5% of the market value of gas produced and saved. A number of exemptions from or reductions of the severance tax on oil and gas production is provided by the State of Texas which effectively lowers the cost of production. States also regulate the method of developing new fields, the spacing and operation of wells and the prevention of waste of natural gas resources. States may regulate rates of production and may establish maximum daily production allowable from natural gas wells based on market demand or resource conservation, or both. States do not regulate wellhead prices or engage in other similar direct economic regulation, but there can be no assurance that they will not do so in the future. The effect of these regulations may be to limit the amount of oil and natural gas that may be produced from our wells and to limit the number of wells or locations we can drill.
The petroleum industry is also subject to compliance with various other federal, state and local regulations and laws. Some of those laws relate to resource conservation and equal employment opportunity. We do not believe that compliance with these laws will have a material adverse effect on us.
Employees
As of December 31, 2018, the Company had 222 employees. None of these employees are represented by labor unions or covered by any collective bargaining agreement. We believe that our relations with our employees are satisfactory.
Offices
Our principal executive office is located at 500 Dallas Street, Suite 1700, Houston, Texas 77002. Our main telephone number is (713) 490-8900.
Available Information
Our annual reports on Form 10-K, quarterly reports on Form 10-Q, current reports on Form 8–K and amendments to those reports filed or furnished pursuant to Section 13(a) or 15(d) of the Exchange Act are made available free of charge on our website at www.amplifyenergy.com as soon as reasonably practicable after these reports have been electronically filed with, or furnished to, the SEC. Our website also includes our Code of Business Conduct and Ethics and the charters of our audit committee and our compensation committee. The information contained on, or connected to, our website is not incorporated by reference into this Form 10-K and should not be considered part of this or any other report that we file with or furnish to the SEC.
The SEC maintains a website that contains reports, proxy and information statements, and other information regarding the Company at www.sec.gov.
28
Our business and operations are subject to many risks. The risks described below, in addition to the risks described in “Item 1. Business” and “Item 7A. Quantitative and Qualitative Disclosures About Market Risk” of this annual report, may not be the only risks we face, as our business and operations may also be subject to risks that we do not yet know of, or that we currently believe are immaterial. You should carefully consider the following risk factors together with all of the other information included in this annual report, including the financial statements and related notes, when deciding to invest in us. You should be aware that the occurrence of any of the events described in this Risk Factors section and elsewhere in this annual report could have a material adverse effect on our business, financial position, results of operations and cash flows and the trading price of our securities could decline and you could lose all or part of your investment.
Risks Related to Our Business
Oil, natural gas and NGL prices are volatile, due to factors beyond our control, and greatly affect our business, results of operations and financial condition. Any decline in, or sustained low levels of, oil, natural gas and NGL prices will cause a decline in our cash flow from operations, which could materially and adversely affect our business, results of operations and financial condition.
Our revenues, operating results, profitability, liquidity, future growth and the value of our assets depend primarily on prevailing commodity prices. Historically, oil and natural gas prices have been volatile and fluctuate in response to changes in supply and demand, market uncertainty, and other factors that are beyond our control, including:
| • | the regional, domestic and foreign supply of oil, natural gas and NGLs; |
| • | the level of commodity prices and expectations about future commodity prices; |
| • | the level of global oil and natural gas exploration and production; |
| • | localized supply and demand fundamentals, including the proximity and capacity of pipelines and other transportation facilities, and other factors that result in differentials to benchmark prices from time to time; |
| • | the cost of exploring for developing, producing and transporting reserves; |
| • | the price and quantity of foreign imports; |
| • | political and economic conditions in oil producing countries; |
| • | the ability of members of the Organization of Petroleum Exporting Countries to agree to and maintain oil price and production controls; |
| • | speculative trading in crude oil and natural gas derivative contracts; |
| • | the level of consumer product demand; |
| • | weather conditions and other natural disasters; |
| • | risks associated with operating drilling rigs; |
| • | technological advances affecting exploration and production operations and overall energy consumption; |
| • | domestic and foreign governmental regulations and taxes; |
| • | the impact of energy conservation efforts; |
| • | the continued threat of terrorism and the impact of military and other action; |
| • | the price and availability of competitors’ supplies of oil and natural gas and alternative fuels; and |
| • | overall domestic and global economic conditions. |
These factors and the volatility of the energy markets make it extremely difficult to predict future oil, natural gas and NGL price movements with any certainty. For example, for the five years ended December 31, 2018, the NYMEX-WTI oil future price ranged from a high of $107.26 per Bbl to a low of $26.21 per Bbl, while the NYMEX-Henry Hub natural gas future price ranged from a high of $7.94 per MMBtu to a low of $1.49 per MMBtu. For the year ended December 31, 2018, the West Texas Intermediate posted prices ranged from a low of $42.53 per Bbl on December 24, 2018 to a high of $76.41 per Bbl on October 3, 2018 and NYMEX Henry Hub spot market price ranged from a low of $2.48 per MMBtu on February 17, 2018 to a high of $6.88 per MMBtu on January 4, 2018. Likewise, NGLs, which are made up of ethane, propane, isobutane, normal butane and natural gasoline, each of which has different uses and different pricing characteristics, have sustained depressed realized prices during this period and are generally correlated with the price of oil. A further or extended decline in commodity prices could materially and adversely affect our business, results of operations and financial condition.
29
If commodity prices decline further or remain depressed for a prolonged period, a significant portion of our development projects may become uneconomic and cause further write downs of the value of our oil and natural gas properties, which may adversely affect our financial condition and our ability to fund our operations.
As discussed above, oil, natural gas and NGL prices have experienced significant volatility over the past few years. A further or extended decline in commodity prices could render many of our development and production projects uneconomical and result in a downward adjustment of our reserve estimates, which would reduce our borrowing base and our ability to fund our operations.
No impairment was recognized for the year ended December 31, 2018, the period from May 5, 2017 through December 31, 2017 and the period from January 1, 2017 through May 4, 2017. We recognized $183.4 million of impairments for the year ended December 31, 2016, related to certain properties in East Texas, South Texas, the Permian Basin, Wyoming and Colorado. A further or extended decline in commodity prices may cause us to recognize additional impairments in the value of our oil and natural gas properties. In addition, if our estimates of development costs increase, production data factors change or drilling results deteriorate, accounting rules may require us to write down, as a non-cash charge to earnings, the carrying value of our oil and natural gas properties for impairments. We may in the future incur impairment charges that could have a material adverse effect on our results of operations in the period taken and our ability to borrow funds under our New Revolving Credit Facility.
We may be unable to maintain compliance with the covenants in the New Revolving Credit Facility, which could result in an event of default thereunder that, if not cured or waived, would have a material adverse effect on our business and financial condition.
Under our New Revolving Credit Facility, we are required to maintain (i) as of the date of determination, a maximum total debt to EBITDAX ratio of 4.00 to 1.00, and (ii) a current ratio of not less than 1.00 to 1.00. If we were to violate any of the covenants under the New Revolving Credit Facility and were unable to obtain a waiver or amendment, it would be considered a default after the expiration of any applicable grace period. If we were in default under the New Revolving Credit Facility, then the lenders may exercise certain remedies including, among others, declaring all borrowings outstanding thereunder, if any, immediately due and payable. This could adversely affect our operations and our ability to satisfy our obligations as they come due, because we might not have, or be able to obtain, sufficient funds to make these accelerated payments. In addition, our obligations under our New Revolving Credit Facility are secured by mortgages on not less than 85% of the PV-9 value of our oil and gas properties (and at least 85% of the PV-9 value of the proved, developed and producing oil and gas properties), and if we are unable to repay our indebtedness under our New Revolving Credit Facility, the lenders could seek to foreclose on our assets.
Restrictive covenants in our New Revolving Credit Facility could limit our growth and our ability to finance our operations, fund our capital needs, respond to changing conditions and engage in other business activities that may be in our best interests.
Restrictive covenants in our New Revolving Credit Facility impose significant operating and financial restrictions on us and our subsidiaries. These restrictions limit our ability to, among other things:
• incur additional liens;
• incur additional indebtedness;
• merge, consolidate or sell our assets;
• pay dividends or make other distributions or repurchase or redeem our stock;
• make certain investments; and
• enter into transactions with our affiliates.
The New Revolving Credit Facility also requires us to comply with certain financial maintenance covenants as discussed above. A breach of any of these covenants could result in a default under the New Revolving Credit Facility. If a default occurs and remains uncured or unwaived, the administrative agent or majority lenders under the New Revolving Credit Facility may elect to declare all borrowings outstanding thereunder, if any, together with accrued interest and other fees, to be immediately due and payable. The administrative agent or majority lenders under the New Revolving Credit Facility would also have the right in these circumstances to terminate any commitments they have to provide further borrowings. If we are unable to repay our indebtedness when due or declared due, the administrative agent will also have the right to proceed against the collateral pledged to it to secure the indebtedness under the New Revolving Credit Facility. If such indebtedness were to be accelerated, our assets may not be sufficient to repay in full our secured indebtedness.
We may also be prevented from taking advantage of business opportunities that arise because of the limitations imposed on us by the restrictive covenants in the New Revolving Credit Facility. The terms and conditions of the New Revolving Credit Facility affect us in several ways, including:
| • | requiring us to dedicate a substantial portion of our cash flow from operations to service our existing debt, thereby reducing the cash available to finance our operations and other business activities and could limit our flexibility in planning for or reacting to changes in our business and the industry in which we operate; |
30
| • | increasing our vulnerability to economic downturns and adverse developments in our business; |
| • | limiting our ability to access the capital markets to raise capital on favorable terms or to obtain additional financing for working capital, capital expenditures or acquisitions or to refinance existing indebtedness; |
| • | placing restrictions on our ability to obtain additional financing, make investments, lease equipment, sell assets and engage in business combinations; |
| • | placing us at a competitive disadvantage relative to competitors with lower levels of indebtedness in relation to their overall size or less restrictive terms governing their indebtedness; and |
| • | limiting management’s discretion in operating our business. |
Our lenders periodically redetermine the amount we may borrow under our New Revolving Credit Facility, which may materially impact our operations.
Our New Revolving Credit Facility allows us to borrow in an amount up to the borrowing base, which is primarily based on the estimated value of our oil and natural gas properties and our commodity derivative contracts as determined semi-annually by our lenders in their sole discretion. The borrowing base is subject to redetermination on at least a semi-annual basis primarily based on an engineering report with respect to our estimated natural gas, oil and NGL reserves, which takes into account the prevailing natural gas, oil and NGL prices at such time, as adjusted for the impact of our commodity derivative contracts. Accordingly, declining commodity prices may have an impact on the amount we can borrow, which could affect our cash flows and ability to execute on our business plans. Any reduction in the borrowing base would materially and adversely affect our business and financing activities, limit our flexibility and management’s discretion in operating our business, and increase the risk that we may default on our debt obligations. In addition, as hedges roll off, the borrowing base is subject to further reduction. Our New Revolving Credit Facility requires us to repay any deficiency over a certain period or pledge additional oil and gas properties to eliminate such deficiency, which we are required to do within 30 days of notice to do so. If our outstanding borrowings exceed the borrowing base and we are unable to repay the deficiency or pledge additional oil and gas properties to eliminate such deficiency, our failure to repay any of the installments due related to the borrowing base deficiency would constitute an event of default under the New Revolving Credit Facility and as such, the lenders could declare all outstanding principal and interest to be due and payable, could freeze our accounts, or foreclose against the assets securing the obligations owed under the New Revolving Credit Facility.
We may be able to incur substantially more debt, which could exacerbate the risks associated with our indebtedness.
We and our subsidiaries may be able to incur substantial additional indebtedness in the future, subject to certain limitations, including under our New Revolving Credit Facility. If new debt is added to our current debt levels, the related risks that we now face could increase. These risks could result in a material adverse effect on our business, financial condition, results of operations, business prospects and ability to satisfy our obligations under our outstanding indebtedness.
Our variable rate indebtedness subjects us to interest rate risk, which could cause our debt service obligations to increase significantly.
Borrowings under our New Revolving Credit Facility bear interest at variable rates and expose us to interest rate risk. If interest rates increase, our debt service obligations on the variable rate indebtedness would increase even if the amount borrowed remained the same, and our net income and cash available for servicing our indebtedness would decrease. See “Item 7A. Quantitative and Qualitative Disclosures About Market Risk — Interest Price Risk” included under Part II of this annual report for further information regarding interest rate sensitivity.
Our hedging strategy may not effectively mitigate the impact of commodity price volatility from our cash flows, and our hedging activities could result in cash losses and may limit potential gains.
We intend to maintain a portfolio of commodity derivative contracts covering at least 25% - 50% of our estimated production from proved developed producing reserves over a one-to-three year period at any given point in time. These commodity derivative contracts include natural gas, oil and NGL financial swaps. The prices and quantities at which we enter into commodity derivative contracts covering our production in the future will be dependent upon oil and natural gas prices and price expectations, at the time we enter into these transactions, which may be substantially higher or lower than current or future oil and natural gas prices. Accordingly, our price hedging strategy may not protect us from significant declines in oil, natural gas and NGL prices received for our future production. Many of the derivative contracts to which we will be a party will require us to make cash payments to the extent the applicable index exceeds a predetermined price, thereby limiting our ability to realize the benefit of increases in oil, natural gas and NGL prices. If our actual production and sales for any period are less than our hedged production and sales for that period (including reductions in production due to operational delays) or if we are unable to perform our drilling activities as planned, we might be forced to satisfy all or a portion of our hedging obligations without the benefit of the cash flow from our sale of the underlying physical commodity, which may materially impact our liquidity.
31
Our hedging transactions expose us to counterparty credit risk.
Our hedging transactions expose us to risk of financial loss if a counterparty fails to perform under a derivative contract. Disruptions in the financial markets or other unforeseen events could lead to sudden changes in a counterparty’s liquidity, which could impair its ability to perform under the terms of a derivative contract and, accordingly, prevent us from realizing the benefit of such a derivative contract.
An increase in the differential between the NYMEX or other benchmark prices of oil and natural gas and the wellhead price we receive for our production could significantly reduce our cash flow and adversely affect our financial condition.
The prices that we receive for our oil and natural gas production often reflect a regional discount, based on the location of production, to the relevant benchmark prices, such as NYMEX or ICE, that are used for calculating hedge positions. The prices we receive for our production are also affected by the specific characteristics of the production relative to production sold at benchmark prices. For example, our California oil typically has a lower gravity, and a portion has higher sulfur content, than oil sold at certain benchmark prices. Therefore, because our oil requires more complex refining equipment to convert it into high value products, it may sell at a discount to those prices. These discounts, if significant, could reduce our cash flows and adversely affect our results of operations and financial condition.
Our estimated reserves and future production rates are based on many assumptions that may turn out to be inaccurate. Any material inaccuracies in our reserve estimates or underlying assumptions will materially affect the quantities and present value of our estimated reserves.
It is not possible to measure underground accumulations of oil or natural gas in an exact way. The process of estimating natural gas and oil reserves is complex. It requires interpretations of available technical data and many assumptions, including assumptions relating to current and future economic conditions and commodity prices. Any significant inaccuracies in these interpretations or assumptions could materially affect our estimated quantities and present value of our reserves.
In order to prepare our estimates, we must project production rates and timing of operating and development expenditures. We must also analyze available geological, geophysical, production and engineering data. The extent, quality and reliability of this data can vary.
The process also requires economic assumptions about matters such as natural gas and oil prices, drilling and operating expenses, capital expenditures and availability of funds.
Actual future production, oil prices, natural gas prices, revenues, development expenditures, operating expenses and quantities of recoverable reserves will vary from our estimates. Any significant variance could materially affect the estimated quantities and present value of our reserves. In addition, we may adjust our reserve estimates to reflect production history, results of development, existing commodity prices and other factors, many of which are beyond our control.
You should not assume that the present value of future net revenues from our reserves is the current market value of our estimated reserves. We generally base the estimated discounted future net cash flows from our reserves on prices and costs on the date of the estimate. Actual future prices and costs may differ materially from those used in the present value estimate.
Any material inaccuracies in these reserve estimates or underlying assumptions will materially affect the quantities and present value of our reserves, which could adversely affect our business, results of operations and financial condition.
The standardized measure of our estimated proved reserves is not necessarily the same as the current market value of our estimated proved oil and natural gas reserves.
The present value of future net cash flows from our proved reserves shown in this report, or standardized measure, may not be the current market value of our estimated natural gas and oil reserves. In accordance with rules established by the SEC and the FASB, we base the estimated discounted future net cash flows from our proved reserves on the trailing 12-month average oil and gas index prices, calculated as the unweighted arithmetic average for the first-day-of-the-month price for each month and costs in effect on the date of the estimate, holding the prices and costs constant throughout the life of the properties. Actual future prices and costs may differ materially from those used in the net present value estimate, and future net present value estimates using then current prices and costs may be significantly less than the current estimate. In addition, the 10% discount factor we use when calculating discounted future net cash flows for reporting requirements, which is required by the SEC and FASB, is not necessarily the most appropriate discount factor based on interest rates in effect from time to time and risks associated with us or the natural gas and oil industry in general.
32
The failure to replace our proved oil and natural gas reserves could adversely affect our business, financial condition, results of operations, production and cash flows.
Producing oil and natural gas reservoirs are characterized by declining production rates that vary depending upon reservoir characteristics and other factors. Our future oil and natural gas reserves and production and therefore our cash flow are highly dependent on our success in efficiently developing and exploiting our current reserves. Our production decline rates may be significantly higher than currently estimated if our wells do not produce as expected. Further, our decline rate may change when we drill additional wells or make acquisitions. We may not be able to develop, find or acquire additional reserves to replace our current and future production at economically acceptable terms, which would materially and adversely affect our business, financial condition and results of operations.
We may be subject to risks in connection with divestitures and acquisitions.
We may sell any of our core or non-core assets in order to increase capital resources available for other core assets, create organizational and operational efficiencies or for other purposes. Various factors could materially affect our ability to dispose of such assets, including the approvals of governmental agencies or third parties and the availability of purchasers willing to acquire the assets on terms we deem acceptable. Though we continue to evaluate various options for the divestiture of such assets, there can be no assurance that this evaluation will result in any specific action.
In addition, in the future we may make acquisitions of businesses that complement or expand our current business. We may not be able to identify attractive acquisition opportunities. Even if we do identify attractive acquisition opportunities, we may not be able to complete the acquisition or do so on commercially acceptable terms. As a result, our acquisition activities may not be successful, which may hinder our replacement of reserves and adversely affect our results of operations.
Our acquisition and development operations will require additional capital that may not be available.
Our business is capital intensive and requires substantial expenditures to maintain currently producing wells, to make the acquisitions and/or conduct the development activities necessary to replace our reserves, to pay expenses and to satisfy our other obligations. Low oil and natural gas prices, declines in the trading price of our common stock and concern about the global financial markets may limit our ability to obtain funding in the capital and credit markets on terms we find acceptable, and could limit our ability to obtain additional or continued funding under our New Revolving Credit Facility or obtain any funding at all.
If we reduce our capital spending in an effort to conserve cash, this would likely result in production being lower than anticipated, and could result in reduced revenues, cash flow from operations and income. Further, if the borrowing base under our New Revolving Credit Facility decreases, or our revenues decrease, as a result of lower oil or natural gas prices or for any other reason, we may not be able to obtain the capital necessary to sustain our operations.
Developing and producing oil and natural gas are costly and high-risk activities with many uncertainties that may result in a total loss of investment or otherwise adversely affect our business, financial condition, results of operations and cash flows.
Our drilling activities are subject to many risks, including the risk that we will not discover commercially productive reservoirs. Drilling for oil and natural gas often involves unprofitable efforts, not only from dry holes, but also from wells that are productive but do not produce sufficient oil or natural gas to return a profit at then-realized prices after deducting drilling, operating and other costs. The seismic data and other technologies we use do not allow us to know conclusively prior to drilling a well that oil or natural gas is present or that it can be produced economically. The costs of our development and production activities are subject to numerous uncertainties beyond our control, and increases in those costs can adversely affect the economics of a project. Further, our development and production operations may be curtailed, delayed, canceled or otherwise negatively impacted as a result of other factors, including:
| • | high costs, shortages or delivery delays of rigs, equipment, labor, electrical power or other services; |
| • | unusual or unexpected geological formations; |
| • | composition of sour natural gas, including sulfur, carbon dioxide and other diluent content; |
| • | unexpected operational events and conditions; |
| • | failure of down hole equipment and tubulars; |
| • | loss of wellbore mechanical integrity; |
| • | failure, unavailability or shortage of capacity of gathering and transportation pipelines, or other transportation facilities; |
| • | human errors, facility or equipment malfunctions and equipment failures or accidents, including acceleration of deterioration of our facilities and equipment due to the highly corrosive nature of sour natural gas; |
33
| • | loss of drilling fluid circulation; |
| • | hydrocarbon or oilfield chemical spills; |
| • | fires, blowouts, surface craterings and explosions; |
| • | surface spills or underground migration due to uncontrollable flows of oil, natural gas, formation water or well fluids; |
| • | delays imposed by or resulting from compliance with environmental and other governmental or regulatory requirements; and |
| • | adverse weather conditions and natural disasters. |
Any of these risks can cause substantial losses, including personal injury or loss of life, damage to or destruction of property, natural resources and equipment, pollution, environmental contamination or loss of wells and other regulatory penalties. In the event that planned operations are delayed or cancelled, or existing wells or development wells have lower than anticipated production due to one or more of the factors above or for any other reason, our financial condition and results of operations may be adversely affected. If any of these factors were to occur with respect to a particular field, we could lose all or a part of our investment in the field or we could fail to realize the expected benefits from the field, either of which could materially and adversely affect our business, financial condition, results of operations and cash flows.
Expenses not covered by our insurance could have a material adverse effect on our financial position and results of operations.
Our operations are subject to all of the hazards and operating risks associated with drilling for and production of oil and natural gas, including natural disasters, the risk of fire, explosions, blowouts, surface cratering, uncontrollable flows of natural gas, oil and formation water, pipe or pipeline failures, abnormally pressured formations, casing collapses and environmental hazards such as oil spills, natural gas leaks, ruptures or discharges of toxic gases, all of which could cause substantial financial losses. In addition, our operations are subject to risks associated with hydraulic fracturing, including any mishandling, surface spillage or potential underground migration of fracturing fluids, including chemical additives. The location of any properties and other assets near populated areas, including residential areas, commercial business centers and industrial sites, could significantly increase the level of damages resulting from these risks. The occurrence of any of these or other similar events could result in substantial losses to us due to injury or loss of life, severe damage to or destruction of property, natural resources and equipment, pollution or other environmental damage, clean-up responsibilities, regulatory investigation and penalties, suspension or disruption of operations, substantial revenue losses and repairs to resume operations.
We maintain insurance coverage against potential losses that we believe is customary in the industry. However, insurance against all operational risk is not available to us. These insurance policies may not cover all liabilities, claims, fines, penalties or costs and expenses that we may incur in connection with our business and operations, including those related to environmental claims. Pollution and environmental risks generally are not fully insurable. In addition, we cannot assure you that we will be able to maintain adequate insurance at rates we consider reasonable. We may elect not to obtain insurance if we believe that the cost of available insurance is excessive relative to the perceived risks presented. A liability, claim or other loss not fully covered by insurance could have a material adverse effect on our business, financial position, results of operations and cash flows.
The production from our Wyoming Bairoil properties could be adversely affected by the cessation or interruption of the supply of CO2 to those properties.
We inject water and CO2 into formations on substantially all of the Wyoming Bairoil properties to increase production of oil and natural gas. The additional production and reserves attributable to the use of enhanced recovery methods are inherently difficult to predict. If we are unable to produce oil and gas by injecting CO2 in the manner or to the extent that we anticipate, our future results of operations and financial condition could be materially adversely affected. Additionally, our ability to utilize CO2 to enhance production is subject to our ability to obtain sufficient quantities of CO2. If, under our CO2 supply contracts, the supplier is unable to deliver its contractually required quantities of CO2 to us, or if our ability to access adequate supplies is impeded, then we may not have sufficient CO2 to produce oil and natural gas in the manner or to the extent that we anticipate, and our future oil and gas production volumes will be negatively impacted.
Many of our properties are in areas that may have been partially depleted or drained by offset wells.
Many of our properties are in areas that may have already been partially depleted or drained by earlier offset drilling. The owners of leasehold interests lying contiguous or adjacent to or adjoining any of our properties could take actions, such as drilling additional wells that could adversely affect our operations. When a new well is completed and produced, the pressure differential in the vicinity of the well causes the migration of reservoir fluids towards the new wellbore (and potentially away from existing wellbores). As a result, the drilling and production of these potential locations could cause a depletion of our proved reserves, and may inhibit our ability to further exploit and develop our reserves.
34
Our expectations for future development activities are planned to be realized over several years, making them susceptible to uncertainties that could materially alter the occurrence or timing of such activities.
We have identified drilling, recompletion and development locations and prospects for future drilling, recompletion and development. These drilling, recompletion and development locations represent a significant part of our future drilling and enhanced recovery opportunity plans. We cannot predict in advance of drilling, testing and analysis of data whether any particular drilling location will yield production in sufficient quantities to recover drilling or completion costs or to be economically viable. Even if sufficient amounts of oil or natural gas reserves exist, we may damage the potentially productive hydrocarbon bearing formation or experience mechanical difficulties while drilling or completing the well, possibly resulting in a reduction in production from the well or abandonment of the well. If we drill dry holes in our current and future drilling locations, our drilling success rate may decline and materially harm our business. Our ability to drill, recomplete and develop locations depends on a number of factors, including the availability of capital, seasonal conditions, regulatory approvals, negotiation of agreements with third parties, commodity prices, costs, the generation of additional seismic or geological information, the availability of drilling rigs, drilling results, construction of infrastructure and lease expirations. Because of these uncertainties, we cannot be certain of the timing of these activities or that they will ultimately result in the realization of estimated proved reserves or meet our expectations for success. As such, our actual drilling and enhanced recovery activities may materially differ from our current expectations, which could have a significant adverse effect on our estimated reserves, financial condition, results of operations and cash flows.
Part of our strategy involves using horizontal drilling and completion techniques, which involve risks and uncertainties in their application.
Our operations involve utilizing some of the latest drilling and completion techniques as developed by us and our service providers. Risks that we face while drilling horizontal wells include, but are not limited to, the following:
| • | landing our wellbore in the desired drilling zone; |
| • | staying in the desired drilling zone while drilling horizontally through the formation; |
| • | running our casing the entire length of the wellbore; and |
| • | being able to run tools and other equipment consistently through the horizontal wellbore. |
Risks that we face while completing our wells include, but are not limited to, the following:
| • | the ability to fracture stimulate the target reservoir formation as planned, including the planned number of stages; |
| • | the ability to run tools the entire length of the wellbore during completion operations; and |
| • | the ability to successfully clean out the wellbore after completion of the final fracture stimulation stage. |
If our drilling results are less than anticipated, the return on our investment for a particular project may not be as attractive as we anticipated and we could incur material write-downs of unevaluated properties, and the value of our undeveloped acreage could decline in the future.
Our use of 2-D and 3-D seismic data is subject to interpretation and may not accurately identify the presence of oil and natural gas, which could adversely affect the results of our drilling operations.
Even when properly used and interpreted, 2-D and 3-D seismic data and visualization techniques are only tools used to assist geoscientists in identifying subsurface structures and hydrocarbon indicators and do not enable the interpreter to know whether hydrocarbons are, in fact, present in those structures. In addition, the use of 3-D seismic and other advanced technologies requires greater predrilling expenditures than traditional drilling strategies and we could incur losses as a result of such expenditures. As a result, our drilling activities may not be successful or economical, which could have a material adverse impact on our financial condition, results of operations and cash flows.
SEC rules could limit our ability to book additional PUDs in the future.
SEC rules require that, subject to limited exceptions, PUDs may only be booked if they relate to wells scheduled to be drilled within five years after the date of booking. This requirement has limited and will likely continue to limit our ability to book additional PUDs as we pursue our drilling program, especially in a time of depressed commodity prices. Moreover, we may be required to write down our PUDs if we do not drill those wells within the required five-year timeframe.
35
The unavailability or high cost of rigs, equipment, supplies and crews could delay our operations, increase our costs and delay forecasted revenue.
Our industry is cyclical, and historically there have been periodic shortages of rigs, equipment, supplies and crew. Sustained declines in oil and natural gas prices may reduce the number of service providers for such rigs, equipment, supplies and crews, contributing to or resulting in shortages. Alternatively, during periods of higher oil and natural gas prices, the demand for rigs, equipment, supplies and crews is increased and can lead to shortages of, and increasing costs for, development equipment, supplies, services and personnel. Shortages of, or increasing costs for, experienced development crews and oil field equipment and services could restrict the Company’s ability to drill the wells and conduct the operations that it currently has planned relating to the fields where our properties are located. In addition, some of our operations require supply materials for production, such as CO2, which could become subject to shortages and increased costs. Any delay in the development of new wells or a significant increase in development costs could reduce our revenues and impact our development plan, which would thus affect our financial conduction, results of operations and our cash flows.
We may incur losses as a result of title defects in the properties in which we invest.
The existence of a material title deficiency can render a lease worthless and can adversely affect our results of operations and financial condition. While we typically obtain title opinions prior to commencing drilling operations on a lease or in a unit, the failure of title may not be discovered until after a well is drilled, in which case we may lose the lease and the right to produce all or a portion of the minerals under the property.
Development and production of oil and natural gas in offshore waters has inherent and historically higher risk than similar activities onshore.
Our offshore operations are subject to a variety of operating risks specific to the marine environment, such as a dependence on a limited number of electrical transmission lines, as well as capsizing, collisions and damage or loss from adverse weather conditions. Offshore activities are subject to more extensive governmental regulation than our other oil and natural gas activities. We are vulnerable to the risks associated with operating offshore California, including risks relating to:
| • | natural disasters such as earthquakes, tidal waves, mudslides, fires and floods; |
| • | oil field service costs and availability; |
| • | compliance with environmental and other laws and regulations; |
| • | remediation and other costs resulting from oil spill releases of hazardous materials and other environmental damages; and |
| • | failure of equipment or facilities. |
In addition to lost production and increased costs, these hazards could cause serious injuries, fatalities, contamination or property damage for which we could be held responsible. The potential consequences of these hazards are particularly severe for us because a significant portion of our offshore operations are conducted in environmentally sensitive areas, including areas with significant residential populations and public and commercial infrastructure. An accidental oil spill or release on or related to offshore properties and operations could expose us to joint and several strict liability, without regard to fault, under applicable law for all containment and oil removal costs and a variety of public and private damages including, but not limited to, the costs of responding to a release of oil, natural resource damages, and economic damages suffered by persons adversely affected by an oil spill. If an oil discharge or substantial threat of discharge were to occur, we may be liable for costs and damages, which costs and damages could be material to our business, financial condition or results of operations and could subject us to criminal and civil penalties. Finally, maintenance activities undertaken to reduce operational risks can be costly and can require exploration, exploitation and development operations to be curtailed while those activities are being completed.
Adverse developments in our operating areas could adversely affect our business, financial condition, results of operations and cash flows.
Our properties are located in East Texas / North Louisiana, the Rockies, federal waters offshore Southern California, and South Texas. An adverse development in the oil and natural gas business of any of these geographic areas, such as in our ability to attract and retain field personnel or in our ability to comply with local regulations, could adversely affect our business, financial condition, results of operations and cash flows.
36
We are dependent upon a small number of significant customers for a substantial portion of our production sales. The loss of those customers, if not replaced, could reduce our revenues and have a material adverse effect on our financial condition and results of operations.
We had three customers that each accounted for 10% or more of total reported revenues for the year ended December 31, 2018. The loss of these customers or any significant customer, should we be unable to replace them, could adversely affect our revenues and have a material adverse effect on our financial condition and results of operations. Also, if any significant customer reduces the volume it purchases from us, we could experience a temporary interruption in sales of, or may receive a lower price for, our production, and our revenues and cash flows could decline. We cannot assure you that any of our customers will continue to do business with us or that we will continue to have access to suitably liquid markets for our future production. See “Item 1. Business — Operations — Marketing and Major Customers.”
The inability of our significant customers to meet their obligations to us may adversely affect our financial results.
We are subject to credit risk due to concentration of our oil and natural gas receivables. The inability or failure of our significant customers, or any purchasers of our production, to meet their payment obligations to us or their insolvency or liquidation could have a material adverse effect on our results of operations. To the extent that purchasers of our production rely on access to the credit or equity markets to fund their operations, there could be an increased risk that those purchasers could default in their contractual obligations to us. If for any reason we were to determine that it was probable that some or all of the accounts receivable from any one or more of the purchasers of our production were uncollectible, we would recognize a charge in the earnings of that period for the probable loss and could suffer a material reduction in our liquidity and cash flows.
We are exposed to trade credit risk in the ordinary course of our business activities.
We are exposed to risks of loss in the event of nonperformance by our vendors and other counterparties. Some of our vendors and other counterparties may be highly leveraged and subject to their own operating and regulatory risks. Many of our vendors and other counterparties finance their activities through cash flow from operations, the incurrence of debt or the issuance of equity. The combination of reduction of cash flow resulting from declines in commodity prices and the lack of availability of debt or equity financing may result in a significant reduction in our vendors’ and other counterparties’ liquidity and ability to make payments or perform on their obligations to us. Even if our credit review and analysis mechanisms work properly, we may experience financial losses in our dealings with other parties. Any increase in the nonpayment or nonperformance by our vendors and/or counterparties could adversely affect our business, financial condition, results of operations and cash flows.
Conservation measures and technological advances could reduce demand for oil and natural gas.
Fuel conservation measures, alternative fuel requirements, increasing consumer demand for alternatives to oil and natural gas, technological advances in fuel economy and energy generation devices could reduce demand for oil and natural gas. The impact of the changing demand for oil and natural gas services and products may have a material adverse effect on our business, financial condition, results of operations and cash flows.
We may be unable to compete effectively with larger companies.
The oil and natural gas industry is intensely competitive with respect to acquiring prospects and productive properties, marketing oil and natural gas and securing equipment and trained personnel. Our ability to acquire additional properties and to discover reserves in the future will depend on our ability to evaluate and select suitable properties and to consummate transactions in a highly competitive environment. Many of our larger competitors not only drill for and produce oil and natural gas but also carry on refining operations and market petroleum and other products on a regional, national or worldwide basis and many of our competitors have access to capital at a lower cost than that available to us. These companies may be able to pay more for oil and natural gas properties and evaluate, bid for and purchase a greater number of properties than our financial, technical or personnel resources permit. In addition, there is substantial competition for investment capital in the oil and natural gas industry. These larger companies may have a greater ability to continue development activities during periods of low oil and natural gas prices and to absorb the burden of present and future federal, state, local and other laws and regulations. Furthermore, we may not be able to aggregate sufficient quantities of production to compete with larger companies that are able to sell greater volumes of production to intermediaries, thereby reducing the realized prices attributable to our production. Any inability to compete effectively with larger companies could have a material adverse impact on our business activities, financial condition, results of operations and cash flows.
Our business relies on certain key personnel.
Our management believes that our continued success will depend to a significant extent upon the efforts and abilities of certain of our key personnel. The loss of the services of any of these key personnel could have a material adverse effect on our business. We do not maintain “key man” life insurance on any of our officers or other employees.
37
Our business depends in part on pipelines, gathering systems and processing facilities owned by us or others. Any limitation in the availability of those facilities could interfere with our ability to market our oil and natural gas production.
The marketability of our oil and natural gas production depends in part on the availability, proximity and capacity of pipelines and other transportation methods, gathering systems and processing facilities owned by third parties. The amount of oil and natural gas that can be produced and sold is subject to curtailment in certain circumstances, such as pipeline interruptions due to scheduled and unscheduled maintenance, excessive pressure, physical damage or lack of contracted capacity on such systems. For example, our ability to produce and sell oil from the Beta properties will depend on the availability of the pipeline infrastructure between platforms as well as the San Pedro Bay Pipeline for delivery of that oil to shore, and any unavailability of that pipeline infrastructure or pipeline could cause us to shut in all or a portion of the production from the Beta properties for the length of such unavailability. Our access to transportation options can also be affected by U.S. federal and state regulation of oil and natural gas production and transportation, general economic conditions and changes in supply and demand. The curtailments arising from these and similar circumstances may last from a few days to several months. In many cases, we are provided with only limited, if any, notice as to when these circumstances will arise and their duration. Any significant curtailment in gathering system or transportation or processing facility capacity could reduce our ability to market our oil and natural gas production and harm our business, financial condition, results of operations and cash flows.
We have limited control over the activities on properties we do not operate.
Some of the properties in which we have an interest are operated by other companies and involve third-party working interest owners. As a result, we have limited ability to influence or control the operation or future development of such properties, including compliance with environmental, safety and other regulations, or the amount of capital expenditures that we will be required to fund with respect to such properties. Moreover, we are dependent on the other working interest owners of such projects to fund their contractual share of the capital expenditures of such projects. In addition, a third-party operator could also decide to shut-in or curtail production from wells, or plug and abandon marginal wells, on properties owned by that operator during periods of lower crude oil or natural gas prices. These limitations and our dependence on the operator and third-party working interest owners for these projects could cause us to incur unexpected future costs, lower production and materially and adversely affect our financial condition and results of operations.
We are subject to complex federal, state, local and other laws and regulations that could adversely affect the cost, manner or feasibility of conducting our operations.
Our oil and natural gas development and production operations are subject to complex and stringent laws and regulations administered by governmental authorities vested with broad authority relating to the exploration for and the development, production and transportation of, oil and natural gas, as well as environmental and safety matters. To conduct our operations in compliance with these laws and regulations, we must obtain and maintain numerous permits, approvals and certificates from various federal, state and local governmental authorities. We may incur substantial costs in order to maintain compliance with these existing laws and regulations. In addition, the long-term trend in environmental regulation has been to place more restrictions and limitations on activities that may affect the environment and thus, our costs of compliance may increase if existing laws and regulations are revised or reinterpreted, or if new laws and regulations become applicable to our operations. Failure to comply with laws and regulations applicable to our operations, including any evolving interpretation and enforcement by governmental authorities, could have a material adverse effect on our business, financial condition, results of operations and cash flows.
Our oil and natural gas development and production operations are also subject to stringent and complex federal, state and local laws and regulations governing the discharge of materials into the environment, worker health and safety aspects of our operations, or otherwise relating to environmental protection. These laws and regulations may impose numerous obligations applicable to our operations including the acquisition of a permit before conducting regulated drilling activities; the restriction of types, quantities and concentration of materials that can be released into the environment; the limitation or prohibition of drilling activities on certain lands lying within wilderness, wetlands, seismically active areas and other protected areas; the application of specific health and safety criteria addressing worker protection; and the imposition of substantial liabilities for pollution resulting from our operations. Numerous governmental authorities, such as the EPA and analogous state agencies, have the power to enforce compliance with these laws and regulations and the permits issued under them, often requiring difficult and costly compliance measures or corrective actions. Failure to comply with these laws and regulations may result in the assessment of sanctions, including administrative, civil or criminal penalties, the imposition of investigatory or remedial obligations, the suspension or revocation of necessary permits, licenses and authorizations, the requirement that additional pollution controls be installed and, in some instances, the issuance of orders limiting or prohibiting some or all of our operations. In addition, we may experience delays in obtaining or be unable to obtain required permits, which may delay or interrupt our operations and limit our growth and revenue.
38
Under certain environmental laws that impose strict as well as joint and several liability, we may be required to remediate contaminated properties currently or formerly owned or operated by us or facilities of third parties that received waste generated by our operations regardless of whether such contamination resulted from the conduct of others or from consequences of our own actions that were in compliance with all applicable laws at the time those actions were taken. In addition, claims for damages to persons or property, including natural resources, may result from the environmental, health and safety impacts of our operations. Moreover, public interest in the protection of the environment has increased in recent years. The trend of more expansive and stringent environmental legislation and regulations applied to the crude oil and natural gas industry could continue, resulting in increased costs of doing business and consequently affecting profitability. To the extent laws are enacted or other governmental action is taken that restricts drilling or imposes more stringent and costly operating, waste handling, disposal and cleanup requirements, our business, prospects, financial condition or results of operations could be materially adversely affected.
Further, the Mineral Leasing Act of 1920, as amended (the “Mineral Act”) prohibits ownership of any direct or indirect interest in federal onshore oil and natural gas leases by a foreign citizen or a foreign entity except through equity ownership in a corporation formed under the laws of the United States or of any U.S. State or territory, and only if the laws, customs, or regulations of their country of origin or domicile do not deny similar or like privileges to citizens or entities of the United States. If these restrictions are violated, the oil and natural gas lease can be canceled in a proceeding instituted by the United States Attorney General. We qualify as an entity formed under the laws of the United States or of any U.S. State or territory. Although the regulations promulgated and administered by the BLM pursuant to the Mineral Act provide for agency designations of non-reciprocal countries, there are presently no such designations in effect. It is possible that our stockholders may be citizens of foreign countries who do not own their stock in a U.S. corporation, or that even if such stock are held through a U.S. corporation, their country of citizenship may be determined to be non-reciprocal countries under the Mineral Act. In such event, any federal onshore oil and natural gas leases held by us could be subject to cancellation based on such determination. See “Item 1. Business — Environmental, Occupational Health and Safety Matters and Regulations” and “— Other Regulation of the Oil and Natural Gas Industry” for a description of the laws and regulations that affect us.
Climate change legislation or regulations restricting emissions of “greenhouse gases,” or GHGs could result in increased operating costs and reduced demand for the oil and natural gas that we produce.
In December 2009, the EPA published its findings that emissions of GHGs present an endangerment to public health and the environment because emissions of such gases are contributing to the warming of the earth’s atmosphere and other climatic changes. Based on these findings, the EPA has adopted and implemented regulations to restrict emissions of GHGs under existing provisions of the CAA. In addition, the EPA has also adopted rules requiring the monitoring and reporting of GHG emissions from specified sources on an annual basis in the United States, including, among others, certain oil and natural gas production facilities, which includes certain of our operations. The adoption and implementation of any regulations imposing reporting obligations on, or limiting emissions of GHGs from, our equipment and operations could require us to incur costs to reduce emissions of GHGs associated with our operations or could adversely affect demand for the oil and natural gas we produce. Such climate change regulatory and legislative initiatives could have a material adverse effect on our business, financial condition and results of operations.
While Congress has from time to time considered legislation to reduce emissions of GHGs, there has not been significant activity in the form of adopted legislation to reduce GHG emissions at the federal level in recent years. In the absence of such federal climate legislation, almost one-half of the states have taken legal measures to reduce emissions of greenhouse gases primarily through the planned development of greenhouse gas emission inventories and/or regional greenhouse gas cap and trade programs. In addition, on an international level, the United States was one of 175 countries to sign an international climate change agreement in Paris, France that requires member countries to set their own GHG emission reduction goals beginning in 2020. However, on June 1, 2017, President Trump announced that the United States will withdraw from the Paris Agreement. It is not clear what steps the Trump Administration plans to take to withdraw from the Paris Agreement, whether a new agreement can be negotiated, or what terms would be included in such an agreement. Various states and local governments have vowed to continue to enact regulations to achieve the goals of the Paris Agreement.
Although it is not possible at this time to predict how legislation or new regulations that may be adopted to address GHG emissions would impact our business, any such future laws and regulations that require reporting of GHGs or otherwise limit emissions of GHGs from our equipment and operations could require us to incur costs to monitor and report on GHG emissions or reduce emissions of GHGs associated with our operations, and such requirements also could adversely affect demand for the oil and natural gas that we produce. Finally, it should be noted that most scientists have concluded that increasing concentrations of GHGs in the Earth’s atmosphere may produce climate changes that have significant physical effects, such as increased frequency and severity of storms, droughts and floods and other climatic events. If any such effects were to occur, they could have an adverse effect on our financial condition and results of operations. See “Item 1. Business — Environmental, Occupational Health and Safety Matters and Regulations — Regulation of “Greenhouse Gas” Emissions for a description of the climate change laws and regulations that affect us.
39
The listing of a species as either “threatened” or “endangered” under the federal Endangered Species Act could result in increased costs, new operating restrictions, or delays in our operations, which could adversely affect our results of operations and financial condition.
The ESA and analogous state laws regulate activities that could have an adverse effect on threatened and endangered species. Operations in areas where threatened or endangered species or their habitat are known to exist may require us to incur increased costs to implement mitigation or protective measures and also may restrict or preclude our activities in those areas or during certain seasons, such as breeding and nesting seasons. The listing of species in areas where we operate or, alternatively, entry into certain range-wide conservation planning agreements could result in increased costs to us from species protection measures, time delays or limitations on our activities, which costs, delays or limitations may be significant and could adversely affect our results of operations and financial position.
The third parties on whom we rely for gathering and transportation services are subject to complex federal, state and other laws that could adversely affect the cost, manner or feasibility of conducting our business.
The operations of the third parties on whom we rely for gathering and transportation services are subject to complex and stringent laws and regulations that require obtaining and maintaining numerous permits, approvals and certifications from various federal, state and local government authorities. These third parties may incur substantial costs in order to comply with existing laws and regulations. If existing laws and regulations governing such third-party services are revised or reinterpreted, or if new laws and regulations become applicable to their operations, these changes may affect the costs that we pay for such services. Similarly, a failure to comply with such laws and regulations by the third parties on whom we rely could have a material adverse effect on our business, financial condition and results of operations. See “Item 1. Business — Environmental, Occupational Health and Safety Matters and Regulations” and “— Other Regulation of the Oil and Natural Gas Industry” for a description of the laws and regulations that affect the third parties on whom we rely.
Derivatives reform legislation and related regulations could have an adverse effect on our ability to hedge risks associated with our business.
The Dodd-Frank Act provides for federal oversight of the over-the-counter derivatives market and entities that participate in that market and mandates that the CFTC, the SEC, and federal regulators of financial institutions (the “Prudential Regulators”), adopt rules or regulations implementing the Dodd-Frank Act and providing definitions of terms used in the Dodd-Frank Act. The Dodd-Frank Act establishes margin requirements and requires clearing and trade execution practices for certain market participants and may result in certain market participants needing to curtail or cease their derivatives activities.
Although some of the rules necessary to implement the Dodd-Frank Act remain to be adopted, the CFTC, the SEC and the Prudential Regulators have issued a large number of rules, including a rule, which we refer to as the “Clearing Rule,” requiring clearing of hedges, or swaps, that are subject to it (currently, only certain interest rate and credit default swaps, which we do not presently have), a rule establishing an “end user” exception to the Clearing Rule, referred to herein as the “End User Exception,” a rule, which we refer to as the “Margin Rule,” setting forth collateral requirements in connection with swaps that are not cleared and also an exception to the Margin Rule for end users that are not financial end users, which exception we refer to as the “Non-Financial End User Exception,” and a rule, subsequently vacated by the United States District Court for the District of Columbia and remanded to the CFTC for further proceedings, imposing position limits. The CFTC proposed a new version of this rule, with respect to which the comment period closed but the rule was not adopted, and another new version of this rule, which we refer to as the “Re-Proposed Position Limit Rule,” with respect to which the comment period has closed but a final rule has not been issued. The Re-Proposed Position Limit Rule provides an exemption from the position limits for swaps that constitute “bona fide hedging positions” within the definition of such term under the Re-Proposed Position Limit Rule, subject to the party claiming the exemption complying with the applicable filing, recordkeeping and reporting requirements of the Re-Proposed Position Limit Rule.
40
We currently qualify for the End User Exception and will utilize it if the Clearing Rule is expanded to cover swaps in which we participate; we currently qualify for the Non-Financial End User Exception and will not be required to post margin under the Margin Rule, and our existing and anticipated hedging positions constitute “bona fide hedging positions” under the Re-Proposed Position Limit Rule and we intend to do the filing, recordkeeping and reporting necessary to utilize the bona fide hedging position exemption under the Re-Proposed Position Limit Rule if and when it becomes effective, so we do not expect to be directly affected by any of such rules. However, most if not all of our hedge counterparties will be subject to mandatory clearing in connection with their hedging activities with parties who do not qualify for the End User Exception and will be required to post margin in connection with their hedging activities with other swap dealers, major swap participants, financial end users and other persons that do not qualify for the Non-Financial End User Exception. In addition, the European Union and other non-U.S. jurisdictions have enacted laws and regulations (including laws and regulations giving European Union financial authorities the power to write down amounts we may be owed on hedging agreements with counterparties subject to such laws and regulations and/or require that we accept equity interests in such counterparties in lieu of cash in satisfaction of such amounts), which we refer to collectively as “Foreign Regulations” which may apply to our transactions with counterparties subject to such Foreign Regulations. The Dodd-Frank Act, the rules which have been adopted and not vacated, and, to the extent that the Re-Proposed Position Limit Rule is ultimately effected, such proposed rule could significantly increase the cost of derivative contracts, materially alter the terms of derivative contracts, reduce the availability of derivatives to protect against risks we encounter, reduce our ability to monetize or restructure our existing derivative contracts and increase our exposure to less creditworthy counterparties. The Foreign Regulations could have similar effects. If we reduce our use of derivatives as a result of the Dodd-Frank Act and regulations and Foreign Regulations, our results of operations may become more volatile and our cash flows may be less predictable, which could adversely affect our ability to plan for and fund capital expenditures. Finally, the Dodd-Frank Act was intended, in part, to reduce the volatility of oil and natural gas prices, which some legislators attributed to speculative trading in derivatives and commodity contracts related to oil and natural gas. Our revenues could therefore be adversely affected if a consequence of the Dodd-Frank Act and regulations is to lower commodity prices. Any of these consequences could have a material adverse effect on us, our financial condition, and our results of operations.
Oil and natural gas producers’ operations, especially those using hydraulic fracturing, are substantially dependent on the availability of water and the disposal of waste, including produced water and drilling fluids. Restrictions on the ability to obtain water or dispose of waste may impact our operations.
Water is an essential component of oil and natural gas production during the drilling, and in particular, hydraulic fracturing, process. Our inability to locate sufficient amounts of water, or dispose of or recycle water used in our development and production operations, could adversely impact our operations. Moreover, the imposition of new environmental initiatives and regulations could include restrictions on our ability to conduct certain operations such as hydraulic fracturing or disposal of waste, including, but not limited to, produced water, drilling fluids and other wastes associated with the exploration, development or production of natural gas. The Clean Water Act imposes restrictions and strict controls regarding the discharge of produced waters and other natural gas and oil waste into navigable waters. Permits must be obtained to discharge pollutants to waters and to conduct construction activities in waters and wetlands. The Clean Water Act and similar state laws provide for civil, criminal and administrative penalties for any unauthorized discharges of pollutants and unauthorized discharges of reportable quantities of oil and other hazardous substances. State and federal discharge regulations prohibit the discharge of produced water and sand, drilling fluids, drill cuttings and certain other substances related to the natural gas and oil industry into coastal waters. Also, the EPA has adopted regulations requiring certain natural gas and oil exploration and production facilities to obtain permits for storm water discharges. Compliance with current and future environmental regulations and permit requirements governing the withdrawal, storage and use of surface water or groundwater necessary for hydraulic fracturing of wells may increase our operating costs and cause delays, interruptions or termination of our operations, the extent of which cannot be predicted. In addition, in some instances, the operation of underground injection wells for the disposal of waste has been alleged to cause earthquakes. In some jurisdictions, such issues have led to orders prohibiting continued injection or the suspension of drilling in certain wells identified as possible sources of seismic activity or resulted in stricter regulatory requirements relating to the location and operation of underground injection wells. Any such orders or regulations addressing concerns about seismic activity from well injection in jurisdictions where we operate could affect our operations. See “Item 1. Business — Environmental, Occupational Health and Safety Matters and Regulations — Water Discharges and Other Waste Discharges & Spills” and “— Hydraulic Fracturing” for a description of the laws and regulations relating to the discharge of water and other wastes and hydraulic fracturing that affect us.
Federal and state legislative and regulatory initiatives relating to hydraulic fracturing could result in increased costs and additional operating restrictions or delays and adversely affect our production.
Hydraulic fracturing is an essential and common practice in the oil and gas industry used to stimulate production of natural gas and/or oil from dense subsurface rock formations. Hydraulic fracturing involves using water, sand and certain chemicals to fracture the hydrocarbon-bearing rock formation to allow flow of hydrocarbons into the wellbore. We routinely apply hydraulic fracturing techniques in our drilling and completion programs. While hydraulic fracturing has historically been regulated by state oil and natural gas commissions, the practice has become increasingly controversial in certain parts of the country, resulting in increased scrutiny and regulation. See “Item 1. Business — Environmental, Health and Safety Matters and Regulations — Hydraulic Fracturing” for a description of the federal and state legislative and regulatory initiatives relating to hydraulic fracturing that affect us.
41
If these or any other new laws or regulations that significantly restrict hydraulic fracturing are adopted at the state and local level, such laws could make it more difficult or costly for us to perform fracturing to stimulate production from dense subsurface rock formations and, in the event of local prohibitions against commercial production of natural gas, may preclude our ability to drill wells. In addition, if hydraulic fracturing becomes further regulated at the federal level as a result of federal legislation or regulatory initiatives by the EPA or other federal agencies, our fracturing activities could become subject to additional permitting requirements and result in permitting delays as well as potential increases in costs. The U.S. Congress has from time to time considered legislation to amend the SDWA, including legislation that would repeal the exemption for hydraulic fracturing from the definition of “underground injection” and require federal permitting and regulatory control of hydraulic fracturing, as well as legislative proposals to require disclosure of the chemical constituents of the fluids used in the fracturing process. Restrictions on hydraulic fracturing could also reduce the amount of oil and natural gas that we are ultimately able to produce from our reserves.
In addition, certain governmental reviews have been conducted that focus on environmental aspects of hydraulic fracturing practices, which could spur initiatives to further regulate hydraulic fracturing, and could ultimately make it more difficult or costly for us to perform fracturing and increase our costs of compliance and doing business.
The cost of decommissioning is uncertain.
We are required to maintain reserve funds to provide for the payment of decommissioning costs associated with the Beta properties. The estimates of decommissioning costs are inherently imprecise and subject to change due to changing cost estimates, oil and natural gas prices and other factors. If actual decommissioning costs exceed such estimates, or we are required to provide a significant amount of collateral in cash or other security as a result of a revision to such estimates, our financial condition, results of operations and cash flows may be materially adversely affected.
Our business could be adversely affected by security threats, including cyber-security threats, and related disruptions.
As a producer of natural gas and oil, we face from time to time various security threats, including cyber-security threats, to gain unauthorized access to our sensitive information or to render our information or systems unusable, and threats to the security of our facilities and infrastructure or third-party facilities and infrastructure, such as gathering and processing and other facilities, refineries and pipelines. These security threats subject our operations to increased risks that could have a material adverse effect on our business, financial condition, results of operations and cash flows.
Our implementation of various procedures and controls to monitor and mitigate such security threats and to increase security for our information, systems, facilities and infrastructure may result in increased costs. Moreover, there can be no assurance that such procedures and controls will be sufficient to prevent security breaches from occurring. We rely heavily on our information systems, and the availability and integrity of these systems are essential for us to conduct our business and operations. If any security breaches were to occur, they could lead to losses of, or damage to, sensitive information or facilities, infrastructure and systems essential to our business and operations, as well as data corruption, communication interruptions or other disruptions to our operations, which, in turn, could have a material adverse effect on our business, financial position, results of operations and cash flows.
Damage to our reputation could damage our business.
Our reputation is a critical factor in our relationships with employees, investors, customers and suppliers. If we fail to address, or appear to fail to address, issues that give rise to reputational risk, including those described throughout this “Risk Factors” section, we could significantly harm our reputation. Our reputation may also be damaged by how we respond to corporate crises. Corporate crises can arise from catastrophic events as well as from incidents involving unethical behavior or misconduct; allegations of legal noncompliance; internal control failures; corporate governance issues; data breaches; workplace safety incidents; environmental incidents; media statements; the conduct of our suppliers or representatives; and other issues or incidents that, whether actual or perceived, result in adverse publicity. If we fail to respond quickly and effectively to address such crises, the ensuing negative public reaction could significantly harm our reputation and could lead to increases in litigation claims and asserted damages or subject us to regulatory actions or restrictions.
Damage to our reputation could negatively affect the demand for our services and consequently, have a material adverse effect on our business, financial condition, and results of operations. It could also reduce investor confidence in us, adversely affecting our stock price. Moreover, repairing our reputation may be difficult, time-consuming and expensive.
42
Certain U.S. federal income tax deductions currently available with respect to oil and natural gas exploration and production may be eliminated as a result of future legislation.
In past years, legislation has been proposed that would, if enacted into law, make significant changes to U.S. tax laws, including the elimination of certain key U.S. federal income tax incentives currently available to oil and natural gas exploration and production companies. These changes include, but are not limited to, (i) the repeal of the percentage depletion allowance for oil and natural gas properties, (ii) the elimination of current deductions for intangible drilling and development costs, or IDCs, (iii) the elimination of the deduction for certain domestic production activities, and (iv) an extension of the amortization period for certain geological and geophysical expenditures. Although these provisions were largely unchanged in the Tax Cuts and Jobs Act of 2017 (which was signed in December 2017), Congress could consider, and could include, some or all of these proposals as part of future tax reform legislation. It is unclear whether any of the foregoing or similar proposals will be considered and enacted as part of future tax reform legislation and if enacted, how soon any such changes could become effective. The passage of any legislation as a result of these proposals or any other similar changes in U.S. federal income tax laws could eliminate or postpone certain tax deductions that are currently available with respect to oil and natural gas exploration and development and any such change could have an adverse effect on the Company’s financial position, results of operations and cash flows.
Recent changes in U. S. federal income tax law may have an adverse effect on our cash flows, results of operations or financial condition.
The Tax Cuts and Jobs Act of 2017 may affect our cash flows, results of operations and financial condition. Among other items, the Tax Cuts and Jobs Act of 2017 repealed the deduction for certain U.S. production activities and provided for a new limitation on the deduction for interest expense. Given the scope of this law and the potential interdependency of its changes, it is difficult at this time to assess whether the overall effect of the Tax Cuts and Jobs Act of 2017 will be cumulatively positive or negative for our earnings and cash flow, but such changes may adversely impact our financial results.
Risks Relating to Our Common Stock
The price and trading volume of our common stock may fluctuate significantly.
The market price of our common stock may be highly volatile and could be subject to wide fluctuations. In addition, the trading volume of our common stock may fluctuate and cause significant price variations to occur. Volatility in the market price of our common stock may prevent you from being able to sell your shares at or above the price at which you were granted your shares of common stock or above the price you paid to acquire your shares of common stock. The market price for our common stock could fluctuate significantly for various reasons, including:
| • | our new capital structure as a result of the transactions contemplated by the Plan; |
| • | our limited trading history subsequent to our emergence from the Chapter 11 Cases; |
| • | our limited trading volume; |
| • | the lack of comparable historical financial information due to our adoption of fresh start accounting; |
| • | actual or anticipated variations in our operating results and cash flow; |
| • | the nature and content of our earnings releases, announcements or events that impact our products, customers, competitors or markets; and |
| • | business conditions in our markets and the general state of the securities markets and the market for energy-related stocks, as well as general economic and market conditions. |
We currently have no plans to pay regular dividends on our common stock, so you may not receive funds without selling your common stock.
While we may decide to pay cash dividends in the future, we have not paid, nor do we currently intend to pay, any cash dividends on our common stock. Any payment of dividends in the future will be at the discretion of our board of directors and will depend on, among other things, our earnings, financial condition and business opportunities, the restrictions in our debt agreements, and other considerations that our board of directors deems relevant. Accordingly, you may have to sell some or all of your common stock in order to generate cash flow from your investment.
43
If we fail to maintain an effective system of internal controls, we may not be able to accurately report our financial results or prevent fraud. As a result, current and potential shareholders could lose confidence in our financial reporting, which would harm our business and the trading price of our common stock.
Effective internal controls are necessary for us to provide reliable financial reports, prevent fraud and operate successfully as a public company. If we cannot provide reliable financial reports or prevent fraud, our reputation and operating results would be harmed. We cannot be certain that our efforts to maintain our internal controls will be successful, that we will be able to maintain adequate controls over our financial processes and reporting in the future or that we will be able to comply with our obligations under Section 404 of the Sarbanes Oxley Act of 2002. Any failure to maintain effective internal controls, or difficulties encountered in implementing or improving our internal controls, could harm our operating results or cause us to fail to meet our reporting obligations. Ineffective internal controls could also cause investors to lose confidence in our reported financial information, which would likely have a negative effect on the trading price of our common stock.
ITEM 1B. | UNRESOLVED STAFF COMMENTS |
None.
Information regarding our properties is contained in “Item 1. Business — Our Areas of Operation” and “—Our Oil and Natural Gas Data” and “Item 7. Management’s Discussion and Analysis of Financial Condition and Results of Operations —Results of Operations” contained herein.
As part of our normal business activities, we may be named as defendants in litigation and legal proceedings, including those arising from regulatory and environmental matters. If we determine that a negative outcome is probable and the amount of loss is reasonably estimable, we accrue the estimated amount. We are not aware of any litigation, pending or threatened, that we believe will have a material adverse effect on our financial position, results of operations or cash flows. No amounts have been accrued at December 31, 2018.
For additional information regarding legal proceedings, see Note 17, “Commitments and Contingencies — Litigation and Environmental” of the Notes to Consolidated Financial Statements included under “Item 8. Financial Statements and Supplementary Data” of this annual report, which is incorporated herein by reference.
ITEM 4. | MINE SAFETY DISCLOSURES |
Not applicable.
44
PART II
ITEM 5. | MARKET FOR REGISTRANT’S COMMON EQUITY, RELATED STOCKHOLDER MATTERS AND ISSUER PURCHASES OF EQUITY SECURITIES |
Market Information
Our common stock is quoted on the OTCQX U.S. Premier marketplace (“OTCQX”) under the trading symbol “AMPY” and has been trading since June 21, 2017. Prior to such date, there was no established public trading market for our common stock. Over-the-counter market quotations reflect inter-dealer prices, without retail mark-up, mark-down or commission and may not necessarily represent actual transactions.
As of February 28, 2019, we had 22,141,804 shares of our common stock outstanding. As of February 28, 2019, we had eight record holders of our common stock, based on information provided by our transfer agent.
Dividends Policy
While we may decide to pay cash dividends in the future, we have not paid, nor do we currently intend to pay, any cash dividends on our common stock. Any future payment of cash dividends would be subject to the restrictions in the New Revolving Credit Facility.
Securities Authorized for Issuance Under Equity Compensation Plan
See the information incorporated by reference in “Item 12. Security Ownership of Certain Beneficial Owners and Management and Related Shareholder Matters” for information regarding shares of our common stock authorized for issuance under our stock compensation plans, which information is incorporated herein by reference.
Issuer Purchases of Equity Securities
On December 21, 2018, the Company’s board of directors authorized the repurchase of up to $25.0 million of the Company’s outstanding shares of common stock, with such repurchases to begin on or after January 9, 2019 (in accordance with the SEC’s regulations regarding issuer tender offers). Purchases may be made from time to time in negotiated purchases or in the open market, including through Rule 10b5-1 prearranged stock trading plans designed to facilitate the repurchase of the Company's shares during times it would not otherwise be in the market due to self-imposed trading blackout periods or possible possession of material nonpublic information. The timing and amounts of any such repurchases of shares will be subject to market conditions and certain other factors, and will be in accordance with applicable securities laws and other legal requirements, including restrictions contained in the Company’s New Revolving Credit Facility. The repurchase plan does not obligate the Company to acquire any specific number of shares and may be discontinued at any time.
The following sets forth information with respect to the Company’s repurchases of shares of its common stock during the fourth quarter of 2018.
Period | | Total Number of Shares Purchased | | | Average Price Paid per Share | | | Total Number of Shares Purchased as Part of Publicly Announced Plans or Programs | | | Approximate Dollar Value of Shares That May Yet Be Purchased Under the Plans or Programs (1) | |
| | | | | | | | | | | | | | (In thousands) | |
Common Shares Repurchased (1) | | | | | | | | | | | | | | | | |
October 1, 2018 - October 31, 2018 (Successor) | | | — | | | n/a | | | | — | | | n/a | |
November 1, 2018 - November 30, 2018 (Successor) | | | — | | | n/a | | | | — | | | n/a | |
December 1, 2018 - December 31, 2018 (Successor) | | | 2,916,667 | | | $ | 12.00 | | | | — | | | $ | 25,000 | |
Total | | | 2,916,667 | | | $ | 12.00 | | | | — | | | | | |
(1) On November 19, 2018, the Company’s board of directors announced the commencement of a tender offer to purchase up to 2,916,667 shares of the Company’s common stock. On December 19, 2018, upon the terms and subject to the conditions described in the Offer to Purchase dated November 19, 2018, as amended, the Company repurchased an aggregate of 2,916,667 shares of common stock at a price of $12.00 per share for a total cost of approximately $35.0 million (excluding fees and expenses relating to the tender offer).
45
ITEM 6. | SELECTED FINANCIAL DATA |
The following selected financial data should be read in conjunction with “Item 7. Management’s Discussion and Analysis of Financial Condition and Results of Operations” and “Item 8. Financial Statements and Supplementary Data,” both contained herein.
Basis of Presentation. The selected financial data as of and for the year ended December 31, 2018, the period from May 5, 2017 through December 31, 2017, the period from January 1, 2017 through May 4, 2017 and for the years ended December 31, 2016, 2015 and 2014 have been derived from our consolidated financial statements, the Predecessor consolidated financial statements and the previous owners’ combined financial statements. The combined financial statements of the previous owners reflect certain oil and gas properties acquired from Memorial Resource in April and May 2012 for periods after common control commenced through their respective acquisition dates, the WHT Properties owned by WHT Energy Partners LLC from February 2, 2011 (inception) through the date of acquisition, the Cinco Group from inception through October 1, 2013 and the Property Swap in February 2015 for periods after common control commenced through the date of acquisition. The combined selected financial data of the previous owners may not necessarily be indicative of the actual results of operations that might have occurred if the Predecessor operated those assets separately during those periods.
Comparability of the information reflected in selected financial data. The comparability of the results of operations among the periods presented below is impacted by the following acquisitions:
| • | The acquisition of certain oil and natural gas producing properties in the Eagle Ford from a third party in March 2014 for a total purchase price of approximately $168.1 million; |
| • | The acquisition of certain oil and natural gas liquids properties in Wyoming from a third party in July 2014 for a total purchase price of approximately $906.1 million; |
| • | The acquisition of the remaining interest in the Beta properties from a third party in November 2015 for approximately $94.6 million; |
| • | The sale of assets located in the Permian Basin in June 2016 for approximately $36.7 million; |
| • | The sale of assets located in Colorado and Wyoming in July 2016 for approximately $16.4 million; and |
| • | The sale of non-core assets located in South Texas in May 2018 for approximately $17.1 million. |
In addition, the comparability of the results of operations among the periods presented below is impacted by the application of fresh start accounting upon the Company’s emergence from bankruptcy. The Company’s Consolidated Financial Statements are separated into two distinct periods, the period before the Effective Date (labeled Predecessor), and the period after that date (labeled Successor), to indicate the application of different basis of accounting between the periods presented.
46
As a result of the factors listed above, the combined historical results of operations and period-to-period comparisons of these results and certain financial data may not be comparable or indicative of future results.
| Successor | | | | Predecessor | |
| For the | | | Period from | | | | Period from | | | | | | | | | | | | | |
| Year Ended | | | May 5, 2017 | | | | January 1, 2017 | | | | | | | | | | | | | |
| December 31, | | | through | | | | through | | | For the Year Ended December 31, | |
($ in thousands, except per share/unit data) | 2018 | | | December 31, 2017 | | | | May 4, 2017 | | | 2016 | | | 2015 | | | 2014 | |
Statement of Operations Data: | | | | | | | | | | | | | | | | | | | | | | | | |
Revenues: | | | | | | | | | | | | | | | | | | | | | | | | |
Oil & natural gas sales | $ | 339,840 | | | $ | 205,176 | | | | $ | 108,970 | | | $ | 284,051 | | | $ | 355,422 | | | $ | 561,677 | |
Pipeline tariff income and other | | 304 | | | | 303 | | | | | 231 | | | | 529 | | | | 2,725 | | | | 4,366 | |
Total revenues | | 340,144 | | | | 205,479 | | | | | 109,201 | | | | 284,580 | | | | 358,147 | | | | 566,043 | |
| | | | | | | | | | | | | | | | | | | | | | | | |
Costs and expenses: | | | | | | | | | | | | | | | | | | | | | | | | |
Lease operating expense | | 114,405 | | | | 74,547 | | | | | 35,568 | | | | 126,175 | | | | 168,199 | | | | 143,733 | |
Gathering, processing and transportation | | 23,231 | | | | 18,652 | | | | | 10,772 | | | | 34,979 | | | | 34,939 | | | | 31,892 | |
Exploration | | 3,045 | | | | 32 | | | | | 21 | | | | 981 | | | | 2,317 | | | | 2,750 | |
Taxes other than income | | 20,364 | | | | 11,101 | | | | | 5,187 | | | | 15,540 | | | | 25,828 | | | | 33,141 | |
Depreciation, depletion and amortization | | 52,334 | | | | 35,979 | | | | | 37,717 | | | | 171,629 | | | | 195,814 | | | | 185,955 | |
Impairment of proved oil and natural gas properties | | — | | | | — | | | | | — | | | | 183,437 | | | | 616,784 | | | | 407,540 | |
General and administrative expense | | 43,129 | | | | 29,506 | | | | | 31,606 | | | | 63,280 | | | | 56,671 | | | | 49,124 | |
Accretion of asset retirement obligations | | 5,711 | | | | 4,384 | | | | | 3,407 | | | | 10,231 | | | | 7,125 | | | | 5,773 | |
(Gain) loss on commodity derivative instruments | | (8,155 | ) | | | 31,609 | | | | | (23,076 | ) | | | 117,105 | | | | (462,890 | ) | | | (492,254 | ) |
Gain (loss) on sale of properties | | 3,614 | | | | — | | | | | — | | | | (2,754 | ) | | | (2,998 | ) | | | — | |
Other, net | | 943 | | | | 485 | | | | | 36 | | | | 516 | | | | (665 | ) | | | (11 | ) |
Total costs and expenses | | 258,621 | | | | 206,295 | | | | | 101,238 | | | | 721,119 | | | | 641,124 | | | | 367,643 | |
Operating income (loss) | | 81,523 | | | | (816 | ) | | | | 7,963 | | | | (436,539 | ) | | | (282,977 | ) | | | 198,400 | |
Other income (expense): | | | | | | | | | | | | | | | | | | | | | | | | |
Interest expense, net | | (21,923 | ) | | | (15,936 | ) | | | | (10,243 | ) | | | (146,031 | ) | | | (115,154 | ) | | | (83,550 | ) |
Other income (expense) | | 190 | | | | 16,981 | | | | | 8 | | | | 8 | | | | 43 | | | | (657 | ) |
Gain (loss) on extinguishment on debt | | (3,034 | ) | | | — | | | | | — | | | | 42,337 | | | | 422 | | | | — | |
Total other income (expense) | | (24,767 | ) | | | 1,045 | | | | | (10,235 | ) | | | (103,686 | ) | | | (114,689 | ) | | | (84,207 | ) |
Income (loss) before reorganization items, net and income taxes | | 56,756 | | | | 229 | | | | | (2,272 | ) | | | (540,225 | ) | | | (397,666 | ) | | | 114,193 | |
Reorganization items, net | | (2,147 | ) | | | (1,119 | ) | | | | (88,774 | ) | | | — | | | | — | | | | — | |
Income tax benefit (expense) | | — | | | | 2,176 | | | | | 91 | | | | (173 | ) | | | 2,175 | | | | 1,421 | |
Net income (loss) | | 54,609 | | | | 1,286 | | | | | (90,955 | ) | | | (540,398 | ) | | | (395,491 | ) | | | 115,614 | |
Net income (loss) attributable to noncontrolling interest | | — | | | | — | | | | | — | | | | — | | | | 386 | | | | 32 | |
Net income (loss) attributable to Successor/Predecessor | $ | 54,609 | | | $ | 1,286 | | | | $ | (90,955 | ) | | $ | (540,398 | ) | | $ | (395,877 | ) | | $ | 115,582 | |
| | | | | | | | | | | | | | | | | | | | | | | | |
Successor/Predecessor interest in net income (loss): | | | | | | | | | | | | | | | | | | | | | | | | |
Net income (loss) attributable to Successor/Predecessor | $ | 54,609 | | | $ | 1,286 | | | | $ | (90,955 | ) | | $ | (540,398 | ) | | $ | (395,877 | ) | | $ | 115,582 | |
Net (income) loss allocated to previous owners | | — | | | | — | | | | | — | | | | — | | | | 2,268 | | | | 2,465 | |
Net (income) loss allocated to Predecessor's general partner | | — | | | | — | | | | | — | | | | 168 | | | | 327 | | | | (206 | ) |
Net (income) loss allocated to NGP IDRs | | — | | | | — | | | | | — | | | | — | | | | (83 | ) | | | (88 | ) |
Net (income) allocated to participating restricted stockholders | | (2,426 | ) | | | (35 | ) | | | | — | | | | — | | | | — | | | | — | |
Net income (loss) available to common stockholders/limited partners | $ | 52,183 | | | $ | 1,251 | | | | $ | (90,955 | ) | | $ | (540,230 | ) | | $ | (393,365 | ) | | $ | 117,753 | |
| | | | | | | | | | | | | | | | | | | | | | | | |
Earnings per share/unit: | | | | | | | | | | | | | | | | | | | | | | | | |
Basic earnings per share/unit | $ | 2.09 | | | $ | 0.05 | | | | $ | (1.09 | ) | | $ | (6.48 | ) | | $ | (4.71 | ) | | $ | 1.66 | |
Diluted earnings per share/unit | $ | 2.09 | | | $ | 0.05 | | | | $ | (1.09 | ) | | $ | (6.48 | ) | | $ | (4.71 | ) | | $ | 1.66 | |
| | | | | | | | | | | | | | | | | | | | | | | | |
Predecessor's cash distributions declared per unit | n/a | | | n/a | | | | n/a | | | $ | 0.16 | | | $ | 1.95 | | | $ | 2.20 | |
| | | | | | | | | | | | | | | | | | | | | | | | |
Cash Flow Data: | | | | | | | | | | | | | | | | | | | | | | | | |
Net cash flow provided by operating activities | $ | 141,781 | | | $ | 94,642 | | | | $ | 125,498 | | | $ | 408,626 | | | $ | 216,751 | | | $ | 254,273 | |
Net cash (used in) investing activities | | 23,666 | | | | (53,357 | ) | | | | (6,496 | ) | | | (16,442 | ) | | | (337,569 | ) | | | (1,386,109 | ) |
Net cash provided by (used in) financing activities | | (121,810 | ) | | | (62,594 | ) | | | | (106,674 | ) | | | (377,410 | ) | | | 120,447 | | | | 1,111,108 | |
| | | | | | | | | | | | | | | | | | | | | | | | |
Balance Sheet Data: | | | | | | | | | | | | | | | | | | | | | | | | |
Working capital (deficit) | $ | 55,179 | | | $ | 35,948 | | | | $ | 59,527 | | | $ | (1,581,193 | ) | | $ | 246,778 | | | $ | 150,953 | |
Total assets | | 836,843 | | | | 917,464 | | | | | 981,427 | | | | 1,973,254 | | | | 2,906,003 | | | | 3,168,494 | |
Current portion of long-term debt (1) | | — | | | | — | | | | | — | | | | 1,622,904 | | | | — | | | | — | |
Long-term debt (1) | | 294,000 | | | | 376,000 | | | | | 430,000 | | | | — | | | | 2,000,579 | | | | 1,574,147 | |
Total equity | | 416,558 | | | | 393,933 | | | | | 390,140 | | | | 99,489 | | | | 645,492 | | | | 1,296,314 | |
(1) | Due to the existing and anticipated financial covenant violations at December 31, 2016, the borrowings under the Predecessor’s revolving credit facility and the Predecessor’s 7.625% senior notes due May 2021 and 6.875% senior notes due August 2022 were classified as current at December 31, 2016. There were no existing or anticipated financial covenant violations as of December 31, 2018 and 2017, respectively. |
47
ITEM 7. | MANAGEMENT’S DISCUSSION AND ANALYSIS OF FINANCIAL CONDITION AND RESULTS OF OPERATIONS |
Management’s Discussion and Analysis of Financial Condition and Results of Operations should be read in conjunction with the financial statements and related notes in “Item 8. Financial Statements and Supplementary Data” contained herein. The following discussion contains forward-looking statements that reflect our future plans, estimates, beliefs and expected performance. The forward-looking statements are dependent upon events, risks and uncertainties that may be outside our control. Our actual results could differ materially from those discussed in these forward-looking statements. Factors that could cause or contribute to such differences are discussed in “Risk Factors” contained in Part I, Item 1A. of this report. In light of these risks, uncertainties and assumptions, the forward-looking events discussed may not occur. See “Forward-Looking Statements” in the front of this annual report.
References
When referring to Amplify Energy Corp. (also referred to as “Successor,” “Amplify Energy,” or the “Company”), the intent is to refer to Amplify Energy, a Delaware corporation, and its consolidated subsidiaries as a whole or on an individual basis, depending on the context in which the statements are made. Amplify Energy is the successor reporting company of Memorial Production Partners LP (“MEMP”) pursuant to Rule 15d-5 of the Securities Exchange Act of 1934, as amended (the “Exchange Act”). When referring to the “Predecessor” or the “Company” in reference to the period prior to the emergence from bankruptcy, the intent is to refer to MEMP, the predecessor that was dissolved following the effective date of the Plan and its consolidated subsidiaries as a whole or on an individual basis, depending on the context in which the statements are made.
Overview
We operate in one reportable segment engaged in the acquisition, development, exploitation and production of oil and natural gas properties. Our management evaluates performance based on the reportable business segment as the economic environments are not different within the operation of our oil and natural gas properties. Our business activities are conducted through OLLC, our wholly owned subsidiary, and its wholly owned subsidiaries. Our assets consist primarily of producing oil and natural gas properties located in the Rockies, federal waters offshore Southern California, East Texas / North Louisiana and South Texas. Most of our oil and natural gas properties are located in large, mature oil and natural gas reservoirs. The Company’s properties consist primarily of operated and non-operated working interests in producing and undeveloped leasehold acreage and working interests in identified producing wells. As of December 31, 2018:
| • | Our total estimated proved reserves were approximately 841.1 Bcfe, of which approximately 50% were oil and 79% were classified as proved developed reserves; |
| • | We produced from 2,068 gross (1,125 net) producing wells across our properties, with an average working interest of 54%, and the Company is the operator of record of the properties containing 92% of our total estimated proved reserves; and |
| • | Our average net production for the three months ended December 31, 2018 was 142.5 MMcfe/d, implying a reserve-to-production ratio of approximately 16 years. |
Recent Developments
Share Repurchase Program
On December 21, 2018, the Company’s board of directors authorized the repurchase of up to $25.0 million of the Company’s outstanding shares of common stock, with such repurchases to begin on or after January 9, 2019 (in accordance with the SEC’s regulations regarding issuer tender offers). In January and February 2019, the Company repurchased 42,583 shares of common stock at an average price of $8.63 for a total cost of approximately $0.4 million. At February 28, 2019, approximately $24.6 million remains available for share repurchases under the program.
Any share repurchases are subject to restrictions in the Company’s New Revolving Credit Facility (as defined below).
Tender Offer
On November 19, 2018, the Company’s board of directors announced the commencement of a tender offer to purchase up to 2,916,667 shares of the Company’s common stock. On December 19, 2018, upon the terms and subject to the conditions described in the Offer to Purchase dated November 19, 2018, as amended, the Company repurchased an aggregate of 2,916,667 shares of common stock at a price of $12.00 per share for a total cost of approximately $35.0 million (excluding fees and expenses relating to the tender offer).
48
New Revolving Credit Facility
On November 2, 2018, OLLC and Amplify Acquisitionco, Inc., our wholly owned subsidiaries, entered into a credit agreement (the “New Credit Agreement”) providing for a new $425.0 million reserve-based revolving credit facility (the “New Revolving Credit Facility”) with Bank of Montreal, as administrative agent and an issuer of letters of credit, and the other lenders and agents from time to time party thereto. The New Revolving Credit Facility matures on November 2, 2023.
The New Revolving Credit Facility is subject to a borrowing base with maximum loan value to be assigned to the PV-9 attributable to our oil and gas properties. The initial borrowing base is $425.0 million. The first scheduled redetermination will take place on or about April 1, 2019. The borrowing base will be redetermined semiannually on or around April 1st and October 1st, with one interim “wildcard” redetermination available between scheduled redeterminations.
See Note 11 of the Notes to the Consolidated Financial Statements included under “Item 8. Financial Statements and Supplementary Data” of this annual report for additional information.
Beta Decommissioning Trust Account
In October 2018, the Company received approximately $61.5 million from the trust account (the “Beta Decommissioning Trust Account”). In November 2018, the Company received an additional $1.0 million from the Beta Decommissioning Trust Account that had been withheld from the initial payment on October 5, 2018. The cash released to the Company’s balance sheet was made pursuant to an order of the Bankruptcy Court dated February 9, 2018, which allowed for the release of Beta cash subject to certain conditions that have since been satisfied. Following the cash release, Beta’s decommissioning obligations remain fully supported by A-rated surety bonds and $90 million of cash.
See Note 17 of the Notes to the Consolidated Financial Statements included under “Item 8. Financial Statements and Supplementary Data” of this annual report for additional information.
Predecessor and Successor Reporting
As a result of the application of fresh start accounting upon the emergence from bankruptcy, the Company’s Consolidated Financial Statements and certain note presentations are separated into two distinct periods, the period before the Effective Date (labeled Predecessor) and the period after that date (labeled Successor), to indicate the application of different basis of accounting between the periods presented. Despite this separate presentation, there was continuity of the Company’s operations.
See Note 3 of the Notes to Consolidated Financial Statements included under “Item 8. Financial Statements and Supplementary Data” for additional information related to our adoption of fresh start accounting.
Business Environment and Operational Focus
We use a variety of financial and operational metrics to assess the performance of our oil and natural gas operations, including: (i) production volumes; (ii) realized prices on the sale of our production; (iii) cash settlements on our commodity derivatives; (iv) lease operating expense; (v) gathering, processing and transportation; (vi) general and administrative expense; and (vii) Adjusted EBITDA.
Production Volumes
Production volumes directly impact our results of operations. For more information about our volumes, see “— Results of Operations” below.
Realized Prices on the Sale of Oil and Natural Gas
We market our oil and natural gas production to a variety of purchasers based on regional pricing. The relative prices of oil and natural gas are determined by the factors impacting global and regional supply and demand dynamics, such as economic conditions, production levels, weather cycles and other events. In addition, realized prices are heavily influenced by product quality and location relative to consuming and refining markets.
Natural Gas. The NYMEX-Henry Hub future price of natural gas is a widely used benchmark for the pricing of natural gas in the United States. The actual prices realized from the sale of natural gas can differ from the quoted NYMEX-Henry Hub price as a result of quality and location differentials. Quality differentials to NYMEX-Henry Hub prices result from: (1) the Btu content of natural gas, which measures its heating value, and (2) the percentage of sulfur, CO2 and other inert content by volume. Natural gas with a high Btu content (“wet” natural gas) sells at a premium to natural gas with low Btu content (“dry” natural gas) because it yields a greater quantity of NGLs. Natural gas with low sulfur and CO2 content sells at a premium to natural gas with high sulfur and CO2 content because of the added cost required to separate the sulfur and CO2 from the natural gas to render it marketable. Wet natural gas may be processed in third-party natural gas plants, where residue natural gas as well as NGLs are recovered and sold. At the wellhead, our natural gas production typically has an average energy content greater than 1,000 Btu and minimal sulfur and CO2 content and generally receives a premium valuation. The dry natural gas residue from our properties is generally sold based on index prices in the region from which it is produced.
49
Location differentials to NYMEX-Henry Hub prices result from variances in transportation costs based on the produced natural gas’ proximity to the major consuming markets to which it is ultimately delivered. Historically, these index prices have generally been at a discount to NYMEX-Henry Hub natural gas prices.
Oil. The NYMEX-WTI futures price is a widely used benchmark in the pricing of domestic and imported oil in the United States. The ICE Brent futures price is a widely used global price benchmark for oil. The actual prices realized from the sale of oil can differ from the quoted NYMEX-WTI price as a result of quality and location differentials. Quality differentials result from the fact that crude oils differ from one another in their molecular makeup, which plays an important part in their refining and subsequent sale as petroleum products. Among other things, there are two characteristics that commonly drive quality differentials: (1) the oil’s American Petroleum Institute (“API”) gravity and (2) the oil’s percentage of sulfur content by weight. In general, lighter oil (with higher API gravity) produces a larger number of lighter products, such as gasoline, which have higher resale value and, therefore, normally sells at a higher price than heavier oil. Oil with low sulfur content (“sweet” oil) is less expensive to refine and, as a result, normally sells at a higher price than high sulfur-content oil (“sour” oil).
Location differentials result from variances in transportation costs based on the produced oil’s proximity to the major consuming and refining markets to which it is ultimately delivered. Oil that is produced close to major consuming and refining markets, such as near Cushing, Oklahoma, is in higher demand as compared to oil that is produced farther from such markets. Consequently, oil that is produced close to major consuming and refining markets normally realizes a higher price (i.e., a lower location differential).
The oil produced from our onshore properties is a combination of sweet and sour oil, varying by location. This oil is typically sold at the NYMEX-WTI price, adjusted for quality and transportation differential, depending primarily on location and purchaser. The oil produced from our Beta properties is heavy and sour oil. Oil produced from our Beta properties is currently sold based on refiners’ posted prices for California Midway-Sunset deliveries in Southern California, adjusted primarily for quality and a negotiated market differential.
Price Volatility. In the past, oil and natural gas prices have been extremely volatile, and we expect this volatility to continue. The following table shows the low and high commodity future index prices for the periods indicated:
| High | | | Low | |
For the Year Ended December 31, 2018: | | | | | | | |
NYMEX-WTI oil future price range per Bbl | $ | 76.41 | | | $ | 42.53 | |
NYMEX-Henry Hub natural gas future price range per MMBtu | $ | 6.88 | | | $ | 2.48 | |
ICE Brent oil future price range per Bbl | $ | 86.29 | | | $ | 50.47 | |
| | | | | | | |
For the Five Years Ended December 31, 2018: | | | | | | | |
NYMEX-WTI oil future price range per Bbl | $ | 107.26 | | | $ | 26.21 | |
NYMEX-Henry Hub natural gas future price range per MMBtu | $ | 7.94 | | | $ | 1.49 | |
ICE Brent oil future price range per Bbl | $ | 115.06 | | | $ | 27.88 | |
Commodity Derivative Contracts. Our hedging activities are intended to support oil, natural gas and NGL prices at targeted levels and to manage our exposure to commodity price fluctuations. See “Item 7A. Quantitative and Qualitative Disclosures About Market Risk” for additional information. We intend to enter into commodity derivative contracts at times and on terms desired to maintain a portfolio of commodity derivative contracts covering at least 25% - 50% of our estimated production from proved developed producing reserves over a one-to-three year period at any given point of time to satisfy the hedging covenants in our New Revolving Credit Facility and pursuant to our internal policies. We may, however, from time to time hedge more or less than this approximate range. Additionally, we may take advantage of opportunities to modify our commodity derivative portfolio to change the percentage of our hedged production volumes when circumstances suggest that it is prudent to do so. The current market conditions may also impact our ability to enter into future commodity derivative contracts.
Principal Components of Cost Structure
| • | Lease operating expense. These are the day to day costs incurred to maintain production of our natural gas, NGLs and oil. Such costs include utilities, direct labor, water injection and disposal, the cost of CO2 injection, chemicals, materials and supplies, compression, repairs and workover expenses. Cost levels for these expenses can vary based on supply and demand for oilfield services and activities performed during a specific period. |
| • | Gathering, processing and transportation. These are costs incurred to deliver production of our natural gas, NGLs and oil to the market. Cost levels of these expenses can vary based on the volume of natural gas, NGLs and oil production. |
| • | Exploration expense. These are geological and geophysical costs and include certain seismic costs, costs of unsuccessful exploratory dry holes and unsuccessful leasing efforts. Exploration expense also include rig contract termination fees. |
50
| • | Taxes other than income. These consist of production, ad valorem and franchise taxes. Production taxes are paid on produced natural gas, NGLs and oil based on a percentage of market prices and at fixed per unit rates established by federal, state or local taxing authorities. We take advantage of credits and exemptions in the various taxing jurisdictions where we operate. Ad valorem taxes are generally tied to the valuation of the oil and natural gas properties. Franchise taxes are privilege taxes levied by states that are imposed on companies, including limited liability companies and partnerships, which gives the businesses the right to be chartered or operate within that state. |
| • | Depreciation, depletion and amortization. Depreciation, depletion and amortization (“DD&A”) includes the systematic expensing of the capitalized costs incurred to acquire, exploit and develop oil and natural gas properties. As a “successful efforts” company, all costs associated with acquisition and development efforts and all successful exploration efforts are capitalized, and these costs are depleted using the units of production method. |
| • | Impairment of proved oil and natural gas properties. Proved properties are impaired whenever the net carrying value of the properties exceed their estimated undiscounted future cash flows. |
| • | General and administrative expense. These costs include overhead, including payroll and benefits for employees, costs of maintaining headquarters, costs of managing production and development operations, compensation expense associated with certain long-term incentive-based plans, audit and other professional fees and legal compliance expenses. |
Prior to June 1, 2016, Memorial Resource provided management, administrative and operating services to the Predecessor and the Predecessor’s general partner pursuant to our Predecessor’s Omnibus Agreement. Upon completion of the MEMP GP Acquisition (as defined in Note 1 of the Notes to Consolidated Financial Statements included under “Item 8. Financial Statement and Supplementary Data”), the Predecessor’s Omnibus Agreement was terminated on June 1, 2016 and the Predecessor entered into a transition services agreement with Memorial Resource to manage certain post-closing separation costs and activities. See Note 1 and Note 16 of the Notes to Consolidated Financial Statements included under “Item 8. Financial Statements and Supplementary Data.”
| • | Accretion expense. Accretion expense is recognized over time as the discounted liabilities are accreted to their expected settlement value. |
| • | Interest expense. Historically, we financed a portion of our working capital requirements, capital development and acquisitions with borrowings under our New Revolving Credit Facility, our Emergence Credit Facility, our Predecessor’s revolving credit facility and the Predecessor’s senior note issuances. As a result, we incur substantial interest expense that is affected by both fluctuations in interest rates and financing decisions. We expect to continue to incur significant interest expense. |
| • | Income tax expense. We are a corporation subject to federal and certain state income taxes. Our Predecessor was organized as a pass-through entity for federal and most state income tax purposes. During the period from January 1, 2017 through May 4, 2017 and the year ended December 31, 2016, certain of our consolidated subsidiaries were taxed as corporations for federal and state income tax purposes. We are subject to the Texas margin tax for activities in the State of Texas. |
Outlook
Based on our current plans, our capital expenditure program for the full year 2019 is expected to be approximately $55.0 to $65.0 million. The charts below detail the allocation of capital across our asset base and by investment type based on the midpoint of our 2019 capital expenditure range. The amounts noted below are in millions:
51
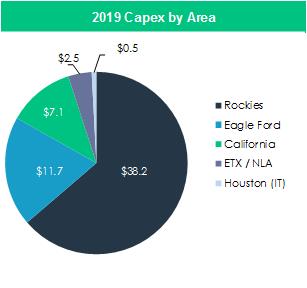
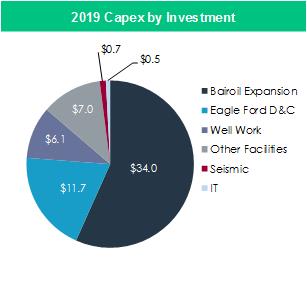
As has been our historical practice, we will periodically review our capital expenditures throughout the year and may adjust the budget based on commodity prices, drilling success and other factors. We anticipate funding our 2019 capital program from internally generated cash flow. Borrowings under our New Revolving Credit Facility and/or debt or equity financings may provide incremental financial flexibility.
Beginning in 2019, the Company has elected to change its reporting convention from natural gas equivalent (Mcfe) to oil equivalent (Boe). This change in presentation reflects the Company’s increasing focus on its liquids-weighted production and development in its Rockies and California operations, as well as the Company’s liquids-dominated proved reserves as of year-end 2018, of which 50% were crude oil, 15% were natural gas liquids and 35% were natural gas.
Critical Accounting Policies and Estimates
Fresh Start Accounting
Upon the Effective Date, we adopted fresh start accounting as required by GAAP. We met the requirements of fresh start accounting, which include: (i) the holders of the Predecessor’s voting common units immediately prior to the Effective Date received less than 50% of the voting shares of the Company and (ii) the reorganization value of our assets immediately prior to the Effective Date was less than the post-petition liabilities and allowed claims. Fresh start accounting involved a comprehensive valuation process in which we determined the fair value of all of our assets and liabilities on the Effective Date. See Note 3 of the Notes to Consolidated Financial Statements included under “Item 8. Financial Statements and Supplementary Data” for additional information related to our adoption of fresh start accounting.
Use of Estimates
The preparation of Consolidated Financial Statements in conformity with GAAP requires management to make estimates and assumptions that affect the reported amounts of assets and liabilities and disclosure of contingent assets and liabilities at the date of the Consolidated Financial Statements and the reported amounts of revenues and expenses during the reporting period. Actual results could differ from those estimates.
Significant estimates include, but are not limited to, oil and natural gas reserves; depreciation, depletion and amortization of proved oil and natural gas properties; future cash flows from oil and natural gas properties; impairment of long-lived assets; fair value of derivatives; fair value of equity compensation; fair values of assets acquired and liabilities assumed in business combinations and asset retirement obligations.
Oil and Natural Gas Properties
Oil and natural gas exploration, development and production activities are accounted for in accordance with the successful efforts method of accounting. Under this method, costs of acquiring properties, costs of drilling successful exploration wells and development costs are capitalized. The costs of exploratory wells are initially capitalized pending a determination of whether proved reserves have been found. At the completion of drilling activities, the costs of exploratory wells remain capitalized if a determination is made that proved reserves have been found. If no proved reserves have been found, the costs of each of the related exploratory wells are charged to expense. In some cases, a determination of proved reserves cannot be made at the completion of drilling, requiring additional testing and evaluation of the wells. The costs of such exploratory wells are expensed if a determination of proved reserves has not been made within a twelve-month period after drilling is complete. Exploration costs such as geological, geophysical, and seismic costs attributable to unproved locations are expensed as incurred.
52
As exploration and development work progresses and the reserves on these properties are proven, capitalized costs attributed to the properties are subject to depreciation and depletion. Depletion of capitalized costs is provided using the units-of-production method based on proved oil and gas reserves related to the associated field. Capitalized drilling and development costs of producing oil and natural gas properties are depleted over proved developed reserves and leasehold costs are depleted over total proved reserves. Support equipment and facilities, which are primarily related to our Rockies and California assets, are depreciated using the straight-line method generally based on estimated useful lives of fifteen to forty years.
On the sale or retirement of a complete or partial unit of a proved property or pipeline and related facilities, the cost and related accumulated depreciation, depletion, and amortization are eliminated from the property accounts, and any gain or loss is recognized.
Oil and Natural Gas Reserves
The estimates of proved oil and natural gas reserves utilized in the preparation of the Consolidated Financial Statements are estimated in accordance with the rules established by the SEC and the FASB. These rules require that reserve estimates be prepared under existing economic and operating conditions using a trailing 12-month average price with no provision for price and cost escalations in future years except by contractual arrangements. We engaged Ryder Scott, our independent reserve engineers, to audit our internally prepared reserves estimates for all of our estimated proved reserves (by volume) at December 31, 2018.
Reserve estimates are inherently imprecise. Accordingly, the estimates are expected to change as more current information becomes available. It is possible that, because of changes in market conditions or the inherent imprecision of reserve estimates, the estimates of future cash inflows, future gross revenues, the amount of oil and natural gas reserves, the remaining estimated lives of oil and natural gas properties, or any combination of the above may be increased or decreased. Increases in recoverable economic volumes generally reduce per unit depletion rates while decreases in recoverable economic volumes generally increase per unit depletion rates.
Impairments
Proved oil and natural gas properties are reviewed for impairment when events and circumstances indicate the carrying value of such properties may not be recoverable. This may be due to a downward revision of the reserve estimates, less than expected production or drilling results, higher operating and development costs, or lower commodity prices. The estimated undiscounted future cash flows expected in connection with the property are compared to the carrying value of the property to determine if the carrying amount is recoverable. If the carrying value of the property exceeds its estimated undiscounted future cash flows, the carrying amount of the property is reduced to its estimated fair value using Level 3 inputs. The factors used to determine fair value include, but are not limited to, estimates of proved and probable reserves, future commodity prices, the timing of future production and capital expenditures and a discount rate commensurate with the risk reflective of the lives remaining for the respective oil and gas properties.
Unproved oil and natural gas properties are reviewed for impairment based on time or geologic factors. Information such as drilling results, reservoir performance, seismic interpretation or future plans to develop acreage is also considered. When unproved property investments are deemed to be impaired, the expense is reported in exploration expenses.
Asset Retirement Obligations
An asset retirement obligation associated with retiring long-lived assets is recognized as a liability on a discounted basis in the period in which the legal obligation is incurred and becomes determinable, with an equal amount capitalized as an addition to oil and natural gas properties, which is allocated to expense over the useful life of the asset. Generally, oil and gas producing companies incur such a liability upon acquiring or drilling a well. Accretion expense is recognized over time as the discounted liabilities are accreted to their expected settlement value. Upon settlement of the liability, a gain or loss is recognized in net income (loss) to the extent the actual costs differ from the recorded liability.
Revenue Recognition
Revenue from the sale of oil and natural gas is recognized when title passes, net of royalties due to third parties. Oil and natural gas revenues are recorded using the sales method. Under this method, revenues are recognized based on actual volumes of oil and natural gas sold to purchasers, regardless of whether the sales are proportionate to our ownership in the property. An asset or a liability is recognized to the extent there is an imbalance in excess of the proportionate share of the remaining recoverable reserves on the underlying properties.
Derivative Instruments
Commodity derivative financial instruments (e.g., swaps, collars and puts) are used to reduce the impact of natural gas and oil price fluctuations. Every derivative instrument is recorded in the balance sheet as either an asset or liability measured at its fair value. Changes in the derivative’s fair value are recognized currently in earnings as we have not elected hedge accounting for any of our derivative positions.
53
Results of Operations
The results of operations for the year ended December 31, 2018, the period from May 5, 2017 through December 31, 2017, the period from January 1, 2017 through May 4, 2017, and the year ended December 31, 2016 have been derived from our consolidated financial statements.
Factors Affecting the Comparability of the Historical Financial Results
The comparability of the results of operations among the periods presented is impacted by the following significant transactions:
| • | The sale of assets located in the Permian Basin (the “Permian Divestiture”) in June 2016 for approximately $36.7 million; |
| • | The sale of assets located in Colorado and Wyoming (the “Rockies Divestiture”) in July 2016 for approximately $16.4 million; and |
| • | The sale of non-core assets located in South Texas (the “South Texas Divestiture”) in May 2018 for approximately $17.1 million. |
In addition, the comparability of the results of operations among the periods presented below is impacted by the application of fresh start accounting upon the emergence from bankruptcy. The Company’s Consolidated Financial Statements are separated into two distinct periods, the period before the Effective Date (labeled Predecessor) and the period after that date (labeled Successor), to indicate the application of different basis of accounting between the periods presented.
As a result of the factors listed above, the historical results of operations and period-to-period comparisons of these results and certain financial data may not be comparable or indicative of future results.
54
The table below summarizes certain of the results of operations and period-to-period comparisons for the periods indicated.
| Successor | | | | Predecessor | |
| For the | | | Period from | | | | Period from | | | For the | |
| Year Ended | | | May 5, 2017 | | | | January 1, 2017 | | | Year Ended | |
| December 31, | | | through | | | | through | | | December 31, | |
| 2018 | | | December 31, 2017 | | | | May 4, 2017 | | | 2016 | |
| ($ In thousands) | | | | ($ In thousands) | |
Oil and natural gas sales | $ | 339,840 | | | $ | 205,176 | | | | $ | 108,970 | | | $ | 284,051 | |
Lease operating expense | | 114,405 | | | | 74,547 | | | | | 35,568 | | | | 126,175 | |
Gathering, processing and transportation | | 23,231 | | | | 18,652 | | | | | 10,772 | | | | 34,979 | |
Exploration expense | | 3,045 | | | | 32 | | | | | 21 | | | | — | |
Taxes other than income | | 20,364 | | | | 11,101 | | | | | 5,187 | | | | 15,540 | |
Depreciation, depletion and amortization | | 52,334 | | | | 35,979 | | | | | 37,717 | | | | 171,629 | |
Impairment of proved oil and natural gas properties | | — | | | | — | | | | | — | | | | 183,437 | |
General and administrative expense | | 43,129 | | | | 29,506 | | | | | 31,606 | | | | 63,280 | |
Accretion of asset retirement obligations | | 5,711 | | | | 4,384 | | | | | 3,407 | | | | 10,231 | |
(Gain) loss on commodity derivative instruments | | (8,155 | ) | | | 31,609 | | | | | (23,076 | ) | | | 117,105 | |
(Gain) loss on sale of properties | | 3,614 | | | | — | | | | | — | | | | (2,754 | ) |
Interest expense, net | | (21,923 | ) | | | (15,936 | ) | | | | (10,243 | ) | | | (146,031 | ) |
Other income (expense) | | 190 | | | | 16,981 | | | | | 8 | | | | 8 | |
Gain (loss) on extinguishment of debt | | (3,034 | ) | | | — | | | | | — | | | | 42,337 | |
Reorganization items, net | | (2,147 | ) | | | (1,119 | ) | | | | (88,774 | ) | | | — | |
Income tax benefit (expense) | | — | | | | 2,176 | | | | | 91 | | | | (173 | ) |
Net income (loss) | | 54,609 | | | | 1,286 | | | | | (90,955 | ) | | | (540,398 | ) |
| | | | | | | | | | | | | | | | |
Oil and natural gas revenue: | | | | | | | | | | | | | | | | |
Oil sales | $ | 209,066 | | | $ | 112,123 | | | | $ | 55,767 | | | $ | 143,456 | |
NGL sales | | 42,463 | | | | 26,817 | | | | | 14,103 | | | | 33,137 | |
Natural gas sales | | 88,311 | | | | 66,236 | | | | | 39,100 | | | | 107,458 | |
Total oil and natural gas revenue | $ | 339,840 | | | $ | 205,176 | | | | $ | 108,970 | | | $ | 284,051 | |
| | | | | | | | | | | | | | | | |
Production volumes: | | | | | | | | | | | | | | | | |
Oil (MBbls) | | 3,335 | | | | 2,380 | | | | | 1,204 | | | | 3,883 | |
NGLs (MBbls) | | 1,496 | | | | 1,114 | | | | | 616 | | | | 2,286 | |
Natural gas (MMcf) | | 29,176 | | | | 21,885 | | | | | 12,411 | | | | 44,776 | |
Total (MMcfe) | | 58,166 | | | | 42,850 | | | | | 23,336 | | | | 81,773 | |
Average net production (MMcfe/d) | | 159.4 | | | | 177.8 | | | | | 188.2 | | | | 223.4 | |
| | | | | | | | | | | | | | | | |
Average sales price: | | | | | | | | | | | | | | | | |
Oil (per Bbl) | $ | 62.68 | | | $ | 47.11 | | | | $ | 46.28 | | | $ | 36.94 | |
NGL (per Bbl) | | 28.38 | | | | 24.07 | | | | | 22.90 | | | | 14.52 | |
Natural gas (per Mcf) | | 3.03 | | | | 3.03 | | | | | 3.15 | | | | 2.40 | |
Total (per Mcfe) | $ | 5.84 | | | $ | 4.79 | | | | $ | 4.67 | | | $ | 3.47 | |
| | | | | | | | | | | | | | | | |
Average unit costs per Mcfe: | | | | | | | | | | | | | | | | |
Lease operating expense | $ | 1.97 | | | $ | 1.74 | | | | $ | 1.52 | | | $ | 1.54 | |
Gathering, processing and transportation | | 0.40 | | | | 0.44 | | | | | 0.46 | | | | 0.43 | |
Taxes other than income | | 0.35 | | | | 0.26 | | | | | 0.22 | | | | 0.19 | |
General and administrative expense | | 0.74 | | | | 0.69 | | | | | 1.35 | | | | 0.77 | |
Depletion, depreciation and amortization | | 0.90 | | | | 0.84 | | | | | 1.62 | | | | 2.10 | |
For the year ended December 31, 2018, the period from May 5, 2017 through December 31, 2017 and the period from January 1, 2017 through May 4, 2017
Net income of $54.6 million, net income of $1.3 million and a net loss of $91.0 million was recorded for the year ended December 31, 2018, the period from May 5, 2017 through December 31, 2017 and the period from January 1, 2017 through May 4, 2017, respectively.
Oil, natural gas and NGL revenues were $339.8 million, $205.2 million and $109.0 million for the year ended December 31, 2018, the period from May 5, 2017 through December 31, 2017 and the period from January 1, 2017 through May 4, 2017, respectively. Average net production volumes were approximately 159.4 MMcfe/d, 177.8 MMcfe/d and 188.2 MMcfe/d for the year ended December 31, 2018, the period from May 5, 2017 through December 31, 2017 and the period from January 1, 2017 to May 4, 2017, respectively. The change in production volumes was primarily related to decreases in drilling activities and the South Texas Divestiture. The average realized sales price was $5.84 per Mcfe, $4.79 per Mcfe and $4.67 per Mcfe for the year ended December 31, 2018, the period from May 5, 2017 through December 31, 2017 and the period from January 1, 2017 through May 4, 2017, respectively. The change in the average realized sales price was primarily due to increases in realized prices for oil, natural gas and NGLs.
55
Lease operating expense was $114.4 million, $74.5 million and $35.6 million for the year ended December 31, 2018, the period from May 5, 2017 through December 31, 2017 and the period from January 1, 2017 through May 4, 2017, respectively. The change in lease operating expense was the result of increased workover activity and the South Texas Divestiture. On a per Mcfe basis, lease operating expense was $1.97, $1.74 and $1.52 for the year ended December 31, 2018, the period from May 5, 2017 through December 31, 2017 and the period from January 1, 2017 through May 4, 2017, respectively. The change in lease operating expense on a per Mcfe basis was primarily related to increased workover activity.
Gathering, processing and transportation expenses were $23.2 million, $18.7 million and $10.8 million for the year ended December 31, 2018, the period from May 5, 2017 through December 31, 2017 and the period from January 1, 2017 through May 4, 2017, respectively. The change in gathering, processing and transportation expenses was primarily due to lower production and the impact of the new accounting standard related to revenue from contracts with customers adopted on January 1, 2018. On a per Mcfe basis, gathering, processing and transportation expenses were $0.40, $0.44 and $0.46 for the year ended December 31, 2018, the period from May 5, 2017 through December 31, 2017 and the period from January 1, 2017 through May 4, 2017, respectively.
Taxes other than income was $20.4 million, $11.1 million and $5.2 million for the year ended December 31, 2018, the period from May 5, 2017 through December 31, 2017 and the period from January 1, 2017 through May 4, 2017, respectively. On a per Mcfe basis, taxes other than income were $0.35, $0.26 and $0.22 for the year ended December 31, 2018, the period from May 5, 2017 through December 31, 2017 and the period from January 1, 2017 through May 4, 2017, respectively. The change in taxes other than income on a per Mcfe basis was primarily due to an increase in commodity prices.
DD&A expense was $52.3 million, $36.0 million and $37.7 million for the year ended December 31, 2018, the period from May 5, 2017 through December 31, 2017 and the period from January 1, 2017 through May 4, 2017, respectively. The change in DD&A expense was primarily due to a decrease in production volumes and the South Texas Divestiture, which closed on May 30, 2018. The assets were accounted for as assets held for sale for the period from March 31, 2018 through the closing date.
No impairment was recognized for the year ended December 31, 2018, the period from May 5, 2017 through December 31, 2017 and the period from January 1, 2017 through May 4, 2017.
General and administrative expense was $43.1 million, $29.5 million and $31.6 million for the year ended December 31, 2018, the period from May 5, 2017 through December 31, 2017 and the period from January 1, 2017 through May 4, 2017, respectively. General and administrative expense includes $7.5 million in severance payments to departing executives during the year ended December 31, 2018. Non-cash share/unit-based compensation expense was approximately $4.2 million, $2.5 million, and $3.7 million for the year ended December 31, 2018, the period from May 5, 2017 through December 31, 2017 and the period from January 1, 2017 through May 4, 2017, respectively. The year ended December 31, 2018 includes a $1.7 million reduction in non-cash share/unit-based compensation expenses related to the impact of management separation and retirement agreements for departing executives, TSUs and restricted stock options. The period from January 1, 2017 through May 4, 2017 includes $2.3 million of non-cash share/unit-based compensation expense related to the cancellation of the Predecessor’s restricted common units. Additionally, the Company recorded $7.5 million in pre-petition restructuring-related costs primarily for advisory and professional fees for the period from January 1, 2017 through May 4, 2017.
Net gains on commodity derivative instruments of $8.2 million were recognized for the year ended December 31, 2018, consisting of $10.1 million of cash settlements received on expired positions offset by a $1.9 million decrease in the fair value of open positions. Net losses on commodity derivative instruments of $31.6 million were recognized for the period from May 5, 2017 through December 31, 2017, consisting of $30.4 million of cash settlements received on expired positions offset by a $62.0 million decrease in the fair value of open positions. Net gains on commodity derivative instruments of $23.1 million were recognized for January 1, 2017 through May 4, 2017, consisting of $15.9 million of cash settlements received on expired positions and $94.1 million in cash settlements received on terminated derivatives. These receipts were partially offset by an $86.9 million decrease in the fair value of open positions.
Given the volatility of commodity prices, it is not possible to predict future reported unrealized mark-to-market net gains or losses and the actual net gains or losses that will ultimately be realized upon settlement of the hedge positions in future years. If commodity prices at settlement are lower than the prices of the hedge positions, the hedges are expected to mitigate the otherwise negative effect on earnings of lower oil, natural gas and NGL prices. However, if commodity prices at settlement are higher than the prices of the hedge positions, the hedges are expected to dampen the otherwise positive effect on earnings of higher oil, natural gas and NGL prices and will, in this context, be viewed as having resulted in an opportunity cost.
56
Interest expense, net was $21.9 million, $15.9 million and $10.2 million for the year ended December 31, 2018, the period from May 5, 2017 through December 31, 2017 and the period from January 1, 2017 through May 4, 2017, respectively. The change in interest expense was primarily due to the Company not recording interest expense on the Predecessor’s 7.625% senior notes due May 2021 and 6.875% senior notes due August 2022 (collectively, the “Notes”), for the period from the Petition Date through the Effective Date. The Company recorded $3.5 million in interest expense related to the Notes for the period from January 1, 2017 through May 4, 2017. No interest expense was recorded on the Notes for the period from May 5, 2017 through December 31, 2017, as the Notes were cancelled on the Effective Date. The Company recognized $2.5 million and $2.1 million in amortization and write-off of deferred financing cost for the year ended December 31, 2018 and the period from May 5, 2017 through December 31, 2017, respectively. No amortization of deferred financing cost was recorded for the period from January 1, 2017 through May 4, 2017, as the unamortized amount of deferred financing cost was written off in the fourth quarter of 2016.
Average outstanding borrowings under our New Revolving Credit Facility were $294.0 million for the period from November 2, 2018 through December 31, 2018. Average outstanding borrowings under our Emergence Credit Facility was $330.4 million and $406.4 million for the period from January 1, 2018 through November 1, 2018 and the period from May 5, 2017 through December 31, 2017, respectively. Average outstanding borrowings under the Predecessor’s revolving credit facility were $460.2 million for the period from January 1, 2017 through May 4, 2017. We had an average of $1.1 billion aggregate principal amount of the Notes issued and outstanding for the period from January 1, 2017 through May 4, 2017. The Notes were cancelled on the Effective Date.
Reorganization items, net. The Company incurred significant costs associated with the reorganization. Reorganization items, net represents costs and income directly associated with the Chapter 11 proceedings since the Petition Date, such as the gain on settlement of liabilities subject to compromise, fresh start valuation adjustments and professional fees. The Company incurred $2.1 million, $1.1 million and $88.8 million of reorganization items, net for the year ended December 31, 2018, the period from May 5, 2017 through December 31, 2017 and the period from January 1, 2017 through May 4, 2017, respectively. See Note 3 of the Notes to the Consolidated Financial Statements under “Item 8. Financial Statements and Supplementary Data” of this annual report for additional information.
Other income (expense) was $17.0 million for the period from May 5, 2017 through December 31, 2017, primarily related to a $17.0 million gain in connection with the sale of a third-party midstream entity with whom our natural gas gathering and processing agreements entitled us to a percentage of the proceeds in the event of a sale.
For the period from May 5, 2017 through December 31, 2017, the period from January 1, 2017 through May 4, 2017 and the year ended December 31, 2016
Net income of $1.3 million, a net loss of $91.0 million and a net loss of $540.4 million was recorded for the period from May 5, 2017 through December 31, 2017, the period from January 1, 2017 through May 4, 2017 and the year ended December 31, 2016, respectively.
Oil, natural gas and NGL revenues were $205.2 million, $109.0 million and $284.1 million for the period from May 5, 2017 through December 31, 2017, the period from January 1, 2017 through May 4, 2017 and the year ended December 31, 2016, respectively. Average net production volumes were approximately 177.8 MMcfe/d, 188.2 MMcfe/d and 223.4 MMcfe/d for the period from May 5, 2017 through December 31, 2017, the period from January 1, 2017 to May 4, 2017 and the year ended December 31, 2016, respectively. The change in production volumes was primarily related to decreases in drilling activities and divestitures. The average realized sales price was $4.79 per Mcfe, $4.67 per Mcfe and $3.47 per Mcfe for the period from May 5, 2017 through December 31, 2017, the period from January 1, 2017 through May 4, 2017 and the year ended December 31, 2016, respectively. The change in the average realized sales price was primarily due to increases in realized prices for oil, natural gas and NGLs.
Lease operating expense was $74.5 million, $35.6 million and $126.2 million for the period from May 5, 2017 through December 31, 2017, the period from January 1, 2017 through May 4, 2017 and the year ended December 31, 2016, respectively. The change in lease operating expense was the result of decreased workover activity and the Permian Divestiture and Rockies Divestitures. On a per Mcfe basis, lease operating expense was $1.74, $1.52 and $1.54 for the period from May 5, 2017 through December 31, 2017, the period from January 1, 2017 through May 4, 2017 and the year ended December 31, 2016, respectively. The change in lease operating expense on a per Mcfe basis was primarily related to lower production.
Gathering, processing and transportation expenses were $18.7 million, $10.8 million and $35.0 million for the period from May 5, 2017 through December 31, 2017, the period from January 1, 2017 through May 4, 2017 and the year ended December 31, 2016, respectively. The change in gathering, processing and transportation was primarily due to lower production. On a per Mcfe basis, gathering, processing and transportation expenses were $0.44, $0.46 and $0.43 for the period from May 5, 2017 through December 31, 2017, the period from January 1, 2017 through May 4, 2017 and the year ended December 31, 2016, respectively.
Taxes other than income was $11.1 million, $5.2 million and $15.5 million for the period from May 5, 2017 through December 31, 2017, the period from January 1, 2017 through May 4, 2017 and the year ended December 31, 2016, respectively. On a per Mcfe basis, taxes other than income were $0.26, $0.22 and $0.19 for the period from May 5, 2017 through December 31, 2017, the period from January 1, 2017 through May 4, 2017 and the year ended December 31, 2016, respectively. The change in taxes other than income on a per Mcfe basis was primarily due to an increase in commodity prices.
57
DD&A expense was $36.0 million, $37.7 million and $171.6 million for the period from May 5, 2017 through December 31, 2017, the period from January 1, 2017 through May 4, 2017 and the year ended December 31, 2016, respectively. The change in DD&A expense was primarily due to lower rates as a result of the application of fresh start accounting and a decrease in production volumes.
No impairment was recognized for the period from May 5, 2017 through December 31, 2017 and the period from January 1, 2017 through May 4, 2017. We recognized $183.4 million of impairments for the year ended December 31, 2016 related to certain properties in East Texas. The estimated future cash flows expected from these properties were compared to their carrying values and determined to be unrecoverable primarily due to a downward revision of estimated proved reserves as a result of significant declines in commodity prices. For additional information, see Note 7 of the Notes to Consolidated Financial Statements included under “Item 8. Financial Statements and Supplementary Data.”
General and administrative expense was $29.5 million, $31.6 million and $63.3 million for the period from May 5, 2017 through December 31, 2017, the period from January 1, 2017 through May 4, 2017 and the year ended December 31, 2016, respectively. Non-cash share/unit-based compensation expense was approximately $2.5 million, $3.7 million and $7.4 million for the period from May 5, 2017 through December 31, 2017, the period from January 1, 2017 through May 4, 2017 and the year ended December 31, 2016, respectively. Additionally, the Company recorded $7.5 million in pre-petition restructuring-related costs primarily for advisory and professional fees for the period from January 1, 2017 through May 4, 2017.
Net losses on commodity derivative instruments of $31.6 million were recognized for the period from May 5, 2017 through December 31, 2017, consisting of $30.4 million of cash settlements received on expired positions offset by a $62.0 million decrease in the fair value of open positions. Net gains on commodity derivative instruments of $23.1 million were recognized for January 1, 2017 through May 4, 2017, consisting of $15.9 million of cash settlements received on expired positions and $94.1 million in cash settlements received on terminated derivatives. These receipts were partially offset by an $86.9 million decrease in the fair value of open positions. Net losses on commodity derivative instruments of $117.1 million were recognized for the year ended December 31, 2016, consisting of $212.6 million of cash settlements received on expired positions and $230.7 million in cash settlements received on terminated derivatives. These gains were offset by a $560.4 million decrease in the fair value of open positions.
Interest expense, net was $15.9 million, $10.2 million and $146.0 million for the period from May 5, 2017 through December 31, 2017, the period from January 1, 2017 through May 4, 2017 and the year ended December 31, 2016, respectively. The change in interest expense was primarily due to the Company not recording interest expense on the Notes for the period from the Petition Date through the Effective Date. The Company recorded $3.5 million and $84.1 million in interest expense related to the Notes for the period from January 1, 2017 through May 4, 2017 and the year ended December 31, 2016, respectively. No interest expense was recorded on the Notes for the period from May 5, 2017 through December 31, 2017, as the Notes were cancelled on the Effective Date. The Company recognized $2.1 million and $22.1 million in amortization and write-off of deferred financing cost for the period from May 5, 2017 through December 31, 2017 and the year ended December 31, 2016, respectively. No amortization of deferred financing cost was recorded for the period from January 1, 2017 through May 4, 2017, as the unamortized amount of deferred financing cost was written off in the fourth quarter of 2016. The Company recorded $13.2 million of accretion of the Notes discount for the year ended December 31, 2016. No expense was recorded for the period from May 5, 2017 through December 31, 2017 and the period from January 1, 2017 through May 4, 2017, as the unamortized amount of accretion of the Notes discount was written off in the fourth quarter of 2016.
Average outstanding borrowings under our Emergence Credit Facility were $406.4 million for the period from May 5, 2017 through December 31, 2017. Average outstanding borrowings under the Predecessor’s revolving credit facility were $460.2 million and $746.0 million for the period from January 1, 2017 through May 4, 2017 and for the year ended December 31, 2016, respectively. We had an average of $1.1 billion aggregate principal amount of the Notes issued and outstanding for the period from January 1, 2017 through May 4, 2017 and for the year ended December 31, 2016, respectively. The Notes were cancelled on the Effective Date.
Reorganization items, net represents costs and income directly associated with the Chapter 11 proceedings since the Petition Date, such as the gain on settlement of liabilities subject to compromise, fresh start valuation adjustments and professional fees. The Company incurred $1.1 million and $88.8 million of reorganization items, net for the period from May 5, 2017 through December 31, 2017 and the period from January 1, 2017 through May 4, 2017, respectively. See Note 3 of the Notes to the Consolidated Financial Statements under “Item 8. Financial Statements and Supplementary Data” of this annual report for additional information.
Other income (expense) was $17.0 million for the period from May 5, 2017 through December 31, 2017, primarily related to a $17.0 million gain in connection with the sale of a third-party midstream entity with whom our natural gas gathering and processing agreements entitled us to a percentage of the proceeds in the event of a sale.
We recognized a gain on extinguishment of debt of approximately $42.3 million for the year ended December 31, 2016 related to the repurchase of the Notes.
58
Adjusted EBITDA
We include in this report the non-GAAP financial measure Adjusted EBITDA and provide our calculation of Adjusted EBITDA and a reconciliation of Adjusted EBITDA to net cash flow from operating activities, our most directly comparable financial measure calculated and presented in accordance with GAAP. Adjusted EBITDA is a supplemental non-GAAP financial measure that is used by management and external users of our consolidated financial statements, such as industry analysts, investors, lenders and rating agencies. Adjusted EBITDA is not a measure of net income or cash flows as determined by GAAP. We define Adjusted EBITDA as net income (loss):
Plus:
| • | Interest expense, including gains or losses on interest rate derivative contracts; |
| • | Depreciation, depletion and amortization (“DD&A”); |
| • | Impairment of goodwill and long-lived assets (including oil and natural gas properties); |
| • | Accretion of asset retirement obligations (“AROs”); |
| • | Loss on commodity derivative instruments; |
| • | Cash settlements received on expired commodity derivative instruments; |
| • | Losses on sale of assets and other, net; |
| • | Share/unit-based compensation expenses; |
| • | Acquisition and divestiture related expenses; |
| • | Amortization of gain associated with terminated commodity derivatives; |
| • | Restructuring related costs; |
| • | Reorganization items, net; |
| • | Other non-routine items that we deem appropriate. |
Less:
| • | Gain on extinguishment of debt |
| • | Gain on expired commodity derivative instruments; |
| • | Cash settlements paid on expired commodity derivative instruments; |
| • | Gains on sale of assets and other, net; and |
| • | Other non-routine items that we deem appropriate. |
We are required to comply with certain Adjusted EBITDA-related metrics under our New Revolving Credit Facility.
59
We believe that Adjusted EBITDA is useful because it allows us to more effectively evaluate our operating performance and compare the results of our operations from period to period without regard to our financing methods or capital structure.
Adjusted EBITDA should not be considered as an alternative to, or more meaningful than, net income or cash flows from operating activities as determined in accordance with GAAP or as an indicator of our operating performance or liquidity. Certain items excluded from Adjusted EBITDA are significant components in understanding and assessing a company's financial performance, such as a company's cost of capital and tax structure, as well as the historic costs of depreciable assets, none of which are components of Adjusted EBITDA. Our computations of Adjusted EBITDA may not be comparable to other similarly titled measures of other companies. We believe that Adjusted EBITDA is a widely followed measure of operating performance and may also be used by investors to measure our ability to meet debt service requirements.
In addition, management uses Adjusted EBITDA to evaluate actual cash flow, develop existing reserves or acquire additional oil and natural gas properties.
The following tables present our calculation of Adjusted EBITDA as well as a reconciliation of Adjusted EBITDA to cash flows from operating activities, our most directly comparable GAAP financial measure, for each of the periods indicated.
Calculation of Adjusted EBITDA
| Successor | | | | Predecessor | |
| For the | | | Period from | | | | Period from | | | For the | |
| Year Ended | | | May 5, 2017 | | | | January 1, 2017 | | | Year Ended | |
| December 31, | | | through | | | | through | | | December 31, | |
| 2018 | | | December 31, 2017 | | | | May 4, 2017 | | | 2016 | |
| (In thousands) | | | | (In thousands) | |
Net income (loss) | $ | 54,609 | | | $ | 1,286 | | | | $ | (90,955 | ) | | $ | (540,398 | ) |
Interest expense, net | | 21,923 | | | | 15,936 | | | | | 10,243 | | | | 146,031 | |
Gain (loss) on extinguishment of debt | | 3,034 | | | | — | | | | | — | | | | (42,337 | ) |
Income tax expense (benefit) | | — | | | | (2,176 | ) | | | | (91 | ) | | | 173 | |
DD&A | | 52,334 | | | | 35,979 | | | | | 37,717 | | | | 171,629 | |
Impairment of proved oil and gas properties | | — | | | | — | | | | | — | | | | 183,437 | |
Accretion of AROs | | 5,711 | | | | 4,384 | | | | | 3,407 | | | | 10,231 | |
(Gains) losses on commodity derivative instruments | | (8,155 | ) | | | 31,609 | | | | | (23,076 | ) | | | 117,105 | |
Cash settlements received (paid) on expired commodity derivative instruments | | 10,087 | | | | 30,445 | | | | | 15,895 | | | | 212,566 | |
Amortization of gain associated with terminated commodity derivatives | | — | | | | — | | | | | — | | | | 42,236 | |
(Gain) loss on sale of properties | | 3,614 | | | | — | | | | | — | | | | (2,754 | ) |
Acquisition and divestiture related expenses | | 205 | | | | 609 | | | | | — | | | | 1,451 | |
Share/Unit-based compensation expense | | 4,198 | | | | 2,516 | | | | | 3,667 | | | | 7,351 | |
Exploration costs | | 3,045 | | | | 32 | | | | | 16 | | | | 981 | |
(Gain) loss on settlement of AROs | | 953 | | | | 181 | | | | | 36 | | | | 531 | |
Restructuring related costs | | — | | | | — | | | | | 7,548 | | | | — | |
Reorganization items, net | | 2,147 | | | | 1,119 | | | | | 88,774 | | | | 10,069 | |
Third-party midstream transaction | | (105 | ) | | | (16,979 | ) | | | | — | | | | — | |
Bad debt expense | | 106 | | | | — | | | | | — | | | | 2,050 | |
Severance payments | | 7,485 | | | | — | | | | | — | | | | — | |
Other | | — | | | | — | | | | | 57 | | | | 229 | |
Adjusted EBITDA | $ | 161,191 | | | $ | 104,941 | | | | $ | 53,238 | | | $ | 320,581 | |
60
Reconciliation of Net Cash from Operating Activities to Adjusted EBITDA
| Successor | | | | Predecessor | |
| For the | | | Period from | | | | Period from | | | For the | |
| Year Ended | | | May 5, 2017 | | | | January 1, 2017 | | | Year Ended | |
| December 31, | | | through | | | | through | | | December 31, | |
| 2018 | | | December 31, 2017 | | | | May 4, 2017 | | | 2016 | |
| (In thousands) | | | | (In thousands) | |
Net cash provided by operating activities | $ | 141,781 | | | $ | 94,642 | | | | $ | 125,498 | | | $ | 408,626 | |
Changes in working capital | | (14,316 | ) | | | 10,832 | | | | | (16,524 | ) | | | (26,614 | ) |
Interest expense, net | | 21,923 | | | | 15,936 | | | | | 10,243 | | | | 146,031 | |
Gain (loss) on interest rate swaps | | — | | | | — | | | | | — | | | | (1,289 | ) |
Cash settlements paid (received) on interest rate derivative instruments | | — | | | | — | | | | | — | | | | 3,944 | |
Cash settlements received on terminated commodity derivatives | | — | | | | — | | | | | (94,146 | ) | | | (230,729 | ) |
Amortization of gain associated with terminated commodity derivatives | | — | | | | — | | | | | — | | | | 42,236 | |
Amortization and extinguishment of deferred financing fees | | (2,518 | ) | | | (2,093 | ) | | | | — | | | | (22,106 | ) |
Accretion and extinguishment of senior notes discount | | — | | | | — | | | | | — | | | | (13,185 | ) |
Acquisition and divestiture related expenses | | 205 | | | | 609 | | | | | — | | | | 1,451 | |
Income tax expense (benefit) - current portion | | — | | | | 30 | | | | | (17 | ) | | | (14 | ) |
Exploration costs | | 3,045 | | | | 32 | | | | | 16 | | | | 189 | |
Plugging and abandonment cost | | 1,720 | | | | 813 | | | | | 200 | | | | 1,972 | |
Restructuring related costs | | — | | | | — | | | | | 7,548 | | | | — | |
Reorganization items, net | | 2,147 | | | | 1,119 | | | | | 20,420 | | | | 10,069 | |
Severance payments | | 7,485 | | | | — | | | | | — | | | | — | |
Third-party midstream transaction | | (105 | ) | | | (16,979 | ) | | | | — | | | | — | |
Other | | (176 | ) | | | — | | | | | — | | | | — | |
Adjusted EBITDA | $ | 161,191 | | | $ | 104,941 | | | | $ | 53,238 | | | $ | 320,581 | |
Liquidity and Capital Resources
Overview. Our ability to finance our operations, including funding capital expenditures and acquisitions, to meet our indebtedness obligations, to refinance our indebtedness or to meet our collateral requirements will depend on our ability to generate cash in the future. Our primary sources of liquidity and capital resources have historically been cash flows generated by operating activities, borrowings under our Predecessor’s revolving credit facility, our Emergence Credit Facility or our New Revolving Credit Facility, as applicable, and equity and debt capital markets. As we pursue reserve and production growth, we plan to monitor which capital resources, including equity and debt financings, are available to us to meet our future financial obligations, planned capital expenditure activities and liquidity requirements. Based on our current oil and natural gas price expectations, we believe our cash flows provided by operating activities and availability under our New Revolving Credit Facility will provide us with the financial flexibility necessary to meet our cash requirements, including normal operating needs, and to pursue our currently planned 2019 development drilling activities. However, future cash flows are subject to a number of variables, including the level of our oil and natural gas production and the prices we receive for our oil and natural gas production, and significant additional capital expenditures will be required to more fully develop our properties. We cannot assure you that operations and other needed capital will be available on acceptable terms, or at all. We anticipate funding our 2019 capital program from internally generated cash flow. Borrowings under our New Revolving Credit Facility and/or debt or equity financings may provide incremental financial flexibility.
Capital Markets. We do not currently anticipate any near-term capital markets activity, but we will continue to evaluate the availability of public debt and equity for funding potential future growth projects and acquisition activity.
Hedging. Commodity hedging has been and remains an important part of our strategy to reduce cash flow volatility. Our hedging activities are intended to support oil, NGL and natural gas prices at targeted levels and to manage our exposure to commodity price fluctuations. We intend to enter into commodity derivative contracts at times and on terms desired to maintain a portfolio of commodity derivative contracts covering at least 25% - 50% of our estimated production from total proved developed producing reserves over a one-to-three year period at any given point of time to satisfy the hedging covenants in our New Revolving Credit Facility and pursuant to our internal policies. We may, however, from time to time, hedge more or less than this approximate amount. Additionally, we may take advantage of opportunities to modify our commodity derivative portfolio to change the percentage of our hedged production volumes when circumstances suggest that it is prudent to do so. The current market conditions may also impact our ability to enter into future commodity derivative contracts. For additional information regarding the volumes of our production covered by commodity derivative contracts and the average prices at which production is hedged as of December 31, 2018, see “Item 7A. Quantitative and Qualitative Disclosures About Market Risk.”
We evaluate counterparty risks related to our commodity derivative contracts and trade credit. Should any of these financial counterparties not perform, we may not realize the benefit of some of our hedges under lower commodity prices. We sell our oil and natural gas to a variety of purchasers. Non-performance by a customer could also result in losses.
61
Capital Expenditures. Our total capital expenditures were approximately $56.0 million for the year ended December 31, 2018, which were primarily related to drilling, capital workovers and capital facilities expenditures located in East Texas, the Rockies and California.
Government Trust Account. In 2015, the Bureau of Safety and Environmental Enforcement issued a preliminary report that indicated the estimated cost of decommissioning the offshore production facilities associated with our Beta properties in federal waters offshore Southern California may further increase. The implementation of this increase is currently on hold and we do not expect resolution of a negotiated decommissioning estimate until later in 2019. At December 31, 2018, there was approximately $90.2 million in the trust account and $71.3 million in surety bonds.
Working Capital. Working capital is the amount by which current assets exceed current liabilities. Our working capital requirements are primarily driven by changes in accounts receivable and accounts payable as well as the classification of our debt outstanding. These changes are impacted by changes in the prices of commodities that we buy and sell. In general, our working capital requirements increase in periods of rising commodity prices and decreases in periods of declining commodity prices. However, our working capital needs do not necessarily change at the same rate as commodity prices because both accounts receivable and accounts payable are impacted by the same commodity prices. In addition, the timing of payments received by our customers or paid to our suppliers can also cause fluctuations in working capital because we settle with most of our larger customers on a monthly basis and often near the end of the month. We expect that our future working capital requirements will be impacted by these same factors.
As of December 31, 2018, we had a working capital balance of $55.2 million primarily due to a cash balance of $49.7 million, current derivative asset balance of $18.8 million and accounts receivable of $29.5 million partially offset by the timing of accruals, which included accrued lease operating expense of approximately $10.5 million, accrued general and administrative expense of approximately $4.4 million, and accrued capital expenditures of approximately $4.3 million.
Debt Agreements
Emergence Credit Facility. On May 4, 2017, OLLC, as borrower, entered into an amended and restated credit agreement with Wells Fargo Bank, National Association, as administrative agent, and the lenders party thereto, providing for a $1.0 billion senior secured reserve-based revolving credit facility (the “Emergence Credit Facility”).
On November 2, 2018, in connection with entry into the New Revolving Credit Facility, the Emergence Credit Facility was terminated and repaid in full. For additional information regarding the New Revolving Credit Facility, see “— Recent Developments — New Revolving Credit Facility” and Note 11 of the Notes to Consolidated Financial Statements included under “Item 8. Financial Statements and Supplementary Data” or this annual report for additional information.
On December 21, 2018, we entered into a letter agreement relating to the New Credit Agreement (the “Letter Agreement”). Pursuant to the Letter Agreement, the parties to the New Credit Agreement agreed, among other things, to:
| • | extend the date by which OLLC was required to show compliance with certain minimum hedging requirements set forth in the New Credit Agreement from December 31, 2018 to February 28, 2019; and |
| • | subject to certain conditions, waive the requirement that OLLC deliver to the Agent within 60 days after the closing date of the New Credit Agreement control agreements with respect to certain deposit accounts held or maintained by each Loan Party (as defined in the New Credit Agreement) on the closing date of the New Credit Agreement. |
The borrowing base under the New Revolving Credit Facility as of December 31, 2018, was $425.0 million.
As of December 31, 2018, we were in compliance with all the financial (ratio of total debt to EBITDAX and current ratio) and other covenants associated with our New Revolving Credit Facility.
As of December 31, 2018, we had approximately $128.6 million of available borrowings under our New Revolving Credit Facility, net of $2.4 million in letters of credit.
See Note 11 of the Notes to the Consolidated Financial Statements included under “Item 8. Financial Statements and Supplementary Data” of this annual report for additional information.
Cash Flows from Operating, Investing and Financing Activities
The following table summarizes our cash flows from operating, investing and financing activities for the periods indicated. The cash flows for the year ended December 31, 2018, the period from May 5, 2017 through December 31, 2017, the period from January 1, 2017 through May 4, 2017 and the year ended December 31, 2016 have been derived from our Consolidated Financial Statements. For information regarding the individual components of our cash flow amounts, see the Statements of Consolidated Cash Flows included under “Item 8. Financial Statements and Supplementary Data” contained herein.
62
| Successor | | | | Predecessor | |
| | | | | Period from | | | | Period from | | | For the | |
| For the Nine | | | May 5, 2017 | | | | January 1, 2017 | | | Year Ended | |
| Months Ended | | | through | | | | through | | | December 31, | |
| December 31, 2018 | | | December 31, 2017 | | | | May 4, 2017 | | | 2016 | |
| (In thousands) | | | | (In thousands) | |
Net cash provided by operating activities | $ | 141,781 | | | $ | 94,642 | | | | $ | 125,498 | | | $ | 408,626 | |
Net cash provided by (used in) investing activities | | 23,666 | | | | (53,357 | ) | | | | (6,496 | ) | | | (16,442 | ) |
Net cash provided by (used in) financing activities | | (121,810 | ) | | | (62,594 | ) | | | | (106,674 | ) | | | (377,410 | ) |
For the year ended December 31, 2018, the period from May 5, 2017 through December 31, 2017 and the period from January 1, 2017 through May 4, 2017
Operating Activities. Key drivers of net operating cash flows are commodity prices, production volumes and operating costs. Net cash provided by operating activities was $141.8 million, $94.6 million and $125.5 million for the year ended December 31, 2018, the period from May 5, 2017 through December 31, 2017 and the period from January 1, 2017 through May 4, 2017, respectively. Production volumes were approximately 159.4 MMcfe/d, 177.8 MMcfe/d and 188.2 MMcfe/d for the year ended December 31, 2018, the period from May 5, 2017 through December 31, 2017 and the period from January 1, 2017 through May 4, 2017, respectively. The average realized sales price was $5.84 per Mcfe, $4.79 per Mcfe and $4.67 per Mcfe for the year ended December 31, 2018, the period from May 5, 2017 through December 31, 2017 and the period from January 1, 2017 through May 4, 2017, respectively. Lease operating expense was $114.4 million, $74.5 million and $35.6 million for the year ended December 31, 2018, the period from May 5, 2017 through December 31, 2017 and the period from January 1, 2017 through May 4, 2017, respectively. Gathering, processing and transportation expenses were $23.2 million, $18.7 million and $10.8 million for the year ended December 31, 2018, the period from May 5, 2017 through December 31, 2017 and the period from January 1, 2017 through May 4, 2017, respectively.
Investing Activities. Net cash used in investing activities for the year ended December 31, 2018 was $23.7 million, of which $55.4 million was used for additions to oil and gas properties and partially offset by $17.1 million in proceeds from the sale of oil and natural gas properties primarily related to the South Texas Divestiture. Net cash used in investing activities for the period from May 5, 2017 through December 31, 2017 was $53.4 million, of which $52.7 million was used for additions to oil and gas properties. Net cash used in investing activities for the period from January 1, 2017 through May 4, 2017 was $6.5 million, of which $6.2 million was used for additions to oil and gas properties. Various restricted investment accounts fund certain long-term contractual and regulatory asset retirement obligations and collateralize certain regulatory bonds associated with our offshore Southern California oil and natural gas properties. Additions to restricted investments were $0.5 million, $0.5 million and $0.2 million for the year ended December 31, 2018, the period from May 5, 2017 through December 31, 2017 and the period from January 1, 2017 through May 4, 2017, respectively. Withdrawal of restricted cash was $62.5 million at December 31, 2018, which related to the Company receiving approximately $62.5 million from the Beta Decommissioning Trust Account. See Note 17 of the Notes to the Consolidated Financial Statements included under “Item 8. Financial Statements and Supplementary Data” for additional information regarding our restricted investments.
Financing Activities. The Company had net repayments of $82.0 million under the Emergence Credit Facility and paid $3.5 million in deferred financing costs for the year ended December 31, 2018. In December 2018, the Company repurchased an aggregate of 2,916,667 shares of its common stock at a price of $12.00 per share, for a total cost of $35.0 million (excluding fees and expenses relating to the tender offer). The Company had net repayments of $54.0 million under the Emergence Credit Facility and made $8.2 million in payments to the holders of the Notes, $1.3 million in payments to the Predecessor common unitholders and received a $1.5 million contribution from management in accordance with the Plan for the period from May 5, 2017 through December 31, 2017. The Company had net repayments of $81.7 million under the Predecessor’s revolving credit facility, made $16.4 million in payments to the holders of the Notes and paid $8.6 million in deferred financing costs for the period from January 1, 2017 through May 4, 2017.
For the period from May 5, 2017 through December 31, 2017, the period from January 1, 2017 through May 4, 2017 and the year ended December 31, 2016
Operating Activities. Key drivers of net operating cash flows are commodity prices, production volumes and operating costs. Net cash provided by operating activities was $94.6 million, $125.5 million and $408.6 million for the period from May 5, 2017 through December 31, 2017, the period from January 1, 2017 through May 4, 2017 and the year ended December 31, 2016, respectively. Production volumes were approximately 177.8 MMcfe/d, 188.2 MMcfe/d and 223.4 MMcfe/d for the period from May 5, 2017 through December 31, 2017, the period from January 1, 2017 through May 4, 2017 and the year ended December 31, 2016, respectively. The average realized sales price was $4.79 per Mcfe, $4.67 per Mcfe and $3.47 per Mcfe for the period from May 5, 2017 through December 31, 2017, the period from January 1, 2017 through May 4, 2017 and the year ended December 31, 2016, respectively. Lease operating expense was $74.5 million, $35.6 million and $126.2 million for the period from May 5, 2017 through December 31, 2017, the period from January 1, 2017 through May 4, 2017 and the year ended December 31, 2016, respectively. Gathering, processing and transportation expenses were $18.7 million, $10.8 million and $35.0 million for the period from May 5, 2017 through December 31, 2017, the period from January 1, 2017 through May 4, 2017 and the year ended December 31, 2016, respectively.
63
Investing Activities. Net cash used in investing activities for the period from May 5, 2017 through December 31, 2017 was $53.4 million, of which $52.7 million was used for additions to oil and gas properties. Net cash used in investing activities for the period from January 1, 2017 through May 4, 2017 was $6.5 million, of which $6.2 million was used for additions to oil and gas properties. Net cash used in investing activities for the year ended December 31, 2016 was $16.4 million, of which $57.7 million was used for additions to oil and gas properties and $7.9 million was used for additions to other property and equipment. This amount was partially offset by $52.7 million in proceeds from the sale of oil and natural gas properties for the year ended December 31, 2016. Various restricted investment accounts fund certain long-term contractual and regulatory asset retirement obligations and collateralize certain regulatory bonds associated with our offshore Southern California oil and natural gas properties. Additions to restricted investments were $0.5 million, $0.2 million and $8.4 million for the period from May 5, 2017 through December 31, 2017, the period from January 1, 2017 through May 4, 2017 and the year ended December 31, 2016, respectively. See Note 10 of the Notes to the Consolidated Financial Statements included under “Item 8. Financial Statements and Supplementary Data” for additional information regarding our restricted investments.
Financing Activities. The Company had net repayments of $54.0 million under the Emergence Credit Facility and made $8.2 million in payments to the holders of the Notes, $1.3 million in payments to the Predecessor common unitholders and received a $1.5 million contribution from management in accordance with the Plan for the period from May 5, 2017 through December 31, 2017. The Company had net repayments of $81.7 million under the Predecessor’s revolving credit facility, made $16.4 million in payments to the holders of the Notes and paid $8.6 million in deferred financing costs for the period from January 1, 2017 through May 4, 2017. The Company had net repayments of $324.3 million under the Predecessor’s revolving credit facility for the year ended December 31, 2016. Distributions to partners for the year ended December 31, 2016 were $13.3 million. We repurchased an aggregate principal amount of approximately $85.7 million of the Notes for $41.3 million for the year ended December 31, 2016.
Capital Requirements
See “— Outlook” for additional information regarding our capital spending program for 2019.
Contractual Obligations
In the table below, we set forth our contractual obligations as of December 31, 2018. The contractual obligations we will actually pay in future periods may vary from those reflected in the table because the estimates and assumptions are subjective.
| | | | | | Payment or Settlement due by Period | |
Contractual Obligation | | Total | | | Less than 1 year | | | 1-3 years | | | 4-5 years | | | Thereafter | |
| | (In thousands) | |
New Revolving Credit Facility (1) | | $ | 294,000 | | | $ | — | | | $ | — | | | $ | 294,000 | | | $ | — | |
Estimated interest payments (2) | | | 70,481 | | | | 14,582 | | | | 29,165 | | | | 26,734 | | | | — | |
Asset retirement obligations (3) | | | 76,344 | | | | 477 | | | | — | | | | — | | | | 75,867 | |
CO2 minimum purchase commitment (4) | | | 8,315 | | | | 4,306 | | | | 4,009 | | | | — | | | | — | |
Operating leases (5) | | | 11,846 | | | | 5,893 | | | | 4,181 | | | | 542 | | | | 1,230 | |
Midstream services (6) | | | 12,308 | | | | 3,075 | | | | 6,158 | | | | 3,075 | | | | — | |
Total | | $ | 473,294 | | | $ | 28,333 | | | $ | 43,513 | | | $ | 324,351 | | | $ | 77,097 | |
(1) | Represents the scheduled future maturities of principal amount outstanding for the periods indicated. Maturities are shown at original maturity dates assuming no acceleration. See Note 11 of the Notes to Consolidated Financial Statements included under “Item 8. Financial Statements and Supplementary Data” of this annual report for information regarding our New Revolving Credit Facility. |
(2) | Estimated interest payments are based on the principal amount outstanding under our New Revolving Credit Facility at December 31, 2018. In calculating these amounts, we applied the weighted-average interest rate for the year ended December 31, 2018 associated with such debt. See Note 11 of the Notes to Consolidated Financial Statements included under “Item 8. Financial Statements and Supplementary Data” of this annual report for the weighted-average variable interest rate charged during 2018 under our New Revolving Credit Facility and Emergence Credit Facility. Maturities are shown at original maturity dates assuming no acceleration. |
(3) | Asset retirement obligations represent estimated discounted costs for future dismantlement and abandonment costs. These obligations are recorded as liabilities on our December 31, 2018 balance sheet. See Note 9 of the Notes to Consolidated Financial Statements included under “Item 8. Financial Statements and Supplementary Data” of this annual report for additional information regarding our asset retirement obligations. |
(4) | Represents a firm agreement to purchase CO2 volumes related to our Bairoil properties in Wyoming. |
(5) | Primarily represents leases for office space as well as equipment rentals and offshore Southern California right-of-way use. See Note 17 of the Notes to Consolidated Financial Statements included under “Item 8. Financial Statements and Supplementary Data” of this annual report for information regarding our operating leases. |
(6) | Represents processing fees associated with a minimum volume commitment related to certain of our properties located in East Texas. |
Off–Balance Sheet Arrangements
As of December 31, 2018, we had no off–balance sheet arrangements.
Recently Issued Accounting Pronouncements
For a discussion of recent accounting pronouncements that will affect us, see Note 4 of the Notes to Consolidated Financial Statements included under “Item 8. Financial Statements and Supplementary Data.”
64
ITEM 7A. | QUANTITATIVE AND QUALITATIVE DISCLOSURES ABOUT MARKET RISK |
We are exposed to market risk, including the effects of adverse changes in commodity prices and interest rates as described below. The primary objective of the following information is to provide quantitative and qualitative information about our potential exposure to market risks. The term “market risk” refers to the risk of loss arising from adverse changes in oil and natural gas prices and interest rates. The disclosures are not meant to be precise indicators of expected future losses, but rather indicators of reasonably possible losses. All of our market risk sensitive instruments were entered into for purposes other than speculative trading.
Commodity Price Risk
Our major market risk exposure is in the prices that we receive for our oil, natural gas and NGL production. To reduce the impact of fluctuations in commodity prices on our revenues, we periodically enter into derivative contracts with respect to a portion of our projected production through various transactions that fix the future prices we receive. It has been our practice to enter into fixed price swaps and costless collars only with lenders and their affiliates under our Predecessor’s revolving credit facility, our Emergence Credit Facility and our New Revolving Credit Facility, as applicable.
Swaps. In a typical commodity swap agreement, we receive the difference between a fixed price per unit of production and a price based on an agreed upon published third-party index, if the index price is lower than the fixed price. If the index price is higher, we pay the difference. By entering into swap agreements, we effectively fix the price that we will receive in the future for the hedged production. Our swaps are settled in cash on a monthly basis.
Collars. In a typical collar arrangement, we receive the excess, if any, of the contract floor price over the reference price, primarily based on NYMEX, or regional quoted prices, and pay the excess, if any, of the reference price over the contract ceiling price. Collars are typically exercised in cash on a monthly basis only when the reference price is outside of floor and ceiling prices (the collar), otherwise they expire.
Puts. In a typical put contract, we (as the buyer of the put option) hedge against the potential for lower prices by limiting our exposure and setting a floor price for the hedged commodity. This mitigates downside risk but we retain the upside on commodity prices above the fixed floor price. Puts are typically exercised in cash on a monthly basis only when the reference price is below the floor prices. In addition, puts typically have a cost (or premium) associated with the purchase that will either be settled at the time of purchase or deferred until the period covered by the transaction. These costs will be paid regardless of the commodity price during the hedge period.
The following table summarizes our derivative contracts as of December 31, 2018 and the average prices at which the production will be hedged:
| 2019 | | | 2020 | |
Natural Gas Derivative Contracts: | | | | | | | |
Fixed price swap contracts: | | | | | | | |
Average monthly volume (MMBtu) | | 1,565,000 | | | | — | |
Weighted-average fixed price | $ | 2.89 | | | $ | — | |
| | | | | | | |
Collar contracts: | | | | | | | |
Average monthly volume (MMBtu) | | — | | | | 90,000 | |
Weighted-average floor price | | — | | | $ | 2.60 | |
Weighted-average ceiling price | $ | — | | | $ | 2.85 | |
| | | | | | | |
Crude Oil Derivative Contracts: | | | | | | | |
Fixed price swap contracts: | | | | | | | |
Average monthly volume (Bbls) | | 148,000 | | | | — | |
Weighted-average fixed price | $ | 53.06 | | | $ | — | |
| | | | | | | |
Collar contracts: | | | | | | | |
Average monthly volume (Bbls) | | 38,000 | | | | 14,300 | |
Weighted-average floor price | $ | 55.00 | | | $ | 55.00 | |
Weighted-average ceiling price | $ | 63.85 | | | $ | 62.10 | |
| | | | | | | |
Purchased put option contracts: | | | | | | | |
Average Monthly Volume (Bbls) | | — | | | | 14,300 | |
Weighted-average strike price | $ | — | | | $ | 55.00 | |
| | | | | | | |
NGL Derivative Contracts: | | | | | | | |
Fixed price swap contracts: | | | | | | | |
Average monthly volume (Bbls) | | 72,000 | | | | 18,200 | |
Weighted-average fixed price | $ | 29.96 | | | $ | 28.67 | |
65
The following table summarizes our derivative contracts as of December 31, 2017 and the average prices at which the production was hedged:
| 2018 | | | 2019 | |
Natural Gas Derivative Contracts: | | | | | | | |
Fixed price swap contracts: | | | | | | | |
Average Monthly Volume (MMBtu) | | 1,102,000 | | | | 300,000 | |
Weighted-average fixed price | $ | 3.91 | | | $ | 2.91 | |
| | | | | | | |
Crude Oil Derivative Contracts: | | | | | | | |
Fixed price swap contracts: | | | | | | | |
Average Monthly Volume (Bbls) | | 152,000 | | | | 110,000 | |
Weighted-average fixed price | $ | 71.31 | | | $ | 51.34 | |
| | | | | | | |
NGL Derivative Contracts: | | | | | | | |
Fixed price swap contracts: | | | | | | | |
Average Monthly Volume (Bbls) | | 65,700 | | | | — | |
Weighted-average fixed price | $ | 24.13 | | | $ | — | |
Interest Rate Risk
Our risk management policy provides for the use of interest rate swaps to reduce the exposure to market rate fluctuations by converting variable interest rates to fixed interest rates. Conditions sometimes arise where actual borrowings are less than notional amounts hedged which has and could result in over-hedged amounts from an economic perspective. The Company did not have any interest rate swaps at December 31, 2018.
Counterparty and Customer Credit Risk
We are subject to credit risk due to the concentration of our oil and natural gas receivables with several significant customers. In addition, our derivative contracts may expose us to credit risk in the event of nonperformance by counterparties. Some of the lenders, or certain of their affiliates, under our New Revolving Credit Facility are counterparties to our derivative contracts. While collateral is generally not required to be posted by counterparties, credit risk associated with derivative instruments is minimized by limiting exposure to any single counterparty and entering into derivative instruments only with counterparties that are large financial institutions. Additionally, master netting agreements are used to mitigate risk of loss due to default with counterparties on derivative instruments. These agreements allow us to offset our asset position with our liability position in the event of default by the counterparty. We have also entered into International Swaps and Derivatives Association Master Agreements (“ISDA Agreements”) with each of our counterparties. The terms of the ISDA Agreements provide us and each of our counterparties with rights of set-off upon the occurrence of defined acts of default by either us or our counterparty to a derivative, whereby the party not in default may set-off all liabilities owed to the defaulting party against all net derivative asset receivables from the defaulting party. At December 31, 2018, after taking into effect netting arrangements, we had no counterparty exposure related to our derivative instruments. As a result, had all counterparties failed completely to perform according to the terms of the existing contracts, we would have the right to offset $21.2 million against amounts outstanding under our New Revolving Credit Facility at December 31, 2018.
ITEM 8. | FINANCIAL STATEMENTS AND SUPPLEMENTARY DATA |
Our Consolidated Financial Statements, together with the report of our independent registered public accounting firm, begin on page F-1 of this annual report and are incorporated herein by reference.
ITEM 9. | CHANGES IN AND DISAGREEMENTS WITH ACCOUNTANTS ON ACCOUNTING AND FINANCIAL DISCLOSURE |
None.
66
ITEM 9A. | CONTROLS AND PROCEDURES |
Evaluation of Disclosure Controls and Procedures.
As required by Rules 13a-15(b) and 15d-15(b) of the Exchange Act, we have evaluated, under the supervision and with the participation of our management, including the principal executive officer and principal financial officer of the Company, the effectiveness of the design and operation of our disclosure controls and procedures (as defined in Rules 13a-15(e) and 15d-15(e) and under the Exchange Act) as of the end of the period covered by this annual report. Our disclosure controls and procedures are designed to provide reasonable assurance that the information required to be disclosed by us in reports that we file under the Exchange Act is accumulated and communicated to our management, including the principal executive officer and principal financial officer of the Company, as appropriate, to allow timely decisions regarding required disclosure, and is recorded, processed, summarized and reported within the time periods specified in the rules and forms of the SEC. Based upon this evaluation, the principal executive officer and principal financial officer of the Company have concluded that our disclosure controls and procedures were effective at the reasonable assurance level as of December 31, 2018.
Management’s Report on Internal Control Over Financial Reporting
The Company’s management is responsible for establishing and maintaining adequate internal control over financial reporting, as defined in Rules 13a-15(f) and 15d-15(f) of the Exchange Act. Internal control over financial reporting, no matter how well designed, has inherent limitations. Because of its inherent limitations, internal control over financial reporting may not prevent or detect misstatements.
Under the supervision and with the participation of the Company’s management, including the principal executive officer and principal financial officer of the Company, the Company assessed the effectiveness of its internal control over financial reporting based on the framework in Internal Control — Integrated Framework (2013) issued by the Committee of Sponsoring Organizations of the Treadway Commission (the “COSO Framework”). Based on this assessment, the Company’s management, including its principal executive and financial officers, concluded that the Company’s internal control over financial reporting was effective as of December 31, 2018 based on the criteria set forth under the COSO Framework.
KPMG LLP, the independent registered public accounting firm who audited the Company’s Consolidated Financial Statements included under “Item 8. Financial Statements and Supplementary Data” in this annual report, has issued an attestation report on the effectiveness of the Company’s internal control over financial reporting as of December 31, 2018. The report, which expresses an unqualified opinion on the effectiveness of the Company’s internal control over financial reporting as of December 31, 2018, is contained herein under the heading “Report of Independent Registered Public Accounting Firm.”
Changes in Internal Controls Over Financial Reporting
No changes in our internal control over financial reporting occurred during the quarter ended December 31, 2018 that have materially affected, or are reasonably likely to materially affect, our internal control over financial reporting.
The certifications required by Section 302 of the Sarbanes-Oxley Act of 2002 are filed as exhibits 31.1 and 31.2, respectively, to this annual report.
67
Report of Independent Registered Public Accounting Firm
The Stockholders and Board of Directors
Amplify Energy Corp.:
Opinion on Internal Control Over Financial Reporting
We have audited Amplify Energy Corp. and subsidiaries (the Company) internal control over financial reporting as of December 31, 2018, based on criteria established in Internal Control – Integrated Framework (2013) issued by the Committee of Sponsoring Organizations of the Treadway Commission. In our opinion, the Company maintained, in all material respects, effective internal control over financial reporting as of December 31, 2018, based on criteria established in Internal Control – Integrated Framework (2013) issued by the Committee of Sponsoring Organizations of the Treadway Commission.
We also have audited, in accordance with the standards of the Public Company Accounting Oversight Board (United States) (PCAOB), the consolidated balance sheets of the Company as of December 31, 2018 and 2017, the related consolidated statements of operations, equity, and cash flows for the year ended December 31, 2018, the period May 5, 2017 through December 31, 2017 (Successor), the period from January 1, 2017 through May 4, 2017 and the year ended December 31, 2016 (Predecessor) and the related notes (collectively, the consolidated financial statements), and our report dated March 6, 2019 expressed an unqualified opinion on those consolidated financial statements.
Basis for Opinion
The Company’s management is responsible for maintaining effective internal control over financial reporting and for its assessment of the effectiveness of internal control over financial reporting, included in the accompanying Management’s Report on Control Over Financial Reporting. Our responsibility is to express an opinion on the Company’s internal control over financial reporting based on our audit. We are a public accounting firm registered with the PCAOB and are required to be independent with respect to the Company in accordance with the U.S. federal securities laws and the applicable rules and regulations of the Securities and Exchange Commission and the PCAOB.
We conducted our audit in accordance with the standards of the PCAOB. Those standards require that we plan and perform the audit to obtain reasonable assurance about whether effective internal control over financial reporting was maintained in all material respects. Our audit of internal control over financial reporting included obtaining an understanding of internal control over financial reporting, assessing the risk that a material weakness exists, and testing and evaluating the design and operating effectiveness of internal control based on the assessed risk. Our audit also included performing such other procedures as we considered necessary in the circumstances. We believe that our audit provides a reasonable basis for our opinion.
Definition and Limitations of Internal Control Over Financial Reporting
A company’s internal control over financial reporting is a process designed to provide reasonable assurance regarding the reliability of financial reporting and the preparation of financial statements for external purposes in accordance with generally accepted accounting principles. A company’s internal control over financial reporting includes those policies and procedures that (1) pertain to the maintenance of records that, in reasonable detail, accurately and fairly reflect the transactions and dispositions of the assets of the company; (2) provide reasonable assurance that transactions are recorded as necessary to permit preparation of financial statements in accordance with generally accepted accounting principles, and that receipts and expenditures of the company are being made only in accordance with authorizations of management and directors of the company; and (3) provide reasonable assurance regarding prevention or timely detection of unauthorized acquisition, use, or disposition of the company’s assets that could have a material effect on the financial statements.
Because of its inherent limitations, internal control over financial reporting may not prevent or detect misstatements. Also, projections of any evaluation of effectiveness to future periods are subject to the risk that controls may become inadequate because of changes in conditions, or that the degree of compliance with the policies or procedures may deteriorate.
/s/ KPMG LLP
Houston, Texas
March 6, 2019
68
ITEM 9B. | OTHER INFORMATION |
None
69
PART III
ITEM 10. | DIRECTORS, EXECUTIVE OFFICERS AND CORPORATE GOVERNANCE |
The information required by this item is incorporated herein by reference to the Company’s definitive proxy statement relating to the 2019 Annual Meeting of Stockholders of Amplify Energy Corp. (the “Proxy Statement”) to be held on May 15, 2019.
The Company’s Code of Business Conduct and Ethics (the “Code of Ethics”) can be found on the Company’s website located at http://investor.amplifyenergy.com/corporate-governance. Any stockholder may request a printed copy of the Code of Ethics by submitting a written request to the Company’s Corporate Secretary. If the Company amends the Code of Ethics or grants a waiver, including an implicit waiver, from the Code of Ethics, the Company will disclose the information on its website. The waiver information will remain on the website for at least 12 months after the initial disclosure of such waiver.
ITEM 11. | EXECUTIVE COMPENSATION |
The information required by this item is incorporated herein by reference to the Proxy Statement.
ITEM 12. | SECURITY OWNERSHIP OF CERTAIN BENEFICIAL OWNERS AND MANAGEMENT AND RELATED STOCKHOLDER MATTERS |
The information required by this item is incorporated herein by reference to the Proxy Statement.
ITEM 13. | CERTAIN RELATIONSHIPS AND RELATED TRANSACTIONS, AND DIRECTOR INDEPENDENCE |
The information required by this item is incorporated herein by reference to the Proxy Statement.
ITEM 14. | PRINCIPAL ACCOUNTANT FEES AND SERVICES |
The information required by this item is incorporated herein by reference to the Proxy Statement.
70
PART IV
ITEM 15. | EXHIBITS AND FINANCIAL STATEMENT SCHEDULES |
(a)(1) Financial Statements
Our Consolidated Financial Statements are included under Part II, “Item 8. Financial Statements and Supplementary Data” of the Annual Report. For a listing of these statements and accompanying footnotes, see “Index to Financial Statements” Page F-1 of this Annual Report.
(a)(2) Financial Statement Schedules
All schedules have been omitted because they are either not applicable, not required or the information called for therein appears in the consolidated financial statements or notes thereto.
(a)(3) Exhibits
The exhibits listed on the Exhibit Index below are filed or incorporated by reference as part of this report, and such Exhibit Index is incorporated herein by reference.
71
Exhibit Index
Exhibit
Number | | | | | Description |
| | | |
2.1 | | | — | | Second Amended Joint Plan of Reorganization of Memorial Production Partners LP and its affiliated Debtors, dated April 13, 2017 (incorporated by reference to Exhibit 2.1 of the Company’s Current Report on Form 8-K (File No. 001-35364) filed on April 17, 2017). |
| | | | | |
2.2## | | | — | | Purchase and Sale Agreement, dated as of November 3, 2015, by and between SP Beta Holdings, LLC and Memorial Production Operating LLC (incorporated by reference to Exhibit 2.1 to Current Report on Form 8-K (File No. 001-35364) filed on November 5, 2015). |
| | | |
2.3## | | | — | | Purchase and Sale Agreement, dated as of April 27, 2016, among Memorial Production Partners LP, Memorial Resources Development Corp., Memorial Production Partners GP LLC, Memorial Production Operating LLC, Beta Operating Company, LLC and MEMP Services LLC (incorporated by reference to Exhibit 2.1 to Current Report on Form 8-K (File No. 001-35364) filed on May 2, 2016). |
| | | | | |
2.4## | | | — | | Joint Plan of Reorganization of Memorial Production Partners LP, et al. under Chapter 11 of the Bankruptcy Code, dated as of January 16, 2017 (incorporated by reference to Exhibit 2.1 to Current Report on Form 8-K (File No. 001-35364) filed on January 17, 2017). |
| | | | | |
3.1 | | | — | | Amended and Restated Certificate of Incorporation of Amplify Energy Corp. (incorporated by reference to Exhibit 4.1 of the Company’s Registration Statement on Form S-8 (File No. 333-217674) filed on May 4, 2017). |
| | | | | |
3.2 | | | — | | Amended and Restated Bylaws of Amplify Energy Corp. (incorporated by reference to Exhibit 4.2 of the Company’s Registration Statement on Form S-8 (File No. 333-217674) filed on May 4, 2017). |
| | | | | |
4.1# | | | — | | Form of Restricted Unit Agreement under the Memorial Production Partners GP LLC Long-Term Incentive Plan (incorporated by reference to Exhibit 4.6 to Registration Statement on Form S-8 (File No. 333-178493) filed on December 14, 2011). |
| | | |
4.2# | | | — | | Form of Phantom Unit Agreement under the Memorial Production Partners GP LLC Long-Term Incentive Plan (incorporated by reference to Exhibit 4.2 to Annual Report on Form 10-K (File No. 001-35364) filed on February 24, 2016). |
| | | | | |
10.1# | | | — | | Employment Agreement, dated May 5, 2018, by and between Amplify Energy Corp. and Kenneth Mariani (incorporated by reference to Exhibit 10.2 to Quarterly Report on Form 10-Q (File No. 001-35364) filed on August 8, 2018). |
| | | | | |
10.2# | | | — | | Employment Agreement, dated July 30, 2018, by and between Amplify Energy Corp and Denise DuBard (incorporated by reference to Exhibit 10.1 to Quarterly Report on Form 10-Q (File No. 001-35364) filed on November 11, 2018). |
| | | | | |
10.3# | | | — | | Letter Agreement, dated April 27, 2018, by and between Amplify Energy Corp. and William J. Scarff (incorporated by reference to Exhibit 10.3 to Quarterly Report on Form 10-Q (File No. 001-35364) filed on August 8, 2018). |
| | | | | |
10.4# | | | — | | Letter Agreement, dated April 27, 2018, by and between Amplify Energy Corp. and Robert L. Stillwell, Jr. (incorporated by reference to Exhibit 10.4 to Quarterly Report on Form 10-Q (File No. 001-35364) filed on August 8, 2018). |
| | | | | |
10.5# | | | — | | Letter Agreement, dated April 27, 2018, by and between Amplify Energy Corp. and Christopher S. Cooper (incorporated by reference to Exhibit 10.5 to Quarterly Report on Form 10-Q (File No. 001-35364) filed on August 8, 2018). |
| | | | | |
10.6#* | | | — | | Form of Restricted Stock Unit Agreement. |
| | | | | |
10.7#* | | | — | | Form of Option Forfeiture Agreement. |
| | | | | |
10.8# | | | — | | Form of RSU Award Agreement (incorporated by reference to Exhibit 10.6 to Quarterly Report on Form 10-Q (File No. 001-35364) filed on August 8, 2018). |
| | | | | |
10.9# | | | — | | Form of Stock Option Award Agreement (incorporated by reference to Exhibit 99.2 of the Company’s Registration Statement on Form S-8 (File No. 333-217674) filed on May 4, 2017). |
| | | | | |
72
Exhibit
Number | | | | | Description |
10.10# | | | — | | Form of Restricted Stock Unit Award Agreement (incorporated by reference to Exhibit 99.3 of the Company’s Registration Statement on Form S-8 (File No. 333-217674) filed on May 4, 2017). |
| | | | | |
10.11# | | | — | | Form of Restricted Stock Unit Award Agreement under the Amplify Energy Corp. 2017 Non-Employee Directors Compensation Plan (incorporated by reference to Exhibit 99.2 of the Company’s Registration Statement on Form S-8 (File No. 333-218745) filed on June 14, 2017). |
| | | | | |
10.12# | | | — | | Form of Change of Control Agreement (incorporated by reference to Exhibit 10.2 to Quarterly Report on Form 10-Q (File No. 001-35364) filed on May 4, 2016). |
| | | | | |
10.13# | | | — | | Form of Key Employee Retention Bonus Agreement for Senior Management (incorporated by reference to Exhibit 10.5 to Annual Report on Form 10-K (File No. 001-35364) filed on March 10, 2017). |
| | | | | |
10.14# | | | — | | Form of Key Employee Retention Bonus Agreement (incorporated by reference to Exhibit 10.6 to Annual Report on Form 10-K (File No. 001-35364) filed on March 10, 2017). |
| | | | | |
10.15# | | | — | | Memorial Production Partners LP Key Employee Incentive Plan (incorporated by reference to Exhibit 10.7 to Annual Report on Form 10-K (File No. 001-35364) filed on March 10, 2017). |
| | | | | |
10.16 | | | — | | Plan Support Agreement, dated as of December 22, 2016, among Memorial Production Partners LP (the “Partnership”) and its subsidiaries party thereto and certain holders of the Partnership’s 7.625% Senior Notes due 2021 and the Partnership’s 6.875% Senior Notes due 2022 (incorporated by reference to Exhibit 10.1 to Current Report on Form 8-K (File No. 001-35364) filed on December 23, 2016). |
| | | | | |
10.17 | | | — | | Plan Support Agreement, dated as of January 13, 2017, among Memorial Production Partners LP and its subsidiaries party thereto and the banks party thereto (incorporated by reference to Exhibit 10.1 to Current Report on Form 8-K (File No. 001-35364) filed on January 17, 2017). |
| | | | | |
10.18 | | | — | | Amendment to Plan Support Agreement, dated as of January 12, 2017, among Memorial Production Partners LP (the “Partnership”) and its subsidiaries party thereto and certain holders of the Partnership’s 7.625% Senior Notes due 2021 and the Partnership’s 6.875% Senior Notes due 2022 (incorporated by reference to Exhibit 10.2 to Current Report on Form 8-K (File No. 001-35364) filed on January 17, 2017). |
| | | | | |
10.19# | | | — | | Amplify Energy Corp. Management Incentive Plan (incorporated by reference to Exhibit 99.1 of the Company’s Registration Statement on Form S-8 (File No. 333-217674) filed on May 4, 2017). |
| | | | | |
10.20 | | | — | | Credit Agreement, dated as of November 2, 2018, among Amplify Energy Operating LLC, Amplify Acquisitionco. Inc., as parent , Bank of Montreal, as administrative agent and an L/C issuer, and the other lenders and agents from time to time party thereto (incorporated by reference to Exhibit 10.2 of Quarterly Report on Form 10-Q (File No. 001-35364) filed on November 7, 2018). |
| | | | | |
10.21* | | | — | | Letter Agreement, dated as of December 21, 2018, among Amplify Energy Operating LLC, Amplify Acquisitionco, Inc., as parent, Bank of Montreal, as administrative agent and L/C issuer, and the other lenders and agents from time to time party thereto. |
| | | | | |
10.22 | | | — | | Amended and Restated Credit Agreement, dated as of May 4, 2017, among Amplify Energy Operating LLC, Amplify Acquisitionco Inc., as a parent guarantor, the lenders from time to time party thereto and Wells Fargo Bank, National Association, as Administrative Agent (incorporated by reference to Exhibit 10.1 of the Company’s Current Report on Form 8-K (File No. 001-35364) filed on May 5, 2017). |
| | | | | |
10.23 | | | — | | First Amendment to Amended and Restated Credit Agreement, dated as of November 30, 2017, among Amplify Energy Operating LLC, the guarantors party thereto, lenders party thereto and Wells Fargo Bank, National Association, as administrative agent (incorporated by reference to Exhibit 10.1 of the Company’s Current Report on Form 8-K (File No. 001-35364) filed on December 6, 2017). |
| | | | | |
10.24 | | | — | | Second Amendment to Amended and Restated Credit Agreement dated as of May 15, 2018, among Amplify Energy Operating LLC, the guarantors party thereto and Wells Fargo Bank National Association, as administrative agent (incorporated by reference to Exhibit 10.1 of the Company’s Current Report on Form 8-K (File No. 001-35364) filed on May 17, 2018. |
| | | | | |
10.25# | | | — | | Stockholders Agreement, dated as of May 4, 2017, between the Company and certain Stockholders (incorporated by reference to Exhibit 10.2 of the Company’s Current Report on Form 8-K (File No. 001-35364) filed on May 5, 2017). |
| | | | | |
73
Exhibit
Number | | | | | Description |
10.26 | | | — | | Registration Rights Agreement, dated as of May 4, 2017, between the Company and certain Stockholders (incorporated by reference to Exhibit 10.3 of the Company’s Current Report on Form 8-K (File No. 001-35364) filed on May 5, 2017). |
| | | | | |
10.27 | | | — | | Warrant Agreement between Amplify Energy Corp., as Issuer, and American Stock Transfer & Trust Company, LLC, as Warrant Agent, dated as of May 4, 2017 (incorporated by reference to Exhibit 10.4 of the Company’s Current Report on Form 8-K (File No. 001-35364) filed on May 5, 2017). |
| | | | | |
10.28# | | | — | | Form of Amendment to the Change of Control Agreement (incorporated by reference to Exhibit 10.5 of the Company’s Current Report on Form 8-K (File No. 001-35364) filed on May 5, 2017). |
| | | | | |
10.29# | | | — | | Form of Amendment to the Management Incentive Plan Severance Agreement (incorporated by reference to Exhibit 10.6 of the Company’s Current Report on Form 8-K (File No. 001-35364) filed on May 5, 2017). |
| | | | | |
10.30# | | | — | | Amplify Energy Corp. Amended and Restated Key Employee Incentive Plan (incorporated by reference to Exhibit 10.7 of the Company’s Current Report on Form 8-K (File No. 001-35364) filed on May 5, 2017). |
| | | | | |
10.31# | | | — | | Amplify Energy Corp. 2017 Non-Employee Directors Compensation Plan (incorporated by reference to Exhibit 99.1 of the Company’s Registration Statement on Form S-8 (File No. 333-218745) filed on June 14, 2017). |
| | | | | |
21.1* | | | — | | List of Subsidiaries of Amplify Energy Corp. |
| | | |
23.1* | | | — | | Consent of Ryder Scott Company, L.P. |
| | | |
23.2* | | — | Consent of KPMG LLP |
| | | |
31.1* | | | — | | Certification of Chief Executive Officer Pursuant to Rule 13a-14(a)/15d-14(a) of the Securities Exchange Act of 1934 |
| | | |
31.2* | | | — | | Certification of Chief Financial Officer Pursuant to Rule 13a-14(a)/15d-14(a) of the Securities Exchange Act of 1934 |
| | | |
32.1* | | | — | | Certifications of Chief Executive Officer and Chief Financial Officer pursuant to 18. U.S.C. Section 1350, as adopted pursuant to Section 906 of the Sarbanes-Oxley Act of 2002. |
| | | |
99.1* | | | — | | Report of Ryder Scott Company, L.P. |
| | | |
101.CAL* | | | — | | XBRL Calculation Linkbase Document |
| | | |
101.DEF* | | | — | | XBRL Definition Linkbase Document |
| | | |
101.INS* | | | — | | XBRL Instance Document |
| | | |
101.LAB* | | | — | | XBRL Labels Linkbase Document |
| | | |
101.PRE* | | | — | | XBRL Presentation Linkbase Document |
| | | |
101.SCH* | | | — | | XBRL Schema Document |
* | Filed or furnished as an exhibit to this Annual Report on Form 10-K. |
# | Management contract or compensatory plan or arrangement. |
## | Pursuant to Item 601(b)(2) of Regulation S-K, the registrant agrees to furnish supplementally a copy of any omitted exhibit or schedule to the SEC upon request. |
ITEM 16. | Form 10-K Summary |
None.
74
SIGNATURES
Pursuant to the requirements of Section 13 or 15(d) of the Securities Exchange Act of 1934, the registrant has duly caused this report to be signed on its behalf by the undersigned, thereunto duly authorized.
| Amplify Energy Corp. |
| (Registrant) |
| | | |
Date: March 6, 2019 | By: | | /s/ Martyn Willsher |
| Name: | | Martyn Willsher |
| Title: | | Senior Vice President and Chief Financial Officer |
75
Pursuant to the requirements of the Securities Exchange Act of 1934, this report has been signed below by the following persons on behalf of the registrant and in their capacities and on the dates indicated.
Name | | Title (Position with Amplify Energy Corp.) | | Date |
| | |
/s/ Kenneth Mariani | | President, Chief Executive Officer and Director | | March 6, 2019 |
Kenneth Mariani | | (Principal Executive Officer) | | |
| | |
/s/ Martyn Willsher | | Senior Vice President and Chief Financial Officer | | March 6, 2019 |
Martyn Willsher | | (Principal Financial Officer) | | |
| | |
/s/ Denise DuBard | | Vice President and Chief Accounting Officer | | March 6, 2019 |
Denise DuBard | | (Principal Accounting Officer) | | |
| | |
/s/ David H. Proman | | Director and Chairman | | March 6, 2019 |
David H. Proman | | | | |
| | | | |
/s/ David M. Dunn | | Director | | March 6, 2019 |
David M. Dunn | | | | |
| | | | |
/s/ Christopher W. Hamm | | Director | | March 6, 2019 |
Christopher W. Hamm | | | | |
| | | | |
/s/ P. Michael Highum | | Director | | March 6, 2019 |
P. Michael Highum | | | | |
| | | | |
/s/ Evan S. Lederman | | Director | | March 6, 2019 |
Evan S. Lederman | | | | |
| | | | |
/s/ Edward A. Scoggins, Jr. | | Director | | March 6, 2019 |
Edward A. Scoggins, Jr. | | | | |
| | | | |
| | |
Supplemental Information to be Furnished With Reports Filed Pursuant to Section 15(d) of the Act by Registrants Which Have Not Registered Securities Pursuant to Section 12 of the Act
No annual report, proxy statement, form of proxy, or other proxy soliciting material has been sent to the registrant's security holders. The registrant undertakes to furnish to the Commission any annual report or proxy material which it delivers to security holders in connection with an annual meeting.
76
ITEM 8. | FINANCIAL STATEMENTS AND SUPPLEMENTARY DATA |
AMPLIFY ENERGY CORP.
INDEX TO FINANCIAL STATEMENTS
| | Page No. |
Report of Independent Registered Public Accounting Firm | | F-2 |
Consolidated Balance Sheets as of December 31, 2018 (Successor Period) and December 31, 2017 (Successor Period) | | F-3 |
Statements of Consolidated Operations for the year ended December 31, 2018 (Successor Period), the period from May 5, 2017 through December 31, 2017 (Successor Period), period from January 1, 2017 through May 4, 2017 (Predecessor Period) and the year ended December 31, 2016 (Predecessor Period) | | F-4 |
Statements of Consolidated Cash Flows for the year ended December 31, 2018 (Successor Period), the period from May 5, 2017 through December 31, 2017 (Successor Period), the period from January 1, 2017 through May 4, 2017 (Predecessor Period), and the year ended December 31, 2016 (Predecessor Period) | | F-5 |
Statements of Consolidated Equity for the December 31, 2018 (Successor Period), the period from May 5, 2017 through December 31, 2017 (Successor Period), the period from January 1, 2017 through May 4, 2017 (Predecessor Period), and the year ended December 31, 2016 (Predecessor Period) | | F-7 |
Notes to Consolidated Financial Statements | | |
Note 1 – Organization and Basis of Presentation | | F-9 |
Note 2 – Emergence from Voluntary Reorganization under Chapter 11 | | F-11 |
Note 3 – Fresh Start Accounting | | F-12 |
Note 4 – Summary of Significant Accounting Policies | | F-15 |
Note 5 – Revenues | | F-21 |
Note 6 – Acquisitions and Divestitures | | F-22 |
Note 7 – Fair Value Measurements of Financial Instruments | | F-24 |
Note 8 – Risk Management and Derivative Instruments | | F-25 |
Note 9 – Asset Retirement Obligations | | F-28 |
Note 10 – Restricted Investments | | F-29 |
Note 11 – Debt | | F-29 |
Note 12 – Equity (Deficit) | | F-33 |
Note 13 – Earnings per Share/Unit | | F-36 |
Note 14 – Equity-based Awards | | F-36 |
Note 15 – Supplemental Disclosures to the Consolidated Balance Sheet and Condensed Statement of Cash Flows | | F-42 |
Note 16 – Related Party Transactions | | F-43 |
Note 17 – Commitments and Contingencies | | F-44 |
Note 18 – Income Tax | | F-46 |
Note 19 – Quarterly Financial Information (Unaudited) | | F-49 |
Note 20 – Supplemental Oil and Gas Information (Unaudited) | | F-49 |
Note 21- Subsequent Events | | F-54 |
F-1
REPORT OF INDEPENDENT REGISTERED PUBLIC ACCOUNTING FIRM
The Stockholders and Board of Directors
Amplify Energy Corp.:
Opinion on the Consolidated Financial Statements
We have audited the accompanying consolidated balance sheets of Amplify Energy Corp. and subsidiaries (the Company) as of December 31, 2018 and 2017, the related consolidated statements of operations, equity, and cash flows for the year ended December 31, 2018, the period May 5, 2017 through December 31, 2017 (Successor), the period from January 1, 2017 through May 5, 2017 and the year ended December 31, 2016 (Predecessor), and the related notes (collectively, the consolidated financial statements). In our opinion, the consolidated financial statements present fairly, in all material respects, the financial position of the Company as of December 31, 2018 and 2017, and the results of its operations and its cash flows for the year ended December 31, 2018, the period May 5, 2017 through December 31, 2017 (Successor), the period from January 1, 2017 through May 5, 2017 and the year ended December 31, 2016 (Predecessor), in conformity with U.S. generally accepted accounting principles.
We also have audited, in accordance with the standards of the Public Company Accounting Oversight Board (United States) (PCAOB), the Company’s internal control over financial reporting as of December 31, 2018, based on Internal Control – Integrated Framework (2013) issued by the Committee of Sponsoring Organizations of the Treadway Commission and our report dated March 6, 2019 expressed an unqualified opinion on the effectiveness of the Company’s internal control over financial reporting.
Basis of Accounting
As discussed in note 2 to the consolidated financial statements, on April 14, 2017, the United States Bankruptcy Court for the Southern District of Texas entered an order confirming the plan for reorganization, which became effective on May 4, 2017. Accordingly, the accompanying consolidated financial statements have been prepared in conformity with Accounting Standards Codification Topic 852, Reorganizations, for the Successor as a new entity with assets, liabilities and a capital structure having carrying amounts not comparable with prior periods (Predecessor) as described in note 1.
Basis for Opinion
These consolidated financial statements are the responsibility of the Company’s management. Our responsibility is to express an opinion on these consolidated financial statements based on our audits. We are a public accounting firm registered with the PCAOB and are required to be independent with respect to the Company in accordance with the U.S. federal securities laws and the applicable rules and regulations of the Securities and Exchange Commission and the PCAOB.
We conducted our audits in accordance with the standards of the PCAOB. Those standards require that we plan and perform the audit to obtain reasonable assurance about whether the consolidated financial statements are free of material misstatement, whether due to error or fraud. Our audits included performing procedures to assess the risks of material misstatement of the consolidated financial statements, whether due to error or fraud, and performing procedures that respond to those risks. Such procedures included examining, on a test basis, evidence regarding the amounts and disclosures in the consolidated financial statements. Our audits also included evaluating the accounting principles used and significant estimates made by management, as well as evaluating the overall presentation of the consolidated financial statements. We believe that our audits provide a reasonable basis for our opinion.
/s/ KPMG LLP
We have served as the Company’s auditor since 2011.
Houston, Texas
March 6, 2019
F-2
AMPLIFY ENERGY CORP.
CONSOLIDATED BALANCE SHEETS
(In thousands, except outstanding shares)
| Successor | |
| December 31, | | | December 31, | |
| 2018 | | | 2017 | |
ASSETS | | | | | | | |
Current assets: | | | | | | | |
Cash and cash equivalents | $ | 49,704 | | | $ | 6,392 | |
Restricted cash | | 325 | | | | — | |
Accounts receivable | | 29,514 | | | | 36,391 | |
Short-term derivative instruments | | 18,813 | | | | 28,546 | |
Prepaid expenses and other current assets | | 7,241 | | | | 7,220 | |
Total current assets | | 105,597 | | | | 78,549 | |
Property and equipment, at cost: | | | | | | | |
Oil and natural gas properties, successful efforts method | | 598,331 | | | | 603,053 | |
Support equipment and facilities | | 108,760 | | | | 100,225 | |
Other | | 6,625 | | | | 6,133 | |
Accumulated depreciation, depletion and impairment | | (85,535 | ) | | | (35,979 | ) |
Property and equipment, net | | 628,181 | | | | 673,432 | |
Long-term derivative instruments | | 2,469 | | | | — | |
Restricted investments | | 94,467 | | | | 156,938 | |
Other long-term assets | | 6,129 | | | | 8,545 | |
Total assets | $ | 836,843 | | | $ | 917,464 | |
| | | | | | | |
LIABILITIES AND EQUITY | | | | | | | |
Current liabilities: | | | | | | | |
Accounts payable | $ | 2,345 | | | $ | 1,941 | |
Revenues payable | | 24,779 | | | | 22,427 | |
Accrued liabilities (see Note 15) | | 23,155 | | | | 18,233 | |
Short-term derivative instruments | | 139 | | | | — | |
Total current liabilities | | 50,418 | | | | 42,601 | |
Long-term debt (see Note 11) | | 294,000 | | | | 376,000 | |
Asset retirement obligations | | 75,867 | | | | 99,460 | |
Long-term derivative instruments | | — | | | | 5,470 | |
Total liabilities | | 420,285 | | | | 523,531 | |
Commitments and contingencies (see Note 17) | | | | | | | |
Stockholders' equity: | | | | | | | |
Preferred stock, $0.0001 par value: 45,000,000 shares authorized; no shares issued and outstanding at December 31, 2018 and 2017, respectively | | — | | | | — | |
Warrants, 2,173,913 warrants issued and outstanding at December 31, 2018 and 2017, respectively | | 4,788 | | | | 4,788 | |
Common stock, $0.0001 par value: 300,000,000 shares authorized; 22,181,881 and 25,000,000 shares issued and outstanding at December 31, 2018 and 2017, respectively | | 3 | | | | 3 | |
Additional paid-in capital | | 355,872 | | | | 387,856 | |
Accumulated earnings (deficit) | | 55,895 | | | | 1,286 | |
Total stockholders' equity | | 416,558 | | | | 393,933 | |
Total liabilities and equity | $ | 836,843 | | | $ | 917,464 | |
See Accompanying Notes to Consolidated Financial Statements.
F-3
AMPLIFY ENERGY CORP.
STATEMENTS OF CONSOLIDATED OPERATIONS
(In thousands, except per share/unit amounts)
| Successor | | | | Predecessor | |
| | | | | Period from | | | | Period from | | | | | |
| For the | | | May 5, 2017 | | | | January 1, 2017 | | | For the | |
| Year Ended | | | through | | | | through | | | Year Ended | |
| December 31, 2018 | | | December 31, 2017 | | | | May 4, 2017 | | | December 31, 2016 | |
Revenues: | | | | | | | | | | | | | | | | |
Oil and natural gas sales | $ | 339,840 | | | $ | 205,176 | | | | $ | 108,970 | | | $ | 284,051 | |
Other revenues | | 304 | | | | 303 | | | | | 231 | | | | 529 | |
Total revenues | | 340,144 | | | | 205,479 | | | | | 109,201 | | | | 284,580 | |
| | | | | | | | | | | | | | | | |
Costs and expenses: | | | | | | | | | | | | | | | | |
Lease operating expense | | 114,405 | | | | 74,547 | | | | | 35,568 | | | | 126,175 | |
Gathering, processing and transportation | | 23,231 | | | | 18,652 | | | | | 10,772 | | | | 34,979 | |
Exploration | | 3,045 | | | | 32 | | | | | 21 | | | | 981 | |
Taxes other than income | | 20,364 | | | | 11,101 | | | | | 5,187 | | | | 15,540 | |
Depreciation, depletion and amortization | | 52,334 | | | | 35,979 | | | | | 37,717 | | | | 171,629 | |
Impairment of proved oil and natural gas properties | | — | | | | — | | | | | — | | | | 183,437 | |
General and administrative expense | | 43,129 | | | | 29,506 | | | | | 31,606 | | | | 63,280 | |
Accretion of asset retirement obligations | | 5,711 | | | | 4,384 | | | | | 3,407 | | | | 10,231 | |
(Gain) loss on commodity derivative instruments | | (8,155 | ) | | | 31,609 | | | | | (23,076 | ) | | | 117,105 | |
(Gain) loss on sale of properties | | 3,614 | | | | — | | | | | — | | | | (2,754 | ) |
Other, net | | 943 | | | | 485 | | | | | 36 | | | | 516 | |
Total costs and expenses | | 258,621 | | | | 206,295 | | | | | 101,238 | | | | 721,119 | |
Operating income (loss) | | 81,523 | | | | (816 | ) | | | | 7,963 | | | | (436,539 | ) |
Other income (expense): | | | | | | | | | | | | | | | | |
Interest expense, net | | (21,923 | ) | | | (15,936 | ) | | | | (10,243 | ) | | | (146,031 | ) |
Other income (expense) | | 190 | | | | 16,981 | | | | | 8 | | | | 8 | |
Gain (loss) on extinguishment of debt | | (3,034 | ) | | | — | | | | | — | | | | 42,337 | |
Total other income (expense) | | (24,767 | ) | | | 1,045 | | | | | (10,235 | ) | | | (103,686 | ) |
Income (loss) before reorganization items, net and income taxes | | 56,756 | | | | 229 | | | | | (2,272 | ) | | | (540,225 | ) |
Reorganization items, net | | (2,147 | ) | | | (1,119 | ) | | | | (88,774 | ) | | | — | |
Income tax benefit (expense) | | — | | | | 2,176 | | | | | 91 | | | | (173 | ) |
Net income (loss) | | 54,609 | | | | 1,286 | | | | | (90,955 | ) | | | (540,398 | ) |
Net income (loss) attributable to common stockholders/limited partners | $ | 54,609 | | | $ | 1,286 | | | | $ | (90,955 | ) | | $ | (540,398 | ) |
| | | | | | | | | | | | | | | | |
Successor/Predecessor interest in net income (loss): | | | | | | | | | | | | | | | | |
Net income (loss) attributable to Successor/Predecessor | $ | 54,609 | | | $ | 1,286 | | | | $ | (90,955 | ) | | $ | (540,398 | ) |
Net (income) loss allocated to Predecessor's general partner | | — | | | | — | | | | | — | | | | 168 | |
Net (income) loss allocated to participating restricted stockholders | | (2,426 | ) | | | (35 | ) | | | | — | | | | — | |
Net income (loss) available to common stockholders/limited partners | $ | 52,183 | | | $ | 1,251 | | | | $ | (90,955 | ) | | $ | (540,230 | ) |
| | | | | | | | | | | | | | | | |
Earnings per share/unit: (See Note 13) | | | | | | | | | | | | | | | | |
Basic and diluted earnings per share/unit | $ | 2.09 | | | $ | 0.05 | | | | $ | (1.09 | ) | | $ | (6.48 | ) |
Weighted average common shares/unit outstanding: | | | | | | | | | | | | | | | | |
Basic and diluted | | 24,959 | | | | 25,000 | | | | | 83,807 | | | | 83,351 | |
See Accompanying Notes to Consolidated Financial Statements.
F-4
AMPLIFY ENERGY CORP.
STATEMENTS OF CONSOLIDATED CASH FLOWS
(In thousands)
| Successor | | | | Predecessor | |
| For the Year Ended December 31, 2018 | | | Period from May 5, 2017 through December 31, 2017* | | | | Period from January 1, 2017 through May 4, 2017* | | | For the Year Ended December 31, 2016 | |
Cash flows from operating activities: | | | | | | | | | | | | | | | | |
Net income (loss) | $ | 54,609 | | | $ | 1,286 | | | | $ | (90,955 | ) | | $ | (540,398 | ) |
Adjustments to reconcile net income (loss) to net cash provided by operating activities: | | | | | | | | | | | | | | | | |
Depreciation, depletion and amortization | | 52,334 | | | | 35,979 | | | | | 37,717 | | | | 171,629 | |
Impairment of proved oil and natural gas properties | | — | | | | — | | | | | — | | | | 183,437 | |
(Gain) loss on derivative instruments | | (8,155 | ) | | | 31,609 | | | | | (23,076 | ) | | | 118,395 | |
Cash settlements (paid) received on expired derivative instruments | | 10,087 | | | | 30,446 | | | | | 15,895 | | | | 210,704 | |
Cash settlements (paid) on terminated derivatives | | — | | | | — | | | | | 94,146 | | | | 228,646 | |
Bad debt expense | | 106 | | | | — | | | | | — | | | | 2,050 | |
Deferred income tax expense (benefit) | | — | | | | (2,206 | ) | | | | (74 | ) | | | 187 | |
Amortization and write-off of deferred financing costs | | 2,518 | | | | 2,093 | | | | | — | | | | 22,106 | |
Amortization and write-off of senior notes discount | | — | | | | — | | | | | — | | | | 13,185 | |
(Gain) loss on extinguishment of debt | | 3,034 | | | | — | | | | | — | | | | (42,337 | ) |
Accretion of asset retirement obligations | | 5,711 | | | | 4,384 | | | | | 3,407 | | | | 10,231 | |
(Gain) loss on sale of properties | | 3,614 | | | | — | | | | | — | | | | (2,754 | ) |
Share/unit-based compensation (see Note 14) | | 4,374 | | | | 2,516 | | | | | 3,667 | | | | 7,350 | |
Settlement of asset retirement obligations | | (767 | ) | | | (633 | ) | | | | (164 | ) | | | (1,442 | ) |
Exploration costs | | — | | | | — | | | | | — | | | | 792 | |
Reorganization items, net | | — | | | | — | | | | | 68,356 | | | | — | |
Other | | — | | | | — | | | | | 56 | | | | 229 | |
Changes in operating assets and liabilities: | | | | | | | | | | | | | | | | |
Accounts receivable | | 5,783 | | | | (2,830 | ) | | | | 1,024 | | | | 23,928 | |
Prepaid expenses and other assets | | 623 | | | | 5,578 | | | | | 735 | | | | (4,088 | ) |
Payables and accrued liabilities | | 7,925 | | | | (13,590 | ) | | | | 15,030 | | | | 4,084 | |
Other | | (15 | ) | | | 10 | | | | | (266 | ) | | | 2,692 | |
Net cash provided by operating activities | | 141,781 | | | | 94,642 | | | | | 125,498 | | | | 408,626 | |
Cash flows from investing activities: | | | | | | | | | | | | | | | | |
Additions to oil and gas properties | | (55,425 | ) | | | (52,735 | ) | | | | (6,211 | ) | | | (57,675 | ) |
Additions to other property and equipment | | (492 | ) | | | (127 | ) | | | | (76 | ) | | | (7,875 | ) |
Additions to restricted investments | | (500 | ) | | | (495 | ) | | | | (209 | ) | | | (8,443 | ) |
Withdrawals of restricted investments | | 62,467 | | | | — | | | | | — | | | | 4,840 | |
Proceeds from the sale of oil and natural gas properties, net of cash and cash equivalents sold | | 17,113 | | | | — | | | | | — | | | | 52,711 | |
Other | | 503 | | | | — | | | | | — | | | | — | |
Net cash provided by (used in) investing activities | | 23,666 | | | | (53,357 | ) | | | | (6,496 | ) | | | (16,442 | ) |
Cash flows from financing activities: | | | | | | | | | | | | | | | | |
Advances on revolving credit facilities | | 315,000 | | | | 9,000 | | | | | 16,600 | | | | 144,000 | |
Payments on revolving credit facilities | | (397,000 | ) | | | (63,000 | ) | | | | (98,252 | ) | | | (468,348 | ) |
Deferred financing costs | | (3,451 | ) | | | (642 | ) | | | | (8,575 | ) | | | (1,350 | ) |
Payment to holders of the Notes | | — | | | | (8,193 | ) | | | | (16,446 | ) | | | — | |
Payment to Predecessor common unitholders | | — | | | | (1,250 | ) | | | | — | | | | — | |
Contribution from management | | — | | | | 1,500 | | | | | — | | | | — | |
Retirement of common stock under tender offer | | (35,000 | ) | | | — | | | | | — | | | | — | |
Costs incurred in conjunction with tender offer | | (521 | ) | | | — | | | | | — | | | | — | |
Repurchase of senior notes | | — | | | | — | | | | | — | | | | (41,261 | ) |
Contributions related to sale of assets to NGP affiliate | | — | | | | — | | | | | — | | | | 26 | |
Transfer of operating subsidiary from Memorial Resource | | — | | | | — | | | | | — | | | | 2,363 | |
Proceeds from the issuance of Predecessor common units | | — | | | | — | | | | | — | | | | 2,385 | |
Costs incurred in conjunction with issuance of Predecessor common units | | — | | | | — | | | | | — | | | | (536 | ) |
Distributions to partners | | — | | | | — | | | | | — | | | | (13,300 | ) |
Acquisition of Predecessor's general partner (see Note 1) | | — | | | | — | | | | | — | | | | (750 | ) |
Acquisition of incentive distribution rights from NGP (see Note 1) | | — | | | | — | | | | | — | | | | (50 | ) |
Restricted units returned to plan | | (847 | ) | | | — | | | | | (10 | ) | | | (589 | ) |
Other | | 9 | | | | (9 | ) | | | | 9 | | | | — | |
Net cash (used in) provided by financing activities | | (121,810 | ) | | | (62,594 | ) | | | | (106,674 | ) | | | (377,410 | ) |
Net change in cash, cash equivalents and restricted cash | | 43,637 | | | | (21,309 | ) | | | | 12,328 | | | | 14,774 | |
F-5
Cash, cash equivalents and restricted cash, beginning of period | | 6,392 | | | | 27,701 | | | | | 15,373 | | | | 599 | |
Cash, cash equivalents and restricted cash, end of period | $ | 50,029 | | | $ | 6,392 | | | | $ | 27,701 | | | $ | 15,373 | |
See Accompanying Notes to Consolidated Financial Statements.
*See Note 1 for information regarding recast amounts and basis of financial statement presentation.
F-6
AMPLIFY ENERGY CORP.
STATEMENTS OF CONSOLIDATED EQUITY (PREDECESSOR)
(In thousands)
| Partner's Equity | | | | | |
| Limited Partners | | | | | | | | | | |
| Common | | | | General | | | | | |
| Units | | | | Partner | | | Total | |
Balance, December 31, 2015 | | 644,644 | | | | | 848 | | | | 645,492 | |
Net income (loss) | | (540,230 | ) | | | | (168 | ) | | | (540,398 | ) |
Distributions | | (13,289 | ) | | | | (11 | ) | | | (13,300 | ) |
Purchase of equity interest of general partner (see Note 1) | | (81 | ) | | | | (669 | ) | | | (750 | ) |
Acquisition of IDRs from NGP (see Note 1) | | (50 | ) | | | | — | | | | (50 | ) |
Net proceeds from issuance of Predecessor common units | | 1,849 | | | | | — | | | | 1,849 | |
Amortization of equity/unit-based awards | | 7,206 | | | | | — | | | | 7,206 | |
Restricted units repurchased and other | | (560 | ) | | | | — | | | | (560 | ) |
Balance at December 31, 2016 (Predecessor) | | 99,489 | | | | | — | | | | 99,489 | |
Net income (loss) | | (90,955 | ) | | | | — | | | | (90,955 | ) |
Cancellation and amortization of equity/unit-based awards | | 3,713 | | | | | — | | | | 3,713 | |
Restricted units repurchased and other | | (2 | ) | | | | — | | | | (2 | ) |
Issuance of common stock to Predecessor common unitholders | | (7,707 | ) | | | | — | | | | (7,707 | ) |
Issuance of warrants to Predecessor common unitholders | | (4,788 | ) | | | | — | | | | (4,788 | ) |
Contribution from management | | 1,500 | | | | | — | | | | 1,500 | |
Settlement with Predecessor common unitholders | | (1,250 | ) | | | | — | | | | (1,250 | ) |
Balance at May 4, 2017 (Predecessor) | $ | — | | | | $ | — | | | $ | — | |
See Accompanying Notes to Consolidated Financial Statements.
F-7
AMPLIFY ENERGY CORP.
STATEMENTS OF CONSOLIDATED EQUITY (SUCCESSOR)
(In thousands)
| Stockholders' Equity | | | | | |
| Common Stock | | | Warrants | | | Additional Paid-in Capital | | | Accumulated Earnings (Deficit) | | | Total | |
Issuance of Successor common stock to holders of the Notes | $ | 3 | | | $ | — | | | $ | 377,642 | | | $ | — | | | $ | 377,645 | |
Issuance of Successor warrants to Predecessor common unitholders | | — | | | | 4,788 | | | | — | | | | — | | | | 4,788 | |
Issuance of Successor common stock to Predecessor common unitholders | | — | | | | — | | | | 7,707 | | | | — | | | | 7,707 | |
Balance at May 5, 2017 (Successor) | | 3 | | | | 4,788 | | | | 385,349 | | | | — | | | | 390,140 | |
Net income (loss) | | — | | | | — | | | | — | | | | 1,286 | | | | 1,286 | |
Share-based compensation expense | | — | | | | — | | | | 2,516 | | | | — | | | | 2,516 | |
Other | | — | | | | — | | | | (9 | ) | | | — | | | | (9 | ) |
Balance at December 31, 2017 (Successor) | $ | 3 | | | $ | 4,788 | | | $ | 387,856 | | | $ | 1,286 | | | $ | 393,933 | |
Net income (loss) | | — | | | | — | | | | — | | | | 54,609 | | | | 54,609 | |
Tender offer distribution | | — | | | | — | | | | (35,520 | ) | | | — | | | | (35,520 | ) |
Share-based compensation expense | | — | | | | — | | | | 4,374 | | | | — | | | | 4,374 | |
Restricted shares repurchased | | — | | | | — | | | | (847 | ) | | | — | | | | (847 | ) |
Other | | — | | | | — | | | | 9 | | | | — | | | | 9 | |
Balance at December 31, 2018 (Successor) | $ | 3 | | | $ | 4,788 | | | $ | 355,872 | | | $ | 55,895 | | | $ | 416,558 | |
See Accompanying Notes to Consolidated Financial Statements.
F-8
AMPLIFY ENERGY CORP.
NOTES TO CONSOLIDATED FINANCIAL STATEMENTS
Note 1. Organization and Basis of Presentation
General
When referring to Amplify Energy Corp. (formerly known as Memorial Production Partners LP and also referred to as “Successor,” “Amplify Energy,” or the “Company”), the intent is to refer to Amplify Energy, a newly formed Delaware corporation, and its consolidated subsidiaries as a whole or on an individual basis, depending on the context in which the statements are made. Amplify Energy is the successor reporting company of Memorial Production Partners LP (“MEMP”) pursuant to Rule 15d-5 of the Securities Exchange Act of 1934, as amended. When referring to the “Predecessor” or the “Company” in reference to the period prior to the emergence from bankruptcy, the intent is to refer to MEMP, the predecessor that was dissolved following the effective date of the Plan (as defined below) and its consolidated subsidiaries as a whole or on an individual basis, depending on the context in which the statements are made.
We operate in one reportable segment engaged in the acquisition, development, exploitation and production of oil and natural gas properties. Our management evaluates performance based on one reportable business segment as there are not different economic environments within the operation of our oil and natural gas properties. Our assets consist primarily of producing oil and natural gas properties located in the Rockies, federal waters offshore Southern California, East Texas / North Louisiana and South Texas. Most of our oil and natural gas properties are located in large, mature oil and natural gas reservoirs. The Company’s properties consist primarily of operated and non-operated working interests in producing and undeveloped leasehold acreage and working interests in identified producing wells.
Unless the context requires otherwise, references to: (i) our “Predecessor’s general partner” and “MEMP GP” refer to Memorial Production Partners GP LLC, our Predecessor’s general partner, which was dissolved following the effective date of the Plan; (ii) “Memorial Resource” refers to Memorial Resource Development Corp., the former owner of our Predecessor’s general partner; (iii) “MRD LLC” refers to Memorial Resource Development LLC, which is the predecessor of Memorial Resource; (iv) “the Funds” refers collectively to Natural Gas Partners VIII, L.P., Natural Gas Partners IX, L.P. and NGP IX Offshore Holdings, L.P., which collectively controlled MRD Holdco LLC; (v) “OLLC” refers to Amplify Energy Operating LLC, formerly known as Memorial Production Operating LLC, our wholly owned subsidiary through which we operate our properties; (vi) “Finance Corp.” refers to Memorial Production Finance Corporation, our Predecessor’s wholly owned subsidiary, whose activities were limited to co-issuing our debt securities and engaging in other activities incidental thereto and which was dissolved following the effective date of the Plan; and (vii) “NGP” refers to Natural Gas Partners.
MEMP GP Acquisition
On April 27, 2016, we entered into an agreement pursuant to which the Predecessor agreed to acquire, among other things, all of the equity interests in our Predecessor’s general partner, MEMP GP, from Memorial Resource (the “MEMP GP Acquisition”) for cash consideration of approximately $0.8 million. MEMP GP held an approximate 0.1% general partner interest and 50% of the incentive distribution rights ("IDRs") in us. In conjunction with the MEMP GP Acquisition, on April 27, 2016, we also entered into an agreement with an NGP affiliate pursuant to which we agreed to acquire the other 50% of the IDRs. The acquisition was accounted for as an equity transaction and no gain or loss was recognized as a result of the acquisition.
In connection with the closing of the transactions on June 1, 2016, our Predecessor’s partnership agreement was amended and restated to, among other things, (i) convert the 0.1% general partner interest in the Predecessor held by MEMP GP into a non-economic general partner interest, (ii) cancel the IDRs, and (iii) provide that the limited partners of the Predecessor will have the ability to elect the members of MEMP GP’s board of directors. In addition, we terminated the Predecessor’s Omnibus Agreement under which Memorial Resource provided management, administrative and operations personnel to us and our Predecessor’s general partner, and we entered into a transition services agreement with Memorial Resource to manage certain post-closing separation costs and activities. See Note 16 for additional information regarding the MEMP GP Acquisition and the transition services agreement.
Emergence from Voluntary Reorganization under Chapter 11
On January 16, 2017 (the “Petition Date”), MEMP and certain of its subsidiaries (collectively with MEMP, the “Debtors”) filed voluntary petitions (the cases commenced thereby, the “Chapter 11 proceedings”) under Chapter 11 of Title 11 of the United States Code (the “Bankruptcy Code” or “Chapter 11”) in the United States Bankruptcy Court for the Southern District of Texas, Houston Division (the “Bankruptcy Court”). The Debtors’ Chapter 11 proceedings were jointly administered under the caption In re: Memorial Production Partners LP, et al. (Case No. 17-30262). On April 14, 2017, the Bankruptcy Court entered an order approving the Second Amended Joint Plan of Reorganization of Memorial Production Partners LP and its affiliated Debtors, dated April 13, 2017 (as amended and supplemented, the “Plan”). On May 4, 2017 (the “Effective Date”), the Debtors satisfied the conditions to effectiveness of the Plan, the Plan became effective in accordance with its terms and the Company emerged from bankruptcy.
F-9
AMPLIFY ENERGY CORP.
NOTES TO CONSOLIDATED FINANCIAL STATEMENTS
Management and Board Changes
On April 27, 2018, the board of directors appointed Martyn Willsher to serve as Senior Vice President and Chief Financial Officer of the Company, effective April 27, 2018.
On May 1, 2018, the Company announced the retirement of William J. Scarff, the Company’s President and Chief Executive Officer and member of the board of directors, which retirement became effective May 14, 2018. Also on May 1, 2018, the Company announced the departure of Christopher S. Cooper, Senior Vice President and Chief Operating Officer, and Robert L. Stillwell, Jr., Senior Vice President and Chief Financial Officer, from their respective positions with the Company, effective April 27, 2018. There were no disagreements between the Company and any of Messrs. Scarff, Cooper or Stillwell (collectively, the “Departing Executives”) which led to their retirement or separation (as applicable) from the Company.
On May 4, 2018, the board of directors appointed Kenneth Mariani to serve as President and Chief Executive Officer of the Company, effective May 14, 2018.
On May 17, 2018, Mr. Scarff resigned from the board of directors of the Company. There were no disagreements between Mr. Scarff and the Company which led to Mr. Scarff’s resignation from the board of directors. Also on May 17, 2018, the board of directors appointed Mr. Mariani to serve as a director of the Company to fill the vacancy caused by Mr. Scarff’s resignation.
On July 25, 2018, the board of directors appointed Denise DuBard to serve as Vice President and Chief Accounting Officer of the Company, effective August 9, 2018.
Also on July 25, 2018, Matthew J. Hoss tendered his resignation from his position as Vice President and Chief Accounting Officer of the Company, effective August 9, 2018. There were no disagreements between Mr. Hoss and the Company which led to his separation from the Company.
Basis of Presentation
Our Consolidated Financial Statements included herein have been prepared pursuant to the rule and guidelines of the Securities and Exchange Commission (the “SEC”).
All material intercompany transactions and balances have been eliminated in preparation of our Consolidated Financial Statements. The accompanying Consolidated Financial Statements have been prepared in accordance with accounting principles generally accepted in the United States of America (“GAAP”). Certain amounts in the prior year financial statements have been reclassified to conform to current presentation. Gain (loss) on extinguishment of deferred finance cost were previously accounted for as interest expense, net and are now being presented as gain (loss) on extinguishment of debt on our Statement of Consolidated Operations.
The Consolidated Financial Statements have been prepared as if the Company is a going concern and reflect the application of Accounting Standards Codification 852 “Reorganizations” (“ASC 852”). ASC 852 requires that the financial statements, for periods subsequent to the Chapter 11 filing, distinguish transactions and events that are directly associated with the reorganization from the ongoing operations of the business. Accordingly, certain expenses, gains and losses that were realized or incurred in the bankruptcy proceedings are recorded in “reorganization items, net” on the Company’s Statement of Consolidated Operations.
The Company adopted the new accounting pronouncement related to the presentation of statement of cash flows — restricted cash in the first quarter of 2018. See Note 4 for additional information. A retrospective change for the period from January 1, 2017 through May 4, 2017 and May 5, 2017 through December 31, 2017 on the Statement of Consolidated Cash Flows as previously presented was required due to adoption. The table below sets forth the retrospective adjustments for the periods presented:
| Predecessor | |
| Previously Reported Period from January 1, 2017 through May 4, 2017 | | | Adjustment Effect | | | As Adjusted Period from January 1, 2017 through May 4, 2017 | |
| (In thousands) | |
Changes in operating assets and liabilities: | | | | | | | | | | | |
Restricted cash | $ | (7,561 | ) | | $ | 7,561 | | | $ | — | |
Net cash provided by operating activities | | 117,937 | | | | 7,561 | | | | 125,498 | |
Net change in cash and cash equivalents | | 4,767 | | | | 7,561 | | | | 12,328 | |
Cash and cash equivalents, end of period | | 20,140 | | | | 7,561 | | | | 27,701 | |
F-10
AMPLIFY ENERGY CORP.
NOTES TO CONSOLIDATED FINANCIAL STATEMENTS
| Successor | |
| Previously Reported Period from May 5, 2017 through December 31, 2017 | | | Adjustment Effect | | | As Adjusted Period from May 5, 2017 through December 30, 2017 | |
| (In thousands) | |
Changes in operating assets and liabilities: | | | | | | | | | | | |
Restricted cash | $ | 7,561 | | | $ | (7,561 | ) | | $ | — | |
Net cash provided by operating activities | | 102,203 | | | | (7,561 | ) | | | 94,642 | |
Net change in cash and cash equivalents | | (13,748 | ) | | | (7,561 | ) | | | (21,309 | ) |
Cash and cash equivalents, end of period | | 6,392 | | | | — | | | | 6,392 | |
Comparability of Financial Statements to Prior Periods
As discussed in further detail in Note 3 below, we adopted and applied the relevant guidance provided in GAAP with respect to the accounting and financial statement disclosures for entities that have emerged from bankruptcy proceedings (“Fresh Start Accounting”). Accordingly, our Consolidated Financial Statements and Notes after May 4, 2017, are not comparable to the Consolidated Financial Statements and Notes prior to that date. To facilitate our financial statement presentations, we refer to the reorganized company in these Consolidated Financial Statements and Notes as the “Successor” for periods subsequent to May 4, 2017 and “Predecessor” for periods prior to May 5, 2017. Furthermore, our Consolidated Financial Statements and Notes have been presented with a “black line” division to delineate the lack of comparability between the Predecessor and Successor.
Note 2. Emergence from Voluntary Reorganization under Chapter 11
On the Petition Date, the Debtors filed voluntary petitions under the Bankruptcy Code in the Bankruptcy Court to pursue a Joint Chapter 11 Plan of Reorganization for the Debtors. The Debtors’ Chapter 11 proceedings were jointly administered under the caption In re Memorial Production Partners LP, et al. (Case No. 17-30262).
On April 14, 2017, the Bankruptcy Court entered an order (the “Confirmation Order”) approving the Plan.
On the Effective Date, the Debtors satisfied the conditions to effectiveness of the Plan, the Plan became effective in accordance with its terms and the Company emerged from bankruptcy. Although the Company is no longer a debtor-in-possession, the Company was a debtor-in-possession from January 16, 2017 through May 4, 2017. As such, certain aspects of the Chapter 11 proceedings and related matters are described below in order to provide context to the Company’s financial condition and results of operations for the period presented.
Plan of Reorganization
In accordance with the Plan, on the Effective Date:
| • | The Successor issued (i) 25,000,000 new shares (the “New Common Shares”) of its common stock, par value $0.0001 per share (“common stock”); and (ii) warrants (the “Warrants”) to purchase up to 2,173,913 shares of the Company’s common stock exercisable for a five-year period commencing on the Effective Date entitling their holders upon exercise thereof, on a pro rata basis, to 8% of the total issued and outstanding common shares (including common shares as of the Effective Date issuable upon full exercise of the Warrants, but excluding any common shares issuable under the Management Incentive Plan (the “MIP”)), at a per share exercise price of $42.60. |
| • | The holders of claims under the Predecessor’s revolving credit facility received a full recovery, consisting of a cash pay down and their pro rata share of the $1 billion exit senior secured reserve-based revolving credit facility (the “Emergence Credit Facility”), as further discussed in Note 11. |
| • | The 7.625% senior notes due May 2021 (“2021 Senior Notes”) and 6.875% senior notes due August 2022 (“2022 Senior Notes” and collectively, the “Notes”) were cancelled and the Predecessor’s liability thereunder discharged, and the holders of the Notes received (directly or indirectly) their pro rata share of New Common Shares representing, in the aggregate, 98% of the New Common Shares on the Effective Date (subject to dilution by the MIP and the common shares issuable upon exercise of the Warrants). Additionally, the holders of the Notes received their pro rata share of a $24.6 million cash distribution. |
F-11
AMPLIFY ENERGY CORP.
NOTES TO CONSOLIDATED FINANCIAL STATEMENTS
| • | The Predecessor’s common units were cancelled, and each common unitholder received its pro rata share of: (i) 2% of the New Common Shares, (ii) the Warrants, and (iii) cash in an aggregate amount of approximately $1.3 million. |
| • | The holders of administrative expense claims, priority tax claims, other priority claims and general unsecured creditors of the Predecessor received in exchange for their claims payment in full in cash or otherwise had their rights unimpaired under Title 11 of the United States Code. |
| • | The Successor entered into a stockholders agreement with certain parties pursuant to which the Successor agreed to, at the direction of such stockholders, use commercially reasonable efforts to effect the sale of their common stock. |
| • | The Successor entered into a registration rights agreement with certain parties pursuant to which the Successor agreed to, among other things, file a registration statement with the SEC within 90 days of the receipt of a request from the stockholders party thereto covering the offer and resale of the common stock held by such stockholders. |
| • | The Company’s MIP became effective, such that an aggregate of 2,322,404 shares of the Company’s common stock became available for grant pursuant to awards under the MIP. |
| • | The terms of the Predecessor’s general partner’s board of directors automatically expired on the Effective Date. The Successor formed a new seven-member board of directors consisting of the President and Chief Executive Officer, one director of the Predecessor, and five new members designated by certain parties to the plan support agreement. |
Note 3. Fresh Start Accounting
Upon emergence from the Chapter 11 proceedings on May 4, 2017, we adopted fresh start accounting as required by GAAP. We met the requirements of fresh start accounting, which include: (i) the holders of the Predecessor’s voting common units immediately prior to the Effective Date received less than 50% of the voting shares of the Company and (ii) the reorganization value of our assets immediately prior to the Effective Date was less than the post-petition liabilities and allowed claims.
Reorganization Value
The Successor’s enterprise value, as approved by the Bankruptcy Court, was estimated to be within a range of $700 million to $900 million, with a midpoint estimate of approximately $800 million. Enterprise value represents the estimated fair value of a company’s interest-bearing debt and its shareholders’ equity. Based on the estimates and assumptions utilized in our fresh start accounting process, we estimated the Successor’s enterprise value to be approximately $800 million before the consideration of cash and cash equivalents on hand at the Effective Date. Reorganization value represents the fair value of the Successor’s total assets prior to the consideration of liabilities and is intended to approximate the amount a willing buyer would pay for the assets immediately after a restructuring. The reorganization value, which was derived from the Successor’s enterprise value, was allocated to our individual assets based on their estimated fair values.
The following table is a reconciliation of the enterprise value to the reorganization value of the Successor assets at the Effective Date (in thousands):
Enterprise value | $ | 800,000 | |
Plus: Cash and cash equivalents | | 20,140 | |
Plus: Other working capital liabilities | | 63,817 | |
Plus: Other long-term liabilities | | 97,470 | |
Reorganization value of Successor assets | $ | 981,427 | |
Our assets consist primarily of producing oil and natural gas properties. The fair values of proved and unproved oil and natural gas properties were estimated using valuation techniques consistent with the income approach, converting future cash flows to a single discounted amount. The factors to determine fair value include, but are not limited to, estimates of: (i) economic reserves; (ii) future operating and development costs; (iii) future commodity prices; and (iv) a market-based weighted average cost of capital. These inputs require significant judgments and estimates by the Company’s management at the time of the valuation and are the most sensitive and subject to change. The underlying commodity prices embedded in the Company’s estimated cash flows are the product of a process that begins with NYMEX forward curve pricing and is adjusted for estimated location and quality differentials, as well as other factors as necessary that the Company’s management believes will impact realizable prices. The fair value of support equipment and facilities were estimated using a cost approach, based on current replacement costs of the assets less depreciation based on the estimated economic useful lives of the assets and age of the assets.
See below under the caption “Fresh Start Adjustments” for additional information regarding assumptions used in the valuation of the Company’s various other significant assets and liabilities.
F-12
AMPLIFY ENERGY CORP.
NOTES TO CONSOLIDATED FINANCIAL STATEMENTS
Condensed Consolidated Balance Sheet
The adjustments included in the following condensed consolidated balance sheet reflected the effect of the transactions contemplated by the Plan (reflected in the column “Reorganization Adjustments”) as well as fair value and other required accounting adjustments resulting from the adoption of fresh start accounting (reflected in the column “Fresh Start Adjustments”). The explanatory notes provide additional information with regard to the adjustments recorded, the methods used to determine the fair values and significant assumptions.
| As of May 4, 2017 | |
| | | | | Reorganization | | | | Fresh Start | | | | | |
| Predecessor | | | Adjustments (1) | | | | Adjustments | | | Successor | |
| (In thousands) | |
ASSETS | | | | | | | | | | | | | | | | |
Current assets: | | | | | | | | | | | | | | | | |
Cash and cash equivalents | $ | 83,050 | | | $ | (62,910 | ) | | (2) | $ | — | | | $ | 20,140 | |
Restricted cash | | — | | | | 7,411 | | | (3) | | — | | | | 7,411 | |
Accounts receivable | | 33,560 | | | | — | | | | | — | | | | 33,560 | |
Short-term derivative instruments | | 51,329 | | | | — | | | | | — | | | | 51,329 | |
Prepaid expenses and other current assets | | 10,229 | | | | 675 | | | (4) | | — | | | | 10,904 | |
Total current assets | | 178,168 | | | | (54,824 | ) | | | | — | | | | 123,344 | |
Property and equipment, net | | 1,551,500 | | | | — | | | | | (894,164 | ) | (11) | | 657,336 | |
Long-term derivative instruments | | 33,800 | | | | — | | | | | — | | | | 33,800 | |
Restricted investments | | 156,443 | | | | — | | | | | — | | | | 156,443 | |
Other long-term assets | | 1,929 | | | | 8,575 | | | (5) | | — | | | | 10,504 | |
Total assets | $ | 1,921,840 | | | $ | (46,249 | ) | | | $ | (894,164 | ) | | $ | 981,427 | |
| | | | | | | | | | | | | | | | |
LIABILITIES AND EQUITY | | | | | | | | | | | | | | | | |
Current liabilities: | | | | | | | | | | | | | | | | |
Accounts payable | $ | 1,501 | | | $ | 1,389 | | | (6) | $ | — | | | $ | 2,890 | |
Revenues payable | | 22,747 | | | | — | | | | | — | | | | 22,747 | |
Accrued liabilities | | 36,954 | | | | 2,939 | | | (7) | | (1,713 | ) | (12) | | 38,180 | |
Current portion of long-term debt | | 454,799 | | | | (454,799 | ) | | (8) | | — | | | | — | |
Total current liabilities | | 516,001 | | | | (450,471 | ) | | | | (1,713 | ) | | | 63,817 | |
Liabilities subject to compromise | | 1,162,437 | | | | (1,162,437 | ) | | (9) | | — | | | | — | |
Long-term debt | | — | | | | 430,000 | | | (8) | | — | | | | 430,000 | |
Asset retirement obligations | | 158,114 | | | | — | | | | | (62,928 | ) | (13) | | 95,186 | |
Deferred tax liabilities | | 2,206 | | | | — | | | | | — | | | | 2,206 | |
Other long-term liabilities | | 2,481 | | | | — | | | | | (2,403 | ) | (12) | | 78 | |
Total liabilities | | 1,841,239 | | | | (1,182,908 | ) | | | | (67,044 | ) | | | 591,287 | |
Commitments and contingencies (see Note 17) | | | | | | | | | | | | | | | | |
Stockholders'/partners' equity: | | | | | | | | | | | | | | | | |
Predecessor common units | | 80,601 | | | | (80,601 | ) | | (10) | | — | | | | — | |
Successor warrants | | — | | | | 4,788 | | | (10) | | — | | | | 4,788 | |
Successor common stock | | — | | | | 3 | | | (10) | | — | | | | 3 | |
Successor additional paid-in capital | | — | | | | 1,212,469 | | | (10) | | (827,120 | ) | (14) | | 385,349 | |
Total stockholders'/ partners' equity | | 80,601 | | | | 1,136,659 | | | | | (827,120 | ) | | | 390,140 | |
Total liabilities and equity | $ | 1,921,840 | | | $ | (46,249 | ) | | | $ | (894,164 | ) | | $ | 981,427 | |
Reorganization Adjustments
(1) | Reflected amounts recorded as of the Effective Date for the implementation of the Plan, including among other items, settlement of the Predecessor’s liabilities subject to compromise, cancellation of the Predecessor’s equity, issuance of the Successor New Common Shares and the Warrants, repayment of certain of Predecessor’s debt and settlement with holders of the Notes. |
F-13
AMPLIFY ENERGY CORP.
NOTES TO CONSOLIDATED FINANCIAL STATEMENTS
(2) | Reflected the changes in cash and cash equivalents, including the following (in thousands): |
Payment on the Predecessor's revolving credit facility | $ | (24,799 | ) |
Payment to holders of the Notes (1) | | (16,446 | ) |
Payment of fees related to Emergence Credit Facility | | (8,575 | ) |
Funding of the professional fees escrow account | | (7,411 | ) |
Payment of professional fees | | (4,295 | ) |
Other | | (1,384 | ) |
Changes in cash and cash equivalents | $ | (62,910 | ) |
| (1) | The total cash settlement to the holders of the Notes was approximately $24.6 million, of which $16.4 million was paid upon emergence and $8.2 million was paid post-emergence and is reflected in accrued liabilities in the above condensed consolidated balance sheet. |
(3) | Reflected the transfer to restricted cash to fund the professional fees escrow account. |
(4) | Reflected the pre-payment of certain professional fees. |
(5) | Reflected the deferred financing costs related to the Emergence Credit Facility. |
(6) | Reflected the recognition of payables for general unsecured claims. |
(7) | Net increase in accrued liabilities reflected the following (in thousands): |
Recognition of liability for settlement with holders of the Notes | $ | 8,193 | |
Payment of professional fees | | (4,295 | ) |
Recognition of contribution from management | | (1,500 | ) |
Recognition of settlement with Predecessor common unitholders | | 1,250 | |
Other | | (709 | ) |
Net increase in accrued liabilities due to reorganization items | $ | 2,939 | |
(8) | Reflected a repayment of $24.8 million on the Predecessor’s revolving credit facility and the reclassification of $430.0 million in borrowings under the Emergence Credit Facility to long-term debt. |
(9) | Settlement of liabilities subject to compromise and the resulting net gain were determined as follows (in thousands): |
Accounts payable | $ | 1,389 | |
Accrued interest payable | | 49,796 | |
Debt | | 1,111,252 | |
Total liabilities subject to compromise of Predecessor | | 1,162,437 | |
Recognition of payables for general unsecured claims | | (1,389 | ) |
Recognition of settlement with holders of the Notes | | (24,639 | ) |
Issuance of common stock to holders of the Notes | | (377,645 | ) |
Gain on settlement of liabilities subject to compromise | $ | 758,764 | |
(10) | Net increase in our stockholders’/partners’ equity reflects the following (in thousands): |
Issuance of common stock to holders of the Notes | $ | 377,645 | |
Issuance of common stock to Predecessor common unitholders | | 7,707 | |
Cancellation of the Predecessor's units issued and outstanding | | 80,601 | |
Recognition on gain on settlement of liabilities subject to compromise | | 758,764 | |
Recognition of issuance of common stock to Predecessor common unitholders | | (7,707 | ) |
Recognition of issuance of warrants to Predecessor common unitholders | | (4,788 | ) |
Recognition of contribution from management | | 1,500 | |
Recognition of settlement with Predecessor common unitholders | | (1,250 | ) |
Par value of common stock | | (3 | ) |
Change in Successor additional paid-in capital | | 1,212,469 | |
Issuance of warrants to Predecessor common unitholders | | 4,788 | |
Par value of common stock | | 3 | |
Predecessor units issued and outstanding | | (80,601 | ) |
Net increase in capital accounts | $ | 1,136,659 | |
F-14
AMPLIFY ENERGY CORP.
NOTES TO CONSOLIDATED FINANCIAL STATEMENTS
Fresh Start Adjustments
(11) | Reflected a decrease of property and equipment, net based on the methodology discussed above and the elimination of accumulated depreciation, depletion and impairment. The fresh start adjustments to property and equipment, net are as follow: |
| Predecessor | | | Fresh Start Adjustments | | | Successor | |
| (In thousands) | |
Property and equipment at cost: | | | | | | | | | | | |
Proved oil and natural gas properties | $ | 3,124,137 | | | $ | (2,615,076 | ) | | $ | 509,061 | |
Support equipment and facilities | | 199,463 | | | | (101,883 | ) | | | 97,580 | |
Unproved oil and natural gas properties | | — | | | | 44,688 | | | | 44,688 | |
Other | | 15,420 | | | | (9,413 | ) | | | 6,007 | |
Property and equipment | | 3,339,020 | | | | (2,681,684 | ) | | | 657,336 | |
Accumulated depreciation, depletion and impairment | | (1,787,520 | ) | | | 1,787,520 | | | | — | |
Property and equipment, net | $ | 1,551,500 | | | $ | (894,164 | ) | | $ | 657,336 | |
(12) | Reflected the write-off of the deferred rent and loss on sublease liabilities. |
(13) | Reflected a decrease of $62.9 million for asset retirement obligations. The fair value of asset retirement obligations was estimated using valuation techniques that convert future cash flows to a single discounted amount. Significant inputs to the valuation include estimates of: (i) plugging and abandonment costs per well based on existing regulatory requirements; (ii) remaining life per well; (iii) future inflation factors; and (iv) a credit-adjusted risk free rate. |
(14) | Reflected the cumulative impact of our fresh start accounting adjustments discussed above. |
Reorganization Items, Net
The Company has incurred significant costs associated with the reorganization. These costs, which are expensed as incurred, were expected to significantly affect the Company’s results of operations. Reorganization items, net represent costs and income directly associated with the Chapter 11 proceedings since the Petition Date.
The following table summarizes the components of reorganization items, net included in the accompanying Statements of Consolidated Operations (in thousands):
| Successor | | | | Predecessor | |
| | | | | Period from | | | | Period from | |
| For the | | | May 5, 2017 | | | | January 1, | |
| Year Ended | | | through | | | | 2017 through | |
| December 31, 2018 | | | December 31, 2017 | | | | May 4, 2017 | |
Gain on settlement of liabilities subject to compromise | $ | — | | | $ | — | | | | $ | 758,764 | |
Fresh start valuation adjustments | | — | | | | — | | | | | (827,120 | ) |
Professional fees | | (864 | ) | | | (724 | ) | | | | (19,824 | ) |
Other | | (1,283 | ) | | | (395 | ) | | | | (594 | ) |
Reorganization items, net | $ | (2,147 | ) | | $ | (1,119 | ) | | | $ | (88,774 | ) |
Note 4. Summary of Significant Accounting Policies
Fresh Start Accounting
Upon the Effective Date, we adopted fresh start accounting as required by GAAP. We met the requirements of fresh start accounting, which include: (i) the holders of the Predecessor’s voting common units immediately prior to the Effective Date received less than 50% of the voting shares of the Company and (ii) the reorganization value of our assets immediately prior to the Effective Date was less than the post-petition liabilities and allowed claims. Fresh start accounting involved a comprehensive valuation process in which we determined the fair value of all of our assets and liabilities on the Effective Date. See Note 3 for additional information.
F-15
AMPLIFY ENERGY CORP.
NOTES TO CONSOLIDATED FINANCIAL STATEMENTS
Use of Estimates
The preparation of Consolidated Financial Statements in conformity with GAAP requires management to make estimates and assumptions that affect the reported amounts of assets and liabilities and disclosure of contingent assets and liabilities at the date of the Consolidated Financial Statements and the reported amounts of revenues and expenses during the reporting period. Actual results could differ from those estimates.
Significant estimates include, but are not limited to, oil and natural gas reserves; depreciation, depletion and amortization of proved oil and natural gas properties; future cash flows from oil and natural gas properties; impairment of long-lived assets; fair value of derivatives; fair value of equity compensation; fair values of assets acquired and liabilities assumed in business combinations and asset retirement obligations.
Cash and Cash Equivalents
Cash and cash equivalents represent unrestricted cash on hand and all highly liquid investments with original contractual maturities of three months or less.
Concentrations of Credit Risk
Cash balances, accounts receivable, restricted investments and derivative financial instruments are financial instruments potentially subject to credit risk. Cash and cash equivalents are maintained in bank deposit accounts which, at times, may exceed the federally insured limits. Management periodically reviews and assesses the financial condition of the banks to mitigate the risk of loss. Various restricted investment accounts fund certain long-term contractual and regulatory asset retirement obligations and collateralize certain regulatory bonds associated with the offshore Southern California oil and gas properties. These restricted investments consist of money market deposit accounts which are held with credit-worthy financial institutions. Derivative financial instruments are generally executed with major financial institutions that expose us to market and credit risks and which may, at times, be concentrated with certain counterparties. The credit worthiness of the counterparties is subject to continual review. We rely upon netting arrangements with counterparties to reduce credit exposure.
Oil and natural gas are sold to a variety of purchasers, including intrastate and interstate pipelines or their marketing affiliates and independent marketing companies. Accounts receivable from joint operations are from a number of oil and natural gas companies, individuals and others who own interests in the properties operated by us. Generally, operators of crude oil and natural gas properties have the right to offset future revenues against unpaid charges related to operated wells, minimizing the credit risk associated with these receivables. Additionally, management believes that any credit risk imposed by a concentration in the oil and natural gas industry is mitigated by the creditworthiness of its customer base. An allowance for doubtful accounts is recorded after all reasonable efforts have been exhausted to collect or settle the amount owed. Any amounts outstanding longer than the contractual terms are considered past due. We recorded $1.2 million and $1.9 million as an allowance for doubtful accounts at December 31, 2018 and 2017, respectively.
If we were to lose any one of our customers, the loss could temporarily delay the production and the sale of oil and natural gas in the related producing region. If we were to lose any single customer, we believe that a substitute customer to purchase the impacted production volumes could be identified.
Oil and Natural Gas Properties
Oil and natural gas exploration, development and production activities are accounted for in accordance with the successful efforts method of accounting. Under this method, costs of acquiring properties, costs of drilling successful exploration wells and development costs are capitalized. The costs of exploratory wells are initially capitalized pending a determination of whether proved reserves have been found. At the completion of drilling activities, the costs of exploratory wells remain capitalized if determination is made that proved reserves have been found. If no proved reserves have been found, the costs of each of the related exploratory wells are charged to expense. In some cases, a determination of proved reserves cannot be made at the completion of drilling, requiring additional testing and evaluation of the wells. The costs of such exploratory wells are expensed if a determination of proved reserves has not been made within a twelve-month period after drilling is complete. Exploration costs such as geological, geophysical, seismic costs and delay rental payments attributable to unproved locations are expensed as incurred.
As exploration and development work progresses and the reserves on these properties are proven, capitalized costs attributed to the properties are subject to depreciation and depletion. Depletion of capitalized costs is provided using the units-of-production method based on proved oil and gas reserves related to the associated field. Capitalized drilling and development costs of producing oil and natural gas properties are depleted over proved developed reserves and leasehold costs are depleted over total proved reserves. Support equipment and facilities, which are primarily related to our Wyoming and California assets, are depreciated using the straight-line method generally based on estimated useful lives of twelve to twenty-four years.
F-16
AMPLIFY ENERGY CORP.
NOTES TO CONSOLIDATED FINANCIAL STATEMENTS
On the sale or retirement of a complete or partial unit of a proved property or pipeline and related facilities, the cost and related accumulated depreciation, depletion, and amortization are removed from the property accounts, and any gain or loss is recognized.
There were no material capitalized exploratory drilling costs pending evaluation at December 31, 2018 and 2017.
Oil and Natural Gas Reserves
The estimates of proved oil and natural gas reserves utilized in the preparation of the Consolidated Financial Statements are estimated in accordance with the rules established by the SEC and the Financial Accounting Standards Board (“FASB”). These rules require that reserve estimates be prepared under existing economic and operating conditions using a trailing 12-month average price with no provision for price and cost escalations in future years except by contractual arrangements. We engaged Ryder Scott Company, L.P. (“Ryder Scott”), our independent reserve engineers, to audit our internally prepared reserves estimates for all of our estimated proved reserves (by volume) at December 31, 2018.
Reserve estimates are inherently imprecise. Accordingly, the estimates are expected to change as more current information becomes available. It is possible that, because of changes in market conditions or the inherent imprecision of reserve estimates, the estimates of future cash inflows, future gross revenues, the amount of oil and natural gas reserves, the remaining estimated lives of oil and natural gas properties, or any combination of the above may be increased or decreased. Increases in recoverable economic volumes generally reduce per unit depletion rates while decreases in recoverable economic volumes generally increase per unit depletion rates.
Other Property & Equipment
Other property and equipment is stated at historical cost and is comprised primarily of vehicles, furniture, fixtures, office build-out cost and computer hardware and software. Depreciation of other property and equipment is calculated using the straight-line method generally based on estimated useful lives of three to seven years.
Restricted Investments
Various restricted investment accounts fund certain long-term contractual and regulatory asset retirement obligations and collateralize certain regulatory bonds associated with the offshore Southern California oil and gas properties. These investments are classified as held-to-maturity and such investments are stated at amortized cost. Interest earned on these investments is included in interest expense, net in the statement of operations. These restricted investments may consist of money market deposit accounts and U.S. Government securities. See Note 17 for additional information.
Debt Issuance Costs
These costs are recorded on the balance sheet and amortized over the term of the associated debt using the straight-line method which generally approximates the effective yield method. Amortization expense, including write-off of debt issuance costs, for the year ended December 31, 2018, the period from May 5, 2017 through December 31, 2017 and the year ended December 31, 2016 was approximately $2.5 million, $2.1 million, and $22.1 million, respectively. No amortization of deferred financing cost was recorded for the period from January 1, 2017 through May 4, 2017 as the unamortized amount of deferred financing cost at December 31, 2016 was written off due to (i) the uncertainty regarding the Predecessor’s ability to cure the default that existed at December 31, 2016, (ii) the Predecessor’s inability to comply with certain financial covenants contained in our Predecessor’s revolving credit facility and (iii) the default or cross default provisions in the indentures governing the 2021 Senior Notes and 2022 Senior Notes.
Impairments
Proved oil and natural gas properties are reviewed for impairment when events and circumstances indicate the carrying value of such properties may not be recoverable. This may be due to a downward revision of the reserve estimates, less than expected production, drilling results, higher operating and development costs, or lower commodity prices. The estimated undiscounted future cash flows expected in connection with the property are compared to the carrying value of the property to determine if the carrying amount is recoverable. If the carrying value of the property exceeds its estimated undiscounted future cash flows, the carrying amount of the property is reduced to its estimated fair value using Level 3 inputs. The factors used to determine fair value include, but are not limited to, estimates of proved and probable reserves, future commodity prices, the timing of future production and capital expenditures and a discount rate commensurate with the risk reflective of the lives remaining for the respective oil and gas properties. No impairment expense was recorded for the year ended December 31, 2018, the period from May 5, 2017 through December 31, 2017 or the period from January 1, 2017 through May 4, 2017. Impairment expense for the year ended December 31, 2016 was approximately $183.4 million.
F-17
AMPLIFY ENERGY CORP.
NOTES TO CONSOLIDATED FINANCIAL STATEMENTS
Unproved oil and natural gas properties are reviewed for impairment based on time or geologic factors. Information such as drilling results, reservoir performance, seismic interpretation or future plans to develop acreage is also considered. When unproved property investments are deemed to be impaired, the expense is reported in exploration expenses. We did not record any impairments related to unproved properties for the year ended December 31, 2018, 2017 and 2016.
Asset Retirement Obligations
An asset retirement obligation associated with retiring long-lived assets is recognized as a liability on a discounted basis in the period in which the legal obligation is incurred and becomes determinable, with an equal amount capitalized as an addition to oil and natural gas properties, which is allocated to expense over the useful life of the asset. Generally, oil and gas producing companies incur such a liability upon acquiring or drilling a well. Accretion expense is recognized over time as the discounted liabilities are accreted to their expected settlement value. Upon settlement of the liability, a gain or loss is recognized in net income (loss) to the extent the actual costs differ from the recorded liability. See Note 9 for further discussion of asset retirement obligations.
Book Overdrafts
Book overdrafts, representing outstanding checks in excess of funds on deposit, are classified as accounts payable and the change in the related balance is reflected in operating activities in the statement of cash flows.
Revenue Recognition
Revenue from the sale of oil and natural gas is recognized when title passes, net of royalties due to third parties. Oil and natural gas revenues are recorded using the sales method. Under this method, revenues are recognized based on actual volumes of oil and natural gas sold to purchasers, regardless of whether the sales are proportionate to our ownership in the property. An asset or a liability is recognized to the extent there is an imbalance in excess of the proportionate share of the remaining recoverable reserves on the underlying properties. No significant imbalances existed at December 31, 2018 and 2017.
In May 2014, the FASB issued guidance regarding the accounting for revenue from contracts with customers. This standard includes a five-step revenue recognition model to depict the transfer of goods or services to customers in an amount that reflects the consideration we expect to be entitled to in exchange for those goods or services. Among other things, the standard also eliminates industry-specific revenue guidance and requires enhanced disclosures related to the nature, amount, timing, and uncertainty of revenue and cash flows arising from contracts with customers. The standard was effective for the Company starting January 1, 2018, and the Company adopted the standard using a modified retrospective approach. See Note 5 for additional information.
The following individual customers each accounted for 10% or more of total reported revenues for the period indicated:
| Successor | | | | Predecessor | |
| For the | | | Period from | | | | Period from | | | For the | |
| Year Ended | | | May 5, 2017 | | | | January 1, 2017 | | | Year Ended | |
| December 31, | | | through | | | | through | | | December 31, | |
| 2018 | | | December 31, 2017 | | | | May 4, 2017 | | | 2016 | |
Major customers: | | | | | | | | | | | | | | | | |
Phillips 66 | 27% | | | 23% | | | | 19% | | | 19% | |
Sinclair Oil & Gas Company | 21% | | | 19% | | | | 20% | | | 16% | |
CIMA Energy | 10% | | | 11% | | | | n/a | | | n/a | |
BP America Production Company | n/a | | | 10% | | | | 10% | | | n/a | |
Royal Dutch Shell plc and subsidiaries | n/a | | | n/a | | | | n/a | | | 14% | |
F-18
AMPLIFY ENERGY CORP.
NOTES TO CONSOLIDATED FINANCIAL STATEMENTS
General and Administrative Expense
Prior to June 1, 2016, Memorial Resource provided management, administrative and operating services to the Predecessor and our Predecessor’s general partner pursuant to our Predecessor’s Omnibus Agreement. Upon completion of the MEMP GP Acquisition, the Predecessor’s Omnibus Agreement was terminated on June 1, 2016, and the Predecessor entered into a transition services agreement with Memorial Resource to manage certain post-closing separation costs and activities. Prior to the MEMP GP Acquisition, our Predecessor’s partnership agreement provided that our Predecessor’s general partner determined in good faith the expenses that were allocated to us, including expenses incurred by our Predecessor’s general partner and its former affiliates on our behalf. Memorial Resource allocated indirect general and administrative costs based on time allocations for the three months ended March 31, 2016 and based on the terms as set forth by the MEMP GP Acquisition purchase and sale agreement for the period from April 1, 2016 through the closing date. Under our Predecessor’s partnership agreement and the Predecessor’s Omnibus Agreement, we reimbursed Memorial Resource for all direct and indirect costs incurred on our behalf. See Note 16 for additional information regarding the Predecessor’s Omnibus Agreement.
General and administrative expenses associated with the previous owners included the costs of administrative employees, related benefits, office rents, professional fees and other costs not directly associated with field operations or production.
Derivative Instruments
Commodity derivative financial instruments (e.g., swaps, collars and puts) are used to reduce the impact of natural gas and oil price fluctuations. Every derivative instrument is recorded on the balance sheet as either an asset or liability measured at its fair value. Changes in the derivative’s fair value are recognized in earnings as we have not elected hedge accounting for any of our derivative positions.
Capitalized Interest
We capitalize interest costs to oil and gas properties on expenditures made in connection with certain projects such as drilling and completion of new oil and natural gas wells and major facility installations. Interest is capitalized only for the period that such activities are in progress. Interest is capitalized using a weighted average interest rate based on our outstanding borrowings. These capitalized costs are included with intangible drilling costs and amortized using the units of production method. For the year ended December 31, 2018, the period from May 5, 2017 through December 31, 2017 and the year ended December 31, 2016, we had $0.5 million, $0.4 million, and $0.5 million in capitalized interest, respectively. No capitalized interest recorded for the period from January 1, 2017 through May 4, 2017.
Income Tax
We are a corporation subject to federal and certain state income taxes. Our Predecessor was organized as a pass-through entity for federal and most state income tax purposes. Certain of our consolidated subsidiaries were taxed as corporations for federal and state income tax purposes. We are also subject to the Texas margin tax for activity in the state of Texas.
We use the asset and liability method of accounting for income taxes, under which deferred tax assets and liabilities are recognized for the future tax consequences of (1) temporary differences between the tax basis of assets and liabilities and their reported amounts in the financial statements and (2) operating loss and tax credit carryforwards. Deferred income tax assets and liabilities are based on enacted tax rates applicable to the future period when those temporary differences are expected to be recovered or settled. Deferred tax assets are reduced by a valuation allowance if, based on the weight of available evidence, it is more likely than not that some portion or all of deferred tax assets will not be realized. We recognize interest and penalties accrued to unrecognized tax benefits in other income (expense) in our Statement of Consolidated Operations.
We recognize a tax benefit from an uncertain tax position when it is more likely than not that the position will be sustained upon examination by taxing authorities, based on the technical merits of the position. The tax benefit recorded is equal to the largest amount that is greater than 50% likely to be realized through effective settlement with a taxing authority. Although we believe our assumptions, judgements and estimates are reasonable, changes in tax laws or our interpretation of tax laws and the resolution of any tax audits could significantly impact the amounts provided for income taxes in our consolidated financial statements.
On December 22, 2017, the U.S. government enacted comprehensive tax legislation commonly referred to as the Tax Cuts and Jobs Act (the “Tax Act”). The provisions of the Tax Act that impact us include, but are not limited to, (1) reducing the U.S. federal corporate tax rate from 35% to 21%; (2) elimination of the corporate alternative minimum tax (AMT); (3) temporary bonus depreciation that will allow for full expensing of qualified property, and (4) limitations on net operating losses (NOLs) generated after December 31, 2017, to 80 percent of taxable income.
F-19
AMPLIFY ENERGY CORP.
NOTES TO CONSOLIDATED FINANCIAL STATEMENTS
Earnings Per Share/Unit
Basic and diluted earnings per share/unit (“EPS” or “EPU”) is determined by dividing net income or loss available to the common stockholders/limited partners by the weighted average number of outstanding shares/units during the period. Diluted earnings (loss) per common share is calculated under the two-class method and the treasury stock method by dividing net income (loss) available to common stockholders by the weighted average number of diluted common shares outstanding, which includes the effect of potentially dilutive securities. When a loss from continuing operations exists, all potentially dilutive securities are anti-dilutive and are therefore excluded from the computation of diluted earnings per share. Net income or loss available to the Predecessor limited partners was determined by applying the two-class method. The two-class method of computing the Predecessor’s EPU was an earnings allocation formula that determined EPU based on distributions declared. The amount of net income or loss used in the determination of EPU was reduced (or increased) by the amount of available cash that had been distributed to the Predecessor’s limited partners for that corresponding period. The remaining undistributed earnings or excess distributions over earnings were allocated to the Predecessor’s limited partners in accordance with the contractual terms of the Predecessor’s partnership agreement. The total earnings allocated to the Predecessor’s limited partners was determined by adding together the amount allocated for distributions declared and the amount allocated for the undistributed earnings or excess distributions over earnings. Basic and diluted EPU are equivalent, as all restricted common units and subordinated units participated in distributions. See Note 13 for additional information.
Equity Compensation
The fair value of equity-classified awards (e.g., restricted common unit awards, restricted stock units or stock options) is amortized to earnings over the requisite service or vesting period. Compensation expense for liability-classified awards (e.g., phantom units awards) are recognized over the requisite service or vesting period of an award based on the fair value of the award re-measured at each reporting period. We currently have awards subject to performance criteria; such awards would vest when it is probable that the performance criteria will be met and the requisite service period has been met. Generally, no compensation expense is recognized for equity instruments that do not vest. See Note 14 for further information.
Recently Adopted Accounting Pronouncements
Compensation—Stock Compensation. In May 2017, the FASB issued an accounting standard update to clarify and reduce both (i) diversity in practice and (ii) cost and complexity when applying its guidance in the terms and conditions of a share-based payment award. The new guidance is effective for annual periods beginning after December 15, 2017, and interim periods within those annual periods. The Company adopted this guidance as of January 1, 2018, noting the impact of adopting this guidance was not material to the Company’s financial statements and related disclosures.
Statement of Cash Flows – Restricted Cash a consensus of the FASB Emerging Issues Task Force. In November 2016, the FASB issued an accounting standard update to clarify the guidance on the classification and presentation of restricted cash in the statement of cash flows. The changes in restricted cash and restricted cash equivalents that result from the transfers between cash, cash equivalents, and restricted cash and restricted cash equivalents should not be presented as cash flow activities in the statement of cash flows. The new guidance is effective for reporting periods beginning after December 15, 2017 and interim periods within those fiscal years. Early adoption is permitted, including adoption in an interim period. The new guidance requires transition under a retrospective approach for each period presented. The Company adopted this guidance as of January 1, 2018 and applied the disclosure requirements retrospectively.
New Accounting Pronouncements
Fair Value Measurement. In August 2018, the FASB issued an amendment to modify the disclosure requirements on fair value measurements in Topic 820, Fair Value Measurement. Certain disclosure requirements were removed, modified and added and primarily relate to Level 3 hierarchy measurements and changes to non-public entities disclosures. The guidance is effective for all entities for fiscal years and interim periods within those fiscal years, beginning after December 15, 2019. The impact of this guidance is not expected to have a material impact on the Company.
Leases. In February 2016, the FASB issued a revision to lease accounting guidance. The FASB retained a dual model, requiring leases to be classified as either direct financing or operating leases. The classification will be based on criteria that are similar to the current lease accounting treatment. The revised guidance requires lessees to recognize a right-of-use asset and lease liability for all leasing transactions regardless of classification. For leases with a term of 12 months or less, a lessee is permitted to make an accounting policy election by class of underlying asset not to recognize lease assets and lease liabilities. If a lessee makes this election, it should recognize lease expense for such leases generally on a straight-line basis over the lease term.
F-20
AMPLIFY ENERGY CORP.
NOTES TO CONSOLIDATED FINANCIAL STATEMENTS
In July 2018, the FASB issued a revision to lease accounting implementation guidance, targeting improvements to comparative reporting requirements for initial adoption. Previously, the reporting requirements for initial adoption required an entity to initially apply the new leases standard (subject to specific transition requirements and optional practical expedients) at the beginning of the earliest period presented in the financial statements (which is January 1, 2017, for calendar-year-end public business entities that adopt the new leases standard on January 1, 2019). Under this new revision an optional method in addition to the existing method allows entities to initially apply the new leases standard at the adoption date January 1, 2019 for calendar-year-end public business entities and recognize a cumulative effect adjustment to the opening balance of retained earnings in the period of adoption. The FASB also issued another update in July on additional codification improvements, primarily corrections and clarifications. The Company will not early adopt this standard.
The Company is the lessee under various agreements for office space, compressors, equipment, vehicles and surface rentals (right of use assets) that are currently accounted for as operating leases, see Note 17, for additional information.
The Company will apply the revised lease rules for our interim and annual reporting periods starting January 1, 2019 using the modified retrospective approach with a cumulative impact to retained earnings in that period, and including several optional practical expedients relating to leases commenced before the effective date. The practical expedients the Company will adopt are: 1) the original correct assessment of a contract containing a lease will be accepted without further review on all existing or expired contracts; 2) the original lease classification as an operating lease will convert as an operating lease under the new guidance; 3) initial direct costs for any existing leases will not be reassessed; 4) existing land easements or right of use agreements will continue under current accounting policy and only new agreements will be evaluated in the future and 5) short-term leases for twelve months or less will not be evaluated under the guidance.
The adoption of this standard will result in an increase in the assets and liabilities on the Company’s consolidated balance sheets. The Company has completed the review and evaluation of current and potential leases which resulted primarily in our corporate office lease and some minor equipment and vehicle leases qualifying under the new guidance. Based upon this analysis, the impact of the new guidance is expected to establish a liability and the corresponding asset of approximately $5.0 million to $6.0 million at inception related to leases existing as of January 1, 2019.
Other accounting standards that have been issued by the FASB or other standards-setting bodies are not expected to have a material impact on the Company’s financial position, results of operations and cash flows.
Note 5. Revenues
Revenue from contracts with customers
As discussed in Note 4, the Company adopted Accounting Standard Update (ASU) No. 2014-09, revenue from contracts with customers (ASC 606), on January 1, 2018 using the modified retrospective method of adoption. Adoption of the ASU did not require an adjustment to the opening balance of equity and did not materially change the Company's amount and timing of revenues. The Company applied the ASU only to contracts that were not completed as of January 1, 2018.
Although the adoption of ASC 606 did not have an impact on the Company’s net income or cash flows, it did result in the reclassification of fees incurred under certain gathering and gas processing agreements. Such reclassification led to an overall decrease in oil and natural gas sales with a corresponding decrease in gathering, processing and transportation as follows:
| For the Year Ended | |
| December 31, 2018 | |
| As Reported | | | Previous Revenue Recognition Method | | | Increase/ (Decrease) | |
| (in thousands) | |
Revenues: | | | | | | | | | | | |
Oil and natural gas sales | $ | 339,840 | | | $ | 342,210 | | | $ | (2,370 | ) |
Cost and expenses: | | | | | | | | | | | |
Gathering, processing and transportation | | 23,231 | | | | 25,601 | | | $ | (2,370 | ) |
| | | | | | | | | | | |
Net income (loss) | $ | 54,609 | | | $ | 54,609 | | | $ | — | |
F-21
AMPLIFY ENERGY CORP.
NOTES TO CONSOLIDATED FINANCIAL STATEMENTS
The reclassification of certain fees between oil and natural gas sales and gathering, processing and transportation is the result of the Company’s assessment of the point in time at which its performance obligations under its commodity sales contracts are satisfied and control of the commodity is transferred to the customer. The Company has determined that its contracts for the sale of crude oil, unprocessed natural gas, residue gas and NGLs contain monthly performance obligations to deliver product at locations specified in the contract. Control is transferred at the delivery location, at which point the performance obligation has been satisfied and revenue is recognized. Fees included in the contract that are incurred prior to control transfer are classified as gathering, processing and transportation and fees incurred after control transfers are included as a reduction to the transaction price. The transaction price at which revenue is recognized consists entirely of variable consideration based on quoted market prices less various fees and the quantity of volumes delivered.
Oil and natural gas revenues are recorded using the sales method. Under this method, revenues are recognized based on actual volumes of oil and natural gas sold to purchasers, regardless of whether the sales are proportionate to our ownership in the property. An asset or a liability is recognized to the extent there is an imbalance in excess of the proportionate share of the remaining recoverable reserves on the underlying properties. No significant imbalances existed at December 31, 2018.
Disaggregation of Revenue
We have identified three material revenue streams in our business: oil, natural gas and NGLs. The following table present our revenues disaggregated by revenue stream.
| For the Year Ended | |
| December 31, 2018 | |
| (in thousands) | |
Revenues | | | |
Oil | $ | 209,066 | |
NGLs | | 42,463 | |
Natural gas | | 88,311 | |
Oil and natural gas sales | $ | 339,840 | |
Contract Balances
Under our sales contracts, we invoice customers once our performance obligations have been satisfied, at which point payment is unconditional. Accordingly, our contracts do not give rise to contract assets or liabilities. Accounts receivable attributable to our revenue contracts with customers was $25.0 million at December 31, 2018 and $30.1 million at December 31, 2017.
Transaction Price Allocated to Remaining Performance Obligations
For our contracts that have a contract term greater than one year, we have utilized the practical expedient in ASC 606, which states that a company is not required to disclose the transaction price allocated to remaining performance obligations if the variable consideration is allocated entirely to a wholly unsatisfied performance obligation. Under our contracts, each unit of product delivered to the customer represents a separate performance obligation; therefore, future volumes are wholly unsatisfied and disclosure of the transaction price allocated to remaining performance obligations is not required. For our contracts that have a contract term of one year or less, we have utilized the practical expedient in ASC 606, which states that a company is not required to disclose the transaction price allocated to remaining performance obligations if the performance obligation is part of a contract that has an original expected duration of one year or less.
Note 6. Acquisitions and Divestitures
The third party acquisitions discussed below were accounted for under the acquisition method of accounting. Accordingly, we conducted assessments of net assets acquired and recognized amounts for identifiable assets acquired and liabilities assumed at their estimated acquisition date fair values, while acquisition costs associated with the acquisitions were expensed as incurred. The operating revenues and expenses of acquired properties are included in the accompanying financial statements from their respective closing dates forward. The transactions were financed through capital contributions and borrowings under our Predecessor’s revolving credit facility.
The fair values of oil and natural gas properties are measured using valuation techniques that convert future cash flows to a single discounted amount. Significant inputs to the valuation of oil and natural properties include estimates of: (i) economic reserves; (ii) future operating and development costs; (iii) future commodity prices; and (iv) a market-based weighted average cost of capital.
The Predecessor had consummated several common control acquisitions since completing its initial public offering in December 2011, as further discussed in Note 16, directly or indirectly from Memorial Resource and certain affiliates of NGP.
F-22
AMPLIFY ENERGY CORP.
NOTES TO CONSOLIDATED FINANCIAL STATEMENTS
Acquisition and Divestiture related expenses
Acquisition and divestiture related expenses for third party transactions are included in general and administrative expenses in the accompanying statements of operations for the periods indicated below (in thousands):
Successor | | | | Predecessor | |
For the | | | Period from | | | | Period from | | | For the | |
Year Ended | | | May 5, 2017 | | | | January 1, 2017 | | | Year Ended | |
December 31, | | | through | | | | through | | | December 31, | |
2018 | | | December 31, 2017 | | | | May 4, 2017 | | | 2016 | |
$ | 205 | | | $ | 609 | | | | $ | — | | | $ | 1,451 | |
2018 Acquisitions & Divestitures
On May 30, 2018, we closed a transaction to divest certain of our non-core assets located in South Texas (the “South Texas Divestiture”) for total proceeds of approximately $17.1 million, including post-closing adjustments, which includes $18.6 million in cash, $0.5 million in accounts payable and $0.9 million paid in legal and advisor expenses. We recorded a loss on sale of properties of approximately $3.6 million for the year ended December 31, 2018, in “(gain) loss on sale of properties” in the accompanying Statements of Consolidated Operations. The net proceeds from the sale were used to reduce outstanding borrowings under our Emergence Credit Facility (as defined below). This disposition did not qualify as a discontinued operation.
There were no material acquisitions for the year ended December 31, 2018.
2017 Acquisitions & Divestitures
There were no material acquisitions or divestitures the period from January 1, 2017 through May 4, 2017 or for the period from May 5, 2017 through December 31, 2017.
2016 Acquisitions & Divestitures
On July 14, 2016, we closed a transaction to divest certain assets located in Colorado and Wyoming (the “Rockies Divestiture”) to a third party for total proceeds of approximately $16.4 million, including final post-closing adjustments. We recorded a loss of approximately $4.2 million in “(gain) loss on sale of properties” in the accompanying statement of operations. The proceeds from this transaction were used to reduce borrowings under our Predecessor’s revolving credit facility. This disposition did not qualify as a discontinued operation.
On June 14, 2016, we closed a transaction to divest certain assets located in the Permian Basin (the “Permian Divestiture”) to a third party for a total purchase price of approximately $36.7 million including final post-closing adjustments, which included $36.4 million in cash and $0.3 million in accounts receivable at December 31, 2016. We recognized a gain of $6.1 million on the sale of properties related to the Permian Divestiture in “(gain) loss on sale of properties” in the accompanying statement of operations. The proceeds from this transaction were used to reduce borrowings under our Predecessor’s revolving credit facility. This disposition did not qualify as a discontinued operation.
During the year ended December 31, 2016, the Predecessor completed other immaterial divestitures for less than $0.1 million for which we recorded a gain of $0.9 million on the sale that is recorded in “(gain) loss on sale of properties” in the accompanying statement of operations.
The income (loss) before income taxes, including the associated (gain) loss on sale of properties, related to the Permian Divestiture and Rockies Divestiture included in the Statements of Consolidated Operations of the Company is as follows (in thousands):
| Predecessor | |
| For the | |
| Year Ended | |
| December 31, 2016 | |
Permian Divestiture | $ | 4,297 | |
Rockies Divestiture | | (7,677 | ) |
F-23
AMPLIFY ENERGY CORP.
NOTES TO CONSOLIDATED FINANCIAL STATEMENTS
Note 7. Fair Value Measurements of Financial Instruments
Fair value is defined as the price that would be received to sell an asset or paid to transfer a liability in an orderly transaction between market participants at a specified measurement date. Fair value estimates are based on either (i) actual market data or (ii) assumptions that other market participants would use in pricing an asset or liability, including estimates of risk. A three-tier hierarchy has been established that classifies fair value amounts recognized or disclosed in the financial statements. The hierarchy considers fair value amounts based on observable inputs (Levels 1 and 2) to be more reliable and predictable than those based primarily on unobservable inputs (Level 3). The characteristics of fair value amounts classified within each level of the hierarchy are described as follows:
Level 1 — Unadjusted quoted prices in active markets that are accessible at the measurement date for identical, unrestricted assets or liabilities. An active market is one in which transactions for the assets or liabilities occur in sufficient frequency and volume to provide pricing information on an ongoing basis.
Level 2 — Quoted prices in markets that are not active, or inputs that are observable, either directly or indirectly, for substantially the full term of the asset or liability. Substantially all of these inputs are observable in the marketplace throughout the full term of the derivative instrument, can be derived from observable data, or are supported by observable levels at which transactions are executed in the marketplace. At December 31, 2017 and 2016, all of the derivative instruments reflected on the accompanying balance sheets were considered Level 2.
Level 3 — Measure based on prices or valuation models that require inputs that are both significant to the fair value measurement and are less observable from objective sources (i.e., supported by little or no market activity).
Assets and Liabilities Measured at Fair Value on a Recurring Basis
The carrying values of cash and cash equivalents, accounts receivables, accounts payables (including accrued liabilities) and amounts outstanding under long-term debt agreements with variable rates included in the accompanying balance sheets approximated fair value at December 31, 2018 and December 31, 2017. The fair value estimates are based upon observable market data and are classified within Level 2 of the fair value hierarchy. These assets and liabilities are not presented in the following tables. See Note 11 for the estimated fair value of our outstanding fixed-rate debt.
The fair market values of the derivative financial instruments reflected on the balance sheets as of December 31, 2018 and December 31, 2017 were based on estimated forward commodity prices (including nonperformance risk). Nonperformance risk is the risk that the obligation related to the derivative instrument will not be fulfilled. Financial assets and liabilities are classified based on the lowest level of input that is significant to the fair value measurement in its entirety. The significance of a particular input to the fair value measurement requires judgment and may affect the valuation of the fair value of assets and liabilities and their placement within the fair value hierarchy levels.
The following table presents the derivative assets and liabilities that are measured at fair value on a recurring basis at December 31, 2018 and December 31, 2017 for each of the fair value hierarchy levels:
| Successor | |
| Fair Value Measurements at December 31, 2018 Using | |
| Quoted Prices in | | | Significant Other | | | Significant | | | | | |
| Active Market | | | Observable Inputs | | | Unobservable Inputs | | | | | |
| (Level 1) | | | (Level 2) | | | (Level 3) | | | Fair Value | |
| (In thousands) | |
Assets: | | | | | | | | | | | | | | | |
Commodity derivatives | $ | — | | | $ | 25,515 | | | $ | — | | | $ | 25,515 | |
| | | | | | | | | | | | | | | |
Liabilities: | | | | | | | | | | | | | | | |
Commodity derivatives | $ | — | | | $ | 4,372 | | | $ | — | | | $ | 4,372 | |
F-24
AMPLIFY ENERGY CORP.
NOTES TO CONSOLIDATED FINANCIAL STATEMENTS
| Successor | |
| Fair Value Measurements at December 31, 2017 Using | |
| Quoted Prices in | | | Significant Other | | | Significant | | | | | |
| Active Market | | | Observable Inputs | | | Unobservable Inputs | | | | | |
| (Level 1) | | | (Level 2) | | | (Level 3) | | | Fair Value | |
| (In thousands) | |
Assets: | | | | | | | | | | | | | | | |
Commodity derivatives | $ | — | | | $ | 38,188 | | | $ | — | | | $ | 38,188 | |
| | | | | | | | | | | | | | | |
Liabilities: | | | | | | | | | | | | | | | |
Commodity derivatives | $ | — | | | $ | 15,112 | | | $ | — | | | $ | 15,112 | |
See Note 8 for additional information regarding our derivative instruments.
Assets and Liabilities Measured at Fair Value on a Nonrecurring Basis
Certain assets and liabilities are reported at fair value on a nonrecurring basis as reflected on the balance sheets. The following methods and assumptions are used to estimate the fair values:
| • | The fair value of asset retirement obligations (“AROs”) is based on discounted cash flow projections using numerous estimates, assumptions, and judgments regarding such factors as the existence of a legal obligation for an ARO; amounts and timing of settlements; the credit-adjusted risk-free rate; and inflation rates. The initial fair value estimates are based on unobservable market data and are classified within Level 3 of the fair value hierarchy. See Note 9 for a summary of changes in AROs. |
| • | If sufficient market data is not available, the determination of the fair values of proved and unproved properties acquired in transactions accounted for as business combinations are prepared by utilizing estimates of discounted cash flow projections. The factors to determine fair value include, but are not limited to, estimates of: (i) economic reserves; (ii) future operating and development costs; (iii) future commodity prices; and (iv) a market-based weighted average cost of capital. The fair value of supporting equipment, such as plant assets, acquired in transactions accounted for as business combinations is commonly estimated using the depreciated replacement cost approach. |
| • | Proved oil and natural gas properties are reviewed for impairment when events and circumstances indicate the carrying value of such properties may not be recoverable. The factors used to determine fair value include, but are not limited to, estimates of proved reserves, future commodity prices, the timing of future production and capital expenditures and a discount rate commensurate with the risk reflective of the lives remaining for the respective oil and gas properties. |
| (i) | No impairments were recognized for the year ended December 31, 2018. |
| (ii) | No impairments were recognized for the period from May 5, 2017 through December 31, 2017 or the period from January 1, 2017 through May 4, 2017. |
| (iii) | During the year ended December 31, 2016, our Predecessor recognized $183.4 million of impairments related to certain properties in East Texas. The estimated future cash flows expected from these properties were compared to their carrying values and determined to be unrecoverable primarily as a result of declining commodity prices and change in future planned development due to liquidity constraints as a result of our Predecessor’s reduced borrowing base during the three months ended December 31, 2016. As a result of the impairments, the carrying value of these properties was reduced to approximately $156.2 million. |
Note 8. Risk Management and Derivative Instruments
Derivative instruments are utilized to manage exposure to commodity price fluctuations and achieve a more predictable cash flow in connection with natural gas and oil sales from production. These transactions limit exposure to declines in prices, but also limit the benefits that would be realized if prices increase.
F-25
AMPLIFY ENERGY CORP.
NOTES TO CONSOLIDATED FINANCIAL STATEMENTS
Certain inherent business risks are associated with commodity and interest derivative contracts, including market risk and credit risk. Market risk is the risk that the price of natural gas or oil will change, either favorably or unfavorably, in response to changing market conditions. Credit risk is the risk of loss from nonperformance by the counterparty to a contract. It is our policy to enter into derivative contracts, only with creditworthy counterparties, which generally are financial institutions, deemed by management as competent and competitive market makers. Some of the lenders, or certain of their affiliates, under our New Credit Agreement are counterparties to our derivative contracts. While collateral is generally not required to be posted by counterparties, credit risk associated with derivative instruments is minimized by limiting exposure to any single counterparty and entering into derivative instruments only with creditworthy counterparties that are generally large financial institutions. Additionally, master netting agreements are used to mitigate risk of loss due to default with counterparties on derivative instruments. We have also entered into International Swaps and Derivatives Association Master Agreements (“ISDA Agreements”) with each of our counterparties. The terms of the ISDA Agreements provide us and each of our counterparties with rights of set-off upon the occurrence of defined acts of default by either us or our counterparty to a derivative, whereby the party not in default may set-off all liabilities owed to the defaulting party against all net derivative asset receivables from the defaulting party. At December 31, 2018, after taking into effect netting arrangements, we had no counterparty exposure related to our derivative instruments. As a result, had all counterparties failed completely to perform according to the terms of the existing contracts, we would have the right to offset $21.2 million against amounts outstanding under our New Revolving Credit Facility at December 31, 2018. See Note 11 for additional information regarding our New Revolving Credit Facility.
Commodity Derivatives
A combination of commodity derivatives (e.g., floating-for-fixed swaps, costless collars, call spreads and puts) is used to manage exposure to commodity price volatility.
In January 2017, in connection with our restructuring efforts, we monetized $94.1 million in commodity hedges and used a portion of the proceeds to reduce the amounts outstanding under our Predecessor’s revolving credit facility and kept the remaining portion as cash on hand for general partnership purposes.
In December 2016, in connection with our restructuring efforts, we monetized approximately $191.4 million in commodity hedges and used the proceeds to reduce amounts outstanding under our Predecessor’s revolving credit facility.
During the periods of April through June 2016, we monetized approximately $39.3 million in commodity hedges and used the proceeds from the settlements to repurchase senior notes.
We enter into natural gas derivative contracts that are indexed to NYMEX Henry Hub. We also enter into oil derivative contracts indexed to either NYMEX WTI or Inter-Continental Exchange (“ICE”) Brent. Our NGL derivative contracts are indexed to Oil Price Information Service Mont Belvieu.
F-26
AMPLIFY ENERGY CORP.
NOTES TO CONSOLIDATED FINANCIAL STATEMENTS
At December 31, 2018, the Company had the following open commodity positions:
| 2019 | | | 2020 | |
Natural Gas Derivative Contracts: | | | | | | | |
Fixed price swap contracts: | | | | | | | |
Average monthly volume (MMBtu) | | 1,565,000 | | | | — | |
Weighted-average fixed price | $ | 2.89 | | | $ | — | |
| | | | | | | |
Collar contracts: | | | | | | | |
Average monthly volume (MMBtu) | | — | | | | 90,000 | |
Weighted-average floor price | | — | | | $ | 2.60 | |
Weighted-average ceiling price | $ | — | | | $ | 2.85 | |
| | | | | | | |
Crude Oil Derivative Contracts: | | | | | | | |
Fixed price swap contracts: | | | | | | | |
Average monthly volume (Bbls) | | 148,000 | | | | — | |
Weighted-average fixed price | $ | 53.06 | | | $ | — | |
| | | | | | | |
Collar contracts: | | | | | | | |
Average monthly volume (Bbls) | | 38,000 | | | | 14,300 | |
Weighted-average floor price | $ | 55.00 | | | $ | 55.00 | |
Weighted-average ceiling price | $ | 63.85 | | | $ | 62.10 | |
| | | | | | | |
Purchased put option contracts: | | | | | | | |
Average Monthly Volume (Bbls) | | — | | | | 14,300 | |
Weighted-average strike price | $ | — | | | $ | 55.00 | |
| | | | | | | |
NGL Derivative Contracts: | | | | | | | |
Fixed price swap contracts: | | | | | | | |
Average monthly volume (Bbls) | | 72,000 | | | | 18,200 | |
Weighted-average fixed price | $ | 29.96 | | | $ | 28.67 | |
Interest Rate Swaps
Periodically, interest rate swaps are entered into to mitigate exposure to market rate fluctuations by converting variable interest rates such as those in our New Credit Agreement to fixed interest rates. The Company did not have any interest rate swaps at December 31, 2018 and 2017, respectively.
During December 2016, in connection with our restructuring efforts, we elected to terminate the interest rate swaps associated with our Predecessor’s revolving credit facility and in the aggregate paid our counterparties approximately $2.1 million. The Predecessor did not have any interest rate swaps at December 31, 2016.
Balance Sheet Presentation
The following table summarizes both: (i) the gross fair value of derivative instruments by the appropriate balance sheet classification even when the derivative instruments are subject to netting arrangements and qualify for net presentation in the balance sheet and (ii) the net recorded fair value as reflected on the balance sheet at December 31, 2018 and 2017. There was no cash collateral received or pledged associated with our derivative instruments since most of the counterparties, or certain of their affiliates, to our derivative contracts are lenders under our New Credit Agreement.
F-27
AMPLIFY ENERGY CORP.
NOTES TO CONSOLIDATED FINANCIAL STATEMENTS
| | | | Successor | |
| | | | Asset Derivatives | | | Liability Derivatives | | | Asset Derivatives | | | Liability Derivatives | |
| | | | December 31, | | | December 31, | | | December 31, | | | December 31, | |
Type | | Balance Sheet Location | | 2018 | | | 2018 | | | 2017 | | | 2017 | |
| | | | (In thousands) | |
Commodity contracts | | | | $ | 21,217 | | | $ | 2,543 | | | $ | 37,729 | | | $ | 9,183 | |
Gross fair value | | | | | 21,217 | | | | 2,543 | | | | 37,729 | | | | 9,183 | |
Netting arrangements | | | | | (2,404 | ) | | | (2,404 | ) | | | (9,183 | ) | | | (9,183 | ) |
Net recorded fair value | | Short-term derivative instruments | | $ | 18,813 | | | $ | 139 | | | $ | 28,546 | | | $ | — | |
| | | | | | | | | | | | | | | | | | |
Commodity contracts | | | | $ | 4,298 | | | $ | 1,829 | | | $ | 459 | | | $ | 5,929 | |
Gross fair value | | | | | 4,298 | | | | 1,829 | | | | 459 | | | | 5,929 | |
Netting arrangements | | | | | (1,829 | ) | | | (1,829 | ) | | | (459 | ) | | | (459 | ) |
Net recorded fair value | | Long-term derivative instruments | | $ | 2,469 | | | $ | — | | | $ | — | | | $ | 5,470 | |
(Gains) Losses on Derivatives
We do not designate derivative instruments as hedging instruments for accounting and financial reporting purposes. Accordingly, all gains and losses, including changes in the derivative instruments’ fair values, have been recorded in the accompanying statements of operations. The following table details the gains and losses related to derivative instruments for the periods indicated (in thousands):
| Successor | | | | Predecessor | |
| For the | | | Period from | | | | Period from | | | For the | |
| Year Ended | | | May 5, 2017 | | | | January 1, 2017 | | | Year Ended | |
Statements of | December 31, | | | through | | | | through | | | December 31, | |
Operations Location | 2018 | | | December 31, 2017 | | | | May 4, 2017 | | | 2016 | |
(Gain) loss on commodity derivatives | $ | (8,155 | ) | | $ | 31,609 | | | | $ | (23,076 | ) | | $ | 117,105 | |
Interest expense, net | | — | | | | — | | | | | — | | | | 1,290 | |
Note 9. Asset Retirement Obligations
The Company’s asset retirement obligations primarily relate to the Company’s portion of future plugging and abandonment of wells and related facilities. The following table presents the changes in the asset retirement obligations for the year ended December 31, 2018, the period from May 5, 2017 through December 31, 2017, the period from January 1, 2017 through May 4, 2017 and the year ended December 31, 2016 (in thousands):
| Successor | | | | Predecessor | |
| For the | | | Period from | | | | Period from | | | For the | |
| Year Ended | | | May 5, 2017 | | | | January 1, 2017 | | | Year Ended | |
| December 31, | | | through | | | | through | | | December 31, | |
| 2018 | | | December 31, 2017 | | | | May 4, 2017 | | | 2016 | |
Asset retirement obligations at beginning of period | $ | 100,173 | | | $ | 96,127 | | | | $ | 155,702 | | | $ | 164,164 | |
Liabilities added from acquisition or drilling | | 89 | | | | 191 | | | | | 6 | | | | 30 | |
Liabilities removed upon sale of wells | | (15,702 | ) | | | — | | | | | — | | | | (19,669 | ) |
Liabilities settled | | (767 | ) | | | (633 | ) | | | | (164 | ) | | | (1,442 | ) |
Accretion expense | | 5,711 | | | | 4,384 | | | | | 3,407 | | | | 10,231 | |
Revision of estimates (1) | | (13,160 | ) | | | 104 | | | | | 104 | | | | 2,388 | |
Asset retirement obligation at end of period | | 76,344 | | | | 100,173 | | | | | 159,055 | | | | 155,702 | |
Fresh start adjustment (2) | | — | | | | — | | | | | (62,928 | ) | | | — | |
Less: Current Portion | | 477 | | | | 713 | | | | | 941 | | | | 789 | |
Asset retirement obligations - long-term portion | $ | 75,867 | | | $ | 99,460 | | | | $ | 95,186 | | | $ | 154,913 | |
(1) | The decrease in revision of estimates for the year ended December 31, 2018 is primarily due to receiving new cost estimates from third parties regarding the estimated plugging and abandonment costs. |
(2) | As a result of the application of fresh start accounting, the Successor recorded its asset retirement obligation at fair value as of the Effective Date. |
F-28
AMPLIFY ENERGY CORP.
NOTES TO CONSOLIDATED FINANCIAL STATEMENTS
Note 10. Restricted Investments
Various restricted investment accounts fund certain long-term contractual and regulatory asset retirement obligations and collateralize certain regulatory bonds associated with the offshore Southern California oil and gas properties. The components of the restricted investment balances are as follows:
| Successor | |
| December 31, | | | December 31, | |
| 2018 | | | 2017 | |
| (In thousands) | |
BOEM platform abandonment (See Note 17) | $ | 90,162 | | | $ | 152,272 | |
Surety bond cash collateral | | — | | | | 501 | |
| | | | | | | |
SPBPC Collateral: | | | | | | | |
Contractual pipeline and surface facilities abandonment | | 4,305 | | | | 4,058 | |
Port of Long Beach pipeline license | | — | | | | 107 | |
Restricted investments | $ | 94,467 | | | $ | 156,938 | |
Note 11. Debt
Our consolidated debt obligations consisted of the following at the dates indicated:
| Successor | |
| December 31, | | | December 31, | |
| 2018 | | | 2017 | |
| (In thousands) | |
$425.0 million New Revolving Credit Facility, variable-rate, due November 2023 (1) | $ | 294,000 | | | $ | — | |
$1.0 billion Emergence Credit Facility, variable-rate, due March 2021 (1) | | — | | | | 376,000 | |
Long-term debt | $ | 294,000 | | | $ | 376,000 | |
| (1) | The carrying amount of our New Revolving Credit Facility and Emergence Credit Facility approximates fair value because the interest rates are variable and reflective of market rates. |
New Revolving Credit Facility
On November 2, 2018, OLLC and Amplify Acquisitionco, Inc. (“Acquisitionco”), our wholly owned subsidiaries, entered into a credit agreement (the “New Credit Agreement”) providing for a new $425.0 million reserve-based revolving credit facility (the “New Revolving Credit Facility”) with Bank of Montreal, as administrative agent (in such capacity, the “Agent”) and an issuer of letters of credit, and the other lenders and agents from time to time party thereto. The New Revolving Credit Facility matures on November 2, 2023.
The terms and conditions under the New Revolving Credit Facility include (but are not limited to) the following:
| • | a borrowing base of $425.0 million; |
| • | at OLLC’s option, borrowings under the New Credit Agreement will bear interest at the base rate, LIBOR Market Index rate or LIBOR plus an applicable margin. Base rate loans bear interest at a rate per annum equal to the greatest of: (i) the federal funds effective rate plus 50 basis points, (ii) the rate of interest in effect for each day as publicly announced from time to time by the Agent as its “prime rate”; and (iii) the adjusted LIBOR rate for a one-month interest period plus 100 basis points per annum. The applicable margin for base rate loans ranges from 100 to 200 basis points, and the applicable margin for LIBOR loans and LIBOR Market loans ranges from 200 to 300 basis points, in each case depending on the percentage of the borrowing base utilized; |
F-29
AMPLIFY ENERGY CORP.
NOTES TO CONSOLIDATED FINANCIAL STATEMENTS
| • | the obligations under the New Revolving Credit Facility are secured by mortgages on not less than 85% of the PV-9 value of oil and gas properties (and at least 85% of the PV-9 value of the proved, developed and producing oil and gas properties) included in the determination of the borrowing base. OLLC and its other subsidiaries entered into a pledge and security agreement in favor of the Agent for the secured parties, pursuant to which OLLC’s obligations under the New Credit Agreement are secured by a first priority security interest in substantially all of our assets (subject to permitted liens). Additionally, the Company entered into a non-recourse pledge agreement in favor of the Agent for the secured parties, pursuant to which OLLC’s obligations under the New Credit Agreement are secured by a pledge and security interest of 100% of the equity interests held by the Company in Acquisitionco; |
| • | certain financial covenants, including the maintenance of (i) as of the date of determination, a maximum total debt to EBITDAX ratio of 4.00 to 1.00, and (ii) a current ratio of not less than 1.00 to 1.00; and |
| • | certain events of default, including, without limitation: non-payment; breaches of representations and warranties; non-compliance with covenants or other agreements; cross-default to material indebtedness; judgments; change of control; and voluntary and involuntary bankruptcy. |
On December 21, 2018, we entered into a letter agreement relating to the New Credit Agreement (the “Letter Agreement”). Pursuant to the Letter Agreement, the parties to the New Credit Agreement agreed, among other things, to:
| • | extend the date by which OLLC was required to show compliance with certain minimum hedging requirements set forth in the New Credit Agreement from December 31, 2018 to February 28, 2019; and |
| • | subject to certain conditions, waive the requirement that OLLC deliver to the Agent within 60 days after the closing date of the New Credit Agreement control agreements with respect to certain deposit accounts held or maintained by each Loan Party (as defined in the New Credit Agreement) on the closing date of the New Credit Agreement. |
Emergence Credit Facility
On May 4, 2017, OLLC, as borrower, entered into the Amended and Restated Credit Agreement (the “Emergence Credit Agreement”) among Acquisitionco, as parent guarantor, the lenders from time to time party thereto and Wells Fargo Bank, National Association, as administrative agent. Pursuant to the Emergence Credit Agreement the lenders party thereto agreed to provide OLLC with the Emergence Credit Facility (the loans thereunder, the “Loans”). The aggregate principal amount of Loans outstanding under the Emergence Credit Facility as of the Effective Date was $430.0 million.
The terms and conditions under the Emergence Credit Agreement included (but were not limited to) the following:
| • | a borrowing base of approximately $490.0 million; |
| • | a maturity date of March 19, 2021 for the Emergence Credit Facility; |
| • | the Loans shall bear interest at a rate per annum equal to (i) the alternative base rate plus an applicable margin of 2.00% to 3.00% or (ii) adjusted LIBOR plus an applicable margin of 3.00% to 4.00%, in each case based on the borrowing base utilization percentage under the Emergence Credit Facility; |
| • | the unused commitments under the Emergence Credit Facility accrued a commitment fee of 0.50%, payable quarterly in arrears; |
| • | the obligations under the Emergence Credit Agreement were guaranteed by Acquisitionco and substantially all of OLLC’s subsidiaries (the “Guarantors”), subject to limited exceptions, and secured on a first-priority basis by substantially all of OLLC’s and the Guarantors’ assets, including, without limitation, liens on at least 95% of the total value of OLLC’s and the Guarantors’ oil and gas properties, a non-recourse pledge by the Company of the capital stock of Acquisitionco, a pledge by Acquisitionco of the membership interests of OLLC and pledges of stock of all other direct and indirect subsidiaries of OLLC, subject to certain limited exceptions; |
| • | certain financial covenants, including the maintenance of (i) an interest coverage ratio not to exceed 2.50 to 1.00, determined as of the last day of each fiscal quarter for the four fiscal-quarter period then ending, commencing with the fiscal quarter ending September 30, 2017, (ii) a current ratio, determined as of the last day of each fiscal quarter, commencing with the fiscal quarter ending September 30, 2017, of not less than 1.00 to 1.00 and (iii) a total leverage ratio, determined as of the last day of each fiscal quarter, commencing with the fiscal quarter ending September 30, 2017, of less than or equal to 4.00 to 1.00; and |
F-30
AMPLIFY ENERGY CORP.
NOTES TO CONSOLIDATED FINANCIAL STATEMENTS
| • | certain events of default, including, without limitation: non-payment; breaches of representations and warranties; non-compliance with covenants or other agreements; cross-default to material indebtedness; judgments; change of control; and voluntary and involuntary bankruptcy. |
First Amendment to Emergence Credit Facility
On November 30, 2017, we entered into the first amendment to the Emergence Credit Agreement. The first amendment, among other things, amended the Emergence Credit Agreement to:
| • | reflect the reduction of the borrowing base under the Emergence Credit Facility from $475.0 million to $450.0 million, effective as of November 30, 2017, with the borrowing base to be automatically reduced by $2.5 million each month until the next scheduled redetermination of the borrowing base to occur on or about April 2018; |
| • | remove the requirement to make mandatory prepayments of borrowings in respect of excess unrestricted cash and cash equivalents greater than $35.0 million; and |
| • | increase the hedging requirement from 50% to 75% of reasonably anticipated projected production of hydrocarbons from proved developed producing reserves for each calendar month for 2018 and 2019 and extended the deadline for entry into such hedging arrangements from December 31, 2017 to April 30, 2018. |
Second Amendment to Emergence Credit Facility
On May 15, 2018, we entered into the second amendment to the Emergence Credit Agreement, to among other things, (i) reflect the reduction of the borrowing base under the Emergence Credit Agreement from $435.0 million to $430.0 million, effective as of May 15, 2018, with the borrowing base to be further reduced by $15.0 million upon the consummation of the South Texas Divestiture and by $5.0 million each month until the next scheduled redetermination of the borrowing base; and (ii) amend the minimum hedging requirement to disregard the reasonably anticipated production of hydrocarbons from the assets to be sold in the South Texas Divestiture.
Extinguishment of Debt
On November 2, 2018, in connection with our entrance into the New Revolving Credit Facility, the Emergence Credit Facility was terminated and repaid in full. At December 31, 2018, $3.0 million of deferred financing costs related to the Emergence Credit Facility was written off resulting in a loss on extinguishment of debt.
Borrowing Base
The borrowing base for our New Revolving Credit Facility was $425.0 million at December 31, 2018. The borrowing base is subject to redetermination on at least a semi-annual basis based on an engineering report with respect to our estimated oil, NGL and natural gas reserves, which will take into account the prevailing oil, NGL and natural gas prices at such time, as adjusted for the impact of commodity derivative contracts. Unanimous approval by the lenders is required for any increase to the borrowing base.
Predecessor’s Revolving Credit Facility
Our Predecessor was a party to a $2.0 billion revolving credit facility, which was guaranteed by us and all of our current and future subsidiaries (other than certain immaterial subsidiaries).
On the Effective Date of the Plan, the holders of claims under the Predecessor’s revolving credit facility received a full recovery, which included a $24.8 million pay down and their pro rata share of the Emergence Credit Facility. See Note 2 for additional information.
Weighted-Average Interest Rates
The following table presents the weighted-average interest rates paid on variable-rate debt obligations for the periods presented:
| Successor | | | | Predecessor | |
| | | | | Period from | | | | Period from | | | | | |
| For the Year Ended | | | May 5, 2017 | | | | January 1, 2017 | | | For the Year Ended | |
| December 31, | | | through | | | | through | | | December 31, | |
| 2018 | | | December 31, 2017 | | | | May 4, 2017 | | | 2016 | |
New Revolving Credit Facility | 4.96% | | | n/a | | | | n/a | | | n/a | |
Emergence Credit Facility | 5.75% | | | 5.08% | | | | n/a | | | n/a | |
Predecessor's revolving credit facility | n/a | | | n/a | | | | 4.18% | | | 3.28% | |
F-31
AMPLIFY ENERGY CORP.
NOTES TO CONSOLIDATED FINANCIAL STATEMENTS
Senior Notes
On April 17, 2013, May 23, 2013 and October 10, 2013, our Predecessor and Finance Corp. (collectively, the “Issuers”) issued $300.0 million, $100.0 million and $300.0 million, respectively, of the 2021 Senior Notes. The 2021 Senior Notes were fully and unconditionally guaranteed (subject to customary release provisions) on a joint and several basis by the Guarantor Subsidiaries and by certain subsidiaries of the Predecessor. The 2021 Senior Notes would have matured on May 1, 2021 with interest accruing at a rate of 7.625% per annum and were payable semi-annually in arrears on May 1 and November 1 of each year. The 2021 Senior Notes were governed by an indenture and were subject to optional redemption at prices specified in the indenture plus accrued and unpaid interest, if any.
On July 17, 2014, the Issuers completed a private placement of $500.0 million aggregate principal amount of the 2022 Senior Notes. The 2022 Senior Notes were issued at 98.485% of par and were fully and unconditionally guaranteed (subject to customary release provisions) on a joint and several basis by the Guarantor Subsidiaries and by certain subsidiaries of the Predecessor. The 2022 Senior Notes would have matured on August 1, 2022 with interest accruing at 6.875% per annum and were payable semi-annually in arrears on February 1 and August 1 of each year. The 2022 Senior Notes were governed by an indenture and were subject to optional redemption at prices specified in the indenture plus accrued and unpaid interest, if any.
During the year ended December 31, 2016, the Predecessor repurchased on the open market an aggregate principal amount of approximately $53.7 million of its 2021 Senior Notes. In connection with the repurchases, the Predecessor paid approximately $26.4 million and recorded a gain of $27.5 million.
During the year ended December 31, 2016, the Predecessor repurchased on the open market an aggregate principal amount of $32.0 million of its 2022 Senior Notes. In connection with the repurchases, the Predecessor paid approximately $14.9 million and recorded a gain of $14.8 million.
The Company’s voluntary petitions as described in Note 2 constituted an event of default that accelerated the obligations under the Notes. For the period from January 17, 2017 through May 4, 2017 our contractual interest that was not recorded on the Notes was approximately $24.2 million.
On the Effective Date, the Notes were cancelled and the Predecessor’s liability thereunder discharged, and the holders of the Notes received their pro rata share of the New Common Shares. Additionally, the holders of the Notes received their pro rata share of a $24.6 million cash distribution.
Letters of credit
At December 31, 2018, we had $2.4 million letters of credit outstanding, all related to operations at our Wyoming properties.
Unamortized Deferred Financing Costs
Unamortized deferred financing costs associated with our New Revolving Credit Facility was $3.3 million at December 31, 2018. The unamortized deferred financing costs are amortized over the remaining life of our New Revolving Credit Facility using the straight-line method which generally approximate the effective interest method.
On November 2, 2018, in connection with our entrance into the New Revolving Credit Facility, the Emergence Credit Facility was terminated and repaid in full. The remaining deferred financing costs of $3.0 million was written off resulting in a loss on extinguishment of debt.
At December 31, 2016, there were no remaining unamortized deferred financing costs as approximately $1.3 million in deferred financing fees were written off related to our Predecessor’s revolving credit facility, approximately $8.5 million were written off for the 2021 Senior Notes and approximately $5.7 million were written off for the 2022 Senior Notes due to a default and event of default and the uncertainty regarding anticipated financial covenant violations at December 31, 2016.
F-32
AMPLIFY ENERGY CORP.
NOTES TO CONSOLIDATED FINANCIAL STATEMENTS
Note 12. Equity (Deficit)
Issuance of Common Stock and Cancellation of Units
In accordance with the Plan, on the Effective Date:
| • | the Company issued 25,000,000 New Common Shares and Warrants to purchase up to 2,173,913 shares of its common stock; |
| • | the Predecessor common units were cancelled; and |
| • | each Predecessor common unitholder received its pro rata share of: (i) 2% of the New Common Shares, (ii) the Warrants, and (iii) cash in an aggregate amount of approximately $1.3 million. |
On the Effective Date, there were 25,000,000 New Common Shares issued and outstanding.
Equity Outstanding
The following table summarizes the changes in the number of outstanding common units and shares of common stock:
| Common | | | General | |
| Shares/Units | | | Partner | |
Balance, December 31, 2015 (Predecessor) | | 82,906,400 | | | | 86,797 | |
Common units issued | | 1,178,102 | | | | — | |
Restricted common units issued | | 50,000 | | | | — | |
Restricted common units forfeited | | (27,537 | ) | | | — | |
Restricted common units repurchased (1) | | (279,045 | ) | | | — | |
Cancellation of general partner units | | — | | | | (86,797 | ) |
Balance, December 31, 2016 (Predecessor) | | 83,827,920 | | | | — | |
Restricted common units issued | | — | | | | — | |
Restricted common units forfeited | | (12,952 | ) | | | — | |
Restricted common units repurchased (1) | | (14,681 | ) | | | — | |
Balance, May 4, 2017 (Predecessor) | | 83,800,287 | | | | — | |
Cancellation of Predecessor common units | | (83,800,287 | ) | | | — | |
Balance, May 4, 2017 (Predecessor) | | — | | | | — | |
Issuance of Successor common stock | | 25,000,000 | | | | — | |
Balance, May 5, 2017 (Successor) | | 25,000,000 | | | | — | |
Issuance of Successor common stock | | — | | | | — | |
Balance, December 31, 2017 (Successor) | | 25,000,000 | | | | — | |
Issuance of common stock | | — | | | | — | |
Restricted stock units vested | | 163,700 | | | | — | |
Repurchase of common shares | | (65,152 | ) | | | — | |
Restricted common stock repurchased and retired under tender offer | | (2,916,667 | ) | | | — | |
Balance, December 31, 2018 (Successor) | | 22,181,881 | | | | — | |
| (1) | Restricted common units were generally net-settled by our Predecessor unitholders to cover the required withholding tax upon vesting. The Predecessor unitholders surrendered units with value equivalent to the employees’ minimum statutory obligation for the applicable income and other employment taxes. Total payments remitted for the employees’ tax obligations to the appropriate taxing authorities were less than approximately $0.1 million for the period from January 1, 2017 through May 4, 2017 and were $0.6 million for the year ended December 31, 2016. These net-settlements had the effect of unit repurchases by the Company as they reduced the number of units that would have otherwise been outstanding as a result of the vesting and did not represent an expense to the Company. |
Warrants
On the Effective Date, the Company entered into a warrant agreement with American Stock Transfer & Trust Company, LLC, as warrant agent, pursuant to which the Company issued Warrants to purchase up to 2,173,913 shares of the Company’s common stock (representing 8% of the Company’s outstanding common stock as of the Effective Date including shares of the Company’s common stock issuable upon full exercise of the Warrants, but excluding any common stock issuable under the MIP), exercisable for a five year period commencing on the Effective Date at an exercise price of $42.60 per share.
F-33
AMPLIFY ENERGY CORP.
NOTES TO CONSOLIDATED FINANCIAL STATEMENTS
The fair values for the warrants upon issuance on the Effective Date have been estimated using the Black-Scholes option pricing model using the following assumptions:
| Warrants Issued in | |
| Successor Period | |
Risk-free interest rate | | 2.06 | % |
Dividend yield | | — | |
Expected life (in years) | | 5.0 | |
Expected volatility | | 50.0 | % |
Strike Price | $ | 42.60 | |
Calculated fair value | $ | 2.20 | |
Tender Offer
On November 19, 2018, the Company’s board of directors announced the commencement of a tender offer to purchase 2,916,667 shares of the Company’s common stock. On December 19, 2018, upon the terms and subject to the conditions described in the Offer to Purchase dated November 19, 2018, as amended, the Company repurchased an aggregate of 2,916,667 shares of its common stock at a price of $12.00 per share, for a total cost of approximately $35.0 million (excluding fees and expenses relating to the offer).
Share Repurchase Program
On December 21, 2018, the Company’s board of directors authorized the repurchase of up to $25.0 million of the Company’s outstanding shares of common stock, with repurchases to begin on or after January 9, 2019.
Subsequent Event. In January and February 2019, the Company repurchased 42,583 shares of common stock at an average price of $8.63 for a total cost of approximately $0.4 million. At February 28, 2019, approximately $24.6 million remains available for share repurchases under the program.
Predecessor’s General Partner Interest and IDRs.
On April 27, 2016, we acquired MEMP GP from Memorial Resource for cash consideration of approximately $0.8 million. MEMP GP held an approximate 0.1% general partner interest and 50% of the IDRs in us. In conjunction with the MEMP GP Acquisition, on April 27, 2016, we also entered into an agreement with an NGP affiliate pursuant to which we agreed to acquire the other 50% of the IDRs. The acquisition was accounted for as an equity transaction and no gain or loss was recognized as a result of the acquisition. In connection with the MEMP GP Acquisition, our Predecessor’s partnership agreement was amended and restated to convert the 0.1% general partner interest in the Predecessor held by MEMP GP into a non-economic general partner interest. Prior to June 1, 2016, Memorial Resource owned 100% of our Predecessor’s general partner, which owned 50% of our incentive distribution rights. The Funds collectively indirectly owned 50% of our incentive distribution rights.
Predecessor Common Units.
The common units were a separate class of the limited partner interest in our Predecessor and had limited voting rights as set forth in our Predecessor’s partnership agreement. The holders of units were entitled to participate in partnership distributions as discussed further below under “Predecessor’s Cash Distribution Policy” and exercise the rights or privileges available to limited partners under our Predecessor’s partnership agreement.
Predecessor “At-the-Market” Equity Program
On May 25, 2016, the Predecessor entered into an equity distribution agreement for the sale of up to $60.0 million of common units under an at-the-market program (the “ATM Program”). Sales of common units were made under the ATM Program by means of ordinary brokers’ transactions, through the facilities of the NASDAQ Global Market at market prices, or as otherwise agreed between the Predecessor and a sales agent.
During the year ended December 31, 2016, the Predecessor sold 1,178,102 common units under the ATM program. The sale of the units generated proceeds of approximately $1.8 million for the year ended December 31, 2016, which was net of approximately $0.5 million in fees. The Predecessor used the net proceeds from the sale of common units to repurchase senior notes.
F-34
AMPLIFY ENERGY CORP.
NOTES TO CONSOLIDATED FINANCIAL STATEMENTS
Allocations of Net Income (Loss)
Prior to the MEMP GP Acquisition, net income (loss) attributable to the Predecessor was allocated between our Predecessor’s general partner and the common unitholders in proportion to their pro rata ownership after giving effect to priority earnings allocations in an amount equal to incentive cash distributions allocated to our Predecessor’s general partner and the Funds. Net income (loss) attributable to acquisitions accounted for as a transaction between entities under common control in a manner similar to the pooling of interest method prior to their acquisition date is allocated to the previous owners since they were affiliates of our Predecessor’s general partner. Subsequent to the MEMP GP Acquisition, net income (loss) attributable to the Predecessor was allocated entirely to the common unit holders, and net income (loss) attributable to the Successor is allocated entirely to the common stockholders.
Predecessor’s Cash Distribution Policy
In October 2016, the board of directors of our Predecessor’s general partner suspended distributions on common units primarily due to the then current and expected commodity price environment and market conditions and their impact on our future business as well as restrictions imposed by our debt instruments, including our Predecessor’s revolving credit facility. Additionally, under our Predecessor’s revolving credit facility, we could not pay distributions to unitholders in any such quarter in the event there existed a borrowing base deficiency or an event of default either before or after giving effect to such distribution or we were not in pro forma compliance with our Predecessor’s revolving credit facility after giving effect to such distribution.
Cash Distributions to Predecessor Unitholders
The following table summarizes our declared quarterly cash distribution rates with respect to the quarter indicated (dollars in millions, except per unit amounts):
| | | | | | | | | | | | | | | | Distribution | |
| | | | | | | | Amount | | | Aggregate | | | Received by | |
Quarter | | Declaration Date | | Record Date | | Payment Date | | Per Unit | | | Distribution | | | Affiliates | |
2nd Quarter 2016 | | July 26, 2016 | | August 5, 2016 | | August 12, 2016 | | $ | 0.0300 | | | $ | 2.5 | | | $ | < 0.1 | |
1st Quarter 2016 | | April 26, 2016 | | May 6, 2016 | | May 13, 2016 | | $ | 0.0300 | | | $ | 2.5 | | | $ | < 0.1 | |
4th Quarter 2015 | | January 26, 2016 | | February 5, 2016 | | February 12, 2016 | | $ | 0.1000 | | | $ | 8.3 | | | $ | < 0.1 | |
F-35
AMPLIFY ENERGY CORP.
NOTES TO CONSOLIDATED FINANCIAL STATEMENTS
Note 13. Earnings per Share/Unit
The following sets forth the calculation of earnings (loss) per share/unit, or EPS/EPU, for the periods indicated (in thousands, except per unit amounts):
| Successor | | | | Predecessor | |
| | | | | Period from | | | | | | | | | | |
| For the | | | May 5, 2017 | | | | Period from | | | For the | |
| Year Ended | | | through | | | | January 1, | | | Year Ended | |
| December 31, | | | December 31, | | | | 2017 through | | | December 31, | |
| 2018 | | | 2017 | | | | May 4, 2017 | | | 2016 | |
Net income (loss) attributable to Successor/Predecessor | $ | 54,609 | | | $ | 1,286 | | | | $ | (90,955 | ) | | $ | (540,398 | ) |
Less: Predecessor's general partner's 0.1% interest in net income (loss) (1) | | — | | | | — | | | | | — | | | | (168 | ) |
Less: Net income (loss) allocated to participating restricted stockholders | | 2,426 | | | | 35 | | | | | — | | | | — | |
Basic and diluted earnings available to common stockholders/limited partners | $ | 52,183 | | | $ | 1,251 | | | | $ | (90,955 | ) | | $ | (540,230 | ) |
| | | | | | | | | | | | | | | | |
Common shares/units: | | | | | | | | | | | | | | | | |
Common shares/units outstanding — basic | | 24,959 | | | | 25,000 | | | | | 83,807 | | | | 83,351 | |
Dilutive effect of potential common shares | | — | | | | — | | | | | — | | | | — | |
Common shares/units outstanding — diluted (2) | | 24,959 | | | | 25,000 | | | | | 83,807 | | | | 83,351 | |
| | | | | | | | | | | | | | | | |
Net earnings per share/unit: | | | | | | | | | | | | | | | | |
Basic | $ | 2.09 | | | $ | 0.05 | | | | $ | (1.09 | ) | | $ | (6.48 | ) |
Diluted | $ | 2.09 | | | $ | 0.05 | | | | $ | (1.09 | ) | | $ | (6.48 | ) |
Antidilutive stock options (3) | | — | | | | 517 | | | | | — | | | | — | |
Antidilutive warrants (4) | | 2,174 | | | | 2,174 | | | | | — | | | | — | |
(1) | As a result of repurchases under the MEMP Repurchase Program, our Predecessor’s general partner had an approximate average 0.105% interest in us prior to the MEMP GP Acquisition for the five months ended May 31, 2016. |
(2) | For the year ended December 31, 2016, 3,325,318 incremental phantom units under the treasury stock method were excluded from the calculation of diluted earnings per unit, due to their antidilutive effect as we were in a loss position. |
(3) | Amount represents options to purchase common stock that are excluded from the diluted net earnings per share calculations because of their antidilutive effect. |
(4) | Amount represents warrants to purchase common stock that are excluded from the diluted net earnings per share calculations because of their antidilutive effect. |
Note 14. Equity-based Awards
On the Effective Date in connection with the Plan, the Company implemented the MIP for selected employees of the Company or its subsidiaries. An aggregate of 2,322,404 shares of the Company’s common stock were reserved for issuance under the MIP as of the Effective Date. MIP awards are granted in the form of nonqualified stock options, incentive stock options, restricted stock awards, restricted stock units, stock appreciation rights, performance awards, stock awards and other incentive awards. To the extent that an award under the MIP is expired, forfeited or cancelled for any reason without having been exercised in full, the unexercised award would then be available again for grant under the MIP. The MIP is administered by the board of directors of the Company.
On May 4, 2017, the board of directors approved grants of restricted stock unit awards and restricted stock options (collectively the “Emergence Awards”) to certain of the Company’s employees, including the Company’s executive officers. Emergence Awards will generally vest annually in three equal installments on each of the first three anniversaries of the Effective Date, subject to the grantee’s continued employment through each such vesting date. However, upon a grantee’s termination of employment by the Company without Cause, or due to death or Disability, or the grantee resigns from Service for Good Reason (as such terms are defined in the respective Emergence Award agreement), all unvested restricted stock unit awards shall fully vest upon such termination or resignation date. Moreover, (i) upon a grantee’s termination of employment by the Company without Cause, or due to death or Disability, or the grantee resigns from Service for Good Reason (as such terms are defined in the respective Emergence Award agreement), any portion of the then unvested restricted stock options that would have vested had the grantee continued his or her Service during the 12 months following such termination or resignation shall vest on such termination or resignation date and (ii) upon a grantee’s termination of employment by the Company without Cause or the grantee resigns from Service for Good Reason, in each case, following a Change of Control, all unvested restricted stock options shall fully vest as of such termination or resignation date. Notwithstanding the foregoing, the vesting of such Emergence Awards may be subject to and limited by employment-related agreements by and between the Company and grantee.
F-36
AMPLIFY ENERGY CORP.
NOTES TO CONSOLIDATED FINANCIAL STATEMENTS
Restricted Stock Units
Restricted Stock Units with Service Vesting Condition
The restricted stock units with service vesting conditions (“TSUs”) granted are accounted for as equity-classified awards. The grant-date fair value is recognized as compensation cost on a straight-line basis over the requisite service period and forfeitures are accounted for as they occur. Compensation costs are recorded as general and administrative expense. The unrecognized cost associated with TSUs was $5.6 million at December 31, 2018. We expect to recognize the unrecognized compensation cost for these awards over a weighted-average period of 2.2 years.
The following table summarizes information regarding the TSUs granted under the MIP for the period presented:
| | | | | Weighted- | |
| | | | | Average Grant | |
| Number of | | | Date Fair Value | |
| Units | | | per Unit (1) | |
TSUs outstanding at May 5, 2017 (Successor) | | 614,754 | | | $ | 13.77 | |
Granted (2) | | 173,070 | | | $ | 12.87 | |
Forfeited | | (105,032 | ) | | $ | 13.77 | |
Vested | | — | | | $ | — | |
TSUs outstanding at December 31, 2017 (Successor) | | 682,792 | | | $ | 13.54 | |
Granted (3) | | 437,000 | | | $ | 10.51 | |
Forfeited (4) | | (363,513 | ) | | $ | 13.55 | |
Vested | | (158,255 | ) | | $ | 13.44 | |
TSUs outstanding at December 31, 2018 (Successor) | | 598,024 | | | $ | 11.35 | |
| (1) | Determined by dividing the aggregate grant date fair value of awards by the number of awards issued. |
| (2) | The aggregate grant date fair value of TSUs issued for the period from May 5, 2017 through December 31, 2017 was $2.2 million based on a grant date market price ranging from $10.00 to $13.77 per share. |
(3) The aggregate grant date fair value of TSUs issued for the year ended December 31, 2018 was $4.6 million based on a grant date market price ranging from $9.30 to $11.00 per share.
(4) In connection with the separation and retirement agreements of certain executives as discussed in Note 1, the Departing Executives forfeited 298,354 TSUs during the year ended December 31, 2018.
Restricted Stock Units with Market and Service Vesting Conditions
The restricted stock units with market and service vesting conditions (“PSUs”) are accounted for as equity-classified awards. The grant-date fair value is recognized as compensation cost on a graded-vesting basis. As such, the Company recognizes compensation cost over the requisite service period for each separately vesting tranche of the award as though the award were, in substance, multiple awards. The Company accounts for forfeitures as they occur. Compensation costs are recorded as general and administrative expense. The unrecognized cost related to the PSUs was $1.8 million at December 31, 2018. We expect to recognize the unrecognized compensation cost for these awards over a weighted-average period of approximately 1.4 years.
During the year ended December 31, 2018, the board of directors granted PSUs to certain executives and employees of the Company. The PSUs will vest based on the satisfaction of service and market vesting conditions with market vesting based on the Company’s achievement of certain share price targets. The PSUs are subject to service-based vesting such that 50% of the PSUs service vest on the applicable market vesting date and an additional 25% of the PSUs service vest on each of the first and second anniversaries of the applicable market vesting date.
In the event of a qualifying termination, subject to certain conditions, (i) all PSUs that have satisfied the market vesting conditions will fully service vest, upon such termination, and (ii) if the termination occurs between the second and third anniversaries of the grant date, then PSUs that have not market vested as of the termination will market vest to the extent that the share targets (in each case, reduced by $0.25) are achieved as of such termination. Subject to the foregoing, any unvested PSUs will be forfeited upon termination of employment.
A Monte Carlo simulation was used to determine the fair value of these awards at the grant date.
F-37
AMPLIFY ENERGY CORP.
NOTES TO CONSOLIDATED FINANCIAL STATEMENTS
The assumptions used to estimate the fair value of the PSUs are as follows:
Share price targets | $ | 12.50 | | | $ | 15.00 | | | $ | 17.50 | |
| | | | | | | | | | | |
Risk-free interest rate: | | | | | | | | | | | |
Awards Issued on May 14, 2018 | | 2.68 | % | | | 2.68 | % | | | 2.68 | % |
Awards Issued on July 1, 2018 | | 2.61 | % | | | 2.61 | % | | | 2.61 | % |
Awards Issued on August 1, 2018 | | 2.76 | % | | | 2.76 | % | | | 2.76 | % |
Awards Issued on October 1, 2018 | | 2.88 | % | | | 2.88 | % | | | 2.88 | % |
Awards Issued on November 1, 2018 | | 2.89 | % | | | 2.89 | % | | | 2.89 | % |
| | | | | | | | | | | |
Dividend yield | | — | | | | — | | | | — | |
| | | | | | | | | | | |
Expected volatility: | | | | | | | | | | | |
Awards Issued on May 14, 2018 | | 50.0 | % | | | 50.0 | % | | | 50.0 | % |
Awards Issued on July 1, 2018 | | 50.0 | % | | | 50.0 | % | | | 50.0 | % |
Awards Issued on August 1, 2018 | | 55.0 | % | | | 55.0 | % | | | 55.0 | % |
Awards Issued on October 1, 2018 | | 53.0 | % | | | 53.0 | % | | | 53.0 | % |
Awards Issued on November 1, 2018 | | 54.0 | % | | | 54.0 | % | | | 54.0 | % |
| | | | | | | | | | | |
Calculated fair value per PSU: | | | | | | | | | | | |
Awards Issued on May 14, 2018 | $ | 9.71 | | | $ | 8.52 | | | $ | 7.48 | |
Awards Issued on July 1, 2018 | $ | 9.87 | | | $ | 8.72 | | | $ | 7.68 | |
Awards Issued on August 1, 2018 | $ | 9.79 | | | $ | 8.66 | | | $ | 7.65 | |
Awards Issued on October 1, 2018 | $ | 8.54 | | | $ | 7.57 | | | $ | 6.66 | |
Awards Issued on November 1, 2018 | $ | 7.65 | | | $ | 6.72 | | | $ | 5.88 | |
The following table summarizes information regarding the PSUs granted under the MIP for the period presented:
| | | | | Weighted- | |
| | | | | Average Grant | |
| Number of | | | Date Fair Value | |
| Units | | | per Unit (1) | |
PSUs outstanding at December 31, 2017 (Successor) | | — | | | $ | — | |
Granted (2) | | 395,500 | | | $ | 8.14 | |
Forfeited | | (2,000 | ) | | $ | 7.59 | |
Vested | | — | | | $ | — | |
PSUs outstanding at December 31, 2018 (Successor) | | 393,500 | | | $ | 8.14 | |
| (1) | Determined by dividing the aggregate grant date fair value of awards by the number of awards issued. |
| (2) | The aggregate grant date fair value of PSUs issued for the year ended December 31, 2018 was $3.2 million based on a calculated fair value price ranging from $5.88 to $9.87 per share. |
Restricted Stock Options
The restricted stock options granted are accounted for as equity-classified awards. The grant-date fair value is recognized as compensation cost on a straight-line basis over the requisite service period and forfeitures are accounted for as they occur. Compensation costs are recorded as general and administrative expense.
The fair value for restricted stock options granted during the year ended December 31, 2017 have been estimated using Black-Scholes option pricing model using the following assumptions:
| Awards Issued in | |
| Successor Period | |
Risk-free interest rate | | 2.06 | % |
Dividend yield | | — | |
Expected life (in years) | | 6.0 | |
Expected volatility | | 50.0 | % |
Strike Price | $ | 21.58 | |
Calculated fair value per stock option | $ | 5.01 | |
F-38
AMPLIFY ENERGY CORP.
NOTES TO CONSOLIDATED FINANCIAL STATEMENTS
The following table summarizes information regarding the restricted stock option awards granted under the MIP for the period presented:
| | | | | Weighted- | |
| | | | | Average Grant | |
| Number of | | | Date Fair Value | |
| Options | | | per Option (1) | |
Restricted stock options outstanding at May 5, 2017 (Successor) | | 614,754 | | | $ | 5.01 | |
Granted | | 1,876 | | | $ | 5.01 | |
Forfeited | | (99,232 | ) | | $ | 5.01 | |
Vested | | — | | | $ | — | |
Restricted stock options outstanding at December 31, 2017 (Successor) | | 517,398 | | | $ | 5.01 | |
Granted | | — | | | $ | — | |
Forfeited (2) | | (161,243 | ) | | $ | 5.01 | |
Vested | | (356,155 | ) | | $ | 5.01 | |
Restricted stock options outstanding at December 31, 2018 (Successor) | | — | | | $ | — | |
| (1) | Determined by dividing the aggregate grant date fair value of awards by the number of awards issued. |
| (2) | In connection with certain grants awarded in 2018 pursuant to the MIP, all remaining outstanding and unvested restricted stock options were forfeited. |
Stock Option Modification
On April 27, 2018, in connection with the separation and retirement of certain executives as discussed in Note 1, the board of directors of the Company approved the acceleration of the vesting schedule for 298,354 unvested restricted stock option awards with an exercisable period of two years that otherwise would have been forfeited upon an involuntary termination.
The acceleration of the restricted stock options vesting schedule represents an improbable to probable modification. The grant-date fair value compensation cost of approximately $0.5 million was reversed and the modified-date grant fair value compensation cost of $0.3 million was recognized.
The modified-date grant fair value was estimated using the Black-Scholes option pricing model using the following assumptions:
| Awards Issued in | |
| Successor Period | |
Risk-free interest rate | | 2.49 | % |
Dividend yield | | — | |
Expected life (in years) | | 2.0 | |
Expected volatility | | 50.0 | % |
Strike Price | $ | 21.58 | |
Calculated fair value per stock option | $ | 0.85 | |
2017 Non-Employee Directors Compensation Plan
In June 2017, in connection with the Plan, the Company implemented the 2017 Non-Employee Directors Compensation Plan (“Directors Compensation Plan”) to attract and retain services of experienced non-employee directors of the Company or its subsidiaries. An aggregate of 200,000 shares of the Company’s common stock were reserved for issuance under the Directors Compensation Plan upon adoption. Directors Compensation Plan awards are granted in the form of nonqualified stock options, restricted stock awards, restricted stock units, and other cash-based awards and stock-based awards. To the extent that an award under the Director Compensation Plan is expired, forfeited or cancelled for any reason without having been exercised in full, the unexercised award would then be available again for grant under the Director Compensation Plan. Awards granted will generally vest annually in three equal installments on each of the first three anniversaries of the grant date, subject to the grantee’s continued employment through each such vesting date.
The restricted stock units with a service vesting condition (“Board RSUs”) granted are accounted for as equity-classified awards. The grant-date fair value is recognized as compensation cost on a straight-line basis over the requisite service period and forfeitures are accounted for as they occur. Compensation costs are recorded as general and administrative expense. The unrecognized cost associated with Board RSUs was $0.4 million at December 31, 2018. We expect to recognize the unrecognized compensation cost for these awards over a weighted-average period of 2.0 years.
The following table summarizes information regarding the Board RSUs granted under the Director Compensation Plan for the period presented:
F-39
AMPLIFY ENERGY CORP.
NOTES TO CONSOLIDATED FINANCIAL STATEMENTS
| | | | | Weighted- | |
| | | | | Average Grant | |
| Number of | | | Date Fair Value | |
| Units | | | per Unit (1) | |
Board RSUs outstanding at May 5, 2017 (Successor) | | — | | | $ | — | |
Granted (2) | | 16,341 | | | $ | 13.77 | |
Forfeited | | — | | | $ | — | |
Vested | | — | | | $ | — | |
Board RSUs outstanding at December 31, 2017 (Successor) | | 16,341 | | | $ | 13.77 | |
Granted (3) | | 28,708 | | | $ | 10.45 | |
Forfeited | | — | | | $ | — | |
Vested | | (5,445 | ) | | $ | 13.77 | |
Board RSUs outstanding at December 31, 2018 (Successor) | | 39,604 | | | $ | 11.36 | |
| (1) | Determined by dividing the aggregate grant date fair value of awards by the number of awards issued. |
| (2) | The aggregate grant date fair value of Board RSUs issued in 2017 was $0.2 million based on grant date market price of $13.77 per share. |
| (3) | The aggregate grant date fair value of Board RSUs issued in 2018 was $0.3 million based on a grant date market price of $10.45 per share. |
Predecessor Restricted Common Units
In December 2011, the board of directors of our Predecessor’s general partner adopted the Memorial Production Partners GP LLC Long-Term Incentive Plan (“LTIP”) for employees, officers, consultants and directors of the general partner and any of its affiliates, who perform services for the Predecessor. The LTIP authorized the grant of restricted units, phantom units, unit options, unit appreciation rights, distribution equivalent rights (“DERs”), other unit-based awards and unit awards. The LTIP initially limited the number of common units that could be delivered pursuant to awards under the plan to 2,142,221 common units. Common units that were cancelled, forfeited or withheld to satisfy exercise prices or tax withholding obligations would have been available for delivery pursuant to other awards. The LTIP was administered by the board of directors of our Predecessor’s general partner or a committee thereof. During the year ended December 31, 2016, there were multiple awards of restricted common units that were granted under the LTIP to executive officers and independent directors of our Predecessor’s general partner and other Memorial Resource employees.
The restricted common units awarded were subject to restrictions on transferability, customary forfeiture provisions and typically graded vesting provisions in which one-third of each award vested on the first, second, and third anniversaries of the date of grant. Award recipients had all the rights of a Predecessor unitholder in the Predecessor with respect to the restricted common units, including the right to receive distributions thereon if and when distributions were made by the Predecessor to its unitholders. The term “restricted common unit” represented a time-vested unit. Such awards were non-vested until the required service period expired.
Based on the market price per unit on the date of grant, the aggregate fair value of the restricted common units awarded to our Predecessor’s general partner’s executive officers and other employees during the year ended December 31, 2016 was $0.1 million. The restricted common units granted were accounted for as equity-classified awards. The grant-date fair value was recognized as compensation cost on a straight-line basis over the requisite service period and forfeitures accounted for as they occur. The fair value of the restricted unit awards granted to the independent directors of our Predecessor’s general partner was also recognized as compensation cost on a straight-line basis over the requisite service period. Compensation costs were recorded as direct general and administrative expenses.
On May 1, 2017, the Company effectively cancelled the unvested restricted common unit awards under the LTIP and recorded $2.3 million in compensation expense.
F-40
AMPLIFY ENERGY CORP.
NOTES TO CONSOLIDATED FINANCIAL STATEMENTS
The following table summarizes information regarding restricted common unit awards for the periods presented:
| | | | | Weighted- | |
| | | | | Average Grant | |
| Number of | | | Date Fair Value | |
| Units | | | per Unit (1) | |
Restricted common units outstanding at December 31, 2015 (Predecessor) | | 1,368,538 | | | $ | 17.61 | |
Granted (2) | | 50,000 | | | $ | 2.41 | |
Forfeited | | (27,537 | ) | | $ | 16.99 | |
Vested | | (958,841 | ) | | $ | 18.01 | |
Restricted common units outstanding at December 31, 2016 (Predecessor) | | 432,160 | | | $ | 15.00 | |
Granted | | — | | | $ | — | |
Forfeited | | (12,952 | ) | | $ | 9.51 | |
Vested | | (43,045 | ) | | $ | 10.40 | |
Cancelled | | (376,163 | ) | | $ | 15.72 | |
Restricted common units outstanding at May 4, 2017 (Predecessor) | | — | | | $ | — | |
| (1) | Determined by dividing the aggregate grant date fair value of awards by the number of awards issued. |
| (2) | The aggregate grant date fair value of restricted common unit awards issued in 2016 was $0.1 million based on grant date market price of $2.41 per unit. |
On June 1, 2016, in connection with the MEMP GP Acquisition, as discussed in Note 1, the board of directors of our Predecessor’s general partner approved the acceleration of the vesting schedule of unvested awards under the LTIP for the employees that remained with Memorial Resource. The grant-date fair value compensation cost of approximately $0.1 million was reversed and the modified-date grant fair value compensation cost of $0.5 million was recognized.
On March 9, 2016, certain employees were impacted by an involuntary termination which, upon the approval of the board of directors of our Predecessor’s general partner, accelerated the vesting schedule of unvested awards under the LTIP that otherwise would have been forfeited upon an involuntary termination. The acceleration of the LTIP vesting schedule represents an improbable-to-probable modification. The grant-date fair value compensation cost of approximately $0.5 million was reversed and the modified-date grant fair value compensation cost of approximately $0.3 million was recognized.
Predecessor Phantom Units
The following table summarizes information regarding the Predecessor’s phantom unit awards granted under the LTIP:
| Number of | |
| Units | |
Phantom units outstanding at December 31, 2015 (Predecessor) | | — | |
Granted | | 6,169,018 | |
Forfeited | | (188,325 | ) |
Phantom units outstanding at December 31, 2016 (Predecessor) | | 5,980,693 | |
Granted | | — | |
Forfeited | | (132,347 | ) |
Vested | | (155,601 | ) |
Phantom units outstanding at May 4, 2017 (Predecessor) | | 5,692,745 | |
Cancelled | | (5,692,745 | ) |
Phantom units outstanding at December 31, 2017 (Successor) | | — | |
Phantom units issued to non-employee directors of our Predecessor in January 2016 vested on the first anniversary of the date of grant and were settled in cash for less than $0.1 million. Phantom units issued to certain employees in June 2016 were scheduled to vest in substantially equal one-third increments on the first, second, and third anniversaries of the date of grant. The awards included distribution equivalent rights (“DERs”) pursuant to which the recipient would receive, upon vesting, receive a cash payment with respect to each phantom unit equal to any cash distributions that we pay to a holder of a common unit. DERs were treated as additional compensation expense. Upon vesting, the phantom units were scheduled to be settled through an amount of cash in a single lump sum payment equal to the product of (y) the closing price of our common units on the vesting date and (z) the number of such vested phantom units. In lieu of a cash payment, the board of directors of our Predecessor’s general partner, in its discretion, was permitted to elect for the recipient to receive either a number of common units equal to the number of such vested phantom units or a combination of cash and common units. Upon emergence from bankruptcy, the remaining awards were settled in cash for less than $0.1 million.
F-41
AMPLIFY ENERGY CORP.
NOTES TO CONSOLIDATED FINANCIAL STATEMENTS
Compensation Expense
The following table summarizes the amount of recognized compensation expense associated with these awards that are reflected in the accompanying statements of operations for the periods presented (in thousands):
| Successor | | | | Predecessor | |
| For the | | | Period from | | | | Period from | | | For the | |
| Year Ended | | | May 5, 2017 | | | | January 1, 2017 | | | Year Ended | |
| December 31, | | | through | | | | through | | | December 31, | |
| 2018 | | | December 31, 2017 | | | | May 4, 2017 | | | 2016 | |
Equity classified awards | | | | | | | | | | | | | | | | |
TSUs (Successor) | $ | 1,445 | | | $ | 1,906 | | | | $ | — | | | $ | — | |
PSUs (Successor) | | 1,404 | | | | — | | | | | — | | | | — | |
Board RSUs (Successor) | | 142 | | | | 41 | | | | | — | | | | — | |
Restricted stock options (Successor) | | (214 | ) | | | 569 | | | | | — | | | | — | |
Restricted common units (Predecessor) | | — | | | | — | | | | | 3,713 | | | | 7,206 | |
Liability classified awards | | | | | | | | | | | | | | | | |
Phantom units (Predecessor) | | — | | | | — | | | | | (46 | ) | | | 322 | |
| $ | 2,777 | | | $ | 2,516 | | | | $ | 3,667 | | | $ | 7,528 | |
Note 15. Supplemental Disclosures to the Consolidated Balance Sheet and Condensed Statement of Cash Flows
Accrued Liabilities
Current accrued liabilities consisted of the following at the dates indicated (in thousands):
| Successor | |
| December 31, | | | December 31, | |
| 2018 | | | 2017 | |
Accrued lease operating expense | $ | 10,469 | | | $ | 6,439 | |
Accrued general and administrative expense | | 4,393 | | | | 4,412 | |
Accrued capital expenditures | | 4,349 | | | | 3,854 | |
Accrued interest payable | | 2,476 | | | | 1,309 | |
Accrued ad valorem tax | | 729 | | | | 398 | |
Asset retirement obligations | | 477 | | | | 713 | |
Other | | 262 | | | | 1,108 | |
Accrued liabilities | $ | 23,155 | | | $ | 18,233 | |
F-42
AMPLIFY ENERGY CORP.
NOTES TO CONSOLIDATED FINANCIAL STATEMENTS
Cash and Cash Equivalents Reconciliation
The following table provides a reconciliation of cash and cash equivalents on the Consolidated Balance Sheet to cash, cash equivalents and restricted cash on the Statements of Consolidated Cash Flows (in thousands):
| Successor | |
| December 31, | | | December 31, | |
| 2018 | | | 2017 | |
Cash and cash equivalents | $ | 49,704 | | | $ | 6,392 | |
Restricted cash | | 325 | | | | — | |
Total cash, cash equivalents and restricted cash | $ | 50,029 | | | $ | 6,392 | |
Supplemental Cash Flows
Supplemental cash flow for the periods presented (in thousands):
| Successor | | | | Predecessor | |
| | | | | Period from | | | | Period from | | | | | |
| For the | | | May 5, 2017 | | | | January 1, 2017 | | | For the | |
| Year Ended | | | through | | | | through | | | Year Ended | |
| December 31, 2018 | | | December 31, 2017 | | | | May 4, 2017 | | | December 31, 2016 | |
Supplemental cash flows: | | | | | | | | | | | | | | | | |
Cash paid for interest, net of amounts capitalized | $ | 17,083 | | | $ | 12,109 | | | | $ | 6,598 | | | $ | 87,527 | |
Cash paid for reorganization items, net | | 2,399 | | | | 7,934 | | | | | 11,999 | | | $ | — | |
Noncash investing and financing activities: | | | | | | | | | | | | | | | | |
Increase (decrease) in capital expenditures in payables and accrued liabilities | | (156 | ) | | | (1,080 | ) | | | | 3,173 | | | | (6,284 | ) |
(Increase) decrease in accounts receivable/payable related to divestiture | | — | | | | — | | | | | — | | | | (289 | ) |
Asset retirement obligation removal related to divestitures | | (15,702 | ) | | | — | | | | | — | | | | (19,669 | ) |
Note 16. Related Party Transactions
On June 1, 2016, Memorial Resource and certain affiliates of NGP became unaffiliated entities after we closed the MEMP GP Acquisition, as discussed in Note 1.
NGP Affiliated Companies
During the year ended December 31, 2016, we paid less than $0.1 million to Multi-Shot, LLC, an NGP affiliated company, for services related to our drilling and completion activities.
Common Control Acquisitions
2016 Acquisition
On June 1, 2016, as discussed in Note 1, the Predecessor acquired all of the equity interests in our Predecessor’s general partner, MEMP GP, from Memorial Resource for cash consideration of approximately $0.8 million. The acquisition was accounted for as an equity transaction and no gain or loss was recognized as a result of the acquisition. In connection with the closing of the transaction, our Predecessor’s partnership agreement was amended and restated to, among other things, (i) convert MEMP GP’s 0.1% general partnership interest into a non-economic general partner interest, (ii) cancel the IDRs, and (iii) provide that the limited partners of our Predecessor had the ability to elect the members of MEMP GP’s board of directors. On June 1, 2016, the Predecessor also acquired the remaining 50% of the IDRs of MEMP owned by an NGP affiliate.
Related Party Agreements
The Predecessor and certain of our former affiliates entered into various documents and agreements. These agreements were negotiated among affiliated parties and, consequently, were not the result of arm’s-length negotiations. Since our emergence from bankruptcy on May 4, 2017, there have been no transactions in excess of $120,000 between us and a related person in which the related person had a direct or indirect material interest.
F-43
AMPLIFY ENERGY CORP.
NOTES TO CONSOLIDATED FINANCIAL STATEMENTS
Predecessor Omnibus Agreement
Memorial Resource provided management, administrative and operating services to the Predecessor and our Predecessor’s general partner pursuant to our Predecessor’s Omnibus Agreement. Upon completion of the MEMP GP Acquisition, the Predecessor’s Omnibus Agreement was terminated and the Predecessor entered into a transition services agreement with Memorial Resource. The following table summarizes the amount of general and administrative expenses recognized under the Predecessor’s Omnibus Agreement that are reflected in the accompanying statements of operations for the periods presented (in thousands):
Successor | | | | Predecessor | |
For the | | | Period from | | | | Period from | | | For the | |
Year Ended | | | May 5, 2017 | | | | January 1, 2017 | | | Year Ended | |
December 31, | | | through | | | | through | | | December 31, | |
2018 | | | December 31, 2017 | | | | May 4, 2017 | | | 2016 | |
$ | — | | | $ | — | | | | $ | — | | | $ | 11,867 | |
Transition Services Agreement
On June 1, 2016, we closed the MEMP GP Acquisition. Upon closing of the MEMP GP Acquisition, we and Memorial Resource became unaffiliated entities. We terminated our Predecessor’s Omnibus Agreement as noted above and entered into a transition services agreement with Memorial Resource to manage post-closing separation costs and activities. The Company did not incur any costs under the transition services agreement for the year ended December 31, 2018, the period from May 5, 2017 through December 31, 2017 or for the period from January 1, 2017 through May 4, 2017. During the year ended December 31, 2016, we recorded $1.6 million of general and administrative expense related to the transition services agreement with Memorial Resource.
Note 17. Commitments and Contingencies
Litigation & Environmental
As part of our normal business activities, we may be named as defendants in litigation and legal proceedings, including those arising from regulatory and environmental matters. On January 13, 2017, the Company received a letter from the Environmental Protection Agency (“EPA”) concerning potential violations of the Clean Air Act (“CAA”) section 112(r) associated with our Bairoil complex in Wyoming. The Company met with the EPA on February 16, 2017 to present relevant information related to the allegations. On September 12, 2017, the EPA filed an Administrative Compliance Order on Consent for which the Company was required to bring all outstanding issues to closure no later than June 30, 2018. On June 14, 2018, we sent the EPA a letter informing the EPA that we had completed all remedial action items related to the Administrative Compliance Order on Consent. In September 2018, we came to an agreement regarding the potential violations, noting no material impact on the Company’s financial position, results of operations or cash flows. Other than the Chapter 11 proceedings and the alleged CAA violations discussed herein, based on facts currently available, we are not aware of any litigation, pending or threatened, that we believe will have a material adverse effect on our financial position, results of operations or cash flows; however, cash flow could be significantly impacted in the reporting periods in which such matters are resolved.
Although we are insured against various risks to the extent we believe it is prudent, there is no assurance that the nature and amount of such insurance will be adequate, in every case, to indemnify us against liabilities arising from future legal proceedings.
Environmental costs for remediation are accrued based on estimates of known remediation requirements. Such accruals are based on management’s best estimate of the ultimate cost to remediate a site and are adjusted as further information and circumstances develop. Those estimates may change substantially depending on information about the nature and extent of contamination, appropriate remediation technologies and regulatory approvals. Expenditures to mitigate or prevent future environmental contamination are capitalized. Ongoing environmental compliance costs are charged to expense as incurred. In accruing for environmental remediation liabilities, costs of future expenditures for environmental remediation are not discounted to their present value, unless the amount and timing of the expenditures are fixed or reliably determinable.
F-44
AMPLIFY ENERGY CORP.
NOTES TO CONSOLIDATED FINANCIAL STATEMENTS
The following table presents the activity of our environmental reserves for the periods presented:
| | Successor | | | | Predecessor | |
| | 2018 | | | 2017 | | | | 2016 | |
| | (In thousands) | | | | (In thousands) | |
Balance at beginning of period | | $ | — | | | $ | — | | | | $ | 216 | |
Charged to costs and expenses | | | — | | | | — | | | | | — | |
Payments | | | — | | | | — | | | | | (216 | ) |
Balance at end of period | | $ | — | | | $ | — | | | | $ | — | |
At December 31, 2018 and 2017, we had no environmental reserves recorded.
Third-Party Midstream Transaction
In October 2017, we recognized an approximately $17.0 million gain in connection with the sale of a third-party midstream entity with whom our natural gas gathering and processing agreements entitled us to a percentage of the proceeds in the event of a sale.
Application for Final Decree
On April 30, 2018, the Debtors filed with the Bankruptcy Court a motion for a final decree and entry of an order closing the Chapter 11 cases with respect to each of the Debtors other than (i) San Pedro Bay Pipeline Company, Ch. 11 Case No. 17-30249, (ii) Rise Energy Beta, LLC, Ch. 11 Case No. 17-30250, and (iii) Beta Operating Company, LLC, Ch. 11 Case No. 17-30253, (collectively, the “Closing Debtors”). On May 30, 2018, the Bankruptcy Court entered the final decree closing the Chapter 11 cases of the Closing Debtors.
Sinking Fund Trust Agreement
Beta Operating Company, LLC (“Beta”) assumed an obligation with a third party to make payments into a sinking fund in connection with its 2009 acquisition of our properties in federal waters offshore California, the purpose of which is to provide funds adequate to decommission the portion of the San Pedro Bay pipeline that lies within state waters and the surface facilities. Under the terms of the agreement, the operator of the properties is obligated to make monthly deposits into the sinking fund account in an amount equal to $0.25 per barrel of oil and other liquid hydrocarbon produced from the acquired working interest. Interest earned in the account stays in the account. The obligation to fund ceases when the aggregate value of the account reaches $4.3 million. As of December 31, 2018, the account balance included in restricted investments was approximately $4.3 million.
Supplemental Bond for Decommissioning Liabilities Trust Agreement
Beta has an obligation with the BOEM in connection with the 2009 acquisition of the Beta properties. On October 5, 2018, the Company received approximately $61.5 million from the trust account (the “Beta Decommissioning Trust Account”). On November 20, 2018, the Company received an additional $1.0 million from the Beta Decommissioning Trust Account that had been withheld from the initial payment on October 5, 2018. The cash released to the Company’s balance sheet was made pursuant to an order of the Bankruptcy Court dated February 9, 2018, which allowed for the release of Beta cash subject to certain conditions that have since been satisfied. Following the cash release, Beta’s decommissioning obligations remain fully supported by A-rated surety bonds and $90.0 million of cash.
In the event the account balance is less than the contractual amount, the working interest owners must make additional payments. Interest income earned and deposited in the trust account mitigates the likelihood that additional payments will have to be made by the working interest owners. In 2015, the BOEM issued a preliminary report that indicated the estimated cost of decommissioning may further increase. The implementation of this increase is currently on hold and we do not expect resolution of a negotiated decommissioning estimate until later in 2019.
The gross held-to-maturity investments held in the trust account as of December 31, 2018 for the U.S. Bank money market cash equivalent was $90.2 million.
Operating Leases
We have leases for offshore Southern California pipeline right-of-way use as well as office space in our operating regions. We also lease equipment, compressors and incur surface rentals related to our business operations.
F-45
AMPLIFY ENERGY CORP.
NOTES TO CONSOLIDATED FINANCIAL STATEMENTS
For the year ended December 31, 2018, the period from May 5, 2017 through December 31, 2017, the period from January 1, 2017 through May 4, 2017 and the year ended December 31, 2016, we recognized $8.6 million, $6.3 million, $3.1 million, and $10.9 million of rent expense, respectively.
Amounts shown in the following table represent minimum lease payment obligations under non-cancelable operating leases with a remaining term in excess of one year (in thousands):
| | | | | | Payment or Settlement Due by Period | |
Operating leases | | Total | | | 2019 | | | | 2020 | | | 2021 | | | 2022 | | | 2023 | | | Thereafter | |
Operating leases | | $ | 11,846 | | | $ | 5,893 | | | | $ | 2,072 | | | $ | 2,109 | | | $ | 337 | | | $ | 205 | | | $ | 1,230 | |
Purchase Commitments
At December 31, 2018, we had a CO2 purchase commitment with a third party associated with our Wyoming Bairoil properties. The price we will pay for CO2 generally varies depending on the amount of CO2 delivered and the price of oil. The table below outlines our purchase commitments under these contracts based on pricing at December 31, 2018 (in thousands):
| | | | | | Payment or Settlement Due by Period | |
Purchase commitment | | Total | | | 2019 | | | | 2020 | | | 2021 | | | 2022 | | | 2023 | | | Thereafter | |
CO2 minimum purchase commitment | | $ | 8,315 | | | $ | 4,306 | | | | $ | 4,009 | | | $ | — | | | $ | — | | | $ | — | | | $ | — | |
Minimum Volume Commitment
At December 31, 2018, we had a long-term minimum volume commitment with a third party associated with a certain portion of our properties located in East Texas. The table below outlines the payment commitments associated with this minimum volume commitment (in thousands):
| | | | | | Payment or Settlement Due by Period | |
Minimum volume commitment | | Total | | | 2019 | | | | 2020 | | | 2021 | | | 2022 | | | 2023 | | | Thereafter | |
Midstream services | | $ | 12,308 | | | $ | 3,075 | | | | $ | 3,083 | | | $ | 3,075 | | | $ | 3,075 | | | $ | — | | | $ | — | |
Note 18. Income Tax
Amplify Energy is a corporation and as a result, is subject to U.S. federal, state and local income taxes.
On December 22, 2017, the U.S. government enacted comprehensive tax legislation commonly referred to as the Tax Cuts and Jobs Act (the “Tax Act”). The provisions of the Tax Act that impact us include, but are not limited to, (1) reducing the U.S. federal corporate tax rate from 35% to 21%; (2) elimination of the corporate alternative minimum tax (AMT); (3) temporary bonus depreciation that will allow for full expensing of qualified property, and (4) limitations on net operating losses (NOLs) generated after December 31, 2017, to 80% of taxable income. In conjunction with the Tax Act, the SEC staff issued Staff Accounting Bulletin No. 118, Income Tax Accounting Implications of the Tax Cuts and Jobs Act (SAB 118), which provides a measurement period that should not extend beyond one year from the Tax Act enactment date for companies to complete the accounting under Accounting Standards Codification 740 “Income Tax” (“ASC 740”). In accordance with SAB 118, a company must reflect the income tax effects of those aspects of the Tax Act for which the accounting under ASC 740 is complete. To the extent that a company’s accounting for certain income tax effects of the Tax Act is incomplete but it is able to determine a reasonable estimate, it must record a provisional estimate in the financial statements. If a company cannot determine a provisional estimate to be included in the financial statements, it should continue to apply ASC 740 on the basis of the provisions of the tax laws that were in effect immediately before the enactment of the Tax Act.
We previously reported provisional amounts resulting from the income tax effects of the Tax Act for which the accounting was incomplete, but a reasonable estimate could be determined. During the year ended December 31, 2018, our accounting for the income tax effects of the Tax Act was completed without material changes to the previously provided estimates.
F-46
AMPLIFY ENERGY CORP.
NOTES TO CONSOLIDATED FINANCIAL STATEMENTS
The components of income tax benefit (expense) are as follows:
| Successor | | | | Predecessor | |
| | | | | Period from | | | | Period from | | | | | |
| For the Year Ended | | | May 5, 2017 | | | | January 1, 2017 | | | For the Year Ended | |
| December 31, | | | through | | | | through | | | December 31, | |
| 2018 | | | December 31, 2017 | | | | May 4, 2017 | | | 2016 | |
| (In thousands) | | | | (In thousands) | |
Current taxes: | | | | | | | | | | | | | | | | |
Federal | $ | — | | | $ | 4 | | | | $ | — | | | $ | 6 | |
State | | — | | | | (34 | ) | | | | 17 | | | | 8 | |
Total current income tax benefit (expense) | | — | | | | (30 | ) | | | | 17 | | | | 14 | |
Deferred taxes: | | | | | | | | | | | | | | | | |
Federal | | — | | | | 1,933 | | | | | 71 | | | | 8 | |
State | | — | | | | 273 | | | | | 3 | | | | (195 | ) |
Total deferred income tax benefit (expense) | | — | | | | 2,206 | | | | | 74 | | | | (187 | ) |
Total income tax benefit (expense) | $ | — | | | $ | 2,176 | | | | $ | 91 | | | $ | (173 | ) |
The actual income tax benefit (expense) differs from the expected amount computed by applying the federal statutory corporate tax rate of 21% in 2018 and 35% in 2017 and 2016 as follows:
| Successor | | | | Predecessor | |
| | | | | Period from | | | | Period from | | | | | |
| For the Year Ended | | | May 5, 2017 | | | | January 1, 2017 | | | For the Year Ended | |
| December 31, | | | through | | | | through | | | December 31, | |
| 2018 | | | December 31, 2017 | | | | May 4, 2017 | | | 2016 | |
| (In thousands) | | | | (In thousands) | | | | | |
Expected tax benefit (expense) at federal statutory rate | $ | 11,468 | | | $ | 310 | | | | $ | 5,764 | | | $ | 191,870 | |
State income tax benefit (expense), net of federal benefit | | 1,108 | | | | 240 | | | | | 30 | | | | 382 | |
Non-deductible expenses | | 1,328 | | | | (187 | ) | | | | — | | | | — | |
Changes in valuation allowances | | (14,194 | ) | | | 24,767 | | | | | — | | | | — | |
Remeasurement of federal deferred tax assets due rate change | | — | | | | (22,958 | ) | | | | — | | | | — | |
Pass-through entities (1) | | — | | | | — | | | | | (5,686 | ) | | | (191,921 | ) |
Other | | 290 | | | | 4 | | | | | (17 | ) | | | (504 | ) |
Total income tax benefit (expense) | $ | — | | | $ | 2,176 | | | | $ | 91 | | | $ | (173 | ) |
(1) | MEMP, a publicly traded partnership with qualifying income, was a pass-through entity for federal income tax purposes. |
F-47
AMPLIFY ENERGY CORP.
NOTES TO CONSOLIDATED FINANCIAL STATEMENTS
The Company’s deferred tax position reflects the net tax effects of the temporary differences between the carrying amounts of assets and liabilities for financial reporting purposes and the amounts used for income tax reporting. Significant components of the deferred tax assets and liabilities are as follows (in thousands):
| Successor | |
| December 31, | | | December 31, | |
| 2018 | | | 2017 | |
Deferred income tax assets: | | | | | | | |
Property, Plant & Equipment | $ | 2,208 | | | $ | 19,423 | |
Derivative instrument | | — | | | | 6,251 | |
Net operating loss carryforward | | 19,085 | | | | 10,452 | |
Asset retirement obligation | | — | | | | 1,223 | |
Interest | | 5,748 | | | | — | |
Accrued liabilities | | 1,387 | | | | — | |
Other | | 307 | | | | 779 | |
Total deferred income tax assets: | | 28,735 | | | | 38,128 | |
Valuation allowance | | (23,934 | ) | | | (38,128 | ) |
Net deferred income tax assets | | 4,801 | | | | — | |
| | | | | | | |
Deferred income tax liabilities: | | | | | | | |
Property, plant and equipment | $ | — | | | $ | — | |
Derivatives | | 4,801 | | | | — | |
Other | | — | | | | — | |
Total deferred income tax liabilities | | 4,801 | | | | — | |
| | | | | | | |
Net deferred income tax liabilities | $ | — | | | $ | — | |
As of December 31, 2018, the Company had approximately $86.0 million of federal net operating loss carryovers of which $41.0 million federal net operating loss forwards have no expiration date and the remaining will expire in years 2035 – 2037. As of December 31, 2018, the Company had approximately $14.8 million of state net operating loss carryovers. The state net operating loss carryforwards will expire in varying amounts beginning in 2035.
In assessing deferred tax assets, the Company considers whether a valuation allowance should be recorded for some or all of the deferred tax assets which may not be realized. The ultimate realization of deferred tax assets is dependent upon the generation of future taxable income during the periods in which the temporary differences become deductible. Among other items, the Company considers the scheduled reversal of deferred tax liabilities, projected future taxable income and available tax planning strategies. As of December 31, 2018, a valuation allowance of $23.9 million had been recorded.
Uncertain Income Tax Position. We must recognize the tax effects of any uncertain tax positions we may adopt, if the position taken by us is more likely than not sustainable based on its technical merits. For those benefits to be recognized, an income tax position must be more-likely-than-not to be sustained upon examination by taxing authorities. We had no unrecognized tax benefits as of December 31, 2018.
Tax Audits and Settlements. Generally, our income tax years 2015 through 2018 remain open and subject to examination by the Internal Revenue Service or state tax jurisdictions where we conduct operations. In certain jurisdictions we operate through more than one legal entity, each of which may have different open years subject to examination.
F-48
AMPLIFY ENERGY CORP.
NOTES TO CONSOLIDATED FINANCIAL STATEMENTS
Note 19. Quarterly Financial Information (Unaudited)
The following tables present selected quarterly financial data for the periods indicated. Earnings per share/unit are computed independently for each of the quarters presented and the sum of the quarterly earnings per share/unit may not necessarily equal the total for the year.
| Successor | |
| First | | | Second | | | | Third | | | Fourth | |
| Quarter | | | Quarter | | | | Quarter | | | Quarter | |
| (In thousands, except per share amounts) | |
Revenues | $ | 87,932 | | | $ | 90,988 | | | | $ | 85,522 | | | $ | 75,702 | |
Operating income (loss) | | 9,529 | | | | (18,226 | ) | | | | 3,206 | | | | 87,014 | |
Net income (loss) | | 3,239 | | | | (25,279 | ) | | | | (2,598 | ) | | | 79,247 | |
Net income (loss) attributable to Successor | | 3,239 | | | | (25,279 | ) | | | | (2,598 | ) | | | 79,247 | |
Net income (loss) available to common stockholders | | 3,156 | | | | (25,279 | ) | | | | (2,598 | ) | | | 75,727 | |
Basic and diluted earnings per share | $ | 0.13 | | | $ | (1.01 | ) | | | $ | (0.10 | ) | | $ | 3.06 | |
| Predecessor | | | | Successor | |
| | | | | Period from | | | | Period from | | | | | | | | | |
| | | | | April 1, 2017 | | | | May 5, 2017 | | | | | | | | | |
| First | | | through | | | | through | | | Third | | | Fourth | |
| Quarter | | | May 4, 2017 | | | | June 30, 2017 | | | Quarter | | | Quarter | |
| (In thousands, except per share/unit amounts) | |
Revenues | $ | 81,380 | | | $ | 27,821 | | | | $ | 42,395 | | | $ | 75,589 | | | $ | 87,495 | |
Operating income (loss) | | (421 | ) | | | 8,384 | | | | | 2,654 | | | | (6,043 | ) | | | 2,573 | |
Net income (loss) | | (16,377 | ) | | | (74,578 | ) | | | | (906 | ) | | | (7,536 | ) | | | 9,728 | |
Net income (loss) attributable to Successor/Predecessor | | (16,377 | ) | | | (74,578 | ) | | | | (906 | ) | | | (7,536 | ) | | | 9,728 | |
Net income (loss) available to common stockholders/limited partners | | (16,377 | ) | | | (74,578 | ) | | | | (906 | ) | | | (7,536 | ) | | | 9,463 | |
Basic and diluted earnings per unit/share | | (0.20 | ) | | | (0.89 | ) | | | | (0.04 | ) | | | (0.30 | ) | | | 0.38 | |
See Notes 4 and 13 for additional information regarding earnings per share/unit.
Note 20. Supplemental Oil and Gas Information (Unaudited)
Capitalized Costs Relating to Oil and Natural Gas Producing Activities
The total amount of capitalized costs relating to oil and natural gas producing activities and the total amount of related accumulated depreciation, depletion and amortization is as follows at the dates indicated.
| Successor | |
| December 31, | | | December 31, | |
| 2018 | | | 2017 | |
| (In thousands) | |
Evaluated oil and natural gas properties | $ | 598,331 | | | $ | 603,053 | |
Support equipment and facilities | | 108,760 | | | | 100,225 | |
Accumulated depletion, depreciation, and amortization | | (82,389 | ) | | | (34,429 | ) |
Total | $ | 624,702 | | | $ | 668,849 | |
F-49
AMPLIFY ENERGY CORP.
NOTES TO CONSOLIDATED FINANCIAL STATEMENTS
Costs Incurred in Oil and Natural Gas Property Acquisition, Exploration and Development Activities
Costs incurred in property acquisition, exploration and development activities were as follows for the periods indicated:
| Successor | | | | Predecessor | |
| | | | | Period from | | | | | | | | | | |
| For the | | | May 5, 2017 | | | | Period from | | | For the | |
| Year Ended | | | through | | | | January 1, | | | Year Ended | |
| December 31, | | | December 31, | | | | 2017 through | | | December 31, | |
| 2018 | | | 2017 | | | | May 4, 2017 | | | 2016 | |
| (In thousands) | | | | (In thousands) | |
Property acquisition costs, proved | $ | — | | | $ | — | | | | $ | — | | | $ | — | |
Property acquisition costs, unproved | | — | | | | — | | | | | — | | | | — | |
Exploration | | — | | | | — | | | | | — | | | | 792 | |
Development | | 42,878 | | | | 51,925 | | | | | 9,573 | | | | 54,310 | |
Total | $ | 42,878 | | | $ | 51,925 | | | | $ | 9,573 | | | $ | 55,102 | |
Standardized Measure of Discounted Future Net Cash Flows from Proved Reserves
As required by the FASB and SEC, the standardized measure of discounted future net cash flows presented below is computed by applying first-day-of-the-month average prices, year-end costs and legislated tax rates and a discount factor of 10 percent to proved reserves. We do not believe the standardized measure provides a reliable estimate of the Company’s expected future cash flows to be obtained from the development and production of its oil and gas properties or of the value of its proved oil and gas reserves. The standardized measure is prepared on the basis of certain prescribed assumptions including first-day-of-the-month average prices, which represent discrete points in time and therefore may cause significant variability in cash flows from year to year as prices change.
Oil and Natural Gas Reserves
Users of this information should be aware that the process of estimating quantities of “proved” and “proved developed” oil and natural gas reserves is very complex, requiring significant subjective decisions in the evaluation of all available geological, engineering and economic data for each reservoir. The data for a given reservoir may also change substantially over time as a result of numerous factors including, but not limited to, additional development activity, evolving production history and continual reassessment of the viability of production under varying economic conditions. As a result, revisions to existing reserve estimates may occur from time to time. Although every reasonable effort is made to ensure reserve estimates reported represent the most accurate assessments possible, the subjective decisions and variances in available data for various reservoirs make these estimates generally less precise than other estimates included in the financial statement disclosures.
Proved reserves are those quantities of oil and natural gas that by analysis of geoscience and engineering data can be estimated with reasonable certainty to be economically producible — from a given date forward, from known reservoirs, and under existing economic conditions, operating methods and government regulations — prior to the time at which contracts providing the right to operate expire, unless evidence indicates that renewal is reasonably certain, regardless of whether deterministic or probabilistic methods are used for the estimation. The project to extract the hydrocarbons must have commenced or the operator must be reasonably certain that it will commence the project within a reasonable time.
We engaged Ryder Scott to audit our reserves estimates for all of our estimated proved reserves (by volume) at December 31, 2018. All proved reserves are located in the United States and all prices are held constant in accordance with SEC rules.
F-50
AMPLIFY ENERGY CORP.
NOTES TO CONSOLIDATED FINANCIAL STATEMENTS
The weighted-average benchmark product prices used for valuing the reserves are based upon the average of the first-day-of-the-month price for each month within the period January through December of each year presented:
| 2018 | | | 2017 | | | 2016 | |
Oil ($/Bbl): | | | | | | | | | | | |
WTI (1) | $ | 65.56 | | | $ | 51.34 | | | $ | 42.75 | |
| | | | | | | | | | | |
NGL ($/Bbl): | | | | | | | | | | | |
WTI (1) | $ | 65.56 | | | $ | 51.34 | | | $ | 42.75 | |
| | | | | | | | | | | |
Natural Gas ($/MMbtu): | | | | | | | | | | | |
Henry Hub (2) | $ | 3.10 | | | $ | 2.98 | | | $ | 2.48 | |
| (1) | The weighted average WTI price was adjusted by lease for quality, transportation fees, and a regional price differential. |
| (2) | The weighted average Henry Hub price was adjusted by lease for energy content, compression charges, transportation fees, and regional price differentials. |
The following tables set forth estimates of the net reserves for the periods indicated:
| Year Ended December 31, 2018 (Successor) | |
| Oil | | | Gas | | | NGLs | | | Equivalent | |
| (MBbls) | | | (MMcf) | | | (MBbls) | | | (MMcfe) | |
Proved developed and undeveloped reserves: | | | | | | | | | | | | | | | |
Beginning of year | | 72,004 | | | | 406,558 | | | | 25,189 | | | | 989,721 | |
Extensions and discoveries | | 1,207 | | | | 2,910 | | | | 231 | | | | 11,541 | |
Production | | (3,335 | ) | | | (29,176 | ) | | | (1,496 | ) | | | (58,166 | ) |
Sale of minerals in place | | (159 | ) | | | (56,328 | ) | | | (1,469 | ) | | | (66,095 | ) |
Revision of previous estimates | | (93 | ) | | | (30,005 | ) | | | (883 | ) | | | (35,864 | ) |
End of year | | 69,624 | | | | 293,959 | | | | 21,572 | | | | 841,137 | |
| | | | | | | | | | | | | | | |
Proved developed reserves: | | | | | | | | | | | | | | | |
Beginning of year | | 50,014 | | | | 299,481 | | | | 17,982 | | | | 707,459 | |
End of year | | 54,147 | | | | 232,110 | | | | 17,324 | | | | 660,937 | |
| | | | | | | | | | | | | | | |
Proved undeveloped reserves: | | | | | | | | | | | | | | | |
Beginning of year | | 21,990 | | | | 107,077 | | | | 7,207 | | | | 282,262 | |
End of year | | 15,477 | | | | 61,849 | | | | 4,248 | | | | 180,200 | |
| For the period from May 5, 2017 through December 31, 2017 (Successor) | |
| Oil | | | Gas | | | NGLs | | | Equivalent | |
| (MBbls) | | | (MMcf) | | | (MBbls) | | | (MMcfe) | |
Proved developed and undeveloped reserves: | | | | | | | | | | | | | | | |
Beginning of period | | 80,960 | | | | 419,472 | | | | 30,572 | | | | 1,088,660 | |
Extensions and discoveries | | 121 | | | | 4,900 | | | | 261 | | | | 7,195 | |
Production | | (2,380 | ) | | | (21,885 | ) | | | (1,114 | ) | | | (42,850 | ) |
Revision of previous estimates | | (6,697 | ) | | | 4,071 | | | | (4,530 | ) | | | (63,284 | ) |
End of period | | 72,004 | | | | 406,558 | | | | 25,189 | | | | 989,721 | |
| | | | | | | | | | | | | | | |
Proved developed reserves: | | | | | | | | | | | | | | | |
Beginning of period | | 57,803 | | | | 297,101 | | | | 21,963 | | | | 775,693 | |
End of period | | 50,014 | | | | 299,481 | | | | 17,982 | | | | 707,459 | |
| | | | | | | | | | | | | | | |
Proved undeveloped reserves: | | | | | | | | | | | | | | | |
Beginning of period | | 23,157 | | | | 122,371 | | | | 8,609 | | | | 312,967 | |
End of period | | 21,990 | | | | 107,077 | | | | 7,207 | | | | 282,262 | |
F-51
AMPLIFY ENERGY CORP.
NOTES TO CONSOLIDATED FINANCIAL STATEMENTS
| For the period from January 1, 2017 through May 4, 2017 (Predecessor) | |
| Oil | | | Gas | | | NGLs | | | Equivalent | |
| (MBbls) | | | (MMcf) | | | (MBbls) | | | (MMcfe) | |
Proved developed and undeveloped reserves: | | | | | | | | | | | | | | | |
Beginning of period | | 65,741 | | | | 371,016 | | | | 25,184 | | | | 916,565 | |
Extensions and discoveries | | 53 | | | | 45 | | | | 8 | | | | 410 | |
Production | | (1,204 | ) | | | (12,411 | ) | | | (616 | ) | | | (23,336 | ) |
Revision of previous estimates | | 16,370 | | | | 60,822 | | | | 5,996 | | | | 195,021 | |
End of period | | 80,960 | | | | 419,472 | | | | 30,572 | | | | 1,088,660 | |
| | | | | | | | | | | | | | | |
Proved developed reserves: | | | | | | | | | | | | | | | |
Beginning of period | | 45,536 | | | | 280,035 | | | | 18,923 | | | | 666,786 | |
End of period | | 57,803 | | | | 297,101 | | | | 21,963 | | | | 775,693 | |
| | | | | | | | | | | | | | | |
Proved undeveloped reserves: | | | | | | | | | | | | | | | |
Beginning of period | | 20,205 | | | | 90,981 | | | | 6,261 | | | | 249,779 | |
End of period | | 23,157 | | | | 122,371 | | | | 8,609 | | | | 312,967 | |
| Year Ended December 31, 2016 (Predecessor) | |
| Oil | | | Gas | | | NGLs | | | Equivalent | |
| (MBbls) | | | (MMcf) | | | (MBbls) | | | (MMcfe) | |
Proved developed and undeveloped reserves: | | | | | | | | | | | | | | | |
Beginning of year | | 90,945 | | | | 461,526 | | | | 43,395 | | | | 1,267,571 | |
Extensions and discoveries | | 297 | | | | 288 | | | | 42 | | | | 2,320 | |
Production | | (3,883 | ) | | | (44,776 | ) | | | (2,283 | ) | | | (81,773 | ) |
Sale of minerals in place | | (3,228 | ) | | | (15,227 | ) | | | (123 | ) | | | (35,328 | ) |
Revision of previous estimates | | (18,390 | ) | | | (30,795 | ) | | | (15,847 | ) | | | (236,225 | ) |
End of year | | 65,741 | | | | 371,016 | | | | 25,184 | | | | 916,565 | |
| | | | | | | | | | | | | | | |
Proved developed reserves: | | | | | | | | | | | | | | | |
Beginning of year | | 50,817 | | | | 311,147 | | | | 30,315 | | | | 797,936 | |
End of year | | 45,536 | | | | 280,035 | | | | 18,923 | | | | 666,786 | |
| | | | | | | | | | | | | | | |
Proved undeveloped reserves: | | | | | | | | | | | | | | | |
Beginning of year | | 40,128 | | | | 150,379 | | | | 13,080 | | | | 469,635 | |
End of year | | 20,205 | | | | 90,981 | | | | 6,261 | | | | 249,779 | |
Noteworthy amounts included in the categories of proved reserve changes in the above tables include:
| • | The 148.6 Bcfe reduction in reserves for the year ended December 31, 2018 is primarily due to a 27.6 Bcfe upward pricing revision and a 63.5 Bcfe downward revision due to updated well performance data and future anticipated development and maintenance cost increases. We divested 66.1 Bcfe during the year ended December 31, 2018. We added 11.5 Bcfe during the year ended December 31, 2018 due to extensions and discoveries. |
| • | The 98.9 Bcfe reduction in reserves for the period from May 5, 2017 through December 31, 2017 is primarily due to a 13.4 Bcfe upward pricing revision and a 76.7 Bcfe downward revision due to updated well performance data and future anticipated development and maintenance cost increases. We added 7.2 Bcfe during the period from May 5, 2017 through December 31, 2017 due to extensions and discoveries. |
| • | The 172.1 Bcfe increase in reserves for the January 1, 2017 through May 4, 2017 is primarily due to a 204.6 Bcfe upward pricing revision and a 9.6 Bcfe downward revision due to updated well performance data. Proved undeveloped reserves increased primarily due to upward pricing during the period from January 1, 2017 through May 4, 2017. |
F-52
AMPLIFY ENERGY CORP.
NOTES TO CONSOLIDATED FINANCIAL STATEMENTS
| • | The 351.0 Bcfe reduction in reserves for the year ended December 31, 2016 is primarily due to a 148.3 Bcfe downward pricing revision and an 87.9 Bcfe downward revision due to updated well performance data. We divested 35.3 Bcfe during the year ended December 31, 2016. Proved undeveloped reserves decreased primarily due to downward pricing during the year ended December 31, 2016. |
See Note 6 for additional information on acquisitions and divestitures.
A variety of methodologies are used to determine our proved reserve estimates. The principal methodologies employed are reservoir simulation, decline curve analysis, volumetric, material balance, advance production type curve matching, petro-physics/log analysis and analogy. Some combination of these methods is used to determine reserve estimates in substantially all of our fields.
The standardized measure of discounted future net cash flows is as follows:
| Successor | | | | Predecessor | |
| | | | | Period from | | | | | | | | | | |
| For the | | | May 5, 2017 | | | | Period from | | | For the | |
| Year Ended | | | through | | | | January 1, | | | Year Ended | |
| December 31, | | | December 31, | | | | 2017 through | | | December 31, | |
| 2018 | | | 2017 | | | | May 4, 2017 | | | 2016 | |
| (In thousands) | | | | (In thousands) | |
Future cash inflows | $ | 6,000,268 | | | $ | 5,149,623 | | | | $ | 5,246,487 | | | $ | 3,666,731 | |
Future production costs | | (3,280,778 | ) | | | (2,982,035 | ) | | | | (3,275,952 | ) | | | (2,384,195 | ) |
Future development costs | | (474,413 | ) | | | (530,133 | ) | | | | (492,610 | ) | | | (440,496 | ) |
Future income tax expense | | — | | | | — | | | | | — | | | | — | |
Future net cash flows for estimated timing of cash flows | | 2,245,077 | | | | 1,637,455 | | | | | 1,477,925 | | | | 842,040 | |
10% annual discount for estimated timing of cash flows | | (1,132,048 | ) | | | (869,784 | ) | | | | (786,836 | ) | | | (446,199 | ) |
Standardized measure of discounted future net cash flows | $ | 1,113,029 | | | $ | 767,671 | | | | $ | 691,089 | | | $ | 395,841 | |
Changes in Standardized Measure of Discounted Future Net Cash Flows Relating to Proved Reserves
The following is a summary of the changes in the standardized measure of discounted future net cash flows for the proved oil and natural gas reserves during each of the years in the three year period ended December 31, 2018:
| Successor | | | | Predecessor | |
| | | | | Period from | | | | | | | | | | |
| For the | | | May 5, 2017 | | | | Period from | | | For the | |
| Year Ended | | | through | | | | January 1, | | | Year Ended | |
| December 31, | | | December 31, | | | | 2017 through | | | December 31, | |
| 2018 | | | 2017 | | | | May 4, 2017 | | | 2016 | |
| (In thousands) | | | | (In thousands) | |
Beginning of year | $ | 767,671 | | | $ | 691,089 | | | | $ | 395,841 | | | $ | 589,554 | |
Sale of oil and natural gas produced, net of production costs | | (181,841 | ) | | | (100,946 | ) | | | | (57,420 | ) | | | (107,357 | ) |
Sale of minerals in place | | (29,036 | ) | | | — | | | | | — | | | | (28,277 | ) |
Extensions and discoveries | | 27,157 | | | | 7,187 | | | | | 1,320 | | | | 2,016 | |
Changes in prices and costs | | 507,888 | | | | 161,106 | | | | | 306,375 | | | | (404,870 | ) |
Previously estimated development costs incurred | | 73,761 | | | | 61,851 | | | | | 9,227 | | | | 89,748 | |
Net changes in future development costs | | 24,396 | | | | (31,438 | ) | | | | (55,333 | ) | | | 254,043 | |
Revisions of previous quantities | | (86,812 | ) | | | (27,060 | ) | | | | 99,591 | | | | 14,414 | |
Accretion of discount | | 51,769 | | | | 46,072 | | | | | 13,195 | | | | 58,956 | |
Change in production rates and other | | (41,924 | ) | | | (40,190 | ) | | | | (21,707 | ) | | | (72,386 | ) |
End of year | $ | 1,113,029 | | | $ | 767,671 | | | | $ | 691,089 | | | $ | 395,841 | |
F-53
AMPLIFY ENERGY CORP.
NOTES TO CONSOLIDATED FINANCIAL STATEMENTS
Note. 21 Subsequent Events
Share Repurchase Program
See Note 12 for additional information regarding the share repurchase program.
F-54