UNITED STATES
SECURITIES AND EXCHANGE COMMISSION
Washington, D.C. 20549
Form 10-K
| |
☒ | ANNUAL REPORT PURSUANT TO SECTION 13 OR 15(d) OF THE SECURITIES EXCHANGE ACT OF 1934 |
For the fiscal year ended December 31, 2018
or
| |
◻ | TRANSITION REPORT PURSUANT TO SECTION 13 OR 15(d) OF THE SECURITIES EXCHANGE ACT OF 1934 |
For the transition period from to .
Commission File No. 001-36739
STORE CAPITAL CORPORATION
(Exact name of registrant as specified in its charter)
| | |
Maryland | | 45-2280254 |
(State or other jurisdiction of incorporation or organization) | | (I.R.S. Employer Identification No.) |
8377 East Hartford Drive, Suite 100, Scottsdale, Arizona 85255
(Address of principal executive offices) (Zip Code)
Registrant’s telephone number, including area code: (480) 256-1100
Securities Registered Pursuant to Section 12(b) of the Act:
| | |
Title of Each Class | | Name of Each Exchange on Which Registered |
Common Stock, $0.01 par value | | New York Stock Exchange |
Securities Registered Pursuant to Section 12(g) of the Act: None
Indicate by check mark if the registrant is a well-known seasoned issuer, as defined in Rule 405 of the Securities Act. Yes ☒ No ◻
Indicate by check mark if the registrant is not required to file reports pursuant to Section 13 or Section 15(d) of the Act. Yes ◻ No ☒
Indicate by check mark whether the registrant (1) has filed all reports required to be filed by Section 13 or 15(d) of the Securities Exchange Act of 1934 during the preceding 12 months (or for such shorter period that the registrant was required to file such reports), and (2) has been subject to such filing requirements for the past 90 days. Yes ☒ No ◻
Indicate by check mark whether the registrant has submitted electronically every Interactive Data File required to be submitted pursuant to Rule 405 of Regulation S-T during the preceding 12 months (or for such shorter period that the registrant was required to submit such files). Yes ☒ No ◻
Indicate by check mark if disclosure of delinquent filers pursuant to Item 405 of Regulation S-K is not contained herein, and will not be contained, to the best of registrant’s knowledge, in definitive proxy or information statements incorporated by reference in Part III of this Form 10-K or any amendment to this Form 10-K. ☒
Indicate by check mark whether the registrant is a large accelerated filer, an accelerated filer, a non-accelerated filer, a smaller reporting company, or an emerging growth company. See the definitions of “large accelerated filer,” “accelerated filer,” “smaller reporting company,” and “emerging growth company” in Rule 12b-2 of the Exchange Act.
| | | |
Large accelerated filer | ☒ | Accelerated filer | ◻ |
| | | |
Non-accelerated filer | ◻ | Smaller reporting company | ◻ |
| | | |
| | Emerging growth company | ◻ |
If an emerging growth company, indicate by check mark if the registrant has elected not to use the extended transition period for complying with any new or revised financial accounting standards provided pursuant to . ☐
Indicate by check mark whether the registrant is a shell company (as defined in Rule 12b-2 of the Exchange Act). Yes ◻ No ☒
As of June 29, 2018 (the last business day of the registrant’s most recently completed second fiscal quarter), the aggregate market value of the Registrant’s shares of common stock, $0.01 par value, held by non-affiliates of the Registrant, was $5.6 billion based on the last reported sale price of $27.40 per share on the New York Stock Exchange on June 29, 2018.
As of February 20, 2019, there were 221,612,845 shares of the registrant’s common stock outstanding.
Documents Incorporated by Reference
Portions of Part III of this Form 10-K are incorporated by reference from the registrant’s definitive proxy statement for its 2019 Annual Meeting of Stockholders to be filed with the Securities and Exchange Commission no later than 120 days after the end of the registrant’s fiscal year.
PART I
In this Annual Report on Form 10-K, or this Annual Report, we refer to STORE Capital Corporation, a Maryland corporation, as “we,” “us,” “our,” “the Company,” “S|T|O|R|E” or STORE Capital,” unless we specifically state otherwise or the context indicates otherwise.
Forward-Looking Statements
This Annual Report contains forward-looking statements within the meaning of Section 27A of the Securities Act of 1933, as amended, or the Securities Act, and Section 21E of the Securities Exchange Act of 1934, as amended, or the Exchange Act. Such forward-looking statements include, without limitation, statements concerning our business and growth strategies, investment, financing and leasing activities and trends in our business, including trends in the market for long-term, triple-net leases of freestanding, single-tenant properties. Words such as “expects,” “anticipates,” “intends,” “plans,” “likely,” “will,” “believes,” “seeks,” “estimates,” and variations of such words and similar expressions are intended to identify such forward-looking statements. Such statements involve known and unknown risks, uncertainties and other factors which may cause our actual results, performance or achievements to be materially different from the results of operations or plans expressed or implied by such forward-looking statements. Although we believe that the assumptions underlying the forward-looking statements contained herein are reasonable, any of the assumptions could be inaccurate, and therefore such statements included in this Annual Report may not prove to be accurate. In light of the significant uncertainties inherent in the forward-looking statements included herein, the inclusion of such information should not be regarded as a representation by us or any other person that the results or conditions described in such statements or our objectives and plans will be achieved. For a further discussion of these and other factors that could impact future results, performance or transactions, see “Item 1A. Risk Factors” elsewhere in this Annual Report. Furthermore, actual results may differ materially from those described in the forward-looking statements and may be affected by a variety of risks and factors including, without limitation:
| · | | the factors included in this report, including those set forth under the headings “Business,” “Risk Factors” and “Management’s Discussion and Analysis of Financial Condition and Results of Operations”; |
| · | | our ability to raise debt and equity capital on attractive terms; |
| · | | the competitive environment in which we operate; |
| · | | the performance and financial condition of our customers; |
| · | | real estate risks, including fluctuations in real estate values and the general economic climate in local markets and competition for customers in such markets; |
| · | | decreased rental rates or increased vacancy rates; |
| · | | potential defaults (including bankruptcy or insolvency) on, or non-renewal of, leases by customers; |
| · | | real estate acquisition risks, including our ability to identify and complete acquisitions and/or failure of such acquisitions to perform in accordance with projections; |
| · | | potential natural disasters and other potentially catastrophic events such as acts of war and/or terrorism; |
| · | | the general level of interest rates; |
| · | | litigation, including costs associated with defending claims against us as a result of incidents on our properties, and any adverse outcomes; |
| · | | potential changes in the law or governmental regulations that affect us and interpretations of those laws and regulations, including changes in real estate and zoning or real estate investment trust tax laws; |
| · | | the impact of changes in the tax code as a result of federal tax legislation and uncertainty as to how such changes may be applied; |
| · | | financing risks, including the risks that our cash flows from operations may be insufficient to meet required payments of principal and interest and that we may be unable to refinance our existing debt upon maturity or obtain new financing on attractive terms at all; |
| · | | lack of or insufficient amounts of insurance; |
| · | | our inability to comply with the laws, rules and regulations applicable to companies, and in particular, public companies; |
| · | | our ability to maintain our qualification as a real estate investment trust; |
| · | | our ability to retain key personnel; and |
| · | | possible environmental liabilities, including costs, fines or penalties that may be incurred due to necessary remediation of contamination of properties presently owned or previously owned by us. |
Forward-looking statements and such risks, uncertainties and other factors speak only as of the date of this Annual Report, and we expressly disclaim any obligation or undertaking to update or revise any forward-looking statement contained herein, to reflect any change in our expectations with regard thereto, or any other change in events, conditions or circumstances on which any such statement is based, except to the extent otherwise required by law.
Item 1. BUSINESS
General
S|T|O|R|E is an internally managed net-lease real estate investment trust, or REIT, that is the leader in the acquisition, investment and management of Single Tenant Operational Real Estate, or STORE Properties, which is our target market and the inspiration for our name. A STORE Property is a real property location at which a company operates its business and generates sales and profits, which makes the location a profit center and, therefore, fundamentally important to that business.
S|T|O|R|E continues the investment activities of our senior leadership team, which has been investing in single-tenant operational real estate for over 30 years. We are one of the largest and fastest-growing net-lease REITs, and own a well-diversified portfolio that consists of investments in 2,255 property locations operated by 434 customers across 49 states as of December 31, 2018. Our customers operate across a wide variety of industries within the service, retail and manufacturing sectors of the U.S. economy, with restaurants, early childhood education centers, furniture stores, health clubs and movie theaters representing the top industries in our portfolio.
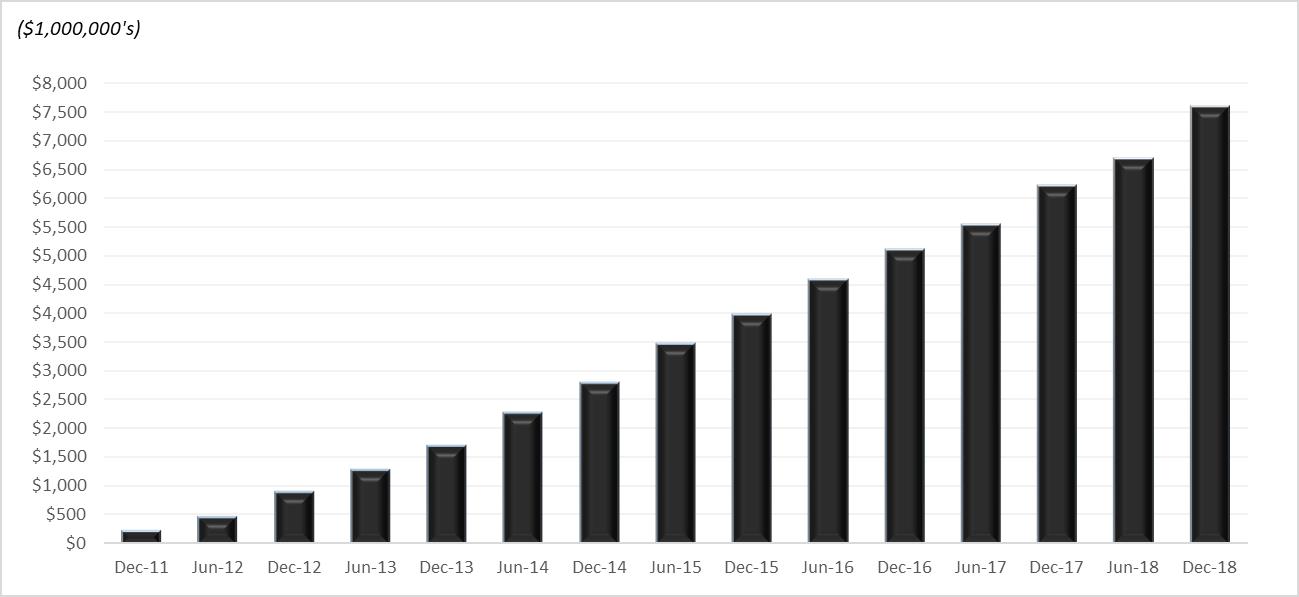
The following table depicts the growth in our investment portfolio since our inception in 2011.
Our Total Investment Portfolio at Period End
We have elected to be taxed as a REIT under the Internal Revenue Code of 1986, as amended, which we refer to as the Code, commencing with our initial taxable year ended December 31, 2011. To continue to qualify as a REIT, we must continue to meet certain tests which, among other things, require that our assets consist primarily of real estate assets, our income be derived primarily from real estate assets, and that we distribute at least 90% of our REIT taxable income (other than our net capital gains) to our stockholders annually.
Corporate Responsibility
We define success by our ability to make a positive difference for all our many stakeholders. S|T|O|R|E’s beginning was inspired by our belief that we could make a positive difference for real estate intensive businesses across America by delivering innovative and superior real estate capital solutions. In that process, we have sought to add an important tool to middle market company capital formation while improving the liquidity of middle market businesses.
For our many customers, S|T|O|R|E’s real estate lease solutions have contributed to their prospects for wealth creation and to their ability to grow, create jobs and contribute to many communities across the country. In turn, meeting the needs of our customers provides an extraordinary investment opportunity that we believe holds the promise of sustainable long-term wealth creation for our many stockholders. In fulfilling this mission, S|T|O|R|E has grown our staff to more than 90 associates, many of whom have worked together through predecessor companies. From the earliest of these predecessor companies in 1980, our leadership team has shown a commitment to employee development, employee engagement and personal growth central to the creation of a quality business.
Customers, stockholders and employees: These are our three most integral stakeholders. Through them, we are able to make a positive difference to our many other important stakeholders, including our creditors, suppliers and the many communities we serve.
2018 Highlights
| · | | During the year ended December 31, 2018, we invested approximately $1.6 billion in 418 property locations. |
| · | | As of December 31, 2018, our total gross investment in real estate had reached approximately $7.6 billion, of which $4.6 billion was unencumbered. Our long-term outstanding debt totaled $3.0 billion at December 31, 2018, and, at that date, approximately $2.0 billion of our total long-term debt was secured debt and approximately $3.0 billion of our investment portfolio served as collateral for these outstanding borrowings. |
| · | | For the year ended December 31, 2018, we declared dividends totaling $1.28 per share of common stock to our stockholders. In the third quarter of 2018, we raised our quarterly dividend 6.5% from our previous quarterly dividend amount. |
| · | | During 2018, we raised aggregate net proceeds of $741.7 million from sales of shares under our “at the market”, or ATM, equity offering program. As of December 31, 2018, we had the ability to offer and sell up to an additional $504.9 million of our shares of common stock under our $750.0 million ATM authorization which we established in November 2018. |
| · | | In February 2018, we expanded our unsecured revolving credit facility from $500 million to $600 million and increased the accordion feature from $300 million to $800 million for a total maximum borrowing capacity of $1.4 billion. The amended credit facility matures in February 2022 and includes two six-month extension options, subject to certain conditions. |
| · | | In March 2018, we completed our first public debt offering, issuing $350 million in aggregate principal amount of unsecured, investment-grade rated 4.50% Senior Notes, due in March 2028. |
| · | | In October 2018, we marked the inaugural issuance of AAA rated net-lease mortgage notes under our STORE Master Funding debt program; we issued a total of $592 million of net-lease mortgage notes, of which $378 million are rated AAA with the remainder rated A+. The weighted average coupon rate of the AAA rated notes is 4.16% and the weighted average coupon rate of the A+ rated notes is 4.66%. |
| · | | In October 2018, as part of the $592 million STORE Master Funding debt issuance, we prepaid, without penalty, STORE Master Funding notes with an aggregate balance of approximately $233.3 million at the time of prepayment; these notes were scheduled to mature in 2020 and bore a weighted average coupon rate of 4.25%. |
Our Target Market
We are the leader in providing real estate financing solutions principally to middle-market and larger businesses that own STORE Properties and operate within the broad-based service, retail and manufacturing sectors of the U.S. economy. We have designed our net-lease solutions to provide a long-term, lower-cost way to improve our customers’ capital structures and, thus, be a preferred alternative to real estate ownership. We estimate the market for STORE Properties to exceed $3.4 trillion in market value and to include more than 2.0 million properties.
We define middle-market companies as those having approximate annual gross revenues of between $10 million and $1.0 billion, although approximately 16% of our customers have annual revenues in excess of $1.0 billion. The median annual revenues of our 434 customers was approximately $54 million and, on a weighted average basis, our average customer has revenues of approximately $862 million. Most of our customers do not have credit ratings, while some have ratings from rating agencies that service insurance companies or fixed-income investors. Most of these non-rated companies either prefer to be unrated or are simply too small to issue debt rated by a nationally recognized rating agency in a cost-efficient manner.
The financing marketplace for STORE Properties is highly fragmented, with few participants addressing the long-term capital needs of middle-market and larger non-rated companies. While we believe our net-lease financing solutions can add value to a wide variety of companies, we believe the largest underserved market and, therefore, our greatest opportunity is non-rated, bank-dependent, middle-market and larger companies that generally have less access to efficient sources of long-term capital.
Our customers typically have the choice to either own or to lease the real estate they use in their daily businesses. They choose to lease for various reasons, including the potential to lower their cost of capital, since leasing supplants traditional financing options and the costlier equity that lenders require be tied up in the real estate. Leasing is also viewed as an attractive alternative to our customers because it generally locks in scheduled payments, at lower levels and for longer periods, than traditional financing options, which are viewed as attractive relative to the amounts funded.
Whether companies elect to rent or own the real estate they use in their businesses is most often a financial decision. For the few highly capitalized large companies that possess investment-grade credit ratings, real estate leasing tends to be viewed as a substitute for corporate borrowings that they could otherwise access (so long as they remain highly rated and equitized). With real estate leases often bearing rental costs that exceed corporate term borrowing costs, such companies elect to rent for strategic reasons. Such reasons may include the long-term flexibility to vacate properties that are no longer strategic, the permanence of lease capital which lessens potential refinancing risk should corporate credit ratings deteriorate, the lack of corporate financial covenants associated with leasing and the ability to harness developers to effectively outsource their real estate development needs. The primary motivations for S|T|O|R|E’s middle market and larger customers tend to be different. For such companies, real estate lease solutions offer the potential to lower their cost of capital. In addition to these primary economic motivations, real estate leasing offers the potential for greater corporate flexibility, which is a hallmark of S|T|O|R|E’s approach and which offers the potential for further tenant wealth creation. Important tenant concerns include lease assignability, property substitution rights, property closure rights and the ability of S|T|O|R|E to assist with property expansion and lease contract modification. We believe that our customers select us as their landlord of choice principally as a result of our service, comparative business flexibility and the tailored net-lease solutions we provide.
We believe the demand for our net-lease solutions has grown as a result of the current bank regulatory environment. In our view, the increased scrutiny and regulation of the banking industry in response to the collapse of the housing and mortgage industries from 2007 to 2009, particularly with the passage of the Dodd-Frank Wall Street Reform and Consumer Protection Act of 2010, or the Dodd-Frank Act, and the Basel Accords issued by the Basel Committee on Banking Supervision, have constrained aggressive real estate lending practices and limited desirable term debt real estate borrowing options. Real estate leasing today represents a highly desirable component of corporate capitalization strategies for reasons due, in part, to the unavailability of long-term, fixed rate commercial real estate mortgage financing with important features such as affordable prepayment and modification options or loan assignability.
S|T|O|R|E was formed to capitalize on a large market opportunity resulting from the widespread need amongst middle market and larger companies for efficient corporate real estate capital solutions. We believe our opportunities include both gaining market share from the fragmented network of net-lease capital providers and growing the market by creating demand for our net-lease solutions that meet the long-term real estate capital needs of these companies.
The estimated $3.4 trillion market of STORE Properties is divided into three primary industry sectors and various industry sub-sectors. The primary sectors and their proportion of this $3.4 trillion market of STORE Properties are service at 42%, retail at 46% and manufacturing at 12%. The sub-sectors included within each primary sector are summarized in the table below.
Service | | Retail | | Manufacturing |
Restaurants | | Big box retail | | Industrial profit-centers |
Education | | Specialty retail | | Light manufacturing |
Fitness centers | | Grocery | | |
Transportation | | Drug stores | | |
Automotive services | | Automotive (new and used) | | |
Family entertainment | | | | |
Within the sub-sectors, the market for STORE Properties is further subdivided into a wide variety of industries within the service, retail and manufacturing sectors, such as:
| | |
Automotive parts stores | | Movie theaters |
Cold storage facilities | | Office supplies retailers |
Department stores | | Pet care facilities |
Discount stores | | Rental centers |
Early childhood education | | Secondary education |
Family entertainment facilities | | Supermarkets |
Furniture stores | | Truck stops |
Fast food restaurants | | Wholesale clubs |
Full service restaurants | | |
Although many of these industries are represented within our diverse property portfolio, S|T|O|R|E primarily targets service sector properties that represent a broad array of everyday services, such as restaurants and health clubs, are located near customers targeted by the business operating on the property and are for services not readily available online. Although not our primary focus, the retail sector assets we target are primarily located in retail corridors, tend to be internet resistant and include a high experiential component, such as furniture and hunting and fishing stores. For the manufacturing sector of the market of STORE Properties, we typically target properties, across a broad array of industries, that are located in industrial parks near customers and suppliers and that are operated by businesses that make products that are everyday necessities. As of December 31, 2018, our portfolio of investments in STORE Properties was diversified across more than 100 industries, of which 65% was in the service sector, 18% was in the retail sector and 17% was in the manufacturing sector, based on annualized revenue.
Our Asset Class: STORE Properties
STORE Properties are a unique asset class that inspired the formation of S|T|O|R|E and our company name. STORE (Single Tenant Operational Real Estate) Properties are profit-center real estate locations on which our customers conduct their businesses and generate their revenues and profits. The defining characteristic of STORE Properties is the number of payment sources: STORE Properties have the following three payment sources, whereas all other commercial real estate assets have just two.
| · | | Unit-Level Profitability. STORE Properties are distinguished by the primary source of their rent payment, which comes directly from the profits produced by the business operations at the real estate locations we own, which we refer to as unit-level profitability. While it is a common perception that the tenant under a lease is the primary source of the rent payment (as distinguished from the business unit operating at the leased site), we have observed a historic pattern in which tenants in corporate insolvencies seek to vacate unprofitable locations while retaining profitable ones, which indicates that the profitability of the location is the main indicator of a tenant’s long-term ability to pay. Because tenants historically retain profitable locations and vacate unprofitable ones in the event of insolvency, it is fundamentally important for S|T|O|R|E to collect and review the unit-level financial statements of our customers at our real estate locations, which is a key component of our business model. As of December 31, 2018, approximately 98% of the properties in our portfolio are subject to unit-level financial reporting requirements. Without access to unit-level financial reporting for the business activities conducted on the properties we own, it is difficult to accurately assess our customer’s business and, thus, the quality of the most important, and primary, source for our rent payments. |
| · | | Customer Credit Quality. In addition to the unit-level profitability of the business on the real estate we own, our customers’ overall financial health, or credit quality, serves as an additional, but not primary, source of payment. Our customer’s credit can become the primary payment source if our unit is not profitable and our customer is required to divert cash flows from its other profitable locations or utilize other resources to pay our rents. However, we have seen that customer credit quality tends to be subject to greater volatility over time than unit-level profitability, because customer credit quality is not only a function of the unit-level profitability of the operations at our locations, but of the profitability of potentially many other existing and new assets owned and operated by our customer. Corporate financial health is also a function of many other |
decisions, such as optional changes in capital structure or growth strategies, as well as conditions in the marketplace for our customers’ products and services, that can change over time and that may have profound impacts on customer creditworthiness. |
| · | | Real Estate Residual Value. The final payment source that is common to all real estate investments is the residual value of the underlying real estate, which gives us the opportunity to receive rents from other substitute tenants in the event our property becomes vacant. For S|T|O|R|E, this means more than just looking at comparable lease rates and transactions. Studies we have done underscore the importance of investing in properties at or below their as-new replacement costs. We also review the local markets in which our properties are located and seek to have rents that are at or below prevailing market rents on a per square foot basis for comparable properties. Taking these steps protects S|T|O|R|E and our customers by making it easier for us to assign, sell or sublease properties that our customers may want to sell, reposition or vacate as part of their capital efficiency strategies. |
Acquiring STORE Properties
In assessing properties for potential acquisition, S|T|O|R|E follows a process designed to ensure that the properties it chooses to acquire will continue to be environmentally sustainable assets around which its customers can build and operate successful businesses. In this regard, S|T|O|R|E believes that being conscious of, and seeking to address, the environmental impacts of its properties – both before acquiring a property and after becoming the owner – can play an important role.
S|T|O|R|E’s commitment to environmental sustainability begins before it acquires a real estate asset. S|T|O|R|E’s standard, pre-acquisition property due diligence procedures include the following:
| · | | Engaging a S|T|O|R|E-approved, nationally recognized and insured independent environmental engineering firm that is qualified to perform environmental site assessments in accordance with the most current standards published by the American Society for Testing and Materials. |
| · | | Requiring, as a condition precedent to the acquisition, the delivery of a Phase I environmental assessment (a ���Phase I”) identifying any recognized environmental conditions (“RECs”) affecting the property. As part of the Phase I, the independent firm will: |
| o | | Visually inspect the property from the boundaries and selected interior portions of the property, focusing on general property operations, the existence of above-ground or visible underground chemical or waste storage, evidence of releases of hazardous substances, the existence of asbestos-containing materials and/or the possibility of vapor intrusion. |
| o | | Analyze the physical setting of the property based on a review of US Geological Survey topographical maps, Federal Emergency Management Agency flood maps, US Department of Agriculture soil surveys and selected geological reference information. |
| o | | Review historical information regarding the property – including aerial photographs, city directories, fire (Sanborn) insurance maps, prior reports (if any exist), property tax assessor files, property land title records and zoning records – to identify and document past uses of the property and adjoining properties. |
| o | | Review regulatory records, including federal and state databases, for indications of RECs or other conditions or liabilities affecting the property. |
| o | | Conduct interviews with personnel of the seller who have knowledge of the uses and physical characteristics of the property. |
Where S|T|O|R|E has identified RECs associated with a property but still determines to proceed with the acquisition, S|T|O|R|E will act to address these and other conditions. These actions may include:
| · | | Conducting additional environmental testing in the form of a Phase II environmental assessment. |
| · | | Submitting the property into the voluntary compliance or clean-up program of the state where the property is located. |
| · | | Purchasing an environmental insurance policy to insure against future contamination-related claims of the state or a third-party claimant and/or obtaining or increasing coverage for flood, hurricane and other similar risks. |
| · | | Remediating the REC in accordance with any state-mandated minimum requirements. |
If S|T|O|R|E is satisfied with the results and outcome of its pre-acquisition due diligence process, then it will execute a lease with the seller, pursuant to which the seller will agree to certain covenants and indemnities related to its continued use of the property.
Creating Investment-Grade Contracts
From our inception in 2011, based upon the experiences gained by our founding leadership team over more than thirty years and two prior successful public companies, we have emphasized and uniquely disclosed information regarding the net-lease contracts that we create with our tenants. We believe that our net-lease contracts, and not simply tenant or real estate quality, are central to our potential to deliver superior long-term risk-adjusted rates of return to our stockholders. Contract quality embodies tenant and real estate characteristics, together with other investment attributes we believe are highly material. Contract attributes include the prices we pay for the real estate we own, inclusive of the prices relative to new construction cost. As of December 31, 2018, our average investment approximated 81% of replacement cost, a statistic that has been relatively stable since 2015. Other important contract attributes include the ability to receive unit-level financial statements, which allows us to evaluate unit-level cash flows relative to the rents we receive. As of December 31, 2018, the median ability of the properties we own to cover our rents, inclusive of an allowance for indirect costs, approximated 2.1:1, which also has held fairly stable since 2015. Likewise, over many years of providing real estate net-lease capital, we have determined that tenant alignments of interest are highly important. Such alignments of interest can include full parent company recourse, credit enhancements in the form of guarantees, cross default provisions and the use of master leases. Master leases are individual lease contracts that bind multiple properties and offer landlords greater security in the event of tenant insolvency and bankruptcy. Whereas individual property leases convey to tenants the options to evaluate the desirability and viability of each individual property they rent in the event of a bankruptcy, master leases bind multiple properties, permitting landlords to benefit from aggregate property performance. As of December 31, 2018, 91% of our multi-property net-lease contracts were in the form of master leases. Contract economic terms are also highly important because they can enhance margins of safety. During 2018, our weighted average initial lease rate was 7.9%, with annual contractual lease escalations averaging an added 1.8% of contract rents. We believe that our initial yields, on average, range from 10% to 15% above those expected by investors seeking real estate investment opportunities through the broker auction market, which provides us greater flexibility to preserve and enhance returns. Other important tenant contract considerations include indemnification provisions, lease renewal rights, and the ability to sublease and assign leases, as well as qualitative considerations, such as alternative real estate use assessment and the composition of a tenant’s capitalization structure.
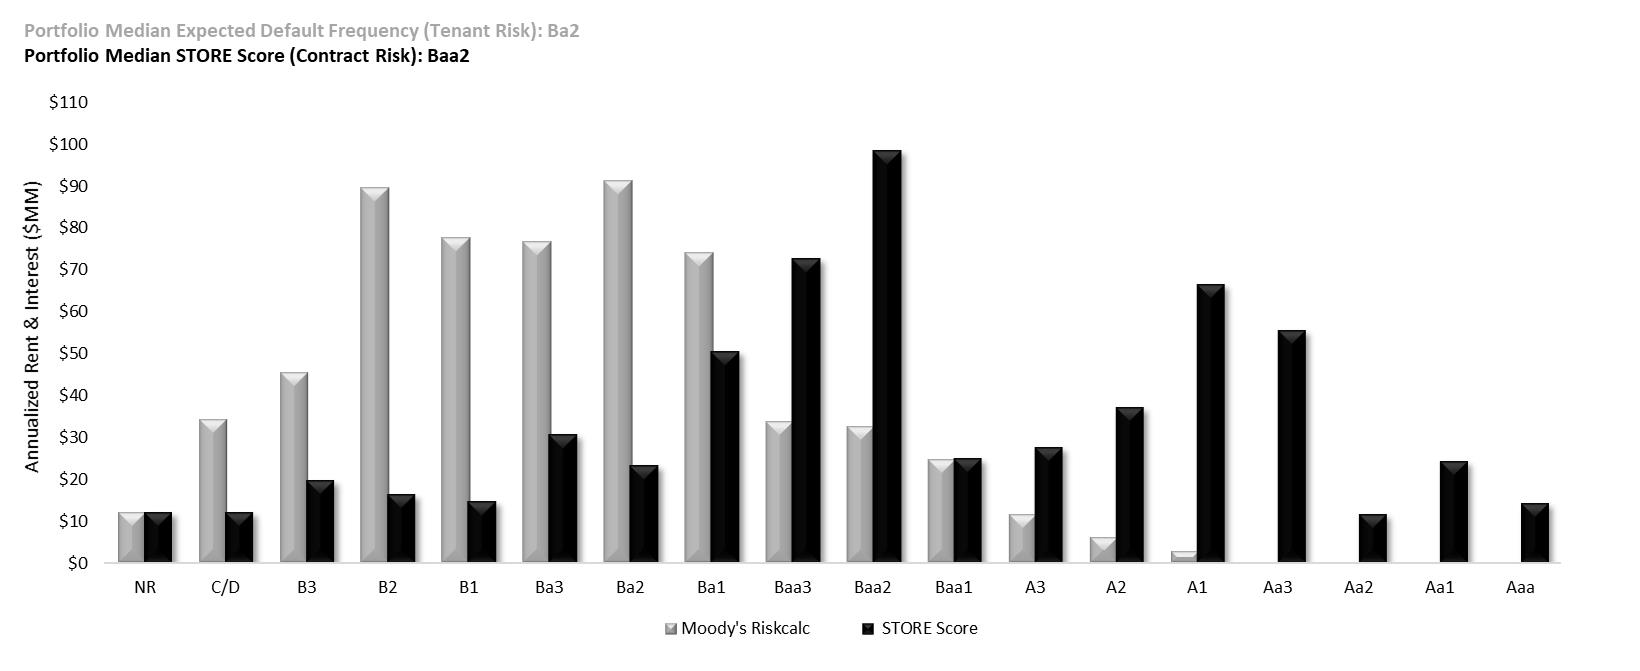
Since our November 2014 initial public offering, S|T|O|R|E’s extensive contract attribute disclosure has uniquely included a tenant credit quality distribution chart, employing computed implied credit ratings applied to regularly received tenant financial statements using Moody’s Analytics RiskCalc. Since tenant credit ratings are merely one component of contract risk, we developed a means to deliver a base quantitative contract quality estimate. Our approach was to modify risk of tenant insolvency, as estimated by the Moody’s algorithm, by our own estimate of the likelihood of property closure, based on the regularly monitored profitability of the properties bound by each lease contract we create. To accomplish this, we established a simple range of property closure likelihood ranging from 10% to 100% based upon property profitability ranges from breakeven to a computed ability to cover our rents twice over. Multiplying tenant
estimated insolvency probability (Moody’s Analytics RiskCalc) by our estimate of the probability of property closure results in a contract risk measurement that we call the STORE Score and which we regularly and uniquely disclose.
Our Competitive Strengths
We have a market-leading platform for the acquisition, investment in and management of STORE Properties that simultaneously creates value for stockholders and customers through our five corporate competencies.
| · | | Investment Origination. S|T|O|R|E was formed to fill a need for efficient long-term real estate capital for middle-market and larger customers. We do this principally through a solutions-oriented approach that includes the use of lease contracts that address our customers’ needs and that strive to provide superior value for our customers over other financial options they may have to capitalize their businesses. A S|T|O|R|E hallmark is our ability to directly market our real estate lease solutions to middle market and larger companies nation-wide, harnessing a geographically focused team of experienced relationship managers at our home office. Approximately 80% of our investments, by dollar volume, have been originated by our internal origination team through direct new customer solicitations and a strong level of repeat business from existing customers. By creating demand for our services, we maintain a large pipeline of investment opportunities, which we estimate to be $13.2 billion as of December 31, 2018. Our objective is to be both highly selective and achieve higher rates of return than our stockholders could achieve if they sought to acquire profit-center real estate on their own. |
| · | | Investment Underwriting. Our senior leadership team has developed our methods of risk evaluation over more than 30 years and across investments of more than $17 billion in over 9,600 STORE Properties. Our investment underwriting approach centers on evaluations of unit-level and corporate-level financial performance, together with detailed real estate valuation assessments, which is reflective of the characteristics of the STORE Property asset class. We have combined our underwriting approach with our portfolio management systems to capture and track computed customer credit ratings as well as the performance of the businesses conducted at the properties that we own (unit-level performance). Our focus on STORE Properties, which are profit-centers for our tenants, enables us to create lease contracts having payment performance characteristics that are generally materially superior to the implied credit ratings of our diverse tenant base. Through our underwriting and portfolio management approach, we track, measure and report investment performance, with the investment underwriting goal to create a diverse portfolio centered on investment-grade quality contracts. As of December 31, 2018, we estimate that the net portfolio losses we have experienced due to credit events experienced by our customers have averaged 0.2% per year of the total investments we have made since we began in 2011 based on average annual credit events of 1.0%, average |
annual net credit losses of 0.3% offset by average annual gains on property sales of 0.1%, which is reflective of our strict underwriting and portfolio management guidelines. |
| · | | Investment Documentation. Because we believe lease contracts are the principal determinants of investment risk, we have always emphasized the importance of lease documentation. The documentation process includes the validation of investment underwriting through third party real estate valuations, property condition and environmental reports, and other due diligence. Our lease documents incorporate lessons learned over decades to forge balanced contracts characterized by important alignments of interest, including strong enforcement provisions. Altogether, our documentation process, like our approach to investment underwriting, is integral to investment quality and designed to offer our investors a value that most could not create for themselves. |
| · | | Portfolio Management. Net-lease real estate investment portfolios require active management to realize superior risk-adjusted rates of return. S|T|O|R|E represents our senior leadership team’s third, and most highly developed and scalable, servicing platform. We are virtually paperless and can access detailed information on our large diversified portfolio from practically anywhere and at any time. For over 30 years, our senior leadership team has learned how to monitor unit-level profit and loss statements, customer corporate financial statements and the timely payment of property taxes and insurance in order to gauge portfolio quality. Having such systems is central to our ability to effectively monitor and reduce customer credit risk at the property level, which, in turn, allows us to place greater focus on effectively managing the minority of investments that may have higher risks. We believe these systems, when combined with our high degree of financial and operating flexibility, allow us to realize better stockholder risk-adjusted rates of return on our invested capital. |
| · | | Financial Reporting and Treasury. We consider and evaluate our corporate financing strategies with the same emphasis as our real estate investment strategies. Under our financing strategy, borrowings must: prudently improve stockholder returns; be structured to provide portfolio flexibility and minimize our exposure to changes in long-term interest rates; be structured to optimize our cost of financing in a way that will enhance investor rates of return; and contribute to corporate governance by enhancing corporate flexibility. Our senior leadership team has extensive experience with diverse liability strategies. Today, we are one of the few REITs able to employ our own AAA rated borrowing source, while simultaneously maintaining investment-grade corporate credit ratings. We have designed and implemented our strategies that add value to our investors by offering a more efficient means to finance real estate than they could otherwise do on their own. At the same time, the flexibility we derive from our liability strategies can also result in important flexibility for our customers. |
Our Business and Growth Strategies
Our objective is to continue to create stockholder value through sustained investment and management activities designed to increase distributable cash flows and deliver attractive risk-adjusted rates of return from a growing, diverse portfolio of STORE Properties. To accomplish this, our principal business and growth strategies are as follows:
| · | | Focus on Middle-Market and Larger Companies Operating STORE Properties. We believe we have selected the most attractive investment opportunity within the net-lease market, STORE Properties, and targeted the most attractive customer type within that market, middle-market and larger non-investment-grade-rated companies. We focus on this market given its strong fundamentals and the limited long-term financing solutions available to them. Within the net-lease market for STORE Properties, our value proposition is most compelling to middle-market and larger, bank-dependent companies, most of which are not rated by any nationally recognized rating agency due to their size or capital markets preferences, but who have strong credit metrics and operate within broad-based industries having the potential for sustained relevance. |
| · | | Realize Stable Income and Internal Growth. We seek to make investments that generate strong and stable current income as a result of the difference, or spread, between the rate we earn on our assets (primarily our lease revenues) and the rate we pay on our liabilities (primarily our long-term debt). We augment that income |
with internal growth. We seek to realize superior internal growth through a combination of (1) a target dividend payout ratio that permits a meaningful level of free cash flow reinvestment and (2) cash generated from the estimated 1.8% weighted average annual escalation of base rent and interest in our portfolio (as of December 31, 2018, as if the escalations in all of our leases were expressed on an annual basis). We benefit from contractual rent escalations, as approximately 98% of our leases and loans (as of December 31, 2018, by annualized base rent and interest) have escalations that are either fixed (14% of our leases and loans) or based on the Consumer Price Index, or CPI (84% of our leases and loans). A final means of internal growth is the accretive redeployment of cash realized from the occasional sale of real estate. During 2018, we divested $251.4 million of real estate at a net gain of $23.6 million over our initial cost which we were able to redeploy. We believe these three means of internal growth will enable strong cash flow growth without relying exclusively on future common stock issuances to fund new portfolio investments. |
| · | | Capitalize on Direct Origination Capabilities for External Growth. As the market leader in STORE Property investment originations, we plan to complement our internal growth with external growth driven by continued new investments that are funded through future equity issuances and borrowings to expand our platform and raise investor cash flows. |
| · | | Actively Manage our Balance Sheet to Maximize Capital Efficiency. We seek funding sources that enable us to lock in long-term investment spreads and limit interest rate sensitivity. We also seek to maintain a prudent balance between the use of debt (which includes our own STORE Master Funding program, unsecured term notes, commercial mortgage-backed securities borrowings, insurance borrowings, bank borrowings and possibly preferred stock issuances) and equity financing. During 2017, we received a rating of Baa2, stable outlook, from Moody’s Investors Service and received a credit rating upgrade to BBB, stable outlook, from both S&P Global Ratings and Fitch Ratings. As of December 31, 2018, our secured and unsecured long-term debt had an aggregate outstanding principal balance of $3.0 billion, a weighted average maturity of six years and a weighted average interest rate of 4.4%. |
| · | | Increase our portfolio diversity. As of December 31, 2018, we had invested approximately $7.6 billion in 2,255 property locations, substantially all of which are profit centers for our customers. Our portfolio is highly diversified; built on an average transaction size of just under $9.0 million, we now have over 400 customers (having added an average of approximately 15 new customers quarterly since inception) operating across more than 600 different brand names, or business concepts, across 49 states and over 100 industry groups. Our largest customer represented 2.7% of our portfolio as of December 31, 2018, based on annualized base rent and interest. Our portfolio’s diversity decreases the impact on us of an adverse event affecting a specific customer, industry or region, thereby increasing the stability of our cash flows. We expect that additional acquisitions in the future will further increase the diversity of our portfolio and, from time to time, we may sell properties in our portfolio to improve overall portfolio credit quality or diversity. |
Competition
We face competition in the acquisition and financing of STORE Properties from numerous investors, including, but not limited to, traded and non-traded public REITs, private equity investors and other institutional investment funds, as well as private wealth management advisory firms that serve high net worth investors (also known as family offices), some of which have greater financial resources than we do, a greater ability to borrow funds to acquire properties and the willingness to accept more risk. We also believe that competition for real estate financing comes from middle-market business owners themselves, many of whom have had a historic preference to own, rather than lease, the real estate they use in their businesses. The competition we face may increase the demand for STORE Properties and, therefore, reduce the number of suitable acquisition opportunities available to us or increase the price we must pay to acquire STORE Properties. This competition will increase if investments in real estate become more attractive relative to other forms of investment.
Employees
S|T|O|R|E has long acted to foster a diverse and vibrant workplace. Since the founding of the company in 2011, and at the prior companies founded by our management team, we have believed that we must have the best talent, including individuals who possess a broad range of experiences, backgrounds and skills that enable us to anticipate and meet the needs of our business and our customers. Over time, we have hired, developed and retained a diverse workforce that is a key component in our success by providing our employees market-competitive compensation and benefits and affording our employees an engaging work experience that allows for career development and opportunities for meaningful civic involvement. From our management team – where women hold seven of the ten positions at the level of senior vice president and above and two of our nine Board of Directors positions – through the rest of the company, we have a deep bench of men and women who are collectively fully capable of professionally operating the business and fulfilling the S|T|O|R|E vision. As of December 31, 2018, we had 90 full-time employees, an increase of 12.5% over the total at December 31, 2017, all of whom are located in our single office in Scottsdale, Arizona. None of our employees are subject to a collective bargaining agreement. We consider our employee relations to be good.
Insurance
Our leases and loan agreements typically require our customers to maintain insurance of the types and in the amounts that are usual and customary for similar commercial properties, including commercial general liability, fire and extended loss insurance provided by reputable companies, with commercially reasonable exclusions, deductibles and limits, all as verified by our independent insurance consultant.
Separately, we purchase contingent liability insurance, in excess of our customers’ liability coverage, to provide us with additional security in the event of a catastrophic claim.
Regulations and Requirements
Our properties are subject to various laws and regulations, including regulations relating to fire and safety requirements, as well as affirmative and negative contractual covenants and, in some instances, common area obligations. Our customers have primary responsibility for complying with these regulations and other requirements pursuant to our lease and loan agreements. We believe that each of our customers has the necessary permits and approvals to operate and conduct their businesses on our properties.
About Us & Available Information
We were incorporated under the laws of Maryland on May 17, 2011. Since our initial public offering in November 2014, shares of our common stock have traded under the ticker symbol “STOR” on the New York Stock Exchange, or NYSE. Our offices are located at 8377 E. Hartford Drive, Suite 100, Scottsdale, Arizona 85255. We currently lease approximately 27,500 square feet of office space from an unaffiliated third party. Our telephone number is (480) 256-1100 and our website is www.storecapital.com.
We electronically file with the Securities and Exchange Commission, or the SEC, our annual reports on Form 10-K, quarterly reports on Form 10-Q and current reports on Form 8-K, pursuant to Section 13(a) of the Exchange Act. You may obtain a free copy of our annual reports on Form 10-K, quarterly reports on Form 10-Q and current reports on Form 8-K, and amendments to those reports, on the day of filing with the SEC on our website, or by sending an email message to info@storecapital.com.
Item 1A. RISK FACTORS
There are many factors that affect our business, financial condition, operating results, cash flows and distributions, as well as the market prices for our securities. The following is a description of important factors that may cause our actual results of operations in future periods to differ materially from those currently expected or discussed in forward-looking statements set forth in this Annual Report. The risks and uncertainties described below are not the only risks we face. Additional risks and uncertainties not presently known to us or that we may currently deem immaterial also may impair our business operations. Forward-looking statements and such risks, uncertainties and other factors speak only as of the date of this Annual Report, and we expressly disclaim any obligation or undertaking to update or revise any forward-looking statement contained herein, to reflect any change in our expectations with regard thereto, or any other change in events, conditions or circumstances on which any such statement is based, except to the extent otherwise required by law. See “Forward-Looking Statements.”
Risks Related to Our Business and Operations
The success of our business depends upon the success of our customers’ businesses.
We lease substantially all of our properties to customers who generate sales and profits from businesses operated at the leased properties. We underwrite and evaluate investment risk based on our belief that our customers’ most important, and primary, source of payment for our leases and loans is the profitability of the businesses operated at the leased properties, which we refer to as “unit-level profitability”. While a customer may have other sources of payment to meet its lease or loan obligations to us, we believe the success of our investments materially depends upon whether our customers successfully operate their businesses, and thus generate unit‑level profitability, at the location or locations we acquire and lease back or finance. Our customers may be adversely affected by many factors beyond our control that might render one or more of their locations uneconomic. These factors include poor management, changing demographics, a downturn in general economic conditions or changes in consumer trends that decrease demand for our customers’ products or services. The occurrence of any of these may cause our customers to fail to pay rent, real estate taxes or insurance premiums when due, become insolvent or declare bankruptcy, any of which could materially and adversely affect our business.
Reduced discretionary spending by consumers could reduce the demand for our net‑lease solutions.
Most of our portfolio is leased to or financed with customers operating service or retail businesses on our property locations. Restaurants, early childhood education centers, furniture stores, health clubs and movie theaters represent the largest industries in our portfolio; Fleet Farm, Ashley Furniture HomeStore, Cabela’s, Art Van Furniture and Zips Car Wash represent the largest concepts in our portfolio. The success of most of these businesses depends on the willingness of consumers to use discretionary income to purchase their products or services. A downturn in the economy could cause consumers to reduce their discretionary spending, which may have a material adverse effect on us.
Service and retail businesses using physical outlets also face increasing competition from alternate methods of purchasing goods and services, including online service providers and retailers. As consumers increasingly use alternate methods to obtain goods and services, including the internet, this trend could adversely impact the success of physical service and retail business locations. Because we lease real estate to service and retail businesses, a decrease in purchases at these locations may have a material adverse effect on us.
Default by one or more of our customers could materially and adversely affect us, and bankruptcy laws will limit our remedies.
Any of our customers may experience a downturn in its business at any time that may significantly weaken its financial condition or cause its failure. As a result, such customer may decline to extend or renew its lease upon expiration, fail to make rental payments when due or declare bankruptcy. Any claims against bankrupt customers for unpaid future rent would be subject to statutory limitations that would likely result in our receipt of rental revenues, if any, that are substantially less than the contractually specified rent we are owed under their leases. This risk is magnified in situations where we lease multiple properties to a single customer under a master lease, as a customer failure or default under a master lease could reduce or eliminate rental revenue from multiple properties. In addition, any claim we have
for unpaid past rent will most likely not be paid in full. If a customer becomes bankrupt or insolvent, federal law may prohibit us from evicting such customer based solely upon such bankruptcy or insolvency. We may also be unable to re‑lease a terminated or rejected space or re‑lease it on comparable or more favorable terms. Following a vacancy at a property, we will be responsible for all of the operating costs at such property until it can be sold or re-let, if at all.
Our investments are concentrated in the middle‑market sector, and we would be adversely affected by an economic downturn or an excess of STORE Properties for rent in that sector.
Our target market is middle‑market companies that operate their businesses out of one or more locations that generate unit‑level profitability for the business. Historically, many companies prefer to own, rather than lease, the real estate they use in their businesses. A failure to increase demand for our products by, among other ways, failing to convince middle‑market companies to sell and lease back their STORE Properties, a decrease in the demand of middle‑market companies to rent STORE Properties, or an increase in the availability of STORE Properties for rent could materially and adversely affect us.
Adverse economic conditions could harm our returns and profitability.
Our operating results may be affected by market and economic challenges and uncertainties, which may result from a continued or exacerbated general economic slowdown experienced by the nation as a whole, by the local economies where our properties are located or our customers conduct business, or by the real estate industry in particular. These economic challenges and uncertainties may result in:
| · | | customer defaults or non-renewals under leases, including as a result of constricted access to credit; |
| · | | reduced demand for our net-lease solutions, forcing us to offer concessions or reduced rental rates when re-leasing properties; and |
| · | | adverse capital and credit market conditions that may restrict our operating activities. |
Also, to the extent we purchase real estate in an unstable market, we are subject to the risk that if the real estate market ceases to attract the same level of capital investment in the future that it attracts at the time of our purchases, or the number of companies seeking to acquire properties decreases, the value of our investments may not appreciate or may decrease significantly below the amount we paid. The length and severity of any economic slowdown or downturn cannot be predicted. Our operations could be negatively affected to the extent that an economic slowdown or downturn is prolonged or becomes more severe.
Geographic or industry concentrations lessen the diversity of our portfolio and may negatively affect our financial results.
Our operating performance is impacted by the economic conditions affecting the specific markets and industries in which we have concentrations of properties. As of December 31, 2018, the five states from which we derived the largest amount of our annualized base rent and interest were Texas (11.6%), Florida (6.2%), Illinois (6.2%), Ohio (5.5%) and Georgia (5.3%). In addition, as of December 31, 2018, 16.7% of the dollar amount of our investment portfolio was represented by properties dedicated to, and 17.0% of our annualized base rent and interest was derived from customers operating in, the restaurant industry and, in the future, it is likely we will acquire additional restaurant properties. As a result of these concentrations, local economic and industry conditions, changes in state or local governmental rules and regulations, acts of nature and other factors in these states could result in a decrease in consumer demand for the products and services offered by our customers operating in those states or industries, which would have an adverse effect on our customers’ revenues, costs and results of operations, thereby adversely affecting their ability to meet their obligations to us. Because the restaurant industry represents a significant portion of our portfolio, a downturn in the restaurant industry may have a material adverse effect on us. As we continue to acquire properties, our portfolio may become more concentrated by customer, industry or geographic area. Such decreased diversity in our portfolio could cause us to be more sensitive to
the bankruptcy or insolvency of fewer customers, to changes in consumer trends of a particular industry and to a general economic downturn in a particular geographic area.
Failure of our underwriting and risk‑management procedures to accurately evaluate a potential customer’s credit risk could materially and adversely affect our operating results and financial position.
Our success depends in part on the creditworthiness of our customers, which, since they are mostly middle‑market companies, are not rated by any nationally recognized rating agency. We analyze the creditworthiness of our customers using Moody’s Analytics RiskCalc, our methodology of estimating probability of lease rejection and the STORE Score, each of which may be faulty, deficient, inaccurate, or incomplete or which otherwise may fail to adequately assess default risk. An expected default frequency, or EDF, score from Moody’s Analytics RiskCalc is not the same as a published credit rating and lacks the extensive company participation that is typically involved when a rating agency publishes a rating. EDF scores and the financial ratios we calculate are based on financial information provided to us by our customers and prospective customers without independent verification by us, and may reflect only a limited operating history of the customer. The probability of lease rejection we assign an investment may be inaccurate. Moreover, the risks we have identified as our principal risks may fail to incorporate significant risks of which we are unaware. If our underwriting procedures fail to properly assess the unit‑level profitability, customer or corporate credit risk or real estate value of potential investments, then we may invest in properties and lease them to customers who ultimately default, and we may be unable to recover our investment by re‑leasing or selling the related property, which could materially and adversely affect our operating results and financial position.
In addition, we use a proprietary information technology, or IT, platform, which we developed to proactively manage our investment portfolio. Our IT platform offers customer relationship management and general ledger and servicing system integration, and includes the STORE Universal Database System, or SUDS, which provides our management with access to lease abstracts, customer information, document scans, property data and servicing information. Our IT platform and SUDS may not capture all of the information needed to effectively mitigate the risk of customer default.
We have now, and may have in the future, exposure to contingent rent escalators, which may expose us to inflation risk and can hinder our growth and profitability.
A substantial portion of our leases contain rent escalators, pursuant to which the base rent payable by the customer under the lease is periodically increased. Our leases that have contingent rent escalators indexed to future increases in the Consumer Price Index, or CPI, primarily adjust over a one‑year period but may adjust over multiple‑year periods. Generally, these escalators increase rent at the lesser of (i) 1 to 1.25 times the change in the CPI over a specified period or (ii) a fixed percentage. Under this formula, during periods of deflation or low inflation, small increases or decreases in the CPI will subject us to the risk of receiving lower rental revenue than we otherwise would have been entitled to receive if our rent escalators were based solely on fixed, rather than variable, rates. Conversely, in periods when inflation is higher, contingent rent increases may not keep up with the rate of inflation. In either event, our growth and profitability may be adversely affected. Higher inflation may also have an adverse impact on our customers if increases in their operating expenses exceed increases in revenue, which may adversely affect our customers’ ability to satisfy their financial obligations to us.
We depend on key personnel; the loss of their full service could materially impair our ability to operate successfully.
As an internally managed company, our overall success and the achievement of our investment objectives depends upon the performance of our senior leadership team, including, in particular, Christopher H. Volk, our Chief Executive Officer and Mary Fedewa, our Chief Operating Officer. We rely on our senior leadership team to, among other things, identify and consummate acquisitions, design and implement our financing strategies, manage our investments and conduct our day‑to‑day operations. We cannot guarantee the continued employment of any of the members of our senior leadership team, who may choose to leave our company for any number of reasons, such as other business opportunities, differing views on our strategic direction or other personal reasons. We rely on the experience, efforts and abilities of these individuals, each of whom would be difficult to replace. The employment agreements we have entered into with each of these executives do not guarantee their continued service to us. The loss of services of one or more members of our senior leadership team, or our inability to attract and retain highly qualified personnel, could adversely affect our
business, diminish our investment opportunities and weaken our relationships with lenders, business partners, existing and prospective customers and industry personnel, all of which could materially and adversely affect us.
We may be unable to identify and complete acquisitions of suitable properties, which may impede our growth.
We acquire and intend to continue to acquire STORE Properties. Our ability to continue to acquire properties we believe to be suitable may be constrained by numerous factors, including the following:
| · | | We may be unable to locate properties that will produce a sufficient spread between our cost of capital and the lease rate we can obtain from a customer, in which case our ability to profitably grow our company will decrease. |
| · | | Because many customers we approach have historically preferred to own, rather than lease, their real estate, our ability to grow requires that we overcome those preferences and convince customers that it is in their best interests to lease, rather than own, their STORE Properties, and we may be unable to do so. |
| · | | After beginning to negotiate the terms of a transaction and during our real property, legal and financial due‑diligence review with respect to a transaction, we may be unable to reach an agreement with the customer or discover previously unknown matters, conditions or liabilities and may be forced to abandon the opportunity after incurring significant costs and diverting management’s attention. |
| · | | We may fail to have sufficient equity, adequate capital resources or other financing available to complete acquisitions. |
We typically acquire only a small percentage (approximately 7%) of all properties that we evaluate (which we refer to as our “pipeline”). To the extent any of the foregoing decreases our pipeline or otherwise impacts our ability to continue to acquire suitable properties, our ability to grow our business will be adversely affected.
We face significant competition for customers and the acquisition of STORE Properties, which may decrease or prevent increases in the occupancy and rental rates of our properties, and may reduce the number of acquisitions we are able to complete or may increase the cost of these acquisitions.
We compete with numerous developers, owners and operators of properties, many of which own properties similar to ours in the same markets in which our properties are located. If our competitors rent properties at rates below that which we currently charge our customers, we may be pressured to reduce our rental rates or to offer more substantial rent abatements, customer improvements, early termination rights, below-market renewal options or other lease incentive payments in order to retain customers when our leases expire or obtain new customers. Competition for customers could negatively impact the occupancy and rental rates of our properties, which could materially and adversely affect us.
We also face competition for acquisitions of real property from investors, including traded and non-traded public REITs, private equity investors and other institutional investment funds, as well as private wealth management advisory firms that serve high net worth investors (also known as family offices), some of which have greater financial resources than we do, a greater ability to borrow funds to acquire properties and the willingness to accept more risk than we can prudently manage. This competition may increase the demand for the types of properties in which we typically invest and, therefore, reduce the number of suitable acquisition opportunities available to us and increase the prices we must pay for such acquisition properties.
Some of our customers rely on government funding, and their failure to continue to qualify for such funding could adversely impact their ability to make timely lease payments to us.
Some of our customers operate businesses that depend, to various extents, on government funding or reimbursements. For example, customers operating in the education industry often rely extensively on local, state and federal government funding for their students’ tuition payments. In addition, customers in the healthcare and childcare‑related industries typically receive local, state or federal funding, subsidies or reimbursements. The amount and timing of these government payments depend on various factors beyond our or our customers’ control, including
government budgets and policies and political issues. Some of these customers also must satisfy certain licensure or certification requirements in order to qualify for government funding, subsidies or reimbursements. As we continue to grow our investment portfolio, we likely will continue to invest in properties leased by customers operating in these industries and expand our business into other industries that rely significantly on payments from government payors. If these customers fail to receive government funding, when and as needed, including as a result of tightened government budgets, revised funding policies or otherwise, or fail to comply with related regulations, their cash flow could be materially affected leading them to default on their leases and causing an adverse impact on our business.
Some of our customers operate under franchise or license agreements, which, if terminated or not renewed prior to the expiration of their leases with us, would likely impair their ability to pay us rent.
We frequently invest in properties operated by our customers under franchise or license agreements. Generally, franchise agreements have terms that end earlier than the respective expiration dates of the related leases. In addition, a customer’s rights as a franchisee or licensee typically may be terminated and the customer may be precluded from competing with the franchisor or licensor upon termination. A franchisor’s or licensor’s termination or refusal to renew a franchise or license agreement would likely have a material adverse effect on the ability of the customer to make payments under its lease or loan with us, which could materially and adversely affect us. In addition, we usually have no notice or cure rights with respect to such a termination and have no rights to assignment of any such franchise agreement. This may have an adverse effect on our ability to mitigate losses arising from a default by a terminated franchisee on any of our leases or loans.
If a customer defaults under either the ground lease or mortgage loan of a hybrid lease, we may be required to undertake foreclosure proceedings on the mortgage before we can re‑lease or sell the property.
In certain circumstances, we may enter into hybrid leases with customers. A hybrid lease is a modified sale‑leaseback transaction, where the customer sells us land and then we lease the land back to the customer under a ground lease and simultaneously make a mortgage loan to the customer secured by the improvements the customer continues to own. If a customer defaults under a hybrid lease, we may: (i) evict the customer under the ground lease and assume ownership of the improvements; or (ii) if required by a court, foreclose on the mortgage loan that is secured by the improvements. Under a ground lease, we as ground lessor generally become the owner of the improvements on the land at lease maturity or if the customer defaults. If, upon default, a court requires us to foreclose on the mortgage rather than evicting the customer, we might encounter delays and expenses in obtaining possession of the improvements, which in turn could delay our ability to sell or re‑lease the property in a prompt manner, which could materially and adversely affect us.
As leases expire, we may be unable to renew those leases or re‑lease the space on favorable terms or at all.
As of December 31, 2018, leases and loans representing approximately 16.1% of our annualized base rent and interest will expire prior to 2029. We cannot guarantee that we will be able to renew leases or re‑lease space without an interruption in the rental revenue from those properties, at or above our current rental rates or without having to offer substantial rent abatements, customer improvement allowances, early termination rights or below‑market renewal options. The difficulty, delay and cost of renewing leases, re‑leasing space and leasing vacant space could materially and adversely affect us.
Defaults by customers on mortgages we hold could lead to losses on our investments.
From time to time, we make or assume commercial mortgage loans. We have also made a limited amount of investments on properties we own or finance in the form of loans secured by equipment or other fixtures owned by our customers. A default by a customer on its loan payments to us that would prevent us from earning interest or receiving a return of the principal of our loan could materially and adversely affect us. In the event of a default, we may also experience delays in enforcing our rights as lender and may incur substantial costs in collecting the amounts owed to us and in liquidating any collateral.
Foreclosure and other similar proceedings used to enforce payment of real estate loans are generally subject to principles of equity, which are designed to relieve the indebted party from the legal effect of that party’s default. Foreclosure and other similar laws may limit our right to obtain a deficiency judgment against the defaulting party after a
foreclosure or sale. The application of any of these principles may lead to a loss or delay in the payment on loans we hold. Further, in the event we have to foreclose on a property, the amount we receive from the foreclosure sale of the property may be inadequate to fully pay the amounts owed to us by the customer and our costs incurred to foreclose, repossess and sell the property. Any of such events could materially and adversely affect us.
We are subject to litigation in the ordinary course of our business, which could materially and adversely affect us.
From time to time, we are subject to litigation in connection with the ordinary course operation of our business, including instances in which we are named as defendants in lawsuits arising out of accidents causing personal injuries or other events that occur on the properties operated by our customers. We generally seek to have our customers defend, and assume liability for, the matters involving their properties. In other cases, we may defend ourselves, invoke our insurance coverage or the coverage of our customers, and/or pursue our rights to indemnification that we include in our leases. Resolution of these types of matters against us may result in our incurrence of significant legal fees and/or require us to pay significant fines, judgments or settlements, which, to the extent uninsured or in excess of insured limits, or not subject to indemnification, could adversely impact our earnings and cash flows, thereby materially and adversely affecting us. We also may become subject to litigation relating to our financing and other transactions. Certain types of litigation, if determined adversely to us, may affect the availability or cost of some of our insurance coverage, which could materially and adversely impact us, expose us to increased risks that would be uninsured and materially and adversely impact our ability to attract directors and officers.
Construction and renovation risks could adversely affect our profitability.
In certain instances, we provide financing to our customers for the construction and/or renovation of their properties. We are therefore subject to the risks that this construction or renovation may not be completed. Construction and renovation costs for a property may exceed a customer’s original estimates due to increased costs for materials or labor or other costs that are unexpected. A customer may also be unable to complete construction or renovation of a property on schedule, which could result in increased debt service expense or construction costs. These additional expenses may affect the ability of the customer to make payments to us.
We face risks associated with security breaches through cyber-attacks, cyber intrusions or otherwise, as well as other significant disruptions of our IT networks and related systems.
We face risks associated with security breaches, through cyber-attacks or cyber intrusions over the internet, malware, computer viruses, attachments to e-mails, persons inside our organization or persons with access to systems inside our organization, and other significant disruptions of our IT networks and related systems. The risk of a security breach or disruption, particularly through cyber-attack or cyber intrusion, including by computer hackers, foreign governments and cyber terrorists, has generally increased as the number, intensity and sophistication of attempted attacks and intrusions from around the world have increased. Our IT networks and related systems are essential to the operation of our business and our ability to perform day-to-day operations and, in some cases, may be critical to the operations of certain of our customers. Although we make efforts to maintain the security and integrity of our IT networks and related systems, and we have implemented various measures to manage the risk of a security breach or disruption, there can be no assurance that our security efforts and measures will be effective or that attempted security breaches or disruptions would not be successful or damaging. Even the most well protected information, networks, systems and facilities remain potentially vulnerable because the techniques used in such attempted security breaches evolve and generally are not recognized until launched against a target, and in some cases are designed to not be detected and, in fact, may not be detected. Accordingly, we may be unable to anticipate these techniques or to implement adequate security barriers or other preventative measures, and thus it is impossible for us to entirely mitigate this risk. A security breach or other significant disruption involving our IT networks and related systems could disrupt the proper functioning of our networks and systems; result in misstated financial reports, violations of loan covenants and/or missed reporting deadlines; result in our inability to properly monitor our compliance with the rules and regulations regarding our qualification as a REIT; result in the unauthorized access to, and destruction, loss, theft, misappropriation or release of proprietary, confidential, sensitive or otherwise valuable information of ours or others, which others could use to compete against us or for disruptive, destructive or otherwise harmful purposes and outcomes; require significant management attention and resources to remedy any damages that result; subject us to claims for breach of contract, damages, credits, penalties or termination of
leases or other agreements; or damage our reputation among our customers and investors generally.
Risks Related to the Financing of Our Business
Our growth depends on external sources of capital, which are outside of our control and affect our ability to seize strategic opportunities, satisfy debt obligations and make distributions to our stockholders.
We rely on third-party sources to fund our capital needs. Our access to third-party sources of capital depends, in part, on:
| · | | general market conditions; |
| · | | the market’s perception of our growth potential; |
| · | | our current debt levels; |
| · | | our current and expected future earnings; |
| · | | our cash flows and cash distributions; and |
| · | | the market price per share of our common stock. |
In addition, in order to maintain our qualification as a REIT, we are generally required under the Code to, among other things, distribute annually at least 90% of our REIT taxable income, determined without regard to the dividends paid deduction and excluding any net capital gain, and we will be subject to income tax at the regular corporate rate to the extent that we distribute less than 100% of our REIT taxable income, determined without regard to the dividends paid deduction and including any net capital gain. Because of these distribution requirements, without access to third-party sources of capital, we may not be able to acquire properties when strategic opportunities exist, meet the capital and operating needs of our existing properties, satisfy our debt service obligations or make the cash distributions to our stockholders necessary to maintain our qualification as a REIT.
Our operating results and financial condition could be adversely affected if we are unable to make required payments on our debt.
Our charter and bylaws do not limit the amount or percentage of indebtedness that we may incur, and we are subject to risks normally associated with debt financing, including the risk that our cash flows will be insufficient to meet required payments of principal and interest. If we are unable to make our debt service payments as required on loans secured by properties we own, a lender could foreclose on the property or properties securing its debt. This could cause us to lose part or all of our investment.
Failure of our subsidiaries to make required payments on borrowings secured by a significant portion of our assets could materially and adversely affect us.
A significant portion of our investment portfolio consists of assets owned by our consolidated, bankruptcy remote, special purpose entity subsidiaries that have been pledged to secure the long‑term borrowings of those subsidiaries. As of December 31, 2018, the total outstanding principal balance of non‑recourse debt obligations of our consolidated special purpose entity subsidiaries was $2.0 billion and approximately $3.0 billion in assets held by those subsidiaries had been pledged to secure such borrowings. We or our other consolidated subsidiaries are the equity owners of these special purpose entities, meaning we are entitled to the excess cash flows after debt service and all other required payments are made on the debt of these entities. If our subsidiaries fail to make the required payments on such indebtedness, distributions of excess cash flows to us may be reduced or suspended and the indebtedness may become immediately due and payable. If the subsidiaries are unable to pay the accelerated indebtedness, the pledged assets could be foreclosed upon and distributions of excess cash flows to us may be suspended or terminated, which could have a material adverse impact on us.
Current market conditions, including increases in interest rates, could adversely affect our ability to refinance existing indebtedness or obtain additional financing for growth on acceptable terms or at all.
In the recent past, the credit markets have experienced significant price volatility, displacement and liquidity disruptions, including the bankruptcy, insolvency or restructuring of certain financial institutions. These circumstances have materially impacted liquidity in the financial markets, making financing terms for customers less attractive, and in certain cases, have resulted in the unavailability of various types of debt financing. As a result, we may be unable to obtain debt financing on favorable terms or at all or fully refinance maturing indebtedness with new indebtedness (including indebtedness that requires us to make a lump-sum or “balloon” payment at maturity). Reductions in our available borrowing capacity or inability to obtain credit when required or when business conditions warrant could materially and adversely affect us. Furthermore, if prevailing interest rates or other factors at the time of refinancing result in higher interest rates upon refinancing, then the interest expense relating to that refinanced indebtedness would increase. Higher interest rates on newly incurred debt may negatively impact us as well. If interest rates increase, our interest costs and overall costs of capital will increase, which could materially and adversely affect us.
The agreements governing some of our indebtedness contain restrictions and covenants which may limit our ability to enter into or obtain funding for certain transactions, operate our business or make distributions to our common stockholders.
The agreements governing some of our indebtedness contain restrictions and covenants, including financial covenants, that limit or will limit our ability to operate our business. These covenants, as well as any additional covenants to which we may be subject in the future because of additional indebtedness, could cause us to forego investment opportunities, reduce or eliminate distributions to our common stockholders or obtain financing that is more expensive than financing we could obtain if we were not subject to the covenants. In addition, the agreements may have cross default provisions, which provide that a default under one of our financing agreements would lead to a default on some or all of our debt financing agreements.
The covenants and other restrictions under our debt agreements may affect, among other things, our ability to:
| · | | sell or substitute assets; |
| · | | modify certain terms of our leases; |
| · | | prepay debt with higher interest rates; |
| · | | manage our cash flows; and |
| · | | make distributions to equity holders. |
Additionally, these restrictions may adversely affect our operating and financial flexibility and may limit our ability to respond to changes in our business or competitive environment, all of which may materially and adversely affect us.
Our hedging strategies may not be successful in mitigating our risks associated with interest rates and could reduce the overall returns on an investment in our company.
We attempt to mitigate our exposure to interest rate risk by entering into long‑term fixed-rate financing through the combination of periodic debt offerings under our unsecured debt program and STORE Master Funding program, our asset-backed securities conduit, through discrete non‑recourse secured borrowings, through insurance company and bank borrowings, by laddering our borrowing maturities and by using leases that generally provide for rent escalations during the term of the lease. However, the weighted average term of our borrowings does not match the weighted average term of our investments, and the methods we employ to mitigate our exposure to changes in interest rates involve risks,
including the risk that the debt markets are volatile and tend to reflect the conditions of the then‑current economic climate. Our efforts may not be effective in reducing our exposure to interest rate changes. Failure to effectively mitigate our exposure to changes in interest rates may materially and adversely affect us by increasing our cost of capital and reducing the net returns we earn on our portfolio.
We depend on the asset‑backed securities, or ABS, and the commercial mortgage‑backed securities, or CMBS, markets for a substantial portion of our long‑term debt financing.
Historically, we have raised a significant amount of debt capital through our STORE Master Funding program, which accesses the ABS market, and, to a lesser extent, through our access to the CMBS market. A substantial portion of the long‑term debt on our balance sheet has been obtained from debt offerings in the ABS and CMBS markets. This ABS debt is issued by bankruptcy remote, special purpose entities that we or our subsidiaries own. These special purpose entities issue multiple series of investment‑grade ABS notes from time to time as additional collateral is added to the collateral pool. Our CMBS debt is generally in the form of first mortgage debt incurred by other special purpose entities that we or our subsidiaries own. Our ABS and CMBS debt is generally non‑recourse. However, there are customary limited exceptions to recourse for matters such as fraud, misrepresentation, gross negligence or willful misconduct, misapplication of payments, bankruptcy and environmental liabilities.
We have generally used the proceeds from these ABS and CMBS financings to repay debt and fund real estate acquisitions. Through December 31, 2018, we had issued eight series of notes under our STORE Master Funding program; an aggregate principal balance of $1.9 billion is outstanding as of December 31, 2018 representing seven series of notes. Collectively these notes are referred to as the “Master Trust Notes” and had a weighted average maturity of six years, as of December 31, 2018. In addition, we had CMBS and other mortgage loans with an aggregate outstanding principal balance of $169 million and an average maturity of six years, as of December 31, 2018. Our obligations under these loans are generally secured by liens on certain of our properties. In the case of our STORE Master Funding program, subject to certain conditions and limitations, we may substitute real estate collateral for assets in the collateral pool from time to time. No assurance can be given that the ABS or the CMBS markets will be available to us in the future, whether to refinance existing debt or to raise additional debt capital. Moreover, we view our ability to substitute collateral under our STORE Master Funding program favorably, and no assurance can be given that financing facilities offering similar flexibility will be available to us in the future.
In the event of a disruption in the financial markets for ABS or CMBS debt, our ability to obtain long‑term debt may be materially and adversely affected. As a result, we may acquire real estate assets at a lower than anticipated growth rate, or we may be unable to acquire additional real estate assets. In addition, this disruption may affect our return on equity as a result of the decrease in the availability of long‑term debt or leverage for us. Furthermore, a reduction in the difference, or spread, between the rate we earn on our assets and the rate we pay on our liabilities (primarily our long‑term debt), which would occur if the interest rates available to us on future debt issuances increase faster than the lease rates we can charge our customers on STORE Properties we acquire and lease back to them, could have a material and adverse effect on our financial condition.
General Real Estate Risks
Real estate investments are relatively illiquid.
We may desire to sell a property in the future because of changes in market conditions, poor customer performance or default under any mortgage we hold, or to avail ourselves of other opportunities. We may also be required to sell a property in the future to meet debt obligations or avoid a default. Certain types of real estate assets, such as movie theaters, cannot always be sold quickly, and we cannot assure you that we could always obtain a favorable price. In addition, the Code limits our ability to sell our properties. We may be required to invest in the restoration or modification of a property before we can sell it. The inability to respond promptly to changes in the performance of our property portfolio could adversely affect our financial condition and ability to service our debt and pay dividends to our stockholders.
Property vacancies could result in significant capital expenditures.
The loss of a customer, either through lease expiration or customer bankruptcy or insolvency, may require us to spend significant amounts of capital to renovate the property before it is suitable for a new customer and cause us to incur significant costs in the form of ongoing expenses for property maintenance, taxes, insurance and other expenses.
Uninsured losses relating to real property may adversely affect our returns.
Our leases and loan agreements typically require that our customers maintain insurance of the types and in the amounts that are usual and customary for similar types of commercial property, as reviewed by our independent insurance consultant. Under certain circumstances, however, we may permit certain customers to self‑insure. Depending on the location of the property or nature of its use, losses of a catastrophic nature, such as those caused by earthquakes, floods, or other accidents may be covered by insurance policies that are held by our customers with limitations, such as large deductibles or co‑payments that a customer may not be able to meet. In addition, factors such as inflation, changes in building codes and ordinances, environmental considerations and others, including terrorism or acts of war, may make any insurance proceeds we receive insufficient to repair or replace a property if it is damaged or destroyed. In that situation, the insurance proceeds we receive may not be adequate to restore our economic position with respect to the affected real property. In the event we experience a substantial or comprehensive loss of any of our properties, we may not be able to rebuild such property to its existing specifications without significant capital expenditures, which may exceed any amounts received under insurance policies, as reconstruction or improvement of such a property would likely require significant upgrades to meet zoning and building code requirements. The loss of our capital investment in, or anticipated future returns from, our properties due to material uninsured losses could materially and adversely affect us.
Certain provisions of our leases or loan agreements may be unenforceable, which could adversely impact us.
Our rights and obligations with respect to our leases, mortgage loans or other loans are governed by written agreements. A court could determine that one or more provisions of such an agreement are unenforceable, such as a particular remedy (including rights to indemnification), a loan prepayment provision or a provision governing our security interest in the underlying collateral of a customer. We could be adversely impacted if, for example, this were to happen with respect to a master lease governing our rights relating to multiple properties.
Compliance with the Americans with Disabilities Act and fire, safety and other regulations may require us to make significant unanticipated expenditures that could materially and adversely affect us.
Our properties are subject to the Americans with Disabilities Act, or ADA. Under the ADA, all public accommodations must meet federal requirements related to access and use by disabled persons. Compliance with the ADA could require us to modify the properties we own or may purchase to remove architectural and communication barriers in order to make our properties readily accessible to and usable by disabled individuals, and may restrict renovations on our properties. Failure to comply with the ADA could result in the imposition of fines or an award of damages to private litigants, as well as the incurrence of the costs of making modifications to attain compliance. Future legislation could impose additional obligations or restrictions on our properties. Our customers are generally responsible to maintain and repair our properties pursuant to our lease and loan agreements, including compliance with the ADA and other similar laws and regulations, but we could be held liable as the owner of the property for their failure to comply with the ADA or other similar laws and regulations. Any required changes could involve greater expenditures than anticipated or the changes might be made on a more accelerated basis than anticipated, either of which could adversely affect the ability of our customers to cover such costs. If we are subject to liability under the ADA or similar laws and regulations as an owner and our customers are unable to cover the cost of compliance or if we are required to expend our own funds to comply with the ADA or similar laws and regulations, we could be materially and adversely affected.
In addition, our properties are subject to various laws and regulations relating to fire, safety and other regulations, and in some instances, common‑area obligations. Our customers have primary responsibility for compliance with these requirements pursuant to our lease and loan agreements. Our customers may not have the financial ability to fully comply with these regulations. If our customers are unable to comply with these regulations, they may be unable to pay rent on time or may default, or we may have to make substantial capital expenditures to comply with these regulations, which we may not be able to recoup from our customers. We may also face owner liability for failure to comply with these
regulations, which may lead to the imposition of fines or an award of damages to private litigants. Therefore, the failure of our customers to comply with these regulations could materially and adversely affect us.
Environmentally hazardous conditions may adversely affect our operating results.
Our properties may be subject to known and unknown environmental liabilities under various federal, state and local laws and regulations relating to human health and the environment. Certain of these laws and regulations may impose joint and several liability on certain statutory classes of persons, including owners or operators, for the costs of investigation or remediation of contaminated properties. These laws and regulations apply to past and present business operations on the properties, and the use, storage, handling and recycling or disposal of hazardous substances or wastes. We may face liability regardless of our knowledge of the contamination, the timing of the contamination, the cause of the contamination or the party responsible for the contamination of the property. Our leases and loans typically impose obligations on our customers to indemnify us from all or most compliance costs we may experience as a result of the environmental conditions on our properties, but if a customer fails to, or cannot, comply, we may be required to pay such costs. We cannot predict whether in the future, new or more stringent environmental laws will be enacted or how such laws will impact the operations of businesses on our properties. Costs associated with an adverse environmental event could be substantial, and the potential liability as to any of our properties is generally not limited under such laws and regulations and could significantly exceed the value of such property.
Under the laws of many states, contamination on a site may give rise to a lien on the site for clean‑up costs. In several states, such a lien has priority over all existing liens, including those of existing mortgages. In these states, a lien of a mortgage may lose its priority to such a “super lien.” If any of the properties on which we have a mortgage are or become contaminated and subject to a super lien, we may not be able to recover the full value of our investment and may be materially and adversely affected.
Certain federal, state and local laws, regulations and ordinances govern the use, removal and/or replacement of underground storage tanks in the event of a release on, or an upgrade or redevelopment of, certain properties. Such laws, as well as common‑law standards, may impose liability for any releases of hazardous substances associated with the underground storage tanks and may provide for third parties to seek recovery from owners or operators of such properties for damages associated with such releases. If hazardous substances are released from any underground storage tanks on any of our properties, we may be materially and adversely affected.
In a few states, transfers of some types of sites are conditioned upon cleanup of contamination prior to transfer, including in cases where a lender has become the owner of the site through a foreclosure, deed in lieu of foreclosure or otherwise. If any of our properties are subject to such contamination, we may be subject to substantial clean‑up costs before we are able to sell or otherwise transfer the property.
Certain federal, state and local laws, regulations and ordinances govern the removal, encapsulation or disturbance of asbestos‑containing materials, ACMs, in the event of the remodeling, renovation or demolition of a building. Such laws, as well as common‑law standards, may impose liability for releases of ACMs and may impose fines and penalties against us or our customers for failure to comply with these requirements or provide for third parties to seek recovery from us or our customers.
In addition, our properties may contain or develop harmful mold. Exposure to mold may cause a variety of adverse health effects and symptoms, including allergic or other reactions. If our customers or their employees or customers are exposed to mold at any of our properties, we could be required to undertake a costly remediation program to contain or remove the mold from the affected property. In addition, exposure to mold by our customers or others could subject us to liability if property damage or health concerns arise.
If we or our customers become subject to any of the above‑mentioned environmental risks, we may be materially and adversely affected.
Risks Related to Our Tax Status and Other Tax Related Matters
Failure to qualify as a REIT would reduce our net earnings available for investment or distribution.
We have elected to be taxed as a REIT under the Code. Our qualification as a REIT requires us to satisfy numerous requirements, some on an annual and quarterly basis, established under highly technical and complex Code provisions for which there are only limited judicial or administrative interpretations, and which involves the determination of various factual matters and circumstances not entirely within our control. We expect that our current organization and methods of operation will enable us to continue to qualify as a REIT, but we may not so qualify or we may not be able to remain so qualified in the future.
If we fail to qualify as a REIT in any taxable year, we would be subject to federal income tax (including any applicable alternative minimum tax for taxable years ending prior to January 1, 2018) on our taxable income at the regular corporate rate, and would not be allowed to deduct dividends paid to our stockholders in computing our taxable income. Also, unless the Internal Revenue Service, or the IRS, granted us relief under certain statutory provisions, we could not re-elect REIT status until the fifth calendar year after the year in which we first failed to qualify as a REIT. The additional tax liability from the failure to qualify as a REIT would reduce or eliminate the amount of cash available for investment or distribution to our stockholders. This would likely have a significant adverse effect on the value of our securities and our ability to raise additional capital. In addition, we would no longer be required to make distributions to our stockholders. Even if we continue to qualify as a REIT, we will continue to be subject to certain federal, state and local taxes on our income and property.
Changes to tax law could affect our ability to qualify as a REIT and could adversely affect our stockholders.
U.S. federal income tax laws governing REITs and other corporations and the administrative interpretations of those laws may be amended at any time, potentially with retroactive effect. For example, the latest tax reform bill, informally known as the Tax Cuts and Jobs Act (“TCJA”), made significant changes to the U.S. federal income tax laws applicable to individuals and corporations, including REITs and their shareholders. While we believe our analysis and computations of the tax effects of the TCJA (including issued guidance) are properly reflected in our financial statements, future technical corrections or other amendments to the TCJA or administrative guidance interpreting the TCJA may increase the uncertainty as to the long-term effect of the TCJA on us. Any similar future legislation, new regulations, administrative interpretations or court decisions could adversely affect our ability to qualify as a REIT or adversely affect our stockholders.
Even if we qualify as a REIT for purposes of the Code, we may be subject to other tax liabilities that reduce our cash flow and our ability to make distributions to our stockholders.
As a REIT, we are subject to annual distribution requirements, which limit the amount of cash we retain for other business purposes, including amounts to fund our growth. We generally must distribute annually at least 90% of our net REIT taxable income to our stockholders, excluding any net capital gain, in order for our distributed earnings to not be subject to corporate income tax. Additionally, we will be subject to a 4% nondeductible excise tax on the amount, if any, by which distributions we pay in any calendar year are less than the sum of 85% of our ordinary income, 95% of our capital gain net income and 100% of our undistributed income from prior years. If we have net income from the sale of foreclosure property that we hold primarily for sale to customers in the ordinary course of business or other non-qualifying income from foreclosure property, we must pay a tax on that income at the corporate income tax rate. Further, if we sell an asset, other than foreclosure property, that we hold primarily for sale to customers in the ordinary course of business, our gain would be subject to the 100% “prohibited transaction” tax unless such sale were made by our taxable REIT subsidiary, or TRS, or if we qualify for a safe harbor from tax.
We intend to make distributions to our stockholders to comply with the requirements of the Code. However, differences in timing between the recognition of taxable income and the actual receipt of cash could require us to sell assets or borrow funds on a short‑term or long‑term basis to meet the 90% distribution requirement of the Code, even if the prevailing market conditions are not favorable for these borrowings.
Dividends paid by REITs generally do not qualify for reduced tax rates.
In general, the maximum U.S. federal income tax rate for dividends that constitute “qualified dividend income” paid to individuals, trusts and estates is 20%. Unlike dividends received from a corporation that is not a REIT, our distributions generally are not eligible for the reduced rates. Beginning in 2018 and for taxable years prior to 2026, non-corporate stockholders are generally allowed to deduct up to 20% of the aggregate amount of ordinary dividends distributed by us, subject to certain limitations, which would reduce the maximum marginal effective tax rate for individuals on the receipt of such ordinary dividends to 29.6%. Although these rules do not adversely affect the taxation of REITs or dividends payable by REITs, investors who are individuals, trusts and estates may perceive investments in REITs to be relatively less attractive than investments in the stocks of non‑REIT corporations that pay dividends, which could materially and adversely affect the value of the shares of REITs, including the per share trading price of our common stock.
Recharacterization of sale-leaseback transactions may cause us to lose our REIT status.
The IRS may take the position that specific sale‑leaseback transactions that we treat as leases are not true leases for federal income tax purposes but are, instead, financing arrangements or loans. If a sale‑leaseback transaction were so re‑characterized, we might fail to satisfy the REIT asset tests, the income tests or distribution requirements and consequently lose our REIT status effective with the year of re‑characterization unless we elect to make an additional distribution to maintain our REIT status. Alternatively, the amount of our REIT taxable income could be recalculated which might also cause us to fail to meet the distribution requirement for a taxable year.
As a result of acquiring C corporations in carry-over basis transactions, we may inherit material tax liabilities and other tax attributes from such acquired corporations, and we may be required to distribute earnings and profits.
From time to time, we have and may continue to acquire C corporations in transactions in which the basis of the corporations’ assets in our hands is determined by reference to the basis of the assets in the hands of the acquired corporations, or carry-over basis transactions.
If we acquire any asset from a corporation that is or has been a C corporation in a carry-over basis transaction, and we subsequently recognize gain on the disposition of the asset during the five-year period beginning on the date on which we acquired the asset, then we will be required to pay tax on such a built-in gain at the regular corporate tax rate on this gain to the extent of the excess of (1) the fair market value of the asset over (2) our adjusted basis in the asset, in each case determined as of the date on which we acquired the asset. Any taxes we pay as a result of such gain would reduce the amount available for distribution to our stockholders. The imposition of such tax may require us to forgo an otherwise attractive disposition of any assets we acquire from a C corporation in a carry-over basis transaction, and as a result may reduce the liquidity of our portfolio of investments. In addition, in such a carry-over basis transaction, we will succeed to any tax liabilities and earnings and profits of the acquired C corporation. To qualify as a REIT, we must distribute any non-REIT earnings and profits accumulated by the C corporation prior to the acquisition by the close of the taxable year in which we acquire the corporation.
We could face possible state and local tax audits and adverse changes in state and local tax laws.
As discussed in the risk factors above, because we are organized and qualify as a REIT, we are generally not subject to federal income taxes, but we are subject to certain state and local taxes. From time to time, changes in state and local tax laws or regulations are enacted, which may result in an increase in our tax liability. A shortfall in tax revenues for states and municipalities in which we own properties may lead to an increase in the frequency and size of such changes. If such changes occur, we may be required to pay additional state and local taxes. These increased tax costs could adversely affect our financial condition and the amount of cash available for the payment of distributions to our stockholders. In the normal course of business, entities through which we own real estate may also become subject to tax audits. If such entities become subject to state or local tax audits, the ultimate result of such audits could have an adverse effect on our financial condition.
Risks Related to Our Organization and Structure
Our board of directors may change our investment strategy, financing strategy or leverage policies without stockholder consent.
Our board of directors has overall authority to oversee our operations and determine our major corporate policies. This authority includes significant flexibility. For example, our board of directors can do the following:
| · | | change any of our strategies, policies or procedures with respect to property acquisitions and divestitures; |
| · | | amend our policies with respect to asset allocation, growth, operations, indebtedness, financing and distributions; |
| · | | within the limits provided in our charter, prevent the ownership, transfer and/or accumulation of shares in order to protect our status as a REIT or for any other reason deemed to be in the best interests of us and our stockholders; |
| · | | employ and compensate affiliates; |
| · | | change creditworthiness standards with respect to customers; |
| · | | make amendments to our equity incentive plans; |
| · | | direct our resources toward investments that do not ultimately appreciate over time; and |
| · | | determine that it is no longer in our best interests to continue to qualify as a REIT. |
Any of these actions could increase our operating expenses, impact our ability to make distributions or reduce the value of our assets without giving our stockholders the right to vote.
Our board of directors’ power to increase the number of authorized shares of our stock without stockholder approval may negatively impact our existing stockholders.
Our charter authorizes us to issue up to 375,000,000 shares of common stock, and up to 125,000,000 shares of preferred stock, $0.01 par value per share. Our charter authorizes our board of directors, with the approval of a majority of the board of directors and without stockholder approval, to amend our charter to increase or decrease the aggregate number of shares of stock or the number of shares of any class or series of stock that we are authorized to issue. Accordingly, our board of directors could authorize the issuance of shares of common stock or another class or series of stock, including a class or series of preferred stock, that could have the effect of delaying, deferring or preventing a change in control of us that our existing stockholders may view as favorable. In addition, our board of directors may increase our authorized stock in order to issue additional shares in connection with future financings and other transactions. These additional issuances could dilute the ownership interests of our existing stockholders.
Limitations on share ownership and limitations on the ability of our stockholders to effect a change in control of us restrict the transferability of our stock and may prevent takeovers that are beneficial to our stockholders.
One of the requirements for maintenance of our qualification as a REIT for U.S. federal income tax purposes is that no more than 50% in value of our outstanding capital stock may be owned by five or fewer individuals, including entities specified in the Code, during the last half of any taxable year. Our charter contains ownership and transfer restrictions relating to our stock to assist us in complying with this and other REIT ownership requirements, among other purposes. However, the restrictions may have the effect of preventing a change of control that does not threaten REIT status. These restrictions include a provision in our charter that generally limits ownership by any person of more than 9.8% of the value of our outstanding stock or 9.8% (in value or by number of shares, whichever is more restrictive) of our outstanding common stock, unless our board of directors exempts the person from such ownership limitation. Absent such an exemption from our board of directors, the transfer of our stock to any person in excess of the applicable ownership limit, or any transfer of shares of such stock in violation of the ownership requirements of the Code for REITs, may be void under certain circumstances, and the intended transferee of such stock will acquire no rights in such shares.
These provisions of our charter may have the effect of delaying, deferring or preventing someone from taking control of us, even though a change of control might involve a premium price for our stockholders or might otherwise be in our stockholders’ best interests.
Our rights and the rights of our stockholders to take action against our directors and officers are limited.
As permitted by Maryland law, our charter limits the liability of our directors and officers to stockholders for money damages, except for liability resulting from:
| · | | actual receipt of an improper benefit or profit in money, property or services; or |
| · | | active and deliberate dishonesty by the director or officer that was established by a final judgment as being material to the cause of action adjudicated. |
As a result, we and our stockholders have rights against our directors and officers that are more limited than might otherwise exist. Accordingly, in the event that actions taken in good faith by any of our directors or officers impede the performance of our company, our ability and the ability of our stockholders to recover damages from such director or officer will be limited. In addition, our charter authorizes us to obligate our company, and our bylaws require us, to indemnify our directors and officers for actions taken by them in those and certain other capacities to the maximum extent permitted by Maryland law.
We will continue to incur significant expenses as a result of being a public company, which will negatively impact our financial performance.
We incur, and will continue to incur, significant legal, accounting, insurance and other expenses as a result of being a public company. The Dodd‑Frank Wall Street Reform and Consumer Protection Act of 2010, or the Dodd‑Frank Act, and the Sarbanes‑Oxley Act, as well as related rules implemented by the SEC and the NYSE, have required changes in corporate governance practices of public companies. In addition, rules that the SEC is implementing or is required to implement pursuant to the Dodd‑Frank Act are expected to require additional changes. We expect that compliance with these and other similar laws, rules and regulations, including compliance with Section 404 of the Sarbanes‑Oxley Act, will substantially increase our expenses, including our legal and accounting costs, and make some activities more time‑consuming and costly. We also expect these laws, rules and regulations to make it more expensive for us to obtain director and officer liability insurance, and we may be required to accept reduced policy limits and coverage or incur substantially higher costs to obtain the same or similar coverage, which may make it more difficult for us to attract and retain qualified persons to serve on our board of directors or as officers.
Risks Related to Ownership of Our Common Stock
Changes in market conditions and volatility of stock prices could adversely affect the market price of our common stock.
The stock markets, including the NYSE, on which our common stock is listed, have experienced significant price and volume fluctuations. As a result, the market price of our common stock could be similarly volatile, and investors in our common stock may experience a decrease in the value of their shares, including decreases unrelated to our operating performance or prospects. In addition to the risks discussed or referred to in this “Risk Factors” section, a number of factors could negatively affect the price per share of our common stock, including:
| · | | general market and economic conditions; |
| · | | actual or anticipated variations in our quarterly operating results or dividends or our payment of dividends in shares of our common stock; |
| · | | changes in our funds from operations or earnings estimates; |
| · | | difficulties or inability to access capital or extend or refinance existing debt; |
| · | | changes in market valuations of similar companies; |
| · | | publication of research reports about us or the real estate industry; |
| · | | the general reputation of REITs and the attractiveness of their equity securities in comparison to other equity securities; |
| · | | general stock and bond market conditions, including changes in interest rates on fixed income securities, that may lead prospective purchasers of our stock to demand a higher annual yield from future dividends; |
| · | | a change in ratings issued by any analyst following us or any nationally recognized statistical rating organization; |
| · | | additions or departures of key management personnel; |
| · | | adverse market reaction to any additional debt we may incur in the future; |
| · | | speculation in the press or investment community; |
| · | | terrorist activity which may adversely affect the markets in which our securities trade, possibly increasing market volatility and causing further erosion of business and consumer confidence and spending; |
| · | | failure to continue to qualify as a REIT; |
| · | | strategic decisions by us or our competitors, such as acquisitions, divestments, spin-offs, joint ventures, strategic investments or changes in business strategy; |
| · | | failure to satisfy listing requirements of the NYSE; |
| · | | governmental regulatory action and changes in tax laws; and |
| · | | the issuance of additional shares of our common stock, or the perception that such sales might occur. |
Many of the factors listed above are beyond our control. These factors may cause the market price of shares of our common stock to decline, regardless of our financial condition, results of operations, business or our prospects.
Furthermore, in recent years, the stock markets have experienced significant price and volume fluctuations. This volatility has had a significant impact on the market price of securities issued by many companies, including companies in our industry. The changes frequently appear to occur without regard to the operating performance of the affected companies. Hence, the price of our common stock could fluctuate based upon factors that have little or nothing to do with us in particular, and these fluctuations could materially reduce the price of our common stock and materially affect the value of an investment in us.
Increases in market interest rates may have an adverse effect on the value of our common stock if prospective purchasers of our common stock expect a higher dividend yield and increased borrowing costs may decrease our funds available for distribution.
The market price of our common stock will generally be influenced by the dividend yield on our common stock (as a percentage of the price of our common stock) relative to market interest rates. An increase in market interest rates, which are currently at low levels relative to historical rates, may lead prospective purchasers of shares of our common stock to expect a higher dividend yield. However, higher market interest rates would likely increase our borrowing costs and potentially decrease funds available for distribution. Thus, higher market interest rates could cause the market price of our common stock to decrease.
Future offerings of debt, which would be senior to our common stock upon liquidation, or preferred equity securities, which may be senior to our common stock for purposes of dividend distributions or upon liquidation, may adversely affect the market price of our common stock.
In the future, we may issue debt or preferred equity securities. Upon liquidation, holders of our debt securities and shares of preferred stock and lenders with respect to other borrowings will receive distributions of our available assets prior to the holders of our common stock. Additional equity offerings, including convertible preferred stock, may dilute the holdings of our existing stockholders or otherwise reduce the market price of our common stock, or both. Holders of our common stock are not entitled to preemptive rights or other protections against dilution. Our preferred stock, if issued, could have a preference on liquidating distributions or a preference on distribution payments that could limit our ability to make distributions to holders of our common stock. Because our decision to issue securities in any future offering will depend on market conditions and other factors beyond our control, we cannot predict or estimate the amount, timing or nature of our future offerings. Thus, our stockholders bear the risk that future offerings may reduce the market price of our common stock and dilute their stock holdings in us.
A substantial portion of our total outstanding common stock may be sold into the market at any time, which could cause the market price of our common stock to drop significantly, even if our business is doing well, and make it difficult for us to sell equity securities in the future.
The market price of our common stock could decline as a result of sales of a large number of shares of our common stock or the perception that such sales could occur. These sales, or the possibility that these sales may occur, also might make it difficult for us to sell equity securities in the future at times or prices that we deem appropriate. We filed a registration statement on Form S-8 under the Securities Act to register the offer and sale of up to 7,314,221 shares of our common stock or securities convertible into or exchangeable for shares of our common stock that may be issued pursuant to our 2012 Long Term Incentive Plan and our 2015 Omnibus Equity Incentive Plan. Such Form S-8 registration statement automatically became effective upon filing. Accordingly, recipients of shares issued pursuant to such registration statement may generally freely resell those shares in the open market, subject to limitations in the case of any such recipients who are our affiliates. In addition, we issue, and intend to continue to issue, additional equity securities periodically to finance our growth, including through our existing and any future “at the market” offering program. When we raise additional capital through the issuance of new equity securities, such issuances will dilute the interests of our existing stockholders and could adversely affect the value of their investments. If our performance or prospects decline and we are unable to access the equity markets when needed in the future, our ability to grow our business will be adversely impacted.
We may change the dividend policy for our common stock in the future.
The decision to declare and pay dividends on our common stock, as well as the form, timing and amount of any such future dividends, is at the sole discretion of our board of directors and will depend on our earnings, cash flows, liquidity, financial condition, capital requirements, contractual prohibitions or other limitations under our indebtedness, the annual distribution requirements under the REIT provisions of the Code, state law and such other factors as our board of directors considers relevant. Any change in our dividend policy could have a material adverse effect on the market price of our common stock.
Item 1B. UNRESOLVED STAFF COMMENTS
None.
Item 2. PROPERTIES
As of December 31, 2018, our total investment in real estate and loans approximated $7.6 billion, representing investments in 2,255 property locations, substantially all of which are profit centers for our customers. These investments generate cash flows from approximately 680 contracts predominantly structured as net leases. The weighted average non‑cancelable remaining term of our leases was approximately 14 years.
Our real estate portfolio is highly diversified. As of December 31, 2018, our 2,255 property locations were operated by 434 customers across 49 states. Our largest customer represented approximately 2.7% of our portfolio at December 31, 2018, and our top ten largest customers represented 18.1% of annualized base rent and interest. Our customers operate their businesses across more than 600 brand names or business concepts in over 100 industries.
The following tables summarize the diversification of our real estate portfolio based on the percentage of base rent and interest, annualized based on rates in effect on December 31, 2018, for all of our leases, loans and direct financing receivables in place as of that date.
Diversification by Customer
As of December 31, 2018, our 2,255 property locations were operated by 434 customers and the following table identifies our ten largest customers:
| | | | | |
| | % of | | | |
| | Annualized | | | |
| | Base Rent | | Number | |
| | and | | of | |
Customer | | Interest | | Properties | |
AVF Parent, LLC (Art Van Furniture) | | 2.7 | % | 23 | |
Mills Fleet Farm Group LLC | | 2.4 | | 8 | |
Bass Pro Group, LLC (Cabela's) | | 2.2 | | 9 | |
American Multi-Cinema, Inc. (AMC/Carmike/Starplex) | | 1.7 | | 14 | |
Stratford School, Inc. (Elementary and middle schools) | | 1.6 | | 17 | |
Cadence Education, Inc. (Early childhood/elementary education) | | 1.6 | | 32 | |
Zips Holdings, LLC | | 1.6 | | 42 | |
US LBM Holdings, LLC (Building materials distribution) | | 1.5 | | 46 | |
CWGS Group, LLC (Camping World/Gander Outdoors) | | 1.5 | | 19 | |
Dufresne Spencer Group Holdings, LLC (Ashley Furniture HomeStore) | | 1.3 | | 16 | |
All other (424 customers) | | 81.9 | | 2,029 | |
Total | | 100.0 | % | 2,255 | |
Diversification by Concept
As of December 31, 2018, our customers operated their businesses across more than 600 concepts and the following table identifies the top ten concepts:
| | | | | |
| | % of | | | |
| | Annualized | | | |
| | Base Rent | | Number | |
| | and | | of | |
Customer Business Concept | | Interest | | Properties | |
Fleet Farm | | 2.4 | % | 8 | |
Ashley Furniture HomeStore | | 2.2 | | 25 | |
Cabela's | | 2.0 | | 8 | |
Art Van Furniture | | 1.9 | | 16 | |
Zips Car Wash | | 1.6 | | 42 | |
Big R Stores | | 1.5 | | 24 | |
Stratford School | | 1.2 | | 4 | |
AMC Theaters | | 1.1 | | 10 | |
Popeyes Louisiana Kitchen | | 1.1 | | 63 | |
Applebee's | | 1.0 | | 35 | |
All other (600 concepts) | | 84.0 | | 2,020 | |
Total | | 100.0 | % | 2,255 | |
Diversification by Industry
As of December 31, 2018, our customers’ business concepts were diversified across more than 100 industries within the service, retail and manufacturing sectors of the U.S. economy. The following table summarizes those industries into 74 industry groups:
| | | | | | | |
| | % of | | | | | |
| | Annualized | | | | Building | |
| | Base Rent | | Number | | Square | |
| | and | | of | | Footage | |
Customer Industry Group | | Interest | | Properties | | (in thousands) | |
Service: | | | | | | | |
Restaurants—full service | | 11.2 | % | 403 | | 2,719 | |
Restaurants—limited service | | 5.8 | | 395 | | 1,040 | |
Early childhood education centers | | 5.9 | | 185 | | 2,082 | |
Health clubs | | 5.3 | | 76 | | 2,267 | |
Movie theaters | | 4.8 | | 38 | | 1,879 | |
Family entertainment centers | | 4.0 | | 38 | | 1,290 | |
Automotive repair and maintenance | | 3.8 | | 139 | | 643 | |
All other service (28 industry groups) | | 24.0 | | 566 | | 16,546 | |
Total service | | 64.8 | | 1,840 | | 28,466 | |
Retail: | | | | | | | |
Furniture stores | | 5.5 | | 54 | | 3,224 | |
Farm and ranch supply stores | | 4.3 | | 41 | | 3,914 | |
All other retail (14 industry groups) | | 8.6 | | 113 | | 4,970 | |
Total retail | | 18.4 | | 208 | | 12,108 | |
Manufacturing: | | | | | | | |
Metal fabrication | | 3.9 | | 57 | | 6,894 | |
All other manufacturing (22 industry groups) | | 12.9 | | 150 | | 17,797 | |
Total manufacturing | | 16.8 | | 207 | | 24,691 | |
Total | | 100.0 | % | 2,255 | | 65,265 | |
Diversification by Geography
Our portfolio is also highly diversified by geography, as our 2,255 property locations can be found in every state except Delaware. The following table details the top ten geographical locations of the properties as of December 31, 2018:
| | | | | |
| | % of | | | |
| | Annualized | | | |
| | Base Rent | | | |
| | and | | Number of | |
State | | Interest | | Properties | |
Texas | | 11.6 | % | 232 | |
Florida | | 6.2 | | 137 | |
Illinois | | 6.2 | | 140 | |
Ohio | | 5.5 | | 134 | |
Georgia | | 5.3 | | 140 | |
Michigan | | 4.4 | | 79 | |
California | | 4.3 | | 40 | |
Tennessee | | 4.2 | | 100 | |
Arizona | | 4.0 | | 71 | |
Minnesota | | 3.7 | | 75 | |
All other (39 states) (1) | | 44.6 | | 1,107 | |
Total | | 100.0 | % | 2,255 | |
| (1) | | Includes one property in Ontario, Canada which represents 0.3% of annualized base rent and interest. |
Contract Expirations
The following table sets forth the schedule of our lease, loan and direct financing receivable expirations as of December 31, 2018:
| | | | | |
| | % of | | | |
| | Annualized | | | |
| | Base Rent | | | |
| | and | | Number of | |
Year of Lease Expiration or Loan Maturity (1) | | Interest | | Properties (2) | |
2019 | | 0.8 | % | 18 | |
2020 | | 0.7 | | 13 | |
2021 | | 0.6 | | 7 | |
2022 | | 0.4 | | 7 | |
2023 | | 1.0 | | 26 | |
2024 | | 0.7 | | 15 | |
2025 | | 1.5 | | 23 | |
2026 | | 2.1 | | 54 | |
2027 | | 3.5 | | 64 | |
2028 | | 4.8 | | 79 | |
Thereafter | | 83.9 | | 1,941 | |
Total | | 100.0 | % | 2,247 | |
| (1) | | Expiration year of contracts in place as of December 31, 2018, excluding any tenant option renewal periods. |
| (2) | | Excludes eight properties which were vacant and not subject to a lease as of December 31, 2018. |
Item 3. LEGAL PROCEEDINGS
We are subject to various legal proceedings and claims that arise in the ordinary course of our business, including instances in which we are named as defendants in lawsuits arising out of accidents causing personal injuries or other events that occur on the properties operated by our customers. These matters are generally covered by insurance and/or by our customers pursuant to our contractual indemnification rights that we include in our leases. Management believes that the final outcome of such matters will not have a material adverse effect on our financial position, results of operations or liquidity.
Item 4. MINE SAFETY DISCLOSURES
Not Applicable.
PART II
Item 5. MARKET FOR REGISTRANT’S COMMON STOCK, RELATED STOCKHOLDER MATTERS AND ISSUER PURCHASES OF EQUITY SECURITIES
Our common stock is listed on the NYSE under the symbol “STOR”.
On February 20, 2019, there were 42 holders of record of the 221,612,845 outstanding shares of our common stock. Because many of our shares of common stock are held by brokers and other institutions on behalf of stockholders, we are unable to estimate the total number of stockholders represented by these record holders. We have determined that, for federal income tax purposes, all of the distributions paid in 2018 represented taxable income.
Distributions
The Company pays regular quarterly distributions to holders of its common stock. Future distributions will be at the discretion of our Board of Directors and will depend on our actual funds from operations, financial condition and capital requirements, the annual distribution requirements under the REIT provisions of the Code and other factors.
Issuer Purchases of Equity Securities
During the three months ended December 31, 2018, the Company did not repurchase any of its equity securities.
Stock Performance Graph
The following performance chart compares, for the period from November 18, 2014 (our first trading day on the NYSE) through December 31, 2018, the cumulative total stockholder return on our common stock with that of the Standard & Poor’s 500 Composite Stock Index, or the S&P 500, and the MSCI U.S. REIT Index. The chart assumes $100.00 was invested on November 18, 2014 and assumes the reinvestment of any dividends. The historical stock price performance reflected in the following graph is not necessarily indicative of future stock price performance.
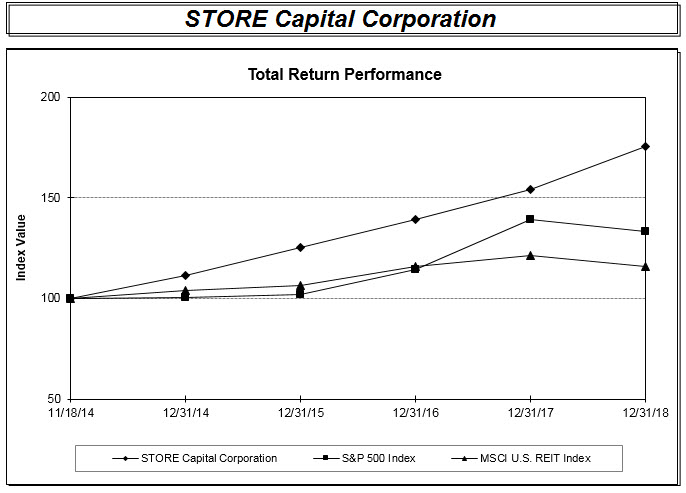
| | | | | | | | | | | | |
| Period Ending | |
Index | 11/18/2014 | | 12/31/2014 | | 12/31/2015 | | 12/31/2016 | | 12/31/2017 | | 12/31/2018 | |
STORE Capital Corporation | 100 | | 111.40 | | 125.40 | | 139.23 | | 154.06 | | 175.60 | |
S&P 500 | 100 | | 100.60 | | 101.99 | | 114.19 | | 139.12 | | 133.02 | |
MSCI US REIT (RMS) | 100 | | 103.86 | | 106.48 | | 115.64 | | 121.50 | | 115.95 | |
The performance graph and the related chart and text are being furnished solely to accompany this Annual Report on Form 10-K pursuant to Item 201(e) of Regulation S-K, and are not being filed for purposes of Section 18 of the Exchange Act and are not to be incorporated by reference into any filing of ours, whether made before or after the date hereof, regardless of any general incorporation language in such filing.
Item 6. SELECTED FINANCIAL DATA
The following tables set forth selected consolidated financial and other information of the Company as of and for each of the years ended December 31, 2018, 2017, 2016, 2015 and 2014. The table should be read in conjunction with the Company’s consolidated financial statements and the notes thereto and Item 7 “Management’s Discussion and Analysis of Financial Condition and Results of Operations” included in this Annual Report on Form 10-K.
| | | | | | | | | | | | | | | |
| | | | | | | | | | | | | | | |
| Year ended December 31, | |
(Dollars in thousands, except per share data) | 2018 | | 2017 | | 2016 | | | 2015 | | 2014 | |
Statement of Operations Data: | | | | | | | | | | | | | | | |
Total revenues | $ | 540,756 | | $ | 452,847 | | $ | 376,343 | | $ | 284,762 | | $ | 190,441 | |
Expenses: | | | | | | | | | | | | | | | |
Interest | | 129,061 | | | 120,478 | | | 105,180 | | | 81,782 | | | 67,959 | |
Transaction costs | | — | | | — | | | 523 | | | 1,156 | | | 2,804 | |
Property costs | | 4,250 | | | 4,773 | | | 4,067 | | | 1,515 | | | 473 | |
General and administrative | | 45,725 | | | 40,990 | | | 33,972 | | | 27,972 | | | 19,494 | |
Selling stockholder costs | | — | | | — | | | 800 | | | — | | | — | |
Depreciation and amortization | | 181,826 | | | 150,279 | | | 119,618 | | | 88,615 | | | 57,025 | |
Provisions for impairment | | 7,810 | | | 13,440 | | | 1,720 | | | 1,000 | | | — | |
Total expenses | | 368,672 | | | 329,960 | | | 265,880 | | | 202,040 | | | 147,755 | |
| | | | | | | | | | | | | | | |
Gain on dispositions of real estate | | 45,528 | | | 39,609 | | | 13,296 | | | 1,322 | | | 4,493 | |
Income from continuing operations before income taxes | | 217,612 | | | 162,496 | | | 123,759 | | | 84,044 | | | 47,179 | |
Income tax expense | | 642 | | | 458 | | | 434 | | | 274 | | | 180 | |
Income from continuing operations | | 216,970 | | | 162,038 | | | 123,325 | | | 83,770 | | | 46,999 | |
Income from discontinued operations | | — | | | — | | | — | | | — | | | 1,140 | |
Net income | $ | 216,970 | | $ | 162,038 | | $ | 123,325 | | $ | 83,770 | | $ | 48,139 | |
Per Common Share Data: | | | | | | | | | | | | | | | |
Income from continuing operations—basic and diluted | $ | 1.06 | | $ | 0.90 | | $ | 0.82 | | $ | 0.68 | | $ | 0.59 | |
Net income —basic and diluted | | 1.06 | | | 0.90 | | | 0.82 | | | 0.68 | | | 0.61 | |
Cash dividends declared | | 1.2800 | | | 1.2000 | | | 1.1200 | | | 1.0400 | | | 0.9898 | |
Balance Sheet Data (at period end): | | | | | | | | | | | | | | | |
Total real estate investments, at cost(1) | $ | 7,253,868 | | $ | 5,962,457 | | $ | 4,855,306 | | $ | 3,766,600 | | $ | 2,694,557 | |
Carrying amount of loans and direct financing receivables | | 351,202 | | | 271,453 | | | 269,210 | | | 213,342 | | | 111,354 | |
Total investment portfolio, gross(1) | | 7,605,070 | | | 6,233,910 | | | 5,124,516 | | | 3,979,942 | | | 2,805,911 | |
Less accumulated depreciation and amortization(1) | | (585,913) | | | (428,900) | | | (298,984) | | | (184,182) | | | (98,671) | |
Net investments | | 7,019,157 | | | 5,805,010 | | | 4,825,532 | | | 3,795,760 | | | 2,707,240 | |
Cash and cash equivalents | | 27,511 | | | 42,937 | | | 54,200 | | | 67,115 | | | 136,313 | |
Total assets | | 7,113,971 | | | 5,899,777 | | | 4,941,668 | | | 3,911,388 | | | 2,882,703 | |
Credit facility | | 135,000 | | | 290,000 | | | 48,000 | | | — | | | — | |
Senior unsecured notes and term loans payable, net | | 916,720 | | | 570,595 | | | 470,190 | | | 172,442 | | | — | |
Non-recourse debt obligations of consolidated special purpose entities, net | | 2,008,592 | | | 1,736,306 | | | 1,833,481 | | | 1,597,505 | | | 1,253,242 | |
Total liabilities | | 3,250,470 | | | 2,728,835 | | | 2,458,413 | | | 1,851,595 | | | 1,300,019 | |
Total stockholders’ equity | | 3,863,501 | | | 3,170,942 | | | 2,483,255 | | | 2,059,793 | | | 1,582,684 | |
Other Data: | | | | | | | | | | | | | | | |
Funds from Operations(2) | $ | 357,625 | | $ | 283,930 | | $ | 230,904 | | $ | 171,705 | | $ | 99,383 | |
Adjusted Funds from Operations(2) | $ | 377,869 | | $ | 306,077 | | $ | 245,829 | | $ | 183,475 | | $ | 109,876 | |
Number of investment property locations (at period end) | | 2,255 | | | 1,921 | | | 1,660 | | | 1,325 | | | 947 | |
% of owned properties subject to a lease contract (at period end) | | 99.6 | % | | 99.6 | % | | 99.5 | % | | 99.8 | % | | 100 | % |
| (1) | | Includes the dollar amount of investments ($18.7 million) and the accumulated depreciation and amortization ($2.0 million) related to real estate investments held for sale at December 31, 2017. |
| (2) | | For definitions and reconciliations of Funds from Operations and Adjusted Funds from Operations, see “Management’s Discussion and Analysis of Financial Condition and Results of Operations—Non‑GAAP Measures.” |
Item 7. MANAGEMENT’S DISCUSSION AND ANALYSIS OF FINANCIAL CONDITION AND RESULTS OF OPERATIONS
The following discussion and analysis of our financial condition and results of operations should be read together with the “Selected Consolidated Financial Data” and “Business” sections, as well as the consolidated financial statements and related notes in Part II, Item 8 in this Annual Report on Form 10-K. Some of the information contained in this discussion and analysis or set forth elsewhere in this report, including information with respect to our plans and strategies for our business, includes forward‑looking statements that involve risks and uncertainties. You should read “Item 1A. Risk Factors” and the “Forward‑Looking Statements” sections of this Annual Report on Form 10-K for a discussion of important factors that could cause actual results to differ materially from the results described in or implied by these forward‑looking statements.
Overview
We were formed in 2011 to invest in and manage Single Tenant Operational Real Estate, or STORE Property, which is our target market and the inspiration for our name. A STORE Property is a property location at which a company operates its business and generates sales and profits, which makes the location a profit center and, therefore, fundamentally important to that business. Due to the long-term nature of our leases, we focus our acquisition activity on properties that operate in industries we believe have long-term relevance, the majority of which are service industries. Examples of single-tenant operational real estate in the service industry sector include restaurants, early childhood education centers, health clubs and movie theaters. By acquiring the real estate from the operators and then leasing the real estate back to them, the operators become our long‑term tenants, and we refer to them as our customers. Through the execution of these sale-leaseback transactions, we fill a need for our customers by providing them a source of long‑term capital that enables them to avoid the need to incur debt and/or employ equity in order to finance the real estate that is essential to their business.
We are a Maryland corporation organized as an internally managed real estate investment trust, or REIT. As a REIT, we will generally not be subject to federal income tax to the extent that we distribute all of our taxable income to our stockholders and meet other requirements.
On December 22, 2017, the Tax Cuts and Jobs Act (“TCJA”) was signed into law. The TCJA made significant changes to the U.S. federal income tax laws applicable to individuals and corporations, including REITs and their shareholders, generally effective for tax years beginning after December 31, 2017. We believe our analysis and computations of the tax effects of the TCJA (including issued guidance) are properly reflected in our financial statements. Future technical corrections or other amendments to the TCJA or administrative guidance interpreting the TCJA may increase the uncertainty as to the long-term effect of the TCJA on us.
Our shares of common stock have been listed on the New York Stock Exchange since our initial public offering, or IPO, in November 2014 and trade under the ticker symbol “STOR.”
Since our inception in 2011, we have selectively originated over $8.3 billion of real estate investments. As of December 31, 2018, our investment portfolio totaled approximately $7.6 billion, consisting of investments in 2,255 property locations across 49 states. All of the real estate we acquire is held by our wholly owned subsidiaries, many of which are special purpose bankruptcy remote entities formed to facilitate the financing of our real estate. We predominantly acquire our single‑tenant properties directly from our customers in sale‑leaseback transactions where our customers sell us their operating properties and then simultaneously enter into long‑term triple‑net leases with us to lease the properties back. Accordingly, our properties are fully occupied and under lease from the moment we acquire them.
We generate our cash from operations primarily through the monthly lease payments, or “base rent”, we receive from our customers under their long‑term leases with us. We also receive interest payments on loans receivable, which are a small part of our portfolio. We refer to the monthly scheduled lease and interest payments due from our customers as “base rent and interest”. Most of our leases contain lease escalations every year or every several years that are based on the lesser of the increase in the Consumer Price Index or a stated percentage (if such contracts are expressed on an annual basis, currently averaging approximately 1.8%), which allows the monthly lease payments we receive to increase somewhat in an inflationary economic environment. As of December 31, 2018, approximately 98% of our leases (based on annualized base rent) were “triple-net” leases, which means that our customers are responsible for all of the operating costs
such as maintenance, insurance and property taxes associated with the properties they lease from us, including any increases in those costs that may occur as a result of inflation. The remaining leases have some landlord responsibilities, generally related to maintenance and structural component replacement that may be required on such properties in the future, although we do not currently anticipate incurring significant capital expenditures or property costs under such leases. Because our properties are single‑tenant properties, almost all of which are under long‑term leases, it is not necessary for us to perform any significant ongoing leasing activities on our properties. As of December 31, 2018, the weighted average remaining term of our leases (calculated based on annualized base rent) was approximately 14 years, excluding renewal options, which are exercisable at the option of our tenants upon expiration of their base lease term. Leases approximating 99% of our base rent as of that date provide for tenant renewal options (generally two to four five‑year options) and leases approximating 11% of our base rent provide our tenants the option, at their election, to purchase the property from us at a specified time or times (generally at the greater of the then‑fair market value or our cost).
We have dedicated an internal team to review and analyze ongoing tenant financial performance, both at the corporate level and at each property we own, in order to identify properties that may no longer be part of our long-term strategic plan. As part of that continuous active-management process, we may decide to sell properties where we believe the property no longer fits within our plan. Because generally we have been able to originate assets at lease rates above the online commercial real estate auction marketplace, we have been able to sell these assets on both opportunistic and strategic bases, typically for a gain. This gain acts to partially offset any possible losses we may experience in the real estate portfolio.
Liquidity and Capital Resources
At the beginning of 2018, our real estate investment portfolio totaled $6.2 billion, consisting of investments in 1,921 property locations with base rent and interest due from our customers aggregating approximately $41.8 million per month, excluding future rent payment escalations. By December 31, 2018, our investment portfolio had grown to approximately $7.6 billion, consisting of investments in 2,255 property locations with base rent and interest due from our customers aggregating approximately $51.2 million per month. Substantially all of our cash from operations is generated by our investment portfolio.
Our primary cash expenditures are the principal and interest payments we make on the debt we use to finance our real estate investment portfolio and the general and administrative expenses of managing the portfolio and operating our business. Since substantially all of our leases are triple net, our tenants are generally responsible for the maintenance, insurance and property taxes associated with the properties they lease from us. When a property becomes vacant through a tenant default or expiration of the lease term with no tenant renewal, we incur the property costs not paid by the tenant, as well as those property costs accruing during the time it takes to locate a substitute tenant or sell the property. The lease contracts related to just six of our properties are due to expire during 2019; 84% of our leases have ten years or more remaining in their base lease term. As of December 31, 2018, eight of our 2,255 properties were vacant and not subject to a lease, which represents a 99.6% occupancy rate. We expect to incur some property costs from time to time in periods during which properties that become vacant are being remarketed. In addition, we may recognize an expense for certain property costs, such as real estate taxes billed in arrears, if we believe the tenant is likely to vacate the property before making payment on those obligations. The amount of such property costs can vary quarter to quarter based on the timing of property vacancies and the level of underperforming properties; however, we do not anticipate that such costs will be significant to our operations.
We intend to continue to grow through additional real estate investments. To accomplish this objective, we must identify real estate acquisitions that are consistent with our underwriting guidelines and raise future additional capital to make such acquisitions. We acquire real estate with a combination of debt and equity capital and with cash from operations that is not otherwise distributed to our stockholders in the form of dividends. When we sell properties, we generally reinvest the cash proceeds from those sales in new property acquisitions. We also periodically commit to fund the construction of new properties for our customers or to provide them funds to improve and/or renovate properties we lease to them. These additional investments will generally result in increases to the rental revenue or interest income due under the related contracts. As of December 31, 2018, we had commitments to our customers to fund improvements to owned or mortgaged real estate properties totaling approximately $78.5 million, of which $72.5 million is expected to be funded in the next twelve months.
Financing Strategy
Our debt capital is initially provided on a short-term, temporary basis through a multi-year, variable‑rate unsecured revolving credit facility with a group of banks. We manage our long-term leverage position through the strategic and economic issuance of long-term fixed-rate debt on both a secured and unsecured basis. By matching the expected cash inflows from our long‑term real estate leases with the expected cash outflows of our long‑term fixed‑rate debt, we “lock in”, for as long as is economically feasible, the expected positive difference between our scheduled cash inflows on the leases and the cash outflows on our debt payments. By locking in this difference, or spread, we seek to reduce the risk that increases in interest rates would adversely impact our profitability. In addition, we may use various financial instruments designed to mitigate the impact of interest rate fluctuations on our cash flows and earnings, including hedging strategies such as interest rate swaps and caps, depending on our analysis of the interest rate environment and the costs and risks of such strategies. We also ladder our debt maturities in order to minimize the gap between our free cash flow, or cash from operations less dividends, and our annual debt maturities.
As of December 31, 2018, all of our long‑term debt was fixed‑rate debt or was effectively converted to a fixed‑rate for the term of the debt and our weighted average debt maturity was 6.2 years. As part of our long-term debt strategy, we develop and maintain broad access to multiple debt sources. We believe that having access to multiple debt markets increases our financing flexibility because different debt markets may attract different kinds of investors, thus expanding our access to a larger pool of potential debt investors. Also, a particular debt market may be more competitive than another at any particular point in time.
The long-term debt we have issued to date is comprised of both secured non-recourse borrowings, the vast majority of which is investment-grade rated, and senior investment-grade unsecured borrowings. During 2017, we received a rating of Baa2, stable outlook, from Moody’s Investors Service and we are currently rated BBB, stable outlook, by both S&P Global Ratings and Fitch Ratings. In conjunction with our investment-grade debt strategy, we target a level of debt net of cash and cash equivalents that approximates 5½ to 6 times our estimated annualized amount of earnings (excluding gains on sales of real estate and provisions for impairment) before interest, taxes, depreciation and amortization (based on our current investment portfolio).
Our secured non-recourse borrowings are obtained through multiple debt markets – primarily the asset-backed securities debt market. The vast majority of our secured non-recourse borrowings were made through an investment-grade-rated debt program we designed, which we call our Master Funding debt program. By design, this program provides flexibility not commonly found in most secured non-recourse debt and which is described in Non-recourse Secured Debt below. To a lesser extent, we may also obtain fixed-rate non‑recourse mortgage financing through the commercial mortgage-backed securities debt market or from banks and insurance companies secured by specific properties we pledge as collateral.
Our goal is to employ a prudent blend of secured non-recourse debt through our flexible Master Funding debt program, paired with senior unsecured debt that uses our investment grade credit ratings. By balancing the mix of secured and unsecured debt, we can effectively leverage those properties subject to the secured debt in the range of 60%-70% and, at the same time, target a more conservative level of overall corporate leverage by maintaining a large pool of properties that are unencumbered. As of December 31, 2018, our secured non-recourse borrowings had a weighted average loan-to-cost ratio of approximately 68% and approximately 39% of our investment portfolio serves as collateral for this long-term debt. The remaining 61% of our portfolio properties, aggregating approximately $4.6 billion at December 31, 2018, are unencumbered and this unencumbered pool of properties provides us the flexibility to access long-term unsecured borrowings. The result is that our growing unencumbered pool of properties can provide higher levels of debt service coverage on the senior unsecured debt than would be the case if we employed only unsecured debt at our overall corporate leverage level. We believe this debt strategy can lead to a lower cost of capital for the Company, especially now that we can issue AAA rated debt from our Master Funding debt program, as described further below.
The availability of debt to finance commercial real estate in the United States can, at times, be impacted by economic and other factors that are beyond our control. An example of adverse economic factors occurred during the recession of 2007 to 2009 when availability of debt capital for commercial real estate was significantly curtailed. We seek to reduce the risk that long‑term debt capital may be unavailable to us by maintaining the flexibility to issue long-term debt in multiple debt capital markets, both secured and unsecured, and by limiting the period between the time we acquire our
real estate and the time we finance our real estate with long‑term debt. In addition, we have arranged our unsecured revolving credit facility to have a multi‑year term with extension options in order to reduce the risk that short‑term real estate financing would not be available to us. As we grow our real estate portfolio, we also intend to manage our debt maturities to reduce the risk that a significant amount of our debt will mature in any single year in the future. Because our long-term secured debt generally requires monthly payments of principal, in addition to the monthly interest payments, the resulting principal amortization also reduces our refinancing risk upon maturity of the debt. As our outstanding debt matures, we may refinance the maturing debt as it comes due or choose to repay it using cash and cash equivalents or our unsecured revolving credit facility. For example, in August 2017, we prepaid, without penalty, our first issuance of STORE Master Funding notes (Series 2012-1, Class A notes, originally scheduled to mature in August 2019), which bore an interest rate of 5.77% and had an outstanding balance of $198.6 million at the time of prepayment. During 2018, we also repaid two maturing secured notes payable totaling approximately $24.0 million which had a weighted average interest rate of 5.1%. As part of the STORE Master Funding Series 2018-1 notes issuance discussed further below, we prepaid, without penalty, an aggregate of $233.3 million of STORE Master Funding Series 2013-1 and Series 2013-2 Class A-1 notes that were scheduled to mature in 2020. Aside from one $100 million extendable bank term loan scheduled to mature in March 2019, there are now no other significant debt maturities until 2021. Similar to these STORE Master Funding prepayments described above, we may prepay other existing long-term debt in circumstances where we believe it would be economically advantageous to do so.
Unsecured Revolving Credit Facility
Typically, we use our unsecured revolving credit facility to acquire our real estate properties, until those borrowings are sufficiently large to warrant the economic issuance of long-term fixed-rate debt, the proceeds from which we use to repay the amounts outstanding under our revolving credit facility. At December 31, 2018, we had $135.0 million of borrowings outstanding under our unsecured credit facility.
In February 2018, we expanded our unsecured credit facility from $500 million to $600 million and increased the accordion feature from $300 million to $800 million, which gives us a maximum borrowing capacity of $1.4 billion. The amended facility matures in February 2022 and includes two six-month extension options, subject to certain conditions. Borrowings under the amended facility require monthly payments of interest at a rate selected by us of either (1) LIBOR plus a credit spread ranging from 0.825% to 1.55%, or (2) the Base Rate, as defined in the credit agreement, plus a credit spread ranging from 0.00% to 0.55%. The credit spread used is based on our credit rating as defined in the credit agreement. We are also required to pay a facility fee on the total commitment amount ranging from 0.125% to 0.30%. The currently applicable credit spread for LIBOR-based borrowings is 1.00% and the facility fee is 0.20%.
Under the terms of the amended facility, we are subject to various restrictive financial and nonfinancial covenants which, among other things, require us to maintain certain leverage ratios, cash flow and debt service coverage ratios, secured borrowing ratios and a minimum level of tangible net worth. Certain of these ratios are based on our pool of unencumbered assets, which aggregated approximately $4.6 billion at December 31, 2018. The facility is recourse to us and, as of December 31, 2018, we were in compliance with the financial and nonfinancial covenants under the facility.
Senior Unsecured Term Debt
In March 2018, we completed our inaugural issuance of underwritten public notes in an aggregate principal amount of $350.0 million. These senior unsecured notes, which were issued at 99.515% of their principal amount, are due in March 2028 and bear a coupon rate of 4.50%; interest will be paid semi-annually in March and September of each year. In January 2018, we entered into a treasury-lock agreement, which limited our exposure to increases in the 10-year treasury rate until the time the notes were issued; we received a $4.3 million cash payment from the counterparty upon settlement of the agreement in March 2018, reducing the effective yield on these public notes to approximately 4.4%. The supplemental indenture governing these public notes contains various restrictive covenants, including limitations on our ability to incur additional secured and unsecured indebtedness. As of December 31, 2018, we were in compliance with these covenants. Prior to this initial issuance of public debt, our unsecured long-term debt had been issued through the private placement of notes to institutional investors and through groups of lenders who also participate in our unsecured revolving credit facility; the financial covenants of the privately placed notes and bank term loans are similar to our unsecured credit facility. The aggregate outstanding principal amount of our unsecured senior notes and term loans payable
was $925 million as of December 31, 2018.
Non-recourse Secured Debt
As of December 31, 2018, approximately 35% of our real estate investment portfolio served as collateral for outstanding borrowings under our STORE Master Funding debt program. We believe our STORE Master Funding program allows for flexibility not commonly found in non-recourse debt, often making it preferable to traditional debt issued in the commercial mortgage-backed securities market. Under the program, STORE serves as both master and special servicer for the collateral pool, allowing for active portfolio monitoring and prompt issue resolution. In addition, features of the program allowing for the sale or substitution of collateral, provided certain criteria are met, facilitate active portfolio management. Through this debt program, we arrange for bankruptcy remote, special purpose entity subsidiaries to issue multiple series of investment‑grade asset‑backed net‑lease mortgage notes, or ABS notes, from time to time as additional collateral is added to the collateral pool and leverage can be added in incremental issuances based on the value of the collateral pool.
The ABS notes are generally issued by our wholly owned special purpose entity subsidiaries to institutional investors through the asset‑backed securities market. These ABS notes are typically issued in two classes, Class A and Class B. At the time of issuance, the Class A notes represent approximately 70% of the appraised value of the underlying real estate collateral owned by the issuing subsidiaries and are currently rated AAA or A+ by S&P Global Ratings. The Class B notes, which are subordinated to the Class A notes as to principal repayment, represent approximately 5% of the appraised value of the underlying real estate collateral and are currently rated BBB by S&P Global Ratings. We have historically retained the Class B notes of each series, which aggregated $147.0 million in principal amount outstanding at December 31, 2018 and are held by one of our bankruptcy remote, special purpose entity subsidiaries. The Class B notes are not reflected in our financial statements because they eliminate in consolidation. Since the Class B notes are considered issued and outstanding, they provide us with additional financial flexibility in that we may sell them to a third party in the future or use them as collateral for short‑term borrowings as we have done from time to time in the past.
On October 22, 2018, our consolidated special purpose entities issued the eighth series, Series 2018-1, of net-lease mortgage notes under the STORE Master Funding debt program consisting of $592 million of notes issued in four classes as summarized below:
| | | | | | | | | | |
Class | | Rating (a) | | Amount
(in millions) | | Coupon Rate | | Maturity Date |
Class A-1 | | AAA | | $ | 150.0 | | 3.96 | % | | Oct. 2024 |
Class A-2 | | AAA | | | 228.0 | | 4.29 | % | | Oct. 2027 |
Class A-3 | | A+ | | | 50.0 | | 4.40 | % | | Oct. 2024 |
Class A-4 | | A+ | | | 164.0 | | 4.74 | % | | Oct. 2027 |
Total | | | | $ | 592.0 | | | | | |
| (a) | | By S&P Global Ratings. |
The Series 2018-1 transaction marked our inaugural issuance of AAA rated notes and we believe it broadens the market for our STORE Master Funding debt program and gives us access to lower cost secured debt. The net proceeds from the issuance of the Class A notes were primarily used to pay down outstanding balances on our credit facility and to prepay, without penalty, STORE Master Funding Series 2013-1 and Series 2013-2 Class A-1 notes aggregating approximately $233.3 million at the time of prepayment; these notes were scheduled to mature in 2020 and bore interest rates of 4.16% and 4.37%, respectively.
The ABS notes outstanding at December 31, 2018 totaled $1.9 billion in Class A principal amount and were supported by a collateral pool of approximately $2.7 billion representing 980 property locations operated by 177 customers. The amount of debt that can be issued in any new series is determined by the structure of the transaction and the aggregate amount of collateral in the pool at the time of issuance. In addition, the issuance of each new series of notes is subject to the satisfaction of several conditions, including that there is no event of default on the existing note series and that the issuance will not result in an event of default on, or the credit rating downgrade of, the existing note series.
A significant portion of our cash flow is generated by the special purpose entities comprising our STORE Master Funding debt program. For the year ended December 31, 2018, excess cash flow, after payment of debt service and servicing and trustee expenses, totaled $114 million on cash collections of $217 million, which represents an overall ratio of cash collections to debt service, or debt service coverage ratio (as defined in the STORE Master Funding program documents), of greater than 2 to 1 on the STORE Master Funding program. If at any time the debt service coverage ratio generated by the collateral pool is less than 1.3 to 1, excess cash flow from the STORE Master Funding entities will be deposited into a reserve account to be used for payments to be made on the net‑lease mortgage notes, to the extent there is a shortfall. We anticipate that the debt service coverage ratio for the STORE Master Funding program will remain well above program minimums.
To a lesser extent, we also may obtain debt in discrete transactions through other bankruptcy remote, special purpose entity subsidiaries, which debt is solely secured by specific real estate assets and is generally non‑recourse to us (subject to certain customary limited exceptions). These discrete borrowings are generally in the form of traditional mortgage notes payable, with principal and interest payments due monthly and balloon payments due at their respective maturity dates, which typically range from seven to ten years from the date of issuance. Our secured borrowings contain various covenants customarily found in mortgage notes, including a limitation on the issuing entity’s ability to incur additional indebtedness on the underlying real estate. Certain of the notes also require the posting of cash reserves with the lender or trustee if specified coverage ratios are not maintained by the special purpose entity or the tenant. During 2017, two properties that secured a $12.9 million note payable became vacant and did not generate cash flow to cover the debt service. During early 2018, we reached an agreement with the special servicer regarding this note and surrendered the collateral properties in exchange for the release of the indebtedness, including any accrued interest, encumbering them. During the second quarter of 2018, we sold a property securing one of our mortgage notes payable and the buyer of the property assumed the $20.8 million non-recourse note outstanding at the time of sale.
Debt Summary
As of December 31, 2018, our aggregate secured and unsecured long‑term debt had an outstanding principal balance of $3.0 billion, a weighted average maturity of 6.2 years and a weighted average interest rate of 4.4%. The following is a summary of the outstanding balance of our borrowings as well as a summary of the portion of our real estate investment portfolio that is either pledged as collateral for these borrowings or is unencumbered as of December 31, 2018:
| | | | | | | | | | | | | |
| | | | | Gross Investment Portfolio Assets | |
| | | | | Special Purpose | | | | | | | |
| | Outstanding | | Entity | | All Other | | | | |
(In millions) | | Borrowings | | Subsidiaries | | Subsidiaries | | Total | |
STORE Master Funding net-lease mortgage notes payable | | $ | 1,869 | | $ | 2,674 | | $ | — | | $ | 2,674 | |
Other mortgage notes payable | | | 169 | | | 303 | | | — | | | 303 | |
Unsecured notes and term loans payable | | | 925 | | | — | | | — | | | — | |
Unsecured credit facility | | | 135 | | | — | | | — | | | — | |
Total debt | | | 3,098 | | | 2,977 | | | — | | | 2,977 | |
Unencumbered real estate assets | | | — | | | 3,626 | | | 1,002 | | | 4,628 | |
| | $ | 3,098 | | $ | 6,603 | | $ | 1,002 | | $ | 7,605 | |
Our decision to use either senior unsecured term debt, STORE Master Funding or other non‑recourse traditional mortgage loan borrowings depends on our view of the most strategic blend of unsecured versus secured debt that is needed to maintain our targeted level of overall corporate leverage as well as on borrowing costs, debt terms, debt flexibility and the tenant and industry diversification levels of our real estate assets. As we continue to acquire real estate, we expect to balance the overall degree of leverage on our portfolio by growing our pool of portfolio assets that are unencumbered. Our growing pool of unencumbered assets will increase our financial flexibility by providing us with assets that can support senior unsecured financing or that can serve as substitute collateral for existing debt. Should market factors, which are beyond our control, adversely impact our access to these debt sources at economically feasible rates, our ability to grow through additional real estate acquisitions will be limited to any undistributed amounts available from our operations and any additional equity capital raises.
Equity
We access the equity markets in various ways, such as follow-on stock offerings as well as, in 2017, a private placement of 18.6 million shares of our common stock to a wholly owned subsidiary of Berkshire Hathaway. In September 2016, we established our first “at the market” equity distribution program, or ATM program, pursuant to which, from time to time, we may offer and sell registered shares of our common stock through a group of banks acting as our sales agents. Under the program established in September 2016, we could offer and sell up to a maximum amount of $400 million of common stock (the 2016 ATM Program). In February 2018, we established a $500 million ATM program (the 2018-1 ATM Program) and terminated the 2016 ATM Program. In November 2018, we established a $750 million ATM program (the 2018-2 ATM Program) and terminated the 2018-1 ATM Program.
The following tables outline the common stock issuances under these programs (in millions except share and per share information):
| | | | | | | | | | | | | | | | |
| Year Ended December 31, 2018 |
ATM Program | Shares Sold | | Weighted Average Price per Share | | Gross Proceeds | | Sales Agents' Commissions | | Other Offering Expenses | | Net Proceeds |
$750 million 2018-2 ATM Program | 8,232,742 | | $ | 29.78 | | $ | 245.1 | | $ | (3.7) | | $ | (0.3) | | $ | 241.1 |
$500 million 2018-1 ATM Program | 18,536,871 | | $ | 26.95 | | | 499.6 | | | (7.5) | | | (0.6) | | | 491.5 |
$400 million 2016 ATM Program | 355,946 | | $ | 25.92 | | | 9.2 | | | (0.1) | | | — | | | 9.1 |
Total | 27,125,559 | | $ | 27.79 | | $ | 753.9 | | $ | (11.3) | | $ | (0.9) | | $ | 741.7 |
| | | | | | | | | | | | | | | | |
| Inception of Program Through December 31, 2018 |
ATM Program | Shares Sold | | Weighted Average Price per Share | | Gross Proceeds | | Sales Agents' Commissions | | Other Offering Expenses | | Net Proceeds |
$750 million 2018-2 ATM Program | 8,232,742 | | $ | 29.78 | | $ | 245.1 | | $ | (3.7) | | $ | (0.3) | | $ | 241.1 |
$500 million 2018-1 ATM Program | 18,536,871 | | $ | 26.95 | | | 499.6 | | | (7.5) | | | (0.6) | | | 491.5 |
$400 million 2016 ATM Program | 12,195,601 | | $ | 26.15 | | | 318.9 | | | (4.8) | | | (0.9) | | | 313.2 |
Total | 38,965,214 | | $ | 27.30 | | $ | 1,063.6 | | $ | (16.0) | | $ | (1.8) | | $ | 1,045.8 |
Cash Flows
Substantially all of our cash from operations is generated by our investment portfolio. As shown in the following table, net cash provided by operating activities in 2018 increased by $82.3 million over the $309.4 million reported in 2017, which had increased $63.1 million reported over the $246.3 million reported in 2016, primarily due to the increase in the size of our real estate investment portfolio, which generated additional rent and interest revenues. The 2018 operating cash flows include a $4.3 million payment received in settlement of a treasury lock agreement in the first quarter. Investment activity in real estate, loans and direct financing receivables during 2018 was $232.3 million higher than in 2017 which was $173.1 million higher than 2016 and was primarily funded, in all years, with a combination of cash from operations, proceeds from the sale of real estate properties, proceeds from the issuance of long-term debt and proceeds from the issuance of stock. Net cash provided by financing activities was higher for 2018 as compared to 2017. Net activity on our credit facility during 2018 was a net repayment of $155.0 million as compared to net short-term borrowings of $242.0 million in 2017. During 2018, our net proceeds from the issuance of long-term debt were $924.6 million as compared to $232.2 million in 2017. Long-term debt repayments were $283.8 million in 2018 or $45.8 million higher than 2017; both 2018 and 2017 repayment activity include prepayments of STORE Master Funding debt as noted earlier. In recent years, we have funded a larger portion of our acquisitions with proceeds from equity offerings as compared to debt issuances, net of debt payments, as part of our overall strategy to reduce leverage. Additionally, we paid dividends to our stockholders totaling $255.6 million in 2018, $209.9 million in 2017 and $162.6 million in 2016. Our quarterly dividend was increased by 6.9% in the third quarter of 2017 to an annualized $1.24 per common share. We also increased our quarterly dividend in the third quarter of 2018 by 6.5% to an annualized $1.32 per common share.
| | | | | | | | | | |
| | Year Ended December 31, | |
(In thousands) | | 2018 | | 2017 | | 2016 | |
Net cash provided by operating activities | | $ | 391,678 | | $ | 309,425 | | $ | 246,304 | |
Net cash used in investing activities | | | (1,367,038) | | | (1,100,871) | | | (1,130,373) | |
Net cash provided by financing activities | | | 969,199 | | | 767,458 | | | 873,797 | |
Net decrease in cash, cash equivalents and restricted cash | | | (6,161) | | | (23,988) | | | (10,272) | |
Cash, cash equivalents and restricted cash, beginning of period | | | 49,178 | | | 73,166 | | | 83,438 | |
Cash, cash equivalents and restricted cash, end of period | | $ | 43,017 | | $ | 49,178 | | $ | 73,166 | |
| | | | | | | | | | |
Reconciliation of cash, cash equivalents and restricted cash: | | | | | | | | | | |
Cash and cash equivalents | | $ | 27,511 | | $ | 42,937 | | $ | 54,200 | |
Restricted cash included in other assets | | | 15,506 | | | 6,241 | | | 18,966 | |
Total cash, cash equivalents and restricted cash | | $ | 43,017 | | $ | 49,178 | | $ | 73,166 | |
Management believes that the cash generated by our operations, our current borrowing capacity on our revolving credit facility and our access to long‑term debt capital, will be sufficient to fund our operations for the foreseeable future and allow us to acquire the real estate for which we currently have made commitments. In order to continue to grow our real estate portfolio in the future beyond the excess cash generated by our operations and our ability to borrow, we intend to raise additional equity capital through the sale of our common stock.
Off‑Balance Sheet Arrangements
We have no off‑balance sheet arrangements as of December 31, 2018.
Contractual Obligations
The following table provides information with respect to our contractual commitments as of December 31, 2018, including any guaranteed or minimum commitments under contractual obligations.
| | | | | | | | | | | | | | | | |
| | | | | Payment Due by Period | |
| | | | | | | | | | | | | | More than | |
| | | | | 1 year | | 1 - 3 years | | 3 - 5 years | | 5 years | |
(In thousands) | | Total | | (2019) | | (2020 - 2021) | | (2022 - 2023) | | (after 2023) | |
Credit facility (1) | | $ | 135,000 | | $ | — | | $ | — | | $ | 135,000 | | $ | — | |
Long-term debt obligations (secured and unsecured): | | | | | | | | | | | | | | | | |
Principal | | | 2,962,871 | | | 135,311 | | | 353,108 | | | 513,303 | | | 1,961,149 | |
Interest | | | 795,196 | | | 127,240 | | | 240,028 | | | 204,324 | | | 223,604 | |
Commitments to customers (2) | | | 78,488 | | | 72,543 | | | 5,945 | | | — | | | — | |
Operating ground lease obligations paid by STORE Capital | | | 3,260 | | | 29 | | | 62 | | | 62 | | | 3,107 | |
Operating ground lease obligations paid by STORE Capital's tenants (3) | | | 44,810 | | | 2,028 | | | 3,286 | | | 3,039 | | | 36,457 | |
Corporate office operating lease obligation | | | 6,756 | | | 735 | | | 1,510 | | | 1,566 | | | 2,945 | |
Total | | $ | 4,026,381 | | $ | 337,886 | | $ | 603,939 | | $ | 857,294 | | $ | 2,227,262 | |
| (1) | | As of December 31, 2018, balances on our $600 million credit facility bear interest at one-month LIBOR plus a credit rating-based credit spread of 1.00%. We also pay a facility fee on the total commitment amount of 0.20%. |
| (2) | | Represents our commitments to fund improvements to real estate properties previously acquired or mortgaged; these construction improvement commitments are similar to property acquisitions or new loans as they will result in increases to rental revenue or interest income due under the related contracts. |
| (3) | | STORE Capital’s tenants, who are generally sub-tenants under the ground leases, are responsible for paying the rent under these ground leases. In the event the tenant fails to pay the ground lease rent, we would be primarily responsible for the payment, assuming we do not re-tenant the property or sell the leasehold interest. Of the total $44.8 million commitment, $16.8 million is due for periods beyond the current term of our leases with the tenants. Excludes contingent rent due under three leases where the ground lease payment, or a portion thereof, is based on the level of the tenant’s sales. |
Recently Issued Accounting Pronouncements
See Note 2 to the December 31, 2018 consolidated financial statements.
Critical Accounting Policies and Estimates
Our discussion and analysis of our historical financial condition and results of operations is based upon our consolidated financial statements, which are prepared in accordance with U.S. generally accepted accounting principles, or GAAP. The preparation of financial statements in conformity with GAAP requires management to make estimates and assumptions that affect the reported amounts of assets and liabilities, the disclosure of contingent assets and liabilities and the reported amounts of revenues and expenses during the reporting period. Although management believes its estimates are reasonable, actual results could differ materially from those estimates. The accounting policies discussed below are considered critical because changes to certain judgments and assumptions inherent in these policies could affect the financial statements. For more information on our accounting policies, please refer to the notes to our consolidated financial statements.
Accounting for Real Estate Investments
We record the acquisition of real estate properties at cost, including acquisition and closing costs. We allocate the cost of real estate properties to the tangible and intangible assets and liabilities acquired based on their estimated relative fair values. Intangible assets and liabilities acquired may include the value of existing in-place leases, above-market or below-market lease value of in-place leases and ground lease intangibles, as applicable. Management uses multiple sources to estimate fair value, including independent appraisals and information obtained about each property as a result of its pre‑acquisition due diligence and its marketing and leasing activities.
Properties classified as held for sale are recorded at the lower of the carrying value or the fair value, less anticipated closing costs.
Lease Intangibles
In‑place lease intangibles are valued based on management’s estimates of lost rent and carrying costs during the time it would take to locate a tenant if the property were vacant, considering current market conditions and costs to execute similar leases. In estimating lost rent and carrying costs, management considers market rents, real estate taxes, insurance, costs to execute similar leases including leasing commissions and other related costs. The value assigned to in‑place leases is amortized on a straight‑line basis as a component of depreciation and amortization expense typically over the remaining term of the related leases.
The fair value of any above‑market and below‑market leases is estimated based on the present value of the difference between the contractual amounts to be paid pursuant to the in‑place lease and management’s estimate of current market lease rates for the property, measured over a period equal to the remaining term of the lease. Capitalized above‑market lease intangibles are amortized over the remaining term of the respective leases as a decrease to rental revenue. Below‑market lease intangibles are amortized as an increase in rental revenue over the remaining term of the respective leases plus the fixed‑rate renewal periods on those leases, if any. Should a lease terminate early, the unamortized portion of any related lease intangible is immediately recognized in operations.
Loans and Direct Financing Receivables
We hold our loans receivable for long‑term investment. Loans receivable are carried at amortized cost, including related unamortized discounts or premiums, if any. Certain of our real estate investment transactions are accounted for as direct financing leases. We record the direct financing receivables at their net investment, determined as the aggregate minimum lease payments and the estimated residual value of the leased property less unearned income. The unearned income is recognized over the life of the related contracts so as to produce a constant rate of return on the net investment in the asset.
Impairment
We review our real estate investments and related lease intangibles periodically for impairment whenever events or changes in circumstances indicate that the carrying amount of an asset may not be recoverable. Management considers factors such as expected future undiscounted cash flows, estimated residual value, market trends (such as the effects of leasing demand and competition) and other factors in making this assessment. An asset is considered impaired if the carrying value of the asset exceeds its estimated undiscounted cash flows, and the impairment is calculated as the amount by which the carrying value of the asset exceeds its estimated fair value. Estimating future cash flows is highly subjective and such estimates could differ materially from actual results.
We periodically evaluate the collectibility of our loans receivable, including accrued interest, by analyzing the underlying property‑level economics and trends, collateral value and quality and other relevant factors in determining the adequacy of our allowance for loan losses. A loan is determined to be impaired when, in management’s judgment based on current information and events, it is probable that we will be unable to collect all amounts due according to the contractual terms of the loan agreement. Specific allowances for loan losses are provided for impaired loans on an individual loan basis in the amount by which the carrying value exceeds the estimated fair value of the underlying collateral less disposition costs.
Revenue Recognition
We lease real estate to our tenants under long‑term net leases that are predominantly classified as operating leases. Direct costs associated with lease origination, offset by any lease origination fees received, are deferred and amortized over the related lease term as an adjustment to rental revenue. We periodically commit to fund construction of new properties for our customers; rental revenue collected during the construction period is deferred and amortized over the remaining lease term when the construction project is complete. Substantially all of the leases are triple‑net, which provide that the lessees are responsible for the payment of all property operating expenses, including property taxes, maintenance and insurance.
Our leases generally provide for rent escalations throughout the lease terms. For leases that provide for specific contractual escalations, rental revenue is recognized on a straight‑line basis so as to produce a constant periodic rent over the term of the lease. Accordingly, accrued rental revenue, calculated as the aggregate difference between the rental revenue recognized on a straight‑line basis and scheduled rents, represents unbilled rent receivables that we will receive only if the tenants make all rent payments required through the expiration of the lease. We provide an estimated reserve for uncollectible straight‑line rental revenue based on management’s assessment of the risks inherent in those lease contracts, giving consideration to industry default rates for long‑term receivables. Leases that have contingent rent escalators indexed to future increases in the CPI may adjust over a one‑year period or over multiple‑year periods. Generally, these escalators increase rent at the lesser of (a) 1 to 1.25 times the increase in the CPI over a specified period or (b) a fixed percentage. Because of the volatility and uncertainty with respect to future changes in the CPI, our inability to determine the extent to which any specific future change in the CPI is probable at each rent adjustment date during the entire term of these leases and our view that the multiplier does not represent a significant leverage factor, increases in rental revenue from leases with this type of escalator are recognized only after the changes in the rental rates have actually occurred. For leases that have contingent rentals that are based on a percentage of the tenant’s gross sales, we recognize contingent rental revenue when the threshold upon which the contingent lease payment is based is actually reached.
We suspend revenue recognition if the collectibility of amounts due pursuant to a lease is not reasonably assured or if the tenant’s monthly lease payments become more than 60 days past due, whichever is earlier. In the event that the collectibility of a receivable with respect to any tenant is in doubt, a provision for uncollectible amounts will be established or a direct write‑off of the specific rent receivable will be made.
We recognize interest income on loans receivable using the effective interest method applied on a loan‑by‑loan basis. Direct costs associated with originating loans are offset against any related fees received and the balance, along with any premium or discount, is deferred and amortized as an adjustment to interest income over the term of the related loan receivable using the effective interest method. A loan receivable is placed on nonaccrual status when the loan has become more than 60 days past due, or earlier if management determines that full recovery of the contractually specified payments of principal and interest is doubtful. While on nonaccrual status, interest income is recognized only when received.
Share‑Based Compensation
Our directors and key employees have been granted long‑term incentive awards, including restricted stock awards (RSAs) and restricted stock unit awards (RSUs), which provide such directors and employees with equity interests as an incentive to remain in our service and to align their interests with those of our stockholders. We estimate the fair value of RSAs based on the closing price per share of the common stock on the date of grant and recognize that amount in general and administrative expense ratably over the vesting period at the greater of the amount amortized on a straight‑line basis or the amount vested. We value the RSUs with a market condition using a Monte Carlo simulation model on the date of grant and value the RSUs with a performance condition based on the fair value of the awards expected to be earned; we recognize those amounts in general and administrative expense on a tranche by tranche basis ratably over the vesting periods.
Depreciation
Our real estate portfolio is depreciated using the straight‑line method over the estimated remaining useful life of the properties, which generally ranges from 30 to 40 years for buildings and is 15 years for land improvements. Any properties classified as held for sale are not depreciated.
Income Taxes
We have made an election to qualify, and believe we are operating in a manner to continue to qualify, as a REIT for federal income tax purposes beginning with our initial taxable year ended December 31, 2011. As a REIT, we will generally not be subject to federal income taxes to the extent that we distribute all of our taxable income to our stockholders and meet other specific requirements; however, we are still subject to certain state and local income taxes and to federal income and excise tax on our undistributed income.
Derivative Instruments and Hedging Activities
We may enter into derivatives contracts as part of our overall financing strategy to manage our exposure to changes in interest rates associated with current and/or future debt issuances. We do not use derivatives for trading or speculative purposes. We record our derivatives on the balance sheet at fair value. The accounting for changes in the fair value of derivatives depends on the intended use of the derivative, whether we have elected to apply hedge accounting and whether the hedging relationship has satisfied the criteria necessary to apply hedge accounting. Derivatives qualifying as a hedge of the exposure to variability in expected future cash flows, or other types of forecasted transactions, are considered cash flow hedges. Hedge accounting generally provides for the matching of the earnings effect of the hedged forecasted transactions in a cash flow hedge.
Results of Operations
Overview
As of December 31, 2018, our real estate investment portfolio had grown to approximately $7.6 billion, consisting of investments in 2,255 property locations in 49 states, operated by over 400 customers in various industries. Approximately 95% of the real estate investment portfolio represents commercial real estate properties subject to long‑term leases, 5% represents mortgage loan and direct financing receivables primarily on commercial real estate buildings (located on land we own and lease to our customers) and a nominal amount represents loans receivable secured by our tenants’ other assets.
Year Ended December 31, 2018 Compared to Year Ended December 31, 2017
| | | | | | | | | | | |
| | Year Ended | | | | | |
| | December 31, | | Increase | | |
(In thousands) | | 2018 | | 2017 | | (Decrease) | | |
Total revenues | | $ | 540,756 | | $ | 452,847 | | $ | 87,909 | | |
Expenses: | | | | | | | | | | | |
Interest | | | 129,061 | | | 120,478 | | | 8,583 | | |
Property costs | | | 4,250 | | | 4,773 | | | (523) | | |
General and administrative | | | 45,725 | | | 40,990 | | | 4,735 | | |
Depreciation and amortization | | | 181,826 | | | 150,279 | | | 31,547 | | |
Provisions for impairment | | | 7,810 | | | 13,440 | | | (5,630) | | |
Total expenses | | | 368,672 | | | 329,960 | | | 38,712 | | |
| | | | | | | | | | | |
Gain on dispositions of real estate | | | 45,528 | | | 39,609 | | | 5,919 | | |
Income from operations before income taxes | | | 217,612 | | | 162,496 | | | 55,116 | | |
Income tax expense | | | 642 | | | 458 | | | 184 | | |
Net income | | $ | 216,970 | | $ | 162,038 | | $ | 54,932 | | |
Revenues
The increase in revenues year over year was driven primarily by the growth in the size of our real estate investment portfolio, which generated additional rental revenues and interest income. Our real estate investment portfolio grew from approximately $6.2 billion in gross investment amount representing 1,921 properties at the end of 2017 to approximately $7.6 billion in gross investment amount representing 2,255 properties at December 31, 2018. The weighted average real estate investment amounts outstanding during the years were approximately $5.6 billion in 2017 and $6.8 billion in 2018. Our real estate investments were made throughout the years presented and were not all outstanding for the entire period; accordingly, a portion of the increase in revenues between years is related to recognizing a full year of revenue in 2018 on acquisitions that were made during 2017. Similarly, the full revenue impact of acquisitions made during 2018 will not be seen until 2019. A smaller component of the increase in revenues between years is related to rent escalations recognized on our lease contracts; these rent increases can provide a strong source of revenue growth. Revenues for 2017 included a $4.6 million charge related to accelerated amortization of lease incentives associated with terminated lease contracts.
The initial rental or capitalization rates we achieve on sale‑leaseback transactions, calculated as the initial annualized base rent divided by the purchase price of the properties, vary from transaction to transaction based on many factors, such as the terms of the lease, the property type including the property’s real estate fundamentals and the market rents in the area on the various types of properties we target across the United States. The majority of our transactions are sale‑leaseback transactions where we acquire the property and simultaneously negotiate a lease directly with the tenant based on the tenant’s business needs. There are also online commercial real estate auction marketplaces for real estate transactions; properties acquired through these online marketplaces are often subject to existing leases and offered by third‑party sellers. In general, because we provide tailored customer lease solutions in sale-leaseback transactions, our lease rates historically have been higher and subject to less short-term market influences than what we have seen in the auction marketplace as a whole. In addition, since our real estate lease contracts are a substitute for both borrowings and
equity that our customers would otherwise have to commit to their real estate locations, we believe there is a relationship between lease rates and market interest rates and that lease rates are also influenced by overall capital availability. During 2018, we experienced a small increase of 0.1% in the weighted average lease rate attained on our new investments as compared to 2017, but it was in line with our experience during the latter portion of 2017. Based on our experience, our expectations for the future include the possibility that we could see flat to a slight increase in lease rates as market interest rates increase. The weighted average initial capitalization rates on the properties we acquired during 2018 was 7.9% as compared to 7.8% for properties acquired during 2017.
Interest Expense
We fund the growth in our real estate investment portfolio with excess cash flow from our operations after dividends and principal payments, net proceeds from periodic sales of real estate, net proceeds from equity issuances and proceeds from issuances of long‑term fixed-rate debt. We use our unsecured revolving credit facility to temporarily finance the properties we acquire.
The following table summarizes our interest expense for the years ended December 31, 2018 and 2017.
| | | | | | | | | |
| | For the Year Ended | | | |
| | December 31, | | | |
(Dollars in thousands) | | 2018 | | 2017 | | | |
Interest expense - credit facility | | $ | 6,009 | | $ | 2,031 | | | |
Interest expense - credit facility fees | | | 1,195 | | | 1,029 | | | |
Interest expense - long-term debt (secured and unsecured) | | | 115,763 | | | 108,682 | | | |
Capitalized interest | | | (2,641) | | | (1,242) | | | |
Gain on extinguishment of debt | | | (814) | | | — | | | |
Amortization of deferred financing costs and other | | | 9,549 | | | 9,978 | | | |
Total interest expense | | $ | 129,061 | | $ | 120,478 | | | |
Credit facility: | | | | | | | | | |
Average debt outstanding | | $ | 201,677 | | $ | 87,151 | | | |
Average interest rate during the period (excluding facility fees) | | | 3.0 | % | | 2.3 | % | | |
Long-term debt (secured and unsecured): | | | | | | | | | |
Average debt outstanding | | $ | 2,645,152 | | $ | 2,426,091 | | | |
Average interest rate during the period | | | 4.4 | % | | 4.5 | % | | |
The average amount of long-term debt outstanding was approximately $2.6 billion during 2018, up from approximately $2.4 billion in 2017, making it the primary driver for the increase in interest expense on long-term debt. This increase was slightly offset by a decrease in the weighted average interest rate of the long-term debt. During the third quarter of 2017, we prepaid approximately $198.6 million of STORE Master Funding Series 2012-1, Class A notes. These notes, which were not scheduled to mature until August 2019, bore an interest rate of 5.77% and this prepayment was largely responsible for bringing our weighted average interest rate on long-term debt down to 4.4% at the end of 2017. Long-term debt added since the end of 2017 consisted of the $350 million of 4.50% senior unsecured notes issued in March 2018 and the $592 million of STORE Master Funding Series 2018-1 notes issued in October 2018 which bear a weighted average interest rate of 4.34%. As part of the Series 2018-1 note issuance in October, we prepaid, without penalty, STORE Master Funding Series 2013-1 and Series 2013-2 Class A-1 notes aggregating approximately $233.3 million at the time of prepayment; these notes were scheduled to mature in 2020 and bore interest rates of 4.16% and 4.37%, respectively. During 2018, we also repaid two maturing secured notes payable totaling approximately $24.0 million which had a weighted average interest rate of 5.14% and, in mid-2018, one secured note payable of approximately $20.8 million which bore an interest rate of 4.36% was assumed by the purchaser of one of our real estate properties. As of December 31, 2018, we had $3.0 billion of long-term debt outstanding with a weighted average interest rate of 4.4%.
Interest expense for 2018 included a $0.8 million gain on the extinguishment of debt related to collateral assets with a net book value totaling $12.9 million which we surrendered to a lender in exchange for the forgiveness of the related debt obligations aggregating $13.7 million. Interest expense for 2018 and 2017 included $2.1 million and $2.0 million,
respectively, in accelerated amortization of deferred financing costs primarily related to the STORE Master Funding prepayments discussed above.
We use our revolving credit facility on a short-term, temporary basis to acquire real estate properties until those borrowings are sufficiently large to warrant the economic issuance of long-term fixed-rate debt, the proceeds of which we generally use to pay down the amounts outstanding under our revolving credit facility. For 2018 and 2017, average borrowings outstanding were $201.7 million and $87.2 million, respectively, and interest expense was $6.0 million and $2.0 million, respectively. Borrowing activity during 2017 was lower than 2018 as we had very limited borrowing activity during the third quarter due to the cash we had available from the June 2017 private placement of stock to a wholly owned subsidiary of Berkshire Hathaway. A portion of the increase in interest expense in 2018 versus 2017 is also due to an increase in the weighted average interest rate incurred on our borrowings due to increases in one-month LIBOR. During 2018, the average one-month LIBOR was approximately 0.9% higher than during 2017. The increase in the base interest rates was partially offset by a decrease in the credit spread on each borrowing as a result of the improved investment-grade credit ratings we received in mid-2017. The amount and timing of real estate acquisition activity and long-term debt and/or equity transactions will affect the level of borrowing activity on our credit facility.
From time to time, we may have construction activities on one or more of our real estate properties. Interest capitalized as a part of those activities represented approximately $2.6 million and $1.2 million in 2018 and 2017, respectively.
Property Costs
Approximately 98% of our leases are triple net, meaning that our tenants are generally responsible for the property-level operating costs such as taxes, insurance and maintenance. Accordingly, we generally do not expect to incur property-level operating costs or capital expenditures, except during any period when one or more of our properties is no longer under lease. Our need to expend capital on our properties is further reduced because some of our tenants will periodically refresh the property at their own expense to meet their business needs or in connection with franchisor requirements. As of December 31, 2018, we owned eight properties that were vacant and not subject to a lease and lease contracts related to just six properties we own are due to expire in 2019. We expect to incur some property costs related to the vacant properties until such time as those properties are either leased or sold.
Included in property costs in 2018 and 2017 was approximately $469,000 and $465,000, respectively, related to the amortization of ground lease interest intangibles. Property costs also include the expense of performing site inspections of our properties from time to time, as well as the property management costs of the few properties we own that have specific landlord property-level expense obligations.
As of December 31, 2018, we had 25 properties in which we have ground lease interests; five of those ground leases have been prepaid in full. Although we make the ground lease payments under one of these leases, the payment obligations for the remaining ground leases are the responsibility of our tenants operating on the properties. Through December 31, 2018, the ground lease obligations being paid directly to the ground lessor by our tenants has been presented on a net basis in our consolidated statements of income. As described in Note 2 to the consolidated financial statements, we adopted Accounting Standards Update, or ASU, No. 2016-02, Leases (Topic 842)(ASU 2016-02) in January 2019. As a result of this adoption, beginning in 2019, the obligations paid directly by our tenant to the ground lessor will be presented on a gross basis in the consolidated statement of income, both as property costs and as rental revenues. Also as a result of the adoption of ASU 2016-02, beginning in 2019, for the few lease contracts where we collect property taxes from our tenants and remit those taxes to governmental authorities, we will no longer present those property taxes on a net basis in the consolidated statements of income, but will now reflect it on a gross basis as both property tax reimbursement revenue included in rental revenue and as expense included in property costs. While we expect that these presentation changes will have little or no impact on net income, they will result in increases to property costs and rental revenues as compared to prior years’ presentations.
General and Administrative Expenses
General and administrative expenses include compensation and benefits; professional fees such as portfolio servicing, legal, accounting and rating agency fees; and general office expenses such as insurance, office rent and travel
costs. General and administrative costs totaled $45.7 million in 2018 as compared to $41.0 million in 2017 with the increase primarily due to the growth of our portfolio and related staff additions. Certain expenses, such as property‑related insurance costs and the costs of servicing the properties and loans comprising our real estate portfolio, increase in direct proportion to the increase in the size of the portfolio. During the third quarter of 2018, we transitioned the outsourced administrative portion of our portfolio servicing between service providers. These costs are variable and increase with the size of our portfolio; however, the base cost for these services is now lower. Our employee base grew from 80 employees at December 31, 2017 to 90 employees as of December 31, 2018. We expect that general and administrative expenses will continue to rise in some measure as our real estate investment portfolio grows; however, we expect that such expenses as a percentage of the portfolio will decrease over time due to efficiencies and economies of scale.
Depreciation and Amortization Expense
Depreciation and amortization expense, which increases in proportion to the increase in the size of our real estate portfolio, rose from $150.3 million in 2017 to $181.8 million in 2018.
Provisions for Impairment
During 2018, we recognized provisions for impairment aggregating $7.8 million. Of this amount, $5.2 million represented provisions for impairment of real estate and $2.6 million represented provisions for loan losses associated with two of our loans receivable. During 2017, we recognized provisions for impairment aggregating $13.4 million, of which $11.9 million represented provisions for impairment of real estate and $1.5 million represented a provision for loan losses associated with one of our loans receivable.
Gain on Dispositions of Real Estate
As part of our ongoing active portfolio management process, we sell properties from time to time in order to enhance the diversity and quality of our real estate portfolio and to take advantage of opportunities to recycle capital. During 2018, we recognized a $45.5 million aggregate net gain on the sale of 80 properties. In comparison, during 2017, we recognized a $39.6 million aggregate net gain on the sale of 55 properties. The proceeds from the dispositions of real estate during 2018 aggregated $252 million as compared to an aggregate original investment amount of $228 million. For properties sold during 2017, proceeds, including loan repayments received in conjunction with those sales, aggregated $267 million as compared to an aggregate original investment amount of $254 million.
Net Income
For the year ended December 31, 2018, our net income rose to $217.0 million, an increase from $162.0 million in 2017. Our net income rose primarily due to the growth in the size of our real estate investment portfolio, which generated additional rental revenues and interest income, and due to the increase in gains on dispositions of real estate, offset by the impact of impairments and accelerated amortization of lease incentives and deferred financing costs, all as discussed above.
Year Ended December 31, 2017 Compared to Year Ended December 31, 2016
| | | | | | | | | |
| | Year Ended | | | |
| | December 31, | | Increase |
(In thousands) | | 2017 | | 2016 | | (Decrease) |
Total revenues | | $ | 452,847 | | $ | 376,343 | | $ | 76,504 |
Expenses: | | | | | | | | | |
Interest | | | 120,478 | | | 105,180 | | | 15,298 |
Transaction costs | | | — | | | 523 | | | (523) |
Property costs | | | 4,773 | | | 4,067 | | | 706 |
General and administrative | | | 40,990 | | | 33,972 | | | 7,018 |
Selling stockholder costs | | | — | | | 800 | | | (800) |
Depreciation and amortization | | | 150,279 | | | 119,618 | | | 30,661 |
Provisions for impairment | | | 13,440 | | | 1,720 | | | 11,720 |
Total expenses | | | 329,960 | | | 265,880 | | | 64,080 |
| | | | | | | | | |
Gain on dispositions of real estate | | | 39,609 | | | 13,296 | | | 26,313 |
Income from operations before income taxes | | | 162,496 | | | 123,759 | | | 38,737 |
Income tax expense | | | 458 | | | 434 | | | 24 |
Net income | | $ | 162,038 | | $ | 123,325 | | $ | 38,713 |
Revenues
Revenues rose by 20.3% to $452.8 million for the year ended December 31, 2017 from $376.3 million for the year ended December 31, 2016, driven primarily by the growth in the size of our real estate investment portfolio, which generated additional rental revenues and interest income. Revenues for 2017 included a $4.6 million charge related to accelerated amortization of lease incentives associated with terminated lease contracts. Our real estate investment portfolio grew from approximately $5.1 billion in gross investment amount representing 1,660 properties at December 31, 2016 to approximately $6.2 billion in gross investment amount representing 1,921 properties at December 31, 2017. Our real estate investments were made throughout the years presented and were not all outstanding for the entire period. The weighted average real estate investment amounts outstanding during the years were approximately $5.6 billion in 2017 and $4.5 billion in 2016. The weighted average initial real estate capitalization rate on the properties we acquired during 2017 was 7.8% as compared to 7.9% for properties acquired during 2016.
Interest Expense
The following table summarizes our interest expense for the years ended December 31, 2017 and 2016.
| | | | | | | |
| | For the Year Ended | |
| | December 31, | |
(Dollars in thousands) | | 2017 | | 2016 | |
Interest expense - credit facility | | $ | 2,031 | | $ | 1,126 | |
Interest expense - credit facility fees | | | 1,029 | | | 1,041 | |
Interest expense - long-term debt (secured and unsecured) | | | 108,682 | | | 96,564 | |
Capitalized interest | | | (1,242) | | | (818) | |
Amortization of deferred financing costs and other | | | 9,978 | | | 7,267 | |
Total interest expense | | $ | 120,478 | | $ | 105,180 | |
Credit facility: | | | | | | | |
Average debt outstanding | | $ | 87,151 | | $ | 54,675 | |
Average interest rate during the period (excluding facility fees) | | | 2.3 | % | | 2.1 | % |
Long-term debt (secured and unsecured): | | | | | | | |
Average debt outstanding | | $ | 2,426,091 | | $ | 2,071,838 | |
Average interest rate during the period | | | 4.5 | % | | 4.7 | % |
The average amount of long-term debt outstanding was approximately $2.4 billion during 2017, up from approximately $2.1 billion in 2016, making it the primary driver for the increase in interest expense on long-term debt.
This increase was slightly offset by a decrease in the weighted average interest rate of our long-term debt as higher interest rate maturing debt was replaced with lower interest rate debt. The long-term debt added during 2017 included $100 million of unsecured bank term debt we issued in March 2017, which bears an interest rate of 2.57%, and $135 million of STORE Master Funding net‑lease mortgage notes we sold in March 2017, which bear an interest rate of 4.32%. During the third quarter of 2017, we prepaid approximately $198.6 million of STORE Master Funding Series 2012-1, Class A notes. These notes which were not scheduled to mature until August 2019, bore an interest rate of 5.77% and, as a result of the prepayment, we recognized a $2.0 million charge to interest expense for the accelerated amortization of the related deferred financing costs. As of December 31, 2017, we had $2.3 billion outstanding in long-term debt with a weighted average interest rate of 4.4%.
Interest expense, excluding facility fees, associated with our revolving credit facility increased to $2.0 million during 2017, up from $1.1 million in 2016, primarily as a result of the increase in average borrowings outstanding on our revolving credit facility which increased from $54.7 million during 2016 to $87.2 million during 2017. The increase in expense was also partially driven by an increase in the weighted average interest rate incurred on our borrowings due to increases in the facility base interest rates, primarily one-month LIBOR, during 2017. During 2017, the average one-month LIBOR was approximately 0.6% higher than during 2016.
From time to time, we may have construction activities on one or more of our real estate properties and interest capitalized as a part of those activities represented approximately $1.2 million and $0.8 million during 2017 and 2016, respectively.
Transaction Costs
Our real estate acquisitions have been predominantly sale‑leaseback transactions in which acquisition and closing costs are capitalized as part of the investment in the property. We also occasionally acquire properties subject to an existing lease and, prior to 2017, expensed transaction costs associated with these acquisitions, which were accounted for as business combinations, in the period incurred. Transaction costs expensed during 2016 totaled $0.5 million.
Property Costs
Property costs increased to $4.8 million in 2017 as compared to $4.1 million in 2016, primarily related to property taxes, insurance and maintenance costs on properties that were vacant during a portion of 2017 as well as certain property costs, such as real estate taxes billed in arrears, where we determined that our tenant may be unlikely to pay those obligations. Included in property costs in 2017 and 2016 was approximately $465,000 and $448,000, respectively, related to the amortization of ground lease interest intangibles.
General and Administrative Expenses
General and administrative costs totaled $41.0 million in 2017 as compared to $34.0 million in 2016, with the increase primarily due to the growth of our portfolio and related staff additions. Certain expenses, such as property‑related insurance costs and the costs of servicing the properties and loans comprising our real estate portfolio, increase in direct proportion to the increase in the size of the portfolio. Compensation and benefits expense increased partially due to staffing additions to support our growing investment portfolio, as well as an increase in amortization expense related to our stock-based incentive compensation program. Our employee base grew from 68 employees at December 31, 2016 to 80 employees as of December 31, 2017.
Depreciation and Amortization Expense
Depreciation and amortization expense, which increases in proportion to the increase in the size of our real estate portfolio, rose from $119.6 million in 2016 to $150.3 million in 2017.
Provisions for Impairment
During 2017, we recognized provisions for impairment aggregating $13.4 million. Of this amount, $11.9 million represented provisions for impairment of real estate and $1.5 million represented a provision for loan losses associated
with one of our loans receivable. During 2016, we recognized a $1.7 million provision for impairment of two properties sold in 2017.
Gain on Dispositions of Real Estate
During 2017, we recognized a $39.6 million aggregate net gain on the sale of 55 properties. In comparison, in 2016, we recognized an aggregate net gain of $13.3 million on the sale of 31 properties.
Net Income
For the year ended December 31, 2017, our net income rose to $162.0 million, an increase from $123.3 million in 2016. Our net income rose primarily due to the growth in the size of our real estate investment portfolio, which generated additional rental revenues and interest income, and due to the increase in gains on dispositions of real estate, offset by the impact of impairments and accelerated amortization of lease incentives and deferred financing costs, all as discussed above.
Non-GAAP Measures
Our reported results are presented in accordance with U.S. generally accepted accounting principles, or GAAP. We also disclose Funds from Operations, or FFO, and Adjusted Funds from Operations, or AFFO, both of which are non‑GAAP measures. We believe these two non‑GAAP financial measures are useful to investors because they are widely accepted industry measures used by analysts and investors to compare the operating performance of REITs. FFO and AFFO do not represent cash generated from operating activities and are not necessarily indicative of cash available to fund cash requirements; accordingly, they should not be considered alternatives to net income as a performance measure or to cash flows from operations as reported on a statement of cash flows as a liquidity measure and should be considered in addition to, and not in lieu of, GAAP financial measures.
We compute FFO in accordance with the definition adopted by the Board of Governors of the National Association of Real Estate Investment Trusts, or NAREIT. NAREIT defines FFO as GAAP net income, excluding gains (or losses) from extraordinary items and sales of depreciable property, real estate impairment losses, and depreciation and amortization expense from real estate assets, including the pro rata share of such adjustments of unconsolidated subsidiaries.
To derive AFFO, we modify the NAREIT computation of FFO to include other adjustments to GAAP net income related to certain non‑cash revenues and expenses that have no impact on our long-term operating performance, such as straight‑line rents, amortization of deferred financing costs and stock‑based compensation. In addition, in deriving AFFO, we exclude certain other costs not related to our ongoing operations, such as the amortization of lease-related intangibles.
FFO is used by management, investors and analysts to facilitate meaningful comparisons of operating performance between periods and among our peers primarily because it excludes the effect of real estate depreciation and amortization and net gains on sales, which are based on historical costs and implicitly assume that the value of real estate diminishes predictably over time, rather than fluctuating based on existing market conditions. Management believes that AFFO provides more useful information to investors and analysts because it modifies FFO to exclude certain additional non-cash revenues and expenses such as straight‑line rents, including construction period rent deferrals, and the amortization of deferred financing costs, stock‑based compensation and lease-related intangibles as such items may cause short-term fluctuations in net income but have no impact on long-term operating performance. We believe that these costs are not an ongoing cost of the portfolio in place at the end of each reporting period and, for these reasons, the portion expensed is added back when computing AFFO. As a result, we believe AFFO to be a more meaningful measurement of ongoing performance that allows for greater performance comparability. Therefore, we disclose both FFO and AFFO and reconcile them to the most appropriate GAAP performance metric, which is net income. STORE Capital’s FFO and AFFO may not be comparable to similarly titled measures employed by other companies.
The following is a reconciliation of net income (which we believe is the most comparable GAAP measure) to FFO and AFFO.
| | | | | | | | | | |
| | Year Ended December 31, | |
(In thousands) | | 2018 | | 2017 | | 2016 | |
Net Income | | $ | 216,970 | | $ | 162,038 | | $ | 123,325 | |
Depreciation and amortization of real estate assets | | | 180,851 | | | 149,556 | | | 119,079 | |
Provision for impairment of real estate | | | 5,202 | | | 11,940 | | | 1,720 | |
Gain on dispositions of real estate, net of tax (a) | | | (45,398) | | | (39,604) | | | (13,220) | |
Funds from Operations | | | 357,625 | | | 283,930 | | | 230,904 | |
Adjustments: | | | | | | | | | | |
Straight-line rental revenue, net: | | | | | | | | | | |
Fixed rent escalations accrued | | | (6,121) | | | (6,414) | | | (5,486) | |
Construction period rent deferrals | | | 6,622 | | | 3,056 | | | 3,142 | |
Transaction costs | | | — | | | — | | | 523 | |
Amortization of: | | | | | | | | | | |
Equity-based compensation | | | 8,608 | | | 7,931 | | | 7,022 | |
Deferred financing costs and other noncash interest expense (b) | | | 9,549 | | | 9,978 | | | 7,267 | |
Lease-related intangibles and costs (c) | | | 2,433 | | | 7,043 | | | 2,474 | |
Provision for loan losses | | | 2,608 | | | 1,500 | | | — | |
Capitalized interest | | | (2,641) | | | (1,243) | | | (817) | |
Gain on extinguishment of debt | | | (814) | | | — | | | — | |
Accrued severance costs | | | — | | | 296 | | | — | |
Selling stockholder costs | | | — | | | — | | | 800 | |
Adjusted Funds from Operations | | $ | 377,869 | | $ | 306,077 | | $ | 245,829 | |
| (a) | | For the years ended December 31, 2018, 2017 and 2016, includes $130,000, $5,000 and $76,000, respectively, of income tax expense associated with gains recognized on the dispositions of certain properties. |
| (b) | | For the years ended December 31, 2018 and 2017, includes $2.1 million and $2.0 million, respectively, of accelerated amortization of deferred financing costs primarily related to the prepayment of debt. |
| (c) | | For the year ended December 31, 2017, includes a $4.6 million charge related to accelerated amortization of lease incentives associated with terminated lease contracts. |
Item 7A. Quantitative and Qualitative Disclosures About Market Risk
Our interest rate risk management objective is to limit the impact of future interest rate changes on our earnings and cash flows. We seek to match the cash inflows from our long‑term leases with the expected cash outflows on our long‑term debt. To achieve this objective, our consolidated subsidiaries primarily borrow on a fixed‑rate basis for longer‑term debt issuances. At December 31, 2018, all of our long‑term debt carried a fixed interest rate, or was effectively converted to a fixed‑rate through the use of interest rate swaps for the term of the debt, and the weighted average debt maturity was approximately 6.2 years. We are exposed to interest rate risk between the time we enter into a sale‑leaseback transaction and the time we finance the related real estate with long‑term fixed‑rate debt. In addition, when that long‑term debt matures, we may have to refinance the real estate at a higher interest rate. Market interest rates are sensitive to many factors that are beyond our control.
We address interest rate risk by employing the following strategies to help insulate us from any adverse impact of rising interest rates:
| · | | We seek to minimize the time period between acquisition of our real estate and the ultimate financing of that real estate with long‑term fixed‑rate debt. |
| · | | By using serial issuances of long-term debt, we intend to ladder out our debt maturities to avoid a significant amount of debt maturing during any single period and to minimize the gap between free cash flow, or cash from operations less dividends, and annual debt maturities. |
| · | | Our secured long‑term debt generally provides for some amortization of the principal balance over the term of the debt, which serves to reduce the amount of refinancing risk at debt maturity to the extent that we can refinance the reduced debt balance over a revised long-term amortization schedule. |
| · | | We seek to maintain a large pool of unencumbered real estate assets to give us the flexibility to choose among various secured and unsecured debt markets when we are seeking to issue new long-term debt. |
| · | | We may also use derivative instruments, primarily cash flow hedges such as interest rate swaps, caps and treasury lock agreements, to limit our exposure to interest rate movements with respect to various debt instruments. |
Although all of our long-term debt carries a fixed rate, we often temporarily fund our property acquisitions with our revolving credit facility, which carries a variable rate. During the year ended December 31, 2018, we had average daily outstanding borrowings of $201.7 million on our variable‑rate credit facility, which primarily bears interest based on one-month LIBOR, plus a credit spread of 1.0% based on our current credit rating. We monitor our market interest rate risk exposures using a sensitivity analysis. Our sensitivity analysis estimates the exposure to market risk sensitive instruments assuming a hypothetical adverse change in interest rates. Based on the results of a sensitivity analysis, which assumes a 1% adverse change in interest rates, the estimated market risk exposure for our variable‑rate debt was approximately $2.0 million, or approximately 0.5% of net cash provided by operating activities for the year ended December 31, 2018. In addition, we may use various financial instruments designed to mitigate the impact of interest rate fluctuations on our cash flows and earnings, including hedging strategies, depending on our analysis of the interest rate environment and the costs and risks of such strategies. We do not use derivative instruments for trading or speculative purposes. See Note 2 to our Consolidated Financial Statements for further information on derivatives.
In July 2017, the Financial Conduct Authority (the authority that regulates LIBOR) announced it intends to stop compelling banks to submit rates for the calculation of LIBOR after 2021. The Alternative Reference Rates Committee, or ARRC, has proposed that the Secured Overnight Financing Rate, or SOFR, is the rate that represents best practice as the alternative to LIBOR for use in derivatives and other financial contracts that are currently indexed to LIBOR. The ARRC has proposed a paced market transition plan to SOFR from LIBOR and organizations are currently working on industry wide and company specific transition plans as it relates to derivatives and cash markets exposed to LIBOR. At December 31, 2018, the Company does have contracts that are indexed to LIBOR, including its unsecured revolving credit facility, and continues to monitor this activity and evaluate the related risks.
Item 8. FINANCIAL STATEMENTS AND SUPPLEMENTARY DATA
Report of Independent Registered Public Accounting Firm
To the Stockholders and the Board of Directors of STORE Capital Corporation
Opinion on the Financial Statements
We have audited the accompanying consolidated balance sheets of STORE Capital Corporation (the Company) as of December 31, 2018 and 2017, and the related consolidated statements of income, comprehensive income, stockholders' equity and cash flows for each of the three years in the period ended December 31, 2018, the related notes and the financial statement schedules listed in the Index at Item 15(a) (collectively referred to as the “consolidated financial statements”). In our opinion, the consolidated financial statements present fairly, in all material respects, the financial position of the Company at December 31, 2018 and 2017, and the results of its operations and its cash flows for each of the three years in the period ended December 31, 2018, in conformity with U.S. generally accepted accounting principles.
We also have audited, in accordance with the standards of the Public Company Accounting Oversight Board (United States) (PCAOB), the Company's internal control over financial reporting as of December 31, 2018, based on criteria established in Internal Control-Integrated Framework issued by the Committee of Sponsoring Organizations of the Treadway Commission (2013 framework) and our report dated February 22, 2019 expressed an unqualified opinion thereon.
Basis for Opinion
These financial statements are the responsibility of the Company's management. Our responsibility is to express an opinion on the Company’s financial statements based on our audits. We are a public accounting firm registered with the PCAOB and are required to be independent with respect to the Company in accordance with the U.S. federal securities laws and the applicable rules and regulations of the Securities and Exchange Commission and the PCAOB.
We conducted our audits in accordance with the standards of the PCAOB. Those standards require that we plan and perform the audit to obtain reasonable assurance about whether the financial statements are free of material misstatement, whether due to error or fraud. Our audits included performing procedures to assess the risks of material misstatement of the financial statements, whether due to error or fraud, and performing procedures that respond to those risks. Such procedures included examining, on a test basis, evidence regarding the amounts and disclosures in the financial statements. Our audits also included evaluating the accounting principles used and significant estimates made by management, as well as evaluating the overall presentation of the financial statements. We believe that our audits provide a reasonable basis for our opinion.
/s/ Ernst & Young LLP
We have served as the Company’s auditor since 2011.
Phoenix, Arizona
February 22, 2019
Report of Independent Registered Public Accounting Firm
To the Stockholders and the Board of Directors of STORE Capital Corporation
Opinion on Internal Control over Financial Reporting
We have audited STORE Capital Corporation’s internal control over financial reporting as of December 31, 2018, based on criteria established in Internal Control—Integrated Framework issued by the Committee of Sponsoring Organizations of the Treadway Commission (2013 framework) (the COSO criteria). In our opinion, STORE Capital Corporation (the Company) maintained, in all material respects, effective internal control over financial reporting as of December 31, 2018, based on the COSO criteria.
We also have audited, in accordance with the standards of the Public Company Accounting Oversight Board (United States) (PCAOB), the consolidated balance sheets as of December 31, 2018 and 2017, and the related consolidated statements of income, comprehensive income, stockholders’ equity and cash flows for each of the three years in the period ended December 31, 2018, the related notes and the financial statement schedules listed in the Index at Item 15(a) and our report dated February 22, 2019 expressed an unqualified opinion thereon.
Basis for Opinion
The Company’s management is responsible for maintaining effective internal control over financial reporting and for its assessment of the effectiveness of internal control over financial reporting included in the accompanying Management’s Report on Internal Control over Financial Reporting. Our responsibility is to express an opinion on the Company’s internal control over financial reporting based on our audit. We are a public accounting firm registered with the PCAOB and are required to be independent with respect to the Company in accordance with the U.S. federal securities laws and the applicable rules and regulations of the Securities and Exchange Commission and the PCAOB.
We conducted our audit in accordance with the standards of the PCAOB. Those standards require that we plan and perform the audit to obtain reasonable assurance about whether effective internal control over financial reporting was maintained in all material respects.
Our audit included obtaining an understanding of internal control over financial reporting, assessing the risk that a material weakness exists, testing and evaluating the design and operating effectiveness of internal control based on the assessed risk, and performing such other procedures as we considered necessary in the circumstances. We believe that our audit provides a reasonable basis for our opinion.
Definition and Limitations of Internal Control Over Financial Reporting
A company’s internal control over financial reporting is a process designed to provide reasonable assurance regarding the reliability of financial reporting and the preparation of financial statements for external purposes in accordance with generally accepted accounting principles. A company’s internal control over financial reporting includes those policies and procedures that (1) pertain to the maintenance of records that, in reasonable detail, accurately and fairly reflect the transactions and dispositions of the assets of the company; (2) provide reasonable assurance that transactions are recorded as necessary to permit preparation of financial statements in accordance with generally accepted accounting principles, and that receipts and expenditures of the company are being made only in accordance with authorizations of management and directors of the company; and (3) provide reasonable assurance regarding prevention or timely detection of unauthorized acquisition, use, or disposition of the company’s assets that could have a material effect on the financial statements.
Because of its inherent limitations, internal control over financial reporting may not prevent or detect misstatements. Also, projections of any evaluation of effectiveness to future periods are subject to the risk that controls may become inadequate because of changes in conditions, or that the degree of compliance with the policies or procedures may deteriorate.
/s/ Ernst & Young LLP
Phoenix, Arizona
February 22, 2019
STORE Capital Corporation
Consolidated Balance Sheets
(In thousands, except share and per share data)
| | | | | | | | |
| | December 31, | | |
| | 2018 | | 2017 | | |
Assets | | | | | | | | |
Investments: | | | | | | | | |
Real estate investments: | | | | | | | | |
Land and improvements | | $ | 2,280,280 | | $ | 1,898,342 | | |
Buildings and improvements | | | 4,888,440 | | | 3,958,003 | | |
Intangible lease assets | | | 85,148 | | | 87,402 | | |
Total real estate investments | | | 7,253,868 | | | 5,943,747 | | |
Less accumulated depreciation and amortization | | | (585,913) | | | (426,931) | | |
| | | 6,667,955 | | | 5,516,816 | | |
Real estate investments held for sale, net | | | — | | | 16,741 | | |
Loans and direct financing receivables | | | 351,202 | | | 271,453 | | |
Net investments | | | 7,019,157 | | | 5,805,010 | | |
Cash and cash equivalents | | | 27,511 | | | 42,937 | | |
Other assets, net | | | 67,303 | | | 51,830 | | |
Total assets | | $ | 7,113,971 | | $ | 5,899,777 | | |
| | | | | | | | |
Liabilities and stockholders’ equity | | | | | | | | |
Liabilities: | | | | | | | | |
Credit facility | | $ | 135,000 | | $ | 290,000 | | |
Unsecured notes and term loans payable, net | | | 916,720 | | | 570,595 | | |
Non-recourse debt obligations of consolidated special purpose entities, net | | | 2,008,592 | | | 1,736,306 | | |
Dividends payable | | | 72,954 | | | 60,068 | | |
Accrued expenses, deferred revenue and other liabilities | | | 117,204 | | | 71,866 | | |
Total liabilities | | | 3,250,470 | | | 2,728,835 | | |
Stockholders’ equity: | | | | | | | | |
Common stock, $0.01 par value per share, 375,000,000 shares authorized, 221,071,838 and 193,766,854 shares issued and outstanding, respectively | | | 2,211 | | | 1,938 | | |
Capital in excess of par value | | | 4,129,082 | | | 3,381,090 | | |
Distributions in excess of retained earnings | | | (267,651) | | | (214,845) | | |
Accumulated other comprehensive (loss) income | | | (141) | | | 2,759 | | |
Total stockholders’ equity | | | 3,863,501 | | | 3,170,942 | | |
Total liabilities and stockholders’ equity | | $ | 7,113,971 | | $ | 5,899,777 | | |
See accompanying notes.
STORE Capital Corporation
Consolidated Statements of Income
(In thousands, except share and per share data)
| | | | | | | | | | | |
| | Year Ended December 31, | | |
| | 2018 | | 2017 | | 2016 | | |
Revenues: | | | | | | | | | | | |
Rental revenues | | $ | 513,302 | | $ | 427,943 | | $ | 356,081 | | |
Interest income on loans and direct financing receivables | | | 25,741 | | | 22,565 | | | 19,677 | | |
Other income | | | 1,713 | | | 2,339 | | | 585 | | |
Total revenues | | | 540,756 | | | 452,847 | | | 376,343 | | |
Expenses: | | | | | | | | | | | |
Interest | | | 129,061 | | | 120,478 | | | 105,180 | | |
Transaction costs | | | — | | | — | | | 523 | | |
Property costs | | | 4,250 | | | 4,773 | | | 4,067 | | |
General and administrative | | | 45,725 | | | 40,990 | | | 33,972 | | |
Selling stockholder costs | | | — | | | — | | | 800 | | |
Depreciation and amortization | | | 181,826 | | | 150,279 | | | 119,618 | | |
Provisions for impairment | | | 7,810 | | | 13,440 | | | 1,720 | | |
Total expenses | | | 368,672 | | | 329,960 | | | 265,880 | | |
| | | | | | | | | | | |
Gain on dispositions of real estate | | | 45,528 | | | 39,609 | | | 13,296 | | |
Income from operations before income taxes | | | 217,612 | | | 162,496 | | | 123,759 | | |
Income tax expense | | | 642 | | | 458 | | | 434 | | |
Net income | | $ | 216,970 | | $ | 162,038 | | $ | 123,325 | | |
| | | | | | | | | | | |
Net income per share of common stock—basic and diluted | | $ | 1.06 | | $ | 0.90 | | $ | 0.82 | | |
Weighted average common shares outstanding: | | | | | | | | | | | |
Basic | | | 204,322,298 | | | 178,586,266 | | | 148,878,504 | | |
Diluted | | | 204,933,292 | | | 178,656,676 | | | 149,124,010 | | |
See accompanying notes.
STORE Capital Corporation
Consolidated Statements of Comprehensive Income
(In thousands)
| | | | | | | | | | | |
| | Year Ended December 31, | | |
| | 2018 | | 2017 | | 2016 | | |
Net income | | $ | 216,970 | | $ | 162,038 | | $ | 123,325 | | |
Other comprehensive income (loss): | | | | | | | | | | | |
Deferred gain on cash flow hedges | | | 4,288 | | | — | | | — | | |
Unrealized (losses) gains on cash flow hedges | | | (5,641) | | | 720 | | | 876 | | |
Cash flow hedge (gains) losses reclassified to interest expense | | | (1,547) | | | 630 | | | 826 | | |
Total other comprehensive (loss) income | | | (2,900) | | | 1,350 | | | 1,702 | | |
Total comprehensive income | | $ | 214,070 | | $ | 163,388 | | $ | 125,027 | | |
See accompanying notes.
STORE Capital Corporation
Consolidated Statements of Stockholders’ Equity
For the Years Ended December 31, 2018, 2017 and 2016
(In thousands, except share data)
| | | | | | | | | | | | | | | | | | |
| | | | | | | | | | Distributions | | Accumulated | | | | |
| | | | | | | Capital in | | in Excess of | | Other | | Total | |
| | Common Stock | | Excess of | | Retained | | Comprehensive | | Stockholders’ | |
| | Shares | | Par Value | | Par Value | | Earnings | | (Loss) Income | | Equity | |
Balance at December 31, 2015 | | 140,858,765 | | $ | 1,409 | | $ | 2,162,130 | | $ | (103,453) | | $ | (293) | | $ | 2,059,793 | |
Net income | | — | | | — | | | — | | | 123,325 | | | — | | | 123,325 | |
Other comprehensive income | | — | | | — | | | — | | | — | | | 1,702 | | | 1,702 | |
Issuance of common stock, net of costs of $14,823 | | 18,447,601 | | | 184 | | | 463,696 | | | — | | | — | | | 463,880 | |
Equity-based compensation | | 104,086 | | | 1 | | | 7,068 | | | — | | | — | | | 7,069 | |
Shares repurchased under stock compensation plan | | (68,497) | | | (1) | | | (1,049) | | | (669) | | | — | | | (1,719) | |
Common dividends declared ($1.12 per common share) | | — | | | — | | | — | | | (170,795) | | | — | | | (170,795) | |
Balance at December 31, 2016 | | 159,341,955 | | | 1,593 | | | 2,631,845 | | | (151,592) | | | 1,409 | | | 2,483,255 | |
Net income | | — | | | — | | | — | | | 162,038 | | | — | | | 162,038 | |
Other comprehensive income | | — | | | — | | | — | | | — | | | 1,350 | | | 1,350 | |
Issuance of common stock, net of costs of $11,766 | | 34,323,728 | | | 343 | | | 742,247 | | | — | | | — | | | 742,590 | |
Equity-based compensation | | 157,268 | | | 2 | | | 7,931 | | | 12 | | | — | | | 7,945 | |
Shares repurchased under stock compensation plan | | (56,097) | | | — | | | (933) | | | (413) | | | — | | | (1,346) | |
Common dividends declared ($1.20 per common share) and dividend equivalents on restricted stock units | | — | | | — | | | — | | | (224,890) | | | — | | | (224,890) | |
Balance at December 31, 2017 | | 193,766,854 | | | 1,938 | | | 3,381,090 | | | (214,845) | | | 2,759 | | | 3,170,942 | |
Net income | | — | | | — | | | — | | | 216,970 | | | — | | | 216,970 | |
Other comprehensive loss | | — | | | — | | | — | | | — | | | (2,900) | | | (2,900) | |
Issuance of common stock, net of costs of $12,253 | | 27,125,559 | | | 271 | | | 741,394 | | | — | | | — | | | 741,665 | |
Equity-based compensation | | 293,373 | | | 3 | | | 8,606 | | | 31 | | | — | | | 8,640 | |
Shares repurchased under stock compensation plan | | (113,948) | | | (1) | | | (2,008) | | | (826) | | | — | | | (2,835) | |
Common dividends declared ($1.28 per common share) and dividend equivalents on restricted stock units | | — | | | — | | | — | | | (268,981) | | | — | | | (268,981) | |
Balance at December 31, 2018 | | 221,071,838 | | $ | 2,211 | | $ | 4,129,082 | | $ | (267,651) | | $ | (141) | | $ | 3,863,501 | |
See accompanying notes.
STORE Capital Corporation
Consolidated Statements of Cash Flows
(In thousands)
| | | | | | | | | | |
| Year Ended December 31, | | |
| 2018 | | 2017 | | 2016 | | |
Operating activities | | | | | | | | | | |
Net income | $ | 216,970 | | $ | 162,038 | | $ | 123,325 | | |
Adjustments to net income: | | | | | | | | | | |
Depreciation and amortization | | 181,826 | | | 150,279 | | | 119,618 | | |
Amortization of deferred financing costs and other noncash interest expense | | 9,549 | | | 9,978 | | | 7,267 | | |
Amortization of equity-based compensation | | 8,608 | | | 7,931 | | | 7,022 | | |
Provisions for impairment | | 7,810 | | | 13,440 | | | 1,720 | | |
Gain on dispositions of real estate | | (45,528) | | | (39,609) | | | (13,296) | | |
Gain on extinguishment of debt | | (814) | | | — | | | — | | |
Noncash revenue and other | | 2,291 | | | 3,733 | | | 54 | | |
Payments received in settlement of cash flow hedges | | 4,288 | | | — | | | — | | |
Changes in operating assets and liabilities: | | | | | | | | | | |
Other assets | | (4,926) | | | (4,126) | | | (5,340) | | |
Accrued expenses, deferred revenue and other liabilities | | 11,604 | | | 5,761 | | | 5,934 | | |
Net cash provided by operating activities | | 391,678 | | | 309,425 | | | 246,304 | | |
Investing activities | | | | | | | | | | |
Acquisition of and additions to real estate | | (1,514,718) | | | (1,335,305) | | | (1,153,141) | | |
Investment in loans and direct financing receivables | | (88,088) | | | (35,229) | | | (44,297) | | |
Collections of principal on loans and direct financing receivables | | 5,205 | | | 29,770 | | | 5,680 | | |
Proceeds from dispositions of real estate | | 230,563 | | | 239,893 | | | 61,385 | | |
Net cash used in investing activities | | (1,367,038) | | | (1,100,871) | | | (1,130,373) | | |
Financing activities | | | | | | | | | | |
Borrowings under credit facility | | 988,000 | | | 642,000 | | | 599,000 | | |
Repayments under credit facility | | (1,143,000) | | | (400,000) | | | (551,000) | | |
Borrowings under unsecured notes and term loans payable | | 348,303 | | | 100,000 | | | 300,000 | | |
Borrowings under non-recourse debt obligations of consolidated special purpose entities | | 591,843 | | | 134,961 | | | 264,894 | | |
Repayments under non-recourse debt obligations of consolidated special purpose entities | | (283,770) | | | (237,998) | | | (29,115) | | |
Financing costs paid | | (15,521) | | | (2,764) | | | (8,912) | | |
Proceeds from the issuance of common stock | | 753,918 | | | 754,357 | | | 478,704 | | |
Stock issuance costs paid | | (12,167) | | | (11,834) | | | (15,437) | | |
Shares repurchased under stock compensation plans | | (2,835) | | | (1,346) | | | (1,719) | | |
Dividends paid | | (255,572) | | | (209,918) | | | (162,618) | | |
Net cash provided by financing activities | | 969,199 | | | 767,458 | | | 873,797 | | |
Net decrease in cash, cash equivalents and restricted cash | | (6,161) | | | (23,988) | | | (10,272) | | |
Cash, cash equivalents and restricted cash, beginning of period | | 49,178 | | | 73,166 | | | 83,438 | | |
Cash, cash equivalents and restricted cash, end of period | $ | 43,017 | | $ | 49,178 | | $ | 73,166 | | |
| | | | | | | | | | |
Reconciliation of cash, cash equivalents and restricted cash: | | | | | | | | | | |
Cash and cash equivalents | $ | 27,511 | | $ | 42,937 | | $ | 54,200 | | |
Restricted cash included in other assets | | 15,506 | | | 6,241 | | | 18,966 | | |
Total cash, cash equivalents and restricted cash | $ | 43,017 | | $ | 49,178 | | $ | 73,166 | | |
| | | | | | | | | | |
Supplemental disclosure of noncash investing and financing activities: | | | | | | | | | | |
Accrued tenant improvements included in real estate investments | $ | 34,769 | | $ | 25,884 | | $ | 23,911 | | |
Net real estate assets surrendered to lender | | 12,573 | | | — | | | — | | |
Seller financing provided to purchasers of real estate sold | | — | | | — | | | 17,479 | | |
Acquisition of collateral property securing a mortgage note receivable | | — | | | 2,000 | | | — | | |
Non-recourse debt obligation assumed by purchaser of real estate | | 20,845 | | | — | | | — | | |
Non-recourse debt forgiven by lender in exchange for collateral assets | | 12,874 | | | — | | | — | | |
Accrued financing and stock issuance costs | | 211 | | | 101 | | | 105 | | |
Supplemental disclosure of cash flow information: | | | | | | | | | | |
Cash paid during the period for interest, net of amounts capitalized | $ | 115,425 | | $ | 109,898 | | $ | 95,968 | | |
Cash paid during the period for income and franchise taxes | | 1,930 | | | 1,666 | | | 1,194 | | |
See accompanying notes.
STORE Capital Corporation
Notes to Consolidated Financial Statements
December 31, 2018
1. Organization
STORE Capital Corporation (STORE Capital or the Company) was incorporated under the laws of Maryland on May 17, 2011 to acquire single‑tenant operational real estate to be leased on a long‑term, net basis to companies that operate across a wide variety of industries within the service, retail and manufacturing sectors of the United States economy. From time to time, it also provides mortgage financing to its customers.
On November 21, 2014, the Company completed the initial public offering (IPO) of its common stock. The shares began trading on the New York Stock Exchange on November 18, 2014 under the ticker symbol “STOR”.
STORE Capital has made an election to qualify, and believes it is operating in a manner to continue to qualify, as a real estate investment trust (REIT) for federal income tax purposes beginning with its initial taxable year ended December 31, 2011. As a REIT, it will generally not be subject to federal income taxes to the extent that it distributes all of its taxable income to its stockholders and meets other specific requirements.
2. Summary of Significant Accounting Principles
Basis of Accounting and Principles of Consolidation
The consolidated financial statements have been prepared in accordance with U.S. generally accepted accounting principles (GAAP) and the rules and regulations of the U.S. Securities and Exchange Commission (SEC). These consolidated statements include the accounts of STORE Capital and its subsidiaries which are wholly owned and controlled by the Company through its voting interest. One of the Company’s wholly owned subsidiaries, STORE Capital Advisors, LLC, provides all of the general and administrative services for the day‑to‑day operations of the consolidated group, including property acquisition and lease origination, real estate portfolio management and marketing, accounting and treasury services. The remaining subsidiaries were formed to acquire and hold real estate investments or to facilitate non‑recourse secured borrowing activities. Generally, the initial operations of the real estate subsidiaries are funded by an interest‑bearing intercompany loan from STORE Capital, and such intercompany loan is repaid when the subsidiary issues long‑term debt secured by its properties. All intercompany account balances and transactions have been eliminated in consolidation.
Certain of the Company’s wholly owned consolidated subsidiaries were formed as special purpose entities. Each special purpose entity is a separate legal entity and is the sole owner of its assets and liabilities. The assets of the special purpose entities are not available to pay or otherwise satisfy obligations to the creditors of any owner or affiliate of the special purpose entity. At December 31, 2018 and 2017, these special purpose entities held assets totaling $6.1 billion and $5.2 billion, respectively, and had third‑party liabilities totaling $2.1 billion and $1.8 billion, respectively. These assets and liabilities are included in the accompanying consolidated balance sheets.
Use of Estimates
The preparation of financial statements in conformity with GAAP requires management to make estimates and assumptions that affect the reported amounts of assets and liabilities, the disclosure of contingent assets and liabilities and the reported amounts of revenues and expenses during the reporting period. Although management believes its estimates are reasonable, actual results could differ from those estimates.
Reclassifications
Certain reclassifications have been made to prior period balances to conform to the current period presentation, primarily to change the presentation of gain on dispositions of real estate, net of tax on the consolidated statements of income for the years ended December 31, 2017 and 2016. The gain on dispositions of real estate is now shown gross of the related income tax expense and included in results of operations as a result of the SEC’s recent elimination of Rule 3-15(a) of Regulation S-X.
Segment Reporting
The Financial Accounting Standards Board’s (FASB) Accounting Standards Codification (ASC) Topic 280, Segment Reporting, established standards for the manner in which enterprises report information about operating segments. The Company views its operations as one reportable segment.
Accounting for Real Estate Investments
STORE Capital records the acquisition of real estate properties at cost, including acquisition and closing costs. The Company allocates the cost of real estate properties to the tangible and intangible assets and liabilities acquired based on their estimated relative fair values. Intangible assets and liabilities acquired may include the value of existing in-place leases, above-market or below-market lease value of in-place leases and ground lease intangibles, as applicable. Management uses multiple sources to estimate fair value, including independent appraisals and information obtained about each property as a result of its pre‑acquisition due diligence and its marketing and leasing activities.
In‑place lease intangibles are valued based on management’s estimates of lost rent and carrying costs during the time it would take to locate a tenant if the property were vacant, considering current market conditions and costs to execute similar leases. In estimating lost rent and carrying costs, management considers market rents, real estate taxes, insurance, costs to execute similar leases including leasing commissions and other related costs. The value assigned to in‑place leases is amortized on a straight‑line basis as a component of depreciation and amortization expense typically over the remaining term of the related leases.
The fair value of any above‑market and below‑market leases is estimated based on the present value of the difference between the contractual amounts to be paid pursuant to the in‑place lease and management’s estimate of current market lease rates for the property, measured over a period equal to the remaining term of the lease. Capitalized above‑market lease intangibles are amortized over the remaining term of the respective leases as a decrease to rental revenue. Below‑market lease intangibles are amortized as an increase in rental revenue over the remaining term of the respective leases plus the fixed‑rate renewal periods on those leases, if any. Should a lease terminate early, the unamortized portion of any related lease intangible is immediately recognized in operations.
The Company’s real estate portfolio is depreciated using the straight‑line method over the estimated remaining useful life of the properties, which generally ranges from 30 to 40 years for buildings and is generally 15 years for land improvements. Properties classified as held for sale are recorded at the lower of their carrying value or their fair value, less anticipated closing costs. Any properties classified as held for sale are not depreciated.
Impairment
STORE Capital reviews its real estate investments and related lease intangibles periodically for impairment whenever events or changes in circumstances indicate that the carrying amount of an asset may not be recoverable through operations. Management considers factors such as expected future undiscounted cash flows, estimated residual value, market trends (such as the effects of leasing demand and competition) and other factors including bona fide purchase offers received from third parties in making this assessment. These factors are classified as Level 3 inputs within the fair value hierarchy, discussed in Fair Value Measurements below. An asset is considered impaired if the carrying value of the asset exceeds its estimated undiscounted cash flows and the impairment is calculated as the amount by which the carrying value of the asset exceeds its estimated fair value. Estimating future cash flows is highly subjective and such estimates could differ materially from actual results.
During the years ended December 31, 2018 and 2017, the Company recognized an aggregate provision for impairment of real estate of $5.2 million and $11.9 million, respectively. As of December 31, 2018, the estimated fair value of the impaired real estate assets still held by the Company was $6.3 million.
Revenue Recognition
STORE Capital leases real estate to its tenants under long‑term net leases that are predominantly classified as operating leases. Direct costs associated with lease origination, offset by any lease origination fees received, are deferred and amortized over the related lease term as an adjustment to rental revenue. The Company periodically commits to fund the construction of new properties for its customers; rental revenue collected during the construction period is deferred and amortized over the remaining lease term when the construction project is complete. Substantially all of the leases are triple‑net, which means that the lessees are responsible for the payment
of all property operating expenses, including property taxes, maintenance and insurance. For a few lease contracts, the Company collects property taxes from its customers and remits those taxes to governmental authorities; such property taxes have historically been presented on a net basis in the consolidated statements of income. As discussed in Recent Accounting Pronouncements below, the Company adopted ASU 2016-02, Leases (Topic 842)(ASU 2016-02) in January 2019 and, as a result, these property tax payments will now be presented on a gross basis in the consolidated statements of income.
The Company’s leases generally provide for rent escalations throughout the lease terms. For leases that provide for specific contractual escalations, rental revenue is recognized on a straight‑line basis so as to produce a constant periodic rent over the term of the lease. Accordingly, accrued rental revenue, calculated as the aggregate difference between the rental revenue recognized on a straight‑line basis and scheduled rents, represents unbilled rent receivables that the Company will receive only if the tenants make all rent payments required through the expiration of the lease. The Company provides an estimated reserve for uncollectible straight‑line rental revenue based on management’s assessment of the risks inherent in those lease contracts, giving consideration to industry default rates for long‑term receivables. There was $25.7 million and $20.9 million of accrued straight‑line rental revenue, net of allowances of $4.3 million and $2.9 million, at December 31, 2018 and 2017, respectively, which were included in other assets, net, on the consolidated balance sheets. Leases that have contingent rent escalators indexed to future increases in the Consumer Price Index (CPI) may adjust over a one‑year period or over multiple‑year periods. Generally, these escalators increase rent at the lesser of (a) 1 to 1.25 times the increase in the CPI over a specified period or (b) a fixed percentage. Because of the volatility and uncertainty with respect to future changes in the CPI, the Company’s inability to determine the extent to which any specific future change in the CPI is probable at each rent adjustment date during the entire term of these leases and the Company’s view that the multiplier does not represent a significant leverage factor, increases in rental revenue from leases with this type of escalator are recognized only after the changes in the rental rates have actually occurred.
For leases that have contingent rentals that are based on a percentage of the tenant’s gross sales, the Company recognizes contingent rental revenue when the threshold upon which the contingent lease payment is based is actually reached. Less than 1.3% of the Company’s investment portfolio is subject to leases that provide for contingent rent based on a percentage of the tenant’s gross sales.
The Company suspends revenue recognition when the collectibility of amounts due pursuant to a lease is no longer reasonably assured or if the tenant’s monthly lease payments become more than 60 days past due, whichever is earlier. The Company reviews its accounts receivable for collectibility on a regular basis, taking into consideration changes in factors such as the tenant’s payment history, the financial condition of the tenant, business conditions in the industry in which the tenant operates and economic conditions in the area where the property is located. In the event that the collectibility of a receivable with respect to any tenant is in doubt, a provision for uncollectible amounts will be established or a direct write‑off of the specific receivable will be made.
Loans Receivable
STORE Capital holds its loans receivable for long‑term investment. Loans receivable are carried at amortized cost, including related unamortized discounts or premiums, if any.
Revenue Recognition
The Company recognizes interest income on loans receivable using the effective-interest method applied on a loan‑by‑loan basis. Direct costs associated with originating loans are offset against any related fees received and the balance, along with any premium or discount, is deferred and amortized as an adjustment to interest income over the term of the related loan receivable using the effective interest method. A loan receivable is placed on nonaccrual status when the loan has become more than 60 days past due, or earlier if management determines that full recovery of the contractually specified payments of principal and interest is doubtful. While on nonaccrual status, interest income is recognized only when received. As of December 31, 2018, there were three loans receivable with an aggregate outstanding principal balance of $8.5 million on nonaccrual status. As of December 31, 2017, there were two loans receivable with an aggregate outstanding principal balance of $5.4 million on nonaccrual status.
Impairment and Provision for Loan Losses
The Company periodically evaluates the collectibility of its loans receivable, including accrued interest, by analyzing the underlying property‑level economics and trends, collateral value and quality and other relevant factors in determining the adequacy of its allowance for loan losses. A loan is determined to be impaired when, in management’s judgment based on current information and events, it is probable that the Company will be unable to collect all amounts due according to the contractual terms of the loan agreement. Specific
allowances for loan losses are provided for impaired loans on an individual loan basis in the amount by which the carrying value exceeds the estimated fair value of the underlying collateral less disposition costs. At December 31, 2018 and 2017, there was $2.5 million and $1.5 million, respectively, of allowances for loan losses, which were included in loans and direct financing receivables on the consolidated balance sheets, related to one outstanding loan receivable. During 2018, the Company recognized $2.6 million of provisions for loan losses which are included in provisions for impairment on the consolidated statement of income; $1.6 million of this amount was recognized as part of a write-off of one loan receivable, net of collateral assets acquired. During 2017, the Company recognized a $1.5 million provision for loan losses.
Direct Financing Receivables
Certain of the Company’s real estate investment transactions are accounted for as direct financing leases. The Company records the direct financing receivables at their net investment, determined as the aggregate minimum lease payments and the estimated residual value of the leased property less unearned income. The unearned income is recognized over the life of the related contracts so as to produce a constant rate of return on the net investment in the asset.
Cash and Cash Equivalents
Cash and cash equivalents include cash and highly liquid investment securities with maturities at acquisition of three months or less. The Company invests cash primarily in money‑market funds of a major financial institution, consisting predominantly of U.S. Government obligations.
Restricted Cash
Restricted cash primarily consists of reserve account deposits held by lenders, including deposits required to be used for future investment in real estate assets, and escrow deposits. The Company had $15.5 million and $6.2 million of restricted cash and deposits in escrow at December 31, 2018 and 2017, respectively, which were included in other assets, net, on the consolidated balance sheets.
Deferred Costs
Financing costs related to the issuance of the Company’s long-term debt are deferred and amortized as an increase to interest expense over the term of the related debt instrument using the effective-interest method and are reported as a reduction of the related debt balance on the consolidated balance sheets. Deferred financing costs related to the establishment of the Company's credit facility are deferred and amortized to interest expense over the term of the credit facility and are included in other assets, net, on the consolidated balance sheets.
Derivative Instruments and Hedging Activities
The Company may enter into derivative contracts as part of its overall financing strategy to manage the Company’s exposure to changes in interest rates associated with current and/or future debt issuances. The Company does not use derivatives for trading or speculative purposes. The use of derivative financial instruments carries certain risks, including the risk that the counterparties to these contractual arrangements are not able to perform under the agreements. To mitigate this risk, the Company enters into derivative financial instruments only with counterparties with high credit ratings and with major financial institutions with which the Company may also have other financial relationships. The Company does not anticipate that any of the counterparties will fail to meet their obligations.
The Company records its derivatives on the balance sheet at fair value. All derivatives subject to a master netting arrangement in accordance with the associated master International Swap and Derivatives Association agreement have been presented on a net basis by counterparty portfolio for purposes of balance sheet presentation and related disclosures. The accounting for changes in the fair value of derivatives depends on the intended use of the derivative, whether the Company has elected to apply hedge accounting and whether the hedging relationship has satisfied the criteria necessary to apply hedge accounting. Derivatives qualifying as a hedge of the exposure to variability in expected future cash flows, or other types of forecasted transactions, are considered cash flow hedges. Hedge accounting generally provides for the matching of the earnings effect of the hedged forecasted transactions in a cash flow hedge. The changes in the fair value of derivatives designated and that qualify as cash flow hedges is recorded in accumulated other comprehensive income (loss). Amounts reported in accumulated other comprehensive income (loss) related to cash flow hedges are reclassified to operations as an adjustment to interest expense as interest payments are made on the hedged debt transaction.
As of December 31, 2018, the Company had one interest rate floor, three interest rate swap and two treasury lock agreements in place. One of the interest rate swaps has a notional amount of $100 million and was designated as a cash flow hedge of the Company’s $100 million variable-rate bank term loan due in 2019 (Note 4). The remaining two interest rate swaps and related interest rate floor transaction have an aggregate notional amount of $100 million and were designated as a cash flow hedge of the Company’s $100 million variable-rate bank term loan due in 2021 (Note 4). The two treasury lock agreements, which have an aggregate notional amount of $300 million, were designated as cash flow hedges associated with a portion of an expected future debt issuance.
In January 2018, the Company entered into a treasury lock agreement which was designated as a cash flow hedge associated with the expected public offering of the senior unsecured notes issued by the Company in March 2018 (Note 4). The agreement was settled in accordance with its terms in March 2018 and the Company received a $4.3 million payment from the counterparty which was recognized as a deferred gain in accumulated other comprehensive income.
Fair Value Measurement
The Company estimates the fair value of financial and non-financial assets and liabilities based on the framework established in fair value accounting guidance. Fair value is defined as the price that would be received to sell an asset or paid to transfer a liability in an orderly transaction between market participants at the measurement date (an exit price). The hierarchy described below prioritizes inputs to the valuation techniques used in measuring the fair value of assets and liabilities. This hierarchy maximizes the use of observable inputs and minimizes the use of unobservable inputs by requiring the most observable inputs to be used when available. The hierarchy is broken down into three levels based on the reliability of inputs as follows:
| · | | Level 1—Quoted market prices in active markets for identical assets and liabilities that the Company has the ability to access. |
| · | | Level 2—Significant inputs that are observable, either directly or indirectly. These types of inputs would include quoted prices for similar assets or liabilities in active markets, quoted prices for identical assets in inactive markets and market‑corroborated inputs. |
| · | | Level 3—Inputs that are unobservable and significant to the overall fair value measurement of the assets or liabilities. These types of inputs include the Company’s own assumptions. |
Share‑based Compensation
Directors and key employees of the Company have been granted long‑term incentive awards, including restricted stock awards (RSAs) and restricted stock unit awards (RSUs), which provide such directors and employees with equity interests as an incentive to remain in the Company’s service and to align their interests with those of the Company’s stockholders.
The Company estimates the fair value of RSAs based on the closing price per share of the common stock on the date of grant and recognizes that amount in general and administrative expense ratably over the vesting period at the greater of the amount amortized on a straight‑line basis or the amount vested.
The Company’s RSUs granted in 2015 through 2017 contain both a market condition and a service condition and RSUs granted in 2018 contain both a market condition and a performance condition as well as a service condition. The Company values the RSUs with a market condition using a Monte Carlo simulation model and values the RSUs with a performance condition based on the fair value of the awards expected to be earned and recognizes those amounts in general and administrative expense on a tranche by tranche basis ratably over the vesting periods.
Income Taxes
As a REIT, the Company generally will not be subject to federal income tax. It is still subject, however, to state and local income taxes and to federal income and excise tax on its undistributed income. STORE Investment Corporation is the Company’s wholly owned taxable REIT subsidiary (TRS) created to engage in non‑qualifying REIT activities. The TRS is subject to federal, state and local income taxes.
Net Income Per Common Share
Net income per common share has been computed pursuant to the guidance in the FASB ASC Topic 260, Earnings Per Share. The guidance requires the classification of the Company’s unvested restricted common shares, which contain rights to receive non‑forfeitable dividends, as participating securities requiring the two‑class method of computing net income per common share. The following table is a reconciliation of the numerator and denominator used in the computation of basic and diluted net income per common share (dollars in thousands):
| | | | | | | | | | | | |
| | Year Ended December 31, | | | |
| | 2018 | | 2017 | | 2016 | | | |
Numerator: | | | | | | | | | | | | |
Net income | | $ | 216,970 | | $ | 162,038 | | $ | 123,325 | | | |
Less: earnings attributable to unvested restricted shares | | | (398) | | | (445) | | | (513) | | | |
Net income used in basic and diluted income per share | | $ | 216,572 | | $ | 161,593 | | $ | 122,812 | | | |
Denominator: | | | | | | | | | | | | |
Weighted average common shares outstanding | | | 204,666,034 | | | 178,958,667 | | | 149,350,191 | | | |
Less: Weighted average number of shares of unvested restricted stock | | | (343,736) | | | (372,401) | | | (471,687) | | | |
Weighted average shares outstanding used in basic income per share | | | 204,322,298 | | | 178,586,266 | | | 148,878,504 | | | |
Effects of dilutive securities: | | | | | | | | | | | | |
Add: Treasury stock method impact of potentially dilutive securities (a) | | | 610,994 | | | 70,410 | | | 245,506 | | | |
Weighted average shares outstanding used in diluted income per share | | | 204,933,292 | | | 178,656,676 | | | 149,124,010 | | | |
| (a) | | For the years ended December 31, 2018, 2017 and 2016, excludes 113,895 shares, 118,443 shares and 201,778 shares, respectively, related to unvested restricted shares as the effect would have been antidilutive. |
Recent Accounting Pronouncements
From time to time, new accounting pronouncements are issued by the FASB or the SEC. The Company adopts the new pronouncements as of the specified effective date. When permitted, the Company may elect to early adopt the new pronouncements. Unless otherwise discussed, these new accounting pronouncements include technical corrections to existing guidance or introduce new guidance related to specialized industries or entities and, therefore, will have minimal, if any, impact on the Company’s financial position, results of operations or cash flows upon adoption.
In May 2014, the FASB issued ASU 2014-09, Revenue from Contracts with Customers (Topic 606)(ASU 2014-09), which established a principles-based approach for accounting for revenue from contracts with customers. The standard does not apply to revenue recognition for lease contracts or to the interest income recognized from loans receivable, which together represent over 99% of the Company’s revenue streams. This new revenue guidance also included changes to the accounting for sales of real estate properties; however, based on the Company’s analysis, the new standard is not expected to have a material impact on the Company’s recognition of gains or losses in connection with future real estate sales. The Company adopted the standard on January 1, 2018 using the modified retrospective method for transition and did not recognize a cumulative effect adjustment.
In February 2016, the FASB issued ASU 2016-02, Leases (Topic 842)(ASU 2016-02) to amend the accounting for leases. The new standard requires lessees to classify leases as either finance or operating leases based on certain criteria and record a right-of-use asset and a lease liability for all leases with a term of greater than 12 months, regardless of their classification. The new standard requires lessors to account for leases using an approach that is substantially equivalent to the previous guidance for sales-type leases, direct financing leases and operating leases. The standard also eliminates current real estate-specific provisions and changes the guidance on sale-leaseback transactions, initial direct costs, lease modifications and lease executory costs for all entities. Certain changes to the guidance pertaining to sale-leaseback transactions may impact the Company. For example, the inclusion of a purchase option in the lease associated with a sale-leaseback transaction will now result in the lessor accounting for such transaction as a financing arrangement.
ASU 2016-02 was effective for the Company on January 1, 2019 and, in accordance with the provisions of ASU 2018-11, Leases (Topic 842), Targeted Improvements, was adopted retrospectively by the Company as of the beginning of the period of adoption. There
was no impact to retained earnings at the time of adoption and, therefore, no cumulative-effect adjustment was recorded. At the time of adoption, both lessees and lessors are permitted to make an election to apply a package of practical expedients available for implementation under the standard. The Company applied this package of practical expedients and, as such, at the time of adoption did not reassess the classification of existing lease contracts, whether existing or expired contracts contain a lease or whether a portion of initial direct costs for existing leases should have been expensed. The accounting applied by a lessor is largely unchanged under ASU 2016-02; however, the standard requires that lessors expense, on an as-incurred basis, certain initial direct costs that are not incremental in obtaining a lease. Under the previous standards, certain of these costs were capitalizable and, therefore, this new standard will result in a portion of these costs being expensed as incurred; during the year ended December 31, 2018, the Company capitalized $2.0 million of initial direct costs which are included in other assets, net, on the consolidated balance sheet. Although primarily a lessor, the Company is also a lessee under several ground lease arrangements and under its corporate office lease. The Company has completed its inventory and evaluation of these leases and has calculated a right-of-use asset and a lease liability for the present value of the minimum lease payments; the amount recognized upon adoption was less than 1% of total assets. For the majority of the Company’s ground lease arrangements, the sublessees, or the Company’s tenants, are responsible for making payment directly to the ground lessors. Prior to the new standard such amounts were presented on a net basis; however, upon adoption of ASU 2016-02 the expense related to the ground lease obligations, along with the related sublease revenues, will be presented on a gross basis in the consolidated statements of income. ASU 2016-02 also requires additional disclosures within the notes accompanying the consolidated financial statements.
Approximately 98% of the Company’s lease contracts (under which the Company is the lessor) are “triple-net” leases, which means that its tenants are responsible for making payments to third parties for operating expenses such as property taxes and insurance costs associated with the properties the Company leases to them. Under the previous lease accounting guidance, these payments were excluded from rental revenue. In December 2018, the FASB issued ASU 2018-20 Leases (Topic 842), Narrow-Scope Improvements for Lessors. This update requires lessors to exclude from variable lease payments, and therefore revenue and expense, lessor costs paid by lessees directly to third parties (a net presentation). Costs paid by the lessor and reimbursed by lessees will be included in variable lease payments (a gross presentation).
In June 2016, the FASB issued ASU 2016-13, Financial Instruments — Credit Losses (Topic 326): Measurement of Credit Losses on Financial Instruments, which changes how entities measure credit losses for most financial assets. This guidance requires an entity to estimate its lifetime “expected credit loss” and record an allowance that, when deducted from the amortized cost basis of the financial asset, presents the net amount expected to be collected on the financial asset. In November 2018, the FASB issued ASU 2018-19, Codification Improvements to Topic 326, Financial Instruments – Credit Losses, which clarified that receivables arising from operating leases are within the scope of the leasing standard (Topic 842) discussed above. This new standard will be effective for the Company on January 1, 2020, with early adoption permitted beginning on January 1, 2019. The Company has loans and direct financing receivables that will be subject to the new guidance and continues to evaluate the impact this new standard will have on its consolidated financial statements.
In August 2016, the FASB issued ASU 2016-15, Statement of Cash Flows (Topic 230): Classification of Certain Cash Receipts and Cash Payments, which is intended to reduce diversity in practice in how certain specified transactions, such as particular debt and insurance claim related cash flows, are classified in the statement of cash flows. This new standard was effective for the Company on January 1, 2018 and the adoption by the Company did not have a material impact on its consolidated financial statements.
In May 2017, the FASB issued ASU 2017-09, Compensation – Stock Compensation (Topic 718): Scope of Modification Accounting, which clarifies when changes to the terms or conditions of a share-based payment award must be accounted for as modifications and is expected to reduce diversity in practice. The standard was effective for the Company on January 1, 2018 and the adoption by the Company did not have a material impact on its consolidated financial statements.
In August 2018, the FASB issued ASU 2018-15, Intangibles — Goodwill and Other — Internal-Use Software (Subtopic 350-40), Customer’s Accounting for Implementation Costs Incurred in a Cloud Computing Arrangement That Is a Service Contract, which requires a customer in a cloud computing arrangement (i.e., hosting arrangement) that is a service contract to follow the internal-use software guidance to determine which implementation costs to capitalize as assets or expense as incurred. Capitalized implementation costs related to a hosting arrangement that is a service contract will be amortized over the term of the hosting arrangement, beginning when the module or component of the hosting arrangement is ready for its intended use. As permitted in the guidance, the Company early adopted the provisions of ASU 2018-15 beginning with the quarter ended December 31, 2018 using the prospective approach. The adoption by the Company did not have a material impact on its consolidated financial statements.
3. Investments
At December 31, 2018, STORE Capital had investments in 2,255 property locations representing 2,199 owned properties (of which 61 are accounted for as direct financing receivables), 21 ground lease interests and 35 properties which secure mortgage loans. The gross investment portfolio totaled $7.61 billion at December 31, 2018 and consisted of the gross acquisition cost of the real estate investments totaling $7.25 billion and loans and direct financing receivables with an aggregate carrying amount of $351.2 million. As of December 31, 2018, approximately 39% of these investments are assets of consolidated special purpose entity subsidiaries and are pledged as collateral under the non‑recourse obligations of these special purpose entities (Note 4).
The gross dollar amount of the Company’s investments includes the investment in land, buildings, improvements and lease intangibles related to real estate investments as well as the carrying amount of the loans and direct financing receivables. During 2016, 2017 and 2018, the Company had the following gross real estate and loan activity (dollars in thousands):
| | | | | | |
| | Number of | | Dollar | |
| | Investment | | Amount of | |
| | Locations | | Investments | |
Gross investments, December 31, 2015 | | 1,325 | | $ | 3,979,942 | |
Acquisition of and additions to real estate (a)(b) | | 342 | | | 1,161,159 | |
Investment in loans and direct financing receivables (c) | | 25 | | | 61,776 | |
Sales of real estate | | (31) | | | (70,824) | |
Principal collections on loans and direct financing receivables | | (1) | | | (5,680) | |
Provisions for impairment | | | | | (1,720) | |
Other | | | | | (137) | |
Gross investments, December 31, 2016 | | 1,660 | | | 5,124,516 | |
Acquisition of and additions to real estate (a)(d)(e) | | 313 | | | 1,339,682 | |
Investment in loans and direct financing receivables | | 5 | | | 35,229 | |
Sales of real estate | | (55) | | | (219,640) | |
Principal collections on loans and direct financing receivables (e) | | (2) | | | (31,770) | |
Provisions for impairment | | | | | (13,440) | |
Other | | | | | (667) | |
Gross investments, December 31, 2017 | | 1,921 | | | 6,233,910 | |
Acquisition of and additions to real estate (a)(f) | | 389 | | | 1,538,015 | |
Investment in loans and direct financing receivables | | 29 | | | 88,088 | |
Sales of real estate | | (80) | | | (227,135) | |
Principal collections on loans and direct financing receivables | | (2) | | | (5,205) | |
Provisions for impairment | | | | | (7,810) | |
Other (g) | | (2) | | | (14,793) | |
Gross investments, December 31, 2018 | | | | | 7,605,070 | |
Less accumulated depreciation and amortization | | | | | (585,913) | |
Net investments, December 31, 2018 | | 2,255 | | $ | 7,019,157 | |
| (a) | | Includes $0.8 million during 2016, $1.2 million during 2017 and $2.6 million during 2018 of interest capitalized to properties under construction. |
| (b) | | Excludes $15.9 million of tenant improvement advances disbursed in 2016 which were accrued as of December 31, 2015. |
| (c) | | Includes $17.5 million of mortgage loans made to the purchasers of four real estate properties sold. |
| (d) | | Excludes $23.5 million of tenant improvement advances disbursed in 2017 which were accrued as of December 31, 2016. |
| (e) | | One loan receivable was repaid in full through a $2.0 million non-cash transaction in which the Company acquired the underlying mortgaged property and leased it back to the borrower. |
| (f) | | Excludes $14.4 million of tenant improvement advances disbursed in 2018 which were accrued as of December 31, 2017. |
| (g) | | Includes $14.3 million representing the gross carrying amount of two real estate properties surrendered to the lender in exchange for the release of the related indebtedness (Note 4). |
Significant Credit and Revenue Concentration
STORE Capital’s real estate investments are leased or financed to more than 400 customers geographically dispersed throughout 49 states. Only one state, Texas (12%), accounted for 10% or more of the total dollar amount of STORE Capital’s investment portfolio at December 31, 2018. None of the Company’s customers represented more than 10% of the Company’s real estate investment portfolio at December 31, 2018, with the largest customer representing 2.9% of the total investment portfolio. On an annualized basis, the largest customer represented 2.7% of the Company’s total annualized investment portfolio revenues as of December 31, 2018. The Company’s customers operate their businesses across more than 600 concepts and the largest of these concepts represented 2.4% of the Company’s total annualized investment portfolio revenues as of December 31, 2018.
The following table shows information regarding the diversification of the Company’s total investment portfolio among the different industries in which its tenants and borrowers operate as of December 31, 2018 (dollars in thousands):
| | | | | | | | |
| | | | | | | Percentage of | |
| | Number of | | Dollar | | Total Dollar | |
| | Investment | | Amount of | | Amount of | |
| | Locations | | Investments | | Investments | |
Restaurants | | 798 | | $ | 1,272,835 | | 17 | % |
Furniture stores | | 54 | | | 420,710 | | 5 | |
Early childhood education centers | | 185 | | | 419,132 | | 5 | |
Health clubs | | 76 | | | 397,717 | | 5 | |
Movie theaters | | 38 | | | 350,149 | | 5 | |
Farm and ranch supply stores | | 41 | | | 346,362 | | 5 | |
Automotive repair and maintenance | | 139 | | | 312,043 | | 4 | |
All manufacturing industries | | 207 | | | 1,260,012 | | 17 | |
All other service industries | | 604 | | | 2,116,163 | | 28 | |
All other retail industries | | 113 | | | 709,947 | | 9 | |
Total | | 2,255 | | $ | 7,605,070 | | 100 | % |
Intangible Lease Assets
The following details intangible lease assets and related accumulated amortization at December 31 (in thousands):
| | | | | | | |
| | 2018 | | 2017 | |
In-place lease assets | | $ | 54,293 | | $ | 56,547 | |
Ground lease interest assets | | | 21,363 | | | 21,363 | |
Above-market lease assets | | | 9,492 | | | 9,492 | |
Total intangible lease assets | | | 85,148 | | | 87,402 | |
Accumulated amortization | | | (29,223) | | | (24,184) | |
Net intangible lease assets | | $ | 55,925 | | $ | 63,218 | |
Aggregate lease intangible amortization included in expense was $5.8 million, $6.3 million and $6.4 million during the years ended December 31, 2018, 2017 and 2016, respectively. The amount amortized as a decrease to rental revenue for capitalized above‑market lease intangibles was $1.1 million, $1.1 million and $1.2 million for the years ended December 31, 2018, 2017 and 2016, respectively.
Based on the balance of the intangible assets as of December 31, 2018, the aggregate amortization expense is expected to be $5.3 million in 2019, $4.8 million in 2020, $4.5 million in 2021, $4.3 million in 2022 and $3.8 million in 2023; the amount expected to be amortized as a decrease to rental revenue is $1.1 million for the years 2019 and 2020, $0.5 million in 2021 and $0.4 million in the years 2022 and 2023. The weighted average remaining amortization period is approximately nine years for the in‑place lease intangibles, approximately 45 years for the amortizing ground lease interests and approximately six years for the above‑market lease intangibles.
Real Estate Investments
The Company’s investment properties are leased to tenants under long‑term operating leases that typically include one or more renewal options. The weighted average remaining noncancelable lease term at December 31, 2018 was approximately 14 years. Substantially all of the leases are triple‑net, which means that the lessees are responsible for the payment of all property operating expenses, including property taxes, maintenance and insurance; therefore, the Company is generally not responsible for repairs or other capital expenditures related to the properties while the triple-net leases are in effect. At December 31, 2018, eight of the Company’s properties were vacant and not subject to a lease.
Scheduled future minimum rentals to be received under the remaining noncancelable term of the operating leases in place as of December 31, 2018, are as follows (in thousands):
| | | | |
2019 | | $ | 585,497 | |
2020 | | | 583,257 | |
2021 | | | 582,375 | |
2022 | | | 582,658 | |
2023 | | | 579,637 | |
Thereafter | | | 5,494,077 | |
Total future minimum rentals | | $ | 8,407,501 | |
Since lease renewal periods are exercisable at the option of the lessee, the preceding table presents future minimum lease payments due during the initial lease term only. In addition, the future minimum lease payments do not include any contingent rentals such as lease escalations based on future changes in CPI.
Loans and Direct Financing Receivables
At December 31, 2018, the Company held 37 loans receivable with an aggregate carrying amount of $166.3 million. Twenty-two of the loans are mortgage loans secured by land and/or buildings and improvements on the mortgaged property. Ten of the mortgage loans are shorter-term loans (maturing prior to 2023) that generally require monthly interest-only payments for an established period and then monthly principal and interest payments with a balloon payment at maturity. The remaining mortgage loans receivable generally require the borrowers to make monthly principal and interest payments based on a 40-year amortization period with balloon payments, if any, at maturity or earlier upon the occurrence of certain other events. The interest rates on 11 of the mortgage loans are subject to increases over the term of the loans. The other loans are primarily loans secured by a tenant’s equipment or other assets and generally require the borrower to make monthly interest‑only payments with a balloon payment at maturity.
The Company’s loans and direct financing receivables are summarized below (dollars in thousands):
| | | | | | | | | | | | |
| | Interest | | Maturity | | December 31, | |
Type | | Rate (a) | | Date | | 2018 | | 2017 | |
Ten mortgage loans receivable | | 8.27 | % | | 2019 - 2022 | | $ | 49,934 | | $ | 29,079 | |
Four mortgage loans receivable | | 8.49 | % | | 2032 - 2038 | | | 17,666 | | | 42,827 | |
Eight mortgage loans receivable (b) | | 8.73 | % | | 2051 - 2058 | | | 88,019 | | | 58,752 | |
Total mortgage loans receivable | | | | | | | | 155,619 | | | 130,658 | |
Fifteen equipment and other loans receivable | | 8.76 | % | | 2019 - 2025 | | | 12,013 | | | 11,944 | |
Total principal amount outstanding—loans receivable | | | | | | | | 167,632 | | | 142,602 | |
Unamortized loan origination costs | | | | | | | | 1,249 | | | 1,245 | |
Allowance for loan losses | | | | | | | | (2,538) | | | (1,500) | |
Direct financing receivables | | | | | | | | 184,859 | | | 129,106 | |
Total loans and direct financing receivables | | | | | | | $ | 351,202 | | $ | 271,453 | |
| (a) | | Represents the weighted average interest rate as of the balance sheet date. |
| (b) | | Four of these mortgage loans allow for prepayment in whole, but not in part, with penalties ranging from 20% to 70% depending on the timing of the prepayment. |
The long-term mortgage loans receivable generally allow for prepayments in whole, but not in part, without penalty or with penalties ranging from 1% to 20%, depending on the timing of the prepayment, except as noted in the table above. All other loans receivable allow for prepayments in whole or in part without penalty. Absent prepayments, scheduled maturities are expected to be as follows (in thousands):
| | | | | | | | | | |
| | Scheduled | | | | | |
| | Principal | | Balloon | | Total | |
| | Payments | | Payments | | Payments | |
2019 | | $ | 3,407 | | $ | 21,453 | | $ | 24,860 | |
2020 | | | 1,884 | | | 19,523 | | | 21,407 | |
2021 | | | 1,115 | | | 6,208 | | | 7,323 | |
2022 | | | 887 | | | 8,474 | | | 9,361 | |
2023 | | | 791 | | | 1,203 | | | 1,994 | |
Thereafter | | | 90,638 | | | 12,049 | | | 102,687 | |
Total principal payments | | $ | 98,722 | | $ | 68,910 | | $ | 167,632 | |
As of December 31, 2018 and 2017, the Company had $184.9 million and $129.1 million, respectively, of investments accounted for as direct financing leases; the components of the investments accounted for as direct financing receivables were as follows (in thousands):
| | | | | | | |
| | 2018 | | 2017 | |
Minimum lease payments receivable | | $ | 424,305 | | $ | 305,438 | |
Estimated residual value of leased assets | | | 24,053 | | | 15,521 | |
Unearned income | | | (263,499) | | | (191,853) | |
Net investment | | $ | 184,859 | | $ | 129,106 | |
As of December 31, 2018, the future minimum lease payments to be received under the direct financing lease receivables is expected to average approximately $18.0 million for each of the next five years.
4. Debt
Credit Facility
The Company has an unsecured revolving credit facility with a group of lenders that is used to partially fund real estate acquisitions pending the issuance of long-term, fixed-rate debt. In February 2018, the Company expanded its credit facility from $500 million to $600 million and increased the accordion feature from $300 million to $800 million, which now allows the size of the facility to be increased up to $1.4 billion. The amended facility matures in February 2022 and includes two six-month extension options, subject to certain conditions and the payment of a 0.075% extension fee. At December 31, 2018, the Company had $135 million of borrowings outstanding on the facility.
Borrowings under the amended facility require monthly payments of interest at a rate selected by the Company of either (1) LIBOR plus a credit spread ranging from 0.825% to 1.55%, or (2) the Base Rate, as defined in the credit agreement, plus a credit spread ranging from 0.00% to 0.55%. The credit spread used is based on the Company’s credit rating as defined in the credit agreement. The Company is required to pay a facility fee on the total commitment amount ranging from 0.125% to 0.30%. Currently, the applicable credit spread for LIBOR-based borrowings is 1.00% and the facility fee is 0.20%.
Under the terms of the amended facility, the Company is subject to various restrictive financial and nonfinancial covenants which, among other things, require the Company to maintain certain leverage ratios, cash flow and debt service coverage ratios, secured borrowing ratios and a minimum level of tangible net worth. Certain of these ratios are based on the Company’s pool of unencumbered assets, which aggregated approximately $4.6 billion at December 31, 2018.
The facility is recourse to the Company and, as of December 31, 2018, the Company was in compliance with the covenants under the facility.
At December 31, 2018 and 2017, unamortized financing costs related to the Company’s credit facility totaled $3.1 million and $1.7 million, respectively, and are included in other assets, net, on the consolidated balance sheets.
Unsecured Notes and Term Loans Payable, net
The Company has entered into Note Purchase Agreements (NPAs) with institutional purchasers that provided for the private placement of three series of senior unsecured notes aggregating $375 million (the Notes). Interest on the Notes is payable semi-annually in arrears in May and November of each year. On each interest payment date, the interest rate on each series of Notes may be increased by 1.0% should the Company’s Applicable Credit Rating (as defined in the NPAs) fail to be an investment-grade credit rating; the increased interest rate would remain in effect until the next interest payment date on which the Company obtains an investment grade credit rating. The Company may prepay at any time all, or any part, of any series of Notes, in an amount not less than 5% of the aggregate principal amount of the series then outstanding in the case of a partial prepayment, at 100% of the principal amount so prepaid plus a Make-Whole Amount (as defined in the NPAs). The Notes are senior unsecured obligations of the Company.
The NPAs contain a number of financial covenants that are similar to the Company’s unsecured credit facility as summarized above. Subject to the terms of the NPAs and the Notes, upon certain events of default, including, but not limited to, (i) a payment default under the Notes, and (ii) a default in the payment of certain other indebtedness by the Company or its subsidiaries, all amounts outstanding under the Notes will become due and payable at the option of the purchasers. As of December 31, 2018, the Company was in compliance with its covenants under the NPAs.
In March 2018, the Company completed a public offering of $350 million in aggregate principal amount of senior unsecured notes (Public Notes). The Public Notes have a coupon rate of 4.50% and interest is payable semi-annually in arrears in March and September of each year. The notes were issued at 99.515% of their principal amount.
The supplemental indenture governing the Public Notes contains various restrictive covenants, including limitations on the Company’s ability to incur additional secured and unsecured indebtedness. As of December 31, 2018, the Company was in compliance with these covenants. The Public Notes can be redeemed, in whole or in part, at par within three months of their maturity date or at a redemption price equal to the sum of (i) the principal amount of the notes being redeemed plus accrued and unpaid interest and (ii) the make-whole premium, as defined in the supplemental indenture governing these notes.
In April 2016, the Company entered into a $100 million floating-rate, unsecured five-year term loan and, in March 2017, the Company entered into a second $100 million floating-rate, unsecured term loan. This second loan is a two-year loan which has three one-year extension options. The interest rate on these loans resets monthly at one-month LIBOR plus a credit rating-based credit spread ranging from 0.90% to 1.75%; the credit spread currently applicable to the Company is 1.10%. The Company has entered into interest rate swap agreements that effectively convert the variable interest rates on the term loans to fixed rates. The term loans were arranged with lenders who also participate in the Company’s unsecured revolving credit facility and, in connection with the Company’s amendment of its credit facility in February 2018 as described above, the terms of these term loans were incorporated into the amended credit facility. The financial covenants of the term loans match the covenants of the unsecured credit facility. The term loans are senior unsecured obligations of the Company and may be prepaid at any time without penalty.
The Company’s senior unsecured notes and term loans payable are summarized below (dollars in thousands):
| | | | | | | | | | | | | | |
| | Maturity | | Interest | | December 31, | | | |
| | Date | | Rate | | 2018 | | 2017 | | | |
Notes Payable: | | | | | | | | | | | | | | |
Series A issued November 2015 | | Nov. 2022 | | 4.95 | % | | $ | 75,000 | | $ | 75,000 | | | |
Series B issued November 2015 | | Nov. 2024 | | 5.24 | % | | | 100,000 | | | 100,000 | | | |
Series C issued April 2016 | | Apr. 2026 | | 4.73 | % | | | 200,000 | | | 200,000 | | | |
| | | | | | | | | | | | | | |
Public Notes issued March 2018 | | Mar. 2028 | | 4.50 | % | | | 350,000 | | | — | | | |
Total notes payable | | | | | | | | 725,000 | | | 375,000 | | | |
Term Loans: | | | | | | | | | | | | | | |
Term Loan issued March 2017 | | Mar. 2019 | | 2.57 | % (a) | | | 100,000 | | | 100,000 | | | |
Term Loan issued April 2016 | | Apr. 2021 | | 2.44 | % (a) | | | 100,000 | | | 100,000 | | | |
Total term loans | | | | | | | | 200,000 | | | 200,000 | | | |
Unamortized discount | | | | | | | | (1,563) | | | — | | | |
Unamortized deferred financing costs | | | | | | | | (6,717) | | | (4,405) | | | |
Total unsecured notes and term loans payable, net | | | | | | | $ | 916,720 | | $ | 570,595 | | | |
| (a) | | Loan is a variable‑rate loan which resets monthly at one-month LIBOR + the applicable credit spread which was 1.10% at December 31, 2018. The Company has entered into interest rate swap agreements that effectively convert the floating rate to the fixed rate noted above as of December 31, 2018. |
Non‑recourse Debt Obligations of Consolidated Special Purpose Entities, net
During 2012, the Company implemented the STORE Master Funding debt program pursuant to which certain of its consolidated special purpose entities issue multiple series of non‑recourse net‑lease mortgage notes from time to time that are collateralized by the assets and related leases (collateral) owned by these entities. One of the principal features of the program is that, as additional series of notes are issued, new collateral is contributed to the collateral pool, thereby increasing the size and diversity of the collateral pool for the benefit of all noteholders, including those who invested in prior series. Another feature of the program is the ability to substitute collateral from time to time subject to meeting certain prescribed conditions and criteria. The notes are generally segregated into Class A amortizing notes and Class B non‑amortizing notes. The Company has retained each of the Class B notes which aggregate $147.0 million at December 31, 2018.
The Class A notes require monthly principal and interest payments with a balloon payment due at maturity and these notes may be prepaid at any time, subject to a yield maintenance prepayment premium if prepaid more than 24 or 36 months prior to maturity. As of December 31, 2018, the aggregate collateral pool securing the net‑lease mortgage notes was comprised primarily of single-tenant commercial real estate properties with an aggregate investment amount of approximately $2.7 billion.
In conjunction with the issuance of the STORE Master Funding Series 2018-1 notes in October 2018, the Company prepaid, without penalty, the Series 2013-1, Class A-1 notes and Series 2013-2, Class A-1 notes; these notes had an aggregate outstanding balance of $233.3 million at the time of prepayment, were issued in 2013, scheduled to mature in 2020, and bore an interest rates of 4.16% and 4.37%, respectively. The Company recognized $1.7 million of accelerated amortization of deferred financing costs associated with this debt. As a result of this prepayment and the size of the collateral pool at the time of the issuance of the Series 2018-1 notes, no additional collateral was contributed to the collateral pool.
A number of additional consolidated special purpose entity subsidiaries of the Company have financed their real estate properties with traditional first mortgage debt. The notes generally require monthly principal and interest payments with balloon payments due at maturity. In general, these mortgage notes payable can be prepaid in whole or in part upon payment of a yield maintenance premium. The mortgage notes payable are collateralized by real estate properties owned by these consolidated special purpose entity subsidiaries with an aggregate investment amount of approximately $303.1 million at December 31, 2018.
The mortgage notes payable, which are obligations of the consolidated special purpose entities described in Note 2, contain various covenants customarily found in mortgage notes, including a limitation on the issuing entity’s ability to incur additional indebtedness on the underlying real estate. Although this mortgage debt generally is non‑recourse, there are customary limited exceptions to recourse for matters such as fraud, misrepresentation, gross negligence or willful misconduct, misapplication of payments, bankruptcy
and environmental liabilities. Certain of the mortgage notes payable also require the posting of cash reserves with the lender or trustee if specified coverage ratios are not maintained by the Company or one of its tenants. Beginning on September 1, 2017, the Company did not make the scheduled debt service payments due on a $12.9 million note payable (see table below) because the two properties that secured this note were vacant and not generating cash flow to cover the debt service. During the first quarter of 2018, the Company completed discussions with the special servicer regarding this note and reached an agreement to surrender the collateral properties in exchange for the release of the indebtedness, including any accrued interest, encumbering them. As a result, during the first quarter of 2018, the Company recognized a $0.8 million gain on the extinguishment of this debt, which is included in interest expense on the consolidated statement of income.
The Company’s non-recourse debt obligations of consolidated special purpose entity subsidiaries are summarized below (dollars in thousands):
| | | | | | | | | | | | | |
| | Maturity | | Interest | December 31, | | | |
| | Date | | Rate | 2018 | | 2017 | | | |
Non-recourse net-lease mortgage notes: | | | | | | | | | | | | | |
$150,000 Series 2013-1, Class A-1 | | | | | | $ | — | | $ | 137,960 | | | |
$107,000 Series 2013-2, Class A-1 | | | | | | | — | | | 99,393 | | | |
$77,000 Series 2013-3, Class A-1 | | Nov. 2020 | | 4.24 | % | | 70,589 | | | 71,982 | | | |
$120,000 Series 2014-1, Class A-1 | | Apr. 2021 | | 4.21 | % | | 117,250 | | | 117,850 | | | |
$95,000 Series 2015-1, Class A-1 | | Apr. 2022 | | 3.75 | % | | 93,258 | | | 93,733 | | | |
$102,000 Series 2013-1, Class A-2 | | Mar. 2023 | | 4.65 | % | | 91,841 | | | 93,812 | | | |
$97,000 Series 2013-2, Class A-2 | | Jul. 2023 | | 5.33 | % | | 88,320 | | | 90,104 | | | |
$100,000 Series 2013-3, Class A-2 | | Nov. 2023 | | 5.21 | % | | 91,675 | | | 93,483 | | | |
$140,000 Series 2014-1, Class A-2 | | Apr. 2024 | | 5.00 | % | | 136,792 | | | 137,492 | | | |
$150,000 Series 2018-1, Class A-1 | | Oct. 2024 | | 3.96 | % | | 149,484 | | | — | | | |
$50,000 Series 2018-1, Class A-3 | | Oct. 2024 | | 4.40 | % | | 49,958 | | | — | | | |
$270,000 Series 2015-1, Class A-2 | | Apr. 2025 | | 4.17 | % | | 265,050 | | | 266,400 | | | |
$200,000 Series 2016-1, Class A-1 (2016) | | Oct. 2026 | | 3.96 | % | | 192,187 | | | 195,877 | | | |
$135,000 Series 2016-1, Class A-2 (2017) | | Apr. 2027 | | 4.32 | % | | 130,984 | | | 133,426 | | | |
$228,000 Series 2018-1, Class A-2 | | Oct. 2027 | | 4.29 | % | | 227,215 | | | — | | | |
$164,000 Series 2018-1, Class A-4 | | Oct. 2027 | | 4.74 | % | | 163,863 | | | — | | | |
Total non-recourse net-lease mortgage notes | | | | | | | 1,868,466 | | | 1,531,512 | | | |
Non-recourse mortgage notes payable: | | | | | | | | | | | | | |
$8,000 note issued January 2012; assumed in December 2013 | | | | | | | — | | | 6,664 | | | |
$20,530 note issued December 2011; amended February 2012 | | | | | | | — | | | 17,840 | | | |
$14,950 note issued July 2012 | | | | | | | — | | | 12,874 | | | |
$21,125 note issued July 2015 | | | | | | | — | | | 21,015 | | | |
$6,500 note issued December 2012 | | Dec. 2019 | | 4.806 | % | | 5,560 | | | 5,734 | | | |
$16,100 note issued February 2014 | | Mar. 2021 | | 4.83 | % | | 14,388 | | | 14,783 | | | |
$13,000 note issued May 2012 | | May 2022 | | 5.195 | % | | 11,081 | | | 11,418 | | | |
$26,000 note issued August 2012 | | Sept. 2022 | | 5.05 | % | | 22,315 | | | 22,987 | | | |
$6,400 note issued November 2012 | | Dec. 2022 | | 4.707 | % | | 5,496 | | | 5,665 | | | |
$11,895 note issued March 2013 | | Apr. 2023 | | 4.7315 | % | | 10,328 | | | 10,637 | | | |
$17,500 note issued August 2013 | | Sept. 2023 | | 5.46 | % | | 15,583 | | | 15,993 | | | |
$10,075 note issued March 2014 | | Apr. 2024 | | 5.10 | % | | 9,365 | | | 9,532 | | | |
$65,000 note issued June 2016 | | Jul. 2026 | | 4.75 | % | | 62,609 | | | 63,635 | | | |
$7,750 note issued February 2013 | | Mar. 2038 | | 4.81 | % (a) | | 6,723 | | | 6,924 | | | |
$6,944 notes issued March 2013 | | Apr. 2038 | | 4.50 | % (b) | | 5,957 | | | 6,148 | | | |
Total non-recourse mortgage notes payable | | | | | | | 169,405 | | | 231,849 | | | |
Unamortized discount | | | | | | | (455) | | | (383) | | | |
Unamortized deferred financing costs | | | | | | | (28,824) | | | (26,672) | | | |
Total non-recourse debt obligations of consolidated special purpose
entities, net | | | | | | $ | 2,008,592 | | $ | 1,736,306 | | | |
| (a) | | Interest rate is effective until March 2023 and will reset to greater of (1) initial rate plus 400 basis points or (2) Treasury rate plus 400 basis points. |
| (b) | | Interest rate is effective until March 2023 and will reset to the lender’s then prevailing interest rate. |
Credit Risk Related Contingent Features
The Company has agreements with derivative counterparties, which provide generally that the Company could be declared in default on its derivative obligations if the Company defaults on the underlying indebtedness following acceleration of the indebtedness by the lender. As of December 31, 2018, the Company had no interest rate swaps that were in a liability position; the termination value of its interest rate lock agreements was a liability of $6.9 million.
Long-term Debt Maturity Schedule
As of December 31, 2018, the scheduled maturities, including balloon payments, on the Company’s aggregate long-term debt obligations are expected to be as follows (in thousands):
| | | | | | | | | | |
| | Scheduled | | | | | | |
| | Principal | | Balloon | | | | |
| | Payments | | Payments | | Total | |
2019 | | $ | 29,917 | | $ | 105,394 | | $ | 135,311 | |
2020 | | | 29,827 | | | 67,848 | | | 97,675 | |
2021 | | | 26,067 | | | 229,366 | | | 255,433 | |
2022 | | | 25,726 | | | 200,829 | | | 226,555 | |
2023 | | | 21,391 | | | 265,357 | | | 286,748 | |
Thereafter | | | 56,026 | | | 1,905,123 | | | 1,961,149 | |
| | $ | 188,954 | | $ | 2,773,917 | | $ | 2,962,871 | |
5. Income Taxes
The Company’s total current income tax expense was as follows (in thousands):
| | | | | | | | | | |
| | Year ended December 31, | |
| | 2018 | | 2017 | | 2016 | |
Federal income tax | | $ | 106 | | $ | 35 | | $ | 93 | |
State income tax | | | 536 | | | 423 | | | 341 | |
Total current income tax expense | | $ | 642 | | $ | 458 | | $ | 434 | |
The Company’s deferred income tax expense and its ending balance in deferred tax assets and liabilities were immaterial for 2018, 2017 and 2016.
The Company files federal, state and local income tax returns. Certain state income tax returns filed for 2014 and tax returns filed for 2015 through 2017 remain subject to examination. The Company has a net operating loss carryforward (NOL) for income tax purposes of $1.5 million that was generated during the year ended December 31, 2011 and, therefore, has no impact on income tax expense for the three years ended December 31, 2018. This loss is available to reduce future REIT taxable income until it expires in 2031. At this time, the Company does not believe it is likely it will use the NOL to reduce future taxable income; therefore, any deferred tax asset associated with such NOL has been fully reserved.
Management of the Company determines whether any tax positions taken or expected to be taken meet the “more‑likely‑than‑not” threshold of being sustained by the applicable federal, state or local tax authority. As of December 31, 2018 and 2017, management concluded that there is no tax liability relating to uncertain income tax positions. The Company’s policy is to recognize interest related to any underpayment of income taxes as interest expense and to recognize any penalties as operating expenses. There was no accrual for interest or penalties at December 31, 2018 and 2017.
The Company’s common stock distributions were characterized for federal income tax purposes as follows (per share):
| | | | | | | | | | |
| | Year ended December 31, | |
| | 2018 | | 2017 | | 2016 | |
Ordinary income dividends | | $ | 1.1125 | | $ | 0.9883 | | $ | 0.9998 | |
Capital gain dividends | | | 0.1632 | | | 0.1590 | | | 0.0755 | |
Return of capital | | | — | | | 0.0327 | | | 0.0247 | |
Total | | $ | 1.2757 | (a) | $ | 1.1800 | | $ | 1.1000 | |
| (a) | | Includes $0.0157 of distributions per share paid in January 2019. |
6. Stockholders’ Equity
In September 2016, the Company established its first “at the market” equity distribution program, or ATM program, pursuant to which, from time to time, it may offer and sell registered shares of common stock through a group of banks acting as its sales agents. Under the program established in September 2016, the Company could offer and sell up to a maximum amount of $400 million of common stock (the 2016 ATM Program). In February 2018, the Company established a $500 million ATM program (the 2018-1 ATM Program) and terminated the 2016 ATM Program. In November 2018, the Company established a $750 million ATM program (the 2018-2 ATM Program) and terminated the 2018-1 ATM Program.
The following tables outline the common stock issuances under these programs (in millions except share and per share information):
| | | | | | | | | | | | | | | | |
| Year Ended December 31, 2018 |
ATM Program | Shares Sold | | Weighted Average Price per Share | | Gross Proceeds | | Sales Agents' Commissions | | Other Offering Expenses | | Net Proceeds |
$750 million 2018-2 ATM Program | 8,232,742 | | $ | 29.78 | | $ | 245.1 | | $ | (3.7) | | $ | (0.3) | | $ | 241.1 |
$500 million 2018-1 ATM Program | 18,536,871 | | $ | 26.95 | | | 499.6 | | | (7.5) | | | (0.6) | | | 491.5 |
$400 million 2016 ATM Program | 355,946 | | $ | 25.92 | | | 9.2 | | | (0.1) | | | — | | | 9.1 |
Total | 27,125,559 | | $ | 27.79 | | $ | 753.9 | | $ | (11.3) | | $ | (0.9) | | $ | 741.7 |
| | | | | | | | | | | | | | | | |
| Inception of Program Through December 31, 2018 |
ATM Program | Shares Sold | | Weighted Average Price per Share | | Gross Proceeds | | Sales Agents' Commissions | | Other Offering Expenses | | Net Proceeds |
$750 million 2018-2 ATM Program | 8,232,742 | | $ | 29.78 | | $ | 245.1 | | $ | (3.7) | | $ | (0.3) | | $ | 241.1 |
$500 million 2018-1 ATM Program | 18,536,871 | | $ | 26.95 | | | 499.6 | | | (7.5) | | | (0.6) | | | 491.5 |
$400 million 2016 ATM Program | 12,195,601 | | $ | 26.15 | | | 318.9 | | | (4.8) | | | (0.9) | | | 313.2 |
Total | 38,965,214 | | $ | 27.30 | | $ | 1,063.6 | | $ | (16.0) | | $ | (1.8) | | $ | 1,045.8 |
The Company declared dividends payable to common stockholders totaling $267.9 million, $223.8 million and $170.8 million during the years ended December 31, 2018, 2017 and 2016, respectively.
7. Long‑Term Incentive Plans
In November 2014, the Company’s Board of Directors approved the adoption of the STORE Capital Corporation 2015 Omnibus Equity Incentive Plan (the 2015 Plan), which permits the issuance of up to 6,903,076 shares of common stock, which represented 6% of the number of issued and outstanding shares of the Company’s common stock upon the completion of the IPO. As of December 31, 2018, 4,875,978 shares are available for grant under the 2015 Plan.
In 2012, the Company’s Board of Directors established the STORE Capital Corporation 2012 Long‑Term Incentive Plan (the 2012 Plan) which permits the issuance of up to 1,035,400 shares of common stock. As of December 31, 2018, 252,907 shares remain available for grant under the 2012 Plan.
Both the 2015 and 2012 Plans allow for awards to officers, directors and key employees of the Company in the form of restricted shares of the Company’s common stock and other equity-based awards including performance‑based grants.
The following table summarizes the restricted stock award (RSA) activity:
| | | | | | | | | | | | | | | | |
| | 2018 | | 2017 | | 2016 | |
| | | | Weighted | | | | Weighted | | | | Weighted | |
| | Number of | | Average Share | | Number of | | Average Share | | Number of | | Average Share | |
| | Shares | | Price (1) | | Shares | | Price (1) | | Shares | | Price (1) | |
Outstanding non-vested shares, beginning of year | | 403,751 | | $ | 22.24 | | 459,716 | | $ | 19.95 | | 577,651 | | $ | 17.58 | |
Shares granted | | 135,496 | | $ | 24.14 | | 166,575 | | $ | 23.92 | | 104,086 | | $ | 25.65 | |
Shares vested | | (192,011) | | $ | 20.27 | | (213,233) | | $ | 18.55 | | (222,021) | | $ | 16.38 | |
Shares forfeited | | (16,235) | | $ | 23.33 | | (9,307) | | $ | 23.80 | | — | | $ | — | |
Outstanding non-vested shares, end of year | | 331,001 | | $ | 24.10 | | 403,751 | | $ | 22.24 | | 459,716 | | $ | 19.95 | |
The Company grants RSAs to its officers, directors and key employees. Generally, restricted shares granted to the Company’s employees and its chairman vest in 25% increments in February of each year. The other independent directors receive annual grants that vest at the end of each term served. As permitted, the Company does not estimate a forfeiture rate for non-vested shares. Accordingly, unexpected forfeitures will lower share-based compensation expense during the applicable period. Under the terms of the 2015 and 2012 Plans, the Company pays non-refundable dividends to the holders of non-vested shares. Applicable accounting guidance requires that the dividends paid to holders of these non-vested shares be charged as compensation expense to the extent that they relate to non-vested shares that do not or are not expected to vest. The Company estimates the fair value of RSAs at the date of grant and recognizes that amount in expense over the vesting period as the greater of the amount amortized on a straight‑line basis or the amount vested. The fair value of the RSAs is based on the closing price per share of the Company’s common stock on the date of the grant.
The Company has granted restricted stock unit awards (RSUs) with (a) both a market and a performance condition or (b) a market condition to its executive officers; these awards also contain a service condition. The number of common shares to be earned from each grant range from zero to 100% of the total RSUs granted over a three-year performance period. The following table summarizes the RSU activity:
| | | | | | | |
| | Number of RSUs | |
| | 2018 | | 2017 | | 2016 | |
Non-vested and outstanding, beginning of year | | 919,041 | | 719,434 | | 348,220 | |
RSUs granted | | 540,975 | | 373,719 | | 371,214 | |
RSUs vested | | (289,556) | | (174,112) | | — | |
RSUs forfeited | | (79,745) | | — | | — | |
RSUs not earned | | (74,854) | | — | | — | |
Non-vested and outstanding, end of year | | 1,015,861 | | 919,041 | | 719,434 | |
For the 2018 grants, one-half of the common shares to be earned is based on the Company’s total shareholder return (TSR) measured against a market index and one-half of the number of shares to be earned is based on the growth in a key Company performance indicator over a three-year period. For the 2017 and 2016 grants, one-half of the number of common shares to be earned is based on the Company’s TSR measured against the benchmark TSR of a peer group or market index and one-half of the number of shares to be earned is based on the Company’s TSR measured against pre-determined thresholds. The TSR is a measure of stock price appreciation plus dividends paid during the measurement period. To the extent market and service conditions are met, the earned RSUs from each grant awarded prior to 2018 vest 50% at the end of the three-year performance period and, subject to continued employment, 50% at the end of one additional year. The 2018 awards vest 100% at the end of the three-year performance period to the extent market, performance and service conditions are met. The RSUs accrue dividend equivalents which are paid only if the award vests. As of both December 31, 2018 and 2017, the Company accrued $1.1 million related to dividend equivalents expected to be paid on awards earned through December 31,
2018; during the year ended December 31, 2018, the Company paid $585,000 of these accrued dividend equivalents to its executive officers.
The Company valued the RSUs with a performance condition based on the closing price per share of the Company’s common stock on the date of the grant multiplied by the number of awards expected to be earned. The Company valued the RSUs with a market condition using a Monte Carlo simulation model on the date of grant which resulted in grant date fair values of $3.1 million, $3.6 million and $6.1 million for the 2018, 2017 and 2016 grants, respectively. The estimated fair value is amortized to expense on a tranche by tranche basis ratably over the vesting periods. The following assumptions were used in the Monte Carlo simulation for computing the grant date fair value of the RSUs with a market condition for each grant year:
| | | | | | | | | | |
| | 2018 | | 2017 | | 2016 | |
Volatility | | 21.00 | % | | 21.00 | % | | 21.00 | % | |
Risk-free interest rate | | 2.38 | % | | 1.54 | % | | 0.91 | % | |
Dividend yield | | 0.00 | % | | 0.00 | % | | 0.00 | % | |
The 2015 and 2012 Plans each allow the Company’s employees to elect to satisfy the minimum statutory tax withholding obligation due upon vesting of RSAs and RSUs by allowing the Company to repurchase an amount of shares otherwise deliverable on the vesting date having a fair market value equal to the withholding obligation. During the years ended December 31, 2018, 2017 and 2016, the Company repurchased an aggregate 113,948 shares, 56,097 shares and 68,497 shares, respectively, in connection with this tax withholding obligation.
Compensation expense for equity‑based payments totaled $8.6 million, $7.9 million and $7.0 million for the years ended December 31, 2018, 2017 and 2016, respectively, and is included in general and administrative expenses. At December 31, 2018, STORE Capital had $11.7 million of unrecognized compensation cost related to non‑vested equity‑based compensation arrangements which will be recognized through February 2022.
8. Commitments and Contingencies
The Company is subject to various legal proceedings and claims that arise in the ordinary course of its business. Management believes that the final outcome of such matters will not have a material adverse effect on the Company’s financial position or results of operations.
In the normal course of business, the Company enters into various types of commitments to purchase real estate properties. These commitments are generally subject to the Company’s customary due diligence process and, accordingly, a number of specific conditions must be met before the Company is obligated to purchase the properties. As of December 31, 2018, the Company had commitments to its customers to fund improvements to owned or mortgaged real estate properties totaling approximately $78.5 million, of which $72.5 million is expected to be funded in the next twelve months. These additional investments will generally result in increases to the rental revenue or interest income due under the related contracts.
The Company has entered into a lease agreement with an unrelated third party for its corporate office space that will expire in July 2027; the lease allows for one five-year renewal period at the option of the Company. During the years ended December 31, 2018, 2017 and 2016, total rent expense was $721,000, $711,000 and $395,000, respectively. At December 31, 2018, the Company’s future minimum rental commitments under this noncancelable operating lease was approximately $735,000 in 2019, $748,000 in 2020, $762,000 in 2021, $776,000 in 2022, $790,000 in 2023 and $2.9 million thereafter.
As of December 31, 2018, STORE Capital had 21 properties in which it has ground lease interests and four properties where a portion of the land is subject to a ground lease. The Company is responsible for the ground lease payments under one of the contracts and payment obligations associated with five of the ground lease contracts have been prepaid in full. The ground lease payment obligations for the remaining properties are the responsibility of the tenants operating on the properties, in accordance with the Company’s leases with the respective tenants.
The minimum aggregate rental commitments under the operating ground leases, excluding the five prepaid ground leases, as of December 31, 2018 are as follows (in thousands):
| | | | | | | | | | |
| | | | Ground | | | | |
| | Ground | | Leases | | | | |
| | Leases | | Paid by | | | | |
| | Paid by | | STORE Capital's | | | | |
| | STORE Capital | | Tenants (a) | | Total | |
2019 | | $ | 29 | | $ | 2,028 | | $ | 2,057 | |
2020 | | | 31 | | | 1,723 | | | 1,754 | |
2021 | | | 31 | | | 1,563 | | | 1,594 | |
2022 | | | 31 | | | 1,513 | | | 1,544 | |
2023 | | | 31 | | | 1,526 | | | 1,557 | |
Thereafter | | | 3,107 | | | 36,457 | | | 39,564 | |
| | $ | 3,260 | | $ | 44,810 | | $ | 48,070 | |
| (a) | | STORE Capital’s tenants, who are generally sub-tenants under the ground leases, are responsible for paying the rent under these ground leases. In the event the tenant fails to pay the ground lease rent, the Company would be primarily responsible for the payment, assuming the Company does not re-tenant the property or sell the leasehold interest. Of the total $44.8 million commitment, $16.8 million is due for periods beyond the current term of the Company’s leases with the tenants. Excludes contingent rent due under three leases where the ground lease payment, or a portion thereof, is based on the level of the tenant’s sales. |
The Company has employment agreements with each of its executive officers that provide for minimum annual base salaries, and annual cash and equity incentive compensation based on the satisfactory achievement of reasonable performance criteria and objectives to be adopted by the Company’s Board of Directors each year. In the event an executive officer’s employment terminates under certain circumstances, the Company would be liable for cash severance, continuation of healthcare benefits and, in some instances, accelerated vesting of equity awards that he or she has been awarded as part of the Company’s incentive compensation program.
The Company has a defined contribution retirement savings plan qualified under Section 401(a) of the Internal Revenue Code (the 401(k) Plan). The 401(k) Plan is available to employees who have completed at least six consecutive months of service or, if earlier, one year of service with the Company. STORE Capital provides a matching contribution in cash, up to a maximum of 4% of compensation, which vests immediately. The matching contributions made by the Company totaled approximately $406,000 in 2018, $345,000 in 2017 and $308,000 in 2016.
9. Fair Value of Financial Instruments
The Company’s derivatives are required to be measured at fair value in the Company’s consolidated financial statements on a recurring basis. Derivatives are measured under a market approach, using prices obtained from a nationally recognized pricing service and pricing models with market observable inputs such as interest rates and equity index levels. These measurements are classified as Level 2 within the fair value hierarchy. At December 31, 2018 and 2017, the fair value of the Company’s derivative instruments was an asset of $253,000 and $2.8 million, respectively, included in other assets, net, on the consolidated balance sheets, and a liability of $4.3 million and a nominal amount, respectively, included in accrued expenses, deferred revenue and other liabilities on the consolidated balance sheets. Had the Company elected not to offset derivatives in the consolidated balance sheet as of December 31, 2018, the Company would have had derivative assets of $2.8 million associated with its three interest rate swap and related interest rate floor agreements and gross derivative liabilities of $6.9 million associated with its two treasury lock agreements. There were no derivative assets offset in derivative liabilities at December 31, 2017.
In addition to the disclosures for assets and liabilities required to be measured at fair value at the balance sheet date, companies are required to disclose the estimated fair values of all financial instruments, even if they are not carried at their fair value. The fair values of financial instruments are estimates based upon market conditions and perceived risks at December 31, 2018 and 2017. These estimates require management’s judgment and may not be indicative of the future fair values of the assets and liabilities.
Financial assets and liabilities for which the carrying values approximate their fair values include cash and cash equivalents, restricted cash, accounts receivable, accounts payable and tenant deposits. Generally these assets and liabilities are short‑term in duration and are recorded at fair value on the consolidated balance sheets. The Company believes the carrying value of the borrowings on its credit
facility approximate fair value based on their nature, terms and variable interest rate. Additionally, the Company believes the carrying values of its fixed‑rate loans receivable approximate fair values based on market quotes for comparable instruments or discounted cash flow analyses using estimates of the amount and timing of future cash flows, market rates and credit spreads.
The estimated fair values of the Company’s aggregate long-term debt obligations have been derived based on market observable inputs such as interest rates and discounted cash flow analyses using estimates of the amount and timing of future cash flows, market rates and credit spreads. These measurements are classified as Level 2 within the fair value hierarchy. At December 31, 2018, these debt obligations had an aggregate carrying value of $2,925.3 million and an estimated fair value of $2,988.8 million. At December 31, 2017, these debt obligations had an aggregate carrying value of $2,306.9 million and an estimated fair value of $2,407.0 million.
10. Quarterly Financial Information (Unaudited)
The following table summarizes the unaudited consolidated quarterly financial information for 2018 and 2017. All adjustments (consisting of only normal recurring accruals) necessary for a fair presentation of the interim periods presented are included. The calculation of basic and diluted per share amounts for each quarter is based on the weighted average shares outstanding for that period; consequently, the sum of the quarters may not necessarily be equal to the full year basic and diluted net income per share (amounts in thousands, except per share amounts):
| | | | | | | | | | | | | | | | |
| | First Quarter | | Second Quarter | | Third Quarter | | Fourth Quarter | | Total | |
2018 | | | | | | | | | | | | | | | | |
Total revenues | | $ | 125,842 | | $ | 131,205 | | $ | 137,005 | | $ | 146,704 | | $ | 540,756 | |
Net income | | | 49,960 | | | 62,201 | | | 48,225 | | | 56,584 | | | 216,970 | |
Net income per share of common stock—basic and diluted | | | 0.26 | | | 0.31 | | | 0.23 | | | 0.26 | | | 1.06 | |
Dividends declared per common share | | | 0.31 | | | 0.31 | | | 0.33 | | | 0.33 | | | 1.28 | |
| | | | | | | | | | | | | | | | |
| | First Quarter | | Second Quarter | | Third Quarter | | Fourth Quarter | | Total | |
2017 | | | | | | | | | | | | | | | | |
Total revenues | | $ | 107,971 | | $ | 114,208 | | $ | 110,544 | | $ | 120,124 | | $ | 452,847 | |
Net income | | | 31,390 | | | 61,060 | | | 28,580 | | | 41,008 | | | 162,038 | |
Net income per share of common stock—basic and diluted | | | 0.19 | | | 0.35 | | | 0.15 | | | 0.21 | | | 0.90 | |
Dividends declared per common share | | | 0.29 | | | 0.29 | | | 0.31 | | | 0.31 | | | 1.20 | |
Item 9. CHANGES IN AND DISAGREEMENTS WITH ACCOUNTANTS ON ACCOUNTING AND FINANCIAL DISCLOSURE
None.
Item 9A. CONTROLS AND PROCEDURES
Disclosure Controls and Procedures
As of the end of the period covered by this Annual Report on Form 10-K, we carried out an evaluation, under the supervision and with the participation of our management, including our Chief Executive Officer and our Chief Financial Officer, of the effectiveness of the design and operation of our disclosure controls and procedures (as such term is defined in Rules 13a-15(e) and 15d-15(e) under the Exchange Act). Based on that evaluation, our Chief Executive Officer and our Chief Financial Officer concluded that, as of the end of the period covered by this Annual Report on Form 10-K, the Company’s disclosure controls and procedures were effective.
Management’s Report on Internal Control over Financial Reporting
The management of the Company is responsible for establishing and maintaining adequate internal control over financial reporting (as such term is defined in Rules 13a-15(f) and 15d-15(f) under the Exchange Act) for the Company. Under the supervision and with the participation of the management, the Chief Executive Officer and Chief Financial Officer of the Company conducted an evaluation of the effectiveness of the internal control over financial reporting based on the framework in Internal Control — Integrated Framework issued by the Committee of Sponsoring Organizations (2013 Framework) (COSO). Based on such evaluation, management concluded that the Company’s internal control over financial reporting was effective as of December 31, 2018.
The Company’s internal control over financial reporting as of December 31, 2018 has been audited by Ernst & Young LLP, an independent registered public accounting firm, as stated in their report which is included herein.
Changes in Internal Control over Financial Reporting
There have not been any changes in the Company’s internal control over financial reporting (as such term is defined in Rules 13a-15(f) and 15d-15(f) under the Exchange Act) during the fourth fiscal quarter to which this report relates that materially affected, or are reasonably likely to materially affect, the internal control over financial reporting of the Company.
Item 9B. OTHER INFORMATION
None.
PART III
Item 10. DIRECTORS, EXECUTIVE OFFICERS AND CORPORATE GOVERNANCE
The information regarding Director Nominations under the heading "Governance – Proposal No. 1-Election of Directors," the information regarding Executive Officers under the heading “Executive Compensation – Executive Officers,” the information regarding Section 16(a) compliance under the heading "Ownership of Our Stock – Section 16(a) Beneficial Ownership Reporting Compliance," the information regarding our Code of Business Conduct and Ethics under the heading "Governance – Additional Corporate Governance Features," and the information regarding the Audit Committee under the heading "Governance – Board and Committee Governance" in the Company's 2019 Proxy Statement is incorporated herein by reference.
Item 11. EXECUTIVE COMPENSATION
The information regarding director compensation under the heading "Governance – 2018 Director Compensation" and the information under the subheadings "Compensation Discussion and Analysis," "Compensation Committee Report on Executive Compensation," "Compensation Committee Interlocks and Insider Participation," "Compensation Tables," and "Payments on Termination or
Change in Control" under the principal heading "Executive Compensation" in the Company's 2019 Proxy Statement is incorporated herein by reference
Item 12. SECURITY OWNERSHIP OF CERTAIN BENEFICIAL OWNERS AND MANAGEMENT AND RELATED STOCKHOLDER MATTERS
The information regarding share ownership under the heading "Ownership of Our Stock – Beneficial Ownership of Our Common Stock by Certain Beneficial Owners and Management” in the Company's 2019 Proxy Statement is incorporated herein by reference.
Securities Authorized for Issuance Under Equity Compensation Plans
The following information reflects certain information about our equity compensation plans as of December 31, 2018:
| | | | | | | |
| | Number of securities | | | | Number of securities | |
| | to be issued upon | | Weighted-average | | available for future issuance | |
| | exercise of | | exercise price of | | under equity compensation | |
| | outstanding options, | | outstanding options, | | plans (excluding securities | |
Plan category | | warrants and rights | | warrants and rights | | reflected in column (a)) | |
| | (a) | | (b) | | (c) | |
Equity compensation plans approved by stockholders | | | | | | 5,128,885 | (1) |
Equity compensation plans not approved by stockholders | | | | | | | |
Total | | — | | — | | 5,128,885 | |
| (1) | | Represents 4,875,978 shares available for future issuance under the STORE Capital Corporation 2015 Omnibus Equity Incentive Plan and 252,907 shares available for future issuance under the STORE Capital Corporation 2012 Long-Term Incentive Plan. |
Item 13. CERTAIN RELATIONSHIPS AND RELATED TRANSACTIONS, AND DIRECTOR INDEPENDENCE
The information regarding director independence and related party transactions under the heading "Governance – Director Independence and Related Party Transactions" in the Company's 2019 Proxy Statement is incorporated herein by reference.
Item 14. PRINCIPAL ACCOUNTANT FEES AND SERVICES
The information regarding Audit Fees, Audit-Related Fees, Tax Fees, All Other Fees and the Audit Committee’s policies and procedures on pre-approval of audit and permissible non-audit services of independent auditors under the heading "Audit Matters” in the Company's 2019 Proxy Statement is incorporated herein by reference.
PART IV
Item 15. EXHIBITS AND FINANCIAL STATEMENT SCHEDULES
(a) The following documents are filed as part of this Annual Report:
1. Financial Statements. (see Item 8)
Reports of Independent Registered Public Accounting Firm
Consolidated Balance Sheets as of December 31, 2018 and 2017
Consolidated Statements of Income for the years ended December 31, 2018, 2017 and 2016
Consolidated Statements of Comprehensive Income for the years ended December 31, 2018, 2017 and 2016
Consolidated Statements of Stockholders’ Equity for the years ended December 31, 2018, 2017 and 2016
Consolidated Statements of Cash Flows for the years ended December 31, 2018, 2017 and 2016
Notes to Consolidated Financial Statements
2. Financial Statement Schedules. (see schedules beginning on page F-1)
Schedule III—Real Estate and Accumulated Depreciation
Schedule IV—Mortgage Loans on Real Estate
All other schedules are omitted since the required information is not present or is not present in amounts sufficient to require submission of the schedule, or because the information required is included in the consolidated financial statements and notes thereto.
3. Exhibits.
The exhibits listed below are filed as part of this Annual Report. References under the caption “Location” to exhibits or other filings indicate that the exhibit or other filing has been filed, that the indexed exhibit and the exhibit referred to are the same and that the exhibit referred to is incorporated by reference. Management contracts and compensatory plans or arrangements filed as exhibits to this Annual Report are identified by an asterisk.
4.2 | | Third Amended and Restated Master Indenture dated as of May 6, 2014, among STORE Master Funding I, LLC, STORE Master Funding II, LLC, STORE Master Funding III, LLC, STORE Master Funding IV, LLC, and STORE Master Funding V, LLC, collectively as Issuers, and Citibank, N.A., as Indenture Trustee. | | Exhibit 4.1 to Amendment No. 1 to the Company’s Registration Statement on Form S-11 dated and filed with the SEC as of September 23, 2014. |
4.3 | | Series 2013-1 Indenture Supplement dated as of March 27, 2013, between STORE Master Funding I, LLC and STORE Master Funding II, LLC, collectively as Issuers, and Citibank, N.A., as Indenture Trustee. | | Exhibit 4.3 to Amendment No. 1 to the Company’s Registration Statement on Form S-11 dated and filed with the SEC as of September 23, 2014. |
4.4 | | Series 2013-2 Indenture Supplement dated as of July 25, 2013, between STORE Master Funding I, LLC, STORE Master Funding II, LLC, and STORE Master Funding III, LLC, collectively as Issuers, and Citibank, N.A., as Indenture Trustee. | | Exhibit 4.4 to Amendment No. 1 to the Company’s Registration Statement on Form S-11 dated and filed with the SEC as of September 23, 2014. |
4.5 | | Series 2013-3 Indenture Supplement dated as of December 3, 2013, among STORE Master Funding I, LLC, STORE Master Funding II, LLC, STORE Master Funding III, LLC, and STORE Master Funding IV, LLC, collectively as Issuers, and Citibank, N.A., as Indenture Trustee. | | Exhibit 4.5 to Amendment No. 1 to the Company’s Registration Statement on Form S-11 dated and filed with the SEC as of September 23, 2014. |
4.6 | | Series 2014-1 Indenture Supplement dated as of May 6, 2014, among STORE Master Funding I, LLC, STORE Master Funding II, LLC, STORE Master Funding III, LLC, STORE Master Funding IV, LLC, and STORE Master Funding V, LLC, collectively as Issuers, and Citibank, N.A., as Indenture Trustee. | | Exhibit 4.6 to Amendment No. 1 to the Company’s Registration Statement on Form S-11 dated and filed with the SEC as of September 23, 2014. |
4.7 | | Fourth Amended and Restated Master Indenture dated as of April 16, 2015, among STORE Master Funding I, LLC, STORE Master Funding II, LLC, STORE Master Funding III, LLC, STORE Master Funding IV, LLC, STORE Master Funding V, LLC and STORE Master Funding VI, LLC, collectively as Issuers, and Citibank, N.A., as Indenture Trustee. | | Exhibit 4.1 to the Company’s Current Report on Form 8-K dated April 16, 2015 and filed with the SEC on April 20, 2015. |
4.8 | | Series 2015-1 Indenture Supplement dated as of April 16, 2015, among STORE Master Funding I, LLC, STORE Master Funding II, LLC, STORE Master Funding III, LLC, STORE Master Funding IV, LLC, STORE Master Funding V, LLC and STORE Master Funding VI, LLC, collectively as Issuers, and Citibank, N.A., as Indenture Trustee. | | Exhibit 4.2 to the Company’s Current Report on Form 8-K dated April 16, 2015 and filed with the SEC on April 20, 2015. |
| | | | |
4.9 | | Fifth Amended and Restated Master Indenture dated as of October 18, 2016, among STORE Master Funding I, LLC, STORE Master Funding II, LLC, STORE Master Funding III, LLC, STORE Master Funding IV, LLC, STORE Master Funding V, LLC, STORE Master Funding VI, LLC, and STORE Master Funding VII, LLC, collectively as Issuers, and Citibank, N.A., as Indenture Trustee. | | Exhibit 4.1 to the Company’s Current Report on Form 8-K dated October 18, 2016 and filed with the SEC on October 21, 2016. |
4.10 | | Series 2016-1 Indenture Supplement dated as of October 18, 2016, among STORE Master Funding I, LLC, STORE Master Funding II, LLC, STORE Master Funding III, LLC, STORE Master Funding IV, LLC, STORE Master Funding V, LLC STORE Master Funding VI, LLC, and STORE Master Funding VII, LLC, collectively as Issuers, and Citibank, N.A., as Indenture Trustee. | | Exhibit 4.2 to the Company’s Current Report on Form 8-K dated October 18, 2016 and filed with the SEC on October 21, 2016. |
4.11 | | Indenture, dated as of March 15, 2018, between STORE Capital Corporation and Wilmington Trust, National Association. | | Exhibit 4.1 to the Company’s Current Report on Form 8-K dated and filed with the SEC on March 15, 2018. |
4.12 | | Supplemental Indenture No. 1, dated as of March 15, 2018, between STORE Capital Corporation and Wilmington Trust, National Association. | | Exhibit 4.2 to the Company’s Current Report on Form 8-K dated and filed with the SEC on March 15, 2018. |
4.13 | | Sixth Amended and Restated Master Indenture, dated as of October 22, 2018, by and among STORE Master Funding I, LLC, STORE Master Funding II, LLC, STORE Master Funding III, LLC, STORE Master Funding IV, LLC, STORE Master Funding V, LLC, STORE Master Funding VI, LLC, and STORE Master Funding VII, LLC, each a Delaware limited liability company, collectively as issuers, and Citibank, N.A., as indenture trustee, relating to Net-Lease Mortgage Notes. | | Exhibit 4.1 to the Company’s Current Report on Form 8-K dated October 22, 2018 and filed with the SEC on October 23, 2018. |
4.14 | | Series 2018-1 Indenture Supplement, dated as of October 22, 2018, among STORE Master Funding I, LLC, STORE Master Funding II, LLC, STORE Master Funding III, LLC, STORE Master Funding IV, LLC, STORE Master Funding V, LLC, STORE Master Funding VI, LLC, and STORE Master Funding VII, LLC, each a Delaware limited liability company, and Citibank, N.A., as indenture trustee. | | Exhibit 4.2 to the Company’s Current Report on Form 8-K dated October 22, 2018 and filed with the SEC on October 23, 2018. |
10.1 | * | STORE Capital Corporation 2015 Omnibus Equity Incentive Plan. | | Exhibit 10.3 to the Company’s Current Report on Form 8-K dated November 20, 2014 and filed with the SEC on November 26, 2014. |
10.2 | * | STORE Capital Corporation 2012 Long-Term Incentive Plan. | | Exhibit 10.7 to Amendment No. 1 to the Company’s Registration Statement on Form S-11 dated and filed with the SEC as of September 23, 2014. |
10.3 | * | Form of 2012 Long-Term Incentive Award Plan Restricted Stock Award Grant Agreement. | | Exhibit 10.8 to Amendment No. 1 to the Company’s Registration Statement on Form S-11 dated and filed with the SEC as of September 23, 2014. |
10.4 | * | Form of Indemnification Agreement between STORE Capital Corporation and each of its directors and executive officers. | | Exhibit 10.10 to the Company’s Current Report on Form 8-K dated November 20, 2014 and filed with the SEC on November 26, 2014. |
10.5 | * | Employment Agreement dated as of November 2, 2017, among STORE Capital Corporation, STORE Capital Advisors, LLC, and Christopher H. Volk. | | Exhibit 10.7 to the Company’s Annual Report on Form 10-K filed with the SEC on February 23, 2018. |
10.6 | * | Employment Agreement dated as of November 2, 2017, among STORE Capital Corporation, STORE Capital Advisors, LLC, and Michael T. Bennett. | | Exhibit 10.8 to the Company’s Annual Report on Form 10-K filed with the SEC on February 23, 2018. |
10.7 | * | Employment Agreement dated as of November 2, 2017, among STORE Capital Corporation, STORE Capital Advisors, LLC, and Catherine Long. | | Exhibit 10.9 to the Company’s Annual Report on Form 10-K filed with the SEC on February 23, 2018. |
10.8 | * | Employment Agreement dated as of November 2, 2017, among STORE Capital Corporation, STORE Capital Advisors, LLC, and Mary Fedewa. | | Exhibit 10.10 to the Company’s Annual Report on Form 10-K filed with the SEC on February 23, 2018. |
10.9 | * | Employment Agreement dated as of November 2, 2017, among STORE Capital Corporation, STORE Capital Advisors, LLC, and Christopher K. Burbach. | | Exhibit 10.11 to the Company’s Annual Report on Form 10-K filed with the SEC on February 23, 2018. |
10.10 | * | Resignation and Consulting Agreement, dated January 9, 2019, among STORE Capital Corporation, STORE Capital Advisors, LLC, and Christopher K. Burbach. | | Exhibit 10.1 to the Company’s Current Report on Form 8-K dated January 7, 2019 and filed with the SEC on January 10, 2019. |
10.11 | | Form of 2015 Omnibus Equity Incentive Plan Restricted Share Award Agreement. | | Exhibit 10.1 to the Company’s Current Report on Form 8-K dated March 27, 2015 and filed with the SEC on March 30, 2015. |
10.12 | | Form of 2015 Omnibus Equity Incentive Plan Restricted Share Award Agreement for Directors (2019). | | Filed herewith. |
10.13 | | Form of 2015 Omnibus Equity Incentive Plan Restricted Share Unit Award Agreement. | | Exhibit 10.2 to the Company’s Current Report on Form 8-K dated March 27, 2015 and filed with the SEC on March 30, 2015. |
10.14 | | Form of 2015 Omnibus Equity Incentive Plan Restricted Share Unit Award Agreement (2018). | | Exhibit 10.1 to the Company’s Quarterly Report for the period ended March 31, 2018 on Form 10-Q filed with the SEC on May 4, 2018. |
10.15 | | Note Purchase Agreement dated as of November 19, 2015, among STORE Capital Corporation and the Purchasers identified therein. | | Exhibit 10.1 to the Company’s Current Report on Form 8-K dated November 19, 2015 and filed with the SEC on November 23, 2015. |
10.16 | | Note Purchase Agreement dated as of April 28, 2016, among STORE Capital Corporation and the Purchasers identified therein. | | Exhibit 10.1 to the Company’s Current Report on Form 8-K dated April 26, 2016 and filed with the SEC on May 2, 2016. |
10.17 | | Amended and Restated Credit Agreement, dated as of February 9, 2018, by and among STORE Capital Corporation, as borrower, KeyBank National Association as lender and administrative agent, the other lenders parties thereto, KeyBank Capital Markets Inc. and Wells Fargo Securities, LLC as joint lead arrangers and joint bookrunners, Wells Fargo Bank, National Association, as syndication agent, and BMO Harris Bank N.A., Capital One Bank, Regions Bank, SunTrust Bank and U.S. Bank National Association, as co-documentation agents. | | Exhibit 10.1 to the Company’s Current Report on Form 8-K dated February 9, 2018 and filed with the SEC on February 12, 2018. |
10.18 | | Fifth Amended and Restated Property Management and Servicing Agreement, dated as of October 22, 2018, among STORE Master Funding I, LLC, STORE Master Funding II, LLC, STORE Master Funding III, LLC, STORE Master Funding IV, LLC, STORE Master Funding V, LLC, STORE Master Funding VI, LLC, and STORE Master Funding VII, LLC, each a Delaware limited liability company, STORE Capital Corporation, a Maryland corporation, as property manager and special servicer, and KeyBank National Association, as back-up manager. | | Exhibit 10.1 to the Company’s Current Report on Form 8-K dated October 22, 2018 and filed with the SEC on October 23, 2018. |
21 | | List of Subsidiaries. | | Filed herewith. |
23 | | Consent of Independent Registered Public Accounting Firm. | | Filed herewith. |
31.1 | | Rule 13a-14(a) Certification of the Chief Executive Officer. | | Filed herewith. |
31.2 | | Rule 13a-14(a) Certification of the Chief Financial Officer. | | Filed herewith. |
32.1 | | Section 1350 Certification of the Chief Executive Officer. | | Filed herewith. |
32.2 | | Section 1350 Certification of the Chief Financial Officer. | | Filed herewith. |
101.1 | | The following materials from STORE Capital Corporation Annual Report on Form 10-K for the period ended December 31, 2018, are formatted in Extensible Business Reporting Language: (i) consolidated balance sheets, (ii) consolidated statements of comprehensive income, (iii) consolidated statements of cash flows, and (iv) notes to consolidated financial statements. | | |
*Indicates management contract or compensatory plan.
Item 16. Form 10-K Summary
None.
SIGNATURES
Pursuant to the requirements of Section 13 or 15 (d) of the Securities Exchange Act of 1934, the registrant has duly caused this Report to be signed on its behalf by the undersigned, thereunto duly authorized.
| STORE CAPITAL CORPORATION |
| |
Date: February 22, 2019 | By: | /s/ Christopher H. Volk |
| | Christopher H. Volk |
| | Chief Executive Officer and
President (Principal Executive Officer) |
Pursuant to the requirements of the Securities Exchange Act of 1934, this Report has been signed below on February 22, 2019 by the following persons on behalf of the registrant and in the capacities indicated.
Signature | | Title | | Date |
| | | | |
/s/Christopher H. Volk | | President, Chief Executive Officer and Director | | February 22, 2019 |
Christopher H. Volk | | (principal executive officer) | | |
| | | | |
/s/Catherine Long | | Executive Vice President, Chief Financial Officer and Treasurer | | February 22, 2019 |
Catherine Long | | (principal financial officer) | | |
| | | | |
/s/Stacy M. LaFrance | | Senior Vice President – Chief Accounting Officer | | February 22, 2019 |
Stacy M. LaFrance | | (principal accounting officer) | | |
| | | | |
/s/Morton H. Fleischer | | Chairman of the Board of Directors | | February 22, 2019 |
Morton H. Fleischer | | | | |
| | | | |
/s/Mary Fedewa | | Chief Operating Officer and Director | | February 22, 2019 |
Mary Fedewa | | | | |
| | | | |
/s/Joseph M. Donovan | | Director | | February 22, 2019 |
Joseph M. Donovan | | | | |
| | | | |
/s/William F. Hipp | | Director | | February 22, 2019 |
William F. Hipp | | | | |
| | | | |
/s/Catherine D. Rice | | Director | | February 22, 2019 |
Catherine D. Rice | | | | |
| | | | |
/s/Einar A. Seadler | | Director | | February 22, 2019 |
Einar A. Seadler | | | | |
| | | | |
/s/Rajath Shourie | | Director | | February 22, 2019 |
Rajath Shourie | | | | |
| | | | |
/s/Quentin P. Smith, Jr. | | Director | | February 22, 2019 |
Quentin P. Smith, Jr. | | | | |
STORE Capital Corporation
Schedule III - Real Estate and Accumulated Depreciation
(Dollars in Thousands)
| | | | | | | | | | | | | | | | | | | | | | | | | | | | | | | | | | | |
Descriptions (a) | | | | Initial Cost to Company | | Costs Capitalized Subsequent to Acquisition | | Gross amount at December 31, 2018 (b) (c) | | | | | | |
Tenant Industry | | City | | St | | Encumbrances | | Land & Improvements | | Building & Improvements | | Land & Improvements | | Building & Improvements | | Land & Improvements | | Building & Improvements | | Total | | Accumulated
Depreciation (d) (e) | | Year
Constructed | | Date Acquired |
Restaurants – Limited Service | | Benson | | MN | | $ | (f) | | $ | 187 | | $ | 627 | | $ | 28 | | $ | 197 | | $ | 215 | | $ | 824 | | $ | 1,039 | | $ | (234) | | 1987 | | 07/29/2011 |
Restaurants – Limited Service | | Glencoe | | MN | | | (f) | | | 369 | | | 772 | | | 10 | | | 240 | | | 379 | | | 1,012 | | | 1,391 | | | (286) | | 1986 | | 07/29/2011 |
Restaurants – Limited Service | | Little Falls | | MN | | | (f) | | | 456 | | | 803 | | | 17 | | | 208 | | | 473 | | | 1,011 | | | 1,484 | | | (345) | | 1983 | | 07/29/2011 |
Restaurants – Limited Service | | Minneapolis | | MN | | | (f) | | | 243 | | | 590 | | | 34 | | | 169 | | | 277 | | | 759 | | | 1,036 | | | (242) | | 1996 | | 07/29/2011 |
Restaurants – Limited Service | | Sauk Rapids | | MN | | | (f) | | | 224 | | | 887 | | | - | | | 225 | | | 224 | | | 1,112 | | | 1,336 | | | (274) | | 1996 | | 07/29/2011 |
Restaurants – Limited Service | | Staples | | MN | | | (f) | | | 213 | | | 729 | | | 19 | | | 206 | | | 232 | | | 935 | | | 1,167 | | | (254) | | 1987 | | 07/29/2011 |
Restaurants – Limited Service | | Wadena | | MN | | | (f) | | | 171 | | | 731 | | | - | | | 250 | | | 171 | | | 981 | | | 1,152 | | | (232) | | 1980 | | 07/29/2011 |
Restaurants – Limited Service | | Valley City | | ND | | | (f) | | | 217 | | | 676 | | | 170 | | | 55 | | | 387 | | | 731 | | | 1,118 | | | (290) | | 1984 | | 07/29/2011 |
Restaurants – Limited Service | | Wahpeton | | ND | | | (f) | | | 314 | | | 589 | | | 3 | | | 222 | | | 317 | | | 811 | | | 1,128 | | | (221) | | 1987 | | 07/29/2011 |
Restaurants – Limited Service | | Mobridge | | SD | | | (f) | | | 336 | | | 517 | | | - | | | 225 | | | 336 | | | 742 | | | 1,078 | | | (272) | | 1993 | | 07/29/2011 |
Furniture Stores | | Austin | | TX | | | (f) | | | 2,212 | | | 3,600 | | | - | | | - | | | 2,212 | | | 3,600 | | | 5,812 | | | (781) | | 2006 | | 09/02/2011 |
Furniture Stores | | Live Oak | | TX | | | (f) | | | 1,885 | | | 3,927 | | | - | | | - | | | 1,885 | | | 3,927 | | | 5,812 | | | (823) | | 2005 | | 09/02/2011 |
Furniture Stores | | New Braunfels | | TX | | | (f) | | | 1,692 | | | 6,926 | | | - | | | - | | | 1,692 | | | 6,926 | | | 8,618 | | | (1,927) | | 1995 | | 09/02/2011 |
Furniture Stores | | San Antonio | | TX | | | (f) | | | 2,361 | | | 3,952 | | | - | | | - | | | 2,361 | | | 3,952 | | | 6,313 | | | (865) | | 2006 | | 09/02/2011 |
Restaurants – Limited Service | | Florence | | AL | | | (f) | | | 398 | | | 540 | | | - | | | - | | | 398 | | | 540 | | | 938 | | | (161) | | 1994 | | 09/08/2011 |
Restaurants – Limited Service | | Vestavia | | AL | | | (f) | | | 310 | | | 354 | | | - | | | - | | | 310 | | | 354 | | | 664 | | | (103) | | 1972 | | 09/08/2011 |
Restaurants – Limited Service | | Jacksonville | | FL | | | (f) | | | 310 | | | 325 | | | - | | | - | | | 310 | | | 325 | | | 635 | | | (101) | | 1982 | | 09/08/2011 |
Restaurants – Limited Service | | Bainbridge | | GA | | | (f) | | | 147 | | | 381 | | | - | | | - | | | 147 | | | 381 | | | 528 | | | (115) | | 1989 | | 09/08/2011 |
Restaurants – Limited Service | | Winder | | GA | | | (f) | | | 348 | | | 366 | | | - | | | - | | | 348 | | | 366 | | | 714 | | | (137) | | 1986 | | 09/08/2011 |
Restaurants – Limited Service | | Evansville | | IN | | | (f) | | | 226 | | | 380 | | | - | | | - | | | 226 | | | 380 | | | 606 | | | (133) | | 1988 | | 09/08/2011 |
Restaurants – Limited Service | | Louisville | | KY | | | (f) | | | 310 | | | 383 | | | - | | | - | | | 310 | | | 383 | | | 693 | | | (134) | | 1973 | | 09/08/2011 |
Restaurants – Limited Service | | Florissant | | MO | | | (f) | | | 460 | | | 400 | | | - | | | - | | | 460 | | | 400 | | | 860 | | | (132) | | 1981 | | 09/08/2011 |
Restaurants – Limited Service | | Jackson | | MS | | | (f) | | | 253 | | | 460 | | | - | | | - | | | 253 | | | 460 | | | 713 | | | (140) | | 1993 | | 09/08/2011 |
Restaurants – Limited Service | | Jackson | | MS | | | (f) | | | 225 | | | 342 | | | - | | | - | | | 225 | | | 342 | | | 567 | | | (99) | | 1983 | | 09/08/2011 |
Restaurants – Limited Service | | Cincinnati | | OH | | | (f) | | | 148 | | | 467 | | | - | | | - | | | 148 | | | 467 | | | 615 | | | (143) | | 1987 | | 09/08/2011 |
Restaurants – Limited Service | | Owasso | | OK | | | (f) | | | 275 | | | 301 | | | - | | | - | | | 275 | | | 301 | | | 576 | | | (92) | | 1986 | | 09/08/2011 |
Restaurants – Limited Service | | Tulsa | | OK | | | (f) | | | 209 | | | 328 | | | - | | | - | | | 209 | | | 328 | | | 537 | | | (125) | | 1977 | | 09/08/2011 |
Restaurants – Limited Service | | Antioch | | TN | | | (f) | | | 391 | | | 264 | | | - | | | 150 | | | 391 | | | 414 | | | 805 | | | (108) | | 1978 | | 09/08/2011 |
Restaurants – Limited Service | | Clarksville | | TN | | | (f) | | | 239 | | | 425 | | | - | | | 124 | | | 239 | | | 549 | | | 788 | | | (145) | | 1993 | | 09/08/2011 |
Restaurants – Limited Service | | Knoxville | | TN | | | (f) | | | 371 | | | 323 | | | - | | | - | | | 371 | | | 323 | | | 694 | | | (106) | | 1987 | | 09/08/2011 |
Restaurants – Limited Service | | Princeton | | WV | | | (f) | | | 246 | | | 408 | | | - | | | - | | | 246 | | | 408 | | | 654 | | | (119) | | 1977 | | 09/08/2011 |
Wood Product Manufacturing | | Delaware | | OH | | | (f) | | | 308 | | | 478 | | | - | | | - | | | 308 | | | 478 | | | 786 | | | (141) | | 1969 | | 09/27/2011 |
Wood Product Manufacturing | | Hillsboro | | OR | | | (f) | | | 879 | | | 167 | | | - | | | - | | | 879 | | | 167 | | | 1,046 | | | (74) | | 1965 | | 09/27/2011 |
Wood Product Manufacturing | | Stayton | | OR | | | (f) | | | 2,254 | | | 2,526 | | | - | | | - | | | 2,254 | | | 2,526 | | | 4,780 | | | (712) | | 1985 | | 09/27/2011 |
Family Entertainment Centers | | Webster | | TX | | | (f) | | | 2,135 | | | 6,355 | | | - | | | - | | | 2,135 | | | 6,355 | | | 8,490 | | | (1,428) | | 2007 | | 09/30/2011 |
Child Day Care Services | | Laveen | | AZ | | | (f) | | | 1,427 | | | 3,012 | | | 35 | | | 210 | | | 1,462 | | | 3,222 | | | 4,684 | | | (698) | | 2008 | | 10/07/2011 |
Child Day Care Services | | Maricopa | | AZ | | | (f) | | | 2,212 | | | 4,080 | | | - | | | - | | | 2,212 | | | 4,080 | | | 6,292 | | | (887) | | 2008 | | 10/07/2011 |
Beer, Wine, and Liquor Stores | | McAllen | | TX | | | (f) | | | 1,397 | | | 2,220 | | | - | | | - | | | 1,397 | | | 2,220 | | | 3,617 | | | (772) | | 1955 | | 10/07/2011 |
Beer, Wine, and Liquor Stores | | Pharr | | TX | | | (f) | | | 699 | | | 1,362 | | | - | | | - | | | 699 | | | 1,362 | | | 2,061 | | | (439) | | 1989 | | 10/07/2011 |
Restaurants – Full Service | | Canton | | GA | | | (f) | | | 1,101 | | | 973 | | | - | | | - | | | 1,101 | | | 973 | | | 2,074 | | | (311) | | 1998 | | 10/17/2011 |
Restaurants – Full Service | | Fayetteville | | GA | | | (f) | | | 1,155 | | | 1,210 | | | - | | | - | | | 1,155 | | | 1,210 | | | 2,365 | | | (391) | | 2004 | | 10/17/2011 |
Restaurants – Full Service | | Ft. Oglethorpe | | GA | | | (f) | | | 957 | | | 986 | | | - | | | - | | | 957 | | | 986 | | | 1,943 | | | (289) | | 2003 | | 10/17/2011 |
Restaurants – Full Service | | Stockbridge | | GA | | | (f) | | | 1,135 | | | 1,276 | | | - | | | - | | | 1,135 | | | 1,276 | | | 2,411 | | | (397) | | 2000 | | 10/17/2011 |
Restaurants – Full Service | | Camby | | IN | | | (f) | | | 636 | | | 1,297 | | | - | | | - | | | 636 | | | 1,297 | | | 1,933 | | | (395) | | 2008 | | 10/17/2011 |
Restaurants – Full Service | | Greenwood | | IN | | | (f) | | | 518 | | | 1,196 | | | - | | | - | | | 518 | | | 1,196 | | | 1,714 | | | (344) | | 2005 | | 10/17/2011 |
Restaurants – Full Service | | Georgetown | | KY | | | (f) | | | 727 | | | 1,076 | | | - | | | - | | | 727 | | | 1,076 | | | 1,803 | | | (325) | | 2002 | | 10/17/2011 |
Restaurants – Full Service | | Owensboro | | KY | | | (f) | | | 585 | | | 1,427 | | | - | | | - | | | 585 | | | 1,427 | | | 2,012 | | | (474) | | 1996 | | 10/17/2011 |
Restaurants – Full Service | | Charlotte | | NC | | | (f) | | | 737 | | | 1,086 | | | - | | | - | | | 737 | | | 1,086 | | | 1,823 | | | (400) | | 2000 | | 10/17/2011 |
| | | | | | | | | | | | | | | | | | | | | | | | | | | | | | | | | | | |
Descriptions (a) | | | | Initial Cost to Company | | Costs Capitalized Subsequent to Acquisition | | Gross amount at December 31, 2018 (b) (c) | | | | | | |
Tenant Industry | | City | | St | | Encumbrances | | Land &
Improvements | | Building &
Improvements | | Land &
Improvements | | Building &
Improvements | | Land &
Improvements | | Building &
Improvements | | Total | | Accumulated
Depreciation (d) (e) | | Year
Constructed | | Date Acquired |
Restaurants – Full Service | | Greensboro | | NC | | | (f) | | | 626 | | | 1,039 | | | - | | | - | | | 626 | | | 1,039 | | | 1,665 | | | (361) | | 2004 | | 10/17/2011 |
Restaurants – Full Service | | Dayton | | OH | | | (f) | | | 1,369 | | | 1,357 | | | - | | | - | | | 1,369 | | | 1,357 | | | 2,726 | | | (438) | | 1998 | | 10/17/2011 |
Restaurants – Full Service | | Springdale | | OH | | | (f) | | | 1,286 | | | 897 | | | - | | | - | | | 1,286 | | | 897 | | | 2,183 | | | (252) | | 1996 | | 10/17/2011 |
Restaurants – Full Service | | Cookeville | | TN | | | (f) | | | 1,528 | | | 1,511 | | | 691 | | | - | | | 2,219 | | | 1,511 | | | 3,730 | | | (497) | | 1994 | | 10/17/2011 |
Restaurants – Full Service | | Knoxville | | TN | | | (f) | | | 1,161 | | | 1,221 | | | - | | | - | | | 1,161 | | | 1,221 | | | 2,382 | | | (425) | | 2003 | | 10/17/2011 |
Restaurants – Full Service | | Harrisonburg | | VA | | | (f) | | | 468 | | | 1,067 | | | - | | | - | | | 468 | | | 1,067 | | | 1,535 | | | (341) | | 2003 | | 10/17/2011 |
Restaurants – Full Service | | Panama City | | FL | | | | | | 230 | | | 1,451 | | | - | | | - | | | 230 | | | 1,451 | | | 1,681 | | | (388) | | 2001 | | 10/17/2011 |
Restaurants – Full Service | | Augusta | | GA | | | | | | 853 | | | 1,148 | | | - | | | - | | | 853 | | | 1,148 | | | 2,001 | | | (341) | | 1997 | | 10/17/2011 |
Restaurants – Full Service | | Cumming | | GA | | | | | | 1,375 | | | 946 | | | - | | | - | | | 1,375 | | | 946 | | | 2,321 | | | (317) | | 1998 | | 10/17/2011 |
Restaurants – Full Service | | Lawrenceville | | GA | | | | | | 985 | | | 879 | | | - | | | - | | | 985 | | | 879 | | | 1,864 | | | (278) | | 1996 | | 10/17/2011 |
Restaurants – Full Service | | Snellville | | GA | | | | | | 1,954 | | | 927 | | | - | | | - | | | 1,954 | | | 927 | | | 2,881 | | | (305) | | 1998 | | 10/17/2011 |
Restaurants – Full Service | | Frankfort | | KY | | | | | | 955 | | | 916 | | | - | | | - | | | 955 | | | 916 | | | 1,871 | | | (300) | | 1998 | | 10/17/2011 |
Restaurants – Full Service | | Lexington | | KY | | | | | | 533 | | | 1,148 | | | - | | | - | | | 533 | | | 1,148 | | | 1,681 | | | (331) | | 1988 | | 10/17/2011 |
Restaurants – Full Service | | Louisville | | KY | | | | | | 1,217 | | | 1,028 | | | - | | | - | | | 1,217 | | | 1,028 | | | 2,245 | | | (314) | | 1993 | | 10/17/2011 |
Restaurants – Full Service | | Mansfield | | OH | | | | | | 725 | | | 1,156 | | | - | | | - | | | 725 | | | 1,156 | | | 1,881 | | | (390) | | 2003 | | 10/17/2011 |
Restaurants – Full Service | | Charleston | | SC | | | | | | 889 | | | 1,245 | | | - | | | - | | | 889 | | | 1,245 | | | 2,134 | | | (426) | | 2001 | | 10/17/2011 |
Restaurants – Full Service | | Cleveland | | TN | | | | | | 1,169 | | | 1,346 | | | - | | | - | | | 1,169 | | | 1,346 | | | 2,515 | | | (470) | | 1996 | | 10/17/2011 |
Restaurants – Full Service | | Goodlettsville | | TN | | | | | | 933 | | | 1,191 | | | - | | | - | | | 933 | | | 1,191 | | | 2,124 | | | (361) | | 1985 | | 10/17/2011 |
Restaurants – Full Service | | Lebanon | | TN | | | | | | 1,037 | | | 1,134 | | | - | | | - | | | 1,037 | | | 1,134 | | | 2,171 | | | (374) | | 1997 | | 10/17/2011 |
Restaurants – Full Service | | Morristown | | TN | | | | | | 803 | | | 1,578 | | | - | | | - | | | 803 | | | 1,578 | | | 2,381 | | | (538) | | 2000 | | 10/17/2011 |
Restaurants – Full Service | | Lynchburg | | VA | | | | | | 903 | | | 1,078 | | | - | | | - | | | 903 | | | 1,078 | | | 1,981 | | | (442) | | 2001 | | 10/17/2011 |
Restaurants – Limited Service | | Bradenton | | FL | | | (f) | | | 785 | | | 276 | | | - | | | - | | | 785 | | | 276 | | | 1,061 | | | (234) | | 1984 | | 10/19/2011 |
Restaurants – Limited Service | | Sarasota | | FL | | | (f) | | | 848 | | | 410 | | | - | | | - | | | 848 | | | 410 | | | 1,258 | | | (310) | | 1981 | | 10/19/2011 |
Automotive Repair and Maintenance | | Prescott Valley | | AZ | | | (f) | | | 241 | | | 259 | | | - | | | - | | | 241 | | | 259 | | | 500 | | | (75) | | 2003 | | 11/01/2011 |
Automotive Repair and Maintenance | | Snowflake | | AZ | | | (f) | | | 276 | | | 134 | | | - | | | - | | | 276 | | | 134 | | | 410 | | | (43) | | 1998 | | 11/01/2011 |
Restaurants – Full Service | | Davenport | | IA | | | (f) | | | 1,613 | | | 2,210 | | | - | | | 141 | | | 1,613 | | | 2,351 | | | 3,964 | | | (742) | | 2003 | | 11/07/2011 |
Restaurants – Full Service | | Eagan | | MN | | | (f) | | | 1,481 | | | 2,958 | | | 14 | | | 137 | | | 1,495 | | | 3,095 | | | 4,590 | | | (678) | | 1998 | | 11/07/2011 |
Health Clubs | | Edinburg | | TX | | | (f) | | | 865 | | | 4,109 | | | - | | | 116 | | | 865 | | | 4,225 | | | 5,090 | | | (1,137) | | 1994 | | 11/18/2011 |
Health Clubs | | McAllen | | TX | | | (f) | | | 1,423 | | | 1,540 | | | 583 | | | 1,293 | | | 2,006 | | | 2,833 | | | 4,839 | | | (489) | | 2004 | | 11/18/2011 |
Health Clubs | | Mission | | TX | | | (f) | | | 692 | | | 2,408 | | | - | | | 49 | | | 692 | | | 2,457 | | | 3,149 | | | (567) | | 2000 | | 11/18/2011 |
Movie Theaters | | Owasso | | OK | | | (f) | | | 986 | | | 3,926 | | | - | | | - | | | 986 | | | 3,926 | | | 4,912 | | | (1,184) | | 1992 | | 12/16/2011 |
Other Personal Services | | Erlanger | | KY | | | (f) | | | 604 | | | 1,809 | | | - | | | - | | | 604 | | | 1,809 | | | 2,413 | | | (526) | | 2000 | | 12/22/2011 |
Other Personal Services | | Louisville | | KY | | | (f) | | | 492 | | | 2,022 | | | - | | | - | | | 492 | | | 2,022 | | | 2,514 | | | (546) | | 2003 | | 12/22/2011 |
Other Personal Services | | Cincinnati | | OH | | | (f) | | | 547 | | | 1,967 | | | - | | | - | | | 547 | | | 1,967 | | | 2,514 | | | (559) | | 2005 | | 12/22/2011 |
Restaurants – Full Service | | Snyder | | TX | | | (f) | | | 177 | | | 740 | | | - | | | - | | | 177 | | | 740 | | | 917 | | | (222) | | 1974 | | 12/22/2011 |
Other Chemical Product and Preparation Manufacturing | | Elk Grove Village | | IL | | | (f) | | | 854 | | | 1,460 | | | - | | | - | | | 854 | | | 1,460 | | | 2,314 | | | (410) | | 1964 | | 12/29/2011 |
Other Chemical Product and Preparation Manufacturing | | Wheeling | | IL | | | (f) | | | 1,463 | | | 3,064 | | | - | | | - | | | 1,463 | | | 3,064 | | | 4,527 | | | (881) | | 1966 | | 12/29/2011 |
Restaurants – Limited Service | | Leadington | | MO | | | (f) | | | 494 | | | 499 | | | - | | | - | | | 494 | | | 499 | | | 993 | | | (175) | | 1978 | | 12/30/2011 |
Restaurants – Limited Service | | St. Louis | | MO | | | (f) | | | 395 | | | 393 | | | - | | | - | | | 395 | | | 393 | | | 788 | | | (113) | | 1977 | | 12/30/2011 |
Child Day Care Services | | Blue Ash | | OH | | | (f) | | | 739 | | | 2,463 | | | - | | | - | | | 739 | | | 2,463 | | | 3,202 | | | (528) | | 1979 | | 12/30/2011 |
Restaurants – Limited Service | | Marietta | | OH | | | (f) | | | 435 | | | 676 | | | - | | | - | | | 435 | | | 676 | | | 1,111 | | | (230) | | 1986 | | 12/30/2011 |
Restaurants – Limited Service | | Salem | | OH | | | (f) | | | 205 | | | 676 | | | - | | | - | | | 205 | | | 676 | | | 881 | | | (202) | | 1969 | | 12/30/2011 |
Restaurants – Limited Service | | Warren | | OH | | | (f) | | | 328 | | | 612 | | | - | | | - | | | 328 | | | 612 | | | 940 | | | (203) | | 1988 | | 12/30/2011 |
Restaurants – Limited Service | | McKees Rocks | | PA | | | (f) | | | 556 | | | 692 | | | - | | | - | | | 556 | | | 692 | | | 1,248 | | | (216) | | 1984 | | 12/30/2011 |
Restaurants – Limited Service | | Pittsburgh | | PA | | | (f) | | | 364 | | | 440 | | | - | | | - | | | 364 | | | 440 | | | 804 | | | (133) | | 1989 | | 12/30/2011 |
Restaurants – Limited Service | | Clinton | | TN | | | (f) | | | 454 | | | 653 | | | - | | | - | | | 454 | | | 653 | | | 1,107 | | | (223) | | 1984 | | 12/30/2011 |
Child Day Care Services | | Franklin | | TN | | | (f) | | | 1,782 | | | 2,422 | | | - | | | - | | | 1,782 | | | 2,422 | | | 4,204 | | | (741) | | 2010 | | 12/30/2011 |
Restaurants – Limited Service | | Greeneville | | TN | | | (f) | | | 566 | | | 490 | | | - | | | - | | | 566 | | | 490 | | | 1,056 | | | (191) | | 1985 | | 12/30/2011 |
Restaurants – Limited Service | | Knoxville | | TN | | | (f) | | | 405 | | | 702 | | | - | | | - | | | 405 | | | 702 | | | 1,107 | | | (249) | | 1986 | | 12/30/2011 |
| | | | | | | | | | | | | | | | | | | | | | | | | | | | | | | | | | | |
Descriptions (a) | | | | Initial Cost to Company | | Costs Capitalized Subsequent to Acquisition | | Gross amount at December 31, 2018 (b) (c) | | | | | | |
Tenant Industry | | City | | St | | Encumbrances | | Land &
Improvements | | Building &
Improvements | | Land &
Improvements | | Building &
Improvements | | Land &
Improvements | | Building &
Improvements | | Total | | Accumulated
Depreciation (d) (e) | | Year
Constructed | | Date Acquired |
Restaurants – Limited Service | | Maryville | | TN | | | (f) | | | 542 | | | 414 | | | 45 | | | 309 | | | 587 | | | 723 | | | 1,310 | | | (226) | | 1983 | | 12/30/2011 |
Restaurants – Limited Service | | Newport | | TN | | | (f) | | | 484 | | | 623 | | | - | | | - | | | 484 | | | 623 | | | 1,107 | | | (240) | | 1987 | | 12/30/2011 |
Restaurants – Limited Service | | New Martinsville | | WV | | | (f) | | | 269 | | | 475 | | | - | | | - | | | 269 | | | 475 | | | 744 | | | (152) | | 1978 | | 12/30/2011 |
Restaurants – Limited Service | | Parkersburg | | WV | | | (f) | | | 245 | | | 461 | | | - | | | - | | | 245 | | | 461 | | | 706 | | | (143) | | 1987 | | 12/30/2011 |
Restaurants – Limited Service | | Parkersburg | | WV | | | (f) | | | 769 | | | 301 | | | - | | | - | | | 769 | | | 301 | | | 1,070 | | | (117) | | 1986 | | 12/30/2011 |
Restaurants – Limited Service | | Wheeling | | WV | | | (f) | | | 357 | | | 714 | | | - | | | - | | | 357 | | | 714 | | | 1,071 | | | (240) | | 1986 | | 12/30/2011 |
Family Entertainment Centers | | Frisco | | TX | | | (f) | | | 3,705 | | | 5,109 | | | - | | | - | | | 3,705 | | | 5,109 | | | 8,814 | | | (1,206) | | 2008 | | 01/27/2012 |
Family Entertainment Centers | | Lubbock | | TX | | | (f) | | | 2,056 | | | 6,658 | | | - | | | - | | | 2,056 | | | 6,658 | | | 8,714 | | | (1,545) | | 2007 | | 01/27/2012 |
Elementary and Secondary Schools | | Milpitas | | CA | | | | | | 5,749 | | | 8,840 | | | 1,218 | | | 4,622 | | | 6,967 | | | 13,462 | | | 20,429 | | | (2,467) | | 1987 | | 02/29/2012 |
Elementary and Secondary Schools | | Stockton | | CA | | | 11,081 | | | 1,789 | | | 3,557 | | | - | | | 24 | | | 1,789 | | | 3,581 | | | 5,370 | | | (1,050) | | 1990 | | 02/29/2012 |
Movie Theaters | | Bethlehem | | GA | | | (f) | | | 1,888 | | | 5,168 | | | - | | | - | | | 1,888 | | | 5,168 | | | 7,056 | | | (1,042) | | 2011 | | 03/15/2012 |
Restaurants – Limited Service | | Cherryville | | NC | | | (f) | | | 461 | | | 650 | | | - | | | - | | | 461 | | | 650 | | | 1,111 | | | (172) | | 2005 | | 03/28/2012 |
Restaurants – Limited Service | | Hudson | | NC | | | (f) | | | 215 | | | 996 | | | - | | | - | | | 215 | | | 996 | | | 1,211 | | | (201) | | 1984 | | 03/28/2012 |
Restaurants – Limited Service | | Maiden | | NC | | | (f) | | | 557 | | | 533 | | | - | | | - | | | 557 | | | 533 | | | 1,090 | | | (143) | | 1987 | | 03/28/2012 |
Restaurants – Limited Service | | Marion | | NC | | | (f) | | | 322 | | | 637 | | | - | | | - | | | 322 | | | 637 | | | 959 | | | (165) | | 1999 | | 03/28/2012 |
Restaurants – Limited Service | | Richfield | | NC | | | (f) | | | 361 | | | 720 | | | - | | | - | | | 361 | | | 720 | | | 1,081 | | | (188) | | 2007 | | 03/28/2012 |
Restaurants – Limited Service | | West Jefferson | | NC | | | (f) | | | 358 | | | 854 | | | - | | | - | | | 358 | | | 854 | | | 1,212 | | | (217) | | 1996 | | 03/28/2012 |
Restaurants – Full Service | | Naperville | | IL | | | (f) | | | 1,869 | | | 3,154 | | | - | | | - | | | 1,869 | | | 3,154 | | | 5,023 | | | (605) | | 2011 | | 03/30/2012 |
Restaurants – Full Service | | Wheeling | | IL | | | (f) | | | 824 | | | 2,441 | | | - | | | - | | | 824 | | | 2,441 | | | 3,265 | | | (412) | | 2008 | | 03/30/2012 |
Child Day Care Services | | Arlington | | TX | | | (f) | | | 183 | | | 574 | | | - | | | - | | | 183 | | | 574 | | | 757 | | | (216) | | 1984 | | 03/30/2012 |
Child Day Care Services | | Cedar Hill | | TX | | | (f) | | | 285 | | | 569 | | | - | | | - | | | 285 | | | 569 | | | 854 | | | (215) | | 1984 | | 03/30/2012 |
Child Day Care Services | | Grand Prairie | | TX | | | (f) | | | 292 | | | 581 | | | - | | | - | | | 292 | | | 581 | | | 873 | | | (224) | | 1985 | | 03/30/2012 |
Child Day Care Services | | Haltom City | | TX | | | (f) | | | 362 | | | 415 | | | - | | | - | | | 362 | | | 415 | | | 777 | | | (158) | | 1985 | | 03/30/2012 |
Child Day Care Services | | Watauga | | TX | | | (f) | | | 174 | | | 622 | | | - | | | - | | | 174 | | | 622 | | | 796 | | | (238) | | 1986 | | 03/30/2012 |
Furniture Stores | | Tacoma | | WA | | | (f) | | | 2,213 | | | 3,319 | | | - | | | 817 | | | 2,213 | | | 4,136 | | | 6,349 | | | (794) | | 1994 | | 04/20/2012 |
Other Personal Services | | Dayton | | OH | | | (f) | | | 574 | | | 1,937 | | | - | | | - | | | 574 | | | 1,937 | | | 2,511 | | | (502) | | 2008 | | 04/30/2012 |
Child Day Care Services | | Tucson | | AZ | | | (f) | | | 2,674 | | | 4,120 | | | - | | | - | | | 2,674 | | | 4,120 | | | 6,794 | | | (1,254) | | 2008 | | 05/08/2012 |
Furniture Stores | | Tucson | | AZ | | | (f) | | | 1,371 | | | 4,170 | | | - | | | - | | | 1,371 | | | 4,170 | | | 5,541 | | | (980) | | 2003 | | 05/10/2012 |
Restaurants – Full Service | | Troy | | MI | | | (f) | | | 1,503 | | | 2,506 | | | - | | | 120 | | | 1,503 | | | 2,626 | | | 4,129 | | | (425) | | 2012 | | 05/15/2012 |
Movie Theaters | | Ardmore | | OK | | | (f) | | | 1,302 | | | 3,095 | | | - | | | - | | | 1,302 | | | 3,095 | | | 4,397 | | | (708) | | 2008 | | 05/17/2012 |
Restaurants – Limited Service | | Carrollton | | GA | | | (f) | | | 467 | | | 627 | | | 31 | | | 141 | | | 498 | | | 768 | | | 1,266 | | | (177) | | 1980 | | 05/18/2012 |
Restaurants – Limited Service | | Cedartown | | GA | | | (f) | | | 319 | | | 502 | | | 4 | | | 119 | | | 323 | | | 621 | | | 944 | | | (142) | | 1981 | | 05/18/2012 |
Restaurants – Limited Service | | College Park | | GA | | | (f) | | | 918 | | | 227 | | | 7 | | | 104 | | | 925 | | | 331 | | | 1,256 | | | (68) | | 1973 | | 05/18/2012 |
Restaurants – Limited Service | | Dalton | | GA | | | (f) | | | 337 | | | 483 | | | 16 | | | 80 | | | 353 | | | 563 | | | 916 | | | (136) | | 1980 | | 05/18/2012 |
Restaurants – Limited Service | | Decatur | | GA | | | (f) | | | 378 | | | 484 | | | 4 | | | 92 | | | 382 | | | 576 | | | 958 | | | (197) | | 1981 | | 05/18/2012 |
Restaurants – Limited Service | | Lithonia | | GA | | | (f) | | | 469 | | | 706 | | | 56 | | | 86 | | | 525 | | | 792 | | | 1,317 | | | (277) | | 1979 | | 05/18/2012 |
Restaurants – Limited Service | | Macon | | GA | | | (f) | | | 379 | | | 715 | | | 19 | | | 101 | | | 398 | | | 816 | | | 1,214 | | | (276) | | 1975 | | 05/18/2012 |
Restaurants – Limited Service | | McDonough | | GA | | | (f) | | | 304 | | | 719 | | | 2 | | | 113 | | | 306 | | | 832 | | | 1,138 | | | (196) | | 2001 | | 05/18/2012 |
Restaurants – Limited Service | | Riverdale | | GA | | | (f) | | | 241 | | | 873 | | | 35 | | | 365 | | | 276 | | | 1,238 | | | 1,514 | | | (364) | | 1976 | | 05/18/2012 |
Restaurants – Limited Service | | Savannah | | GA | | | (f) | | | 422 | | | 946 | | | 159 | | | 241 | | | 581 | | | 1,187 | | | 1,768 | | | (284) | | 1973 | | 05/18/2012 |
Restaurants – Limited Service | | Ooltewah | | TN | | | (f) | | | 458 | | | 687 | | | - | | | - | | | 458 | | | 687 | | | 1,145 | | | (178) | | 1999 | | 05/18/2012 |
Restaurants – Full Service | | Franklin | | NC | | | (f) | | | 573 | | | 1,087 | | | - | | | - | | | 573 | | | 1,087 | | | 1,660 | | | (315) | | 2008 | | 05/24/2012 |
Restaurants – Full Service | | Morganton | | NC | | | (f) | | | 1,125 | | | 708 | | | - | | | - | | | 1,125 | | | 708 | | | 1,833 | | | (193) | | 2002 | | 05/24/2012 |
Restaurants – Full Service | | Rockingham | | NC | | | (f) | | | 1,111 | | | 870 | | | - | | | - | | | 1,111 | | | 870 | | | 1,981 | | | (240) | | 2005 | | 05/24/2012 |
Restaurants – Full Service | | Aiken | | SC | | | (f) | | | 1,009 | | | 974 | | | - | | | - | | | 1,009 | | | 974 | | | 1,983 | | | (279) | | 2006 | | 05/24/2012 |
| | | | | | | | | | | | | | | | | | | | | | | | | | | | | | | | | | | |
Descriptions (a) | | | | Initial Cost to Company | | Costs Capitalized Subsequent to Acquisition | | Gross amount at December 31, 2018 (b) (c) | | | | | | |
Tenant Industry | | City | | St | | Encumbrances | | Land &
Improvements | | Building &
Improvements | | Land &
Improvements | | Building &
Improvements | | Land &
Improvements | | Building &
Improvements | | Total | | Accumulated
Depreciation (d) (e) | | Year
Constructed | | Date Acquired |
Restaurants – Full Service | | Rock Hill | | SC | | | (f) | | | 1,121 | | | 778 | | | - | | | - | | | 1,121 | | | 778 | | | 1,899 | | | (211) | | 2004 | | 05/24/2012 |
Child Day Care Services | | Pearland | | TX | | | (f) | | | 1,345 | | | 6,258 | | | 608 | | | 2,526 | | | 1,953 | | | 8,784 | | | 10,737 | | | (1,539) | | 2011 | | 06/20/2012 |
Restaurants – Full Service | | Aiken | | SC | | | (f) | | | 547 | | | 1,587 | | | - | | | - | | | 547 | | | 1,587 | | | 2,134 | | | (348) | | 2009 | | 06/21/2012 |
Health Clubs | | Fairfield | | CA | | | (f) | | | 1,564 | | | 1,949 | | | 542 | | | 1,758 | | | 2,106 | | | 3,707 | | | 5,813 | | | (807) | | 1978 | | 06/27/2012 |
Restaurants – Limited Service | | Altamonte Springs | | FL | | | (f) | | | 438 | | | - | | | - | | | - | | | 438 | | | - | | | 438 | | | - | | 1978 | | 06/27/2012 |
Restaurants – Limited Service | | Apopka | | FL | | | (f) | | | 550 | | | - | | | - | | | - | | | 550 | | | - | | | 550 | | | - | | 1988 | | 06/27/2012 |
Restaurants – Limited Service | | Fort Pierce | | FL | | | (f) | | | 153 | | | - | | | - | | | - | | | 153 | | | - | | | 153 | | | - | | 1979 | | 06/27/2012 |
Restaurants – Limited Service | | Jacksonville | | FL | | | (f) | | | 550 | | | - | | | - | | | - | | | 550 | | | - | | | 550 | | | - | | 1986 | | 06/27/2012 |
Restaurants – Limited Service | | Jacksonville | | FL | | | (f) | | | 234 | | | - | | | - | | | - | | | 234 | | | - | | | 234 | | | - | | 1985 | | 06/27/2012 |
Restaurants – Limited Service | | Jacksonville | | FL | | | (f) | | | 326 | | | - | | | - | | | - | | | 326 | | | - | | | 326 | | | - | | 1981 | | 06/27/2012 |
Restaurants – Limited Service | | Jacksonville | | FL | | | (f) | | | 275 | | | - | | | - | | | - | | | 275 | | | - | | | 275 | | | - | | 1980 | | 06/27/2012 |
Restaurants – Limited Service | | Jacksonville | | FL | | | (f) | | | 285 | | | - | | | - | | | - | | | 285 | | | - | | | 285 | | | - | | 1982 | | 06/27/2012 |
Restaurants – Limited Service | | Kissimmee | | FL | | | (f) | | | 601 | | | - | | | - | | | - | | | 601 | | | - | | | 601 | | | - | | 1981 | | 06/27/2012 |
Restaurants – Limited Service | | Lake City | | FL | | | (f) | | | 224 | | | - | | | - | | | - | | | 224 | | | - | | | 224 | | | - | | 1978 | | 06/27/2012 |
Restaurants – Limited Service | | Merritt Island | | FL | | | (f) | | | 316 | | | - | | | - | | | - | | | 316 | | | - | | | 316 | | | - | | 1983 | | 06/27/2012 |
Restaurants – Limited Service | | Orange Park | | FL | | | (f) | | | 326 | | | - | | | - | | | - | | | 326 | | | - | | | 326 | | | - | | 1985 | | 06/27/2012 |
Restaurants – Limited Service | | Orlando | | FL | | | (f) | | | 285 | | | - | | | - | | | - | | | 285 | | | - | | | 285 | | | - | | 1981 | | 06/27/2012 |
Restaurants – Limited Service | | Palatka | | FL | | | (f) | | | 1,110 | | | - | | | - | | | - | | | 1,110 | | | - | | | 1,110 | | | - | | 1997 | | 06/27/2012 |
Restaurants – Limited Service | | Plant City | | FL | | | (f) | | | 621 | | | - | | | - | | | - | | | 621 | | | - | | | 621 | | | - | | 1988 | | 06/27/2012 |
Restaurants – Limited Service | | Sanford | | FL | | | (f) | | | 407 | | | - | | | - | | | - | | | 407 | | | - | | | 407 | | | - | | 1986 | | 06/27/2012 |
Restaurants – Limited Service | | Tallahassee | | FL | | | (f) | | | 306 | | | - | | | - | | | - | | | 306 | | | - | | | 306 | | | - | | 1978 | | 06/27/2012 |
Restaurants – Limited Service | | Fairview Heights | | IL | | | (f) | | | 326 | | | - | | | - | | | - | | | 326 | | | - | | | 326 | | | - | | 1986 | | 06/27/2012 |
Child Day Care Services | | South Elgin | | IL | | | (f) | | | 574 | | | 2,508 | | | - | | | - | | | 574 | | | 2,508 | | | 3,082 | | | (482) | | 2009 | | 06/27/2012 |
Restaurants – Limited Service | | Monroe | | LA | | | (f) | | | 266 | | | - | | | - | | | - | | | 266 | | | - | | | 266 | | | - | | 1998 | | 06/27/2012 |
Restaurants – Limited Service | | West Monroe | | LA | | | (f) | | | 511 | | | - | | | - | | | - | | | 511 | | | - | | | 511 | | | - | | 2000 | | 06/27/2012 |
Restaurants – Limited Service | | Brookhaven | | MS | | | (f) | | | 337 | | | - | | | - | | | - | | | 337 | | | - | | | 337 | | | - | | 1979 | | 06/27/2012 |
Restaurants – Limited Service | | Byram | | MS | | | (f) | | | 306 | | | - | | | - | | | - | | | 306 | | | - | | | 306 | | | - | | 1993 | | 06/27/2012 |
Restaurants – Limited Service | | Canton | | MS | | | (f) | | | 133 | | | - | | | - | | | - | | | 133 | | | - | | | 133 | | | - | | 1991 | | 06/27/2012 |
Restaurants – Limited Service | | Clarksdale | | MS | | | (f) | | | 276 | | | - | | | - | | | - | | | 276 | | | - | | | 276 | | | - | | 1979 | | 06/27/2012 |
Restaurants – Limited Service | | Cleveland | | MS | | | (f) | | | - | | | - | | | - | | | - | | | - | | | - | | | - | | | - | | 1991 | | 06/27/2012 |
Restaurants – Limited Service | | Clinton | | MS | | | (f) | | | 337 | | | - | | | - | | | - | | | 337 | | | - | | | 337 | | | - | | 1994 | | 06/27/2012 |
Restaurants – Limited Service | | McComb | | MS | | | (f) | | | 337 | | | - | | | - | | | - | | | 337 | | | - | | | 337 | | | - | | 1985 | | 06/27/2012 |
Restaurants – Limited Service | | Starkville | | MS | | | (f) | | | 184 | | | - | | | - | | | - | | | 184 | | | - | | | 184 | | | - | | 1991 | | 06/27/2012 |
Restaurants – Limited Service | | Tupelo | | MS | | | (f) | | | 317 | | | - | | | - | | | - | | | 317 | | | - | | | 317 | | | - | | 1990 | | 06/27/2012 |
Child Day Care Services | | Sicklerville | | NJ | | | (f) | | | 403 | | | 2,527 | | | - | | | - | | | 403 | | | 2,527 | | | 2,930 | | | (473) | | 2008 | | 06/27/2012 |
Child Day Care Services | | Collegeville | | PA | | | (f) | | | 546 | | | 2,182 | | | - | | | - | | | 546 | | | 2,182 | | | 2,728 | | | (418) | | 2008 | | 06/27/2012 |
Child Day Care Services | | Woodbridge | | VA | | | (f) | | | 777 | | | 2,204 | | | 219 | | | - | | | 996 | | | 2,204 | | | 3,200 | | | (608) | | 2002 | | 06/27/2012 |
Grocery Stores | | Alabaster | | AL | | | | | | 487 | | | 2,872 | | | - | | | - | | | 487 | | | 2,872 | | | 3,359 | | | (694) | | 1985 | | 06/29/2012 |
Grocery Stores | | Atmore | | AL | | | | | | 292 | | | 1,568 | | | - | | | - | | | 292 | | | 1,568 | | | 1,860 | | | (375) | | 1990 | | 06/29/2012 |
Grocery Stores | | Brewton | | AL | | | | | | 234 | | | 1,625 | | | - | | | 107 | | | 234 | | | 1,732 | | | 1,966 | | | (391) | | 1990 | | 06/29/2012 |
Grocery Stores | | Luverne | | AL | | | | | | 234 | | | 1,425 | | | - | | | - | | | 234 | | | 1,425 | | | 1,659 | | | (341) | | 1992 | | 06/29/2012 |
Grocery Stores | | Muscle Shoals | | AL | | | | | | 521 | | | 2,089 | | | - | | | - | | | 521 | | | 2,089 | | | 2,610 | | | (513) | | 1982 | | 06/29/2012 |
Grocery Stores | | Troy | | AL | | | | | | 511 | | | 2,209 | | | - | | | - | | | 511 | | | 2,209 | | | 2,720 | | | (565) | | 1984 | | 06/29/2012 |
Grocery Stores | | Milledgeville | | GA | | | | | | 652 | | | 2,317 | | | - | | | - | | | 652 | | | 2,317 | | | 2,969 | | | (567) | | 1994 | | 06/29/2012 |
Other Motor Vehicle Dealers | | Oklahoma City | | OK | | | (f) | | | 5,451 | | | 3,275 | | | 438 | | | 1,227 | | | 5,889 | | | 4,502 | | | 10,391 | | | (2,738) | | 1997 | | 06/29/2012 |
Health Clubs | | Visalia | | CA | | | | | | 1,382 | | | 4,928 | | | - | | | - | | | 1,382 | | | 4,928 | | | 6,310 | | | (1,253) | | 1975 | | 07/06/2012 |
Restaurants – Full Service | | Alpharetta | | GA | | | (f) | | | 842 | | | 3,520 | | | - | | | - | | | 842 | | | 3,520 | | | 4,362 | | | (823) | | 2001 | | 07/17/2012 |
| | | | | | | | | | | | | | | | | | | | | | | | | | | | | | | | | | | |
Descriptions (a) | | | | Initial Cost to Company | | Costs Capitalized Subsequent to Acquisition | | Gross amount at December 31, 2018 (b) (c) | | | | | | |
Tenant Industry | | City | | St | | Encumbrances | | Land &
Improvements | | Building &
Improvements | | Land &
Improvements | | Building &
Improvements | | Land &
Improvements | | Building &
Improvements | | Total | | Accumulated
Depreciation (d) (e) | | Year
Constructed | | Date Acquired |
Restaurants – Full Service | | Newnan | | GA | | | (f) | | | 1,114 | | | 1,847 | | | 4 | | | 65 | | | 1,118 | | | 1,912 | | | 3,030 | | | (497) | | 2005 | | 07/17/2012 |
Restaurants – Full Service | | Peachtree City | | GA | | | (f) | | | 1,280 | | | 1,750 | | | 22 | | | 57 | | | 1,302 | | | 1,807 | | | 3,109 | | | (526) | | 1999 | | 07/17/2012 |
Restaurants – Full Service | | Suwanee | | GA | | | (f) | | | 1,325 | | | 1,954 | | | - | | | 33 | | | 1,325 | | | 1,987 | | | 3,312 | | | (508) | | 2006 | | 07/17/2012 |
Restaurants – Full Service | | Suwanee | | GA | | | (f) | | | 1,168 | | | 1,624 | | | - | | | 27 | | | 1,168 | | | 1,651 | | | 2,819 | | | (452) | | 2005 | | 07/17/2012 |
Restaurants – Limited Service | | South St. Paul | | MN | | | (f) | | | 357 | | | 498 | | | 60 | | | 240 | | | 417 | | | 738 | | | 1,155 | | | (295) | | 1987 | | 07/19/2012 |
Elementary and Secondary Schools | | Scottsdale | | AZ | | | (f) | | | 3,729 | | | 6,288 | | | - | | | - | | | 3,729 | | | 6,288 | | | 10,017 | | | (1,490) | | 1991 | | 07/25/2012 |
Home Furnishings Stores | | Dayton | | OH | | | (f) | | | 369 | | | 1,318 | | | - | | | - | | | 369 | | | 1,318 | | | 1,687 | | | (336) | | 1996 | | 07/26/2012 |
Home Furnishings Stores | | Fairborn | | OH | | | (f) | | | 418 | | | 872 | | | - | | | - | | | 418 | | | 872 | | | 1,290 | | | (219) | | 2006 | | 07/26/2012 |
Home Furnishings Stores | | Heath | | OH | | | (f) | | | 818 | | | 1,171 | | | - | | | - | | | 818 | | | 1,171 | | | 1,989 | | | (265) | | 2004 | | 07/26/2012 |
Other Personal Services | | Columbus | | OH | | | (f) | | | 853 | | | 1,655 | | | - | | | - | | | 853 | | | 1,655 | | | 2,508 | | | (461) | | 2012 | | 07/27/2012 |
Movie Theaters | | Corpus Christi | | TX | | | | | | 5,954 | | | 9,373 | | | - | | | - | | | 5,954 | | | 9,373 | | | 15,327 | | | (3,225) | | 1995 | | 08/21/2012 |
Movie Theaters | | Forney | | TX | | | | | | 2,740 | | | 2,904 | | | - | | | - | | | 2,740 | | | 2,904 | | | 5,644 | | | (793) | | 2006 | | 08/21/2012 |
Movie Theaters | | Fort Worth | | TX | | | 22,315 | | | 3,105 | | | 7,677 | | | - | | | - | | | 3,105 | | | 7,677 | | | 10,782 | | | (2,020) | | 2010 | | 08/21/2012 |
Movie Theaters | | Irving | | TX | | | | | | 1,976 | | | 1,172 | | | - | | | - | | | 1,976 | | | 1,172 | | | 3,148 | | | (406) | | 1995 | | 08/21/2012 |
Movie Theaters | | Rio Grande City | | TX | | | | | | 1,933 | | | 3,196 | | | - | | | - | | | 1,933 | | | 3,196 | | | 5,129 | | | (857) | | 2008 | | 08/21/2012 |
Restaurants – Limited Service | | Hancock | | MD | | | (f) | | | 490 | | | 347 | | | - | | | - | | | 490 | | | 347 | | | 837 | | | (119) | | 1987 | | 08/29/2012 |
Restaurants – Limited Service | | Chambersburg | | PA | | | (f) | | | 539 | | | 666 | | | - | | | - | | | 539 | | | 666 | | | 1,205 | | | (190) | | 1989 | | 08/29/2012 |
Restaurants – Limited Service | | Greencastle | | PA | | | (f) | | | 767 | | | 638 | | | - | | | - | | | 767 | | | 638 | | | 1,405 | | | (191) | | 1986 | | 08/29/2012 |
Child Day Care Services | | Gilbert | | AZ | | | | | | 453 | | | 1,639 | | | - | | | - | | | 453 | | | 1,639 | | | 2,092 | | | (302) | | 1996 | | 08/30/2012 |
Child Day Care Services | | Gilbert | | AZ | | | | | | 393 | | | 1,699 | | | - | | | - | | | 393 | | | 1,699 | | | 2,092 | | | (299) | | 2002 | | 08/30/2012 |
Child Day Care Services | | Phoenix | | AZ | | | 5,560 | | | 877 | | | 2,311 | | | - | | | - | | | 877 | | | 2,311 | | | 3,188 | | | (481) | | 2003 | | 08/30/2012 |
Child Day Care Services | | Phoenix | | AZ | | | | | | 595 | | | 2,094 | | | - | | | - | | | 595 | | | 2,094 | | | 2,689 | | | (400) | | 2006 | | 08/30/2012 |
Other Motor Vehicle Dealers | | Garner | | NC | | | (f) | | | 2,163 | | | 342 | | | 1,603 | | | 2,002 | | | 3,766 | | | 2,344 | | | 6,110 | | | (843) | | 1997 | | 09/13/2012 |
Other Motor Vehicle Dealers | | Hope Mills | | NC | | | (f) | | | 1,462 | | | 1,437 | | | - | | | - | | | 1,462 | | | 1,437 | | | 2,899 | | | (497) | | 1993 | | 09/13/2012 |
Movie Theaters | | Savoy | | IL | | | (f) | | | 2,764 | | | 3,552 | | | 212 | | | 5,788 | | | 2,976 | | | 9,340 | | | 12,316 | | | (1,707) | | 1990 | | 09/25/2012 |
Restaurants – Full Service | | Lumberton | | NC | | | (f) | | | 676 | | | 451 | | | - | | | - | | | 676 | | | 451 | | | 1,127 | | | (125) | | 1999 | | 09/25/2012 |
Restaurants – Full Service | | Morrisville | | NC | | | (f) | | | 891 | | | 235 | | | - | | | - | | | 891 | | | 235 | | | 1,126 | | | (78) | | 1999 | | 09/25/2012 |
Restaurants – Full Service | | Roanoke Rapids | | NC | | | (f) | | | 464 | | | 471 | | | - | | | - | | | 464 | | | 471 | | | 935 | | | (129) | | 1998 | | 09/25/2012 |
Restaurants – Full Service | | Rocky Mount | | NC | | | (f) | | | 593 | | | 403 | | | - | | | - | | | 593 | | | 403 | | | 996 | | | (118) | | 1994 | | 09/25/2012 |
Restaurants – Full Service | | Smithfield | | NC | | | (f) | | | 702 | | | 384 | | | - | | | - | | | 702 | | | 384 | | | 1,086 | | | (122) | | 1998 | | 09/25/2012 |
Restaurants – Full Service | | Wilson | | NC | | �� | (f) | | | 631 | | | 304 | | | - | | | - | | | 631 | | | 304 | | | 935 | | | (92) | | 2001 | | 09/25/2012 |
Restaurants – Full Service | | Charleston | | WV | | | (f) | | | 496 | | | 399 | | | - | | | - | | | 496 | | | 399 | | | 895 | | | (110) | | 2004 | | 09/25/2012 |
Child Day Care Services | | Columbus | | OH | | | (f) | | | 937 | | | 1,135 | | | - | | | - | | | 937 | | | 1,135 | | | 2,072 | | | (292) | | 1992 | | 09/28/2012 |
Furniture Stores | | Fairfield | | CA | | | | | | 2,618 | | | 2,633 | | | - | | | - | | | 2,618 | | | 2,633 | | | 5,251 | | | (601) | | 2006 | | 10/01/2012 |
Furniture Stores | | Rohnert Park | | CA | | | 5,496 | | | 2,115 | | | 3,362 | | | - | | | - | | | 2,115 | | | 3,362 | | | 5,477 | | | (757) | | 2006 | | 10/01/2012 |
Child Day Care Services | | Oak Creek | | WI | | | (f) | | | 781 | | | 1,657 | | | - | | | - | | | 781 | | | 1,657 | | | 2,438 | | | (351) | | 2009 | | 10/02/2012 |
Restaurants – Full Service | | Auburn | | IN | | | (f) | | | 750 | | | 1,420 | | | - | | | - | | | 750 | | | 1,420 | | | 2,170 | | | (390) | | 2000 | | 10/05/2012 |
Restaurants – Full Service | | Fort Wayne | | IN | | | (f) | | | 946 | | | 1,335 | | | - | | | - | | | 946 | | | 1,335 | | | 2,281 | | | (332) | | 1993 | | 10/05/2012 |
Restaurants – Full Service | | Fort Wayne | | IN | | | (f) | | | 964 | | | 1,337 | | | - | | | - | | | 964 | | | 1,337 | | | 2,301 | | | (328) | | 1993 | | 10/05/2012 |
Restaurants – Full Service | | Fort Wayne | | IN | | | (f) | | | 1,239 | | | 1,614 | | | - | | | - | | | 1,239 | | | 1,614 | | | 2,853 | | | (379) | | 2002 | | 10/05/2012 |
Restaurants – Full Service | | Goshen | | IN | | | (f) | | | 612 | | | 1,451 | | | - | | | - | | | 612 | | | 1,451 | | | 2,063 | | | (388) | | 1999 | | 10/05/2012 |
Restaurants – Full Service | | Portage | | IN | | | (f) | | | 555 | | | 1,374 | | | - | | | - | | | 555 | | | 1,374 | | | 1,929 | | | (358) | | 1999 | | 10/05/2012 |
Restaurants – Full Service | | Valparaiso | | IN | | | (f) | | | 507 | | | 1,502 | | | - | | | - | | | 507 | | | 1,502 | | | 2,009 | | | (382) | | 1995 | | 10/05/2012 |
| | | | | | | | | | | | | | | | | | | | | | | | | | | | | | | | | | | |
Descriptions (a) | | | | Initial Cost to Company | | Costs Capitalized Subsequent to Acquisition | | Gross amount at December 31, 2018 (b) (c) | | | | | | |
Tenant Industry | | City | | St | | Encumbrances | | Land &
Improvements | | Building &
Improvements | | Land &
Improvements | | Building &
Improvements | | Land &
Improvements | | Building &
Improvements | | Total | | Accumulated
Depreciation (d) (e) | | Year
Constructed | | Date Acquired |
Restaurants – Full Service | | Fremont | | OH | | | (f) | | | 728 | | | 1,443 | | | - | | | - | | | 728 | | | 1,443 | | | 2,171 | | | (360) | | 2000 | | 10/05/2012 |
Restaurants – Full Service | | Lima | | OH | | | (f) | | | 765 | | | 1,576 | | | - | | | - | | | 765 | | | 1,576 | | | 2,341 | | | (383) | | 1996 | | 10/05/2012 |
Restaurants – Full Service | | Lima | | OH | | | (f) | | | 755 | | | 1,536 | | | - | | | - | | | 755 | | | 1,536 | | | 2,291 | | | (374) | | 2005 | | 10/05/2012 |
Restaurants – Full Service | | Northwood | | OH | | | (f) | | | 615 | | | 1,716 | | | - | | | - | | | 615 | | | 1,716 | | | 2,331 | | | (421) | | 2004 | | 10/05/2012 |
Child Day Care Services | | Bradenton | | FL | | | (f) | | | 545 | | | 2,149 | | | - | | | - | | | 545 | | | 2,149 | | | 2,694 | | | (541) | | 1982 | | 10/19/2012 |
Restaurants – Full Service | | Chicago | | IL | | | (f) | | | 504 | | | 3,959 | | | - | | | - | | | 504 | | | 3,959 | | | 4,463 | | | (675) | | 1886 | | 10/29/2012 |
Restaurants – Full Service | | Chicago | | IL | | | (f) | | | 900 | | | 2,410 | | | - | | | - | | | 900 | | | 2,410 | | | 3,310 | | | (554) | | 1923 | | 10/29/2012 |
Restaurants – Full Service | | Chicago | | IL | | | (f) | | | 810 | | | 5,559 | | | 18 | | | 470 | | | 828 | | | 6,029 | | | 6,857 | | | (949) | | 2008 | | 10/29/2012 |
Restaurants – Limited Service | | Baton Rouge | | LA | | | (f) | | | 700 | | | 162 | | | - | | | - | | | 700 | | | 162 | | | 862 | | | (60) | | 2005 | | 11/09/2012 |
Restaurants – Limited Service | | Baton Rouge | | LA | | | (f) | | | 742 | | | 212 | | | - | | | - | | | 742 | | | 212 | | | 954 | | | (85) | | 2005 | | 11/09/2012 |
Restaurants – Limited Service | | Denham | | LA | | | (f) | | | 831 | | | 444 | | | - | | | - | | | 831 | | | 444 | | | 1,275 | | | (172) | | 2001 | | 11/09/2012 |
Restaurants – Limited Service | | Donaldsonville | | LA | | | (f) | | | 327 | | | 562 | | | - | | | - | | | 327 | | | 562 | | | 889 | | | (205) | | 1981 | | 11/09/2012 |
Restaurants – Limited Service | | Gonzales | | LA | | | (f) | | | 547 | | | 599 | | | - | | | - | | | 547 | | | 599 | | | 1,146 | | | (199) | | 1981 | | 11/09/2012 |
Restaurants – Limited Service | | Gonzales | | LA | | | (f) | | | 617 | | | 419 | | | - | | | - | | | 617 | | | 419 | | | 1,036 | | | (153) | | 1996 | | 11/09/2012 |
Restaurants – Limited Service | | Kentwood | | LA | | | (f) | | | 243 | | | 600 | | | - | | | - | | | 243 | | | 600 | | | 843 | | | (164) | | 2006 | | 11/09/2012 |
Restaurants – Limited Service | | Larose | | LA | | | (f) | | | 418 | | | 756 | | | - | | | - | | | 418 | | | 756 | | | 1,174 | | | (290) | | 1986 | | 11/09/2012 |
Restaurants – Limited Service | | Port Vincent | | LA | | | (f) | | | 692 | | | 207 | | | - | | | - | | | 692 | | | 207 | | | 899 | | | (68) | | 2006 | | 11/09/2012 |
Restaurants – Limited Service | | Prairieville | | LA | | | (f) | | | 724 | | | 165 | | | - | | | - | | | 724 | | | 165 | | | 889 | | | (91) | | 1995 | | 11/09/2012 |
Restaurants – Limited Service | | Walker | | LA | | | (f) | | | 508 | | | 776 | | | - | | | - | | | 508 | | | 776 | | | 1,284 | | | (302) | | 2001 | | 11/09/2012 |
Other Schools and Instruction | | Denver | | CO | | | 6,723 | | | 5,201 | | | 8,925 | | | - | | | - | | | 5,201 | | | 8,925 | | | 14,126 | | | (1,810) | | 1962 | | 11/21/2012 |
Scientific Research and Development Services | | Columbia | | MO | | | 10,328 | | | 807 | | | 13,794 | | | - | | | 620 | | | 807 | | | 14,414 | | | 15,221 | | | (2,053) | | 2008 | | 11/29/2012 |
Restaurants – Full Service | | Orland Park | | IL | | | (f) | | | 1,267 | | | 4,320 | | | - | | | - | | | 1,267 | | | 4,320 | | | 5,587 | | | (711) | | 2005 | | 11/30/2012 |
Child Day Care Services | | Cincinnati | | OH | | | (f) | | | 1,074 | | | 1,610 | | | - | | | - | | | 1,074 | | | 1,610 | | | 2,684 | | | (399) | | 2001 | | 12/10/2012 |
Child Day Care Services | | Powell | | OH | | | (f) | | | 1,102 | | | 1,602 | | | - | | | - | | | 1,102 | | | 1,602 | | | 2,704 | | | (397) | | 1998 | | 12/10/2012 |
Child Day Care Services | | Manassas | | VA | | | (f) | | | 938 | | | 2,580 | | | - | | | - | | | 938 | | | 2,580 | | | 3,518 | | | (582) | | 2005 | | 12/10/2012 |
Restaurants – Limited Service | | Dalton | | GA | | | (f) | | | 418 | | | 1,133 | | | - | | | - | | | 418 | | | 1,133 | | | 1,551 | | | (264) | | 1984 | | 12/11/2012 |
Restaurants – Limited Service | | Chattanooga | | TN | | | (f) | | | 426 | | | 984 | | | - | | | - | | | 426 | | | 984 | | | 1,410 | | | (233) | | 1984 | | 12/11/2012 |
Restaurants – Limited Service | | East Ridge | | TN | | | (f) | | | 481 | | | 807 | | | - | | | - | | | 481 | | | 807 | | | 1,288 | | | (199) | | 1982 | | 12/11/2012 |
Restaurants – Full Service | | Abilene | | TX | | | (f) | | | 593 | | | 2,023 | | | - | | | - | | | 593 | | | 2,023 | | | 2,616 | | | (502) | | 1961 | | 12/11/2012 |
Health Clubs | | Mesa | | AZ | | | (f) | | | 1,112 | | | 3,684 | | | - | | | - | | | 1,112 | | | 3,684 | | | 4,796 | | | (656) | | 2003 | | 12/20/2012 |
Health Clubs | | Scottsdale | | AZ | | | (f) | | | 2,029 | | | 4,716 | | | - | | | - | | | 2,029 | | | 4,716 | | | 6,745 | | | (897) | | 2003 | | 12/20/2012 |
Restaurants – Full Service | | Dekalb | | IL | | | (f) | | | 615 | | | 747 | | | - | | | - | | | 615 | | | 747 | | | 1,362 | | | (212) | | 2000 | | 12/27/2012 |
Restaurants – Full Service | | Effingham | | IL | | | (f) | | | 514 | | | 717 | | | - | | | - | | | 514 | | | 717 | | | 1,231 | | | (181) | | 2003 | | 12/27/2012 |
Restaurants – Full Service | | Skokie | | IL | | | (f) | | | 737 | | | 1,189 | | | - | | | - | | | 737 | | | 1,189 | | | 1,926 | | | (289) | | 2000 | | 12/27/2012 |
Restaurants – Full Service | | Merrillville | | IN | | | (f) | | | 981 | | | 1,795 | | | - | | | - | | | 981 | | | 1,795 | | | 2,776 | | | (491) | | 1979 | | 12/27/2012 |
Restaurants – Full Service | | Emporia | | KS | | | (f) | | | 730 | | | 1,541 | | | - | | | - | | | 730 | | | 1,541 | | | 2,271 | | | (479) | | 1998 | | 12/27/2012 |
Restaurants – Full Service | | Louisville | | KY | | | (f) | | | 1,127 | | | 1,577 | | | - | | | - | | | 1,127 | | | 1,577 | | | 2,704 | | | (456) | | 1973 | | 12/27/2012 |
Restaurants – Full Service | | Louisville | | KY | | | (f) | | | 1,122 | | | 1,415 | | | - | | | - | | | 1,122 | | | 1,415 | | | 2,537 | | | (421) | | 1974 | | 12/27/2012 |
| | | | | | | | | | | | | | | | | | | | | | | | | | | | | | | | | | | |
Descriptions (a) | | | | Initial Cost to Company | | Costs Capitalized Subsequent to Acquisition | | Gross amount at December 31, 2018 (b) (c) | | | | | | |
Tenant Industry | | City | | St | | Encumbrances | | Land &
Improvements | | Building &
Improvements | | Land &
Improvements | | Building &
Improvements | | Land &
Improvements | | Building &
Improvements | | Total | | Accumulated
Depreciation (d) (e) | | Year
Constructed | | Date Acquired |
Restaurants – Full Service | | Maryville | | MO | | | (f) | | | 682 | | | 1,727 | | | - | | | - | | | 682 | | | 1,727 | | | 2,409 | | | (452) | | 2005 | | 12/27/2012 |
Restaurants – Full Service | | Grand Island | | NE | | | (f) | | | 749 | | | 1,922 | | | - | | | - | | | 749 | | | 1,922 | | | 2,671 | | | (407) | | 1999 | | 12/27/2012 |
Restaurants – Full Service | | Lincoln | | NE | | | (f) | | | 672 | | | 1,539 | | | - | | | - | | | 672 | | | 1,539 | | | 2,211 | | | (368) | | 1993 | | 12/27/2012 |
Restaurants – Full Service | | Ada | | OK | | | 1,461 | | | 1,252 | | | 1,438 | | | - | | | - | | | 1,252 | | | 1,438 | | | 2,690 | | | (336) | | 2006 | | 12/27/2012 |
Restaurants – Full Service | | Altus | | OK | | | 1,020 | | | 732 | | | 1,147 | | | - | | | - | | | 732 | | | 1,147 | | | 1,879 | | | (272) | | 2005 | | 12/27/2012 |
Restaurants – Full Service | | Ardmore | | OK | | | (f) | | | 946 | | | 1,539 | | | - | | | - | | | 946 | | | 1,539 | | | 2,485 | | | (393) | | 1998 | | 12/27/2012 |
Restaurants – Full Service | | Lawton | | OK | | | 1,184 | | | 923 | | | 1,258 | | | - | | | - | | | 923 | | | 1,258 | | | 2,181 | | | (368) | | 1996 | | 12/27/2012 |
Restaurants – Full Service | | Goodlettsville | | TN | | | (f) | | | 969 | | | 1,616 | | | - | | | - | | | 969 | | | 1,616 | | | 2,585 | | | (520) | | 1973 | | 12/27/2012 |
Restaurants – Full Service | | Memphis | | TN | | | (f) | | | 1,244 | | | 1,580 | | | - | | | - | | | 1,244 | | | 1,580 | | | 2,824 | | | (494) | | 2002 | | 12/27/2012 |
Restaurants – Full Service | | Nashville | | TN | | | (f) | | | 979 | | | 1,319 | | | - | | | - | | | 979 | | | 1,319 | | | 2,298 | | | (419) | | 1978 | | 12/27/2012 |
Restaurants – Full Service | | Nashville | | TN | | | (f) | | | 626 | | | 2,270 | | | - | | | - | | | 626 | | | 2,270 | | | 2,896 | | | (494) | | 1910 | | 12/27/2012 |
Restaurants – Full Service | | Amarillo | | TX | | | 1,188 | | | 927 | | | 1,330 | | | - | | | - | | | 927 | | | 1,330 | | | 2,257 | | | (382) | | 1995 | | 12/27/2012 |
Restaurants – Full Service | | Lubbock | | TX | | | 1,104 | | | 1,289 | | | 808 | | | - | | | - | | | 1,289 | | | 808 | | | 2,097 | | | (236) | | 1994 | | 12/27/2012 |
Restaurants – Full Service | | Gillette | | WY | | | (f) | | | 1,322 | | | 1,990 | | | - | | | - | | | 1,322 | | | 1,990 | | | 3,312 | | | (507) | | 2001 | | 12/27/2012 |
Restaurants – Full Service | | Omaha | | NE | | | (f) | | | 920 | | | 1,324 | | | - | | | - | | | 920 | | | 1,324 | | | 2,244 | | | (336) | | 2005 | | 12/28/2012 |
Restaurants – Full Service | | Oklahoma City | | OK | | | (f) | | | 507 | | | 556 | | | - | | | - | | | 507 | | | 556 | | | 1,063 | | | (202) | | 1999 | | 12/28/2012 |
Restaurants – Full Service | | Oklahoma City | | OK | | | (f) | | | 186 | | | 390 | | | - | | | - | | | 186 | | | 390 | | | 576 | | | (116) | | 1984 | | 12/28/2012 |
Restaurants – Full Service | | Oklahoma City | | OK | | | (f) | | | 500 | | | 603 | | | - | | | - | | | 500 | | | 603 | | | 1,103 | | | (200) | | 1968 | | 12/28/2012 |
Restaurants – Full Service | | Oklahoma City | | OK | | | (f) | | | 398 | | | 427 | | | - | | | - | | | 398 | | | 427 | | | 825 | | | (136) | | 1995 | | 12/28/2012 |
Restaurants – Full Service | | Oklahoma City | | OK | | | (f) | | | 291 | | | 384 | | | - | | | - | | | 291 | | | 384 | | | 675 | | | (129) | | 1997 | | 12/28/2012 |
Restaurants – Full Service | | Yukon | | OK | | | (f) | | | 408 | | | 426 | | | - | | | - | | | 408 | | | 426 | | | 834 | | | (160) | | 2002 | | 12/28/2012 |
Restaurants – Full Service | | Bartlett | | TN | | | (f) | | | 1,182 | | | 1,297 | | | - | | | - | | | 1,182 | | | 1,297 | | | 2,479 | | | (363) | | 1998 | | 12/28/2012 |
Restaurants – Limited Service | | Huntingdon | | TN | | | (f) | | | 132 | | | 956 | | | - | | | - | | | 132 | | | 956 | | | 1,088 | | | (135) | | 1989 | | 12/28/2012 |
Restaurants – Limited Service | | Paris | | TN | | | (f) | | | 383 | | | 686 | | | - | | | - | | | 383 | | | 686 | | | 1,069 | | | (139) | | 1981 | | 12/28/2012 |
Restaurants – Limited Service | | Wise | | VA | | | (f) | | | 371 | | | 1,207 | | | - | | | - | | | 371 | | | 1,207 | | | 1,578 | | | (184) | | 1983 | | 12/28/2012 |
Other Motor Vehicle Dealers | | Liberty Lake | | WA | | | (f) | | | 2,458 | | | 2,687 | | | 1,570 | | | 2,068 | | | 4,028 | | | 4,755 | | | 8,783 | | | (1,110) | | 2006 | | 12/28/2012 |
Restaurants – Limited Service | | Welch | | WV | | | (f) | | | 542 | | | 997 | | | - | | | - | | | 542 | | | 997 | | | 1,539 | | | (180) | | 1984 | | 12/28/2012 |
Restaurants – Full Service | | Jonesboro | | GA | | | (f) | | | 477 | | | 664 | | | - | | | 220 | | | 477 | | | 884 | | | 1,361 | | | (187) | | 2000 | | 12/31/2012 |
Restaurants – Full Service | | Lawrenceville | | GA | | | (f) | | | 675 | | | 446 | | | - | | | 175 | | | 675 | | | 621 | | | 1,296 | | | (140) | | 2000 | | 12/31/2012 |
Restaurants – Limited Service | | Altoona | | IA | | | (f) | | | 368 | | | 468 | | | - | | | - | | | 368 | | | 468 | | | 836 | | | (109) | | 1995 | | 12/31/2012 |
Restaurants – Limited Service | | Ankeny | | IA | | | (f) | | | 423 | | | 474 | | | - | | | - | | | 423 | | | 474 | | | 897 | | | (131) | | 1986 | | 12/31/2012 |
Restaurants – Limited Service | | Boone | | IA | | | (f) | | | 308 | | | 538 | | | - | | | - | | | 308 | | | 538 | | | 846 | | | (115) | | 1974 | | 12/31/2012 |
Restaurants – Limited Service | | Des Moines | | IA | | | (f) | | | 419 | | | 901 | | | - | | | - | | | 419 | | | 901 | | | 1,320 | | | (194) | | 2003 | | 12/31/2012 |
Restaurants – Limited Service | | Des Moines | | IA | | | (f) | | | 382 | | | 555 | | | - | | | - | | | 382 | | | 555 | | | 937 | | | (147) | | 2008 | | 12/31/2012 |
Restaurants – Limited Service | | Des Moines | | IA | | | (f) | | | 250 | | | 536 | | | - | | | - | | | 250 | | | 536 | | | 786 | | | (140) | | 1991 | | 12/31/2012 |
Restaurants – Limited Service | | West Des Moines | | IA | | | (f) | | | 366 | | | 652 | | | - | | | - | | | 366 | | | 652 | | | 1,018 | | | (143) | | 2010 | | 12/31/2012 |
Restaurants – Limited Service | | West Des Moines | | IA | | | (f) | | | 490 | | | 628 | | | - | | | - | | | 490 | | | 628 | | | 1,118 | | | (141) | | 1995 | | 12/31/2012 |
Restaurants – Full Service | | Fishers | | IN | | | (f) | | | 750 | | | 1,622 | | | - | | | 440 | | | 750 | | | 2,062 | | | 2,812 | | | (455) | | 2004 | | 01/03/2013 |
Restaurants – Full Service | | Fishers | | IN | | | (f) | | | 730 | | | 1,181 | | | 8 | | | - | | | 738 | | | 1,181 | | | 1,919 | | | (235) | | 2009 | | 01/03/2013 |
Restaurants – Full Service | | Greenwood | | IN | | | (f) | | | 1,418 | | | 1,194 | | | - | | | 164 | | | 1,418 | | | 1,358 | | | 2,776 | | | (486) | | 2007 | | 01/03/2013 |
Restaurants – Full Service | | Lafayette | | IN | | | (f) | | | 679 | | | 1,953 | | | 198 | | | 388 | | | 877 | | | 2,341 | | | 3,218 | | | (492) | | 2006 | | 01/03/2013 |
| | | | | | | | | | | | | | | | | | | | | | | | | | | | | | | | | | | |
Descriptions (a) | | | | Initial Cost to Company | | Costs Capitalized Subsequent to Acquisition | | Gross amount at December 31, 2018 (b) (c) | | | | | | |
Tenant Industry | | City | | St | | Encumbrances | | Land &
Improvements | | Building &
Improvements | | Land &
Improvements | | Building &
Improvements | | Land &
Improvements | | Building &
Improvements | | Total | | Accumulated
Depreciation (d) (e) | | Year
Constructed | | Date Acquired |
Health Clubs | | North Las Vegas | | NV | | | (f) | | | 1,609 | | | 6,621 | | | - | | | - | | | 1,609 | | | 6,621 | | | 8,230 | | | (1,058) | | 2009 | | 01/17/2013 |
Restaurants – Full Service | | Peoria | | AZ | | | (f) | | | 510 | | | 1,630 | | | - | | | - | | | 510 | | | 1,630 | | | 2,140 | | | (348) | | 2003 | | 01/22/2013 |
Electronics and Appliance Stores | | Las Cruces | | NM | | | (f) | | | 1,350 | | | 4,043 | | | - | | | - | | | 1,350 | | | 4,043 | | | 5,393 | | | (687) | | 1981 | | 01/31/2013 |
Electronics and Appliance Stores | | Houston | | TX | | | (f) | | | 1,538 | | | 4,829 | | | 61 | | | 483 | | | 1,599 | | | 5,312 | | | 6,911 | | | (888) | | 2007 | | 01/31/2013 |
Electronics and Appliance Stores | | McAllen | | TX | | | (f) | | �� | 1,321 | | | 2,917 | | | - | | | - | | | 1,321 | | | 2,917 | | | 4,238 | | | (505) | | 2006 | | 01/31/2013 |
Electronics and Appliance Stores | | Mesquite | | TX | | | (f) | | | 1,795 | | | 5,838 | | | - | | | - | | | 1,795 | | | 5,838 | | | 7,633 | | | (922) | | 1973 | | 01/31/2013 |
Restaurants – Full Service | | Norcross | | GA | | | (f) | | | 499 | | | 190 | | | 2 | | | 31 | | | 501 | | | 221 | | | 722 | | | (63) | | 1999 | | 02/05/2013 |
Restaurants – Full Service | | Norcross | | GA | | | (f) | | | 687 | | | 351 | | | 5 | | | 92 | | | 692 | | | 443 | | | 1,135 | | | (127) | | 1996 | | 02/05/2013 |
Restaurants – Full Service | | Stockbridge | | GA | | | (f) | | | 704 | | | 1,274 | | | 6 | | | 104 | | | 710 | | | 1,378 | | | 2,088 | | | (352) | | 1996 | | 02/05/2013 |
Movie Theaters | | Lewisville | | TX | | | (f) | | | 1,330 | | | 3,294 | | | - | | | - | | | 1,330 | | | 3,294 | | | 4,624 | | | (819) | | 1994 | | 02/08/2013 |
Restaurants – Limited Service | | Charlotte | | NC | | | (f) | | | 997 | | | 109 | | | - | | | - | | | 997 | | | 109 | | | 1,106 | | | (46) | | 2005 | | 02/27/2013 |
Restaurants – Limited Service | | Charlotte | | NC | | | (f) | | | 978 | | | 128 | | | - | | | - | | | 978 | | | 128 | | | 1,106 | | | (54) | | 2007 | | 02/27/2013 |
Restaurants – Limited Service | | Gastonia | | NC | | | (f) | | | 703 | | | 244 | | | - | | | - | | | 703 | | | 244 | | | 947 | | | (95) | | 2004 | | 02/27/2013 |
Restaurants – Limited Service | | Indian Trail | | NC | | | (f) | | | 830 | | | 78 | | | - | | | - | | | 830 | | | 78 | | | 908 | | | (33) | | 2003 | | 02/27/2013 |
Restaurants – Limited Service | | Mooresville | | NC | | | (f) | | | 874 | | | 34 | | | - | | | - | | | 874 | | | 34 | | | 908 | | | (15) | | 2002 | | 02/27/2013 |
Restaurants – Limited Service | | Morganton | | NC | | | (f) | | | 703 | | | 28 | | | - | | | - | | | 703 | | | 28 | | | 731 | | | (13) | | 2003 | | 02/27/2013 |
Restaurants – Limited Service | | Newton | | NC | | | (f) | | | 594 | | | 403 | | | - | | | - | | | 594 | | | 403 | | | 997 | | | (173) | | 2002 | | 02/27/2013 |
Home Furnishings Stores | | Oklahoma City | | OK | | | (f) | | | 2,898 | | | 5,889 | | | - | | | - | | | 2,898 | | | 5,889 | | | 8,787 | | | (1,440) | | 1995 | | 03/15/2013 |
Home Furnishings Stores | | Tulsa | | OK | | | (f) | | | 3,406 | | | 5,372 | | | - | | | - | | | 3,406 | | | 5,372 | | | 8,778 | | | (1,417) | | 1996 | | 03/15/2013 |
Furniture Stores | | Prescott | | AZ | | | (f) | | | 1,937 | | | 3,216 | | | - | | | 200 | | | 1,937 | | | 3,416 | | | 5,353 | | | (610) | | 2007 | | 03/26/2013 |
Foundries | | Fayetteville | | AR | | | (f) | | | 968 | | | 2,227 | | | - | | | - | | | 968 | | | 2,227 | | | 3,195 | | | (437) | | 2005 | | 03/28/2013 |
Foundries | | Harrison | | AR | | | (f) | | | 224 | | | 1,322 | | | - | | | - | | | 224 | | | 1,322 | | | 1,546 | | | (291) | | 1998 | | 03/28/2013 |
Foundries | | Harrison | | AR | | | (f) | | | 920 | | | 2,378 | | | - | | | 2,400 | | | 920 | | | 4,778 | | | 5,698 | | | (867) | | 1950 | | 03/28/2013 |
Foundries | | Harrison | | AR | | | (f) | | | 211 | | | 1,438 | | | - | | �� | - | | | 211 | | | 1,438 | | | 1,649 | | | (306) | | 1988 | | 03/28/2013 |
Restaurants – Limited Service | | Ashland | | KY | | | (f) | | | 1,224 | | | 1,986 | | | - | | | - | | | 1,224 | | | 1,986 | | | 3,210 | | | (500) | | 1996 | | 03/28/2013 |
Foundries | | Chelmsford | | MA | | | (f) | | | 542 | | | 571 | | | - | | | - | | | 542 | | | 571 | | | 1,113 | | | (343) | | 1963 | | 03/28/2013 |
Restaurants – Limited Service | | Ironwood | | MI | | | (f) | | | 171 | | | 415 | | | - | | | 376 | | | 171 | | | 791 | | | 962 | | | (121) | | 1999 | | 03/28/2013 |
Restaurants – Limited Service | | Ishpeming | | MI | | | (f) | | | 384 | | | 597 | | | - | | | - | | | 384 | | | 597 | | | 981 | | | (135) | | 1999 | | 03/28/2013 |
Foundries | | Arden Hills | | MN | | | (f) | | | 1,176 | | | 1,359 | | | - | | | - | | | 1,176 | | | 1,359 | | | 2,535 | | | (444) | | 1964 | | 03/28/2013 |
Foundries | | St. Charles | | MO | | | (f) | | | 988 | | | 825 | | | 163 | | | 1,069 | | | 1,151 | | | 1,894 | | | 3,045 | | | (362) | | 1995 | | 03/28/2013 |
Restaurants – Limited Service | | Lillington | | NC | | | (f) | | | 188 | | | 377 | | | - | | | - | | | 188 | | | 377 | | | 565 | | | (83) | | 1970 | | 03/28/2013 |
Foundries | | Dover | | NH | | | (f) | | | 1,125 | | | 1,688 | | | - | | | - | | | 1,125 | | | 1,688 | | | 2,813 | | | (531) | | 1970 | | 03/28/2013 |
Restaurants – Limited Service | | Clayton | | OH | | | (f) | | | 704 | | | 769 | | | - | | | - | | | 704 | | | 769 | | | 1,473 | | | (180) | | 2004 | | 03/28/2013 |
Foundries | | Loyalhanna | | PA | | | (f) | | | 237 | | | 1,928 | | | 650 | | | - | | | 887 | | | 1,928 | | | 2,815 | | | (373) | | 1989 | | 03/28/2013 |
Restaurants – Limited Service | | Jefferson City | | TN | | | (f) | | | 450 | | | 440 | | | - | | | - | | | 450 | | | 440 | | | 890 | | | (100) | | 1988 | | 03/28/2013 |
| | | | | | | | | | | | | | | | | | | | | | | | | | | | | | | | | | | |
Descriptions (a) | | | | Initial Cost to Company | | Costs Capitalized Subsequent to Acquisition | | Gross amount at December 31, 2018 (b) (c) | | | | | | |
Tenant Industry | | City | | St | | Encumbrances | | Land & Improvements | | Building & Improvements | | Land & Improvements | | Building & Improvements | | Land & Improvements | | Building & Improvements | | Total | | Accumulated
Depreciation (d) (e) | | Year
Constructed | | Date Acquired |
Restaurants – Limited Service | | Houston | | TX | | | (f) | | | 912 | | | 913 | | | - | | | - | | | 912 | | | 913 | | | 1,825 | | | (206) | | 1988 | | 03/28/2013 |
Restaurants – Limited Service | | Cross Lanes | | WV | | | (f) | | | 1,490 | | | 2,067 | | | - | | | - | | | 1,490 | | | 2,067 | | | 3,557 | | | (564) | | 1999 | | 03/28/2013 |
Restaurants – Limited Service | | Huntington | | WV | | | (f) | | | 1,042 | | | 2,287 | | | - | | | - | | | 1,042 | | | 2,287 | | | 3,329 | | | (576) | | 1997 | | 03/28/2013 |
Restaurants – Limited Service | | Parkersburg | | WV | | | (f) | | | 1,288 | | | 2,428 | | | - | | | - | | | 1,288 | | | 2,428 | | | 3,716 | | | (609) | | 2004 | | 03/28/2013 |
Colleges, Universities, and Professional Schools | | San Marcos | | CA | | | 15,583 | | | 4,528 | | | 22,213 | | | - | | | - | | | 4,528 | | | 22,213 | | | 26,741 | | | (2,887) | | 2008 | | 03/29/2013 |
Other Personal Services | | Wheat Ridge | | CO | | | (f) | | | 590 | | | 211 | | | - | | | - | | | 590 | | | 211 | | | 801 | | | (72) | | 1953 | | 03/29/2013 |
Other Personal Services | | Avon | | CT | | | (f) | | | 747 | | | 215 | | | - | | | - | | | 747 | | | 215 | | | 962 | | | (155) | | 1964 | | 03/29/2013 |
Other Personal Services | | Bethany | | CT | | | (f) | | | 257 | | | 435 | | | - | | | - | | | 257 | | | 435 | | | 692 | | | (274) | | 1970 | | 03/29/2013 |
Restaurants – Full Service | | Snellville | | GA | | | (f) | | | 427 | | | 1,005 | | | 4 | | | 65 | | | 431 | | | 1,070 | | | 1,501 | | | (264) | | 1985 | | 03/29/2013 |
Restaurants – Full Service | | Stone Mountain | | GA | | | (f) | | | 894 | | | 1,148 | | | 6 | | | 108 | | | 900 | | | 1,256 | | | 2,156 | | | (313) | | 1984 | | 03/29/2013 |
Other Personal Services | | Prairie View | | IL | | | (f) | | | 780 | | | 2,415 | | | - | | | - | | | 780 | | | 2,415 | | | 3,195 | | | (884) | | 1975 | | 03/29/2013 |
Other Personal Services | | Carmel | | IN | | | (f) | | | 299 | | | 783 | | | - | | | - | | | 299 | | | 783 | | | 1,082 | | | (253) | | 1984 | | 03/29/2013 |
Other Personal Services | | Boxford | | MA | | | (f) | | | 1,185 | | | 829 | | | - | | | - | | | 1,185 | | | 829 | | | 2,014 | | | (508) | | 1955 | | 03/29/2013 |
Other Personal Services | | Wakefield | | MA | | | (f) | | | 401 | | | 901 | | | - | | | - | | | 401 | | | 901 | | | 1,302 | | | (264) | | 1965 | | 03/29/2013 |
Other Personal Services | | Clinton Township | | MI | | | (f) | | | 511 | | | 451 | | | - | | | - | | | 511 | | | 451 | | | 962 | | | (177) | | 1977 | | 03/29/2013 |
Other Personal Services | | Cinnaminson | | NJ | | | (f) | | | 378 | | | 323 | | | - | | | - | | | 378 | | | 323 | | | 701 | | | (109) | | 1949 | | 03/29/2013 |
Other Personal Services | | Windsor | | NJ | | | (f) | | | 691 | | | 170 | | | - | | | - | | | 691 | | | 170 | | | 861 | | | (59) | | 1985 | | 03/29/2013 |
Other Personal Services | | Cincinnati | | OH | | | (f) | | | 605 | | | 276 | | | - | | | - | | | 605 | | | 276 | | | 881 | | | (108) | | 1972 | | 03/29/2013 |
Other Personal Services | | Chadds Ford | | PA | | | (f) | | | 837 | | | 666 | | | - | | | - | | | 837 | | | 666 | | | 1,503 | | | (211) | | 1979 | | 03/29/2013 |
Other Personal Services | | Houston | | TX | | | (f) | | | 237 | | | 1,015 | | | - | | | - | | | 237 | | | 1,015 | | | 1,252 | | | (304) | | 1975 | | 03/29/2013 |
Other Personal Services | | Spring | | TX | | | (f) | | | 1,828 | | | 3,561 | | | - | | | - | | | 1,828 | | | 3,561 | | | 5,389 | | | (929) | | 1973 | | 03/29/2013 |
Automotive Parts, Accessories, and Tire Stores | | La Salle | | IL | | | (f) | | | 1,620 | | | 8,166 | | | - | | | - | | | 1,620 | | | 8,166 | | | 9,786 | | | (1,847) | | 1997 | | 04/17/2013 |
Restaurants – Full Service | | Amarillo | | TX | | | (f) | | | 840 | | | 1,954 | | | - | | | - | | | 840 | | | 1,954 | | | 2,794 | | | (432) | | 2002 | | 05/06/2013 |
Restaurants – Full Service | | Lubbock | | TX | | | (f) | | | 766 | | | 1,657 | | | - | | | - | | | 766 | | | 1,657 | | | 2,423 | | | (390) | | 2004 | | 05/06/2013 |
Other Motor Vehicle Dealers | | Byron | | GA | | | | | | 1,726 | | | 3,656 | | | 932 | | | - | | | 2,658 | | | 3,656 | | | 6,314 | | | (1,130) | | 2007 | | 05/16/2013 |
Restaurants – Full Service | | Clovis | | NM | | | (f) | | | 253 | | | 787 | | | - | | | - | | | 253 | | | 787 | | | 1,040 | | | (199) | | 2013 | | 05/28/2013 |
Restaurants – Full Service | | Ruidoso | | NM | | | (f) | | | 518 | | | 346 | | | 72 | | | 528 | | | 590 | | | 874 | | | 1,464 | | | (268) | | 1961 | | 05/28/2013 |
Restaurants – Full Service | | Tucumcari | | NM | | | (f) | | | 130 | | | 508 | | | 12 | | | 193 | | | 142 | | | 701 | | | 843 | | | (213) | | 1985 | | 05/28/2013 |
Restaurants – Full Service | | Beeville | | TX | | | (f) | | | 189 | | | 449 | | | 14 | | | 411 | | | 203 | | | 860 | | | 1,063 | | | (246) | | 1986 | | 05/28/2013 |
Restaurants – Full Service | | Corpus Christi | | TX | | | (f) | | | 473 | | | 470 | | | - | | | 268 | | | 473 | | | 738 | | | 1,211 | | | (224) | | 2005 | | 05/28/2013 |
Restaurants – Full Service | | Fort Stockton | | TX | | | (f) | | | 344 | | | 657 | | | 35 | | | 182 | | | 379 | | | 839 | | | 1,218 | | | (225) | | 1978 | | 05/28/2013 |
Restaurants – Full Service | | Lamesa | | TX | | | (f) | | | 220 | | | 447 | | | 31 | | | 581 | | | 251 | | | 1,028 | | | 1,279 | | | (306) | | 1978 | | 05/28/2013 |
Wholesale Automobile Auction | | Washington | | PA | | | (f) | | | 6,508 | | | 1,380 | | | 165 | | | 1,233 | | | 6,673 | | | 2,613 | | | 9,286 | | | (1,647) | | 1975 | | 05/31/2013 |
Restaurants – Full Service | | Cincinnati | | OH | | | (f) | | | 1,334 | | | 1,669 | | | - | | | - | | | 1,334 | | | 1,669 | | | 3,003 | | | (375) | | 2007 | | 06/04/2013 |
Health and Personal Care Stores | | Cherokee Village | | AR | | | (f) | | | 498 | | | 790 | | | - | | | - | | | 498 | | | 790 | | | 1,288 | | | (213) | | 2011 | | 06/14/2013 |
Health and Personal Care Stores | | Marion | | IL | | | (f) | | | 614 | | | 668 | | | - | | | - | | | 614 | | | 668 | | | 1,282 | | | (193) | | 2010 | | 06/14/2013 |
Health and Personal Care Stores | | Albany | | KY | | | (f) | | | 396 | | | 1,051 | | | - | | | - | | | 396 | | | 1,051 | | | 1,447 | | | (276) | | 2010 | | 06/14/2013 |
Health and Personal Care Stores | | Cave City | | KY | | | (f) | | | 365 | | | 754 | | | - | | | - | | | 365 | | | 754 | | | 1,119 | | | (213) | | 2010 | | 06/14/2013 |
Health and Personal Care Stores | | Hartford | | KY | | | (f) | | | 337 | | | 1,066 | | | - | | | - | | | 337 | | | 1,066 | | | 1,403 | | | (272) | | 2012 | | 06/14/2013 |
Health and Personal Care Stores | | Gautier | | MS | | | (f) | | | 764 | | | 1,037 | | | - | | | - | | | 764 | | | 1,037 | | | 1,801 | | | (269) | | 2011 | | 06/14/2013 |
Health and Personal Care Stores | | Leakesville | | MS | | | (f) | | | 361 | | | 915 | | | - | | | - | | | 361 | | | 915 | | | 1,276 | | | (245) | | 2012 | | 06/14/2013 |
Health and Personal Care Stores | | Pascagoula | | MS | | | (f) | | | 646 | | | 995 | | | - | | | - | | | 646 | | | 995 | | | 1,641 | | | (247) | | 2011 | | 06/14/2013 |
Restaurants – Full Service | | LaVale | | MD | | | (f) | | | 1,313 | | | 1,629 | | | - | | | - | | | 1,313 | | | 1,629 | | | 2,942 | | | (369) | | 2005 | | 06/27/2013 |
| | | | | | | | | | | | | | | | | | | | | | | | | | | | | | | | | | | |
Descriptions (a) | | | | Initial Cost to Company | | Costs Capitalized Subsequent to Acquisition | | Gross amount at December 31, 2018 (b) (c) | | | | | | |
Tenant Industry | | City | | St | | Encumbrances | | Land &
Improvements | | Building &
Improvements | | Land &
Improvements | | Building &
Improvements | | Land &
Improvements | | Building &
Improvements | | Total | | Accumulated
Depreciation (d) (e) | | Year
Constructed | | Date Acquired |
Child Day Care Services | | Columbus | | OH | | | (f) | | | 452 | | | 1,687 | | | - | | | - | | | 452 | | | 1,687 | | | 2,139 | | | (313) | | 2006 | | 06/27/2013 |
Child Day Care Services | | Columbus | | OH | | | (f) | | | 253 | | | 943 | | | - | | | - | | | 253 | | | 943 | | | 1,196 | | | (175) | | 2006 | | 06/27/2013 |
Child Day Care Services | | Delaware | | OH | | | (f) | | | 1,130 | | | 1,029 | | | - | | | - | | | 1,130 | | | 1,029 | | | 2,159 | | | (213) | | 2005 | | 06/27/2013 |
Child Day Care Services | | Delaware | | OH | | | (f) | | | 647 | | | 590 | | | - | | | - | | | 647 | | | 590 | | | 1,237 | | | (122) | | 2005 | | 06/27/2013 |
Child Day Care Services | | Hilliard | | OH | | | (f) | | | 278 | | | 852 | | | - | | | - | | | 278 | | | 852 | | | 1,130 | | | (166) | | 2003 | | 06/27/2013 |
Child Day Care Services | | Hilliard | | OH | | | (f) | | | 485 | | | 1,485 | | | - | | | - | | | 485 | | | 1,485 | | | 1,970 | | | (289) | | 2003 | | 06/27/2013 |
Child Day Care Services | | Marysville | | OH | | | (f) | | | 237 | | | 949 | | | - | | | - | | | 237 | | | 949 | | | 1,186 | | | (174) | | 2005 | | 06/27/2013 |
Child Day Care Services | | Marysville | | OH | | | (f) | | | 424 | | | 1,696 | | | - | | | - | | | 424 | | | 1,696 | | | 2,120 | | | (311) | | 2005 | | 06/27/2013 |
Child Day Care Services | | Powell | | OH | | | (f) | | | 735 | | | 2,303 | | | - | | | - | | | 735 | | | 2,303 | | | 3,038 | | | (446) | | 2004 | | 06/27/2013 |
Child Day Care Services | | Powell | | OH | | | (f) | | | 286 | | | 895 | | | - | | | - | | | 286 | | | 895 | | | 1,181 | | | (173) | | 2004 | | 06/27/2013 |
Child Day Care Services | | Westerville | | OH | | | (f) | | | 315 | | | 918 | | | - | | | - | | | 315 | | | 918 | | | 1,233 | | | (180) | | 2005 | | 06/27/2013 |
Child Day Care Services | | Westerville | | OH | | | (f) | | | 550 | | | 1,601 | | | - | | | - | | | 550 | | | 1,601 | | | 2,151 | | | (315) | | 2005 | | 06/27/2013 |
Restaurants – Full Service | | Midlothian | | VA | | | (f) | | | 729 | | | 2,037 | | | - | | | - | | | 729 | | | 2,037 | | | 2,766 | | | (425) | | 1992 | | 06/27/2013 |
Restaurants – Full Service | | Martinsburg | | WV | | | (f) | | | 1,115 | | | 1,267 | | | - | | | - | | | 1,115 | | | 1,267 | | | 2,382 | | | (289) | | 1995 | | 06/27/2013 |
Other Motor Vehicle Dealers | | Holiday | | FL | | | (f) | | | 2,444 | | | 2,723 | | | 1,881 | | | 829 | | | 4,325 | | | 3,552 | | | 7,877 | | | (833) | | 1974 | | 06/28/2013 |
Other Motor Vehicle Dealers | | Jacksonville | | FL | | | (f) | | | 1,758 | | | 2,450 | | | 460 | | | 1,375 | | | 2,218 | | | 3,825 | | | 6,043 | | | (905) | | 2010 | | 06/28/2013 |
Restaurants – Limited Service | | Charlotte | | NC | | | (f) | | | 1,545 | | | 2,176 | | | - | | | - | | | 1,545 | | | 2,176 | | | 3,721 | | | (536) | | 2009 | | 06/28/2013 |
Child Day Care Services | | Maineville | | OH | | | (f) | | | 685 | | | 1,575 | | | - | | | - | | | 685 | | | 1,575 | | | 2,260 | | | (374) | | 2008 | | 06/28/2013 |
Restaurants – Limited Service | | Glen Allen | | VA | | | (f) | | | 2,184 | | | - | | | - | | | - | | | 2,184 | | | - | | | 2,184 | | | - | | 1995 | | 06/28/2013 |
Restaurants – Limited Service | | North Chesterfield | | VA | | | (f) | | | 1,945 | | | - | | | - | | | - | | | 1,945 | | | - | | | 1,945 | | | - | | 1993 | | 06/28/2013 |
Restaurants – Full Service | | Harker Heights | | TX | | | (f) | | | 860 | | | 149 | | | 577 | | | 1,811 | | | 1,437 | | | 1,960 | | | 3,397 | | | (362) | | 2014 | | 07/09/2013 |
Restaurants – Limited Service | | Broken Arrow | | OK | | | (f) | | | 366 | | | 597 | | | - | | | - | | | 366 | | | 597 | | | 963 | | | (120) | | 2007 | | 07/12/2013 |
Restaurants – Limited Service | | Moore | | OK | | | (f) | | | 179 | | | 744 | | | - | | | - | | | 179 | | | 744 | | | 923 | | | (135) | | 2000 | | 07/12/2013 |
Restaurants – Limited Service | | Oklahoma City | | OK | | | (f) | | | 161 | | | 554 | | | - | | | - | | | 161 | | | 554 | | | 715 | | | (131) | | 1978 | | 07/12/2013 |
Restaurants – Limited Service | | Oklahoma City | | OK | | | (f) | | | 400 | | | 473 | | | - | | | - | | | 400 | | | 473 | | | 873 | | | (120) | | 1998 | | 07/12/2013 |
Child Day Care Services | | Conover | | NC | | | (f) | | | 250 | | | 644 | | | - | | | - | | | 250 | | | 644 | | | 894 | | | (143) | | 1985 | | 07/26/2013 |
Child Day Care Services | | Conover | | NC | | | (f) | | | 257 | | | 780 | | | - | | | - | | | 257 | | | 780 | | | 1,037 | | | (179) | | 1986 | | 07/26/2013 |
Child Day Care Services | | Dobson | | NC | | | (f) | | | 73 | | | 413 | | | - | | | - | | | 73 | | | 413 | | | 486 | | | (95) | | 1996 | | 07/26/2013 |
Child Day Care Services | | Millers Creek | | NC | | | (f) | | | 219 | | | 321 | | | - | | | - | | | 219 | | | 321 | | | 540 | | | (108) | | 1997 | | 07/26/2013 |
Child Day Care Services | | Wilson | | NC | | | (f) | | | 601 | | | 568 | | | - | | | - | | | 601 | | | 568 | | | 1,169 | | | (132) | | 1987 | | 07/26/2013 |
Child Day Care Services | | Charlottesville | | VA | | | (f) | | | 708 | | | 328 | | | - | | | - | | | 708 | | | 328 | | | 1,036 | | | (98) | | 1990 | | 07/26/2013 |
Child Day Care Services | | Charlottesville | | VA | | | (f) | | | 935 | | | 123 | | | - | | | - | | | 935 | | | 123 | | | 1,058 | | | (44) | | 1992 | | 07/26/2013 |
Restaurants – Full Service | | Champaign | | IL | | | (f) | | | 777 | | | 1,640 | | | - | | | - | | | 777 | | | 1,640 | | | 2,417 | | | (405) | | 1984 | | 07/31/2013 |
Restaurants – Full Service | | Rockford | | IL | | | (f) | | | 1,012 | | | 1,643 | | | - | | | - | | | 1,012 | | | 1,643 | | | 2,655 | | | (340) | | 1992 | | 07/31/2013 |
Restaurants – Limited Service | | Gulfport | | MS | | | (f) | | | 2,288 | | | 1,674 | | | - | | | - | | | 2,288 | | | 1,674 | | | 3,962 | | | (422) | | 2008 | | 07/31/2013 |
Home Furnishings Stores | | Centerville | | OH | | | (f) | | | 341 | | | 948 | | | - | | | - | | | 341 | | | 948 | | | 1,289 | | | (210) | | 1994 | | 08/08/2013 |
Restaurants – Full Service | | Tempe | | AZ | | | (f) | | | 1,696 | | | 545 | | | - | | | - | | | 1,696 | | | 545 | | | 2,241 | | | (350) | | 1988 | | 08/13/2013 |
Plastics Product Manufacturing | | Milesburg | | PA | | | (f) | | | 2,563 | | | 4,327 | | | - | | | - | | | 2,563 | | | 4,327 | | | 6,890 | | | (1,685) | | 1970 | | 08/23/2013 |
Machinery, Equipment, and Supplies Merchant Wholesalers | | Davie | | FL | | | (f) | | | 2,198 | | | 1,973 | | | 956 | | | 2,688 | | | 3,154 | | | 4,661 | | | 7,815 | | | (502) | | 1996 | | 08/28/2013 |
Machinery, Equipment, and Supplies Merchant Wholesalers | | Fort Myers | | FL | | | (f) | | | 1,384 | | | 4,797 | | | - | | | - | | | 1,384 | | | 4,797 | | | 6,181 | | | (724) | | 2007 | | 08/28/2013 |
| | | | | | | | | | | | | | | | | | | | | | | | | | | | | | | | | | | |
Descriptions (a) | | | | Initial Cost to Company | | Costs Capitalized Subsequent to Acquisition | | Gross amount at December 31, 2018 (b) (c) | | | | | | |
Tenant Industry | | City | | St | | Encumbrances | | Land &
Improvements | | Building &
Improvements | | Land &
Improvements | | Building &
Improvements | | Land &
Improvements | | Building &
Improvements | | Total | | Accumulated
Depreciation (d) (e) | | Year
Constructed | | Date Acquired |
Machinery, Equipment, and Supplies Merchant Wholesalers | | Tampa | | FL | | | (f) | | | 2,063 | | | 4,869 | | | 318 | | | 1,182 | | | 2,381 | | | 6,051 | | | 8,432 | | | (1,121) | | 2000 | | 08/28/2013 |
Furniture Stores | | Huntsville | | AL | | | (f) | | | 1,812 | | | 4,314 | | | - | | | - | | | 1,812 | | | 4,314 | | | 6,126 | | | (746) | | 1987 | | 08/29/2013 |
Furniture Stores | | Tuscaloosa | | AL | | | (f) | | | 1,273 | | | 3,856 | | | - | | | - | | | 1,273 | | | 3,856 | | | 5,129 | | | (560) | | 2007 | | 08/29/2013 |
Restaurants – Full Service | | Tulsa | | OK | | | (f) | | | 3,210 | | | 3,773 | | | 20 | | | 826 | | | 3,230 | | | 4,599 | | | 7,829 | | | (1,331) | | 1991 | | 08/30/2013 |
Outpatient Care Centers | | Charleston | | SC | | | (f) | | | 1,005 | | | 1,802 | | | - | | | - | | | 1,005 | | | 1,802 | | | 2,807 | | | (283) | | 1968 | | 08/30/2013 |
Restaurants – Limited Service | | Athens | | TN | | | (f) | | | 318 | | | - | | | - | | | - | | | 318 | | | - | | | 318 | | | - | | 2005 | | 08/30/2013 |
Restaurants – Limited Service | | Cleveland | | TN | | | (f) | | | 346 | | | - | | | - | | | - | | | 346 | | | - | | | 346 | | | - | | 2001 | | 08/30/2013 |
Restaurants – Limited Service | | Dayton | | TN | | | (f) | | | 271 | | | - | | | - | | | - | | | 271 | | | - | | | 271 | | | - | | 1997 | | 08/30/2013 |
Restaurants – Limited Service | | Kimball | | TN | | | (f) | | | 271 | | | - | | | - | | | - | | | 271 | | | - | | | 271 | | | - | | 1987 | | 08/30/2013 |
Restaurants – Limited Service | | Madisonville | | TN | | | (f) | | | 243 | | | - | | | - | | | - | | | 243 | | | - | | | 243 | | | - | | 2005 | | 08/30/2013 |
Home Furnishings Stores | | Fort Worth | | TX | | | (f) | | | 3,783 | | | 9,559 | | | - | | | - | | | 3,783 | | | 9,559 | | | 13,342 | | | (1,553) | | 1998 | | 08/30/2013 |
Other Motor Vehicle Dealers | | Flint | | MI | | | (f) | | | 919 | | | 6,382 | | | 28 | | | 468 | | | 947 | | | 6,850 | | | 7,797 | | | (1,864) | | 1992 | | 09/16/2013 |
Restaurants – Limited Service | | Moncks Corner | | SC | | | (f) | | | 145 | | | 768 | | | - | | | - | | | 145 | | | 768 | | | 913 | | | (112) | | 1989 | | 09/17/2013 |
Other Motor Vehicle Dealers | | Peoria | | IL | | | (f) | | | 850 | | | 2,768 | | | - | | | 610 | | | 850 | | | 3,378 | | | 4,228 | | | (438) | | 2001 | | 09/18/2013 |
Other Motor Vehicle Dealers | | Jackson | | TN | | | (f) | | | 3,437 | | | 4,634 | | | 11 | | | 685 | | | 3,448 | | | 5,319 | | | 8,767 | | | (835) | | 2007 | | 09/18/2013 |
Health Clubs | | Weslaco | | TX | | | (f) | | | 1,565 | | | 224 | | | 354 | | | 3,020 | | | 1,919 | | | 3,244 | | | 5,163 | | | (480) | | 2014 | | 09/27/2013 |
Consumer Goods Rental | | Bradenton | | FL | | | (f) | | | 365 | | | 524 | | | - | | | - | | | 365 | | | 524 | | | 889 | | | (108) | | 1964 | | 09/30/2013 |
Consumer Goods Rental | | Dade City | | FL | | | (f) | | | 533 | | | 752 | | | - | | | - | | | 533 | | | 752 | | | 1,285 | | | (168) | | 1995 | | 09/30/2013 |
Consumer Goods Rental | | Lake City | | FL | | | (f) | | | 192 | | | 465 | | | - | | | - | | | 192 | | | 465 | | | 657 | | | (94) | | 1973 | | 09/30/2013 |
Consumer Goods Rental | | Plant City | | FL | | | (f) | | | 412 | | | 985 | | | - | | | - | | | 412 | | | 985 | | | 1,397 | | | (209) | | 1979 | | 09/30/2013 |
Consumer Goods Rental | | Tampa | | FL | | | (f) | | | 752 | | | 4,014 | | | - | | | - | | | 752 | | | 4,014 | | | 4,766 | | | (791) | | 1967 | | 09/30/2013 |
Consumer Goods Rental | | Tampa | | FL | | | (f) | | | 139 | | | 457 | | | - | | | - | | | 139 | | | 457 | | | 596 | | | (92) | | 1967 | | 09/30/2013 |
Consumer Goods Rental | | Tampa | | FL | | | (f) | | | 347 | | | 380 | | | - | | | - | | | 347 | | | 380 | | | 727 | | | (95) | | 1999 | | 09/30/2013 |
Consumer Goods Rental | | Adel | | GA | | | (f) | | | 102 | | | 544 | | | - | | | - | | | 102 | | | 544 | | | 646 | | | (109) | | 1978 | | 09/30/2013 |
Consumer Goods Rental | | Moultrie | | GA | | | (f) | | | 142 | | | 1,073 | | | - | | | - | | | 142 | | | 1,073 | | | 1,215 | | | (205) | | 1960 | | 09/30/2013 |
Outpatient Care Centers | | Ballwin | | MO | | | | | | 233 | | | 1,297 | | | - | | | - | | | 233 | | | 1,297 | | | 1,530 | | | (176) | | 2011 | | 09/30/2013 |
Outpatient Care Centers | | Ballwin | | MO | | | | | | 610 | | | 3,390 | | | - | | | - | | | 610 | | | 3,390 | | | 4,000 | | | (460) | | 2004 | | 09/30/2013 |
Fiber, Yarn, and Thread Mills | | Brownsville | | TX | | | (f) | | | 547 | | | 1,826 | | | - | | | - | | | 547 | | | 1,826 | | | 2,373 | | | (408) | | 1997 | | 10/08/2013 |
Consumer Goods Rental | | Auburn | | WA | | | (f) | | | 236 | | | 835 | | | - | | | - | | | 236 | | | 835 | | | 1,071 | | | (141) | | 1953 | | 10/11/2013 |
Consumer Goods Rental | | Centralia | | WA | | | (f) | | | 298 | | | 711 | | | - | | | - | | | 298 | | | 711 | | | 1,009 | | | (162) | | 1975 | | 10/11/2013 |
Consumer Goods Rental | | Moses Lake | | WA | | | (f) | | | 451 | | | 569 | | | - | | | - | | | 451 | | | 569 | | | 1,020 | | | (149) | | 1993 | | 10/11/2013 |
Consumer Goods Rental | | Wenatchee | | WA | | | (f) | | | 535 | | | 259 | | | - | | | - | | | 535 | | | 259 | | | 794 | | | (59) | | 2005 | | 10/11/2013 |
Outpatient Care Centers | | Jacksonville | | FL | | | (f) | | | 1,372 | | | 6,666 | | | 3,579 | | | 18,675 | | | 4,951 | | | 25,341 | | | 30,292 | | | (2,568) | | 1972 | | 10/31/2013 |
Health Clubs | | San Antonio | | TX | | | (f) | | | 3,403 | | | 2,796 | | | - | | | - | | | 3,403 | | | 2,796 | | | 6,199 | | | (478) | | 2013 | | 11/04/2013 |
Machinery, Equipment, and Supplies Merchant Wholesalers | | Williams | | IA | | | (f) | | | 2,134 | | | 4,246 | | | - | | | - | | | 2,134 | | | 4,246 | | | 6,380 | | | (1,128) | | 2013 | | 11/08/2013 |
Metal and Mineral Merchant Wholesalers | | Melrose Park | | IL | | | (f) | | | 1,285 | | | 3,249 | | | - | | | - | | | 1,285 | | | 3,249 | | | 4,534 | | | (664) | | 1966 | | 11/08/2013 |
Metal and Mineral Merchant Wholesalers | | Northlake | | IL | | | (f) | | | 593 | | | 2,234 | | | - | | | - | | | 593 | | | 2,234 | | | 2,827 | | | (432) | | 1964 | | 11/08/2013 |
Metal and Mineral Merchant Wholesalers | | Northlake | | IL | | | (f) | | | 770 | | | 1,055 | | | - | | | - | | | 770 | | | 1,055 | | | 1,825 | | | (265) | | 1958 | | 11/08/2013 |
Metal and Mineral Merchant Wholesalers | | Rockford | | IL | | | (f) | | | 513 | | | 1,211 | | | - | | | - | | | 513 | | | 1,211 | | | 1,724 | | | (245) | | 1977 | | 11/08/2013 |
Metal and Mineral Merchant Wholesalers | | South Bend | | IN | | | (f) | | | 359 | | | 1,464 | | | - | | | - | | | 359 | | | 1,464 | | | 1,823 | | | (327) | | 1983 | | 11/08/2013 |
Metal and Mineral Merchant Wholesalers | | Benton Harbor | | MI | | | (f) | | | 659 | | | 1,475 | | | - | | | - | | | 659 | | | 1,475 | | | 2,134 | | | (368) | | 1957 | | 11/08/2013 |
Metal and Mineral Merchant Wholesalers | | Coldwater | | MI | | | (f) | | | 757 | | | 2,484 | | | - | | | - | | | 757 | | | 2,484 | | | 3,241 | | | (626) | | 1995 | | 11/08/2013 |
Metal and Mineral Merchant Wholesalers | | St. Marys | | PA | | | (f) | | | 447 | | | 2,098 | | | - | | | - | | | 447 | | | 2,098 | | | 2,545 | | | (424) | | 1987 | | 11/08/2013 |
Furniture Stores | | Southaven | | MS | | | (f) | | | 1,969 | | | 4,553 | | | - | | | - | | | 1,969 | | | 4,553 | | | 6,522 | | | (664) | | 2007 | | 11/12/2013 |
| | | | | | | | | | | | | | | | | | | | | | | | | | | | | | | | | | | |
Descriptions (a) | | | | Initial Cost to Company | | Costs Capitalized Subsequent to Acquisition | | Gross amount at December 31, 2018 (b) (c) | | | | | | |
Tenant Industry | | City | | St | | Encumbrances | | Land &
Improvements | | Building &
Improvements | | Land &
Improvements | | Building &
Improvements | | Land &
Improvements | | Building &
Improvements | | Total | | Accumulated
Depreciation (d) (e) | | Year
Constructed | | Date Acquired |
Furniture Stores | | Chattanooga | | TN | | | (f) | | | 2,897 | | | 3,891 | | | - | | | - | | | 2,897 | | | 3,891 | | | 6,788 | | | (732) | | 1996 | | 11/12/2013 |
Furniture Stores | | Jackson | | TN | | | (f) | | | 1,956 | | | 3,757 | | | - | | | - | | | 1,956 | | | 3,757 | | | 5,713 | | | (664) | | 2004 | | 11/12/2013 |
Converted Paper Product Manufacturing | | Green Bay | | WI | | | (f) | | | 871 | | | 6,889 | | | - | | | - | | | 871 | | | 6,889 | | | 7,760 | | | (1,351) | | 1997 | | 11/12/2013 |
Converted Paper Product Manufacturing | | Green Bay | | WI | | | (f) | | | 795 | | | 4,877 | | | - | | | - | | | 795 | | | 4,877 | | | 5,672 | | | (1,409) | | 1968 | | 11/12/2013 |
Sporting Goods, Hobby, and Musical Instrument Stores | | Fargo | | ND | | | (f) | | | 2,024 | | | 2,841 | | | - | | | - | | | 2,024 | | | 2,841 | | | 4,865 | | | (1,248) | | 2004 | | 11/14/2013 |
Sporting Goods, Hobby, and Musical Instrument Stores | | Gadsden | | AL | | | (f) | | | 1,849 | | | 299 | | | 297 | | | 4,003 | | | 2,146 | | | 4,302 | | | 6,448 | | | (594) | | 2014 | | 11/15/2013 |
Other Personal Services | | Charlotte | | NC | | | (f) | | | 681 | | | 2,905 | | | - | | | - | | | 681 | | | 2,905 | | | 3,586 | | | (429) | | 2002 | | 11/22/2013 |
Restaurants – Full Service | | Alcoa | | TN | | | (f) | | | 572 | | | 1,295 | | | - | | | - | | | 572 | | | 1,295 | | | 1,867 | | | (277) | | 1997 | | 11/22/2013 |
Restaurants – Full Service | | Knoxville | | TN | | | (f) | | | 861 | | | 2,073 | | | - | | | - | | | 861 | | | 2,073 | | | 2,934 | | | (464) | | 1995 | | 11/22/2013 |
Health Clubs | | Humble | | TX | | | (f) | | | 1,209 | | | 2,816 | | | - | | | - | | | 1,209 | | | 2,816 | | | 4,025 | | | (456) | | 2012 | | 11/27/2013 |
Movie Theaters | | Spring Hill | | TN | | | (f) | | | 1,976 | | | 180 | | | 1,475 | | | 6,596 | | | 3,451 | | | 6,776 | | | 10,227 | | | (959) | | 2015 | | 12/12/2013 |
Movie Theaters | | Austin | | TX | | | (f) | | | 3,839 | | | 6,201 | | | - | | | - | | | 3,839 | | | 6,201 | | | 10,040 | | | (861) | | 2012 | | 12/12/2013 |
Restaurants – Full Service | | Waco | | TX | | | (f) | | | 888 | | | 123 | | | 692 | | | 2,406 | | | 1,580 | | | 2,529 | | | 4,109 | | | (443) | | 2014 | | 12/12/2013 |
Lumber and Other Construction Materials Merchant Wholesalers | | Conway | | SC | | | (f) | | | 1,727 | | | 3,668 | | | - | | | - | | | 1,727 | | | 3,668 | | | 5,395 | | | (1,017) | | 2002 | | 12/13/2013 |
Other Motor Vehicle Dealers | | Cicero | | NY | | | | | | 1,933 | | | 7,013 | | | - | | | 530 | | | 1,933 | | | 7,543 | | | 9,476 | | | (1,139) | | 2004 | | 12/19/2013 |
Health Clubs | | Denver | | CO | | | (f) | | | 608 | | | 4,393 | | | 12 | | | 453 | | | 620 | | | 4,846 | | | 5,466 | | | (950) | | 1997 | | 12/30/2013 |
Restaurants – Limited Service | | Evansville | | IN | | | (f) | | | 381 | | | 840 | | | - | | | - | | | 381 | | | 840 | | | 1,221 | | | (189) | | 2005 | | 12/30/2013 |
Outpatient Care Centers | | Knoxville | | TN | | | (f) | | | 223 | | | 1,508 | | | - | | | - | | | 223 | | | 1,508 | | | 1,731 | | | (308) | | 1981 | | 12/30/2013 |
Outpatient Care Centers | | Knoxville | | TN | | | (f) | | | 214 | | | 1,444 | | | - | | | - | | | 214 | | | 1,444 | | | 1,658 | | | (295) | | 1973 | | 12/30/2013 |
Outpatient Care Centers | | Knoxville | | TN | | | (f) | | | 72 | | | 485 | | | - | | | - | | | 72 | | | 485 | | | 557 | | | (99) | | 1989 | | 12/30/2013 |
Restaurants – Limited Service | | Hamden | | CT | | | (f) | | | 346 | | | 349 | | | - | | | - | | | 346 | | | 349 | | | 695 | | | (87) | | 1985 | | 12/31/2013 |
Restaurants – Limited Service | | Manchester | | CT | | | (f) | | | 114 | | | 602 | | | - | | | - | | | 114 | | | 602 | | | 716 | | | (118) | | 1953 | | 12/31/2013 |
Restaurants – Limited Service | | New Britain | | CT | | | (f) | | | 394 | | | 1,038 | | | - | | | - | | | 394 | | | 1,038 | | | 1,432 | | | (210) | | 1988 | | 12/31/2013 |
Restaurants – Limited Service | | New Haven | | CT | | | (f) | | | 231 | | | 613 | | | - | | | - | | | 231 | | | 613 | | | 844 | | | (119) | | 1982 | | 12/31/2013 |
Restaurants – Limited Service | | West Hartford | | CT | | | (f) | | | 316 | | | 917 | | | - | | | - | | | 316 | | | 917 | | | 1,233 | | | (181) | | 1998 | | 12/31/2013 |
Other Motor Vehicle Dealers | | Lake Park | | GA | | | (f) | | | 2,108 | | | 2,897 | | | - | | | - | | | 2,108 | | | 2,897 | | | 5,005 | | | (731) | | 2013 | | 12/31/2013 |
Restaurants – Full Service | | Olathe | | KS | | | (f) | | | 787 | | | 2,119 | | | - | | | - | | | 787 | | | 2,119 | | | 2,906 | | | (422) | | 2005 | | 12/31/2013 |
Restaurants – Full Service | | Springfield | | MO | | | (f) | | | 1,684 | | | 5,405 | | | 86 | | | 201 | | | 1,770 | | | 5,606 | | | 7,376 | | | (1,103) | | 1977 | | 12/31/2013 |
| | | | | | | | | | | | | | | | | | | | | | | | | | | | | | | | | | | |
Descriptions (a) | | | | Initial Cost to Company | | Costs Capitalized Subsequent to Acquisition | | Gross amount at December 31, 2018 (b) (c) | | | | | | |
Tenant Industry | | City | | St | | Encumbrances | | Land &
Improvements | | Building &
Improvements | | Land &
Improvements | | Building &
Improvements | | Land &
Improvements | | Building &
Improvements | | Total | | Accumulated
Depreciation (d) (e) | | Year
Constructed | | Date Acquired |
Semiconductor and Other Electronic Component Manufacturing | | State College | | PA | | | 9,365 | | | 4,398 | | | 11,502 | | | - | | | - | | | 4,398 | | | 11,502 | | | 15,900 | | | (3,465) | | 1960 | | 12/31/2013 |
Elementary and Secondary Schools | | Arlington | | TX | | | (f) | | | 744 | | | 5,783 | | | - | | | - | | | 744 | | | 5,783 | | | 6,527 | | | (814) | | 1945 | | 12/31/2013 |
Child Day Care Services | | Houston | | TX | | | (f) | | | 706 | | | 2,798 | | | - | | | - | | | 706 | | | 2,798 | | | 3,504 | | | (402) | | 2003 | | 12/31/2013 |
Movie Theaters | | Keller | | TX | | | (f) | | | 1,532 | | | 1,720 | | | 1,691 | | | 5,759 | | | 3,223 | | | 7,479 | | | 10,702 | | | (1,249) | | 2014 | | 12/31/2013 |
Child Day Care Services | | Alexandria | | KY | | | (f) | | | 317 | | | 852 | | | - | | | - | | | 317 | | | 852 | | | 1,169 | | | (167) | | 1997 | | 01/03/2014 |
Child Day Care Services | | Covington | | KY | | | (f) | | | 240 | | | 989 | | | - | | | - | | | 240 | | | 989 | | | 1,229 | | | (167) | | 1990 | | 01/03/2014 |
Child Day Care Services | | Crescent Springs | | KY | | | (f) | | | 205 | | | 692 | | | - | | | - | | | 205 | | | 692 | | | 897 | | | (147) | | 1990 | | 01/03/2014 |
Child Day Care Services | | Crestview Hills | | KY | | | (f) | | | 566 | | | 1,862 | | | - | | | - | | | 566 | | | 1,862 | | | 2,428 | | | (307) | | 2007 | | 01/03/2014 |
Child Day Care Services | | Erlanger | | KY | | | (f) | | | 295 | | | 1,277 | | | - | | | - | | | 295 | | | 1,277 | | | 1,572 | | | (241) | | 2000 | | 01/03/2014 |
Child Day Care Services | | Florence | | KY | | | (f) | | | 418 | | | 1,426 | | | - | | | - | | | 418 | | | 1,426 | | | 1,844 | | | (273) | | 1992 | | 01/03/2014 |
Child Day Care Services | | Florence | | KY | | | (f) | | | 289 | | | 699 | | | - | | | - | | | 289 | | | 699 | | | 988 | | | (159) | | 1988 | | 01/03/2014 |
Child Day Care Services | | Hebron | | KY | | | (f) | | | 350 | | | 1,555 | | | - | | | - | | | 350 | | | 1,555 | | | 1,905 | | | (295) | | 1997 | | 01/03/2014 |
Child Day Care Services | | Independence | | KY | | | (f) | | | 440 | | | 1,141 | | | - | | | - | | | 440 | | | 1,141 | | | 1,581 | | | (257) | | 2000 | | 01/03/2014 |
Child Day Care Services | | Taylor Mill | | KY | | | (f) | | | 658 | | | 752 | | | - | | | - | | | 658 | | | 752 | | | 1,410 | | | (181) | | 1995 | | 01/03/2014 |
Child Day Care Services | | Walton | | KY | | | (f) | | | 269 | | | 1,253 | | | - | | | - | | | 269 | | | 1,253 | | | 1,522 | | | (225) | | 1998 | | 01/03/2014 |
Warehousing and Storage | | Mason City | | IA | | | (f) | | | 401 | | | 8,703 | | | - | | | - | | | 401 | | | 8,703 | | | 9,104 | | | (1,131) | | 2003 | | 01/10/2014 |
Casinos | | Cripple Creek | | CO | | | | | | 513 | | | 16,128 | | | - | | | - | | | 513 | | | 16,128 | | | 16,641 | | | (2,037) | | 2008 | | 01/17/2014 |
Casinos | | Cripple Creek | | CO | | | | | | 212 | | | 588 | | | - | | | - | | | 212 | | | 588 | | | 800 | | | (160) | | 1993 | | 01/17/2014 |
Casinos | | Cripple Creek | | CO | | | | | | 293 | | | - | | | 534 | | | 972 | | | 827 | | | 972 | | | 1,799 | | | (160) | | 2016 | | 01/17/2014 |
Child Day Care Services | | Jamestown | | NC | | | (f) | | | 477 | | | 730 | | | - | | | - | | | 477 | | | 730 | | | 1,207 | | | (204) | | 1989 | | 01/24/2014 |
Health Clubs | | Louisville | | KY | | | (f) | | | 2,493 | | | 6,029 | | | - | | | - | | | 2,493 | | | 6,029 | | | 8,522 | | | (1,192) | | 1972 | | 01/31/2014 |
Health Clubs | | Lexington | | KY | | | | | | 1,164 | | | 8,000 | | | 51 | | | - | | | 1,215 | | | 8,000 | | | 9,215 | | | (1,097) | | 2004 | | 01/31/2014 |
Health Clubs | | Lexington | | KY | | | 14,388 | | | 1,251 | | | 6,619 | | | - | | | - | | | 1,251 | | | 6,619 | | | 7,870 | | | (904) | | 2005 | | 01/31/2014 |
Health Clubs | | Antioch | | TN | | | | | | 1,400 | | | 5,388 | | | - | | | - | | | 1,400 | | | 5,388 | | | 6,788 | | | (843) | | 2002 | | 01/31/2014 |
Child Day Care Services | | Fayetteville | | AR | | | (f) | | | 465 | | | 1,866 | | | - | | | - | | | 465 | | | 1,866 | | | 2,331 | | | (300) | | 2012 | | 02/14/2014 |
Restaurants – Full Service | | Eagan | | MN | | | (f) | | | 1,405 | | | 2,162 | | | - | | | - | | | 1,405 | | | 2,162 | | | 3,567 | | | (342) | | 1996 | | 02/19/2014 |
Restaurants – Full Service | | Maplewood | | MN | | | (f) | | | 915 | | | 1,848 | | | - | | | - | | | 915 | | | 1,848 | | | 2,763 | | | (295) | | 2000 | | 02/19/2014 |
Restaurants – Full Service | | Naperville | | IL | | | (f) | | | 2,000 | | | 489 | | | 501 | | | 1,564 | | | 2,501 | | | 2,053 | | | 4,554 | | | (379) | | 2014 | | 03/06/2014 |
Colleges, Universities, and Professional Schools | | Columbia | | SC | | | | | | 562 | | | 11,878 | | | - | | | 810 | | | 562 | | | 12,688 | | | 13,250 | | | (2,069) | | 1995 | | 03/10/2014 |
Colleges, Universities, and Professional Schools | | Columbia | | SC | | | | | | 638 | | | 5,017 | | | - | | | - | | | 638 | | | 5,017 | | | 5,655 | | | (826) | | 2010 | | 03/10/2014 |
Colleges, Universities, and Professional Schools | | Columbia | | SC | | | | | | 244 | | | - | | | 766 | | | 3,351 | | | 1,010 | | | 3,351 | | | 4,361 | | | (517) | | 2015 | | 03/10/2014 |
Child Day Care Services | | Cumming | | GA | | | (f) | | | 826 | | | 3,449 | | | - | | | - | | | 826 | | | 3,449 | | | 4,275 | | | (465) | | 2006 | | 03/11/2014 |
Restaurants – Full Service | | Athens | | GA | | | (f) | | | 731 | | | 1,065 | | | - | | | - | | | 731 | | | 1,065 | | | 1,796 | | | (211) | | 2007 | | 03/21/2014 |
Restaurants – Full Service | | Winder | | GA | | | (f) | | | 752 | | | 1,045 | | | - | | | - | | | 752 | | | 1,045 | | | 1,797 | | | (150) | | 2005 | | 03/21/2014 |
Restaurants – Full Service | | Lenoir | | NC | | | (f) | | | 975 | | | 1,065 | | | - | | | - | | | 975 | | | 1,065 | | | 2,040 | | | (156) | | 2008 | | 03/21/2014 |
Restaurants – Full Service | | Anderson | | SC | | | (f) | | | 900 | | | 825 | | | - | | | - | | | 900 | | | 825 | | | 1,725 | | | (178) | | 2006 | | 03/21/2014 |
Restaurants – Full Service | | Camden | | SC | | | (f) | | | 765 | | | 1,275 | | | - | | | - | | | 765 | | | 1,275 | | | 2,040 | | | (210) | | 2006 | | 03/21/2014 |
Restaurants – Full Service | | Cheraw | | SC | | | (f) | | | 626 | | | 947 | | | - | | | - | | | 626 | | | 947 | | | 1,573 | | | (153) | | 2007 | | 03/21/2014 |
Restaurants – Full Service | | Clinton | | SC | | | (f) | | | 697 | | | 1,515 | | | - | | | - | | | 697 | | | 1,515 | | | 2,212 | | | (240) | | 2006 | | 03/21/2014 |
Restaurants – Full Service | | Greenwood | | SC | | | (f) | | | 808 | | | 1,181 | | | - | | | - | | | 808 | | | 1,181 | | | 1,989 | | | (253) | | 1995 | | 03/21/2014 |
| | | | | | | | | | | | | | | | | | | | | | | | | | | | | | | | | | | |
Descriptions (a) | | | | Initial Cost to Company | | Costs Capitalized Subsequent to Acquisition | | Gross amount at December 31, 2018 (b) (c) | | | | | | |
Tenant Industry | | City | | St | | Encumbrances | | Land &
Improvements | | Building &
Improvements | | Land &
Improvements | | Building &
Improvements | | Land &
Improvements | | Building &
Improvements | | Total | | Accumulated
Depreciation (d) (e) | | Year
Constructed | | Date Acquired |
Restaurants – Full Service | | Bristol | | TN | | | (f) | | | 776 | | | 1,020 | | | - | | | - | | | 776 | | | 1,020 | | | 1,796 | | | (214) | | 2005 | | 03/21/2014 |
Restaurants – Full Service | | Kingsport | | TN | | | (f) | | | 814 | | | 1,053 | | | - | | | - | | | 814 | | | 1,053 | | | 1,867 | | | (212) | | 2006 | | 03/21/2014 |
Restaurants – Full Service | | Dublin | | VA | | | (f) | | | 947 | | | 971 | | | - | | | - | | | 947 | | | 971 | | | 1,918 | | | (174) | | 2008 | | 03/21/2014 |
Restaurants – Limited Service | | Jacksonville | | FL | | | (f) | | | 494 | | | - | | | - | | | - | | | 494 | | | - | | | 494 | | | - | | 1997 | | 03/27/2014 |
Restaurants – Limited Service | | Miami | | FL | | | (f) | | | 1,210 | | | - | | | - | | | - | | | 1,210 | | | - | | | 1,210 | | | - | | 1981 | | 03/27/2014 |
Restaurants – Limited Service | | Orlando | | FL | | | (f) | | | 625 | | | - | | | - | | | - | | | 625 | | | - | | | 625 | | | - | | 1997 | | 03/27/2014 |
Restaurants – Limited Service | | Tampa | | FL | | | (f) | | | 474 | | | - | | | - | | | - | | | 474 | | | - | | | 474 | | | - | | 1999 | | 03/27/2014 |
Restaurants – Limited Service | | Warner Robins | | GA | | | (f) | | | 373 | | | - | | | - | | | - | | | 373 | | | - | | | 373 | | | - | | 1996 | | 03/27/2014 |
Machinery, Equipment, and Supplies Merchant Wholesalers | | Irving | | TX | | | (f) | | | 1,375 | | | 4,661 | | | - | | | - | | | 1,375 | | | 4,661 | | | 6,036 | | | (664) | | 1982 | | 03/27/2014 |
Family Entertainment Centers | | Tempe | | AZ | | | (f) | | | 3,288 | | | 6,268 | | | - | | | - | | | 3,288 | | | 6,268 | | | 9,556 | | | (1,056) | | 2013 | | 03/28/2014 |
Restaurants – Limited Service | | Los Fresnos | | TX | | | (f) | | | 250 | | | 772 | | | 14 | | | 86 | | | 264 | | | 858 | | | 1,122 | | | (179) | | 2014 | | 03/28/2014 |
Health Clubs | | Antioch | | CA | | | (f) | | | 836 | | | 2,724 | | | - | | | - | | | 836 | | | 2,724 | | | 3,560 | | | (454) | | 1989 | | 03/31/2014 |
Health Clubs | | Monterey | | CA | | | (f) | | | 868 | | | 2,694 | | | - | | | - | | | 868 | | | 2,694 | | | 3,562 | | | (500) | | 1978 | | 03/31/2014 |
Medical and Diagnostic Laboratories | | Boynton Beach | | FL | | | (f) | | | 301 | | | 4,727 | | | - | | | - | | | 301 | | | 4,727 | | | 5,028 | | | (904) | | 2005 | | 03/31/2014 |
Medical and Diagnostic Laboratories | | Jupiter | | FL | | | (f) | | | 158 | | | 4,457 | | | - | | | - | | | 158 | | | 4,457 | | | 4,615 | | | (637) | | 2011 | | 03/31/2014 |
Medical and Diagnostic Laboratories | | Wellington | | FL | | | (f) | | | 860 | | | 4,652 | | | - | | | - | | | 860 | | | 4,652 | | | 5,512 | | | (756) | | 2009 | | 03/31/2014 |
Child Day Care Services | | Fort Mill | | SC | | | (f) | | | 707 | | | 3,271 | | | - | | | - | | | 707 | | | 3,271 | | | 3,978 | | | (498) | | 2007 | | 03/31/2014 |
Other Miscellaneous Manufacturing | | Bozeman | | MT | | | (f) | | | 2,127 | | | 348 | | | - | | | - | | | 2,127 | | | 348 | | | 2,475 | | | (123) | | 1977 | | 04/09/2014 |
Other Miscellaneous Manufacturing | | Nashville | | TN | | | (f) | | | 4,264 | | | 4,273 | | | - | | | - | | | 4,264 | | | 4,273 | | | 8,537 | | | (1,130) | | 1975 | | 04/09/2014 |
Medical and Diagnostic Laboratories | | Fort Pierce | | FL | | | (f) | | | 806 | | | 2,953 | | | - | | | - | | | 806 | | | 2,953 | | | 3,759 | | | (701) | | 2007 | | 04/10/2014 |
Medical and Diagnostic Laboratories | | Palm Beach Gardens | | FL | | | (f) | | | 43 | | | 1,337 | | | - | | | - | | | 43 | | | 1,337 | | | 1,380 | | | (211) | | 2005 | | 04/10/2014 |
Medical and Diagnostic Laboratories | | Palm Beach Gardens | | FL | | | (f) | | | 32 | | | 1,288 | | | - | | | - | | | 32 | | | 1,288 | | | 1,320 | | | (227) | | 2005 | | 04/10/2014 |
Medical and Diagnostic Laboratories | | Vero Beach | | FL | | | (f) | | | 233 | | | 2,529 | | | - | | | - | | | 233 | | | 2,529 | | | 2,762 | | | (546) | | 2009 | | 04/10/2014 |
Medical and Diagnostic Laboratories | | Wellington | | FL | | | (f) | | | 272 | | | 1,421 | | | - | | | - | | | 272 | | | 1,421 | | | 1,693 | | | (141) | | 2008 | | 04/10/2014 |
Health Clubs | | Phoenix | | AZ | | | (f) | | | - | | | - | | | 1,411 | | | 4,841 | | | 1,411 | | | 4,841 | | | 6,252 | | | (805) | | 2014 | | 04/16/2014 |
Junior Colleges | | Youngstown | | OH | | | (f) | | | 471 | | | 5,075 | | | - | | | 1,126 | | | 471 | | | 6,201 | | | 6,672 | | | (880) | | 1974 | | 04/16/2014 |
Junior Colleges | | Middletown | | OH | | | (f) | | | 404 | | | 5,441 | | | - | | | 371 | | | 404 | | | 5,812 | | | 6,216 | | | (920) | | 1969 | | 04/23/2014 |
Child Day Care Services | | Gastonia | | NC | | | (f) | | | 184 | | | 1,212 | | | - | | | - | | | 184 | | | 1,212 | | | 1,396 | | | (211) | | 2003 | | 04/25/2014 |
Machinery, Equipment, and Supplies Merchant Wholesalers | | Rapid City | | SD | | | (f) | | | 812 | | | 1,211 | | | - | | | 494 | | | 812 | | | 1,705 | | | 2,517 | | | (300) | | 1992 | | 04/30/2014 |
Medical and Diagnostic Laboratories | | Jupiter | | FL | | | (f) | | | 742 | | | 5,525 | | | - | | | - | | | 742 | | | 5,525 | | | 6,267 | | | (795) | | 2007 | | 05/02/2014 |
Home Furnishings Stores | | Columbus | | OH | | | (f) | | | 753 | | | 1,047 | | | - | | | - | | | 753 | | | 1,047 | | | 1,800 | | | (168) | | 2014 | | 05/07/2014 |
Forging and Stamping | | Pharr | | TX | | | (f) | | | 1,343 | | | 1,863 | | | - | | | - | | | 1,343 | | | 1,863 | | | 3,206 | | | (344) | | 1999 | | 05/07/2014 |
Forging and Stamping | | Clearwater | | FL | | | (f) | | | 1,529 | | | 6,239 | | | - | | | - | | | 1,529 | | | 6,239 | | | 7,768 | | | (1,088) | | 1994 | | 05/15/2014 |
Restaurants – Full Service | | Schaumburg | | IL | | | (f) | | | 2,063 | | | - | | | 1,056 | | | 1,623 | | | 3,119 | | | 1,623 | | | 4,742 | | | (425) | | 2015 | | 05/15/2014 |
Child Day Care Services | | Cincinnati | | OH | | | (f) | | | 537 | | | 1,765 | | | - | | | - | | | 537 | | | 1,765 | | | 2,302 | | | (242) | | 2004 | | 05/15/2014 |
Other Motor Vehicle Dealers | | Fort Worth | | TX | | | | | | 2,009 | | | - | | | 1,355 | | | 5,126 | | | 3,364 | | | 5,126 | | | 8,490 | | | (757) | | 2014 | | 05/21/2014 |
Machinery, Equipment, and Supplies Merchant Wholesalers | | Tucson | | AZ | | | (f) | | | 1,107 | | | 932 | | | - | | | - | | | 1,107 | | | 932 | | | 2,039 | | | (240) | | 1980 | | 05/22/2014 |
Consumer Goods Rental | | Florence | | AL | | | | | | 492 | | | 634 | | | - | | | - | | | 492 | | | 634 | | | 1,126 | | | (98) | | 2004 | | 05/23/2014 |
Other Professional, Scientific, and Technical Services | | Scottsdale | | AZ | | | (f) | | | 821 | | | 1,285 | | | - | | | - | | | 821 | | | 1,285 | | | 2,106 | | | (223) | | 2006 | | 05/23/2014 |
Bakeries and Tortilla Manufacturing | | West Monroe | | LA | | | (f) | | | 902 | | | 3,827 | | | - | | | - | | | 902 | | | 3,827 | | | 4,729 | | | (805) | | 2004 | | 05/23/2014 |
Consumer Goods Rental | | Lenoir | | NC | | | | | | 548 | | | 578 | | | - | | | - | | | 548 | | | 578 | | | 1,126 | | | (84) | | 2005 | | 05/23/2014 |
Other Professional, Scientific, and Technical Services | | Waxhaw | | NC | | | (f) | | | 570 | | | 934 | | | - | | | - | | | 570 | | | 934 | | | 1,504 | | | (188) | | 1968 | | 05/23/2014 |
Consumer Goods Rental | | Lynchburg | | VA | | | (f) | | | 259 | | | 865 | | | - | | | - | | | 259 | | | 865 | | | 1,124 | | | (108) | | 1961 | | 05/23/2014 |
Grocery Stores | | Lodi | | CA | | | | | | 1,431 | | | 7,215 | | | - | | | - | | | 1,431 | | | 7,215 | | | 8,646 | | | (968) | | 2004 | | 05/30/2014 |
Machinery, Equipment, and Supplies Merchant Wholesalers | | Commerce City | | CO | | | (f) | | | 1,283 | | | 1,448 | | | 103 | | | 1,035 | | | 1,386 | | | 2,483 | | | 3,869 | | | (495) | | 1980 | | 05/30/2014 |
Movie Theaters | | Flower Mound | | TX | | | (f) | | | 1,860 | | | 442 | | | 927 | | | 7,468 | | | 2,787 | | | 7,910 | | | 10,697 | | | (930) | | 2015 | | 05/30/2014 |
| | | | | | | | | | | | | | | | | | | | | | | | | | | | | | | | | | | |
Descriptions (a) | | | | Initial Cost to Company | | Costs Capitalized Subsequent to Acquisition | | Gross amount at December 31, 2018 (b) (c) | | | | | | |
Tenant Industry | | City | | St | | Encumbrances | | Land &
Improvements | | Building &
Improvements | | Land &
Improvements | | Building &
Improvements | | Land &
Improvements | | Building &
Improvements | | Total | | Accumulated
Depreciation (d) (e) | | Year
Constructed | | Date Acquired |
Other General Purpose Machinery Manufacturing | | Saltillo | | MS | | | | | | 605 | | | 15,409 | | | - | | | - | | | 605 | | | 15,409 | | | 16,014 | | | (2,469) | | 1974 | | 06/05/2014 |
Restaurants – Full Service | | Shawnee | | OK | | | (f) | | | 192 | | | 1,016 | | | - | | | - | | | 192 | | | 1,016 | | | 1,208 | | | (147) | | 1982 | | 06/06/2014 |
Restaurants – Full Service | | San Antonio | | TX | | | (f) | | | 1,578 | | | 1,632 | | | - | | | - | | | 1,578 | | | 1,632 | | | 3,210 | | | (225) | | 2008 | | 06/06/2014 |
Forging and Stamping | | Wickliffe | | OH | | | (f) | | | 617 | | | 2,725 | | | - | | | - | | | 617 | | | 2,725 | | | 3,342 | | | (658) | | 1958 | | 06/12/2014 |
Packaging and Labeling Services | | Mills River | | NC | | | | | | 1,027 | | | 2,862 | | | 1,119 | | | 1,255 | | | 2,146 | | | 4,117 | | | 6,263 | | | (943) | | 2001 | | 06/16/2014 |
Child Day Care Services | | Columbus | | GA | | | (f) | | | 377 | | | 1,007 | | | - | | | - | | | 377 | | | 1,007 | | | 1,384 | | | (148) | | 2014 | | 06/19/2014 |
Medical Equipment and Supplies Manufacturing | | Buford | | GA | | | | | | 2,680 | | | 24,103 | | | - | | | - | | | 2,680 | | | 24,103 | | | 26,783 | | | (2,908) | | 1998 | | 06/20/2014 |
Medical Equipment and Supplies Manufacturing | | Buford | | GA | | | | | | 225 | | | 2,681 | | | - | | | - | | | 225 | | | 2,681 | | | 2,906 | | | (419) | | 1993 | | 06/20/2014 |
Corporate Aircraft Repair and Maintenance Facilities | | East Alton | | IL | | | (f) | | | 1,710 | | | 7,126 | | | - | | | - | | | 1,710 | | | 7,126 | | | 8,836 | | | (1,193) | | 1988 | | 06/20/2014 |
Medical Equipment and Supplies Manufacturing | | North Attleboro | | MA | | | | | | 1,541 | | | 8,900 | | | - | | | - | | | 1,541 | | | 8,900 | | | 10,441 | | | (1,139) | | 1981 | | 06/20/2014 |
Foundation, Structure, and Building Exterior Contractors | | Indian Trail | | NC | | | (f) | | | 526 | | | 311 | | | - | | | - | | | 526 | | | 311 | | | 837 | | | (74) | | 1968 | | 06/20/2014 |
Foundation, Structure, and Building Exterior Contractors | | Amarillo | | TX | | | (f) | | | 269 | | | 457 | | | - | | | - | | | 269 | | | 457 | | | 726 | | | (55) | | 1954 | | 06/20/2014 |
Foundation, Structure, and Building Exterior Contractors | | Humble | | TX | | | (f) | | | 269 | | | 467 | | | - | | | - | | | 269 | | | 467 | | | 736 | | | (84) | | 1982 | | 06/20/2014 |
Foundation, Structure, and Building Exterior Contractors | | Milwaukee | | WI | | | (f) | | | 515 | | | 3,318 | | | - | | | - | | | 515 | | | 3,318 | | | 3,833 | | | (549) | | 1968 | | 06/20/2014 |
Restaurants – Full Service | | Calumet City | | IL | | | (f) | | | 521 | | | 983 | | | - | | | 12 | | | 521 | | | 995 | | | 1,516 | | | (184) | | 1983 | | 06/23/2014 |
Restaurants – Full Service | | Lansing | | IL | | | (f) | | | 406 | | | 877 | | | 74 | | | - | | | 480 | | | 877 | | | 1,357 | | | (242) | | 1973 | | 06/23/2014 |
Outpatient Care Centers | | Ballwin | | MO | | | | | | 696 | | | 1,814 | | | - | | | - | | | 696 | | | 1,814 | | | 2,510 | | | (314) | | 1977 | | 06/23/2014 |
Computer Systems Design and Related Services | | Peachtree Corners | | GA | | | (f) | | | 400 | | | 3,768 | | | - | | | - | | | 400 | | | 3,768 | | | 4,168 | | | (886) | | 1986 | | 06/24/2014 |
Restaurants – Full Service | | Rockford | | IL | | | (f) | | | 239 | | | 409 | | | - | | | - | | | 239 | | | 409 | | | 648 | | | (121) | | 1993 | | 06/24/2014 |
Restaurants – Full Service | | Beloit | | WI | | | (f) | | | 218 | | | 528 | | | - | | | - | | | 218 | | | 528 | | | 746 | | | (147) | | 1983 | | 06/24/2014 |
Restaurants – Full Service | | Mauston | | WI | | | (f) | | | 226 | | | 432 | | | - | | | - | | | 226 | | | 432 | | | 658 | | | (125) | | 2000 | | 06/24/2014 |
Restaurants – Full Service | | Monroe | | WI | | | (f) | | | 344 | | | 711 | | | - | | | - | | | 344 | | | 711 | | | 1,055 | | | (164) | | 1977 | | 06/24/2014 |
Other Personal Services | | Lexington | | KY | | | (f) | | | 943 | | | 1,967 | | | - | | | - | | | 943 | | | 1,967 | | | 2,910 | | | (278) | | 2005 | | 06/25/2014 |
Electrical Equipment Manufacturing | | Chattanooga | | TN | | | (f) | | | 1,419 | | | 5,648 | | | - | | | 413 | | | 1,419 | | | 6,061 | | | 7,480 | | | (949) | | 1960 | | 06/25/2014 |
Child Day Care Services | | Anderson Township | | OH | | | (f) | | | 273 | | | 829 | | | - | | | - | | | 273 | | | 829 | | | 1,102 | | | (164) | | 1995 | | 06/26/2014 |
Child Day Care Services | | Forney | | TX | | | (f) | | | 511 | | | 2,785 | | | - | | | - | | | 511 | | | 2,785 | | | 3,296 | | | (328) | | 2004 | | 06/26/2014 |
Health Clubs | | Oakdale | | CA | | | (f) | | | 1,073 | | | 4,560 | | | - | | | - | | | 1,073 | | | 4,560 | | | 5,633 | | | (786) | | 1973 | | 06/27/2014 |
Other Professional, Scientific, and Technical Services | | Orlando | | FL | | | (f) | | | 461 | | | 385 | | | - | | | - | | | 461 | | | 385 | | | 846 | | | (77) | | 1998 | | 06/27/2014 |
Restaurants – Limited Service | | Saint Martinville | | LA | | | (f) | | | 264 | | | 921 | | | - | | | - | | | 264 | | | 921 | | | 1,185 | | | (232) | | 1987 | | 06/27/2014 |
Health Clubs | | Chanhassen | | MN | | | (f) | | | 511 | | | 2,168 | | | - | | | - | | | 511 | | | 2,168 | | | 2,679 | | | (273) | | 1999 | | 06/27/2014 |
Health Clubs | | Maple Grove | | MN | | | (f) | | | 1,372 | | | 1,386 | | | - | | | - | | | 1,372 | | | 1,386 | | | 2,758 | | | (390) | | 2001 | | 06/27/2014 |
Health Clubs | | Chapel Hill | | NC | | | (f) | | | 1,198 | | | 1,926 | | | - | | | 115 | | | 1,198 | | | 2,041 | | | 3,239 | | | (406) | | 2005 | | 06/30/2014 |
Health Clubs | | Hanahan | | SC | | | (f) | | | 412 | | | 722 | | | 1 | | | 23 | | | 413 | | | 745 | | | 1,158 | | | (137) | | 2008 | | 06/30/2014 |
Health Clubs | | Mount Pleasant | | SC | | | (f) | | | 1,615 | | | 1,943 | | | 7 | | | 212 | | | 1,622 | | | 2,155 | | | 3,777 | | | (298) | | 1985 | | 06/30/2014 |
Health Clubs | | Mount Pleasant | | SC | | | (f) | | | 1,427 | | | 3,281 | | | 12 | | | 127 | | | 1,439 | | | 3,408 | | | 4,847 | | | (421) | | 2004 | | 06/30/2014 |
Health Clubs | | North Charleston | | SC | | | (f) | | | 1,618 | | | 800 | | | 46 | | | 298 | | | 1,664 | | | 1,098 | | | 2,762 | | | (207) | | 1986 | | 06/30/2014 |
Child Day Care Services | | Colorado Springs | | CO | | | (f) | | | 855 | | | 1,851 | | | 2 | | | 23 | | | 857 | | | 1,874 | | | 2,731 | | | (245) | | 2008 | | 07/24/2014 |
Child Day Care Services | | Loveland | | CO | | | (f) | | | 629 | | | 1,005 | | | 6 | | | 14 | | | 635 | | | 1,019 | | | 1,654 | | | (179) | | 2003 | | 07/24/2014 |
Child Day Care Services | | Cartersville | | GA | | | (f) | | | 343 | | | 601 | | | 2 | | | 47 | | | 345 | | | 648 | | | 993 | | | (115) | | 1997 | | 07/24/2014 |
Child Day Care Services | | Kennesaw | | GA | | | (f) | | | 557 | | | 714 | | | - | | | 71 | | | 557 | | | 785 | | | 1,342 | | | (130) | | 1997 | | 07/24/2014 |
Child Day Care Services | | Norcross | | GA | | | (f) | | | 487 | | | 521 | | | 4 | | | 11 | | | 491 | | | 532 | | | 1,023 | | | (93) | | 1988 | | 07/24/2014 |
Child Day Care Services | | Stockbridge | | GA | | | (f) | | | 426 | | | 891 | | | 10 | | | 81 | | | 436 | | | 972 | | | 1,408 | | | (161) | | 1997 | | 07/24/2014 |
Child Day Care Services | | Tucker | | GA | | | (f) | | | 450 | | | 585 | | | - | | | 68 | | | 450 | | | 653 | | | 1,103 | | | (109) | | 1994 | | 07/24/2014 |
Child Day Care Services | | Woodstock | | GA | | | (f) | | | 537 | | | 299 | | | 47 | | | 47 | | | 584 | | | 346 | | | 930 | | | (67) | | 1992 | | 07/24/2014 |
Child Day Care Services | | Charlotte | | NC | | | (f) | | | 625 | | | 783 | | | 7 | | | 86 | | | 632 | | | 869 | | | 1,501 | | | (153) | | 2001 | | 07/24/2014 |
Child Day Care Services | | Greensboro | | NC | | | (f) | | | 325 | | | 193 | | | 10 | | | 94 | | | 335 | | | 287 | | | 622 | | | (50) | | 1983 | | 07/24/2014 |
Child Day Care Services | | Greensboro | | NC | | | (f) | | | 628 | | | 244 | | | 9 | | | 129 | | | 637 | | | 373 | | | 1,010 | | | (59) | | 1968 | | 07/24/2014 |
Child Day Care Services | | Greensboro | | NC | | | (f) | | | 330 | | | 360 | | | 71 | | | 99 | | | 401 | | | 459 | | | 860 | | | (81) | | 1970 | | 07/24/2014 |
| | | | | | | | | | | | | | | | | | | | | | | | | | | | | | | | | | | |
Descriptions (a) | | | | Initial Cost to Company | | Costs Capitalized Subsequent to Acquisition | | Gross amount at December 31, 2018 (b) (c) | | | | | | |
Tenant Industry | | City | | St | | Encumbrances | | Land &
Improvements | | Building &
Improvements | | Land &
Improvements | | Building &
Improvements | | Land &
Improvements | | Building &
Improvements | | Total | | Accumulated
Depreciation (d) (e) | | Year
Constructed | | Date Acquired |
Child Day Care Services | | Greensboro | | NC | | | (f) | | | 500 | | | 300 | | | 1 | | | 87 | | | 501 | | | 387 | | | 888 | | | (65) | | 1978 | | 07/24/2014 |
Child Day Care Services | | Greensboro | | NC | | | (f) | | | 544 | | | 173 | | | - | | | 103 | | | 544 | | | 276 | | | 820 | | | (48) | | 1981 | | 07/24/2014 |
Child Day Care Services | | Winston Salem | | NC | | | (f) | | | 519 | | | 362 | | | 1 | | | 94 | | | 520 | | | 456 | | | 976 | | | (89) | | 1969 | | 07/24/2014 |
Child Day Care Services | | Winston Salem | | NC | | | (f) | | | 364 | | | 517 | | | 1 | | | 188 | | | 365 | | | 705 | | | 1,070 | | | (111) | | 1983 | | 07/24/2014 |
Child Day Care Services | | Aiken | | SC | | | (f) | | | 164 | | | 508 | | | 16 | | | 151 | | | 180 | | | 659 | | | 839 | | | (104) | | 1985 | | 07/24/2014 |
Child Day Care Services | | Aiken | | SC | | | (f) | | | 281 | | | 563 | | | 5 | | | 53 | | | 286 | | | 616 | | | 902 | | | (116) | | 1992 | | 07/24/2014 |
Child Day Care Services | | Duncan | | SC | | | (f) | | | 428 | | | 326 | | | 32 | | | 67 | | | 460 | | | 393 | | | 853 | | | (107) | | 1997 | | 07/24/2014 |
Child Day Care Services | | Florence | | SC | | | (f) | | | 147 | | | 489 | | | - | | | 39 | | | 147 | | | 528 | | | 675 | | | (88) | | 1983 | | 07/24/2014 |
Child Day Care Services | | Greenwood | | SC | | | (f) | | | 317 | | | 183 | | | 1 | | | 105 | | | 318 | | | 288 | | | 606 | | | (49) | | 1978 | | 07/24/2014 |
Child Day Care Services | | Greenwood | | SC | | | (f) | | | 367 | | | 396 | | | 5 | | | 26 | | | 372 | | | 422 | | | 794 | | | (85) | | 1984 | | 07/24/2014 |
Child Day Care Services | | Greer | | SC | | | (f) | | | 125 | | | 633 | | | 16 | | | 36 | | | 141 | | | 669 | | | 810 | | | (133) | | 2002 | | 07/24/2014 |
Child Day Care Services | | Mauldin | | SC | | | (f) | | | 296 | | | 231 | | | 22 | | | 110 | | | 318 | | | 341 | | | 659 | | | (59) | | 1981 | | 07/24/2014 |
Child Day Care Services | | North Augusta | | SC | | | (f) | | | 257 | | | 561 | | | 29 | | | 59 | | | 286 | | | 620 | | | 906 | | | (112) | | 1983 | | 07/24/2014 |
Child Day Care Services | | North Charleston | | SC | | | (f) | | | 272 | | | 300 | | | 7 | | | 71 | | | 279 | | | 371 | | | 650 | | | (67) | | 1987 | | 07/24/2014 |
Child Day Care Services | | Spartanburg | | SC | | | (f) | | | 334 | | | 293 | | | - | | | 2 | | | 334 | | | 295 | | | 629 | | | (64) | | 1987 | | 07/24/2014 |
Child Day Care Services | | Spartanburg | | SC | | | (f) | | | 185 | | | 560 | | | - | | | 137 | | | 185 | | | 697 | | | 882 | | | (103) | | 1973 | | 07/24/2014 |
Child Day Care Services | | Summerville | | SC | | | (f) | | | 678 | | | 185 | | | 7 | | | 134 | | | 685 | | | 319 | | | 1,004 | | | (56) | | 1984 | | 07/24/2014 |
Child Day Care Services | | Frisco | | TX | | | (f) | | | 509 | | | 1,253 | | | 24 | | | 30 | | | 533 | | | 1,283 | | | 1,816 | | | (161) | | 1996 | | 07/24/2014 |
Child Day Care Services | | Little Elm | | TX | | | (f) | | | 454 | | | 1,018 | | | 18 | | | 144 | | | 472 | | | 1,162 | | | 1,634 | | | (178) | | 1989 | | 07/24/2014 |
Other Motor Vehicle Dealers | | Rothschild | | WI | | | (f) | | | 2,440 | | | 10,171 | | | 2,164 | | | 788 | | | 4,604 | | | 10,959 | | | 15,563 | | | (1,385) | | 2003 | | 07/29/2014 |
Drugs and Druggists' Sundries Merchant Wholesalers | | Knoxville | | TN | | | (f) | | | 1,421 | | | 7,109 | | | - | | | - | | | 1,421 | | | 7,109 | | | 8,530 | | | (1,115) | | 1983 | | 07/30/2014 |
Electronics and Appliance Stores | | Phoenix | | AZ | | | (f) | | | 3,480 | | | 3,209 | | | - | | | - | | | 3,480 | | | 3,209 | | | 6,689 | | | (459) | | 1988 | | 07/31/2014 |
Electronics and Appliance Stores | | Colorado Springs | | CO | | | (f) | | | 2,223 | | | 4,197 | | | - | | | - | | | 2,223 | | | 4,197 | | | 6,420 | | | (601) | | 1995 | | 07/31/2014 |
Movie Theaters | | Berlin | | CT | | | (f) | | | 2,937 | | | 6,719 | | | - | | | - | | | 2,937 | | | 6,719 | | | 9,656 | | | (1,368) | | 1990 | | 07/31/2014 |
Lessors of Real Estate | | Sugar Hill | | GA | | | (f) | | | 1,658 | | | 4,507 | | | - | | | - | | | 1,658 | | | 4,507 | | | 6,165 | | | (838) | | 2013 | | 07/31/2014 |
Movie Theaters | | Ridgefield Park | | NJ | | | (f) | | | 44 | | | 10,848 | | | - | | | - | | | 44 | | | 10,848 | | | 10,892 | | | (1,610) | | 1991 | | 07/31/2014 |
Movie Theaters | | Boerne | | TX | | | (f) | | | 4,186 | | | 3,413 | | | - | | | - | | | 4,186 | | | 3,413 | | | 7,599 | | | (836) | | 2013 | | 07/31/2014 |
Lessors of Real Estate | | Corinth | | TX | | | (f) | | | 2,517 | | | 4,173 | | | - | | | - | | | 2,517 | | | 4,173 | | | 6,690 | | | (760) | | 2009 | | 07/31/2014 |
Lessors of Real Estate | | Houston | | TX | | | (f) | | | 2,650 | | | 3,644 | | | - | | | - | | | 2,650 | | | 3,644 | | | 6,294 | | | (697) | | 2005 | | 07/31/2014 |
Electronics and Appliance Stores | | Lubbock | | TX | | | (f) | | | 2,220 | | | 4,148 | | | - | | | - | | | 2,220 | | | 4,148 | | | 6,368 | | | (595) | | 2014 | | 07/31/2014 |
Child Day Care Services | | Monroe | | NC | | | (f) | | | 753 | | | 1,560 | | | - | | | - | | | 753 | | | 1,560 | | | 2,313 | | | (251) | | 2000 | | 08/08/2014 |
Child Day Care Services | | McDonough | | GA | | | (f) | | | 310 | | | 812 | | | - | | | - | | | 310 | | | 812 | | | 1,122 | | | (129) | | 1999 | | 08/11/2014 |
Other Professional, Scientific, and Technical Services | | Tucson | | AZ | | | (f) | | | 1,200 | | | 5,810 | | | - | | | - | | | 1,200 | | | 5,810 | | | 7,010 | | | (727) | | 2004 | | 08/21/2014 |
Other Professional, Scientific, and Technical Services | | Baltimore | | MD | | | (f) | | | 1,235 | | | 1,347 | | | - | | | - | | | 1,235 | | | 1,347 | | | 2,582 | | | (303) | | 1950 | | 08/28/2014 |
Furniture Stores | | Memphis | | TN | | | (f) | | | 1,367 | | | 3,771 | | | - | | | - | | | 1,367 | | | 3,771 | | | 5,138 | | | (462) | | 2005 | | 09/02/2014 |
Child Day Care Services | | Huntersville | | NC | | | (f) | | | 1,118 | | | 1,719 | | | - | | | - | | | 1,118 | | | 1,719 | | | 2,837 | | | (213) | | 2006 | | 09/05/2014 |
Consumer Goods Rental | | Immokalee | | FL | | | (f) | | | 548 | | | 686 | | | - | | | - | | | 548 | | | 686 | | | 1,234 | | | (87) | | 1999 | | 09/09/2014 |
Consumer Goods Rental | | Lewiston | | ID | | | (f) | | | 390 | | | 996 | | | - | | | - | | | 390 | | | 996 | | | 1,386 | | | (183) | | 2008 | | 09/10/2014 |
Consumer Goods Rental | | Hardin | | MT | | | (f) | | | 45 | | | 513 | | | - | | | - | | | 45 | | | 513 | | | 558 | | | (111) | | 1920 | | 09/10/2014 |
Consumer Goods Rental | | Moses Lake | | WA | | | (f) | | | 459 | | | 1,034 | | | - | | | - | | | 459 | | | 1,034 | | | 1,493 | | | (194) | | 2009 | | 09/10/2014 |
Consumer Goods Rental | | Casper | | WY | | | (f) | | | 506 | | | 846 | | | - | | | - | | | 506 | | | 846 | | | 1,352 | | | (160) | | 2009 | | 09/10/2014 |
Consumer Goods Rental | | Puyallup | | WA | | | (f) | | | 743 | | | 392 | | | - | | | - | | | 743 | | | 392 | | | 1,135 | | | (111) | | 1982 | | 09/16/2014 |
Other Professional, Scientific, and Technical Services | | Albany | | GA | | | (f) | | | 176 | | | 438 | | | - | | | - | | | 176 | | | 438 | | | 614 | | | (79) | | 1974 | | 09/17/2014 |
Health Clubs | | Southaven | | MS | | | (f) | | | 2,264 | | | 3,039 | | | - | | | - | | | 2,264 | | | 3,039 | | | 5,303 | | | (598) | | 1999 | | 09/18/2014 |
Movie Theaters | | Parker | | CO | | | | | | 1,773 | | | 4,252 | | | - | | | - | | | 1,773 | | | 4,252 | | | 6,025 | | | (704) | | 2002 | | 09/23/2014 |
Restaurants – Full Service | | Morristown | | TN | | | (f) | | | 552 | | | 958 | | | - | | | - | | | 552 | | | 958 | | | 1,510 | | | (178) | | 1987 | | 09/23/2014 |
| | | | | | | | | | | | | | | | | | | | | | | | | | | | | | | | | | | |
Descriptions (a) | | | | Initial Cost to Company | | Costs Capitalized Subsequent to Acquisition | | Gross amount at December 31, 2018 (b) (c) | | | | | | |
Tenant Industry | | City | | St | | Encumbrances | | Land &
Improvements | | Building &
Improvements | | Land &
Improvements | | Building &
Improvements | | Land &
Improvements | | Building &
Improvements | | Total | | Accumulated
Depreciation (d) (e) | | Year
Constructed | | Date Acquired |
Other Ambulatory Health Care Services | | Birmingham | | AL | | | | | | 316 | | | 1,628 | | | - | | | - | | | 316 | | | 1,628 | | | 1,944 | | | (192) | | 2008 | | 09/24/2014 |
Other Ambulatory Health Care Services | | Glendale | | AZ | | | | | | 357 | | | 3,099 | | | - | | | - | | | 357 | | | 3,099 | | | 3,456 | | | (357) | | 1982 | | 09/24/2014 |
Other Ambulatory Health Care Services | | Glendale | | AZ | | | | | | 283 | | | 1,510 | | | - | | | - | | | 283 | | | 1,510 | | | 1,793 | | | (237) | | 1985 | | 09/24/2014 |
Other Ambulatory Health Care Services | | Council Bluffs | | IA | | | | | | 946 | | | 2,010 | | | - | | | - | | | 946 | | | 2,010 | | | 2,956 | | | (286) | | 2009 | | 09/24/2014 |
Other Ambulatory Health Care Services | | Rexburg | | ID | | | | | | 139 | | | 1,204 | | | - | | | - | | | 139 | | | 1,204 | | | 1,343 | | | (173) | | 1976 | | 09/24/2014 |
Other Motor Vehicle Dealers | | Forest Lake | | MN | | | (f) | | | 5,403 | | | 7,570 | | | - | | | 671 | | | 5,403 | | | 8,241 | | | 13,644 | | | (1,184) | | 2003 | | 09/24/2014 |
Other Ambulatory Health Care Services | | Cleveland | | OH | | | | | | 274 | | | 1,990 | | | - | | | - | | | 274 | | | 1,990 | | | 2,264 | | | (258) | | 2009 | | 09/24/2014 |
Other Ambulatory Health Care Services | | Fort Worth | | TX | | | | | | 1,584 | | | 2,053 | | | - | | | - | | | 1,584 | | | 2,053 | | | 3,637 | | | (258) | | 2009 | | 09/24/2014 |
Other Ambulatory Health Care Services | | Salt Lake City | | UT | | | | | | 543 | | | 649 | | | - | | | - | | | 543 | | | 649 | | | 1,192 | | | (104) | | 1972 | | 09/24/2014 |
Restaurants – Full Service | | Bangor | | ME | | | (f) | | | 506 | | | 547 | | | - | | | - | | | 506 | | | 547 | | | 1,053 | | | (101) | | 2006 | | 09/29/2014 |
Restaurants – Full Service | | Ellsworth | | ME | | | (f) | | | 249 | | | 552 | | | - | | | - | | | 249 | | | 552 | | | 801 | | | (133) | | 1979 | | 09/29/2014 |
Restaurants – Full Service | | Farmington | | ME | | | (f) | | | 365 | | | 648 | | | - | | | - | | | 365 | | | 648 | | | 1,013 | | | (124) | | 1993 | | 09/29/2014 |
Restaurants – Full Service | | Presque Isle | | ME | | | (f) | | | 172 | | | 416 | | | - | | | - | | | 172 | | | 416 | | | 588 | | | (111) | | 1980 | | 09/29/2014 |
Restaurants – Full Service | | Concord | | NH | | | (f) | | | 563 | | | 359 | | | - | | | - | | | 563 | | | 359 | | | 922 | | | (98) | | 1973 | | 09/29/2014 |
Restaurants – Full Service | | Dover | | NH | | | (f) | | | 832 | | | 678 | | | - | | | - | | | 832 | | | 678 | | | 1,510 | | | (167) | | 1979 | | 09/29/2014 |
Restaurants – Full Service | | Littleton | | NH | | | (f) | | | 418 | | | 362 | | | - | | | - | | | 418 | | | 362 | | | 780 | | | (95) | | 1981 | | 09/29/2014 |
Restaurants – Full Service | | Nashua | | NH | | | (f) | | | 508 | | | 668 | | | - | | | - | | | 508 | | | 668 | | | 1,176 | | | (118) | | 2006 | | 09/29/2014 |
Restaurants – Full Service | | Galloway | | NJ | | | (f) | | | 819 | | | 498 | | | - | | | - | | | 819 | | | 498 | | | 1,317 | | | (126) | | 1991 | | 09/29/2014 |
Restaurants – Full Service | | Bennington | | VT | | | (f) | | | 480 | | | 482 | | | - | | | - | | | 480 | | �� | 482 | | | 962 | | | (124) | | 1998 | | 09/29/2014 |
Restaurants – Full Service | | Rutland | | VT | | | (f) | | | 475 | | | 346 | | | - | | | - | | | 475 | | | 346 | | | 821 | | | (88) | | 1983 | | 09/29/2014 |
Restaurants – Full Service | | Eden Prairie | | MN | | | (f) | | | 1,252 | | | 2,873 | | | - | | | - | | | 1,252 | | | 2,873 | | | 4,125 | | | (349) | | 1994 | | 09/30/2014 |
Machinery, Equipment, and Supplies Merchant Wholesalers | | Watertown | | SD | | | (f) | | | 2,425 | | | 7,933 | | | - | | | - | | | 2,425 | | | 7,933 | | | 10,358 | | | (1,386) | | 2014 | | 09/30/2014 |
Building Material and Supplies Dealers | | Columbus | | OH | | | (f) | | | 1,475 | | | 3,704 | | | - | | | - | | | 1,475 | | | 3,704 | | | 5,179 | | | (1,007) | | 1994 | | 10/03/2014 |
Junior Colleges | | Warren | | OH | | | (f) | | | 194 | | | 340 | | | - | | | 943 | | | 194 | | | 1,283 | | | 1,477 | | | (169) | | 1968 | | 10/03/2014 |
Health Clubs | | Carmichael | | CA | | | (f) | | | 1,301 | | | 3,840 | | | 168 | | | 499 | | | 1,469 | | | 4,339 | | | 5,808 | | | (640) | | 1977 | | 10/31/2014 |
Restaurants – Full Service | | Indianapolis | | IN | | | | | | 468 | | | 1,570 | | | - | | | - | | | 468 | | | 1,570 | | | 2,038 | | | (245) | | 1985 | | 10/31/2014 |
Used Merchandise Stores | | Shawnee | | OK | | | | | | 624 | | | 1,294 | | | - | | | - | | | 624 | | | 1,294 | | | 1,918 | | | (197) | | 2011 | | 11/12/2014 |
Movie Theaters | | La Vista | | NE | | | | | | 807 | | | 251 | | | 504 | | | 7,175 | | | 1,311 | | | 7,426 | | | 8,737 | | | (694) | | 2015 | | 11/14/2014 |
Child Day Care Services | | Collierville | | TN | | | (f) | | | 544 | | | 1,986 | | | - | | | - | | | 544 | | | 1,986 | | | 2,530 | | | (302) | | 1999 | | 11/14/2014 |
Child Day Care Services | | Collierville | | TN | | | (f) | | | 579 | | | 1,316 | | | - | | | - | | | 579 | | | 1,316 | | | 1,895 | | | (172) | | 2009 | | 11/14/2014 |
Furniture Stores | | Wichita Falls | | TX | | | | | | 1,198 | | | 5,038 | | | - | | | 240 | | | 1,198 | | | 5,278 | | | 6,476 | | | (627) | | 2006 | | 11/19/2014 |
Child Day Care Services | | Stockbridge | | GA | | | (f) | | | 206 | | | 315 | | | 80 | | | 269 | | | 286 | | | 584 | | | 870 | | | (90) | | 2006 | | 11/21/2014 |
Restaurants – Full Service | | Chicago | | IL | | | (f) | | | 1,130 | | | 3,699 | | | - | | | - | | | 1,130 | | | 3,699 | | | 4,829 | | | (385) | | 1908 | | 11/26/2014 |
Restaurants – Full Service | | Chicago | | IL | | | (f) | | | 1,697 | | | 3,360 | | | - | | | - | | | 1,697 | | | 3,360 | | | 5,057 | | | (361) | | 1892 | | 11/26/2014 |
Wholesale Automobile Auction | | Mechanicsburg | | PA | | | (f) | | | 9,019 | | | 1,771 | | | - | | | - | | | 9,019 | | | 1,771 | | | 10,790 | | | (907) | | 1980 | | 12/05/2014 |
Restaurants – Limited Service | | Bessemer | | AL | | | | | | 517 | | | 830 | | | - | | | - | | | 517 | | | 830 | | | 1,347 | | | (139) | | 1994 | | 12/10/2014 |
Restaurants – Limited Service | | Birmingham | | AL | | | | | | 701 | | | 706 | | | - | | | - | | | 701 | | | 706 | | | 1,407 | | | (126) | | 1991 | | 12/10/2014 |
Restaurants – Limited Service | | Birmingham | | AL | | | | | | 726 | | | 752 | | | - | | | - | | | 726 | | | 752 | | | 1,478 | | | (133) | | 2002 | | 12/10/2014 |
Restaurants – Limited Service | | Birmingham | | AL | | | | | | 566 | | | 841 | | | - | | | - | | | 566 | | | 841 | | | 1,407 | | | (143) | | 1995 | | 12/10/2014 |
Restaurants – Limited Service | | Decatur | | AL | | | | | | 235 | | | 1,012 | | | - | | | - | | | 235 | | | 1,012 | | | 1,247 | | | (161) | | 1996 | | 12/10/2014 |
Restaurants – Limited Service | | Fairfield | | AL | | | | | | 583 | | | 765 | | | - | | | - | | | 583 | | | 765 | | | 1,348 | | | (129) | | 1995 | | 12/10/2014 |
Restaurants – Limited Service | | Forestdale | | AL | | | | | | 559 | | | 769 | | | - | | | - | | | 559 | | | 769 | | | 1,328 | | | (129) | | 1991 | | 12/10/2014 |
Restaurants – Limited Service | | Gardendale | | AL | | | | | | 915 | | | 492 | | | - | | | - | | | 915 | | | 492 | | | 1,407 | | | (95) | | 1988 | | 12/10/2014 |
| | | | | | | | | | | | | | | | | | | | | | | | | | | | | | | | | | | |
Descriptions (a) | | | | Initial Cost to Company | | Costs Capitalized Subsequent to Acquisition | | Gross amount at December 31, 2018 (b) (c) | | | | | | |
Tenant Industry | | City | | St | | Encumbrances | | Land &
Improvements | | Building &
Improvements | | Land &
Improvements | | Building &
Improvements | | Land &
Improvements | | Building &
Improvements | | Total | | Accumulated
Depreciation (d) (e) | | Year
Constructed | | Date Acquired |
Restaurants – Limited Service | | Hueytown | | AL | | | | | | 886 | | | 282 | | | - | | | - | | | 886 | | | 282 | | | 1,168 | | | (83) | | 1988 | | 12/10/2014 |
Restaurants – Limited Service | | Huntsville | | AL | | | | | | 368 | | | 910 | | | - | | | - | | | 368 | | | 910 | | | 1,278 | | | (145) | | 1976 | | 12/10/2014 |
Restaurants – Limited Service | | Huntsville | | AL | | | | | | 404 | | | 873 | | | - | | | - | | | 404 | | | 873 | | | 1,277 | | | (147) | | 2004 | | 12/10/2014 |
Restaurants – Limited Service | | Madison | | AL | | | | | | 511 | | | 756 | | | - | | | - | | | 511 | | | 756 | | | 1,267 | | | (136) | | 1986 | | 12/10/2014 |
Restaurants – Limited Service | | Madison | | AL | | | | | | 468 | | | 1,009 | | | - | | | - | | | 468 | | | 1,009 | | | 1,477 | | | (178) | | 1999 | | 12/10/2014 |
Restaurants – Limited Service | | Meridianville | | AL | | | | | | 598 | | | 1,358 | | | - | | | - | | | 598 | | | 1,358 | | | 1,956 | | | (222) | | 2001 | | 12/10/2014 |
Child Day Care Services | | Huntsville | | AL | | | (f) | | | 298 | | | 1,187 | | | - | | | - | | | 298 | | | 1,187 | | | 1,485 | | | (181) | | 1994 | | 12/12/2014 |
Child Day Care Services | | Huntsville | | AL | | | (f) | | | 694 | | | 1,181 | | | - | | | - | | | 694 | | | 1,181 | | | 1,875 | | | (179) | | 2003 | | 12/12/2014 |
Consumer Goods Rental | | Jacksonville | | FL | | | (f) | | | 543 | | | 893 | | | - | | | - | | | 543 | | | 893 | | | 1,436 | | | (163) | | 2014 | | 12/12/2014 |
Consumer Goods Rental | | Jacksonville | | FL | | | (f) | | | 594 | | | 1,276 | | | - | | | - | | | 594 | | | 1,276 | | | 1,870 | | | (202) | | 2014 | | 12/12/2014 |
Restaurants – Limited Service | | Boise | | ID | | | | | | 670 | | | - | | | - | | | - | | | 670 | | | - | | | 670 | | | - | | 2000 | | 12/15/2014 |
Restaurants – Limited Service | | Boise | | ID | | | | | | 610 | | | - | | | - | | | - | | | 610 | | | - | | | 610 | | | - | | 2003 | | 12/15/2014 |
Restaurants – Limited Service | | Emmett | | ID | | | | | | 350 | | | - | | | - | | | - | | | 350 | | | - | | | 350 | | | - | | 2006 | | 12/15/2014 |
Restaurants – Limited Service | | Garden City | | ID | | | | | | 410 | | | - | | | - | | | - | | | 410 | | | - | | | 410 | | | - | | 2005 | | 12/15/2014 |
Restaurants – Limited Service | | Meridian | | ID | | | | | | 490 | | | - | | | - | | | - | | | 490 | | | - | | | 490 | | | - | | 2003 | | 12/15/2014 |
Restaurants – Limited Service | | Nampa | | ID | | | | | | 480 | | | - | | | - | | | - | | | 480 | | | - | | | 480 | | | - | | 2006 | | 12/15/2014 |
Restaurants – Limited Service | | Nampa | | ID | | | | | | 410 | | | - | | | - | | | - | | | 410 | | | - | | | 410 | | | - | | 2006 | | 12/15/2014 |
Restaurants – Full Service | | Chicago | | IL | | | (f) | | | 2,298 | | | 2,425 | | | - | | | - | | | 2,298 | | | 2,425 | | | 4,723 | | | (257) | | 1911 | | 12/15/2014 |
Resin, Synthetic Rubber, and Artificial Synthetic Fibers and Filaments Manufacturing | | Greenfield | | MA | | | | | | 655 | | | 5,499 | | | - | | | - | | | 655 | | | 5,499 | | | 6,154 | | | (758) | | 1999 | | 12/16/2014 |
Resin, Synthetic Rubber, and Artificial Synthetic Fibers and Filaments Manufacturing | | Greenfield | | MA | | | | | | 300 | | | 1,831 | | | - | | | - | | | 300 | | | 1,831 | | | 2,131 | | | (263) | | 1989 | | 12/16/2014 |
Resin, Synthetic Rubber, and Artificial Synthetic Fibers and Filaments Manufacturing | | Greenfield | | MA | | | | | | 195 | | | 1,406 | | | - | | | - | | | 195 | | | 1,406 | | | 1,601 | | | (205) | | 1986 | | 12/16/2014 |
Health and Personal Care Stores | | Syracuse | | NY | | | | | | 357 | | | 1,610 | | | - | | | - | | | 357 | | | 1,610 | | | 1,967 | | | (230) | | 1986 | | 12/16/2014 |
Foundation, Structure, and Building Exterior Contractors | | Chandler | | AZ | | | | | | 1,884 | | | 6,218 | | | - | | | - | | | 1,884 | | | 6,218 | | | 8,102 | | | (629) | | 2010 | | 12/17/2014 |
Restaurants – Full Service | | Woodbury | | MN | | | (f) | | | 2,758 | | | 2,275 | | | - | | | - | | | 2,758 | | | 2,275 | | | 5,033 | | | (284) | | 2008 | | 12/18/2014 |
Restaurants – Full Service | | Portage | | IN | | | | | | 1,406 | | | 2,351 | | | - | | | 38 | | | 1,406 | | | 2,389 | | | 3,795 | | | (302) | | 2007 | | 12/19/2014 |
Movie Theaters | | Nicholasville | | KY | | | | | | 4,505 | | | 3,506 | | | 428 | | | 4,112 | | | 4,933 | | | 7,618 | | | 12,551 | | | (859) | | 2005 | | 12/19/2014 |
Restaurants – Full Service | | Albemarle | | NC | | | (f) | | | 419 | | | 482 | | | - | | | - | | | 419 | | | 482 | | | 901 | | | (104) | | 1998 | | 12/22/2014 |
Restaurants – Full Service | | Lenoir | | NC | | | (f) | | | 537 | | | 454 | | | - | | | - | | | 537 | | | 454 | | | 991 | | | (110) | | 1997 | | 12/22/2014 |
Restaurants – Full Service | | Mt. Airy | | NC | | | (f) | | | 331 | | | 450 | | | - | | | - | | | 331 | | | 450 | | | 781 | | | (103) | | 1996 | | 12/22/2014 |
Restaurants – Full Service | | Sanford | | NC | | | (f) | | | 323 | | | 479 | | | - | | | - | | | 323 | | | 479 | | | 802 | | | (104) | | 1997 | | 12/22/2014 |
Grocery Stores | | Hot Springs Village | | AR | | | | | | 362 | | | 1,299 | | | - | | | 190 | | | 362 | | | 1,489 | | | 1,851 | | | (287) | | 1991 | | 12/23/2014 |
Grocery Stores | | Redfield | | AR | | | | | | 415 | | | 333 | | | - | | | 60 | | | 415 | | | 393 | | | 808 | | | (124) | | 1999 | | 12/23/2014 |
Child Day Care Services | | Bremen | | GA | | | (f) | | | 550 | | | 488 | | | - | | | - | | | 550 | | | 488 | | | 1,038 | | | (91) | | 2005 | | 12/23/2014 |
Child Day Care Services | | McDonough | | GA | | | (f) | | | 1,826 | | | 748 | | | 5 | | | 160 | | | 1,831 | | | 908 | | | 2,739 | | | (145) | | 2006 | | 12/23/2014 |
Child Day Care Services | | Villa Rica | | GA | | | (f) | | | 665 | | | 792 | | | - | | | - | | | 665 | | | 792 | | | 1,457 | | | (120) | | 2004 | | 12/23/2014 |
Child Day Care Services | | Villa Rica | | GA | | | (f) | | | 855 | | | 783 | | | 40 | | | 210 | | | 895 | | | 993 | | | 1,888 | | | (147) | | 1999 | | 12/23/2014 |
| | | | | | | | | | | | | | | | | | | | | | | | | | | | | | | | | | | |
Descriptions (a) | | | | Initial Cost to Company | | Costs Capitalized Subsequent to Acquisition | | Gross amount at December 31, 2018 (b) (c) | | | | | | |
Tenant Industry | | City | | St | | Encumbrances | | Land &
Improvements | | Building &
Improvements | | Land &
Improvements | | Building &
Improvements | | Land &
Improvements | | Building &
Improvements | | Total | | Accumulated
Depreciation (d) (e) | | Year
Constructed | | Date Acquired |
Child Day Care Services | | Elkin | | NC | | | (f) | | | 278 | | | 768 | | | - | | | - | | | 278 | | | 768 | | | 1,046 | | | (154) | | 1995 | | 12/23/2014 |
Child Day Care Services | | Greensboro | | NC | | | (f) | | | 725 | | | 421 | | | - | | | - | | | 725 | | | 421 | | | 1,146 | | | (77) | | 1994 | | 12/23/2014 |
Child Day Care Services | | High Point | | NC | | | (f) | | | 462 | | | 733 | | | - | | | - | | | 462 | | | 733 | | | 1,195 | | | (130) | | 1996 | | 12/23/2014 |
Child Day Care Services | | King | | NC | | | (f) | | | 313 | | | 882 | | | - | | | - | | | 313 | | | 882 | | | 1,195 | | | (138) | | 2008 | | 12/23/2014 |
Child Day Care Services | | Mount Airy | | NC | | | (f) | | | 176 | | | 820 | | | - | | | - | | | 176 | | | 820 | | | 996 | | | (136) | | 1999 | | 12/23/2014 |
Child Day Care Services | | Mount Airy | | NC | | | (f) | | | 260 | | | 737 | | | - | | | - | | | 260 | | | 737 | | | 997 | | | (116) | | 2006 | | 12/23/2014 |
Child Day Care Services | | Mount Airy | | NC | | | (f) | | | 207 | | | 739 | | | - | | | - | | | 207 | | | 739 | | | 946 | | | (120) | | 1995 | | 12/23/2014 |
Other Miscellaneous Manufacturing | | Utica | | NY | | | (f) | | | 102 | | | 988 | | | - | | | - | | | 102 | | | 988 | | | 1,090 | | | (137) | | 1965 | | 12/23/2014 |
Sporting Goods, Hobby, and Musical Instrument Stores | | North Canton | | OH | | | (f) | | | 1,574 | | | 6,043 | | | - | | | - | | | 1,574 | | | 6,043 | | | 7,617 | | | (935) | | 1989 | | 12/23/2014 |
Sporting Goods, Hobby, and Musical Instrument Stores | | Springfield | | OH | | | (f) | | | 1,983 | | | 2,437 | | | - | | | - | | | 1,983 | | | 2,437 | | | 4,420 | | | (404) | | 1984 | | 12/23/2014 |
Other Miscellaneous Manufacturing | | Warrensville Heights | | OH | | | (f) | | | 842 | | | 767 | | | - | | | - | | | 842 | | | 767 | | | 1,609 | | | (120) | | 1982 | | 12/23/2014 |
Sporting Goods, Hobby, and Musical Instrument Stores | | Monroeville | | PA | | | (f) | | | 1,621 | | | 6,552 | | | - | | | - | | | 1,621 | | | 6,552 | | | 8,173 | | | (1,054) | | 1977 | | 12/23/2014 |
Other Miscellaneous Manufacturing | | Cookeville | | TN | | | (f) | | | 797 | | | 3,689 | | | - | | | - | | | 797 | | | 3,689 | | | 4,486 | | | (514) | | 1973 | | 12/23/2014 |
Resin, Synthetic Rubber, and Artificial Synthetic Fibers and Filaments Manufacturing | | Paris | | IL | | | (f) | | | 2,022 | | | 4,907 | | | - | | | - | | | 2,022 | | | 4,907 | | | 6,929 | | | (1,092) | | 1993 | | 12/29/2014 |
Resin, Synthetic Rubber, and Artificial Synthetic Fibers and Filaments Manufacturing | | Hazle Township | | PA | | | (f) | | | 1,400 | | | 6,260 | | | - | | | - | | | 1,400 | | | 6,260 | | | 7,660 | | | (1,332) | | 1998 | | 12/29/2014 |
Resin, Synthetic Rubber, and Artificial Synthetic Fibers and Filaments Manufacturing | | Manchester | | PA | | | (f) | | | 1,489 | | | 5,911 | | | - | | | - | | | 1,489 | | | 5,911 | | | 7,400 | | | (825) | | 1985 | | 12/29/2014 |
Colleges, Universities, and Professional Schools | | Austin | | TX | | | | | | 1,721 | | | 7,175 | | | - | | | - | | | 1,721 | | | 7,175 | | | 8,896 | | | (740) | | 2012 | | 12/29/2014 |
Freight Transportation Arrangement | | Cartersville | | GA | | | | | | 1,119 | | | 6,093 | | | - | | | - | | | 1,119 | | | 6,093 | | | 7,212 | | | (935) | | 2000 | | 12/31/2014 |
Other Professional, Scientific, and Technical Services | | Elmwood Park | | IL | | | (f) | | | 258 | | | 1,027 | | | - | | | - | | | 258 | | | 1,027 | | | 1,285 | | | (210) | | 1960 | | 12/31/2014 |
Freight Transportation Arrangement | | Spartanburg | | SC | | | | | | 1,698 | | | 8,619 | | | - | | | - | | | 1,698 | | | 8,619 | | | 10,317 | | | (1,303) | | 1997 | | 12/31/2014 |
Restaurants – Full Service | | Anderson | | SC | | | (f) | | | 1,161 | | | 1,134 | | | - | | | - | | | 1,161 | | | 1,134 | | | 2,295 | | | (188) | | 1997 | | 01/05/2015 |
Health Clubs | | Eden Prairie | | MN | | | (f) | | | 1,466 | | | 3,073 | | | - | | | - | | | 1,466 | | | 3,073 | | | 4,539 | | | (683) | | 1974 | | 01/09/2015 |
Family Entertainment Centers | | San Diego | | CA | | | | | | 351 | | | 10,144 | | | - | | | - | | | 351 | | | 10,144 | | | 10,495 | | | (1,434) | | 2001 | | 01/15/2015 |
Child Day Care Services | | Cedar Park | | TX | | | | | | 1,482 | | | 3,346 | | | - | | | - | | | 1,482 | | | 3,346 | | | 4,828 | | | (432) | | 2010 | | 01/30/2015 |
Other Wood Product Manufacturing | | Janesville | | WI | | | | | | 814 | | | 3,800 | | | - | | | 265 | | | 814 | | | 4,065 | | | 4,879 | | | (575) | | 1988 | | 01/30/2015 |
Restaurants – Limited Service | | Demopolis | | AL | | | (f) | | | 312 | | | 549 | | | - | | | - | | | 312 | | | 549 | | | 861 | | | (108) | | 1994 | | 02/06/2015 |
Restaurants – Limited Service | | Huntsville | | AL | | | (f) | | | 384 | | | 725 | | | - | | | - | | | 384 | | | 725 | | | 1,109 | | | (128) | | 1992 | | 02/06/2015 |
Restaurants – Limited Service | | Talladaga | | AL | | | (f) | | | 352 | | | 470 | | | - | | | - | | | 352 | | | 470 | | | 822 | | | (98) | | 1982 | | 02/06/2015 |
Restaurants – Limited Service | | Benton | | AR | | | (f) | | | 410 | | | 411 | | | - | | | - | | | 410 | | | 411 | | | 821 | | | (83) | | 1982 | | 02/06/2015 |
Restaurants – Limited Service | | Jacksonville | | AR | | | (f) | | | 316 | | | 347 | | | - | | | - | | | 316 | | | 347 | | | 663 | | | (71) | | 1981 | | 02/06/2015 |
Restaurants – Limited Service | | Little Rock | | AR | | | (f) | | | 389 | | | 512 | | | - | | | - | | | 389 | | | 512 | | | 901 | | | (93) | | 1977 | | 02/06/2015 |
Restaurants – Limited Service | | Searcy | | AR | | | (f) | | | 327 | | | 484 | | | - | | | - | | | 327 | | | 484 | | | 811 | | | (95) | | 1983 | | 02/06/2015 |
Restaurants – Limited Service | | DeLand | | FL | | | (f) | | | 525 | | | 365 | | | - | | | - | | | 525 | | | 365 | | | 890 | | | (121) | | 1986 | | 02/06/2015 |
Restaurants – Limited Service | | Jacksonville | | FL | | | (f) | | | 526 | | | 374 | | | - | | | - | | | 526 | | | 374 | | | 900 | | | (130) | | 1983 | | 02/06/2015 |
Restaurants – Limited Service | | Atlanta | | GA | | | (f) | | | 383 | | | 923 | | | - | | | - | | | 383 | | | 923 | | | 1,306 | | | (132) | | 1982 | | 02/06/2015 |
Restaurants – Limited Service | | Cartersville | | GA | | | (f) | | | 361 | | | 1,064 | | | - | | | - | | | 361 | | | 1,064 | | | 1,425 | | | (169) | | 1986 | | 02/06/2015 |
Restaurants – Limited Service | | College Park | | GA | | | (f) | | | 254 | | | 488 | | | - | | | - | | | 254 | | | 488 | | | 742 | | | (74) | | 1988 | | 02/06/2015 |
Restaurants – Limited Service | | Columbus | | GA | | | (f) | | | 428 | | | 314 | | | - | | | - | | | 428 | | | 314 | | | 742 | | | (51) | | 1985 | | 02/06/2015 |
Restaurants – Limited Service | | Hinesville | | GA | | | (f) | | | 209 | | | 741 | | | - | | | - | | | 209 | | | 741 | | | 950 | | | (133) | | 1990 | | 02/06/2015 |
Restaurants – Limited Service | | Marietta | | GA | | | (f) | | | 234 | | | 567 | | | - | | | - | | | 234 | | | 567 | | | 801 | | | (77) | | 1985 | | 02/06/2015 |
Restaurants – Limited Service | | Tucker | | GA | | | (f) | | | 367 | | | 247 | | | - | | | - | | | 367 | | | 247 | | | 614 | | | (56) | | 1976 | | 02/06/2015 |
Restaurants – Limited Service | | Waycross | | GA | | | (f) | | | 154 | | | 538 | | | - | | | - | | | 154 | | | 538 | | | 692 | | | (100) | | 1991 | | 02/06/2015 |
Restaurants – Limited Service | | Edwardsville | | IL | | | (f) | | | 446 | | | 355 | | | - | | | - | | | 446 | | | 355 | | | 801 | | | (75) | | 1986 | | 02/06/2015 |
Restaurants – Limited Service | | Clarksville | | IN | | | (f) | | | 286 | | | 763 | | | - | | | - | | | 286 | | | 763 | | | 1,049 | | | (123) | | 1977 | | 02/06/2015 |
Restaurants – Limited Service | | Vincennes | | IN | | | (f) | | | 323 | | | 429 | | | - | | | - | | | 323 | | | 429 | | | 752 | | | (110) | | 1978 | | 02/06/2015 |
Restaurants – Limited Service | | Bowling Green | | KY | | | (f) | | | 355 | | | 368 | | | - | | | - | | | 355 | | | 368 | | | 723 | | | (64) | | 1978 | | 02/06/2015 |
Restaurants – Limited Service | | St. Ann | | MO | | | (f) | | | 367 | | | 583 | | | - | | | - | | | 367 | | | 583 | | | 950 | | | (89) | | 1982 | | 02/06/2015 |
Restaurants – Limited Service | | St. Louis | | MO | | | (f) | | | 365 | | | 793 | | | - | | | - | | | 365 | | | 793 | | | 1,158 | | | (117) | | 1983 | | 02/06/2015 |
| | | | | | | | | | | | | | | | | | | | | | | | | | | | | | | | | | | |
Descriptions (a) | | | | Initial Cost to Company | | Costs Capitalized Subsequent to Acquisition | | Gross amount at December 31, 2018 (b) (c) | | | | | | |
Tenant Industry | | City | | St | | Encumbrances | | Land & Improvements | | Building & Improvements | | Land & Improvements | | Building & Improvements | | Land & Improvements | | Building & Improvements | | Total | | Accumulated
Depreciation (d) (e) | | Year
Constructed | | Date Acquired |
Restaurants – Limited Service | | Columbus | | MS | | | (f) | | | 409 | | | 422 | | | - | | | - | | | 409 | | | 422 | | | 831 | | | (89) | | 1982 | | 02/06/2015 |
Restaurants – Limited Service | | Greenville | | NC | | | (f) | | | 280 | | | 403 | | | - | | | - | | | 280 | | | 403 | | | 683 | | | (56) | | 1986 | | 02/06/2015 |
Restaurants – Limited Service | | Columbus | | OH | | | (f) | | | 342 | | | 291 | | | - | | | - | | | 342 | | | 291 | | | 633 | | | (68) | | 1987 | | 02/06/2015 |
Restaurants – Limited Service | | Huber Heights | | OH | | | (f) | | | 358 | | | 295 | | | - | | | - | | | 358 | | | 295 | | | 653 | | | (70) | | 1986 | | 02/06/2015 |
Restaurants – Limited Service | | Cayce | | SC | | | (f) | | | 509 | | | 795 | | | - | | | - | | | 509 | | | 795 | | | 1,304 | | | (186) | | 1980 | | 02/06/2015 |
Restaurants – Limited Service | | North Charleston | | SC | | | (f) | | | 388 | | | 434 | | | - | | | - | | | 388 | | | 434 | | | 822 | | | (112) | | 1985 | | 02/06/2015 |
Restaurants – Limited Service | | Chattanooga | | TN | | | (f) | | | 305 | | | 417 | | | - | | | - | | | 305 | | | 417 | | | 722 | | | (78) | | 1981 | | 02/06/2015 |
Restaurants – Limited Service | | Dickson | | TN | | | (f) | | | 424 | | | 951 | | | - | | | 119 | | | 424 | | | 1,070 | | | 1,494 | | | (182) | | 1981 | | 02/06/2015 |
Restaurants – Limited Service | | Rockwood | | TN | | | (f) | | | 296 | | | 367 | | | - | | | - | | | 296 | | | 367 | | | 663 | | | (65) | | 1992 | | 02/06/2015 |
Restaurants – Limited Service | | Beckley | | WV | | | (f) | | | 303 | | | 588 | | | - | | | - | | | 303 | | | 588 | | | 891 | | | (110) | | 1982 | | 02/06/2015 |
Health Clubs | | Glendale | | AZ | | | (f) | | | 1,298 | | | 168 | | | 1,052 | | | 5,046 | | | 2,350 | | | 5,214 | | | 7,564 | | | (635) | | 2015 | | 02/13/2015 |
Restaurants – Limited Service | | Bristol | | TN | | | (f) | | | 223 | | | 709 | | | - | | | - | | | 223 | | | 709 | | | 932 | | | (106) | | 2001 | | 02/13/2015 |
Restaurants – Limited Service | | Elizabethton | | TN | | | (f) | | | 269 | | | 537 | | | - | | | - | | | 269 | | | 537 | | | 806 | | | (83) | | 2004 | | 02/13/2015 |
Restaurants – Limited Service | | Kingsport | | TN | | | (f) | | | 69 | | | 902 | | | - | | | - | | | 69 | | | 902 | | | 971 | | | (136) | | 2000 | | 02/13/2015 |
Restaurants – Limited Service | | Norton | | VA | | | (f) | | | 167 | | | 542 | | | - | | | - | | | 167 | | | 542 | | | 709 | | | (80) | | 1979 | | 02/13/2015 |
Restaurants – Full Service | | Opelika | | AL | | | | | | 627 | | | - | | | - | | | - | | | 627 | | | - | | | 627 | | | - | | 2008 | | 02/17/2015 |
Restaurants – Limited Service | | Burton | | MI | | | (f) | | | 177 | | | 304 | | | - | | | - | | | 177 | | | 304 | | | 481 | | | (63) | | 2003 | | 02/18/2015 |
Restaurants – Limited Service | | Burton | | MI | | | (f) | | | 563 | | | 995 | | | - | | | - | | | 563 | | | 995 | | | 1,558 | | | (180) | | 1980 | | 02/18/2015 |
Restaurants – Limited Service | | Detroit | | MI | | | (f) | | | 392 | | | 243 | | | - | | | - | | | 392 | | | 243 | | | 635 | | | (50) | | 2011 | | 02/18/2015 |
Restaurants – Limited Service | | Fenton | | MI | | | (f) | | | 403 | | | 453 | | | - | | | - | | | 403 | | | 453 | | | 856 | | | (117) | | 1980 | | 02/18/2015 |
Restaurants – Limited Service | | Ferndale | | MI | | | (f) | | | 428 | | | 447 | | | - | | | - | | | 428 | | | 447 | | | 875 | | | (78) | | 1983 | | 02/18/2015 |
Restaurants – Limited Service | | Flint | | MI | | | (f) | | | 659 | | | 745 | | | - | | | - | | | 659 | | | 745 | | | 1,404 | | | (184) | | 1974 | | 02/18/2015 |
Restaurants – Limited Service | | Flint | | MI | | | (f) | | | 481 | | | 471 | | | - | | | - | | | 481 | | | 471 | | | 952 | | | (127) | | 1976 | | 02/18/2015 |
Restaurants – Limited Service | | Flint | | MI | | | (f) | | | 140 | | | 225 | | | - | | | - | | | 140 | | | 225 | | | 365 | | | (49) | | 2011 | | 02/18/2015 |
Restaurants – Limited Service | | Flint | | MI | | | (f) | | | 164 | | | 259 | | | - | | | - | | | 164 | | | 259 | | | 423 | | | (66) | | 1987 | | 02/18/2015 |
Restaurants – Limited Service | | Flint | | MI | | | (f) | | | 190 | | | 406 | | | - | | | - | | | 190 | | | 406 | | | 596 | | | (90) | | 1929 | | 02/18/2015 |
Restaurants – Limited Service | | Grand Blanc | | MI | | | (f) | | | 260 | | | 384 | | | - | | | - | | | 260 | | | 384 | | | 644 | | | (74) | | 2011 | | 02/18/2015 |
Restaurants – Limited Service | | Ortonville | | MI | | | (f) | | | 231 | | | 384 | | | - | | | - | | | 231 | | | 384 | | | 615 | | | (77) | | 2011 | | 02/18/2015 |
Health Clubs | | South Lake Tahoe | | CA | | | (f) | | | 683 | | | 1,696 | | | 498 | | | - | | | 1,181 | | | 1,696 | | | 2,877 | | | (299) | | 1981 | | 02/19/2015 |
Resin, Synthetic Rubber, and Artificial Synthetic Fibers and Filaments Manufacturing | | Greenfield | | MA | | | | | | 302 | | | 1,121 | | | - | | | - | | | 302 | | | 1,121 | | | 1,423 | | | (233) | | 1989 | | 02/19/2015 |
Colleges, Universities, and Professional Schools | | Blairsville | | PA | | | | | | 1,245 | | | 7,284 | | | - | | | - | | | 1,245 | | | 7,284 | | | 8,529 | | | (1,272) | | 2003 | | 02/25/2015 |
Outpatient Care Centers | | Allen | | TX | | | | | | 742 | | | 4,837 | | | - | | | - | | | 742 | | | 4,837 | | | 5,579 | | | (427) | | 2013 | | 02/25/2015 |
Outpatient Care Centers | | Frisco | | TX | | | | | | 598 | | | 3,938 | | | - | | | - | | | 598 | | | 3,938 | | | 4,536 | | | (352) | | 2008 | | 02/25/2015 |
Foundries | | Maple Lake | | MN | | | (f) | | | 352 | | | 1,210 | | | 1,251 | | | 6,536 | | | 1,603 | | | 7,746 | | | 9,349 | | | (1,021) | | 1987 | | 03/05/2015 |
Health Clubs | | Bloomingdale | | IL | | | | | | 605 | | | 1,550 | | | 273 | | | 152 | | | 878 | | | 1,702 | | | 2,580 | | | (238) | | 1986 | | 03/06/2015 |
Other Ambulatory Health Care Services | | Cedar City | | UT | | | | | | 392 | | | - | | | 403 | | | 3,869 | | | 795 | | | 3,869 | | | 4,664 | | | (390) | | 2016 | | 03/06/2015 |
Movie Theaters | | Tulare | | CA | | | | | | 573 | | | 10,253 | | | - | | | 1,218 | | | 573 | | | 11,471 | | | 12,044 | | | (1,088) | | 2004 | | 03/11/2015 |
Furniture Stores | | Lexington | | KY | | | (f) | | | 2,222 | | | 3,745 | | | - | | | - | | | 2,222 | | | 3,745 | | | 5,967 | | | (547) | | 2008 | | 03/11/2015 |
Furniture Stores | | Cookeville | | TN | | | (f) | | | 1,013 | | | 1,980 | | | - | | | - | | | 1,013 | | | 1,980 | | | 2,993 | | | (278) | | 2004 | | 03/11/2015 |
Restaurants – Limited Service | | Flint | | MI | | | (f) | | | 161 | | | 538 | | | - | | | - | | | 161 | | | 538 | | | 699 | | | (120) | | 1979 | | 03/12/2015 |
Restaurants – Limited Service | | Grand Blanc | | MI | | | (f) | | | 635 | | | 478 | | | - | | | - | | | 635 | | | 478 | | | 1,113 | | | (123) | | 1998 | | 03/12/2015 |
Restaurants – Limited Service | | Mt. Morris | | MI | | | (f) | | | 77 | | | 317 | | | - | | | - | | | 77 | | | 317 | | | 394 | | | (70) | | 1995 | | 03/12/2015 |
Automotive Repair and Maintenance | | Bentonville | | AR | | | (f) | | | 865 | | | 2,240 | | | - | | | - | | | 865 | | | 2,240 | | | 3,105 | | | (381) | | 2009 | | 03/16/2015 |
Automotive Repair and Maintenance | | Fayetteville | | AR | | | (f) | | | 1,056 | | | 1,014 | | | - | | | - | | | 1,056 | | | 1,014 | | | 2,070 | | | (180) | | 2005 | | 03/16/2015 |
Automotive Repair and Maintenance | | Little Rock | | AR | | | (f) | | | 852 | | | 1,007 | | | - | | | - | | | 852 | | | 1,007 | | | 1,859 | | | (186) | | 2011 | | 03/16/2015 |
Automotive Repair and Maintenance | | North Little Rock | | AR | | | (f) | | | 707 | | | 1,222 | | | - | | | - | | | 707 | | | 1,222 | | | 1,929 | | | (216) | | 2009 | | 03/16/2015 |
Automotive Repair and Maintenance | | Rogers | | AR | | | (f) | | | 1,307 | | | 1,988 | | | - | | | - | | | 1,307 | | | 1,988 | | | 3,295 | | | (364) | | 2006 | | 03/16/2015 |
Automotive Repair and Maintenance | | Shreveport | | LA | | | (f) | | | 544 | | | 1,194 | | | - | | | - | | | 544 | | | 1,194 | | | 1,738 | | | (222) | | 2006 | | 03/16/2015 |
Automotive Repair and Maintenance | | Shreveport | | LA | | | (f) | | | 731 | | | 2,865 | | | - | | | - | | | 731 | | | 2,865 | | | 3,596 | | | (466) | | 2006 | | 03/16/2015 |
| | | | | | | | | | | | | | | | | | | | | | | | | | | | | | | | | | | |
Descriptions (a) | | | | Initial Cost to Company | | Costs Capitalized Subsequent to Acquisition | | Gross amount at December 31, 2018 (b) (c) | | | | | | |
Tenant Industry | | City | | St | | Encumbrances | | Land &
Improvements | | Building &
Improvements | | Land &
Improvements | | Building &
Improvements | | Land &
Improvements | | Building &
Improvements | | Total | | Accumulated
Depreciation (d) (e) | | Year
Constructed | | Date Acquired |
Automotive Repair and Maintenance | | Shreveport | | LA | | | (f) | | | 479 | | | 1,340 | | | - | | | - | | | 479 | | | 1,340 | | | 1,819 | | | (229) | | 2011 | | 03/16/2015 |
Automotive Repair and Maintenance | | Lapeer | | MI | | | (f) | | | 76 | | | 174 | | | 8 | | | 44 | | | 84 | | | 218 | | | 302 | | | (31) | | 1986 | | 03/16/2015 |
Automotive Repair and Maintenance | | Royal Oak | | MI | | | (f) | | | 296 | | | 136 | | | 20 | | | 71 | | | 316 | | | 207 | | | 523 | | | (33) | | 1987 | | 03/16/2015 |
Automotive Repair and Maintenance | | Sterling Heights | | MI | | | (f) | | | 275 | | | 114 | | | 21 | | | 61 | | | 296 | | | 175 | | | 471 | | | (36) | | 1960 | | 03/16/2015 |
Automotive Repair and Maintenance | | Olive Branch | | MS | | | (f) | | | 546 | | | 781 | | | - | | | - | | | 546 | | | 781 | | | 1,327 | | | (139) | | 2009 | | 03/16/2015 |
Automotive Repair and Maintenance | | Broken Arrow | | OK | | | (f) | | | 326 | | | 910 | | | - | | | - | | | 326 | | | 910 | | | 1,236 | | | (163) | | 2011 | | 03/16/2015 |
Automotive Repair and Maintenance | | Norman | | OK | | | (f) | | | 937 | | | 1,243 | | | - | | | - | | | 937 | | | 1,243 | | | 2,180 | | | (206) | | 2005 | | 03/16/2015 |
Automotive Repair and Maintenance | | Oklahoma City | | OK | | | (f) | | | 1,187 | | | 1,174 | | | - | | | - | | | 1,187 | | | 1,174 | | | 2,361 | | | (232) | | 2005 | | 03/16/2015 |
Automotive Repair and Maintenance | | Oklahoma City | | OK | | | (f) | | | 757 | | | 1,172 | | | - | | | - | | | 757 | | | 1,172 | | | 1,929 | | | (215) | | 2011 | | 03/16/2015 |
Automotive Repair and Maintenance | | Oklahoma City | | OK | | | (f) | | | 908 | | | 1,041 | | | - | | | - | | | 908 | | | 1,041 | | | 1,949 | | | (201) | | 2007 | | 03/16/2015 |
Automotive Repair and Maintenance | | Tulsa | | OK | | | (f) | | | 1,065 | | | 1,216 | | | - | | | - | | | 1,065 | | | 1,216 | | | 2,281 | | | (217) | | 2011 | | 03/16/2015 |
Automotive Repair and Maintenance | | Tulsa | | OK | | | (f) | | | 1,110 | | | 1,452 | | | - | | | - | | | 1,110 | | | 1,452 | | | 2,562 | | | (286) | | 2006 | | 03/16/2015 |
Automotive Repair and Maintenance | | Cordova | | TN | | | (f) | | | 878 | | | 1,885 | | | - | | | - | | | 878 | | | 1,885 | | | 2,763 | | | (324) | | 2006 | | 03/16/2015 |
Automotive Repair and Maintenance | | Memphis | | TN | | | (f) | | | 437 | | | 1,381 | | | - | | | - | | | 437 | | | 1,381 | | | 1,818 | | | (227) | | 2005 | | 03/16/2015 |
Automotive Repair and Maintenance | | Memphis | | TN | | | (f) | | | 911 | | | 1,269 | | | - | | | - | | | 911 | | | 1,269 | | | 2,180 | | | (216) | | 2006 | | 03/16/2015 |
Junior Colleges | | New Bedford | | MA | | | | | | 178 | | | 8,653 | | | - | | | - | | | 178 | | | 8,653 | | | 8,831 | | | (1,624) | | 1920 | | 03/17/2015 |
Restaurants – Full Service | | Bluffton | | SC | | | (f) | | | 657 | | | 1,871 | | | - | | | - | | | 657 | | | 1,871 | | | 2,528 | | | (201) | | 2006 | | 03/24/2015 |
Restaurants – Full Service | | Greenville | | SC | | | (f) | | | 721 | | | 1,579 | | | - | | | 78 | | | 721 | | | 1,657 | | | 2,378 | | | (203) | | 2001 | | 03/24/2015 |
Restaurants – Full Service | | Hilton Head Island | | SC | | | (f) | | | 1,184 | | | 1,127 | | | - | | | 150 | | | 1,184 | | | 1,277 | | | 2,461 | | | (195) | | 1996 | | 03/24/2015 |
Restaurants – Full Service | | North Charleston | | SC | | | (f) | | | 2,208 | | | 1,760 | | | - | | | 150 | | | 2,208 | | | 1,910 | | | 4,118 | | | (272) | | 2003 | | 03/24/2015 |
Foundries | | Muscle Shoals | | AL | | | (f) | | | 415 | | | 1,091 | | | - | | | - | | | 415 | | | 1,091 | | | 1,506 | | | (258) | | 1968 | | 03/25/2015 |
Foundries | | Grafton | | WI | | | (f) | | | 531 | | | 3,575 | | | - | | | - | | | 531 | | | 3,575 | | | 4,106 | | | (690) | | 1948 | | 03/25/2015 |
Restaurants – Limited Service | | Evansville | | IN | | | | | | 266 | | | 701 | | | - | | | - | | | 266 | | | 701 | | | 967 | | | (109) | | 1981 | | 03/27/2015 |
Restaurants – Limited Service | | Evansville | | IN | | | | | | 278 | | | 464 | | | - | | | - | | | 278 | | | 464 | | | 742 | | | (82) | | 1994 | | 03/27/2015 |
Restaurants – Limited Service | | Mayfield | | KY | | | | | | 437 | | | 412 | | | - | | | - | | | 437 | | | 412 | | | 849 | | | (133) | | 1993 | | 03/27/2015 |
Restaurants – Limited Service | | Paducah | | KY | | | | | | 702 | | | 713 | | | - | | | - | | | 702 | | | 713 | | | 1,415 | | | (185) | | 2006 | | 03/27/2015 |
Restaurants – Limited Service | | Paducah | | KY | | | | | | 578 | | | 379 | | | - | | | - | | | 578 | | | 379 | | | 957 | | | (127) | | 1991 | | 03/27/2015 |
Restaurants – Limited Service | | Paducah | | KY | | | | | | 581 | | | 463 | | | - | | | - | | | 581 | | | 463 | | | 1,044 | | | (123) | | 2000 | | 03/27/2015 |
Restaurants – Limited Service | | Paducah | | KY | | | | | | 392 | | | 399 | | | - | | | - | | | 392 | | | 399 | | | 791 | | | (98) | | 1995 | | 03/27/2015 |
Restaurants – Limited Service | | Cape Girardeau | | MO | | | | | | 332 | | | 536 | | | - | | | - | | | 332 | | | 536 | | | 868 | | | (110) | | 2005 | | 03/27/2015 |
Restaurants – Limited Service | | Cape Girardeau | | MO | | | | | | 260 | | | 560 | | | - | | | - | | | 260 | | | 560 | | | 820 | | | (90) | | 1980 | | 03/27/2015 |
Restaurants – Limited Service | | Doniphan | | MO | | | | | | 445 | | | 502 | | | - | | | - | | | 445 | | | 502 | | | 947 | | | (141) | | 1990 | | 03/27/2015 |
Restaurants – Limited Service | | Jackson | | MO | | | | | | 445 | | | 482 | | | - | | | - | | | 445 | | | 482 | | | 927 | | | (137) | | 1992 | | 03/27/2015 |
Restaurants – Limited Service | | Malden | | MO | | | | | | 446 | | | 511 | | | - | | | - | | | 446 | | | 511 | | | 957 | | | (140) | | 2002 | | 03/27/2015 |
Restaurants – Limited Service | | Springfield | | MO | | | | | | 559 | | | 563 | | | - | | | - | | | 559 | | | 563 | | | 1,122 | | | (145) | | 2000 | | 03/27/2015 |
Restaurants – Limited Service | | Elizabethton | | TN | | | | | | 284 | | | 741 | | | - | | | - | | | 284 | | | 741 | | | 1,025 | | | (114) | | 1978 | | 03/27/2015 |
Restaurants – Limited Service | | Morristown | | TN | | | | | | 509 | | | 584 | | | - | | | - | | | 509 | | | 584 | | | 1,093 | | | (113) | | 1978 | | 03/27/2015 |
Packaging and Labeling Services | | Winona | | MN | | | (f) | | | 303 | | | 1,896 | | | - | | | - | | | 303 | | | 1,896 | | | 2,199 | | | (245) | | 1993 | | 03/31/2015 |
Resin, Synthetic Rubber, and Artificial Synthetic Fibers and Filaments Manufacturing | | Greensboro | | NC | | | (f) | | | 412 | | | 4,898 | | | - | | | - | | | 412 | | | 4,898 | | | 5,310 | | | (655) | | 1980 | | 03/31/2015 |
Packaging and Labeling Services | | Mason | | OH | | | (f) | | | 470 | | | 3,738 | | | - | | | 260 | | | 470 | | | 3,998 | | | 4,468 | | | (503) | | 1993 | | 03/31/2015 |
Packaging and Labeling Services | | Mason | | OH | | | (f) | | | 383 | | | 1,360 | | | - | | | - | | | 383 | | | 1,360 | | | 1,743 | | | (191) | | 1997 | | 03/31/2015 |
Packaging and Labeling Services | | Algoma | | WI | | | (f) | | | 313 | | | 5,462 | | | 46 | | | - | | | 359 | | | 5,462 | | | 5,821 | | | (724) | | 1955 | | 03/31/2015 |
Packaging and Labeling Services | | Algoma | | WI | | | (f) | | | 227 | | | 2,037 | | | - | | | - | | | 227 | | | 2,037 | | | 2,264 | | | (279) | | 2000 | | 03/31/2015 |
Restaurants – Full Service | | Canonsburg | | PA | | | (f) | | | 1,357 | | | 857 | | | 21 | | | 31 | | | 1,378 | | | 888 | | | 2,266 | | | (189) | | 1977 | | 04/06/2015 |
Restaurants – Full Service | | Franklin | | PA | | | (f) | | | 346 | | | 897 | | | 22 | | | 42 | | | 368 | | | 939 | | | 1,307 | | | (204) | | 1984 | | 04/06/2015 |
Restaurants – Full Service | | Gibsonia | | PA | | | (f) | | | 442 | | | 801 | | | 21 | | | 41 | | | 463 | | | 842 | | | 1,305 | | | (125) | | 1994 | | 04/06/2015 |
Restaurants – Full Service | | Grove City | | PA | | | (f) | | | 421 | | | 771 | | | 22 | | | 43 | | | 443 | | | 814 | | | 1,257 | | | (169) | | 1998 | | 04/06/2015 |
Restaurants – Full Service | | Kittanning | | PA | | | (f) | | | 591 | | | 912 | | | 19 | | | 40 | | | 610 | | | 952 | | | 1,562 | | | (199) | | 1993 | | 04/06/2015 |
Restaurants – Full Service | | Leechburg | | PA | | | (f) | | | 810 | | | 1,454 | | | 17 | | | 37 | | | 827 | | | 1,491 | | | 2,318 | | | (229) | | 2004 | | 04/06/2015 |
Restaurants – Full Service | | Meadville | | PA | | | (f) | | | 263 | | | 889 | | | 24 | | | 45 | | | 287 | | | 934 | | | 1,221 | | | (135) | | 1983 | | 04/06/2015 |
| | | | | | | | | | | | | | | | | | | | | | | | | | | | | | | | | | | |
Descriptions (a) | | | | Initial Cost to Company | | Costs Capitalized Subsequent to Acquisition | | Gross amount at December 31, 2018 (b) (c) | | | | | | |
Tenant Industry | | City | | St | | Encumbrances | | Land &
Improvements | | Building &
Improvements | | Land &
Improvements | | Building &
Improvements | | Land &
Improvements | | Building &
Improvements | | Total | | Accumulated
Depreciation (d) (e) | | Year
Constructed | | Date Acquired |
Restaurants – Full Service | | Monaca | | PA | | | (f) | | | 616 | | | 1,077 | | | 43 | | | 60 | | | 659 | | | 1,137 | | | 1,796 | | | (167) | | 1990 | | 04/06/2015 |
Restaurants – Full Service | | Monroeville | | PA | | | (f) | | | 596 | | | 646 | | | 7 | | | 39 | | | 603 | | | 685 | | | 1,288 | | | (105) | | 1972 | | 04/06/2015 |
Restaurants – Full Service | | Pittsburgh | | PA | | | (f) | | | 467 | | | 675 | | | 18 | | | 30 | | | 485 | | | 705 | | | 1,190 | | | (106) | | 1976 | | 04/06/2015 |
Restaurants – Full Service | | Somerset | | PA | | | (f) | | | 603 | | | 840 | | | 14 | | | 78 | | | 617 | | | 918 | | | 1,535 | | | (139) | | 1992 | | 04/06/2015 |
Restaurants – Full Service | | Petoskey | | MI | | | (f) | | | 396 | | | 364 | | | - | | | - | | | 396 | | | 364 | | | 760 | | | (84) | | 2004 | | 04/07/2015 |
Used Merchandise Stores | | Edmond | | OK | | | | | | 499 | | | 2,551 | | | - | | | - | | | 499 | | | 2,551 | | | 3,050 | | | (196) | | 2015 | | 04/09/2015 |
Family Entertainment Centers | | Huntsville | | AL | | | | | | 1,307 | | | 1,361 | | | 76 | | | 1,682 | | | 1,383 | | | 3,043 | | | 4,426 | | | (405) | | 1985 | | 04/16/2015 |
Restaurants – Full Service | | Loganville | | GA | | | (f) | | | 545 | | | 1,073 | | | - | | | - | | | 545 | | | 1,073 | | | 1,618 | | | (244) | | 1982 | | 04/16/2015 |
Child Day Care Services | | Cedar Park | | TX | | | (f) | | | 761 | | | 178 | | | 603 | | | 2,116 | | | 1,364 | | | 2,294 | | | 3,658 | | | (276) | | 2016 | | 04/17/2015 |
Restaurants – Full Service | | Shelby | | NC | | | (f) | | | 619 | | | 624 | | | 8 | | | 567 | | | 627 | | | 1,191 | | | 1,818 | | | (123) | | 2000 | | 04/20/2015 |
Restaurants – Full Service | | Waynesville | | NC | | | (f) | | | 793 | | | 837 | | | - | | | - | | | 793 | | | 837 | | | 1,630 | | | (133) | | 1977 | | 04/20/2015 |
Restaurants – Full Service | | Addison | | IL | | | | | | 1,029 | | | 793 | | | - | | | - | | | 1,029 | | | 793 | | | 1,822 | | | (92) | | 2005 | | 04/22/2015 |
Restaurants – Full Service | | Chicago | | IL | | | | | | 668 | | | 902 | | | - | | | - | | | 668 | | | 902 | | | 1,570 | | | (99) | | 1920 | | 04/22/2015 |
Restaurants – Full Service | | Mount Prospect | | IL | | | | | | 830 | | | 755 | | | - | | | 171 | | | 830 | | | 926 | | | 1,756 | | | (143) | | 2005 | | 04/22/2015 |
Restaurants – Full Service | | Oak Park | | IL | | | | | | 703 | | | 426 | | | - | | | - | | | 703 | | | 426 | | | 1,129 | | | (52) | | 2005 | | 04/22/2015 |
Restaurants – Full Service | | Oakbrook Terrace | | IL | | | | | | 1,967 | | | 870 | | | - | | | - | | | 1,967 | | | 870 | | | 2,837 | | | (125) | | 1998 | | 04/22/2015 |
Restaurants – Full Service | | Oswego | | IL | | | | | | 1,094 | | | 869 | | | - | | | - | | | 1,094 | | | 869 | | | 1,963 | | | (100) | | 2005 | | 04/22/2015 |
Restaurants – Full Service | | Willowbrook | | IL | | | | | | 869 | | | 796 | | | - | | | - | | | 869 | | | 796 | | | 1,665 | | | (119) | | 1979 | | 04/22/2015 |
Restaurants – Full Service | | Adrian | | MI | | | (f) | | | 356 | | | 602 | | | - | | | - | | | 356 | | | 602 | | | 958 | | | (109) | | 2001 | | 04/24/2015 |
Restaurants – Full Service | | Brooklyn | | MI | | | (f) | | | 432 | | | 466 | | | - | | | - | | | 432 | | | 466 | | | 898 | | | (147) | | 1995 | | 04/24/2015 |
Restaurants – Full Service | | Tecumseh | | MI | | | (f) | | | 171 | | | 708 | | | - | | | - | | | 171 | | | 708 | | | 879 | | | (109) | | 1880 | | 04/24/2015 |
Outpatient Care Centers | | Barbourville | | KY | | | | | | 424 | | | 893 | | | - | | | - | | | 424 | | | 893 | | | 1,317 | | | (118) | | 2014 | | 04/29/2015 |
Outpatient Care Centers | | Bowling Green | | KY | | | | | | 190 | | | 504 | | | - | | | - | | | 190 | | | 504 | | | 694 | | | (76) | | 1987 | | 04/29/2015 |
Outpatient Care Centers | | Danville | | KY | | | | | | 244 | | | 756 | | | - | | | - | | | 244 | | | 756 | | | 1,000 | | | (92) | | 2010 | | 04/29/2015 |
Outpatient Care Centers | | Frankfort | | KY | | | | | | 206 | | | 479 | | | - | | | - | | | 206 | | | 479 | | | 685 | | | (62) | | 2011 | | 04/29/2015 |
Outpatient Care Centers | | Morehead | | KY | | | | | | 199 | | | 710 | | | - | | | - | | | 199 | | | 710 | | | 909 | | | (79) | | 2012 | | 04/29/2015 |
Health Clubs | | Roanoke | | VA | | | (f) | | | 1,799 | | | 2,834 | | | - | | | - | | | 1,799 | | | 2,834 | | | 4,633 | | | (624) | | 1961 | | 04/29/2015 |
Agriculture, Construction, and Mining Machinery Manufacturing | | Woodridge | | IL | | | | | | 432 | | | - | | | - | | | - | | | 432 | | | - | | | 432 | | | - | | 1990 | | 04/30/2015 |
Amusement and Theme Parks | | West Berlin | | NJ | | | (f) | | | 3,864 | | | 13,408 | | | 329 | | | 2,176 | | | 4,193 | | | 15,584 | | | 19,777 | | | (2,525) | | 2009 | | 04/30/2015 |
Restaurants – Limited Service | | Norfolk | | VA | | | | | | 545 | | | 646 | | | 22 | | | 153 | | | 567 | | | 799 | | | 1,366 | | | (96) | | 1979 | | 04/30/2015 |
Restaurants – Full Service | | Douglasville | | GA | | | (f) | | | 1,608 | | | 2,711 | | | - | | | - | | | 1,608 | | | 2,711 | | | 4,319 | | | (390) | | 1999 | | 05/06/2015 |
Child Day Care Services | | Minneapolis | | MN | | | (f) | | | 580 | | | 1,293 | | | - | | | - | | | 580 | | | 1,293 | | | 1,873 | | | (123) | | 1954 | | 05/06/2015 |
Child Day Care Services | | Minneapolis | | MN | | | (f) | | | 981 | | | 665 | | | 102 | | | 1,153 | | | 1,083 | | | 1,818 | | | 2,901 | | | (333) | | 1959 | | 05/06/2015 |
Health Clubs | | Modesto | | CA | | | (f) | | | 1,297 | | | 3,526 | | | - | | | - | | | 1,297 | | | 3,526 | | | 4,823 | | | (495) | | 1978 | | 05/08/2015 |
Restaurants – Full Service | | Athens | | AL | | | | | | 1,038 | | | 1,681 | | | - | | | - | | | 1,038 | | | 1,681 | | | 2,719 | | | (217) | | 2008 | | 05/13/2015 |
Restaurants – Full Service | | Bryant | | AR | | | | | | 505 | | | 1,569 | | | - | | | - | | | 505 | | | 1,569 | | | 2,074 | | | (187) | | 2011 | | 05/13/2015 |
Movie Theaters | | Clarksville | | IN | | | | | | 1,620 | | | 4,214 | | | - | | | - | | | 1,620 | | | 4,214 | | | 5,834 | | | (743) | | 2006 | | 05/13/2015 |
Restaurants – Full Service | | Richmond | | KY | | | | | | 1,164 | | | 1,784 | | | - | | | - | | | 1,164 | | | 1,784 | | | 2,948 | | | (265) | | 2008 | | 05/13/2015 |
Restaurants – Full Service | | Pearl | | MS | | | | | | 1,329 | | | 2,214 | | | - | | | - | | | 1,329 | | | 2,214 | | | 3,543 | | | (293) | | 2010 | | 05/13/2015 |
Restaurants – Full Service | | Yukon | | OK | | | | | | 915 | | | 1,636 | | | - | | | - | | | 915 | | | 1,636 | | | 2,551 | | | (195) | | 2010 | | 05/13/2015 |
Restaurants – Full Service | | Chattanooga | | TN | | | | | | 1,502 | | | 1,694 | | | - | | | - | | | 1,502 | | | 1,694 | | | 3,196 | | | (219) | | 2010 | | 05/13/2015 |
Restaurants – Full Service | | Manchester | | TN | | | | | | 983 | | | 1,696 | | | - | | | - | | | 983 | | | 1,696 | | | 2,679 | | | (259) | | 2010 | | 05/13/2015 |
Restaurants – Full Service | | Buda | | TX | | | | | | 714 | | | 1,618 | | | - | | | - | | | 714 | | | 1,618 | | | 2,332 | | | (203) | | 2010 | | 05/13/2015 |
Automotive Repair and Maintenance | | Edinburg | | TX | | | | | | 1,796 | | | 1,793 | | | - | | | - | | | 1,796 | | | 1,793 | | | 3,589 | | | (329) | | 2014 | | 05/13/2015 |
Automotive Repair and Maintenance | | Harlingen | | TX | | | | | | 1,657 | | | 2,349 | | | - | | | - | | | 1,657 | | | 2,349 | | | 4,006 | | | (414) | | 2014 | | 05/13/2015 |
| | | | | | | | | | | | | | | | | | | | | | | | | | | | | | | | | | | |
Descriptions (a) | | | | Initial Cost to Company | | Costs Capitalized Subsequent to Acquisition | | Gross amount at December 31, 2018 (b) (c) | | | | | | |
Tenant Industry | | City | | St | | Encumbrances | | Land &
Improvements | | Building &
Improvements | | Land &
Improvements | | Building &
Improvements | | Land &
Improvements | | Building &
Improvements | | Total | | Accumulated
Depreciation (d) (e) | | Year
Constructed | | Date Acquired |
Automotive Repair and Maintenance | | League City | | TX | | | | | | 1,385 | | | 2,502 | | | - | | | - | | | 1,385 | | | 2,502 | | | 3,887 | | | (413) | | 2011 | | 05/13/2015 |
Automotive Repair and Maintenance | | Weslaco | | TX | | | | | | 1,196 | | | 2,513 | | | - | | | - | | | 1,196 | | | 2,513 | | | 3,709 | | | (417) | | 2014 | | 05/13/2015 |
Car Dealers | | Toledo | | OH | | | | | | 474 | | | 957 | | | - | | | - | | | 474 | | | 957 | | | 1,431 | | | (175) | | 1972 | | 05/15/2015 |
Car Dealers | | Erie | | PA | | | | | | 430 | | | 1,009 | | | - | | | - | | | 430 | | | 1,009 | | | 1,439 | | | (172) | | 2000 | | 05/15/2015 |
Health Clubs | | Summerville | | SC | | | (f) | | | 368 | | | 1,920 | | | - | | | - | | | 368 | | | 1,920 | | | 2,288 | | | (273) | | 2012 | | 05/15/2015 |
Miscellaneous Nondurable Goods Merchant Wholesalers | | Grand Haven | | MI | | | | | | 11,429 | | | 6,038 | | | - | | | - | | | 11,429 | | | 6,038 | | | 17,467 | | | (2,132) | | 1950 | | 05/22/2015 |
Miscellaneous Nondurable Goods Merchant Wholesalers | | Sims | | NC | | | | | | 4,275 | | | 1,406 | | | - | | | - | | | 4,275 | | | 1,406 | | | 5,681 | | | (815) | | 1985 | | 05/22/2015 |
Miscellaneous Nondurable Goods Merchant Wholesalers | | Hulbert | | OK | | | | | | 6,712 | | | 2,221 | | | - | | | - | | | 6,712 | | | 2,221 | | | 8,933 | | | (1,629) | | 1995 | | 05/22/2015 |
Miscellaneous Nondurable Goods Merchant Wholesalers | | Smithville | | TN | | | | | | 4,766 | | | 454 | | | - | | | - | | | 4,766 | | | 454 | | | 5,220 | | | (967) | | 1995 | | 05/22/2015 |
Health and Personal Care Stores | | Tampa | | FL | | | (f) | | | 984 | | | 5,558 | | | - | | | - | | | 984 | | | 5,558 | | | 6,542 | | | (815) | | 1980 | | 05/29/2015 |
Automotive Repair and Maintenance | | Davenport | | IA | | | | | | 216 | | | 283 | | | - | | | - | | | 216 | | | 283 | | | 499 | | | (48) | | 1997 | | 06/01/2015 |
Automotive Repair and Maintenance | | Bourbonnais | | IL | | | | | | 192 | | | 521 | | | - | | | - | | | 192 | | | 521 | | | 713 | | | (78) | | 2001 | | 06/01/2015 |
Automotive Repair and Maintenance | | East Peoria | | IL | | | | | | 262 | | | 227 | | | - | | | - | | | 262 | | | 227 | | | 489 | | | (53) | | 1996 | | 06/01/2015 |
Automotive Repair and Maintenance | | Galesburg | | IL | | | | | | 115 | | | 324 | | | - | | | - | | | 115 | | | 324 | | | 439 | | | (49) | | 1990 | | 06/01/2015 |
Automotive Repair and Maintenance | | Moline | | IL | | | | | | 116 | | | 200 | | | - | | | - | | | 116 | | | 200 | | | 316 | | | (46) | | 1997 | | 06/01/2015 |
Automotive Repair and Maintenance | | Pekin | | IL | | | | | | 165 | | | 395 | | | - | | | - | | | 165 | | | 395 | | | 560 | | | (64) | | 1996 | | 06/01/2015 |
Automotive Repair and Maintenance | | Streator | | IL | | | | | | 63 | | | 161 | | | - | | | - | | | 63 | | | 161 | | | 224 | | | (36) | | 1990 | | 06/01/2015 |
Automotive Repair and Maintenance | | Washington | | IL | | | | | | 204 | | | 366 | | | - | | | - | | | 204 | | | 366 | | | 570 | | | (60) | | 1994 | | 06/01/2015 |
Cement and Concrete Product Manufacturing | | Delaware | | OH | | | | | | 346 | | | 1,494 | | | - | | | - | | | 346 | | | 1,494 | | | 1,840 | | | (199) | | 1961 | | 06/02/2015 |
Cement and Concrete Product Manufacturing | | Obetz | | OH | | | | | | 624 | | | 1,266 | | | - | | | - | | | 624 | | | 1,266 | | | 1,890 | | | (156) | | 1970 | | 06/02/2015 |
Cement and Concrete Product Manufacturing | | Sunbury | | OH | | | | | | 749 | | | 1,181 | | | - | | | - | | | 749 | | | 1,181 | | | 1,930 | | | (145) | | 1994 | | 06/02/2015 |
Restaurants – Full Service | | Commerce | | GA | | | (f) | | | 469 | | | 705 | | | - | | | 175 | | | 469 | | | 880 | | | 1,349 | | | (108) | | 1996 | | 06/03/2015 |
Restaurants – Full Service | | Flowery Branch | | GA | | | (f) | | | 439 | | | 725 | | | - | | | - | | | 439 | | | 725 | | | 1,164 | | | (108) | | 1998 | | 06/03/2015 |
Restaurants – Full Service | | Chandler | | AZ | | | | | | 287 | | | 1,395 | | | - | | | - | | | 287 | | | 1,395 | | | 1,682 | | | (248) | | 1985 | | 06/08/2015 |
Restaurants – Full Service | | Tempe | | AZ | | | | | | 687 | | | 654 | | | - | | | - | | | 687 | | | 654 | | | 1,341 | | | (189) | | 1995 | | 06/08/2015 |
Other Professional, Scientific, and Technical Services | | Manitowoc | | WI | | | (f) | | | 309 | | | 472 | | | - | | | - | | | 309 | | | 472 | | | 781 | | | (106) | | 1966 | | 06/19/2015 |
Furniture Stores | | Becker | | MN | | | (f) | | | 2,965 | | | 7,102 | | | - | | | - | | | 2,965 | | | 7,102 | | | 10,067 | | | (1,510) | | 2000 | | 06/24/2015 |
Movie Theaters | | Porterville | | CA | | | | | | 1,743 | | | 3,614 | | | - | | | - | | | 1,743 | | | 3,614 | | | 5,357 | | | (512) | | 1998 | | 06/25/2015 |
Movie Theaters | | Riverbank | | CA | | | | | | 3,963 | | | 8,072 | | | 210 | | | 3,118 | | | 4,173 | | | 11,190 | | | 15,363 | | | (1,472) | | 2000 | | 06/25/2015 |
Other Ambulatory Health Care Services | | Albany | | GA | | | | | | 497 | | | - | | | 534 | | | 3,364 | | | 1,031 | | | 3,364 | | | 4,395 | | | (282) | | 2016 | | 06/25/2015 |
Restaurants – Full Service | | Cincinnati | | OH | | | | | | 286 | | | 2,683 | | | - | | | - | | | 286 | | | 2,683 | | | 2,969 | | | (259) | | 1960 | | 06/25/2015 |
Restaurants – Full Service | | Cincinnati | | OH | | | | | | 407 | | | 127 | | | - | | | - | | | 407 | | | 127 | | | 534 | | | (32) | | 1971 | | 06/25/2015 |
Restaurants – Full Service | | Cincinnati | | OH | | | | | | 1,014 | | | 5,982 | | | - | | | - | | | 1,014 | | | 5,982 | | | 6,996 | | | (724) | | 1951 | | 06/25/2015 |
Child Day Care Services | | North Aurora | | IL | | | (f) | | | 760 | | | 2,443 | | | - | | | - | | | 760 | | | 2,443 | | | 3,203 | | | (243) | | 2005 | | 06/26/2015 |
Child Day Care Services | | Champlin | | MN | | | | | | 862 | | | 1,526 | | | - | | | - | | | 862 | | | 1,526 | | | 2,388 | | | (320) | | 1938 | | 06/26/2015 |
Child Day Care Services | | Plymouth | | MN | | | | | | 1,737 | | | 1,925 | | | 365 | | | 1,501 | | | 2,102 | | | 3,426 | | | 5,528 | | | (494) | | 1950 | | 06/26/2015 |
Automotive Repair and Maintenance | | Champaign | | IL | | | | | | 338 | | | 886 | | | - | | | - | | | 338 | | | 886 | | | 1,224 | | | (126) | | 2007 | | 06/30/2015 |
Automotive Repair and Maintenance | | Danville | | IL | | | | | | 600 | | | 844 | | | - | | | - | | | 600 | | | 844 | | | 1,444 | | | (161) | | 1970 | | 06/30/2015 |
Automotive Repair and Maintenance | | Homewood | | IL | | | | | | 295 | | | 768 | | | - | | | - | | | 295 | | | 768 | | | 1,063 | | | (114) | | 1973 | | 06/30/2015 |
Automotive Repair and Maintenance | | Macomb | | IL | | | | | | 397 | | | 746 | | | - | | | - | | | 397 | | | 746 | | | 1,143 | | | (112) | | 1992 | | 06/30/2015 |
Automotive Repair and Maintenance | | Normal | | IL | | | | | | 694 | | | 470 | | | - | | | - | | | 694 | | | 470 | | | 1,164 | | | (90) | | 1995 | | 06/30/2015 |
Automotive Repair and Maintenance | | Springfield | | IL | | | | | | 234 | | | 458 | | | - | | | - | | | 234 | | | 458 | | | 692 | | | (66) | | 1986 | | 06/30/2015 |
Machine Shops; Turned Product; and Screw, Nut, and Bolt Manufacturing | | Selmer | | TN | | | | | | 1,122 | | | 5,613 | | | - | | | - | | | 1,122 | | | 5,613 | | | 6,735 | | | (881) | | 1995 | | 06/30/2015 |
Movie Theaters | | Humble | | TX | | | | | | 2,532 | | | 139 | | | 1,989 | | | 10,631 | | | 4,521 | | | 10,770 | | | 15,291 | | | (1,100) | | 2016 | | 06/30/2015 |
Machine Shops; Turned Product; and Screw, Nut, and Bolt Manufacturing | | Beloit | | WI | | | | | | 666 | | | 3,425 | | | - | | | - | | | 666 | | | 3,425 | | | 4,091 | | | (496) | | 1926 | | 06/30/2015 |
Machine Shops; Turned Product; and Screw, Nut, and Bolt Manufacturing | | Waukesha | | WI | | | | | | 2,577 | | | 8,710 | | | - | | | - | | | 2,577 | | | 8,710 | | | 11,287 | | | (1,263) | | 1911 | | 06/30/2015 |
Machine Shops; Turned Product; and Screw, Nut, and Bolt Manufacturing | | Lombard | | IL | | | | | | 2,040 | | | 5,923 | | | - | | | - | | | 2,040 | | | 5,923 | | | 7,963 | | | (762) | | 1968 | | 07/17/2015 |
Metal and Mineral Merchant Wholesalers | | Louisville | | KY | | | | | | 1,165 | | | - | | | - | | | - | | | 1,165 | | | - | | | 1,165 | | | - | | 1962 | | 07/17/2015 |
Machine Shops; Turned Product; and Screw, Nut, and Bolt Manufacturing | | Willoughby | | OH | | | | | | 395 | | | 1,396 | | | - | | | - | | | 395 | | | 1,396 | | | 1,791 | | | (183) | | 1979 | | 07/17/2015 |
| | | | | | | | | | | | | | | | | | | | | | | | | | | | | | | | | | | |
Descriptions (a) | | | | Initial Cost to Company | | Costs Capitalized Subsequent to Acquisition | | Gross amount at December 31, 2018 (b) (c) | | | | | | |
Tenant Industry | | City | | St | | Encumbrances | | Land &
Improvements | | Building &
Improvements | | Land &
Improvements | | Building &
Improvements | | Land &
Improvements | | Building &
Improvements | | Total | | Accumulated
Depreciation (d) (e) | | Year
Constructed | | Date Acquired |
Machine Shops; Turned Product; and Screw, Nut, and Bolt Manufacturing | | Hudson | | WI | | | | | | 502 | | | 4,960 | | | - | | | - | | | 502 | | | 4,960 | | | 5,462 | | | (613) | | 1981 | | 07/17/2015 |
Movie Theaters | | Lawrenceville | | GA | | | (f) | | | 6,077 | | | 153 | | | 408 | | | 8,675 | | | 6,485 | | | 8,828 | | | 15,313 | | | (496) | | 2016 | | 07/28/2015 |
Health Clubs | | Summerville | | SC | | | | | | 1,026 | | | 3,203 | | | - | | | - | | | 1,026 | | | 3,203 | | | 4,229 | | | (431) | | 1993 | | 07/29/2015 |
Outpatient Care Centers | | Asheville | | NC | | | (f) | | | 286 | | | 975 | | | - | | | - | | | 286 | | | 975 | | | 1,261 | | | (141) | | 2000 | | 07/31/2015 |
Outpatient Care Centers | | Clyde | | NC | | | (f) | | | 164 | | | 263 | | | - | | | - | | | 164 | | | 263 | | | 427 | | | (57) | | 1978 | | 07/31/2015 |
Restaurants – Full Service | | Jersey Village | | TX | | | | | | 486 | | | 1,192 | | | - | | | - | | | 486 | | | 1,192 | | | 1,678 | | | (158) | | 1982 | | 08/11/2015 |
Restaurants – Full Service | | San Antonio | | TX | | | | | | 1,564 | | | 1,872 | | | - | | | - | | | 1,564 | | | 1,872 | | | 3,436 | | | (257) | | 2014 | | 08/11/2015 |
Restaurants – Limited Service | | Mission | | KS | | | | | | 500 | | | - | | | - | | | - | | | 500 | | | - | | | 500 | | | - | | 2001 | | 08/12/2015 |
Restaurants – Limited Service | | Blue Springs | | MO | | | | | | 429 | | | - | | | - | | | - | | | 429 | | | - | | | 429 | | | - | | 1993 | | 08/12/2015 |
Restaurants – Limited Service | | Blue Springs | | MO | | | | | | 367 | | | - | | | - | | | - | | | 367 | | | - | | | 367 | | | - | | 2001 | | 08/12/2015 |
Restaurants – Limited Service | | Independence | | MO | | | | | | 388 | | | - | | | - | | | - | | | 388 | | | - | | | 388 | | | - | | 1994 | | 08/12/2015 |
Restaurants – Limited Service | | Independence | | MO | | | | | | 316 | | | - | | | - | | | - | | | 316 | | | - | | | 316 | | | - | | 1994 | | 08/12/2015 |
Restaurants – Limited Service | | Independence | | MO | | | | | | 388 | | | - | | | - | | | - | | | 388 | | | - | | | 388 | | | - | | 2001 | | 08/12/2015 |
Restaurants – Limited Service | | Kansas City | | MO | | | | | | 286 | | | - | | | - | | | - | | | 286 | | | - | | | 286 | | | - | | 1998 | | 08/12/2015 |
Restaurants – Limited Service | | Kansas City | | MO | | | | | | 306 | | | - | | | - | | | - | | | 306 | | | - | | | 306 | | | - | | 1998 | | 08/12/2015 |
Restaurants – Limited Service | | Lee's Summit | | MO | | | | | | 337 | | | - | | | - | | | - | | | 337 | | | - | | | 337 | | | - | | 2000 | | 08/12/2015 |
Movie Theaters | | Jacinto City | | TX | | | | | | 1,034 | | | 6,178 | | | - | | | - | | | 1,034 | | | 6,178 | | | 7,212 | | | (1,288) | | 1998 | | 08/12/2015 |
Restaurants – Full Service | | Belvidere | | IL | | | | | | 688 | | | 635 | | | - | | | - | | | 688 | | | 635 | | | 1,323 | | | (123) | | 2007 | | 08/20/2015 |
Restaurants – Full Service | | Freeport | | IL | | | | | | 561 | | | 2,214 | | | - | | | - | | | 561 | | | 2,214 | | | 2,775 | | | (225) | | 1993 | | 08/20/2015 |
Restaurants – Full Service | | Galesburg | | IL | | | | | | 776 | | | 2,040 | | | - | | | - | | | 776 | | | 2,040 | | | 2,816 | | | (236) | | 1993 | | 08/20/2015 |
Restaurants – Full Service | | Jacksonville | | IL | | | | | | 670 | | | 1,494 | | | - | | | - | | | 670 | | | 1,494 | | | 2,164 | | | (184) | | 2007 | | 08/20/2015 |
Health Clubs | | Monroe | | WA | | | | | | 1,643 | | | 2,552 | | | - | | | - | | | 1,643 | | | 2,552 | | | 4,195 | | | (382) | | 2004 | | 08/20/2015 |
Corporate Aircraft Repair and Maintenance Facilities | | Grand Junction | | CO | | | | | | 472 | | | 8,967 | | | - | | | - | | | 472 | | | 8,967 | | | 9,439 | | | (1,101) | | 2015 | | 08/21/2015 |
Bowling Centers | | Richland | | WA | | | | | | 1,180 | | | 2,185 | | | - | | | - | | | 1,180 | | | 2,185 | | | 3,365 | | | (415) | | 1960 | | 08/21/2015 |
Consumer Goods Rental | | Harrison | | AR | | | | | | 294 | | | 777 | | | - | | | - | | | 294 | | | 777 | | | 1,071 | | | (72) | | 2008 | | 08/26/2015 |
Consumer Goods Rental | | Jonesboro | | AR | | | | | | 232 | | | 941 | | | - | | | - | | | 232 | | | 941 | | | 1,173 | | | (74) | | 2007 | | 08/26/2015 |
Consumer Goods Rental | | North Little Rock | | AR | | | | | | 371 | | | 1,043 | | | - | | | - | | | 371 | | | 1,043 | | | 1,414 | | | (115) | | 1999 | | 08/26/2015 |
Restaurants – Limited Service | | Sierra Vista | | AZ | | | | | | 384 | | | 1,035 | | | - | | | - | | | 384 | | | 1,035 | | | 1,419 | | | (120) | | 2005 | | 08/27/2015 |
Restaurants – Limited Service | | Tucson | | AZ | | | | | | 522 | | | 508 | | | - | | | 250 | | | 522 | | | 758 | | | 1,280 | | | (100) | | 1990 | | 08/27/2015 |
Restaurants – Limited Service | | Tucson | | AZ | | | | | | 361 | | | 639 | | | - | | | - | | | 361 | | | 639 | | | 1,000 | | | (95) | | 1989 | | 08/27/2015 |
Restaurants – Limited Service | | Tucson | | AZ | | | | | | 514 | | | 347 | | | - | | | - | | | 514 | | | 347 | | | 861 | | | (72) | | 1990 | | 08/27/2015 |
Other Professional, Scientific, and Technical Services | | Cortez | | FL | | | (f) | | | 256 | | | 879 | | | - | | | - | | | 256 | | | 879 | | | 1,135 | | | (104) | | 1974 | | 08/31/2015 |
Amusement and Theme Parks | | Monticello | | IN | | | | | | 19,925 | | | - | | | - | | | 98 | | | 19,925 | | | 98 | | | 20,023 | | | - | | | | 09/01/2015 |
Restaurants – Full Service | | Milan | | MI | | | (f) | | | 322 | | | 488 | | | - | | | 175 | | | 322 | | | 663 | | | 985 | | | (136) | | 1978 | | 09/01/2015 |
Elementary and Secondary Schools | | Los Angeles | | CA | | | | | | 9,745 | | | 5,021 | | | 228 | | | 2,276 | | | 9,973 | | | 7,297 | | | 17,270 | | | (844) | | 1981 | | 09/09/2015 |
Restaurants – Limited Service | | Athens | | AL | | | (f) | | | 401 | | | 631 | | | - | | | - | | | 401 | | | 631 | | | 1,032 | | | (82) | | 1976 | | 09/16/2015 |
Restaurants – Limited Service | | Dawsonville | | GA | | | (f) | | | 507 | | | 647 | | | - | | | - | | | 507 | | | 647 | | | 1,154 | | | (95) | | 1997 | | 09/16/2015 |
Restaurants – Limited Service | | East Ellijay | | GA | | | (f) | | | 588 | | | 476 | | | - | | | - | | | 588 | | | 476 | | | 1,064 | | | (94) | | 2005 | | 09/16/2015 |
Restaurants – Limited Service | | Jasper | | GA | | | (f) | | | 316 | | | 738 | | | - | | | - | | | 316 | | | 738 | | | 1,054 | | | (107) | | 2006 | | 09/16/2015 |
Restaurants – Limited Service | | Roswell | | GA | | | (f) | | | 268 | | | 475 | | | - | | | - | | | 268 | | | 475 | | | 743 | | | (68) | | 1978 | | 09/16/2015 |
Furniture Stores | | Hobbs | | NM | | | | | | 1,805 | | | 8,828 | | | - | | | 240 | | | 1,805 | | | 9,068 | | | 10,873 | | | (753) | | 2009 | | 09/16/2015 |
Restaurants – Limited Service | | Lawrenceburg | | TN | | | (f) | | | 283 | | | 388 | | | - | | | - | | | 283 | | | 388 | | | 671 | | | (57) | | 1979 | | 09/16/2015 |
Restaurants – Limited Service | | Springfield | | TN | | | (f) | | | 417 | | | 545 | | | - | | | - | | | 417 | | | 545 | | | 962 | | | (74) | | 1976 | | 09/16/2015 |
Lessors of Real Estate | | Houston | | TX | | | (f) | | | 1,603 | | | 5,711 | | | - | | | - | | | 1,603 | | | 5,711 | | | 7,314 | | | (510) | | 2015 | | 09/16/2015 |
Furniture Stores | | Lubbock | | TX | | | | | | 1,512 | | | 7,836 | | | - | | | 342 | | | 1,512 | | | 8,178 | | | 9,690 | | | (612) | | 2005 | | 09/16/2015 |
Child Day Care Services | | Charlotte | | NC | | | (f) | | | 609 | | | 1,526 | | | - | | | - | | | 609 | | | 1,526 | | | 2,135 | | | (191) | | 2006 | | 09/17/2015 |
Child Day Care Services | | Matthews | | NC | | | (f) | | | 616 | | | 1,520 | | | - | | | - | | | 616 | | | 1,520 | | | 2,136 | | | (152) | | 2003 | | 09/17/2015 |
| | | | | | | | | | | | | | | | | | | | | | | | | | | | | | | | | | | |
Descriptions (a) | | | | Initial Cost to Company | | Costs Capitalized Subsequent to Acquisition | | Gross amount at December 31, 2018 (b) (c) | | | | | | |
Tenant Industry | | City | | St | | Encumbrances | | Land & Improvements | | Building & Improvements | | Land & Improvements | | Building & Improvements | | Land & Improvements | | Building & Improvements | | Total | | Accumulated
Depreciation (d) (e) | | Year
Constructed | | Date Acquired |
Other Professional, Scientific, and Technical Services | | Tinley Park | | IL | | | (f) | | | 265 | | | 619 | | | - | | | - | | | 265 | | | 619 | | | 884 | | | (85) | | 1971 | | 09/18/2015 |
Movie Theaters | | McKinney | | TX | | | (f) | | | 2,714 | | | 827 | | | 997 | | | 8,822 | | | 3,711 | | | 9,649 | | | 13,360 | | | (692) | | 2016 | | 09/22/2015 |
Other Professional, Scientific, and Technical Services | | Des Moines | | IA | | | (f) | | | 188 | | | 231 | | | - | | | - | | | 188 | | | 231 | | | 419 | | | (43) | | 1983 | | 09/24/2015 |
Other Motor Vehicle Dealers | | Greensboro | | NC | | | | | | 1,894 | | | 6,998 | | | 9 | | | 515 | | | 1,903 | | | 7,513 | | | 9,416 | | | (594) | | 2005 | | 09/25/2015 |
Car Dealers | | Midwest City | | OK | | | | | | 194 | | | 361 | | | - | | | - | | | 194 | | | 361 | | | 555 | | | (43) | | 1965 | | 09/25/2015 |
Car Dealers | | Moore | | OK | | | | | | 1,290 | | | 1,853 | | | - | | | - | | | 1,290 | | | 1,853 | | | 3,143 | | | (241) | | 1990 | | 09/25/2015 |
Car Dealers | | Oklahoma City | | OK | | | | | | 1,969 | | | 4,746 | | | - | | | - | | | 1,969 | | | 4,746 | | | 6,715 | | | (569) | | 1978 | | 09/25/2015 |
Outpatient Care Centers | | Wickenburg | | AZ | | | | | | 1,264 | | | 5,647 | | | - | | | - | | | 1,264 | | | 5,647 | | | 6,911 | | | (600) | | 1994 | | 09/30/2015 |
Outpatient Care Centers | | Wickenburg | | AZ | | | | | | 295 | | | 1,274 | | | 46 | | | - | | | 341 | | | 1,274 | | | 1,615 | | | (174) | | 1986 | | 09/30/2015 |
Plastics Product Manufacturing | | Tampa | | FL | | | | | | 797 | | | 7,539 | | | - | | | - | | | 797 | | | 7,539 | | | 8,336 | | | (857) | | 1989 | | 09/30/2015 |
Outpatient Care Centers | | Augusta | | GA | | | | | | 3,513 | | | 1,986 | | | - | | | - | | | 3,513 | | | 1,986 | | | 5,499 | | | (324) | | 1987 | | 09/30/2015 |
Plastics Product Manufacturing | | Thomasville | | GA | | | | | | 1,449 | | | 3,065 | | | - | | | - | | | 1,449 | | | 3,065 | | | 4,514 | | | (436) | | 1973 | | 09/30/2015 |
Plastics Product Manufacturing | | Milan | | TN | | | | | | 123 | | | 1,578 | | | - | | | - | | | 123 | | | 1,578 | | | 1,701 | | | (180) | | 1977 | | 09/30/2015 |
Restaurants – Full Service | | Arden Hills | | MN | | | (f) | | | 723 | | | 68 | | | 365 | | | 2,938 | | | 1,088 | | | 3,006 | | | 4,094 | | | (191) | | 2017 | | 10/09/2015 |
Automotive Repair and Maintenance | | Garfield Heights | | OH | | | | | | 110 | | | 433 | | | - | | | - | | | 110 | | | 433 | | | 543 | | | (61) | | 1989 | | 10/09/2015 |
Movie Theaters | | Orlando | | FL | | | | | | 4,576 | | | 8,451 | | | - | | | - | | | 4,576 | | | 8,451 | | | 13,027 | | | (1,452) | | 1999 | | 10/16/2015 |
Movie Theaters | | Houston | | TX | | | (f) | | | 1,998 | | | 873 | | | 2,231 | | | 6,538 | | | 4,229 | | | 7,411 | | | 11,640 | | | (660) | | 2016 | | 10/21/2015 |
Health Clubs | | Sacramento | | CA | | | (f) | | | 1,682 | | | 4,842 | | | - | | | - | | | 1,682 | | | 4,842 | | | 6,524 | | | (612) | | 2004 | | 10/23/2015 |
Other Professional, Scientific, and Technical Services | | Englewood | | CO | | | (f) | | | 1,992 | | | 4,741 | | | - | | | - | | | 1,992 | | | 4,741 | | | 6,733 | | | (518) | | 1987 | | 10/23/2015 |
Child Day Care Services | | Golden Valley | | MN | | | | | | 1,012 | | | 696 | | | 15 | | | 244 | | | 1,027 | | | 940 | | | 1,967 | | | (162) | | 1959 | | 10/27/2015 |
Movie Theaters | | Houston | | TX | | | | | | 2,034 | | | 371 | | | 695 | | | 7,426 | | | 2,729 | | | 7,797 | | | 10,526 | | | (422) | | 2017 | | 10/28/2015 |
Restaurants – Full Service | | Wheaton | | IL | | | | | | 1,976 | | | 1,342 | | | - | | | - | | | 1,976 | | | 1,342 | | | 3,318 | | | (305) | | 1994 | | 10/30/2015 |
Consumer Goods Rental | | Tacoma | | WA | | | (f) | | | 271 | | | 1,519 | | | - | | | - | | | 271 | | | 1,519 | | | 1,790 | | | (172) | | 1948 | | 11/03/2015 |
Automotive Repair and Maintenance | | Flint | | MI | | | (f) | | | 127 | | | 204 | | | 4 | | | 36 | | | 131 | | | 240 | | | 371 | | | (50) | | 1996 | | 11/10/2015 |
Automotive Repair and Maintenance | | Flint | | MI | | | (f) | | | 206 | | | 225 | | | 5 | | | 41 | | | 211 | | | 266 | | | 477 | | | (49) | | 2003 | | 11/10/2015 |
Automotive Repair and Maintenance | | Houghton Lake | | MI | | | (f) | | | 73 | | | 78 | | | 5 | | | 30 | | | 78 | | | 108 | | | 186 | | | (22) | | 1990 | | 11/10/2015 |
Automotive Repair and Maintenance | | Owosso | | MI | | | (f) | | | 58 | | | 242 | | | 4 | | | 35 | | | 62 | | | 277 | | | 339 | | | (48) | | 1983 | | 11/10/2015 |
Restaurants – Full Service | | Midwest City | | OK | | | | | | 1,121 | | | 385 | | | - | | | - | | | 1,121 | | | 385 | | | 1,506 | | | (96) | | 1998 | | 11/12/2015 |
Other Professional, Scientific, and Technical Services | | Austell | | GA | | | (f) | | | 177 | | | 340 | | | - | | | - | | | 177 | | | 340 | | | 517 | | | (64) | | 1994 | | 11/19/2015 |
Other Professional, Scientific, and Technical Services | | Villa Rica | | GA | | | (f) | | | 138 | | | 351 | | | - | | | - | | | 138 | | | 351 | | | 489 | | | (68) | | 2002 | | 11/19/2015 |
Health Clubs | | Peoria | | AZ | | | (f) | | | 1,866 | | | 5,400 | | | - | | | - | | | 1,866 | | | 5,400 | | | 7,266 | | | (513) | | 2009 | | 11/20/2015 |
Advertising, Public Relations, and Related Services | | New Century | | KS | | | | | | 1,058 | | | 6,931 | | | - | | | - | | | 1,058 | | | 6,931 | | | 7,989 | | | (930) | | 1988 | | 11/23/2015 |
Other Professional, Scientific, and Technical Services | | St. Louis | | MO | | | (f) | | | 263 | | | 643 | | | - | | | - | | | 263 | | | 643 | | | 906 | | | (108) | | 1989 | | 11/24/2015 |
Restaurants – Limited Service | | Creston | | IA | | | (f) | | | 179 | | | 690 | | | 60 | | | 244 | | | 239 | | | 934 | | | 1,173 | | | (141) | | 1982 | | 11/25/2015 |
Restaurants – Limited Service | | Des Moines | | IA | | | (f) | | | 272 | | | 789 | | | 174 | | | 274 | | | 446 | | | 1,063 | | | 1,509 | | | (132) | | 1982 | | 11/25/2015 |
Restaurants – Limited Service | | Oskaloosa | | IA | | | (f) | | | 194 | | | 640 | | | 2 | | | 239 | | | 196 | | | 879 | | | 1,075 | | | (121) | | 1980 | | 11/25/2015 |
Restaurants – Limited Service | | Ottumwa | | IA | | | (f) | | | 136 | | | 726 | | | 49 | | | 142 | | | 185 | | | 868 | | | 1,053 | | | (138) | | 1960 | | 11/25/2015 |
Other Electrical Equipment and Component Manufacturing | | Niagara Falls | | NY | | | | | | 715 | | | 2,571 | | | - | | | - | | | 715 | | | 2,571 | | | 3,286 | | | (491) | | 1965 | | 12/03/2015 |
Farm and Ranch Supply Stores | | Alamosa | | CO | | | | | | 1,024 | | | 3,781 | | | - | | | - | | | 1,024 | | | 3,781 | | | 4,805 | | | (488) | | 2002 | | 12/04/2015 |
Farm and Ranch Supply Stores | | Colorado Springs | | CO | | | | | | 2,280 | | | 2,766 | | | - | | | - | | | 2,280 | | | 2,766 | | | 5,046 | | | (368) | | 2012 | | 12/04/2015 |
Farm and Ranch Supply Stores | | Elizabeth | | CO | | | | | | 1,810 | | | 3,796 | | | - | | | - | | | 1,810 | | | 3,796 | | | 5,606 | | | (444) | | 2004 | | 12/04/2015 |
Farm and Ranch Supply Stores | | La Junta | | CO | | | | | | 985 | | | 1,808 | | | - | | | - | | | 985 | | | 1,808 | | | 2,793 | | | (217) | | 1974 | | 12/04/2015 |
Farm and Ranch Supply Stores | | La Veta | | CO | | | | | | 324 | | | 217 | | | - | | | - | | | 324 | | | 217 | | | 541 | | | (38) | | 1985 | | 12/04/2015 |
Farm and Ranch Supply Stores | | Lamar | | CO | | | | | | 1,574 | | | 749 | | | - | | | - | | | 1,574 | | | 749 | | | 2,323 | | | (169) | | 1982 | | 12/04/2015 |
Farm and Ranch Supply Stores | | Limon | | CO | | | | | | 508 | | | 263 | | | - | | | - | | | 508 | | | 263 | | | 771 | | | (58) | | 1982 | | 12/04/2015 |
Farm and Ranch Supply Stores | | Pueblo | | CO | | | | | | 1,168 | | | 4,439 | | | - | | | - | | | 1,168 | | | 4,439 | | | 5,607 | | | (421) | | 1968 | | 12/04/2015 |
Child Day Care Services | | Madison | | CT | | | | | | 487 | | | - | | | - | | | - | | | 487 | | | - | | | 487 | | | - | | 1965 | | 12/04/2015 |
Child Day Care Services | | O'Fallon | | MO | | | (f) | | | 898 | | | 2,974 | | | - | | | - | | | 898 | | | 2,974 | | | 3,872 | | | (257) | | 2007 | | 12/10/2015 |
Other Textile Product Mills | | Pauls Valley | | OK | | | | | | 1,069 | | | 2,666 | | | - | | | - | | | 1,069 | | | 2,666 | | | 3,735 | | | (476) | | 1974 | | 12/10/2015 |
Other Textile Product Mills | | Wichita Falls | | TX | | | | | | 1,368 | | | 2,075 | | | - | | | - | | | 1,368 | | | 2,075 | | | 3,443 | | | (535) | | 1969 | | 12/10/2015 |
| | | | | | | | | | | | | | | | | | | | | | | | | | | | | | | | | | | |
Descriptions (a) | | | | Initial Cost to Company | | Costs Capitalized Subsequent to Acquisition | | Gross amount at December 31, 2018 (b) (c) | | | | | | |
Tenant Industry | | City | | St | | Encumbrances | | Land & Improvements | | Building & Improvements | | Land & Improvements | | Building & Improvements | | Land & Improvements | | Building & Improvements | | Total | | Accumulated
Depreciation (d) (e) | | Year
Constructed | | Date Acquired |
Medical and Diagnostic Laboratories | | Miami | | FL | | | (f) | | | 511 | | | 2,498 | | | - | | | - | | | 511 | | | 2,498 | | | 3,009 | | | (218) | | 2008 | | 12/14/2015 |
Other Miscellaneous Manufacturing | | Burnham | | ME | | | | | | 728 | | | 5,769 | | | - | | | - | | | 728 | | | 5,769 | | | 6,497 | | | (693) | | 1950 | | 12/15/2015 |
Other Miscellaneous Manufacturing | | Guilford | | ME | | | | | | 79 | | | 621 | | | - | | | - | | | 79 | | | 621 | | | 700 | | | (72) | | 1991 | | 12/15/2015 |
Other Miscellaneous Manufacturing | | Florence | | WI | | | | | | 313 | | | 987 | | | - | | | - | | | 313 | | | 987 | | | 1,300 | | | (114) | | 1988 | | 12/15/2015 |
Other Fabricated Metal Product Manufacturing | | Grand Junction | | CO | | | | | | 1,817 | | | 5,634 | | | - | | | 535 | | | 1,817 | | | 6,169 | | | 7,986 | | | (668) | | 1970 | | 12/16/2015 |
Home Furnishings Stores | | Bloomington | | IL | | | | | | 404 | | | 1,178 | | | - | | | - | | | 404 | | | 1,178 | | | 1,582 | | | (136) | | 1986 | | 12/16/2015 |
Home Furnishings Stores | | Bloomington | | IL | | | | | | 438 | | | 1,314 | | | - | | | - | | | 438 | | | 1,314 | | | 1,752 | | | (151) | | 1998 | | 12/16/2015 |
Home Furnishings Stores | | Bloomington | | IL | | | | | | 204 | | | 377 | | | - | | | - | | | 204 | | | 377 | | | 581 | | | (44) | | 1970 | | 12/16/2015 |
Home Furnishings Stores | | Bourbonnais | | IL | | | | | | 476 | | | 625 | | | - | | | - | | | 476 | | | 625 | | | 1,101 | | | (96) | | 1995 | | 12/16/2015 |
Home Furnishings Stores | | Champaign | | IL | | | | | | 496 | | | 1,267 | | | - | | | - | | | 496 | | | 1,267 | | | 1,763 | | | (152) | | 2000 | | 12/16/2015 |
Home Furnishings Stores | | Lincoln | | IL | | | | | | 322 | | | 1,190 | | | - | | | - | | | 322 | | | 1,190 | | | 1,512 | | | (213) | | 1996 | | 12/16/2015 |
Home Furnishings Stores | | Peoria | | IL | | | | | | 607 | | | 745 | | | - | | | - | | | 607 | | | 745 | | | 1,352 | | | (139) | | 1999 | | 12/16/2015 |
Home Furnishings Stores | | Springfield | | IL | | | | | | 1,015 | | | 1,128 | | | - | | | - | | | 1,015 | | | 1,128 | | | 2,143 | | | (177) | | 2013 | | 12/16/2015 |
Automotive Repair and Maintenance | | Crystal | | MN | | | | | | 226 | | | 799 | | | 4 | | | 30 | | | 230 | | | 829 | | | 1,059 | | | (100) | | 1969 | | 12/16/2015 |
Wholesale Automobile Auction | | Crestwood | | IL | | | (f) | | | 10,376 | | | 2,486 | | | 8 | | | 1,303 | | | 10,384 | | | 3,789 | | | 14,173 | | | (1,155) | | 1994 | | 12/17/2015 |
Other Miscellaneous Manufacturing | | Riviera Beach | | FL | | | | | | 1,204 | | | 3,754 | | | - | | | - | | | 1,204 | | | 3,754 | | | 4,958 | | | (333) | | 1979 | | 12/18/2015 |
Other Miscellaneous Manufacturing | | Concord | | NC | | | | | | 1,079 | | | 2,176 | | | - | | | - | | | 1,079 | | | 2,176 | | | 3,255 | | | (298) | | 1988 | | 12/18/2015 |
Offices of Physicians | | Amarillo | | TX | | | | | | 266 | | | 541 | | | - | | | - | | | 266 | | | 541 | | | 807 | | | (71) | | 1967 | | 12/18/2015 |
Amusement and Theme Parks | | Mansfield | | TX | | | | | | - | | | - | | | - | | | 131 | | | - | | | 131 | | | 131 | | | (98) | | 2009 | | 12/18/2015 |
Amusement and Theme Parks | | Roanoke | | TX | | | | | | - | | | - | | | - | | | 131 | | | - | | | 131 | | | 131 | | | (98) | | 2011 | | 12/18/2015 |
Amusement and Theme Parks | | Waco | | TX | | | | | | - | | | - | | | - | | | 131 | | | - | | | 131 | | | 131 | | | (98) | | 2012 | | 12/18/2015 |
Restaurants – Full Service | | St. Cloud | | MN | | | (f) | | | 839 | | | 3,171 | | | - | | | 99 | | | 839 | | | 3,270 | | | 4,109 | | | (383) | | 1999 | | 12/21/2015 |
Offices of Physicians | | Crest Hill | | IL | | | | | | 918 | | | 6,499 | | | - | | | - | | | 918 | | | 6,499 | | | 7,417 | | | (465) | | 2009 | | 12/23/2015 |
Offices of Physicians | | Naperville | | IL | | | | | | 1,501 | | | 2,489 | | | - | | | - | | | 1,501 | | | 2,489 | | | 3,990 | | | (261) | | 2005 | | 12/23/2015 |
Other Ambulatory Health Care Services | | Flint | | MI | | | | | | 345 | | | - | | | 750 | | | 3,537 | | | 1,095 | | | 3,537 | | | 4,632 | | | (272) | | 2016 | | 12/23/2015 |
Home Furnishings Stores | | Kennesaw | | GA | | | (f) | | | 5,000 | | | 9,026 | | | - | | | - | | | 5,000 | | | 9,026 | | | 14,026 | | | (1,094) | | 1997 | | 12/29/2015 |
Home Furnishings Stores | | Norcross | | GA | | | | | | 4,465 | | | 7,385 | | | - | | | - | | | 4,465 | | | 7,385 | | | 11,850 | | | (1,373) | | 1997 | | 12/29/2015 |
Consumer Goods Rental | | Trenton | | IL | | | | | | 1,401 | | | 5,894 | | | - | | | - | | | 1,401 | | | 5,894 | | | 7,295 | | | (750) | | 1989 | | 12/29/2015 |
Consumer Goods Rental | | Anderson | | IN | | | | | | 285 | | | 933 | | | - | | | - | | | 285 | | | 933 | | | 1,218 | | | (169) | | 1988 | | 12/29/2015 |
Consumer Goods Rental | | Salina | | KS | | | | | | 335 | | | 762 | | | - | | | - | | | 335 | | | 762 | | | 1,097 | | | (127) | | 1972 | | 12/29/2015 |
Consumer Goods Rental | | Seguin | | TX | | | | | | 466 | | | 641 | | | - | | | - | | | 466 | | | 641 | | | 1,107 | | | (89) | | 1985 | | 12/29/2015 |
Restaurants – Full Service | | Muncie | | IN | | | | | | 261 | | | - | | | - | | | - | | | 261 | | | - | | | 261 | | | - | | 1972 | | 12/30/2015 |
Restaurants – Limited Service | | Spartanburg | | SC | | | (f) | | | 129 | | | 393 | | | - | | | - | | | 129 | | | 393 | | | 522 | | | (65) | | 2015 | | 12/30/2015 |
Restaurants – Full Service | | Austin | | TX | | | | | | 1,546 | | | 1,720 | | | - | | | - | | | 1,546 | | | 1,720 | | | 3,266 | | | (212) | | 1919 | | 12/30/2015 |
Other Personal Services | | Madison | | WI | | | (f) | | | 254 | | | 770 | | | - | | | - | | | 254 | | | 770 | | | 1,024 | | | (70) | | 2005 | | 01/04/2016 |
Other Professional, Scientific, and Technical Services | | Gainesville | | GA | | | (f) | | | 211 | | | 541 | | | - | | | - | | | 211 | | | 541 | | | 752 | | | (91) | | 1999 | | 01/08/2016 |
Other Professional, Scientific, and Technical Services | | Oakwood | | GA | | | (f) | | | 217 | | | 455 | | | - | | | - | | | 217 | | | 455 | | | 672 | | | (59) | | 2001 | | 01/08/2016 |
Other Professional, Scientific, and Technical Services | | Suwanee | | GA | | | (f) | | | 337 | | | 716 | | | - | | | - | | | 337 | | | 716 | | | 1,053 | | | (123) | | 1990 | | 01/08/2016 |
Offices of Dentists | | Westmont | | IL | | | | | | 429 | | | 906 | | | - | | | 33 | | | 429 | | | 939 | | | 1,368 | | | (151) | | 1989 | | 01/12/2016 |
Other Professional, Scientific, and Technical Services | | Anchorage | | AK | | | (f) | | | 828 | | | 702 | | | - | | | - | | | 828 | | | 702 | | | 1,530 | | | (119) | | 2005 | | 01/29/2016 |
Restaurants – Full Service | | Milton | | GA | | | | | | 487 | | | 1,021 | | | - | | | - | | | 487 | | | 1,021 | | | 1,508 | | | (83) | | 1950 | | 01/29/2016 |
Health Clubs | | Louisville | | KY | | | | | | 407 | | | 654 | | | 4 | | | 1,378 | | | 411 | | | 2,032 | | | 2,443 | | | (120) | | 2003 | | 02/01/2016 |
Movie Theaters | | Bristol | | TN | | | | | | 3,322 | | | 6,883 | | | - | | | - | | | 3,322 | | | 6,883 | | | 10,205 | | | (722) | | 2015 | | 02/02/2016 |
Management, Scientific, and Technical Consulting Services | | Hebron | | KY | | | | | | 955 | | | 776 | | | - | | | - | | | 955 | | | 776 | | | 1,731 | | | (198) | | 1998 | | 02/09/2016 |
Management, Scientific, and Technical Consulting Services | | Wayland | | MI | | | | | | 1,009 | | | 843 | | | - | | | - | | | 1,009 | | | 843 | | | 1,852 | | | (192) | | 2005 | | 02/09/2016 |
Management, Scientific, and Technical Consulting Services | | Ypsilanti | | MI | | | | | | 1,686 | | | 2,016 | | | - | | | - | | | 1,686 | | | 2,016 | | | 3,702 | | | (374) | | 1999 | | 02/09/2016 |
Management, Scientific, and Technical Consulting Services | | Columbus | | OH | | | | | | 962 | | | 769 | | | - | | | - | | | 962 | | | 769 | | | 1,731 | | | (196) | | 1995 | | 02/09/2016 |
Other Personal Services | | Lenexa | | KS | | | | | | 459 | | | 1,163 | | | - | | | - | | | 459 | | | 1,163 | | | 1,622 | | | (138) | | 1999 | | 02/11/2016 |
Other Personal Services | | Kansas City | | MO | | | | | | 941 | | | 861 | | | - | | | - | | | 941 | | | 861 | | | 1,802 | | | (132) | | 2004 | | 02/11/2016 |
Other Personal Services | | Lee's Summit | | MO | | | | | | 513 | | | 947 | | | - | | | - | | | 513 | | | 947 | | | 1,460 | | | (127) | | 2001 | | 02/11/2016 |
| | | | | | | | | | | | | | | | | | | | | | | | | | | | | | | | | | | |
Descriptions (a) | | | | Initial Cost to Company | | Costs Capitalized Subsequent to Acquisition | | Gross amount at December 31, 2018 (b) (c) | | | | | | |
Tenant Industry | | City | | St | | Encumbrances | | Land & Improvements | | Building & Improvements | | Land & Improvements | | Building & Improvements | | Land & Improvements | | Building & Improvements | | Total | | Accumulated
Depreciation (d) (e) | | Year
Constructed | | Date Acquired |
Restaurants – Full Service | | Charlotte | | NC | | | | | | 1,516 | | | - | | | 327 | | | 941 | | | 1,843 | | | 941 | | | 2,784 | | | (120) | | 2016 | | 02/12/2016 |
Child Day Care Services | | Minnetonka | | MN | | | | | | 521 | | | 1,064 | | | - | | | 634 | | | 521 | | | 1,698 | | | 2,219 | | | (171) | | 1977 | | 02/18/2016 |
Medical and Diagnostic Laboratories | | Jupiter | | FL | | | (f) | | | 281 | | | 472 | | | - | | | - | | | 281 | | | 472 | | | 753 | | | (101) | | 1990 | | 02/19/2016 |
Child Day Care Services | | Justin | | TX | | | | | | 159 | | | 956 | | | 6 | | | 214 | | | 165 | | | 1,170 | | | 1,335 | | | (122) | | 1999 | | 02/19/2016 |
Metal and Mineral Merchant Wholesalers | | Elk Grove Village | | IL | | | | | | 2,742 | | | 11,164 | | | - | | | - | | | 2,742 | | | 11,164 | | | 13,906 | | | (1,606) | | 1956 | | 02/22/2016 |
Automotive Repair and Maintenance | | Aurora | | IL | | | | | | 1,603 | | | 2,333 | | | - | | | - | | | 1,603 | | | 2,333 | | | 3,936 | | | (220) | | 2006 | | 02/24/2016 |
Automotive Repair and Maintenance | | Elmwood Park | | IL | | | | | | 1,083 | | | 2,152 | | | - | | | - | | | 1,083 | | | 2,152 | | | 3,235 | | | (168) | | 1951 | | 02/24/2016 |
Automotive Repair and Maintenance | | Naperville | | IL | | | | | | 1,134 | | | 2,643 | | | - | | | - | | | 1,134 | | | 2,643 | | | 3,777 | | | (301) | | 2015 | | 02/24/2016 |
Automotive Repair and Maintenance | | Plainfield | | IL | | | | | | 764 | | | 2,970 | | | - | | | - | | | 764 | | | 2,970 | | | 3,734 | | | (237) | | 2013 | | 02/24/2016 |
Automotive Repair and Maintenance | | Wyoming | | MI | | | | | | 351 | | | 1,905 | | | - | | | - | | | 351 | | | 1,905 | | | 2,256 | | | (163) | | 2006 | | 02/24/2016 |
Restaurants – Full Service | | Balcones Heights | | TX | | | | | | 194 | | | 1,064 | | | - | | | - | | | 194 | | | 1,064 | | | 1,258 | | | (161) | | 1950 | | 02/24/2016 |
Restaurants – Full Service | | Converse | | TX | | | | | | 230 | | | 390 | | | - | | | - | | | 230 | | | 390 | | | 620 | | | (66) | | 1999 | | 02/24/2016 |
Restaurants – Full Service | | San Antonio | | TX | | | | | | 1,189 | | | 1,260 | | | - | | | - | | | 1,189 | | | 1,260 | | | 2,449 | | | (211) | | 1945 | | 02/24/2016 |
Restaurants – Full Service | | San Antonio | | TX | | | | | | 228 | | | 808 | | | - | | | - | | | 228 | | | 808 | | | 1,036 | | | (188) | | 1962 | | 02/24/2016 |
Restaurants – Full Service | | San Antonio | | TX | | | | | | 117 | | | 569 | | | - | | | - | | | 117 | | | 569 | | | 686 | | | (69) | | 1997 | | 02/24/2016 |
Restaurants – Full Service | | San Antonio | | TX | | | | | | 375 | | | 740 | | | - | | | - | | | 375 | | | 740 | | | 1,115 | | | (87) | | 1992 | | 02/24/2016 |
Restaurants – Full Service | | San Antonio | | TX | | | | | | 274 | | | 821 | | | - | | | - | | | 274 | | | 821 | | | 1,095 | | | (107) | | 1990 | | 02/24/2016 |
Child Day Care Services | | Augusta | | GA | | | | | | 255 | | | 542 | | | - | | | - | | | 255 | | | 542 | | | 797 | | | (87) | | 1982 | | 02/26/2016 |
Child Day Care Services | | Augusta | | GA | | | | | | 401 | | | 538 | | | - | | | - | | | 401 | | | 538 | | | 939 | | | (75) | | 2006 | | 02/26/2016 |
Farm and Ranch Supply Stores | | Mankato | | MN | | | | | | 7,639 | | | 11,328 | | | - | | | - | | | 7,639 | | | 11,328 | | | 18,967 | | | (1,673) | | 2015 | | 02/26/2016 |
Farm and Ranch Supply Stores | | Fargo | | ND | | | | | | 7,219 | | | 16,872 | | | - | | | - | | | 7,219 | | | 16,872 | | | 24,091 | | | (2,265) | | 1995 | | 02/26/2016 |
Farm and Ranch Supply Stores | | Hudson | | WI | | | 62,609 | | | 7,105 | | | 9,891 | | | - | | | - | | | 7,105 | | | 9,891 | | | 16,996 | | | (1,454) | | 1992 | | 02/26/2016 |
Farm and Ranch Supply Stores | | Green Bay | | WI | | | | | | 7,367 | | | 17,793 | | | - | | | - | | | 7,367 | | | 17,793 | | | 25,160 | | | (1,903) | | 1966 | | 06/16/2016 |
Farm and Ranch Supply Stores | | Marshfield | | WI | | | | | | 3,018 | | | 11,874 | | | - | | | - | | | 3,018 | | | 11,874 | | | 14,892 | | | (1,207) | | 1980 | | 06/16/2016 |
Child Day Care Services | | Boiling Springs | | SC | | | | | | 98 | | | 336 | | | - | | | - | | | 98 | | | 336 | | | 434 | | | (55) | | 1979 | | 02/26/2016 |
Furniture Stores | | Midland | | TX | | | | | | 1,846 | | | 7,267 | | | - | | | 373 | | | 1,846 | | | 7,640 | | | 9,486 | | | (662) | | 2007 | | 02/26/2016 |
Automotive Repair and Maintenance | | McAllen | | TX | | | | | | 1,620 | | | 2,245 | | | - | | | - | | | 1,620 | | | 2,245 | | | 3,865 | | | (307) | | 2015 | | 03/02/2016 |
Offices of Dentists | | Palos Heights | | IL | | | | | | 222 | | | 294 | | | - | | | 31 | | | 222 | | | 325 | | | 547 | | | (53) | | 1974 | | 03/04/2016 |
Commercial and Industrial Machinery and Equipment Repair and Maintenance | | Cannon Falls | | MN | | | | | | 1,788 | | | 3,291 | | | - | | | - | | | 1,788 | | | 3,291 | | | 5,079 | | | (610) | | 1987 | | 03/11/2016 |
Commercial and Industrial Machinery and Equipment Repair and Maintenance | | Hastings | | MN | | | | | | 799 | | | 703 | | | - | | | - | | | 799 | | | 703 | | | 1,502 | | | (154) | | 1997 | | 03/11/2016 |
Medical and Diagnostic Laboratories | | Alpharetta | | GA | | | | | | 2,852 | | | 5,676 | | | - | | | - | | | 2,852 | | | 5,676 | | | 8,528 | | | (466) | | 1999 | | 03/17/2016 |
Restaurants – Limited Service | | Oklahoma City | | OK | | | | | | 719 | | | 35 | | | 277 | | | 687 | | | 996 | | | 722 | | | 1,718 | | | (77) | | 2017 | | 03/22/2016 |
Restaurants – Full Service | | Edmond | | OK | | | (f) | | | 231 | | | 599 | | | - | | | - | | | 231 | | | 599 | | | 830 | | | (64) | | 1971 | | 03/23/2016 |
Farm and Ranch Supply Stores | | Casa Grande | | AZ | | | | | | 1,950 | | | 1,063 | | | - | | | - | | | 1,950 | | | 1,063 | | | 3,013 | | | (177) | | 2013 | | 03/29/2016 |
Farm and Ranch Supply Stores | | Burley | | ID | | | | | | 1,287 | | | 2,705 | | | - | | | - | | | 1,287 | | | 2,705 | | | 3,992 | | | (355) | | 1967 | | 03/29/2016 |
Restaurants – Limited Service | | Tulsa | | OK | | | | | | 679 | | | 826 | | | - | | | - | | | 679 | | | 826 | | | 1,505 | | | (121) | | 2013 | | 03/29/2016 |
Farm and Ranch Supply Stores | | Cedar City | | UT | | | | | | 3,348 | | | 2,884 | | | - | | | - | | | 3,348 | | | 2,884 | | | 6,232 | | | (539) | | 2002 | | 03/29/2016 |
Farm and Ranch Supply Stores | | St George | | UT | | | | | | 3,223 | | | 3,189 | | | - | | | - | | | 3,223 | | | 3,189 | | | 6,412 | | | (483) | | 2012 | | 03/29/2016 |
Farm and Ranch Supply Stores | | Tooele | | UT | | | | | | 3,308 | | | 3,535 | | | - | | | - | | | 3,308 | | | 3,535 | | | 6,843 | | | (496) | | 2002 | | 03/29/2016 |
Farm and Ranch Supply Stores | | Vernal | | UT | | | | | | 1,811 | | | 1,851 | | | - | | | - | | | 1,811 | | | 1,851 | | | 3,662 | | | (249) | | 2009 | | 03/29/2016 |
Farm and Ranch Supply Stores | | West Jordan | | UT | | | | | | 2,587 | | | 3,435 | | | - | | | - | | | 2,587 | | | 3,435 | | | 6,022 | | | (412) | | 2008 | | 03/29/2016 |
Aerospace Product and Parts Manufacturing | | Athens | | GA | | | | | | 1,289 | | | 5,935 | | | - | | | - | | | 1,289 | | | 5,935 | | | 7,224 | | | (660) | | 1995 | | 03/30/2016 |
Health Clubs | | Hobart | | IN | | | | | | 544 | | | 1,193 | | | - | | | - | | | 544 | | | 1,193 | | | 1,737 | | | (210) | | 1976 | | 03/30/2016 |
Other Personal Services | | Olathe | | KS | | | (f) | | | 1,294 | | | 1,034 | | | - | | | - | | | 1,294 | | | 1,034 | | | 2,328 | | | (214) | | 1996 | | 03/30/2016 |
Aerospace Product and Parts Manufacturing | | Tulsa | | OK | | | | | | 1,985 | | | 3,133 | | | 418 | | | 2,935 | | | 2,403 | | | 6,068 | | | 8,471 | | | (536) | | 1965 | | 03/30/2016 |
Machine Shops; Turned Product; and Screw, Nut, and Bolt Manufacturing | | Osgood | | IN | | | | | | 470 | | | 1,011 | | | - | | | - | | | 470 | | | 1,011 | | | 1,481 | | | (125) | | 2002 | | 03/31/2016 |
Machine Shops; Turned Product; and Screw, Nut, and Bolt Manufacturing | | Versailles | | IN | | | | | | 795 | | | 3,106 | | | - | | | - | | | 795 | | | 3,106 | | | 3,901 | | | (316) | | 1965 | | 03/31/2016 |
Machinery, Equipment, and Supplies Merchant Wholesalers | | Jamestown | | ND | | | (f) | | | 2,112 | | | 6,577 | | | - | | | - | | | 2,112 | | | 6,577 | | | 8,689 | | | (766) | | 2013 | | 03/31/2016 |
Machine Shops; Turned Product; and Screw, Nut, and Bolt Manufacturing | | Euclid | | OH | | | | | | 371 | | | 1,486 | | | - | | | - | | | 371 | | | 1,486 | | | 1,857 | | | (163) | | 1930 | | 03/31/2016 |
Machine Shops; Turned Product; and Screw, Nut, and Bolt Manufacturing | | Martin | | TN | | | | | | 336 | | | 2,079 | | | - | | | - | | | 336 | | | 2,079 | | | 2,415 | | | (237) | | 1972 | | 03/31/2016 |
| | | | | | | | | | | | | | | | | | | | | | | | | | | | | | | | | | | |
Descriptions (a) | | | | Initial Cost to Company | | Costs Capitalized Subsequent to Acquisition | | Gross amount at December 31, 2018 (b) (c) | | | | | | |
Tenant Industry | | City | | St | | Encumbrances | | Land &
Improvements | | Building &
Improvements | | Land &
Improvements | | Building &
Improvements | | Land &
Improvements | | Building &
Improvements | | Total | | Accumulated
Depreciation (d) (e) | | Year
Constructed | | Date Acquired |
Machine Shops; Turned Product; and Screw, Nut, and Bolt Manufacturing | | Merrill | | WI | | | | | | 738 | | | 2,164 | | | - | | | - | | | 738 | | | 2,164 | | | 2,902 | | | (250) | | 1970 | | 03/31/2016 |
Chemical and Allied Products Merchant Wholesalers | | Memphis | | TN | | | | | | 910 | | | 6,623 | | | - | | | - | | | 910 | | | 6,623 | | | 7,533 | | | (677) | | 1973 | | 04/11/2016 |
Outpatient Care Centers | | Spartanburg | | SC | | | | | | 338 | | | 719 | | | - | | | - | | | 338 | | | 719 | | | 1,057 | | | (94) | | 2007 | | 04/14/2016 |
Restaurants – Limited Service | | Frisco | | TX | | | | | | 641 | | | 79 | | | 190 | | | 684 | | | 831 | | | 763 | | | 1,594 | | | (67) | | 2017 | | 04/14/2016 |
Child Day Care Services | | Eden Prairie | | MN | | | (f) | | | 791 | | | 1,608 | | | - | | | - | | | 791 | | | 1,608 | | | 2,399 | | | (134) | | 2012 | | 04/15/2016 |
Child Day Care Services | | St Paul | | MN | | | (f) | | | 560 | | | 452 | | | 437 | | | 1,724 | | | 997 | | | 2,176 | | | 3,173 | | | (167) | | 2016 | | 04/15/2016 |
Restaurants – Limited Service | | Florence | | SC | | | | | | 373 | | | 409 | | | - | | | - | | | 373 | | | 409 | | | 782 | | | (57) | | 1996 | | 04/15/2016 |
Restaurants – Limited Service | | Florence | | SC | | | | | | 251 | | | 352 | | | - | | | - | | | 251 | | | 352 | | | 603 | | | (46) | | 1991 | | 04/15/2016 |
Machinery, Equipment, and Supplies Merchant Wholesalers | | Charlotte | | NC | | | | | | 532 | | | 996 | | | - | | | - | | | 532 | | | 996 | | | 1,528 | | | (96) | | 1988 | | 04/19/2016 |
Machinery, Equipment, and Supplies Merchant Wholesalers | | Tulsa | | OK | | | | | | 214 | | | 861 | | | - | | | - | | | 214 | | | 861 | | | 1,075 | | | (86) | | 1970 | | 04/19/2016 |
Plastics Product Manufacturing | | Indianapolis | | IN | | | | | | 2,500 | | | 7,705 | | | - | | | - | | | 2,500 | | | 7,705 | | | 10,205 | | | (843) | | 1979 | | 04/22/2016 |
Plastics Product Manufacturing | | Grenada | | MS | | | | | | 519 | | | 2,390 | | | - | | | - | | | 519 | | | 2,390 | | | 2,909 | | | (290) | | 1978 | | 04/22/2016 |
Plastics Product Manufacturing | | Rockingham | | NC | | | | | | 553 | | | 1,686 | | | - | | | - | | | 553 | | | 1,686 | | | 2,239 | | | (220) | | 1900 | | 04/22/2016 |
Plastics Product Manufacturing | | Paxinos | | PA | | | | | | 964 | | | 1,974 | | | - | | | - | | | 964 | | | 1,974 | | | 2,938 | | | (279) | | 1961 | | 04/22/2016 |
Plastics Product Manufacturing | | Reading | | PA | | | | | | 4,816 | | | 12,985 | | | - | | | - | | | 4,816 | | | 12,985 | | | 17,801 | | | (1,667) | | 1968 | | 04/22/2016 |
Restaurants – Limited Service | | Alvin | | TX | | | | | | 363 | | | 398 | | | - | | | - | | | 363 | | | 398 | | | 761 | | | (55) | | 1982 | | 04/26/2016 |
Restaurants – Limited Service | | Bay City | | TX | | | | | | 339 | | | 493 | | | - | | | 145 | | | 339 | | | 638 | | | 977 | | | (56) | | 1975 | | 04/26/2016 |
Restaurants – Limited Service | | Baytown | | TX | | | | | | 255 | | | 311 | | | - | | | 136 | | | 255 | | | 447 | | | 702 | | | (41) | | 1982 | | 04/26/2016 |
Restaurants – Limited Service | | Dickinson | | TX | | | | | | 346 | | | 359 | | | - | | | 145 | | | 346 | | | 504 | | | 850 | | | (53) | | 1977 | | 04/26/2016 |
Restaurants – Limited Service | | El Campo | | TX | | | | | | 529 | | | 666 | | | - | | | 145 | | | 529 | | | 811 | | | 1,340 | | | (84) | | 1972 | | 04/26/2016 |
Restaurants – Limited Service | | Freeport | | TX | | | | | | 210 | | | 216 | | | - | | | - | | | 210 | | | 216 | | | 426 | | | (31) | | 1984 | | 04/26/2016 |
Restaurants – Limited Service | | Houston | | TX | | | | | | 355 | | | 425 | | | - | | | 145 | | | 355 | | | 570 | | | 925 | | | (56) | | 1982 | | 04/26/2016 |
Restaurants – Limited Service | | Houston | | TX | | | | | | 221 | | | 309 | | | - | | | 134 | | | 221 | | | 443 | | | 664 | | | (37) | | 1985 | | 04/26/2016 |
Restaurants – Limited Service | | Houston | | TX | | | | | | 280 | | | 345 | | | - | | | 134 | | | 280 | | | 479 | | | 759 | | | (45) | | 1980 | | 04/26/2016 |
Restaurants – Limited Service | | Houston | | TX | | | | | | 247 | | | 317 | | | - | | | - | | | 247 | | | 317 | | | 564 | | | (38) | | 1985 | | 04/26/2016 |
Restaurants – Limited Service | | Houston | | TX | | | | | | 274 | | | 327 | | | - | | | 134 | | | 274 | | | 461 | | | 735 | | | (44) | | 1984 | | 04/26/2016 |
Restaurants – Limited Service | | Houston | | TX | | | | | | 226 | | | 247 | | | - | | | 145 | | | 226 | | | 392 | | | 618 | | | (36) | | 1975 | | 04/26/2016 |
Restaurants – Limited Service | | Houston | | TX | | | | | | 349 | | | 448 | | | - | | | 145 | | | 349 | | | 593 | | | 942 | | | (56) | | 1978 | | 04/26/2016 |
Restaurants – Limited Service | | Houston | | TX | | | | | | 341 | | | 432 | | | - | | | 145 | | | 341 | | | 577 | | | 918 | | | (55) | | 1979 | | 04/26/2016 |
Restaurants – Limited Service | | Houston | | TX | | | | | | 223 | | | 263 | | | - | | | - | | | 223 | | | 263 | | | 486 | | | (34) | | 1982 | | 04/26/2016 |
Restaurants – Limited Service | | Huntsville | | TX | | | | | | 545 | | | 593 | | | - | | | - | | | 545 | | | 593 | | | 1,138 | | | (82) | | 1979 | | 04/26/2016 |
Restaurants – Limited Service | | Jasper | | TX | | | | | | 240 | | | 336 | | | - | | | - | | | 240 | | | 336 | | | 576 | | | (38) | | 1982 | | 04/26/2016 |
Restaurants – Limited Service | | Katy | | TX | | | | | | 247 | | | 306 | | | - | | | - | | | 247 | | | 306 | | | 553 | | | (38) | | 1984 | | 04/26/2016 |
Restaurants – Limited Service | | La Marque | | TX | | | | | | 288 | | | 331 | | | - | | | - | | | 288 | | | 331 | | | 619 | | | (44) | | 1995 | | 04/26/2016 |
Restaurants – Limited Service | | Livingston | | TX | | | | | | 222 | | | 295 | | | - | | | - | | | 222 | | | 295 | | | 517 | | | (35) | | 1986 | | 04/26/2016 |
Restaurants – Limited Service | | Pasadena | | TX | | | | | | 333 | | | 349 | | | - | | | - | | | 333 | | | 349 | | | 682 | | | (49) | | 1982 | | 04/26/2016 |
Restaurants – Limited Service | | Port Arthur | | TX | | | | | | 350 | | | 344 | | | - | | | 145 | | | 350 | | | 489 | | | 839 | | | (53) | | 1986 | | 04/26/2016 |
Restaurants – Limited Service | | South Houston | | TX | | | | | | 257 | | | 326 | | | - | | | 123 | | | 257 | | | 449 | | | 706 | | | (41) | | 1982 | | 04/26/2016 |
Restaurants – Limited Service | | West Columbia | | TX | | | | | | 316 | | | 349 | | | - | | | 145 | | | 316 | | | 494 | | | 810 | | | (49) | | 1982 | | 04/26/2016 |
Restaurants – Limited Service | | Wharton | | TX | | | | | | 306 | | | 317 | | | - | | | 145 | | | 306 | | | 462 | | | 768 | | | (47) | | 1972 | | 04/26/2016 |
Child Day Care Services | | Montgomery | | IL | | | | | | 772 | | | 1,695 | | | - | | | - | | | 772 | | | 1,695 | | | 2,467 | | | (186) | | 2009 | | 04/29/2016 |
Child Day Care Services | | Morton | | IL | | | | | | 604 | | | 948 | | | - | | | - | | | 604 | | | 948 | | | 1,552 | | | (119) | | 2012 | | 04/29/2016 |
Child Day Care Services | | Pekin | | IL | | | | | | 485 | | | 808 | | | - | | | - | | | 485 | | | 808 | | | 1,293 | | | (99) | | 1992 | | 04/29/2016 |
Child Day Care Services | | Peoria | | IL | | | | | | 767 | | | 943 | | | - | | | - | | | 767 | | | 943 | | | 1,710 | | | (115) | | 1996 | | 04/29/2016 |
| | | | | | | | | | | | | | | | | | | | | | | | | | | | | | | | | | | |
Descriptions (a) | | | | Initial Cost to Company | | Costs Capitalized Subsequent to Acquisition | | Gross amount at December 31, 2018 (b) (c) | | | | | | |
Tenant Industry | | City | | St | | Encumbrances | | Land & Improvements | | Building & Improvements | | Land & Improvements | | Building & Improvements | | Land & Improvements | | Building & Improvements | | Total | | Accumulated
Depreciation (d) (e) | | Year
Constructed | | Date Acquired |
Child Day Care Services | | Peoria | | IL | | | | | | 626 | | | 1,751 | | | - | | | - | | | 626 | | | 1,751 | | | 2,377 | | | (185) | | 1985 | | 04/29/2016 |
Child Day Care Services | | Peoria | | IL | | | | | | 402 | | | 762 | | | - | | | - | | | 402 | | | 762 | | | 1,164 | | | (87) | | 1970 | | 04/29/2016 |
Child Day Care Services | | Peoria Heights | | IL | | | | | | 217 | | | 1,175 | | | - | | | - | | | 217 | | | 1,175 | | | 1,392 | | | (115) | | 1965 | | 04/29/2016 |
Child Day Care Services | | Romeoville | | IL | | | | | | 802 | | | 1,516 | | | - | | | - | | | 802 | | | 1,516 | | | 2,318 | | | (170) | | 2003 | | 04/29/2016 |
Child Day Care Services | | Becker | | MN | | | | | | 191 | | | 690 | | | 65 | | | 99 | | | 256 | | | 789 | | | 1,045 | | | (123) | | 1994 | | 04/29/2016 |
Health Clubs | | Lake in the Hills | | IL | | | | | | 381 | | | - | | | 5 | | | 2,401 | | | 386 | | | 2,401 | | | 2,787 | | | (106) | | 2017 | | 05/04/2016 |
Restaurants – Limited Service | | Clarksdale | | MS | | | | | | 171 | | | 459 | | | 2 | | | 51 | | | 173 | | | 510 | | | 683 | | | (58) | | 1988 | | 05/06/2016 |
Restaurants – Limited Service | | Cleveland | | MS | | | | | | 91 | | | 396 | | | 2 | | | 54 | | | 93 | | | 450 | | | 543 | | | (54) | | 1999 | | 05/06/2016 |
Restaurants – Limited Service | | Greenwood | | MS | | | | | | 195 | | | 323 | | | 3 | | | 48 | | | 198 | | | 371 | | | 569 | | | (62) | | 1984 | | 05/06/2016 |
Restaurants – Full Service | | Rochester | | NY | | | | | | 429 | | | 4,630 | | | - | | | - | | | 429 | | | 4,630 | | | 5,059 | | | (426) | | 1905 | | 05/06/2016 |
Restaurants – Full Service | | Syracuse | | NY | | | | | | 776 | | | 4,965 | | | - | | | - | | | 776 | | | 4,965 | | | 5,741 | | | (453) | | 1892 | | 05/06/2016 |
Other Professional, Scientific, and Technical Services | | Vancouver | | WA | | | (f) | | | 534 | | | 1,490 | | | - | | | - | | | 534 | | | 1,490 | | | 2,024 | | | (151) | | 2000 | | 05/06/2016 |
Child Day Care Services | | Burleson | | TX | | | | | | 309 | | | 1,069 | | | - | | | - | | | 309 | | | 1,069 | | | 1,378 | | | (134) | | 2006 | | 05/11/2016 |
Child Day Care Services | | Burleson | | TX | | | | | | 425 | | | 1,905 | | | - | | | - | | | 425 | | | 1,905 | | | 2,330 | | | (181) | | 1993 | | 05/11/2016 |
Child Day Care Services | | Burleson | | TX | | | | | | 435 | | | 1,494 | | | - | | | - | | | 435 | | | 1,494 | | | 1,929 | | | (187) | | 2009 | | 05/11/2016 |
Other Professional, Scientific, and Technical Services | | Merced | | CA | | | (f) | | | 583 | | | 1,656 | | | - | | | - | | | 583 | | | 1,656 | | | 2,239 | | | (183) | | 1986 | | 05/12/2016 |
Amusement and Theme Parks | | Grand Island | | NY | | | | | | 8,009 | | | - | | | - | | | - | | | 8,009 | | | - | | | 8,009 | | | (792) | | 1961 | | 05/13/2016 |
Restaurants – Limited Service | | Akron | | OH | | | | | | 1,288 | | | 414 | | | - | | | - | | | 1,288 | | | 414 | | | 1,702 | | | (133) | | 1950 | | 05/17/2016 |
Restaurants – Limited Service | | Akron | | OH | | | | | | 453 | | | 1,975 | | | - | | | - | | | 453 | | | 1,975 | | | 2,428 | | | (118) | | 1960 | | 05/17/2016 |
Restaurants – Limited Service | | Akron | | OH | | | | | | 1,194 | | | 647 | | | - | | | - | | | 1,194 | | | 647 | | | 1,841 | | | (141) | | 1994 | | 05/17/2016 |
Restaurants – Limited Service | | Akron | | OH | | | | | | 241 | | | 1,541 | | | - | | | - | | | 241 | | | 1,541 | | | 1,782 | | | (249) | | 2005 | | 05/17/2016 |
Restaurants – Limited Service | | Massillon | | OH | | | | | | 511 | | | 733 | | | - | | | - | | | 511 | | | 733 | | | 1,244 | | | (117) | | 1996 | | 05/17/2016 |
Restaurants – Limited Service | | North Canton | | OH | | | | | | 584 | | | 799 | | | - | | | - | | | 584 | | | 799 | | | 1,383 | | | (128) | | 2003 | | 05/17/2016 |
Restaurants – Limited Service | | Seven Hills | | OH | | | | | | 780 | | | 374 | | | - | | | - | | | 780 | | | 374 | | | 1,154 | | | (73) | | 2001 | | 05/17/2016 |
Restaurants – Limited Service | | Stow | | OH | | | | | | 718 | | | 725 | | | - | | | - | | | 718 | | | 725 | | | 1,443 | | | (104) | | 1987 | | 05/17/2016 |
Radio and Television Broadcasting | | Honolulu | | HI | | | | | | 392 | | | 11,391 | | | - | | | - | | | 392 | | | 11,391 | | | 11,783 | | | (739) | | 1998 | | 05/19/2016 |
Automotive Repair and Maintenance | | Peru | | IL | | | | | | 251 | | | 360 | | | - | | | - | | | 251 | | | 360 | | | 611 | | | (46) | | 1996 | | 05/26/2016 |
Automotive Repair and Maintenance | | Princeton | | IL | | | | | | 89 | | | 482 | | | - | | | - | | | 89 | | | 482 | | | 571 | | | (69) | | 1993 | | 05/26/2016 |
Plastics Product Manufacturing | | Greenville | | SC | | | | | | 958 | | | 3,146 | | | - | | | - | | | 958 | | | 3,146 | | | 4,104 | | | (354) | | 1965 | | 05/27/2016 |
Plastics Product Manufacturing | | Travelers Rest | | SC | | | | | | 919 | | | 5,883 | | | - | | | - | | | 919 | | | 5,883 | | | 6,802 | | | (852) | | 1981 | | 05/27/2016 |
Child Day Care Services | | Andover | | MA | | | | | | 1,500 | | | 5,423 | | | - | | | - | | | 1,500 | | | 5,423 | | | 6,923 | | | (566) | | 1930 | | 05/31/2016 |
Child Day Care Services | | Beverly | | MA | | | | | | 1,520 | | | 5,003 | | | - | | | - | | | 1,520 | | | 5,003 | | | 6,523 | | | (518) | | 2009 | | 05/31/2016 |
Child Day Care Services | | Hopkinton | | MA | | | | | | 2,438 | | | 7,089 | | | - | | | - | | | 2,438 | | | 7,089 | | | 9,527 | | | (861) | | 2004 | | 05/31/2016 |
Child Day Care Services | | Marlborough | | MA | | | | | | 1,038 | | | 3,683 | | | - | | | - | | | 1,038 | | | 3,683 | | | 4,721 | | | (387) | | 1996 | | 05/31/2016 |
Lumber and Other Construction Materials Merchant Wholesalers | | Naples | | FL | | | | | | 2,154 | | | 3,343 | | | - | | | - | | | 2,154 | | | 3,343 | | | 5,497 | | | (404) | | 2002 | | 06/01/2016 |
Lumber and Other Construction Materials Merchant Wholesalers | | North Fort Myers | | FL | | | | | | 5,501 | | | 15,647 | | | - | | | - | | | 5,501 | | | 15,647 | | | 21,148 | | | (1,834) | | 1983 | | 06/01/2016 |
Lumber and Other Construction Materials Merchant Wholesalers | | North Port | | FL | | | | | | 1,249 | | | 3,247 | | | - | | | - | | | 1,249 | | | 3,247 | | | 4,496 | | | (395) | | 2000 | | 06/01/2016 |
Other Personal Services | | Pompano Beach | | FL | | | (f) | | | 788 | | | 969 | | | 2,346 | | | 2,105 | | | 3,134 | | | 3,074 | | | 6,208 | | | (287) | | 1968 | | 06/01/2016 |
Elementary and Secondary Schools | | Sunnyvale | | CA | | | | | | 10,265 | | | 3,811 | | | 42 | | | 4,459 | | | 10,307 | | | 8,270 | | | 18,577 | | | (1,039) | | 1956 | | 06/02/2016 |
Restaurants – Limited Service | | Abingdon | | VA | | | (f) | | | 321 | | | 96 | | | 106 | | | 585 | | | 427 | | | 681 | | | 1,108 | | | (60) | | 1977 | | 06/02/2016 |
Restaurants – Limited Service | | Spring Hill | | TN | | | | | | 455 | | | 91 | | | 441 | | | 450 | | | 896 | | | 541 | | | 1,437 | | | (103) | | 2016 | | 06/03/2016 |
Child Day Care Services | | Sudbury | | MA | | | | | | 2,291 | | | 6,093 | | | - | | | - | | | 2,291 | | | 6,093 | | | 8,384 | | | (681) | | 1911 | | 06/07/2016 |
Child Day Care Services | | Walpole | | MA | | | | | | 2,430 | | | 7,847 | | | - | | | - | | | 2,430 | | | 7,847 | | | 10,277 | | | (671) | | 2008 | | 06/07/2016 |
Child Day Care Services | | Westford | | MA | | | | | | 1,179 | | | 6,153 | | | - | | | - | | | 1,179 | | | 6,153 | | | 7,332 | | | (624) | | 1996 | | 06/07/2016 |
Furniture Stores | | San Antonio | | TX | | | (f) | | | 1,190 | | | 3,501 | | | - | | | - | | | 1,190 | | | 3,501 | | | 4,691 | | | (243) | | 1993 | | 06/16/2016 |
Automotive Repair and Maintenance | | Maplewood | | MN | | | | | | 254 | | | 224 | | | 35 | | | 37 | | | 289 | | | 261 | | | 550 | | | (48) | | 1962 | | 06/17/2016 |
Automotive Repair and Maintenance | | Minneapolis | | MN | | | | | | 282 | | | 821 | | | 17 | | | 72 | | | 299 | | | 893 | | | 1,192 | | | (123) | | 1954 | | 06/17/2016 |
Child Day Care Services | | Douglasville | | GA | | | | | | 638 | | | 1,563 | | | - | | | - | | | 638 | | | 1,563 | | | 2,201 | | | (140) | | 2008 | | 06/27/2016 |
| | | | | | | | | | | | | | | | | | | | | | | | | | | | | | | | | | | |
Descriptions (a) | | | | Initial Cost to Company | | Costs Capitalized Subsequent to Acquisition | | Gross amount at December 31, 2018 (b) (c) | | | | | | |
Tenant Industry | | City | | St | | Encumbrances | | Land &
Improvements | | Building &
Improvements | | Land &
Improvements | | Building &
Improvements | | Land &
Improvements | | Building &
Improvements | | Total | | Accumulated
Depreciation (d) (e) | | Year
Constructed | | Date Acquired |
Restaurants – Full Service | | Nashville | | TN | | | (f) | | | 1,974 | | | - | | | 145 | | | 2,038 | | | 2,119 | | | 2,038 | | | 4,157 | | | (66) | | 2017 | | 06/30/2016 |
Spring and Wire Product Manufacturing | | Houston | | TX | | | | | | 4,401 | | | 5,028 | | | - | | | - | | | 4,401 | | | 5,028 | | | 9,429 | | | (479) | | 1972 | | 06/30/2016 |
Other Professional, Scientific, and Technical Services | | Glendale | | WI | | | (f) | | | 313 | | | 710 | | | - | | | - | | | 313 | | | 710 | | | 1,023 | | | (96) | | 1974 | | 06/30/2016 |
Child Day Care Services | | Novi | | MI | | | | | | 959 | | | 90 | | | 1,204 | | | 2,711 | | | 2,163 | | | 2,801 | | | 4,964 | | | (263) | | 2017 | | 07/01/2016 |
Health Clubs | | Katy | | TX | | | | | | 1,065 | | | 468 | | | 1,382 | | | 5,151 | | | 2,447 | | | 5,619 | | | 8,066 | | | (330) | | 2017 | | 07/11/2016 |
Restaurants – Full Service | | Sioux City | | IA | | | | | | 369 | | | 2,169 | | | - | | | - | | | 369 | | | 2,169 | | | 2,538 | | | (200) | | 1994 | | 07/15/2016 |
Foundation, Structure, and Building Exterior Contractors | | Bangor | | ME | | | (f) | | | 273 | | | 614 | | | 82 | | | 163 | | | 355 | | | 777 | | | 1,132 | | | (120) | | 1979 | | 07/15/2016 |
Restaurants – Full Service | | Rapid City | | SD | | | | | | 887 | | | 1,652 | | | - | | | - | | | 887 | | | 1,652 | | | 2,539 | | | (179) | | 1996 | | 07/15/2016 |
Restaurants – Full Service | | Sioux Falls | | SD | | | | | | 518 | | | 2,550 | | | - | | | - | | | 518 | | | 2,550 | | | 3,068 | | | (243) | | 2001 | | 07/15/2016 |
Restaurants – Full Service | | Spearfish | | SD | | | | | | 790 | | | 1,447 | | | - | | | - | | | 790 | | | 1,447 | | | 2,237 | | | (157) | | 2000 | | 07/15/2016 |
Restaurants – Full Service | | Watertown | | SD | | | | | | 700 | | | 2,327 | | | - | | | - | | | 700 | | | 2,327 | | | 3,027 | | | (233) | | 2005 | | 07/15/2016 |
Resin, Synthetic Rubber, and Artificial Synthetic Fibers and Filaments Manufacturing | | Philmont | | NY | | | (f) | | | 887 | | | 3,434 | | | - | | | - | | | 887 | | | 3,434 | | | 4,321 | | | (461) | | 1963 | | 07/21/2016 |
Bowling Centers | | Seattle | | WA | | | | | | 1,726 | | | 1,082 | | | - | | | 338 | | | 1,726 | | | 1,420 | | | 3,146 | | | (152) | | 1957 | | 07/26/2016 |
Other Personal Services | | Ann Arbor | | MI | | | (f) | | | 719 | | | 899 | | | - | | | - | | | 719 | | | 899 | | | 1,618 | | | (134) | | 1986 | | 07/27/2016 |
Outpatient Care Centers | | Newton | | AL | | | | | | 102 | | | 349 | | | - | | | - | | | 102 | | | 349 | | | 451 | | | (32) | | 1980 | | 07/28/2016 |
Outpatient Care Centers | | Oxford | | AL | | | | | | 132 | | | 1,140 | | | - | | | - | | | 132 | | | 1,140 | | | 1,272 | | | (71) | | 1950 | | 07/28/2016 |
Outpatient Care Centers | | Waco | | TX | | | | | | 68 | | | 223 | | | - | | | - | | | 68 | | | 223 | | | 291 | | | (28) | | 1976 | | 07/28/2016 |
Health Clubs | | Florence | | KY | | | | | | 286 | | | - | | | 293 | | | 2,124 | | | 579 | | | 2,124 | | | 2,703 | | | (115) | | 2017 | | 07/29/2016 |
Other Personal Services | | Phoenix | | AZ | | | | | | 573 | | | 1,121 | | | - | | | - | | | 573 | | | 1,121 | | | 1,694 | | | (85) | | 2008 | | 08/02/2016 |
Other Personal Services | | Jacksonville | | FL | | | | | | 415 | | | 3,236 | | | 78 | | | 322 | | | 493 | | | 3,558 | | | 4,051 | | | (673) | | 2004 | | 08/02/2016 |
Other Personal Services | | Newberry | | FL | | | | | | 999 | | | 1,372 | | | - | | | - | | | 999 | | | 1,372 | | | 2,371 | | | (166) | | 2008 | | 08/02/2016 |
Other Personal Services | | Ormond Beach | | FL | | | | | | 404 | | | 1,274 | | | - | | | - | | | 404 | | | 1,274 | | | 1,678 | | | (113) | | 2006 | | 08/02/2016 |
Other Personal Services | | Riviera Beach | | FL | | | | | | 934 | | | 2,037 | | | - | | | - | | | 934 | | | 2,037 | | | 2,971 | | | (200) | | 1987 | | 08/02/2016 |
Other Personal Services | | Sanford | | FL | | | | | | 1,165 | | | 667 | | | - | | | - | | | 1,165 | | | 667 | | | 1,832 | | | (88) | | 2007 | | 08/02/2016 |
Other Personal Services | | Kenner | | LA | | | | | | 650 | | | 1,603 | | | - | | | - | | | 650 | | | 1,603 | | | 2,253 | | | (158) | | 1968 | | 08/02/2016 |
Other Personal Services | | Huntersville | | NC | | | | | | 1,070 | | | 732 | | | - | | | - | | | 1,070 | | | 732 | | | 1,802 | | | (144) | | 2001 | | 08/02/2016 |
Other Personal Services | | Matthews | | NC | | | | | | 440 | | | 1,162 | | | - | | | - | | | 440 | | | 1,162 | | | 1,602 | | | (111) | | 1992 | | 08/02/2016 |
Other Personal Services | | Houston | | TX | | | | | | 1,412 | | | 3,100 | | | - | | | - | | | 1,412 | | | 3,100 | | | 4,512 | | | (266) | | 2008 | | 08/02/2016 |
Other Personal Services | | Humble | | TX | | | | | | 936 | | | 1,746 | | | - | | | - | | | 936 | | | 1,746 | | | 2,682 | | | (178) | | 2009 | | 08/02/2016 |
Other Personal Services | | Irving | | TX | | | | | | 383 | | | 2,349 | | | - | | | - | | | 383 | | | 2,349 | | | 2,732 | | | (165) | | 2005 | | 08/02/2016 |
Other Personal Services | | Albuquerque | | NM | | | (f) | | | 764 | | | 1,010 | | | - | | | - | | | 764 | | | 1,010 | | | 1,774 | | | (106) | | 1996 | | 08/09/2016 |
Other Personal Services | | Los Ranchos de Albuquerque | | NM | | | (f) | | | 1,107 | | | 768 | | | - | | | - | | | 1,107 | | | 768 | | | 1,875 | | | (111) | | 1955 | | 08/09/2016 |
Health Clubs | | Little Rock | | AR | | | | | | 1,867 | | | 1,330 | | | - | | | 83 | | | 1,867 | | | 1,413 | | | 3,280 | | | (125) | | 2008 | | 08/12/2016 |
Health Clubs | | Chattanooga | | TN | | | | | | 962 | | | 883 | | | - | | | 81 | | | 962 | | | 964 | | | 1,926 | | | (131) | | 2007 | | 08/12/2016 |
Other Professional, Scientific, and Technical Services | | Columbus | | GA | | | (f) | | | 192 | | | 431 | | | - | | | - | | | 192 | | | 431 | | | 623 | | | (58) | | 1975 | | 08/19/2016 |
Restaurants – Full Service | | Gastonia | | NC | | | (f) | | | 1,408 | | | - | | | 352 | | | 1,282 | | | 1,760 | | | 1,282 | | | 3,042 | | | (99) | | 2017 | | 08/22/2016 |
Automotive Repair and Maintenance | | Channahon | | IL | | | | | | 446 | | | 630 | | | - | | | - | | | 446 | | | 630 | | | 1,076 | | | - | | 2018 | | 08/25/2016 |
Car Dealers | | Orlando | | FL | | | | | | 4,389 | | | 4,933 | | | 144 | | | 473 | | | 4,533 | | | 5,406 | | | 9,939 | | | (610) | | 1990 | | 08/26/2016 |
Other Professional, Scientific, and Technical Services | | Horn Lake | | MS | | | | | | 200 | | | 673 | | | - | | | - | | | 200 | | | 673 | | | 873 | | | (58) | | 1997 | | 08/26/2016 |
Foundation, Structure, and Building Exterior Contractors | | Rotterdam | | NY | | | (f) | | | 244 | | | 417 | | | - | | | 32 | | | 244 | | | 449 | | | 693 | | | (59) | | 2002 | | 08/26/2016 |
Restaurants – Limited Service | | Benton | | KY | | | | | | 341 | | | 574 | | | - | | | - | | | 341 | | | 574 | | | 915 | | | (62) | | 2014 | | 08/30/2016 |
Restaurants – Limited Service | | Jackson | | OH | | | | | | 521 | | | 394 | | | - | | | - | | | 521 | | | 394 | | | 915 | | | (40) | | 1994 | | 08/30/2016 |
Restaurants – Limited Service | | Nelsonville | | OH | | | | | | 382 | | | 563 | | | - | | | - | | | 382 | | | 563 | | | 945 | | | (69) | | 1994 | | 08/30/2016 |
Restaurants – Limited Service | | Portsmouth | | OH | | | | | | 377 | | | 607 | | | - | | | - | | | 377 | | | 607 | | | 984 | | | (62) | | 1998 | | 08/30/2016 |
Restaurants – Limited Service | | Barboursville | | WV | | | | | | 389 | | | 654 | | | - | | | - | | | 389 | | | 654 | | | 1,043 | | | (68) | | 1994 | | 08/30/2016 |
Restaurants – Limited Service | | Parkersburg | | WV | | | | | | 366 | | | 698 | | | - | | | - | | | 366 | | | 698 | | | 1,064 | | | (71) | | 2007 | | 08/30/2016 |
Residential Intellectual and Developmental Disability, Mental Health, and Substance Abuse Facilities | | Dripping Springs | | TX | | | | | | 3,346 | | | 4,063 | | | - | | | - | | | 3,346 | | | 4,063 | | | 7,409 | | | (649) | | 1981 | | 09/02/2016 |
Lumber and Other Construction Materials Merchant Wholesalers | | Big Lake | | MN | | | | | | 752 | | | 492 | | | - | | | - | | | 752 | | | 492 | | | 1,244 | | | (105) | | 1999 | | 09/14/2016 |
| | | | | | | | | | | | | | | | | | | | | | | | | | | | | | | | | | | |
Descriptions (a) | | | | Initial Cost to Company | | Costs Capitalized Subsequent to Acquisition | | Gross amount at December 31, 2018 (b) (c) | | | | | | |
Tenant Industry | | City | | St | | Encumbrances | | Land &
Improvements | | Building &
Improvements | | Land &
Improvements | | Building &
Improvements | | Land &
Improvements | | Building &
Improvements | | Total | | Accumulated
Depreciation (d) (e) | | Year
Constructed | | Date Acquired |
Lumber and Other Construction Materials Merchant Wholesalers | | Hastings | | MN | | | | | | 798 | | | 1,038 | | | - | | | - | | | 798 | | | 1,038 | | | 1,836 | | | (169) | | 1986 | | 09/14/2016 |
Lumber and Other Construction Materials Merchant Wholesalers | | Kasson | | MN | | | | | | 367 | | | 1,249 | | | - | | | - | | | 367 | | | 1,249 | | | 1,616 | | | (179) | | 1981 | | 09/14/2016 |
Lumber and Other Construction Materials Merchant Wholesalers | | Red Wing | | MN | | | | | | 568 | | | 526 | | | - | | | - | | | 568 | | | 526 | | | 1,094 | | | (104) | | 2002 | | 09/14/2016 |
Lumber and Other Construction Materials Merchant Wholesalers | | Stillwater | | MN | | | | | | 207 | | | 45 | | | - | | | - | | | 207 | | | 45 | | | 252 | | | (12) | | 1959 | | 09/14/2016 |
Lumber and Other Construction Materials Merchant Wholesalers | | Amery | | WI | | | | | | 230 | | | 342 | | | - | | | - | | | 230 | | | 342 | | | 572 | | | (51) | | 1998 | | 09/14/2016 |
Lumber and Other Construction Materials Merchant Wholesalers | | Chippewa Falls | | WI | | | | | | 331 | | | 1,322 | | | - | | | - | | | 331 | | | 1,322 | | | 1,653 | | | (132) | | 2006 | | 09/14/2016 |
Lumber and Other Construction Materials Merchant Wholesalers | | Hayward | | WI | | | | | | 589 | | | 594 | | | - | | | - | | | 589 | | | 594 | | | 1,183 | | | (97) | | 1970 | | 09/14/2016 |
Lumber and Other Construction Materials Merchant Wholesalers | | Milltown | | WI | | | | | | 372 | | | 300 | | | - | | | - | | | 372 | | | 300 | | | 672 | | | (59) | | 2001 | | 09/14/2016 |
Lumber and Other Construction Materials Merchant Wholesalers | | Rice Lake | | WI | | | | | | 419 | | | 463 | | | - | | | - | | | 419 | | | 463 | | | 882 | | | (71) | | 1982 | | 09/14/2016 |
Lumber and Other Construction Materials Merchant Wholesalers | | River Falls | | WI | | | | | | 817 | | | 1,146 | | | - | | | - | | | 817 | | | 1,146 | | | 1,963 | | | (203) | | 1978 | | 09/14/2016 |
Lumber and Other Construction Materials Merchant Wholesalers | | Siren | | WI | | | | | | 384 | | | 568 | | | - | | | - | | | 384 | | | 568 | | | 952 | | | (93) | | 2001 | | 09/14/2016 |
Lumber and Other Construction Materials Merchant Wholesalers | | Spooner | | WI | | | | | | 177 | | | 485 | | | - | | | - | | | 177 | | | 485 | | | 662 | | | (64) | | 1970 | | 09/14/2016 |
Restaurants – Full Service | | McDonough | | GA | | | (f) | | | 1,814 | | | 235 | | | 761 | | | 1,731 | | | 2,575 | | | 1,966 | | | 4,541 | | | (157) | | 2017 | | 09/16/2016 |
Restaurants – Limited Service | | Carlisle | | PA | | | (f) | | | 668 | | | - | | | 440 | | | 530 | | | 1,108 | | | 530 | | | 1,638 | | | (70) | | 2017 | | 09/20/2016 |
Restaurants – Full Service | | Troy | | NY | | | | | | 1,695 | | | 4,540 | | | - | | | - | | | 1,695 | | | 4,540 | | | 6,235 | | | (324) | | 1989 | | 09/26/2016 |
Other Professional, Scientific, and Technical Services | | Carmel | | IN | | | | | | 400 | | | 1,082 | | | - | | | - | | | 400 | | | 1,082 | | | 1,482 | | | (94) | | 1975 | | 09/27/2016 |
Medical Equipment and Supplies Manufacturing | | Warsaw | | IN | | | | | | 1,603 | | | 2,186 | | | - | | | - | | | 1,603 | | | 2,186 | | | 3,789 | | | (309) | | 1954 | | 09/28/2016 |
Restaurants – Full Service | | Minneapolis | | MN | | | | | | 2,614 | | | 3,424 | | | - | | | - | | | 2,614 | | | 3,424 | | | 6,038 | | | (198) | | 1956 | | 09/28/2016 |
Medical Equipment and Supplies Manufacturing | | Kenosha | | WI | | | | | | 1,456 | | | 2,774 | | | - | | | - | | | 1,456 | | | 2,774 | | | 4,230 | | | (284) | | 2001 | | 09/28/2016 |
Health Clubs | | Fresno | | CA | | | (f) | | | 681 | | | 1,796 | | | 50 | | | 251 | | | 731 | | | 2,047 | | | 2,778 | | | (166) | | 1978 | | 09/30/2016 |
Child Day Care Services | | Aurora | | IL | | | | | | 332 | | | 1,228 | | | - | | | - | | | 332 | | | 1,228 | | | 1,560 | | | (162) | | 1999 | | 09/30/2016 |
Child Day Care Services | | Naperville | | IL | | | | | | 488 | | | 1,121 | | | - | | | - | | | 488 | | | 1,121 | | | 1,609 | | | (154) | | 1999 | | 09/30/2016 |
Child Day Care Services | | Oswego | | IL | | | | | | 374 | | | 1,155 | | | - | | | - | | | 374 | | | 1,155 | | | 1,529 | | | (116) | | 2007 | | 09/30/2016 |
Other Professional, Scientific, and Technical Services | | Winston-Salem | | NC | | | (f) | | | 463 | | | 712 | | | - | | | - | | | 463 | | | 712 | | | 1,175 | | | (97) | | 1966 | | 09/30/2016 |
Metalworking Machinery Manufacturing | | Mineral Ridge | | OH | | | | | | 392 | | | 270 | | | - | | | - | | | 392 | | | 270 | | | 662 | | | (36) | | 2001 | | 09/30/2016 |
Other Chemical Product and Preparation Manufacturing | | Fountain Inn | | SC | | | | | | 612 | | | 4,113 | | | - | | | - | | | 612 | | | 4,113 | | | 4,725 | | | (350) | | 1995 | | 09/30/2016 |
Steel Product Manufacturing from Purchased Steel | | Bristol | | TN | | | | | | 1,698 | | | 5,746 | | | - | | | - | | | 1,698 | | | 5,746 | | | 7,444 | | | (470) | | 1965 | | 09/30/2016 |
Other Chemical Product and Preparation Manufacturing | | Cleveland | | TN | | | | | | 490 | | | 3,861 | | | - | | | - | | | 490 | | | 3,861 | | | 4,351 | | | (299) | | 1977 | | 09/30/2016 |
Boiler, Tank, and Shipping Container Manufacturing | | Andrews | | TX | | | | | | 2,098 | | | 1,545 | | | - | | | - | | | 2,098 | | | 1,545 | | | 3,643 | | | (172) | | 1998 | | 09/30/2016 |
Metalworking Machinery Manufacturing | | Houston | | TX | | | | | | 1,222 | | | 171 | | | - | | | - | | | 1,222 | | | 171 | | | 1,393 | | | (31) | | 1965 | | 09/30/2016 |
Dairy Product Manufacturing | | Colby | | WI | | | | | | 769 | | | 14,530 | | | - | | | 9,363 | | | 769 | | | 23,893 | | | 24,662 | | | (1,171) | | 1976 | | 09/30/2016 |
Dairy Product Manufacturing | | Unity | | WI | | | | | | 272 | | | 2,100 | | | - | | | - | | | 272 | | | 2,100 | | | 2,372 | | | (189) | | 1990 | | 09/30/2016 |
Movie Theaters | | Clinton Township | | MI | | | (f) | | | 2,119 | | | 4,674 | | | - | | | 3,710 | | | 2,119 | | | 8,384 | | | 10,503 | | | (923) | | 1989 | | 10/07/2016 |
Metalworking Machinery Manufacturing | | Statesboro | | GA | | | | | | 217 | | | 309 | | | - | | | 273 | | | 217 | | | 582 | | | 799 | | | (45) | | 2000 | | 10/14/2016 |
Metalworking Machinery Manufacturing | | Macomb | | MI | | | | | | 656 | | | 5,967 | | | - | | | 741 | | | 656 | | | 6,708 | | | 7,364 | | | (385) | | 1999 | | 10/14/2016 |
Metalworking Machinery Manufacturing | | Washington | | MO | | | | | | 892 | | | 2,758 | | | - | | | - | | | 892 | | | 2,758 | | | 3,650 | | | (297) | | 1994 | | 10/14/2016 |
Metalworking Machinery Manufacturing | | Washington | | MO | | | | | | 726 | | | 1,490 | | | - | | | - | | | 726 | | | 1,490 | | | 2,216 | | | (181) | | 1999 | | 10/14/2016 |
Metalworking Machinery Manufacturing | | Fort Loramie | | OH | | | | | | 490 | | | 2,476 | | | - | | | - | | | 490 | | | 2,476 | | | 2,966 | | | (183) | | 1992 | | 10/14/2016 |
Plastics Product Manufacturing | | Perrysville | | OH | | | | | | 4,176 | | | 10,092 | | | - | | | - | | | 4,176 | | | 10,092 | | | 14,268 | | | (1,075) | | 1995 | | 10/18/2016 |
Plastics Product Manufacturing | | Streetsboro | | OH | | | | | | 4,515 | | | 14,239 | | | - | | | - | | | 4,515 | | | 14,239 | | | 18,754 | | | (1,524) | | 1993 | | 10/18/2016 |
Health Clubs | | Mission | | TX | | | (f) | | | 618 | | | 283 | | | 460 | | | 1,686 | | | 1,078 | | | 1,969 | | | 3,047 | | | (73) | | 2018 | | 10/18/2016 |
Other Professional, Scientific, and Technical Services | | Thiensville | | WI | | | (f) | | | 216 | | | 584 | | | - | | | - | | | 216 | | | 584 | | | 800 | | | (74) | | 1964 | | 10/21/2016 |
Offices of Physicians | | Little Rock | | AR | | | | | | 850 | | | 3,564 | | | - | | | - | | | 850 | | | 3,564 | | | 4,414 | | | (222) | | 1989 | | 10/26/2016 |
Restaurants – Full Service | | Brooklyn Park | | MN | | | | | | 905 | | | 1,216 | | | - | | | - | | | 905 | | | 1,216 | | | 2,121 | | | (118) | | 1988 | | 10/27/2016 |
Psychiatric and Substance Abuse Hospitals | | Columbus | | OH | | | | | | 1,517 | | | 14,502 | | | - | | | - | | | 1,517 | | | 14,502 | | | 16,019 | | | (861) | | 2007 | | 10/27/2016 |
Lumber and Other Construction Materials Merchant Wholesalers | | Glencoe | | MN | | | | | | 205 | | | 537 | | | - | | | - | | | 205 | | | 537 | | | 742 | | | (72) | | 1961 | | 10/28/2016 |
Lumber and Other Construction Materials Merchant Wholesalers | | Watertown | | MN | | | | | | 500 | | | 763 | | | - | | | - | | | 500 | | | 763 | | | 1,263 | | | (88) | | 1997 | | 10/28/2016 |
Furniture Stores | | Prattville | | AL | | | | | | 1,416 | | | 4,557 | | | - | | | - | | | 1,416 | | | 4,557 | | | 5,973 | | | (270) | | 1996 | | 10/31/2016 |
Other Personal Services | | Thonotosassa | | FL | | | (f) | | | 575 | | | 1,708 | | | - | | | - | | | 575 | | | 1,708 | | | 2,283 | | | (128) | | 2009 | | 11/03/2016 |
Apparel Manufacturing | | Conover | | NC | | | | | | 251 | | | 2,716 | | | - | | | - | | | 251 | | | 2,716 | | | 2,967 | | | (206) | | 1973 | | 11/07/2016 |
| | | | | | | | | | | | | | | | | | | | | | | | | | | | | | | | | | | |
Descriptions (a) | | | | Initial Cost to Company | | Costs Capitalized Subsequent to Acquisition | | Gross amount at December 31, 2018 (b) (c) | | | | | | |
Tenant Industry | | City | | St | | Encumbrances | | Land & Improvements | | Building & Improvements | | Land & Improvements | | Building & Improvements | | Land & Improvements | | Building & Improvements | | Total | | Accumulated
Depreciation (d) (e) | | Year
Constructed | | Date Acquired |
Apparel Manufacturing | | Newton | | NC | | | | | | 445 | | | 1,765 | | | - | | | 174 | | | 445 | | | 1,939 | | | 2,384 | | | (153) | | 1982 | | 11/07/2016 |
Wholesale Automobile Auction | | Houston | | TX | | | (f) | | | 6,981 | | | 6,294 | | | 5,912 | | | 126 | | | 12,893 | | | 6,420 | | | 19,313 | | | (1,029) | | 2015 | | 11/07/2016 |
Furniture Stores | | Rogers | | AR | | | | | | 3,546 | | | 3,094 | | | - | | | - | | | 3,546 | | | 3,094 | | | 6,640 | | | (229) | | 2005 | | 11/09/2016 |
Furniture Stores | | Terre Haute | | IN | | | | | | 1,991 | | | 3,168 | | | - | | | - | | | 1,991 | | | 3,168 | | | 5,159 | | | (232) | | 2013 | | 11/09/2016 |
Furniture Stores | | Springfield | | MO | | | | | | 2,591 | | | 4,105 | | | - | | | - | | | 2,591 | | | 4,105 | | | 6,696 | | | (229) | | 2005 | | 11/09/2016 |
Furniture Stores | | Springfield | | MO | | | | | | 715 | | | 1,919 | | | - | | | - | | | 715 | | | 1,919 | | | 2,634 | | | (142) | | 2013 | | 11/09/2016 |
Restaurants – Limited Service | | Lexington | | KY | | | (f) | | | 569 | | | 232 | | | - | | | - | | | 569 | | | 232 | | | 801 | | | (24) | | 1980 | | 11/14/2016 |
Restaurants – Limited Service | | Lexington | | KY | | | (f) | | | 314 | | | 266 | | | - | | | - | | | 314 | | | 266 | | | 580 | | | (30) | | 1980 | | 11/14/2016 |
Restaurants – Limited Service | | Lexington | | KY | | | (f) | | | 338 | | | 393 | | | - | | | - | | | 338 | | | 393 | | | 731 | | | (42) | | 1986 | | 11/14/2016 |
Restaurants – Limited Service | | Middletown | | KY | | | (f) | | | 391 | | | 380 | | | - | | | - | | | 391 | | | 380 | | | 771 | | | (39) | | 1997 | | 11/14/2016 |
Restaurants – Limited Service | | Nicholasville | | KY | | | (f) | | | 269 | | | 241 | | | - | | | - | | | 269 | | | 241 | | | 510 | | | (29) | | 1992 | | 11/14/2016 |
Restaurants – Limited Service | | Pikeville | | KY | | | (f) | | | 321 | | | 300 | | | - | | | - | | | 321 | | | 300 | | | 621 | | | (36) | | 1983 | | 11/14/2016 |
Child Day Care Services | | Queen Creek | | AZ | | | (f) | | | 527 | | | 1,581 | | | - | | | - | | | 527 | | | 1,581 | | | 2,108 | | | (98) | | 2006 | | 11/17/2016 |
Other Personal Services | | Largo | | FL | | | (f) | | | 273 | | | 549 | | | - | | | - | | | 273 | | | 549 | | | 822 | | | (52) | | 1950 | | 11/18/2016 |
Child Day Care Services | | Augusta | | GA | | | | | | 148 | | | 445 | | | - | | | - | | | 148 | | | 445 | | | 593 | | | (44) | | 1991 | | 11/18/2016 |
Car Dealers | | Indianapolis | | IN | | | | | | 1,033 | | | 1,437 | | | - | | | - | | | 1,033 | | | 1,437 | | | 2,470 | | | (146) | | 1969 | | 11/18/2016 |
Car Dealers | | Indianapolis | | IN | | | | | | 720 | | | 700 | | | - | | | - | | | 720 | | | 700 | | | 1,420 | | | (99) | | 1998 | | 11/18/2016 |
Car Dealers | | Mishawaka | | IN | | | | | | 775 | | | 470 | | | - | | | - | | | 775 | | | 470 | | | 1,245 | | | (67) | | 1999 | | 11/18/2016 |
Semiconductor and Other Electronic Component Manufacturing | | Albuquerque | | NM | | | | | | 722 | | | 3,127 | | | - | | | - | | | 722 | | | 3,127 | | | 3,849 | | | (317) | | 1999 | | 11/18/2016 |
Car Dealers | | Columbus | | OH | | | | | | 385 | | | 724 | | | - | | | - | | | 385 | | | 724 | | | 1,109 | | | (65) | | 1982 | | 11/18/2016 |
Car Dealers | | Columbus | | OH | | | | | | 1,766 | | | 2,007 | | | - | | | - | | | 1,766 | | | 2,007 | | | 3,773 | | | (227) | | 1967 | | 11/18/2016 |
Restaurants – Full Service | | San Antonio | | TX | | | | | | 1,390 | | | 211 | | | 745 | | | 1,320 | | | 2,135 | | | 1,531 | | | 3,666 | | | (132) | | 2017 | | 11/29/2016 |
Automotive Repair and Maintenance | | Chandler | | AZ | | | | | | 1,319 | | | 2,488 | | | - | | | - | | | 1,319 | | | 2,488 | | | 3,807 | | | (160) | | 2000 | | 11/30/2016 |
Automotive Repair and Maintenance | | Fountain Hills | | AZ | | | | | | 355 | | | 557 | | | - | | | - | | | 355 | | | 557 | | | 912 | | | (43) | | 2009 | | 11/30/2016 |
Automotive Repair and Maintenance | | Gilbert | | AZ | | | | | | 765 | | | 702 | | | - | | | - | | | 765 | | | 702 | | | 1,467 | | | (86) | | 1999 | | 11/30/2016 |
Automotive Repair and Maintenance | | Gilbert | | AZ | | | | | | 852 | | | 1,131 | | | - | | | - | | | 852 | | | 1,131 | | | 1,983 | | | (79) | | 2008 | | 11/30/2016 |
Automotive Repair and Maintenance | | Glendale | | AZ | | | | | | 426 | | | 704 | | | - | | | - | | | 426 | | | 704 | | | 1,130 | | | (58) | | 1976 | | 11/30/2016 |
Automotive Repair and Maintenance | | Glendale | | AZ | | | | | | 664 | | | 1,001 | | | - | | | - | | | 664 | | | 1,001 | | | 1,665 | | | (83) | | 1995 | | 11/30/2016 |
Automotive Repair and Maintenance | | Mesa | | AZ | | | | | | 706 | | | 1,208 | | | - | | | - | | | 706 | | | 1,208 | | | 1,914 | | | (99) | | 1983 | | 11/30/2016 |
Automotive Repair and Maintenance | | Mesa | | AZ | | | | | | 781 | | | 2,203 | | | - | | | - | | | 781 | | | 2,203 | | | 2,984 | | | (161) | | 1986 | | 11/30/2016 |
Automotive Repair and Maintenance | | Mesa | | AZ | | | | | | 858 | | | 976 | | | - | | | - | | | 858 | | | 976 | | | 1,834 | | | (86) | | 2004 | | 11/30/2016 |
Automotive Repair and Maintenance | | Scottsdale | | AZ | | | | | | 552 | | | 787 | | | - | | | - | | | 552 | | | 787 | | | 1,339 | | | (63) | | 1993 | | 11/30/2016 |
Automotive Repair and Maintenance | | Scottsdale | | AZ | | | | | | 893 | | | 743 | | | - | | | - | | | 893 | | | 743 | | | 1,636 | | | (64) | | 1997 | | 11/30/2016 |
Automotive Repair and Maintenance | | Sun City West | | AZ | | | | | | 452 | | | 1,134 | | | - | | | - | | | 452 | | | 1,134 | | | 1,586 | | | (84) | | 1990 | | 11/30/2016 |
Automotive Repair and Maintenance | | Tempe | | AZ | | | | | | 831 | | | 983 | | | - | | | - | | | 831 | | | 983 | | | 1,814 | | | (83) | | 1995 | | 11/30/2016 |
Automotive Repair and Maintenance | | Henderson | | NV | | | | | | 458 | | | 1,525 | | | - | | | - | | | 458 | | | 1,525 | | | 1,983 | | | (119) | | 2006 | | 11/30/2016 |
Automotive Repair and Maintenance | | Las Vegas | | NV | | | | | | 316 | | | 755 | | | - | | | - | | | 316 | | | 755 | | | 1,071 | | | (86) | | 1991 | | 11/30/2016 |
Automotive Repair and Maintenance | | Las Vegas | | NV | | | | | | 933 | | | 1,397 | | | - | | | - | | | 933 | | | 1,397 | | | 2,330 | | | (119) | | 2004 | | 11/30/2016 |
Automotive Repair and Maintenance | | North Las Vegas | | NV | | | | | | 1,044 | | | 1,107 | | | - | | | - | | | 1,044 | | | 1,107 | | | 2,151 | | | (96) | | 2005 | | 11/30/2016 |
Automotive Repair and Maintenance | | Austin | | TX | | | | | | 1,108 | | | 1,301 | | | - | | | - | | | 1,108 | | | 1,301 | | | 2,409 | | | (89) | | 2009 | | 11/30/2016 |
Automotive Repair and Maintenance | | Georgetown | | TX | | | | | | 638 | | | 502 | | | - | | | - | | | 638 | | | 502 | | | 1,140 | | | (46) | | 2008 | | 11/30/2016 |
Automotive Repair and Maintenance | | Lakeway | | TX | | | | | | 841 | | | 1,202 | | | - | | | - | | | 841 | | | 1,202 | | | 2,043 | | | (132) | | 2015 | | 11/30/2016 |
Health Clubs | | Chicago | | IL | | | | | | 7,155 | | | 4,440 | | | - | | | - | | | 7,155 | | | 4,440 | | | 11,595 | | | (350) | | 1974 | | 12/01/2016 |
Automotive Repair and Maintenance | | Jacksonville | | FL | | | (f) | | | 2,312 | | | 1,931 | | | - | | | - | | | 2,312 | | | 1,931 | | | 4,243 | | | (249) | | 2005 | | 12/06/2016 |
Automotive Repair and Maintenance | | Jacksonville | | FL | | | (f) | | | 2,100 | | | 1,392 | | | - | | | - | | | 2,100 | | | 1,392 | | | 3,492 | | | (219) | | 2008 | | 12/06/2016 |
Automotive Repair and Maintenance | | Jacksonville | | FL | | | (f) | | | 1,575 | | | 1,508 | | | - | | | - | | | 1,575 | | | 1,508 | | | 3,083 | | | (182) | | 2011 | | 12/06/2016 |
Automotive Repair and Maintenance | | Jacksonville | | FL | | | (f) | | | 1,314 | | | 1,479 | | | - | | | - | | | 1,314 | | | 1,479 | | | 2,793 | | | (188) | | 2008 | | 12/06/2016 |
Rubber Product Manufacturing | | Kaufman | | TX | | | | | | 1,119 | | | 5,897 | | | - | | | - | | | 1,119 | | | 5,897 | | | 7,016 | | | (714) | | 1973 | | 12/06/2016 |
Health Clubs | | Harlingen | | TX | | | | | | 920 | | | 391 | | | 819 | | | 2,293 | | | 1,739 | | | 2,684 | | | 4,423 | | | - | | 2018 | | 12/08/2016 |
Child Day Care Services | | Frisco | | TX | | | | | | 995 | | | 1,842 | | | - | | | - | | | 995 | | | 1,842 | | | 2,837 | | | (171) | | 2003 | | 12/09/2016 |
| | | | | | | | | | | | | | | | | | | | | | | | | | | | | | | | | | | |
Descriptions (a) | | | | Initial Cost to Company | | Costs Capitalized Subsequent to Acquisition | | Gross amount at December 31, 2018 (b) (c) | | | | | | |
Tenant Industry | | City | | St | | Encumbrances | | Land &
Improvements | | Building &
Improvements | | Land &
Improvements | | Building &
Improvements | | Land &
Improvements | | Building &
Improvements | | Total | | Accumulated
Depreciation (d) (e) | | Year
Constructed | | Date Acquired |
Restaurants – Full Service | | Dickson City | | PA | | | | | | 968 | | | 277 | | | - | | | 733 | | | 968 | | | 1,010 | | | 1,978 | | | (79) | | 2000 | | 12/12/2016 |
Paint, Coating, and Adhesive Manufacturing | | Norton | | OH | | | | | | 748 | | | 2,892 | | | - | | | - | | | 748 | | | 2,892 | | | 3,640 | | | (233) | | 1986 | | 12/16/2016 |
Paint, Coating, and Adhesive Manufacturing | | Tomball | | TX | | | | | | 1,544 | | | 1,272 | | | - | | | - | | | 1,544 | | | 1,272 | | | 2,816 | | | (184) | | 2001 | | 12/16/2016 |
Other Professional, Scientific, and Technical Services | | Phoenix | | AZ | | | (f) | | | 611 | | | 1,808 | | | - | | | - | | | 611 | | | 1,808 | | | 2,419 | | | (136) | | 1997 | | 12/22/2016 |
Consumer Goods Rental | | Cortez | | CO | | | | | | 569 | | | 1,653 | | | - | | | - | | | 569 | | | 1,653 | | | 2,222 | | | (118) | | 2014 | | 12/22/2016 |
Consumer Goods Rental | | Grand Junction | | CO | | | | | | 578 | | | 831 | | | - | | | - | | | 578 | | | 831 | | | 1,409 | | | (66) | | 2005 | | 12/22/2016 |
Farm and Ranch Supply Stores | | Monticello | | MN | | | | | | 8,998 | | | 5,920 | | | 3,642 | | | 10,165 | | | 12,640 | | | 16,085 | | | 28,725 | | | (1,007) | | 2017 | | 12/22/2016 |
Consumer Goods Rental | | Ontario | | OR | | | | | | 434 | | | 1,302 | | | - | | | - | | | 434 | | | 1,302 | | | 1,736 | | | (69) | | 2010 | | 12/22/2016 |
Other Professional, Scientific, and Technical Services | | Arlington | | TX | | | | | | 447 | | | 324 | | | - | | | - | | | 447 | | | 324 | | | 771 | | | (39) | | 1993 | | 12/22/2016 |
Other Professional, Scientific, and Technical Services | | Bedford | | TX | | | | | | 166 | | | 646 | | | - | | | - | | | 166 | | | 646 | | | 812 | | | (52) | | 1982 | | 12/22/2016 |
Other Professional, Scientific, and Technical Services | | Farmers Branch | | TX | | | | | | 118 | | | 551 | | | - | | | - | | | 118 | | | 551 | | | 669 | | | (40) | | 1965 | | 12/22/2016 |
Other Professional, Scientific, and Technical Services | | Houston | | TX | | | | | | 309 | | | 350 | | | - | | | - | | | 309 | | | 350 | | | 659 | | | (38) | | 1977 | | 12/22/2016 |
Other Professional, Scientific, and Technical Services | | Houston | | TX | | | | | | 218 | | | 148 | | | - | | | - | | | 218 | | | 148 | | | 366 | | | (17) | | 1965 | | 12/22/2016 |
Other Professional, Scientific, and Technical Services | | Humble | | TX | | | | | | 254 | | | 283 | | | - | | | - | | | 254 | | | 283 | | | 537 | | | (51) | | 1992 | | 12/22/2016 |
Other Professional, Scientific, and Technical Services | | La Porte | | TX | | | | | | 159 | | | 531 | | | - | | | - | | | 159 | | | 531 | | | 690 | | | (61) | | 2000 | | 12/22/2016 |
Other Professional, Scientific, and Technical Services | | Mansfield | | TX | | | | | | 271 | | | 430 | | | - | | | - | | | 271 | | | 430 | | | 701 | | | (65) | | 1984 | | 12/22/2016 |
Other Professional, Scientific, and Technical Services | | Spring | | TX | | | | | | 361 | | | 491 | | | - | | | - | | | 361 | | | 491 | | | 852 | | | (58) | | 1994 | | 12/22/2016 |
Other Professional, Scientific, and Technical Services | | Wylie | | TX | | | | | | 226 | | | 596 | | | - | | | - | | | 226 | | | 596 | | | 822 | | | (68) | | 1985 | | 12/22/2016 |
Consumer Goods Rental | | Vernal | | UT | | | | | | 420 | | | 1,306 | | | - | | | - | | | 420 | | | 1,306 | | | 1,726 | | | (72) | | 2007 | | 12/22/2016 |
Consumer Goods Rental | | Riverton | | WY | | | | | | 368 | | | 1,388 | | | - | | | - | | | 368 | | | 1,388 | | | 1,756 | | | (78) | | 2009 | | 12/22/2016 |
Cement and Concrete Product Manufacturing | | Jacksonville | | FL | | | | | | 4,343 | | | 3,230 | | | - | | | - | | | 4,343 | | | 3,230 | | | 7,573 | | | (660) | | 2005 | | 12/27/2016 |
Other Professional, Scientific, and Technical Services | | Inver Grove Heights | | MN | | | | | | 758 | | | 1,047 | | | - | | | - | | | 758 | | | 1,047 | | | 1,805 | | | (119) | | 1963 | | 12/30/2016 |
Outpatient Care Centers | | St. Albans | | VT | | | | | | 312 | | | 283 | | | 4 | | | 354 | | | 316 | | | 637 | | | 953 | | | (73) | | 1997 | | 12/30/2016 |
Other Professional, Scientific, and Technical Services | | Atlanta | | GA | | | | | | 376 | | | 858 | | | - | | | - | | | 376 | | | 858 | | | 1,234 | | | (61) | | 2005 | | 01/03/2017 |
Other Professional, Scientific, and Technical Services | | Murrayville | | GA | | | | | | 406 | | | 366 | | | - | | | - | | | 406 | | | 366 | | | 772 | | | (37) | | 1988 | | 01/03/2017 |
Other Professional, Scientific, and Technical Services | | Thomasville | | NC | | | (f) | | | 369 | | | 1,259 | | | - | | | - | | | 369 | | | 1,259 | | | 1,628 | | | (81) | | 2014 | | 01/05/2017 |
Other Personal Services | | Thomasville | | NC | | | (f) | | | 174 | | | 459 | | | - | | | - | | | 174 | | | 459 | | | 633 | | | (31) | | 1956 | | 01/05/2017 |
Other General Purpose Machinery Manufacturing | | Malvern | | AR | | | | | | 832 | | | 3,507 | | | 17 | | | 424 | | | 849 | | | 3,931 | | | 4,780 | | | (322) | | 1971 | | 01/06/2017 |
Other General Purpose Machinery Manufacturing | | Germantown | | WI | | | | | | 1,127 | | | 2,265 | | | 16 | | | 247 | | | 1,143 | | | 2,512 | | | 3,655 | | | (211) | | 1978 | | 01/06/2017 |
Health Clubs | | Amarillo | | TX | | | | | | 903 | | | 2,562 | | | - | | | - | | | 903 | | | 2,562 | | | 3,465 | | | (282) | | 1980 | | 01/09/2017 |
Health Clubs | | Chandler | | AZ | | | (f) | | | 1,591 | | | 413 | | | 25 | | | 4,493 | | | 1,616 | | | 4,906 | | | 6,522 | | | (71) | | 2018 | | 01/11/2017 |
Farm and Ranch Supply Stores | | Peyton | | CO | | | | | | 1,714 | | | 4,961 | | | - | | | - | | | 1,714 | | | 4,961 | | | 6,675 | | | (385) | | 2000 | | 01/17/2017 |
Medical and Diagnostic Laboratories | | Cohoes | | NY | | | | | | 663 | | | 2,031 | | | - | | | - | | | 663 | | | 2,031 | | | 2,694 | | | (152) | | 1985 | | 01/23/2017 |
Medical and Diagnostic Laboratories | | Kingston | | PA | | | | | | 510 | | | 5,348 | | | - | | | - | | | 510 | | | 5,348 | | | 5,858 | | | (277) | | 1959 | | 01/23/2017 |
Other Professional, Scientific, and Technical Services | | Englewood | | CO | | | (f) | | | 204 | | | 764 | | | - | | | - | | | 204 | | | 764 | | | 968 | | | (73) | | 1965 | | 01/27/2017 |
Lumber and Other Construction Materials Merchant Wholesalers | | Batesville | | AR | | | | | | 430 | | | 1,072 | | | - | | | - | | | 430 | | | 1,072 | | | 1,502 | | | (109) | | 1995 | | 01/31/2017 |
Lumber and Other Construction Materials Merchant Wholesalers | | Benton | | AR | | | | | | 322 | | | 719 | | | - | | | - | | | 322 | | | 719 | | | 1,041 | | | (78) | | 1977 | | 01/31/2017 |
Lumber and Other Construction Materials Merchant Wholesalers | | Cabot | | AR | | | | | | 346 | | | 1,256 | | | - | | | - | | | 346 | | | 1,256 | | | 1,602 | | | (112) | | 1980 | | 01/31/2017 |
Lumber and Other Construction Materials Merchant Wholesalers | | Conway | | AR | | | | | | 560 | | | 1,592 | | | - | | | - | | | 560 | | | 1,592 | | | 2,152 | | | (159) | | 1985 | | 01/31/2017 |
Lumber and Other Construction Materials Merchant Wholesalers | | Conway | | AR | | | | | | 52 | | | 509 | | | - | | | - | | | 52 | | | 509 | | | 561 | | | (37) | | 1993 | | 01/31/2017 |
Lumber and Other Construction Materials Merchant Wholesalers | | Fayetteville | | AR | | | | | | 502 | | | 1,831 | | | - | | | - | | | 502 | | | 1,831 | | | 2,333 | | | (157) | | 1995 | | 01/31/2017 |
Lumber and Other Construction Materials Merchant Wholesalers | | Jonesboro | | AR | | | | | | 483 | | | 1,559 | | | - | | | - | | | 483 | | | 1,559 | | | 2,042 | | | (136) | | 1988 | | 01/31/2017 |
Lumber and Other Construction Materials Merchant Wholesalers | | Little Rock | | AR | | | | | | 540 | | | 772 | | | - | | | - | | | 540 | | | 772 | | | 1,312 | | | (73) | | 1970 | | 01/31/2017 |
Lumber and Other Construction Materials Merchant Wholesalers | | Rogers | | AR | | | | | | 1,530 | | | 2,104 | | | - | | | - | | | 1,530 | | | 2,104 | | | 3,634 | | | (173) | | 1992 | | 01/31/2017 |
Lumber and Other Construction Materials Merchant Wholesalers | | Russellville | | AR | | | | | | 685 | | | 1,057 | | | - | | | - | | | 685 | | | 1,057 | | | 1,742 | | | (105) | | 1983 | | 01/31/2017 |
Lumber and Other Construction Materials Merchant Wholesalers | | Searcy | | AR | | | | | | 519 | | | 3,716 | | | - | | | - | | | 519 | | | 3,716 | | | 4,235 | | | (276) | | 1988 | | 01/31/2017 |
Lumber and Other Construction Materials Merchant Wholesalers | | Searcy | | AR | | | | | | 1,003 | | | 949 | | | - | | | - | | | 1,003 | | | 949 | | | 1,952 | | | (70) | | 1985 | | 01/31/2017 |
Lumber and Other Construction Materials Merchant Wholesalers | | Searcy | | AR | | | | | | 487 | | | 1,915 | | | - | | | - | | | 487 | | | 1,915 | | | 2,402 | | | (145) | | 1999 | | 01/31/2017 |
Restaurants – Full Service | | Altamonte Springs | | FL | | | | | | 382 | | | 1,311 | | | - | | | - | | | 382 | | | 1,311 | | | 1,693 | | | (90) | | 1994 | | 01/31/2017 |
Restaurants – Full Service | | Bradenton | | FL | | | | | | 1,238 | | | 1,153 | | | - | | | - | | | 1,238 | | | 1,153 | | | 2,391 | | | (142) | | 1960 | | 01/31/2017 |
| | | | | | | | | | | | | | | | | | | | | | | | | | | | | | | | | | | |
Descriptions (a) | | | | Initial Cost to Company | | Costs Capitalized Subsequent to Acquisition | | Gross amount at December 31, 2018 (b) (c) | | | | | | |
Tenant Industry | | City | | St | | Encumbrances | | Land &
Improvements | | Building &
Improvements | | Land &
Improvements | | Building &
Improvements | | Land &
Improvements | | Building &
Improvements | | Total | | Accumulated
Depreciation (d) (e) | | Year
Constructed | | Date Acquired |
Restaurants – Full Service | | Gainesville | | FL | | | | | | 1,076 | | | 817 | | | - | | | - | | | 1,076 | | | 817 | | | 1,893 | | | (113) | | 1992 | | 01/31/2017 |
Restaurants – Full Service | | Kissimmee | | FL | | | | | | 967 | | | 926 | | | - | | | - | | | 967 | | | 926 | | | 1,893 | | | (93) | | 2009 | | 01/31/2017 |
Restaurants – Full Service | | Lakeland | | FL | | | | | | 843 | | | 1,049 | | | - | | | - | | | 843 | | | 1,049 | | | 1,892 | | | (84) | | 1985 | | 01/31/2017 |
Restaurants – Full Service | | Largo | | FL | | | | | | 784 | | | 1,607 | | | - | | | - | | | 784 | | | 1,607 | | | 2,391 | | | (125) | | 1972 | | 01/31/2017 |
Restaurants – Full Service | | New Port Richey | | FL | | | | | | 1,022 | | | 871 | | | - | | | - | | | 1,022 | | | 871 | | | 1,893 | | | (112) | | 1973 | | 01/31/2017 |
Restaurants – Full Service | | Orlando | | FL | | | | | | 1,159 | | | 933 | | | - | | | - | | | 1,159 | | | 933 | | | 2,092 | | | (125) | | 1982 | | 01/31/2017 |
Restaurants – Full Service | | Orlando | | FL | | | | | | 1,188 | | | 804 | | | - | | | - | | | 1,188 | | | 804 | | | 1,992 | | | (104) | | 1999 | | 01/31/2017 |
Restaurants – Full Service | | Palm Harbor | | FL | | | | | | 949 | | | 844 | | | - | | | - | | | 949 | | | 844 | | | 1,793 | | | (96) | | 1983 | | 01/31/2017 |
Restaurants – Full Service | | Sanford | | FL | | | | | | 1,312 | | | 879 | | | - | | | - | | | 1,312 | | | 879 | | | 2,191 | | | (114) | | 1984 | | 01/31/2017 |
Restaurants – Full Service | | Tampa | | FL | | | | | | 913 | | | 880 | | | - | | | - | | | 913 | | | 880 | | | 1,793 | | | (114) | | 1985 | | 01/31/2017 |
Restaurants – Full Service | | Tampa | | FL | | | | | | 949 | | | 844 | | | - | | | - | | | 949 | | | 844 | | | 1,793 | | | (87) | | 1984 | | 01/31/2017 |
Restaurants – Full Service | | Wesley Chapel | | FL | | | | | | 1,322 | | | 1,168 | | | - | | | - | | | 1,322 | | | 1,168 | | | 2,490 | | | (112) | | 2007 | | 01/31/2017 |
Restaurants – Full Service | | Plymouth | | MN | | | (f) | | | 1,837 | | | 2,894 | | | - | | | - | | | 1,837 | | | 2,894 | | | 4,731 | | | (237) | | 1973 | | 01/31/2017 |
Lumber and Other Construction Materials Merchant Wholesalers | | Joplin | | MO | | | | | | 430 | | | 692 | | | - | | | - | | | 430 | | | 692 | | | 1,122 | | | (71) | | 1977 | | 01/31/2017 |
Other Professional, Scientific, and Technical Services | | Huntsville | | AL | | | | | | 290 | | | 733 | | | - | | | - | | | 290 | | | 733 | | | 1,023 | | | (50) | | 1963 | | 02/01/2017 |
Motor Vehicle Parts Manufacturing | | Tallahassee | | FL | | | | | | 1,681 | | | 6,860 | | | - | | | - | | | 1,681 | | | 6,860 | | | 8,541 | | | (584) | | 1980 | | 02/03/2017 |
Motor Vehicle Parts Manufacturing | | Defiance | | OH | | | | | | 378 | | | 1,289 | | | - | | | - | | | 378 | | | 1,289 | | | 1,667 | | | (153) | | 1985 | | 02/03/2017 |
Motor Vehicle Parts Manufacturing | | Defiance | | OH | | | | | | 662 | | | 2,960 | | | - | | | - | | | 662 | | | 2,960 | | | 3,622 | | | (347) | | 1987 | | 02/03/2017 |
Motor Vehicle Parts Manufacturing | | Toledo | | OH | | | | | | 320 | | | 2,873 | | | - | | | - | | | 320 | | | 2,873 | | | 3,193 | | | (298) | | 1983 | | 02/03/2017 |
Health Clubs | | Westborough | | MA | | | | | | 2,013 | | | 5,511 | | | - | | | - | | | 2,013 | | | 5,511 | | | 7,524 | | | (418) | | 1973 | | 02/15/2017 |
Consumer Goods Rental | | Winnemucca | | NV | | | | | | 364 | | | 749 | | | - | | | 3 | | | 364 | | | 752 | | | 1,116 | | | (74) | | 1996 | | 02/16/2017 |
Consumer Goods Rental | | Cheyenne | | WY | | | | | | 325 | | | 981 | | | - | | | 3 | | | 325 | | | 984 | | | 1,309 | | | (55) | | 2006 | | 02/16/2017 |
Architectural and Structural Metals Manufacturing | | Holland | | MI | | | | | | 1,596 | | | 6,620 | | | - | | | - | | | 1,596 | | | 6,620 | | | 8,216 | | | (510) | | 1969 | | 02/17/2017 |
Chemical and Allied Products Merchant Wholesalers | | Tallapoosa | | GA | | | (f) | | | 657 | | | 2,938 | | | - | | | - | | | 657 | | | 2,938 | | | 3,595 | | | (226) | | 1964 | | 02/23/2017 |
Chemical and Allied Products Merchant Wholesalers | | Barberton | | OH | | | (f) | | | 819 | | | 3,148 | | | - | | | - | | | 819 | | | 3,148 | | | 3,967 | | | (263) | | 1920 | | 02/23/2017 |
Chemical and Allied Products Merchant Wholesalers | | Huntingdon | | TN | | | (f) | | | 645 | | | 1,641 | | | - | | | - | | | 645 | | | 1,641 | | | 2,286 | | | (168) | | 1989 | | 02/23/2017 |
Other Professional, Scientific, and Technical Services | | Melbourne | | FL | | | | | | 314 | | | 1,720 | | | - | | | - | | | 314 | | | 1,720 | | | 2,034 | | | (89) | | 2005 | | 02/27/2017 |
Furniture Stores | | Schaumburg | | IL | | | | | | 6,062 | | | 6,226 | | | - | | | - | | | 6,062 | | | 6,226 | | | 12,288 | | | (445) | | 1996 | | 03/01/2017 |
Furniture Stores | | Woodridge | | IL | | | | | | 3,558 | | | 6,288 | | | - | | | - | | | 3,558 | | | 6,288 | | | 9,846 | | | (397) | | 2014 | | 03/01/2017 |
Furniture Stores | | Bay City | | MI | | | | | | 755 | | | 6,218 | | | - | | | - | | | 755 | | | 6,218 | | | 6,973 | | | (348) | | 1995 | | 03/01/2017 |
Furniture Stores | | Burton | | MI | | | | | | 1,564 | | | 7,900 | | | - | | | - | | | 1,564 | | | 7,900 | | | 9,464 | | | (450) | | 1987 | | 03/01/2017 |
Furniture Stores | | Howell | | MI | | | | | | 1,569 | | | 6,493 | | | - | | | - | | | 1,569 | | | 6,493 | | | 8,062 | | | (371) | | 1997 | | 03/01/2017 |
Furniture Stores | | Livonia | | MI | | | | | | 1,414 | | | 7,442 | | | - | | | - | | | 1,414 | | | 7,442 | | | 8,856 | | | (388) | | 1982 | | 03/01/2017 |
Furniture Stores | | Petoskey | | MI | | | | | | 1,961 | | | 5,983 | | | - | | | - | | | 1,961 | | | 5,983 | | | 7,944 | | | (331) | | 2008 | | 03/01/2017 |
Furniture Stores | | Port Huron | | MI | | | | | | 1,514 | | | 8,215 | | | - | | | - | | | 1,514 | | | 8,215 | | | 9,729 | | | (481) | | 2001 | | 03/01/2017 |
Furniture Stores | | Portage | | MI | | | | | | 1,601 | | | 7,657 | | | - | | | - | | | 1,601 | | | 7,657 | | | 9,258 | | | (370) | | 1983 | | 03/01/2017 |
Furniture Stores | | Royal Oak | | MI | | | | | | 613 | | | 8,390 | | | - | | | - | | | 613 | | | 8,390 | | | 9,003 | | | (519) | | 1998 | | 03/01/2017 |
Furniture Stores | | Saginaw | | MI | | | | | | 1,413 | | | 9,807 | | | - | | | - | | | 1,413 | | | 9,807 | | | 11,220 | | | (659) | | 1984 | | 03/01/2017 |
Furniture Stores | | Shelby Township | | MI | | | | | | 1,666 | | | 11,241 | | | - | | | - | | | 1,666 | | | 11,241 | | | 12,907 | | | (574) | | 1992 | | 03/01/2017 |
Furniture Stores | | Taylor | | MI | | | | | | 2,065 | | | 12,793 | | | - | | | - | | | 2,065 | | | 12,793 | | | 14,858 | | | (666) | | 1977 | | 03/01/2017 |
Furniture Stores | | Warren | | MI | | | | | | 599 | | | 6,933 | | | - | | | - | | | 599 | | | 6,933 | | | 7,532 | | | (348) | | 1962 | | 03/01/2017 |
Furniture Stores | | Waterford | | MI | | | | | | 1,129 | | | 8,364 | | | - | | | - | | | 1,129 | | | 8,364 | | | 9,493 | | | (435) | | 1972 | | 03/01/2017 |
Other Personal Services | | Lutz | | FL | | | (f) | | | 243 | | | 443 | | | - | | | - | | | 243 | | | 443 | | | 686 | | | (36) | | 2008 | | 03/02/2017 |
Psychiatric and Substance Abuse Hospitals | | Albuquerque | | NM | | | | | | 1,283 | | | 1,609 | | | 81 | | | 5,227 | | | 1,364 | | | 6,836 | | | 8,200 | | | (334) | | 1980 | | 03/02/2017 |
Offices of Dentists | | Chicago | | IL | | | | | | 164 | | | 489 | | | - | | | 480 | | | 164 | | | 969 | | | 1,133 | | | (45) | | 1964 | | 03/03/2017 |
Offices of Physicians | | Flagstaff | | AZ | | | (f) | | | 1,062 | | | 2,579 | | | - | | | - | | | 1,062 | | | 2,579 | | | 3,641 | | | (160) | | 2012 | | 03/08/2017 |
Offices of Physicians | | Globe | | AZ | | | (f) | | | 212 | | | 416 | | | - | | | - | | | 212 | | | 416 | | | 628 | | | (39) | | 2003 | | 03/08/2017 |
Offices of Physicians | | Lake Havasu City | | AZ | | | (f) | | | 840 | | | 2,552 | | | - | | | - | | | 840 | | | 2,552 | | | 3,392 | | | (177) | | 1979 | | 03/08/2017 |
| | | | | | | | | | | | | | | | | | | | | | | | | | | | | | | | | | | |
Descriptions (a) | | | | Initial Cost to Company | | Costs Capitalized Subsequent to Acquisition | | Gross amount at December 31, 2018 (b) (c) | | | | | | |
Tenant Industry | | City | | St | | Encumbrances | | Land &
Improvements | | Building &
Improvements | | Land &
Improvements | | Building &
Improvements | | Land &
Improvements | | Building &
Improvements | | Total | | Accumulated
Depreciation (d) (e) | | Year
Constructed | | Date Acquired |
Offices of Physicians | | Mesa | | AZ | | | (f) | | | 1,073 | | | 3,496 | | | - | | | - | | | 1,073 | | | 3,496 | | | 4,569 | | | (160) | | 2008 | | 03/08/2017 |
Offices of Physicians | | Phoenix | | AZ | | | (f) | | | 174 | | | 6,374 | | | - | | | - | | | 174 | | | 6,374 | | | 6,548 | | | (313) | | 1977 | | 03/08/2017 |
Offices of Physicians | | Safford | | AZ | | | (f) | | | 343 | | | 814 | | | - | | | - | | | 343 | | | 814 | | | 1,157 | | | (59) | | 1987 | | 03/08/2017 |
Offices of Physicians | | Show Low | | AZ | | | (f) | | | 413 | | | 2,131 | | | - | | | - | | | 413 | | | 2,131 | | | 2,544 | | | (114) | | 2014 | | 03/08/2017 |
Automotive Repair and Maintenance | | Bloomington | | MN | | | | | | 952 | | | 427 | | | - | | | - | | | 952 | | | 427 | | | 1,379 | | | (34) | | 2003 | | 03/13/2017 |
Aerospace Product and Parts Manufacturing | | Orange City | | IA | | | (f) | | | 1,219 | | | 3,750 | | | - | | | - | | | 1,219 | | | 3,750 | | | 4,969 | | | (236) | | 2004 | | 03/15/2017 |
Child Day Care Services | | Eden Prairie | | MN | | | | | | 1,065 | | | 1,073 | | | 5 | | | 153 | | | 1,070 | | | 1,226 | | | 2,296 | | | (99) | | 1996 | | 03/15/2017 |
Aerospace Product and Parts Manufacturing | | Auburn | | WA | | | (f) | | | 495 | | | 949 | | | - | | | - | | | 495 | | | 949 | | | 1,444 | | | (71) | | 1991 | | 03/15/2017 |
Aerospace Product and Parts Manufacturing | | Auburn | | WA | | | (f) | | | 1,059 | | | 719 | | | - | | | - | | | 1,059 | | | 719 | | | 1,778 | | | (58) | | 1985 | | 03/15/2017 |
Aerospace Product and Parts Manufacturing | | Auburn | | WA | | | (f) | | | 658 | | | 1,313 | | | - | | | - | | | 658 | | | 1,313 | | | 1,971 | | | (100) | | 1988 | | 03/15/2017 |
Chemical and Allied Products Merchant Wholesalers | | Whitewater | | WI | | | (f) | | | 495 | | | 2,230 | | | - | | | - | | | 495 | | | 2,230 | | | 2,725 | | | (160) | | 1994 | | 03/16/2017 |
Outpatient Care Centers | | Jacksonville | | FL | | | (f) | | | 796 | | | 2,212 | | | - | | | - | | | 796 | | | 2,212 | | | 3,008 | | | (124) | | 1998 | | 03/24/2017 |
Restaurants – Limited Service | | Montgomery | | AL | | | | | | 814 | | | 1,100 | | | - | | | - | | | 814 | | | 1,100 | | | 1,914 | | | (78) | | 2016 | | 03/29/2017 |
Restaurants – Limited Service | | Prattville | | AL | | | | | | 798 | | | 1,196 | | | - | | | - | | | 798 | | | 1,196 | | | 1,994 | | | (84) | | 2016 | | 03/29/2017 |
Wholesale Automobile Auction | | Parma | | MI | | | (f) | | | 1,256 | | | 716 | | | - | | | - | | | 1,256 | | | 716 | | | 1,972 | | | (174) | | 1972 | | 03/31/2017 |
Wholesale Automobile Auction | | Wayland | | MI | | | (f) | | | 6,867 | | | 8,177 | | | - | | | - | | | 6,867 | | | 8,177 | | | 15,044 | | | (1,111) | | 1998 | | 03/31/2017 |
Bowling Centers | | Yakima | | WA | | | | | | 1,104 | | | 1,612 | | | - | | | - | | | 1,104 | | | 1,612 | | | 2,716 | | | (158) | | 1966 | | 03/31/2017 |
Health Clubs | | St Paul | | MN | | | (f) | | | 560 | | | 1,468 | | | - | | | - | | | 560 | | | 1,468 | | | 2,028 | | | (91) | | 1988 | | 04/07/2017 |
Converted Paper Product Manufacturing | | El Dorado | | AR | | | | | | 916 | | | 7,440 | | | - | | | - | | | 916 | | | 7,440 | | | 8,356 | | | (689) | | 1963 | | 04/12/2017 |
Converted Paper Product Manufacturing | | Rosemount | | MN | | | | | | 2,768 | | | 5,352 | | | - | | | - | | | 2,768 | | | 5,352 | | | 8,120 | | | (550) | | 1962 | | 04/12/2017 |
Converted Paper Product Manufacturing | | Omaha | | NE | | | | | | 2,028 | | | 3,546 | | | - | | | - | | | 2,028 | | | 3,546 | | | 5,574 | | | (374) | | 1992 | | 04/12/2017 |
Child Day Care Services | | Birmingham | | AL | | | (f) | | | 873 | | | 3,150 | | | - | | | - | | | 873 | | | 3,150 | | | 4,023 | | | (159) | | 1995 | | 04/19/2017 |
Child Day Care Services | | Hoover | | AL | | | (f) | | | 972 | | | 2,568 | | | - | | | - | | | 972 | | | 2,568 | | | 3,540 | | | (137) | | 2001 | | 04/19/2017 |
Restaurants – Limited Service | | Princeton | | WV | | | | | | 915 | | | 424 | | | - | | | - | | | 915 | | | 424 | | | 1,339 | | | (74) | | 2009 | | 04/21/2017 |
Restaurants – Limited Service | | Saint Albans | | WV | | | | | | 512 | | | 457 | | | - | | | - | | | 512 | | | 457 | | | 969 | | | (49) | | 2009 | | 04/21/2017 |
Other Miscellaneous Manufacturing | | Elk Grove Village | | IL | | | | | | 703 | | | 3,541 | | | - | | | - | | | 703 | | | 3,541 | | | 4,244 | | | (206) | | 1967 | | 04/26/2017 |
Furniture Stores | | San Antonio | | TX | | | (f) | | | 1,586 | | | 23 | | | 531 | | | 1,680 | | | 2,117 | | | 1,703 | | | 3,820 | | | (75) | | 2017 | | 04/26/2017 |
Child Day Care Services | | Mesa | | AZ | | | (f) | | | 272 | | | 900 | | | - | | | - | | | 272 | | | 900 | | | 1,172 | | | (45) | | 1991 | | 04/28/2017 |
Offices of Physicians | | Galesburg | | IL | | | (f) | | | 404 | | | 860 | | | - | | | - | | | 404 | | | 860 | | | 1,264 | | | (65) | | 2003 | | 04/28/2017 |
Offices of Physicians | | Morton | | IL | | | (f) | | | 899 | | | 2,822 | | | - | | | - | | | 899 | | | 2,822 | | | 3,721 | | | (154) | | 2012 | | 04/28/2017 |
Offices of Physicians | | Normal | | IL | | | (f) | | | 585 | | | 1,191 | | | - | | | - | | | 585 | | | 1,191 | | | 1,776 | | | (73) | | 2002 | | 04/28/2017 |
Offices of Physicians | | Peoria | | IL | | | (f) | | | 2,874 | | | 9,702 | | | - | | | - | | | 2,874 | | | 9,702 | | | 12,576 | | | (502) | | 1991 | | 04/28/2017 |
Lessors of Real Estate | | Hampstead | | NH | | | | | | 802 | | | 1,370 | | | - | | | - | | | 802 | | | 1,370 | | | 2,172 | | | (145) | | 1991 | | 04/28/2017 |
Movie Theaters | | Richmond | | TX | | | | | | 2,658 | | | - | | | - | | | 6,657 | | | 2,658 | | | 6,657 | | | 9,315 | | | - | | | | 05/25/2017 |
Other Electrical Equipment and Component Manufacturing | | Colorado Springs | | CO | | | | | | 3,091 | | | 9,898 | | | 1,833 | | | 21,260 | | | 4,924 | | | 31,158 | | | 36,082 | | | (528) | | 2005 | | 05/31/2017 |
Freight Transportation Arrangement | | North Charleston | | SC | | | | | | 1,818 | | | 13,195 | | | - | | | - | | | 1,818 | | | 13,195 | | | 15,013 | | | (564) | | 2014 | | 05/31/2017 |
Elementary and Secondary Schools | | Fremont | | CA | | | | | | 8,419 | | | 691 | | | 5,306 | | | 20,171 | | | 13,725 | | | 20,862 | | | 34,587 | | | (257) | | 2018 | | 06/12/2017 |
Other Professional, Scientific, and Technical Services | | South Deerfield | | MA | | | | | | 1,135 | | | 900 | | | - | | | - | | | 1,135 | | | 900 | | | 2,035 | | | (87) | | 2006 | | 06/12/2017 |
Commercial and Industrial Machinery and Equipment Rental and Leasing | | Tampa | | FL | | | | | | 607 | | | 1,334 | | | - | | | 2 | | | 607 | | | 1,336 | | | 1,943 | | | (117) | | 1966 | | 06/27/2017 |
Commercial and Industrial Machinery and Equipment Rental and Leasing | | Arlington | | TX | | | | | | 778 | | | 1,622 | | | - | | | - | | | 778 | | | 1,622 | | | 2,400 | | | (147) | | 1964 | | 06/27/2017 |
Commercial and Industrial Machinery and Equipment Rental and Leasing | | Conroe | | TX | | | | | | 860 | | | 1,134 | | | - | | | - | | | 860 | | | 1,134 | | | 1,994 | | | (76) | | 2003 | | 06/27/2017 |
Commercial and Industrial Machinery and Equipment Rental and Leasing | | Houston | | TX | | | | | | 2,271 | | | 2,673 | | | - | | | - | | | 2,271 | | | 2,673 | | | 4,944 | | | (185) | | 2000 | | 06/27/2017 |
Commercial and Industrial Machinery and Equipment Rental and Leasing | | Longview | | TX | | | | | | 877 | | | 2,433 | | | - | | | - | | | 877 | | | 2,433 | | | 3,310 | | | (132) | | 2012 | | 06/27/2017 |
Commercial and Industrial Machinery and Equipment Rental and Leasing | | San Antonio | | TX | | | | | | 584 | | | 2,943 | | | - | | | - | | | 584 | | | 2,943 | | | 3,527 | | | (231) | | 1970 | | 06/27/2017 |
Commercial and Industrial Machinery and Equipment Rental and Leasing | | Tyler | | TX | | | | | | 1,111 | | | 1,289 | | | - | | | - | | | 1,111 | | | 1,289 | | | 2,400 | | | (105) | | 2007 | | 06/27/2017 |
Restaurants – Full Service | | Highwood | | IL | | | | | | 273 | | | 946 | | | - | | | 423 | | | 273 | | | 1,369 | | | 1,642 | | | (67) | | 2005 | | 06/29/2017 |
Restaurants – Full Service | | Wauconda | | IL | | | | | | 387 | | | 513 | | | - | | | - | | | 387 | | | 513 | | | 900 | | | (44) | | 1985 | | 06/29/2017 |
Restaurants – Full Service | | Fort Walton Beach | | FL | | | | | | 934 | | | 1,992 | | | - | | | - | | | 934 | | | 1,992 | | | 2,926 | | | (91) | | 1988 | | 06/30/2017 |
| | | | | | | | | | | | | | | | | | | | | | | | | | | | | | | | | | | |
Descriptions (a) | | | | Initial Cost to Company | | Costs Capitalized Subsequent to Acquisition | | Gross amount at December 31, 2018 (b) (c) | | | | | | |
Tenant Industry | | City | | St | | Encumbrances | | Land &
Improvements | | Building &
Improvements | | Land &
Improvements | | Building &
Improvements | | Land &
Improvements | | Building &
Improvements | | Total | | Accumulated
Depreciation (d) (e) | | Year
Constructed | | Date Acquired |
Restaurants – Full Service | | Pensacola | | FL | | | | | | 587 | | | 2,575 | | | - | | | - | | | 587 | | | 2,575 | | | 3,162 | | | (118) | | 1991 | | 06/30/2017 |
Restaurants – Full Service | | Pensacola | | FL | | | | | | 640 | | | 2,325 | | | - | | | - | | | 640 | | | 2,325 | | | 2,965 | | | (113) | | 1985 | | 06/30/2017 |
Restaurants – Full Service | | Pensacola | | FL | | | | | | 558 | | | 2,663 | | | - | | | - | | | 558 | | | 2,663 | | | 3,221 | | | (122) | | 2004 | | 06/30/2017 |
Restaurants – Full Service | | Corbin | | KY | | | | | | 642 | | | 1,419 | | | - | | | - | | | 642 | | | 1,419 | | | 2,061 | | | (88) | | 1996 | | 06/30/2017 |
Restaurants – Full Service | | Nicholasville | | KY | | | | | | 656 | | | 1,848 | | | - | | | - | | | 656 | | | 1,848 | | | 2,504 | | | (97) | | 2005 | | 06/30/2017 |
Restaurants – Full Service | | Somerset | | KY | | | | | | 1,068 | | | 2,192 | | | - | | | - | | | 1,068 | | | 2,192 | | | 3,260 | | | (147) | | 1987 | | 06/30/2017 |
Other Personal Services | | Carrollton | | TX | | | (f) | | | 1,166 | | | 630 | | | - | | | - | | | 1,166 | | | 630 | | | 1,796 | | | (54) | | 1999 | | 06/30/2017 |
Other Personal Services | | Grand Prairie | | TX | | | (f) | | | 666 | | | 849 | | | - | | | - | | | 666 | | | 849 | | | 1,515 | | | (89) | | 1986 | | 06/30/2017 |
Other Professional, Scientific, and Technical Services | | Tacoma | | WA | | | | | | 176 | | | 353 | | | - | | | - | | | 176 | | | 353 | | | 529 | | | (29) | | 1923 | | 06/30/2017 |
Other Professional, Scientific, and Technical Services | | Aiken | | SC | | | | | | 245 | | | 783 | | | - | | | - | | | 245 | | | 783 | | | 1,028 | | | (45) | | 2008 | | 07/10/2017 |
Automotive Repair and Maintenance | | Clarksville | | TN | | | (f) | | | 1,126 | | | 1,217 | | | - | | | - | | | 1,126 | | | 1,217 | | | 2,343 | | | (95) | | 2007 | | 07/11/2017 |
Automotive Repair and Maintenance | | Clarksville | | TN | | | (f) | | | 1,053 | | | 1,309 | | | - | | | - | | | 1,053 | | | 1,309 | | | 2,362 | | | (101) | | 2007 | | 07/11/2017 |
Automotive Repair and Maintenance | | Clarksville | | TN | | | (f) | | | 1,341 | | | 1,494 | | | - | | | - | | | 1,341 | | | 1,494 | | | 2,835 | | | (120) | | 2014 | | 07/11/2017 |
Offices of Physicians | | Memphis | | TN | | | | | | 623 | | | 3,102 | | | - | | | - | | | 623 | | | 3,102 | | | 3,725 | | | (163) | | 1998 | | 07/11/2017 |
Lessors of Real Estate | | Mesa | | AZ | | | | | | 619 | | | 877 | | | - | | | - | | | 619 | | | 877 | | | 1,496 | | | (88) | | 1976 | | 07/12/2017 |
Other Personal Services | | Erie | | CO | | | (f) | | | 425 | | | 294 | | | - | | | - | | | 425 | | | 294 | | | 719 | | | (38) | | 2005 | | 07/19/2017 |
Offices of Physicians | | Phoenix | | AZ | | | | | | 882 | | | 988 | | | - | | | 1,719 | | | 882 | | | 2,707 | | | 3,589 | | | (129) | | 1986 | | 07/20/2017 |
Automotive Repair and Maintenance | | Katy | | TX | | | | | | 1,463 | | | 2,516 | | | - | | | - | | | 1,463 | | | 2,516 | | | 3,979 | | | (162) | | 2016 | | 07/21/2017 |
Aerospace Product and Parts Manufacturing | | Wichita | | KS | | | | | | 1,228 | | | 4,889 | | | - | | | 2 | | | 1,228 | | | 4,891 | | | 6,119 | | | (270) | | 1971 | | 07/31/2017 |
Motor Vehicle Parts Manufacturing | | Mentor | | OH | | | | | | 723 | | | 5,926 | | | - | | | 8 | | | 723 | | | 5,934 | | | 6,657 | | | (322) | | 1970 | | 07/31/2017 |
Motor Vehicle Parts Manufacturing | | Tiffin | | OH | | | | | | 2,308 | | | 7,702 | | | - | | | - | | | 2,308 | | | 7,702 | | | 10,010 | | | (551) | | 2003 | | 08/04/2017 |
Plastics Product Manufacturing | | Northfield | | NH | | | | | | 666 | | | 3,724 | | | - | | | - | | | 666 | | | 3,724 | | | 4,390 | | | (225) | | 2001 | | 08/08/2017 |
Other Professional, Scientific, and Technical Services | | Laurel | | MD | | | | | | 4,377 | | | 1,235 | | | - | | | - | | | 4,377 | | | 1,235 | | | 5,612 | | | (91) | | 2007 | | 08/11/2017 |
Other Personal Services | | Arlington | | TX | | | | | | 343 | | | - | | | 614 | | | 2,344 | | | 957 | | | 2,344 | | | 3,301 | | | (41) | | 2018 | | 08/18/2017 |
Other Professional, Scientific, and Technical Services | | Apple Valley | | MN | | | | | | 536 | | | 346 | | | - | | | - | | | 536 | | | 346 | | | 882 | | | (30) | | 2001 | | 08/22/2017 |
Health Clubs | | Elmwood Park | | IL | | | (f) | | | 923 | | | 2,055 | | | 116 | | | 2,789 | | | 1,039 | | | 4,844 | | | 5,883 | | | (157) | | 2006 | | 08/23/2017 |
Scientific Research and Development Services | | Prescott | | WI | | | | | | 660 | | | 5,256 | | | - | | | - | | | 660 | | | 5,256 | | | 5,916 | | | (199) | | 1987 | | 08/30/2017 |
Lumber and Other Construction Materials Merchant Wholesalers | | Evansville | | IN | | | | | | 179 | | | 888 | | | - | | | - | | | 179 | | | 888 | | | 1,067 | | | (46) | | 1976 | | 08/31/2017 |
Lumber and Other Construction Materials Merchant Wholesalers | | Lexington | | KY | | | | | | 909 | | | 2,085 | | | - | | | - | | | 909 | | | 2,085 | | | 2,994 | | | (96) | | 1977 | | 08/31/2017 |
Lumber and Other Construction Materials Merchant Wholesalers | | Louisville | | KY | | | | | | 763 | | | 2,266 | | | - | | | - | | | 763 | | | 2,266 | | | 3,029 | | | (117) | | 1991 | | 08/31/2017 |
Lumber and Other Construction Materials Merchant Wholesalers | | Shelbyville | | KY | | | | | | 1,139 | | | 1,786 | | | - | | | - | | | 1,139 | | | 1,786 | | | 2,925 | | | (105) | | 2002 | | 08/31/2017 |
Health Clubs | | Seattle | | WA | | | | | | 8,741 | | | 375 | | | - | | | - | | | 8,741 | | | 375 | | | 9,116 | | | (19) | | 1952 | | 08/31/2017 |
Other Professional, Scientific, and Technical Services | | Montgomery | | AL | | | | | | 283 | | | 1,053 | | | - | | | - | | | 283 | | | 1,053 | | | 1,336 | | | (52) | | 1981 | | 09/05/2017 |
Other Professional, Scientific, and Technical Services | | Pike Road | | AL | | | | | | 396 | | | 1,675 | | | - | | | - | | | 396 | | | 1,675 | | | 2,071 | | | (62) | | 2011 | | 09/05/2017 |
Consumer Goods Rental | | Fort Smith | | AR | | | (f) | | | 161 | | | 573 | | | - | | | - | | | 161 | | | 573 | | | 734 | | | (33) | | 1967 | | 09/15/2017 |
Automotive Repair and Maintenance | | Cedar Park | | TX | | | | | | 1,116 | | | 987 | | | - | | | - | | | 1,116 | | | 987 | | | 2,103 | | | (56) | | 2010 | | 09/15/2017 |
Consumer Goods Rental | | Kilgore | | TX | | | (f) | | | 283 | | | 883 | | | - | | | - | | | 283 | | | 883 | | | 1,166 | | | (42) | | 2009 | | 09/15/2017 |
Health Clubs | | Phoenix | | AZ | | | (f) | | | 1,360 | | | - | | | 1,551 | | | 4,144 | | | 2,911 | | | 4,144 | | | 7,055 | | | (71) | | 2018 | | 09/20/2017 |
Commercial and Industrial Machinery and Equipment Rental and Leasing | | Corpus Christi | | TX | | | | | | 1,653 | | | 1,630 | | | - | | | - | | | 1,653 | | | 1,630 | | | 3,283 | | | (128) | | 2017 | | 09/20/2017 |
Family Entertainment Centers | | Miami Gardens | | FL | | | | | | 11,520 | | | 10,216 | | | 1,712 | | | 1,384 | | | 13,232 | | | 11,600 | | | 24,832 | | | (526) | | 2017 | | 09/21/2017 |
Sporting Goods, Hobby, and Musical Instrument Stores | | Augusta | | GA | | | | | | 2,046 | | | 7,109 | | | - | | | - | | | 2,046 | | | 7,109 | | | 9,155 | | | (240) | | 2014 | | 09/25/2017 |
Sporting Goods, Hobby, and Musical Instrument Stores | | Post Falls | | ID | | | | | | 4,904 | | | 20,768 | | | - | | | - | | | 4,904 | | | 20,768 | | | 25,672 | | | (924) | | 2007 | | 09/25/2017 |
Sporting Goods, Hobby, and Musical Instrument Stores | | Noblesville | | IN | | | | | | 5,019 | | | 13,339 | | | - | | | - | | | 5,019 | | | 13,339 | | | 18,358 | | | (494) | | 2015 | | 09/25/2017 |
Sporting Goods, Hobby, and Musical Instrument Stores | | Woodbury | | MN | | | | | | 7,593 | | | 18,786 | | | - | | | - | | | 7,593 | | | 18,786 | | | 26,379 | | | (605) | | 2014 | | 09/25/2017 |
Sporting Goods, Hobby, and Musical Instrument Stores | | Billings | | MT | | | | | | 2,753 | | | 14,468 | | | - | | | - | | | 2,753 | | | 14,468 | | | 17,221 | | | (557) | | 2009 | | 09/25/2017 |
Sporting Goods, Hobby, and Musical Instrument Stores | | Columbus | | OH | | | | | | 6,594 | | | 16,754 | | | - | | | - | | | 6,594 | | | 16,754 | | | 23,348 | | | (550) | | 2013 | | 09/25/2017 |
Sporting Goods, Hobby, and Musical Instrument Stores | | West Chester | | OH | | | | | | 9,013 | | | 12,293 | | | - | | | - | | | 9,013 | | | 12,293 | | | 21,306 | | | (432) | | 2015 | | 09/25/2017 |
Sporting Goods, Hobby, and Musical Instrument Stores | | Rapid City | | SD | | | | | | 2,996 | | | 14,193 | | | - | | | - | | | 2,996 | | | 14,193 | | | 17,189 | | | (548) | | 2008 | | 09/25/2017 |
Sporting Goods, Hobby, and Musical Instrument Stores | | League City | | TX | | | | | | 6,032 | | | 10,109 | | | - | | | - | | | 6,032 | | | 10,109 | | | 16,141 | | | (422) | | 2016 | | 09/25/2017 |
Automotive Repair and Maintenance | | Springfield | | MO | | | (f) | | | 884 | | | 1,566 | | | - | | | - | | | 884 | | | 1,566 | | | 2,450 | | | (71) | | 2007 | | 09/26/2017 |
| | | | | | | | | | | | | | | | | | | | | | | | | | | | | | | | | | | |
Descriptions (a) | | | | Initial Cost to Company | | Costs Capitalized Subsequent to Acquisition | | Gross amount at December 31, 2018 (b) (c) | | | | | | |
Tenant Industry | | City | | St | | Encumbrances | | Land &
Improvements | | Building &
Improvements | | Land &
Improvements | | Building &
Improvements | | Land &
Improvements | | Building &
Improvements | | Total | | Accumulated
Depreciation (d) (e) | | Year
Constructed | | Date Acquired |
Automotive Repair and Maintenance | | Springfield | | MO | | | (f) | | | 702 | | | 1,365 | | | - | | | - | | | 702 | | | 1,365 | | | 2,067 | | | (61) | | 2007 | | 09/26/2017 |
Outpatient Care Centers | | Breaux Bridge | | LA | | | | | | 400 | | | 458 | | | - | | | - | | | 400 | | | 458 | | | 858 | | | (26) | | 2014 | | 09/28/2017 |
Automotive Repair and Maintenance | | Columbia | | MO | | | | | | 1,035 | | | 1,238 | | | - | | | - | | | 1,035 | | | 1,238 | | | 2,273 | | | (56) | | 2003 | | 09/28/2017 |
Automotive Repair and Maintenance | | Columbia | | MO | | | | | | 1,273 | | | 1,862 | | | - | | | - | | | 1,273 | | | 1,862 | | | 3,135 | | | (98) | | 2007 | | 09/28/2017 |
Automotive Repair and Maintenance | | Columbia | | MO | | | | | | 914 | | | 1,169 | | | - | | | - | | | 914 | | | 1,169 | | | 2,083 | | | (64) | | 1988 | | 09/28/2017 |
Medical and Diagnostic Laboratories | | Enterprise | | AL | | | (f) | | | 196 | | | 1,538 | | | - | | | - | | | 196 | | | 1,538 | | | 1,734 | | | (60) | | 2005 | | 09/29/2017 |
Lumber and Other Construction Materials Merchant Wholesalers | | Manchester | | CT | | | | | | 745 | | | 266 | | | - | | | - | | | 745 | | | 266 | | | 1,011 | | | (53) | | 1953 | | 09/29/2017 |
Medical and Diagnostic Laboratories | | Marianna | | FL | | | (f) | | | 300 | | | 1,474 | | | - | | | - | | | 300 | | | 1,474 | | | 1,774 | | | (63) | | 2009 | | 09/29/2017 |
Lumber and Other Construction Materials Merchant Wholesalers | | Dyersville | | IA | | | | | | 1,950 | | | 875 | | | - | | | - | | | 1,950 | | | 875 | | | 2,825 | | | (125) | | 1984 | | 09/29/2017 |
Lumber and Other Construction Materials Merchant Wholesalers | | Story City | | IA | | | | | | 710 | | | 479 | | | - | | | - | | | 710 | | | 479 | | | 1,189 | | | (57) | | 1994 | | 09/29/2017 |
Lumber and Other Construction Materials Merchant Wholesalers | | Hampshire | | IL | | | | | | 852 | | | 297 | | | - | | | - | | | 852 | | | 297 | | | 1,149 | | | (67) | | 1991 | | 09/29/2017 |
Scientific Research and Development Services | | Agawam | | MA | | | | | | 980 | | | 4,328 | | | - | | | - | | | 980 | | | 4,328 | | | 5,308 | | | (192) | | 1992 | | 09/29/2017 |
Lumber and Other Construction Materials Merchant Wholesalers | | Mancelona | | MI | | | | | | 572 | | | 439 | | | - | | | - | | | 572 | | | 439 | | | 1,011 | | | (51) | | 1999 | | 09/29/2017 |
Lumber and Other Construction Materials Merchant Wholesalers | | St. Louis | | MI | | | | | | 1,756 | | | 1,940 | | | - | | | - | | | 1,756 | | | 1,940 | | | 3,696 | | | (205) | | 1988 | | 09/29/2017 |
Lumber and Other Construction Materials Merchant Wholesalers | | Chanhassen | | MN | | | | | | 4,844 | | | 1,964 | | | - | | | - | | | 4,844 | | | 1,964 | | | 6,808 | | | (242) | | 1980 | | 09/29/2017 |
Lumber and Other Construction Materials Merchant Wholesalers | | Montrose | | MN | | | | | | 1,651 | | | 925 | | | - | | | - | | | 1,651 | | | 925 | | | 2,576 | | | (100) | | 2000 | | 09/29/2017 |
Lumber and Other Construction Materials Merchant Wholesalers | | Pipestone | | MN | | | | | | 623 | | | 665 | | | - | | | - | | | 623 | | | 665 | | | 1,288 | | | (52) | | 1985 | | 09/29/2017 |
Lumber and Other Construction Materials Merchant Wholesalers | | Rogers | | MN | | | | | | 2,683 | | | 1,093 | | | - | | | - | | | 2,683 | | | 1,093 | | | 3,776 | | | (71) | | 1966 | | 09/29/2017 |
Lumber and Other Construction Materials Merchant Wholesalers | | Hendersonville | | NC | | | | | | 1,459 | | | 355 | | | - | | | - | | | 1,459 | | | 355 | | | 1,814 | | | (70) | | 1985 | | 09/29/2017 |
Lumber and Other Construction Materials Merchant Wholesalers | | Anderson | | SC | | | | | | 794 | | | 494 | | | - | | | - | | | 794 | | | 494 | | | 1,288 | | | (59) | | 1997 | | 09/29/2017 |
Lumber and Other Construction Materials Merchant Wholesalers | | Greenville | | SC | | | | | | 475 | | | 526 | | | - | | | - | | | 475 | | | 526 | | | 1,001 | | | (36) | | 1994 | | 09/29/2017 |
Lumber and Other Construction Materials Merchant Wholesalers | | Greenville | | SC | | | | | | 2,204 | | | 928 | | | - | | | - | | | 2,204 | | | 928 | | | 3,132 | | | (158) | | 1972 | | 09/29/2017 |
Health Clubs | | Bryan | | TX | | | | | | 1,920 | | | 5,707 | | | - | | | 1,379 | | | 1,920 | | | 7,086 | | | 9,006 | | | (257) | | 1984 | | 09/29/2017 |
Health Clubs | | College Station | | TX | | | | | | 53 | | | 6,612 | | | - | | | - | | | 53 | | | 6,612 | | | 6,665 | | | (211) | | 2013 | | 09/29/2017 |
Health Clubs | | McAllen | | TX | | | (f) | | | 1,351 | | | 3,880 | | | - | | | - | | | 1,351 | | | 3,880 | | | 5,231 | | | (142) | | 2015 | | 09/29/2017 |
Lumber and Other Construction Materials Merchant Wholesalers | | Chetek | | WI | | | | | | 1,292 | | | 1,354 | | | - | | | - | | | 1,292 | | | 1,354 | | | 2,646 | | | (117) | | 1921 | | 09/29/2017 |
Lumber and Other Construction Materials Merchant Wholesalers | | Eau Claire | | WI | | | | | | 1,531 | | | 1,253 | | | - | | | - | | | 1,531 | | | 1,253 | | | 2,784 | | | (112) | | 1927 | | 09/29/2017 |
Other Personal Services | | Plano | | TX | | | | | | 1,088 | | | 1,171 | | | - | | | - | | | 1,088 | | | 1,171 | | | 2,259 | | | (53) | | 2007 | | 10/02/2017 |
Other Personal Services | | Lewisville | | TX | | | (f) | | | 220 | | | 592 | | | - | | | - | | | 220 | | | 592 | | | 812 | | | (28) | | 1988 | | 10/04/2017 |
Other Personal Services | | Egg Harbor City | | NJ | | | (f) | | | 431 | | | 1,084 | | | - | | | - | | | 431 | | | 1,084 | | | 1,515 | | | (47) | | 1930 | | 10/05/2017 |
Family Entertainment Centers | | Katy | | TX | | | | | | 1,564 | | | 2,651 | | | - | | | 738 | | | 1,564 | | | 3,389 | | | 4,953 | | | (132) | | 2015 | | 10/17/2017 |
Other Professional, Scientific, and Technical Services | | Arlington | | TN | | | (f) | | | 512 | | | 651 | | | - | | | - | | | 512 | | | 651 | | | 1,163 | | | (34) | | 2007 | | 10/18/2017 |
Restaurants – Limited Service | | Jasper | | AL | | | | | | 700 | | | 1,270 | | | - | | | - | | | 700 | | | 1,270 | | | 1,970 | | | (65) | | 2017 | | 10/26/2017 |
Consumer Goods Rental | | Fort Smith | | AR | | | (f) | | | 216 | | | 804 | | | - | | | - | | | 216 | | | 804 | | | 1,020 | | | (36) | | 1955 | | 10/27/2017 |
Aerospace Product and Parts Manufacturing | | Harbor Springs | | MI | | | | | | 402 | | | 3,756 | | | 976 | | | 6,266 | | | 1,378 | | | 10,022 | | | 11,400 | | | (151) | | 1989 | | 10/27/2017 |
Automotive Repair and Maintenance | | Farmington | | MO | | | | | | 828 | | | 63 | | | 218 | | | 1,618 | | | 1,046 | | | 1,681 | | | 2,727 | | | (33) | | 2018 | | 10/30/2017 |
Health Clubs | | Caldwell | | ID | | | (f) | | | 485 | | | 4,359 | | | - | | | - | | | 485 | | | 4,359 | | | 4,844 | | | (141) | | 2007 | | 11/03/2017 |
Machine Shops; Turned Product; and Screw, Nut, and Bolt Manufacturing | | Hartselle | | AL | | | | | | 3,778 | | | 5,701 | | | - | | | - | | | 3,778 | | | 5,701 | | | 9,479 | | | (438) | | 1978 | | 11/08/2017 |
Health Clubs | | Rexburg | | ID | | | | | | 435 | | | 2,481 | | | - | | | - | | | 435 | | | 2,481 | | | 2,916 | | | (114) | | 2004 | | 11/08/2017 |
Machine Shops; Turned Product; and Screw, Nut, and Bolt Manufacturing | | Albion | | IN | | | | | | 412 | | | 1,400 | | | - | | | - | | | 412 | | | 1,400 | | | 1,812 | | | (92) | | 1992 | | 11/08/2017 |
Machine Shops; Turned Product; and Screw, Nut, and Bolt Manufacturing | | Albion | | IN | | | | | | 368 | | | 1,689 | | | - | | | - | | | 368 | | | 1,689 | | | 2,057 | | | (109) | | 1993 | | 11/08/2017 |
Machine Shops; Turned Product; and Screw, Nut, and Bolt Manufacturing | | Avila | | IN | | | | | | 636 | | | 1,894 | | | - | | | - | | | 636 | | | 1,894 | | | 2,530 | | | (133) | | 1984 | | 11/08/2017 |
Machine Shops; Turned Product; and Screw, Nut, and Bolt Manufacturing | | Southfield | | MI | | | | | | 1,222 | | | 6,010 | | | - | | | - | | | 1,222 | | | 6,010 | | | 7,232 | | | (396) | | 1968 | | 11/08/2017 |
Automotive Repair and Maintenance | | Fenton | | MO | | | | | | 863 | | | 754 | | | 134 | | | 725 | | | 997 | | | 1,479 | | | 2,476 | | | (60) | | 1997 | | 11/08/2017 |
Other Personal Services | | Fairview | | TN | | | (f) | | | 615 | | | 2,098 | | | - | | | - | | | 615 | | | 2,098 | | | 2,713 | | | (93) | | 2008 | | 11/09/2017 |
Outpatient Care Centers | | Tuscaloosa | | AL | | | | | | 165 | | | 381 | | | - | | | - | | | 165 | | | 381 | | | 546 | | | (19) | | 2001 | | 11/17/2017 |
Health Clubs | | Nampa | | ID | | | (f) | | | 1,201 | | | 3,688 | | | - | | | - | | | 1,201 | | | 3,688 | | | 4,889 | | | (127) | | 2009 | | 11/17/2017 |
Consumer Goods Rental | | Meridian | | MS | | | (f) | | | 294 | | | 620 | | | - | | | - | | | 294 | | | 620 | | | 914 | | | (28) | | 1965 | | 11/17/2017 |
Forging and Stamping | | Lebanon | | MO | | | | | | 2,107 | | | 11,542 | | | - | | | - | | | 2,107 | | | 11,542 | | | 13,649 | | | (476) | | 1958 | | 11/21/2017 |
Forging and Stamping | | Decatur | | TX | | | | | | 3,440 | | | 4,239 | | | - | | | - | | | 3,440 | | | 4,239 | | | 7,679 | | | (333) | | 1984 | | 11/21/2017 |
| | | | | | | | | | | | | | | | | | | | | | | | | | | | | | | | | | | |
Descriptions (a) | | | | Initial Cost to Company | | Costs Capitalized Subsequent to Acquisition | | Gross amount at December 31, 2018 (b) (c) | | | | | | |
Tenant Industry | | City | | St | | Encumbrances | | Land &
Improvements | | Building &
Improvements | | Land &
Improvements | | Building &
Improvements | | Land &
Improvements | | Building &
Improvements | | Total | | Accumulated
Depreciation (d) (e) | | Year
Constructed | | Date Acquired |
Forging and Stamping | | Dublin | | VA | | | | | | 4,382 | | | 5,273 | | | - | | | - | | | 4,382 | | | 5,273 | | | 9,655 | | | (411) | | 1975 | | 11/21/2017 |
Forging and Stamping | | Chehalis | | WA | | | | | | 961 | | | 5,335 | | | - | | | - | | | 961 | | | 5,335 | | | 6,296 | | | (317) | | 1996 | | 11/21/2017 |
Farm and Ranch Supply Stores | | Village of Deforest | | WI | | | | | | 4,923 | | | - | | | 7,524 | | | 19,538 | | | 12,447 | | | 19,538 | | | 31,985 | | | (192) | | 2018 | | 11/21/2017 |
Furniture Stores | | Harrisburg | | PA | | | | | | 2,348 | | | 2,847 | | | - | | | - | | | 2,348 | | | 2,847 | | | 5,195 | | | (142) | | 1974 | | 11/22/2017 |
Furniture Stores | | McMurray | | PA | | | | | | 1,882 | | | 14,535 | | | - | | | - | | | 1,882 | | | 14,535 | | | 16,417 | | | (356) | | 2001 | | 11/22/2017 |
Furniture Stores | | Pittsburgh | | PA | | | | | | 2,299 | | | 12,825 | | | - | | | - | | | 2,299 | | �� | 12,825 | | | 15,124 | | | (334) | | 1999 | | 11/22/2017 |
Commercial and Industrial Machinery and Equipment Rental and Leasing | | Austin | | TX | | | | | | 1,241 | | | 977 | | | - | | | - | | | 1,241 | | | 977 | | | 2,218 | | | (86) | | 2017 | | 11/22/2017 |
Furniture Stores | | Leesburg | | VA | | | | | | 3,101 | | | 3,438 | | | - | | | - | | | 3,101 | | | 3,438 | | | 6,539 | | | (175) | | 2012 | | 11/22/2017 |
Restaurants – Limited Service | | Overland | | MO | | | (f) | | | 650 | | | - | | | 429 | | | 670 | | | 1,079 | | | 670 | | | 1,749 | | | - | | 2018 | | 11/29/2017 |
Dairy Product Manufacturing | | New Berlin | | WI | | | | | | 497 | | | 2,612 | | | - | | | - | | | 497 | | | 2,612 | | | 3,109 | | | (108) | | 1979 | | 11/29/2017 |
Restaurants – Full Service | | Saint Marys | | OH | | | | | | 324 | | | 340 | | | - | | | - | | | 324 | | | 340 | | | 664 | | | (28) | | 1978 | | 11/30/2017 |
Child Day Care Services | | Villa Rica | | GA | | | | | | 261 | | | 764 | | | 7 | | | 23 | | | 268 | | | 787 | | | 1,055 | | | (33) | | 2006 | | 11/30/2017 |
Restaurants – Limited Service | | Paducah | | KY | | | | | | 309 | | | 636 | | | - | | | - | | | 309 | | | 636 | | | 945 | | | (33) | | 2013 | | 11/30/2017 |
Restaurants – Limited Service | | Sikeston | | MO | | | | | | 742 | | | 929 | | | - | | | - | | | 742 | | | 929 | | | 1,671 | | | (65) | | 1990 | | 11/30/2017 |
Restaurants – Limited Service | | Sikeston | | MO | | | | | | 550 | | | 237 | | | - | | | - | | | 550 | | | 237 | | | 787 | | | (34) | | 2001 | | 11/30/2017 |
Restaurants – Limited Service | | Hamilton | | OH | | | | | | 502 | | | 344 | | | - | | | - | | | 502 | | | 344 | | | 846 | | | (29) | | 2006 | | 11/30/2017 |
Restaurants – Limited Service | | Hamilton | | OH | | | | | | 485 | | | 361 | | | - | | | - | | | 485 | | | 361 | | | 846 | | | (30) | | 2007 | | 11/30/2017 |
Restaurants – Limited Service | | Maineville | | OH | | | | | | 948 | | | 246 | | | - | | | - | | | 948 | | | 246 | | | 1,194 | | | (27) | | 1993 | | 11/30/2017 |
Restaurants – Limited Service | | Bristol | | VA | | | | | | 349 | | | 606 | | | - | | | - | | | 349 | | | 606 | | | 955 | | | (25) | | 2017 | | 11/30/2017 |
Other Professional, Scientific, and Technical Services | | Orlando | | FL | | | | | | 381 | | | 752 | | | - | | | - | | | 381 | | | 752 | | | 1,133 | | | (38) | | 2005 | | 12/04/2017 |
Health Clubs | | Chandler | | AZ | | | | | | 1,696 | | | 501 | | | 1,288 | | | 3,784 | | | 2,984 | | | 4,285 | | | 7,269 | | | - | | 2018 | | 12/05/2017 |
Household and Institutional Furniture and Kitchen Cabinet Manufacturing | | Bay Minette | | AL | | | | | | 9,634 | | | 27,475 | | | - | | | - | | | 9,634 | | | 27,475 | | | 37,109 | | | (1,646) | | 2000 | | 12/06/2017 |
Health Clubs | | Weslaco | | TX | | | (f) | | | 254 | | | 708 | | | - | | | - | | | 254 | | | 708 | | | 962 | | | (22) | | 2005 | | 12/06/2017 |
Furniture Stores | | Columbus | | OH | | | | | | - | | | - | | | - | | | 9,762 | | | - | | | 9,762 | | | 9,762 | | | - | | | | 12/14/2017 |
Individual and Family Services | | Greer | | SC | | | | | | 126 | | | 342 | | | 30 | | | 267 | | | 156 | | | 609 | | | 765 | | | (31) | | 1994 | | 12/14/2017 |
Individual and Family Services | | Spartanburg | | SC | | | | | | 241 | | | 419 | | | - | | | - | | | 241 | | | 419 | | | 660 | | | (27) | | 1999 | | 12/14/2017 |
Automotive Repair and Maintenance | | San Antonio | | TX | | | | | | 636 | | | 2,410 | | | - | | | - | | | 636 | | | 2,410 | | | 3,046 | | | (84) | | 2013 | | 12/14/2017 |
Automotive Repair and Maintenance | | San Antonio | | TX | | | | | | 678 | | | 2,719 | | | - | | | - | | | 678 | | | 2,719 | | | 3,397 | | | (88) | | 2016 | | 12/14/2017 |
Other Wood Product Manufacturing | | Chandler | | AZ | | | | | | 7,883 | | | 4,645 | | | - | | | - | | | 7,883 | | | 4,645 | | | 12,528 | | | (304) | | 1999 | | 12/15/2017 |
Other Wood Product Manufacturing | | Roseville | | CA | | | | | | 5,534 | | | 2,992 | | | - | | | - | | | 5,534 | | | 2,992 | | | 8,526 | | | (195) | | 1996 | | 12/15/2017 |
Automotive Repair and Maintenance | | Lebanon | | MO | | | | | | 776 | | | 51 | | | 295 | | | 1,584 | | | 1,071 | | | 1,635 | | | 2,706 | | | (26) | | 2018 | | 12/15/2017 |
Automotive Repair and Maintenance | | Sedalia | | MO | | | | | | 297 | | | 87 | | | 280 | | | 1,521 | | | 577 | | | 1,608 | | | 2,185 | | | (25) | | 2018 | | 12/15/2017 |
Other Professional, Scientific, and Technical Services | | Oregon City | | OR | | | | | | 217 | | | 178 | | | - | | | - | | | 217 | | | 178 | | | 395 | | | (12) | | 1971 | | 12/15/2017 |
Restaurants – Full Service | | Wytheville | | VA | | | (f) | | | 564 | | | 545 | | | - | | | - | | | 564 | | | 545 | | | 1,109 | | | (45) | | 1980 | | 12/15/2017 |
Farm and Ranch Supply Stores | | Delavan | | WI | | | | | | 4,022 | | | 55 | | | 9,180 | | | 17,512 | | | 13,202 | | | 17,567 | | | 30,769 | | | (200) | | 2018 | | 12/15/2017 |
Automotive Repair and Maintenance | | Cookeville | | TN | | | (f) | | | 392 | | | 2,320 | | | - | | | - | | | 392 | | | 2,320 | | | 2,712 | | | (82) | | 2008 | | 12/19/2017 |
Automotive Repair and Maintenance | | Cookeville | | TN | | | (f) | | | 446 | | | 1,976 | | | - | | | - | | | 446 | | | 1,976 | | | 2,422 | | | (75) | | 2012 | | 12/19/2017 |
Restaurants – Full Service | | Enterprise | | AL | | | | | | 352 | | | 1,498 | | | - | | | - | | | 352 | | | 1,498 | | | 1,850 | | | (53) | | 1997 | | 12/21/2017 |
Restaurants – Full Service | | Gadsden | | AL | | | | | | 683 | | | 1,082 | | | - | | | - | | | 683 | | | 1,082 | | | 1,765 | | | (51) | | 2002 | | 12/21/2017 |
Restaurants – Full Service | | Mobile | | AL | | | | | | 842 | | | 949 | | | - | | | - | | | 842 | | | 949 | | | 1,791 | | | (44) | | 1998 | | 12/21/2017 |
Restaurants – Full Service | | Denver | | CO | | | | | | 1,318 | | | 1,079 | | | - | | | - | | | 1,318 | | | 1,079 | | | 2,397 | | | (43) | | 2006 | | 12/21/2017 |
Restaurants – Full Service | | Bristol | | CT | | | | | | 877 | | | 904 | | | - | | | - | | | 877 | | | 904 | | | 1,781 | | | (56) | | 2003 | | 12/21/2017 |
Restaurants – Full Service | | Lake City | | FL | | | | | | 626 | | | 523 | | | - | | | - | | | 626 | | | 523 | | | 1,149 | | | (28) | | 2004 | | 12/21/2017 |
Restaurants – Full Service | | Marianna | | FL | | | | | | 363 | | | 545 | | | - | | | - | | | 363 | | | 545 | | | 908 | | | (30) | | 2000 | | 12/21/2017 |
Restaurants – Full Service | | Pensacola | | FL | | | | | | 731 | | | 867 | | | - | | | - | | | 731 | | | 867 | | | 1,598 | | | (40) | | 2003 | | 12/21/2017 |
Restaurants – Full Service | | PENSACOLA | | FL | | | | | | 540 | | | 521 | | | - | | | - | | | 540 | | | 521 | | | 1,061 | | | (27) | | 2001 | | 12/21/2017 |
Restaurants – Full Service | | Sebastian | | FL | | | | | | 730 | | | 597 | | | - | | | - | | | 730 | | | 597 | | | 1,327 | | | (32) | | 2001 | | 12/21/2017 |
Restaurants – Full Service | | Albany | | GA | | | | | | 720 | | | 373 | | | - | | | - | | | 720 | | | 373 | | | 1,093 | | | (24) | | 1994 | | 12/21/2017 |
Restaurants – Full Service | | Carrollton | | GA | | | | | | 713 | | | 610 | | | - | | | - | | | 713 | | | 610 | | | 1,323 | | | (36) | | 2006 | | 12/21/2017 |
Restaurants – Full Service | | College Park | | GA | | | | | | 1,189 | | | 1,941 | | | - | | | - | | | 1,189 | | | 1,941 | | | 3,130 | | | (85) | | 1992 | | 12/21/2017 |
| | | | | | | | | | | | | | | | | | | | | | | | | | | | | | | | | | | |
Descriptions (a) | | | | Initial Cost to Company | | Costs Capitalized Subsequent to Acquisition | | Gross amount at December 31, 2018 (b) (c) | | | | | | |
Tenant Industry | | City | | St | | Encumbrances | | Land &
Improvements | | Building &
Improvements | | Land &
Improvements | | Building &
Improvements | | Land &
Improvements | | Building &
Improvements | | Total | | Accumulated
Depreciation (d) (e) | | Year
Constructed | | Date Acquired |
Restaurants – Full Service | | Dallas | | GA | | | | | | 505 | �� | | 650 | | | - | | | - | | | 505 | | | 650 | | | 1,155 | | | (35) | | 2006 | | 12/21/2017 |
Restaurants – Full Service | | Dublin | | GA | | | | | | 526 | | | 997 | | | - | | | - | | | 526 | | | 997 | | | 1,523 | | | (36) | | 2002 | | 12/21/2017 |
Consumer Goods Rental | | Donaldsonville | | LA | | | (f) | | | 408 | | | 607 | | | - | | | - | | | 408 | | | 607 | | | 1,015 | | | (31) | | 2009 | | 12/21/2017 |
Restaurants – Full Service | | Frederick | | MD | | | | | | 1,190 | | | 610 | | | - | | | - | | | 1,190 | | | 610 | | | 1,800 | | | (41) | | 2004 | | 12/21/2017 |
Restaurants – Full Service | | Cadillac | | MI | | | | | | 663 | | | 1,050 | | | - | | | - | | | 663 | | | 1,050 | | | 1,713 | | | (54) | | 2001 | | 12/21/2017 |
Restaurants – Full Service | | Corinth | | MS | | | | | | 628 | | | 870 | | | - | | | - | | | 628 | | | 870 | | | 1,498 | | | (33) | | 2003 | | 12/21/2017 |
Restaurants – Full Service | | Pearl | | MS | | | | | | 1,005 | | | 657 | | | - | | | - | | | 1,005 | | | 657 | | | 1,662 | | | (36) | | 2004 | | 12/21/2017 |
Restaurants – Full Service | | Eden | | NC | | | | | | 834 | | | 838 | | | - | | | - | | | 834 | | | 838 | | | 1,672 | | | (43) | | 2004 | | 12/21/2017 |
Restaurants – Full Service | | Greenville | | NC | | | | | | 948 | | | 684 | | | - | | | - | | | 948 | | | 684 | | | 1,632 | | | (32) | | 2000 | | 12/21/2017 |
Restaurants – Full Service | | Hickory | | NC | | | | | | 571 | | | 511 | | | - | | | - | | | 571 | | | 511 | | | 1,082 | | | (29) | | 1999 | | 12/21/2017 |
Restaurants – Full Service | | Lumberton | | NC | | | | | | 1,084 | | | 587 | | | - | | | - | | | 1,084 | | | 587 | | | 1,671 | | | (36) | | 1998 | | 12/21/2017 |
Restaurants – Full Service | | Mt. Airy | | NC | | | | | | 613 | | | 482 | | | - | | | - | | | 613 | | | 482 | | | 1,095 | | | (25) | | 2004 | | 12/21/2017 |
Restaurants – Full Service | | Roanoke Rapids | | NC | | | | | | 852 | | | 1,015 | | | - | | | - | | | 852 | | | 1,015 | | | 1,867 | | | (41) | | 2002 | | 12/21/2017 |
Restaurants – Full Service | | Spring Lake | | NC | | | | | | 396 | | | 306 | | | - | | | - | | | 396 | | | 306 | | | 702 | | | (17) | | 2006 | | 12/21/2017 |
Restaurants – Full Service | | Wilkesboro | | NC | | | | | | 529 | | | 471 | | | - | | | - | | | 529 | | | 471 | | | 1,000 | | | (27) | | 2003 | | 12/21/2017 |
Restaurants – Full Service | | Cambridge | | OH | | | | | | 843 | | | 538 | | | - | | | - | | | 843 | | | 538 | | | 1,381 | | | (35) | | 2002 | | 12/21/2017 |
Restaurants – Full Service | | Dayton | | OH | | | | | | 573 | | | 851 | | | - | | | - | | | 573 | | | 851 | | | 1,424 | | | (43) | | 2005 | | 12/21/2017 |
Restaurants – Full Service | | Mt. Vernon | | OH | | | | | | 393 | | | 506 | | | - | | | - | | | 393 | | | 506 | | | 899 | | | (30) | | 2002 | | 12/21/2017 |
Restaurants – Full Service | | Streetsboro | | OH | | | | | | 732 | | | 598 | | | - | | | - | | | 732 | | | 598 | | | 1,330 | | | (29) | | 2001 | | 12/21/2017 |
Car Dealers | | Oklahoma City | | OK | | | (f) | | | 651 | | | 1,021 | | | - | | | - | | | 651 | | | 1,021 | | | 1,672 | | | (55) | | 1946 | | 12/21/2017 |
Restaurants – Full Service | | Mill Hall | | PA | | | | | | 578 | | | 228 | | | - | | | - | | | 578 | | | 228 | | | 806 | | | (14) | | 2002 | | 12/21/2017 |
Restaurants – Full Service | | Moosic | | PA | | | | | | 627 | | | 1,084 | | | - | | | - | | | 627 | | | 1,084 | | | 1,711 | | | (42) | | 2003 | | 12/21/2017 |
Restaurants – Full Service | | NEW FREEDOM | | PA | | | | | | 1,006 | | | 733 | | | - | | | - | | | 1,006 | | | 733 | | | 1,739 | | | (42) | | 2004 | | 12/21/2017 |
Restaurants – Full Service | | Philadelphia | | PA | | | | | | 2,055 | | | 1,248 | | | - | | | - | | | 2,055 | | | 1,248 | | | 3,303 | | | (58) | | 2002 | | 12/21/2017 |
Restaurants – Full Service | | Lexington | | SC | | | | | | 651 | | | 570 | | | - | | | - | | | 651 | | | 570 | | | 1,221 | | | (23) | | 2007 | | 12/21/2017 |
Restaurants – Full Service | | Simpsonville | | SC | | | | | | 1,100 | | | 563 | | | - | | | - | | | 1,100 | | | 563 | | | 1,663 | | | (33) | | 2004 | | 12/21/2017 |
Restaurants – Full Service | | Alcoa | | TN | | | | | | 761 | | | 261 | | | - | | | - | | | 761 | | | 261 | | | 1,022 | | | (20) | | 2007 | | 12/21/2017 |
Restaurants – Full Service | | DANDRIDGE | | TN | | | | | | 899 | | | 891 | | | - | | | - | | | 899 | | | 891 | | | 1,790 | | | (44) | | 2005 | | 12/21/2017 |
Restaurants – Full Service | | Knoxville | | TN | | | | | | 847 | | | 824 | | | - | | | - | | | 847 | | | 824 | | | 1,671 | | | (33) | | 2004 | | 12/21/2017 |
Car Dealers | | Houston | | TX | | | (f) | | | 3,463 | | | 5,678 | | | - | | | - | | | 3,463 | | | 5,678 | | | 9,141 | | | (257) | | 1977 | | 12/21/2017 |
Restaurants – Full Service | | Charles Town | | WV | | | | | | 864 | | | 197 | | | - | | | - | | | 864 | | | 197 | | | 1,061 | | | (16) | | 2002 | | 12/21/2017 |
Restaurants – Full Service | | Martinsburg | | WV | | | | | | 552 | | | 480 | | | - | | | - | | | 552 | | | 480 | | | 1,032 | | | (27) | | 1998 | | 12/21/2017 |
Car Dealers | | Jacksonville | | FL | | | | | | 1,915 | | | 3,132 | | | - | | | - | | | 1,915 | | | 3,132 | | | 5,047 | | | (110) | | 2017 | | 12/26/2017 |
Health Clubs | | Niles | | IL | | | (f) | | | 1,259 | | | 2,152 | | | - | | | - | | | 1,259 | | | 2,152 | | | 3,411 | | | (94) | | 1993 | | 12/27/2017 |
Child Day Care Services | | Bulverde | | TX | | | | | | 895 | | | - | | | 571 | | | 1,702 | | | 1,466 | | | 1,702 | | | 3,168 | | | (31) | | 2018 | | 12/27/2017 |
Other Professional, Scientific, and Technical Services | | Salem | | OR | | | | | | 154 | | | 312 | | | - | | | - | | | 154 | | | 312 | | | 466 | | | (18) | | 1980 | | 12/29/2017 |
Other Professional, Scientific, and Technical Services | | Memphis | | TN | | | | | | 166 | | | 280 | | | - | | | - | | | 166 | | | 280 | | | 446 | | | (17) | | 1968 | | 12/29/2017 |
Other Professional, Scientific, and Technical Services | | Ocala | | FL | | | | | | 507 | | | 464 | | | - | | | - | | | 507 | | | 464 | | | 971 | | | (31) | | 1964 | | 01/02/2018 |
Automotive Repair and Maintenance | | Arlington | | TX | | | (f) | | | 1,979 | | | 3,396 | | | - | | | - | | | 1,979 | | | 3,396 | | | 5,375 | | | (124) | | 2010 | | 01/09/2018 |
Automotive Repair and Maintenance | | Burleson | | TX | | | (f) | | | 1,483 | | | 2,726 | | | - | | | - | | | 1,483 | | | 2,726 | | | 4,209 | | | (104) | | 2008 | | 01/09/2018 |
Automotive Repair and Maintenance | | Hurst | | TX | | | (f) | | | 524 | | | 2,431 | | | - | | | - | | | 524 | | | 2,431 | | | 2,955 | | | (92) | | 2010 | | 01/09/2018 |
Automotive Repair and Maintenance | | Mansfield | | TX | | | (f) | | | 774 | | | 2,065 | | | - | | | - | | | 774 | | | 2,065 | | | 2,839 | | | (98) | | 2012 | | 01/09/2018 |
Automotive Repair and Maintenance | | Saginaw | | TX | | | | | | 1,928 | | | 3,624 | | | - | | | - | | | 1,928 | | | 3,624 | | | 5,552 | | | (132) | | 2014 | | 01/09/2018 |
Automotive Repair and Maintenance | | The Colony | | TX | | | | | | 973 | | | 2,618 | | | - | | | - | | | 973 | | | 2,618 | | | 3,591 | | | (81) | | 2010 | | 01/09/2018 |
Automotive Repair and Maintenance | | Westworth Village | | TX | | | (f) | | | 2,011 | | | 2,261 | | | - | | | - | | | 2,011 | | | 2,261 | | | 4,272 | | | (89) | | 2013 | | 01/09/2018 |
Automotive Repair and Maintenance | | Miramar | | FL | | | | | | 983 | | | 1,482 | | | - | | | - | | | 983 | | | 1,482 | | | 2,465 | | | (53) | | 2011 | | 01/11/2018 |
Health Clubs | | Plymouth | | MN | | | (f) | | | 1,198 | | | 597 | | | - | | | 2,158 | | | 1,198 | | | 2,755 | | | 3,953 | | | (57) | | 1998 | | 01/11/2018 |
Chemical and Allied Products Merchant Wholesalers | | Oldsmar | | FL | | | | | | 278 | | | 743 | | | - | | | - | | | 278 | | | 743 | | | 1,021 | | | (22) | | 1989 | | 01/19/2018 |
Chemical and Allied Products Merchant Wholesalers | | Oldsmar | | FL | | | | | | 119 | | | 1,415 | | | - | | | - | | | 119 | | | 1,415 | | | 1,534 | | | (34) | | 1990 | | 01/19/2018 |
Chemical and Allied Products Merchant Wholesalers | | Hyannis | | MA | | | | | | 214 | | | 170 | | | - | | | - | | | 214 | | | 170 | | | 384 | | | (10) | | 1963 | | 01/19/2018 |
| | | | | | | | | | | | | | | | | | | | | | | | | | | | | | | | | | | |
Descriptions (a) | | | | Initial Cost to Company | | Costs Capitalized Subsequent to Acquisition | | Gross amount at December 31, 2018 (b) (c) | | | | | | |
Tenant Industry | | City | | St | | Encumbrances | | Land &
Improvements | | Building &
Improvements | | Land &
Improvements | | Building &
Improvements | | Land &
Improvements | | Building &
Improvements | | Total | | Accumulated
Depreciation (d) (e) | | Year
Constructed | | Date Acquired |
Chemical and Allied Products Merchant Wholesalers | | Hagerstown | | MD | | | | | | 263 | | | 94 | | | - | | | - | | | 263 | | | 94 | | | 357 | | | (11) | | 1989 | | 01/19/2018 |
Chemical and Allied Products Merchant Wholesalers | | Carlisle | | PA | | | | | | 354 | | | 336 | | | - | | | - | | | 354 | | | 336 | | | 690 | | | (23) | | 1971 | | 01/19/2018 |
Chemical and Allied Products Merchant Wholesalers | | Lancaster | | PA | | | | | | 56 | | | 306 | | | - | | | - | | | 56 | | | 306 | | | 362 | | | (12) | | 1990 | | 01/19/2018 |
Chemical and Allied Products Merchant Wholesalers | | Providence | | RI | | | | | | 479 | | | 1,031 | | | - | | | - | | | 479 | | | 1,031 | | | 1,510 | | | (44) | | 1964 | | 01/19/2018 |
Chemical and Allied Products Merchant Wholesalers | | Hereford | | TX | | | | | | 77 | | | 348 | | | - | | | - | | | 77 | | | 348 | | | 425 | | | (11) | | 1966 | | 01/19/2018 |
Automotive Repair and Maintenance | | Andover | | KS | | | (f) | | | 603 | | | 1 | | | 230 | | | 1,925 | | | 833 | | | 1,926 | | | 2,759 | | | (16) | | 2018 | | 01/23/2018 |
Automotive Repair and Maintenance | | Derby | | KS | | | | | | 900 | | | 2,573 | | | - | | | - | | | 900 | | | 2,573 | | | 3,473 | | | (75) | | 2013 | | 01/23/2018 |
Aerospace Product and Parts Manufacturing | | Wixom | | MI | | | | | | 3,674 | | | 8,844 | | | - | | | - | | | 3,674 | | | 8,844 | | | 12,518 | | | (391) | | 1989 | | 01/26/2018 |
Other Professional, Scientific, and Technical Services | | Panama City | | FL | | | | | | 707 | | | 516 | | | - | | | - | | | 707 | | | 516 | | | 1,223 | | | (37) | | 1983 | | 02/02/2018 |
Aerospace Product and Parts Manufacturing | | Newington | | CT | | | | | | 1,470 | | | 7,837 | | | - | | | - | | | 1,470 | | | 7,837 | | | 9,307 | | | (278) | | 1953 | | 02/09/2018 |
Restaurants – Full Service | | Olean | | NY | | | | | | 433 | | | 715 | | | - | | | 100 | | | 433 | | | 815 | | | 1,248 | | | (27) | | 1977 | | 02/12/2018 |
Restaurants – Full Service | | Ashland | | OH | | | | | | 479 | | | 604 | | | - | | | - | | | 479 | | | 604 | | | 1,083 | | | (23) | | 1971 | | 02/12/2018 |
Restaurants – Full Service | | Ashtabula | | OH | | | | | | 340 | | | 912 | | | - | | | - | | | 340 | | | 912 | | | 1,252 | | | (40) | | 1976 | | 02/12/2018 |
Restaurants – Full Service | | Austintown | | OH | | | | | | 740 | | | 681 | | | - | | | - | | | 740 | | | 681 | | | 1,421 | | | (32) | | 1991 | | 02/12/2018 |
Restaurants – Full Service | | Canfield | | OH | | | | | | 192 | | | 994 | | | - | | | - | | | 192 | | | 994 | | | 1,186 | | | (36) | | 1973 | | 02/12/2018 |
Restaurants – Full Service | | Canton | | OH | | | | | | 555 | | | 1,285 | | | - | | | 100 | | | 555 | | | 1,385 | | | 1,940 | | | (53) | | 1989 | | 02/12/2018 |
Restaurants – Full Service | | Middleburg Heights | | OH | | | | | | 930 | | | 914 | | | - | | | - | | | 930 | | | 914 | | | 1,844 | | | (41) | | 1987 | | 02/12/2018 |
Restaurants – Full Service | | Warren | | OH | | | | | | 394 | | | 830 | | | - | | | - | | | 394 | | | 830 | | | 1,224 | | | (34) | | 1999 | | 02/12/2018 |
Restaurants – Full Service | | Youngstown | | OH | | | | | | 645 | | | 1,199 | | | - | | | - | | | 645 | | | 1,199 | | | 1,844 | | | (51) | | 1985 | | 02/12/2018 |
Restaurants – Full Service | | Bradford | | PA | | | | | | 183 | | | 701 | | | - | | | - | | | 183 | | | 701 | | | 884 | | | (28) | | 1977 | | 02/12/2018 |
Restaurants – Full Service | | Clarion | | PA | | | | | | 186 | | | 670 | | | - | | | - | | | 186 | | | 670 | | | 856 | | | (26) | | 1977 | | 02/12/2018 |
Restaurants – Full Service | | Corry | | PA | | | | | | 171 | | | 780 | | | - | | | - | | | 171 | | | 780 | | | 951 | | | (29) | | 1977 | | 02/12/2018 |
Restaurants – Full Service | | Edinboro | | PA | | | | | | 231 | | | 673 | | | - | | | - | | | 231 | | | 673 | | | 904 | | | (27) | | 1973 | | 02/12/2018 |
Restaurants – Full Service | | Erie | | PA | | | | | | 223 | | | 812 | | | - | | | 100 | | | 223 | | | 912 | | | 1,135 | | | (30) | | 1973 | | 02/12/2018 |
Restaurants – Full Service | | Erie | | PA | | | | | | 389 | | | 656 | | | - | | | 100 | | | 389 | | | 756 | | | 1,145 | | | (28) | | 1973 | | 02/12/2018 |
Restaurants – Full Service | | Erie | | PA | | | | | | 155 | | | 608 | | | - | | | 100 | | | 155 | | | 708 | | | 863 | | | (22) | | 1973 | | 02/12/2018 |
Restaurants – Full Service | | Grove City | | PA | | | | | | 208 | | | 705 | | | - | | | 100 | | | 208 | | | 805 | | | 1,013 | | | (30) | | 1976 | | 02/12/2018 |
Restaurants – Full Service | | Hermitage | | PA | | | | | | 517 | | | 971 | | | - | | | - | | | 517 | | | 971 | | | 1,488 | | | (43) | | 1978 | | 02/12/2018 |
Restaurants – Full Service | | Indiana | | PA | | | | | | 227 | | | 507 | | | - | | | - | | | 227 | | | 507 | | | 734 | | | (21) | | 1978 | | 02/12/2018 |
Restaurants – Full Service | | Meadville | | PA | | | | | | 364 | | | 1,584 | | | - | | | - | | | 364 | | | 1,584 | | | 1,948 | | | (61) | | 1983 | | 02/12/2018 |
Restaurants – Full Service | | Titusville | | PA | | | | | | 132 | | | 574 | | | - | | | - | | | 132 | | | 574 | | | 706 | | | (22) | | 1979 | | 02/12/2018 |
Restaurants – Full Service | | Warren | | PA | | | | | | 244 | | | 1,047 | | | - | | | - | | | 244 | | | 1,047 | | | 1,291 | | | (43) | | 1970 | | 02/12/2018 |
Automotive Repair and Maintenance | | Winston-Salem | | NC | | | (f) | | | 1,321 | | | 3,254 | | | - | | | - | | | 1,321 | | | 3,254 | | | 4,575 | | | (88) | | 2017 | | 02/13/2018 |
Automotive Repair and Maintenance | | Winston-Salem | | NC | | | | | | 1,926 | | | 2,912 | | | - | | | - | | | 1,926 | | | 2,912 | | | 4,838 | | | (85) | | 2016 | | 02/13/2018 |
Automotive Repair and Maintenance | | Little Rock | | AR | | | (f) | | | 1,190 | | | 3,179 | | | - | | | - | | | 1,190 | | | 3,179 | | | 4,369 | | | (102) | | 1999 | | 02/20/2018 |
Other Personal Services | | Madison | | WI | | | (f) | | | 694 | | | 1,083 | | | - | | | - | | | 694 | | | 1,083 | | | 1,777 | | | (51) | | 1972 | | 02/22/2018 |
Other Professional, Scientific, and Technical Services | | Danville | | IL | | | | | | 199 | | | 1,142 | | | - | | | - | | | 199 | | | 1,142 | | | 1,341 | | | (38) | | 1997 | | 02/28/2018 |
Outpatient Care Centers | | Virginia Beach | | VA | | | | | | 416 | | | 761 | | | - | | | - | | | 416 | | | 761 | | | 1,177 | | | (35) | | 1981 | | 02/28/2018 |
Offices of Dentists | | Palatine | | IL | | | | | | 408 | | | 1,118 | | | - | | | - | | | 408 | | | 1,118 | | | 1,526 | | | (37) | | 1991 | | 03/05/2018 |
Office Furniture (including Fixtures) Manufacturing | | Jasper | | GA | | | | | | 1,705 | | | 5,236 | | | - | | | - | | | 1,705 | | | 5,236 | | | 6,941 | | | (238) | | 1981 | | 03/09/2018 |
Office Furniture (including Fixtures) Manufacturing | | Royston | | GA | | | | | | 1,972 | | | 5,106 | | | - | | | - | | | 1,972 | | | 5,106 | | | 7,078 | | | (270) | | 1965 | | 03/09/2018 |
Paint, Coating, and Adhesive Manufacturing | | Phoenix | | AZ | | | | | | 799 | | | 4,503 | | | - | | | - | | | 799 | | | 4,503 | | | 5,302 | | | (107) | | 2016 | | 03/13/2018 |
Other Professional, Scientific, and Technical Services | | Arlington | | TX | | | | | | 817 | | | 3,139 | | | - | | | - | | | 817 | | | 3,139 | | | 3,956 | | | (76) | | 1997 | | 03/14/2018 |
Other Professional, Scientific, and Technical Services | | Brownsville | | TX | | | | | | 53 | | | 348 | | | - | | | 500 | | | 53 | | | 848 | | | 901 | | | (9) | | 1993 | | 03/16/2018 |
Other Professional, Scientific, and Technical Services | | Port Isabel | | TX | | | | | | 196 | | | 277 | | | - | | | - | | | 196 | | | 277 | | | 473 | | | (10) | | 1996 | | 03/16/2018 |
Child Day Care Services | | Doral | | FL | | | | | | 746 | | | 1,793 | | | - | | | - | | | 746 | | | 1,793 | | | 2,539 | | | (43) | | 2001 | | 03/19/2018 |
Car Dealers | | Tempe | | AZ | | | | | | 3,009 | | | 3,267 | | | 466 | | | 1,203 | | | 3,475 | | | 4,470 | | | 7,945 | | | (84) | | 2018 | | 03/23/2018 |
Forging and Stamping | | Sterling Heights | | MI | | | | | | 2,697 | | | 14,754 | | | - | | | - | | | 2,697 | | | 14,754 | | | 17,451 | | | (405) | | 1977 | | 03/23/2018 |
Restaurants – Limited Service | | Akron | | OH | | | | | | 114 | | | 980 | | | - | | | - | | | 114 | | | 980 | | | 1,094 | | | (27) | | 1950 | | 03/23/2018 |
Restaurants – Limited Service | | Ashland | | OH | | | | | | 176 | | | 1,089 | | | - | | | - | | | 176 | | | 1,089 | | | 1,265 | | | (32) | | 1969 | | 03/23/2018 |
| | | | | | | | | | | | | | | | | | | | | | | | | | | | | | | | | | | |
Descriptions (a) | | | | Initial Cost to Company | | Costs Capitalized Subsequent to Acquisition | | Gross amount at December 31, 2018 (b) (c) | | | | | | |
Tenant Industry | | City | | St | | Encumbrances | | Land &
Improvements | | Building &
Improvements | | Land &
Improvements | | Building &
Improvements | | Land &
Improvements | | Building &
Improvements | | Total | | Accumulated
Depreciation (d) (e) | | Year
Constructed | | Date Acquired |
Restaurants – Limited Service | | Blairsville | | PA | | | | | | 194 | | | 1,332 | | | - | | | - | | | 194 | | | 1,332 | | | 1,526 | | | (41) | | 1997 | | 03/23/2018 |
Restaurants – Limited Service | | Leechburg | | PA | | | | | | 275 | | | 1,161 | | | - | | | - | | | 275 | | | 1,161 | | | 1,436 | | | (35) | | 1970 | | 03/23/2018 |
Restaurants – Full Service | | Conyers | | GA | | | | | | 823 | | | 1,309 | | | - | | | - | | | 823 | | | 1,309 | | | 2,132 | | | (48) | | 1993 | | 03/28/2018 |
Restaurants – Full Service | | Fayetteville | | GA | | | | | | 781 | | | 1,475 | | | - | | | - | | | 781 | | | 1,475 | | | 2,256 | | | (48) | | 1993 | | 03/28/2018 |
Restaurants – Full Service | | Baton Rouge | | LA | | | | | | 1,487 | | | 1,194 | | | - | | | - | | | 1,487 | | | 1,194 | | | 2,681 | | | (46) | | 1994 | | 03/28/2018 |
Restaurants – Full Service | | Baton Rouge | | LA | | | | | | 2,091 | | | 1,258 | | | - | | | - | | | 2,091 | | | 1,258 | | | 3,349 | | | (51) | | 1983 | | 03/28/2018 |
Restaurants – Full Service | | Covington | | LA | | | | | | 1,026 | | | 759 | | | - | | | - | | | 1,026 | | | 759 | | | 1,785 | | | (34) | | 2003 | | 03/28/2018 |
Restaurants – Full Service | | Gretna | | LA | | | | | | 1,089 | | | 1,589 | | | - | | | - | | | 1,089 | | | 1,589 | | | 2,678 | | | (55) | | 1983 | | 03/28/2018 |
Restaurants – Full Service | | Memphis | | TN | | | | | | 718 | | | 2,548 | | | - | | | - | | | 718 | | | 2,548 | | | 3,266 | | | (88) | | 1985 | | 03/28/2018 |
Car Dealers | | Akron | | OH | | | | | | 2,089 | | | 2,426 | | | - | | | - | | | 2,089 | | | 2,426 | | | 4,515 | | | (64) | | 2013 | | 03/29/2018 |
Car Dealers | | Beachwood | | OH | | | | | | 2,829 | | | 6,791 | | | - | | | - | | | 2,829 | | | 6,791 | | | 9,620 | | | (159) | | 2015 | | 03/29/2018 |
Car Dealers | | Cleveland | | OH | | | | | | 1,716 | | | 4,171 | | | - | | | - | | | 1,716 | | | 4,171 | | | 5,887 | | | (96) | | 2009 | | 03/29/2018 |
Restaurants – Full Service | | Brookings | | SD | | | | | | 951 | | | 1,805 | | | - | | | - | | | 951 | | | 1,805 | | | 2,756 | | | (46) | | 2003 | | 03/29/2018 |
Health Clubs | | Mesa | | AZ | | | | | | 1,626 | | | 4,716 | | | - | | | - | | | 1,626 | | | 4,716 | | | 6,342 | | | (131) | | 1998 | | 03/30/2018 |
Machinery, Equipment, and Supplies Merchant Wholesalers | | Muscatine | | IA | | | | | | 775 | | | 4,118 | | | 660 | | | 4,963 | | | 1,435 | | | 9,081 | | | 10,516 | | | (187) | | 1974 | | 03/30/2018 |
Machinery, Equipment, and Supplies Merchant Wholesalers | | Fairbury | | IL | | | | | | 127 | | | 404 | | | - | | | - | | | 127 | | | 404 | | | 531 | | | (20) | | 1975 | | 03/30/2018 |
Other Motor Vehicle Dealers | | Meredith | | NH | | | | | | 389 | | | 6,333 | | | - | | | - | | | 389 | | | 6,333 | | | 6,722 | | | (120) | | 2003 | | 03/30/2018 |
Other Motor Vehicle Dealers | | North Conway | | NH | | | | | | 53 | | | 544 | | | - | | | - | | | 53 | | | 544 | | | 597 | | | (14) | | 1975 | | 03/30/2018 |
Machinery, Equipment, and Supplies Merchant Wholesalers | | Wayland | | NY | | | | | | 133 | | | 416 | | | - | | | - | | | 133 | | | 416 | | | 549 | | | (17) | | 1986 | | 03/30/2018 |
Other Professional, Scientific, and Technical Services | | Houston | | TX | | | | | | 311 | | | 757 | | | - | | | - | | | 311 | | | 757 | | | 1,068 | | | (22) | | 2002 | | 03/30/2018 |
Other Professional, Scientific, and Technical Services | | Hurst | | TX | | | | | | 288 | | | 598 | | | - | | | - | | | 288 | | | 598 | | | 886 | | | (14) | | 1997 | | 03/30/2018 |
Other Professional, Scientific, and Technical Services | | Manvel | | TX | | | | | | 307 | | | 461 | | | - | | | - | | | 307 | | | 461 | | | 768 | | | (17) | | 1972 | | 03/30/2018 |
Furniture Stores | | Towson | | MD | | | | | | 1,039 | | | 7,618 | | | - | | | - | | | 1,039 | | | 7,618 | | | 8,657 | | | (205) | | 1963 | | 04/06/2018 |
Furniture Stores | | Altoona | | PA | | | | | | 1,322 | | | 7,316 | | | - | | | - | | | 1,322 | | | 7,316 | | | 8,638 | | | (174) | | 1978 | | 04/06/2018 |
Furniture Stores | | Mount Pleasant | | PA | | | | | | 102 | | | 3,308 | | | - | | | - | | | 102 | | | 3,308 | | | 3,410 | | | (86) | | 1924 | | 04/06/2018 |
Fabric Mills | | Spring City | | PA | | | | | | 1,858 | | | 4,024 | | | - | | | - | | | 1,858 | | | 4,024 | | | 5,882 | | | (136) | | 1989 | | 04/12/2018 |
Fabric Mills | | Independence | | VA | | | | | | 698 | | | 627 | | | - | | | - | | | 698 | | | 627 | | | 1,325 | | | (19) | | 1979 | | 04/12/2018 |
Other Personal Services | | Winter Garden | | FL | | | | | | 1,249 | | | 130 | | | - | | | 3,111 | | | 1,249 | | | 3,241 | | | 4,490 | | | - | | | | 04/13/2018 |
Other Personal Services | | Greenville | | SC | | | | | | 837 | | | 1,202 | | | 1,044 | | | 1,286 | | | 1,881 | | | 2,488 | | | 4,369 | | | (22) | | 2018 | | 04/13/2018 |
Other Personal Services | | Indian Land | | SC | | | | | | 464 | | | 185 | | | - | | | 1,112 | | | 464 | | | 1,297 | | | 1,761 | | | - | | | | 04/13/2018 |
Other Professional, Scientific, and Technical Services | | Harlingen | | TX | | | | | | 414 | | | 547 | | | - | | | - | | | 414 | | | 547 | | | 961 | | | (28) | | 2000 | | 04/13/2018 |
Restaurants – Limited Service | | Auburn | | IN | | | | | | 269 | | | 345 | | | - | | | - | | | 269 | | | 345 | | | 614 | | | (17) | | 1968 | | 04/18/2018 |
Restaurants – Limited Service | | Elkhart | | IN | | | | | | 193 | | | 312 | | | - | | | - | | | 193 | | | 312 | | | 505 | | | (14) | | 1984 | | 04/18/2018 |
Restaurants – Limited Service | | Elkhart | | IN | | | | | | 274 | | | 409 | | | - | | | - | | | 274 | | | 409 | | | 683 | | | (18) | | 1980 | | 04/18/2018 |
Restaurants – Limited Service | | Fort Wayne | | IN | | | | | | 213 | | | 262 | | | - | | | - | | | 213 | | | 262 | | | 475 | | | (14) | | 1985 | | 04/18/2018 |
Restaurants – Limited Service | | Goshen | | IN | | | | | | 242 | | | 243 | | | - | | | - | | | 242 | | | 243 | | | 485 | | | (12) | | 1971 | | 04/18/2018 |
Restaurants – Limited Service | | Marion | | IN | | | | | | 215 | | | 251 | | | - | | | - | | | 215 | | | 251 | | | 466 | | | (13) | | 1968 | | 04/18/2018 |
Restaurants – Limited Service | | Plymouth | | IN | | | | | | 191 | | | 363 | | | - | | | - | | | 191 | | | 363 | | | 554 | | | (12) | | 1973 | | 04/18/2018 |
Restaurants – Limited Service | | Syracuse | | IN | | | | | | 166 | | | 200 | | | - | | | - | | | 166 | | | 200 | | | 366 | | | (10) | | 1978 | | 04/18/2018 |
Restaurants – Limited Service | | Wabash | | IN | | | | | | 346 | | | 267 | | | - | | | - | | | 346 | | | 267 | | | 613 | | | (13) | | 1959 | | 04/18/2018 |
Restaurants – Limited Service | | Warsaw | | IN | | | | | | 279 | | | 374 | | | - | | | - | | | 279 | | | 374 | | | 653 | | | (14) | | 1970 | | 04/18/2018 |
Restaurants – Limited Service | | Warsaw | | IN | | | | | | 310 | | | 284 | | | - | | | - | | | 310 | | | 284 | | | 594 | | | (14) | | 1964 | | 04/18/2018 |
Other Professional, Scientific, and Technical Services | | Garland | | TX | | | | | | 297 | | | 360 | | | - | | | - | | | 297 | | | 360 | | | 657 | | | (15) | | 1965 | | 04/23/2018 |
Plastics Product Manufacturing | | Rochester | | NY | | | | | | 650 | | | 4,107 | | | - | | | - | | | 650 | | | 4,107 | | | 4,757 | | | (156) | | 1998 | | 04/27/2018 |
Plastics Product Manufacturing | | Circleville | | OH | | | | | | 834 | | | 5,574 | | | - | | | - | | | 834 | | | 5,574 | | | 6,408 | | | (203) | | 1966 | | 04/27/2018 |
Plastics Product Manufacturing | | Columbus | | OH | | | | | | 502 | | | 1,842 | | | - | | | - | | | 502 | | | 1,842 | | | 2,344 | | | (50) | | 1984 | | 04/27/2018 |
Plastics Product Manufacturing | | Marion | | OH | | | | | | 2,591 | | | 8,000 | | | - | | | - | | | 2,591 | | | 8,000 | | | 10,591 | | | (338) | | 1999 | | 04/27/2018 |
Family Entertainment Centers | | Lubbock | | TX | | | | | | 962 | | | - | | | - | | | 2,759 | | | 962 | | | 2,759 | | | 3,721 | | | - | | | | 04/27/2018 |
Other Fabricated Metal Product Manufacturing | | Grand Junction | | CO | | | | | | 390 | | | 1,789 | | | - | | | 370 | | | 390 | | | 2,159 | | | 2,549 | | | (45) | | 1976 | | 04/30/2018 |
Other Professional, Scientific, and Technical Services | | Newnan | | GA | | | | | | 743 | | | 1,544 | | | - | | | - | | | 743 | | | 1,544 | | | 2,287 | | | (43) | | 2008 | | 05/07/2018 |
| | | | | | | | | | | | | | | | | | | | | | | | | | | | | | | | | | | |
Descriptions (a) | | | | Initial Cost to Company | | Costs Capitalized Subsequent to Acquisition | | Gross amount at December 31, 2018 (b) (c) | | | | | | |
Tenant Industry | | City | | St | | Encumbrances | | Land &
Improvements | | Building &
Improvements | | Land &
Improvements | | Building &
Improvements | | Land &
Improvements | | Building &
Improvements | | Total | | Accumulated
Depreciation (d) (e) | | Year
Constructed | | Date Acquired |
Other Professional, Scientific, and Technical Services | | Oxford | | MS | | | | | | 490 | | | 1,035 | | | - | | | - | | | 490 | | | 1,035 | | | 1,525 | | | (33) | | 1974 | | 05/07/2018 |
Automotive Repair and Maintenance | | Eden Prairie | | MN | | | | | | 920 | | | 2,059 | | | - | | | 75 | | | 920 | | | 2,134 | | | 3,054 | | | (78) | | 1960 | | 05/10/2018 |
Semiconductor and Other Electronic Component Manufacturing | | Rochester | | NY | | | | | | 337 | | | 1,674 | | | - | | | - | | | 337 | | | 1,674 | | | 2,011 | | | (65) | | 1971 | | 05/11/2018 |
Other Professional, Scientific, and Technical Services | | Centennial | | CO | | | | | | 413 | | | 1,412 | | | 387 | | | 737 | | | 800 | | | 2,149 | | | 2,949 | | | (32) | | 2008 | | 05/15/2018 |
Restaurants – Limited Service | | Warsaw | | IN | | | | | | 276 | | | 290 | | | - | | | - | | | 276 | | | 290 | | | 566 | | | (15) | | 1988 | | 05/15/2018 |
Other Professional, Scientific, and Technical Services | | Haines City | | FL | | | | | | 211 | | | 596 | | | - | | | - | | | 211 | | | 596 | | | 807 | | | (21) | | 1950 | | 05/18/2018 |
Bowling Centers | | Buford | | GA | | | (f) | | | 1,103 | | | 2,702 | | | - | | | - | | | 1,103 | | | 2,702 | | | 3,805 | | | (66) | | 2004 | | 05/22/2018 |
Bowling Centers | | Loganville | | GA | | | (f) | | | 883 | | | 3,323 | | | - | | | - | | | 883 | | | 3,323 | | | 4,206 | | | (77) | | 2007 | | 05/22/2018 |
Bowling Centers | | Stone Mountain | | GA | | | (f) | | | 1,458 | | | 3,549 | | | - | | | - | | | 1,458 | | | 3,549 | | | 5,007 | | | (119) | | 1996 | | 05/22/2018 |
Restaurants – Full Service | | Orange Village | | OH | | | | | | 2,448 | | | - | | | 449 | | | 5,191 | | | 2,897 | | | 5,191 | | | 8,088 | | | (13) | | 2018 | | 05/23/2018 |
Other Professional, Scientific, and Technical Services | | New Port Richey | | FL | | | | | | 240 | | | 292 | | | - | | | - | | | 240 | | | 292 | | | 532 | | | (11) | | 1985 | | 05/30/2018 |
Restaurants – Full Service | | St. Charles | | IL | | | | | | 1,220 | | | 3,802 | | | 4 | | | 14 | | | 1,224 | | | 3,816 | | | 5,040 | | | (74) | | 2017 | | 05/30/2018 |
Death Care Services | | Snellville | | GA | | | | | | 1,733 | | | 3,921 | | | - | | | - | | | 1,733 | | | 3,921 | | | 5,654 | | | (75) | | 1984 | | 06/01/2018 |
Automotive Repair and Maintenance | | Washington | | MO | | | | | | 1,132 | | | 488 | | | 424 | | | 1,273 | | | 1,556 | | | 1,761 | | | 3,317 | | | (18) | | 2018 | | 06/01/2018 |
Death Care Services | | Newland | | NC | | | | | | 515 | | | 1,548 | | | - | | | - | | | 515 | | | 1,548 | | | 2,063 | | | (36) | | 1989 | | 06/01/2018 |
Death Care Services | | Spruce Pine | | NC | | | | | | 396 | | | 1,247 | | | - | | | - | | | 396 | | | 1,247 | | | 1,643 | | | (27) | | 1951 | | 06/01/2018 |
Death Care Services | | Bristol | | TN | | | | | | 772 | | | 1,991 | | | - | | | - | | | 772 | | | 1,991 | | | 2,763 | | | (36) | | 1948 | | 06/01/2018 |
Death Care Services | | Elizabethton | | TN | | | | | | 814 | | | 3,949 | | | - | | | - | | | 814 | | | 3,949 | | | 4,763 | | | (67) | | 1950 | | 06/01/2018 |
Death Care Services | | Elizabethton | | TN | | | | | | 406 | | | 2,607 | | | - | | | - | | | 406 | | | 2,607 | | | 3,013 | | | (54) | | 1920 | | 06/01/2018 |
Death Care Services | | Roan Mountain | | TN | | | | | | 144 | | | 569 | | | - | | | - | | | 144 | | | 569 | | | 713 | | | (12) | | 1974 | | 06/01/2018 |
Other Professional, Scientific, and Technical Services | | Texarkana | | TX | | | | | | 300 | | | 720 | | | - | | | - | | | 300 | | | 720 | | | 1,020 | | | (18) | | 1989 | | 06/01/2018 |
Death Care Services | | Bristol | | VA | | | | | | 689 | | | 1,116 | | | - | | | - | | | 689 | | | 1,116 | | | 1,805 | | | (29) | | 1970 | | 06/01/2018 |
Death Care Services | | Damascus | | VA | | | | | | 309 | | | 2,575 | | | - | | | - | | | 309 | | | 2,575 | | | 2,884 | | | (44) | | 1921 | | 06/01/2018 |
Other Professional, Scientific, and Technical Services | | Melissa | | TX | | | | | | 297 | | | 608 | | | - | | | - | | | 297 | | | 608 | | | 905 | | | (16) | | 2007 | | 06/04/2018 |
Outpatient Care Centers | | Bessemer | | AL | | | | | | 297 | | | 730 | | | - | | | - | | | 297 | | | 730 | | | 1,027 | | | (21) | | 2000 | | 06/06/2018 |
Offices of Physicians | | Douglas | | GA | | | | | | 53 | | | 471 | | | - | | | - | | | 53 | | | 471 | | | 524 | | | (10) | | 1999 | | 06/06/2018 |
Offices of Physicians | | Tifton | | GA | | | | | | 172 | | | 822 | | | 21 | | | 327 | | | 193 | | | 1,149 | | | 1,342 | | | (20) | | 1990 | | 06/06/2018 |
Offices of Physicians | | Valdosta | | GA | | | | | | 622 | | | 2,625 | | | - | | | - | | | 622 | | | 2,625 | | | 3,247 | | | (43) | | 2017 | | 06/06/2018 |
Metalworking Machinery Manufacturing | | Fenton | | MI | | | | | | 499 | | | 2,222 | | | - | | | - | | | 499 | | | 2,222 | | | 2,721 | | | (75) | | 1968 | | 06/07/2018 |
Metalworking Machinery Manufacturing | | Temperance | | MI | | | | | | 341 | | | 1,349 | | | - | | | - | | | 341 | | | 1,349 | | | 1,690 | | | (46) | | 1987 | | 06/07/2018 |
Household and Institutional Furniture and Kitchen Cabinet Manufacturing | | New Albany | | MS | | | | | | 2,346 | | | 15,393 | | | - | | | - | | | 2,346 | | | 15,393 | | | 17,739 | | | (327) | | 1995 | | 06/07/2018 |
Other Professional, Scientific, and Technical Services | | Ruskin | | FL | | | | | | 222 | | | 913 | | | - | | | - | | | 222 | | | 913 | | | 1,135 | | | (22) | | 1965 | | 06/11/2018 |
Child Day Care Services | | Bloomington | | MN | | | | | | 637 | | | 645 | | | - | | | 150 | | | 637 | | | 795 | | | 1,432 | | | (27) | | 1988 | | 06/14/2018 |
Automotive Repair and Maintenance | | Arnold | | MO | | | | | | 1,003 | | | 328 | | | 629 | | | 1,330 | | | 1,632 | | | 1,658 | | | 3,290 | | | (14) | | 2018 | | 06/15/2018 |
Furniture Stores | | Succasunna | | NJ | | | | | | 777 | | | 3,640 | | | - | | | - | | | 777 | | | 3,640 | | | 4,417 | | | (75) | | 1946 | | 06/15/2018 |
Car Dealers | | Indianapolis | | IN | | | | | | 512 | | | 611 | | | 797 | | | 3,250 | | | 1,309 | | | 3,861 | | | 5,170 | | | - | | 2018 | | 06/22/2018 |
Automotive Repair and Maintenance | | Eureka | | MO | | | | | | 754 | | | 362 | | | 646 | | | 1,383 | | | 1,400 | | | 1,745 | | | 3,145 | | | (7) | | 2018 | | 06/22/2018 |
Health Clubs | | Columbus | | OH | | | | | | 605 | | | 1,143 | | | - | | | - | | | 605 | | | 1,143 | | | 1,748 | | | (26) | | 2014 | | 06/22/2018 |
Restaurants – Limited Service | | Abbeville | | SC | | | | | | 503 | | | 905 | | | - | | | - | | | 503 | | | 905 | | | 1,408 | | | (27) | | 1990 | | 06/22/2018 |
Restaurants – Limited Service | | Greenwood | | SC | | | | | | 488 | | | 668 | | | - | | | - | | | 488 | | | 668 | | | 1,156 | | | (20) | | 1987 | | 06/22/2018 |
Restaurants – Limited Service | | Greenwood | | SC | | | | | | 402 | | | 955 | | | - | | | - | | | 402 | | | 955 | | | 1,357 | | | (22) | | 1996 | | 06/22/2018 |
Restaurants – Limited Service | | Honea Path | | SC | | | | | | 360 | | | 1,017 | | | - | | | - | | | 360 | | | 1,017 | | | 1,377 | | | (27) | | 1994 | | 06/22/2018 |
Restaurants – Limited Service | | Iva | | SC | | | | | | 791 | | | 547 | | | - | | | 300 | | | 791 | | | 847 | | | 1,638 | | | (26) | | 1998 | | 06/22/2018 |
Restaurants – Limited Service | | Laurens | | SC | | | | | | 356 | | | 850 | | | - | | | - | | | 356 | | | 850 | | | 1,206 | | | (20) | | 1989 | | 06/22/2018 |
Restaurants – Limited Service | | Newberry | | SC | | | | | | 881 | | | 497 | | | - | | | 382 | | | 881 | | | 879 | | | 1,760 | | | (17) | | 1999 | | 06/22/2018 |
Restaurants – Limited Service | | Saluda | | SC | | | | | | 260 | | | 907 | | | - | | | - | | | 260 | | | 907 | | | 1,167 | | | (21) | | 1992 | | 06/22/2018 |
Restaurants – Limited Service | | Ware Shoals | | SC | | | | | | 290 | | | 475 | | | ��- | | | 300 | | | 290 | | | 775 | | | 1,065 | | | (15) | | 1997 | | 06/22/2018 |
Restaurants – Full Service | | Colorado Springs | | CO | | | | | | 406 | | | 879 | | | - | | | - | | | 406 | | | 879 | | | 1,285 | | | (18) | | 1986 | | 06/26/2018 |
Restaurants – Full Service | | La Junta | | CO | | | | | | 161 | | | 943 | | | - | | | - | | | 161 | | | 943 | | | 1,104 | | | (15) | | 1974 | | 06/26/2018 |
Restaurants – Full Service | | Lamar | | CO | | | | | | 174 | | | 600 | | | - | | | - | | | 174 | | | 600 | | | 774 | | | (11) | | 1972 | | 06/26/2018 |
| | | | | | | | | | | | | | | | | | | | | | | | | | | | | | | | | | | |
Descriptions (a) | | | | Initial Cost to Company | | Costs Capitalized Subsequent to Acquisition | | Gross amount at December 31, 2018 (b) (c) | | | | | | |
Tenant Industry | | City | | St | | Encumbrances | | Land &
Improvements | | Building &
Improvements | | Land &
Improvements | | Building &
Improvements | | Land &
Improvements | | Building &
Improvements | | Total | | Accumulated
Depreciation (d) (e) | | Year
Constructed | | Date Acquired |
Restaurants – Full Service | | Atchison | | KS | | | | | | 285 | | | 960 | | | - | | | - | | | 285 | | | 960 | | | 1,245 | | | (16) | | 1969 | | 06/26/2018 |
Restaurants – Full Service | | Gardner | | KS | | | | | | 438 | | | 1,127 | | | - | | | - | | | 438 | | | 1,127 | | | 1,565 | | | (23) | | 1977 | | 06/26/2018 |
Restaurants – Full Service | | Hays | | KS | | | | | | 254 | | | 770 | | | - | | | - | | | 254 | | | 770 | | | 1,024 | | | (15) | | 1978 | | 06/26/2018 |
Restaurants – Full Service | | Hutchinson | | KS | | | | | | 305 | | | 1,229 | | | - | | | - | | | 305 | | | 1,229 | | | 1,534 | | | (21) | | 1977 | | 06/26/2018 |
Restaurants – Full Service | | Hutchinson | | KS | | | | | | 117 | | | 828 | | | - | | | - | | | 117 | | | 828 | | | 945 | | | (13) | | 2003 | | 06/26/2018 |
Restaurants – Full Service | | Lansing | | KS | | | | | | 228 | | | 1,067 | | | - | | | - | | | 228 | | | 1,067 | | | 1,295 | | | (21) | | 1975 | | 06/26/2018 |
Restaurants – Full Service | | Leavenworth | | KS | | | | | | 248 | | | 756 | | | - | | | - | | | 248 | | | 756 | | | 1,004 | | | (14) | | 2008 | | 06/26/2018 |
Restaurants – Full Service | | Olathe | | KS | | | | | | 426 | | | 989 | | | - | | | - | | | 426 | | | 989 | | | 1,415 | | | (16) | | 1989 | | 06/26/2018 |
Restaurants – Full Service | | Russell | | KS | | | | | | 271 | | | 643 | | | - | | | - | | | 271 | | | 643 | | | 914 | | | (14) | | 1982 | | 06/26/2018 |
Restaurants – Full Service | | Holts Summit | | MO | | | | | | 196 | | | 578 | | | - | | | - | | | 196 | | | 578 | | | 774 | | | (13) | | 1995 | | 06/26/2018 |
Restaurants – Full Service | | Knob Noster | | MO | | | | | | 114 | | | 611 | | | - | | | - | | | 114 | | | 611 | | | 725 | | | (10) | | 1987 | | 06/26/2018 |
Restaurants – Full Service | | Mexico | | MO | | | | | | 219 | | | 1,106 | | | - | | | - | | | 219 | | | 1,106 | | | 1,325 | | | (19) | | 1995 | | 06/26/2018 |
Automotive Repair and Maintenance | | Clemmons | | NC | | | (f) | | | 989 | | | 2,338 | | | - | | | - | | | 989 | | | 2,338 | | | 3,327 | | | (37) | | 2018 | | 06/26/2018 |
Child Day Care Services | | Moncks Corner | | SC | | | (f) | | | 501 | | | 4 | | | - | | | 1,897 | | | 501 | | | 1,901 | | | 2,402 | | | - | | | | 06/26/2018 |
Other Professional, Scientific, and Technical Services | | Weslaco | | TX | | | | | | 290 | | | 1,044 | | | - | | | - | | | 290 | | | 1,044 | | | 1,334 | | | (20) | | 1975 | | 06/26/2018 |
Other Personal Services | | Evergreen | | CO | | | | | | 171 | | | 1,047 | | | - | | | - | | | 171 | | | 1,047 | | | 1,218 | | | (18) | | 1968 | | 06/27/2018 |
Death Care Services | | Lawrenceville | | GA | | | | | | 1,224 | | | 2,027 | | | - | | | - | | | 1,224 | | | 2,027 | | | 3,251 | | | (45) | | 1963 | | 06/27/2018 |
Other Personal Services | | Mooresville | | NC | | | | | | 1,073 | | | 2,838 | | | - | | | - | | | 1,073 | | | 2,838 | | | 3,911 | | | (48) | | 2018 | | 06/27/2018 |
Other Professional, Scientific, and Technical Services | | Portland | | OR | | | | | | 326 | | | 444 | | | - | | | - | | | 326 | | | 444 | | | 770 | | | (9) | | 1968 | | 06/27/2018 |
Death Care Services | | Johnson City | | TN | | | | | | 1,766 | | | 2,725 | | | - | | | - | | | 1,766 | | | 2,725 | | | 4,491 | | | (54) | | 2001 | | 06/27/2018 |
Car Dealers | | Oak Brook | | IL | | | | | | 2,110 | | | 472 | | | - | | | 3,754 | | | 2,110 | | | 4,226 | | | 6,336 | | | - | | | | 06/28/2018 |
Other Personal Services | | Huntingdon Valley | | PA | | | (f) | | | 404 | | | 4,205 | | | - | | | - | | | 404 | | | 4,205 | | | 4,609 | | | (58) | | 1964 | | 06/28/2018 |
Family Entertainment Centers | | Southlake | | TX | | | | | | 2,257 | | | 2,578 | | | - | | | 1,000 | | | 2,257 | | | 3,578 | | | 5,835 | | | (77) | | 2005 | | 06/28/2018 |
Family Entertainment Centers | | Clearfield | | UT | | | | | | 720 | | | 3,261 | | | - | | | 981 | | | 720 | | | 4,242 | | | 4,962 | | | (49) | | 2005 | | 06/28/2018 |
Plastics Product Manufacturing | | Thomson | | GA | | | | | | 1,054 | | | 6,796 | | | - | | | - | | | 1,054 | | | 6,796 | | | 7,850 | | | (129) | | 1984 | | 06/29/2018 |
Steel Product Manufacturing from Purchased Steel | | Munhall | | PA | | | | | | 4,461 | | | 5,559 | | | - | | | - | | | 4,461 | | | 5,559 | | | 10,020 | | | (181) | | 1996 | | 06/29/2018 |
Automotive Repair and Maintenance | | Bourbonnais | | IL | | | | | | 444 | | | 2,100 | | | - | | | - | | | 444 | | | 2,100 | | | 2,544 | | | (35) | | 2010 | | 07/02/2018 |
Automotive Repair and Maintenance | | Markham | | IL | | | | | | 391 | | | 2,574 | | | - | | | - | | | 391 | | | 2,574 | | | 2,965 | | | (47) | | 1962 | | 07/02/2018 |
Automotive Repair and Maintenance | | Normal | | IL | | | | | | 396 | | | 2,067 | | | - | | | - | | | 396 | | | 2,067 | | | 2,463 | | | (33) | | 2014 | | 07/02/2018 |
Automotive Repair and Maintenance | | Peoria | | IL | | | | | | 357 | | | 2,035 | | | - | | | - | | | 357 | | | 2,035 | | | 2,392 | | | (32) | | 2013 | | 07/02/2018 |
Automotive Repair and Maintenance | | Peoria | | IL | | | | | | 293 | | | 2,029 | | | - | | | - | | | 293 | | | 2,029 | | | 2,322 | | | (30) | | 2015 | | 07/02/2018 |
Automotive Repair and Maintenance | | Dyer | | IN | | | | | | 748 | | | 2,197 | | | - | | | - | | | 748 | | | 2,197 | | | 2,945 | | | (36) | | 2013 | | 07/02/2018 |
Automotive Repair and Maintenance | | Hammond | | IN | | | | | | 332 | | | 2,051 | | | - | | | - | | | 332 | | | 2,051 | | | 2,383 | | | (32) | | 2012 | | 07/02/2018 |
Household and Institutional Furniture and Kitchen Cabinet Manufacturing | | Grand Rapids | | MI | | | | | | 4,548 | | | 13,067 | | | - | | | - | | | 4,548 | | | 13,067 | | | 17,615 | | | (370) | | 1966 | | 07/06/2018 |
Health Clubs | | Chandler | | AZ | | | | | | 2,662 | | | 988 | | | - | | | 2,860 | | | 2,662 | | | 3,848 | | | 6,510 | | | (27) | | 1993 | | 07/10/2018 |
Other Professional, Scientific, and Technical Services | | Gastonia | | NC | | | | | | 360 | | | 472 | | | - | | | - | | | 360 | | | 472 | | | 832 | | | (14) | | 2001 | | 07/12/2018 |
Health Clubs | | Cape Coral | | FL | | | | | | 2,153 | | | 4,737 | | | - | | | - | | | 2,153 | | | 4,737 | | | 6,890 | | | (73) | | 2008 | | 07/13/2018 |
Child Day Care Services | | Parma | | OH | | | (f) | | | 436 | | | 2,813 | | | - | | | - | | | 436 | | | 2,813 | | | 3,249 | | | (46) | | 2002 | | 07/19/2018 |
Child Day Care Services | | Solon | | OH | | | (f) | | | 361 | | | 2,531 | | | - | | | - | | | 361 | | | 2,531 | | | 2,892 | | | (41) | | 1956 | | 07/19/2018 |
Child Day Care Services | | Strongsville | | OH | | | (f) | | | 741 | | | 1,943 | | | - | | | - | | | 741 | | | 1,943 | | | 2,684 | | | (52) | | 1994 | | 07/19/2018 |
Child Day Care Services | | Westlake | | OH | | | (f) | | | 676 | | | 1,731 | | | - | | | - | | | 676 | | | 1,731 | | | 2,407 | | | (43) | | 1990 | | 07/19/2018 |
Other Personal Services | | Jacksonville | | FL | | | | | | 2,426 | | | 2,383 | | | - | | | - | | | 2,426 | | | 2,383 | | | 4,809 | | | (40) | | 2007 | | 07/20/2018 |
Health Clubs | | Boalsburg | | PA | | | | | | 395 | | | - | | | - | | | - | | | 395 | | | - | | | 395 | | | - | | | | 07/24/2018 |
Car Dealers | | Warrensville Heights | | OH | | | | | | 1,938 | | | 3,462 | | | - | | | - | | | 1,938 | | | 3,462 | | | 5,400 | | | (55) | | 2018 | | 07/26/2018 |
Metal and Mineral Merchant Wholesalers | | South Bend | | IN | | | | | | 496 | | | 2,224 | | | - | | | - | | | 496 | | | 2,224 | | | 2,720 | | | (39) | | 1978 | | 07/31/2018 |
Metal and Mineral Merchant Wholesalers | | Monroe | | MI | | | | | | 1,060 | | | 2,362 | | | - | | | - | | | 1,060 | | | 2,362 | | | 3,422 | | | (44) | | 1997 | | 07/31/2018 |
Metal and Mineral Merchant Wholesalers | | Warren | | MI | | | | | | 227 | | | 2,391 | | | - | | | - | | | 227 | | | 2,391 | | | 2,618 | | | (35) | | 1986 | | 07/31/2018 |
Metal and Mineral Merchant Wholesalers | | Warren | | MI | | | | | | 644 | | | 2,577 | | | - | | | - | | | 644 | | | 2,577 | | | 3,221 | | | (42) | | 1967 | | 07/31/2018 |
Metal and Mineral Merchant Wholesalers | | Green Bay | | WI | | | | | | 1,034 | | | 3,595 | | | - | | | - | | | 1,034 | | | 3,595 | | | 4,629 | | | (64) | | 1967 | | 07/31/2018 |
Automotive Repair and Maintenance | | Hugo | | MN | | | | | | 245 | | | 293 | | | 490 | | | 2,089 | | | 735 | | | 2,382 | | | 3,117 | | | - | | 2018 | | 08/02/2018 |
| | | | | | | | | | | | | | | | | | | | | | | | | | | | | | | | | | | |
Descriptions (a) | | | | Initial Cost to Company | | Costs Capitalized Subsequent to Acquisition | | Gross amount at December 31, 2018 (b) (c) | | | | | | |
Tenant Industry | | City | | St | | Encumbrances | | Land &
Improvements | | Building &
Improvements | | Land &
Improvements | | Building &
Improvements | | Land &
Improvements | | Building &
Improvements | | Total | | Accumulated
Depreciation (d) (e) | | Year
Constructed | | Date Acquired |
Other Professional, Scientific, and Technical Services | | Port Charlotte | | FL | | | | | | 265 | | | 507 | | | - | | | - | | | 265 | | | 507 | | | 772 | | | (9) | | 1993 | | 08/07/2018 |
Other Professional, Scientific, and Technical Services | | Cary | | NC | | | | | | 399 | | | 1,031 | | | - | | | - | | | 399 | | | 1,031 | | | 1,430 | | | (17) | | 1997 | | 08/07/2018 |
Other Professional, Scientific, and Technical Services | | Las Vegas | | NV | | | | | | 215 | | | 808 | | | - | | | - | | | 215 | | | 808 | | | 1,023 | | | (13) | | 1980 | | 08/14/2018 |
Farm and Ranch Supply Stores | | Danville | | IL | | | | | | 1,071 | | | 4,163 | | | - | | | - | | | 1,071 | | | 4,163 | | | 5,234 | | | (65) | | 1986 | | 08/17/2018 |
Farm and Ranch Supply Stores | | Gibson City | | IL | | | | | | 687 | | | 2,311 | | | - | | | - | | | 687 | | | 2,311 | | | 2,998 | | | (36) | | 1976 | | 08/17/2018 |
Farm and Ranch Supply Stores | | Homer Glen | | IL | | | | | | 1,755 | | | 3,519 | | | - | | | - | | | 1,755 | | | 3,519 | | | 5,274 | | | (72) | | 1981 | | 08/17/2018 |
Farm and Ranch Supply Stores | | Pekin | | IL | | | | | | 1,687 | | | 5,604 | | | - | | | - | | | 1,687 | | | 5,604 | | | 7,291 | | | (105) | | 1984 | | 08/17/2018 |
Farm and Ranch Supply Stores | | Pontiac | | IL | | | | | | 434 | | | 3,658 | | | - | | | - | | | 434 | | | 3,658 | | | 4,092 | | | (67) | | 1972 | | 08/17/2018 |
Farm and Ranch Supply Stores | | Rochelle | | IL | | | | | | 1,694 | | | 1,817 | | | - | | | - | | | 1,694 | | | 1,817 | | | 3,511 | | | (43) | | 1986 | | 08/17/2018 |
Farm and Ranch Supply Stores | | Tilton | | IL | | | | | | 662 | | | 4,241 | | | - | | | - | | | 662 | | | 4,241 | | | 4,903 | | | (81) | | 1987 | | 08/17/2018 |
Farm and Ranch Supply Stores | | Watseka | | IL | | | | | | 688 | | | 4,255 | | | - | | | - | | | 688 | | | 4,255 | | | 4,943 | | | (82) | | 1993 | | 08/17/2018 |
Farm and Ranch Supply Stores | | Crawfordsville | | IN | | | | | | 2,099 | | | 4,530 | | | - | | | - | | | 2,099 | | | 4,530 | | | 6,629 | | | (70) | | 1991 | | 08/17/2018 |
Farm and Ranch Supply Stores | | Michigan City | | IN | | | | | | 939 | | | 5,278 | | | - | | | - | | | 939 | | | 5,278 | | | 6,217 | | | (65) | | 1991 | | 08/17/2018 |
Farm and Ranch Supply Stores | | Rochester | | IN | | | | | | 924 | | | 3,428 | | | - | | | - | | | 924 | | | 3,428 | | | 4,352 | | | (52) | | 1990 | | 08/17/2018 |
Farm and Ranch Supply Stores | | Wabash | | IN | | | | | | 1,824 | | | 3,752 | | | - | | | - | | | 1,824 | | | 3,752 | | | 5,576 | | | (79) | | 1991 | | 08/17/2018 |
Farm and Ranch Supply Stores | | Warsaw | | IN | | | | | | 1,615 | | | 5,744 | | | - | | | - | | | 1,615 | | | 5,744 | | | 7,359 | | | (107) | | 1989 | | 08/17/2018 |
Lumber and Other Construction Materials Merchant Wholesalers | | Stillwater | | MN | | | | | | 1,810 | | | 1,236 | | | - | | | - | | | 1,810 | | | 1,236 | | | 3,046 | | | (31) | | 1979 | | 08/17/2018 |
Lumber and Other Construction Materials Merchant Wholesalers | | Hudson | | WI | | | | | | 1,548 | | | 2,828 | | | - | | | - | | | 1,548 | | | 2,828 | | | 4,376 | | | (52) | | 1966 | | 08/17/2018 |
Offices of Physicians | | Boynton Beach | | FL | | | | | | 2,346 | | | 3,210 | | | - | | | - | | | 2,346 | | | 3,210 | | | 5,556 | | | (32) | | 1988 | | 08/21/2018 |
Offices of Physicians | | Wellington | | FL | | | | | | 206 | | | 2,344 | | | - | | | - | | | 206 | | | 2,344 | | | 2,550 | | | (16) | | 2014 | | 08/21/2018 |
Navigational, Measuring, Electromedical, and Control Instruments Manufacturing | | Hartford | | AL | | | | | | 235 | | | 2,657 | | | - | | | - | | | 235 | | | 2,657 | | | 2,892 | | | (32) | | 2004 | | 08/24/2018 |
Child Day Care Services | | Roseville | | MN | | | | | | 440 | | | 1,060 | | | - | | | 140 | | | 440 | | | 1,200 | | | 1,640 | | | (15) | | 1951 | | 08/24/2018 |
Navigational, Measuring, Electromedical, and Control Instruments Manufacturing | | Chattanooga | | TN | | | | | | 2,255 | | | 7,055 | | | - | | | - | | | 2,255 | | | 7,055 | | | 9,310 | | | (85) | | 1985 | | 08/24/2018 |
Outpatient Care Centers | | Chatsworth | | GA | | | | | | 157 | | | 201 | | | - | | | - | | | 157 | | | 201 | | | 358 | | | (5) | | 1966 | | 08/29/2018 |
Restaurants – Full Service | | Ashland | | KY | | | | | | 60 | | | 2,697 | | | - | | | - | | | 60 | | | 2,697 | | | 2,757 | | | (22) | | 1907 | | 08/30/2018 |
Outpatient Care Centers | | Brasstown | | NC | | | | | | 220 | | | 174 | | | - | | | - | | | 220 | | | 174 | | | 394 | | | (4) | | 1993 | | 08/30/2018 |
Restaurants – Full Service | | Barboursville | | WV | | | | | | 578 | | | 1,883 | | | - | | | - | | | 578 | | | 1,883 | | | 2,461 | | | (24) | | 1995 | | 08/30/2018 |
Restaurants – Full Service | | Huntington | | WV | | | | | | 260 | | | 2,891 | | | - | | | - | | | 260 | | | 2,891 | | | 3,151 | | | (26) | | 1960 | | 08/30/2018 |
Restaurants – Full Service | | Hurricane | | WV | | | | | | 815 | | | 2,336 | | | - | | | - | | | 815 | | | 2,336 | | | 3,151 | | | (26) | | 1995 | | 08/30/2018 |
Child Day Care Services | | Jacksonville | | FL | | | | | | 1,002 | | | 1,431 | | | - | | | 286 | | | 1,002 | | | 1,717 | | | 2,719 | | | (19) | | 1991 | | 08/31/2018 |
Automotive Repair and Maintenance | | Cypress | | TX | | | | | | 1,309 | | | 2,200 | | | - | | | - | | | 1,309 | | | 2,200 | | | 3,509 | | | (28) | | 2017 | | 08/31/2018 |
Automotive Repair and Maintenance | | Mission | | TX | | | | | | 1,272 | | | 2,408 | | | - | | | - | | | 1,272 | | | 2,408 | | | 3,680 | | | (30) | | 2017 | | 08/31/2018 |
Automotive Repair and Maintenance | | Pasadena | | TX | | | | | | 1,088 | | | 2,091 | | | - | | | - | | | 1,088 | | | 2,091 | | | 3,179 | | | (26) | | 2017 | | 08/31/2018 |
Architectural and Structural Metals Manufacturing | | Alexandria | | MN | | | | | | 853 | | | 2,832 | | | - | | | - | | | 853 | | | 2,832 | | | 3,685 | | | (45) | | 1976 | | 09/04/2018 |
Architectural and Structural Metals Manufacturing | | Sauk Centre | | MN | | | | | | 859 | | | 5,568 | | | - | | | - | | | 859 | | | 5,568 | | | 6,427 | | | (75) | | 1973 | | 09/04/2018 |
Lumber and Other Construction Materials Merchant Wholesalers | | Glade Valley | | NC | | | | | | 525 | | | 548 | | | - | | | - | | | 525 | | | 548 | | | 1,073 | | | (15) | | 1946 | | 09/04/2018 |
Lumber and Other Construction Materials Merchant Wholesalers | | Mt Airy | | NC | | | | | | 743 | | | 461 | | | - | | | - | | | 743 | | | 461 | | | 1,204 | | | (15) | | 1991 | | 09/04/2018 |
Lumber and Other Construction Materials Merchant Wholesalers | | N Wilkesboro | | NC | | | | | | 740 | | | 283 | | | - | | | - | | | 740 | | | 283 | | | 1,023 | | | (8) | | 1971 | | 09/04/2018 |
Lumber and Other Construction Materials Merchant Wholesalers | | Sparta | | NC | | | | | | 957 | | | 799 | | | - | | | - | | | 957 | | | 799 | | | 1,756 | | | (18) | | 2000 | | 09/04/2018 |
Lumber and Other Construction Materials Merchant Wholesalers | | W Jefferson | | NC | | | | | | 638 | | | 245 | | | - | | | - | | | 638 | | | 245 | | | 883 | | | (10) | | 2009 | | 09/04/2018 |
Architectural and Structural Metals Manufacturing | | Grand Island | | NE | | | | | | 1,599 | | | 5,442 | | | - | | | - | | | 1,599 | | | 5,442 | | | 7,041 | | | (78) | | 2005 | | 09/04/2018 |
Lumber and Other Construction Materials Merchant Wholesalers | | Galax | | VA | | | | | | 676 | | | 558 | | | - | | | - | | | 676 | | | 558 | | | 1,234 | | | (13) | | 1986 | | 09/04/2018 |
Bowling Centers | | Chico | | CA | | | | | | 1,388 | | | 1,802 | | | - | | | - | | | 1,388 | | | 1,802 | | | 3,190 | | | (23) | | 1958 | | 09/07/2018 |
Bowling Centers | | Manteca | | CA | | | | | | 4,834 | | | 3,240 | | | - | | | - | | | 4,834 | | | 3,240 | | | 8,074 | | | (46) | | 2003 | | 09/07/2018 |
Automotive Repair and Maintenance | | Cleveland | | GA | | | (f) | | | 924 | | | 2,246 | | | - | | | - | | | 924 | | | 2,246 | | | 3,170 | | | (28) | | 2018 | | 09/11/2018 |
Other Professional, Scientific, and Technical Services | | Spring | | TX | | | | | | 447 | | | 1,190 | | | - | | | - | | | 447 | | | 1,190 | | | 1,637 | | | (22) | | 1976 | | 09/13/2018 |
Other Professional, Scientific, and Technical Services | | Clayton | | NC | | | | | | 398 | | | 727 | | | - | | | - | | | 398 | | | 727 | | | 1,125 | | | (8) | | 1986 | | 09/18/2018 |
Other Professional, Scientific, and Technical Services | | Flower Mound | | TX | | | | | | 876 | | | 998 | | | - | | | - | | | 876 | | | 998 | | | 1,874 | | | (11) | | 1993 | | 09/18/2018 |
Health Clubs | | Lubbock | | TX | | | | | | 2,140 | | | 2,461 | | | - | | | - | | | 2,140 | | | 2,461 | | | 4,601 | | | (28) | | 2005 | | 09/19/2018 |
Health Clubs | | Lubbock | | TX | | | | | | 2,601 | | | 3,362 | | | - | | | - | | | 2,601 | | | 3,362 | | | 5,963 | | | (46) | | 1980 | | 09/19/2018 |
| | | | | | | | | | | | | | | | | | | | | | | | | | | | | | | | | | | |
Descriptions (a) | | | | Initial Cost to Company | | Costs Capitalized Subsequent to Acquisition | | Gross amount at December 31, 2018 (b) (c) | | | | | | |
Tenant Industry | | City | | St | | Encumbrances | | Land &
Improvements | | Building &
Improvements | | Land &
Improvements | | Building &
Improvements | | Land &
Improvements | | Building &
Improvements | | Total | | Accumulated
Depreciation (d) (e) | | Year
Constructed | | Date Acquired |
Lumber and Other Construction Materials Merchant Wholesalers | | Berryville | | AR | | | | | | 622 | | | 507 | | | - | | | - | | | 622 | | | 507 | | | 1,129 | | | (14) | | 1985 | | 09/25/2018 |
Lumber and Other Construction Materials Merchant Wholesalers | | Fayetteville | | AR | | | | | | 1,790 | | | 1,096 | | | - | | | - | | | 1,790 | | | 1,096 | | | 2,886 | | | (22) | | 1966 | | 09/25/2018 |
Lumber and Other Construction Materials Merchant Wholesalers | | Harrison | | AR | | | | | | 1,050 | | | 516 | | | - | | | - | | | 1,050 | | | 516 | | | 1,566 | | | (14) | | 1996 | | 09/25/2018 |
Lumber and Other Construction Materials Merchant Wholesalers | | Mountain Home | | AR | | | | | | 958 | | | 657 | | | - | | | - | | | 958 | | | 657 | | | 1,615 | | | (14) | | 1973 | | 09/25/2018 |
Lumber and Other Construction Materials Merchant Wholesalers | | Rogers | | AR | | | | | | 1,781 | | | 909 | | | - | | | - | | | 1,781 | | | 909 | | | 2,690 | | | (23) | | 1977 | | 09/25/2018 |
Lumber and Other Construction Materials Merchant Wholesalers | | Springdale | | AR | | | | | | 1,811 | | | 2,519 | | | - | | | - | | | 1,811 | | | 2,519 | | | 4,330 | | | (40) | | 1989 | | 09/25/2018 |
Lumber and Other Construction Materials Merchant Wholesalers | | Anderson | | CA | | | | | | 2,469 | | | 2,215 | | | - | | | - | | | 2,469 | | | 2,215 | | | 4,684 | | | (43) | | 2006 | | 09/25/2018 |
Lumber and Other Construction Materials Merchant Wholesalers | | Chico | | CA | | | | | | 2,179 | | | 480 | | | - | | | - | | | 2,179 | | | 480 | | | 2,659 | | | (24) | | 1983 | | 09/25/2018 |
Lumber and Other Construction Materials Merchant Wholesalers | | Elk Grove | | CA | | | | | | 4,151 | | | 2,044 | | | - | | | - | | | 4,151 | | | 2,044 | | | 6,195 | | | (59) | | 1972 | | 09/25/2018 |
Lumber and Other Construction Materials Merchant Wholesalers | | Jackson | | CA | | | | | | 1,127 | | | 288 | | | - | | | - | | | 1,127 | | | 288 | | | 1,415 | | | (13) | | 1999 | | 09/25/2018 |
Lumber and Other Construction Materials Merchant Wholesalers | | Meyers | | CA | | | | | | 1,306 | | | 464 | | | - | | | - | | | 1,306 | | | 464 | | | 1,770 | | | (15) | | 1961 | | 09/25/2018 |
Lumber and Other Construction Materials Merchant Wholesalers | | Redding | | CA | | | | | | 1,986 | | | 772 | | | - | | | - | | | 1,986 | | | 772 | | | 2,758 | | | (24) | | 1979 | | 09/25/2018 |
Lumber and Other Construction Materials Merchant Wholesalers | | Rocklin | | CA | | | | | | 2,018 | | | 473 | | | - | | | - | | | 2,018 | | | 473 | | | 2,491 | | | (20) | | 1976 | | 09/25/2018 |
Lumber and Other Construction Materials Merchant Wholesalers | | South Lake Tahoe | | CA | | | | | | 1,569 | | | 379 | | | - | | | - | | | 1,569 | | | 379 | | | 1,948 | | | (20) | | 1967 | | 09/25/2018 |
Lumber and Other Construction Materials Merchant Wholesalers | | Vacaville | | CA | | | | | | 1,734 | | | 530 | | | - | | | - | | | 1,734 | | | 530 | | | 2,264 | | | (22) | | 1985 | | 09/25/2018 |
Lumber and Other Construction Materials Merchant Wholesalers | | Yuba City | | CA | | | | | | 1,948 | | | 366 | | | - | | | - | | | 1,948 | | | 366 | | | 2,314 | | | (17) | | 1986 | | 09/25/2018 |
Lumber and Other Construction Materials Merchant Wholesalers | | Bolivar | | MO | | | | | | 811 | | | 374 | | | - | | | - | | | 811 | | | 374 | | | 1,185 | | | (13) | | 1978 | | 09/25/2018 |
Lumber and Other Construction Materials Merchant Wholesalers | | Branson | | MO | | | | | | 1,182 | | | 204 | | | - | | | - | | | 1,182 | | | 204 | | | 1,386 | | | (10) | | 1977 | | 09/25/2018 |
Lumber and Other Construction Materials Merchant Wholesalers | | Buffalo | | MO | | | | | | 764 | | | 513 | | | - | | | - | | | 764 | | | 513 | | | 1,277 | | | (16) | | 1969 | | 09/25/2018 |
Lumber and Other Construction Materials Merchant Wholesalers | | Columbia | | MO | | | | | | 916 | | | 509 | | | - | | | - | | | 916 | | | 509 | | | 1,425 | | | (18) | | 2002 | | 09/25/2018 |
Lumber and Other Construction Materials Merchant Wholesalers | | El Dorado Springs | | MO | | | | | | 418 | | | 325 | | | - | | | - | | | 418 | | | 325 | | | 743 | | | (11) | | 1949 | | 09/25/2018 |
Lumber and Other Construction Materials Merchant Wholesalers | | Jefferson City | | MO | | | | | | 985 | | | 430 | | | - | | | - | | | 985 | | | 430 | | | 1,415 | | | (16) | | 1983 | | 09/25/2018 |
Lumber and Other Construction Materials Merchant Wholesalers | | Joplin | | MO | | | | | | 1,345 | | | 209 | | | - | | | - | | | 1,345 | | | 209 | | | 1,554 | | | (14) | | 1978 | | 09/25/2018 |
Lumber and Other Construction Materials Merchant Wholesalers | | Lebanon | | MO | | | | | | 699 | | | 418 | | | - | | | - | | | 699 | | | 418 | | | 1,117 | | | (13) | | 1984 | | 09/25/2018 |
| | | | | | | | | | | | | | | | | | | | | | | | | | | | | | | | | | | |
| | | | | | | | | | | | | | | | | | | | | | | | | | | | | | | | | | | |
| | | | | | | | | | | | | | | | | | | | | | | | | | | | | | | | | | | |
| | | | | | | | | | | | | | | | | | | | | | | | | | | | | | | | | | | |
| | | | | | | | | | | | | | | | | | | | | | | | | | | | | | | | | | | |
| | | | | | | | | | | | | | | | | | | | | | | | | | | | | | | | | | | |
| | | | | | | | | | | | | | | | | | | | | | | | | | | | | | | | | | | |
| | | | | | | | | | | | | | | | | | | | | | | | | | | | | | | | | | | |
| | | | | | | | | | | | | | | | | | | | | | | | | | | | | | | | | | | |
| | | | | | | | | | | | | | | | | | | | | | | | | | | | | | | | | | | |
| | | | | | | | | | | | | | | | | | | | | | ` | | | | | | | | | | | | | |
| | | | | | | | | | | | | | | | | | | | | | | | | | | | | | | | | | | |
| | | | | | | | | | | | | | | | | | | | | | | | | | | | | | | | | | | |
| | | | | | | | | | | | | | | | | | | | | | | | | | | | | | | | | | | |
| | | | | | | | | | | | | | | | | | | | | | | | | | | | | | | | | | | |
| | | | | | | | | | | | | | | | | | | | | | | | | | | | | | | | | | | |
| | | | | | | | | | | | | | | | | | | | | | | | | | | | | | | | | | | |
| | | | | | | | | | | | | | | | | | | | | | | | | | | | | | | | | | | |
| | | | | | | | | | | | | | | | | | | | | | | | | | | | | | | | | | | |
| | | | | | | | | | | | | | | | | | | | | | | | | | | | | | | | | | | |
| | | | | | | | | | | | | | | | | | | | | | | | | | | | | | | | | | | |
| | | | | | | | | | | | | | | | | | | | | | | | | | | | | | | | | | | |
Descriptions (a) | | | | Initial Cost to Company | | Costs Capitalized Subsequent to Acquisition | | Gross amount at December 31, 2018 (b) (c) | | | | | | |
Tenant Industry | | City | | St | | Encumbrances | | Land &
Improvements | | Building &
Improvements | | Land &
Improvements | | Building &
Improvements | | Land &
Improvements | | Building &
Improvements | | Total | | Accumulated
Depreciation (d) (e) | | Year
Constructed | | Date Acquired |
Lumber and Other Construction Materials Merchant Wholesalers | | Mexico | | MO | | | | | | 711 | | | 210 | | | - | | | - | | | 711 | | | 210 | | | 921 | | | (12) | | 1970 | | 09/25/2018 |
Lumber and Other Construction Materials Merchant Wholesalers | | Monett | | MO | | | | | | 1,167 | | | 436 | | | - | | | - | | | 1,167 | | | 436 | | | 1,603 | | | (16) | | 1986 | | 09/25/2018 |
Lumber and Other Construction Materials Merchant Wholesalers | | Mount Vernon | | MO | | | | | | 434 | | | 233 | | | - | | | - | | | 434 | | | 233 | | | 667 | | | (7) | | 1979 | | 09/25/2018 |
Lumber and Other Construction Materials Merchant Wholesalers | | Nevada | | MO | | | | | | 560 | | | 440 | | | - | | | - | | | 560 | | | 440 | | | 1,000 | | | (11) | | 1978 | | 09/25/2018 |
Lumber and Other Construction Materials Merchant Wholesalers | | Osage Beach | | MO | | | | | | 549 | | | 294 | | | - | | | - | | | 549 | | | 294 | | | 843 | | | (9) | | 1991 | | 09/25/2018 |
Lumber and Other Construction Materials Merchant Wholesalers | | Reeds Spring | | MO | | | | | | 1,375 | | | 700 | | | - | | | - | | | 1,375 | | | 700 | | | 2,075 | | | (22) | | 1994 | | 09/25/2018 |
Lumber and Other Construction Materials Merchant Wholesalers | | Republic | | MO | | | | | | 1,342 | | | 449 | | | - | | | - | | | 1,342 | | | 449 | | | 1,791 | | | (16) | | 1987 | | 09/25/2018 |
Lumber and Other Construction Materials Merchant Wholesalers | | Rolla | | MO | | | | | | 388 | | | 1,808 | | | - | | | - | | | 388 | | | 1,808 | | | 2,196 | | | (20) | | 1928 | | 09/25/2018 |
Lumber and Other Construction Materials Merchant Wholesalers | | Shell Knob | | MO | | | | | | 798 | | | 617 | | | - | | | - | | | 798 | | | 617 | | | 1,415 | | | (15) | | 1973 | | 09/25/2018 |
Lumber and Other Construction Materials Merchant Wholesalers | | Springfield | | MO | | | | | | 1,030 | | | 1,364 | | | - | | | - | | | 1,030 | | | 1,364 | | | 2,394 | | | (26) | | 1957 | | 09/25/2018 |
Lumber and Other Construction Materials Merchant Wholesalers | | Springfield | | MO | | | | | | 327 | | | 388 | | | - | | | - | | | 327 | | | 388 | | | 715 | | | (5) | | 2002 | | 09/25/2018 |
Lumber and Other Construction Materials Merchant Wholesalers | | Springfield | | MO | | | | | | 1,203 | | | 2,368 | | | - | | | - | | | 1,203 | | | 2,368 | | | 3,571 | | | (38) | | 1970 | | 09/25/2018 |
Lumber and Other Construction Materials Merchant Wholesalers | | Springfield | | MO | | | | | | 478 | | | 717 | | | - | | | - | | | 478 | | | 717 | | | 1,195 | | | (13) | | 1941 | | 09/25/2018 |
Lumber and Other Construction Materials Merchant Wholesalers | | Springfield | | MO | | | | | | 2,408 | | | 381 | | | - | | | - | | | 2,408 | | | 381 | | | 2,789 | | | (16) | | 1979 | | 09/25/2018 |
Lumber and Other Construction Materials Merchant Wholesalers | | Springfield | | MO | | | | | | 508 | | | 315 | | | - | | | - | | | 508 | | | 315 | | | 823 | | | (5) | | 1990 | | 09/25/2018 |
Lumber and Other Construction Materials Merchant Wholesalers | | Carson City | | NV | | | | | | 1,719 | | | 960 | | | - | | | - | | | 1,719 | | | 960 | | | 2,679 | | | (24) | | 1960 | | 09/25/2018 |
Lumber and Other Construction Materials Merchant Wholesalers | | Gardnerville | | NV | | | | | | 1,202 | | | 864 | | | - | | | - | | | 1,202 | | | 864 | | | 2,066 | | | (24) | | 1987 | | 09/25/2018 |
Car Dealers | | Tampa | | FL | | | | | | 3,604 | | | 3,877 | | | - | | | - | | | 3,604 | | | 3,877 | | | 7,481 | | | (31) | | 2018 | | 09/27/2018 |
Satellite Telecommunications | | Hauppauge | | NY | | | | | | 3,566 | | | 16,752 | | | - | | | - | | | 3,566 | | | 16,752 | | | 20,318 | | | (147) | | 1976 | | 09/27/2018 |
Child Day Care Services | | Maple Heights | | OH | | | (f) | | | 339 | | | 1,465 | | | - | | | - | | | 339 | | | 1,465 | | | 1,804 | | | (21) | | 1915 | | 09/27/2018 |
Forging and Stamping | | Valparaiso | | IN | | | | | | 1,557 | | | 1,782 | | | - | | | - | | | 1,557 | | | 1,782 | | | 3,339 | | | (37) | | 1977 | | 09/28/2018 |
Automotive Repair and Maintenance | | Festus | | MO | | | | | | 781 | | | 70 | | | - | | | 1,128 | | | 781 | | | 1,198 | | | 1,979 | | | - | | | | 09/28/2018 |
Packaging and Labeling Services | | Newcomerstown | | OH | | | | | | 1,945 | | | 6,554 | | | - | | | - | | | 1,945 | | | 6,554 | | | 8,499 | | | (60) | | 1991 | | 09/28/2018 |
Forging and Stamping | | Burgettstown | | PA | | | | | | 3,241 | | | 6,368 | | | - | | | - | | | 3,241 | | | 6,368 | | | 9,609 | | | (103) | | 1965 | | 09/28/2018 |
Forging and Stamping | | Carnegie | | PA | | | | | | 1,046 | | | 3,853 | | | - | | | - | | | 1,046 | | | 3,853 | | | 4,899 | | | (43) | | 1906 | | 09/28/2018 |
Forging and Stamping | | Carnegie | | PA | | | | | | 77 | | | 1,483 | | | - | | | - | | | 77 | | | 1,483 | | | 1,560 | | | (13) | | 1961 | | 09/28/2018 |
| | | | | | | | | | | | | | | | | | | | | | | | | | | | | | | | | | | |
Descriptions (a) | | | | Initial Cost to Company | | Costs Capitalized Subsequent to Acquisition | | Gross amount at December 31, 2018 (b) (c) | | | | | | |
Tenant Industry | | City | | St | | Encumbrances | | Land &
Improvements | | Building &
Improvements | | Land &
Improvements | | Building &
Improvements | | Land &
Improvements | | Building &
Improvements | | Total | | Accumulated
Depreciation (d) (e) | | Year
Constructed | | Date Acquired |
Automotive Repair and Maintenance | | Brooklyn Park | | MN | | | | | | 463 | | | 936 | | | - | | | - | | | 463 | | | 936 | | | 1,399 | | | (8) | | 1995 | | 10/03/2018 |
Semiconductor and Other Electronic Component Manufacturing | | Goleta | | CA | | | | | | 11,850 | | | 15,178 | | | - | | | - | | | 11,850 | | | 15,178 | | | 27,028 | | | (161) | | 1967 | | 10/12/2018 |
Automotive Repair and Maintenance | | Topeka | | KS | | | | | | 838 | | | 75 | | | - | | | 604 | | | 838 | | | 679 | | | 1,517 | | | - | | | | 10/12/2018 |
Restaurants – Limited Service | | Jackson | | MS | | | | | | 389 | | | 177 | | | - | | | - | | | 389 | | | 177 | | | 566 | | | (3) | | 1990 | | 10/15/2018 |
Electrical Equipment Manufacturing | | Eastanollee | | GA | | | | | | 481 | | | 3,365 | | | - | | | - | | | 481 | | | 3,365 | | | 3,846 | | | (23) | | 1993 | | 10/17/2018 |
Electrical Equipment Manufacturing | | Oregon | | WI | | | | | | 952 | | | 3,270 | | | - | | | - | | | 952 | | | 3,270 | | | 4,222 | | | (36) | | 2008 | | 10/17/2018 |
Child Day Care Services | | Mahtomedi | | MN | | | | | | 609 | | | 896 | | | - | | | - | | | 609 | | | 896 | | | 1,505 | | | (6) | | 2005 | | 10/19/2018 |
Navigational, Measuring, Electromedical, and Control Instruments Manufacturing | | Clear Lake | | SD | | | | | | 813 | | | 1,381 | | | - | | | - | | | 813 | | | 1,381 | | | 2,194 | | | (15) | | 1978 | | 10/26/2018 |
Other Professional, Scientific, and Technical Services | | Bakersfield | | CA | | | | | | 488 | | | 213 | | | - | | | - | | | 488 | | | 213 | | | 701 | | | (3) | | 1949 | | 10/31/2018 |
Aerospace Product and Parts Manufacturing | | Chester | | CT | | | | | | 628 | | | 1,236 | | | - | | | - | | | 628 | | | 1,236 | | | 1,864 | | | (9) | | 1978 | | 10/31/2018 |
Child Day Care Services | | Huntsville | | AL | | | | | | 2,485 | | | 631 | | | - | | | - | | | 2,485 | | | 631 | | | 3,116 | | | (7) | | 2004 | | 11/01/2018 |
Automotive Repair and Maintenance | | Salina | | KS | | | | | | 401 | | | 81 | | | - | | | 620 | | | 401 | | | 701 | | | 1,102 | | | - | | | | 11/02/2018 |
Pulp, Paper, and Paperboard Mills | | De Pere | | WI | | | | | | 2,892 | | | 9,135 | | | - | | | - | | | 2,892 | | | 9,135 | | | 12,027 | | | (68) | | 1992 | | 11/02/2018 |
General Freight Trucking, Long-Distance | | Gladstone | | MI | | | | | | 1,507 | | | 4,009 | | | - | | | - | | | 1,507 | | | 4,009 | | | 5,516 | | | (30) | | 1996 | | 11/07/2018 |
Restaurants – Full Service | | Downers Grove | | IL | | | | | | 2,422 | | | 690 | | | - | | | - | | | 2,422 | | | 690 | | | 3,112 | | | (5) | | | | 11/09/2018 |
Other Professional, Scientific, and Technical Services | | Everett | | WA | | | | | | 240 | | | 783 | | | - | | | - | | | 240 | | | 783 | | | 1,023 | | | (7) | | 1910 | | 11/13/2018 |
Motor Vehicle Parts Manufacturing | | South Bend | | IN | | | | | | 588 | | | 3,657 | | | - | | | - | | | 588 | | | 3,657 | | | 4,245 | | | (23) | | 1962 | | 11/14/2018 |
Motor Vehicle Parts Manufacturing | | Benton Harbor | | MI | | | | | | 718 | | | 2,417 | | | - | | | - | | | 718 | | | 2,417 | | | 3,135 | | | (17) | | 1969 | | 11/14/2018 |
Motor Vehicle Parts Manufacturing | | Niles | | MI | | | | | | 540 | | | 2,212 | | | - | | | - | | | 540 | | | 2,212 | | | 2,752 | | | (15) | | 1976 | | 11/14/2018 |
Motor Vehicle Parts Manufacturing | | Niles | | MI | | | | | | 1,155 | | | 2,245 | | | - | | | - | | | 1,155 | | | 2,245 | | | 3,400 | | | (17) | | 1980 | | 11/14/2018 |
Motor Vehicle Parts Manufacturing | | Niles | | MI | | | | | | 1,558 | | | 6,214 | | | - | | | - | | | 1,558 | | | 6,214 | | | 7,772 | | | (39) | | 1951 | | 11/14/2018 |
Motor Vehicle Parts Manufacturing | | St Peters | | MO | | | | | | 1,954 | | | 2,881 | | | - | | | - | | | 1,954 | | | 2,881 | | | 4,835 | | | (24) | | 1979 | | 11/14/2018 |
Outpatient Care Centers | | Beaumont | | TX | | | | | | 699 | | | 7,315 | | | - | | | - | | | 699 | | | 7,315 | | | 8,014 | | | (32) | | 2002 | | 11/14/2018 |
Outpatient Care Centers | | Garland | | TX | | | | | | 1,082 | | | 3,429 | | | - | | | 452 | | | 1,082 | | | 3,881 | | | 4,963 | | | (18) | | 1984 | | 11/14/2018 |
Outpatient Care Centers | | Cullman | | AL | | | | | | 170 | | | 504 | | | - | | | - | | | 170 | | | 504 | | | 674 | | | (2) | | 2002 | | 11/16/2018 |
Plastics Product Manufacturing | | Asheboro | | NC | | | | | | 572 | | | 4,424 | | | - | | | - | | | 572 | | | 4,424 | | | 4,996 | | | (14) | | 1987 | | 11/19/2018 |
Plastics Product Manufacturing | | Mocksville | | NC | | | | | | 1,260 | | | 5,156 | | | - | | | - | | | 1,260 | | | 5,156 | | | 6,416 | | | (18) | | 1996 | | 11/19/2018 |
Automotive Repair and Maintenance | | Topeka | | KS | | | | | | 640 | | | 80 | | | - | | | 556 | | | 640 | | | 636 | | | 1,276 | | | - | | | | 11/27/2018 |
Machinery, Equipment, and Supplies Merchant Wholesalers | | Lake City | | MN | | | | | | 360 | | | 2,399 | | | - | | | - | | | 360 | | | 2,399 | | | 2,759 | | | (8) | | 2018 | | 11/27/2018 |
Automotive Repair and Maintenance | | Rolla | | MO | | | | | | 777 | | | - | | | - | | | 754 | | | 777 | | | 754 | | | 1,531 | | | - | | | | 11/30/2018 |
Lumber and Other Construction Materials Merchant Wholesalers | | Biddeford | | ME | | | | | | 504 | | | 2,344 | | | - | | | - | | | 504 | | | 2,344 | | | 2,848 | | | (8) | | 1798 | | 12/03/2018 |
Lumber and Other Construction Materials Merchant Wholesalers | | Kennebunk | | ME | | | | | | 380 | | | 673 | | | - | | | - | | | 380 | | | 673 | | | 1,053 | | | (4) | | 1987 | | 12/03/2018 |
Lumber and Other Construction Materials Merchant Wholesalers | | Springvale | | ME | | | | | | 395 | | | 919 | | | - | | | - | | | 395 | | | 919 | | | 1,314 | | | (4) | | 1920 | | 12/03/2018 |
Other Professional, Scientific, and Technical Services | | McAllen | | TX | | | | | | 274 | | | 311 | | | - | | | - | | | 274 | | | 311 | | | 585 | | | (1) | | 1976 | | 12/05/2018 |
Other Professional, Scientific, and Technical Services | | Marietta | | GA | | | | | | 375 | | | 402 | | | - | | | - | | | 375 | | | 402 | | | 777 | | | (2) | | 1992 | | 12/06/2018 |
Farm and Ranch Supply Stores | | Allegan | | MI | | | | | | 730 | | | 857 | | | - | | | - | | | 730 | | | 857 | | | 1,587 | | | (5) | | 1974 | | 12/06/2018 |
Farm and Ranch Supply Stores | | Benton Harbor | | MI | | | | | | 1,202 | | | 1,359 | | | - | | | - | | | 1,202 | | | 1,359 | | | 2,561 | | | (9) | | 1999 | | 12/06/2018 |
Commercial and Service Industry Machinery Manufacturing | | Salem | | NH | | | | | | 1,831 | | | 3,054 | | | - | | | - | | | 1,831 | | | 3,054 | | | 4,885 | | | (12) | | 1987 | | 12/07/2018 |
Corporate Aircraft Repair and Maintenance Facilities | | Chattanooga | | TN | | | | | | 928 | | | 21,059 | | | - | | | - | | | 928 | | | 21,059 | | | 21,987 | | | (49) | | 2018 | | 12/10/2018 |
Other Professional, Scientific, and Technical Services | | Concord | | NC | | | | | | 849 | | | 1,281 | | | - | | | - | | | 849 | | | 1,281 | | | 2,130 | | | (5) | | 1956 | | 12/11/2018 |
Other Professional, Scientific, and Technical Services | | Magnolia | | TX | | | | | | 393 | | | 911 | | | - | | | - | | | 393 | | | 911 | | | 1,304 | | | (3) | | 2014 | | 12/11/2018 |
Other Professional, Scientific, and Technical Services | | Magnolia | | TX | | | | | | 548 | | | 969 | | | - | | | - | | | 548 | | | 969 | | | 1,517 | | | (3) | | 2004 | | 12/11/2018 |
Resin, Synthetic Rubber, and Artificial Synthetic Fibers and Filaments Manufacturing | | Bainbridge | | GA | | | | | | 1,426 | | | 7,622 | | | - | | | - | | | 1,426 | | | 7,622 | | | 9,048 | | | (28) | | 1970 | | 12/14/2018 |
Resin, Synthetic Rubber, and Artificial Synthetic Fibers and Filaments Manufacturing | | Winchester | | KY | | | | | | 3,745 | | | 17,322 | | | - | | | - | | | 3,745 | | | 17,322 | | | 21,067 | | | (50) | | 1983 | | 12/14/2018 |
Residential Intellectual and Developmental Disability, Mental Health, and Substance Abuse Facilities | | East Grand Forks | | MN | | | | | | 1,002 | | | 6,129 | | | - | | | - | | | 1,002 | | | 6,129 | | | 7,131 | | | - | | 1974 | | 12/18/2018 |
Residential Intellectual and Developmental Disability, Mental Health, and Substance Abuse Facilities | | Rochester | | MN | | | | | | 5,326 | | | 3,191 | | | - | | | - | | | 5,326 | | | 3,191 | | | 8,517 | | | - | | 1966 | | 12/18/2018 |
Residential Intellectual and Developmental Disability, Mental Health, and Substance Abuse Facilities | | Waverly | | MN | | | | | | 1,147 | | | 3,539 | | | - | | | - | | | 1,147 | | | 3,539 | | | 4,686 | | | - | | 1955 | | 12/18/2018 |
Other Personal Services | | Fort Myers | | FL | | | | | | 736 | | | - | | | - | | | - | | | 736 | | | - | | | 736 | | | - | | | | 12/20/2018 |
Other Personal Services | | Jacksonville | | FL | | | | | | 1,150 | | | 3,067 | | | - | | | - | | | 1,150 | | | 3,067 | | | 4,217 | | | - | | 2018 | | 12/20/2018 |
Other Personal Services | | Sharpsburg | | GA | | | | | | 655 | | | - | | | - | | | - | | | 655 | | | - | | | 655 | | | - | | | | 12/20/2018 |
| | | | | | | | | | | | | | | | | | | | | | | | | | | | | | | | | | | |
Descriptions (a) | | | | Initial Cost to Company | | Costs Capitalized Subsequent to Acquisition | | Gross amount at December 31, 2018 (b) (c) | | | | | | |
Tenant Industry | | City | | St | | Encumbrances | | Land &
Improvements | | Building &
Improvements | | Land &
Improvements | | Building &
Improvements | | Land &
Improvements | | Building &
Improvements | | Total | | Accumulated
Depreciation (d) (e) | | Year
Constructed | | Date Acquired |
Household and Institutional Furniture and Kitchen Cabinet Manufacturing | | Baldwyn | | MS | | | | | | 4,953 | | | 23,065 | | | - | | | - | | | 4,953 | | | 23,065 | | | 28,018 | | | - | | 1996 | | 12/20/2018 |
Household and Institutional Furniture and Kitchen Cabinet Manufacturing | | Ecru | | MS | | | | | | 3,495 | | | 6,649 | | | - | | | - | | | 3,495 | | | 6,649 | | | 10,144 | | | - | | 2000 | | 12/20/2018 |
Household and Institutional Furniture and Kitchen Cabinet Manufacturing | | Pontotoc | | MS | | | | | | 2,419 | | | 4,508 | | | - | | | - | | | 2,419 | | | 4,508 | | | 6,927 | | | - | | 2001 | | 12/20/2018 |
Household and Institutional Furniture and Kitchen Cabinet Manufacturing | | Pontotoc | | MS | | | | | | 3,071 | | | 10,225 | | | - | | | - | | | 3,071 | | | 10,225 | | | 13,296 | | | - | | 2001 | | 12/20/2018 |
Household and Institutional Furniture and Kitchen Cabinet Manufacturing | | Pontotoc | | MS | | | | | | 628 | | | 2,530 | | | - | | | - | | | 628 | | | 2,530 | | | 3,158 | | | - | | 2001 | | 12/20/2018 |
Household and Institutional Furniture and Kitchen Cabinet Manufacturing | | Pontotoc | | MS | | | | | | 820 | | | 1,940 | | | - | | | - | | | 820 | | | 1,940 | | | 2,760 | | | - | | 1989 | | 12/20/2018 |
Other Motor Vehicle Dealers | | Sherwood | | AR | | | | | | 3,184 | | | 3,224 | | | - | | | - | | | 3,184 | | | 3,224 | | | 6,408 | | | - | | 2000 | | 12/21/2018 |
Medical and Diagnostic Laboratories | | Belle Glade | | FL | | | (f) | | | 272 | | | 840 | | | - | | | - | | | 272 | | | 840 | | | 1,112 | | | - | | 1985 | | 12/21/2018 |
Medical and Diagnostic Laboratories | | Lake Worth | | FL | | | (f) | | | 822 | | | 2,503 | | | - | | | - | | | 822 | | | 2,503 | | | 3,325 | | | - | | 2003 | | 12/21/2018 |
Medical and Diagnostic Laboratories | | Wellington | | FL | | | (f) | | | 682 | | | 3,384 | | | - | | | - | | | 682 | | | 3,384 | | | 4,066 | | | - | | 2007 | | 12/21/2018 |
Medical and Diagnostic Laboratories | | Wellington | | FL | | | (f) | | | 552 | | | 1,661 | | | - | | | - | | | 552 | | | 1,661 | | | 2,213 | | | - | | 2002 | | 12/21/2018 |
Other Motor Vehicle Dealers | | Augusta | | GA | | | | | | 4,070 | | | 2,119 | | | - | | | - | | | 4,070 | | | 2,119 | | | 6,189 | | | - | | 2015 | | 12/21/2018 |
Metal and Mineral Merchant Wholesalers | | New Hope | | MN | | | | | | 1,084 | | | 5,058 | | | - | | | - | | | 1,084 | | | 5,058 | | | 6,142 | | | - | | 1973 | | 12/21/2018 |
Car Dealers | | Avon | | NY | | | | | | 1,090 | | | 2,595 | | | - | | | - | | | 1,090 | | | 2,595 | | | 3,685 | | | - | | 2006 | | 12/21/2018 |
Car Dealers | | Rochester | | NY | | | | | | 3,239 | | | 8,532 | | | - | | | - | | | 3,239 | | | 8,532 | | | 11,771 | | | - | | 1998 | | 12/21/2018 |
Car Dealers | | Rochester | | NY | | | | | | 3,570 | | | 1,863 | | | - | | | - | | | 3,570 | | | 1,863 | | | 5,433 | | | - | | 2016 | | 12/21/2018 |
Car Dealers | | Rochester | | NY | | | | | | 2,726 | | | 4,024 | | | - | | | - | | | 2,726 | | | 4,024 | | | 6,750 | | | - | | 2015 | | 12/21/2018 |
Car Dealers | | Spencerport | | NY | | | | | | 3,790 | | | 5,818 | | | - | | | - | | | 3,790 | | | 5,818 | | | 9,608 | | | - | | 1963 | | 12/21/2018 |
Other Motor Vehicle Dealers | | Huber Heights | | OH | | | | | | 3,023 | | | 2,161 | | | - | | | - | | | 3,023 | | | 2,161 | | | 5,184 | | | - | | 2005 | | 12/21/2018 |
Semiconductor and Other Electronic Component Manufacturing | | Ridgeway | | SC | | | | | | 2,108 | | | 2,945 | | | - | | | - | | | 2,108 | | | 2,945 | | | 5,053 | | | - | | 1996 | | 12/21/2018 |
Architectural and Structural Metals Manufacturing | | Orlando | | FL | | | | | | 702 | | | 1,666 | | | - | | | - | | | 702 | | | 1,666 | | | 2,368 | | | - | | 1955 | | 12/26/2018 |
Office Furniture (including Fixtures) Manufacturing | | Owensville | | MO | | | | | | 505 | | | 4,202 | | | - | | | - | | | 505 | | | 4,202 | | | 4,707 | | | - | | 1968 | | 12/26/2018 |
Architectural and Structural Metals Manufacturing | | Lynchburg | | VA | | | | | | 277 | | | 5,807 | | | - | | | - | | | 277 | | | 5,807 | | | 6,084 | | | - | | 1950 | | 12/26/2018 |
Architectural and Structural Metals Manufacturing | | Lynchburg | | VA | | | | | | 1,228 | | | 6,728 | | | - | | | - | | | 1,228 | | | 6,728 | | | 7,956 | | | - | | 1950 | | 12/26/2018 |
Grocery and Related Product Merchant Wholesalers | | Yuma | | AZ | | | | | | 9,636 | | | 18,381 | | | - | | | - | | | 9,636 | | | 18,381 | | | 28,017 | | | - | | 2018 | | 12/31/2018 |
| | | | | | | | | | | | | | | | | | | | | | | | | | | | | | | | | | | |
| | | | | | $ | 169,405 | | $ | 2,170,945 | | $ | 4,395,325 | | $ | 109,335 | | $ | 493,115 | | $ | 2,280,280 | | $ | 4,888,440 | | $ | 7,168,720 | | $ | (556,690) | | | | |
| (a) | | As of December 31, 2018, we had investments in 2,220 single-tenant real estate property locations including 2,199 owned properties and 21 ground lease interests; 61 of our owned properties are accounted for as direct financing receivables and are excluded from the table above. Initial costs exclude intangible lease assets totaling $85.1 million. |
| (b) | | The aggregate cost for federal income tax purposes is approximately $7,244.6 million. |
| (c) | | The following is a reconciliation of total real estate carrying value for the years ended December 31, 2018, 2017 and 2016: |
| | | | | | | | | | |
| | Year ended December 31, | |
| | | 2018 | | | 2017 | | | 2016 | |
| | | | | | | | | | |
Balance, beginning of year | | $ | 5,856,345 | | $ | 4,762,969 | | $ | 3,677,876 | |
Additions | | | | | | | | | | |
Acquisitions | | | 1,314,129 | | | 1,244,465 | | | 1,035,344 | |
Improvements | | | 221,578 | | | 94,039 | | | 122,243 | |
Deductions | | | | | | | | | | |
Provision for impairment of real estate | | | (5,202) | | | (11,940) | | | (1,720) | |
Cost of real estate sold | | | (218,130) | | | (214,478) | | | (70,774) | |
Reclasses to held for sale | | | — | | | (18,710) | | | — | |
Balance, end of year | | $ | 7,168,720 | | $ | 5,856,345 | | $ | 4,762,969 | |
| (d) | | The following is a reconciliation of accumulated depreciation for the years ended December 31, 2018, 2017 and 2016: |
| | | | | | | | | | |
| | Year ended December 31, | |
| | | 2018 | | | 2017 | | | 2016 | |
| | | | | | | | | | |
Balance, beginning of year | | $ | (402,747) | | $ | (279,469) | | $ | (172,145) | |
Additions | | | | | | | | | | |
Depreciation expense | | | (175,545) | | | (143,726) | | | (113,145) | |
Deductions | | | | | | | | | | |
Accumulated depreciation associated with real estate sold | | | 21,602 | | | 18,479 | | | 5,821 | |
Reclasses to held for sale | | | — | | | 1,969 | | | — | |
Balance, end of year | | $ | (556,690) | | $ | (402,747) | | $ | (279,469) | |
| (e) | | The Company's real estate assets are depreciated using the straight-line method over the estimated useful lives of the properties, which generally ranges from 30 to 40 years for buildings and improvements and is 15 years for land improvements. |
| (f) | | Property is collateral for non-recourse debt obligations totaling $1.9 billion issued under the Company’s STORE Master Funding debt program. |
See report of independent registered public accounting firm.
STORE Capital Corporation
Schedule IV - Mortgage Loans on Real Estate
As of December 31, 2018
(Dollars in thousands)
| | | | | | | | | | | | | | | | | |
| | | | Final | | Periodic | | Final | | | | Outstanding | | Carrying | |
| | Interest | | Maturity | | Payment | | Payment | | Prior | | face amount of | | amount of | |
Description | | Rate | | Date | | Terms | | Terms | | Liens | | mortgages | | mortgages (e) | |
First mortgage loans: | | | | | | | | | | | | | | | | | |
One restaurant property located in North Carolina | | 9.09 | % | 4/1/2019 | | Interest only | | Balloon of $0.7 million | | None | | $ | 722 | | $ | 722 | |
Three restaurant properties located in Ohio and Pennsylvania (a) | | 8.50 | % | 4/15/2019 | | Principal & Interest | | Fully amortizing | | None | | | 1,115 | | | 1,115 | |
One family entertainment property located in Pennsylvania (a)(b) | | 10.50 | % | 9/30/2019 | | Principal & Interest | | Balloon of $4.4 million | | None | | | 4,404 | | | 4,404 | |
Three movie theater properties located in North Carolina (c) | | 8.35 | % | 12/31/2019 | | Interest only | | Balloon of $12.6 million | | None | | | 12,610 | | | 12,610 | |
Four restaurant properties located in Indiana and Ohio | | 10.00 | % | 12/31/2019 | | Principal & Interest | | Balloon of $0.9 million | | None | | | 1,000 | | | 1,000 | |
One health club property located in Illinois | | 7.75 | % | 7/31/2020 | | Interest only | | Balloon of $4.2 million | | None | | | 4,242 | | | 4,258 | |
Two farm and ranch supply properties located in Illinois and Indiana | | 8.00 | % | 9/1/2020 | | Interest only | | Balloon of $11.9 million | | None | | | 11,903 | | | 11,906 | |
One movie theater property located in California | | 7.50 | % | 5/1/2021 | | Principal & Interest | | Balloon of $4.7 million | | None | | | 5,238 | | | 5,260 | |
One health club property located in Washington | | 7.83 | % | 6/1/2022 | | Principal & Interest | | Balloon of $6.8 million | | None | | | 7,200 | | | 7,224 | |
One restaurant property located in Kentucky | | 7.75 | % | 12/31/2022 | | Interest only | | Balloon of $1.5 million | | None | | | 1,500 | | | 1,503 | |
Two restaurant properties located in Louisiana | | 8.11 | % | 7/1/2032 | | Principal & Interest | | Balloon of $1.9 million | | None | | | 2,124 | | | 2,137 | |
Five restaurant properties located in Mississippi | | 8.17 | % | 7/1/2032 | | Principal & Interest | | Balloon of $5.1 million | | None | | | 5,619 | | | 5,649 | |
Three restaurant properties located in Idaho and Montana | | 8.76 | % | 11/1/2036 | | Principal & Interest | | Balloon of $5.1 million | | None | | | 7,623 | | | 7,655 | |
One automotive repair and maintenance property located in Illinois (d) | | 8.73 | % | 2/28/2038 | | Interest only | | Fully amortizing | | None | | | 2,300 | | | 2,300 | |
29 restaurant properties located in Florida, Illinois, Louisiana and Mississippi | | 8.75 | % | 12/2/2051 | | Principal & Interest | | Fully amortizing | | None | | | 23,576 | | | 23,803 | |
Five restaurant properties located in Tennessee | | 8.25 | % | 8/31/2053 | | Principal & Interest | | Fully amortizing | | None | | | 3,630 | | | 3,643 | |
Three mortgage loans secured by one recreation property located in Colorado | | 8.50 | % | 2/28/2055 | | Principal & Interest | | Fully amortizing | | None | | | 30,922 | | | 31,408 | |
Three restaurant properties located in Ohio | | 7.80 | % | 12/31/2055 | | Principal & Interest | | Fully amortizing | | None | | | 3,048 | | | 3,058 | |
Leasehold interest in an amusement park property located in Ontario, Canada | | 9.32 | % | 8/1/2056 | | Principal & Interest | | Fully amortizing | | None | | | 22,245 | | | 22,350 | |
One family entertainment property located in Texas | | 8.25 | % | 6/30/2058 | | Principal & Interest | | Fully amortizing | | None | | | 4,598 | | | 4,598 | |
| | | | | | | | | | | | $ | 155,619 | | $ | 156,603 | |
The following shows changes in the carrying amounts of mortgage loans receivable during the years ended December 31, 2018, 2017 and 2016 (in thousands):
| | | | | | | | | | |
| | Year ended December 31, | |
| | 2018 | | 2017 | | 2016 | |
Balance, beginning of year | | $ | 131,653 | | $ | 136,733 | | $ | 97,007 | |
Additions: | | | | | | | | | | |
New mortgage loans | | | 29,155 | | | 24,952 | | | 44,778 | |
Other: Capitalized loan origination costs | | | 53 | | | 74 | | | 74 | |
Deductions: | | | | | | | | | | |
Collections of principal (f) | | | (4,194) | | | (30,068) | | | (5,042) | |
Other: Amortization of loan origination costs | | | (64) | | | (38) | | | (84) | |
Balance, end of year | | $ | 156,603 | | $ | 131,653 | | $ | 136,733 | |
| (a) | | Loan was on nonaccrual status as of December 31, 2018. |
| (b) | | Represents a receivable under a contract for deed transaction; interest rate decreases to 8.75% when outstanding balance is below $3.3 million. |
| (c) | | Loan matured on December 31, 2018 and the parties are currently negotiating the terms of an extension. The terms of this loan as presented in the table (interest rate, final maturity date and periodic payment terms) reflect the terms for an extension that the Company has offered to the borrower. |
| (d) | | Loans require interest-only payments for a specified period followed by monthly payments of principal and interest. |
| (e) | | The aggregate cost for federal income tax purposes is $156.6 million. |
| (f) | | During the year ended December 31, 2017, one mortgage loan was repaid in full through a $2.0 million non-cash transaction in which the Company purchased the underlying mortgaged property and leased it back to the borrower. |
See report of independent registered public accounting firm.