Management’s Discussion and Analysis of Financial Results
INTRODUCTION
This management’s discussion and analysis (“MD&A”) of Brookfield Property Partners L.P. (“BPY”, the “partnership”, or “we”) covers the financial position as of June 30, 2021 and December 31, 2020 and results of operations for the three and six months ended June 30, 2021 and 2020. This MD&A should be read in conjunction with the unaudited condensed consolidated financial statements (the “Financial Statements”) and related notes as of June 30, 2021, included elsewhere in this report, and our annual report for the year ended December 31, 2020 on Form 20-F.
STATEMENT REGARDING FORWARD-LOOKING STATEMENTS AND USE OF NON-IFRS MEASURES
This MD&A, particularly “Objectives and Financial Highlights – Overview of the Business” and “Additional Information – Trend Information”, contains “forward-looking information” within the meaning of applicable securities laws and regulations. Forward-looking statements include statements that are predictive in nature, depend upon or refer to future events or conditions, include statements regarding our operations, business, financial condition, expected financial results, performance, prospects, opportunities, priorities, targets, goals, ongoing objectives, strategies and outlook, as well as the outlook for North American and international economies for the current fiscal year and subsequent periods, and include words such as “expects”, “anticipates”, “plans”, “believes”, “estimates”, “seeks”, “intends”, “targets”, “projects”, “forecasts”, “likely”, or negative versions thereof and other similar expressions, or future or conditional verbs such as “may”, “will”, “should”, “would” and “could”.
Although we believe that our anticipated future results, performance or achievements expressed or implied by the forward-looking statements and information are based upon reasonable assumptions and expectations, the reader should not place undue reliance on forward-looking statements and information because they involve known and unknown risks, uncertainties and other factors, many of which are beyond our control, which may cause our actual results, performance or achievements to differ materially from anticipated future results, performance or achievement expressed or implied by such forward-looking statements and information.
Factors that could cause actual results to differ materially from those contemplated or implied by forward-looking statements include, but are not limited to: risks incidental to the ownership and operation of real estate properties including local real estate conditions; the impact or unanticipated impact of general economic, political and market factors in the countries in which we do business, including as a result of the recent global economic shutdown (“global economic shutdown” or “the shutdown”) caused by the coronavirus (“COVID-19”) pandemic; the ability to enter into new leases or renew leases on favorable terms; business competition; dependence on tenants’ financial condition; the use of debt to finance our business; the behavior of financial markets, including fluctuations in interest and foreign exchange rates; uncertainties of real estate development or redevelopment; global equity and capital markets and the availability of equity and debt financing and refinancing within these markets; risks relating to our insurance coverage; the possible impact of international conflicts and other developments including terrorist acts; potential environmental liabilities; changes in tax laws and other tax related risks; dependence on management personnel; illiquidity of investments; the ability to complete and effectively integrate acquisitions into existing operations and the ability to attain expected benefits therefrom; operational and reputational risks; catastrophic events, such as earthquakes, hurricanes or pandemics/epidemics; and other risks and factors detailed from time to time in our documents filed with the securities regulators in Canada and the United States, as applicable. In addition, our future results may be impacted by risks associated with the global economic shutdown and the related global reduction in commerce and travel, which may result in a decrease of cash flows and a potential increase in impairment losses and/or revaluations on our investments and real estate properties, and we may be unable to achieve our expected returns.
We caution that the foregoing list of important factors that may affect future results is not exhaustive. When relying on our forward-looking statements or information, investors and others should carefully consider the foregoing factors and other uncertainties and potential events. Except as required by law, we undertake no obligation to publicly update or revise any forward-looking statements or information, whether written or oral, that may be as a result of new information, future events or otherwise.
We disclose a number of financial measures in this MD&A that are calculated and presented using methodologies other than in accordance with International Financial Reporting Standards (“IFRS”) as issued by the International Accounting Standards Board (“IASB”). We utilize these measures in managing our business, including performance measurement, capital allocation and valuation purposes and believe that providing these performance measures on a supplemental basis to our IFRS results is helpful to investors in assessing our overall performance. These financial measures should not be considered as a substitute for similar financial measures calculated in accordance with IFRS. We caution readers that these non-IFRS financial measures may differ from the calculations disclosed by other businesses, and as a result, may not be comparable to similar measures presented by others. Reconciliations of these non-IFRS financial measures to the most directly comparable financial measures calculated and presented in accordance with IFRS, where applicable, are included within this MD&A.
OBJECTIVES AND FINANCIAL HIGHLIGHTS
BASIS OF PRESENTATION
Our sole direct investments are a 49% managing general partnership unit interest in Brookfield Property L.P. (the “Operating Partnership”) and an interest in BP US REIT LLC. As we have the ability to direct its activities pursuant to our rights as owners of the general partner units, we consolidate the Operating Partnership. Accordingly, our Financial Statements reflect 100% of its assets, liabilities, revenues, expenses and cash flows, including non-controlling interests therein, which capture the ownership interests of other third parties.
We also discuss the results of operations on a segment basis, consistent with how we manage our business. The partnership is organized into four reportable segments: i) Core Office, ii) Core Retail, iii) LP Investments and iv) Corporate. This is consistent with how the partnership presents financial information to the chief operating decision maker (“CODM”) and investors. These segments are independently and regularly reviewed and managed by the Chief Executive Officer, who is considered the CODM.
Our partnership’s equity interests include general partnership units (“GP Units”), publicly traded limited partnership units (“LP Units”), redeemable/exchangeable partnership units of the Operating Partnership (“Redeemable/Exchangeable Partnership Units”), special limited partnership units of the Operating Partnership (“Special LP Units”), FV LTIP Units of the Operating Partnership (“FV LTIP Units”), limited partnership units of Brookfield Office Properties Exchange LP (“Exchange LP Units”), Class A stock, par value $0.01 per share, (“BPYU Units”) of Brookfield Property REIT Inc. (“BPYU”) and Class A Cumulative Redeemable Perpetual Preferred Units, Series 1, Series 2 and Series 3 (“Preferred Equity Units”). Holders of the GP Units, LP Units, Redeemable/Exchangeable Partnership Units, Special LP Units, FV LTIP Units, Exchange LP Units and BPYU Units will be collectively referred to throughout this MD&A as “Unitholders”. The LP Units, Redeemable/Exchangeable Partnership Units, Exchange LP Units and BPYU Units have the same economic attributes in all respects, except that the holders of Redeemable/Exchangeable Partnership Units and BPYU Units have the right to request that their units be redeemed for cash consideration. In the event that Brookfield Asset Management Inc. (“Brookfield Asset Management”), as the holder of the Redeemable/Exchangeable Partnership Units exercises this right, our partnership has the right, at its sole discretion, to satisfy the redemption request with its LP Units, rather than cash, on a one-for-one basis. As a result, Brookfield Asset Management, as holder of Redeemable/Exchangeable Partnership Units, participates in earnings and distributions on a per unit basis equivalent to the per unit participation of the LP Units of our partnership. However, given the redemption feature referenced above and the fact that they were issued by our subsidiary, we present the Redeemable/Exchangeable Partnership Units as a component of non-controlling interests. The Exchange LP Units are exchangeable at any time on a one-for-one basis, at the option of the holder, for LP Units. We present the Exchange LP Units as a component of non-controlling interests. BPYU Units provide their holders with the right to request that their units be redeemed for cash consideration. In the event the holders of BPYU Units exercise this right, our partnership has the right at its sole discretion, to satisfy the redemption request with its LP Units, rather than cash, on a one-for-one basis. As a result, BPYU Units participate in earnings and distributions on a per unit basis equivalent to the per unit participation of LP Units of our partnership. We present BPYU Units as a component of non-controlling interest.
This MD&A includes financial data for the three and six months ended June 30, 2021 and includes material information up to August 6, 2021. Financial data has been prepared using accounting policies in accordance with IFRS as issued by the IASB. Non-IFRS measures used in this MD&A are reconciled to or calculated from such financial information. Unless otherwise specified, all operating and other statistical information is presented as if we own 100% of each property in our portfolio, regardless of whether we own all of the interests in each property. We believe this is the most appropriate basis on which to evaluate the performance of properties in the portfolio relative to each other and others in the market. All dollar references, unless otherwise stated, are in millions of U.S. Dollars. Canadian Dollars (“C$”), Australian Dollars (“A$”), British Pounds (“£”), Euros (“€”), Brazilian Reais (“R$”), Indian Rupees (“₨”), Chinese Yuan (“C¥”), South Korean Won (“₩”) and United Arab Emirates Dirham (“AED”) are identified where applicable.
Additional information is available on our website at bpy.brookfield.com, or on www.sedar.com or www.sec.gov.
OVERVIEW OF THE BUSINESS
We are Brookfield Asset Management’s primary vehicle to make investments across all strategies in real estate. Our goal is to be a leading global owner and operator of high-quality real estate, that generates sustainable and growing distributions to our unitholders and capital appreciation of our asset base over the long term. With approximately 24,400 employees involved in Brookfield Asset Management’s real estate businesses around the globe, we have built operating platforms in various real estate sectors, including in our: | | | | | | | | | | | | | | |
| CORE OFFICE PORTFOLIO | | CORE RETAIL PORTFOLIO |
| Class A office assets in gateway markets around the globe | | 100 of the top 500 malls in the United States |
| l | 143 premier properties | | l | 119 best-in-class malls and urban retail properties |
| l | 98 million square feet | | l | 117 million square feet |
| l | 89% occupancy | | l | 92% occupancy |
| l | 8.1 year average lease term | | | |
| | | | |
| LP INVESTMENTS PORTFOLIO |
Invested in mispriced portfolios and/or properties with significant value-add opportunities. |
| | | | |
| | | | |
| | | | |
| | | | |
INVESTMENT STRATEGY
Our diversified Core portfolios consist of high-quality office and retail assets in some of the world’s most dynamic markets which have stable cash flow as a result of their long-term leases. We target to earn core-plus total returns on our Core portfolios. The drivers of these targets include the mark-to-market of rents upon lease expiry, escalation provisions in leases and projected increases in occupancy, that are expected to generate same-property net operating income (“NOI”) growth without significant capital investment. Furthermore, we enhance the returns on our stable properties through an active development and redevelopment pipeline that earns higher unlevered returns on construction costs. We currently have approximately 6 million square feet of active development projects underway with another 5 million square feet in planning stages. Our development track record reflects successful completions on time and on budget. We expect this portion of our balance sheet to contribute meaningfully to earnings growth in our Core businesses as projects reach completion and begin to contribute rental revenue to our earnings.
Our LP Investments portfolio includes our equity invested in Brookfield-sponsored real estate opportunity funds, which target high-quality assets with operational upside across various real estate sectors, including office, retail, multifamily, logistics, hospitality, triple net lease, manufactured housing and student housing. We target to earn opportunistic returns on our LP Investments portfolio. These investments, unlike our Core portfolios, have a defined hold period and typically generate the majority of profits from gains recognized from realization events including the sale of an asset or portfolio of assets, or exit of the entire investment. The combination of these realized gains and FFO earned represent our earnings on capital invested in these funds and provide liquidity to support our target distributions.
Overall, our goal is to be the leading global owner and operator of high-quality real estate, generating an attractive total return for our Unitholders comprised of: a current yield supported by stable cash flow from a diversified portfolio; distribution growth in-line with earnings growth; and capital appreciation of our asset base. We operate our business to achieve these objectives with a long term view and will continue to make decisions with that in mind, however, we will caution you that in light of the global economic shutdown and its impact on the global economy, we may be unable to achieve these objectives in the near term. We have not changed our investment strategy as a result of COVID-19. Capital appreciation will be reflected in the fair value gains that flow through our income statement as a result of our revaluation of investment properties in accordance with IFRS to reflect initiatives that increase property level cash flows, change the risk profile of the asset, reflect changes in market conditions, or portfolio premiums realized upon sale of these assets. From time to time, we will convert some or all of these unrealized gains to cash through asset sales, joint ventures or refinancings.
We believe our global scale and best-in-class operating platforms provide us with a unique competitive advantage as we are able to efficiently allocate capital around the world toward those sectors and geographies where we see the greatest opportunities to earn attractive returns. We actively recycle assets on our balance sheet as they mature and reinvest the proceeds into higher yielding investment strategies, further enhancing returns. Despite the recent economic disruption caused by the global economic shutdown, we expect that the high quality nature of our stabilized properties and associated cash flows will continue to be in demand from investors, although our ability to execute on these recycling of capital initiatives could be impacted in the short term. In addition, due to the scale of our stabilized portfolio and flexibility of our balance sheet, our business model is self-funding and does not require us to access capital markets to fund our continued growth.
PERFORMANCE MEASURES
We consider the following items to be important drivers of our current and anticipated financial performance, however the impact of the recent global economic shutdown could limit our potential to achieve these measures:
•increases in occupancies by leasing vacant space and pre-leasing active developments;
•increases in rental rates through maintaining or enhancing the quality of our assets and as market conditions permit; and
•reductions in operating costs through achieving economies of scale and diligently managing contracts.
We also believe that key external performance drivers include the availability of the following:
•debt capital at a cost and on terms conducive to our goals;
•equity capital at a reasonable cost;
•new property acquisitions and other investments that fit into our strategic plan; and
•opportunities to dispose of peak value or non-core assets.
In addition to monitoring, analyzing and reviewing earnings performance, we also review initiatives and market conditions that contribute to changes in the fair value of our investment properties. These fair value changes, combined with earnings, represent a total return on the equity attributable to Unitholders and form an important component in measuring how we have performed relative to our targets.
To measure our performance against these targets, as described above, and measure our operating performance, we focus on NOI, same-property NOI, funds from operations (“FFO”), Company FFO, net income attributable to Unitholders and equity attributable to Unitholders. Some of these performance metrics do not have standardized meanings prescribed by IFRS and therefore may differ from similar metrics used by other companies.
•NOI: revenues from our commercial properties operations less direct commercial property expenses (“Commercial property NOI”) and revenues from our hospitality operations less direct hospitality expenses (“Hospitality NOI”).
•Same-property NOI: a subset of NOI, which excludes NOI that is earned from assets acquired, disposed of or developed during the periods presented, not of a recurring nature, or from LP Investments assets.
•FFO: net income, prior to fair value gains, net, depreciation and amortization of real estate assets, and income taxes less non-controlling interests of others in operating subsidiaries and properties therein. When determining FFO, we include our proportionate share of the FFO of unconsolidated partnerships and joint ventures and associates, as well as gains (or losses) related to properties developed for sale.
•Company FFO: FFO before the impact of depreciation and amortization of non-real estate assets, transaction costs, gains (losses) associated with non-investment properties, imputed interest on equity accounted investments and the partnership’s share of Brookfield Strategic Real Estate Partners III (“BSREP III”) FFO. The partnership accounts for its investment in BSREP III as a financial asset and the income (loss) of the fund is not presented in the partnership’s results. Distributions from BSREP III, recorded as dividend income under IFRS, are removed from investment and other income for Company FFO presentation.
•Net income attributable to Unitholders: net income attributable to holders of GP Units, LP Units, Redeemable/Exchangeable Partnership Units, Special LP Units, Exchange LP Units, FV LTIP Units and BPYU Units.
•Equity attributable to Unitholders: equity attributable to holders of GP Units, LP Units, Redeemable/Exchangeable Partnership Units, Special LP Units, Exchange LP Units, FV LTIP Units and BPYU Units.
NOI is a key indicator of our ability to impact the operating performance of our properties. We seek to grow NOI through pro-active management and leasing of our properties. Same-property NOI in our Core Office and Core Retail segments allows us to segregate the impact of leasing and operating initiatives on the portfolio from the impact of investing activities and “one-time items”, which for the historical periods presented consist primarily of lease termination income. We reconcile NOI to net income on page 15.
We also consider FFO an important measure of our operating performance. FFO is a widely recognized measure that is frequently used by securities analysts, investors and other interested parties in the evaluation of real estate entities, particularly those that own and operate income producing properties. Our definition of FFO includes all of the adjustments that are outlined in the National Association of Real Estate Investment Trusts (“NAREIT”) definition of FFO, including the exclusion of gains (or losses) from the sale of investment properties, the add back of any depreciation and amortization related to real estate assets and the adjustment for unconsolidated partnerships and joint ventures. In addition to the adjustments prescribed by NAREIT, we also make adjustments to exclude any unrealized fair value gains (or losses) that arise as a result of reporting under IFRS, and income taxes that arise as certain of our subsidiaries are structured as corporations as opposed to real estate investment trusts (“REITs”). These additional adjustments result in an FFO measure that is similar to that which would result if our partnership was organized as a REIT that determined net income in accordance with generally accepted accounting principles in the United States (“U.S. GAAP”), which is the type of organization on which the NAREIT definition is premised. Our FFO measure will differ from other organizations applying the NAREIT definition to the extent of certain differences between the IFRS and U.S. GAAP reporting frameworks, principally related to the timing of revenue recognition from lease terminations and sale of properties. Because FFO excludes fair value gains (losses), including equity accounted fair value gains (losses), realized gains (losses) on the sale of investment properties, depreciation and amortization of real estate assets and income taxes, it provides a performance measure that, when compared year-over-year, reflects the impact on operations from trends in occupancy rates, rental rates, operating costs and interest costs,
providing perspective not immediately apparent from net income. We do not use FFO as a measure of cash flow generated from operating activities. We reconcile FFO to net income on page 15 as we believe net income is the most comparable measure.
In addition, we consider Company FFO a useful measure for securities analysts, investors and other interested parties in the evaluation of our partnership’s performance. Company FFO, similar to FFO discussed above, provides a performance measure that reflects the impact on operations of trends in occupancy rates, rental rates, operating costs and interest costs. In addition, the adjustments to Company FFO relative to FFO allow the partnership insight into these trends for the real estate operations, by adjusting for non-real estate components. We reconcile net income to Company FFO on page 15.
Net income attributable to Unitholders and Equity attributable to Unitholders are used by the partnership to evaluate the performance of the partnership as a whole as each of the Unitholders participates in the economics of the partnership equally. We reconcile Net income attributable to Unitholders to net income on page 15 and Equity attributable to Unitholders to total equity on page 16.
FAIR VALUE OF INVESTMENT AND HOSPITALITY PROPERTIES
Investment properties
We measure all investment properties at fair value, including those held within equity accounted investments. Valuations are prepared at a balance sheet date with changes to those values recognized as gains or losses in the statement of income. Our valuations are generally prepared at the individual property level by internal investment professionals with the appropriate expertise in the respective industry, geography and asset type. We leverage their extensive expertise and experience in the valuation of properties accumulated through involvement in acquisitions and dispositions, negotiations with lenders and interactions with institutional private fund investors. Additionally, a number of properties are externally appraised each year and the results of those appraisals are compared to the partnership’s internally prepared values.
Substantially all of our investment properties are valued using one of two accepted income approaches, the discounted cash flow approach or the direct capitalization approach. The valuation methodology utilized is generally determined by asset class. Our office and retail assets are typically valued using a discounted cash flow methodology while our multifamily, triple net lease, manufactured housing, student housing and logistics assets are typically valued using a direct capitalization methodology.
Under the discounted cash flow approach, cash flows for each property are forecast for an assumed holding period, generally, ten-years. A capitalization rate is applied to the terminal year net operating income and an appropriate discount rate is applied to those cash flows to determine a value at the reporting date. The forecast cash flows include assumptions prepared at the property level for lease renewal probabilities, downtime, capital expenditures, future leasing rates and associated leasing costs. The majority of property cash flows consist of contracted leases as a result of our core real estate portfolio having a combined 91% occupancy level and an average 6.3 year lease life. Valuation assumptions, such as discount rates and capitalization rates, are determined by the relevant investment professionals and often take into consideration relevant market data such as cost of capital, market transactions and/or brokers opinion of value, and are applied to the cash flows to determine the values.
Under the direct capitalization method, a capitalization rate is applied to estimated stabilized annual net operating income to determine value. Capitalization rates are determined by our investment professionals based on market data from comparable transactions and third-party reports.
As a result of the ongoing global economic shutdown, we believe uncertainty remains with respect to certain input factors on our fair value of investment properties, including capitalization rates and discount rates, due to a lack of market transactions since early March 2020. However, we have adjusted capitalization and discount rates in certain assets to reflect changes to risk-free borrowing rates.
Hospitality properties
Our hospitality properties, including intangible assets, are carried at cost except for the property, plant and equipment which is re-valued annually, at December 31, using a depreciated replacement cost approach. Revaluation increases are generally recognized as revaluation surplus in the statement of comprehensive income, unless the increase reverses a previously recognized revaluation loss recorded through prior period net income. These assets are classified as property, plant and equipment and are depreciated each quarter during a calendar year.
The hospitality sector has had the most immediate and acute impact from the global economic shutdown as the majority of our hospitality investments were closed. Certain of our hospitality assets have now entered the recovery phase, as mandated closures and restrictions have started to lift and there is increased demand for leisure travel.
Valuation methodology
All of our valuations are subject to various layers of review and controls as part of our financial reporting processes. These controls are part of our system of internal control over financial reporting that is assessed by management on an annual basis. Under the discounted cash flow model, the base cash flows are determined as part of our annual business planning process, prepared within each operating business and reviewed by the senior management teams responsible for each segment, along with senior investment professionals responsible for the relevant asset classes. Valuation assumptions such as discount rates and terminal capitalization rates are compared to market data, third party reports, research material and broker opinions as part of the review process.
External valuations
We have a number of properties externally appraised each year to support our valuation process and for other business purposes. We compare the results of those external appraisals to our internally prepared values and reconcile significant differences when they arise. During the three months ended June 30, 2021, we obtained external appraisals of 56 of our Core Office properties representing a gross property value of $19 billion (or 11% of the portfolio). These external appraisals were within 0.08% of management’s valuations. Also, we have historically sold assets, which provides support for our valuations, as we typically contract at prices comparable to IFRS values.
FINANCIAL STATEMENTS ANALYSIS
REVIEW OF CONSOLIDATED FINANCIAL RESULTS
In this section, we review our financial position and consolidated performance as of June 30, 2021 and December 31, 2020 and for the three and six months ended June 30, 2021 and 2020. Further details on our results from operations and our financial positions are contained within the “Segment Performance” section beginning on page 19.
The global economic shutdown continues to interrupt business activities and supply chains; disrupt travel; and contribute to significant volatility in the financial markets, resulting in lower interest rates. The shutdown has also impacted social conditions and adversely impacted local, regional, national and international economic conditions, as well as the labor markets. We have seen an adverse impact to our financial position and consolidated performance as a direct result of the shutdown and it is possible that our results in future periods may continue to be adversely impacted.
The following acquisitions and dispositions affected our consolidated results for the three and six months ended June 30, 2021 and 2020:
In our Core Office segment:
•In the first quarter of 2021, we sold 50% of our interest in Bay Adelaide North in Toronto for approximately C$365 million ($291 million) and a realized gain of C$74 million ($59 million). Prior to the transaction, our interest was consolidated but is now accounted for under the equity method.
•In the fourth quarter of 2020, we sold our interest in One London Wall Place in London for approximately £460 million ($614 million) and a realized gain of approximately £107 million ($143 million).
•In the second quarter of 2020, we sold approximately 50% of our interests in two multifamily properties, One Blue Slip and Andorra, into joint ventures with Brookfield Premier Real Estate Partners Pooling LLC (“BPREP”) for net proceeds of $102 million and $44 million, respectively. Prior to the transactions, our interests were consolidated but are now accounted for under the equity method.
In our Core Retail segment:
•In the first quarter of 2021, North Point Mall and Florence Mall were conveyed to the lenders in satisfaction of outstanding debt obligations of $247 million and $90 million, respectively.
•In the second quarter of 2020, we restructured our joint venture partnership in Water Tower Place in which we acquired an incremental 43.9% interest through the assumption of our partner’s share of debt held on the property. Prior to the acquisition, our joint venture interest was reflected as an equity accounted investment and is now consolidated.
In our LP Investments segment:
•In the second quarter of 2021, we converted our preferred equity interest in a portfolio of select-service hospitality assets valued at approximately $472 million into common shares. Prior to the transaction, our interest was reflected as a financial asset and is now consolidated, as we gained control over the investment.
•In the second quarter of 2021, we acquired a portfolio of manufactured housing assets in the Brookfield Strategic Real Estate Partners II (“BSREP II”) fund for consideration of approximately $159 million.
•In the first quarter of 2021, we sold four retail assets in the United States for approximately $73 million and a realized loss of $97 million.
•In the fourth quarter of 2020, we sold our portfolio of self-storage assets in the United States in BSREP II for approximately $1.2 billion and a realized gain of approximately $244 million.
•In the fourth quarter of 2020, we sold a partial interest in a portfolio of triple-net lease assets in the United States in the Brookfield Strategic Real Estate Partners I (“BSREP I”) fund for approximately $728 million and a realized gain of approximately $105 million. As part of the sale, we no longer have certain voting rights, which has resulted in a loss of control over the investment; as a result, we deconsolidated our investment in the portfolio.
•In the fourth quarter of 2020, we sold two office assets in Brazil in the BSREP II fund for approximately R$2.0 billion ($379 million) and a realized gain of approximately R$735 million ($136 million).
•In the fourth quarter of 2020, we sold five multifamily assets in the United States in the BSREP II fund for approximately $390 million and a realized gain of approximately $61 million.
•In the third quarter of 2020, we completed the recapitalization of the Atlantis Paradise Island resort (“Atlantis”) with a consortium of investors who made a total commitment of $300 million in the form of preferred equity, of which we committed approximately $125 million. As a result, we no longer control the previously consolidated investment and account for the investment under the equity method following recapitalization.
•In the first quarter of 2020, we sold an office asset in California in the BSREP II fund for approximately $131 million and a realized gain of approximately $58 million.
For the purposes of the following comparison discussion between the three and six months ended June 30, 2021 and 2020, the above transactions are referred to as the investment activities. In addition to the investment activities, we will use same-property NOI from our Core Office and Core Retail segments to evaluate our operating results.
Summary Operating Results
| | | | | | | | | | | | | | |
| Three months ended Jun. 30, | Six months ended Jun. 30, |
| (US$ Millions) | 2021 | 2020 | 2021 | 2020 |
| Net income (loss) | $ | 686 | | $ | (1,512) | | $ | 1,417 | | $ | (1,885) | |
Net income (loss) attributable to Unitholders(1) | 319 | | (1,253) | | 585 | | (1,739) | |
NOI(1) | 886 | | 800 | | 1,671 | | 1,800 | |
FFO(1) | 144 | | 170 | | 231 | | 444 | |
Company FFO(1) | 176 | | 178 | | 301 | | 487 | |
(1)This is a non-IFRS measure our partnership uses to assess the performance of its operations as described in the “Performance Measures” section on page 4. An analysis of the measures and reconciliation to IFRS measures is included in the “Reconciliation of Non-IFRS measures” section on page 15.
We recognized net income for the three months ended June 30, 2021 of $686 million which compares to net loss of $(1,512) million for the same period in the prior year. Net income per unit attributable to Unitholders was $0.31 in the current period as compared to a loss of $(1.26) in the prior year. The prior year included fair value losses in our Core Office and Core Retail portfolios, which reflected the initial impact of the shutdown on our near and mid-term cash flows. The current period benefited from fair value gains across our Core Office portfolio, as well as our Multifamily portfolio, due to capitalization rate compression. The current period also benefited from increased earnings in our hospitality portfolio, as certain properties have started to recover following the shutdown and the favorable impact of foreign currency translation.
Net income for the six months ended June 30, 2021 was $1,417 million compared to a loss of $(1,885) million for the same period in prior year. Net income per unit attributable to Unitholders for the six months ended June 30, 2021 was $0.56 compared with a loss of $(1.74) in the prior year. The increase is primarily attributable to the reasons mentioned above.
FFO decreased to $144 million during the three months ended June 30, 2021 compared with $170 million during the same period in the prior year. The decrease was driven by higher interest expense as a result of defeasance costs of approximately $98 million incurred upon refinancing our manufactured housing portfolio, the impact of expirations in our Core Retail portfolio and the impact of dispositions since the prior year. These decreases were partially offset by increased earnings in our hospitality portfolio in the current period, as discussed above.
FFO decreased to $231 million during the six months ended June 30, 2021 compared with $444 million during the same period in the prior year. The decrease was driven by dispositions since the prior year, expirations and incremental abatements resulting from the shutdown in our Core Retail portfolio, defeasance costs incurred upon refinancing our manufactured housing portfolio and first quarter operating losses in our hospitality portfolio due to government-mandated closures, primarily at Center Parcs in the U.K. These decreases were partially offset by lower interest expense due to the historically low interest rate environment on our variable debt obligations.
Operating Results | | | | | | | | | | | | | | |
| Three months ended Jun. 30, | Six months ended Jun. 30, |
| (US$ Millions) | 2021 | 2020 | 2021 | 2020 |
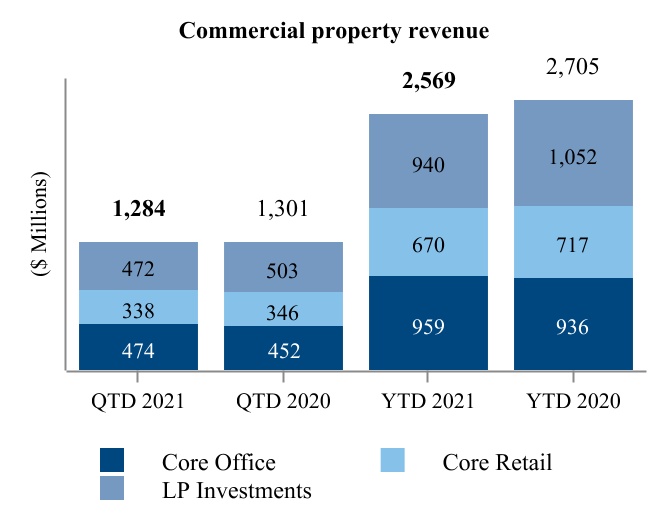
| Commercial property revenue | $ | 1,284 | | $ | 1,301 | | $ | 2,569 | | $ | 2,705 | |
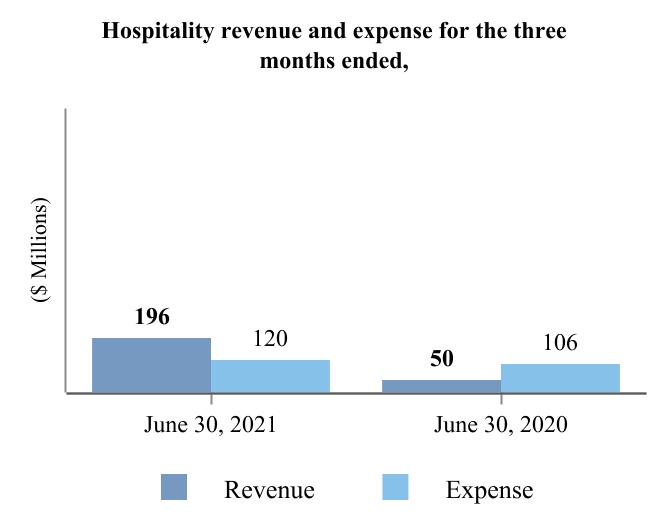
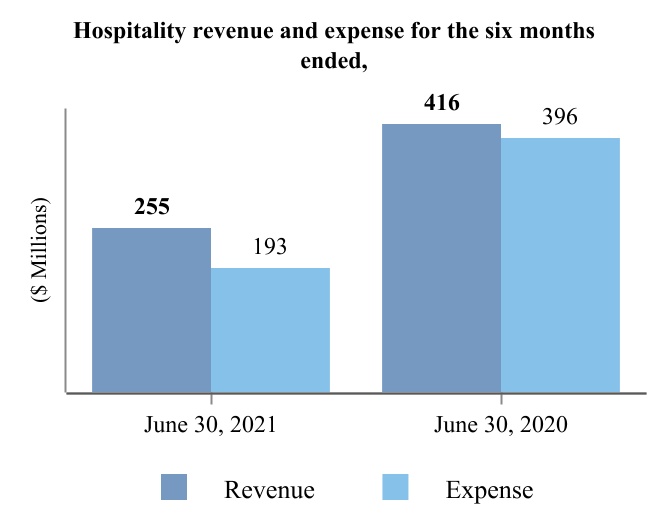
| Hospitality revenue | 196 | | 50 | | 255 | | 416 | |
| Investment and other revenue | 180 | | 86 | | 286 | | 216 | |
| Total revenue | 1,660 | | 1,437 | | 3,110 | | 3,337 | |
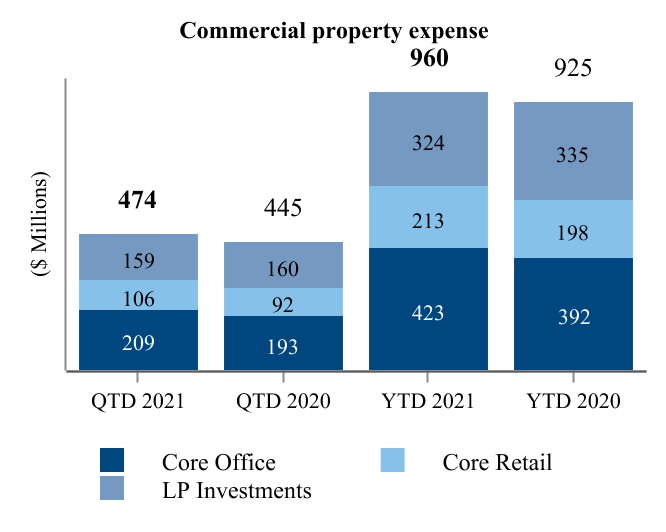
| Direct commercial property expense | 474 | | 445 | | 960 | | 925 | |
| Direct hospitality expense | 120 | | 106 | | 193 | | 396 | |
| Investment and other expense | 23 | | 9 | | 31 | | 13 | |
| Interest expense | 710 | | 599 | | 1,322 | | 1,308 | |
| Depreciation and amortization | 68 | | 83 | | 136 | | 170 | |
| General and administrative expense | 243 | | 195 | | 456 | | 391 | |
| Total expenses | 1,638 | | 1,437 | | 3,098 | | 3,203 | |
| Fair value gains (losses), net | 498 | | (803) | | 1,138 | | (1,113) | |
| Share of earnings from equity accounted investments | 253 | | (757) | | 459 | | (793) | |
| Income before taxes | 773 | | (1,560) | | 1,609 | | (1,772) | |
| Income tax expense (benefit) | 87 | | (48) | | 192 | | 113 | |
| Net income (loss) | $ | 686 | | $ | (1,512) | | $ | 1,417 | | $ | (1,885) | |
| Net income (loss) attributable to non-controlling interests of others in operating subsidiaries and properties | 367 | | (259) | | 832 | | (146) | |
Net income (loss) attributable to Unitholders(1) | $ | 319 | | $ | (1,253) | | $ | 585 | | $ | (1,739) | |
| | | | |
| | | | |
| | | | |
| | | | |
(1)This is a non-IFRS measure our partnership uses to assess the performance of its operations as described in the “Performance Measures” section on page 4. An analysis of the measures and reconciliation to IFRS measures is included in the “Reconciliation of Non-IFRS measures” section on page 15.
Our basic and diluted net (loss) income attributable to Unitholders per unit and weighted average units outstanding are calculated as follows:
| | | | | | | | | | | | | | |
| Three months ended Jun. 30, | Six months ended Jun. 30, |
| (US$ Millions, except per unit information) | 2021 | 2020 | 2021 | 2020 |
| Net income (loss) | $ | 686 | | $ | (1,512) | | $ | 1,417 | | $ | (1,885) | |
| Less: Non-controlling interests | 367 | | (259) | | 832 | | (146) | |
| Less: Preferred unit dividends | 11 | | 11 | | 22 | | 20 | |
Net income (loss) attributable to Unitholders - basic(1) | $ | 308 | | $ | (1,264) | | $ | 563 | | $ | (1,759) | |
| Dilutive effect of conversion of options | — | | — | | — | | — | |
| Net income (loss) attributable to Unitholders - diluted | $ | 308 | | $ | (1,264) | | $ | 563 | | $ | (1,759) | |
| | | | |
Weighted average number of units outstanding - basic(1) | 1,005.7 | | 1,005.6 | | 1,005.7 | | 1,009.6 | |
| Conversion of options | — | | — | | — | | — | |
| Weighted average number of units outstanding - diluted | 1,005.7 | | 1,005.6 | | 1,005.7 | | 1,009.6 | |
Net income (loss) per unit attributable to Unitholders - basic(1)(2) | $ | 0.31 | | $ | (1.26) | | $ | 0.56 | | $ | (1.74) | |
Net income (loss) per unit attributable to Unitholders - diluted(2) | $ | 0.31 | | $ | (1.26) | | $ | 0.56 | | $ | (1.74) | |
(1)Basic net income (loss) attributable to Unitholders per unit requires the inclusion of preferred shares of the Operating Partnership that are mandatorily convertible into LP Units without an add back to earnings of the associated carry on the preferred shares.
(2)Net income (loss) attributable to Unitholders is a non-IFRS measure as described in the “Performance Measures” section on page 4.
Commercial property revenue and direct commercial property expense
For the three months ended June 30, 2021, commercial property revenue decreased by $17 million compared to the same period in the prior year primarily due to property dispositions in our LP Investments segment and expirations and bankruptcies in our Core Retail portfolio, which reflects the ongoing impact of the shutdown on our business. These decreases were partially offset by the lease-up of 100 Bishopsgate which became operational in the prior year, as well as the positive impact of foreign currency translation.
Direct commercial property expense increased by $29 million due to re-opening of properties within our Core Retail portfolio that were closed in the prior year due to the shutdown, as well as the impact of foreign currency translation. Margins in 2021 were 63.1%, a decrease of 2.7% over 2020.
For the six months ended June 30, 2021, commercial property revenue decreased by $136 million compared to the same period in the prior year due to property dispositions in our LP Investments segment and expirations and bankruptcies in our Core Retail portfolio, which reflects the ongoing impact of the shutdown on our business. Additionally, our Core Office portfolio experienced 3% same-property loss, attributable to lower parking and retail revenue due to the shutdown as well as lease expirations since the prior year. These decreases were partially offset by the positive impact of foreign currency translation and leasing at 100 Bishopsgate which became operational in the prior year.
Direct commercial property expense increased by $35 million compared to the prior year. Margins in 2021 were 62.6%, a decrease of 3.2% compared to 2020.
Commercial property NOI decreased by $46 million to $810 million during the three months ended June 30, 2021 compared with $856 million during the same period in the prior year. Commercial property NOI decreased by $171 million to $1,609 million during the six months ended June 30, 2021, compared with $1,780 million during the same period in the prior year. The decreases were primarily driven by the reasons mentioned above.
Hospitality revenue and direct hospitality expense
For the three months ended June 30, 2021, hospitality revenue increased by $146 million compared to the same period in the prior year. The prior year was impacted due to closures and cancellations related to COVID-19, primarily at Center Parcs and Atlantis. The majority of our hospitality investments operated at a loss given reduced occupancy levels or mandated closures. Certain of our hospitality assets have now entered the recovery phase, as mandated closures and restrictions have started to lift and there is increased demand for leisure travel. Direct hospitality expense increased to $120 million for the three months ended June 30, 2021, compared to $106 million in the same period in the prior year.
For the six months ended June 30, 2021, hospitality revenue decreased by $161 million compared to the same period in the prior year. This decrease was due to the impact of the shutdown in the first quarter of 2021, as the majority of our hotels were operating at a loss due to government mandated closures and reduced occupancy levels.
Direct hospitality expense decreased to $193 million for the six months ended June 30, 2021, compared to $396 million in the same period in the prior year, driven by the deconsolidation of Atlantis. Additionally, we have been able to reduce operating costs at our hotels that are closed or operating at reduced occupancy levels, however certain fixed costs remain and are not offset by revenues because of closures and/or drastically reduced occupancy as a result of the shutdown.
Hospitality NOI increased by $132 million to $76 million during three months ended June 30, 2021 compared to $(56) million during the same period in the prior year. For the six months ended June 30, 2021, hospitality NOI increased by $42 million to $62 million compared to $20 million during the same period in the prior year. The increase is almost entirely attributable to the impact of the shutdown in the prior year.
Investment and other revenue, and investment and other expense
Investment and other revenue includes management fees, leasing fees, development fees, interest income and other non-rental revenue. Investment and other revenue increased by $94 million and $70 million for the three and six months ended June 30, 2021, respectively, compared to the same period in the prior year. The increase is primarily due to higher interest income and an incremental distribution from BSREP III of approximately $40 million associated with the sale of a life science portfolio.
Investment and other expense for the three and six months ended June 30, 2021 increased by $14 million and $18 million to $23 million and $31 million, respectively, compared to the prior year.
Interest expense
Interest expense increased by $111 million and $14 million for the three and six months ended June 30, 2021 as compared to the same period in the prior year. This increase is due to defeasance costs of approximately $98 million incurred to refinance our manufactured housing portfolio in the current period, partially offset by the impact of the historically low interest rate environment on our variable debt obligations coupled with reduced debt levels from disposition activity. The increase is also due to interest expense from Corporate bond issuances.
General and administrative expense
General and administrative expense increased by $48 million for the three months ended June 30, 2021 as compared to the same period in the prior year. The increase was primarily attributable to higher management fees and transaction costs associated with the Hospitality Investors Trust transaction during the current period, partially offset by reduced compensation and benefits expense compared to the prior year.
General and administrative expense increased by $65 million for the six months ended June 30, 2021 as compared to the same period in the prior year. The increase was due to the reasons discussed above.
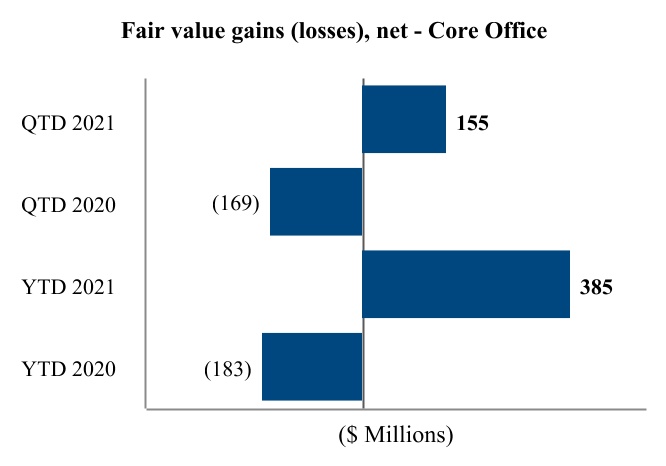
Fair value gains (losses), net
Fair value gains (losses), net includes valuation gains (losses) on commercial properties and developments as well as mark-to-market adjustments on financial instruments and derivatives and foreign currency gains (losses) on disposal of assets denominated in foreign currencies. While we measure and record our commercial properties and developments using valuations prepared by management in accordance with our policy, external appraisals and market comparables, when available, are used to support our valuations.
Fair value gains, net for our Core Office segment were $155 million and $385 million for the three and six months ended June 30, 2021, respectively. The current period gains are driven by a reduction in risk at a development in the U.K as the development continues through the lease-up phase, gains on certain of our multifamily developments in the U.S. due to updated cashflow assumptions, favorable market rent assumptions at an asset in Brazil, and burn-off of free rent in Midtown New York and London.
Fair value losses, net for our Core Office segment were $183 million for the six months ended June 30, 2020. These losses primarily reflected the impact of the shutdown on our near and mid-term cash flows.
Fair value losses, net for our Core Retail segment were $(36) million and $(396) million for the three and six months ended June 30, 2021, respectively. Fair value losses, net for our Core Retail portfolio are primarily due to updated cash flow assumptions, which included the impact of an anchor-tenant expiration at one of our malls and realized losses on the disposition of two assets.
Fair value losses, net for our Core Retail segment were $836 million for the six months ended June 30, 2020. These losses reflected updated cashflow assumptions on a suite-by-suite basis with revised market leasing assumptions, vacancy reserve, downtime, retention assumptions and capital costs due to the shutdown and the resulting store closures. These losses also reflected updated valuation metrics where necessary to reflect changes to property level risk profiles.
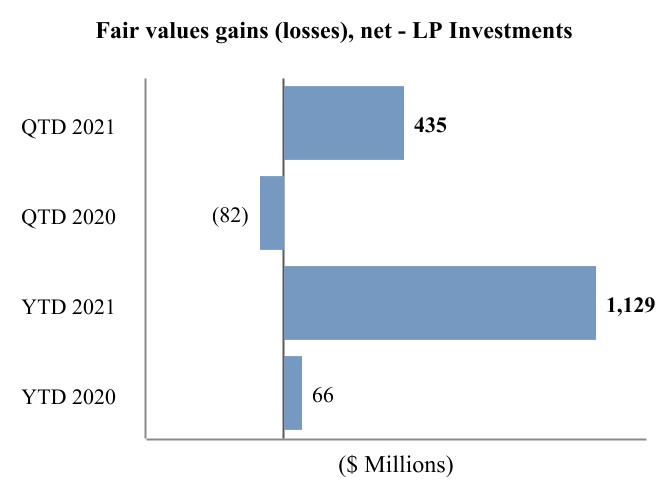
Fair value gains, net for our LP Investments segment were $435 million and $1,129 million for the three and six months ended June 30, 2021, respectively. These gains were driven by capitalization rate compression in our manufactured housing portfolio and an office asset in the U.K. Our student housing portfolio also benefited from capitalization rate compression, as well as increased cash flows from the upcoming school year.
Fair value gains, net for our LP Investments segment for the six months ended June 30, 2020 were $66 million primarily due to capitalization rate compression in South Korea and increased operating cash flows in certain office assets in India. These gains were partially offset by certain of our asset classes that were more materially impacted than others from the shutdown, mostly our retail assets and certain of our office investments. We revisited cash flow assumptions for each of our assets and took into consideration the type of asset, location, the credit-quality of our tenants, renewal rates, average lease term and restrictions that might impact our ability to collect rent. Based on this, we reflected some negative near-term cash flow assumptions into our valuation models.
Fair value sensitivity
The following table presents a sensitivity analysis to the impact of a 0.25 basis point (“bps”) increase of the discount rate and terminal capitalization or overall implied capitalization rate (“ICR”) on fair values of the partnership’s commercial properties for the six months ended June 30, 2021, for properties valued using the discounted cash flow or direct capitalization method, respectively:
| | | | | | | | | | | | | | | | | | | | | | | | | | |
| Jun. 30, 2021 |
| (US$ Millions) | Commercial properties | Commercial developments | Discount rate (“DR”) | Terminal
capitalization
rate
(“TCR”) | Investment horizon (years) | Impact of +25bps DR | Impact of +25bps TCR | Impact of +25bps DR and +25bps TCR or +25bps ICR |
| Core Office | | | | | | | | |
| United States | $ | 14,821 | | $ | 505 | | 6.9 | % | 5.6 | % | 12 | $ | (329) | | $ | (435) | | $ | (752) | |
| Canada | 4,842 | | 65 | | 5.9 | % | 5.2 | % | 10 | (111) | | (161) | | (253) | |
| Australia | 2,341 | | 459 | | 6.6 | % | 5.7 | % | 10 | (59) | | (100) | | (161) | |
| Europe | 2,600 | | 273 | | 4.6 | % | 3.8 | % | 10 | (51) | | (109) | | (158) | |
| Brazil | 380 | | — | | 7.6 | % | 7.0 | % | 10 | (6) | | (6) | | (2) | |
| Core Retail | 20,037 | | — | | 7.0 | % | 5.3 | % | 10 | (678) | | (405) | | (1,067) | |
| LP Investments | | | | | | | | |
| LP Investments- Office | 8,352 | | 743 | | 9.6 | % | 7.1 | % | 7 | (134) | | (269) | | (399) | |
| LP Investments- Retail | 2,238 | | — | | 8.6 | % | 7.0 | % | 10 | (47) | | (77) | | (126) | |
| Hospitality | 89 | | — | | — | % | — | % | — | | — | | — | | — | |
| Mixed-use | 3,042 | | — | | 7.2 | % | 5.1 | % | 10 | (85) | | (86) | | (139) | |
| | | | | | | | |
Multifamily(1) | 2,018 | | — | | 4.7 | % | n/a | n/a | — | | (97) | | (97) | |
Triple Net Lease(1) | 3,704 | | — | | 6.2 | % | n/a | n/a | — | | (141) | | (141) | |
| | | | | | | | |
Student Housing(1) | 2,911 | | 314 | | 4.9 | % | n/a | n/a | — | | (129) | | (129) | |
Manufactured Housing(1) | 3,453 | | — | | 4.6 | % | n/a | n/a | — | | (176) | | (176) | |
| Investment property impact | $ | 70,828 | | $ | 2,359 | | | | | $ | (1,500) | | $ | (2,191) | | $ | (3,600) | |
(1)The valuation method used to value multifamily, triple net lease, student housing, and manufactured housing properties is the direct capitalization method. The rates presented as the discount rate relate to the overall implied capitalization rate. The terminal capitalization rate and investment horizon are not applicable.
In addition, for the three and six months ended June 30, 2021, we recorded fair value losses, net of $56 million and fair value gains, net of $20 million (2020 - fair value losses, net of $11 million and $160 million), respectively, related to mark-to-market adjustments of financial instruments and the settlement of derivative contracts during the period.
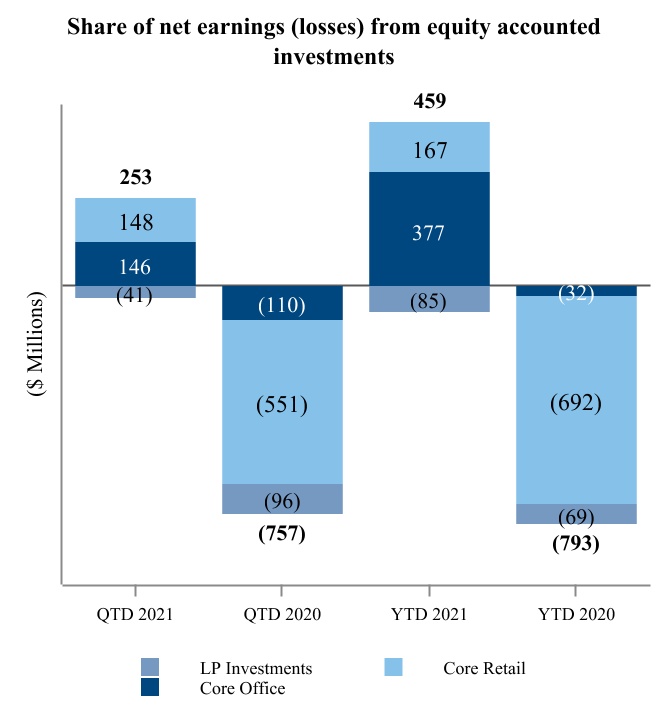
Share of net earnings from equity accounted investments
Our most significant equity accounted investments are:
•In Core Office - Canary Wharf and Manhattan West.
•In Core Retail - Ala Moana Center in Hawaii, Fashion Show in Las Vegas and Grand Canal Shoppes in Las Vegas.
•In LP Investments - our interest in the retail fund in Brazil.
Our share of net earnings (losses) from equity accounted investments for the three and six months ended June 30, 2021 was $253 million and $459 million, respectively, which represents an increase of $1,010 million and $1,252 million, respectively, compared to the prior year. The current year earnings are primarily due to higher investment property fair value gains, gains on derivatives and the favorable impact of foreign currency translation, partially offset by losses in our hospitality portfolio in the first quarter of 2021, which continued to be impacted by the shutdown. The prior year included fair value losses on our Core Retail portfolio, which included updated cash flow assumptions on a suite-by-suite basis, as well as lower share of net earnings from our hospitality portfolio due to the impact of the shutdown on our business.
Income tax expense
The increase in income tax expense for the three and six months ended June 30, 2021 compared to the prior year is primarily due to an increase in book income and an increase in tax rates due to legislative changes. These increases were partially offset by restructuring of certain subsidiaries occurring in the first quarter of 2021.
Reconciliation of Non-IFRS measures
As described in the “Performance Measures” section on page 4, our partnership uses non-IFRS measures to assess the performance of its operations. An analysis of the measures and reconciliation to IFRS measures is included below.
The following table reconciles net income (loss) to NOI for the three and six months ended June 30, 2021 and 2020:
| | | | | | | | | | | | | | |
| Three months ended Jun. 30, | Six months ended Jun. 30, |
| (US$ Millions) | 2021 | 2020 | 2021 | 2020 |
| Commercial property revenue | $ | 1,284 | | $ | 1,301 | | $ | 2,569 | | $ | 2,705 | |
| Direct commercial property expense | (474) | | (445) | | (960) | | (925) | |
| Commercial property NOI | 810 | | 856 | | 1,609 | | 1,780 | |
| Hospitality revenue | 196 | | 50 | | 255 | | 416 | |
| Direct hospitality expense | (120) | | (106) | | (193) | | (396) | |
| Hospitality NOI | 76 | | (56) | | 62 | | 20 | |
| Total NOI | 886 | | 800 | | 1,671 | | 1,800 | |
| Investment and other revenue | 180 | | 86 | | 286 | | 216 | |
| Share of net earnings from equity accounted investments | 253 | | (757) | | 459 | | (793) | |
| Interest expense | (710) | | (599) | | (1,322) | | (1,308) | |
| Depreciation and amortization | (68) | | (83) | | (136) | | (170) | |
| General and administrative expense | (243) | | (195) | | (456) | | (391) | |
| Investment and other expense | (23) | | (9) | | (31) | | (13) | |
| Fair value gains (losses), net | 498 | | (803) | | 1,138 | | (1,113) | |
| Income (loss) before taxes | 773 | | (1,560) | | 1,609 | | (1,772) | |
| Income tax expense | (87) | | 48 | | (192) | | (113) | |
| Net income (loss) | $ | 686 | | $ | (1,512) | | $ | 1,417 | | $ | (1,885) | |
| Net income (loss) attributable to non-controlling interests | 367 | | (259) | | 832 | | (146) | |
| Net income (loss) attributable to Unitholders | $ | 319 | | $ | (1,253) | | $ | 585 | | $ | (1,739) | |
The following table reconciles net income (loss) to FFO and Company FFO for the three and six months ended June 30, 2021 and 2020:
| | | | | | | | | | | | | | |
| Three months ended Jun. 30, | Six months ended Jun. 30, |
| (US$ Millions) | 2021 | 2020 | 2021 | 2020 |
| Net income (loss) | $ | 686 | | $ | (1,512) | | $ | 1,417 | | $ | (1,885) | |
| Add (deduct): | | | | |
| Fair value (gains) losses, net | (498) | | 803 | | (1,138) | | 1,113 | |
| Share of equity accounted fair value (gains) losses, net | (105) | | 908 | | (181) | | 1,158 | |
| Depreciation and amortization of real estate assets | 46 | | 66 | | 91 | | 135 | |
| Income tax expense | 87 | | (48) | | 192 | | 113 | |
| Non-controlling interests in above items | (72) | | (47) | | (150) | | (190) | |
| FFO | $ | 144 | | $ | 170 | | $ | 231 | | $ | 444 | |
| Add (deduct): | | | | |
Depreciation and amortization of non-real-estate assets, net(1) | 14 | | 12 | | 29 | | 23 | |
Transaction costs, net(1) | 55 | | (12) | | 73 | | (2) | |
(Gains)/losses associated with non-investment properties, net(1) | — | | — | | — | | 3 | |
Imputed interest(2) | 4 | | 8 | | 9 | | 16 | |
BSREP III earnings(3) | (41) | | — | | (41) | | 3 | |
| Company FFO | $ | 176 | | $ | 178 | | $ | 301 | | $ | 487 | |
(1)Presented net of non-controlling interests.
(2)Represents imputed interest associated with financing the partnership’s share of commercial developments accounted for under the equity method.
(3)BSREP III is accounted for as a financial asset which results in FFO being recognized in line with distributions received. As such, the BSREP III earnings adjustment picks up our proportionate share of the Company FFO.
Statement of Financial Position Highlights and Key Metrics
| | | | | | | | |
| (US$ Millions) | Jun. 30, 2021 | Dec. 31, 2020 |
| Investment properties | | |
| Commercial properties | $ | 70,828 | | $ | 70,294 | |
| Commercial developments | 2,359 | | 2,316 | |
| Equity accounted investments | 20,442 | | 19,719 | |
| Property, plant and equipment | 6,897 | | 5,235 | |
| Cash and cash equivalents | 2,302 | | 2,473 | |
| Assets held for sale | 965 | | 588 | |
| Total assets | 111,304 | | 107,951 | |
| Debt obligations | 55,281 | | 54,337 | |
| Liabilities associated with assets held for sale | 4 | | 396 | |
| Total equity | 42,229 | | 41,523 | |
Equity attributable to Unitholders(1) | $ | 25,539 | | $ | 25,137 | |
Equity per unit(2) | $ | 27.08 | | $ | 26.66 | |
(1)Equity attributable to Unitholders is a non-IFRS measure as described in the “Performance Measures” section on page 4.
(2)Assumes conversion of mandatorily convertible preferred shares. See page 16 for additional information.
As of June 30, 2021, we had $111,304 million in total assets, compared with $107,951 million at December 31, 2020. This $3,353 million increase was primarily due to the consolidation of a hospitality portfolio previously accounted for as a financial asset.
Commercial properties are commercial, operating, rent-producing properties. Commercial properties increased from $70,294 million at the end of 2020 to $70,828 million at June 30, 2021. The increase was largely due to gains in our LP Investments and Core Office segments as discussed above, acquisitions of a manufactured housing portfolio and a multifamily asset and capital expenditures. These increases were partially offset by property dispositions and valuation losses in our retail portfolio.
Commercial developments consist of commercial property development sites, density rights and related infrastructure. The total fair value of development land and infrastructure was $2,359 million at June 30, 2021, an increase of $43 million from the balance at December 31, 2020. The increase is primarily due to incremental capital spend and valuation gains on our active developments. partially offset by the partial disposition of Bay Adelaide North in Toronto.
The following table presents the changes in investment properties from December 31, 2020 to June 30, 2021:
| | | | | | | | |
| Jun. 30, 2021 |
| (US$ Millions) | Commercial properties | Commercial developments |
| Investment properties, beginning of period | $ | 70,294 | | $ | 2,316 | |
| Acquisitions | 337 | | 12 | |
| Capital expenditures | 410 | | 369 | |
| | |
Dispositions(1) | (295) | | (344) | |
| Fair value (losses) gains, net | 883 | | 129 | |
| Foreign currency translation | (7) | | (3) | |
| Transfer between commercial properties and commercial developments | 120 | | (120) | |
| | |
| Reclassifications to assets held for sale and other changes | (914) | | — | |
| Investment properties, end of period | $ | 70,828 | | $ | 2,359 | |
(1)Property dispositions represent the carrying value on date of sale.
Equity accounted investments increased by $723 million since December 31, 2020. The increase is primarily due to the deconsolidation of our interest in Bay Adelaide North upon partial disposition, as well as an increase in our share of earnings from equity accounted investments, driven by fair value gains and gains on derivative instruments.
The following table presents a roll-forward of changes in our equity accounted investments:
| | | | | |
| (US$ Millions) | Jun. 30, 2021 |
| Equity accounted investments, beginning of period | $ | 19,719 | |
| Additions | 584 | |
| Disposals and return of capital distributions | (149) | |
| Share of net earnings from equity accounted investments | 459 | |
| Distributions received | (92) | |
| Foreign currency translation | 17 | |
| Reclassification (to)/from assets held for sale | (117) | |
| |
| Other comprehensive income and other | 21 | |
| Equity accounted investments, end of period | $ | 20,442 | |
Property, plant and equipment increased by $1,662 million since December 31, 2020, after our preferred equity interest in a hospitality portfolio was converted into common shares and which resulted in us acquiring control over the investment.
As of June 30, 2021, assets held for sale primarily included eight retail assets in the U.S., nine multifamily assets in the U.S, five triple-net lease assets in the U.S, an office asset in the U.S., and a hotel in the U.S., as we intend to sell controlling interests in these properties to third parties in the next 12 months.
The following table presents changes in our assets held for sale from December 31, 2020 to June 30, 2021:
| | | | | |
| (US$ Millions) | Jun. 30, 2021 |
| Balance, beginning of period | $ | 588 | |
| Reclassification to/(from) assets held for sale, net | 1,045 | |
| Disposals | (671) | |
| Fair value adjustments | 3 | |
| |
| Other | — | |
| Balance, end of period | $ | 965 | |
Our debt obligations increased to $55,281 million at June 30, 2021 from $54,337 million at December 31, 2020. The increase was driven by the consolidation of a hospitality portfolio and the acquisition and upfinancing of a manufactured housing portfolio, partially offset by repayment of the partnership’s credit facilities and property-level debt and the deconsolidation of Bay Adelaide North.
The following table presents additional information on our partnership’s outstanding debt obligations:
| | | | | | | | |
| (US$ Millions) | Jun. 30, 2021 | Dec. 31, 2020 |
| Corporate borrowings | $ | 1,924 | | $ | 3,232 | |
| Funds subscription facilities | 300 | | 314 | |
| Non-recourse borrowings | | |
| Property-specific borrowings | 46,618 | | 44,515 | |
| Subsidiary borrowings | 6,439 | | 6,276 | |
| Total debt obligations | $ | 55,281 | | $ | 54,337 | |
| Current | 11,986 | | 13,074 | |
| Non-current | 43,295 | | 41,263 | |
| Total debt obligations | $ | 55,281 | | $ | 54,337 | |
The following table presents the components used to calculate equity attributable to Unitholders per unit:
| | | | | | | | |
| (US$ Millions, except unit information) | Jun. 30, 2021 | Dec. 31, 2020 |
| Total equity | $ | 42,229 | | $ | 41,523 | |
| Less: | | |
| Interests of others in operating subsidiaries and properties | 15,991 | | 15,687 | |
| Preferred equity | 699 | | 699 | |
| Equity attributable to Unitholders | 25,539 | | 25,137 | |
| Mandatorily convertible preferred shares | 1,694 | | 1,679 | |
| Total equity attributable to Unitholders | 27,233 | | 26,816 | |
| Partnership units | 935,748,916 | | 935,984,543 | |
| Mandatorily convertible preferred shares | 70,051,024 | | 70,051,024 | |
| Total partnership units | 1,005,799,940 | | 1,006,035,567 | |
| Total equity attributable to Unitholders per unit | $ | 27.08 | | $ | 26.66 | |
Equity attributable to Unitholders was $25,539 million at June 30, 2021, an increase of $402 million from the balance at December 31, 2020. The increase was primarily due to income earned during the period, partially offset by distributions. Assuming the conversion of mandatorily convertible preferred shares, equity attributable to Unitholders increased to $27.08 per unit at June 30, 2021 from $26.66 per unit at December 31, 2020.
Interests of others in operating subsidiaries and properties was $15,991 million at June 30, 2021, an increase of $304 million from the balance of $15,687 million at December 31, 2020.
| | | | | | | | | | | | | | | | | | | | | | | | | | | |
| 2021 | 2020 | 2019 | |
| (US$ Millions, except per unit information) | Q2 | Q1 | Q4 | Q3 | Q2 | Q1 | Q4 | Q3 | |
| Revenue | $ | 1,660 | | $ | 1,450 | | $ | 1,620 | | $ | 1,636 | | $ | 1,437 | | $ | 1,900 | | $ | 2,087 | | $ | 2,017 | | |
| Direct operating costs | 594 | | 559 | | 566 | | 677 | | 551 | | 770 | | 783 | | 776 | | |
| Net income (loss) | 686 | | 731 | | (38) | | (135) | | (1,512) | | (373) | | 1,551 | | 870 | | |
| Net income (loss) attributable to Unitholders | 319 | | 266 | | (390) | | (229) | | (1,253) | | (486) | | 1,022 | | 474 | | |
| Net income (loss) per share attributable to Unitholders - basic | $ | 0.31 | | $ | 0.25 | | $ | (0.38) | | $ | (0.24) | | $ | (1.26) | | $ | (0.49) | | $ | 1.00 | | $ | 0.46 | | |
| Net income (loss) per share attributable to Unitholders - diluted | $ | 0.31 | | $ | 0.25 | | $ | (0.38) | | $ | (0.24) | | $ | (1.26) | | $ | (0.49) | | $ | 1.00 | | $ | 0.46 | | |
| | | | | | | | | |
| | | | | | | | | |
| | | | | | | | | |
| | | | | | | | | |
Revenue varies from quarter to quarter due to acquisitions and dispositions of commercial and other income producing assets, changes in occupancy levels, including mandated closures, as well as the impact of leasing activity at market net rents. In addition, revenue also fluctuates as a result of changes in foreign exchange rates and seasonality. Seasonality primarily affects our retail assets, wherein the fourth quarter exhibits stronger performance in conjunction with the holiday season. In addition, our North American hospitality assets generally have stronger performance in the winter and spring months compared to the summer and fall months, while our European hospitality assets exhibit the strongest performance during the summer months. Seasonality, however, has been less of an impact in the last four quarters due to the material effect of the economic shutdown on our retail and hospitality sectors. Fluctuations in our net income is also impacted by the fair value of properties in the period to reflect changes in valuation metrics driven by market conditions or property cash flows.
SEGMENT PERFORMANCE
Our operations are organized into four operating segments which include Core Office, Core Retail, LP Investments and Corporate.
The following table presents FFO by segment:
| | | | | | | | | | | | | | |
| Three months ended Jun. 30, | Six months ended Jun. 30, |
| (US$ Millions) | 2021 | 2020 | 2021 | 2020 |
| Core Office | $ | 131 | | $ | 115 | | $ | 254 | | $ | 236 | |
| Core Retail | 103 | | 147 | | 198 | | 335 | |
| LP Investments | 40 | | (11) | | 34 | | 38 | |
| Corporate | (130) | | (81) | | (255) | | (165) | |
| FFO | $ | 144 | | $ | 170 | | $ | 231 | | $ | 444 | |
The following table presents equity attributable to Unitholders by segment as of June 30, 2021 and December 31, 2020:
| | | | | | | | |
| (US$ Millions) | Jun. 30, 2021 | Dec. 31, 2020 |
| Core Office | $ | 15,081 | | $ | 14,246 | |
| Core Retail | 12,738 | | 12,500 | |
| LP Investments | 5,179 | | 5,262 | |
| Corporate | (7,459) | | (6,871) | |
| Total | $ | 25,539 | | $ | 25,137 | |
Core Office
Overview
Our Core Office portfolio consists of interests in 143 high-quality office properties totaling over 98 million square feet, which are located primarily in the world’s leading commercial markets such as New York, London, Los Angeles, Washington, D.C., Sydney, Toronto, and Berlin, as well as approximately 6 million square feet of active office and multifamily developments and office redevelopments. We believe these assets have a stable cash flow profile due to long-term leases in place. The drivers of earnings growth in this business include the mark-to-market of rents upon lease expiry, escalation provisions in leases and projected increases in occupancy, that are expected to generate strong same-property NOI growth without significant capital investment. Furthermore, we expect to earn higher unlevered, pre-tax returns on construction costs from our development pipeline. However, we caution you that as a result of the global economic shutdown, we have seen slower than usual leasing activity, and we may be unable to achieve these returns in the near term. We do expect rent growth to be minimal for the next 6-12 months, but we have a strong average lease-life and occupancy that we think will benefit us from more adverse impacts resulting from the shutdown.
Summary of Operating Results
The following table presents FFO and net income (loss) attributable to Unitholders in our Core Office segment for the three and six months ended June 30, 2021 and 2020:
| | | | | | | | | | | | | | |
| Three months ended Jun. 30, | Six months ended Jun. 30, |
| (US$ Millions) | 2021 | 2020 | 2021 | 2020 |
| FFO | $ | 131 | | $ | 115 | | $ | 254 | | $ | 236 | |
| Net income (loss) attributable to Unitholders | 276 | | (158) | | 757 | | (92) | |
FFO from our Core Office segment was $131 million for the three months ended June 30, 2021 as compared to $115 million in the same period in the prior year. This increase is largely attributable to condominium sales at a residential tower in London, the impact of foreign currency translation and incremental NOI at 100 Bishopsgate in London as the asset continues through the lease-up phase. These increases were partially offset by dispositions as mentioned in investment activity.
FFO from our Core Office segment was $254 million for the six months ended June 30, 2021 as compared to $236 million in the same period in the prior year. This increase is largely attributable to the reasons mentioned above.
Net income attributable to Unitholders increased by $434 million to $276 million during the three months ended June 30, 2021 as compared to net loss of $158 million during the same period in 2020. The increase is largely attributable to fair value gains on investment properties and the impact of foreign currency translation, partially offset by mark-to-market adjustments on financial instruments in the current period and the impact from dispositions.
Net income attributable to Unitholders increased by $849 million to $757 million during the six months ended June 30, 2021 as compared to a loss of $92 million during the same period in 2020. The increase is attributable to the reasons mentioned above.
Leasing Activity
The following table presents key operating metrics for our Core Office portfolio as at and for the three months ended June 30, 2021 and 2020:
| | | | | | | | | | | | | | |
| Consolidated | Unconsolidated |
| (US$ Millions, except where noted) | Jun. 30, 2021 | Jun. 30, 2020 | Jun. 30, 2021 | Jun. 30, 2020 |
| Total portfolio: | | | | |
NOI(1) | $ | 265 | | $ | 256 | | $ | 117 | | $ | 116 | |
| Number of properties | 74 | | 73 | | 69 | | 64 | |
| Leasable square feet (in thousands) | 50,361 | | 48,585 | | 29,443 | | 27,750 | |
| Occupancy | 87.7 | % | 90.6 | % | 90.8 | % | 95.3 | % |
In-place net rents (per square foot)(2)(3) | $ | 33.62 | | $ | 31.19 | | $ | 52.07 | | $ | 43.66 | |
| Same-property: | | | | |
NOI(1,3) | $ | 260 | | $ | 259 | | $ | 116 | | $ | 109 | |
| Number of properties | 73 | | 73 | | 62 | | 62 | |
| Leasable square feet (in thousands) | 50,351 | | 50,323 | | 27,465 | | 25,567 | |
| Occupancy | 87.7 | % | 90.6 | % | 92.7 | % | 94.9 | % |
In-place net rents (per square foot)(2)(3) | $ | 33.62 | | $ | 32.75 | | $ | 51.19 | | $ | 48.13 | |
(1)NOI for unconsolidated properties is presented on a proportionate basis, representing the Unitholders’ interest in the property. See “Reconciliation of Non-IFRS Measures - Core Office” below for a description of the key components of NOI in our Core Office segment.
(2)Annualized cash rent from leases on a per square foot basis including tenant expense reimbursements, less operating expenses incurred for that space, but excluding the impact of straight-line rent or amortization of free rent periods.
(3)Presented using normalized foreign exchange rates, using the June 30, 2021 exchange rate.
NOI from our consolidated properties increased to $265 million during the three months ended June 30, 2021 from $256 million in the same quarter in 2020. The increase was attributable to the impact of foreign currency translation, incremental NOI in London from 100 Bishopsgate and in Sydney from 388 George Street due to leasing activity subsequent to substantial completion of both assets in 2020, and higher parking and ancillary revenue in the U.S. as the economy and return-to-office rates improve subsequent to the shutdown. Same-property NOI for our consolidated properties for the three months ended June 30, 2021 compared with the same period in the prior year was flat at $260 million. Same-property NOI benefited from the impact of foreign currency translation, leasing activity at 100 Bishopsgate and higher retail and parking revenue as discussed above, offset by expirations and dispositions.
NOI from our unconsolidated properties, which is presented on a proportionate basis was flat at $117 million during the three months ended June 30, 2021, compared to $116 million in the prior year. Unconsolidated NOI benefited from the impact of foreign currency translation, leasing at One Manhattan West and the Grace Building, and the substantial completion of ICD Brookfield Place in Dubai in the prior year. These increases were offset by expirations and dispositions since the prior year. Same-property NOI increased compared to the prior year due to leasing activity and the impact of foreign currency translation, as discussed above.
The following table presents certain key operating metrics related to leasing activity in our Core Office segment for the six months ended June 30, 2021 and 2020:
| | | | | | | | |
| Total portfolio |
| (US$, except where noted) | Jun. 30, 2021 | Jun. 30, 2020 |
| Leasing activity (square feet in thousands) | | |
| New leases | 632 | | 1,052 | |
| Renewal leases | 1,981 | | 1,595 | |
| Total leasing activity | 2,613 | | 2,647 |
| Average term (in years) | 8.1 | | 8.5 | |
Year one leasing net rents (per square foot)(1) | $ | 44.20 | | $ | 36.06 | |
Average leasing net rents (per square foot)(1) | 49.05 | | 37.68 | |
Expiring net rents (per square foot)(1) | 39.95 | | 33.37 | |
Estimated market net rents for similar space (per square foot)(1) | 39.38 | | 42.19 | |
| Tenant improvement and leasing costs (per square foot) | 81.58 | | 36.64 | |
(1)Presented using normalized foreign exchange rates, using the June 30, 2021 exchange rate.
For the six months ended June 30, 2021, we leased approximately 2.6 million square feet at average in-place net rents of $49.05 per square foot. Approximately 24% of our leasing activity represented new leases. Our overall Core Office portfolio’s in-place net rents are currently 3% above market net rents as at June 30, 2021. For the six months ended June 30, 2021, tenant improvements and leasing costs related to leasing activity were $81.58 per square foot, compared to $36.64 per square foot in the prior year.
We calculate net rent as the annualized amount of cash rent receivable from leases on a per square foot basis, including tenant expense reimbursements, less operating expenses being incurred for that space, excluding the impact of straight-lining rent escalations or
amortization of free rent periods. This measure represents the amount of cash, on a per square foot basis, generated from leases in a given period.
Valuation Metrics
The key valuation metrics for commercial properties in our Core Office segment on a weighted-average basis are as follows:
| | | | | | | | | | | | | | | | | | | | |
| Jun. 30, 2021 | Dec. 31, 2020 |
| Discount rate | Terminal capitalization rate | Investment horizon | Discount rate | Terminal capitalization rate | Investment horizon |
| Consolidated properties | | | | | | |
| United States | 6.9 | % | 5.6 | % | 12 | 6.9 | % | 5.6 | % | 12 |
| Canada | 5.9 | % | 5.2 | % | 10 | 5.9 | % | 5.2 | % | 10 |
| Australia | 6.6 | % | 5.7 | % | 10 | 6.6 | % | 5.7 | % | 10 |
| Europe | 4.6 | % | 3.8 | % | 10 | 5.2 | % | 3.8 | % | 10 |
| Brazil | 7.6 | % | 7.0 | % | 10 | 7.6 | % | 7.0 | % | 10 |
| Unconsolidated properties | | | | | | |
| United States | 6.4 | % | 4.7 | % | 11 | 6.4 % | 4.7 % | 11 |
| Australia | 6.3 | % | 4.9 | % | 10 | 6.3 % | 5.3 % | 10 |
Europe(1) | 5.5 | % | 4.6 | % | 10 | 5.6 % | 4.7 | % | 10 |
(1)Certain properties in Europe accounted for under the equity method are valued using both discounted cash flow and yield models. For comparative purposes, the discount and terminal capitalization rates and investment horizon calculated under the discounted cash flow method are presented in the table above.
Financial Position
The following table provides an overview of the financial position of our Core Office segment as at June 30, 2021 and December 31, 2020:
| | | | | | | | |
| (US$ Millions) | Jun. 30, 2021 | Dec. 31, 2020 |
| Investment properties | | |
| Commercial properties | $ | 24,984 | | $ | 24,604 | |
| Commercial developments | 1,302 | | 1,329 | |
| Equity accounted investments | 9,813 | | 8,866 | |
| Accounts receivable and other | 1,307 | | 1,094 | |
| Cash and cash equivalents | 632 | | 458 | |
| Assets held for sale | 109 | | 196 | |
| Total assets | $ | 38,147 | | $ | 36,547 | |
| Debt obligations | 14,063 | | 13,681 | |
| Capital securities | 870 | | 863 | |
| Accounts payable and other liabilities | 1,828 | | 1,664 | |
| Deferred tax liability | 1,157 | | 1,151 | |
| Liabilities associated with assets held for sale | — | | 80 | |
| Non-controlling interests of others in operating subsidiaries and properties | 5,148 | | 4,862 | |
| Equity attributable to Unitholders | $ | 15,081 | | $ | 14,246 | |
Equity attributable to Unitholders increased by $835 million to $15,081 million at June 30, 2021 from $14,246 million at December 31, 2020. The increase relates to net income in the current period and the impact of foreign currency translation.
Commercial properties totaled $24,984 million at June 30, 2021, compared to $24,604 million at December 31, 2020. The increase was driven primarily by fair value gains, the impact of foreign currency translation and incremental capital expenditures.
Commercial developments decreased by $27 million from December 31, 2020 to June 30, 2021. The decrease was primarily due to partial disposition of Bay Adelaide North, which was previously consolidated and is now accounted for under the equity method. The decrease was partially offset by incremental capital expenditures on our active developments.
The following table presents changes in our partnership’s equity accounted investments in the Core Office segment from December 31, 2020 to June 30, 2021:
| | | | | |
| (US$ Millions) | Jun. 30, 2021 |
| Equity accounted investments, beginning of period | $ | 8,866 | |
| Additions | 498 | |
| |
| Share of net earnings, including fair value gains | 377 | |
| Distributions received | (72) | |
| Foreign currency translation | 13 | |
| Reclassification to assets held for sale | (109) | |
| Other comprehensive income and Other | 240 | |
| Equity accounted investments, end of period | $ | 9,813 | |
Equity accounted investments increased by $947 million since December 31, 2020 to $9,813 million at June 30, 2021. The increase was driven by the acquisition of Brookfield Place Sydney, the deconsolidation of Bay Adelaide North as mentioned above, as well as an increase in share of net earnings.
Assets held for sale and related liabilities as of June 30, 2021 includes our interest in an office asset in the U.S. and a multifamily asset in the U.S., as we intend to sell controlling interests in this property to third parties in the next 12 months, market conditions permitting.
Debt obligations increased from $13,681 million at December 31, 2020 to $14,063 million at June 30, 2021. This increase is the result of refinancing activity of property-level debt and drawdowns on existing facilities to fund capital expenditures on development properties, partially offset by the deconsolidation of Bay Adelaide North.
The following table provides additional information on our outstanding capital securities – Core Office:
| | | | | | | | | | | | | | |
| (US$ Millions) | Shares outstanding | Cumulative dividend rate | Jun. 30, 2021 | Dec. 31, 2020 |
| Brookfield Office Properties Inc. (“BPO”) Class B Preferred Shares: | | | | |
Series 1(1) | 3,600,000 | 70% of bank prime | — | | — | |
Series 2(1) | 3,000,000 | 70% of bank prime | — | | — | |
| Capital Securities – Fund Subsidiaries | | | 870 | | 863 | |
| Total capital securities | | | $ | 870 | | $ | 863 | |
(1)BPO Class B Preferred Shares, Series 1 and 2 capital securities are owned by Brookfield Asset Management. BPO has an offsetting loan receivable against these securities earning interest at 95% of bank prime.
We had $870 million of capital securities – fund subsidiaries outstanding at June 30, 2021 as compared to $863 million at December 31, 2020. Capital securities – fund subsidiaries includes $814 million (December 31, 2020 - $807 million) of equity interests in Brookfield DTLA Holdings LLC (“DTLA”) held by co-investors in the fund, which have been classified as a liability, rather than as non-controlling interest, as holders of these interests can cause DTLA to redeem their interests in the fund for cash equivalent to the fair value of the interests on October 15, 2023, and on every fifth anniversary thereafter. In addition, capital securities – fund subsidiaries also includes $56 million at June 30, 2021 (December 31, 2020 - $56 million) which represents the equity interests held by the partnership’s co-investor in Brookfield D.C. Office Partners LLC ("D.C. Venture"), which have been classified as a liability, rather than as non-controlling interest, due to the fact that on June 18, 2023, and on every second anniversary thereafter, the holders of these interests can redeem their interests in the D.C. Venture for cash equivalent to the fair value of the interests.
Active Developments
The following table summarizes the scope and progress of active developments in our Core Office segment as of June 30, 2021:
| | | | | | | | | | | | | | | | | | | | | | | | | | |
| Total square feet under construction (in 000’s) | Proportionate
square feet under construction (in 000’s) | Expected
date of accounting stabilization | | Cost | Loan |
| (Millions, except square feet in thousands) | Percent
pre-leased | Total(1) | To-date | Total | Drawn |
| Office: | | | | | | | | |
Manhattan West Retail, Midtown New York(2) | 70 | | 39 | | Q4 2021 | 58 | % | $ | 125 | | $ | 96 | | $ | 64 | | $ | 30 | |
Wood Wharf - 20 Water Street, London(2) | 236 | | 118 | | Q1 2022 | 18 | % | £ | 57 | | £ | 50 | | £ | 47 | | £ | 24 | |
1 The Esplanade, Sydney(2) | 610 | | 153 | | Q2 2023 | 64 | % | A$ | 171 | | A$ | 62 | | A$ | — | | A$ | — | |
Bay Adelaide North, Toronto(2) | 823 | | 412 | | Q4 2023 | 89 | % | C$ | 248 | | C$ | 166 | | C$ | 175 | | C$ | 92 | |
Two Manhattan West, Midtown New York(2) | 1,948 | | 1,091 | | Q4 2023 | 23 | % | $ | 1,331 | | $ | 693 | | $ | 812 | | $ | 224 | |
| Leadenhall Court, London | 430 | | 430 | | Q1 2026 | 57 | % | £ | 564 | | £ | 154 | | £ | 426 | | £ | 39 | |
| Office Redevelopment: | | | | | | | | |
1100 Avenue of the Americas, Midtown New York(2) | 376 | | 136 | | Q2 2022 | 95 | % | $ | 113 | | $ | 82 | | $ | 62 | | $ | 34 | |
| Multifamily: | | | | | | | | |
Wood Wharf - One Park Drive, London(2)(3) | 426 | | 213 | | Q4 2021 | n/a | £ | 202 | | £ | 182 | | £ | 133 | | £ | 102 | |
Halley Rise, Phase I, Washington D.C.(4) | 359 | | 359 | | Q1 2023 | n/a | $ | 153 | | $ | 123 | | $ | 111 | | $ | 70 | |
755 Figueroa, Los Angeles(2) | 674 | | 319 | | Q1 2025 | n/a | $ | 262 | | $ | 100 | | $ | 166 | | $ | 42 | |
| | | | | | | | |
| | | | | | | | |
| Hotel: | | | | | | | | |
1 Charter Street, London(2) | 188 | | 94 | | Q2 2022 | n/a | £ | 70 | | £ | 33 | | £ | 47 | | £ | 19 | |
Wood Wharf - 15 Water Street, London(2) | 94 | | 24 | | Q2 2023 | n/a | £ | 31 | | £ | 5 | | £ | 19 | | £ | 4 | |
Pendry Manhattan West, Midtown New York(2) | 184 | | 103 | | Q3 2023 | n/a | $ | 162 | | $ | 141 | | $ | 62 | | $ | 34 | |
| Total | 6,418 | | 3,491 | | | | | | | |
(1)Net of NOI earned during stabilization.
(2)Presented on a proportionate basis at our ownership interest in each of these developments.
(3)Represents condominium/market sale developments.
(4)Includes retail square feet that is 94% leased to Wegmans Food Market and other retailers.
Our development pipeline consists of prominent, large-scale projects located primarily in the high growth markets of London and New York. For the office developments, we generally look to secure anchor leases before launching the projects. We monitor the scope and progress of our active developments and have an established track record of completion on time and within budget. We have recently completed office towers in the prime markets of New York, London and Dubai and completed two urban multifamily developments in New York. Our current office and redevelopment projects stand at an average 50% pre-leased and despite the global economic shutdown, are generally tracking on time and budget.
Reconciliation of Non-IFRS Measures – Core Office
The key components of NOI in our Core Office segment are presented below:
| | | | | | | | | | | | | | |
| Three months ended Jun. 30, | Six months ended Jun. 30, |
| (US$ Millions) | 2021 | 2020 | 2021 | 2020 |
| Commercial property revenue | $ | 474 | | $ | 452 | | $ | 959 | | $ | 936 | |
Hospitality revenue(1) | 2 | | (2) | | 3 | | 5 | |
| Direct commercial property expense | (209) | | (193) | | (423) | | (392) | |
Direct hospitality expense(1) | (2) | | (1) | | (4) | | (6) | |
| Total NOI | $ | 265 | | $ | 256 | | $ | 535 | | $ | 543 | |
(1)Hospitality revenue and direct hospitality expense within our Core Office segment primarily consists of revenue and expenses incurred at a hotel adjacent to the Allen Center in Houston.
The following table reconciles Core Office NOI to net (loss) income for the three and six months ended June 30, 2021 and 2020:
| | | | | | | | | | | | | | |
| Three months ended Jun. 30, | Six months ended Jun. 30, |
| (US$ Millions) | 2021 | 2020 | 2021 | 2020 |
| Same-property NOI | $ | 260 | | $ | 259 | | $ | 528 | | $ | 545 | |
| Currency variance | — | | (12) | | — | | (20) | |
| NOI related to acquisitions and dispositions | 5 | | 9 | | 7 | | 18 | |
| Total NOI | 265 | | 256 | | 535 | | 543 | |
| Investment and other revenue | 63 | | 44 | | 107 | | 83 | |
| Interest expense | (139) | | (140) | | (282) | | (296) | |
| Depreciation and amortization on real estate assets | (3) | | (3) | | (8) | | (6) | |
| Investment and other expense | (23) | | (9) | | (31) | | (13) | |
| General and administrative expense | (65) | | (60) | | (128) | | (125) | |
| Fair value gains (losses), net | 155 | | (169) | | 385 | | (183) | |
| Share of net earnings from equity accounted investments | 146 | | (110) | | 377 | | (32) | |
| Income before taxes | 399 | | (191) | | 955 | | (29) | |
| Income tax benefit (expense) | (25) | | 26 | | (13) | | 4 | |
| Net income (loss) | 374 | | (165) | | 942 | | (25) | |
| Net income attributable to non-controlling interests | 98 | | (7) | | 185 | | 67 | |
| Net income (loss) attributable to Unitholders | $ | 276 | | $ | (158) | | $ | 757 | | $ | (92) | |
The following table reconciles Core Office net income to FFO for the three and six months ended June 30, 2021 and 2020:
| | | | | | | | | | | | | | |
| Three months ended Jun. 30, | Six months ended Jun. 30, |
| (US$ Millions) | 2021 | 2020 | 2021 | 2020 |
| Net income (loss) | $ | 374 | | $ | (165) | | $ | 942 | | $ | (25) | |
| Add (deduct): | | | | |
| Fair value (gains) losses, net | (155) | | 169 | | (385) | | 183 | |
| Share of equity accounted fair value losses (gains), net | (60) | | 183 | | (212) | | 171 | |
| Depreciation and amortization of real estate assets | 1 | | — | | 2 | | 1 | |
| Income tax expense | 25 | | (26) | | 13 | | (4) | |
| Non-controlling interests in above items | (54) | | (46) | | (106) | | (90) | |
| FFO | $ | 131 | | $ | 115 | | $ | 254 | | $ | 236 | |
The following table reconciles Core Office share of net earnings from equity accounted investments for the three and six months ended June 30, 2021 and 2020:
| | | | | | | | | | | | | | |
| Three months ended Jun. 30, | Six months ended Jun. 30, |
| (US$ Millions) | 2021 | 2020 | 2021 | 2020 |
| Unconsolidated properties NOI | $ | 117 | | $ | 116 | | $ | 233 | | $ | 209 | |
| Unconsolidated properties fair value gains (losses), net | 60 | | (183) | | 212 | | (171) | |
| Other expenses | (31) | | (43) | | (68) | | (70) | |
| Share of net earnings from equity accounted investments | $ | 146 | | $ | (110) | | $ | 377 | | $ | (32) | |
Core Retail
Overview
Our Core Retail segment consists of 119 best-in-class retail properties containing over 117 million square feet in the United States. These assets have a stable revenue profile due to long-term leases in place. The key drivers of growth in the business include the mark-to market of rents upon lease expiry, escalation provisions in leases and operating expense monitoring that are expected to generate same property NOI growth. Furthermore, we expect to earn higher unlevered, pre-tax returns on construction costs from our redevelopment pipeline, which will also drive NOI growth. However, this business has been significantly impacted by the economic shutdown. NOI growth has been partially offset by the impact of tenant bankruptcies in the last 18 months, and while significant progress has been made on re-letting the majority of that space, we are now facing potential new tenant-viability challenges as a result of the shutdown. It is possible that more bankruptcies result from the shutdown which could lead to further down-time in the near and mid-term and rate growth may continue to be a challenge in the near-term.
Summary of Operating Results
The following table presents FFO and net (loss) income attributable to Unitholders in our Core Retail segment for the three and six months ended June 30, 2021 and 2020:
| | | | | | | | | | | | | | |
| Three months ended Jun. 30, | Six months ended Jun. 30, |
| (US$ Millions) | 2021 | 2020 | 2021 | 2020 |
| FFO | $ | 103 | | $ | 147 | | $ | 198 | | $ | 335 | |
| Net income (loss) attributable to Unitholders | 126 | | (920) | | (154) | | (1,218) | |
FFO earned in our Core Retail segment for the three months ended June 30, 2021 was $103 million compared to $147 million for the same period in the prior year. FFO decreased due to the impact of tenant vacancies and rent abatements resulting from the shutdown.
For the six months ended June 30, 2021, FFO earned in our Core Retail segment was $198 million compared to $335 million for the same period in the prior year. FFO decreased due to the impacts of the shutdown. Additionally, the prior year benefited from gains on the sale of our interest in two operating companies.
Net income attributable to Unitholders was $126 million for the three months ended June 30, 2021 as compared to a loss of $920 million during the same period in the prior year. The increase in net income attributable to Unitholders is primarily attributable to fair value losses recorded in the prior year, as we adjusted our cash flow assumptions on a suite-by-suite basis to reflect the impact of the shutdown on our near and mid-term cash flows. The reduction in fair value losses more than offset the decline in FFO in the current period.
Net loss attributable to Unitholders was $154 million for the six months ended June 30, 2021 compared to a loss of $1,218 million during the same period in the prior year. The reduction in net loss over the prior year is due to the reasons discussed above.
Leasing Activity
The following table presents key operating metrics in our Core Retail portfolio as at and for the three months ended June 30, 2021 and 2020:
| | | | | | | | | | | | | | |
| Consolidated | Unconsolidated |
| (US$ Millions, except where noted) | Jun. 30, 2021 | Jun. 30, 2020 | Jun. 30, 2021 | Jun. 30, 2020 |
| Total portfolio: | | | | |
| NOI | $ | 232 | | $ | 254 | | $ | 163 | | $ | 186 | |
| | | | |
| Number of malls and urban retail properties | 62 | | 63 | | 57 | | 59 | |
| Leasable square feet (in thousands) | 54,153 | | 55,519 | | 63,442 | | 64,496 | |
| Same-property: | | | | |
| Number of malls and urban retail properties | 56 | | 56 | | 56 | | 56 | |
| Leasable square feet- mall and freestanding (in thousands) | 22,794 | | 22,794 | | 29,452 | | 29,525 | |
Leased %(1) | 90.3 | % | 93.8 | % | 93.3 | % | 95.6 | % |
Occupancy %(1) | 89.5 | % | 93.0 | % | 92.3 | % | 95.0 | % |
Permanent Occupancy %(1) | 83.7 | % | 88.4 | % | 87.5 | % | 91.8 | % |
| | | | |
(1)Presented on a same-property basis.
NOI from our consolidated properties decreased to $232 million during the three months ended June 30, 2021 from $254 million in the same quarter in 2020 primarily due to the negative impact of the global economic shutdown, partially offset by an increase in lease termination income.
NOI from our unconsolidated properties decreased to $163 million during the three months ended June 30, 2021 from $186 million in the same quarter in 2020 primarily due to the impact of the shutdown as discussed above.
The results of our operations are primarily driven by changes in occupancy and in-place rental rates. The following table presents new and renewal leases for the trailing 12 months compared to expiring leases for the prior tenant in the same suite, for leases where the downtime between new and previous tenant is less than 24 months, among other metrics.
| | | | | | | | |
| Total Portfolio |
| (US$, except where noted) | Jun. 30, 2021 | Jun. 30, 2020 |
| Number of leases | 552 | | 1,032 | |
| Leasing activity (square feet in thousands) | 1,923 | | 3,701 | |
| Average term in years | 6.8 | | 6.9 | |
Initial rent per square foot(1) | $ | 49.19 | | $ | 52.48 | |
Expiring rent per square foot(2) | 47.52 | | 49.26 | |
| Initial rent spread per square foot | 1.67 | | 3.22 | |
| % change | 3.5 | % | 6.5 | % |
| Tenant allowances and leasing costs (US$ in millions) | $ | 47 | | $ | 49 | |
(1)Represents initial rent over the term consisting of base minimum rent and common area costs.
(2)Represents expiring rent at end of lease consisting of base minimum rent and common area costs.
Through June 30, 2021, we leased approximately 1.9 million square feet at initial rents approximately 3.5% higher than expiring net rents on a suite-to-suite basis.
Our Core Retail portfolio same-property occupancy rate at June 30, 2021 was 89.5% and 92.3%, for consolidated and unconsolidated properties, respectively, a decrease from the same period in the prior year due to tenant vacancies.
Valuation Metrics
The key valuation metrics of the properties in our Core Retail segment on a weighted-average basis are presented in the following table. The valuations are most sensitive to changes in the discount rate, terminal capitalization rate, and timing or variability of cash flows.
| | | | | | | | | | | | | | | | | | | | |
| Jun. 30, 2021 | Dec. 31, 2020 |
| Discount rate | Terminal capitalization rate | Investment horizon | Discount rate | Terminal capitalization rate | Investment horizon |
| Consolidated properties | | | | | | |
| United States | 7.0 | % | 5.3 | % | 10 | 7.0 | % | 5.3 | % | 10 |
| Unconsolidated properties | | | | | | |
| United States | 6.4 | % | 4.9 | % | 10 | 6.3 % | 4.9 | % | 10 |
Financial Position
The following table presents an overview of the financial position of our Core Retail segment as at June 30, 2021 and December 31, 2020:
| | | | | | | | |
| (US$ Millions) | Jun. 30, 2021 | Dec. 31, 2020 |
| Investment properties | | |
| Commercial properties | $ | 20,037 | | $ | 20,324 | |
| | |
| Equity accounted investments | 9,728 | | 9,685 | |
| Accounts receivable and other | 792 | | 899 | |
| Cash and cash equivalents | 417 | | 205 | |
| Assets held for sale | 54 | | 353 | |
| Total assets | 31,028 | | 31,466 | |
| Debt obligations | 15,939 | | 16,290 | |
| Accounts payable and other liabilities | 796 | | 853 | |
| Deferred tax liability | 33 | | 23 | |
| Liabilities associated with assets held for sale | — | | 263 | |
| Non-controlling interest | 1,522 | | 1,537 | |
| Equity attributable to Unitholders | $ | 12,738 | | $ | 12,500 | |
Equity attributable to Unitholders in the Core Retail segment increased by $238 million at June 30, 2021 from December 31, 2020 primarily due to the net income recognized during the period.
The following table presents a roll-forward of our partnership’s equity accounted investments for the year ended June 30, 2021:
| | | | | |
| (US$ Millions) | Jun. 30, 2021 |
| Equity accounted investments, beginning of year | $ | 9,685 | |
| Additions | 23 | |
| Disposals and return of capital | (1) | |
| Share of net earnings from equity accounted investments | 167 | |
| Distributions | (157) | |
| Other | 11 | |
| Equity accounted investments, end of period | $ | 9,728 | |
Equity accounted investments increased by $43 million to $9,728 million, primarily due to share of net earnings from equity accounted investments, partially offset by distributions in the current period.
Reconciliation of Non-IFRS Measures – Core Retail
The key components of NOI in our Core Retail segment are presented below:
| | | | | | | | | | | | | | |
| Three months ended Jun. 30, | Six months ended Jun. 30, |
| (US$ Millions) | 2021 | 2020 | 2021 | 2020 |
| Commercial property revenue | $ | 338 | | $ | 346 | | $ | 670 | | $ | 717 | |
| Direct commercial property expense | (106) | | (92) | | (213) | | (198) | |
| Total NOI | $ | 232 | | $ | 254 | | $ | 457 | | $ | 519 | |
The following table reconciles Core Retail NOI to net (loss) income attributable to Unitholders for the three and six months ended June 30, 2021 and 2020:
| | | | | | | | | | | | | | |
| Three months ended Jun. 30, | Six months ended Jun. 30, |
| (US$ Millions) | 2021 | 2020 | 2021 | 2020 |
| Total NOI | $ | 232 | | $ | 254 | | $ | 457 | | $ | 519 | |
| Investment and other revenue | 34 | | 24 | | 66 | | 97 | |
| Interest expense | (165) | | (144) | | (328) | | (318) | |
| Depreciation and amortization on real estate assets | (6) | | (5) | | (12) | | (12) | |
| | | | |
| General and administrative expense | (48) | | (62) | | (101) | | (128) | |
| Fair value (losses), net | (36) | | (541) | | (396) | | (836) | |
| Share of net earnings (losses)from equity accounted investments | 148 | | (551) | | 167 | | (692) | |
| (Loss) income before taxes | 159 | | (1,025) | | (147) | | (1,370) | |
| Income tax benefit | (12) | | 5 | | (11) | | 19 | |
| Net income (loss) | $ | 147 | | $ | (1,020) | | $ | (158) | | $ | (1,351) | |
| Net income (loss) attributable to non-controlling interests | 21 | | (100) | | (4) | | (133) | |
| Net income (loss) attributable to Unitholders | $ | 126 | | $ | (920) | | $ | (154) | | $ | (1,218) | |
The following table reconciles Core Retail net (loss) income to FFO for the three and six months ended June 30, 2021 and 2020:
| | | | | | | | | | | | | | |
| Three months ended Jun. 30, | Six months ended Jun. 30, |
| (US$ Millions) | 2021 | 2020 | 2021 | 2020 |
| Net income (loss) | $ | 147 | | $ | (1,020) | | $ | (158) | | $ | (1,351) | |
| Add (deduct): | | | | |
| Share of equity accounted fair value losses (gains), net | (76) | | 647 | | (19) | | 906 | |
| Fair value losses, net | 36 | | 541 | | 396 | | 836 | |
| Income tax (benefit) | 12 | | (5) | | 11 | | (19) | |
| Non-controlling interests in above items | (16) | | (16) | | (32) | | (37) | |
| FFO | $ | 103 | | $ | 147 | | $ | 198 | | $ | 335 | |
The following table reconciles Core Retail share of net earnings from equity accounted investments for the three and six months ended June 30, 2021 and 2020:
| | | | | | | | | | | | | | |
| Three months ended Jun. 30, | Six months ended Jun. 30, |
| (US$ Millions) | 2021 | 2020 | 2021 | 2020 |
| Unconsolidated properties NOI | $ | 390 | | $ | 186 | | $ | 324 | | $ | 391 | |
| Unconsolidated properties fair value gains (losses), net and income tax expense | 76 | | (647) | | 19 | | (906) | |
| Other expenses | (318) | | (90) | | (176) | | (177) | |
| Share of net earnings and (losses) from equity accounted investments | $ | 148 | | $ | (551) | | $ | 167 | | $ | (692) | |
LP Investments
Overview
Our LP Investments portfolio includes our equity invested in Brookfield-sponsored real estate opportunity funds, which target high-quality assets with operational upside across various real estate sectors, including office, retail, multifamily, logistics, hospitality, triple net lease, student housing and manufactured housing. We target to earn opportunistic returns on our LP Investments portfolio. We caution you that in light of the global economic shutdown, we may be unable to achieve these returns in the near term.
The partnership has interests in the following Brookfield-sponsored real estate opportunity funds:
•BSREP I - 31% interest in BSREP I, which is an opportunistic real estate fund with $4.4 billion in committed capital in aggregate, targeting gross returns of 20%. The fund is in its 10th year, is fully invested and is executing realizations.
•BSREP II - 26% interest in BSREP II, which is an opportunistic real estate fund with $9.0 billion in committed capital in aggregate, targeting gross returns of 20%. The fund is in its 7th year and is fully invested.
•BSREP III - 7% interest in BSREP III, which is an opportunistic real estate fund with $15.0 billion in committed capital in aggregate, targeting gross returns of 20%; the fund is in its 4th year.
•A blended 36% interest in two value-add multifamily funds totaling $1.8 billion targeting gross returns of 16%. These funds seek to invest in a geographically diverse portfolio of U.S. multifamily properties through acquisition and development.
•A blended 13% interest in a series of real estate debt funds totaling $5.4 billion which seek to invest in commercial real estate debt secured by properties in strategic locations.
While our economic interest in these funds are less than 50% in each case, we consolidate several of the portfolios, specifically BSREP I and BSREP II, held through the LP Investments as Brookfield Asset Management’s oversight as general partner together with our exposure to variable returns of the investments through our LP interests provide us with control over the investments. We do not consolidate our interest in BSREP III as our 7% non-voting interest does not provide us with control over the investment and therefore is accounted for as a financial asset.
Summary of Operating Results
Our LP investments, unlike our Core portfolios, have a defined hold period and typically generate the majority of profits from realization events including the sale of an asset or portfolio of assets, or the exit of the entire investment. The combination of gains from realization events and FFO earned during the hold period represent our earnings on capital invested in these funds and, once distributed by the Brookfield-sponsored real estate opportunity funds, provide liquidity to support our target distributions.
The following table presents distributions received on our LP Investments in Brookfield-sponsored real estate opportunity funds received on sale or refinancing events within the funds for the three and six months ended June 30, 2021 and 2020:
| | | | | | | | | | | | | | |
| Three months ended Jun. 30, | Six months ended Jun. 30, |
| (US$ Millions) | 2021 | 2020 | 2021 | 2020 |
| Return of invested capital | $ | 82 | | $ | 7 | | $ | 288 | | $ | 21 | |
| Distribution of earnings and gains on invested capital | 271 | | 24 | | 396 | | 73 | |
| Total LP Investments distributions | $ | 353 | | $ | 31 | | $ | 684 | | $ | 94 | |
| Less: Incentive fees | $ | — | | $ | (2) | | $ | (8) | | $ | (9) | |
| Total LP Investments distributions, net | $ | 353 | | $ | 29 | | $ | 676 | | $ | 85 | |
During the six months ended June 30, 2021, return of invested capital and distribution of earnings and gains on invested capital primarily related to the full disposition of our self-storage portfolio and partial disposition of a portfolio of triple-net lease assets from the
prior year, and distributions of income from our manufactured housing portfolio. Total LP Investments distributions for the six months ended June 30, 2021 were net of incentive fees primarily from the dispositions mentioned above. Distribution of earnings and gains on invested capital in the prior period are primarily due to the disposition of multifamily assets in our second value-add multifamily fund, an office asset in BSREP II and distributions of income from our hotel and multifamily assets and our investment in a Brookfield-sponsored debt fund.
The following table presents FFO and net loss attributable to Unitholders in our LP Investments segment for the three and six months ended June 30, 2021 and 2020:
| | | | | | | | | | | | | | |
| Three months ended Jun. 30, | Six months ended Jun. 30, |
| (US$ Millions) | 2021 | 2020 | 2021 | 2020 |
| | | | |
| FFO | 40 | | (11) | | 34 | | 38 | |
| Net income (loss) attributable to Unitholders | 105 | | (105) | | 241 | | (129) | |
FFO increased by $51 million for the three months ended June 30, 2021 primarily due to increased earnings in our hospitality portfolio, as certain of our assets were able to open or operate at increased capacity as mandated closures and occupancy restrictions lifted. In addition, we benefited from the impact of foreign exchange. These increases were partially offset by defeasance costs incurred upon refinancing our manufactured housing portfolio as well as the impact of property dispositions since the prior year.
FFO decreased by $4 million for the six months ended June 30, 2021 primarily due to reduced NOI from our hospitality properties in the first quarter of 2021 as a result of the shutdown. The decrease was offset by the reasons mentioned above.
Net income attributable to Unitholders increased for the three months ended June 30, 2021 by $210 million, driven by the increase in FFO discussed above, as well as fair value gains in our manufactured housing portfolio, a multifamily portfolio, an office asset in the U.K. and our student housing portfolio, primarily due to capitalization rate compression. Fair value gains in our student housing portfolio were also driven by increased cash flows.
Net income attributable to Unitholders increased for the six months ended June 30, 2021 by $370 million for the reasons mentioned above, partially offset by lower hospitality earnings in our hospitality portfolio in the first quarter of 2021.
Financial Position
The following table presents an overview of the financial position of our LP Investments segment as at June 30, 2021 and December 31, 2020:
| | | | | | | | |
| (US$ Millions) | Jun. 30, 2021 | Dec. 31, 2020 |
| Investment properties | $ | 26,864 | | $ | 26,353 | |
| Property, plant and equipment | 6,682 | | 5,010 | |
| Equity accounted investments | 901 | | 1,168 | |
| Accounts receivable and other | 5,310 | | 5,250 | |
| Cash and cash equivalents | 1,223 | | 1,789 | |
| Assets held for sale | 802 | | 39 | |
| Total assets | $ | 41,782 | | $ | 39,609 | |
| Debt obligations | 23,354 | | 21,134 | |
| Capital securities | 182 | | 431 | |
| Accounts payable and other liabilities | 3,755 | | 3,458 | |
| Liabilities associated with assets held for sale | 4 | | 53 | |
| Non-controlling interests of others in operating subsidiaries and properties | 9,308 | | 9,271 | |
| Equity attributable to Unitholders | $ | 5,179 | | $ | 5,262 | |
The increase in investment properties is primarily the result fair value gains as discussed above, as well as property acquisitions and incremental capital spend in the period. These increases were partially offset by dispositions in the current period and the negative impact of foreign currency translation.
The increase in property, plant and equipment is due to the consolidation of a hospitality portfolio, as we gained control over the investment after our preferred equity interest was converted to common shares.
The following table presents a roll-forward of changes in our property, plant and equipment within our LP Investments segment:
| | | | | | | | |
| (US$ Millions) | Jun. 30, 2021 | Dec. 31, 2020 |
| Cost: | | |
| Balance at the beginning of period | $ | 5,305 | | $ | 6,992 | |
| | |
| Additions | 1,777 | | 140 | |
| Disposals | (28) | | (68) | |
| Foreign currency translation | 15 | | 142 | |
Impact of deconsolidation due to loss of control and other(1) | (12) | | (1,901) | |
| 7,057 | | 5,305 | |
| Accumulated fair value changes: | | |
| Balance at the beginning of period | 475 | | 1,324 | |
Revaluation (losses) gains, net(2) | — | | (124) | |
Impact of deconsolidation due to loss of control and other(1) | (1) | | (729) | |
| Disposals | — | | 13 | |
Provision for impairment(2) | — | | (15) | |
| Foreign currency translation | 4 | | 6 | |
| 478 | | 475 | |
| Accumulated depreciation: | | |
| Balance at the beginning of period | (770) | | (1,288) | |
| Depreciation | (108) | | (270) | |
| Disposals | 27 | | 27 | |
| Foreign currency translation | (4) | | (25) | |
Impact of deconsolidation due to loss of control and other(1) | 2 | | 786 | |
| (853) | | (770) | |
| Total property, plant and equipment | $ | 6,682 | | $ | 5,010 | |
(1)The prior year includes the impact of deconsolidation of the Atlantis.
(2)The prior year impairment losses were recorded in revaluation losses, net in other comprehensive income and fair value (losses) gains, net in the income statement, which was a result of the impairment tests performed on each of the partnership’s hospitality investments from the impact of the shutdown as discussed above.
Equity accounted investments decreased during the six months ended June 30, 2021 primarily due to the change in accounting treatment of an investment in a Brookfield-sponsored debt fund from the equity method and is now accounted for as a financial asset.
Assets held for sale and related liabilities as of June 30, 2021 includes five triple-net lease assets in the U.S., a hotel in the U.S, eight multifamily assets in the U.S. and five retail assets in the U.S., as we intend to sell controlling interests in these properties to third parties in the next 12 months, market conditions permitting.
Debt obligations increased primarily due to the consolidation of a hospitality portfolio and upfinancing our manufactured housing portfolio, partially offset by dispositions and the impact of foreign currency translation.
Reconciliation of Non-IFRS Measures - LP Investments
The following table reconciles LP Investments NOI to net income (loss) for the three and six months ended June 30, 2021 and 2020: | | | | | | | | | | | | | | |
| Three months ended Jun. 30, | Six months ended Jun. 30, |
| (US$ Millions) | 2021 | 2020 | 2021 | 2020 |
| Commercial property revenue | $ | 472 | | $ | 503 | | $ | 940 | | $ | 1,052 | |
| Hospitality revenue | 194 | | 52 | | 252 | | 411 | |
| Direct commercial property expense | (159) | | (160) | | (324) | | (335) | |
| Direct hospitality expense | (118) | | (105) | | (189) | | (390) | |
| Total NOI | 389 | | 290 | | 679 | | 738 | |
| Investment and other revenue | 81 | | 16 | | 110 | | 32 | |
| Interest expense | (334) | | (259) | | (570) | | (578) | |
| General and administrative expense | (70) | | (46) | | (111) | | (85) | |
| Investment and other expense | — | | — | | — | | — | |
| Depreciation and amortization | (59) | | (75) | | (116) | | (152) | |
| Fair value gains, net | 435 | | (82) | | 1,129 | | 66 | |
| Share of net (losses) earnings from equity accounted investments | (41) | | (96) | | (85) | | (69) | |
| Income before taxes | 401 | | (252) | | 1,036 | | (48) | |
| Income tax expense | (48) | | (5) | | (144) | | (161) | |
| Net income (loss) | 353 | | (257) | | 892 | | (209) | |
| Net income attributable to non-controlling interests | 248 | | (152) | | 651 | | (80) | |
| Net income (loss) attributable to Unitholders | $ | 105 | | $ | (105) | | $ | 241 | | $ | (129) | |
The following table reconciles LP Investments net income to FFO for the three and six months ended June 30, 2021 and 2020:
| | | | | | | | | | | | | | |
| Three months ended Jun. 30, | Six months ended Jun. 30, |
| (US$ Millions) | 2021 | 2020 | 2021 | 2020 |
| Net income (loss) | $ | 353 | | $ | (257) | | $ | 892 | | $ | (209) | |
| Add (deduct): | | | | |
| Fair value (gains) losses, net | (435) | | 82 | | (1,129) | | (66) | |
| Share of equity accounted fair value losses, net | 31 | | 78 | | 50 | | 81 | |
| Depreciation and amortization of real estate assets | 45 | | 66 | | 89 | | 134 | |
| Income tax expense | 48 | | 5 | | 144 | | 161 | |
| Non-controlling interests in above items | (2) | | 15 | | (12) | | (63) | |
| FFO | $ | 40 | | $ | (11) | | $ | 34 | | $ | 38 | |
Corporate
Certain amounts are allocated to our corporate segment as those activities should not be used to evaluate our other segments’ operating performance.
Summary of Operating Results
The following table presents FFO and net loss attributable to Unitholders in our corporate segment for the three and six months ended June 30, 2021 and 2020:
| | | | | | | | | | | | | | |
| Three months ended Jun. 30, | Six months ended Jun. 30, |
| (US$ Millions) | 2021 | 2020 | 2021 | 2020 |
| FFO | $ | (130) | | $ | (81) | | $ | (255) | | $ | (165) | |
| Net loss attributable to Unitholders | (188) | | (70) | | (259) | | (300) | |
FFO was a loss of $130 million (2020 - loss of $81 million) and $255 million (2020 - loss of $165 million) for the three and six months ended June 30, 2021, respectively. Corporate FFO generally includes interest expense and general and administrative expense.
Interest expense for the three months ended June 30, 2021 totaled $72 million (2020 - $56 million), which reflects $37 million (2020 - $36 million) of interest expense on capital securities and $35 million (2020 - $20 million) of interest expense on our credit facilities and corporate bonds. For the six months ended June 30, 2021, interest expense totaled $142 million (2020 - $116 million), which reflects $74 million (2020 - $73 million) of interest expense on capital securities and $68 million (2020 - $43 million) of interest expense on our credit facilities and corporate bonds.
Another component of FFO is general and administrative expense, which, for the three months ended June 30, 2021 was $60 million (2020 - $27 million) and consists of $31 million (2020 - $14 million) of asset management fees, equity enhancement fees of $15 million (2020 - nil) and $14 million (2020 - $13 million) of other corporate costs. For the six months ended June 30, 2021 general and
administrative expense was $116 million (2020 - $53 million) and consists of $61 million (2020 - $28 million) of asset management fees, equity enhancement fees of $27 million (2020 - nil) and $28 million (2020 - $25 million) of other corporate costs.
For the three and six months ended June 30, 2021, we also recorded an income tax expense of $2 million and income tax expense $24 million (2020 - income tax benefit of $22 million and income tax benefit of $25 million), respectively, allocated to the corporate segment related to an increase in book income of our holding companies and their subsidiaries. The benefit in the prior year related to a decrease of deferred tax liabilities of our holding companies and their subsidiaries.
Financial Position
The following table presents equity attributable to Unitholders at the corporate level:
| | | | | | | | |
| (US$ Millions) | Jun. 30, 2021 | Dec. 31, 2020 |
| Accounts receivable and other | $ | 317 | | $ | 308 | |
| | |
| Cash and cash equivalents | 30 | | 21 | |
| Total assets | 347 | | 329 | |
| Debt obligations | 1,925 | | 3,232 | |
| Capital securities | 1,754 | | 1,739 | |
| Deferred tax liabilities | 70 | | 37 | |
| Accounts payable and other liabilities | 3,345 | | 1,476 | |
| Preferred equity | 699 | | 699 | |
| Non-controlling interests | 13 | | 17 | |
| Equity attributable to Unitholders | $ | (7,459) | | $ | (6,871) | |
The corporate balance sheet includes corporate debt and capital securities from our partnership. The decrease in equity attributable to Unitholders is primarily due to the current period net loss and distributions to Unitholders.
During the first quarter of 2020, we issued $279 million of our Class A Cumulative Redeemable Perpetual Preferred Units, Series 3 at a coupon rate of 5.75% per annum, payable quarterly in arrears. We also issued C$400 million of medium term notes at a fixed interest rate of 3.93% to fund sustainable building initiatives and C$100 million of medium term notes at a fixed interest rate of 4.35% for general corporate purposes.
In the third quarter of 2020, we issued C$500 million of medium term notes at a fixed interest rate of 3.93%. Proceeds are being used to fund recently completed and future green initiatives.
In addition, as at June 30, 2021, we had $15 million (December 31, 2020 - $15 million) of preferred shares with a cumulative dividend rate of 5% outstanding. The preferred shares were issued by various holding entities of our partnership.
The following table provides additional information on our outstanding capital securities – corporate:
| | | | | | | | | | | | | | | | | |
| (US$ Millions) | | Shares Outstanding | Cumulative Dividend Rate | Jun. 30, 2021 | Dec. 31, 2020 |
| Operating Partnership Class A Preferred Equity Units: | | | | |
| Series 1 | | 24,000,000 | | 6.25 | % | $ | 593 | | $ | 586 | |
| Series 2 | | 24,000,000 | | 6.50 | % | 559 | | 555 | |
| Series 3 | | 24,000,000 | | 6.75 | % | 542 | | 538 | |
| Brookfield Property Split Corp. Senior Preferred Shares: | | | | |
| Class A Series 1 | | 842,534 | | 5.25 | % | 21 | | 21 | |
| Class A Series 2 | | 556,746 | | 5.75 | % | 11 | | 11 | |
| Class A Series 3 | | 789,092 | | 5.00 | % | 16 | | 16 | |
| Class A Series 4 | | 594,994 | | 5.20 | % | 12 | | 12 | |
| Total capital securities - corporate | | | $ | 1,754 | | $ | 1,739 | |
Reconciliation of Non-IFRS Measures – Corporate
The following table reconciles Corporate net loss to net loss attributable to Unitholders for the three and six months ended June 30, 2021 and 2020:
| | | | | | | | | | | | | | |
| Three months ended Jun. 30, | Six months ended Jun. 30, |
| (US$ Millions) | 2021 | 2020 | 2021 | 2020 |
| Net loss | $ | (188) | | $ | (70) | | $ | (259) | | $ | (300) | |
| Net loss attributable to non-controlling interests | — | | — | | — | | — | |
| Net loss attributable to Unitholders | $ | (188) | | $ | (70) | | $ | (259) | | $ | (300) | |
The following table reconciles Corporate net loss to FFO for the three and six months ended June 30, 2021 and 2020:
| | | | | | | | | | | | | | |
| Three months ended Jun. 30, | Six months ended Jun. 30, |
| (US$ Millions) | 2021 | 2020 | 2021 | 2020 |
| Net loss | $ | (188) | | $ | (70) | | $ | (259) | | $ | (300) | |
| Add (deduct): | | | | |
| Fair value (gains) losses, net | 56 | | 11 | | (20) | | 160 | |
| Income tax expense | 2 | | (22) | | 24 | | (25) | |
| Non-controlling interests in above items | — | | — | | — | | — | |
| FFO | $ | (130) | | $ | (81) | | $ | (255) | | $ | (165) | |
LIQUIDITY AND CAPITAL RESOURCES
The capital of our business consists of debt obligations, capital securities, preferred stock and equity. Our objective when managing this capital is to maintain an appropriate balance between holding a sufficient amount of equity capital to support our operations and reducing our weighted average cost of capital to improve our return on equity. As at June 30, 2021, capital totaled $100 billion (December 31, 2020 - $99 billion).
We attempt to maintain a level of liquidity to ensure we are able to participate in investment opportunities as they arise and to better withstand sudden adverse changes in economic circumstances. Our primary sources of liquidity include cash, undrawn committed credit facilities, construction facilities, cash flow from operating activities and access to public and private capital markets. In addition, we structure our affairs to facilitate monetization of longer-duration assets through financings and co-investor participations.
We seek to increase income from our existing properties by maintaining quality standards for our properties that promote high occupancy rates and support increases in rental rates while reducing tenant turnover and related costs, and by controlling operating expenses. Consequently, we believe our revenue, along with proceeds from financing activities and divestitures, will continue to provide the necessary funds to cover our short-term liquidity needs. However, material changes in the factors described above may adversely affect our net cash flows. We anticipate certain planned divestitures may be delayed as a result of the global economic shutdown but do not anticipate execution risk that would have a material impact to our cashflows. Delays might be caused due to reduced business travel which could have an impact on physical touring of targeted assets for disposal.
The future impact of the shutdown on our level of liquidity remains uncertain at this time. Measures undertaken by governments and companies around the world in our principal markets have resulted in the temporary closure of certain of our operating assets. The duration of such measures may impact our ability to collect rental income, particularly in our retail assets, and to generate hospitality revenue. The longer-term impact of the pandemic and resulting economic downturn could reduce demand for real estate and hospitality bookings, though we have begun to see some very modest recovery in certain of our hospitality assets.
Consequently, we are reviewing, and where appropriate adjusting, our current capital expenditure and financing assumptions on existing and future projects to reflect any potential shorter- and longer-term impact of the pandemic. Adjustments may include, but are not limited to, additional draws on existing development facilities, pursuing additional development facilities on certain projects, extension of payment terms to suppliers, and temporary cessation of additional construction work (and related incurrence of expenditures).
We continue to review contractual arrangements with our tenants to assess the rights and responsibilities of the partnership and our tenants in response to the impact of the measures undertaken by governments and/or tenants. Potential responses may include, but are not limited to, payment holidays / extension of payment terms from tenants, adjustments to the duration of leases, and renegotiation of lease terms.
We expect to be able to refinance the majority of debt obligations maturing in the near term or to exercise contractual extension options thereon. In certain instances, particularly where a property has been required to close temporarily, we plan to seek certain modifications to mortgages, including lease restructuring approvals and technical default waivers, and potentially interest deferrals on many loans until the property has reopened. Certain development assets with construction facilities in place will require development waivers subject to a protracted work stoppage.
In addition, certain debt obligations are subject to financial covenants. We are continuously reviewing the financial covenants of each debt instrument and, where applicable, working with our lenders to address debt instruments which may potentially approach or breach covenant limits. Such adjustments may include, but are not limited to, adjustment to the covenant limits, interest payment holidays, and temporary suspension of covenant testing.
In order to maintain financial flexibility, we maintain capacity under credit facilities at BPY and certain subsidiaries. As at June 30, 2021, the available liquidity under such credit facilities was $467 million. We believe we will be able to continue to borrow funds on these facilities from our lenders when and as required.
Our principal liquidity needs for the current year and for periods beyond include:
•Recurring expenses;
•Debt service requirements;
•Distributions to Preferred Unitholders;
•Capital expenditures deemed mandatory, including tenant improvements;
•Development costs not covered under construction loans;
•Unfunded committed capital to funds;
•Investing activities which could include:
◦Discretionary capital expenditures;
◦Property acquisitions;
◦Future developments; and
◦Repurchase of our units.
We plan to meet these liquidity needs by accessing our group-wide liquidity of $5,176 million at June 30, 2021 as highlighted in the table below. In addition, we have the ability to supplement this liquidity through cash generated from operating activities, asset sales, co-investor interests and financing opportunities.
| | | | | | | | |
| (US$ Millions) | Jun. 30, 2021 | Dec. 31, 2020 |
| Proportionate cash retained at subsidiaries | $ | 2,117 | | $ | 1,733 | |
| Proportionate availability under subsidiary credit facilities | 1,484 | | 2,410 | |
| Proportionate availability under construction facilities | 1,575 | | 1,399 | |
Group-wide liquidity(1) | $ | 5,176 | | $ | 5,542 | |
(1)This includes liquidity of investments which are not controlled and can only be obtained through distributions which the partnership does not control.
We finance our assets principally at the operating company level with asset-specific debt that generally has long maturities, few restrictive covenants and with recourse only to the asset. We endeavor to maintain prudent levels of debt and strive to ladder our principal repayments over a number of years.
The following table summarizes our secured debt obligations on investment properties by contractual maturity over the next five years and thereafter:
| | | | | |
| (US$ Millions) | Jun. 30, 2021 |
| 2021 | $ | 5,439 | |
| 2022 | 8,174 | |
| 2023 | 6,423 | |
| 2024 | 9,172 | |
| 2025 | 3,280 | |
| 2026 and thereafter | 8,560 | |
| Deferred financing costs | (247) | |
| Secured debt obligations | $ | 40,801 | |
| Debt to capital ratio | 55.0 | % |
We generally believe that we will be able to either extend the maturity date, repay, or refinance the debt that is scheduled to mature in 2021-2022, however, approximately 2.4% of our debt obligations represent non-recourse mortgages where we have suspended contractual payments. We are currently engaging in modification or restructuring discussions with the respective creditors. These negotiations may, under certain circumstances, result in certain properties securing these loans being transferred to the lenders.
Currently, our debt to capital ratio is 55.0%. We expect to be able to decrease our debt to capital ratios from these levels through the repayment of capital securities, credit facilities and debt related to the acquisition of a further interest in our retail assets with cash flow generated in the business and raised from asset sales. In addition, we expect to improve other credit metrics through the benefit of additional earnings from the completion and stabilization of our active development pipeline. The timing of achieving these expectations may be delayed due to the impact of the global economic shutdown.
Our partnership’s operating subsidiaries are subject to limited financial covenants in respect of their corporate debt and are in compliance with all material covenants at June 30, 2021. The partnership’s operating subsidiaries are also in compliance with all covenants and other capital requirements related to regulatory or contractual obligations of material consequence to our partnership.
For the three and six month periods ended June 30, 2021 and 2020, the partnership made distributions to Unitholders of nil and $312 million (2020 - $313 million and $624 million), respectively. This compares to cash flow from operating activities of $2,325 million and $838 million for the six months ended June 30, 2021 and 2020. Pursuant to the terms of the agreement governing the privatization with Brookfield Asset Management, Unitholders did not receive a quarterly distribution for the quarter ended June 30, 2021.
RISKS AND UNCERTAINTIES
The financial results of our business are impacted by the performance of our properties and various external factors influencing the specific sectors and geographic locations in which we operate, including: macro-economic factors such as economic growth, changes in currency, inflation and interest rates; regulatory requirements and initiatives; and litigation and claims that arise in the normal course of business. As vaccination campaigns against COVID-19 ramp up, the macroeconomic outlook has improved in certain geographies with the return of more favorable economic conditions, including the removal of occupancy restrictions and government-mandated closures. However, uncertainty remains in the near-term surrounding risks of new economic restrictions and general uncertainty surrounding supply chains, disrupted travel, impacted social conditions and the labor markets.
Our property investments are generally subject to varying degrees of risk depending on the nature of the property. These risks include changes in general economic conditions (including the availability and costs of mortgage funds), local conditions (including an oversupply of space or a reduction in demand for real estate in the markets in which we operate), the attractiveness of the properties to tenants, competition from other landlords with competitive space and our ability to provide adequate maintenance at an economical cost.
Certain significant expenditures, including property taxes, maintenance costs, mortgage payments, insurance costs and related charges, must be made regardless of whether a property is producing sufficient income to service these expenses. Certain properties are subject to mortgages which require substantial debt service payments. If we become unable or unwilling to meet mortgage payments on any property, losses could be sustained as a result of the mortgagee’s exercise of its rights of foreclosure or sale. We believe the stability and long-term nature of our contractual revenues effectively mitigates these risks.
We are affected by local, regional, national and international economic conditions and other events and occurrences that affect the markets in which we own assets. As noted above, economic conditions have been impacted substantially by the global economic shutdown. A protracted decline in economic conditions would cause downward pressure on our operating margins and asset values as a result of lower demand for space.
The majority of our properties are located in North America, Europe and Australia, with a growing presence in South America and Asia. A prolonged downturn in the economies of these regions would result in reduced demand for space and number of prospective tenants and will affect the ability of our properties to generate significant revenue. If there is an increase in operating costs resulting from inflation and other factors, we may not be able to offset such increases by increasing rents.
We are subject to risks that affect the retail environment, including unemployment, weak income growth, lack of available consumer credit, industry slowdowns and plant closures, consumer confidence, increased consumer debt, poor housing market conditions, adverse weather conditions, natural disasters and the need to pay down existing obligations. These risks may be exacerbated by the ongoing global economic shutdown. All of these factors could negatively affect consumer spending, and adversely affect the sales of our retail tenants. This could have an unfavorable effect on our operations and our ability to attract new retail tenants. In addition, our retail tenants face competition from retailers at other regional malls, outlet malls and other discount shopping centers, discount shopping clubs, catalogue companies, and through internet sales and telemarketing. Competition of these types could reduce the percentage rent payable by certain retail tenants and adversely affect our revenues and cash flows.
As owners of office and retail properties, lease rollovers also present a risk, as continued growth of rental income is dependent on strong leasing markets to ensure expiring leases are renewed and new tenants are found promptly to fill vacancies. Refer to “Lease Rollover Risk” below for further details.
As a result of the COVID-19 pandemic, our LP Units traded at historic lows, and compared to equity per unit, which is largely based on the fair value of our investment properties less outstanding debt obligations, traded at a significant discount as a result of concerns over liquidity, leverage restrictions and distribution requirements. In part, as a result of adverse economic conditions and increasing pressure within the real estate sector of which we are a part, our LP Units have regularly traded at a discount since our inception. We cannot predict whether our LP Units will trade above, at or below our equity per unit in the future.
For a more detailed description of the risk factors facing our business, please refer to the section entitled Item 3.D. “Key Information - Risk Factors” in our December 31, 2020 annual report on Form 20-F.
Public Health Risk
Our business has been and is expected to continue to be adversely affected by the effects of the COVID-19 pandemic and the preventative measures taken to curb the spread of the virus, as well as the potential for future outbreaks of other highly infectious or contagious diseases. Business has slowed significantly around the globe including in our hospitality, retail, student housing, triple-net lease, mixed-use and office businesses, and there can be no assurance that strategies to address potential disruptions in operations will mitigate the adverse impacts related to the outbreak. Given the ongoing and dynamic nature of the circumstances surrounding COVID-19, it is difficult to predict how significant the impact of this pandemic, including any responses to it, will be on the global economy, our company and our businesses or for how long disruptions are likely to continue. The extent of such impact will depend on future developments, which are highly uncertain, rapidly evolving and cannot be predicted, including new information which may emerge concerning the severity and transmissibility of this coronavirus and actions taken, including the pace, availability, distribution and acceptance of effective vaccines, to contain the COVID-19 or its impact, among others. Such developments, depending on their nature, duration, and intensity, could have a material adverse effect on our business, financial position, results of operations or cash flows.
We operate in industries or geographies impacted by COVID-19. Many of these are facing financial and operational hardships due to COVID-19 and responses to it. Adverse impacts on our business may include:
•a complete or partial closure of, or other operational issues at, one or more of our properties resulting from government or tenant action;
•a slowdown in business activity may severely impact our tenants' businesses, financial condition and liquidity and may cause one or more of our tenants to be unable to fund their business operations, meet their obligations to us in full, or at all, or to otherwise seek modifications of such obligations;
•an increase in re-leasing timelines, potential delays in lease-up of vacant space and the market rates at which such lease will be executed;
•reduced economic activity could result in a prolonged recession, which could negatively impact consumer discretionary spending; and
•expected completion dates for our development and redevelopment projects may be subject to delay as a result of local economic conditions that may continue to be disrupted as a result of the COVID-19 pandemic.
If these and potential other disruptions caused by COVID-19 continue, our business could be materially adversely affected.
Credit Risk
Credit risk arises from the possibility that tenants may be unable to fulfill their lease commitments. We mitigate this risk by ensuring that our tenant mix is diversified and by limiting our exposure to any one tenant. We also maintain a portfolio that is diversified by property type so that exposure to a business sector is lessened. The global economic shutdown has increased the risk in the near-term of our tenants’ ability to fulfill lease commitments, which has been materially impacted by retail store closures, quarantines and stay-at-home orders. Many of our tenants could declare bankruptcy or become insolvent and cease business operations as a result of prolonged mitigation efforts. Our hospitality assets are experiencing the most immediate impact, and our retail assets were most adversely impacted in the second half of 2020, as stay-at-home orders have lifted and our retail centers are fully open. Our office asset tenants do not presently have as acute difficulty in fulfilling lease commitments in the near-term.
Government and government agencies comprise 7.4% of our Core Office segment tenant base and, as at June 30, 2021, no one tenant comprises more than this.
The following list shows the largest tenants by leasable area in our Core Office portfolio and their respective credit ratings and exposure as at June 30, 2021:
| | | | | | | | | | | |
| Tenant | Primary location | Credit rating(1) | Exposure (%)(2) |
| Government and Government Agencies | Various | AA+/AAA | 7.4 | % |
| Morgan Stanley | NY/London | A+ | 2.6 | % |
| Barclays | London/Toronto/Calgary | A | 2.0 | % |
CIBC World Markets(3) | Calgary/Toronto/NY | AA | 1.8 | % |
| Suncor Energy Inc. | Calgary | BBB+ | 1.8 | % |
| EY | Various | Not Rated | 1.5 | % |
| Bank of Montreal | Calgary/Toronto | AA | 1.4 | % |
| Cenovus | Calgary | BBB- | 1.3 | % |
| Royal Bank of Canada | Various | AA- | 1.3 | % |
| Deloitte | Various | Not Rated | 1.3 | % |
| Total | | | 22.4 | % |
(1)From Standard & Poor’s Rating Services, Moody’s Investment Services, Inc. or DBRS Limited.
(2)Prior to considering the partnership’s interest in partially-owned properties.
(3)CIBC World Markets leases 1.1 million square feet at 300 Madison Avenue in New York, of which they sublease 940,000 square feet to PricewaterhouseCoopers LLP and approximately 100,000 square feet to Sumitomo Corporation of America.
The following list reflects the largest tenants in our Core Retail portfolio as at June 30, 2021. The largest ten tenants in our portfolio accounted for approximately 22.1% of minimum rents, tenant recoveries and other.
| | | | | | | | |
| Tenant | Primary Brands | Exposure (%)(1) |
| L Brands, Inc | Victoria's Secret, Bath & Body Works, PINK | 3.7 | % |
| Foot Locker, Inc | Footlocker, Champs Sports, Footaction USA, House of Hoops | 3.3 | % |
| LVMH | Louis Vuitton, Sephora, Fendi, Bulgari, Dior, Tag Heuer | 3.1 | % |
| The Gap, Inc | Gap, Banana Republic, Old Navy, Athleta | 2.2 | % |
| American Eagle Outfitters, Inc | American Eagle Outfitters, Aerie | 2.0 | % |
| Signet Jewelers Limited | Zales, Gordon's, Kay, Jared | 1.9 | % |
| F21 Opco, Llc | Forever 21 | 1.6 | % |
| Luxottica Group S.P.A. | Lenscrafters, Sunglass Hut, Pearle Vision | 1.5 | % |
| H&M Hennes & Mauritz | H&M, COS | 1.5 | % |
| Express, Inc | Express, Express Men, Express Factory | 1.3 | % |
| Total | | 22.1 | % |
(1)Exposure is a percentage of minimum rents and tenant recoveries.
Lease Roll-over Risk
Lease roll-over risk arises from the possibility that we may experience difficulty renewing leases as they expire or in re-leasing space vacated by tenants upon early lease expiry. Due to the global economic shutdown, we may experience an increase in re-leasing timelines, potential delays in lease-up of vacant space and the market rates at which such leases will be executed could be impacted. We attempt to stagger the lease expiry profile so that we are not faced with disproportionate amounts of space expiring in any one year. On average, approximately 8.7% of our Core Office and Core Retail leases mature annually through 2025. Our Core Office and Core Retail leases have a weighted average remaining lease life of approximately 6.8 years. We further mitigate this risk by maintaining a diversified portfolio mix by geographic location and by pro-actively leasing space in advance of its contractual expiry.
The following table sets out lease expiries, by square footage, for our Core Office and Core Retail portfolios at June 30, 2021, including our unconsolidated investments:
| | | | | | | | | | | | | | | | | | | | | | | | | | | | | | | | |
| (Sq. ft. in thousands) | Current | 2021 | 2022 | 2023 | 2024 | 2025 | 2026 | 2027 | 2028 and beyond | Total |
| Core Office | 8,899 | | 971 | | 4,811 | | 4,176 | | 4,469 | | 5,105 | | 5,432 | | 4,483 | | 41,461 | | 79,807 | |
| Total % expiring | 11.2 | % | 1.2 | % | 6.0 | % | 5.2 | % | 5.6 | % | 6.4 | % | 6.8 | % | 5.6 | % | 52.0 | % | 100.0 | % |
Core Retail(1) | 4,407 | 2,013 | 7,104 | 6,866 | 7,196 | 4,918 | 4,381 | 3,857 | 11,412 | 52,154 |
| Total % expiring | 8.0 | % | 3.9 | % | 13.6 | % | 13.2 | % | 13.8 | % | 9.4 | % | 8.4 | % | 7.4 | % | 22.3 | % | 100.0 | % |
| | | | | | | | | | |
| | | | | | | | | | |
| | | | | | | | | | |
| | | | | | | | | | |
| | | | | | | | | | |
| | | | | | | | | | |
(1)Represents regional malls only and excludes traditional anchor and specialty leasing agreements.
Tax Risk
We are subject to income taxes in various jurisdictions, and our tax liabilities are dependent upon the distribution of income among these different jurisdictions. Our effective income tax rate is influenced by a number of factors, including changes in tax law, tax treaties, interpretation of existing laws, and our ability to sustain our reporting positions on examination. Changes in any of those factors could change our effective tax rate, which could adversely affect our profitability and results of operations.
Environmental Risk
As an owner of real property, we are subject to various federal, provincial, state and municipal laws relating to environmental matters. Such laws provide that we could be liable for the costs of removing certain hazardous substances and remediating certain hazardous locations. The failure to remove such substances or remediate such locations, if any, could adversely affect our ability to sell such real estate or to borrow using such real estate as collateral and could potentially result in claims against us. We are not aware of any material non-compliance with environmental laws at any of our properties nor are we aware of any material pending or threatened investigations or actions by environmental regulatory authorities in connection with any of our properties or any material pending or threatened claims relating to environmental conditions at our properties.
We will continue to make the necessary capital and operating expenditures to ensure that we are compliant with environmental laws and regulations. Although there can be no assurances, we do not believe that costs relating to environmental matters will have a material adverse effect on our business, financial condition or results of operations. However, environmental laws and regulations can change and we may become subject to more stringent environmental laws and regulations in the future, which could have an adverse effect on our business, financial condition or results of operations.
Economic Risk
Real estate is relatively illiquid and may be even more illiquid in the context of the global economic shutdown. Such illiquidity may limit our ability to vary our portfolio promptly in response to changing economic or investment conditions. Also, financial difficulties of other property owners resulting in distressed sales could depress real estate values in the markets in which we operate.
Our commercial properties generate a relatively stable source of income from contractual tenant rent payments. Continued growth of rental income is dependent on strong leasing markets to ensure expiring leases are renewed and new tenants are found promptly to fill vacancies. We are substantially protected against short-term market conditions, as most of our leases are long-term in nature with an average term of over six years.
Insurance Risk
Our insurance may not cover some potential losses or may not be obtainable at commercially reasonable rates. We maintain insurance on our properties in amounts and with deductibles that we believe are in line with what owners of similar properties carry. We maintain all risk property insurance and rental value coverage (including coverage for the perils of flood, earthquake and weather catastrophe).
Interest Rate and Financing Risk
We have an on-going need to access debt markets to refinance maturing debt as it comes due. There is a risk that lenders will not refinance such maturing debt on terms and conditions acceptable to us or on any terms at all. This risk may be increased as a result of disrupted market conditions resulting from the global economic shutdown. Our strategy to stagger the maturities of our mortgage portfolio attempts to mitigate our exposure to excessive amounts of debt maturing in any one year and to maintain relationships with a large number of lenders to limit exposure to any one counterparty.
Approximately 47% of our outstanding debt obligations at June 30, 2021 are floating rate debt compared to 43% at December 31, 2020. This debt is subject to fluctuations in interest rates. A 100 basis point increase in interest rates relating to our corporate and commercial floating rate debt obligations would result in an increase in annual interest expense of approximately $261 million. A 100 basis point increase in interest rates relating to fixed rate debt obligations due within one year would result in an increase in annual interest expense of approximately $33 million upon refinancing. In addition, we have exposure to interest rates within our equity accounted investments. We have mitigated, to some extent, the exposure to interest rate fluctuations through interest rate derivative contracts. See “Derivative Financial Instruments” below in this MD&A.
At June 30, 2021, our consolidated debt to capitalization was 55% (December 31, 2020 – 55%). It is our view this level of indebtedness is conservative given the cash flow characteristics of our properties and the fair value of our assets. Based on this, we believe that all debts will be financed or repaid as they come due in the foreseeable future.
Foreign Exchange Risk
As at and for the six months ended June 30, 2021, approximately 33% of our assets and 29% of our revenues originated outside the United States and consequently are subject to foreign currency risk due to potential fluctuations in exchange rates between these currencies and the U.S. Dollar. To mitigate this risk, we attempt to maintain a natural hedged position with respect to the carrying value of assets through debt agreements denominated in local currencies and, from time to time, supplemented through the use of derivative contracts as discussed under “Derivative Financial Instruments”.
DERIVATIVE FINANCIAL INSTRUMENTS
We and our operating entities use derivative and non-derivative instruments to manage financial risks, including interest rate, commodity, equity price and foreign exchange risks. The use of derivative contracts is governed by documented risk management policies and approved limits. We do not use derivatives for speculative purposes. We and our operating entities use the following derivative instruments to manage these risks:
•foreign currency forward contracts to hedge exposures to Canadian Dollar, Australian Dollar, British Pound, Euro, Chinese Yuan, Brazilian Real, Indian Rupee and South Korean Won denominated investments in foreign subsidiaries and foreign currency denominated financial assets;
•interest rate swaps to manage interest rate risk associated with planned refinancings and existing variable rate debt;
•interest rate caps to hedge interest rate risk on certain variable rate debt; and
•cross-currency swaps to manage interest rate and foreign currency exchange rates on existing variable rate debt.
The global economic shutdown has impacted business across the globe and we are monitoring its impact on our business. While it is difficult to predict how significant the impact will be, our business is highly resilient in some of the most critical sectors in the world and has a robust balance sheet with a strong investment grade rating.
There have been no other material changes to our financial risk exposure or risk management activities since December 31, 2020. Please refer to Note 33, Financial Instruments in our December 31, 2020 annual report on Form 20-F for a detailed description of our financial risk exposure and risk management activities.
Interest Rate Hedging
The following table provides our outstanding derivatives that are designated as cash flow hedges of variability in interest rates associated with forecasted fixed rate financings and existing variable rate debt as of June 30, 2021 and December 31, 2020:
| | | | | | | | | | | | | | | | | |
| (US$ Millions) | Hedging item | Notional | Rates | Maturity dates | Fair value |
| Jun. 30, 2021 | Interest rate caps of US$ LIBOR debt | $ | 9,155 | | 2.5% - 5.5% | Jul. 2021 - Jun. 2024 | $ | — | |
| Interest rate swaps of US$ LIBOR debt | 2,380 | | 1.0% - 2.6% | Nov. 2022 - Feb. 2024 | (84) | |
| Interest rate caps of £ LIBOR debt | 3,270 | | 2.0% - 2.5% | Aug. 2021 - Dec. 2023 | — | |
| Interest rate caps of £ SONIA debt | 471 | | 1.0% - 1.0% | Mar. 2025 | 2 | |
| Interest rate caps of € EURIBOR debt | 106 | | 1.3% | Apr. 2022 | — | |
| | | | | |
| Interest rate caps of C$ LIBOR debt | 240 | | 2.0% | Oct. 2021 | — | |
| Interest rate swaps of AUD BBSW/BBSY debt | 436 | | 0.8% - 1.6% | Apr. 2023 - Feb. 2026 | (6) | |
| | | | | |
| | | | | |
| Dec. 31, 2020 | Interest rate caps of US$ LIBOR debt | $ | 8,371 | | 2.5% - 5.5% | May 2021 - Sep. 2023 | $ | — | |
| Interest rate swaps of US$ LIBOR debt | 2,380 | | 1.0% - 2.6% | Nov. 2022 - Feb. 2024 | (112) | |
| Interest rate caps of £ LIBOR debt | 3,198 | | 2.0% - 2.5% | Jan. 2021 - Jan. 2022 | — | |
| Interest rate caps of € EURIBOR debt | 119 | | 1.3% | Apr. 2021 | — | |
| Interest rate caps of C$ LIBOR debt | 189 | | 3.0% | Oct. 2021 - Oct. 2022 | — | |
| Interest rate swaps of AUD BBSW/BBSY debt | 447 | | 0.8% - 1.6% | Apr. 2023 - Apr. 2024 | (11) | |
For the three and six months ended June 30, 2021, the amount of hedge ineffectiveness recorded in earnings in connection with our interest rate hedging activities was nil and nil (2020 - nil and nil), respectively.
Foreign Currency Hedging
The following table provides our outstanding derivatives that are designated as net investments of foreign subsidiaries or foreign currency cash flow hedges as of June 30, 2021 and December 31, 2020:
| | | | | | | | | | | | | | | | | | | | |
| (US$ Millions) | Hedging item | | Notional | Rates | Maturity dates | Fair value |
| Jun. 30, 2021 | Net investment hedges | € | 110 | | €0.81/$ - €0.88/$ | Sep. 2021 - Feb. 2023 | $ | 5 | |
| Net investment hedges | £ | 2,000 | | £0.71/$ - £0.86/$ | Sep. 2021 - Dec. 2023 | (35) | |
| Net investment hedges | A$ | 556 | | A$1.29/$ - A$1.45/$ | Sep. 2021 - Jul. 2022 | 8 | |
| Net investment hedges | C¥ | 853 | | C¥6.63/$ - C¥6.83/$ | Sep. 2021 - Jun. 2023 | — | |
| Net investment hedges | C$ | 153 | | C$1.23/$ - C$1.27/$ | Mar. 2023 - Mar. 2024 | (1) | |
| Net investment hedges | R$ | 1,160 | | R$4.98/$ - R$5.95/$ | May 2023 - Sep. 2021 | (9) | |
| Net investment hedges | ₩ | 720,095 | | ₩1,095.50/$ - ₩1,135.90/$ | Jun. 2022 - Jun. 2023 | 5 | |
| Net investment hedges | Rs | 67,701 | | Rs76.35/$ - Rs86.71/$ | Jan. 2022 - May. 2024 | (3) | |
| Net investment hedges | £ | 90 | | £0.91/€ - £0.91/€ | Apr. 2022 - Apr. 2022 | — | |
| Cross currency swaps of C$ LIBOR debt | C$ | 2,400 | | C$1.29/$ - C$1.38/$ | Oct. 2021 - Jan. 2027 | 109 | |
| Dec. 31, 2020 | Net investment hedges | € | — | | €0.87/$ - €0.88/$ | Sep. 2021 - Sep. 2021 | $ | 1 | |
| Net investment hedges | £ | 201 | | £0.50/$ - £1.08/$ | Mar. 2021 - Dec. 2021 | 5 | |
| Net investment hedges | A$ | 240 | | A$1.34/$ - A$1.52/$ | Jun. 2021 - Dec. 2021 | 3 | |
| Net investment hedges | C¥ | 813 | | C¥4.02/$ - C¥7.43/$ | Mar. 2021 - Sep. 2021 | (11) | |
| Net investment hedges | R$ | 620 | | R$5.20/$ - R$5.20/$ | Mar. 2021 - Mar. 2021 | (3) | |
| Net investment hedges | ₩ | 720,095 | | ₩914.84/$ - ₩1,169.58/$ | Mar. 2021 - Jun. 2022 | (54) | |
| Net investment hedges | Rs | 4,703 | | Rs76.28/$ | Jun. 2021 | (2) | |
| Net investment hedges | £ | 90 | | £0.89/€ - £0.93/€ | Apr. 2021 - Apr. 2021 | — | |
| Cross currency swaps of C$ LIBOR debt | C$ | 2,400 | | C$0.81/$ - C$1.70/$ | Oct. 2021 - Jan. 2027 | 66 | |
For the three and six months ended June 30, 2021, the amount of hedge ineffectiveness recorded in earnings in connection with our foreign currency hedging activities was not significant.
Other Derivatives
The following table presents details of our derivatives, not designated as hedges for accounting purposes, that have been entered into to manage financial risks as of June 30, 2021 and December 31, 2020:
| | | | | | | | | | | | | | | | | | |
| (US$ Millions) | Derivative type | Notional |
Rates | Maturity dates | Fair value | |
| Jun. 30, 2021 | Interest rate caps | $ | 3,594 | | 3.5% - 4.5% | Sep. 2021 - Feb. 2027 | $ | — | | |
| Interest rate swaps on forecasted fixed rate debt | 1,210 | | 2.8% - 6.4% | Sep. 2021 - Jun. 2033 | (253) | | |
| Interest rate swaps of US$ debt | 1,447 | | 0.8% - 5.1% | Nov. 2022 - Mar. 2024 | (21) | | |
| Embedded derivative | — | | — | | Aug. 2025 - Aug. 2026 | 28 | | |
| Dec. 31, 2020 | Interest rate caps | $ | 3,560 | | 3.0% - 5.0% | Jan. 2021 - Feb. 2027 | $ | — | | |
| Interest rate swaps on forecasted fixed rate debt | 1,285 | | 2.7% - 6.4% | Mar. 2021 - Jun. 2030 | (308) | | |
| Interest rate swaps of US$ debt | 1,746 | | 0.8% - 5.1% | Jun. 2021 - Mar. 2024 | (32) | | |
| Interest rate swaptions | 350 | | 2.0 | % | Mar. 2031 - Mar. 2031 | — | | |
For the three and six months ended June 30, 2021, the partnership recognized fair value losses, net of approximately $3 million and $3 million (2020 - losses of $2 million and $54 million), respectively, related to the settlement of certain forward starting interest rate swaps that have not been designated as hedges.
RELATED PARTIES
In the normal course of operations, the partnership enters into transactions with related parties. These transactions are recognized in the consolidated financial statements. These transactions have been measured at exchange value and are recognized in the consolidated financial statements. The immediate parent of the partnership is Brookfield Property Partners Limited. The ultimate parent of the partnership is Brookfield Asset Management. Other related parties of the partnership include Brookfield Asset Management’s subsidiaries and operating entities, certain joint ventures and associates accounted for under the equity method, as well as officers of such entities and their spouses.
We have a management agreement with our service providers, wholly-owned subsidiaries of Brookfield Asset Management. Pursuant to a Master Services Agreement, we pay a base management fee (“base management fee”), to the service providers equal to 0.5% of the total capitalization of the partnership, subject to an annual minimum of $50 million plus annual inflation adjustments. The amount of the equity enhancement distribution is reduced by the amount by which the base management fee is greater than $50 million per annum, plus annual inflation adjustments (“equity enhancement adjustment”).
| | | | | | | | | | | | | | |
| Three months ended Jun. 30, | Six months ended Jun. 30, |
| (US$ Millions) | 2021 | 2020 | 2021 | 2020 |
| Base fee amount at 0.125% of current capitalization | $ | 31 | | $ | 18 | | $ | 61 | | $ | 34 | |
| Fee on increased market capitalization (.3125%) | 43 | | 9 | | 81 | | 13 | |
| Total calculated fees | 74 | | 27 | | 142 | | 47 | |
| Less credits: | | | | |
| Equity enhancement adjustment | (17) | | (4) | | (33) | | (6) | |
| Creditable operating payments and other adjustments | (11) | | (11) | | (21) | | (24) | |
| Total fee, subject to minimum adjusted for inflation | 46 | | 12 | | 88 | | 17 | |
| Total fee, by component: | | | | |
| Base fee | 31 | | 12 | | 61 | | 17 | |
| Equity enhancement adjustment | 15 | | — | | 27 | | — | |
| Total fee | $ | 46 | | $ | 12 | | $ | 88 | | $ | 17 | |
In connection with the issuance of preferred equity units of the operating partnership (“Preferred Equity Units”) to a third party in the fourth quarter of 2014, Brookfield Asset Management has contingently agreed to acquire the seven-year and ten-year tranches of Preferred Equity Units from such investor for the initial issuance price plus accrued and unpaid distributions and to exchange such units for Preferred Equity Units with terms and conditions substantially similar to the twelve-year tranche to the extent that the market price of the LP Units is less than 80% of the exchange price at maturity.
On June 29, 2021, Brookfield Premier Real Estate Partners Australia (“BPREP-A”) acquired Brookfield Place Sydney from Brookfield Strategic Real Estate Partners I (“BSREP I”) fund for approximately $153 million.
On July 26, 2021, Brookfield Asset Management completed its previously announced acquisition of all of the LP units of BPY that it did not previously own. The LP Units were delisted from the TSX and Nasdaq at market close on July 26, 2021. Based on unitholder elections, together with the amounts owing to holders of BPYU shares, an aggregate of 51,971,192 units were elected for cash, 271,358,615 units were elected for BAM class A limited voting shares (“BAM shares”) and 17,970,971 units were elected for BPY preferred units with a liquidation preference of $25.00 per unit (“BPY preferred units”). The BPY preferred units began trading on the TSX (BPYP.PR.A) and Nasdaq (BPYPM) on July 27, 2021. As holders elected to receive more BAM shares than were available under the transaction, unitholders
that elected to receive BAM shares received 54.5316% of the aggregate BAM shares they elected to receive and the balance was delivered 93.05% in cash and 6.95% in BPY preferred units. Unitholders who made an election to receive 100% of their consideration in one of the three available options received, respectively per BPY Unit i) 100% cash election: $18.17 in cash ii) 100% BAM shares election: $7.69 in cash, 0.2185 BAM shares and 0.0230 in BPY preferred units iii) 100% BPY preferred units: 0.7268 BPY preferred units. Total consideration paid by Brookfield Asset Management to complete the transaction was $3.0 billion in cash paid and 59,279,263 BAM Class A shares issued. BPY issued 19,287,783 BPY preferred units in connection with the transaction.
During the year ended December 31, 2020, we issued 9,416,816 LP Units at $11.36 per unit, 2,696,841 LP Units at $12.00 per unit, 5,967,063 LP Units at $12.65 per unit, 13,392,277 LP Units at $13.92 per unit, and 18,715,912 Redeemable/Exchangeable Partnership Units at $12.00 per unit to Brookfield Asset Management.
The following table summarizes transactions with related parties:
| | | | | | | | |
| (US$ Millions) | Jun. 30, 2021 | Dec. 31, 2020 |
| Balances outstanding with related parties: | | |
| Net (payables)/receivables within equity accounted investments | (515) | | (91) | |
| Loans and notes receivable | 177 | | 50 | |
| Receivables and other assets | 64 | | 59 | |
Deposit payable to Brookfield Asset Management(1) | (2,847) | | (754) | |
| | |
| Property-specific debt obligations | (101) | | — | |
| Loans and notes payable and other liabilities | (448) | | (313) | |
| Preferred shares held by Brookfield Asset Management | (15) | | (15) | |
(1)As of June 30, 2021, a $2,847 million on-demand deposit was payable to Brookfield Asset Management, provided for in the deposit agreement between the partnership and Brookfield Asset Management. The deposit limit was increased to $3.0 billion in the second quarter of 2021.
| | | | | | | | | | | | | | |
| Three months ended Jun. 30, | Six months ended Jun. 30, |
| (US$ Millions) | 2021 | 2020 | 2021 | 2020 |
| Transactions with related parties: | | | | |
Commercial property revenue(1) | $ | 9 | | $ | 8 | | $ | 17 | | $ | 15 | |
| Management fee income | 6 | | 15 | | 13 | | 25 | |
| | | | |
| Interest expense on debt obligations | 10 | | 2 | | 15 | | 9 | |
| | | | |
General and administrative expense(2) | 64 | | 35 | | 129 | | 73 | |
Construction costs(3) | 47 | | 110 | | 97 | | 228 | |
| Incentive fees | 22 | | 1 | | 22 | | 7 | |
(1)Amounts received from Brookfield Asset Management and its subsidiaries for the rental of office premises.
(2)Includes amounts paid to Brookfield Asset Management and its subsidiaries for management fees, management fees associated with the partnership’s private fund investments, and administrative services.
(3)Includes amounts paid to Brookfield Asset Management and its subsidiaries for construction costs of development properties.
ADDITIONAL INFORMATION
CRITICAL ACCOUNTING POLICIES, ESTIMATES, AND JUDGEMENTS
USE OF ESTIMATES
The preparation of our financial statements requires management to make judgments, estimates and assumptions that affect the reported amounts of assets and liabilities, disclosure of contingent assets and liabilities at the date of the financial statements and the reported amounts of revenues and expenses during the reporting period. Our estimates are based on historical experience and on various other assumptions that are believed to be reasonable under the circumstances. The result of our ongoing evaluation of these estimates forms the basis for making judgments about the carrying values of assets and liabilities and the reported amounts of revenues and expenses that are not readily apparent from other sources. Actual results may differ from these estimates under different assumptions.
Prior to the end of the first quarter, the global economic shutdown prompted certain responses from global government authorities across the various geographies in which the partnership owns and operates investment properties. Such responses, have included mandatory temporary closure of, or imposed limitations on, the operations of certain non-essential properties and businesses including office properties and retail malls and associated businesses which operate within these properties such as retailers and restaurants. In addition, shelter-in-place mandates and severe travel restrictions have had a significant adverse impact on consumer spending and demand in the near term. These negative economic indicators, restrictions and closure have created significant estimation uncertainty in the determination of the fair value of investment properties as of June 30, 2021. Specifically, while discount and capitalization rates are inherently uncertain, there has been an absence of recently observed market transactions across the partnership’s geographies to support changes in such rates which is a key input into the determination of fair value. In addition, the partnership has had to make assumptions with respect to the length and severity of these restrictions and closures as well as the viability of our tenants in consideration of any credit reserves that should be applied based on deemed tenant risk and the recovery period in estimating the impact and timing of future cash flows generated from investment properties and used in the discounted cash flow model used to determine fair value. As a result of this material estimation uncertainty there is a risk that the assumptions used to determine fair value as of June 30, 2021 may result in a material adjustment to the fair value of investment properties in future reporting periods as more information becomes available.
For further reference on accounting policies and critical judgments and estimates, see our significant accounting policies contained in Note 2, Summary of Significant Accounting Policies to the December 31, 2020 consolidated financial statements and Note 2c, Summary of Significant Accounting Policies: Adoption of Accounting Standards of the Financial Statements.
TREND INFORMATION
We seek to increase the cash flows from our office and retail property activities through continued leasing activity as described below. In particular, we are operating below our historical office occupancy level in the United States, which provides the opportunity to expand cash flows through higher occupancy. However, our future results may be impacted by risks associated with the global pandemic caused by a novel strain of coronavirus, COVID-19, and the related reduction in commerce and travel and substantial volatility in stock markets worldwide, which may result in a decrease of cash flows and impairment losses and/or revaluations on our investments and real estate properties, and we may be unable to achieve our expected returns. In addition, we expect to face a meaningful amount of lease rollover in 2021 and 2022, which may restrain FFO growth from this part of our portfolio in the near future. Our belief is as to the opportunities for our partnership to increase its occupancy levels, lease rates and cash flows are based on assumptions about our business and markets that management believes are reasonable in the circumstances. There can be no assurance as to growth in occupancy levels, lease rates or cash flows. See “Statement Regarding Forward-looking Statements and Use of Non-IFRS Measures”.
We believe our global scale and best-in-class operating platforms provide us with a unique competitive advantage as we are able to efficiently allocate capital around the world toward those sectors and geographies where we see the greatest returns. We actively recycle assets on our balance sheet as they mature and reinvest the proceeds into higher yielding investment strategies, further enhancing returns. In addition, due to the scale of our stabilized portfolio and flexibility of our balance sheet, our business model is self-funding and does not require us to access capital markets to fund our continued growth.
Given the small amount of new office and retail development that occurred over the last decade and the near total development halt during the global financial crisis, we see an opportunity to advance our development inventory in the near term in response to demand we are seeing in our major markets. In addition, we continue to reposition and redevelop existing retail properties, in particular, a number of the highest performing shopping centers in the United States.
OFF-BALANCE SHEET ARRANGEMENTS
We do not have any off-balance sheet arrangements that have or are reasonably likely to have a material current or future effect on our financial condition, changes in financial condition, revenues or expenses, results of operations, liquidity, capital expenditures or capital resources that is material to investors.
CONTROLS AND PROCEDURES
INTERNAL CONTROL OVER FINANCIAL REPORTING
There have been no changes made in our internal control over financial reporting that have occurred during the six months ended June 30, 2021, that have materially affected, or are reasonably likely to materially affect, our internal control over financial reporting. We have not experienced any material impact to our internal control over financial reporting due to the global economic shutdown.
Corporate Information
CORPORATE PROFILE
Brookfield Property Partners is one of the world’s largest commercial real estate companies, with over $89 billion in total assets. We are leading owners, operators and investors in commercial property assets, with a diversified portfolio of premier office and retail assets, as well as multifamily, triple net lease, logistics, hospitality, student housing and manufactured housing assets. Further information is available at bpy.brookfield.com. Important information may be disseminated exclusively via the website; investors should consult the site to access this information.
Brookfield Property Partners is the flagship listed real estate company of Brookfield Asset Management, a leading global alternative asset manager with over $600 billion in assets under management.
BROOKFIELD PROPERTY PARTNERS
73 Front Street, 5th Floor
Hamilton, HM 12
Bermuda
Tel: (441) 294-3309
bpy.brookfield.com
UNITHOLDERS INQUIRIES
Brookfield Property Partners welcomes inquiries from Unitholders, analysts, media representatives and other interested parties. Questions relating to investor relations or media inquiries can be directed to Matt Cherry, Senior Vice President, Investor Relations and Communications at (212) 417-7488 or via e-mail at matthew.cherry@brookfield.com. Inquiries regarding financial results can be directed to Bryan Davis, Chief Financial Officer at (212) 417-7166 or via e-mail at bryan.davis@brookfield.com. Unitholder questions relating to distributions, address changes and unit certificates should be directed to the partnership’s transfer agent, AST Trust Company, as listed below.
AST TRUST COMPANY (Canada)
By mail: P.O. Box 4229
Station A
Toronto, Ontario, M5W 0G1
Tel: (416) 682-3860; (800) 387-0825
Fax: (888) 249-6189
E-mail: inquiries@astfinancial.com
Web site: www.astfinancial.com/ca
COMMUNICATIONS
We strive to keep our Unitholders updated on our progress through a comprehensive annual report, quarterly interim reports and periodic press releases.
Brookfield Property Partners maintains a website, bpy.brookfield.com, which provides access to our published reports, press releases, statutory filings, supplementary information and unit and distribution information as well as summary information on the partnership.
We maintain an investor relations program and respond to inquiries in a timely manner. Management meets on a regular basis with investment analysts and Unitholders to ensure that accurate information is available to investors.