UNITED STATES
SECURITIES AND EXCHANGE COMMISSION
Washington, D.C. 20549
Form 10-K
(Mark One)
| | | | | |
| ☒ | ANNUAL REPORT PURSUANT TO SECTION 13 OR 15(d) OF THE SECURITIES EXCHANGE ACT OF 1934 |
For the fiscal year ended December 31, 2024
OR
| | | | | |
| ☐ | TRANSITION REPORT PURSUANT TO SECTION 13 OR 15(d) OF THE SECURITIES EXCHANGE ACT OF 1934 |
For the transition period from ___________________ to __________________
Commission file number 001-35714
MPLX LP
(Exact name of registrant as specified in its charter)
| | | | | | | | |
| Delaware | | 27-0005456 |
| (State or other jurisdiction of incorporation or organization) | | (I.R.S. Employer Identification No.) |
200 E. Hardin Street, Findlay, OH 45840-3229
(Address of principal executive offices) (Zip code)
(419) 422-2121
(Registrant’s telephone number, including area code)
Securities registered pursuant to Section 12(b) of the Act:
| | | | | | | | |
| Title of each class | Trading Symbol(s) | Name of each exchange on which registered |
| Common Units Representing Limited Partnership Interests | MPLX | New York Stock Exchange |
Securities registered pursuant to Section 12(g) of the Act: None
Indicate by check mark if the registrant is a well-known seasoned issuer, as defined in Rule 405 of the Securities Act. Yes ☑ No ☐
Indicate by check mark if the registrant is not required to file reports pursuant to Section 13 or Section 15(d) of the Act. Yes ☐ No ☑
Indicate by check mark whether the registrant (1) has filed all reports required to be filed by Section 13 or 15(d) of the Securities Exchange Act of 1934 during the preceding 12 months (or for such shorter period that the registrant was required to file such reports), and (2) has been subject to such filing requirements for the past 90 days. Yes ☑ No ☐
Indicate by check mark whether the registrant has submitted electronically every Interactive Data File required to be submitted pursuant to Rule 405 of Regulation S-T (§232.405 of this chapter) during the preceding 12 months (or for such shorter period that the registrant was required to submit such files). Yes ☑ No ☐
Indicate by check mark whether the registrant is a large accelerated filer, an accelerated filer, a non-accelerated filer, a smaller reporting company or an emerging growth company. See the definitions of “large accelerated filer,” “accelerated filer,” “smaller reporting company” and “emerging growth company” in Rule 12b-2 of the Exchange Act.
Large Accelerated Filer ☑ Accelerated filer ☐ Non-accelerated filer ☐ Smaller reporting company ☐ Emerging growth company ☐
If an emerging growth company, indicate by check mark if the registrant has elected not to use the extended transition period for complying with any new or revised financial accounting standards provided pursuant to Section 13(a) of the Exchange Act. ☐
Indicate by check mark whether the registrant has filed a report on and attestation to its management’s assessment of the effectiveness of its internal control over financial reporting under Section 404(b) of the Sarbanes-Oxley Act (15 U.S.C. 7262(b)) by the registered public accounting firm that prepared or issued its audit report. ☑
If securities are registered pursuant to Section 12(b) of the Act, indicate by check mark whether the financial statements of the registrant included in the filing reflect the correction of an error to previously issued financial statements. ☐
Indicate by check mark whether any of those error corrections are restatements that required a recovery analysis of incentive-based compensation received by any of the registrant’s executive officers during the relevant recovery period pursuant to §240.10D-1(b). ☐
Indicate by check mark whether the registrant is a shell company (as defined in Rule 12b-2 of the Exchange Act). Yes ☐ No ☑
The aggregate market value of common units held by non-affiliates as of June 30, 2024 was approximately $15.9 billion. This amount is based on the closing price of the registrant’s common units on the New York Stock Exchange on June 28, 2024, the last trading day of the registrant’s most recently completed second fiscal quarter. Common units held by executive officers and directors of the registrant and its affiliates are not included in the computation. The registrant, solely for the purpose of this required presentation, has deemed its directors and executive officers and those of its affiliates to be affiliates.
MPLX LP had 1,022,509,781 common units outstanding at February 21, 2025.
Documents Incorporated By Reference: None
Table of Contents
| | | | | | | | |
| | | Page |
| | |
| Item 1. | | |
| Item 1A. | | |
| Item 1B. | | |
| Item 1C. | | |
| Item 2. | | |
| Item 3. | | |
| Item 4. | | |
| | |
| Item 5. | | |
| Item 7. | | |
| Item 7A. | | |
| Item 8. | | |
| Item 9. | | |
| Item 9A. | | |
| Item 9B. | | |
| Item 9C. | | |
| | |
| Item 10. | | |
| Item 11. | | |
| Item 12. | | |
| Item 13. | | |
| Item 14. | | |
| | |
| Item 15. | | |
| | |
| | |
Unless otherwise stated or the context otherwise indicates, all references in this Annual Report on Form 10-K to “MPLX LP,” “MPLX,” “the Partnership,” “us,” “our,” “we,” or like terms refer to MPLX LP and its consolidated subsidiaries. References to our sponsor and customer, “MPC,” refer collectively to Marathon Petroleum Corporation and its subsidiaries, other than the Partnership. Additionally, throughout this Annual Report on Form 10-K, we have used terms in our discussion of the business and operating results that have been defined in our Glossary of Terms.
Glossary of Terms
The abbreviations, acronyms and industry terminology used in this report are defined as follows:
| | | | | |
| ARO | Asset retirement obligation |
| ASC | Accounting Standards Codification |
| ASU | Accounting Standards Update |
| |
| Barrel (Bbl) | One stock tank barrel, or 42 United States gallons of liquid volume, used in reference to crude oil or other liquid hydrocarbons. |
| |
| Bcf/d | One billion cubic feet per day |
| Btu | One British thermal unit, an energy measurement |
| |
| |
| DCF (a non-GAAP financial measure) | Distributable Cash Flow |
| DOT | United States Department of Transportation |
| |
| EBITDA (a non-GAAP financial measure) | Earnings Before Interest, Taxes, Depreciation and Amortization |
| |
| EPA | United States Environmental Protection Agency |
| ESG | Environmental, social and governance |
| FASB | Financial Accounting Standards Board |
| FCF (a non-GAAP financial measure) | Free Cash Flow |
| FERC | Federal Energy Regulatory Commission |
| GAAP | Accounting principles generally accepted in the United States of America |
| GHG | Greenhouse gas |
| |
| |
| |
| IRS | Internal Revenue Service |
| |
| |
| |
| LPG | Liquefied petroleum gas, including propane, butane and isobutane |
| mbbls | Thousands of barrels |
| mbpd | Thousand barrels per day |
| |
| |
| MMBtu | One million British thermal units, an energy measurement |
| MMcf/d | One million cubic feet per day |
| |
| |
| |
| NGL | Natural gas liquids, such as ethane, propane, butanes and natural gasoline |
| NYSE | New York Stock Exchange |
| |
| |
| PHMSA | Pipeline and Hazardous Materials Safety Administration |
| |
| |
| |
| SEC | United States Securities and Exchange Commission |
| |
| |
| SOFR | Secured Overnight Financing Rate |
| USCG | United States Coast Guard |
| VIE | Variable interest entity |
| |
| |
Disclosures Regarding Forward-Looking Statements
This Annual Report on Form 10-K, particularly Item 1. Business, Item 1A. Risk Factors, Item 3. Legal Proceedings, Item 7. Management’s Discussion and Analysis of Financial Condition and Results of Operations and Item 7A. Quantitative and Qualitative Disclosures about Market Risk, includes forward-looking statements that are subject to risks, contingencies or uncertainties. You can identify forward-looking statements by words such as “anticipate,” “believe,” “commitment,” “could,” “design,” “estimate,” “expect,” “focus,” “forecast,” “goal,” “guidance,” “intend,” “may,” “objective,” “opportunity,” “outlook,” “plan,” “policy,” “position,” “potential,” “predict,” “priority,” “project,” “prospective,” “pursue,” “seek,” “should,” “strategy,” “target,” “will,” “would” or other similar expressions that convey the uncertainty of future events or outcomes.
Forward-looking statements include, among other things, statements regarding:
•future financial and operating results;
•ESG plans and goals, including those related to GHG emissions and intensity, biodiversity, inclusion and ESG reporting;
•future levels of capital, environmental or maintenance expenditures, general and administrative and other expenses;
•the success or timing of completion of ongoing or anticipated capital or maintenance projects;
•business strategies, growth opportunities and expected investments, including plans to grow stable cash flows, lower costs and return capital to unitholders;
•the timing and amount of future distributions or unit repurchases; and
•the anticipated effects of actions of third parties such as competitors, activist investors, federal, foreign, state or local regulatory authorities or plaintiffs in litigation.
Our forward-looking statements are not guarantees of future performance and you should not rely unduly on them, as they involve risks, uncertainties and assumptions that we cannot predict. Forward-looking and other statements regarding our ESG plans and goals are not an indication that these statements are material to investors or required to be disclosed in our filings with the SEC. In addition, historical, current, and forward-looking ESG-related statements may be based on standards for measuring progress that are still developing, internal controls and processes that continue to evolve, and assumptions that are subject to change in the future. Material differences between actual results and any future performance suggested in our forward-looking statements could result from a variety of factors, including the following:
•general economic, political or regulatory developments, including inflation, tariffs, interest rates, changes in governmental policies relating to refined petroleum products, crude oil, natural gas, NGLs, renewable diesel and other renewable fuels or taxation;
•the ability of MPC to achieve its strategic objectives and the effects of those strategic decisions on us;
•further impairments;
•negative capital market conditions, including an increase of the current yield on common units;
•the ability to achieve strategic and financial objectives, including with respect to distribution coverage, future distribution levels, proposed projects and completed transactions;
•the success of MPC’s portfolio optimization, including the ability to complete any divestitures on commercially reasonable terms and/or within the expected timeframe, and the effects of any such divestitures on our business, financial condition, results of operations and cash flows;
•consumer demand for refined products, natural gas, renewable diesel and other renewable fuels and NGLs;
•the adequacy of capital resources and liquidity, including the availability of sufficient cash flow to pay distributions and access to debt on commercially reasonable terms, and the ability to successfully execute business plans, growth strategies and self-funding models;
•the timing and extent of changes in commodity prices and demand for crude oil, refined products, feedstocks or other hydrocarbon-based products or renewable diesel and other renewable fuels;
•volatility in or degradation of general economic, market, industry or business conditions, including as a result of pandemics, other infectious disease outbreaks, natural hazards, extreme weather events, regional conflicts such as hostilities in the Middle East and Ukraine, inflation or rising interest rates;
•changes to the expected construction costs and timing of projects and planned investments, and the ability to obtain regulatory and other approvals with respect thereto;
•the inability or failure of our joint venture partners to fund their share of operations and capital investments;
•the financing and distribution decisions of joint ventures we do not control;
•the availability of desirable strategic alternatives to optimize portfolio assets and our ability to obtain regulatory and other approvals with respect thereto;
•completion of midstream infrastructure by competitors;
•disruptions due to equipment interruption or failure, including electrical shortages and power grid failures;
•the suspension, reduction or termination of MPC’s obligations under MPLX’s commercial agreements;
•modifications to financial policies, capital budgets, and earnings and distributions;
•the ability to manage disruptions in credit markets or changes to credit ratings;
•our ability to comply with federal and state environmental, economic, health and safety, energy and other policies and regulations or enforcement actions initiated thereunder;
•adverse results in litigation;
•the effect of restructuring or reorganization of business components;
•the potential effects of changes in tariff rates on our business, financial condition, results of operations and cash flows;
•foreign imports and exports of crude oil, refined products, natural gas and NGLs;
•the establishment or increase of tariffs on goods, including crude oil and other feedstocks imported into the United States, other trade protection measures or restrictions or retaliatory actions from foreign governments;
•changes in producer customers’ drilling plans or in volumes of throughput of crude oil, natural gas, NGLs, refined products, other hydrocarbon-based products or renewable diesel and other renewable fuels;
•changes in the cost or availability of third-party vessels, pipelines, railcars and other means of transportation for crude oil, natural gas, NGLs, feedstocks, refined products or renewable diesel and other renewable fuels;
•the price, availability and acceptance of alternative fuels and alternative-fuel vehicles and laws mandating such fuels or vehicles;
•actions taken by our competitors, including pricing adjustments and the expansion and retirement of pipeline capacity, processing, fractionation and treating facilities in response to market conditions;
•expectations regarding joint venture arrangements and other acquisitions or divestitures of assets;
•midstream and refining industry overcapacity or undercapacity;
•industrial incidents or other unscheduled shutdowns affecting our machinery, pipelines, processing, fractionation and treating facilities or equipment, means of transportation, or those of our suppliers or customers;
•acts of war, terrorism or civil unrest that could impair our ability to gather, process, fractionate or transport crude oil, natural gas, NGLs, refined products or renewable diesel and other renewable fuels;
•labor and material shortages;
•the timing and ability to obtain necessary regulatory approvals and permits and to satisfy other conditions necessary to complete planned projects or to consummate planned transactions within the expected timeframe, if at all;
•political pressure and influence of environmental groups and other stakeholders that are adverse to the production, gathering, refining, processing, fractionation, transportation and marketing of crude oil or other feedstocks, refined products, natural gas, NGLs, other hydrocarbon-based products or renewable diesel and other renewable fuels;
•the imposition of windfall profit taxes, maximum margin penalties or minimum inventory requirements on companies operating in the energy industry in California or other jurisdictions;
•our ability to successfully implement our sustainable energy strategy and principles and achieve our ESG goals and targets within the expected timeframe, if at all; and
•the other factors described in Item 1A. Risk Factors.
We undertake no obligation to update any forward-looking statements except to the extent required by applicable law.
PART I
Item 1. Business
OVERVIEW
We are a diversified, large-cap master limited partnership formed by MPC in 2012 (as our sponsor) that owns and operates midstream energy infrastructure and logistics assets, and provides fuels distribution services. Our assets include a network of crude oil and refined product pipelines; an inland marine business; light-product, asphalt, heavy oil and marine terminals; storage caverns; refinery tanks, docks, loading racks, and associated piping; crude oil and natural gas gathering systems and pipelines; as well as natural gas and NGL processing and fractionation facilities. Our assets are positioned throughout the United States. The business consists of two segments based on the product-based value chain each supports: Crude Oil and Products Logistics and Natural Gas and NGL Services. The Crude Oil and Products Logistics segment primarily engages in the gathering, transportation, storage and distribution of crude oil, refined products, other hydrocarbon-based products, and renewables. The Crude Oil and Products Logistics segment also includes the operation of our refining logistics, fuels distribution and inland marine businesses, terminals, rail facilities and storage caverns. The Natural Gas and NGL Services segment provides wellhead to market services including gathering, processing and transportation of natural gas and NGLs. For more information on these segments, see Our Operating Segments discussion below. The map below and Item 2. Properties provide information about our assets as of December 31, 2024:

We continue to have a strategic relationship with MPC, which is a large source of our revenues. We have executed numerous long-term, fee-based agreements with minimum volume commitments with MPC which provide us with a stable and predictable revenue stream and source of cash flows. As of December 31, 2024, MPC owned our general partner and approximately 64 percent of our outstanding common units. In 2024, MPC accounted for 49 percent of our total revenues and other income, primarily within our Crude Oil and Products Logistics segment, and will continue to be an important source of our revenues and cash flows for the foreseeable future. We also have long-term relationships with a diverse set of producer customers in many crude oil and natural gas resource plays, including the Marcellus Shale, Permian Basin, Utica Shale, STACK Shale and Bakken Shale, among others.
PRIORITIES AND COMMITMENTS
Commitment to Safety, Reliability and Sustainability
We remain steadfast in our commitment to safely and reliably operate our assets and protect the health and safety of those that operate them. We are focused on sustainable structural changes to improve our cost competitiveness while maintaining safe and reliable operations. Our approach to sustainability spans the environmental, social and governance dimensions of our business. This means strengthening resiliency by lowering carbon intensity and conserving natural resources; innovating for the future by
investing in emerging technologies; and embedding sustainability in decision-making and in how we engage our people and many stakeholders.
Commitment to Durable Cash Flow Growth
We are focused on growing our fee-based services through long-term contracts, which provide through-cycle cash flow stability. We also challenge ourselves to be disciplined in our capital spending as we look to effectively deploy capital to grow our business and its cash flows. We look to optimize our portfolio of investment opportunities to ensure efficient deployment of capital focusing on projects with the highest returns.
Commitment to Cost Competitiveness
We are committed to achieving operational excellence by reducing costs, improving efficiency, driving operational improvements and being disciplined in capital allocation. This means lowering our costs in all aspects of our business and challenging ourselves to be disciplined in every dollar we spend across our organization.
Commitment to Return Capital to Unitholders
We are committed to generating cash flows in excess of both our capital spending and our distributions, while maintaining a strong balance sheet. With our commitment to strict-capital discipline and cost competitiveness, we expect to continue generating strong cash flow, enhancing our financial flexibility to invest in and grow the business, while also supporting the return of capital to MPLX unitholders.
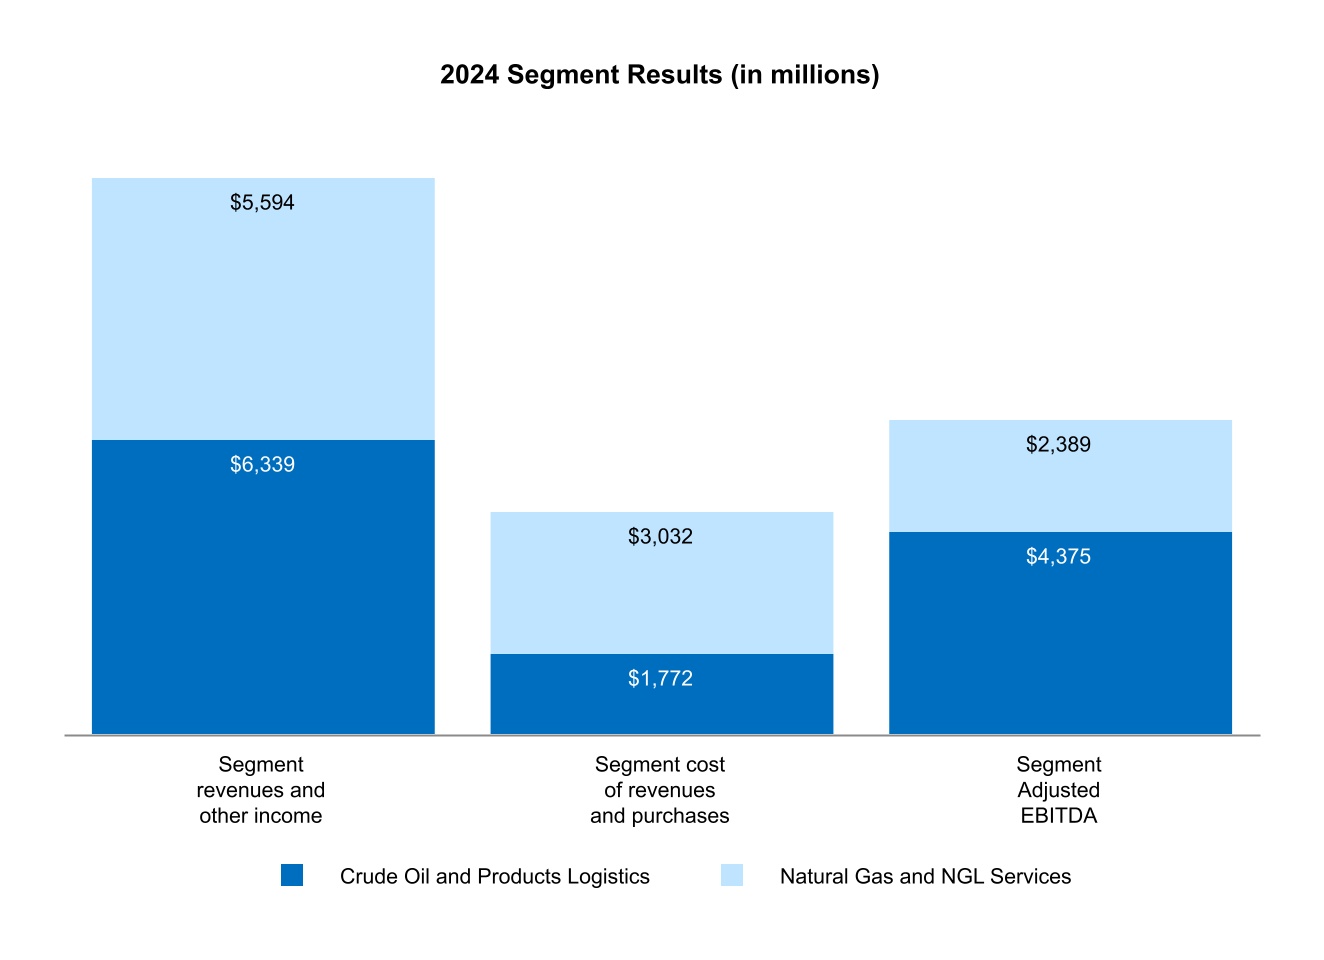
2024 RESULTS
The following table summarizes the operating performance for each segment for the year ended December 31, 2024. We renamed and modified the composition of our segments in the fourth quarter of 2024. The segment realignment is presented for the year ended December 31, 2024, with prior periods recast for comparability. For further discussion of our segments and a reconciliation of Non-GAAP measures to our Consolidated Statements of Income, see Item 7. Management’s Discussion and Analysis of Financial Condition and Results of Operations as well as Item 8. Financial Statements and Supplementary Data – Note 10.
RECENT DEVELOPMENTS
•On January 22, 2025, we announced that the board of directors of our general partner declared a distribution of $0.9565 per common unit that was paid on February 14, 2025 to common unitholders of record on February 3, 2025.
•We announced the expansion of MPLX’s Permian to Gulf Coast integrated value chain, with projects to construct a Gulf Coast fractionation complex consisting of two,150 mbpd fractionation facilities adjacent to MPC’s Galveston Bay refinery. The facilities are expected to be in service in 2028 and 2029.
•Additionally, we announced the formation of strategic joint ventures to develop a complimentary 400 mbpd LPG export terminal and an associated pipeline, which is anticipated to be in service in 2028.
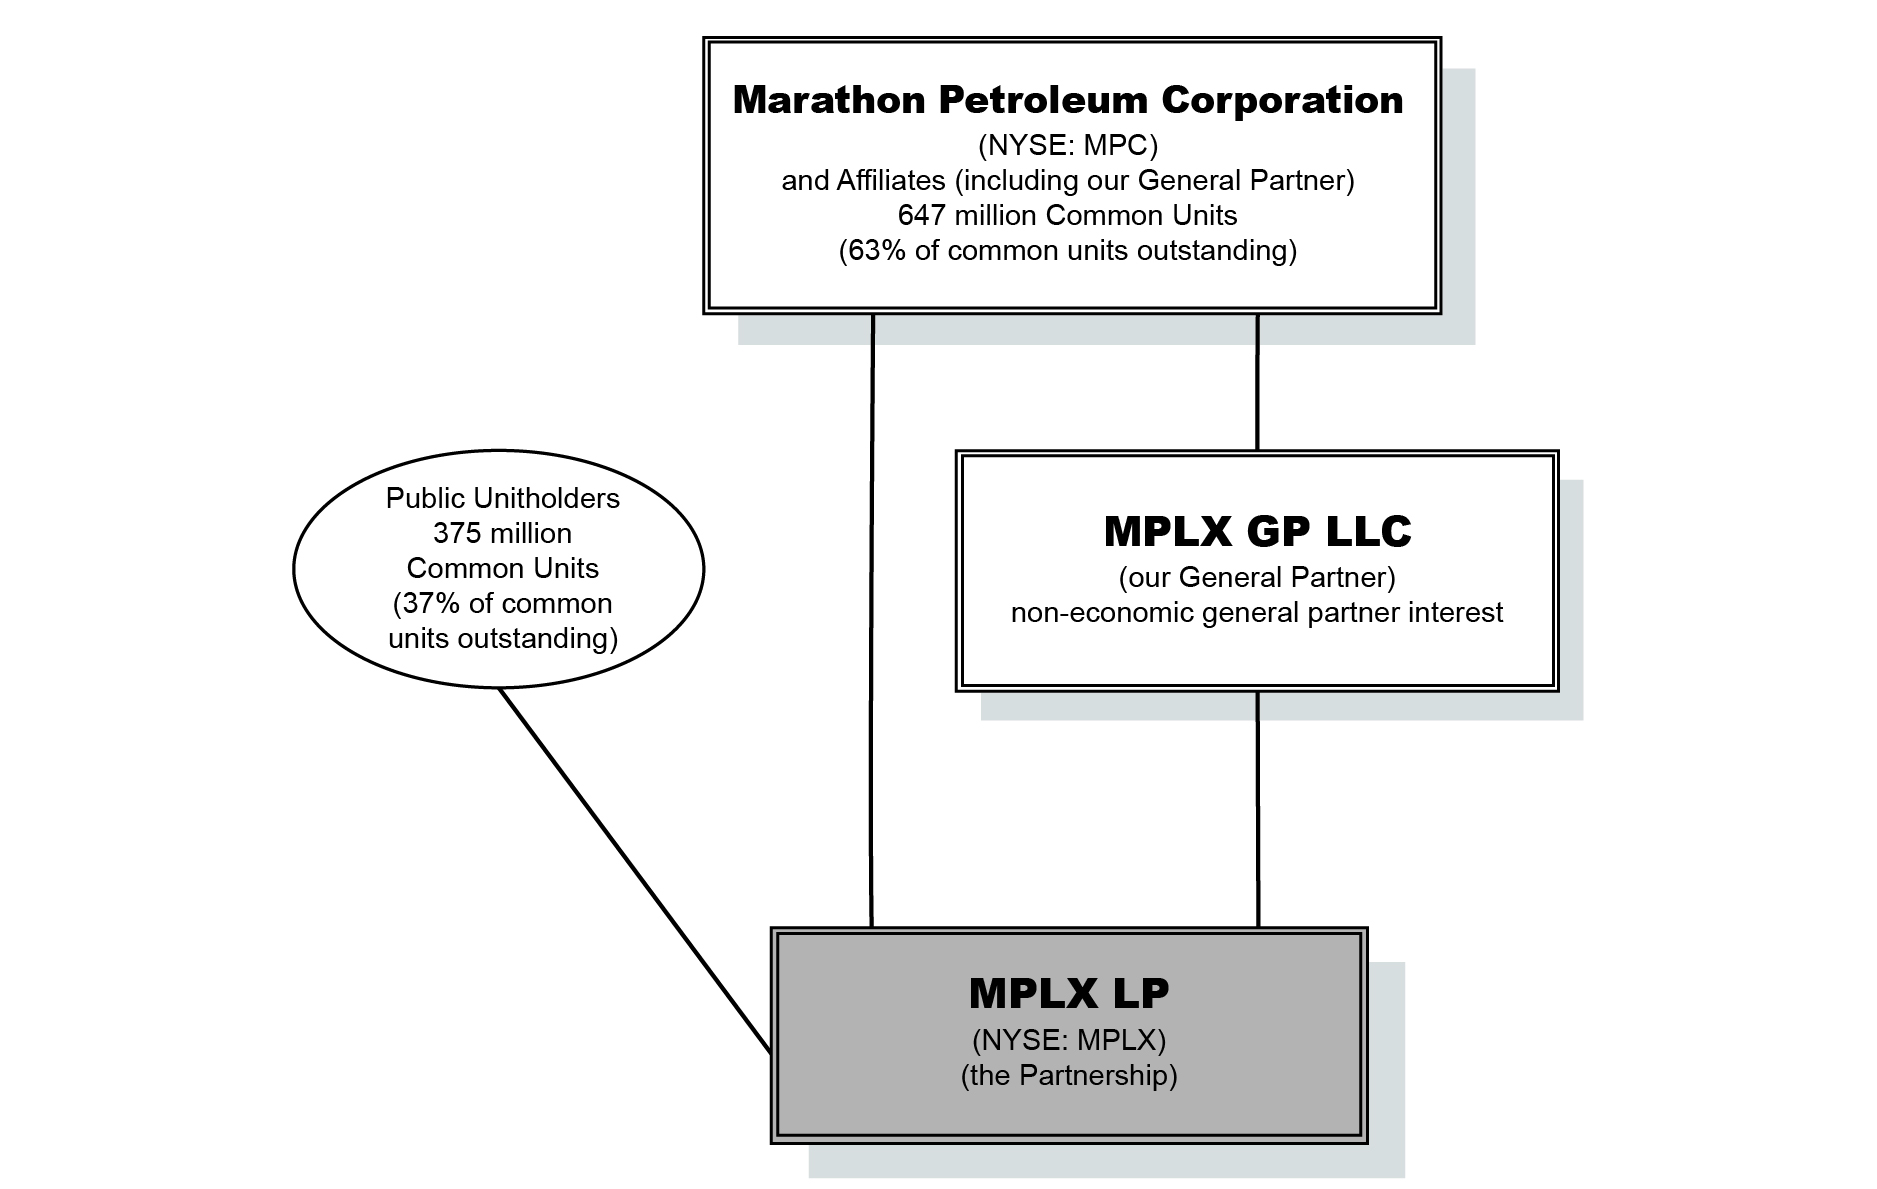
ORGANIZATIONAL STRUCTURE
We are a Master Limited Partnership (“MLP”) with outstanding common units held by MPC and public unitholders as well as preferred units. Our common units are publicly traded on the NYSE under the symbol “MPLX.” On February 11, 2025, MPLX exercised its right to convert the remaining 6 million outstanding Series A preferred units into common units.
The following diagram depicts our organizational structure and MPC’s ownership interest in us as of February 21, 2025.
INDUSTRY OVERVIEW
As of December 31, 2024, our diversified services in the midstream sector broken down by our segments are as follows:
Crude Oil and Products Logistics:
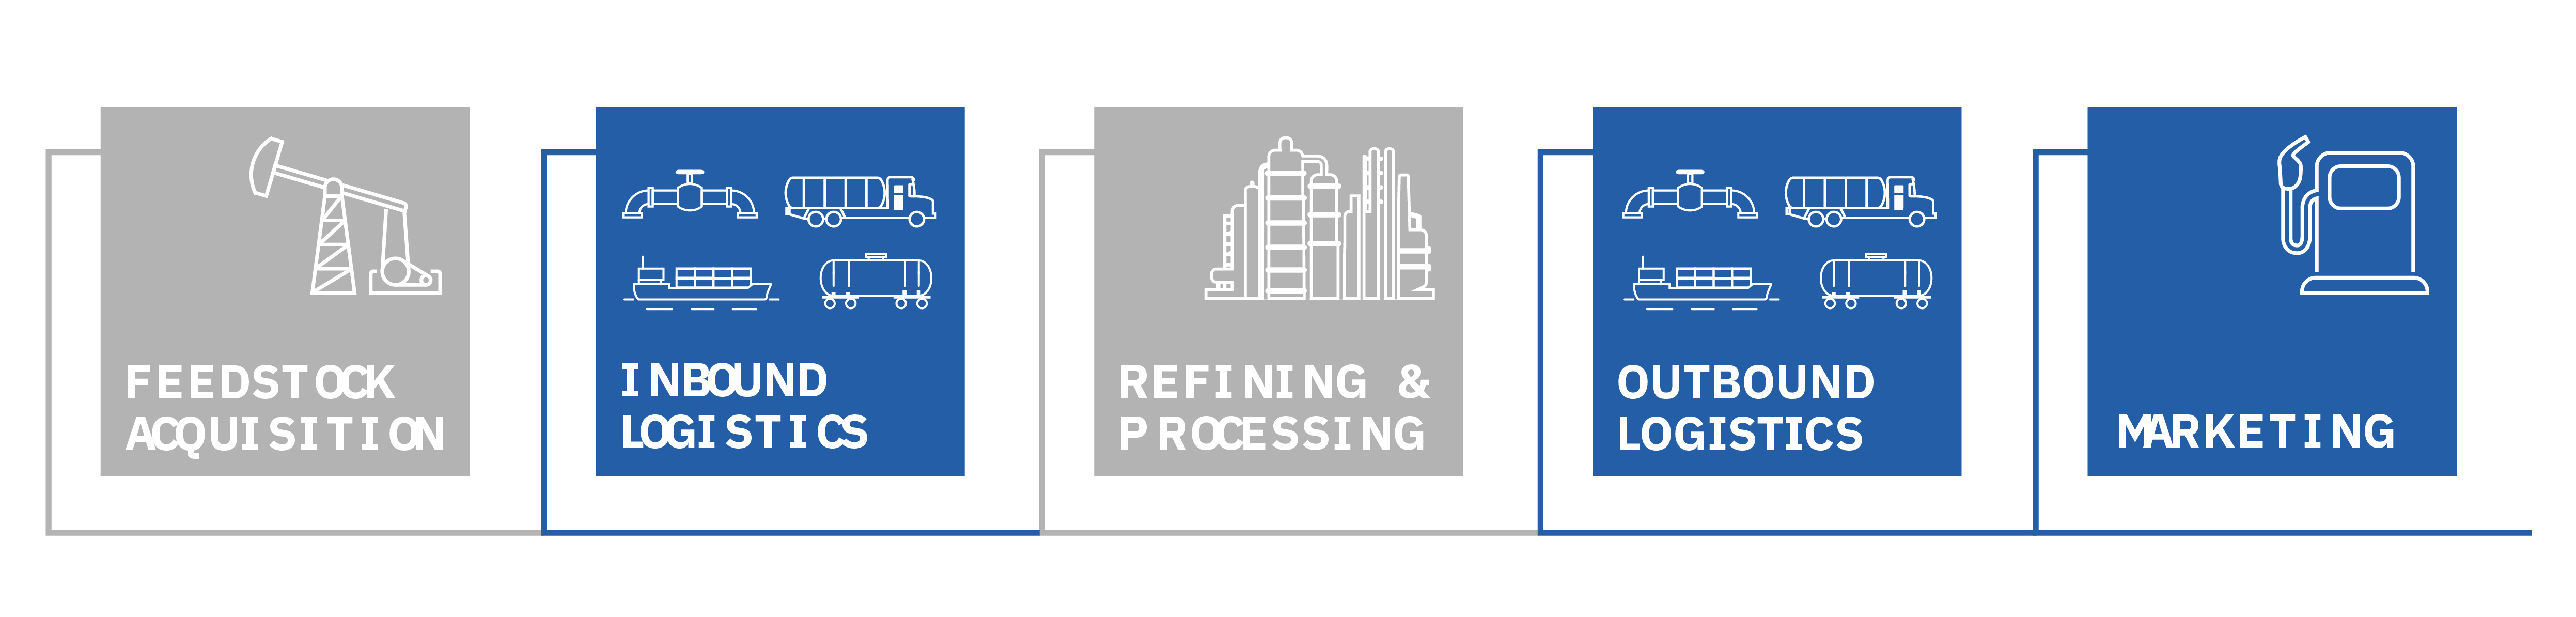
The midstream sector plays a crucial role in the oil and gas industry by providing gathering, transportation, terminalling, storage and marketing services as depicted in blue below.
Crude oil is the primary raw material for transportation fuels and the basis for many products, including plastics, petrochemicals and heating oil for homes. Pipelines bring advantaged North American crude oil from the upper Great Plains, Louisiana, Texas, Canada and West Coast to numerous refineries throughout the United States. Terminals provide for the receipt, storage, blending, additization, handling and redelivery of refined products via pipeline, rail, marine and truck transportation. This network of logistics infrastructure also allows for export opportunities by connecting supply to global demand markets. The hydrocarbon market is often volatile and the ability to take advantage of fast-moving market conditions is enhanced by the ability to store crude oil, refined products, other hydrocarbon-based products and renewables at tank farms and caverns. The ability to store various products provides flexibility and logistics optionality which allows participants within the industry to take advantage of changing market conditions.
Natural Gas and NGL Services:
The midstream natural gas industry is the link between the exploration for, and production of, natural gas and the delivery of its hydrocarbon components to end-use markets, as graphically depicted in blue and further described below:
•Gathering. The natural gas production process begins with the drilling of wells into gas-bearing rock formations. At the initial stages of the midstream value chain, our network of pipelines known, as gathering systems, directly connect to wellheads in the production area. Our gathering systems then transport raw, or untreated, natural gas to a central location for treating and processing.
•Processing. Natural gas has a widely varying composition depending on the field, formation reservoir or facility from which it is produced. Our natural gas processing complexes remove the heavier and more valuable hydrocarbon components, which are extracted as a mixed NGL stream that includes ethane, propane, butanes and natural gasoline (also referred to as “y-grade”). Processing aids in allowing the residue gas remaining after extraction of NGLs to meet the quality specifications for long-haul pipeline transportation and commercial use.
•Fractionation. Fractionation is the further separation of the mixture of extracted NGLs into individual components for end-use sale. Fractionation systems typically exist either as an integral part of a gas processing plant or as a central fractionator.
•Storage, transportation and marketing. Once the raw natural gas has been treated or processed and the raw NGL mix has been fractionated into individual NGL components, the natural gas is delivered to downstream transmission pipelines and NGL components are stored, transported and marketed to end-use markets.
Due to advances in well completion technology and horizontal drilling techniques, unconventional sources, such as shale and tight sand formations, have become a source of current and expected future natural gas production. The industry as a whole is characterized by regional competition, based on the proximity of gathering systems and processing/fractionation plants to producing natural gas wells, or to facilities that produce natural gas as a byproduct of refining crude oil. Due to the shift in the source of natural gas production, midstream providers with a significant presence in the shale plays will likely have a competitive advantage. Well-positioned operations allow access to all major NGL markets and provide for the development of export solutions for producers. This proximity is enhanced by infrastructure build-out and pipeline projects.
OUR OPERATING SEGMENTS
In the fourth quarter of 2024, we renamed and modified the composition of our segments to better reflect the product-based value chains and growth strategy of MPLX's operations. The primary changes were to rename the Logistics and Storage segment to the Crude Oil and Products Logistics segment and to rename the Gathering and Processing segment to the Natural Gas and NGL Services segment. In addition, we reclassified certain equity method investments serving natural gas and NGL customers from Crude Oil and Products Logistics to Natural Gas and NGL Services. The segment realignment is presented for the year ended December 31, 2024, with prior periods recast for comparability. Each of these segments is organized and managed based upon the product-based value chain each supports.
Crude Oil and Products Logistics:
The Crude Oil and Products Logistics segment includes the gathering, transportation, storage and distribution of crude oil, refined products, other hydrocarbon-based products and renewables. These assets consist of a network of 14,766 miles of wholly and jointly-owned pipelines and associated storage assets, refining logistics assets at 13 refineries, 88 terminals including rail and truck racks, one export terminal, storage caverns, tank farm assets, an inland marine business and a fuels distribution business. For information related to our Crude Oil and Products Logistics assets, please see Item 2. Properties - Crude Oil and Products Logistics. Our Crude Oil and Products Logistics assets are integral to the success of MPC’s operations. We continue to evaluate projects and opportunities that will further enhance our existing operations and provide valuable services to MPC and third parties.
We generate revenue in the Crude Oil and Products Logistics segment primarily by charging tariffs for gathering and transporting crude oil, refined products, other hydrocarbon-based products and renewables through our pipelines and at our barge docks delivering to domestic and international destinations, and fees for storing crude oil, refined products and renewables at our storage facilities. Our marine business generates revenue under a fee-for-capacity contract with MPC. Our fuels distribution business provides services related to the scheduling and marketing of products on behalf of MPC, for which it generates revenue based on the volume of MPC’s products sold each month. We are also the operator of additional crude oil and refined product pipelines either owned by MPC, or in which MPLX or MPC has an ownership interest, for which we are paid operating fees. For the year ended December 31, 2024, approximately 88 percent of Crude Oil and Products Logistics segment revenues and other income was generated from MPC.
Natural Gas and NGL Services:
The Natural Gas and NGL Services segment gathers, processes and transports natural gas; and transports, fractionates, stores and markets NGLs. As of December 31, 2024, gathering and processing assets available to MPLX included approximately 10.2 Bcf/d of gas gathering capacity, 12.4 Bcf/d of natural gas processing capacity and 829 mbpd of fractionation and de-ethanization capacity. MPLX also owns or operates approximately 1,045 miles of NGL pipelines. For a summary of our gas processing facilities, fractionation facilities, natural gas gathering systems and NGL and natural gas pipelines see Item 2. Properties - Natural Gas and NGL Services.
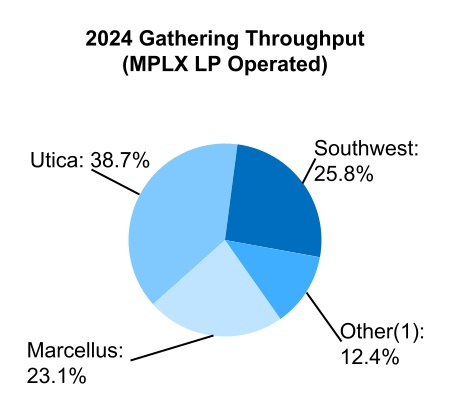
Revenue from the sale of products purchased after services are provided is reported as Product sales on the Consolidated Statements of Income and recognized on a gross basis, as MPLX takes control of the product and is the principal in the transaction. For the year ended December 31, 2024, revenues with one customer primarily related to these NGL transactions in the Southwest region accounted for approximately 16 percent of Natural Gas and NGL Services segment revenues. Revenues earned from two customers within the Marcellus region were also significant to the segment; however, neither of these customers represented more than 15 percent of Natural Gas and NGL Services segment revenues. These customers were not significant to MPLX consolidated revenues.
For further financial information regarding our segments, see Item 7. Management’s Discussion and Analysis of Financial Condition and Results of Operations and Item 8. Financial Statements and Supplementary Data included in this Annual Report on Form 10-K.
OUR RELATIONSHIP WITH MPC
One of our competitive strengths is our strategic relationship with MPC, which operates one of the largest refining systems in the United States in terms of refining capacity. MPC owns and operates 13 refineries in the Gulf Coast, Mid-Continent and West Coast regions of the United States and distributes refined products, including renewable diesel, through transportation, storage, distribution and marketing services provided primarily by MPLX.
MPC retains a significant interest in us through its non-economic ownership of our general partner and held approximately 64 percent of the outstanding common units of MPLX as of December 31, 2024. Given MPC’s significant interest in us, we believe MPC will promote and support the successful execution of our business strategies. We have implemented and continue to pursue growth and integration opportunities along the existing product-based value chains that benefit both MPC and MPLX, demonstrated by the recently announced expansion of the Permian to Gulf Coast integrated value chain, which includes projects to construct a fractionation complex and LPG export terminal adjacent to MPC’s Galveston Bay refinery.
OUR CRUDE OIL AND PRODUCTS LOGISTICS CONTRACTS WITH MPC AND THIRD PARTIES
Transportation Services Agreements, Storage Services Agreements, Terminal Services Agreements and Fuels Distribution Services Agreement with MPC
Our Crude Oil and Products Logistics assets are strategically located within, and integral to, MPC’s operations. We have entered into multiple transportation, terminal and storage services agreements with MPC. Under these long-term, fee-based agreements, we provide transportation, terminal and storage services to MPC and most of these agreements include minimum committed volumes from MPC. Under the marine transportation service agreements MPC has committed to pay a fixed fee for 100 percent of available capacity for boats, barges and third-party chartered equipment. We also have a fuels distribution agreement with MPC under which we provide scheduling and other services for MPC’s products.
The following table sets forth additional information regarding our transportation, storage, terminal and fuels distribution services agreements with MPC as expected to be in effect throughout 2025:
| | | | | | | | | | | | | | | | |
| Agreement | | | | Initial Term (years) | | MPC minimum
commitment |
| Transportation Services (mbpd): | | | | | | |
Crude pipelines(1) | | | | 4 - 10 | | 1,904 | |
Refined product pipelines(2) | | | | 1 - 15 | | 1,595 | |
Marine(3) | | | | 5 - 6 | | N/A |
| Storage Services (mbbls): | | | | | | |
| | | | | | |
| | | | | | |
| | | | | | |
Tank Farms(4) | | | | 2 - 12 | | 132,649 | |
Caverns(5) | | | | 10 - 17 | | 3,632 | |
Terminal Services(6) (mbpd) | | | | Various | | 2,244 | |
Fuels Distribution Services(7) (millions of gallons per year) | | | | 10 | | 23,449 | |
(1) Renewal terms include multiple two to five-year terms.
(2) Renewal terms include multiple one to five-year terms.
(3) MPC has committed to utilize 100 percent of our available capacity of boats and barges. These agreements are each subject to one remaining renewal period of five years.
(4) Volume shown represents total shell capacity available for MPC’s use and includes refining logistics tanks. Renewal terms vary and range from year-to-year to multiple additional five-year terms.
(5) Renewal terms include multiple four to five-year terms. Volume shown represents total shell capacity.
(6) Renewal terms vary and range from month-to-month to two additional five-year terms.
(7) The contract initiated in February 2018 and includes one additional five-year renewal term.
Under transportation services agreements containing minimum volume commitments, if MPC fails to transport its minimum throughput volumes during any period, then MPC will pay us a deficiency payment equal to the volume of the deficiency multiplied by the tariff rate then in effect. Under certain transportation services agreements, the amount of any deficiency payment paid by MPC may be applied as a credit for any volumes transported on the applicable pipeline in excess of MPC’s minimum volume commitment during a limited number of succeeding periods, after which time any unused credits will expire.
Under most of our terminal services agreements, if MPC fails to meet its minimum volume commitment during any period, then MPC will pay us a deficiency payment equal to the volume of the deficiency multiplied by the contractual fee then in effect. Some of our terminal services agreements contain minimum commitments for various additional services such as storage and blending.
We have numerous storage services agreements governing storage services at various types of facilities including terminals, pipeline tank farms, caverns and refineries, under which MPC pays MPLX per-barrel fees for providing storage services. Some of these agreements provide MPC with exclusive access to storage at certain locations, such as storage located at MPC’s refineries or storage in certain caverns. Under these agreements, MPC pays MPLX a per-barrel fee for such storage capacity, regardless of whether MPC fully utilizes the available capacity.
Through our fuels distribution services, we distribute refined products through an extensive network of retail locations owned or operated by independent entrepreneurs. We have a fuels distribution service agreement with MPC under which MPC pays MPLX a tiered monthly fee based on the volume of MPC’s products marketed by MPLX each month, subject to a maximum annual volume. MPLX has agreed to use commercially reasonable efforts to sell not less than a minimum quarterly volume of MPC’s products during each calendar quarter. If MPLX sells less than the minimum quarterly volume of MPC’s products during any calendar quarter despite its commercially reasonable efforts, MPC will pay MPLX a deficiency payment equal to the volume deficiency multiplied by the applicable tiered fee. The dollar amount of actual sales volume of MPC’s products that exceeds the minimum quarterly volume (an “Excess Sale”) for a particular quarter will be applied as a credit, on a first-in-first-out basis, against any future deficiency payment owed by MPC to MPLX during the four calendar quarters immediately following the calendar quarter in which the Excess Sale occurs.
Our agreements with MPC provide for annual escalations that are either fixed or based on a variety of factors including the FERC index and various other inflation-based indexes depending on the nature and geography of the services provided.
Pipeline Operating Agreements with MPC
We operate various pipelines owned by MPC, under operating services agreements. Under these operating services agreements, we receive an operating fee for operating the assets, which include certain MPC wholly owned or partially owned crude oil, natural gas and refined product pipelines, and for providing various operational services with respect to those assets. We are generally reimbursed for all direct and indirect costs associated with operating the assets and providing such operational services. These agreements vary in length and automatically renew with most agreements being indexed for inflation.
Other Pipeline Operating Agreements
We maintain and operate five pipelines in which either MPC or MPLX has a joint interest. We receive an operating fee for each of these pipelines, which is subject to adjustment for inflation. In addition, we are reimbursed for specific costs associated with operating each pipeline. The length and renewal terms for each agreement vary.
Transportation, Terminal and Storage Services Agreements with Third Parties
We have multiple transportation and terminal services agreements with third parties under which we provide use of pipelines and tank storage, and provide services, facilities and other infrastructure related to the receipt, storage, throughput, blending and delivery of commodities. Some of these agreements contain minimum volume commitments under which we agree to handle a certain amount of product throughput each month in exchange for a predetermined fixed fee. Under the remaining agreements, we receive an agreed-upon fee based on actual product throughput following the completion of services.
Marine Management Services Agreements with MPC
MPLX has an agreement with MPC under which it provides management services to assist MPC in the oversight and management of the marine business. MPLX receives fixed annual fees for providing the required services, which are subject to predetermined annual escalation rates. This agreement is subject to an initial term of five years and automatically renews for one additional five-year renewal period unless terminated by either party.
Other Agreements with MPC
We have omnibus agreements with MPC that address our payment of a fixed annual fee to MPC for the provision of executive management services by certain executive officers of our general partner and our reimbursement to MPC for the provision of certain services to us, as well as MPC’s indemnification of us for certain matters, including certain environmental, title and tax matters. In addition, we indemnify MPC for certain matters under these agreements. The omnibus agreements also provide for other reimbursements, including certain capital and expense projects.
We also have various employee services agreements and a secondment agreement under which we reimburse MPC for the provision of certain operational and management services to us. All of the employees that conduct our business are directly employed by affiliates of our general partner.
Additionally, we have certain indemnification agreements with MPC under which MPC retains responsibility for remediation of environmental liabilities due to the use or operation of the assets prior to our ownership, and indemnifies us for any losses we incurred arising out of those remediation obligations.
OUR NATURAL GAS AND NGL SERVICES CONTRACTS WITH MPC AND THIRD PARTIES
The majority of our revenues in the Natural Gas and NGL Services segment are generated from wellhead to market services, including natural gas gathering, transportation and processing; and NGL transportation, fractionation, marketing and storage. MPLX enters into a variety of contract types including fee-based, percent-of-proceeds, keep-whole and purchase arrangements in order to generate revenues. See Item 8. Financial Statements and Supplementary Data - Note 2 for a further description of these different types of arrangements.
In many cases, MPLX provides services under contracts that contain a combination of more than one of the arrangements described above. The terms of MPLX’s contracts vary based on gas quality conditions, the competitive environment when the
contracts are signed and customer requirements. In addition, minimum volume commitments may create contract liabilities or deferred credits if current period payments can be used for future services. These are recognized into service revenue in instances where it is probable the customer will not use the credit in future periods.
MPLX’s contract mix and exposure to natural gas and NGL prices may change as a result of changes in producer preferences, MPLX expansion in regions where some types of contracts are more common and other market factors, including current market and financial conditions which have increased the risk of volatility in crude oil, natural gas and NGL prices. Any change in mix may influence our long-term financial results.
Keep-whole Agreement with MPC
MPLX has a keep-whole commodity agreement related to our Rockies operations with MPC. Under the agreement, MPC pays us a processing fee for NGLs related to keep-whole agreements and we pay MPC a marketing fee in exchange for assuming the commodity risk. The pricing structure under this agreement provides for a base volume subject to a base rate and incremental volumes subject to variable rates, which are calculated with reference to certain of our costs incurred as processor of the volumes. The pricing for both the base and incremental volumes is subject to revision each year. This agreement is scheduled to expire in 2025.
Other Service Agreements
We provide general and administrative services for many of our operated joint ventures under services agreements. Under these services agreements, MPLX receives a management fee, indexed for inflation, for the general and administrative services provided by the Partnership necessary to manage, maintain and report the operating results of the joint ventures’ assets, including natural gas processing plants, natural gas gathering pipelines, natural gas liquids pipelines, fractionation facilities, compressors and related equipment. These service agreements also provide for set fees related to engineering and construction services related to capital projects. These agreements generally remain in force as long as MPLX is the operator of the joint venture.
COMPETITION
Within our Crude Oil and Products Logistics segment, our competition primarily comes from independent terminal and pipeline companies, integrated petroleum companies, refining and marketing companies, distribution companies with marketing and trading arms and from other wholesale petroleum products distributors. Competition in any particular geographic area is affected significantly by the volume of products produced by refineries in the area, and in areas where no refinery is present, by the availability of products and the cost of transportation to the area from other locations. Competition for oil supplies is based primarily on the price and scope of services, location of the facility and connectivity to the best priced markets.
As a result of our contractual relationship with MPC under our transportation and storage services agreements, our terminal services agreement, our fuels distribution agreement and our physical asset connections to MPC’s refineries and terminals, we believe that MPC will continue to utilize our assets for transportation, storage, distribution and marketing services. If MPC’s customers reduce their purchases of refined products from MPC due to increased availability of less expensive refined product from other suppliers or for other reasons, MPC may only receive or deliver the minimum volumes through our terminals (or pay the shortfall payment if it does not deliver the minimum volumes), which could decrease our revenues.
In our Natural Gas and NGL Services segment, we face competition for natural gas gathering and in obtaining natural gas supplies for our processing and related services; in obtaining unprocessed NGLs for transportation and fractionation; and in marketing our products and services. Competition for natural gas supplies is based primarily on the location of gas gathering systems and gas processing plants, operating efficiency and reliability, residue gas and NGL market connectivity, the ability to obtain a satisfactory price for products recovered and the fees charged for services supplied to the customer. Competitive factors affecting our fractionation services include availability of fractionation capacity, proximity to supply and industry marketing centers, the fees charged for fractionation services and operating efficiency and reliability of service. Competition for customers to purchase our natural gas and NGLs is based primarily on price, credit and market connectivity.
Our Natural Gas and NGL Services competitors include:
•natural gas midstream providers, of varying financial resources and experience, that gather, transport, process, fractionate, store and market natural gas and NGLs;
•major integrated oil companies and refineries;
•independent exploration and production companies;
•interstate and intrastate pipelines; and
•other marine and land-based transporters of natural gas and NGLs.
Certain competitors, such as major oil and gas and pipeline companies, may have capital resources and contracted supplies of natural gas substantially greater than ours. Smaller local distributors may have a marketing advantage in their immediate service areas.
We believe that our customer focus, demonstrated by our ability to offer an integrated package of services and our flexibility in considering various types of contractual arrangements, allows us to compete more effectively. This includes having access to both NGL and natural gas markets to allow for flexibility in our gathering and processing in addition to having critical connections to a strong sponsor and key market outlets for NGLs and natural gas. Our strategic gathering and processing agreements with key producers enhances our competitive position to participate in the further development of our resource plays. The strategic location of our assets, including those connected to MPC, and the long-term nature of many of our contracts also provide a significant competitive advantage.
INSURANCE
Our assets may experience physical damage as a result of an accident or natural disaster. These hazards can also cause personal injury and loss of life, severe damage to and destruction of property and equipment, pollution or environmental damage and business interruption. We are insured under MPC and other third-party insurance policies. The MPC policies are subject to a shared retention.
SEASONALITY
The volume of crude oil and refined products transported and stored utilizing our assets is affected by the level of supply and demand for crude oil and refined products in the markets served directly or indirectly by our assets. The majority of the effects of seasonality on the Crude Oil and Products Logistics segment’s revenues are mitigated through the use of capacity-based agreements and minimum volume commitments.
In our Natural Gas and NGL Services segment, we experience minimal impacts from seasonal fluctuations, which impact the demand for natural gas and NGLs and the related commodity prices caused by various factors including variations in weather patterns from year to year. Overall, our exposure to the seasonality fluctuations is limited due to the nature of our fee-based business.
REGULATORY MATTERS
Our operations are subject to numerous laws and regulations, including those relating to the protection of the environment. Such laws and regulations include, among others, the Interstate Commerce Act (“ICA”), the Natural Gas Act (“NGA”), the Clean Water Act (“CWA”) with respect to water discharges, the Clean Air Act (“CAA”) with respect to air emissions, the Resource Conservation and Recovery Act (“RCRA”) with respect to solid and hazardous waste treatment, storage and disposal, the Comprehensive Environmental Response, Compensation, and Liability Act (“CERCLA”) with respect to releases and remediation of hazardous substances and the Oil Pollution Act of 1990 (“OPA-90”) with respect to oil pollution and response. In addition, many states where we operate have similar laws. New laws are being enacted and regulations are being adopted on a continuing basis, and the costs of compliance with such new laws and regulations are very difficult to estimate until finalized.
For a discussion of environmental capital expenditures and costs of compliance, see Item 7. Management’s Discussion and Analysis of Financial Condition and Results of Operations - Environmental Matters and Compliance Costs. For additional information regarding regulatory risks, see Item 1A. Risk Factors.
Pipeline Regulations
Liquids Pipelines
Some of our existing pipelines are considered interstate common carrier pipelines subject to regulation by the FERC under the ICA, Energy Policy Act of 1992 (“EPAct 1992”) and the rules and regulations promulgated under those laws. The ICA and FERC regulations require that tariff rates for oil pipelines, a category that includes crude oil and petroleum product pipelines, be just and reasonable and the terms and conditions of service must not be unduly discriminatory. The ICA permits interested persons to challenge newly proposed tariff rates or terms and conditions of service, or any change to tariff rates or terms and conditions of service, and authorizes FERC to suspend the effectiveness of such proposal or change for a period of time to investigate. If, upon completion of an investigation, FERC finds that the new or changed service or rate is unlawful, it is authorized to require the carrier to refund the revenues in excess of the prior tariff collected during the pendency of the investigation. An interested person may also challenge existing terms and conditions of service or rates and FERC may order a carrier to change its terms and conditions of service or rates prospectively. Upon an appropriate showing, a shipper may also obtain reparations, from a pipeline, for damages sustained as a result of rates or terms which FERC deemed were not just and reasonable. Such reparation damages may accrue from the complaint through the final order and during the two years prior to the filing of a complaint.
EPAct 1992 deemed certain interstate petroleum pipeline rates then in effect to be just and reasonable under the ICA. These rates are commonly referred to as “grandfathered rates.” Our rates for interstate transportation service in effect for the 365-day period ending on the date of the passage of EPAct 1992 were deemed just and reasonable and therefore are grandfathered. Subsequent changes to those rates are not grandfathered. New rates have since been established after EPAct 1992 for certain pipelines, and certain of our pipelines have subsequently been approved to charge market-based rates.
FERC permits regulated oil pipelines to change their rates within prescribed ceiling levels that are tied to an inflation index. A carrier must, as a general rule, utilize the indexing methodology to change its rates. Cost-of-service ratemaking, market-based
rates and settlement rates are alternatives to the indexing approach and may be used in certain specified circumstances to change rates.
Intrastate services provided by certain of our liquids pipelines are subject to regulation by state regulatory authorities. Much of the state regulation is complaint-based, both as to rates and priority of access. Not all state regulatory bodies allow for changes based on an index method similar to that used by FERC. In those instances, rates are generally changed only through a rate case process. The state regulators could limit our ability to increase our rates or to set rates based on our costs or could order us to reduce our rates and could, if permitted under state law, require the payment of refunds to shippers.
FERC and state regulatory agencies generally have not investigated rates on their own initiative when those rates are not the subject of a protest or a complaint by a shipper. FERC or a state commission could investigate our rates on its own initiative or at the urging of a third party if the third party is either a current shipper or is able to show that it has a substantial economic interest in our tariff rate level.
Natural Gas Pipelines
Our natural gas pipeline operations are subject to federal, state and local regulatory authorities. Under the NGA, FERC has authority to regulate natural gas companies that provide natural gas pipeline transportation services in interstate commerce. FERC’s authority to regulate those services includes the rates charged for the services, terms and conditions of service, certification and construction of new facilities, the extension or abandonment of services and facilities, the maintenance of accounts and records, the acquisition and disposition of facilities, the initiation and discontinuation of services and various other matters. Natural gas companies may not charge rates that have been determined to be unjust and unreasonable, or unduly discriminatory by FERC. In addition, FERC prohibits FERC-regulated natural gas companies from unduly preferring, or unduly discriminating against, any person with respect to pipeline rates or terms and conditions of service or other matters. Pursuant to FERC’s jurisdiction, existing rates and/or other tariff provisions may be challenged (e.g., by complaint) and rate increases proposed by the pipeline or other tariff changes may be challenged (e.g., by protest). Any successful complaint or protest related to our services or facilities could have an adverse impact on our revenues.
Some of our intrastate gas pipeline facilities are subject to various state laws and regulations that affect the rates we charge and terms of service. Although state regulation is typically less onerous than FERC, state regulation typically requires pipelines to charge just and reasonable rates and to provide service on a non-discriminatory basis. The rates and service of an intrastate pipeline generally are subject to challenge by complaint. Additionally, FERC has adopted certain regulations and reporting requirements applicable to intrastate natural gas pipelines (and Hinshaw natural gas pipelines) that provide certain interstate services subject to FERC’s jurisdiction. We are subject to such regulations and reporting requirements to the extent that any of our intrastate pipelines provide, or are found to provide, such interstate services.
Natural Gas Gathering
Section 1(b) of the NGA exempts natural gas production and gathering from the jurisdiction of FERC. There is, however, no bright-line test for determining the jurisdictional status of pipeline facilities. We own a number of facilities that we believe qualify as production and gathering facilities not subject to FERC jurisdiction. The distinction between FERC-regulated transmission services and federally unregulated gathering services is the subject of litigation from time to time, so we cannot provide assurance that FERC will not at some point assert that these facilities are within its jurisdiction or that such an assertion would not adversely affect our results of operations and revenues. In such a case, we would possibly be required to file a tariff with FERC, potentially provide a cost justification for the transportation charge and obtain certificate(s) of public convenience and necessity for the FERC-regulated pipelines, and comply with additional FERC reporting requirements.
In the states in which we operate, regulation of gathering facilities and intrastate pipeline facilities generally includes various safety, environmental and, in some circumstances, open access, non-discriminatory take requirement and complaint-based rate regulation. For example, some of our natural gas gathering facilities are subject to state ratable take and common purchaser statutes and regulations. Ratable take statutes and regulations generally require gatherers to take, without undue discrimination, natural gas production that may be tendered to the gatherer for handling. Similarly, common purchaser statutes and regulations generally require gatherers to purchase gas without undue discrimination as to source of supply or producer. These statutes are designed to prohibit discrimination in favor of one producer over another producer or one source of supply over another source of supply. Although state regulation is typically less onerous than at FERC, these statutes and regulations have the effect of restricting our right as an owner of gathering facilities to decide with whom we contract to purchase or gather natural gas.
Our gathering operations could be adversely affected should they be subject in the future to the application of state or federal regulation of rates and services or regulated as a public utility. Our gathering operations also may be or become subject to safety and operational regulations and permitting requirements relating to the design, siting, installation, testing, construction, operation, replacement and management of gathering facilities. Additional rules and legislation pertaining to these matters are considered or adopted from time to time. We cannot predict what effect, if any, such changes might have on our operations, but the industry could be required to incur additional capital expenditures and increased costs depending on future legislative and regulatory changes.
Energy Policy Act of 2005
Under the Domenici-Barton Energy Policy Act of 2005 (“EPAct 2005”) and related regulations, it is unlawful for gas pipelines and storage companies that provide interstate services to: (i) directly or indirectly, use or employ any device, scheme or artifice to defraud in connection with the purchase or sale of natural gas subject to the jurisdiction of FERC, or the purchase or sale of transportation services subject to the jurisdiction of FERC; (ii) make any untrue statement of material fact or omit to make any such statement necessary to make the statements made not misleading; or (iii) engage in any act or practice that operates as a fraud or deceit upon any person. EPAct 2005 gives the FERC civil penalty authority to impose penalties for certain violations. FERC also has the authority to order disgorgement of profits from transactions deemed to violate the NGA and EPAct 2005.
Standards of Conduct
FERC has adopted affiliate standards of conduct applicable to interstate natural gas pipelines and certain other regulated entities, defined as “Transmission Providers.” Under these rules, a Transmission Provider becomes subject to the standards of conduct if it provides service to affiliates that engage in marketing functions (as defined in the standards). If a Transmission Provider is subject to the standards of conduct, the Transmission Provider’s transmission function employees (including the transmission function employees of any of its affiliates) must function independently from the Transmission Provider’s marketing function employees (including the marketing function employees of any of its affiliates). The Transmission Provider must also comply with certain posting and other requirements.
PHMSA Regulation
We are subject to regulation by the DOT under the Hazardous Liquid Pipeline Safety Act of 1979 (“HLPSA”). The HLPSA delegated to the DOT the authority to develop, prescribe and enforce minimum federal safety standards for the transportation of hazardous liquids by pipeline. Congress also enacted the Pipeline Safety Act of 1992, also known as the PSA, which added the environment to the list of statutory factors that must be considered in establishing safety standards for hazardous liquid pipelines, required regulations be issued to define the term “gathering line” and establish safety standards for certain “regulated gathering lines,” and mandated that regulations be issued to establish criteria for operators to use in identifying and inspecting pipelines located in High Consequence Areas (“HCAs”), defined as those areas that are unusually sensitive to environmental damage, that cross a navigable waterway, or that have a high population density. In 1996, Congress enacted the Accountable Pipeline Safety and Partnership Act, which limited the operator identification requirement mandate to pipelines that cross a waterway where a substantial likelihood of commercial navigation exists, required that certain areas where a pipeline rupture would likely cause permanent or long-term environmental damage be considered in determining whether an area is unusually sensitive to environmental damage, and mandated that regulations be issued for the qualification and testing of certain pipeline personnel. In the Pipeline Inspection, Protection, Enforcement, and Safety Act of 2006, Congress required mandatory inspections for certain U.S. crude oil and natural gas transmission pipelines in HCAs and mandated that regulations be issued for low-stress hazardous liquid pipelines and pipeline control room management. We are also subject to the Pipeline Safety, Regulatory Certainty and Job Creation Act of 2011, which increased penalties for safety violations, established additional safety requirements for newly constructed pipelines and required studies of certain safety issues that could result in the adoption of new regulatory requirements for existing pipelines. Additionally, we are subject to the Protecting our Infrastructure of Pipelines and Enhancing Safety Act of 2016, which required PHMSA to develop underground gas storage standards within two years and provided PHMSA with significant new authority to issue industry-wide emergency orders if an unsafe condition or practices results in an imminent hazard.
The DOT has delegated its authority under these statutes to the PHMSA, which administers compliance with these statutes and has promulgated comprehensive safety standards and regulations for the transportation of natural gas by pipeline (49 C.F.R. Part 192), as well as hazardous liquids by pipeline (49 C.F.R. Part 195), including regulations for the design and construction of new pipelines or those that have been relocated, replaced or otherwise changed (Subparts C and D of 49 C.F.R., Part 195); pressure testing of new pipelines (Subpart E of 49 C.F.R. Part 195); operation and maintenance of pipelines, establishing programs for public awareness and damage prevention, managing the integrity of pipelines in HCAs and managing the operation of pipeline control rooms (Subpart F of 49 C.F.R. Part 195); protecting steel pipelines from the adverse effects of internal and external corrosion (Subpart H of 49 C.F.R. Part 195); and integrity management requirements for pipelines in HCAs (49 C.F.R. 195.452). PHMSA has undertaken a number of initiatives to reevaluate its pipeline safety regulations. We do not anticipate that we would be impacted by these regulatory initiatives to any greater degree than other similarly situated competitors.
Environmental and Other Regulations
General
Our processing and fractionation plants, storage facilities, pipelines and associated facilities are subject to multiple obligations and potential liabilities under a variety of federal, regional, state and local laws and regulations relating to environmental protection. Such environmental laws and regulations may affect many aspects of our present and future operations, including for example, requiring the acquisition of permits or other approvals to conduct regulated activities that may impose burdensome conditions or potentially cause delays, restricting the manner in which we handle or dispose of our wastes, limiting or prohibiting construction or other activities in environmentally sensitive areas such as wetlands or areas inhabited by threatened or endangered species, requiring us to incur capital costs to construct, maintain and/or upgrade processes, equipment and/or facilities, restricting the locations in which we may construct our compressor stations and other facilities and/or requiring the relocation of existing stations and facilities, and requiring remedial actions to mitigate any pollution that might be caused by our
operations or attributable to former operations. Spills, releases or other incidents may occur in connection with our active operations or as a result of events outside of our reasonable control, which incidents may result in non-compliance with such laws and regulations. Any failure to comply with these legal requirements may expose us to the assessment of sanctions, including administrative, civil and criminal penalties, the imposition of remedial or corrective actions and the issuance of orders enjoining or limiting some or all of our operations.
We believe that our operations and facilities are in substantial compliance with applicable environmental laws and regulations and the cost of continued compliance with such laws and regulations will not have a material adverse effect on our results of operations or financial condition. Generally speaking, however, the trend in environmental law is to place more restrictions and limitations on activities that may be perceived to adversely affect the environment, which may cause significant delays in obtaining permitting approvals for our facilities, result in the denial of our permitting applications, or cause us to become involved in time consuming and costly litigation. Thus, there can be no assurance as to the amount or timing of future expenditures for compliance with environmental laws and regulations, permits and permitting requirements or remedial actions pursuant to such laws and regulations, and actual future expenditures may be different from the amounts we currently anticipate. Revised or additional environmental requirements may result in increased compliance and mitigation costs or additional operating restrictions, particularly if those costs are not fully recoverable from our customers, and could have a material adverse effect on our business, financial condition, results of operations and cash flow. We may not be able to recover some or any of these costs from insurance. Such revised or additional environmental requirements may also result in substantially increased costs and material delays in the construction of new facilities or expansion of our existing facilities, which may materially impact our ability to meet our construction obligations with our producer customers.
Remediation
A comprehensive framework of environmental laws and regulations governs our operations as they relate to the possible release of hazardous substances or non-hazardous or hazardous wastes into soils, groundwater and surface water and measures taken to mitigate pollution into the environment. CERCLA, also known as the “Superfund” law, as well as comparable state laws, impose liability without regard to fault or the legality of the original conduct on certain classes of persons who are considered to be responsible for the release of a hazardous substance into the environment. These persons include current and prior owners or operators of a site where a release occurred and companies that transported or disposed or arranged for the transport or disposal of the hazardous substances released from the site. Under CERCLA, these persons may be subject to strict joint and several liability for the costs of removing or remediating hazardous substances that have been released into the environment and for restoration costs and damages to natural resources. RCRA and similar state laws may also impose liability for removing or remediating releases of hazardous or non-hazardous wastes from impacted properties.
We currently own or lease, and have in the past owned or leased, properties that have been used over the years for natural gas gathering, processing and transportation, for NGL fractionation, for the storage, gathering and transportation of crude oil, or for the storage and transportation of refined products. During the normal course of operation, whether by us or prior owners or operators, releases of petroleum hydrocarbons or other non-hazardous or hazardous wastes have or may have occurred. We could be required to remove or remediate previously disposed wastes or property contamination, including groundwater contamination, or to perform remedial operations to prevent future contamination. We do not believe that we have any current material liability for cleanup costs under such laws or for third-party claims.
The EPA’s rule designating Perfluorooctanoic Acid (“PFOA”) and Perfluorooctane Sulfonate (“PFOS”) as hazardous substances under CERCLA Section 102(a) became effective on July 8, 2024. In addition, EPA has received three petitions requesting regulatory action on per- and polyfluoroalkyl substances (“PFAS”) under RCRA and in February 2024, proposed two regulations that would add nine PFAS, including PFOA and PFOS, to the list of RCRA hazardous constituents and broaden the definition of hazardous waste applicable to corrective action requirements at hazardous waste treatment, storage, and disposal facilities. We cannot currently predict the impact of these regulations on our remediation costs.
Solid and Hazardous Wastes
We may incur liability under RCRA, and comparable or more stringent state statutes, which impose requirements relating to the handling and disposal of non-hazardous and hazardous wastes. In the course of our operations, we generate some amount of ordinary industrial wastes, such as paint wastes, waste solvents and waste oils that may be regulated as hazardous wastes. It is possible that some wastes generated by us that are currently classified as non-hazardous wastes may in the future be designated as hazardous wastes, resulting in the wastes being subject to more rigorous and costly transportation, storage, treatment and disposal requirements.
Water
We maintain numerous discharge permits as required under the National Pollutant Discharge Elimination System program of the CWA and have implemented systems to oversee our compliance with these permits. In addition, we are regulated under OPA-90, which, among other things, requires the owner or operator of a tank vessel or a facility to maintain an emergency plan to respond to releases of oil or hazardous substances. OPA-90 also requires the responsible company to pay resulting removal costs and damages and provides for civil penalties and criminal sanctions for violations of its provisions. We operate tank vessels and facilities from which spills of oil and hazardous substances could occur. We have implemented emergency oil response plans for all of our components and facilities covered by OPA-90 and we have established Spill Prevention, Control and Countermeasures
plans for all facilities subject to such requirements. Some coastal states in which we operate have passed state laws similar to OPA-90, but with expanded liability provisions, that include provisions for cargo owner responsibility as well as ship owner and operator responsibility.
Construction or maintenance of our plants, compressor stations, pipelines, barge docks and storage facilities may impact wetlands or other surface water bodies, which are also regulated under the CWA by EPA, the United States Army Corps of Engineers (“Army Corps”) and state water quality agencies. Regulatory requirements governing wetlands and other surface water bodies (including associated mitigation projects) may result in the delay of our projects while we obtain necessary permits and may increase the cost of new projects and maintenance activities. We believe that we are in substantial compliance with the CWA and analogous state laws. However, there is no assurance that we will not incur material increases in our operating costs or delays in the construction or expansion of our facilities because of future developments, the implementation of new laws and regulations, the reinterpretation of existing laws and regulations, or otherwise, including, for example, increased construction activities, potential inadvertent releases arising from pursuing borings for pipelines, and earth slips due to heavy rain and/or other causes.
On October 22, 2019, EPA and the Army Corps published a final rule to repeal the 2015 “Clean Water Rule: Definition of Waters of the United States” (“2015 Rule”), which amended portions of the Code of Federal Regulations to restore the regulatory text that existed prior to the 2015 Rule, effective December 23, 2019. The rule repealing the 2015 Rule has been challenged in multiple federal courts. On April 21, 2020, EPA and the Army Corps promulgated the Navigable Waters Protection Rule (“2020 Rule”) to define “waters of the United States.” The 2020 Rule has been vacated by a federal court. On January 18, 2023, EPA and the Army Corps published a final rule (“2023 Rule”) repealing the 2020 Rule defining “waters of the United States” and adopting a rule largely based upon the definition adopted in 1986 with some revisions based upon subsequent United States Supreme Court rulings, in particular Rapanos v. United States (2006), which produced two different tests for determining “waters of the United States,” the relatively permanent waters and significant nexus tests. The 2023 Rule has been challenged in multiple federal courts and has been enjoined from applying in 27 states where the pre-2015 “waters of the United States” definition and guidance applies. On May 25, 2023, the United States Supreme Court issued its decision in Sackett v. EPA rejecting the significant nexus test in favor of the relatively permanent waters test, thereby narrowing the scope of wetlands and other water bodies regulated as “waters of the United States.” On September 8, 2023, EPA and the Army Corps revised the 2023 Rule to conform to the Sackett decision (“Revised 2023 Rule”). The Revised 2023 Rule applies in only 23 states and has also been challenged in multiple federal courts. The regulatory uncertainty could result in delays in permitting and impact pipeline construction and maintenance activities.
In April 2020, the U.S. District Court in Montana vacated Nationwide Permit 12 (“NWP 12”), which authorizes the placement of fill material in “waters of the United States” for utility line activities as long as certain best management practices are implemented. The decision was ultimately appealed to the United States Supreme Court, which partially reversed the district court’s decision, temporarily reinstating NWP 12 for all projects except the Keystone XL oil pipeline. The Army Corps subsequently reissued its nationwide permit authorizations on January 13, 2021, by dividing the NWP that authorizes utility line activities (NWP 12) into three separate NWPs that address the differences in how different utility line projects are constructed, the substances they convey, and the different standards and best management practices that help ensure those NWPs authorize only those activities that have no more than minimal adverse environmental effects. A challenge of the 2021 authorization is currently pending before the U.S. District Court for the District of Columbia (“D.D.C.”), after being transferred from the U.S. District Court for the District of Montana in August 2022 and the plaintiffs request the court vacate and remand the 2021 authorization. Also, a petition has been filed with the Army Corps asking it to revoke the 2021 authorization. The Army Corps could repeal or replace the 2021 authorization in a subsequent rulemaking. The repeal, vacatur, revocation or modification of the 2021 authorization could impact pipeline construction and maintenance activities.
As part of our emergency response activities, we have used aqueous film forming foam (“AFFF”) containing PFAS chemicals as a vapor and fire suppressant. At this time, AFFFs containing PFAS are the most effective foams to prevent and control a flammable petroleum-based liquid fire involving a large storage tank or tank containment area. Fluorine-free firefighting foams are currently under development but have not yet proven to be as effective as AFFFs containing PFAS.
In May 2016, EPA issued lifetime health advisory levels (“HALs”) and health effects support documents for two PFAS substances - PFOA and PFOS. These HALs were updated in June 2022, when EPA also issued HALs for two additional PFAS substances. In February 2019, EPA issued a PFAS Action Plan identifying actions it is planning to take to study and regulate various PFAS chemicals. EPA identified that it would evaluate, among other actions, (1) proposing national drinking water standards for PFOA and PFOS, (2) developing cleanup recommendations for PFOA and PFOS, (3) evaluating listing PFOA and PFOS as hazardous substances under CERCLA, and (4) conducting toxicity assessments for other PFAS chemicals. On December 5, 2022, EPA issued to states and EPA regional offices a memorandum providing guidance for addressing PFAS discharges in wastewater and stormwater. Also, on April 26, 2024, EPA issued a final rule establishing national drinking water standards for PFOS, PFOA, perfluorohexane sulfonic acid (“PFHxS”), perfluorononanoic acid (“PFNA”), perfluorobutane sulfonic acid (“PFBS”), and hexafluoropropylene oxide dimer acid and its ammonium salt (also known as “GenX”). Congress may also take further action to regulate PFAS. We cannot currently predict the impact of potential statutes or regulations on our operations. In addition, many states are actively proposing and adopting legislation and regulations relating to the use of AFFFs containing PFAS. Additionally, many states are using EPA HALs for PFOS and PFOA and some states are adopting and proposing state-specific drinking water and cleanup standards for various PFAS, including but not limited to PFOS and PFOA. We cannot currently predict the impact of these regulations on our liquidity, financial position, or results of operations.
Air Emissions
The CAA and comparable state laws restrict the emission of air pollutants from many sources and impose various monitoring and reporting requirements. These laws and any implementing regulations may require us to obtain pre-approval for the construction or modification of certain projects or facilities expected to produce or significantly increase air emissions, obtain and strictly comply with stringent air permit requirements, utilize specific equipment or technologies to control emissions, or aggregate two or more of our facilities into one application for permitting purposes. We believe that our operations are in substantial compliance with applicable air permitting and control technology requirements. However, we have incurred capital expenditures and may continue to incur capital expenditures in the future for installation of air pollution control equipment and encounter construction or operational delays while applying for, or awaiting the review, processing and issuance of new or amended permits, and we may be required to modify certain of our operations which could increase our operating costs.
In February 2024, EPA released a final rule to lower the primary (health-based) fine particulate matter annual standard from its current level of 12.0 µg/m3 to 9.0 µg/m3. Lowering of the National Ambient Air Quality Standards (“NAAQS”) and subsequent designation as a nonattainment area could result in increased costs associated with, or result in cancellation or delay of, capital projects at our or our customers’ facilities, or could require emission reductions that could result in increased costs to us or our customers. We cannot predict the effects of the various state implementation plan requirements at this time.
In 2007, the California Air Resources Board (“CARB”) adopted the At-Berth Regulation to control airborne emissions from ocean-going vessels at berth but excluded tanker vessels due to safety and technological challenges for stack emission capture on vessels with hazardous cargo, which challenges still exist today. CARB amended the regulation in August 2020 to include maximum emission rates from auxiliary engines and boilers used to unload tanker vessels at berth. The obligation to meet the emission rates applies to both a vessel and the terminal where it is unloading. The emission rates apply to vessels unloading at terminals at the Port of Long Beach and the Port of Los Angeles beginning January 1, 2025, and at all other terminals beginning January 1, 2027. The amended regulation has been challenged in court. Compliance with the regulation is expected to increase our costs at affected facilities; however, to the extent permitted by regulations and our existing agreements, we expect to pass these costs on to our customers.
GHG Emissions
Currently, legislative and regulatory measures to address GHG emissions are in various phases of review, discussion or implementation. Reductions in GHG emissions could result in increased costs to (i) operate and maintain our facilities, (ii) install new emission controls at our facilities, (iii) capture the emissions from our facilities and (iv) administer and manage any GHG emissions programs, including acquiring emission credits or allotments.
Congress has from time to time considered legislation to regulate GHG emissions, and it is possible that such legislation could be enacted in the future. In the absence of federal climate legislation in the United States, a number of state and regional efforts have emerged that are aimed at tracking and/or reducing GHG emissions by means of cap and trade programs that typically require major sources of GHG emissions to acquire and surrender emission allowances in return for emitting those GHGs. Although it is not possible at this time to predict how legislation or new regulations that may be adopted to address GHG emissions would impact our business, any such future laws and regulations could require us to incur increased operating costs, such as costs to purchase and operate emissions control systems, to acquire emission allowances or comply with new regulatory or reporting requirements including the imposition of a carbon tax. Any such legislation or regulatory programs could also increase the cost of consuming, and thereby reduce demand for, crude oil and natural gas produced by our exploration and production customers that, in turn, could reduce the demand for our services and thus adversely affect our cash available for distribution to our unitholders.
Under the National Environmental Policy Act, environmental assessments must be performed for certain projects, including construction of certain new pipelines. Uncertainty related to the environmental assessment, including whether the environmental assessment must consider direct and indirect GHG emissions, can result in delay and increased costs in completing new projects.
On December 2, 2023, EPA issued its final rule to regulate methane emissions from the Oil and Natural Gas Sector. The rule titled “Standards of Performance for New, Reconstructed, and Modified Sources and Emissions Guidelines for Existing Sources: Oil and Gas Sector Climate Review” requires MPLX to control and reduce methane emissions within its natural gas gathering and boosting operations and gas processing facilities. The rule is consistent with the voluntary methane reduction programs that MPLX has been implementing through its Focus on Methane Program. As a result, although the rule requires MPLX to make additional investments to further reduce methane emissions, we do not believe the rule will have a material impact to our operations.
The Inflation Reduction Act of 2022 includes a charge on methane emissions above a certain threshold for facilities that report their GHG emissions under the EPA's Greenhouse Gas Emissions Reporting Program Part 98 regulations. The charge starts at $900 per metric ton of methane in 2024, $1,200 per metric ton in 2025, and increasing to $1,500 per metric ton in 2026 and beyond. At this time, we do not expect it to have a material adverse effect on our operations, financial condition or results of operations.
Endangered Species Act and Migratory Bird Treaty Act Considerations
The federal Endangered Species Act (“ESA”) and analogous state laws regulate activities that may affect endangered or threatened species, including their habitats. If protected species are located in areas where we propose to construct new gathering or transportation pipelines, processing or fractionation facilities, or other infrastructure, such work could be prohibited or delayed in certain of those locations or during certain times, when our operations could result in a taking of the species or destroy or adversely modify critical habitat that has been designated for the species. We also may be obligated to develop plans to avoid potential takings of protected species and provide mitigation to offset the effects of any unavoidable impacts, the implementation of which could materially increase our operating and capital costs. Existing laws, regulations, policies and guidance relating to protected species may also be revised or reinterpreted in a manner that further increases our construction and mitigation costs or restricts our construction activities. Additionally, construction and operational activities could result in inadvertent impact to a listed species and could result in alleged takings under the ESA, exposing MPLX to civil or criminal enforcement actions and fines or penalties. The existence of threatened or endangered species in areas where we conduct operations or plan to construct pipelines or facilities may cause us to incur increased costs arising from species protection measures or could result in delays in, or prohibit, the construction of our facilities or limit our customer’s exploration and production activities, which could have an adverse impact on demand for our midstream operations.
The Migratory Bird Treaty Act implements various treaties and conventions between the United States and certain other nations for the protection of migratory birds. In accordance with this law, the taking, killing or possessing of migratory birds covered under this act is unlawful without authorization. If there is the potential to adversely affect migratory birds as a result of our operations or construction activities, we may be required to seek authorization to conduct those operations or construction activities, which may result in specified operating or construction restrictions on a temporary, seasonal, or permanent basis in affected areas and thus have an adverse impact on our ability to provide timely gathering, processing or fractionation services to our exploration and production customers.
Safety Matters
We are subject to oversight pursuant to the federal Occupational Safety and Health Act, as amended (“OSH Act”), as well as comparable state statutes that regulate the protection of the health and safety of workers. We believe that we have conducted our operations in substantial compliance with regulations promulgated pursuant to the OSH Act, including general industry standards, record-keeping requirements and monitoring of occupational exposure to regulated substances.
We are also subject at regulated facilities to the Occupational Safety and Health Administration’s Process Safety Management and EPA’s Risk Management Program requirements, which are intended to prevent or minimize the consequences of catastrophic releases of toxic, reactive, flammable or explosive chemicals. The application of these regulations can result in increased compliance expenditures.
In general, we expect industry and regulatory safety standards to become more stringent over time, resulting in increased compliance expenditures. While these expenditures cannot be accurately estimated at this time, we do not expect such expenditures will have a material adverse effect on our results of operations.
The DOT has adopted safety regulations with respect to the design, construction, operation, maintenance, inspection and management of our pipeline assets. These regulations contain requirements for the development and implementation of pipeline integrity management programs, which include the inspection and testing of pipelines and the correction of anomalies. These regulations also require that pipeline operation and maintenance personnel meet certain qualifications and that pipeline operators develop comprehensive spill response plans.
Product Quality Standards
Refined products and other hydrocarbon-based products that we transport are generally sold by us or our customers for consumption by the public. Various federal, state and local agencies have the authority to prescribe product quality specifications for products. Changes in product quality specifications or blending requirements could reduce our throughput volumes, require us to incur additional handling costs or require capital expenditures. For example, different product specifications for different markets affect the fungibility of the products in our system and could require the construction of additional storage. In addition, changes in the product quality of the products we receive on our product pipelines could reduce or eliminate our ability to blend products.
Marine Transportation
Our marine transportation business is subject to regulation by the USCG, federal laws, including the Jones Act, state laws and certain international conventions, as well as numerous environmental regulations. The majority of our vessels are subject to inspection by the USCG and carry certificates of inspection. The crews employed aboard the vessels are licensed or certified by the USCG. We are required by various governmental agencies to obtain licenses, certificates and permits for our vessels.
Our marine transportation business competes principally in markets subject to the Jones Act, a federal cabotage law that restricts domestic marine transportation in the United States to vessels built and registered in the United States, and manned and owned by United States citizens. We presently meet all of the requirements of the Jones Act for our vessels. The loss of Jones Act status could have a significant negative effect on our marine transportation business. The requirements that our vessels be
United States built and manned by United States citizens, the crewing requirements and material requirements of the USCG, and the application of United States labor and tax laws increases the cost of United States flag vessels when compared with comparable foreign flag vessels. Our marine transportation business could be adversely affected if the Jones Act were to be modified so as to permit foreign competition that is not subject to the same United States government-imposed burdens.
The Secretary of Homeland Security is vested with the authority and discretion to waive the Jones Act to such extent and upon such terms as the Secretary may prescribe whenever the Secretary of Homeland Security deems that such action is necessary in the interest of national defense. For example, the Secretary of Homeland Security has waived the Jones Act for limited periods of time and in limited areas following the occurrence of certain natural disasters such as hurricanes. Waivers of the Jones Act can result in increased competition from foreign tank vessel operators, which could negatively impact our marine transportation business.
Security
We have several facilities that are subject to the United States Coast Guard’s Maritime Transportation Security Act, and a number of other facilities that are subject to the Transportation Security Administration’s Pipeline Security Guidelines and are designated as “Critical Facilities.” We have an internal inspection program designed to monitor and ensure compliance with all of these requirements. We believe that we are in material compliance with all applicable laws and regulations regarding the security of our facilities.
Tribal Lands
Various federal agencies, including EPA and the Department of the Interior, along with certain Native American tribes, promulgate and enforce regulations pertaining to oil and gas operations on Native American tribal lands where we operate. These regulations include such matters as lease provisions, drilling and production requirements, and standards to protect environmental quality and cultural resources. In addition, each Native American tribe is a sovereign nation having the right to enforce certain laws and regulations and to grant approvals independent from federal, state and local statutes and regulations. These laws and regulations may increase our costs of doing business on Native American tribal lands and impact the viability of, or prevent or delay our ability to conduct, our operations on such lands.
HUMAN CAPITAL
We are managed and operated by the board of directors and executive officers of MPLX GP LLC (“MPLX GP”), our general partner and a wholly owned subsidiary of MPC. Our general partner has the sole responsibility for providing the employees and other personnel necessary to conduct our operations. All of the employees that conduct our business are directly employed by affiliates of our general partner. We believe that our general partner and its affiliates have a satisfactory relationship with those employees.
MPC believes its employees are its greatest asset of strength, and the culture reflects the quality of individuals across its workforce. Its collaborative efforts, which include fostering an inclusive environment, providing broad-based development and mentorship opportunities, recognizing and rewarding accomplishments and offering benefits that support the well-being of its employees and their families, contribute to increased engagement and fulfilling careers. Empowering people and prioritizing accountability are also key components for developing a high-performing culture, which is critical to achieving MPC’s strategic vision.
Employee Profile
As of December 31, 2024, our general partner and its affiliates had approximately 5,560 full-time employees that provide services to us under our employee services agreements.
Safety
MPC is committed to safe operations to protect the health and safety of its employees, contractors and communities. MPC’s commitment to safe operations is reflected in its safety systems design, its well-maintained equipment and by learning from its incidents. Part of MPC’s effort to promote safety includes the Operational Excellence Management System, which expands on the RC14001® scope, incorporates a Plan-Do-Check-Act continual improvement cycle, and aligns with ISO 9001, incorporating quality and an increased stakeholder and process focus. Together, these components of MPC’s safety management system provide it with a comprehensive approach to managing risks and preventing incidents, illnesses and fatalities. Additionally, MPC’s annual cash bonus program includes a broad set of measures tied to safety, environmental stewardship and human capital management.
Talent Management
MPC’s People Strategy holistically addresses the dynamic business environment it operates in. It enables MPC to be an employer of choice in the face of shifting talent needs and availability. Executing this People Strategy requires that it attracts and retains the best talent with the right capabilities when we need them. Attracting and retaining top talent involves presenting employees with the tools for success and providing opportunities for long-term engagement and career advancement. Its Talent Acquisition team consists of three segments: Executive Recruiting, Experienced Recruiting and University Recruiting. The specialization within each group allows it to specifically address MPC’s broad range of current and future talent needs, as well as
devote time and attention to candidates during the hiring process. MPC believes each candidate brings a new perspective to its workforce, and it actively seeks candidates with a variety of backgrounds and experience.
MPC equips its employees at every level with classroom training, online courses and on the job activities that provide the knowledge and skills necessary to perform their daily job functions safely and successfully. Simultaneously, it supports its employees with a wide range of career development programs, tools, and key talent processes to help them advance and grow their careers within MPC.
Compensation and Benefits
To ensure MPC is offering competitive pay packages, it annually benchmarks compensation, including base salaries, bonus levels and long-term incentive targets. MPC’s annual bonus program, for which all employees are eligible, is a critical component of its compensation as it rewards employees for MPC’s achievement against preset goals, encouraging employee commitment and ownership of results. Employees in the senior leader pay grades, as well as most other leaders, receive long-term incentive awards annually to align their compensation to the interests of MPC shareholders and MPLX unitholders.
MPC offers comprehensive benefits that are also benchmarked annually, including medical, dental and vision insurance for employees, their spouses or domestic partners, and their dependents. MPC also provides retirement programs, life insurance, family building and support programs, sick and disability benefits, education assistance, as well as supports the well-being of employees and their families through a comprehensive Employee Assistance Program and financial wellness tools. In addition, MPC encourages employees to refresh and recharge by providing competitive vacation programs and paid parental leave benefits for birth mothers and nonbirth parents. Further, MPC awards a significant number of college and trade school scholarships to the high school senior children of its employees through the Marathon Petroleum Scholars Program. Both full-time and part-time employees are eligible for these benefits.
Inclusion
Inclusion is embedded in MPC’s People Strategy, guided by core values, and supported by a dedicated team of subject matter experts and leadership. Its People Strategy is based on three pillars: building a diverse workforce, creating a more inclusive culture, and contributing to our thriving communities.
MPC promotes inclusivity and respect among its employees. It recognizes that when employees feel valued, it shows in their performance. MPC’s employee networks are fundamental to achieving this goal and connect employees with others who have shared experiences. These seven groups use a member and ally model to promote inclusion - Asian, Black, Disability, Hispanic, LGBTQ+, Veterans, and Women. Led by employees with involvement and support from executive sponsors, MPC’s networks connect colleagues from across the company and provide opportunities for development, networking, and community involvement.
AVAILABLE INFORMATION
General information about MPLX LP and its general partner, MPLX GP LLC, including Governance Principles, Audit Committee Charter, Conflicts Committee Charter and Certificate of Limited Partnership, can be found at www.mplx.com. In addition, our Code of Business Conduct and Code of Ethics for Senior Financial Officers are available in this same location.
MPLX LP uses its website, www.mplx.com, as a channel for routine distribution of important information, including news releases, analyst presentations and financial information. Our Annual Report on Form 10-K, Quarterly Reports on Form 10-Q and Current Reports on Form 8-K, as well as any amendments and exhibits to those reports, are available free of charge through our website as soon as reasonably practicable after the reports are filed or furnished with the SEC, or on the SEC’s website. The SEC maintains a website that contains reports, proxy and information statements, and other information regarding issuers that file electronically with the SEC at www.sec.gov. These documents are also available in hard copy, free of charge, by contacting our Investor Relations office. In addition, our website allows investors and other interested persons to sign up to automatically receive email alerts when we post news releases and financial information on our website. Information contained on our website is not incorporated into this Annual Report on Form 10-K or other securities filings.
Item 1A. Risk Factors
You should carefully consider each of the following risks and all the other information contained in this Annual Report on Form 10-K in evaluating us and our common units. Although the risks are organized by headings, and each risk is discussed separately, many are interrelated. Our business, financial condition, results of operations and cash flows could be materially and adversely affected by these risks, and, as a result, the trading price of our common units could decline. We have in the past been adversely affected by certain of, and may in the future be affected by, these risks.
Summary of Risk Factors
We have in the past been adversely affected by certain of, and may in the future be adversely affected by, the following:
•a significant decrease in crude oil and natural gas production in our areas of operation;
•challenges in accurately estimating expected production volumes of our producer customers;
•our dependence on third parties for the crude oil, natural gas and refined products we gather, transport and store, the natural gas we process, and the NGLs we fractionate and stabilize at our facilities;
•our ability to retain existing customers or acquire new customers;
•our ability to increase fees enough to cover costs incurred under our gathering, processing, transmission, transportation, fractionation, stabilization and storage agreements;
•unplanned maintenance of the United States (“U.S.”) inland waterway infrastructure;
•interruptions in operations at any of our facilities or those of our customers, including MPC;
•inflation;
•problems affecting our information technology systems and those of our third-party business partners and service providers;
•business, compliance and reputational risks associated with increasing regulatory focus on data privacy issues, integrating artificial intelligence into our processes and expanding laws in those areas;
•in our joint ventures, our lack of sole decision-making authority, our reliance on our joint venture partners’ financial condition and disputes between us and our joint venture partners;
•terrorist attacks or other targeted operational disruptions aimed at our facilities or that impact our customers or the markets we serve;
•increases to our maintenance or repair costs;
•severe weather events, other climate conditions and earth movement and other geological hazards;
•insufficient cash from operations after the establishment of cash reserves and payment of our expenses to enable us to pay the intended quarterly distribution to our unitholders;
•our substantial debt and other financial obligations;
•increases in interest rates;
•our exposure to the credit risks of our key customers and derivative counterparties;
•negative effects of our commodity derivative activities;
•uninsured losses;
•future costs relating to evolving environmental or other laws or regulations;
•increased regulation of hydraulic fracturing;
•climate-related and GHG emission regulation;
•climate-related litigation;
•societal and political pressures and other forms of opposition to the future development, transportation and use of carbon-based fuels;
•market deterioration prior to the completion of large capital projects;
•increasing attention to ESG matters;
•goals, targets and disclosures related to ESG matters;
•federal and tribal approvals, regulations and lawsuits relating to our facilities that are located on Native American tribal lands;
•our ability to maintain or obtain real property rights required for our business;
•the consequences resulting from foreign investment in us or our general partner exceeding certain levels;
•federal or state rate and service regulation or rate-making policies;
•costs and liabilities resulting from performance of pipeline integrity programs and related repairs;
•future impairments;
•difficulties in making strategic acquisitions on economically acceptable terms from MPC or third parties;
•integration risks from significant future acquisitions;
•the failure by MPC to satisfy its obligations to us, or a significant reduction in volumes transported through our facilities or stored at our storage assets;
•MPC materially suspending, reducing or terminating its obligations under its agreements with us;
•MPC’s level of indebtedness or credit ratings;
•various tax risks inherent in our master limited partnership structure, including the potential for unexpected tax liabilities for us or our unitholders, more burdensome tax filing requirements and future legislative changes to the expected tax treatment of an investment in us;
•MPC’s conflicts of interest with us, its limited duties to us and our unitholders, and its potential favoring of its interests over our interests and the interests of our unitholders;
•the requirements and restrictions arising under our Sixth Amended and Restated Agreement of Limited Partnership, dated as of February 1, 2021 (“Partnership Agreement”), including the requirement that we distribute all of our available
cash, limitations on our general partner’s duties, limited unitholder voting rights, and limited unitholder recourse in the event unitholders are dissatisfied with our operations;
•cost reimbursements and fees paid to our general partner and its affiliates, which in certain circumstances are subject to our general partner’s sole discretion;
•control of our general partner being transferred to a third party without unitholder consent;
•the issuance of additional units resulting in the dilution of limited unitholder interests, which issuances may be made without unitholder approval;
•the sale of units - and the adverse impact on the trading price of the common units which might result from such sale - by MPC of the units it holds in public or private markets, and such sales could have an adverse impact on the trading price of the common units;
•affiliates of our general partner, including MPC, competing with us, and neither our general partner nor its affiliates having any obligation to present business opportunities to us;
•our general partner having a limited call right that may require unitholders to sell common units at an undesirable time or price;
•a unitholder’s liability not being limited if a court finds that unitholder action constitutes control of our business;
•unitholders may have to repay distributions that were wrongfully distributed to them;
•the NYSE not requiring a publicly traded limited partnership like us to comply with certain of its corporate governance requirements; and
•the Court of Chancery of the State of Delaware being, to the extent permitted by law, the sole and exclusive forum for substantially all disputes between us and our limited partners.
Business and Operational Risks
A significant decrease in oil and natural gas production in our areas of operation may adversely affect our business, financial condition, results of operations and cash available for distribution.
A significant portion of our operations is dependent on the continued availability of natural gas and crude oil production. The production from oil and natural gas reserves and wells owned by our producer customers will naturally decline over time, which means that our cash flows associated with these wells will also decline over time. To maintain or increase throughput levels and the utilization rate of our facilities, we must continually obtain new oil, natural gas, NGL and refined product supplies, which depend in part on the level of successful drilling activity near our facilities, our ability to compete for volumes from successful new wells and our ability to expand our system capacity as needed.
We have no control over the level of drilling activity in the areas of our operations, the amount of reserves associated with the wells or the rate at which production from a well will decline. In addition, we have no control over producers or their production decisions, which are affected by demand, prevailing and projected energy prices, drilling costs, operational challenges, access to downstream markets, the level of reserves, geological considerations, governmental regulations and the availability and cost of capital. Reductions or changes in exploration or production activity in our areas of operations could lead to reduced throughput on our pipelines and utilization rates of our facilities.
Fluctuations in energy prices can negatively affect drilling activity, production rates and investments by third parties in the development of new oil and natural gas reserves. The prices for oil, natural gas and NGLs depend upon factors beyond our control, including global and local demand, production levels, changes in interstate pipeline gas quality specifications, imports and exports, seasonality and weather conditions, alternative energy sources such as wind, solar and other renewable energy technologies, economic and political conditions domestically and internationally and governmental regulations. Sustained periods of low prices could result in producers deciding to limit their oil and gas drilling operations, which could substantially delay the production and delivery of volumes of oil, natural gas and NGLs to our facilities and adversely affect our revenues and cash available for distribution.
This impact may also be exacerbated in circumstances where our compensation for services is commodity-based, which are more directly impacted by changes in natural gas and NGL prices than our fee-based contracts due to frac spread exposure and may result in operating losses when natural gas becomes more expensive on a Btu equivalent basis than NGL products. In addition, our purchase and resale of natural gas and NGLs in the ordinary course exposes us to significant risk of volatility in natural gas or NGL prices due to the potential difference in price at the time of the purchases and then the subsequent sales. The significant volatility in natural gas, NGL and crude oil prices could adversely impact our unit price, thereby increasing our distribution yield and cost of capital. Such impacts could adversely impact our ability to execute our long-term organic growth projects, satisfy our obligations to our customers, and make distributions to unitholders at intended levels, and may also result in non-cash impairments of long-lived assets or goodwill or other-than-temporary non-cash impairments of our equity method investments.
We may not always be able to accurately estimate expected production volumes of our producer customers; therefore, volumes we service in the future could be less than we anticipate.
We may not be able to accurately estimate expected production volumes of our producer customers. Furthermore, we may have only limited oil, natural gas, NGL or refined product supplies committed to any new facility prior to its construction. We may construct facilities to capture anticipated future growth in production or satisfy anticipated market demand which does not materialize, the facilities may not operate as planned, or the facilities may be underutilized. In order to attract additional oil, natural gas, NGL or refined product supplies from a customer, we may be required to order equipment and facilities, obtain rights of way or other land rights or otherwise commence construction activities for facilities that will be required to serve such customer’s additional supplies prior to executing agreements with the customer. If such agreements are not executed, we may be unable to recover such costs and expenses. Additionally, new facilities may not be able to attract enough oil, natural gas, NGLs or refined products to achieve our expected investment return. Alternatively, oil, natural gas, NGL or refined product supplies committed to facilities under construction may be delivered prior to completion of such facilities. In such event, we may be required to temporarily utilize third-party facilities to offload oil, natural gas, NGLs or refined products, which may increase our operating costs and reduce our cash available for distribution.
We depend on third parties for the oil, natural gas and refined products we gather, transport and store, the natural gas we process, and the NGLs we fractionate and stabilize at our facilities, and a reduction in these quantities could reduce our revenues and cash flow.
A significant portion of our supply of oil, natural gas, NGLs and refined products comes from a limited number of key producers/suppliers, who may be under no obligation to deliver a specific volume to our facilities. If any of these significant suppliers, or a significant number of smaller producers, were to decrease the supply of oil, natural gas, NGLs or refined products to our systems and facilities for any reason, we could experience difficulty in replacing those lost volumes. In some cases, the producers or suppliers are responsible for gathering or delivering oil, natural gas, NGLs or refined products to our facilities or we rely on other third parties to deliver volumes to us on behalf of the producers or suppliers. If such producers, suppliers or other third parties are unable, or otherwise fail to, deliver the volumes to our facilities, or if our agreements with any of these third parties terminate or expire such that our facilities are no longer connected to their gathering or transportation systems or the third parties modify the flow of natural gas or NGLs on those systems away from our facilities, the throughput on and utilization of our facilities may be reduced, or we may be required to incur significant capital expenditures to construct and install gathering pipelines or other facilities to be able to receive such volumes. Because our operating costs are primarily fixed, a reduction in the volumes delivered to us would result not only in a reduction of revenues, but also a decline in net income and cash flow.
We may not be able to retain existing customers, or acquire new customers, which would reduce our revenues and limit our future profitability.
A significant portion of our business comes from a limited number of key customers. The renewal or replacement of existing contracts with our customers at rates sufficient to maintain current revenues and cash flows depends on a number of factors beyond our control, including competition from other gatherers, processors, pipelines and fractionators, and the price of, and demand for, natural gas, NGLs, crude oil and refined products in the markets we serve. Our competitors include large oil, natural gas, refining and petrochemical companies, some of which have greater financial resources, more numerous or greater capacity pipelines, processing and other facilities, greater access to natural gas, crude oil and NGL supplies than we do or other synergies with existing or new customers that we cannot provide. Our competitors may also include our joint venture partners, who in some cases are permitted to compete with us and may have a competitive advantage due to their familiarity with our business arising from our joint venture arrangements, as well as third parties on whom we rely to deliver natural gas, NGLs, crude oil and refined products to our facilities, who may have a competitive advantage due to their ability to modify the flow of natural gas, NGLs, crude oil and refined products on their systems away from our facilities. Additionally, our customers that gather gas through facilities that are not otherwise dedicated to us may develop their own processing and fractionation facilities in lieu of using our services.
As a consequence of the increase in competition in the industry, as well as the volatility of natural gas prices, end-users and utilities are reluctant to enter into long-term purchase contracts. Many end-users purchase natural gas from more than one natural gas company and have the ability to change providers at any time. Some of these end-users also have the ability to switch between gas and alternative fuels in response to relative price fluctuations in the market. Because there are numerous companies of greatly varying size and financial capacity that compete with us in the marketing of natural gas, we often compete in the end-user and utilities markets primarily on the basis of price. The inability of our management to renew or replace our current contracts as they expire and to respond appropriately to changing market conditions could affect our profitability.
The fees charged to third parties under our gathering, processing, transmission, transportation, fractionation, stabilization and storage agreements may not escalate sufficiently to cover increases in costs, or the agreements may not be renewed or may be suspended in some circumstances.
Our costs may increase at a rate greater than the fees we charge to third parties. Furthermore, third parties may not renew their contracts with us. Additionally, some third parties’ obligations under their agreements with us may be permanently or temporarily reduced due to certain events, some of which are beyond our control, including force majeure events wherein the supply of natural gas, NGLs, crude oil or refined products are curtailed or cut-off due to events outside our control, and in some cases, certain of those agreements may be terminated in their entirety if the duration of such events exceeds a specified period of time.
If the escalation of fees is insufficient to cover increased costs, or if third parties do not renew or extend their contracts with us, or if third parties suspend or terminate their contracts with us, our financial results would suffer.
The U.S. inland waterway infrastructure is aging and may result in increased costs and disruptions to our operations.
Maintenance of the U.S. inland waterway system is vital to our marine transportation operations. The system is composed of over 12,000 miles of commercially navigable waterway, supported by approximately 240 locks and dams designed to provide flood control, maintain pool levels of water in certain areas of the country and facilitate navigation on the inland river system. The U.S. inland waterway infrastructure is aging, with more than half of the locks over 50 years old. As a result, due to the age of the locks, planned and unplanned maintenance may create more frequent outages, resulting in delays and additional operating expenses. Part of the costs for new construction and major rehabilitation of locks and dams is funded by marine transportation companies through taxes and the other portion is funded by general federal tax revenues. Failure of the federal government to adequately fund infrastructure maintenance and improvements in the future would have a negative impact on our ability to deliver products to our customers on a timely basis. Furthermore, any additional user taxes that may be imposed in the future to fund infrastructure improvements would increase our operating expenses.
Our operations are subject to business interruptions and present inherent hazards and risks, which could adversely impact our results of operations and financial condition.
Our operations are subject to business interruptions, such as unplanned maintenance, explosions, fires, pipeline releases, product quality incidents, power outages, severe weather, labor disputes, acts of terrorism or other natural or man-made disasters. These types of incidents adversely affect us. Our customers’ operations, including MPC’s refining operations, are subject to similar risks.
These types of incidents adversely affect our operations and may result in serious personal injury or loss of human life, significant damage to property and equipment, environmental pollution, impairment of operations and substantial losses. We and our customers have experienced certain of these incidents in the past. For assets located near populated areas, the level of damage resulting from these incidents could be greater. Due to the nature of our operations, certain interruptions could impact operations in other regions.
Our marine transportation business, in particular, is subject to weather conditions. Adverse weather conditions such as high or low water on the inland waterway systems, fog and ice, tropical storms, hurricanes and tsunamis on both the inland waterway systems and throughout the U.S. coastal waters can impair the operating efficiencies of the marine fleet. Such adverse weather conditions can cause a delay, diversion or postponement of shipments of products and are beyond our control.
In addition, we operate in and adjacent to environmentally sensitive waters where tanker, pipeline, rail car and refined product transportation and storage operations are closely regulated by federal, state and local agencies and monitored by environmental interest groups. Transportation and storage of crude oil, other feedstocks and refined products over and adjacent to water involves inherent risk and subjects us to the provisions of the OPA-90 and state laws in U.S. coastal and Great Lakes states and states bordering inland waterways on which we operate. If we are unable to promptly and adequately contain any accident or discharge involving tankers, pipelines, rail cars or above ground storage tanks transporting or storing crude oil, other feedstocks or refined products, we may be subject to substantial liability. In addition, the service providers contracted to aid us in a discharge response may be unavailable due to weather conditions, governmental regulations or other local or global events.
The construction and operation of certain of our facilities may be impacted by surface or subsurface mining operations by one or more third parties, which could adversely impact our construction activities or cause subsidence or other damage to our facilities. In such event, our construction may be prevented or delayed, or the costs and time increased, or our operations at such facilities may be impaired or interrupted, and we may not be able to recover the costs incurred for delays or to relocate or repair our facilities from such third parties.
Damages resulting from an incident involving any of our assets or operations may result in our being named as a defendant in one or more lawsuits asserting potentially substantial claims or in our being assessed potentially substantial fines by governmental authorities.
We may be negatively impacted by inflation.
Increases in inflation may have an adverse effect on us. Such increases in inflation could impact the commodity markets generally, the overall demand for our products and services, our costs for labor, material and services and the margins we are able to realize on our products and services, all of which could have an adverse impact on our business, financial position, results of operations and cash flows. Inflation may also result in higher interest rates, which in turn would result in higher interest expense related to our variable rate indebtedness and any borrowings we undertake to refinance existing fixed rate indebtedness.
We are increasingly dependent on the performance of our information technology systems and those of our third-party business partners and service providers.
We are increasingly dependent on our information technology systems and those of our third-party business partners and service providers for the safe and effective operation of our business. We rely on such systems to process, transmit and store electronic
information, including financial records and regulated personal data, and to manage or support a variety of business processes, including our supply chain, pipeline operations, gathering and processing operations, financial transactions, banking and numerous other processes and transactions.
Our information systems (and those of our third-party business partners and service providers), including our cloud computing environments and operational technology environments, are subject to numerous and evolving cybersecurity threats and attacks, including ransomware and other malware, phishing and social engineering schemes, supply chain attacks, and advanced artificial intelligence attacks, which can compromise our ability to operate, and the confidentiality, availability, and integrity of data in our systems or those of our third-party business partners and service providers. These and other cybersecurity threats may originate with criminal attackers, advanced persistent threats and nation-state actors, state-sponsored actors, or employee error or malfeasance. Cybersecurity threat actors also may attempt to exploit vulnerabilities in software, including software commonly used by companies in cloud-based services and bundled software. Because the techniques used to obtain unauthorized access, or to disable or degrade systems continuously evolve and some have become increasingly complex and sophisticated, and can remain undetected for a period of time despite efforts to detect and respond in a timely manner, we (and our third-party business partners and service providers) are subject to the risk of cyberattacks and cybersecurity incidents.
Our cybersecurity and infrastructure protection technologies, disaster recovery plans and systems, employee training and vendor risk management may not be sufficient to defend us against all unauthorized attempts to access our information or impact our systems. We and our third-party vendors and service providers have been and may in the future be subject to cybersecurity events and incidents of varying degrees. To date, the impacts of prior events and incidents have not had a material adverse effect on us.
Cybersecurity incidents involving our information technology systems or those of our third-party business partners and service providers can result in theft, destruction, loss, misappropriation or release of confidential financial data, regulated personal data, intellectual property and other information; give rise to remediation or other expenses; result in litigation, claims and increased regulatory review, investigations, or scrutiny; reduce our customers’ willingness to do business with us; disrupt our operations and the services we provide to customers; and subject us to litigation and legal liability under international, U.S. federal and state laws. Any of such results could have a material adverse effect on our reputation, business, financial condition, results of operations and cash flows.
Increasing regulatory focus on and expanding laws related to data privacy issues could expose us to increased liability, subject us to lawsuits, investigations, reputational harm and increase costs and restrictions on our operations that could significantly and adversely affect our business.
Along with our own data and information collected in the normal course of our business, we collect, use, transfer and retain certain data that is subject to specific laws and regulations. The transfer and use of this data is becoming increasingly complex. This data is subject to governmental regulation at international, federal, state and local levels in many areas of our business, including data privacy and security laws such as the California Consumer Privacy Act, as amended by the California Privacy Rights Act (“CCPA”). To date, comprehensive state privacy laws have been proposed or passed in more than twenty U.S. states. Additionally, the U.S. Federal Trade Commission and multiple state attorneys general are interpreting federal and state consumer protection laws to impose standards for the online collection, use, dissemination and security of data as well as requiring disclosures regarding such practices. Existing and potential future data privacy laws pose increasingly complex compliance, monitoring and control obligations and could potentially elevate our costs and risk exposure. As the implementation, interpretation, and enforcement of such laws continue to progress and evolve, there may also be developments that amplify such costs and risk exposure. Any failure by us to comply with these laws and regulations, including as a result of a cybersecurity incident or privacy breach, could expose us to significant penalties and liabilities, including individual claims or consumer class actions, commercial litigation, administrative, and investigations or actions, regulatory intervention and sanctions or fines.
As we integrate artificial intelligence technologies into our processes, these technologies may present business, compliance and reputational risks.
Recent and continuously evolving technological advances in artificial intelligence (“AI”) and machine-learning technology present new opportunities and also pose new risks. Our introduction of these technologies into our processes may result in new or expanded risks and liabilities. Such risks and liabilities include enhanced governmental or regulatory scrutiny, litigation, compliance issues, ethical concerns, confidentiality or security risks, as well as other factors that could adversely affect our business, reputation, and financial results. The utilization of AI could also result in loss of intellectual property and subject us to heightened risks related to intellectual property infringement or misappropriation. The use of AI can lead to unintended consequences, including generating content that is inaccurate, misleading or otherwise flawed, or that results in unintended biases and discriminatory outcomes, which could harm our reputation and expose us to risks related to inaccuracies or errors in the output of such technologies.
Our investments in joint ventures could be adversely affected by our reliance on our joint venture partners and their financial condition, and our joint venture partners may have interests or goals that are inconsistent with ours.
We conduct some of our operations through joint ventures in which we share control over certain economic and business interests with our joint venture partners. Our joint venture partners may have economic, business or legal interests or goals that are inconsistent with our goals and interests or may be unable to meet their obligations. Failure by us, or an entity in which we
have an interest, to adequately manage the risks associated with any acquisitions or joint ventures could have a material adverse effect on the financial condition or results of operations of our joint ventures and adversely affect our reputation, business, financial condition, results of operations and cash flows.
Terrorist attacks or other targeted operational disruptions may affect our facilities or those of our customers and suppliers.
Refining, gathering and processing, pipeline and terminal infrastructure, and other energy assets, may be the subject of terrorist attacks or other targeted operational disruptions. Any attack or targeted disruption of our operations, those of our customers or, in some cases, those of other energy industry participants, could have a material and adverse effect on our business. Similarly, any similar event that severely disrupts the markets we serve could materially and adversely affect our results of operations, financial position and cash flows.
Many of our assets have been in service for many years and, as a result, our maintenance or repair costs may increase in the future.
Our pipelines, terminals, fractionators, processing facilities and storage assets are generally long-lived assets, and many of them have been in service for many years. The age and condition of our assets could result in increased maintenance or repair expenditures in the future. Any significant increase in these expenditures could adversely affect our results of operations, financial position or cash flows, as well as our ability to make cash distributions to our unitholders.
Severe weather events, other climate conditions and earth movement and other geological hazards may adversely affect our and our customers’ assets and ongoing operations.
Our and our customers’ assets are subject to acute physical risks, such as floods, hurricane-force winds, wildfires, winter storms, and earth movement in variable, steep and rugged terrain and terrain with varied or changing subsurface conditions, and chronic physical risks, such as sea-level rise or water shortages. For example, in 2024, our Tampa Terminal and other logistics assets were adversely affected by hurricanes. The occurrence of these and similar events have had, and may in the future have, an adverse effect on our assets and operations. We have incurred and will continue to incur additional costs to protect our assets and operations from such physical risks and employ the evolving technologies and processes available to mitigate such risks. To the extent such severe weather events or other climate conditions increase in frequency and severity, we may be required to modify operations and incur costs that could materially and adversely affect our business, financial condition, results of operations and cash flows.
Financial Risks
We may not have sufficient cash from operations after the establishment of cash reserves and payment of our expenses, including cost reimbursements to MPC and its affiliates, to enable us to pay the intended quarterly distribution to our unitholders.
The amount of cash we can distribute to our common unitholders principally depends on the amount of cash we generate from our operations, which fluctuates from quarter to quarter based on, among other things:
•the volumes of natural gas, crude oil, NGLs and refined products we gather, process, store, transport and fractionate;
•the fees and tariff rates we charge and the margins we realize for our services and sales;
•the prices of, level of production of and demand for crude oil, natural gas, NGLs and refined products;
•the level of our operating costs including repairs and maintenance;
•the relative prices of NGLs and crude oil; and
•prevailing economic conditions.
In addition, the actual amount of cash available for distribution also depends on other factors, some of which are beyond our control, including:
•the amount of our operating expenses and general and administrative expenses, including cost reimbursements to MPC;
•our debt service requirements and other liabilities;
•fluctuations in our working capital needs;
•our ability to borrow funds and access capital markets;
•restrictions in our joint venture agreements or agreements governing our debt;
•the level and timing of capital expenditures we make, including capital expenditures incurred in connection with our growth projects;
•the cost of acquisitions, if any; and
•the amount of cash reserves established by our general partner in its discretion, which may increase in the future and which may in turn further reduce the amount of cash available for distribution.
Furthermore, the amount of cash we have available for distribution depends primarily on our cash flow and not solely on profitability, which is affected by non-cash items. As a result, we may make distributions during periods when we record net losses and may not make distributions during periods when we record net income.
Our substantial debt and other financial obligations could impair our financial condition, results of operations and cash flow, and our ability to fulfill our debt obligations.
We have significant debt obligations, which totaled $21.2 billion as of December 31, 2024, including amounts, if any, outstanding under our loan agreement with MPC. We may incur significant debt obligations in the future. Our indebtedness may impose various restrictions and covenants on us that could have, or the incurrence of such debt could otherwise result in, material adverse consequences, including:
•We may have difficulties obtaining additional financing for working capital, capital expenditures, acquisitions, or general business purposes on favorable terms, if at all, or our cost of borrowing may increase.
•We may be at a competitive disadvantage compared to our competitors who have proportionately less debt, or we may be more vulnerable to, and have limited flexibility to respond to, competitive pressures or a downturn in our business or the economy generally.
•If our operating results are not sufficient to service our indebtedness, we may be required to reduce our distributions, reduce or delay our business activities, investments or capital expenditures, sell assets or issue equity, which could materially and adversely affect our financial condition, results of operations, cash flows and ability to make distributions to unitholders, as well as the trading price of our common units.
•The operating and financial restrictions and covenants in our revolving credit facility and any future financing agreements could restrict our ability to finance our operations or capital needs or to expand or pursue our business activities, which may, in turn, limit our ability to make distributions to our unitholders. Our ability to comply with these covenants may be impaired from time to time if the fluctuations in our working capital needs are not consistent with the timing for our receipt of funds from our operations.
•If we fail to comply with our debt obligations and an event of default occurs, our lenders could declare the outstanding principal of that debt, together with accrued interest, to be immediately due and payable, which may trigger defaults under our other debt instruments or other contracts. Our assets may be insufficient to repay such debt in full, and the holders of our units could experience a partial or total loss of their investment.
Increases in interest rates could adversely impact our unit price, our ability to issue equity or incur debt for acquisitions or other purposes or refinance existing debt and our ability to make distributions at our intended levels.
Our revolving credit facility and our loan agreement with MPC have variable interest rates. As a result, future interest rates on our debt could be higher than current levels, causing our financing costs to increase accordingly. In addition, we may in the future refinance outstanding borrowings under our revolving credit facility with fixed-rate indebtedness. Interest rates payable on fixed-rate indebtedness typically are higher than the short-term variable interest rates that we pay on borrowings under our revolving credit facility. We also have other fixed-rate indebtedness that we may need or desire to refinance in the future at or prior to the applicable stated maturity.
As with other yield-oriented securities, our unit price will be impacted by our cash distributions and the implied distribution yield. The distribution yield is often used by investors to compare and rank yield-oriented securities for investment decision-making purposes. Therefore, changes in interest rates, either positive or negative, may affect the yield requirements of investors who invest in our units, and a rising interest rate environment could have an adverse impact on our unit price and our ability to issue equity or incur debt for acquisitions or other purposes and to make distributions at our intended levels.
We are exposed to the credit risks of our key customers, and any material non-payment or non-performance by our key customers could reduce our ability to make distributions to our unitholders.
We are subject to risks of loss resulting from non-payment or non-performance by our customers, which risks may increase during periods of economic uncertainty. Furthermore, some of our customers may be highly leveraged and subject to their own operating and regulatory risks, which increases the risk that they may default on their obligations to us. This risk is further heightened during sustained periods of declines of natural gas, NGL and crude oil prices. To the extent any of our customers are in financial distress or commence bankruptcy proceedings, our contracts with them, including provisions relating to dedications of production, may be subject to renegotiation or rejection under applicable provisions of the United States Bankruptcy Code. If a contract with a customer is altered or rejected in bankruptcy proceedings, we could lose some or all of the expected revenues associated with that contract. Any such material non-payment or non-performance could reduce our ability to make distributions to our unitholders.
We do not insure against all potential losses, and, therefore, our business, financial condition, results of operations and cash flows could be adversely affected by unexpected liabilities and increased costs.
We maintain insurance coverage in amounts we believe to be prudent against many, but not all, potential liabilities arising from operating hazards. Uninsured liabilities arising from operating hazards such as explosions, fires, pipeline releases, cybersecurity breaches or other incidents involving our assets or operations can reduce the funds available to us for capital and investment spending and could have a material adverse effect on our business, financial condition, results of operations and cash flows.
Historically, we also have maintained insurance coverage for physical damage and resulting business interruption to our major facilities, with significant self-insured retentions. In the future, we may not be able to maintain insurance of the types and amounts we desire at reasonable rates.
We have recorded goodwill and other intangible assets that could become further impaired and result in material non-cash charges to our results of operations.
We accounted for certain acquisitions using the acquisition method of accounting, which requires that the assets and liabilities of the acquired business be recorded to our balance sheet at their respective fair values as of the acquisition date. Any excess of the purchase consideration over the fair value of the acquired net assets is recognized as goodwill.
As of December 31, 2024, our balance sheet reflected $7.6 billion and $518 million of goodwill and other intangible assets, respectively. We have in the past recorded significant impairments of our goodwill. To the extent the value of goodwill or intangible assets becomes further impaired, we may be required to incur additional material non-cash charges relating to such impairment. Our operating results may be significantly impacted from both the impairment and the underlying trends in the business that triggered the impairment.
Large capital projects may be subject to delays, can take years to complete, and market conditions could deteriorate significantly between the project approval date and the project startup date, negatively impacting project returns.
Delays in completing capital projects or making required changes or upgrades to our facilities could subject us to fines or penalties as well as affect our ability to supply certain products we produce. Such delays or cost increases may arise as a result of unpredictable factors, many of which are beyond our control, including:
•denials of, delays in receiving, or revocations of requisite regulatory approvals or permits;
•unplanned increases in the cost of construction materials or labor, whether due to inflation or other factors;
•disruptions in transportation of components or construction materials;
•adverse weather conditions, natural disasters or other events (such as equipment malfunctions, explosions, fires or spills) affecting our facilities, or those of vendors or suppliers;
•shortages of sufficiently skilled labor, or labor disagreements resulting in unplanned work stoppages;
•market-related increases in a project’s debt or equity financing costs;
•global supply chain disruptions;
•nonperformance by, or disputes with, vendors, suppliers, contractors or subcontractors; and
•delays due to citizen, state or local political or activist pressure.
Moreover, our revenues may not increase immediately upon the expenditure of funds on a particular project. For instance, if we build a new pipeline, the construction will occur over an extended period of time and we may not receive any material increases in revenues until after completion of the project, if at all.
Any one or more of these factors could have a significant impact on our ongoing capital projects. If we were unable to make up the delays associated with such factors or to recover the related costs, or if market conditions change, it could materially and adversely affect our capital project returns and our business, financial condition, results of operations and cash flows.
Legal and Regulatory Risks
We expect to continue to incur substantial capital expenditures and operating costs to meet the requirements of evolving environmental and other laws or regulations. Additionally, changes to the federal government’s policies and operations could lead to increased regulatory uncertainty and volatility, which may impact our business, financial condition and results of operations.
Our business is subject to numerous environmental laws and regulations. These laws and regulations continue to increase in both number and complexity and affect our business. Laws and regulations expected to become more stringent relate to the following:
•the emission or discharge of materials into the environment;
•solid and hazardous waste management;
•the regulatory classification of materials currently or formerly used in our business;
•pollution prevention;
•climate change and GHG emissions;
•the production, importation, use, and disposal of specific chemicals;
•public and employee safety and health;
•permitting;
•inherently safer technology; and
•facility security.
The specific impact of laws and regulations on us and our competitors may vary depending on a number of factors, including the age and location of operating facilities, marketing areas and production processes and subsequent judicial interpretation of such laws and regulations. We have incurred and will continue to incur substantial capital, operating and maintenance, and remediation expenditures to modify operations, install pollution control equipment, perform site cleanups or curtail operations. We have incurred and may in the future incur liability for personal injury, property damage, natural resource damage or clean-up costs due to alleged contamination and/or exposure to chemicals such as benzene and methyl tert-butyl ether (“MTBE”). There is also increased regulatory interest in PFAS, which we expect will lead to increased monitoring and remediation obligations and potential liability related thereto. Such expenditures could materially and adversely affect our business, financial condition, results of operations and cash flows.
In early 2025, the new U.S. presidential administration announced wide-ranging policy changes and issued numerous executive actions on topics including international trade, energy resources, corporate taxes, global climate change initiatives, employment practices, corporate compliance programs, environmental regulations, as well as other matters. Further, the new presidential administration has indicated an intent to make structural changes to the executive branch of the federal government, including significant reductions in the federal workforce. Continuing legal challenges to many of the policy changes and executive actions are expected. Such actions may directly or indirectly impact our industry and could lead to increased regulatory uncertainty and volatility. We cannot predict how these policy changes and executive actions will be implemented and interpreted, or the ultimate effect they will have on our business, financial condition and results of operations.
Increased regulation of hydraulic fracturing and other oil and gas production activities could result in reductions or delays in U.S. production of crude oil and natural gas, which could adversely affect our results of operations and financial condition.
While we do not conduct hydraulic fracturing operations, we do provide gathering, processing and fractionation services with respect to natural gas and natural gas liquids produced by our customers as a result of such operations. A range of federal, state and local laws and regulations currently govern or, in some cases, prohibit, hydraulic fracturing in some jurisdictions. Stricter laws, regulations and permitting processes may be enacted in the future. If federal, state and local legislation and regulatory initiatives relating to hydraulic fracturing or other oil and gas production activities are enacted or expanded, such efforts could impede oil and gas production, increase producers’ cost of compliance, and result in reduced volumes available for our midstream assets to gather, process and fractionate.
Climate change and GHG emission regulation could affect our operations, energy consumption patterns and regulatory obligations, any of which could adversely impact our results of operations and financial condition.
Currently, multiple legislative and regulatory measures to address GHG (including carbon dioxide, methane and nitrous oxides) and other emissions are in various phases of consideration, promulgation or implementation. These include actions to develop international, federal, regional or statewide programs, which could require reductions in our GHG or other emissions, establish a carbon tax and decrease the demand for refined products. Requiring reductions in these emissions could result in increased costs to (i) operate and maintain our facilities, (ii) install new emission controls at our facilities and (iii) administer and manage any emissions programs, including acquiring emission credits or allotments.
Certain municipalities have also proposed or enacted restrictions on the installation of natural gas appliances and infrastructure in new residential or commercial construction, which could affect demand for the natural gas that we transport and store. Certain jurisdictions have enacted or are considering ordinances that would prohibit construction or expansion of fossil fuel terminals.
Regional and state climate change and air emissions goals and regulatory programs are complex, subject to change and considerable uncertainty due to a number of factors including technological feasibility, legal challenges and potential changes in federal policy. Increasing concerns about climate change and carbon intensity have also resulted in societal concerns and a number of international and national measures to limit GHG emissions. Additional stricter measures and investor pressure can be expected in the future and any of these changes may have a material adverse impact on our business or financial condition.
The scope and magnitude of the changes to U.S. climate change strategy under the current and future administrations, however, remain subject to the passage of legislation and interpretation and action of federal and state regulatory bodies; therefore, the impact to our industry and operations due to GHG regulation is unknown at this time.
Energy companies are subject to increasing environmental and climate-related litigation.
Governmental and other entities in various U.S. states have filed lawsuits against various energy companies, including MPC, alleging damages as a result of climate change, false statements about climate change, and violations of various consumer protection statutes. The plaintiffs are seeking unspecified damages and abatement under various tort theories.
Additionally, private plaintiffs and government parties have undertaken efforts to shut down energy assets by challenging operating permits, the validity of easements or the compliance with easement conditions. For example, the Dakota Access Pipeline, in which we have a minority interest, has been subject to, and may in the future be subject to, litigation seeking a permanent shutdown of the pipeline. There remains a high degree of uncertainty regarding the ultimate outcome of these types of proceedings, as well as their potential effect on our business, financial condition, results of operation and cash flows.
We are subject to risks associated with societal and political pressures and other forms of opposition to the development, transportation and use of carbon-based fuels. Such risks could adversely impact our business and our ability to continue to operate or realize certain growth strategies.
We operate and develop our business with the expectation that regulations and societal sentiment will continue to enable the development, transportation and use of carbon-based fuels. However, policy decisions relating to the production, refining, transportation, storage and marketing of carbon-based fuels are subject to political pressures and the influence of public sentiment on GHG emissions, climate change, and climate adaptation. Additionally, societal sentiment regarding carbon-based fuels may adversely impact our reputation and MPC’s ability to attract and retain the employees who provide services to us.
The approval process for our projects has become increasingly challenging, due in part to state and local concerns related to pipelines, negative public perception regarding the oil and gas industry, and concerns regarding GHG emissions downstream of pipeline operations. Our expansion or construction projects may not be completed on schedule (or at all), or at the budgeted cost. We also may be required to incur additional costs and expenses in connection with the design and installation of our facilities due to their location and the surrounding terrain. We may be required to install additional facilities, incur additional capital and operating expenditures, or experience interruptions in or impairments of our operations to the extent that the facilities are not designed or installed correctly.
Increasing attention to environmental, social and governance matters may impact our business and financial results.
In recent years, increasing attention has been given to corporate activities related to ESG matters in public discourse and the investment community, including climate change, energy transition matters, and inclusion. A number of advocacy groups, both domestically and internationally, have campaigned for governmental and private action to promote ESG-related change at public companies, including, but not limited to, through the investment and voting practices of investment advisers, pension funds, universities and other members of the investing community. These activities include increasing attention and demands for action related to climate change and energy transition matters, such as promoting the use of substitutes to fossil fuel products and encouraging the divestment of fossil fuel equities, as well as pressuring lenders and other financial services companies to limit or curtail activities with fossil fuel companies. If this were to continue, it could have a material adverse effect on our access to capital. Members of the investment community have begun to screen companies such as ours for sustainability performance, including practices related to GHG emission reduction and energy transition strategies. If we are unable to find economically viable, as well as publicly acceptable, solutions that reduce our GHG emissions, reduce GHG intensity for new and existing projects, increase our non-fossil fuel product portfolio, and/or address other ESG-related stakeholder concerns, our business and results of operations could be materially and adversely affected. Further, our reputation could be damaged as a result of our support of, association with or lack of support or disapproval of certain social causes, as well as any decisions we make to continue to conduct, or change, certain of our activities in response to such considerations.
Our goals, targets and disclosures related to ESG matters expose us to numerous risks, including risks to our reputation and unit price.
Companies across all industries are facing increasing scrutiny from stakeholders related to ESG matters, including practices and disclosures regarding climate-related initiatives. In 2022, MPLX established a target to reduce methane emissions intensity and MPC, MPLX’s largest customer, has established a target to reduce GHG emissions. These targets reflect our current plans and aspirations and are not guarantees that we will be able to achieve them. We assess progress with these targets on an annual basis. We may modify, discontinue, update or expand targets or adopt new metrics as new information, opportunities, and technologies become available. Further, there are conflicting expectations and priorities from regulatory authorities, investors, voluntary reporting frame works, and other stakeholders surrounding accounting and disclosure of ESG matters and climate related initiatives. Our efforts to accomplish and accurately report on these goals and objectives, which may be, in part, dependent on the actions of suppliers and other third parties, present numerous operational, regulatory, reputational, financial, legal, and other risks, any of which could have a material negative impact, including on our reputation and unit price.
Efforts to achieve goals and targets, such as the foregoing and future internal climate-related initiatives, may increase costs, require purchase of carbon credits, or limit or impact our business plans and financial results, potentially resulting in the reduction to the economic end-of-life of certain assets and an impairment of the associated net book value, among other material adverse impacts. Additionally, as the nature, scope and complexity of ESG reporting, calculation methodologies, voluntary reporting standards and disclosure requirements expand, including the SEC’s currently stayed disclosure requirements regarding, among other matters, GHG emissions, we may have to undertake additional costs to control, assess and report on ESG metrics. Our failure or perceived failure to pursue or fulfill such goals and targets or to satisfy various reporting standards within the timelines we announce, or at all, could have a negative impact on investor sentiment, ratings outcomes for evaluating our approach to ESG matters, unit price, and cost of capital and expose us to government enforcement actions and private litigation, among other material adverse impacts.
Certain of our facilities are located on Native American tribal lands and are subject to various federal and tribal approvals and regulations, which can increase our costs and delay or prevent our efforts to conduct operations.
Various federal agencies within the U.S. Department of the Interior, particularly the Bureau of Indian Affairs, along with each Native American tribe, regulate natural gas and oil operations on Native American tribal lands. In addition, each Native American tribe is a sovereign nation having the right to enforce laws and regulations and to grant approvals independent from federal, state and local statutes and regulations. These tribal laws and regulations include various taxes, fees, requirements to employ Native American tribal members and other conditions that apply to operators and contractors conducting operations on Native American
tribal lands. Persons conducting operations on tribal lands are generally subject to the Native American tribal court system. In addition, if our relationships with any of the relevant Native American tribes were to deteriorate, we could face significant risks to our ability to continue operations on Native American tribal lands. One or more of these factors has in the past and may in the future increase our cost of doing business on Native American tribal lands and impact the viability of, or prevent or delay our ability to conduct our operations on such lands. For example, we are subject to ongoing litigation regarding trespass claims relating to a portion of the Tesoro High Plains Pipeline in North Dakota.
Our operations could be disrupted if we are unable to maintain or obtain real property rights required for our business.
We do not own all of the land on which our assets are located, but rather obtain the rights to construct and operate such assets on land owned by third parties and governmental agencies for a specific period of time. Therefore, we are subject to the possibility of more burdensome terms and increased costs to obtain and retain necessary land use if our leases, rights-of-way or other property rights lapse, terminate or are reduced or it is determined that we do not have valid leases, rights-of-way or other property rights. For example, a portion of the Tesoro High Plains Pipeline in North Dakota remains shut down following delays in renewing a right-of-way necessary for the operation of a section of the pipeline. Any loss of or reduction in these rights, including loss or reduction due to legal, governmental or other actions or difficulty renewing leases, right-of-way agreements or permits on satisfactory terms or at all, could have a material adverse effect on our business, results of operations, financial condition and ability to make cash distributions to our unitholders.
If foreign investment in us or our general partner exceeds certain levels, we could be prohibited from operating inland river vessels, which could materially and adversely affect our business, financial condition, results of operations and cash flows.
The Shipping Act of 1916 and Merchant Marine Act of 1920 (together, the “Maritime Laws”), generally require that vessels engaged in U.S. coastwise trade be owned by U.S. citizens. Among other requirements to establish citizenship, entities that own such vessels must be owned at least 75 percent by U.S. citizens. If we fail to maintain compliance with the Maritime Laws, we would be prohibited from operating vessels in the U.S. inland waters. Such a prohibition could materially and adversely affect our business, financial condition, results of operations and cash flows.
Some of our natural gas, NGL, crude oil and refined product pipelines are subject to FERC’s rate-making policies that could have an adverse impact on our ability to establish rates that would allow us to recover the full cost of operating our pipelines, plus a reasonable return.
A number of our pipelines provide interstate service that is subject to regulation by FERC. FERC prescribes rate methodologies for developing regulated tariff rates for these natural gas, interstate oil and products pipelines. FERC’s regulated tariff may not allow us to recover all of our costs of providing services. Changes in FERC’s approved rate methodologies, or challenges to our application of an approved methodology, could also adversely affect our rates. Additionally, shippers may protest (and FERC may investigate) the lawfulness of tariff rates. FERC can require refunds of amounts collected pursuant to rates that are ultimately found to be unlawful and prescribe new rates prospectively. Action by FERC could adversely affect our ability to establish reasonable rates that cover operating costs and allow for a reasonable return. An adverse determination in any future rate proceeding brought by or against us could have a material adverse effect on our business, financial condition and results of operations.
Pipelines and operations not subject to regulation by FERC may still be subject to regulation by various state agencies. The applicable statutes and regulations generally require that our rates and terms and conditions of service provide no more than a fair return on the aggregate value of the facilities used to render services and that we offer service to our shippers on a not unduly discriminatory basis. FERC rate cases can involve complex and expensive proceedings. For more information regarding regulatory matters that could affect our business, please read Item 1. Business – Regulatory Matters as set forth in this Annual Report on Form 10-K.
We may incur significant costs and liabilities resulting from performance of pipeline integrity programs and related repairs, and the expansion of pipeline safety laws and regulations could require us to use more comprehensive and stringent safety controls and subject us to increased capital and operating costs.
The DOT through the PHMSA has adopted regulations requiring pipeline operators to develop integrity management programs for gas transmission and hazardous liquids pipelines located where a leak or rupture could do the most harm. The regulations require the following of operators of covered pipelines to:
•perform ongoing assessments of pipeline integrity;
•identify and characterize applicable threats to pipeline segments that could impact a high consequence area;
•improve data collection, integration and analysis;
•repair and remediate the pipeline as necessary; and
•implement preventive and mitigating actions.
Some states have adopted regulations similar to existing PHMSA regulations for intrastate gathering and transmission lines. The adoption of additional laws or regulations that apply more comprehensive or stringent safety standards to gas, NGL, crude oil and refined product lines or other facilities, or the expansion of regulatory inspections by regulators, could require us to install
new or modified safety controls, pursue added capital projects, make modifications or operational changes, or conduct maintenance programs on an accelerated basis, all of which could require us to incur increased capital and operational costs or operational delays that could be significant and have a material adverse effect on our financial position or results of operations and ability to make distributions to our unitholders.
Transaction Risks
If we are unable to make strategic acquisitions on economically acceptable terms from MPC or third parties, our ability to implement our business strategy may be impaired.
In addition to organic growth, a component of our business strategy can include the expansion of our operations through strategic acquisitions. If we are unable to make accretive strategic acquisitions from MPC or third parties that increase the cash generated from operations per unit, whether due to an inability to identify attractive acquisition candidates, to negotiate acceptable purchase contracts, or to obtain financing for these acquisitions on economically acceptable terms, then our ability to successfully implement our business strategy may be impaired.
Future acquisitions will involve the integration of new assets or businesses and may present substantial risks that could adversely affect our business, financial conditions, results of operations and cash flows.
Future transactions involving the addition of new assets or businesses will present risks, which may include, among others:
•inaccurate assumptions about future synergies, revenues, capital expenditures and operating costs;
•an inability to successfully integrate, or a delay in the successful integration of, assets or businesses we acquire;
•a decrease in our liquidity resulting from using a portion of our available cash or borrowing capacity under our revolving credit agreement to finance transactions;
•a significant increase in our interest expense or financial leverage if we incur additional debt to finance transactions;
•the assumption of unknown environmental and other liabilities, losses or costs for which we are not indemnified or for which our indemnity is inadequate;
•the diversion of management’s attention from other business concerns;
•the loss of customers or key employees from the acquired businesses; and
•the incurrence of other significant charges, such as impairment of goodwill or other intangible assets, asset devaluation or restructuring charges.
Risks Relating to the Business and Operations of MPC
MPC accounts for a substantial portion of our revenues. If MPC is unable to satisfy its obligations to us or significantly reduces the volumes transported through our facilities or stored at our storage assets, our revenues would decline and our financial condition, results of operations, cash flows, and ability to make distributions to our unitholders would be materially and adversely affected.
We derive a substantial portion of our revenues from MPC. Any event that materially and adversely affects MPC’s financial condition, results of operations or cash flows may adversely affect our ability to sustain or increase distributions to our unitholders. Accordingly, we are indirectly subject to the operational and business decisions and risks of MPC, which include the following:
•the timing and extent of changes in commodity prices and demand for MPC’s products, and the availability and costs of crude oil and other refinery feedstocks;
•a material decrease in the refining margins at MPC’s refineries;
•disruptions due to equipment interruption or failure at MPC’s facilities or at third-party facilities on which MPC’s business is dependent;
•any decision by MPC to temporarily or permanently alter, curtail or shut down operations at one or more of its refineries or other facilities and reduce or terminate its obligations under our transportation and storage or refining logistics and fuels distribution agreements;
•changes to the routing of volumes shipped by MPC on our crude oil and refined product pipelines or the ability of MPC to utilize third-party pipeline connections to access our pipelines;
•MPC’s ability to remain in compliance with the terms of its outstanding indebtedness;
•changes in the cost or availability of third-party pipelines, railways, vessels, terminals and other means of delivering and transporting crude oil, feedstocks, refined products, other hydrocarbon-based products and renewables;
•state and federal environmental, economic, health and safety, energy and other policies and regulations, and any changes in those policies and regulations;
•imposition of new economic sanctions against Russia or other countries and the effects of potential responsive countermeasures;
•environmental incidents and violations and related remediation costs, fines and other liabilities;
•operational hazards and other incidents at MPC’s refineries and other facilities, such as explosions and fires, that result in temporary or permanent shut downs of those refineries and facilities;
•changes in crude oil and refined product inventory levels and carrying costs; and
•disruptions due to hurricanes, tornadoes or other forces of nature.
MPC is not obligated to use our services with respect to volumes in excess of the minimum volume commitments under its agreements with us. If MPC satisfies only its minimum obligations under, or if we are unable to renew or extend, the transportation, terminal, fuels distribution, marketing and storage services agreements we have with MPC, or if MPC elects to use credits upon the expiration or termination of an agreement, our cash available for distribution will be materially and adversely affected.
In addition, significant stockholders of MPC may attempt to effect changes at MPC or acquire control of the company, which could impact the pursuit of MPC’s business strategies. Campaigns by stockholders to effect changes at publicly traded companies are sometimes led by investors seeking to increase short-term stockholder value through actions such as financial restructuring, increased debt, special dividends, stock repurchases or sales of assets or the entire company. As a result, stockholder campaigns at MPC could directly or indirectly adversely affect our results of operations and financial condition and our ability to sustain or increase distributions to our unitholders.
MPC may suspend, reduce or terminate its obligations under its agreements with us in some circumstances, which could have a material adverse effect on our financial condition, results of operations, cash flows and ability to make distributions to our unitholders.
Certain of our transportation, terminal, fuels distribution, marketing and storage services agreements with MPC include provisions that permit MPC to suspend, reduce or terminate its obligations under the applicable agreement if certain events occur. These events include a material breach of the applicable agreement by us, MPC being prevented from transporting its full minimum volume commitment because of capacity constraints on our pipelines, certain force majeure events that would prevent us from performing some or all of the required services under the applicable agreement and MPC’s determination to suspend refining operations at one of its refineries. MPC has the discretion to make such decisions notwithstanding the fact that they may significantly and adversely affect us. These actions could result in a suspension, reduction or termination of MPC’s obligations under one or more transportation and storage services agreements.
Any such reduction, suspension or termination of MPC’s obligations could have a material adverse effect on our financial condition, results of operations, cash flows and ability to make distributions to our unitholders.
MPC’s level of indebtedness, the terms of its borrowings and its credit ratings could adversely affect our ability to grow our business and our ability to make distributions to our unitholders. Our ability to obtain credit in the future may also be adversely affected by MPC’s credit rating.
MPC must devote a portion of its cash flows from operating activities to service its indebtedness, and therefore, cash flows may not be available for use in pursuing its growth strategy. Furthermore, a higher level of indebtedness at MPC in the future increases the risk that it may default on its obligations to us under our transportation and storage services agreements. As of December 31, 2024, MPC had consolidated long-term indebtedness of approximately $27.8 billion, of which $6.6 billion was a direct obligation of MPC or its subsidiaries other than MPLX or its consolidated subsidiaries. The covenants contained in the agreements governing MPC’s outstanding and future indebtedness may limit its ability to borrow additional funds for development and make certain investments and may directly or indirectly impact our operations in a similar manner.
Furthermore, if MPC were to default under certain of its debt obligations, there is a risk that MPC’s creditors would attempt to assert claims against our assets during the litigation of their claims against MPC. The defense of any such claims could be costly and could materially impact our financial condition, even absent any adverse determination. If these claims were successful, our ability to meet our obligations to our creditors, make distributions and finance our operations could be materially and adversely affected.
Rating agencies have in the past, and may in the future, change MPLX’s credit ratings or credit outlook following developments at MPC. If these ratings are lowered in the future, the interest rate and fees MPC pays on its credit facilities may increase. Credit rating agencies will likely consider MPC’s debt ratings when assigning ours because of MPC’s ownership interest in us, the significant commercial relationships between MPC and us, and our reliance on MPC for a portion of our revenues. If one or more credit rating agencies were to downgrade the outstanding indebtedness of us or MPC, we could experience an increase in our borrowing costs or difficulty accessing the capital markets. Such a development could adversely affect our ability to grow our business and to make distributions to our unitholders.
Tax Risks
Our tax treatment depends on our status as a partnership for federal income tax purposes as well as our not being subject to a material amount of entity level taxation by individual states. If the IRS were to treat us as a corporation for federal income tax purposes, or we become subject to a material amount of entity level taxation for state tax purposes, it would substantially reduce the amount of cash available for distribution to our unitholders.
The anticipated after-tax economic benefit of an investment in our common units depends largely on our being treated as a partnership for federal income tax purposes. We have not requested, and do not plan to request, a ruling from the IRS on this.
A publicly traded partnership such as us may be treated as a corporation for federal income tax purposes unless it satisfies a “qualifying income” requirement. Based on our current operations, we believe that we are treated as a partnership rather than as a corporation for such purposes; however, a change in our business or a change in current law could cause us to be treated as a corporation for federal income tax purposes. The IRS may adopt positions that differ from the ones we take. A successful IRS contest of the federal income tax positions we take may adversely impact the market for our common units, and the costs of any IRS contest will reduce our cash available for distribution to unitholders.
If we were treated as a corporation for federal income tax purposes, we would pay federal income tax on our taxable income at the corporate tax rate, which is currently a maximum of 21 percent, and likely would pay state and local income tax at varying rates. Distributions to unitholders generally would be taxed again as corporate dividends, and no income, gains, losses, deductions, or credits would flow through to our unitholders. Treatment of us as a corporation would result in a material reduction in the anticipated cash flow and after-tax return to our unitholders, likely causing a substantial reduction in the value of our common units. Changes in current state or local law may subject us to additional entity-level taxation by individual states and localities. For example, we are currently subject to state and local taxes in Texas and Tennessee and certain localities in Kentucky, Michigan and Ohio. Imposition of any such additional taxes on us may substantially reduce the cash available for distribution to unitholders.
Our Partnership Agreement provides that, if a law is enacted or an existing law is modified or interpreted in a manner that subjects us to taxation as a corporation or otherwise subjects us to entity-level taxation for federal, state or local income tax purposes, the minimum quarterly distribution amount and the target distribution amounts may be adjusted to reflect the impact of that law on us.
If the IRS contests the federal income tax positions we take, the market for our common units may be adversely impacted and the cost of any IRS contest will reduce our cash available for distribution.
The IRS has made no determination as to our status as a partnership for federal income tax purposes. The IRS may adopt positions that differ from the positions we take. It may be necessary to resort to administrative or court proceedings to sustain some or all the positions we take. A court may not agree with some or all of the positions we take. Any contest with the IRS may materially and adversely impact the market for our common units and the price at which they trade. In addition, our costs of any contest with the IRS will be borne indirectly by our unitholders and our general partner because the costs will reduce our cash available for distribution.
Our unitholders will be required to pay taxes on their share of income even if they do not receive any distributions from us.
Because our unitholders will be treated as partners to whom we will allocate taxable income that could be different in amount than the cash we distribute, our unitholders will be required to pay any federal income taxes and, in some cases, state and local income taxes on their share of our taxable income even if they receive no distributions from us. Our unitholders may not receive distributions from us equal to their share of our taxable income or even equal to the actual tax liability that result from that income.
Tax gain or loss on the disposition of our common units could be more or less than expected.
If our unitholders sell their common units, they will recognize gain or loss equal to the difference between the amount realized and their tax basis in those common units. Because distributions in excess of a unitholder’s allocable share of our net taxable income decrease the unitholder’s tax basis in their common units, the amount, if any, of such prior excess distributions with respect to their units will, in effect, increase taxable income to the unitholder. Furthermore, a substantial portion of the amount realized, whether or not representing gain, may be taxed as ordinary income due to potential recapture items, including depreciation recapture. In addition, because the amount realized includes a unitholder’s share of our non-recourse liabilities, if a unitholder sells units, the unitholder may incur taxable income in excess of the amount of cash received from the sale.
Tax-exempt entities face unique tax issues from owning our common units that may result in adverse tax consequences to them.
Investment in our common units by tax-exempt entities, such as employee benefit plans and individual retirement accounts (known as IRAs), raises issues unique to them. For example, virtually all of our income allocated to organizations that are exempt from federal income tax, including IRAs and other retirement plans, will be unrelated business taxable income and will be taxable to them. Furthermore, a tax-exempt entity’s gain on sale of common units may be treated, at least in part, as unrelated business taxable income. Tax-exempt entities should consult their tax advisor before investing in our common units.
Non-U.S. unitholders will be subject to United States taxes and withholding with respect to their income and gain from owning our units.
Non-U.S. unitholders are generally taxed and subject to income tax filing requirements by the United States on income effectively connected with a U.S. trade or business. All income allocated to our unitholders and any gain from the sale of our units will generally be considered to be “effectively connected” with a U.S. trade or business. As a result, all distributions to non-U.S. unitholders will be subject to withholding taxes at the highest applicable effective tax rate, and, in the event of a sale of our units by a non-U.S. unitholder, such non-U.S. unitholder will be subject to withholding taxes on all proceeds attributable to the sale of such units.
Furthermore, while non-U.S. unitholders are subject to additional withholding on distributions in excess of cumulative net income, we do not calculate cumulative net income for withholding purposes. Consequently, all of our distributions to non-U.S. unitholders will be subject to such additional withholding.
Non-U.S. unitholders will be required to file U.S. federal tax returns and pay tax on their share of our taxable income. Non-U.S. unitholders will also potentially have tax filings and payment obligations in additional jurisdictions.
We treat each purchaser of common units as having the same tax benefits without regard to the actual units purchased. The IRS may challenge this treatment, which could adversely affect the value of the common units.
Because we cannot match transferors and transferees of common units and to enable the uniformity of the economic and tax characteristics of common units, we have adopted depreciation and amortization positions that may not conform to all aspects of existing Treasury Regulations. A successful IRS challenge to those positions could adversely affect the amount of tax benefits available to our unitholders. It also could affect the timing of these tax benefits or the amount of gain from the sale of common units and could have a negative impact on the value of our common units or result in audit adjustments to our unitholders’ tax returns.
Our unitholders will likely be subject to state and local taxes and return filing requirements in states where they do not live as a result of investing in our units.
In addition to federal income taxes, our unitholders will likely be subject to other taxes, including state and local taxes, unincorporated business taxes and estate, inheritance or intangible taxes that are imposed by the various jurisdictions in which we do business or own property now or in the future, even if our unitholders do not live in any of those jurisdictions. Our unitholders will likely be required to file state and local income tax returns and pay state and local income taxes in some or all of these various jurisdictions. Further, our unitholders may be subject to penalties for failure to comply with those requirements. We currently conduct business in a substantial number of states, most of which currently impose a personal income tax and many of which impose an income tax on corporations and other entities. As we make acquisitions or expand our business, we may own assets or conduct business in additional states. It is our unitholders’ responsibility to file all U.S. federal, state and local tax returns.
We have adopted certain valuation methodologies that may result in a shift of income, gain, loss and deduction between our general partner and our unitholders. The IRS may challenge this treatment, which could adversely affect the value of the common units.
When we issue additional units or engage in certain other transactions, we must determine the fair market value of our assets and allocate any unrealized gain or loss attributable to our assets to the capital accounts of our unitholders and our general partner. Our methodology may be viewed as understating the value of our assets. In that case, there may be a shift of income, gain, loss and deduction between certain unitholders and the general partner, which may be unfavorable to such unitholders. Moreover, under our valuation methods, subsequent purchasers of common units may have a greater portion of their Internal Revenue Code Section 743(b) adjustment allocated to our tangible assets and a lesser portion allocated to our intangible assets. The IRS may challenge our valuation methods, our allocation of the Section 743(b) adjustment attributable to our tangible and intangible assets, or our allocations of income, gain, loss and deduction between our general partner and certain of our unitholders.
A successful IRS challenge to these methods or allocations could adversely affect the amount of taxable income or loss being allocated to our unitholders. It also could affect the amount of gain from our unitholders’ sale of common units and could have a negative impact on the value of the common units or result in audit adjustments to our unitholders’ tax returns without the benefit of additional deductions.
A unitholder whose common units are the subject of a securities loan (e.g., a loan to a short seller) may be considered as having disposed of those common units. If so, the unitholder would no longer be treated for tax purposes as a partner with respect to those common units during the period of the loan and may recognize gain or loss from the disposition.
A unitholder whose common units are the subject of a securities loan (i) may be considered as having disposed of the loaned common units, (ii) may no longer be treated for tax purposes as a partner with respect to those common units during the period of the loan to the short seller and (iii) may recognize gain or loss from such disposition.
Moreover, during the period of the loan, any of our income, gain, loss or deduction with respect to those common units may not be reportable by the unitholder and any distributions received by the unitholder as to those common units could be fully taxable as ordinary income. Unitholders desiring to assure their status as partners and avoid the risk of gain recognition from a securities loan are urged to consult a tax adviser to discuss whether it is advisable to modify any applicable brokerage account agreements to prohibit their brokers from borrowing their common units.
The tax treatment of publicly traded partnerships or an investment in our units could be subject to potential legislative, judicial or administrative changes and differing interpretations, possibly on a retroactive basis.
The present U.S. federal income tax treatment of publicly traded partnerships, including us, or an investment in our common units may be modified by administrative, legislative or judicial interpretation at any time. From time to time, the President and members of the U.S. Congress propose and consider substantive changes to the existing U.S. federal income tax laws that would affect publicly traded partnerships, including proposals that would eliminate our ability to qualify for partnership tax treatment.
We are unable to predict whether any such changes will ultimately be enacted. Any modification to the U.S. federal income tax laws and interpretations thereof may or may not be applied retroactively and could make it more difficult or impossible to meet the exception for certain publicly traded partnerships to be treated as partnerships for U.S. federal income tax purposes or increase the amount of taxes payable by unitholders in publicly traded partnerships.
We generally prorate our items of income, gain, loss and deduction between transferors and transferees of our units each month based upon the ownership of our units on the first day of each month, instead of on the basis of the date a particular unit is transferred. The IRS may challenge this treatment, which could change the allocation of items of income, gain, loss and deduction among our unitholders.
We generally prorate our items of income, gain, loss and deduction between existing unitholders and unitholders who purchase our units based upon the ownership of our units on the first day of each month, instead of on the basis of the date a particular unit is transferred. Similarly, we generally allocate certain deductions for depreciation of capital additions, gain or loss realized on a sale or other disposition of our assets and, in the discretion of our general partner, any other extraordinary item of income, gain, loss or deduction based upon ownership on the allocation date. Treasury Regulations allow a similar monthly simplifying convention, but such regulations do not specifically authorize all aspects of the proration method we have adopted. If the IRS were to challenge our proration method or new Treasury Regulations were issued, we may be required to change the allocation of items of income, gain, loss and deduction among our unitholders.
Unitholders may be subject to limitations on their ability to deduct interest expense we incur.
In general, we are entitled to a deduction for interest paid or accrued on indebtedness properly allocable to our trade or business during our taxable year. However, under the Tax Cuts and Jobs Act, for taxable years beginning after December 31, 2017, our deduction for “business interest” is generally limited to the sum of our business interest income and 30 percent of our “adjusted taxable income.” For the purposes of this limitation, our adjusted taxable income is computed without regard to any business interest expense or business interest income, and in the case of taxable years beginning before January 1, 2022, our adjusted taxable income is also computed without regard to any depreciation or amortization.
If our “business interest” is subject to limitation under these rules, our unitholders will be limited in their ability to deduct their share of any interest expense that has been allocated to them in the current taxable year and may be limited in their ability to deduct such interest expense in a future taxable year. As a result, unitholders may be subject to limitation on their ability to deduct interest expense incurred by us.
If the IRS makes audit adjustments to our income tax returns for tax years beginning after 2017, it (and some states) may collect any resulting taxes (including any applicable penalties and interest) directly from us, in which case our cash available for distribution to our unitholders might be substantially reduced.
If the IRS makes audit adjustments to our income tax returns for tax years beginning after December 31, 2017, it (and some states) may collect any resulting taxes (including any applicable penalties and interest) directly from us. We will generally have certain limited rights to shift any such tax liability to our general partner and our unitholders in accordance with their interests in us during the year under audit, but there can be no assurance that we will be able to do so (or choose to do so) under all circumstances. As a result, our current unitholders may bear some or all of the tax liability resulting from such audit adjustment, even if such unitholders did not own units in us during the tax year under audit. If we are required to make payments of taxes, penalties and interest resulting from audit adjustments, our cash available for distribution to our unitholders might be reduced.
Common Unit Ownership Risks
Our general partner and its affiliates, including MPC, have conflicts of interest with us and limited duties to us and our unitholders, and they may favor their own interests to our detriment and that of our unitholders. Additionally, we have no control over MPC’s business decisions and operations, and MPC is under no obligation to adopt a business strategy that favors us.
MPC owned our general partner and approximately 63 percent of our outstanding common units as of February 21, 2025. Although our general partner has a duty to manage us in a manner that is not adverse to the best interests of our partnership,
conflicts of interest may arise between MPC and its affiliates, including our general partner, on the one hand, and us and our unitholders, on the other hand. In resolving these conflicts, the general partner may favor its own interests and the interests of its affiliates, including MPC, over the interests of our common unitholders, which may occur under our Partnership Agreement without being independently reviewed by the conflicts committee. These conflicts include, among others, the following situations:
•neither our Partnership Agreement nor any other agreement requires MPC to pursue a business strategy that favors us or utilizes our assets, which could involve decisions by MPC to increase or decrease refinery production, shut down or reconfigure a refinery, or pursue and grow particular markets;
•MPC’s directors and officers have a fiduciary duty to make decisions in the best interests of the stockholders of MPC;
•disputes may arise under agreements pursuant to which MPC and its affiliates are our customers;
•MPC may be constrained by the terms of its debt instruments from taking actions, or refraining from taking actions, that may be in our best interests;
•except in limited circumstances, our general partner has the power and authority to conduct our business without unitholder approval;
•our general partner will determine the amount and timing of asset purchases and sales, borrowings, issuance of additional partnership securities and the creation, reduction or increase of cash reserves, each of which can affect the amount of cash that is distributed to our unitholders;
•our general partner will determine the amount and timing of many of our cash expenditures and whether a cash expenditure is classified as an expansion capital expenditure, which would not reduce operating surplus, or a maintenance capital expenditure, which would reduce our operating surplus. This determination can affect the amount of cash that is distributed to our unitholders, including MPC, and the amount of adjusted operating surplus generated in any given period;
•our general partner will determine which costs incurred by it are reimbursable by us and may cause us to pay it or its affiliates for any services rendered to us;
•our general partner may cause us to borrow funds in order to permit the payment of distributions;
•our Partnership Agreement permits us to classify up to $60 million as operating surplus, even if it is generated from asset sales, non-working capital borrowings or other sources that would otherwise constitute capital surplus. This cash may be used to fund distributions to our unitholders, including MPC;
•our Partnership Agreement does not restrict our general partner from entering into additional contractual arrangements with it or its affiliates on our behalf;
•our general partner intends to limit its liability regarding our contractual and other obligations;
•our general partner may exercise its right to call and purchase all of the common units not owned by it and its affiliates if it and its affiliates own more than 85 percent of the common units;
•our general partner controls the enforcement of obligations owed to us by our general partner and its affiliates, including our transportation and storage services agreements with MPC; and
•our general partner decides whether to retain separate counsel, accountants or others to perform services for us.
Under the terms of our Partnership Agreement, the doctrine of corporate opportunity, or any analogous doctrine, does not apply to our general partner or any of its affiliates, including its executive officers, directors and owners.
Any such person or entity that becomes aware of a potential transaction, agreement, arrangement or other matter that may be an opportunity for us will not have any duty to communicate or offer such opportunity to us. Any such person or entity will not be liable to us or to any limited partner for breach of any fiduciary duty or other duty by reason of the fact that such person or entity pursues or acquires such opportunity for itself, directs such opportunity to another person or entity or does not communicate such opportunity or information to us. This may create actual and potential conflicts of interest between us and affiliates of our general partner and result in less than favorable treatment of us and our unitholders.
Our Partnership Agreement requires that we distribute all of our available cash, which could limit our ability to grow and make acquisitions.
Our Partnership Agreement requires that we distribute all of our available cash to our unitholders. As a result, we may require external financing sources, including commercial bank borrowings and the issuance of debt and equity securities, to fund our acquisitions and expansion capital expenditures. Therefore, to the extent we are unable to finance our growth externally, our cash distribution policy will significantly impair our ability to grow. In addition, because we will distribute all of our available cash, our growth may not be as fast as that of businesses that reinvest their available cash to expand ongoing operations. To the extent we issue additional units in connection with any acquisitions or expansion capital expenditures, the payment of distributions on those additional units may increase the risk that we will be unable to maintain or increase our per unit distribution level. The incurrence of additional commercial borrowings or other debt to finance our growth strategy would result in increased interest expense, which, in turn, may reduce the amount of cash available to distribute to our unitholders.
Our Partnership Agreement replaces our general partner’s fiduciary duties to holders of our common units with contractual standards governing its duties and restricts the remedies available to unitholders for actions taken by our general partner.
Our Partnership Agreement contains provisions that eliminate the fiduciary standards to which our general partner would otherwise be held by state fiduciary duty law and replaces those duties with several different contractual standards. For example, our Partnership Agreement permits our general partner to make a number of decisions in its individual capacity, as opposed to in its capacity as our general partner, free of any duties to us and our unitholders other than the implied contractual covenant of good faith and fair dealing. Our general partner is entitled to consider only the interests and factors that it desires and is relieved of any duty or obligation to give consideration to any interest of, or factors affecting, us, our affiliates or our limited partners.
Our Partnership Agreement contains provisions that restrict the remedies available to unitholders for actions taken by our general partner that might otherwise constitute breaches of fiduciary duty under state fiduciary duty law. For example, our Partnership Agreement:
•provides that whenever our general partner makes a determination or takes, or declines to take, any other action in its capacity as our general partner, our general partner is required to make such determination, or take or decline to take such other action, in good faith and will not be subject to any other or different standard imposed by our Partnership Agreement, Delaware law, or any other law, rule or regulation, or at equity;
•provides that our general partner will not have any liability to us or our unitholders for decisions made in its capacity as a general partner so long as it acted in good faith;
•provides that our general partner and its officers and directors will not be liable for monetary damages to us or our limited partners resulting from any act or omission unless there has been a final and non-appealable judgment entered by a court of competent jurisdiction determining that our general partner or its officers and directors, as the case may be, acted in bad faith or engaged in fraud or willful misconduct or, in the case of a criminal matter, acted with knowledge that the conduct was criminal; and
•provides that our general partner will not be in breach of its obligations under our Partnership Agreement or its fiduciary duties to us or our limited partners if a transaction with an affiliate or the resolution of a conflict of interest is approved in accordance with, or otherwise meets the standards set forth in, our Partnership Agreement.
In connection with a transaction with an affiliate or a conflict of interest, our Partnership Agreement provides that any determination by our general partner must be made in good faith, and that our conflicts committee and the board of directors of our general partner are entitled to a presumption that they acted in good faith. In any proceeding brought by or on behalf of any limited partner or the partnership, the person bringing or prosecuting such proceeding will have the burden of overcoming such presumption. By purchasing a common unit, a unitholder is treated as having consented to the provisions in our Partnership Agreement, including the provisions discussed above.
Unitholders have very limited voting rights and, even if they are dissatisfied, they have limited ability to remove our general partner without its consent.
Unlike the holders of common stock in a corporation, unitholders have only limited voting rights on matters affecting our business and, therefore, limited ability to influence management’s decisions regarding our business. Unitholders did not elect our general partner or the board of directors of our general partner and will have no right to elect our general partner or the board of directors of our general partner on an annual or other continuing basis. The board of directors of our general partner is chosen by the members of our general partner, which are wholly owned subsidiaries of MPC. Furthermore, if the unitholders are dissatisfied with the performance of our general partner, they will have little ability to remove our general partner. The vote of the holders of at least 66 2/3 percent of all outstanding common units voting together as a single class is required to remove our general partner. As of February 21, 2025, our general partner and its affiliates owned approximately 63 percent of the outstanding common units (excluding common units held by officers and directors of our general partner and MPC). As a result of these limitations, the price at which our common units will trade could be diminished because of the absence or reduction of a takeover premium in the trading price.
Furthermore, unitholders’ voting rights are further restricted by the Partnership Agreement provision providing that any units held by a person that owns 20 percent or more of any class of units then outstanding, other than our general partner, its affiliates, their transferees, and persons who acquired such units with the prior approval of the board of directors of our general partner, cannot vote on any matter.
Our Partnership Agreement also contains provisions limiting the ability of unitholders to call meetings or to acquire information about our operations, as well as other provisions limiting the unitholders’ ability to influence the manner or direction of management.
If unitholders are not both citizenship-eligible holders and rate-eligible holders, their common units may be subject to redemption.
In order to avoid (1) any material adverse effect on the maximum applicable rates that can be charged to customers by our subsidiaries on assets that are subject to rate regulation by the FERC or analogous regulatory body and (2) any substantial risk of cancellation or forfeiture of any property, including any governmental permit, endorsement or other authorization, in which we
have an interest, we have adopted certain requirements regarding those investors who may own our common units. Citizenship eligible holders are individuals or entities whose nationality, citizenship or other related status does not create a substantial risk of cancellation or forfeiture of any property, including any governmental permit, endorsement or authorization, in which we have an interest, and will generally include individuals and entities who are U.S. citizens. Rate-eligible holders are individuals or entities subject to U.S. federal income taxation on the income generated by us or entities not subject to U.S. federal income taxation on the income generated by us, so long as all of the entity’s owners are subject to such taxation. If unitholders are not persons who meet the requirements to be citizenship-eligible holders and rate-eligible holders, they run the risk of having their units redeemed by us at the market price as of the date three days before the date the notice of redemption is mailed. The redemption price will be paid in cash or by delivery of a promissory note, as determined by our general partner. In addition, if unitholders are not persons who meet the requirements to be citizenship eligible holders, they will not be entitled to voting rights.
Cost reimbursements, which will be determined in our general partner’s sole discretion, and fees due our general partner and its affiliates for services provided will be substantial and will reduce our cash available for distribution.
Under our Partnership Agreement, we are required to reimburse our general partner and its affiliates for all costs and expenses that they incur on our behalf for managing and controlling our business and operations. Except to the extent specified under our omnibus agreements or our employee services agreements, our general partner determines the amount of these expenses. Under the terms of the omnibus agreements, we will be required to reimburse MPC for the provision of certain general and administrative services to us. Under the terms of our employee services agreements, we have agreed to reimburse MPC or its affiliates for the provision of certain operational and management services to us in support of our facilities. Our general partner and its affiliates also may provide us other services for which we will be charged fees as determined by our general partner. Payments to our general partner and its affiliates are substantial and reduce the amount of cash available for distribution to unitholders.
The control of our general partner may be transferred to a third party without unitholder consent.
There is no restriction in our Partnership Agreement on the ability of MPC to transfer its membership interest in our general partner to a third party. The new members of our general partner would then be in a position to replace the board of directors and officers of our general partner with their own choices and to control the decisions taken by our general partner.
We may issue additional units without unitholder approval, which will dilute limited unitholder interests.
At any time, we may issue an unlimited number of limited partner interests of any type, including limited partner interests that are convertible into our common units, without the approval of our unitholders and our unitholders will have no preemptive or other rights (solely as a result of their status as unitholders) to purchase any such limited partner interests. Further, neither our Partnership Agreement nor our bank revolving credit facility prohibits the issuance of additional preferred units, or other equity securities that may effectively rank senior to our common units as to distributions or liquidations. The issuance by us of additional common units, preferred units or other equity securities of equal or senior rank will have the following effects:
•our unitholders’ proportionate ownership interest in us will decrease;
•it may be more difficult to maintain or increase our distributions to unitholders, and the amount of cash available for distribution on each unit may decrease;
•the ratio of taxable income to distributions may increase;
•the relative voting strength of each previously outstanding unit may be diminished; and
•the market price of our common units may decline.
MPC may sell units in the public or private markets, and such sales could have an adverse impact on the trading price of the common units.
As of February 21, 2025, MPC held 647,415,452 common units. Additionally, we have agreed to provide MPC with certain registration rights. The sale of these units in the public or private markets could have an adverse impact on the price of the common units or on any trading market that may develop.
Affiliates of our general partner, including MPC, may compete with us, and neither our general partner nor its affiliates have any obligation to present business opportunities to us.
MPC and other affiliates of our general partner are not prohibited from owning assets or engaging in businesses that compete directly or indirectly with us. In addition, MPC and other affiliates of our general partner may acquire, construct or dispose of additional midstream assets in the future without any obligation to offer us the opportunity to purchase any of those assets. As a result, competition from MPC and other affiliates of our general partner could materially and adversely impact our results of operations and cash available for distribution to unitholders.
Our general partner has a limited call right that may require unitholders to sell common units at an undesirable time or price.
If at any time our general partner and its affiliates own more than 85 percent of our common units, our general partner will have the right, but not the obligation, which it may assign to any of its affiliates or to us, to acquire all, but not less than all, of the common units held by unaffiliated persons at a price not less than their then current market price. As a result, unitholders may be
required to sell their common units at an undesirable time or price and may not receive any return on their investment. Unitholders may also incur a tax liability upon a sale of such units.
A unitholder’s liability may not be limited if a court finds that unitholder action constitutes control of our business.
A general partner of a partnership generally has unlimited liability for the obligations of the partnership, except for those contractual obligations of the partnership that are expressly made non-recourse to the general partner. Our partnership is organized under Delaware law, and we conduct business in a number of other states. The limitations on the liability of holders of limited partner interests for the obligations of a limited partnership have not been clearly established in some jurisdictions. A unitholder could be liable for our obligations as if they were a general partner if a court or government agency were to determine that:
•we were conducting business in a state but had not complied with that particular state’s partnership statute; or
•a unitholder’s right to act with other unitholders to remove or replace the general partner, to approve some amendments to our Partnership Agreement or to take other actions under our Partnership Agreement constitute “control” of our business.
Unitholders may have to repay distributions that were wrongfully distributed to them.
Under certain circumstances, unitholders may have to repay amounts wrongfully distributed to them. Under Section 17-607 of the Delaware Revised Uniform Limited Partnership Act, we may not make a distribution to unitholders if the distribution would cause our liabilities to exceed the fair value of our assets. Delaware law provides that for a period of three years from the date of the impermissible distribution, limited partners who received the distribution and who knew at the time of the distribution that it violated Delaware law will be liable to the limited partnership for the distribution amount. Transferees of common units are liable for the obligations of the transferor to make contributions to the partnership that are known to the transferee at the time of the transfer and for unknown obligations if the liabilities could be determined from our Partnership Agreement. Liabilities to partners on account of their partnership interest and liabilities that are non-recourse to the partnership are not counted for purposes of determining whether a distribution is permitted.
The NYSE does not require a publicly traded limited partnership like us to comply with certain of its corporate governance requirements.
We list our common units on the NYSE. Because we are a publicly traded limited partnership, the NYSE does not require us to have a majority of independent directors on our general partner’s board of directors or to establish a compensation committee or a nominating and corporate governance committee. Accordingly, unitholders will not have the same protections afforded to certain corporations that are subject to all of the NYSE corporate governance requirements.
The Court of Chancery of the State of Delaware will be, to the extent permitted by law, the sole and exclusive forum for substantially all disputes between us and our limited partners.
Our limited partnership agreement provides that the Court of Chancery of the State of Delaware will be the sole and exclusive forum for any claims, actions or proceedings:
•arising out of or relating in any way to our limited partnership agreement, or the rights or powers of, or restrictions on, our limited partners or the limited partnership;
•brought in a derivative manner on behalf of the limited partnership;
•asserting a claim of breach of a duty owed by any director, officer, or other employee of the limited partnership or the general partner, or owed by the general partner, to the partnership or the limited partners;
•asserting a claim arising pursuant to any provision of the Delaware Revised Uniform Limited Partnership Act; or
•asserting a claim governed by the internal affairs doctrine.
The forum selection provision may restrict a limited partner's ability to bring a claim against us or directors, officers or other employee of ours or our general partner in a forum that it finds favorable, which may discourage limited partners from bringing such claims at all. Alternatively, if a court were to find the forum selection provision contained in our limited partnership agreement to be inapplicable or unenforceable in an action, we may incur additional costs associated with resolving such action in another forum, which could materially adversely affect our business, financial condition and results of operations. However, the forum selection provision does not apply to any claims, actions or proceedings arising under the Securities Act or the Exchange Act.
Item 1B. Unresolved Staff Comments
None.
Item 1C. Cybersecurity
We are managed and operated by the board of directors and executive officers of MPLX GP, our general partner and a wholly owned subsidiary of MPC. Our general partner has the sole responsibility for providing the employees and other personnel
necessary to conduct our operations, including processes for the assessment, identification and management of material risks from cybersecurity threats.
Risk Management and Strategy
MPC has processes in place designed to protect our information systems, data, assets, infrastructure and computing environments from cybersecurity threats and risks while maintaining confidentiality, integrity, and availability. These enterprise-wide processes are based upon policies, practices and standards that guide MPC on identifying, assessing, and managing material cybersecurity risks and include, but are not limited to:
•placing security limits on physical and network access to our information technology (“IT”) and operating technology (“OT”) systems;
•employing internal IT and OT controls designed to detect cybersecurity threats by collecting and analyzing data in MPC’s centralized cybersecurity operations center;
•utilizing layers of defensive methodologies designed to facilitate cyber resilience, minimize attack surfaces, and provide flexibility and scalability in MPC’s ability to address cybersecurity risks and threats;
•providing cybersecurity threat and awareness training to employees and contractors;
•limiting remote network access to our IT and OT network environments; and
•assessing our cybersecurity resiliency through various methods, including penetration testing, tabletop exercises with varying scenarios and participants ranging from individuals on our operations teams to executive leadership, and analyzing our corporate cybersecurity incident response plan.
MPC applies an enterprise risk management (“ERM”) methodology as established and led by the MPC and MPLX GP executive leadership team and overseen by the Board to identify, assess, and manage enterprise-level risks. MPC’s cybersecurity risk program directly integrates and is intended to align with MPC’s governing ERM program.
MPC engages with external resources to contribute to and provide independent evaluation of its cybersecurity practices, including a periodic assessment of its cybersecurity program that is performed by a third party. MPC’s cybersecurity leadership and operational teams monitor cybersecurity threat intelligence and applicable cybersecurity regulatory requirements in a variety of ways, including by communicating with federal agencies, trade associations, service providers, and other miscellaneous third-party resources. MPLX GP’s management team, through consultation with MPC’s Senior Vice President and Chief Digital Officer (“CDO”), Vice President and Chief Information Security Officer (“CISO”), and the MPLX GP Audit Committee of the MPLX GP Board, use the information gathered from these sources to inform long-term cybersecurity investments and strategies which seek to identify cybersecurity threats and protect against, detect, respond to and recover from cybersecurity incidents.
The information systems, data, assets, infrastructure, and computing environments of MPC’s third-party service providers are also at risk of cybersecurity incidents. MPC manages third-party service provider cybersecurity risks through contract management, evaluation of applicable security control assessments, and third-party risk assessment processes.
As of February 27, 2025, we do not believe that any risks from cybersecurity threats, including as a result of past cybersecurity incidents have had, or are reasonably likely to have, a material adverse effect on the Partnership, including our business strategy, results of operations or financial condition. However, there can be no assurance that MPC’s cybersecurity processes will prevent or mitigate cybersecurity incidents or threats and that efforts will always be successful. It is possible that cybersecurity incidents may occur and could have a material adverse effect on our business strategy, results of operations, or financial condition. See “Business and Operational Risks--We are increasingly dependent on the performance of our information technology systems and those of our third-party business partners and service providers” in Item 1A. Risk Factors of this Annual Report on Form 10-K.
Governance
The full Board of Directors of MPLX GP oversees enterprise-level risks and has delegated to the Audit Committee of the MPLX GP Board oversight of risks from cybersecurity threats as informed through MPC’s ERM program. MPC’s CDO and CISO are standing members of the ERM committee, comprised of members of senior management, and as part of the committee, report on and evaluate cybersecurity threats and risk management efforts, as communicated to them by way of their direct reports and the larger cybersecurity team. The MPC CDO and CISO are responsible for managing risks from cybersecurity threats. The CDO and CISO provide regular cybersecurity briefings to the MPLX GP Board of Directors including the MPLX GP Audit Committee, with a minimum of two briefings per year and additional briefings as needed. The MPLX GP Audit Committee also has direct access to the CDO and CISO and their management teams for other updates on cybersecurity and information security strategy throughout the year. Additionally, the CDO and CISO, from time to time, meet with members of management to discuss cybersecurity risks, strategy, and threats.
MPC’s CISO is responsible for implementing the cybersecurity program which is comprised of Cybersecurity GRC (Governance, Risk & Compliance), Cybersecurity Architecture, Engineering & Operations, and a Cyber Fusion Center that includes Threat Intelligence, Vulnerability Management, & Incident Response. MPC’s CISO has more than 30 years of experience in the oil and gas industry and has held various leadership and strategic roles across IT, software R&D and marketing, including collectively serving as a chief information security officer for seven years at two publicly traded companies. Its CISO also holds an Executive
Master in Cybersecurity degree, a Master of Computer Science degree, and undergraduate degrees in both computer science and mathematics.
MPC’s CISO works at the direction of MPC’s CDO, who has more than 20 years of executive IT leadership experience and leads the company’s Digital and Information Technology functions that seek to provide innovative, secure, and reliable technology products and services to MPC and its customers. Prior to joining MPC in 2021, its CDO was employed by General Electric Company (“GE”) and its subsidiary companies for over 20 years, holding several executive IT leadership roles with increasing responsibility. He was then named Senior Vice President and Chief Information Officer of Services for parent company GE in 2017 and was later named the Vice President and Chief Information Officer of GE Healthcare. MPC’s CDO holds a Bachelor’s degree in Business Administration, Management and Information Systems.
Item 2. Properties
CRUDE OIL AND PRODUCTS LOGISTICS
Crude Oil and Refined Product Pipelines
Our crude oil pipeline and related assets are strategically positioned to support diverse and flexible crude oil supply options for MPC’s refineries, which receive imported and domestic crude oil through a variety of sources. Imported and domestic crude oil is transported to supply hubs from a variety of regions, including: Cushing, Oklahoma; Western Canada; Wyoming; North Dakota; the Gulf Coast and Patoka, Illinois. Crude oil pipelines from the Delaware and Midland Basins, as well as from the Bakken region transport crude oil into major regional takeaway pipelines and refining centers. Our major crude oil pipelines are connected to these supply hubs and transport crude oil to refineries owned by MPC and third parties.
Our products pipelines are strategically positioned to transport products from certain MPC refineries to MPC and MPLX operations, as well as those of third parties. Our product pipelines are integrated with MPC’s and MPLX’s expansive network of refined product terminals, which support MPC’s integrated business.
The following table sets forth information regarding our crude oil and refined product pipeline systems as of December 31, 2024.
| | | | | | | | | | | | | | |
| | Diameter | | Length
(miles) |
Crude Systems(1) | | 2" - 42" | | 5,172 | |
Refined Product Systems(2) | | 4" - 36" | | 3,787 | |
(1) Includes approximately 16 miles of pipeline leased from third parties and 1,207 miles of inactive pipeline.
(2) Includes approximately 2 miles of pipeline leased from third parties, 197 miles of inactive refined product pipeline, 87 miles in which we have partial ownership of 65 percent and 17 miles in which we have partial ownership of 50 percent.
The following table sets forth information regarding the pipeline systems which we have an interest in through ownership of our equity method investments as of December 31, 2024.
| | | | | | | | | | | | | | | | | | | | |
| | Diameter | | Length
(miles) | | Ownership Percentage |
| Crude Systems: | | | | | | |
MarEn Bakken Company LLC(1) | | 30" | | 1,916 | | | 25% |
| Minnesota Pipe Line Company LLC | | 16" - 24" | | 975 | | | 17% |
W2W Holdings LLC(2) | | 24” - 36” | | 652 | | | 50% |
| Illinois Extension Pipeline Company LLC | | 24" | | 168 | | | 35% |
| Andeavor Logistics Rio Pipeline LLC | | 12" | | 119 | | | 67% |
| LOCAP LLC | | 48" | | 57 | | | 59% |
LOOP LLC(3) | | 48" | | 48 | | | 41% |
| Refined Product Systems: | | | | | | |
| Explorer Pipeline Company | | 10" - 28" | | 1,872 | | | 25% |
(1) The investment in MarEn Bakken Company LLC includes our 9.19 percent indirect interest in a joint venture that owns and operates the Dakota Access Pipeline and Energy Transfer Crude Oil Pipeline projects (collectively referred to as the “Bakken Pipeline system”).
(2) The investment in W2W Holdings LLC includes our 16 percent indirect interest in Wink to Webster Pipeline LLC.
(3) LOOP LLC also includes the Louisiana Offshore Oil Port, a deepwater offloading crude oil port, as well as temporary crude oil storage.
Terminal Assets
The following table sets forth certain information regarding our owned and operated terminals as of December 31, 2024.
| | | | | | | | | | | | | | | | | | | | |
| Owned and Operated Terminals | | Number of Terminals | | Tank Shell Capacity (mbbls) | | Number of Tanks |
| Refined Product Terminals: | | | | | | |
| Alabama | | 2 | | | 443 | | | 16 | |
| Alaska | | 3 | | | 1,540 | | | 35 | |
| California | | 8 | | | 3,472 | | | 56 | |
| Florida | | 3 | | | 2,265 | | | 48 | |
| Georgia | | 4 | | | 952 | | | 29 | |
| Idaho | | 3 | | | 1,020 | | | 51 | |
| Illinois | | 2 | | | 562 | | | 15 | |
| Indiana | | 7 | | | 3,770 | | | 68 | |
| Kentucky | | 6 | | | 2,587 | | | 56 | |
| Louisiana | | 2 | | | 5,469 | | | 53 | |
| Michigan | | 8 | | | 2,440 | | | 73 | |
| Minnesota | | 1 | | | 13 | | | 5 | |
| New Mexico | | 2 | | | 467 | | | 20 | |
North Carolina(1) | | 3 | | | 1,343 | | | 26 | |
| North Dakota | | 1 | | | — | | | — | |
| Ohio | | 12 | | | 3,144 | | | 100 | |
| Pennsylvania | | 1 | | | 390 | | | 12 | |
| South Carolina | | 1 | | | 371 | | | 8 | |
| Tennessee | | 4 | | | 1,148 | | | 30 | |
| Texas | | 1 | | | 76 | | | 15 | |
| Utah | | 1 | | | 21 | | | 2 | |
| Washington | | 4 | | | 920 | | | 25 | |
| West Virginia | | 2 | | | 1,564 | | | 24 | |
| Total Refined Product Terminals | | 81 | | | 33,977 | | | 767 | |
| Asphalt Terminals: | | | | | | |
| Arizona | | 3 | | | 552 | | | 52 | |
| Minnesota | | 1 | | | — | | | — | |
Nevada(2) | | 1 | | | 274 | | | 19 | |
| New Mexico | | 1 | | | 36 | | | 6 | |
| Texas | | 1 | | | 206 | | | 22 | |
| Total Asphalt Terminals | | 7 | | | 1,068 | | | 99 | |
| Total Terminals | | 88 | | | 35,045 | | | 866 | |
(1) MPLX also has partial ownership interest in one terminal with a tank shell capacity of 415 mbbls, of which MPLX is not the operator.
(2) This terminal is accounted for as an equity method investment.
Marine Assets
The following table sets forth certain information regarding our marine assets in operation as of December 31, 2024. The marine business currently has associated transportation service agreements with MPC.
| | | | | | | | | | | | | | |
| Marine Vessels | | Number of Boats and Barges | | Capacity
(mbbls) |
| Inland tank barges | | 319 | | | 8,568 | |
| Inland towboats | | 29 | | | N/A |
Our fleet of boats and barges transport light products, heavy oils, crude oil, renewable fuels, chemicals and feedstocks to and from refineries and terminals owned by MPC in the Mid-Continent and Gulf Coast regions. We also have a marine repair facility (“MRF”), which is a full-service marine shipyard, located on the Ohio River, adjacent to MPC’s Catlettsburg, Kentucky refinery. The MRF is responsible for the preventive routine and unplanned maintenance of towboats, barges and local terminal facilities.
Refining Logistics Assets
The following table outlines the tankage owned by us, serving MPC’s refineries as of December 31, 2024. We also own and operate rail and truck racks and docks at certain of these refineries. Each of the following assets are currently included in storage services agreements with MPC.
| | | | | | | | |
| MPC Refining Logistics Assets | | Tank Capacity (mbbls) |
| Galveston Bay, Texas City, Texas | | 19,287 | |
| Garyville, Louisiana | | 16,481 | |
| Los Angeles, California | | 14,242 | |
| Robinson, Illinois | | 6,888 | |
| Anacortes, Washington | | 5,448 | |
| Catlettsburg, Kentucky | | 5,091 | |
| El Paso, Texas | | 5,084 | |
| Detroit, Michigan | | 5,019 | |
| St. Paul Park, Minnesota | | 3,983 | |
| Kenai, Alaska | | 3,488 | |
| Mandan, North Dakota | | 3,180 | |
| Canton, Ohio | | 2,687 | |
| Salt Lake City, Utah | | 2,139 | |
| Total | | 93,017 | |
Additionally, MPLX owns refining logistics assets at MPC’s Martinez Renewable Fuels joint venture with 5,914 mbbls of associated storage capacity, and has entered into terminalling and storage service agreements with the joint venture and its partners to provide services for the facility.
Other Crude Oil and Products Logistics Assets
MPLX owns and operates various other midstream assets, including 31 barge docks with a total capacity of 4,893 mbpd and 8 storage caverns with a storage capacity of 3,632 mbbls. As of December 31, 2024, in addition to the storage tanks at MPC’s refineries, we operated 32 tank farms, including one leased tank farm, with total available storage capacity of 33,718 mbbls. Our operations also include a renewable fuels rail loading hub in North Dakota with 180 mbbls of storage capacity, and more than 100 miles of water pipeline systems in North Dakota and Wyoming dedicated to gathering and handling produced water associated with well completion and production activities. These assets each currently have associated service agreements with MPC or third parties.
NATURAL GAS AND NGL SERVICES
The following tables set forth certain information relating to our consolidated and operated joint venture natural gas gathering systems, gas processing facilities, fractionation facilities and NGL pipelines as of and for the year ended December 31, 2024. See further discussion about our joint ventures in Item 8. Financial Statements and Supplementary Data - Note 5.
Natural Gas Gathering Systems
| | | | | | | | | | | | | | | | | | | | |
| Region | | Design Throughput Capacity (MMcf/d) | | Natural Gas Throughput(1)
(MMcf/d) | | Utilization of Design Capacity(1) |
| Marcellus Operations | | 1,622 | | | 1,521 | | | 94 | % |
| Utica Operations | | 3,903 | | | 2,544 | | | 68 | % |
| Southwest Operations | | 3,180 | | | 1,698 | | | 55 | % |
| Bakken Operations | | 239 | | | 183 | | | 77 | % |
Rockies Operations(2) | | 1,299 | | | 633 | | | 49 | % |
| Total Natural Gas Gathering | | 10,243 | | | 6,579 | | | 66 | % |
(1) Natural gas throughput is a weighted average for days in operation. The utilization of design capacity has been calculated using the weighted average design throughput capacity.
(2) Includes 47 MMcf/d of volumes gathered for third parties by our operated joint venture Rendezvous Gas Services, L.L.C. (“RGS”). Excludes RGS gathering capacity of 1,032 MMcf/d and volumes gathered by RGS which generally interconnect with our owned Rockies region gathering systems.
Gas Processing Complexes
| | | | | | | | | | | | | | | | | | | | |
| Region | | Design Throughput Capacity (MMcf/d) | | Natural Gas Throughput(1)
(MMcf/d) | | Utilization of Design Capacity(1) |
| Marcellus Operations | | 6,520 | | | 5,974 | | | 92 | % |
| Utica Operations | | 1,325 | | | 832 | | | 63 | % |
Southwest Operations(2) | | 2,745 | | | 1,844 | | | 70 | % |
| Southern Appalachia Operations | | 425 | | | 215 | | | 51 | % |
Bakken Operations(3) | | 185 | | | 182 | | | 98 | % |
| Rockies Operations | | 1,177 | | | 616 | | | 52 | % |
| Total Gas Processing | | 12,377 | | | 9,663 | | | 79 | % |
(1) Natural gas throughput is a weighted average for days in operation. The utilization of design capacity has been calculated using the weighted average design throughput capacity.
(2) The capacity presented above includes our proportionate share of Centrahoma Processing LLC’s processing capacity of 550 MMcf/d, as we own a non-operating 40 percent interest in this joint venture. Actual throughput of 118 MMcf/d representing our share of processed volumes is also included and used to compute the utilization presented above.
(3) Includes volumes processed at third-party facilities in the Bakken.
Fractionation Facilities
| | | | | | | | | | | | | | | | | | | | |
| Region | | Design Throughput Capacity (mbpd) | | NGL Throughput(1)
(mbpd) | | Utilization
of Design
Capacity(1) |
Marcellus Operations(2)(3) | | 413 | | | 336 | | | 81 | % |
Utica Operations(2)(3)(4) | | — | | | — | | | — | % |
Southern Appalachia Operations(2)(5) | | 24 | | | 12 | | | 50 | % |
| | | | | | |
| Bakken Operations | | 33 | | | 20 | | | 61 | % |
| Rockies Operations | | 5 | | | 5 | | | 100 | % |
| Total C3+ Fractionation | | 475 | | | 373 | | | 78 | % |
(1) NGL throughput is a weighted average for days in operation. The utilization of design capacity has been calculated using the weighted average design throughput capacity.
(2) Certain complexes have above-ground NGL storage with a usable capacity of 1,333 thousand barrels.
(3) Entities within the Marcellus and Utica Operations jointly own the Hopedale fractionation complex. Hopedale throughput is included in the Marcellus Operations totals for purposes of utilization calculations. During the year ended December 31, 2024, the Marcellus Operations and Utica Operations accounted for approximately 86 percent and 14 percent of total throughput at the Hopedale fractionation complex, respectively. Actual throughput presented within Item 7. Management’s Discussion and Analysis of Financial Condition and Results of Operations for Marcellus and Utica Operations includes each region’s actual utilization of the complex.
(4) We operate a condensate stabilization facility with a capacity of 23 mbpd and 77 thousand barrels of condensate storage. Actual NGL throughput at this facility was 13 mbpd for the year ended December 31, 2024.
(5) This region includes complexes with both above-ground, pressurized NGL storage facilities, with usable capacity of 48 thousand barrels, and underground storage facilities, with usable capacity of 238 thousand barrels.
De-ethanization Facilities
| | | | | | | | | | | | | | | | | | | | |
| Region | | Design Throughput Capacity (mbpd) | | NGL Throughput(1)
(mbpd) | | Utilization
of Design
Capacity(1) |
| Marcellus Operations | | 309 | | | 265 | | | 86 | % |
| Utica Operations | | 40 | | | 16 | | | 40 | % |
| | | | | | |
| Rockies Operations | | 5 | | | — | | | — | % |
| Total De-ethanization | | 354 | | | 281 | | | 80 | % |
(1) NGL throughput is a weighted average for days in operation. The utilization of design capacity has been calculated using the weighted average design throughput capacity.
NGL Pipelines
| | | | | | | | | | | | | | | | | | | | |
| Region | | Diameter | | Length
(miles) | | Throughput(1) (mbpd) |
| Marcellus Operations | | 6" - 20" | | 443 | | | 431 | |
| Utica Operations | | 4" - 20" | | 185 | | | 52 | |
Southwest Operations(2) | | 6" - 16" | | 137 | | | 148 | |
| Southern Appalachia Operations | | 6" - 8" | | 140 | | | 12 | |
| Bakken Operations | | 6" - 12" | | 104 | | | 20 | |
| Rockies Operations | | 4" - 8" | | 36 | | | 5 | |
| Total NGL Pipelines | | | | 1,045 | | | 668 | |
(1) NGL throughput is a weighted average for days in operation.
(2) Southwest Operations includes the portion of the BANGL Pipeline system operated by MPLX. BANGL, LLC, in which MPLX has a 45 percent ownership interest, also owns a 42 percent undivided joint interest in a 323 mile NGL pipeline.
Other Natural Gas and NGL Services Assets
In addition to the MPLX-operated equity method investments included in the above tables, we also have ownership interests in natural gas & NGL pipeline systems through the following entities:
| | | | | | | | | | | | | | | | | | | | |
| | Diameter | | Length
(miles) | | Ownership Percentage |
| Natural Gas Pipelines: | | | | | | |
Delaware Basin Residue, LLC(1) | | 12" - 42" | | 249 | | | 10% |
MXP Parent, LLC(2) | | 36" - 42" | | 580 | | | 5% |
WPC Parent, LLC(3) | | 36" - 42" | | 541 | | | 30% |
| NGL Pipelines: | | | | | | |
| Panola Pipeline Company, LLC | | 8" - 20" | | 253 | | | 15% |
(1) Includes Agua Blanca Pipeline and Carlsbad Gateway Pipeline.
(2) Includes Matterhorn Express Pipeline.
(3) Includes our indirect interest in Whistler Pipeline as well as our 70 percent indirect ownership in the ADCC Pipeline lateral. Also includes 50 percent indirect interest in Waha Gas Storage, which primarily owns natural gas storage facilities.
Title to Properties
We believe that our properties and facilities are adequate for our operations and that our facilities are adequately maintained. Substantially all of our pipelines are constructed on rights-of-way granted by the apparent record owners of the property. In many instances, lands over which pipeline rights-of-way have been obtained may be subject to prior liens that have not been subordinated to the right-of-way grants, as well as potential conflicts with other mineral or surface use owners. We have obtained, where determined necessary, permits, leases, license agreements and franchise ordinances from public authorities to cross over or under, or to lay facilities in or along water courses, county roads, municipal streets and state highways, as applicable. We also have obtained easements and license agreements from railroad companies to cross over or under railroad properties or rights-of-way. Some of the property rights we have obtained are revocable at the election of the grantor. In addition, we lease vehicles, building spaces and pipeline equipment under long-term operating leases, most of which include renewal options. Many of our compression, processing, fractionation and other facilities, including certain fractionation plants and certain of our pipelines and other facilities, are on land that we either own in fee or that is held under long-term leases. For any such facilities that are on land that we lease, we could be required to remove our facilities upon the termination or expiration of the leases.
Some of the leases, easements, rights-of-way, permits, licenses and franchise ordinances that were transferred to us required the consent of the then-current landowner to transfer these rights, which in some instances was a governmental entity. We believe that we have obtained sufficient third-party consents, permits and authorizations for the transfer of the assets necessary
for us to operate our business. We also believe we have satisfactory title or other right to our material land assets. Title to these properties is subject to encumbrances in some cases, such as coal, that may require payment to other holders of title in the property at issue; however, we believe that none of these burdens will materially detract from the value of these properties or from our interest in these properties, or will materially interfere with their use in the operation of our business. See Item 8. Financial Statements and Supplementary Data – Note 21, for additional information regarding our leases.
MPC indemnifies us for certain title defects and for failures to obtain certain consents and permits necessary to conduct our business with respect to the assets contributed to us by MPC. Although title to these properties is subject to encumbrances in some cases, such as customary interests generally retained in connection with acquisition of real property, liens that can be imposed in some jurisdictions for government-initiated action to clean up environmental contamination, liens for current taxes and other burdens, and easements, restrictions and other encumbrances to which the underlying properties were subject at the time of acquisition. We believe that none of these burdens should materially detract from the value of these properties or from our interest in these properties or should materially interfere with their use in the operation of our business.
Item 3. Legal Proceedings
We are the subject of, or a party to, a number of pending or threatened legal actions, contingencies and commitments involving a variety of matters, including laws and regulations relating to the environment. While it is possible that an adverse result in one or more of the lawsuits or proceedings in which we are a defendant could be material to us, based upon current information and our experience as a defendant in other matters, we believe that these lawsuits and proceedings, individually or in the aggregate, will not have a material adverse effect on our consolidated results of operations, financial position or cash flows.
Item 103 of Regulation S-K promulgated by the SEC requires disclosure of certain environmental matters when a governmental authority is a party to the proceedings and such proceedings involve potential monetary sanctions, unless we reasonably believe that the matter will result in no monetary sanctions, or in monetary sanctions, exclusive of interest and costs, of less than a specified threshold. We use a threshold of $1 million for this purpose.
Dakota Access Pipeline
We hold a 9.19 percent indirect interest in a joint venture (“Dakota Access”), which owns and operates the Bakken Pipeline system. In 2020, the D.D.C. ordered the United States Army Corps of Engineers (“Army Corps”), which granted permits and an easement for the Bakken Pipeline system, to prepare an environmental impact statement (“EIS”) relating to an easement under Lake Oahe in North Dakota. The D.D.C. later vacated the easement going forward. The Army Corps issued a draft EIS in September 2023 detailing various options for the easement, including denying the easement, approving the easement with additional measures, rerouting the easement, or approving the easement with no changes. The Army Corps has not selected a preferred alternative, but will make a decision in its final review, after considering input from the public and other agencies. The pipeline remains operational while the Army Corps finalizes its decision which will follow the issuance of the final EIS. According to public statements from Army Corps officials, the EIS is now expected to be issued in 2025.
We have entered into a Contingent Equity Contribution Agreement whereby MPLX LP, along with the other joint venture owners in the Bakken Pipeline system, has agreed to make equity contributions to the joint venture upon certain events occurring to allow the entities that own and operate the Bakken Pipeline system to satisfy their senior note payment obligations. The senior notes were issued to repay amounts owed by the pipeline companies to fund the cost of construction of the Bakken Pipeline system.
If the vacatur of the easement results in a temporary shutdown of the pipeline, MPLX would have to contribute its 9.19 percent pro rata share of funds required to pay interest accruing on the notes and any portion of the principal that matures while the pipeline is shutdown. MPLX also expects to contribute its 9.19 percent pro rata share of any costs to remediate any deficiencies to reinstate the easement and/or return the pipeline into operation. If the vacatur of the easement results in a permanent shutdown of the pipeline, MPLX would have to contribute its 9.19 percent pro rata share of the cost to redeem the bonds (including the one percent redemption premium required pursuant to the indenture governing the notes) and any accrued and unpaid interest. As of December 31, 2024, our maximum potential undiscounted payments under the Contingent Equity Contribution Agreement were approximately $78 million.
Tesoro High Plains Pipeline
In July 2020, Tesoro High Plains Pipeline Company, LLC (“THPP”), a subsidiary of MPLX, received a Notification of Trespass Determination from the Bureau of Indian Affairs (“BIA”) relating to a portion of the Tesoro High Plains Pipeline that crosses the Fort Berthold Reservation in North Dakota. The notification demanded the immediate cessation of pipeline operations and assessed trespass damages of approximately $187 million. After subsequent appeal proceedings and in compliance with a new order issued by the BIA, in December 2020, THPP paid approximately $4 million in assessed trespass damages and ceased use of the portion of the pipeline that crosses the property at issue. In March 2021, the BIA issued an order purporting to vacate the BIA's prior orders related to THPP’s alleged trespass and direct the Regional Director of the BIA to reconsider the issue of THPP’s alleged trespass and issue a new order. In April 2021, THPP filed a lawsuit in the District of North Dakota against the United States of America, the U.S. Department of the Interior and the BIA (collectively, the “U.S. Government Parties”) challenging the March 2021 order purporting to vacate all previous orders related to THPP’s alleged trespass. On February 8, 2022, the U.S. Government Parties filed their answer and counterclaims to THPP’s suit claiming THPP is in continued trespass
with respect to the pipeline and seek disgorgement of pipeline profits from June 1, 2013 to present, removal of the pipeline and remediation. On November 8, 2023, the District Court of North Dakota granted THPP’s motion to sever and stay the U.S. Government Parties’ counterclaims. The case will proceed on the merits of THPP’s challenge to the March 2021 order purporting to vacate all previous orders related to THPP’s alleged trespass. THPP continues not to operate the portion of the pipeline that crosses the property at issue.
Edwardsville Incident
In March 2022, the State of Illinois brought an action in Madison County Circuit Court in Illinois against Marathon Pipe Line LLC (“MPL”), an indirect wholly owned subsidiary of MPLX LP, asserting various violations and demanding a permanent injunction and civil penalties in connection with a release of crude oil on the Wood River to Patoka 22" line near Edwardsville, Illinois. In September 2023, the U.S. Department of Justice and EPA confirmed they will be pursuing federal enforcement for alleged Clean Water Act violations arising from this incident as well as three pipeline incidents in Illinois and Indiana in 2018, 2020 and 2021. We cannot currently estimate the timing of the resolution of this matter but do not believe any civil penalty will have a material impact on our consolidated results of operations, financial position or cash flows.
Item 4. Mine Safety Disclosures
Not applicable.
PART II
Item 5. Market for Registrant’s Common Equity, Related Stockholder Matters and Issuer Purchases of Equity Securities
Our common units are listed on the NYSE and traded under the symbol “MPLX.” As of February 21, 2025, there were approximately 233 registered holders of our outstanding common units.
Issuer Purchases of Equity Securities
The following table sets forth a summary of our purchases during the quarter ended December 31, 2024, of equity securities that are registered by MPLX pursuant to Section 12 of the Securities Exchange Act of 1934, as amended.
| | | | | | | | | | | | | | | | | | | | | | | | | | |
| | | | | | | | Millions of Dollars |
| Period | | Total Number of Units Purchased | | Average Price Paid per Common Unit(1) | | Total Number of Units Purchased as Part of Publicly Announced Plans or Programs | | Maximum Dollar Value of Units that May Yet Be Purchased Under the Plans or Programs(2)(3) |
| 10/1/2024-10/31/2024 | | 453,805 | | | $ | 44.25 | | | 453,805 | | | $ | 600 | |
| 11/1/2024-11/30/2024 | | 505,376 | | | 48.51 | | | 505,376 | | | 575 | |
| 12/1/2024-12/31/2024 | | 1,144,766 | | | 48.39 | | | 1,144,766 | | | $ | 520 | |
| Total | | 2,103,947 | | | $ | 47.53 | | | 2,103,947 | | | |
(1)Amounts in this column reflect the weighted average price paid for units purchased under our unit repurchase authorization. The weighted average price includes any commissions paid to brokers during the relevant period.
(2)On August 2, 2022, we announced the board authorization for the repurchase of up to $1 billion of MPLX common units held by the public. This unit repurchase authorization has no expiration date.
(3)The maximum dollar value remaining has been reduced by the amount of any commissions paid to brokers.
Item 7. Management’s Discussion and Analysis of Financial Condition and Results of Operations
This section of the Annual Report on Form 10-K does not address certain items regarding the year ended December 31, 2022. Discussion and analysis of 2022 and year-to-year comparisons between 2023 and 2022 not included in this Annual Report on Form 10-K can be found in Item 7. Management’s Discussion and Analysis of Financial Condition and Results of Operations of our Annual Report on Form 10-K for the year ended December 31, 2023.
All statements in this section, other than statements of historical fact, are forward-looking statements that are inherently uncertain. See Disclosures Regarding Forward-Looking Statements and Item 1A. Risk Factors for a discussion of the factors that could cause actual results to differ materially from those projected in these statements. The following information concerning our business, results of operations and financial condition should also be read in conjunction with the information included under Item 1. Business, Item 1A. Risk Factors and Item 8. Financial Statements and Supplementary Data.
MPLX OVERVIEW
We are a diversified, large-cap MLP formed by MPC in 2012 that owns and operates midstream energy infrastructure and logistics assets, and provides fuels distribution services. Our assets include a network of crude oil and refined product pipelines; an inland marine business; light-product, asphalt, heavy oil and marine terminals; storage caverns; refinery tanks, docks, loading racks and associated piping; crude oil and natural gas gathering systems and pipelines; as well as natural gas and NGL processing and fractionation facilities. The business consists of two segments based on the product-based value chain each supports: Crude Oil and Products Logistics and Natural Gas and NGL Services. Our assets are positioned throughout the United States. The Crude Oil and Products Logistics segment primarily engages in the gathering, transportation, storage and distribution of crude oil, refined products, other hydrocarbon-based products, and renewables. The Crude Oil and Products Logistics segment also includes the operation of our refining logistics, fuels distribution and inland marine businesses, terminals, rail facilities and storage caverns. The Natural Gas and NGL Services segment provides gathering, processing and transportation of natural gas as well as the transportation, fractionation, storage and marketing of NGLs.
SIGNIFICANT FINANCIAL AND OTHER HIGHLIGHTS
Significant financial and other highlights for the years ended December 31, 2024, 2023 and 2022 are shown in the chart below. Refer to the Results of Operations, the Liquidity and Capital Resources, and Non-GAAP Financial Information sections for further information.
(1) The year ended December 31, 2022 includes a gain on a lease reclassification of $509 million. See Item 8. Financial Statements and Supplementary Data - Note 21 in the Consolidated Financial Statements for additional information.
(2) Non-GAAP measure. See reconciliations that follow for the most directly comparable GAAP measures.
Other Highlights
•Generated $5.9 billion of net cash provided by operating activities, $5.7 billion of distributable cash flow attributable to MPLX, and $3.9 billion of adjusted free cash flow (“Adjusted FCF”).
•Paid $3.6 billion in distributions during the year ended December 31, 2024, which includes a 12.5 percent increase in our quarterly distribution effective for the third quarter of 2024, in line with our commitment to return capital to unitholders.
•Repurchased $326 million of common units held by the public during the year ended December 31, 2024.
•In March 2024, acquired additional ownership interest in existing joint ventures and gathering assets in the Utica basin (“Utica Midstream Acquisition”).
•In May 2024, formed a new joint venture to strategically combine the Whistler Pipeline joint venture and the Rio Bravo Pipeline project (the “Whistler Joint Venture Transaction”). The combined platform connects Permian supply to incremental LNG export markets and supports the development of additional pipeline projects.
•Placed two new processing plants into service, Harmon Creek II in the Marcellus basin in February 2024 and Preakness II in the Permian Basin in July 2024.
•Acquired an additional 20 percent interest in BANGL, LLC, a joint venture that owns the natural gas liquids pipeline system, in July 2024, increasing our ownership interest to 45 percent.
•In February 2025, announced the expansion of MPLX’s Permian to Gulf Coast integrated value chain, with projects to construct a fractionation complex and the formation of strategic joint ventures to develop a complimentary 400 mbpd LPG export terminal and pipeline.
Current Economic Environment
The U.S. refining industry is expected to remain structurally advantaged over the rest of the world. Globally, demand for transportation fuels is expected to grow. Grid electrification, onshoring, near-shoring, and data center development are driving natural gas demand growth forecasts through the end of the decade. Producer activity remains strong across the Marcellus, Utica, and Permian basins. In the Northeast, drilling efficiencies and longer laterals are driving increased production volumes. In the Utica, producers are targeting economically advantaged, liquids-rich acreage. We are well positioned to support the development plans of our producer customers.
NON-GAAP FINANCIAL INFORMATION
Our management uses a variety of financial and operating metrics to analyze our performance. These metrics are significant factors in assessing our operating results and profitability and include the non-GAAP financial measures of Adjusted EBITDA, DCF, Adjusted FCF, and Adjusted FCF after distributions.
Adjusted EBITDA is a financial performance measure used by management, industry analysts, investors, lenders, and rating agencies to assess the financial performance and operating results of our ongoing business operations. Additionally, we believe adjusted EBITDA provides useful information to investors for trending, analyzing and benchmarking our operating results from period to period as compared to other companies that may have different financing and capital structures. We define Adjusted EBITDA as net income adjusted for: (i) provision for income taxes; (ii) net interest and other financial costs; (iii) depreciation and amortization; (iv) income/(loss) from equity method investments; (v) distributions and adjustments related to equity method investments; (vi) impairment expense; (vii) noncontrolling interests; and (viii) other adjustments, as applicable.
DCF is a financial performance and liquidity measure used by management and by the board of directors of our general partner as a key component in the determination of cash distributions paid to unitholders. We believe DCF is an important financial measure for unitholders as an indicator of cash return on investment and to evaluate whether the partnership is generating sufficient cash flow to support quarterly distributions. In addition, DCF is commonly used by the investment community because the market value of publicly traded partnerships is based, in part, on DCF and cash distributions paid to unitholders. We define DCF as Adjusted EBITDA adjusted for: (i) deferred revenue impacts; (ii) sales-type lease payments, net of income; (iii) adjusted net interest and other financial costs; (iv) net maintenance capital expenditures; (v) equity method investment capital expenditures paid out; and (vi) other adjustments as deemed necessary.
Adjusted FCF and Adjusted FCF after distributions are financial liquidity measures used by management in the allocation of capital and to assess financial performance. We believe that unitholders may use this metric to analyze our ability to manage leverage and return capital. We define Adjusted FCF as net cash provided by operating activities adjusted for: (i) net cash used in investing activities; (ii) cash contributions from MPC; and (iii) cash distributions to noncontrolling interests. We define Adjusted FCF after distributions as Adjusted FCF less distributions to common and preferred unitholders.
We believe that the presentation of Adjusted EBITDA, DCF, Adjusted FCF and Adjusted FCF after distributions provides useful information to investors in assessing our financial condition and results of operations. The GAAP measures most directly comparable to Adjusted EBITDA and DCF are net income and net cash provided by operating activities while the GAAP measure most directly comparable to Adjusted FCF and Adjusted FCF after distributions is net cash provided by operating activities. These non-GAAP financial measures should not be considered alternatives to net income or net cash provided by operating activities as they have important limitations as analytical tools because they exclude some but not all items that affect net income
and net cash provided by operating activities or any other measure of financial performance or liquidity presented in accordance with GAAP. These non-GAAP financial measures should not be considered in isolation or as substitutes for analysis of our results as reported under GAAP. Additionally, because non-GAAP financial measures may be defined differently by other companies in our industry, our definitions may not be comparable to similarly titled measures of other companies, thereby diminishing their utility. For a reconciliation of Adjusted EBITDA and DCF to their most directly comparable measures calculated and presented in accordance with GAAP, see Item 7. Management’s Discussion and Analysis of Financial Condition and Results of Operations - Results of Operations. For a reconciliation of Adjusted FCF and Adjusted FCF after distributions to their most directly comparable measure calculated and presented in accordance with GAAP, see Item 7. Management’s Discussion and Analysis of Financial Condition and Results of Operations - Liquidity and Capital Resources.
COMPARABILITY OF OUR FINANCIAL RESULTS
During the normal course of business, we amend or modify our contractual agreements with customers. These amendments or modifications require the agreements to be reassessed under ASU No. 2016-02, Leases (“ASC 842”), which can impact the classification of revenues or costs associated with the agreement. These reassessments may impact the comparability of our financial results.
RESULTS OF OPERATIONS
The following tables and discussion summarize our results of operations for the years ended 2024, 2023 and 2022, including a reconciliation of Adjusted EBITDA and DCF from Net income and Net cash provided by operating activities, the most directly comparable GAAP financial measures.
| | | | | | | | | | | | | | | | | | | | | | | | | | | | | | | | |
| (In millions) | | 2024 | | 2023 | | $ Change | | 2022 | | $ Change |
| Revenues and other income: | | | | | | | | | | |
| Service revenue | | $ | 6,950 | | | $ | 6,524 | | | $ | 426 | | | $ | 6,113 | | | $ | 411 | |
| Rental income | | 1,104 | | | 1,065 | | | 39 | | | 1,090 | | | (25) | |
| Product related revenue | | 2,239 | | | 2,209 | | | 30 | | | 2,811 | | | (602) | |
| Sales-type lease revenue | | 611 | | | 636 | | | (25) | | | 527 | | | 109 | |
Income from equity method investments(1) | | 802 | | | 600 | | | 202 | | | 476 | | | 124 | |
Other income(2) | | 227 | | | 247 | | | (20) | | | 596 | | | (349) | |
| Total revenues and other income | | 11,933 | | | 11,281 | | | 652 | | | 11,613 | | | (332) | |
| Costs and expenses: | | | | | | | | | | |
| Cost of revenues (excludes items below) | | 1,560 | | | 1,401 | | | 159 | | | 1,369 | | | 32 | |
| Purchased product costs | | 1,561 | | | 1,598 | | | (37) | | | 2,063 | | | (465) | |
| Rental cost of sales | | 100 | | | 115 | | | (15) | | | 177 | | | (62) | |
| Purchases - related parties | | 1,583 | | | 1,544 | | | 39 | | | 1,413 | | | 131 | |
| Depreciation and amortization | | 1,283 | | | 1,213 | | | 70 | | | 1,230 | | | (17) | |
| General and administrative expenses | | 427 | | | 379 | | | 48 | | | 335 | | | 44 | |
| Other taxes | | 131 | | | 131 | | | — | | | 115 | | | 16 | |
| Total costs and expenses | | 6,645 | | | 6,381 | | | 264 | | | 6,702 | | | (321) | |
| Income from operations | | 5,288 | | | 4,900 | | | 388 | | | 4,911 | | | (11) | |
| Net interest and other financial costs | | 921 | | | 923 | | | (2) | | | 925 | | | (2) | |
| Income before income taxes | | 4,367 | | | 3,977 | | | 390 | | | 3,986 | | | (9) | |
| Provision for income taxes | | 10 | | | 11 | | | (1) | | | 8 | | | 3 | |
| Net income | | 4,357 | | | 3,966 | | | 391 | | | 3,978 | | | (12) | |
| Less: Net income attributable to noncontrolling interests | | 40 | | | 38 | | | 2 | | | 34 | | | 4 | |
| Net income attributable to MPLX LP | | $ | 4,317 | | | $ | 3,928 | | | $ | 389 | | | $ | 3,944 | | | $ | (16) | |
| | | | | | | | | | |
Adjusted EBITDA attributable to MPLX LP(3) | | $ | 6,764 | | | $ | 6,269 | | | $ | 495 | | | $ | 5,775 | | | $ | 494 | |
DCF attributable to MPLX(3) | | $ | 5,697 | | | $ | 5,340 | | | $ | 357 | | | $ | 4,981 | | | $ | 359 | |
(1)The year ended December 31, 2024 includes a $151 million gain related to the dilution of our ownership interest in connection with the Whistler Joint Venture Transaction. See Item 8. Financial Statements and Supplementary Data - Note 4 for additional information.
(2)The year ended December 31, 2023 includes a $92 million gain on remeasurement of our existing equity investment in MarkWest Torñado GP, L.L.C. (“Torñado”) in conjunction with the purchase of the remaining joint venture interest in 2023 (the “Torñado Acquisition”). See Item 8. Financial Statements and Supplementary Data - Note 4 for additional information. The year ended December 31, 2022 includes a $509 million gain on a lease reclassification. See Item 8. Financial Statements and Supplementary Data - Note 21 for additional information.
(3)Non-GAAP measure. See reconciliation below to the most directly comparable GAAP measures.
| | | | | | | | | | | | | | | | | | | | |
| (In millions) | | 2024 | | 2023 | | 2022 |
| Reconciliation of Adjusted EBITDA attributable to MPLX LP and DCF attributable to LP unitholders from Net income: | | | | | | |
| Net income | | $ | 4,357 | | | $ | 3,966 | | | $ | 3,978 | |
| Provision for income taxes | | 10 | | | 11 | | | 8 | |
| Net interest and other financial costs | | 921 | | | 923 | | | 925 | |
| Income from operations | | 5,288 | | | 4,900 | | | 4,911 | |
| Depreciation and amortization | | 1,283 | | | 1,213 | | | 1,230 | |
| Income from equity method investments | | (802) | | | (600) | | | (476) | |
| Distributions/adjustments related to equity method investments | | 928 | | | 774 | | | 652 | |
| Gain on sales-type leases and equity method investments | | — | | | (92) | | | (509) | |
| | | | | | |
Garyville incident response costs(1) | | — | | | 16 | | | — | |
Other(2) | | 111 | | | 100 | | | 5 | |
| Adjusted EBITDA | | 6,808 | | | 6,311 | | | 5,813 | |
| Adjusted EBITDA attributable to noncontrolling interests | | (44) | | | (42) | | | (38) | |
| Adjusted EBITDA attributable to MPLX LP | | 6,764 | | | 6,269 | | | 5,775 | |
| Deferred revenue impacts | | 31 | | | 97 | | | 158 | |
| Sales-type lease payments, net of income | | 32 | | | 12 | | | 18 | |
Adjusted net interest and other financial costs(3) | | (867) | | | (859) | | | (851) | |
| Maintenance capital expenditures, net of reimbursements | | (206) | | | (150) | | | (144) | |
| Equity method investment maintenance capital expenditures paid out | | (18) | | | (15) | | | (13) | |
| Other | | (39) | | | (14) | | | 38 | |
| DCF attributable to MPLX LP | | 5,697 | | | 5,340 | | | 4,981 | |
| Preferred unit distributions | | (27) | | | (99) | | | (129) | |
| DCF attributable to LP unitholders | | $ | 5,670 | | | $ | 5,241 | | | $ | 4,852 | |
(1)In August 2023, a naphtha release and resulting fire occurred at our Garyville Tank Farm resulting in the loss of four storage tanks with a combined shell capacity of 894 thousand barrels (“Garyville Incident”). We incurred $16 million of incident response costs, net of insurance recoveries, during the year ended December 31, 2023.
(2)Includes unrealized derivative gain/(loss), equity-based compensation and other miscellaneous items.
(3)Represents Net interest and other financial costs excluding gain/loss on extinguishment of debt and amortization of deferred financing costs.
| | | | | | | | | | | | | | | | | | | | |
| (In millions) | | 2024 | | 2023 | | 2022 |
| Reconciliation of Adjusted EBITDA attributable to MPLX LP and DCF attributable to LP unitholders from Net cash provided by operating activities: | | | | | | |
| Net cash provided by operating activities | | $ | 5,946 | | | $ | 5,397 | | | $ | 5,019 | |
| Changes in working capital items | | (241) | | | (169) | | | (128) | |
| All other, net | | (5) | | | 39 | | | (27) | |
| Loss on extinguishment of debt | | — | | | 9 | | | 1 | |
Adjusted net interest and other financial costs(1) | | 867 | | | 859 | | | 851 | |
| Other adjustments to equity method investment distributions | | 102 | | | 38 | | | 74 | |
Garyville Incident response costs(2) | | — | | | 16 | | | — | |
| Other | | 139 | | | 122 | | | 23 | |
| Adjusted EBITDA | | 6,808 | | | 6,311 | | | 5,813 | |
| Adjusted EBITDA attributable to noncontrolling interests | | (44) | | | (42) | | | (38) | |
| Adjusted EBITDA attributable to MPLX LP | | 6,764 | | | 6,269 | | | 5,775 | |
| Deferred revenue impacts | | 31 | | | 97 | | | 158 | |
| Sales-type lease payments, net of income | | 32 | | | 12 | | | 18 | |
Adjusted net interest and other financial costs(1) | | (867) | | | (859) | | | (851) | |
| Maintenance capital expenditures, net of reimbursements | | (206) | | | (150) | | | (144) | |
| Equity method investment maintenance capital expenditures paid out | | (18) | | | (15) | | | (13) | |
| Other | | (39) | | | (14) | | | 38 | |
| DCF attributable to MPLX LP | | 5,697 | | | 5,340 | | | 4,981 | |
| Preferred unit distributions | | (27) | | | (99) | | | (129) | |
| DCF attributable to LP unitholders | | $ | 5,670 | | | $ | 5,241 | | | $ | 4,852 | |
(1) Represents Net interest and other financial costs excluding gain/loss on extinguishment of debt and amortization of deferred financing costs.
(2) We incurred $16 million of Garyville Incident response costs, net of insurance recoveries, during the year ended December 31, 2023.
2024 Compared to 2023
Net income attributable to MPLX increased $389 million in 2024 compared to 2023 primarily due to annual fee escalations, higher throughputs and benefits from recent acquisitions.
Total revenues and other income increased by $652 million in 2024 compared to 2023 primarily due to:
•Increased Service revenue of $426 million primarily due $170 million of incremental revenues from recent acquisitions, including the Torñado Acquisition and the Utica Midstream Acquisition, $157 million due to crude oil and products logistics tariff and other fee escalations and higher natural gas and NGL volumes and throughput fee rates of $84 million.
•Increased Rental income of $39 million primarily due to annual fee escalations related to our refining logistics assets.
•Increased Product related revenue of $30 million primarily due to higher NGL prices of $51 million, partially offset by lower volumes of $15 million.
•Lower Sales-type lease revenue of $25 million due to changes in the presentation of lease income between service revenue, rental income and sales-type lease revenue as a result of lease contract modifications.
•Increased Income from equity method investments of $202 million primarily driven by a $151 million gain related to the Whistler Joint Venture Transaction, increased throughput and fee rates in certain processing and pipeline joint ventures and $12 million of incremental income from the Utica Midstream Acquisition partially offset by a $32 million decrease due to the Torñado Acquisition. See Supplemental Information on Equity Method Investments for additional information regarding the results of our equity method investments.
•Decreased Other income of $20 million primarily due to a $92 million gain recognized on the Torñado Acquisition in 2023, partially offset by an increase of $44 million related to changes in presentation driven by modification of an agreement with MPC in the first quarter of 2024, a $40 million benefit from insurance proceeds, and a $20 million gain related to the Utica Midstream Acquisition in 2024.
Total costs and expenses increased by $264 million in 2024 compared to 2023 primarily due to:
•Increased Cost of revenues of $159 million partially due to $51 million of incremental operating costs as a result of the Torñado and Utica Midstream Acquisitions, $86 million related to higher volumes within the Natural Gas and NGL Services segment attributable to costs that are largely offset in revenues and $31 million related to higher project-related spending within our Crude Oil and Products Logistics segment.
•Decreased Purchased product costs of $37 million primarily due to lower Southwest NGL volumes of $54 million partially offset by higher NGL prices of $19 million.
•Increased Purchases-related parties of $39 million due to $44 million of higher employee costs from MPC, $25 million related to changes in presentation driven by the modification of agreements with MPC partially offset by lower related party transportation costs and $16 million of Garyville Incident response costs in 2023.
•Increased Depreciation and amortization of $70 million primarily due to incremental depreciation associated with assets acquired in the Torñado Acquisition and the Utica Midstream Acquisition as well as other assets placed in service in 2024.
•Increased General and administrative expenses of $48 million due to $29 million in higher employee costs from MPC as well as a $17 million increase in contractor service costs associated with our recently announced NGL value chain expansion project.
SEGMENT REPORTING
In the fourth quarter of 2024, we renamed and modified the composition of our segments to better reflect the product-based value chains and growth strategy of MPLX’s operations. The primary changes were to rename the Logistics and Storage segment to the Crude Oil and Products Logistics segment and to rename the Gathering and Processing segment to the Natural Gas and NGL Services segment. In addition, we reclassified certain equity method investments serving natural gas and NGL customers from Crude Oil and Products Logistics to Natural Gas and NGL Services. The segment realignment is presented for the year ended December 31, 2024, with prior periods recast for comparability. Each of these segments is organized and managed based upon the product-based value chain each supports.
We evaluate the performance of our segments using Segment Adjusted EBITDA. Segment Adjusted EBITDA represents Adjusted EBITDA attributable to the reportable segments. Amounts included in net income and excluded from Segment Adjusted EBITDA include: (i) depreciation and amortization; (ii) net interest and other financial costs; (iii) income/(loss) from equity method investments; (iv) distributions and adjustments related to equity method investments; (v) impairment expense; (vi) noncontrolling interests; and (vii) other adjustments, as applicable. These items are either: (i) believed to be non-recurring in nature; (ii) not believed to be allocable or controlled by the segment; or (iii) are not tied to the operational performance of the segment.
The tables below present additional financial information for our reported segments for the years ended December 31, 2024, 2023 and 2022.
Crude Oil and Products Logistics Segment
Crude Oil and Products Logistics Segment Financial Highlights (in millions)
| | | | | |
| Segment revenues and other income | Segment Adjusted EBITDA |
| | | | | | | | | | | | | | | | | | | | | | | | | | | | | |
| (In millions) | 2024 | | 2023 | | $ Change | | 2022 | | $ Change |
| | | | | | | | | |
| | | | | | | | | |
| | | | | | | | | |
| | | | | | | | | |
| | | | | | | | | |
| | | | | | | | | |
| Total segment revenues and other income | $ | 6,339 | | | $ | 6,048 | | | $ | 291 | | | $ | 5,598 | | | $ | 450 | |
| | | | | | | | | |
| | | | | | | | | |
| | | | | | | | | |
| | | | | | | | | |
| | | | | | | | | |
| | | | | | | | | |
| | | | | | | | | |
| | | | | | | | | |
| Segment Adjusted EBITDA | 4,375 | | | 4,134 | | | 241 | | | 3,761 | | | 373 | |
| Capital expenditures | 482 | | | 414 | | | 68 | | | 325 | | | 89 | |
Investments in unconsolidated affiliates(1) | $ | 93 | | | $ | 8 | | | $ | 85 | | | $ | 63 | | | $ | (55) | |
(1) The years ended December 31, 2024 and 2022 include contributions of $92 million and $60 million, respectively, to a joint venture (“Dakota Access”) that owns and operates the Dakota Access Pipeline and Energy Transfer Crude Oil Pipeline projects (collectively referred to as the “Bakken Pipeline system”), to fund our share of debt repayments by the joint venture.
2024 Compared to 2023
Total segment revenues and other income increased $291 million in 2024 compared to 2023. The increase was primarily driven by $132 million of higher pipeline rates, $77 million of fee escalations related to our refining logistics assets and additional marine
equipment in operation. Additionally, during 2024, we recognized other income of $44 million due to changes in presentation driven by the modification of an agreement with MPC and $33 million in higher insurance proceeds.
Segment Adjusted EBITDA increased $241 million in 2024 compared to 2023. The increase was primarily driven by $132 million of higher pipeline rates, $77 million of fee escalations related to our refining logistics assets, and additional marine equipment in operation. Additionally, during 2024, we had higher distributions and adjustments related to equity method investments of $40 million and benefited from higher insurance proceeds of $33 million, partially offset by $38 million of increased costs from MPC, primarily employee costs, as well as increased contractor service costs.
2023 Compared to 2022
Total segment revenues and other income increased $450 million in 2023 compared to 2022. The increase was primarily driven by higher pipeline rates and increased pipeline throughput of approximately $228 million, refining logistics and storage fee escalations of approximately $94 million, higher terminal throughput and additional marine equipment in operation. Income from equity method investments also increased $73 million in 2023 compared to 2022 due to higher throughput on equity method investment pipeline systems. See Supplemental Information on Equity Method Investments for additional information regarding the results of our equity method investments.
Segment Adjusted EBITDA increased $373 million in 2023 compared to 2022. The increase was primarily driven by $354 million related to rate escalations and higher throughput across the segment. 2023 also benefited from higher distributions and adjustments of $36 million related to equity method investments and lower environmental and remediation costs, as 2022 included a $26 million impact associated with a release of crude oil on our pipeline near Edwardsville, Illinois. Partially offsetting the increase was $40 million of higher expenses, including employee costs from MPC and contractor service costs. Additionally in 2023, property taxes were higher as compared to 2022 primarily resulting from a favorable state tax settlement in 2022.
Crude Oil and Products Logistics Operating Data
| | | | | | | | | | | | | | | | | | | | |
| | 2024 | | 2023 | | 2022 |
| Crude Oil and Products Logistics | | | | | | |
| Crude oil transported for (mbpd): | | | | | | |
| MPC | | 3,086 | | 3,053 | | 2,908 |
| Third parties | | 699 | | 719 | | 641 |
| Total | | 3,785 | | 3,772 | | 3,549 |
| % MPC | | 82% | | 81% | | 82% |
| Refined products transported for (mbpd): | | | | | | |
| MPC | | 1,891 | | 1,941 | | 2,016 |
| Third parties | | 106 | | 99 | | 95 |
| Total | | 1,997 | | 2,040 | | 2,111 |
| % MPC | | 95% | | 95% | | 95% |
Average tariff rates ($ per Bbl)(1): | | | | | | |
| Crude oil pipelines | | $ | 1.03 | | $ | 0.96 | | $ | 0.91 |
| Refined product pipelines | | 1.00 | | 0.90 | | 0.81 |
| Total pipelines | | $ | 1.02 | | $ | 0.94 | | $ | 0.87 |
| | | | | | |
| Terminal throughput (mbpd) | | 3,131 | | 3,130 | | 3,022 |
| | | | | | |
Marine Assets (number in operation)(2) | | | | | | |
| Barges | | 319 | | 305 | | 296 |
| Towboats | | 29 | | 29 | | 23 |
(1)Average tariff rates calculated using pipeline transportation revenues divided by pipeline throughput barrels. Transportation revenues include tariff and other fees, which may vary by region and nature of services provided.
(2)Represents total at end of period.
Natural Gas and NGL Services Segment
Natural Gas and NGL Services Segment Financial Highlights (in millions)
| | | | | |
Segment revenues and other income(1) | Segment Adjusted EBITDA |
| | | | | | | | | | | | | | | | | | | | | | | | | | | | | |
| (In millions) | 2024 | | 2023 | | $ Change | | 2022 | | $ Change |
| | | | | | | | | |
| | | | | | | | | |
| | | | | | | | | |
| | | | | | | | | |
| | | | | | | | | |
| | | | | | | | | |
Total segment revenues and other income(1) | $ | 5,594 | | | $ | 5,233 | | | $ | 361 | | | $ | 6,015 | | | $ | (782) | |
| | | | | | | | | |
| | | | | | | | | |
| | | | | | | | | |
| | | | | | | | | |
| | | | | | | | | |
| | | | | | | | | |
| | | | | | | | | |
| | | | | | | | | |
| | | | | | | | | |
| Segment Adjusted EBITDA | 2,389 | | | 2,135 | | | 254 | | | 2,014 | | | 121 | |
| Capital expenditures | 568 | | | 605 | | | (37) | | | 528 | | | 77 | |
| Investments in unconsolidated affiliates | $ | 143 | | | $ | 90 | | | $ | 53 | | | $ | 154 | | | $ | (64) | |
(1)The year ended December 31, 2024 includes a $151 million gain related to the dilution of ownership interest in connection with the Whistler Joint Venture Transaction. The year ended December 31, 2023 includes a $92 million gain on remeasurement of our existing equity interest in Torñado in conjunction with the purchase of the remaining joint venture interest in 2023. See Item 8. Financial Statements and Supplementary Data - Note 4 for additional information. The year ended December 31, 2022 includes a $509 million gain on a lease reclassification. See Item 8. Financial Statements and Supplementary Data - Note 21 for additional information.
2024 Compared to 2023
Total segment revenues and other income increased $361 million in 2024 compared to 2023. The increase was primarily due to a $151 million gain related to the Whistler Joint Venture Transaction, $126 million of incremental revenues from the consolidation of Torñado in December 2023 and an increase of $44 million from the Utica Midstream Acquisition that was completed in the first quarter of 2024. These increases were partially offset by the impact of a $92 million gain on remeasurement of our existing equity investment in Torñado in conjunction with the purchase of the remaining joint venture interest in 2023. Additional impacts from equity method investments included higher volumes and higher throughput fee rates in the Utica and Marcellus of $29 million in addition to a $12 million benefit from the Utica Midstream Acquisition that was completed in the first quarter of 2024, partially offset by a $32 million decrease from the consolidation of Torñado in December 2023. See Supplemental Information on Equity Method Investments for additional information regarding the results of our equity method investments.
In 2024, higher volumes and higher throughput fee rates across the Marcellus, Rockies and Bakken of $98 million were partially offset by lower volumes in the STACK Shale basin in the Southwest. Revenues benefited from higher NGL prices in the Southwest, Marcellus and Southern Appalachia of $51 million as well as higher volumes in the Rockies and Bakken of $40 million. These increases were partially offset by lower NGL sales volumes in the Southwest of $55 million and lower recognized gains on commodity contracts of $6 million.
Segment Adjusted EBITDA increased $254 million in 2024 compared to 2023. The increase is primarily attributable to higher distributions and adjustments related to equity method investments of $117 million, contributions from recent acquisitions discussed above of $97 million, higher volumes of $73 million and higher NGL pricing of $19 million, partially offset by increased employee costs from MPC of $32 million.
2023 Compared to 2022
Total segment revenues and other income decreased $782 million in 2023 compared to 2022. The decrease was driven by a gain on lease reclassification of $509 million recognized in 2022 which was partially offset by the impact of a $92 million gain on remeasurement of our existing equity investment in Torñado in conjunction with the purchase of the remaining joint venture interest in 2023. Additional impacts from equity method investments included an increase of $51 million attributable to higher volumes associated with our joint ventures in the Marcellus and Utica in addition to a joint venture in the Southwest region which added processing capacity in the fourth quarter of 2022 driving higher volumes over the prior period. See Supplemental Information on Equity Method Investments for additional information regarding the results of our equity method investments.
In 2023, higher NGL sales volumes in the Southwest of $451 million were more than offset by lower NGL prices of $1,059 million. This decrease was partially offset by higher volumes of $76 million and higher throughput fee rates of $57 million in the Marcellus and Rockies.
Segment Adjusted EBITDA increased $121 million in 2023 compared to 2022. The increase is primarily attributable to higher volumes and higher throughput fee rates in all regions of $192 million, higher distributions and adjustments related to equity method investments of $86 million, partially offset by lower NGL pricing across all regions of $132 million and increased employee costs from MPC of $23 million.
Natural Gas and NGL Services Operating Data
(1) Other includes Southern Appalachia, Bakken and Rockies Operations
| | | | | | | | | | | | | | | | | | | | | | | | | | | | | | | | | | | | | | | | | | |
| | MPLX LP(1) | | MPLX LP Operated(2) | | | | |
| | 2024 | | 2023 | | 2022 | | 2024 | | 2023 | | 2022 | | | | |
| Natural Gas and NGL Services | | | | | | | | | | | | | | | | |
| Gathering Throughput (MMcf/d) | | | | | | | | | | | | | | | | |
| Marcellus Operations | | 1,521 | | | 1,389 | | | 1,321 | | | 1,521 | | | 1,389 | | | 1,321 | | | | | |
| Utica Operations | | 264 | | | — | | | — | | | 2,544 | | | 2,338 | | | 2,134 | | | | | |
| Southwest Operations | | 1,698 | | | 1,369 | | | 1,374 | | | 1,698 | | | 1,772 | | | 1,629 | | | | | |
| Bakken Operations | | 183 | | | 165 | | | 152 | | | 183 | | | 165 | | | 152 | | | | | |
| Rockies Operations | | 560 | | | 474 | | | 427 | | | 633 | | | 593 | | | 558 | | | | | |
| Total gathering throughput | | 4,226 | | | 3,397 | | | 3,274 | | | 6,579 | | | 6,257 | | | 5,794 | | | | | |
| Natural Gas Processed (MMcf/d) | | | | | | | | | | | | | | | | |
| Marcellus Operations | | 4,366 | | | 4,179 | | | 4,035 | | | 5,974 | | | 5,773 | | | 5,515 | | | | | |
| Utica Operations | | — | | | — | | | — | | | 832 | | | 564 | | | 495 | | | | | |
| Southwest Operations | | 1,844 | | | 1,466 | | | 1,448 | | | 1,844 | | | 1,772 | | | 1,637 | | | | | |
| Southern Appalachia Operations | | 215 | | | 216 | | | 217 | | | 215 | | | 216 | | | 217 | | | | | |
| Bakken Operations | | 182 | | | 163 | | | 146 | | | 182 | | | 163 | | | 146 | | | | | |
| Rockies Operations | | 616 | | | 483 | | | 438 | | | 616 | | | 483 | | | 438 | | | | | |
| Total natural gas processed | | 7,223 | | | 6,507 | | | 6,284 | | | 9,663 | | | 8,971 | | | 8,448 | | | | | |
| C2 + NGLs Fractionated (mbpd) | | | | | | | | | | | | | | | | |
Marcellus Operations(3) | | 565 | | | 530 | | | 488 | | | 565 | | | 530 | | | 488 | | | | | |
Utica Operations(3) | | — | | | — | | | — | | | 52 | | | 33 | | | 28 | | | | | |
| Southern Appalachia Operations | | 12 | | | 11 | | | 11 | | | 12 | | | 11 | | | 11 | | | | | |
| Bakken Operations | | 20 | | | 20 | | | 21 | | | 20 | | | 20 | | | 21 | | | | | |
| Rockies Operations | | 5 | | | 3 | | | 4 | | | 5 | | | 3 | | | 4 | | | | | |
Total C2 + NGLs fractionated(4) | | 602 | | | 564 | | | 524 | | | 654 | | | 597 | | | 552 | | | | | |
(1) This column represents operating data for entities that have been consolidated into the MPLX financial statements.
(2) This column represents operating data for entities that have been consolidated into the MPLX financial statements as well as operating data for MPLX-operated equity method investments.
(3) Entities within the Marcellus and Utica Operations jointly own the Hopedale fractionation complex. Hopedale throughput is included in the Marcellus and Utica Operations and represents each region’s utilization of the complex.
(4) Purity ethane makes up approximately 265 mbpd, 233 mbpd and 204 mbpd of MPLX LP consolidated total fractionated products for the years ended December 31, 2024, 2023 and 2022, respectively. Purity ethane makes up approximately 282 mbpd, 240 mbpd and 209 mbpd of MPLX operated total fractionated products for the years ended December 31, 2024, 2023 and 2022, respectively.
| | | | | | | | | | | | | | | | | | | | | | | | |
| | 2024 | | 2023 | | 2022 | | | | |
| Pricing Information | | | | | | | | | | |
| Natural Gas NYMEX HH ($/MMBtu) | | $ | 2.41 | | | $ | 2.66 | | | $ | 6.52 | | | | | |
C2 + NGL Pricing/gallon(1) | | $ | 0.84 | | | $ | 0.69 | | | $ | 1.03 | | | | | |
(1) For 2024, C2 + NGL pricing based on Mont Belvieu prices assuming an NGL barrel of approximately 10 percent ethane, 60 percent propane, five percent Iso-Butane, 15 percent normal butane and 10 percent natural gasoline. For 2023 and 2022, C2 + NGL pricing based on Mont Belvieu prices assuming an NGL barrel of approximately 35 percent ethane, 35 percent propane, six percent Iso-Butane, 12 percent normal butane and 12 percent natural gasoline. The changes in mix from 2023 to 2024 resulted in an approximate $0.13 increase in the calculated C2 + NGL price per gallon.
SUPPLEMENTAL INFORMATION ON EQUITY METHOD INVESTMENTS
The following table presents MPLX’s income (loss) from equity method investments for the years ended December 31, 2024, 2023 and 2022:
| | | | | | | | | | | | | | | | | | | | |
| (In millions) | | 2024 | | 2023 | | 2022 |
| Income (loss) from equity method investments: | | | | | | |
| Crude Oil and Products Logistics | | | | | | |
| Illinois Extension Pipeline Company, L.L.C. | | $ | 57 | | | $ | 49 | | | $ | 39 | |
| LOOP LLC | | 11 | | | 30 | | | 23 | |
| MarEn Bakken Company LLC | | 98 | | | 88 | | | 76 | |
| | | | | | |
| | | | | | |
| | | | | | |
| | | | | | |
| | | | | | |
| | | | | | |
| | | | | | |
| | | | | | |
| Other | | 103 | | | 103 | | | 59 | |
| Total Crude Oil and Products Logistics | | 269 | | | 270 | | | 197 | |
| Natural Gas and NGL Services | | | | | | |
| BANGL, LLC | | 7 | | | (5) | | | 5 | |
| MarkWest EMG Jefferson Dry Gas Gathering Company, L.L.C. | | 67 | | | 64 | | | 73 | |
| MarkWest Utica EMG, L.L.C. | | 82 | | | 57 | | | 32 | |
| Ohio Gathering Company L.L.C. | | 13 | | | — | | | — | |
| Sherwood Midstream LLC | | 109 | | | 105 | | | 93 | |
WPC Parent, LLC(1) | | 252 | | | 80 | | | 64 | |
| | | | | | |
| | | | | | |
| | | | | | |
| | | | | | |
| | | | | | |
| | | | | | |
| | | | | | |
| | | | | | |
| | | | | | |
| | | | | | |
| | | | | | |
| | | | | | |
| | | | | | |
| Other | | 3 | | | 29 | | | 12 | |
| Total Natural Gas and NGL Services | | 533 | | | 330 | | | 279 | |
| Total | | $ | 802 | | | $ | 600 | | | $ | 476 | |
(1) In May 2024, MPLX completed the Whistler Joint Venture Transaction, which resulted in the formation of a new entity, WPC Parent, LLC. Results include the equity method investment income of our interest in Whistler Pipeline, LLC, prior to the transaction date, and results of the equity method investment income of our ownership in WPC Parent, LLC, subsequent to the transaction date. The year ended December 31, 2024 includes a gain of $151 million related to the dilution of our ownership interest in connection with the Whistler Joint Venture Transaction.
The following table presents the impact of equity method investment distributions and other adjustments included in MPLX’s Adjusted EBITDA for the years ended December 31, 2024, 2023 and 2022:
| | | | | | | | | | | | | | | | | | | | |
| (In millions) | | 2024 | | 2023 | | 2022 |
| Distributions/adjustments related to equity method investments: | | | | | | |
| Crude Oil and Products Logistics | | | | | | |
| Illinois Extension Pipeline Company, L.L.C. | | $ | 67 | | | $ | 58 | | | $ | 45 | |
| LOOP LLC | | 20 | | | 9 | | | 23 | |
| MarEn Bakken Company LLC | | 113 | | | 116 | | | 113 | |
| | | | | | |
| | | | | | |
| | | | | | |
| | | | | | |
| | | | | | |
| | | | | | |
| | | | | | |
| Other | | 147 | | | 124 | | | 90 | |
| Total Crude Oil and Products Logistics | | 347 | | | 307 | | | 271 | |
| Natural Gas and NGL Services | | | | | | |
| BANGL, LLC | | 17 | | | — | | | — | |
| MarkWest EMG Jefferson Dry Gas Gathering Company, L.L.C. | | 83 | | | 86 | | | 86 | |
| MarkWest Utica EMG, L.L.C. | | 123 | | | 89 | | | 73 | |
| Ohio Gathering Company L.L.C. | | 38 | | | — | | | — | |
| Sherwood Midstream LLC | | 122 | | | 117 | | | 115 | |
WPC Parent, LLC(1) | | 162 | | | 94 | | | 57 | |
| | | | | | |
| | | | | | |
| | | | | | |
| | | | | | |
| | | | | | |
| | | | | | |
| | | | | | |
| | | | | | |
| | | | | | |
| | | | | | |
| | | | | | |
| | | | | | |
| | | | | | |
| Other | | 36 | | | 81 | | | 50 | |
| Total Natural Gas and NGL Services | | 581 | | | 467 | | | 381 | |
| Total | | $ | 928 | | | $ | 774 | | | $ | 652 | |
(1) In May 2024, MPLX completed the Whistler Joint Venture Transaction, which resulted in the formation of a new entity, WPC Parent, LLC. Results include the equity method investment distributions and adjustments of our interest in Whistler Pipeline, LLC, prior to the transaction date, and results of the equity method investment distributions and adjustments of our ownership in WPC Parent, LLC, subsequent to the transaction date.
LIQUIDITY AND CAPITAL RESOURCES
Cash Flows
Our cash and cash equivalents were $1,519 million and $1,048 million at December 31, 2024 and December 31, 2023, respectively. The change in cash and cash equivalents was due to the factors discussed below. Net cash provided by (used in) operating activities, investing activities and financing activities for the past three years were as follows:
| | | | | | | | | | | | | | | | | | | | |
| (In millions) | | 2024 | | 2023 | | 2022 |
| Net cash provided by/(used in): | | | | | | |
| Operating activities | | $ | 5,946 | | | $ | 5,397 | | | $ | 5,019 | |
| Investing activities | | (1,995) | | | (1,252) | | | (956) | |
| Financing activities | | (3,480) | | | (3,335) | | | (3,838) | |
| Total | | $ | 471 | | | $ | 810 | | | $ | 225 | |
Cash Flows Provided by Operating Activities - Net cash provided by operating activities increased $549 million, or ten percent, in 2024 compared to 2023, primarily due to improved results from operations, increased cash distributions from equity method investments and $72 million of favorable working capital changes.
Cash Flows Used in Investing Activities - Net cash used in investing activities increased $743 million in 2024 compared to 2023 primarily due to the Utica Midstream Acquisition in the first quarter of 2024 and higher capital spending. The year ended December 31, 2024 also reflects the use of $228 million for the acquisition of additional ownership interest in equity method investments, as well as higher contributions to equity method investments, including a $92 million contribution to Dakota Access to fund our share of a scheduled debt repayment by the joint venture. The increases were partially offset by a $134 million cash distribution received, recorded as a return of capital, in connection with the Whistler Joint Venture Transaction in 2024.
Cash Flows Used in and Provided by Financing Activities - Net cash used in financing activities increased $145 million in 2024 compared to 2023. The increase was primarily due to the return of capital to unitholders through unit repurchases of $326 million, as well as higher distributions paid to unitholders of $307 million during 2024 compared to 2023, as a result of the 12.5 percent increase in our quarterly distribution effective for the third quarter of 2024. There were also lower net borrowings of $109 million in 2024 as compared to 2023. These increases were partially offset by the use of $600 million to redeem all of the outstanding Series B preferred units during 2023.
Adjusted Free Cash Flow - For the year ended December 31, 2024, we generated Adjusted FCF of $3.9 billion. This provided us the flexibility to return capital to our unitholders by increasing our quarterly distribution by 12.5 percent in the third quarter of 2024. The table below provides a reconciliation of Adjusted FCF and Adjusted FCF after distributions from net cash provided by operating activities for the years ended December 31, 2024, 2023 and 2022.
| | | | | | | | | | | | | | | | | | | | | | | | |
| | | | | | | | | | | | |
| | | | | |
| (In millions) | | | | | | | | 2024 | | 2023 | | 2022 |
Net cash provided by operating activities(1) | | | | | | | | $ | 5,946 | | | $ | 5,397 | | | $ | 5,019 | |
| Adjustments to reconcile net cash provided by operating activities to adjusted free cash flow | | | | | | | | | | | | |
Net cash used in investing activities(2) | | | | | | | | (1,995) | | | (1,252) | | | (956) | |
| Contributions from MPC | | | | | | | | 35 | | | 31 | | | 44 | |
| Distributions to noncontrolling interests | | | | | | | | (44) | | | (41) | | | (38) | |
| Adjusted FCF | | | | | | | | 3,942 | | | 4,135 | | | 4,069 | |
| | | | | | | | | | | | |
| | | | | | | | | | | | |
| | | | | | | | | | | | |
| | | | | | | | | | | | |
| | | | | | | | | | | | |
| Distributions paid to common and preferred unitholders | | | | | | | | (3,603) | | | (3,296) | | | (3,047) | |
| Adjusted FCF after distributions | | | | | | | | $ | 339 | | | $ | 839 | | | $ | 1,022 | |
(1) The years ended December 31, 2024, 2023 and 2022 include working capital draws of $241 million,$169 million and $128 million, respectively.
(2) The year ended December 31, 2024 includes $622 million, net of cash acquired, related to the Utica Midstream Acquisition, $210 million and $18 million related to the acquisition of additional interests in BANGL, LLC and Wink to Webster Pipeline LLC, respectively, a contribution of $92 million to Dakota Access to fund our share of a debt repayment by the joint venture and a $134 million cash distribution received in connection with the Whistler Joint Venture Transaction.
Debt and Liquidity Overview
Senior Notes
On May 20, 2024, MPLX issued $1.65 billion aggregate principal amount of the 5.50 percent senior notes due June 2034 (the “2034 Senior Notes”) in an underwritten public offering. The 2034 Senior Notes were offered at a price to the public of 98.778 percent of par, with interest payable semi-annually in arrears, commencing on December 1, 2024. On December 1, 2024, MPLX used $1,150 million of the net proceeds from the issuance of the 2034 Senior Notes to repay all of (i) MPLX’s outstanding $1,149 million aggregate principal amount of 4.875 percent senior notes due December 2024 and (ii) MarkWest’s outstanding $1 million aggregate principal amount of 4.875 percent senior notes due December 2024. On February 18, 2025, MPLX used the remaining net proceeds from the issuance of the 2034 Senior Notes to repay all of MPLX’s outstanding $500 million aggregate principal amount of 4.000 percent senior notes due February 2025.
As of December 31, 2024, we had $21.2 billion in aggregate principal amount of senior notes outstanding. The increase of $0.5 billion compared to year-end 2023 resulted from financing the redemption of the Senior Notes due February 2025 with the proceeds from the issuance of the 2034 Senior Notes, as discussed above.
Credit Agreement
MPLX’s credit agreement (the “MPLX Credit Agreement”) matures in July 2027 and, among other things, provides for a $2 billion unsecured revolving credit facility and letter of credit issuing capacity under the facility of up to $150 million. Letter of credit issuing capacity is included in, not in addition to, the $2 billion borrowing capacity. Borrowings under the MPLX Credit Agreement bear interest, at MPLX’s election, at either the Adjusted Term SOFR or the Alternate Base Rate, both as defined in the MPLX Credit Agreement, plus an applicable margin.
The borrowing capacity under the MPLX Credit Agreement may be increased by up to an additional $1 billion, subject to certain conditions, including the consent of lenders whose commitments would increase. In addition, the maturity date may be extended for up to two additional one-year periods, subject to, among other conditions, the approval of lenders holding the majority of the commitments then outstanding, provided that the commitments of any non-consenting lenders will terminate on the then-effective maturity date. We are charged various fees and expenses in connection with the agreement, including administrative agent fees, commitment fees on the unused portion of the bank revolving credit facility and fees with respect to issued and outstanding letters of credit. The applicable margins to the benchmark interest rates and certain fees fluctuate based on the credit ratings in effect from time to time on MPLX’s long-term debt.
The MPLX Credit Agreement contains certain representations and warranties, affirmative and negative covenants and events of default that we consider usual and customary for an agreement of that type that could, among other things, limit our ability to pay distributions to our unitholders. The financial covenant requires us to maintain a ratio of Consolidated Total Debt as of the end of each fiscal quarter to Consolidated EBITDA (both as defined in the MPLX Credit Agreement) for the prior four fiscal quarters of no greater than 5.0 to 1.0 (or 5.5 to 1.0 for up to two fiscal quarters following certain acquisitions). Consolidated EBITDA is subject to adjustments, including for certain acquisitions completed and capital projects undertaken during the relevant period. Other covenants restrict us and/or certain of our subsidiaries from incurring debt, creating liens on our assets and entering into transactions with affiliates. As of December 31, 2024, we were in compliance with the covenants contained in the MPLX Credit Agreement.
MPC Loan Agreement
MPLX is party to a loan agreement with MPC (the “MPC Loan Agreement”), which was renewed on July 31, 2024. Under the terms of the MPC Loan Agreement, MPC extends loans to MPLX on a revolving basis as requested by MPLX and as agreed to by MPC. The borrowing capacity of the MPC Loan Agreement is $1.5 billion aggregate principal amount of all loans outstanding at any one time. The MPC Loan Agreement is now scheduled to expire, and borrowings under the loan agreement are scheduled to mature and become due and payable, on July 31, 2029, provided that MPC may demand payment of all or any portion of the outstanding principal amount of the loan, together with all accrued and unpaid interest and other amounts (if any), at any time prior to the maturity date. Borrowings under the MPC Loan Agreement bear interest at one-month term SOFR adjusted upward by 0.10 percent plus 1.25 percent or such lower rate as would be applicable to such loans under the MPLX Credit Agreement as discussed in Item 8. Financial Statements and Supplementary Data - Note 17. All other terms of the MPC Loan Agreement remain unchanged.
There were no borrowings or repayments on the MPC Loan Agreement or MPLX Credit Agreement during the year ended December 31, 2024. The MPLX Credit Agreement had less than $1 million in letters of credit outstanding.
For further discussion, see Item 8. Financial Statements and Supplementary Data – Note 6 and Note 17.
Our intention is to maintain an investment grade credit profile. As of February 1, 2025, the credit ratings on our senior unsecured debt were at or above investment grade level as follows:
| | | | | | | | |
| Rating Agency | | Rating |
| Fitch | | BBB (stable outlook) |
| Moody’s | | Baa2 (stable outlook) |
| Standard & Poor’s | | BBB (stable outlook) |
The ratings reflect the respective views of the rating agencies and should not be interpreted as a recommendation to buy, sell or hold our securities. Although it is our intention to maintain a credit profile that supports an investment grade rating, there is no assurance that these ratings will continue for any given period of time. The ratings may be revised or withdrawn entirely by the rating agencies if, in their respective judgments, circumstances so warrant. A rating from one rating agency should be evaluated independently of ratings from other rating agencies.
The agreements governing our debt obligations do not contain credit rating triggers that would result in the acceleration of interest, principal or other payments solely in the event that our credit ratings are downgraded. However, any downgrades in the credit ratings of our senior unsecured debt ratings to below investment grade ratings could, among other things, increase the applicable interest rates and other fees payable under the MPLX Credit Agreement, and may limit our ability to obtain future financing, including refinancing existing indebtedness.
Our liquidity totaled $5.0 billion at December 31, 2024, consisting of:
| | | | | | | | | | | | | | | | | |
| December 31, 2024 |
| (In millions) | Total Capacity | | Outstanding Borrowings | | Available
Capacity |
| MPLX Credit Agreement | $ | 2,000 | | | $ | — | | | $ | 2,000 | |
| MPC Loan Agreement | 1,500 | | | — | | | 1,500 | |
| Total | $ | 3,500 | | | $ | — | | | 3,500 | |
| Cash and cash equivalents | | | | | 1,519 | |
| Total liquidity | | | | | $ | 5,019 | |
We expect our ongoing sources of liquidity to include cash generated from operations, borrowings under our revolving credit facilities and access to capital markets. We believe that cash generated from these sources will be sufficient to meet our short-term and long-term funding requirements, including working capital requirements, capital expenditure requirements, contractual obligations and quarterly cash distributions. Our material future obligations include interest on debt, payments of debt principal, purchase obligations including contracts to acquire property, plant and equipment and our operating leases and service agreements. We may also, from time to time repurchase our senior notes in the open market, in tender offers, in privately negotiated transactions or otherwise in such volumes, at market prices and upon such other terms as we deem appropriate and execute unit repurchases under our unit repurchase program.
MPC manages our cash and cash equivalents on our behalf directly with third-party institutions as part of the treasury services that it provides to us under our omnibus agreement. From time to time, we may also utilize other sources of liquidity, including the formation of joint ventures or sales of non-strategic assets.
Equity and Preferred Units Overview
Preferred Units
Series A Preferred Units - On May 13, 2016, MPLX completed the private placement of approximately 30.8 million Series A preferred units for a cash purchase price of $32.50 per unit. The aggregate net proceeds of approximately $984 million from the sale of the preferred units were used for capital expenditures, repayment of debt and general business purposes.
The holders of the Series A preferred units received quarterly distributions equal to the greater of $0.528125 per unit or the amount of distributions they would have received on an as converted basis. Distributions paid to Series A preferred unitholders during the years ended December 31, 2024, 2023 and 2022 were $44 million, $94 million and $85 million, respectively.
During the years ended December 31, 2024 and December 31, 2023, certain Series A preferred unitholders exercised their rights to convert their Series A preferred units into approximately 21 million common units and 2 million common units, respectively. Approximately 6 million Series A preferred units were outstanding as of December 31, 2024. On February 11, 2025, MPLX exercised its right to convert the remaining outstanding Series A preferred units into common units.
Unit Repurchase Program
On November 2, 2020, MPLX announced the board authorization of a unit repurchase program for the repurchase of up to $1 billion of MPLX’s outstanding common units held by the public, which was exhausted during the fourth quarter of 2022. On August 2, 2022, we announced the board authorization for the repurchase of up to an additional $1 billion of MPLX common
units held by the public. The authorization has no expiration date. We may utilize various methods to effect the repurchases, which could include open market repurchases, negotiated block transactions, accelerated unit repurchases, tender offers, or open market solicitations for units, some of which may be effected through Rule 10b5-1 plans. The timing and amount of future repurchases, if any, will depend upon several factors, including market and business conditions, and such repurchases may be suspended, discontinued, or restarted at any time.
Total unit repurchases were as follows for the respective periods:
| | | | | | | | | | | | | | | | | |
| (In millions, except per unit data) | 2024 | | 2023 | | 2022 |
| Units repurchased | 8 | | | — | | | 15 | |
Cash paid for common units repurchased(1) | $ | 326 | | | $ | — | | | $ | 491 | |
Average cost per unit(1) | $ | 43.04 | | | $ | — | | | $ | 31.96 | |
(1)Cash paid for common units repurchased and average cost per unit includes commissions paid to brokers during the period.
As of December 31, 2024, we had $520 million remaining under the unit repurchase authorization.
Distributions
On January 22, 2025, we announced that the board of directors of our general partner had declared a quarterly cash distribution of $0.9565 per common unit for the fourth quarter of 2024, which was paid on February 14, 2025 to common unitholders of record on February 3, 2025. This represents a 12.5 percent increase over the fourth quarter of 2023 distribution. Although our Partnership Agreement requires that we distribute all of our available cash each quarter, we do not otherwise have a legal obligation to distribute any particular amount per common unit.
The allocation of total quarterly cash distributions to limited and preferred partners is as follows for the years ended December 31, 2024, 2023 and 2022. Our distributions are declared subsequent to quarter end; therefore, the following table represents total cash distributions applicable to the period in which the distributions were earned. See additional discussion in Item 8. Financial Statements and Supplementary Data - Note 8.
| | | | | | | | | | | | | | | | | |
| (In millions, except per unit data) | 2024 | | 2023 | | 2022 |
| Distribution declared: | | | | | |
| Limited partner common units - public | $ | 1,339 | | | $ | 1,152 | | | $ | 1,063 | |
| Limited partner common units - MPC | 2,339 | | | 2,104 | | | 1,917 | |
| Total distributions declared to limited partner common units | 3,678 | | | 3,256 | | | 2,980 | |
| Series A preferred units | 27 | | | 94 | | | 88 | |
| Series B preferred units | — | | | 5 | | | 41 | |
| Total distribution declared | $ | 3,705 | | | $ | 3,355 | | | $ | 3,109 | |
| Cash distributions declared per limited partner common unit: | | | | | |
| Quarter ended March 31, | $ | 0.8500 | | | $ | 0.7750 | | | $ | 0.7050 | |
| Quarter ended June 30, | 0.8500 | | | 0.7750 | | | 0.7050 | |
| Quarter ended September 30, | 0.9565 | | | 0.8500 | | | 0.7750 | |
| Quarter ended December 31, | 0.9565 | | | 0.8500 | | | 0.7750 | |
| Year ended December 31, | $ | 3.6130 | | | $ | 3.2500 | | | $ | 2.9600 | |
Capital Expenditures
Our operations are capital intensive, requiring investments to expand, upgrade, enhance or maintain existing operations and to meet environmental and operational regulations. Our capital requirements consist of growth capital expenditures and maintenance capital expenditures. Growth capital expenditures are those incurred for acquisitions or capital improvements that we expect will increase our operating capacity for volumes gathered, processed, transported or fractionated, decrease operating expenses within our facilities or increase income from operations over the long term. Examples of growth capital expenditures include costs to develop or acquire additional pipeline, terminal, processing or storage capacity. In general, growth capital includes costs that are expected to generate additional or new cash flow for MPLX. In contrast, maintenance capital expenditures are expenditures made to replace partially or fully depreciated assets, to maintain the existing operating capacity of our assets and to extend their useful lives, or other capital expenditures that are incurred to maintain existing system volumes and related cash flows.
Our capital expenditures for the past three years are shown in the table below:
| | | | | | | | | | | | | | | | | | | | |
| (In millions) | | 2024 | | 2023 | | 2022 |
| Capital expenditures: | | | | | | |
| Growth capital expenditures | | $ | 796 | | | $ | 838 | | | $ | 665 | |
| Growth capital reimbursements | | (115) | | | (165) | | | (151) | |
Investments in unconsolidated affiliates(1) | | 236 | | | 98 | | | 217 | |
| Return of capital | | (12) | | | (3) | | | (11) | |
| Capitalized interest | | (16) | | | (14) | | | (8) | |
Total growth capital expenditures(2) | | 889 | | | 754 | | | 712 | |
| | | | | | |
| Maintenance capital expenditures | | 254 | | | 181 | | | 188 | |
| Maintenance capital reimbursements | | (48) | | | (31) | | | (44) | |
| Capitalized interest | | (3) | | | (1) | | | (1) | |
| Total maintenance capital expenditures | | 203 | | | 149 | | | 143 | |
| | | | | | |
| Total growth and maintenance capital expenditures | | 1,092 | | | 903 | | | 855 | |
Investments in unconsolidated affiliates(3) | | (236) | | | (98) | | | (217) | |
Return of capital(3) | | 12 | | | 3 | | | 11 | |
Growth and maintenance capital reimbursements(4) | | 163 | | | 196 | | | 195 | |
| Decrease/(increase) in capital accruals | | 6 | | | (82) | | | (47) | |
| Capitalized interest | | 19 | | | 15 | | | 9 | |
Additions to property, plant and equipment(3) | | $ | 1,056 | | | $ | 937 | | | $ | 806 | |
(1) Investments in unconsolidated affiliates for the year ended December 31, 2024 exclude $210 million and $18 million related to the acquisition of additional interests in BANGL, LLC and Wink to Webster Pipeline LLC, respectively.
(2) Total growth capital expenditures exclude $622 million, $246 million and $28 million of acquisitions, net of cash acquired, in 2024, 2023 and 2022, respectively, and a $134 million cash distribution received in 2024 in connection with the Whistler Joint Venture Transaction.
(3) Investments in unconsolidated affiliates and return of capital are presented in separate lines within investing activities on the Consolidated Statement of Cash Flows; and therefore excluded from additions to property, plant and equipment.
(4) Growth capital reimbursements are generally included in changes in deferred revenue within the operating activities section of the Consolidated Statements of Cash Flows. Maintenance capital reimbursements are included in the Contributions from MPC line within financing activities section of the Consolidated Statements of Cash Flows.
For 2025, we announced a capital outlook of $2.0 billion, net of reimbursements, and excluding potential acquisitions, if any, which includes growth capital of $1.7 billion and maintenance capital of $300 million. Our growth capital plans are focused on expanding our Permian to Gulf Coast integrated value chain, progressing long-haul pipeline growth projects to support producer activity, and investing in new gas processing plants in the Marcellus and Permian. The remainder of our capital plan targets the expansion of crude gathering pipelines in the Permian and Bakken basins, and the debottlenecking of existing assets to meet customer demand. We continuously evaluate our capital plan and make changes as conditions warrant.
We participate in joint ventures, which, in turn, also invest in capital projects. Certain of our joint ventures fund capital expenditures with project debt financings at the joint venture level or with cash from operations. Growth capital projects funded through debt at the joint venture level or cash from operations of the joint venture do not require capital contributions by us unless otherwise noted. Our pro-rata share of these growth capital projects for our equity method investments that have been funded at the joint venture level for the periods presented are shown in the table below.
| | | | | | | | | | | | | | | | | | | | | | | | | | |
| (In millions, except ownership percentages) | | MPLX Ownership | | 2024 | | 2023 | | 2022 |
| BANGL, LLC | | 45% | | $ | 160 | | | $ | 20 | | | $ | 2 | |
MXP Parent, LLC(1) | | 5% | | 56 | | | 39 | | | — | |
WPC Parent, LLC(2) | | 30% | | 5 | | | 96 | | | 75 | |
| All other | | | | 49 | | | 87 | | | 17 | |
| Total | | | | $ | 270 | | | $ | 242 | | | $ | 94 | |
(1) Includes growth capital for Matterhorn Express Pipeline.
(2) Disclosed amounts include growth capital related to WPC Parent, LLC, including the ADCC Pipeline lateral, Rio Bravo Pipeline, Whistler Pipeline, and our indirect and 12.5 percent direct ownership in the Blackcomb Pipeline.
Project debt at the joint venture level is typically secured by the assets owned by the joint venture and in certain cases, MPLX’s interest in the joint venture, but unless otherwise noted, is non-recourse to MPLX in excess of the value of MPLX’s investment in the joint venture. At December 31, 2024, debt held by our unconsolidated joint ventures based on our equity ownership percentage was $1.6 billion.
Cash Commitments
Our material cash requirements include the following contractual obligations and other cash commitments as of December 31, 2024.
Our contractual obligations primarily consist of outstanding borrowings on debt, commitment and administrative fees and interest. Additional information for third-party debt is included in Item 8. Financial Statements and Supplementary Data – Note 17. See Item 8. Financial Statements and Supplementary Data – Note 6 for additional information for the related party loan. Our cash commitment at December 31, 2024 was $34.0 billion, with $2.6 billion payable within 12 months. We intend to repay the short-term maturities with existing cash on hand, short-term borrowings under our revolving credit agreements or with the proceeds of new long-term debt, depending on, among other things, market conditions.
Our contractual commitment for co-location services agreements was $4.0 billion at December 31, 2024. These agreements obligate us to pay MPC for operational and other services provided to the subsidiaries of MPLX Operations LLC. The co-location services agreements have remaining terms up to 44 years.
Finance and operating leases relate primarily to facilities and equipment under lease, including ground leases, building space, office and field equipment, storage facilities and transportation equipment. See Item 8. Financial Statements and Supplementary Data – Note 21 for further discussion about our lease obligations. Our cash commitment at December 31, 2024 was $923 million.
We execute various third-party transportation, terminalling, and gathering and processing agreements that obligate us to minimum volume, throughput or payment commitments over the remaining terms, which range from less than one year to seven years. We expect to pass any minimum payment commitments through to producer customers. These agreements may include escalation clauses based on various inflationary indices; however, those potential increases have not been incorporated in minimum fees due under these agreements presented below. See Item 8. Financial Statements and Supplementary Data – Note 22 for further discussion. Our cash commitment at December 31, 2024 was $675 million.
At December 31, 2024, our contractual commitment under contracts to acquire property, plant and equipment was $128 million.
Our other cash commitments consist of expense projects, right of way and easement obligations, natural gas purchase obligations and ARO commitments. These other cash commitments at December 31, 2024 totaled $362 million.
In addition, we have omnibus agreements and employee services agreements with MPC. One of the omnibus agreements with MPC addresses our payment of a fixed annual fee to MPC for the provision of executive management services by certain executive officers of our general partner and our reimbursement to MPC for the provision of certain general and administrative services to us.
We also pay MPC additional amounts based on the costs actually incurred by MPC in providing other services, except for the portion of the amount attributable to engineering services, which is based on the amounts actually incurred by MPC and its affiliates plus an incremental surcharge. In addition, we are obligated to reimburse MPC for most out-of-pocket costs and expenses incurred by MPC on our behalf.
MPLX has various employee agreements with MPC under which MPLX reimburses MPC for employee benefit expenses, along with the provision of operational and management services in support of both our Crude Oil and Products Logistics and Natural Gas and NGL Services segments’ operations.
We incurred $2.0 billion of costs under various agreements with MPC, including the omnibus, co-location and employee service agreements for 2024.
Effects of Inflation
Inflation did not have a material impact on our results of operations for the years ended December 31, 2024, 2023 or 2022. We have observed higher costs for labor and materials used in our business during the year ended December 31, 2024. Many of our agreements provide for inflation-based adjustments, including the Producer Price Index-FG, Consumer Price Index or the FERC index. To the extent permitted by competition, regulation and our existing agreements, we have and expect to continue to pass along a portion of increased costs to our customers in the form of higher fees.
TRANSACTIONS WITH RELATED PARTIES
As of December 31, 2024, MPC owned our general partner and an approximate 64 percent limited partner interest in us. We perform a variety of services for MPC related to the transportation of crude and refined products, including renewables, via pipeline or marine, as well as terminal services, storage services and fuels distribution and marketing services, among others. The services that we provide may be based on regulated tariff rates or on contracted rates. In addition, MPC performs certain services for us related to information technology, engineering, legal, accounting, treasury, human resources and other administrative services. For further discussion of agreements and activity with MPC and related parties see Item 1. Business and Item 8. Financial Statements and Supplementary Data – Note 6.
Excluding significant non-cash items, MPC accounted for 49 percent, 50 percent and 47 percent of our total revenues and other income for the years ended December 31, 2024, 2023 and 2022, respectively. Of our total costs and expenses, MPC accounted for 27 percent, 27 percent and 25 percent for the years ended December 31, 2024, 2023 and 2022, respectively.
ENVIRONMENTAL MATTERS AND COMPLIANCE COSTS
We are subject to extensive federal, state and local environmental laws and regulations. These laws, which change frequently, regulate the discharge of materials into the environment or otherwise relate to protection of the environment. Compliance with these laws and regulations may require us to remediate environmental damage from any discharge of hazardous, petroleum or chemical substances from our facilities or require us to install additional pollution control equipment on our equipment and facilities. Our failure to comply with these or any other environmental or safety-related regulations could result in the assessment of administrative, civil or criminal penalties, the imposition of investigatory and remedial liabilities, and the issuance of injunctions that may subject us to additional operational constraints.
Future expenditures may be required to comply with the CAA and other federal, state and local requirements for our various facilities. The impact of these legislative and regulatory developments, if enacted or adopted, could result in increased compliance costs and additional operating restrictions on our business, each of which could have an adverse impact on our financial position, results of operations and liquidity. We expect that certain of these costs will be subject to indemnification by MPC.
Legislation and regulations pertaining to climate change and GHG emissions have the potential to materially adversely impact our business, financial condition, results of operations and cash flows, including costs of compliance and permitting delays. The extent and magnitude of these adverse impacts cannot be reliably or accurately estimated at this time because specific regulatory and legislative requirements have not been finalized and uncertainty exists with respect to the measures being considered, the costs and the time frames for compliance, and our ability to pass compliance costs on to our customers.
We have incurred and may continue to incur substantial capital, operating and maintenance, and remediation expenditures as a result of these environmental laws and regulations. If these expenditures, as with all costs, are not ultimately reflected in the fees and tariff rates we receive for our services, our operating results will be adversely affected. We believe that substantially all of our competitors must comply with similar environmental laws and regulations. However, the specific impact on each competitor may vary depending on a number of factors, including, but not limited to, the age and location of its operating facilities. Our environmental expenditures for each of the past three years were:
| | | | | | | | | | | | | | | | | | | | |
| (In millions, except %) | | 2024 | | 2023 | | 2022 |
| Capital | | $ | 41 | | | $ | 29 | | | $ | 15 | |
| Percent of total capital expenditures | | 4 | % | | 3 | % | | 2 | % |
Compliance:(1) | | | | | | |
| Operating and maintenance | | $ | 41 | | | $ | 10 | | | $ | 15 | |
Remediation(2) | | 9 | | | 19 | | | 33 | |
| Total | | $ | 50 | | | $ | 29 | | | $ | 48 | |
(1)Based on the American Petroleum Institute’s definition of environmental expenditures.
(2)These amounts include spending charged against remediation reserves and exclude non-cash accruals for environmental remediation. Remediation for the year ended December 31, 2022 include costs related to a release of crude oil on our pipeline near Edwardsville, Illinois in March of 2022.
We accrue for environmental remediation activities when the responsibility to remediate is probable and the amount of associated costs can be reasonably estimated. As environmental remediation matters proceed toward ultimate resolution or as additional remediation obligations arise, charges in excess of those previously accrued may be required.
New or expanded environmental requirements, which could increase our environmental costs, may arise in the future. We believe we comply with all legal requirements regarding the environment, but since not all of them are fixed or presently determinable (even under existing legislation) and may be affected by future legislation or regulations, it is not possible to predict all of the ultimate costs of compliance, including remediation costs that may be incurred and penalties that may be imposed.
Our environmental capital expenditures are expected to approximate $111 million in 2025. Actual expenditures may vary as the number and scope of environmental projects are revised as a result of improved technology or changes in regulatory requirements and could increase if additional projects are identified or additional requirements are imposed.
For more information on environmental regulations that impact us, or could impact us, see Item 1. Business – Regulatory Matters and Item 1A. Risk Factors.
TAX MATTERS
Our U.S. federal income tax returns for the years 2019 through 2022 are currently under examination by the Internal Revenue Service.
CRITICAL ACCOUNTING ESTIMATES
The preparation of financial statements in accordance with GAAP requires us to make estimates and assumptions that affect the reported amounts of assets and liabilities, the disclosure of contingent assets and liabilities as of the date of the consolidated financial statements and the reported amounts of revenues and expenses during the respective reporting periods. Accounting estimates are considered to be critical if (i) the nature of the estimates and assumptions is material due to the levels of subjectivity and judgment necessary to account for highly uncertain matters or the susceptibility of such matters to change and (ii) the impact of the estimates and assumptions on financial condition or operating performance is material. Actual results could differ from the estimates and assumptions used. See Item 8. Financial Statements and Supplementary Data – Note 2 for additional information on these policies and estimates, as well as a discussion of additional accounting policies and estimates.
Fair Value Estimates
Fair value is the price that would be received to sell an asset or paid to transfer a liability in an orderly transaction between market participants at the measurement date. There are three approaches for measuring the fair value of assets and liabilities: the market approach, the income approach and the cost approach, each of which includes multiple valuation techniques. The market approach uses prices and other relevant information generated by market transactions involving identical or comparable assets or liabilities. The income approach uses valuation techniques to measure fair value by converting future amounts, such as cash flows or earnings, into a single present value amount using current market expectations about those future amounts. The cost approach is based on the amount that would currently be required to replace the service capacity of an asset. This is often referred to as current replacement cost. The cost approach assumes that the fair value would not exceed what it would cost a market participant to acquire or construct a substitute asset of comparable utility, adjusted for obsolescence.
The fair value accounting standards do not prescribe which valuation technique should be used when measuring fair value and do not prioritize among the techniques. These standards establish a fair value hierarchy that prioritizes the inputs used in applying the various valuation techniques. Inputs broadly refer to the assumptions that market participants use to make pricing decisions, including assumptions about risk. Level 1 inputs are given the highest priority in the fair value hierarchy while Level 3 inputs are given the lowest priority. The three levels of the fair value hierarchy are as follows:
•Level 1 - Observable inputs that reflect unadjusted quoted prices for identical assets or liabilities in active markets as of the measurement date. Active markets are those in which transactions for the asset or liability occur in sufficient frequency and volume to provide pricing information on an ongoing basis.
•Level 2 - Observable market-based inputs or unobservable inputs that are corroborated by market data. These are inputs other than quoted prices in active markets included in Level 1, which are either directly or indirectly observable as of the measurement date.
•Level 3 - Unobservable inputs that are not corroborated by market data and may be used with internally developed methodologies that result in management’s best estimate of fair value.
Valuation techniques that maximize the use of observable inputs are favored. Assets and liabilities are classified in their entirety based on the lowest priority level of input that is significant to the fair value measurement. The assessment of the significance of a particular input to the fair value measurement requires judgment and may affect the placement of assets and liabilities within the levels of the fair value hierarchy. We use an income or market approach for recurring fair value measurements and endeavor to use the best information available. We use a cost method or income approach for non-recurring fair value measurements related to the valuation of our leased assets and assets acquired in business combinations. See Item 8. Financial Statements and Supplementary Data - Note 15 for disclosures regarding our fair value measurements.
Significant uses of fair value measurements include:
•assessment of impairment of long-lived assets, intangible assets, goodwill and equity method investments;
•assessment of values for assets in implicit leases, including sales-type leases;
•assessment of values for underlying assets to record net investment in sales-type leases;
•recorded values for assets acquired and liabilities assumed in connection with acquisitions; and
•recorded values of derivative instruments.
Impairment Assessments of Long-Lived Assets, Intangible Assets, Goodwill and Equity Method Investments
Fair value calculated for the purpose of testing our long-lived assets, intangible assets, goodwill and equity method investments for impairment is estimated using the expected present value of future cash flows method and comparative market prices when appropriate. Significant judgment is involved in performing these fair value estimates since the results are based on forecasted financial information prepared using significant assumptions including:
•Future operating performance. Our estimates of future operating performance are based on our analysis of various supply and demand factors, which include, among other things, industry-wide capacity, our planned utilization rate, end-user demand, capital expenditures and economic conditions, as well as commodity prices. Such estimates are consistent with those used in our planning and capital investment reviews.
•Future volumes. Our estimates of future throughput of crude oil, natural gas, NGL and refined product volumes are based on internal forecasts and depend, in part, on assumptions about our customers and other producers’ drilling activity which is inherently subjective and contingent upon a number of variable factors (including future or expected crude oil and natural gas pricing considerations), many of which are difficult to forecast. Management considers these volume forecasts and other factors when developing our forecasted cash flows.
•Discount rate commensurate with the risks involved. We apply a discount rate to our cash flows based on a variety of factors, including market and economic conditions, operational risk, regulatory risk and political risk. This discount rate is also compared to recent observable market transactions, if possible. A higher discount rate decreases the net present value of cash flows.
•Future capital requirements. These are based on authorized spending and internal forecasts.
Assumptions about the macroeconomic environment are inherently subjective and difficult to forecast. We base our fair value estimates on projected financial information which we believe to be reasonable. However, actual results may differ from these projections.
The need to test for impairment can be based on several indicators, including a significant reduction in prices of or demand for commodities, a poor outlook for profitability, a significant reduction in pipeline throughput volumes, a significant reduction in natural gas or NGL volumes processed, other changes to contracts or changes in the regulatory environment in which the asset or equity method investment is located.
Long-lived Asset Impairment Assessments
Long-lived assets used in operations are assessed for impairment whenever changes in facts and circumstances indicate that the carrying value of the assets may not be recoverable based on the expected undiscounted future cash flow of an asset group. For purposes of impairment evaluation, long-lived assets must be grouped at the lowest level for which independent cash flows can be identified, which is at least at the segment level and in some cases for similar assets in the same geographic region where cash flows can be separately identified. If the sum of the undiscounted cash flows is less than the carrying value of an asset group, fair value is calculated, and the carrying value is written down if greater than the calculated fair value.
Goodwill Impairment Assessments
Unlike long-lived assets, goodwill must be tested for impairment at least annually, and between annual tests if an event occurs or circumstances change that would more likely than not reduce the fair value of a reporting unit below its carrying amount. Goodwill is tested for impairment at the reporting unit level. We have five reporting units, three of which have goodwill allocated to them. A goodwill impairment loss is measured as the amount by which a reporting unit’s carrying value exceeds its fair value, without exceeding the recorded amount of goodwill.
At December 31, 2024, MPLX had three reporting units with goodwill totaling approximately $7.6 billion, which includes goodwill associated with our Crude Gathering reporting unit of $1.1 billion. For the annual impairment assessment as of November 30, 2024, management performed only a qualitative assessment for two reporting units as we determined it was more likely than not that the fair values of the reporting units exceeded their carrying values. The fair value of the Crude Gathering reporting unit for which a quantitative assessment was performed was determined based on applying both a discounted cash flow, or income approach, as well as a market approach which resulted in the fair value of the reporting unit exceeding its carrying value by greater than 10 percent. The significant assumptions that were used to develop the estimate of the fair value included management’s best estimates of the discount rate as well as estimates of future cash flows, which are impacted primarily by producers’ development plans, which impact the reporting unit’s future volumes and capital requirements. A 100-basis point
increase to the discount rate used to estimate the fair value of the reporting unit would not have resulted in a goodwill impairment charge as of November 30, 2024.
Fair value determinations require considerable judgment and are sensitive to changes in underlying assumptions and factors. As a result, there can be no assurance that the estimates and assumptions made for purposes of the impairment tests will prove to be an accurate prediction of the future. See Item 8. Financial Statements and Supplementary Data - Note 14 for additional information relating to our reporting units and goodwill.
Equity Method Investment Impairment Assessments
Equity method investments are assessed for impairment whenever factors indicate an other-than-temporary loss in value. Factors providing evidence of such a loss include the fair value of an investment that is less than its carrying value, absence of an ability to recover the carrying value or the investee’s inability to generate income sufficient to justify our carrying value. At December 31, 2024, we had $4.5 billion of equity method investments recorded on the Consolidated Balance Sheets.
An estimate of the sensitivity to net income resulting from impairment calculations is not practicable, given the numerous assumptions (e.g., pricing, volumes and discount rates) that can materially affect our estimates. That is, unfavorable adjustments to some of the above listed adjustments may be offset by favorable adjustments in other assumptions.
See Item 8. Financial Statements and Supplementary Data - Note 5 for additional information on our equity method investments and Note 14 for additional information on our goodwill and intangibles.
Leases
In accounting for leases, we analyze new or modified leases for lease classification. One of the key inputs into the lease classification analysis is the fair value of the leased assets. For newly classified sales-type leases, the net investment in the lease is recorded at the estimated fair value of the underlying leased assets. Significant assumptions used to estimate the leased assets’ fair value include market information for comparable assets and cost estimates to replace the service capacity of an asset.
Variable Interest Entities
We evaluate all legal entities in which we hold an ownership or other pecuniary interest to determine if the entity is a VIE. Our interests in a VIE are referred to as variable interests. Variable interests can be contractual, ownership or other pecuniary interests in an entity that change with changes in the fair value of the VIE’s assets. When we conclude that we hold an interest in a VIE, we must determine if we are the entity’s primary beneficiary. A primary beneficiary is deemed to have a controlling financial interest in a VIE. This controlling financial interest is evidenced by both (i) the power to direct the activities of the VIE that most significantly impact the VIE’s economic performance and (ii) the obligation to absorb losses that could potentially be significant to the VIE or the right to receive benefits that could potentially be significant to the VIE. We consolidate any VIE when we determine that we are the primary beneficiary. We must disclose the nature of any interests in a VIE that is not consolidated.
Significant judgment is exercised in determining that a legal entity is a VIE and in evaluating our interest in a VIE. We use primarily a qualitative analysis to determine if an entity is a VIE. We evaluate the entity’s need for continuing financial support; the equity holder’s lack of a controlling financial interest; and/or if an equity holder’s voting interests are disproportionate to its obligation to absorb expected losses or receive residual returns. We evaluate our interests in a VIE to determine whether we are the primary beneficiary. We use a primarily qualitative analysis to determine if we are deemed to have a controlling financial interest in the VIE, either on a standalone basis or as part of a related party group. We continually monitor our interests in legal entities for changes in the design or activities of an entity and changes in our interests, including our status as the primary beneficiary to determine if the changes require us to revise our previous conclusions.
Changes in the design or nature of the activities of a VIE, or our involvement with a VIE, may require us to reconsider our conclusions on the entity’s status as a VIE and/or our status as the primary beneficiary. Such reconsideration requires significant judgment and understanding of the organization. This could result in the deconsolidation or consolidation of the affected subsidiary, which would have a significant impact on our financial statements.
VIEs are discussed in Item 8. Financial Statements and Supplementary Data - Note 5.
Contingent Liabilities
We accrue contingent liabilities for legal actions, claims, litigation, environmental remediation, tax deficiencies related to operating taxes and third-party indemnities for specified tax matters when such contingencies are both probable and estimable. We regularly assess these estimates in consultation with legal counsel to consider resolved and new matters, material developments in court proceedings or settlement discussions, new information obtained as a result of ongoing discovery and past experience in defending and settling similar matters. Actual costs can differ from estimates for many reasons. For instance, settlement costs for claims and litigation can vary from estimates based on differing interpretations of laws, opinions on degree of responsibility and assessments of the amount of damages. Similarly, liabilities for environmental remediation may vary from estimates because of changes in laws, regulations and their interpretation, additional information on the extent and nature of site contamination and improvements in technology.
We generally record losses related to these types of contingencies as cost of revenues or selling, general and administrative expenses on the Consolidated Statements of Income, except for tax deficiencies unrelated to income taxes, which are recorded as other taxes.
An estimate of the sensitivity to net income if other assumptions had been used in recording these liabilities is not practical because of the number of contingencies that must be assessed, the number of underlying assumptions and the wide range of reasonably possible outcomes, in terms of both the probability of loss and the estimates of such loss.
For additional information on contingent liabilities, see Item 7. Management’s Discussion and Analysis of Financial Condition and Results of Operations - Environmental Matters and Compliance Costs and Item 8. Financial Statements and Supplementary Data - Note 22.
Item 7A. Quantitative and Qualitative Disclosures about Market Risk
We are exposed to market risks related to the volatility of commodity prices. We employ various strategies, including the potential use of commodity derivative instruments, to economically hedge the risks related to these price fluctuations. We are also exposed to market risks related to changes in interest rates. As of December 31, 2024, we did not have any open financial or commodity derivative instruments to hedge the economic risks related to interest rate fluctuations or the volatility of commodity prices, respectively; however, we continually monitor the market and our exposure and may enter into these arrangements in the future.
Commodity Price Risk
We may at times use a variety of commodity derivative instruments, including futures and options, as part of an overall program to economically hedge commodity price risk. A portion of our profitability is directly affected by prevailing commodity prices primarily as a result of purchasing and selling NGLs and natural gas at index-related prices. To the extent that commodity prices influence the level of drilling by our producer customers, such prices also indirectly affect profitability. We may enter into derivative contracts, which are primarily swaps traded on the Over-the-Counter market as well as fixed price forward contracts. Our risk management policy does not allow us to enter into speculative positions with our derivative contracts. Execution of our hedge strategy and the continuous monitoring of commodity markets and our open derivative positions are carried out by our hedge committee, comprised of members of senior management.
To mitigate our cash flow exposure to fluctuations in the price of NGLs, we may use NGL derivative swap contracts. A small portion of our NGL price exposure may be managed by using crude oil contracts. To mitigate our cash flow exposure to fluctuations in the price of natural gas, we may use natural gas derivative swap contracts, taking into account the partial offset of our long and short natural gas positions resulting from normal operating activities.
We would be exposed to additional commodity risk in certain situations such as if producers under-deliver or over-deliver products or if processing facilities are operated in different recovery modes. In the event that we have derivative positions in excess of the product delivered or expected to be delivered, the excess derivative positions may be terminated.
Management conducts a standard credit review on counterparties to derivative contracts, and we have provided the counterparties with a guaranty as credit support for our obligations. We use standardized agreements that allow for offset of certain positive and negative exposures in the event of default or other terminating events, including bankruptcy.
Outstanding Derivative Contracts
We have a natural gas purchase commitment embedded in a keep-whole processing agreement with a producer customer in the Southern Appalachia region expiring in December 2027. The customer has the unilateral option to extend the agreement for one five-year term through December 2032. For accounting purposes, the natural gas purchase commitment and the term extending option has been aggregated into a single compound embedded derivative. The probability of the customer exercising its option is determined based on assumptions about the customer’s potential business strategy decision points that may exist at the time they would elect whether to renew the contract. The changes in fair value of this compound embedded derivative are based on the difference between the contractual and index pricing, and the probability of the producer customer exercising its option to extend. The changes in fair value are recorded in earnings through Purchased product costs on the Consolidated Statements of Income. At December 31, 2024 and 2023, the estimated fair value of this contract was a liability of $58 million and $61 million, respectively.
Open Derivative Positions and Sensitivity Analysis
The estimated fair value of our Level 2 and 3 financial instruments are sensitive to the assumptions used in our pricing models. Sensitivity analysis of a ten percent difference in our estimated fair value of Level 2 and 3 commodity derivatives (excluding embedded derivatives) as of December 31, 2024 would not have incremental effects on income before income taxes, given we had no open commodity derivative contracts as of December 31, 2024. We evaluate our portfolio of commodity derivative instruments on an ongoing basis and add or revise strategies in anticipation of changes in market conditions and in risk profiles.
Interest Rate Risk
Sensitivity analysis of the effect of a hypothetical 100-basis-point change in interest rates on third-party outstanding debt, excluding finance leases, is provided in the following table. Fair value of cash and cash equivalents, receivables, accounts payable and accrued interest approximate carrying value and are relatively insensitive to changes in interest rates due to the short-term maturity of the instruments. Accordingly, these instruments are excluded from the table.
| | | | | | | | | | | | | | | | | | | | |
| (In millions) | | Fair Value as of December 31, 2024(1) | | Change in Fair Value(2) | | Change in Income before income taxes for the Year Ended December 31, 2024 (3) |
| Outstanding debt | | | | |
| Fixed-rate | | $ | 19,574 | | | $ | 1,489 | | | N/A |
Variable-rate(4) | | $ | — | | | $ | — | | | $ | — | |
(1)Fair value was based on market prices, where available, or current borrowing rates for financings with similar terms and maturities.
(2)Assumes a 100-basis-point decrease in the weighted average yield-to-maturity at December 31, 2024.
(3)Assumes a 100-basis-point change in interest rates. The change to income before income taxes was based on the weighted average balance of all outstanding variable-rate debt for the year ended December 31, 2024.
(4)MPLX had no outstanding borrowings on the MPLX Credit Agreement as of December 31, 2024.
Our use of fixed or variable-rate debt directly exposes us to interest rate risk. Fixed rate debt, such as our senior notes, exposes us to changes in the fair value of our debt due to changes in market interest rates. Fixed rate debt also exposes us to the risk that we may need to refinance maturing debt with new debt at higher rates or that our current fixed rate debt may be higher than the current market. Variable-rate debt, such as borrowings under our revolving credit facilities, exposes us to short-term changes in market rates that impact our interest expense.
Credit Risk
We are subject to risk of loss resulting from non-payment by our customers to whom we provide services, lease assets, or sell natural gas or NGLs. We believe that certain contracts where we sell NGLs and act as our producer customers’ agent would allow us to pass those losses through to our customers, thus reducing our risk. Our credit exposure related to these customers is represented by the value of our trade receivables or lease receivables. Where exposed to credit risk, we analyze the customer’s financial condition prior to entering into a transaction or agreement, establish credit terms and monitor the appropriateness of these terms on an ongoing basis. In the event of a customer default, we may sustain a loss and our cash receipts could be negatively impacted.
Item 8. Financial Statements and Supplementary Data
INDEX
| | | | | | | | |
| | Page |
| |
| |
| (PCAOB ID 238) | |
| Audited Consolidated Financial Statements: | |
| |
| |
| |
| |
| |
| |
| |
| |
| |
| |
| |
| |
| |
| |
| |
| |
| |
| |
| |
| |
| |
| |
| |
| |
| |
| |
| |
| |
Management’s Responsibilities for Financial Statements
The accompanying consolidated financial statements of MPLX LP and its subsidiaries (the “Partnership”) are the responsibility of management of the Partnership’s general partner, MPLX GP LLC, and have been prepared in conformity with accounting principles generally accepted in the United States of America. They necessarily include some amounts that are based on best judgments and estimates. The financial information displayed in other sections of this Annual Report on Form 10-K is consistent with these consolidated financial statements.
MPLX GP LLC seeks to assure the objectivity and integrity of the Partnership’s financial records by careful selection of its managers, by organizational arrangements that provide an appropriate division of responsibility and by communications programs aimed at assuring that its policies and methods are understood throughout the organization.
The MPLX GP LLC Board of Directors pursues its oversight role in the area of financial reporting and internal control over financial reporting through its Audit Committee. This committee, composed solely of independent directors, regularly meets (jointly and separately) with the independent registered public accounting firm, management and internal auditors to monitor the proper discharge by each of their responsibilities relative to internal accounting controls and the consolidated financial statements.
| | | | | | | | | | | | | | |
| /s/ Maryann T. Mannen | | /s/ C. Kristopher Hagedorn | | /s/ Kelly D. Wright |
Maryann T. Mannen
President and Chief Executive Officer of MPLX GP LLC
(the general partner of MPLX LP) | | C. Kristopher Hagedorn
Executive Vice President and Chief Financial Officer of MPLX GP LLC
(the general partner of MPLX LP) | | Kelly D. Wright
Vice President and Controller of MPLX GP LLC
(the general partner of MPLX LP) |
Management’s Report on Internal Control over Financial Reporting
MPLX LP’s management is responsible for establishing and maintaining adequate internal control over financial reporting (as defined in Rule 13a-15(f) under the Securities Exchange Act of 1934, as amended). An evaluation of the design and effectiveness of our internal control over financial reporting, based on the framework in Internal Control—Integrated Framework (2013) issued by the Committee of Sponsoring Organizations of the Treadway Commission, was conducted under the supervision and with the participation of management, including the chief executive officer and chief financial officer of our general partner. Based on the results of this evaluation, MPLX LP’s management concluded that its internal control over financial reporting was effective as of December 31, 2024.
The effectiveness of MPLX LP’s internal control over financial reporting as of December 31, 2024 has been audited by PricewaterhouseCoopers LLP, an independent registered public accounting firm, as stated in their report which is included herein.
| | | | | | | | | | | | | | |
| /s/ Maryann T. Mannen | | /s/ C. Kristopher Hagedorn | | |
Maryann T. Mannen
President and Chief Executive Officer of MPLX GP LLC
(the general partner of MPLX LP) | | C. Kristopher Hagedorn
Executive Vice President and Chief Financial Officer of MPLX GP LLC
(the general partner of MPLX LP) | | |
Report of Independent Registered Public Accounting Firm
To the Partners of MPLX LP and the Board of Directors of MPLX GP LLC
Opinions on the Financial Statements and Internal Control over Financial Reporting
We have audited the accompanying consolidated balance sheets of MPLX LP and its subsidiaries (the “Partnership”) as of December 31, 2024 and 2023, and the related consolidated statements of income, of comprehensive income, of equity and Series A preferred units and of cash flows for each of the three years in the period ended December 31, 2024, including the related notes (collectively referred to as the “consolidated financial statements”). We also have audited the Partnership's internal control over financial reporting as of December 31, 2024, based on criteria established in Internal Control - Integrated Framework (2013) issued by the Committee of Sponsoring Organizations of the Treadway Commission (COSO).
In our opinion, the consolidated financial statements referred to above present fairly, in all material respects, the financial position of the Partnership as of December 31, 2024 and 2023, and the results of its operations and its cash flows for each of the three years in the period ended December 31, 2024 in conformity with accounting principles generally accepted in the United States of America. Also in our opinion, the Partnership maintained, in all material respects, effective internal control over financial reporting as of December 31, 2024, based on criteria established in Internal Control - Integrated Framework (2013) issued by the COSO.
Basis for Opinions
The Partnership's management is responsible for these consolidated financial statements, for maintaining effective internal control over financial reporting, and for its assessment of the effectiveness of internal control over financial reporting, included in the accompanying Management’s Report on Internal Control over Financial Reporting. Our responsibility is to express opinions on the Partnership’s consolidated financial statements and on the Partnership's internal control over financial reporting based on our audits. We are a public accounting firm registered with the Public Company Accounting Oversight Board (United States) (PCAOB) and are required to be independent with respect to the Partnership in accordance with the U.S. federal securities laws and the applicable rules and regulations of the Securities and Exchange Commission and the PCAOB.
We conducted our audits in accordance with the standards of the PCAOB. Those standards require that we plan and perform the audits to obtain reasonable assurance about whether the consolidated financial statements are free of material misstatement, whether due to error or fraud, and whether effective internal control over financial reporting was maintained in all material respects.
Our audits of the consolidated financial statements included performing procedures to assess the risks of material misstatement of the consolidated financial statements, whether due to error or fraud, and performing procedures that respond to those risks. Such procedures included examining, on a test basis, evidence regarding the amounts and disclosures in the consolidated financial statements. Our audits also included evaluating the accounting principles used and significant estimates made by management, as well as evaluating the overall presentation of the consolidated financial statements. Our audit of internal control over financial reporting included obtaining an understanding of internal control over financial reporting, assessing the risk that a material weakness exists, and testing and evaluating the design and operating effectiveness of internal control based on the assessed risk. Our audits also included performing such other procedures as we considered necessary in the circumstances. We believe that our audits provide a reasonable basis for our opinions.
Definition and Limitations of Internal Control over Financial Reporting
A company’s internal control over financial reporting is a process designed to provide reasonable assurance regarding the reliability of financial reporting and the preparation of financial statements for external purposes in accordance with generally accepted accounting principles. A company’s internal control over financial reporting includes those policies and procedures that (i) pertain to the maintenance of records that, in reasonable detail, accurately and fairly reflect the transactions and dispositions of the assets of the company; (ii) provide reasonable assurance that transactions are recorded as necessary to permit preparation of financial statements in accordance with generally accepted accounting principles, and that receipts and expenditures of the company are being made only in accordance with authorizations of management and directors of the company; and (iii) provide reasonable assurance regarding prevention or timely detection of unauthorized acquisition, use, or disposition of the company’s assets that could have a material effect on the financial statements.
Because of its inherent limitations, internal control over financial reporting may not prevent or detect misstatements. Also, projections of any evaluation of effectiveness to future periods are subject to the risk that controls may become inadequate because of changes in conditions, or that the degree of compliance with the policies or procedures may deteriorate.
Critical Audit Matters
The critical audit matter communicated below is a matter arising from the current period audit of the consolidated financial statements that was communicated or required to be communicated to the audit committee and that (i) relates to accounts or disclosures that are material to the consolidated financial statements and (ii) involved our especially challenging, subjective, or
complex judgments. The communication of critical audit matters does not alter in any way our opinion on the consolidated financial statements, taken as a whole, and we are not, by communicating the critical audit matter below, providing a separate opinion on the critical audit matter or on the accounts or disclosures to which it relates.
Goodwill Impairment Test - Crude Gathering Reporting Unit
As described in Note 14 to the consolidated financial statements, the Partnership’s consolidated goodwill balance was $7,645 million as of December 31, 2024. Additionally, as disclosed by management, the goodwill balance at December 31, 2024 includes goodwill associated with the Crude Gathering reporting unit of $1.1 billion. Management annually evaluates goodwill for impairment as of November 30, as well as whenever events or changes in circumstances indicate it is more likely than not that the fair value of a reporting unit with goodwill is less than its carrying amount. The fair value of each reporting unit is determined based on applying both a discounted cash flow method, or income approach, as well as a market approach. The significant assumptions that were used to develop the estimates of the fair values under the discounted cash flow method included management’s best estimates of the discount rate, as well as estimates of future cash flows, which are impacted primarily by producer development plans, which impact the reporting unit’s future volumes and capital requirements.
The principal considerations for our determination that performing procedures relating to the goodwill impairment test of the Crude Gathering reporting unit is a critical audit matter are the significant judgment by management when determining the fair value of the reporting unit, which led to a high degree of auditor judgment, subjectivity, and effort in performing procedures and evaluating audit evidence relating to management’s significant assumption related to future volumes.
Addressing the matter involved performing procedures and evaluating audit evidence in connection with forming our overall opinion on the consolidated financial statements. These procedures included testing the effectiveness of controls relating to management’s goodwill impairment test, including controls over the determination of the fair value of the Crude Gathering reporting unit. These procedures also included, among others, testing management’s process for determining the fair value of the reporting unit; evaluating the appropriateness of the income and market approaches used; testing the completeness and accuracy of underlying data used by management in the approaches; and evaluating the reasonableness of the significant assumption related to future volumes. Evaluating the assumption related to future volumes involved (i) considering whether the assumption used was reasonable considering past performance of the reporting unit, producers’ historical and future production volumes, and industry outlook reports, and (ii) considering whether the assumption was consistent with evidence obtained in other areas of the audit.
/s/ PricewaterhouseCoopers LLP
Toledo, Ohio
February 27, 2025
We have served as the Partnership’s auditor since 2012.
MPLX LP
Consolidated Statements of Income
| | | | | | | | | | | | | | | | | | | | |
| (In millions, except per unit data) | | 2024 | | 2023 | | 2022 |
| Revenues and other income: | | | | | | |
| Service revenue | | $ | 2,770 | | | $ | 2,539 | | | $ | 2,359 | |
| Service revenue - related parties | | 4,180 | | | 3,985 | | | 3,754 | |
| Service revenue - product related | | 357 | | | 294 | | | 394 | |
| Rental income | | 251 | | | 243 | | | 327 | |
| Rental income - related parties | | 853 | | | 822 | | | 763 | |
| Product sales | | 1,657 | | | 1,665 | | | 2,219 | |
| Product sales - related parties | | 225 | | | 250 | | | 198 | |
| Sales-type lease revenue | | 136 | | | 136 | | | 62 | |
| Sales-type lease revenue - related parties | | 475 | | | 500 | | | 465 | |
| | | | | | |
| Income from equity method investments | | 802 | | | 600 | | | 476 | |
| Other income | | 70 | | | 126 | | | 485 | |
| Other income - related parties | | 157 | | | 121 | | | 111 | |
| Total revenues and other income | | 11,933 | | | 11,281 | | | 11,613 | |
| Costs and expenses: | | | | | | |
| Cost of revenues (excludes items below) | | 1,560 | | | 1,401 | | | 1,369 | |
| Purchased product costs | | 1,561 | | | 1,598 | | | 2,063 | |
| Rental cost of sales | | 82 | | | 82 | | | 123 | |
| Rental cost of sales - related parties | | 18 | | | 33 | | | 54 | |
| Purchases - related parties | | 1,583 | | | 1,544 | | | 1,413 | |
| Depreciation and amortization | | 1,283 | | | 1,213 | | | 1,230 | |
| | | | | | |
| General and administrative expenses | | 427 | | | 379 | | | 335 | |
| | | | | | |
| Other taxes | | 131 | | | 131 | | | 115 | |
| Total costs and expenses | | 6,645 | | | 6,381 | | | 6,702 | |
| Income from operations | | 5,288 | | | 4,900 | | | 4,911 | |
| Net interest and other financial costs | | 921 | | | 923 | | | 925 | |
| Income before income taxes | | 4,367 | | | 3,977 | | | 3,986 | |
| Provision for income taxes | | 10 | | | 11 | | | 8 | |
| Net income | | 4,357 | | | 3,966 | | | 3,978 | |
| Less: Net income attributable to noncontrolling interests | | 40 | | | 38 | | | 34 | |
| Net income attributable to MPLX LP | | 4,317 | | | 3,928 | | | 3,944 | |
| | | | | | |
| | | | | | |
| Less: Series A preferred unitholders’ interest in net income | | 27 | | | 94 | | | 88 | |
| Less: Series B preferred unitholders’ interest in net income | | — | | | 5 | | | 41 | |
| | | | | | |
| Limited partners’ interest in net income attributable to MPLX LP | | $ | 4,290 | | | $ | 3,829 | | | $ | 3,815 | |
| | | | | | |
| Per Unit Data (See Note 8) | | | | | | |
| Net income attributable to MPLX LP per limited partner unit: | | | | | | |
| Common - basic | | $ | 4.21 | | | $ | 3.80 | | | $ | 3.75 | |
| Common - diluted | | $ | 4.21 | | | $ | 3.80 | | | $ | 3.75 | |
| | | | | | |
| Weighted average limited partner units outstanding: | | | | | | |
| Common - basic | | 1,016 | | | 1,001 | | | 1,010 | |
| Common - diluted | | 1,017 | | | 1,002 | | | 1,010 | |
| | | | | | |
| | | | | | |
The accompanying notes are an integral part of these consolidated financial statements.
MPLX LP
Consolidated Statements of Comprehensive Income
| | | | | | | | | | | | | | | | | |
| (In millions) | 2024 | | 2023 | | 2022 |
| Net income | $ | 4,357 | | | $ | 3,966 | | | $ | 3,978 | |
| Other comprehensive income, net of tax: | | | | | |
| Remeasurements of pension and other postretirement benefits related to equity method investments, net of tax | 1 | | | 4 | | | 9 | |
| Comprehensive income | 4,358 | | | 3,970 | | | 3,987 | |
| Less comprehensive income attributable to: | | | | | |
| Noncontrolling interests | 40 | | | 38 | | | 34 | |
| Comprehensive income attributable to MPLX LP | $ | 4,318 | | | $ | 3,932 | | | $ | 3,953 | |
The accompanying notes are an integral part of these consolidated financial statements.
MPLX LP
Consolidated Balance Sheets
| | | | | | | | | | | | | | |
| | | December 31, |
| (In millions) | | 2024 | | 2023 |
| Assets | | | | |
| Cash and cash equivalents | | $ | 1,519 | | | $ | 1,048 | |
| Receivables, net | | 718 | | | 823 | |
| Current assets - related parties | | 830 | | | 748 | |
| Inventories | | 180 | | | 159 | |
| Other current assets | | 29 | | | 30 | |
| Total current assets | | 3,276 | | | 2,808 | |
| Equity method investments | | 4,531 | | | 3,743 | |
| Property, plant and equipment, net | | 19,154 | | | 19,264 | |
| Intangibles, net | | 518 | | | 654 | |
| Goodwill | | 7,645 | | | 7,645 | |
| Right of use assets, net | | 273 | | | 264 | |
| Noncurrent assets - related parties | | 1,120 | | | 1,161 | |
| Other noncurrent assets | | 994 | | | 990 | |
| Total assets | | 37,511 | | | 36,529 | |
| | | | |
| Liabilities | | | | |
| Accounts payable | | 147 | | | 153 | |
| Accrued liabilities | | 295 | | | 300 | |
| Current liabilities - related parties | | 396 | | | 360 | |
| | | | |
| Accrued property, plant and equipment | | 208 | | | 216 | |
| | | | |
| Long-term debt due within one year | | 1,693 | | | 1,135 | |
| Accrued interest payable | | 244 | | | 242 | |
| Operating lease liabilities | | 45 | | | 45 | |
| Other current liabilities | | 207 | | | 173 | |
| Total current liabilities | | 3,235 | | | 2,624 | |
| Long-term deferred revenue | | 317 | | | 347 | |
| Long-term liabilities - related parties | | 334 | | | 325 | |
| Long-term debt | | 19,255 | | | 19,296 | |
| | | | |
| Deferred income taxes | | 18 | | | 16 | |
| Long-term operating lease liabilities | | 217 | | | 211 | |
| Other long-term liabilities | | 125 | | | 126 | |
| Total liabilities | | 23,501 | | | 22,945 | |
| Commitments and contingencies (see Note 22) | | | | |
| Series A preferred units - (6 million and 27 million units outstanding) | | 203 | | | 895 | |
| | | | |
| Equity | | | | |
| Common unitholders - public (370 million and 356 million units outstanding) | | 9,322 | | | 8,700 | |
| Common unitholders - MPC (647 million and 647 million units outstanding) | | 4,257 | | | 3,758 | |
| Accumulated other comprehensive loss | | (3) | | | (4) | |
| Total MPLX LP partners’ capital | | 13,576 | | | 12,454 | |
| Noncontrolling interests | | 231 | | | 235 | |
| Total equity | | 13,807 | | | 12,689 | |
| Total liabilities, preferred units and equity | | $ | 37,511 | | | $ | 36,529 | |
The accompanying notes are an integral part of these consolidated financial statements.
MPLX LP
Consolidated Statements of Cash Flows
| | | | | | | | | | | | | | | | | | | | |
| (In millions) | | 2024 | | 2023 | | 2022 |
| Operating activities: | | | | | | |
| Net income | | $ | 4,357 | | | $ | 3,966 | | | $ | 3,978 | |
| Adjustments to reconcile net income to net cash provided by operating activities: | | | | | | |
| Amortization of deferred financing costs | | 54 | | | 55 | | | 73 | |
| Depreciation and amortization | | 1,283 | | | 1,213 | | | 1,230 | |
| | | | | | |
| Deferred income taxes | | 2 | | | 3 | | | 3 | |
| Gain on sales-type leases and equity method investments | | (20) | | | (92) | | | (509) | |
| Loss/(gain) on disposal of assets | | 3 | | | (14) | | | 34 | |
| Income from equity method investments | | (802) | | | (600) | | | (476) | |
| Distributions from unconsolidated affiliates | | 826 | | | 736 | | | 578 | |
| Change in fair value of derivatives | | (3) | | | — | | | (47) | |
| Changes in: | | | | | | |
| Receivables | | 180 | | | 14 | | | 14 | |
| Inventories | | (20) | | | (19) | | | (5) | |
| Current accounts payable and other current assets and liabilities | | 5 | | | (17) | | | (26) | |
| Assets and liabilities - related parties | | 84 | | | 84 | | | 40 | |
| Right of use assets and operating lease liabilities | | (3) | | | — | | | (3) | |
| Deferred revenue | | (5) | | | 107 | | | 108 | |
| All other, net | | 5 | | | (39) | | | 27 | |
| Net cash provided by operating activities | | 5,946 | | | 5,397 | | | 5,019 | |
| Investing activities: | | | | | | |
| Additions to property, plant and equipment | | (1,056) | | | (937) | | | (806) | |
| Acquisitions, net of cash acquired | | (622) | | | (246) | | | (28) | |
| Disposal of assets | | 1 | | | 26 | | | 84 | |
| Investments - acquisitions and contributions | | (464) | | | (98) | | | (217) | |
| Investments - redemptions, repayments, return of capital and sales proceeds | | 146 | | | 3 | | | 11 | |
| | | | | | |
| Net cash used in investing activities | | (1,995) | | | (1,252) | | | (956) | |
| Financing activities: | | | | | | |
| Long-term debt borrowings | | 1,630 | | | 1,589 | | | 3,379 | |
| Long-term debt repayments | | (1,151) | | | (1,001) | | | (2,202) | |
| Related party debt borrowings | | — | | | — | | | 2,989 | |
| Related party debt repayments | | — | | | — | | | (4,439) | |
| Debt issuance costs | | (15) | | | (15) | | | (29) | |
| Unit repurchases | | (326) | | | — | | | (491) | |
| Redemption of Series B preferred units | | — | | | (600) | | | — | |
| Distributions to noncontrolling interests | | (44) | | | (41) | | | (38) | |
| Distributions to Series A preferred unitholders | | (44) | | | (94) | | | (85) | |
| Distributions to Series B preferred unitholders | | — | | | (21) | | | (41) | |
| Distributions to LP unitholders | | (3,559) | | | (3,181) | | | (2,921) | |
| Contributions from MPC | | 35 | | | 31 | | | 44 | |
| All other, net | | (6) | | | (2) | | | (4) | |
| Net cash used in financing activities | | (3,480) | | | (3,335) | | | (3,838) | |
| Net change in cash, cash equivalents and restricted cash | | 471 | | | 810 | | | 225 | |
| Cash, cash equivalents and restricted cash at beginning of period | | 1,048 | | | 238 | | | 13 | |
| Cash, cash equivalents and restricted cash at end of period | | $ | 1,519 | | | $ | 1,048 | | | $ | 238 | |
The accompanying notes are an integral part of these consolidated financial statements.
MPLX LP
Consolidated Statements of Equity and Series A Preferred Units
| | | | | | | | | | | | | | | | | | | | | | | | | | | | | |
| | Partnership | | | | | | |
| (In millions) | Common
Unit-holders
Public | Common
Unit-holder
MPC | Series B Preferred Unit-holders | Accumulated Other Comprehensive Loss | Non-controlling
Interests | Total | | | Series A Preferred Unit-holders |
| Balance at December 31, 2021 | $ | 8,579 | | $ | 2,638 | | $ | 611 | | $ | (17) | | $ | 241 | | $ | 12,052 | | | | $ | 965 | |
| Net income | 1,371 | | 2,444 | | 41 | | — | | 34 | | 3,890 | | | | 88 | |
| Unit repurchases | (491) | | — | | — | | — | | — | | (491) | | | | — | |
| | | | | | | | | |
| Distributions | (1,050) | | (1,871) | | (41) | | — | | (38) | | (3,000) | | | | (85) | |
| Contributions | — | | 82 | | — | | — | | — | | 82 | | | | — | |
| Other | 4 | | — | | — | | 9 | | — | | 13 | | | | — | |
| Balance at December 31, 2022 | 8,413 | | 3,293 | | 611 | | (8) | | 237 | | 12,546 | | | | 968 | |
| Net income | 1,336 | | 2,493 | | 5 | | — | | 38 | | 3,872 | | | | 94 | |
| | | | | | | | | |
| Conversion of Series A preferred units | 73 | | — | | — | | — | | — | | 73 | | | | (73) | |
| Redemption of Series B preferred units | (2) | | (3) | | (595) | | — | | — | | (600) | | | | — | |
| Distributions | (1,125) | | (2,056) | | (21) | | — | | (41) | | (3,243) | | | | (94) | |
| Contributions | — | | 31 | | — | | — | | — | | 31 | | | | — | |
| Other | 5 | | — | | — | | 4 | | 1 | | 10 | | | | — | |
| Balance at December 31, 2023 | 8,700 | | 3,758 | | — | | (4) | | 235 | | 12,689 | | | | 895 | |
| Net income | 1,555 | | 2,735 | | — | | — | | 40 | | 4,330 | | | | 27 | |
| Unit repurchases | (326) | | — | | — | | — | | — | | (326) | | | | — | |
| Conversion of Series A preferred units | 675 | | — | | — | | — | | — | | 675 | | | | (675) | |
| Distributions | (1,289) | | (2,270) | | — | | — | | (44) | | (3,603) | | | | (44) | |
| Contributions | — | | 34 | | — | | — | | — | | 34 | | | | — | |
| Other | 7 | | — | | — | | 1 | | — | | 8 | | | | — | |
| Balance at December 31, 2024 | $ | 9,322 | | $ | 4,257 | | $ | — | | $ | (3) | | $ | 231 | | $ | 13,807 | | | | $ | 203 | |
The accompanying notes are an integral part of these consolidated financial statements.
Notes to Consolidated Financial Statements
1. Description of the Business and Basis of Presentation
Description of the Business
MPLX LP is a diversified, large-cap master limited partnership formed by Marathon Petroleum Corporation that owns and operates midstream energy infrastructure and logistics assets, and provides fuels distribution services. References in this report to “MPLX LP,” “MPLX,” “the Partnership,” “we,” “ours,” “us,” or like terms refer to MPLX LP and its subsidiaries. References to our sponsor and customer, “MPC,” refer collectively to Marathon Petroleum Corporation and its subsidiaries, other than the Partnership. We are engaged in the gathering, transportation, storage and distribution of crude oil, refined products, other hydrocarbon-based products and renewables; the gathering, processing and transportation of natural gas; and the transportation, fractionation, storage and marketing of NGLs. MPLX’s principal executive office is located in Findlay, Ohio. MPLX was formed on March 27, 2012 as a Delaware limited partnership and completed its initial public offering on October 31, 2012.
MPLX’s business consists of two segments. In the fourth quarter of 2024, we renamed and modified the composition of our segments to better reflect the product-based value chains and growth strategy of MPLX’s operations. The primary changes were to rename the Logistics and Storage segment to the Crude Oil and Products Logistics segment and to rename the Gathering and Processing segment to the Natural Gas and NGL Services segment. In addition, we reclassified certain equity method investments serving natural gas and NGL customers from Crude Oil and Products Logistics to Natural Gas and NGL Services. The segment realignment is presented for the year ended December 31, 2024, with prior periods recast for comparability.
The Crude Oil and Products Logistics segment includes the gathering, transportation, storage and distribution of crude oil, refined products, other hydrocarbon-based products and renewables. The Natural Gas and NGL Services segment gathers, processes and transports natural gas; and transports, fractionates, stores and markets NGLs. See Note 10 for additional information regarding the operations and results of these segments.
Basis of Presentation
The accompanying consolidated financial statements of MPLX have been prepared in accordance with GAAP. The consolidated financial statements include all majority-owned and controlled subsidiaries. For non-wholly-owned consolidated subsidiaries, the interests owned by third parties have been recorded as Noncontrolling interests on the accompanying Consolidated Balance Sheets. Intercompany accounts and transactions have been eliminated. MPLX’s investments in which MPLX exercises significant influence but does not control and does not have a controlling financial interest are accounted for using the equity method. MPLX’s investments in VIEs, in which MPLX exercises significant influence but does not control and is not the primary beneficiary, are also accounted for using the equity method.
Certain prior period financial statement amounts have been reclassified to conform to current period presentation.
2. Summary of Principal Accounting Policies
Use of Estimates
The preparation of financial statements in accordance with GAAP requires management to make estimates and assumptions that affect the reported amounts of assets and liabilities and the disclosure of contingent assets and liabilities as of the date of the consolidated financial statements and the reported amounts of revenues and expenses during the respective reporting periods. Actual results could differ materially from those estimates. Estimates are subject to uncertainties due to the levels of subjectivity and judgment necessary to account for highly uncertain matters or the susceptibility of such matters to change and affect items such as valuing identified intangible assets; determining the fair value of derivative instruments; evaluating impairments of long-lived assets, goodwill and equity investments; establishing estimated useful lives for long-lived assets; acquisition accounting; estimating revenues, expense accruals and capital expenditures; valuing AROs; recognizing share-based compensation expense; and determining liabilities, if any, for environmental and legal contingencies.
Revenue Recognition
Revenue is measured based on consideration specified in a contract with a customer. MPLX recognizes revenue when it satisfies a performance obligation by transferring control over a product or providing services to a customer.
MPLX enters into a variety of contract types in order to generate Product sales and Service revenue. MPLX provides services under the following types of arrangements:
•Fee-based arrangements – Under fee-based arrangements, MPLX receives fees for the following services: gathering, processing and transportation of natural gas; transportation, fractionation, exchange and storage of NGLs; and transportation, terminalling, storage and distribution of crude oil, refined products, other hydrocarbon-based products, and renewables. The revenue MPLX earns from these arrangements is generally directly related to the volume of natural gas, NGLs, refined products or crude oil that is handled by or flows through MPLX’s systems and facilities and is not normally directly dependent on commodity prices. In certain cases, MPLX’s arrangements provide for minimum volume commitments. Fee-based arrangements are reported as Service revenue on the Consolidated Statements of
Income. Revenue is recognized over time as services are performed. In certain instances when specifically stated in the contract terms, MPLX purchases product after fee-based services have been provided. Revenue from the sale of products purchased after services are provided is reported as Product sales on the Consolidated Statements of Income and recognized on a gross basis, as MPLX takes control of the product and is the principal in the transaction.
•Percent-of-proceeds arrangements – Under percent-of-proceeds arrangements, MPLX gathers and processes natural gas on behalf of producers; sells the resulting residue gas, condensate and NGLs at market prices; and remits to producers an agreed-upon percentage of the proceeds. In other cases, instead of remitting cash payments to the producer, MPLX delivers an agreed-upon percentage of the residue gas and NGLs to the producer (take-in-kind arrangements) and sells the volumes MPLX retains to third parties or related parties. Revenue is recognized on a net basis when MPLX acts as an agent and does not have control of the gross amount of gas and/or NGLs prior to it being sold. Percent-of-proceeds revenue is reported as Service revenue - product related on the Consolidated Statements of Income.
•Keep-whole arrangements – Under keep-whole arrangements, MPLX gathers natural gas from the producer, processes the natural gas and sells the resulting condensate and NGLs to third parties at market prices. Because the extraction of the condensate and NGLs from the natural gas during processing reduces the Btu content of the natural gas, MPLX must either purchase natural gas at market prices for return to producers or make cash payment to the producers equal to the value of the energy content of this natural gas. Certain keep-whole arrangements also have provisions that require MPLX to share a percentage of the keep-whole profits with the producers based on the oil to gas ratio or the NGL to gas ratio. Service revenue - product related is recorded based on the value of the NGLs received on the date the services are performed. Natural gas purchased to return to the producer and shared NGL profits are recorded as a reduction of Service revenue - product related on the Consolidated Statements of Income on the date the services are performed. Sales of NGLs under these arrangements are reported as Product sales on the Consolidated Statements of Income and are reported on a gross basis as MPLX is the principal in the arrangement and controls the product prior to sale. The sale of the NGLs may occur shortly after services are performed at the tailgate of the plant, or after a period of time as determined by MPLX.
•Purchase arrangements – Under purchase arrangements, MPLX purchases natural gas at either the wellhead or the tailgate of a plant. MPLX then gathers and delivers the natural gas to pipelines where MPLX may resell the natural gas. Wellhead purchase arrangements represent an arrangement with a supplier and are recorded in Purchased product costs. Often, MPLX earns fees for services performed prior to taking control of the product in these arrangements and Service revenue is recorded for these fees. Revenue generated from the sale of product obtained in tailgate purchase arrangements is reported as Product sales on the Consolidated Statements of Income and is recognized on a gross basis as MPLX purchases and takes control of the product prior to sale and is the principal in the transaction.
In many cases, MPLX provides services under contracts that contain a combination of more than one of the arrangements described above. When fees are charged (in addition to product received) under percent-of-proceeds arrangements, keep-whole arrangements or purchase arrangements, MPLX records such fees as Service revenue on the Consolidated Statements of Income. The terms of MPLX’s contracts vary based on gas quality conditions, the competitive environment when the contracts are signed, and customer requirements. Performance obligations are determined based on the specific terms of the arrangements, economics of the geographical regions, and the services offered and whether they are deemed distinct. MPLX allocates the consideration earned between the performance obligations based on the stand-alone selling price when multiple performance obligations are identified.
Revenue from MPLX’s service arrangements will generally be recognized over time as the performance obligation is satisfied as services are provided. MPLX has elected to use the output measure of progress to recognize revenue based on the units delivered, processed or transported. The transaction price may have fixed components related to minimum volume commitments and variable components, which are primarily dependent on volumes. Variable consideration will generally not be estimated at contract inception as the transaction price is specifically allocable to the services provided each period. In instances in which tiered pricing structures do not reflect our efforts to perform, MPLX will estimate variable consideration at contract inception. Product sales will be recognized at a point in time when control of the product transfers to the customer.
Minimum volume commitments may create contract liabilities if current period payments can be used for future services. If a customer fails to meet its minimum committed volumes, it owes MPLX a deficiency payment based on the terms of the applicable agreement. The deficiency amounts received under these agreements (excluding payments received under agreements classified as sales-type leases) are recorded as Current liabilities or Current liabilities - related parties. In many cases, the customer may then apply the amount of any such deficiency payments as a credit for volumes in excess of its minimum volume commitment in future periods under the terms of the applicable agreements. MPLX recognizes revenue for the deficiency payments when credits are used for volumes in excess of minimum quarterly volume commitments, where it is probable the customer will not use the credit in future periods or upon the expiration of the credits. The use or expiration of the credits is a decrease in Current liabilities or Current liabilities - related parties. Deficiency payments under agreements that have been classified as sales-type leases are recorded as a reduction against the corresponding lease receivable.
Amounts billed to customers for shipping and handling, electricity, and other costs to perform services are included in the transaction price as a component of Revenues and other income on the Consolidated Statements of Income. Shipping and handling costs associated with product sales are included in Purchased product costs on the Consolidated Statements of Income.
Customers usually pay monthly based on the products purchased or services performed that month. Taxes collected from customers and remitted to the appropriate taxing authority are excluded from revenue.
Based on the terms of certain contracts, MPLX is considered to be the lessor under several implicit operating and sales-type lease arrangements in accordance with GAAP. Revenue and costs related to the portion of the revenue earned under these contracts considered to be implicit operating leases are recorded as Rental income and Rental cost of sales, respectively, on the Consolidated Statements of Income. Revenue related to the portion of the revenue earned under these contracts considered to be implicit sales-type lease arrangements is recorded as Sales-type lease revenue on the Consolidated Statements of Income, while related costs are recorded to Cost of revenues or Purchases - related parties.
Revenue and Expense Accruals
MPLX routinely makes accruals based on estimates for both revenues and expenses due to the timing of compiling billing information, receiving certain third-party information and reconciling MPLX’s records with those of third parties. The delayed information from third parties includes, among other things, actual volumes purchased, transported or sold, adjustments to inventory and invoices for purchases, actual natural gas and NGL deliveries, and other operating expenses. MPLX makes accruals to reflect estimates for these items based on its internal records and information from third parties. Estimated accruals are adjusted when actual information is received from third parties and MPLX’s internal records have been reconciled.
Other Taxes
Other taxes primarily include real estate taxes.
Cash and Cash Equivalents
Cash and cash equivalents include cash on hand and on deposit and investments in highly liquid debt instruments with original maturities of three months or less.
Receivables
Receivables primarily consist of customer accounts receivable, which are recorded at the invoiced amount and generally do not bear interest. Allowances for doubtful accounts are generally recorded when it becomes probable that the receivable will not be collected and are recorded to bad debt expense. We review the allowance quarterly and past-due balances over 150 days are reviewed individually for collectability. Balances that remain outstanding after reasonable collection efforts have been unsuccessful are written off through a charge to the valuation allowance and a credit to accounts receivable.
Leases
Contracts with a term greater than one year that convey the right to direct the use of and obtain substantially all of the economic benefit of an asset are accounted for as right of use (“ROU”) assets and lease liabilities.
ROU asset and lease liability balances are recorded at the commencement date at present value of the fixed lease payments using a secured incremental borrowing rate with a maturity similar to the lease term because our leases do not provide implicit rates. We have elected to include both lease and non-lease components in the present value of the lease payments for all lessee asset classes with the exception of our marine and third-party contractor service and equipment leases. The lease component of the payment for the marine and equipment asset classes is determined using a relative standalone selling price. Operating lease expense is recognized on a straight-line basis over the lease term. See Note 21 for additional disclosures about our lease contracts.
As a lessor under ASC 842, MPLX may be required to re-classify existing operating leases to sales-type leases upon modification and related reassessment of the leases. See Note 21 for further information regarding our ongoing evaluation of the impacts of lease reassessments as modifications occur. The net investment in sales-type leases with third parties is recorded within Receivables, net and Other noncurrent assets on the Consolidated Balance Sheets. The net investment in sales-type leases with related parties is recorded within Current assets - related parties and Noncurrent assets - related parties on the Consolidated Balance Sheets. These amounts are comprised of the present value of the sum of the future minimum lease payments representing the value of the lease receivable and the unguaranteed residual value of the leased assets. Management assesses the net investment in sales-type leases for recoverability quarterly.
Inventories
Inventories consist of materials and supplies to be used in operations, line fill and other NGLs. Cost for materials and supplies are determined primarily using the weighted-average cost method. Inventories are valued at the lower of cost or net realizable value.
Imbalances
Within our pipelines and storage assets, we experience volume gains and losses due to pressure and temperature changes, evaporation and variances in meter readings and other measurement methods. Until settled, positive imbalances are recorded
as other current assets and negative imbalances are recorded as accounts payable. Positive and negative imbalances are settled in cash, settled by physical delivery of volumes from a different source, or tracked and settled in the future.
Investment in Unconsolidated Affiliates
Equity investments in which MPLX exercises significant influence but does not control and is not the primary beneficiary, are accounted for using the equity method and are reported in Equity method investments on the accompanying Consolidated Balance Sheets. This includes entities in which we hold majority ownership, but the minority shareholders have substantive participating rights. Differences in the basis of the investments and the separate net asset values of the investees, if any, are amortized into net income over the remaining useful lives of the underlying assets and liabilities, except for the excess related to goodwill.
Regular evaluation of these investments is appropriate to evaluate any potential need for impairment. MPLX uses evidence of a loss in value to identify if an investment has an other than a temporary decline. Impairments are recorded through Income from equity method investments.
Property, Plant and Equipment
Property, plant and equipment are recorded at cost and depreciated on a straight-line basis over the estimated useful lives of the assets. Expenditures that extend the useful lives of assets are capitalized.
Long-lived assets used in operations are assessed for impairment whenever changes in facts and circumstances indicate that the carrying value of the assets may not be recoverable based on the expected undiscounted future cash flows of an asset group. For purposes of impairment evaluation, long-lived assets must be grouped at the lowest level for which independent cash flows can be identified, which is at least at the segment level and in some cases for similar assets in the same geographic region where cash flows can be separately identified. If the sum of the undiscounted future cash flows from the use of the asset group and its eventual disposition is less than the carrying value of an asset group, an impairment assessment is performed and the excess of the book value over the fair value is recorded as an impairment loss.
When items of property, plant and equipment are sold or otherwise disposed of, any gains or losses are reported on the Consolidated Statements of Income. Gains on the disposal of property, plant and equipment are recognized when earned, which is generally at the time of closing. If a loss on disposal is expected, such losses are recognized when the assets are classified as held for sale.
Interest costs for the construction or development of long-lived assets are capitalized and amortized over the related asset’s estimated useful life.
Goodwill and Intangibles
Goodwill represents the excess of the purchase price over the estimated fair value of the net assets acquired in the acquisition of a business. Goodwill is not amortized, but rather is tested for impairment at the reporting unit level annually and when events or changes in circumstances indicate that the fair value of a reporting unit with goodwill has been reduced below carrying value. If we determine, based on a qualitative assessment, that it is not more likely than not that a reporting unit’s fair value is less than its carrying amount, no further impairment testing is required. If we do not perform a qualitative assessment or if that assessment indicates that further impairment testing is required, the fair value of each reporting unit is determined using an income and market approach which is compared to the carrying value of the reporting unit. If the carrying amount of the reporting unit exceeds its fair value, an impairment loss would be recognized in an amount equal to that excess, limited to the total amount of goodwill allocated to that reporting unit. The fair value under the income approach is calculated using the expected present value of future cash flows method. Significant assumptions used in the cash flow forecasts include future volumes, discount rates, and future capital requirements. See Note 14 for further details.
Amortization of intangibles with definite lives is calculated using the straight-line method, which is reflective of the benefit pattern in which the estimated economic benefit is expected to be received over the estimated useful life of the intangible asset. Intangibles subject to amortization are reviewed for impairment whenever events or changes in circumstances indicate that the carrying amount of the intangible may not be recoverable. If the sum of the expected undiscounted future cash flows related to the asset is less than the carrying amount of the asset, an impairment loss is recognized based on the fair value of the asset.
Environmental Costs
Environmental expenditures for additional equipment that mitigates or prevents future contamination or improves environmental safety or efficiency of the existing assets are capitalized. We recognize remediation costs and penalties when the responsibility to remediate is probable and the amount of associated costs can be reasonably estimated. The timing of remediation accruals coincides with the completion of a feasibility study or the commitment to a formal plan of action. Remediation liabilities are accrued based on estimates of known environmental exposure and are discounted when the estimated amounts are reasonably
fixed and determinable. If recoveries of remediation costs from third parties are probable, a receivable is recorded and is discounted when the estimated amount is reasonably fixed and determinable.
Asset Retirement Obligations
An ARO is a legal obligation associated with the retirement of tangible long-lived assets that generally result from the acquisition, construction, development or normal operation of the asset. The fair value of AROs is recognized in the period in which the obligations are incurred, if a reasonable estimate of fair value can be made, and added to the carrying amount of the associated asset. This additional carrying amount is then depreciated over the life of the asset. The liability is determined using a credit adjusted risk free interest rate and increases due to the passage of time based on the time value of money until the obligation is settled. AROs have not been recognized for certain assets because the fair value cannot be reasonably estimated since the settlement dates of the obligations are indeterminate. Such obligations will be recognized in the period when sufficient information becomes available to estimate a range of potential settlement dates. As of December 31, 2024 and 2023, MPLX’s asset retirement obligation was $41 million and $39 million, respectively, and is included on the balance sheet within Other long-term liabilities.
Derivative Instruments
MPLX may use commodity derivatives to economically hedge a portion of its exposure to commodity price risk. All derivative instruments (including derivatives embedded in other contracts) are recorded at fair value. MPLX discloses the fair value of all derivative instruments under the captions Other current assets, Other noncurrent assets, Other current liabilities and Other long-term liabilities on the Consolidated Balance Sheets. Certain commodity derivative positions are governed by master netting arrangements and are reflected on the consolidated balance sheets on a net basis by counterparty. We make a distinction between realized or unrealized gains and losses on derivatives. During the period when a derivative contract is outstanding, changes in the fair value of the derivative are recorded as an unrealized gain or loss. When a derivative contract matures or is settled, the previously recorded unrealized gain or loss is reversed, and the realized gain or loss of the contract is recorded. Changes in the fair value of derivative instruments are reported on the Consolidated Statements of Income in accounts related to the item whose value or cash flows are being managed. Derivative instruments are marked to market through Product sales and Purchased product costs on the Consolidated Statements of Income.
During the years ended December 31, 2024, 2023 and 2022, MPLX did not elect hedge accounting for any derivatives. MPLX has historically elected the normal purchases and normal sales designation for certain contracts related to the physical purchase of electric power and the sale of most commodities.
Fair Value Measurement
Financial assets and liabilities recorded at fair value in the Consolidated Balance Sheets are categorized based upon the fair value hierarchy established by GAAP, which classifies the inputs used to measure fair value into Level 1, Level 2 or Level 3. A financial instrument’s categorization within the valuation hierarchy is based upon the lowest level of input that is significant to the fair value measurement. The methods and assumptions utilized may produce a fair value that may not be realized in future periods upon settlement. Furthermore, while MPLX believes its valuation methods are appropriate and consistent with other market participants, the use of different methodologies or assumptions to determine the fair value of certain financial instruments could result in a different estimate of fair value at the reporting date. For further discussion, see Note 15.
Equity-Based Compensation Arrangements
MPLX issues phantom units under the MPLX LP 2018 Incentive Compensation Plan. A phantom unit entitles the grantee a right to receive a common unit upon the issuance of the phantom unit. The fair value of phantom unit awards granted to employees and non-management directors is based on the fair market value of MPLX LP common units on the date of grant. The fair value of the units awarded is amortized into earnings using a straight-line amortization schedule over the period of service corresponding with the vesting period. For phantom units that vest immediately and are not forfeitable, equity-based compensation expense is recognized at the time of grant.
To satisfy common unit awards, MPLX may issue new common units, acquire common units in the open market or use common units already owned by the general partner.
Income Taxes
MPLX is not a taxable entity for United States federal income tax purposes or for the majority of the states that impose an income tax. Taxes on MPLX’s net income generally are borne by its partners through the allocation of taxable income. MPLX’s taxable income or loss, which may vary substantially from the net income or loss reported on the Consolidated Statements of Income, is includable in the federal income tax returns of each partner. MPLX and certain legal entities are, however, taxable entities under certain state jurisdictions.
MPLX accounts for income taxes under the asset and liability method. Deferred income taxes are recognized for the future tax consequences attributable to differences between the financial statement carrying amounts of existing assets and liabilities and their respective tax basis, capital loss carryforwards and net operating loss and credit carryforwards. Deferred tax assets and liabilities are measured using enacted tax rates applied to taxable income in the years in which those temporary differences are expected to be recovered or settled. The effect of any tax rate change on deferred taxes is recognized as tax expense/(benefit)
from continuing operations in the period that includes the enactment date of the tax rate change. Realizability of deferred tax assets is assessed and, if not more likely than not, a valuation allowance is recorded to reflect the deferred tax assets at net realizable value as determined by management. All deferred tax balances are classified as long-term in the accompanying Consolidated Balance Sheets. All changes in the tax bases of assets and liabilities are allocated among operations and items charged or credited directly to equity.
Distributions
In preparing the Consolidated Statements of Equity, net income attributable to MPLX LP is allocated to preferred unitholders based on a fixed distribution schedule, as discussed in Notes 7 and 9, and subsequently allocated to the limited partner unitholders. Distributions, although earned, are not accrued as a liability until declared. The allocation of net income attributable to MPLX LP for purposes of calculating net income per limited partner unit is described below.
Net Income Per Limited Partner Unit
MPLX uses the two-class method when calculating the net income per unit applicable to limited partners, because there is more than one class of participating security. The classes of participating securities include common units, preferred units and certain equity-based compensation awards.
Net income attributable to MPLX LP is allocated to the unitholders differently for preparation of the Consolidated Statements of Equity and the calculation of net income per limited partner unit. In preparing the Consolidated Statements of Equity, net income attributable to MPLX LP is allocated to preferred unitholders based on a fixed distribution schedule and subsequently allocated to remaining unitholders in accordance with their respective ownership percentages. The allocation of net income attributable to MPLX LP for purposes of calculating net income per limited partner unit is described in Note 8.
In preparing net income per limited partner units, during periods in which a net loss attributable to MPLX is reported or periods in which the total distributions exceed the reported net income attributable to MPLX’s unitholders, the amount allocable to certain equity-based compensation awards is based on actual distributions to the equity-based compensation awards. Diluted earnings per unit is calculated by dividing net income attributable to MPLX’s common unitholders, after deducting amounts allocable to other participating securities, by the weighted average number of common units and potential common units outstanding during the period. Potential common units are excluded from the calculation of diluted earnings per unit during periods in which net income attributable to MPLX’s unitholders, after deducting amounts that are allocable to the outstanding equity-based compensation awards and preferred units, is a loss, as the impact would be anti-dilutive.
Business Combinations
We recognize and measure the assets acquired and liabilities assumed in a business combination based on their estimated fair values at the acquisition date. Any excess or deficit of the purchase consideration when compared to the fair value of the net tangible assets acquired, if any, is recorded as goodwill or gain from a bargain purchase. Depending on the nature of the transaction, management may engage an independent valuation specialist to assist with the determination of fair value of the assets acquired, liabilities assumed, noncontrolling interests, if any, and goodwill, based on recognized business valuation methodologies. An income, market or cost valuation method may be utilized to estimate the fair value of the assets acquired, liabilities assumed, and noncontrolling interests, if any, in a business combination. The income valuation method represents the present value of future cash flows over the life of the asset using: (i) discrete financial forecasts, which rely on management’s estimates of volumes, certain commodity prices, revenue and operating expenses; (ii) long-term growth rates; and (iii) appropriate discount rates. The market valuation method uses prices paid for a reasonably similar asset by other purchasers in the market, with adjustments relating to any differences between the assets. The cost valuation method is based on the replacement cost of a comparable asset at prices at the time of the acquisition reduced for depreciation of the asset. If the initial accounting for the business combination is incomplete by the end of the reporting period in which the acquisition occurs, an estimate will be recorded. Subsequent to the acquisition, and not later than one year from the acquisition date, MPLX will record any material adjustments to the initial estimate based on new information obtained that would have existed as of the acquisition date. Any adjustment that arises from information obtained that did not exist as of the date of the acquisition will be recorded in the period of the adjustment. Acquisition-related costs are expensed as incurred in connection with each business combination.
Acquisitions in which the company or business being acquired by MPLX had an existing relationship with MPC may result in the transaction being considered a transfer between entities under common control. In these situations, MPLX records the assets acquired and liabilities assumed on its consolidated balance sheets at MPC’s historical carrying value. For the acquiring entity, transfers of businesses between entities under common control require prior periods to be retrospectively adjusted for those dates that the entity was under common control.
3. Accounting Standards and Disclosure Rules
Recently Adopted
ASU 2023-07, Segment Reporting (Topic 280): Improvements to Reportable Segment Disclosures
The FASB issued this ASU to update reportable segment disclosure requirements primarily by requiring enhanced disclosures about significant segment expenses. During the fourth quarter of 2024, we applied the amendments in this ASU retrospectively to
all periods presented in the financial statements. The enhanced disclosures for significant segment expenses are presented in Note 10 - Segment Information.
ASU 2023-01, Leases (Topic 842): Common Control Arrangements
The FASB issued this ASU to amend certain provisions of ASC 842 that apply to arrangements between related parties under common control. The ASU amends the accounting for the amortization period of leasehold improvements in common-control leases for all entities and requires certain disclosures when the lease term is shorter than the useful life of the asset. During the first quarter of 2024, we adopted this ASU and it did not have a material impact on our financial statements or disclosures.
Not Yet Adopted
ASU 2024-03, Income Statement – Reporting Comprehensive Income – Expense Disaggregation Disclosures (Subtopic 220-40): Disaggregation of Income Statement Expenses
In November 2024, the FASB issued an ASU to require more detailed information about specified categories of expenses (purchases of inventory, employee compensation, depreciation, amortization, and depletion) included in certain expense captions presented on the income statement. This ASU is effective for fiscal years beginning after December 15, 2026, and for interim periods within fiscal years beginning after December 15, 2027. Early adoption is permitted. The amendments may be applied either (1) prospectively to financial statements issued for reporting periods after the effective date of this ASU or (2) retrospectively to all prior periods presented in the financial statements. We are currently evaluating the impact this ASU will have on our disclosures.
SEC Release No. 33-11275, The Enhancement and Standardization of Climate-Related Disclosures for Investors
In March 2024, the SEC adopted rules under SEC Release No. 33-11275, The Enhancement and Standardization of Climate-Related Disclosures for Investors, which requires registrants to provide certain climate-related information in their annual reports. As part of the disclosures, material impacts from severe weather events and other natural conditions will be required in the audited financial statements. In April 2024, the SEC voluntarily stayed the rules pending judicial review. Pending the results of the judicial review, the disclosure requirements are effective for the Partnership’s Annual Report on Form 10-K for the fiscal year ending December 31, 2025. We are evaluating the impact these rules, if effective, will have on our disclosures and monitoring the status of the judicial review.
4. Acquisitions and Other Transactions
BANGL, LLC Acquisition
On July 31, 2024, MPLX exercised its right of first offer under the BANGL, LLC joint venture agreement to purchase an additional 20 percent ownership interest in BANGL, LLC, for $210 million cash, increasing total ownership interest to 45 percent (the “BANGL Transaction”). BANGL, LLC owns a natural gas liquids pipeline system connecting the Delaware and Midland basins to the fractionation market in the Gulf Coast and export markets. The purchase price of the additional 20 percent ownership interest in BANGL, LLC exceeded our portion of the underlying net assets of the joint venture by approximately $156 million. This basis difference is being amortized into net income over the remaining estimated useful lives of the underlying net assets. Following the BANGL Transaction, our investment in BANGL, LLC continues to be accounted for as an equity method investment.
Whistler Joint Venture Transaction
On May 29, 2024, MPLX and its joint venture partner contributed their respective membership interest in Whistler Pipeline, LLC to a newly formed joint venture, WPC Parent, LLC, and issued a 19 percent voting interest in WPC Parent, LLC to an affiliate of Enbridge Inc. in exchange for the contribution of cash and the Rio Bravo Pipeline project (the “Whistler Joint Venture Transaction”). As a result of the transaction, MPLX’s voting interest in the joint venture was reduced from 37.5 percent to 30.4 percent. MPLX recognized a gain of $151 million at closing and received a cash distribution of $134 million, recorded as a return of capital, related to the dilution of the ownership interest. The gain is included in Income from equity method investments on the accompanying consolidated statements of income and the return of capital is included in Investments - redemptions, repayments, return of capital and sales proceeds within the investing section of the accompanying consolidated statements of cash flows.
Utica Midstream Acquisition
On March 22, 2024, MPLX used $625 million of cash on hand to purchase additional ownership interest in existing joint ventures and gathering assets (the “Utica Midstream Acquisition”), which will enhance our position in the Utica basin. Prior to the acquisition, we owned an indirect interest in Ohio Gathering Company L.L.C. (“OGC”) and a direct interest in Ohio Condensate Company L.L.C. (“OCC”) and now own a combined 73 percent interest in OGC, a 100 percent interest in OCC, and a 100 percent interest in a dry gas gathering system in the Utica basin, including 53 miles of gathering pipeline and three dehydration units with a combined capacity of approximately 620 MMcf/d. OGC continues to be accounted for as an equity method investment, as MPLX did not obtain control of OGC as a result of the transaction. The acquisition date fair value of our investment in OGC exceeded our portion of the underlying net assets of the joint venture by approximately $75 million. This basis difference is being amortized into net income over the remaining estimated useful lives of the underlying net assets. OCC was previously accounted for as an equity method investment, and it is now reflected as a consolidated subsidiary within our
consolidated financial results. The results for the acquired business are reported within our Natural Gas and NGL Services segment.
The Utica Midstream Acquisition was accounted for as a business combination requiring all the acquired assets and liabilities to be remeasured to fair value resulting in a consolidated fair value of net assets and liabilities of $625 million. The fair value includes $507 million related to acquired interests in the joint ventures and the remaining balance related to other acquired assets and liabilities. The revaluation of MPLX’s existing 62 percent equity method investment in OCC resulted in a $20 million gain, which is included in Other income within the accompanying consolidated statements of income. The fair value of equity method investments was based on a discounted cash flow model.
Acquisition of 40 Percent Interest in MarkWest Torñado GP, L.L.C.
On December 15, 2023, MPLX used $303 million of cash on hand to purchase the remaining 40 percent interest in MarkWest Torñado GP, L.L.C. (“Torñado”) for approximately $270 million, including cash paid for working capital, and to extend the term of a gathering and processing agreement for approximately $33 million. As a result of this transaction, we now own 100 percent of Torñado and reflect it as a consolidated subsidiary within our consolidated financial results. It was previously accounted for as an equity method investment. Torñado provides natural gas gathering and processing related services in the Permian basin. Its assets include two gas processing plants, each with a capacity of 200 MMcf/d and approximately 142 miles of gathering pipeline. The results for this business are reported under our Natural Gas and NGL Services segment.
At December 15, 2023, the carrying value of our 60 percent equity investment in Torñado was $311 million. Upon acquisition of the remaining 40 percent member interest, our existing equity investment was remeasured to fair value resulting in the recognition of a $92 million gain, which is presented in Other income on the Consolidated Statements of Income. The fair value of the previously-held equity method investment was primarily based on the price negotiated for the 40 percent interest in Torñado.
The acquisition was accounted for as a business combination requiring all of the Torñado assets and liabilities to be remeasured to fair value resulting in a consolidated fair value of net assets and liabilities of $673 million. The fair value of property, plant and equipment was based primarily on the cost approach. The fair value of the identifiable intangible assets, consisting of various customer contracts, was primarily based on the multi-period excess earnings method, which is an income approach. The following table reflects our determination of the fair value of the Torñado assets and liabilities (in millions):
| | | | | |
| (In millions) | |
| Property, Plant and Equipment | $ | 585 | |
| Intangibles | 75 | |
| Working capital, net | 30 | |
| Other Long-term assets and liabilities, net | (17) | |
| Total net assets and liabilities | $ | 673 | |
Pro forma financial information assuming the acquisition had occurred as of the beginning of the calendar year prior to the year of the acquisition, as well as the revenues and earnings generated during the period since the acquisition date, were not material for disclosure purposes.
5. Investments and Noncontrolling Interests
The following table presents MPLX’s equity method investments at the dates indicated: | | | | | | | | | | | | | | | | | | | | | | | |
| | | Ownership as of | | Carrying value at |
| | | December 31, | | December 31, |
| (In millions, except ownership percentages) | VIE | | 2024 | | 2024 | | 2023 |
| Crude Oil and Products Logistics | | | | | | | |
| Illinois Extension Pipeline Company, L.L.C. | | | 35% | | $ | 218 | | | $ | 228 | |
| LOOP LLC | | | 41% | | 310 | | | 314 | |
MarEn Bakken Company LLC(1) | | | 25% | | 526 | | | 449 | |
Other(2) | X | | | | 541 | | | 526 | |
| Total Crude Oil and Products Logistics | | | | | 1,595 | | | 1,517 | |
| Natural Gas and NGL Services | | | | | | | |
BANGL, LLC(3) | | | 45% | | 281 | | | 63 | |
| MarkWest EMG Jefferson Dry Gas Gathering Company, L.L.C. | X | | 67% | | 329 | | | 336 | |
| MarkWest Utica EMG, L.L.C. | X | | 59% | | 742 | | | 676 | |
Ohio Gathering Company L.L.C.(4) | X | | 35% | | 470 | | | — | |
| Sherwood Midstream LLC | X | | 50% | | 488 | | | 500 | |
WPC Parent, LLC(5) | | | 30% | | 208 | | | 214 | |
Other(2) | X | | | | 418 | | | 437 | |
| Total Natural Gas and NGL Services | | | | | 2,936 | | | 2,226 | |
| Total | | | | | $ | 4,531 | | | $ | 3,743 | |
(1) The investment in MarEn Bakken Company LLC includes our 9.19 percent indirect interest in a joint venture (“Dakota Access”) that owns and operates the Dakota Access Pipeline and Energy Transfer Crude Oil Pipeline projects (collectively referred to as the “Bakken Pipeline system”).
(2) Some investments included within Other have also been deemed to be VIEs.
(3) In July 2024, we purchased an additional 20 percent ownership interest in BANGL, LLC, increasing our ownership interest to 45 percent, as discussed in Note 4.
(4) We acquired a 36 percent direct interest in OGC in the Utica Midstream Acquisition discussed in Note 4. We also hold a 38 percent indirect interest in OGC through our ownership interest in MarkWest Utica EMG, L.L.C.
(5) Reflects the dilution of MPLX’s ownership interest in Whistler Pipeline, LLC and the formation of a new entity, WPC Parent, LLC, as discussed in Note 4. The carrying value at December 31, 2024 represents our ownership in WPC Parent, LLC, and the carrying value at December 31, 2023 represents our ownership interest in Whistler Pipeline, LLC.
For those entities that have been deemed to be VIEs, neither MPLX nor any of its subsidiaries have been deemed to be the primary beneficiary due to voting rights on significant matters. While we have the ability to exercise influence through participation in the management committees which make all significant decisions, we have equal influence over each committee as a joint interest partner and all significant decisions require the consent of the other investors without regard to economic interest. As such, we have determined that these entities should not be consolidated and applied the equity method of accounting with respect to our investments in each entity.
MPLX’s maximum exposure to loss as a result of its involvement with equity method investments generally includes its equity investment, any additional capital contribution commitments and any operating expenses incurred by the subsidiary operator in excess of its compensation received for the performance of the operating services. MPLX did not provide any financial support to equity method investments that it was not contractually obligated to provide during the years ended December 31, 2024, 2023 and 2022. See Note 22 for information on our guarantees related to equity method investees.
From time to time, changes in the design or nature of the activities of our equity method investments may require us to reconsider our conclusions on the entity’s status as a VIE and/or our status as the primary beneficiary. Such reconsideration could result in a change in the classification of the equity method investment.
Summarized financial information for MPLX’s equity method investments is as follows:
| | | | | | | | | | | | | | | | | |
| (In millions) | 2024 | | 2023 | | 2022 |
| Income statement data: | | | | | |
| Revenues and other income | $ | 3,594 | | | $ | 3,262 | | | $ | 2,653 | |
| Costs and expenses | 1,535 | | | 1,331 | | | 1,251 | |
| Income from operations | 2,059 | | | 1,930 | | | 1,402 | |
| Net income | 1,631 | | | 1,634 | | | 1,246 | |
| Balance sheet data: | | | | | |
| Current assets | 1,570 | | | 1,531 | | | |
| Noncurrent assets | 17,927 | | | 13,860 | | | |
| Current liabilities | 746 | | | 979 | | | |
| Noncurrent liabilities | 6,711 | | | 4,856 | | | |
As of December 31, 2024 and 2023, the carrying value of MPLX’s equity method investments in the Crude Oil and Products Logistics segment exceeded the underlying net assets of its investees by $291 million and $299 million, respectively. As of December 31, 2024, the carrying value of its equity method investments in the Natural Gas and NGL Services segment exceeded the underlying net assets of its equity method investments by approximately $198 million. As of December 31, 2023, the underlying net assets of MPLX’s investees in the Natural Gas and NGL Services segment exceeded the carrying value of its equity method investments by approximately $30 million.
At both December 31, 2024 and 2023, the Crude Oil and Products Logistics basis difference related to goodwill was $167 million. At both December 31, 2024 and 2023, the Natural Gas and NGL Services basis difference related to goodwill was $31 million.
6. Related Party Agreements and Transactions
MPLX engages in transactions with both MPC and certain of its equity method investments as part of its normal business; however, transactions with MPC make up the majority of MPLX’s related party transactions. Transactions with related parties are further described below.
Commercial Agreements
MPLX has various long-term, fee-based commercial agreements with MPC. Under these agreements, MPLX provides transportation, gathering, terminal, fuels distribution, marketing, storage, management, operational and other services to MPC. MPC has committed to provide MPLX with minimum quarterly throughput volumes on crude oil and refined products and other fees for storage capacity; operating and management fees; and reimbursements for certain direct and indirect costs. MPC has also committed to provide a fixed fee for 100 percent of available capacity for boats, barges and third-party chartered equipment under the marine transportation service agreements.
The commercial agreements with MPC include:
•MPLX has a fuels distribution agreement with MPC under which MPC pays MPLX a tiered monthly volume-based fee for marketing and selling MPC’s products. This agreement is subject to a minimum quarterly volume and has an initial term of 10 years, subject to a five-year renewal period under terms to be renegotiated at that time.
•MPLX has various pipeline transportation agreements under which MPC pays MPLX fees for transporting crude and refined products on MPLX’s pipeline systems. These agreements are subject to minimum throughput volumes under which MPC will pay MPLX deficiency payments for any period in which they do not ship the minimum committed volume. Under certain agreements, deficiency payments can be applied as credits to future periods in which MPC ships volumes in excess of the minimum volume, subject to a limited period of time. These agreements are subject to various terms and renewal periods.
•MPLX has marine transportation agreements with initial terms of five to six years under which MPC pays MPLX fees for providing marine transportation of crude oil, feedstock and refined petroleum products, and related services. These agreements are each subject to one remaining renewal period of five years.
•MPLX has numerous storage services agreements governing storage services at various types of facilities including terminals, pipeline tank farms, caverns and refineries, under which MPC pays MPLX per-barrel fees for providing storage services. Some of these agreements provide MPC with exclusive access to storage at certain locations, such as storage located at MPC’s refineries or storage in certain caverns. Under these agreements, MPC pays MPLX a per-barrel fee for such storage capacity, regardless of whether MPC fully utilizes the available capacity. These agreements are subject to various terms and renewal periods.
•MPLX has multiple terminal services agreements governing certain terminals under which MPC pays MPLX fees for terminal services. Under these agreements MPC pays MPLX agreed upon fees relating to MPC product receipts, deliveries and storage as well as any blending, additization, handling, transfers or other related charges. Many of these agreements are subject to minimum volume throughput commitments, or to various minimum commitments related to some or all terminal activities, under which MPC pays a deficiency payment for any period in which they do not meet the minimum commitment. Some of these agreements allow for deficiency payments to be applied as credits to a limited number of future periods with excess throughput volumes. These agreements are subject to various terms and renewal periods.
•MPLX has a keep-whole commodity agreement with MPC under which MPC pays us a processing fee for NGLs related to keep-whole agreements and we pay MPC a marketing fee in exchange for assuming the commodity risk. The pricing structure under this agreement provides for a base volume subject to a base rate and incremental volumes subject to variable rates, which are calculated with reference to certain of our costs incurred as processor of the volumes. The pricing for both the base and incremental volumes are subject to revision each year. This agreement is subject to automatic three-month renewal periods. This agreement is scheduled to expire in 2025.
•MPLX has an agreement with MPC under which it provides management services to assist MPC in the oversight and management of the marine business. MPLX receives fixed annual fees for providing the required services, which are subject to predetermined annual escalation rates. This agreement is subject to an initial term of five years and automatically renews for one additional five-year renewal period unless terminated by either party.
In many cases, agreements are location-based hybrid agreements, containing provisions relating to multiple of the types of agreements and services described above.
Operating Agreements
MPLX operates various pipelines owned by MPC under operating services agreements. Under these operating services agreements, MPLX receives a fee for operating the assets and is reimbursed for all associated direct and indirect costs. Most of these agreements are indexed for inflation. These agreements range from one to ten years in length and automatically renew unless terminated by either party.
MPLX also receives management fee revenue for engineering, construction and administrative services for operating certain of its equity method investments. Amounts earned under these management agreements are classified as Other income-related parties in the Consolidated Statements of Income.
Co-location Services Agreements
MPLX is party to co-location services agreements with MPC’s refineries under which MPC provides management, operational and other services to MPLX. MPLX pays MPC monthly fixed fees and direct reimbursements for such services calculated as set forth in the agreements. These agreements have initial terms of 50 years.
Ground Lease Agreements
MPLX is party to ground lease agreements with certain of MPC’s refineries under which MPLX is the lessee of certain sections of property which contain facilities owned by MPLX and are within the premises of MPC’s refineries. MPLX pays MPC monthly fixed fees under these ground leases. These agreements are subject to various terms.
Omnibus Agreements
MPLX has omnibus agreements with MPC that address MPLX’s payment of fixed annual fees to MPC for the provision of executive management services by certain executive officers of the general partner and MPLX’s reimbursement of MPC for the provision of certain general and administrative services to it (“Omnibus Charges”). They also provide for MPC’s indemnification to MPLX for certain matters, including environmental, title and tax matters, as well as our indemnification of MPC for certain matters under these agreements.
The omnibus agreements also provide for other reimbursements, including certain capital and expense projects. Capital project reimbursements are recognized as contributions from MPC. Expense project reimbursements are recognized as either revenue over the remaining term of the applicable agreement or as an offset to expense.
Employee Services Agreements
MPLX has various employee services agreements and secondment agreements with MPC under which MPLX reimburses MPC for employee benefit expenses, along with the provision of operational and management services in support of both our Crude Oil and Products Logistics and Natural Gas and NGL Services segments’ operations (“ESA Charges”).
Related Party Loan
MPLX is party to a loan agreement (the “MPC Loan Agreement”) with MPC. Under the terms of the MPC Loan Agreement, MPC extends loans to MPLX on a revolving basis as requested by MPLX and as agreed to by MPC. The borrowing capacity of the MPC Loan Agreement is $1.5 billion aggregate principal amount of all loans outstanding at any one time. The MPC Loan Agreement was renewed on July 31, 2024 and is now scheduled to expire, and borrowings under the loan agreement are
scheduled to mature and become due and payable, on July 31, 2029, provided that MPC may demand payment of all or any portion of the outstanding principal amount of the loan, together with all accrued and unpaid interest and other amounts, if any, at any time prior to maturity. Borrowings under the MPC Loan Agreement bear interest at one-month term SOFR adjusted upward by 0.10 percent plus 1.25 percent or such lower rate as would be applicable to such loans under the MPLX Credit Agreement as discussed in Note 17.
There was no activity on the MPC Loan Agreement for the years ended December 31, 2024 and 2023. Activity on the MPC Loan Agreement for the year ended December 31, 2022 was as follows:
| | | | | | | | | |
| (In millions, except %) | | | | | 2022 |
| Borrowings | | | | | $ | 2,989 | |
| Weighted average interest rate of borrowings | | | | | 1.50 | % |
| Repayments | | | | | $ | 4,439 | |
| Outstanding balance at end of period | | | | | $ | — | |
Related Party Revenue
Related party revenue consists primarily of revenue recognized from the commercial agreements with MPC as well as fees charged under operating agreements with MPC or our equity affiliates as outlined above.
Certain product sales to MPC and other related parties net to zero within the consolidated financial statements as the transactions are recorded net due to the terms of the agreements under which such product was sold. For the years ended December 31, 2024, 2023 and 2022, these sales totaled $754 million, $739 million and $1,002 million, respectively.
Related Party Expenses
Related party expenses consist primarily of Omnibus Charges, ESA Charges, and fees paid under the co-location agreements and ground lease agreements as outlined above. Omnibus Charges and ESA Charges are classified as Rental cost of sales - related parties, Purchases - related parties, or General and administrative expenses depending on the nature of the asset or activity with which the costs are associated. Additionally, we also incur costs under agreements for transportation and processing services with certain of our unconsolidated affiliates.
In addition to these agreements, MPLX purchases products from MPC, makes payments to MPC in its capacity as general contractor to MPLX, and has certain rent and lease agreements with MPC.
For the years ended December 31, 2024, 2023 and 2022, General and administrative expenses incurred from MPC totaled $289 million, $262 million and $235 million, respectively.
Some charges incurred under the omnibus and employee service agreements are related to engineering services and are associated with assets under construction. These charges are added to Property, plant and equipment, net on the Consolidated Balance Sheets. For 2024, 2023 and 2022, these charges totaled $182 million, $94 million and $70 million, respectively.
Related Party Assets and Liabilities
Assets and liabilities with related parties appearing in the Consolidated Balance Sheets are detailed in the table below. This table identifies the various components of related party assets and liabilities, including those associated with leases (see Note 21 for additional information) and deferred revenue.
| | | | | | | | | | | |
| December 31, |
| (In millions) | 2024 | | 2023 |
| Current assets - related parties | | | |
| Receivables | $ | 620 | | | $ | 587 | |
| Lease receivables | 204 | | | 149 | |
| Prepaid | 5 | | | 5 | |
| Other | 1 | | | 7 | |
| Total | 830 | | | 748 | |
| Noncurrent assets - related parties | | | |
| Long-term lease receivables | 677 | | | 789 | |
| Right of use assets | 226 | | | 227 | |
| Unguaranteed residual asset | 189 | | | 126 | |
| Long-term receivables | 28 | | | 19 | |
| Total | 1,120 | | | 1,161 | |
| Current liabilities - related parties | | | |
MPC loan agreement and other payables(1) | 288 | | | 278 | |
| Deferred revenue | 106 | | | 81 | |
| Operating lease liabilities | 2 | | | 1 | |
| Total | 396 | | | 360 | |
| Long-term liabilities - related parties | | | |
| Long-term operating lease liabilities | 224 | | | 226 | |
| Long-term deferred revenue | 110 | | | 99 | |
| Total | $ | 334 | | | $ | 325 | |
(1) There were no borrowings outstanding on the MPC Loan Agreement as of December 31, 2024 or December 31, 2023.
Other Related Party Transactions
From time to time, MPLX may also sell to or purchase from related parties, assets and inventory at the lesser of average unit cost or net realizable value.
7. Equity
Units Outstanding
MPLX had 1,017,142,290 common units outstanding as of December 31, 2024. Of that number, 647,415,452 were owned by MPC. The changes in the number of common units during the years ended December 31, 2022, 2023, and 2024 are summarized below:
| | | | | | | | | | | | | |
| (In units) | Common Units | | | | | | | | |
| Balance at December 31, 2021 | 1,016,178,378 | | | | | | | | | |
| Unit-based compensation awards | 190,529 | | | | | | | | | |
| | | | | | | | | |
| Units redeemed in unit repurchase program | (15,348,291) | | | | | | | | | |
| Balance at December 31, 2022 | 1,001,020,616 | | | | | | | | | |
| Unit-based compensation awards | 196,428 | | | | | | | | | |
| | | | | | | | | |
Conversion of Series A preferred units(1) | 2,281,831 | | | | | | | | | |
| Balance at December 31, 2023 | 1,003,498,875 | | | | | | | | | |
| Unit-based compensation awards | 141,985 | | | | | | | | | |
Conversion of Series A preferred units(1) | 21,078,998 | | | | | | | | | |
| Units redeemed in unit repurchase program | (7,577,568) | | | | | | | | | |
| Balance at December 31, 2024 | 1,017,142,290 | | | | | | | | | |
(1) Certain Series A preferred unitholders have exercised their rights to convert their Series A preferred units into common units as discussed in Note 9.
Unit Repurchase Program
On November 2, 2020, MPLX announced the board authorization of a unit repurchase program for the repurchase of up to $1 billion of MPLX’s outstanding common units held by the public, which was exhausted during the fourth quarter of 2022. On August 2, 2022, we announced the board authorization for the repurchase of up to an additional $1 billion of MPLX common units held by the public. This unit repurchase authorization has no expiration date. We may utilize various methods to effect the repurchases, which could include open market repurchases, negotiated block transactions, accelerated unit repurchases, tender offers or open market solicitations for units, some of which may be effected through Rule 10b5-1 plans. The timing and amount of future repurchases, if any, will depend upon several factors, including market and business conditions, and such repurchases may be suspended, discontinued or restarted at any time.
Total unit repurchases were as follows for the years ended December 31, 2024, 2023 and 2022:
| | | | | | | | | | | | | | | | | | | |
| (In millions, except per unit data) | 2024 | | 2023 | | 2022 | | |
| Number of units repurchased | 8 | | | — | | | 15 | | | |
Cash paid for units repurchased(1) | $ | 326 | | | $ | — | | | $ | 491 | | | |
Average cost per unit(1) | $ | 43.04 | | | $ | — | | | $ | 31.96 | | | |
(1)Cash paid for common units repurchased and average cost per unit includes commissions paid to brokers during the period.
As of December 31, 2024, we had $520 million remaining under the unit repurchase authorization.
Redemption of the Series B Preferred Units
On February 15, 2023, MPLX exercised its right to redeem all 600,000 units of 6.875 percent Fixed-to-Floating Rate Cumulative Redeemable Perpetual Preferred Units (the “Series B preferred units”). MPLX paid unitholders the Series B preferred unit redemption price of $1,000 per unit. MPLX made a final cash distribution of $21 million to Series B preferred unitholders on February 15, 2023, in conjunction with the redemption.
The changes in the Series B preferred unit balance during 2023 and 2022 are included in the Consolidated Statements of Equity within Series B preferred units.
Cash Distributions
Total distributions declared for the years ended December 31, 2024, 2023 and 2022 are summarized in the table below.
| | | | | | | | | | | | | | | | | |
| 2024 | | 2023 | | 2022 |
| Distributions per common unit | $ | 3.613 | | | $ | 3.250 | | | $ | 2.960 | |
The allocation of total quarterly cash distributions to limited, and preferred unitholders is as follows for the years ended December 31, 2024, 2023 and 2022. The Partnership Agreement sets forth the calculation to be used to determine the amount and priority of cash distributions that the common unitholders and preferred unitholders will receive. MPLX’s distributions are declared subsequent to quarter end; therefore, the following table represents total cash distributions applicable to the period in which the distributions were earned.
| | | | | | | | | | | | | | | | | |
| (In millions) | 2024 | | 2023 | | 2022 |
| Common and preferred unit distributions: | | | | | |
| Common unitholders, includes common units of general partner | $ | 3,678 | | | $ | 3,256 | | | $ | 2,980 | |
| Series A preferred unit distributions | 27 | | | 94 | | | 88 | |
Series B preferred unit distributions(1) | — | | | 5 | | | 41 | |
| Total cash distributions declared | $ | 3,705 | | | $ | 3,355 | | | $ | 3,109 | |
(1) 2023 period includes the portion of the $21 million distribution paid to the Series B preferred unitholders on February 15, 2023 that was earned during the period prior to the redemption.
On January 22, 2025, MPLX declared a quarterly cash distribution, based on the results of the fourth quarter of 2024, totaling $972 million, or $0.9565 per common unit. This rate was also received by Series A preferred unitholders. These distributions were paid on February 14, 2025 to unitholders of record on February 3, 2025.
8. Net Income Per Limited Partner Unit
Net income per unit applicable to common limited partner units is computed by dividing net income attributable to MPLX LP less income allocated to participating securities by the weighted average number of common units outstanding.
During the years ended December 31, 2024, 2023 and 2022, MPLX had participating securities consisting of common units, certain equity-based compensation awards, Series A preferred units, and Series B preferred units and also had dilutive potential common units consisting of certain equity-based compensation awards. Potential common units omitted from the diluted earnings per unit calculation for the years ended December 31, 2024, 2023 and 2022, were less than 1 million.
| | | | | | | | | | | | | | | | | |
| (In millions, except per unit data) | 2024 | | 2023 | | 2022 |
Net income attributable to MPLX LP(1): | $ | 4,317 | | | $ | 3,928 | | | $ | 3,944 | |
| Less: Distributions declared on Series A preferred units | 27 | | | 94 | | | 88 | |
| Distributions declared on Series B preferred units | — | | | 5 | | | 41 | |
| Distributions declared on other participating securities | 2 | | | — | | | — | |
| Undistributed earnings allocated to participating securities | 7 | | | 16 | | | 24 | |
| Impact of redemption of Series B preferred units | — | | | 5 | | | — | |
| Net Income available to common unitholders | $ | 4,281 | | | $ | 3,808 | | | $ | 3,791 | |
| Weighted average units outstanding: | | | | | |
| Basic | 1,016 | | | 1,001 | | | 1,010 | |
| Diluted | 1,017 | | | 1,002 | | | 1,010 | |
| Net income attributable to MPLX LP per limited partner unit: | | | | | |
| Basic | $ | 4.21 | | | $ | 3.80 | | | $ | 3.75 | |
| Diluted | $ | 4.21 | | | $ | 3.80 | | | $ | 3.75 | |
(1) Allocation of net income attributable to MPLX LP assumes all earnings for the period have been distributed based on the distribution priorities applicable to the period.
9. Series A Preferred Units
Private Placement of Preferred Units
On May 13, 2016, MPLX completed the private placement of approximately 30.8 million 6.5 percent Series A Convertible preferred units for a cash purchase price of $32.50 per unit. The aggregate net proceeds of approximately $984 million from the sale of the Series A preferred units were used for capital expenditures, repayment of debt and general business purposes.
Preferred Unit Distribution Rights
The Series A preferred units rank senior to all common units and pari passu with all Series B preferred units with respect to distributions and rights upon liquidation. The holders of the Series A preferred units are entitled to receive, when and if declared by the board, a quarterly distribution equal to the greater of $0.528125 per unit or the amount of distributions they would have received on an as converted basis, including any supplemental distributions made to common unitholders. On January 22, 2025,
MPLX declared a quarterly cash distribution of $0.9565 per common unit for the fourth quarter of 2024. Holders of the Series A preferred units received the common unit rate in lieu of the lower $0.528125 base amount.
The holders may convert their Series A preferred units into common units at any time, in full or in part, subject to minimum conversion amounts and conditions. After the fourth anniversary of the issuance date, MPLX may convert the Series A preferred units into common units at any time, in whole or in part, subject to certain minimum conversion amounts and conditions, if the closing price of MPLX common units is greater than $48.75 for the 20-day trading period immediately preceding the conversion notice date. The conversion rate for the Series A preferred units shall be the quotient of (a) the sum of (i) $32.50, plus (ii) any unpaid cash distributions on the applicable preferred unit, divided by (b) $32.50, subject to adjustment for unit distributions, unit splits and similar transactions. The holders of the Series A preferred units are entitled to vote on an as-converted basis with the common unitholders and have certain other class voting rights with respect to any amendment to the MPLX partnership agreement that would adversely affect any rights, preferences or privileges of the preferred units. In addition, upon certain events involving a change of control, the holders of preferred units may elect, among other potential elections, to convert their Series A preferred units to common units at the then applicable change of control conversion rate.
Preferred Units Outstanding
During the years ended December 31, 2024 and December 31, 2023, certain Series A preferred unitholders exercised their rights to convert their Series A preferred units into 21 million common units and 2 million common units, respectively. Approximately 6 million Series A preferred units were outstanding as of December 31, 2024. On February 11, 2025, MPLX exercised its right to convert the remaining outstanding Series A preferred units into common units in accordance with the conversion provision discussed above.
Financial Statement Presentation
The Series A preferred units are considered redeemable securities under GAAP due to the existence of redemption provisions upon a deemed liquidation event, which is outside MPLX’s control. Therefore, they are presented as temporary equity in the mezzanine section of the Consolidated Balance Sheets. The Series A preferred units have been recorded at their issuance date fair value, net of issuance costs. Income allocations increase the carrying value and declared distributions decrease the carrying value of the Series A preferred units. As the Series A preferred units are not currently redeemable and not probable of becoming redeemable, adjustment to the initial carrying amount is not necessary and would only be required if it becomes probable that the Series A preferred units would become redeemable.
For a summary of changes in the redeemable preferred balance for the years ended December 31, 2024, 2023 and 2022, see the Consolidated Statements of Equity.
10. Segment Information
MPLX’s chief operating decision maker (“CODM”) is the chief executive officer of its general partner. The CODM reviews MPLX’s discrete financial information, makes operating decisions, assesses financial performance and allocates resources on a product-based value chain basis. As discussed in Note 1, we renamed and modified the composition of our segments in the fourth quarter of 2024. The segment realignment is presented for the year ended December 31, 2024, with prior periods recast for comparability. See Note 1 for additional details. MPLX has two reportable segments: Crude Oil and Products Logistics and Natural Gas and NGL Services. Each of these segments is organized and managed based upon the product-based value chain each supports.
•Crude Oil and Products Logistics – gathers, transports, stores and distributes crude oil, refined products, other hydrocarbon-based products and renewables. Also includes the operation of refining logistics, fuels distribution and inland marine businesses, terminals, rail facilities and storage caverns.
•Natural Gas and NGL Services – gathers, processes and transports natural gas; and transports, fractionates, stores and markets NGLs.
Our CODM evaluates the performance of our segments using Segment Adjusted EBITDA. The CODM uses adjusted EBITDA by segment results when making decisions about allocating capital and personnel as a part of the annual business plan process and ongoing monitoring of performance. Amounts included in net income and excluded from Segment Adjusted EBITDA include: (i) depreciation and amortization; (ii) net interest and other financial costs; (iii) income/(loss) from equity method investments; (iv) distributions and adjustments related to equity method investments; (v) impairment expense; (vi) noncontrolling interests; and (vii) other adjustments as applicable. These items are either: (i) believed to be non-recurring in nature; (ii) not believed to be allocable or controlled by the segment; or (iii) are not tied to the operational performance of the segment. Assets by segment are not a measure used to assess the performance of the Partnership by our CODM and thus are not reported in our disclosures.
The tables below present information about our reportable segments:
| | | | | | | | | | | | | | | | | | | | |
| (In millions) | | 2024 | | 2023 | | 2022 |
| Crude Oil and Products Logistics | | | | | | |
| Service revenue | | $ | 4,543 | | | $ | 4,335 | | | $ | 4,057 | |
| Rental income | | 882 | | | 857 | | | 803 | |
| Product related revenue | | 18 | | | 18 | | | 19 | |
| Sales-type lease revenue | | 475 | | | 500 | | | 465 | |
| Income from equity method investments | | 269 | | | 270 | | | 197 | |
| Other income | | 152 | | | 68 | | | 57 | |
Total segment revenues and other income(1) | | 6,339 | | | 6,048 | | | 5,598 | |
| Operating expenses | | 2,097 | | | 2,006 | | | 1,937 | |
Other segment items(2) | | (133) | | | (92) | | | (100) | |
Segment Adjusted EBITDA(3) | | 4,375 | | | 4,134 | | | 3,761 | |
| Capital expenditures | | 482 | | | 414 | | | 325 | |
Investments in unconsolidated affiliates(4) | | 93 | | | 8 | | | 63 | |
| Natural Gas and NGL Services | | | | | | |
| Service revenue | | 2,407 | | | 2,189 | | | 2,056 | |
| Rental income | | 222 | | | 208 | | | 287 | |
| Product related revenue | | 2,221 | | | 2,191 | | | 2,792 | |
| Sales-type lease revenue | | 136 | | | 136 | | | 62 | |
Income from equity method investments(5) | | 533 | | | 330 | | | 279 | |
Other income(6) | | 75 | | | 179 | | | 539 | |
Total segment revenues and other income(1) | | 5,594 | | | 5,233 | | | 6,015 | |
| Purchased product costs | | 1,561 | | | 1,598 | | | 2,063 | |
| Operating expenses | | 1,704 | | | 1,564 | | | 1,472 | |
Other segment items(2) | | (60) | | | (64) | | | 466 | |
Segment Adjusted EBITDA(3) | | 2,389 | | | 2,135 | | | 2,014 | |
| Capital expenditures | | 568 | | | 605 | | | 528 | |
Investments in unconsolidated affiliates(4) | | $ | 143 | | | $ | 90 | | | $ | 154 | |
(1) Within the total segment revenues and other income amounts presented above, third party revenues for the Crude Oil and Products Logistics segment were $746 million, $701 million and $574 million for the years ended December 31, 2024, 2023 and 2022, respectively. Third party revenues for the Natural Gas and NGL Services segment were $5,297 million, $4,902 million and $5,748 million for the years ended December 31, 2024, 2023 and 2022, respectively.
(2) Other segment items in the Crude Oil and Products Logistics segment include income from equity method investments, distributions and adjustments related to equity method investments, equity-based compensation and other miscellaneous items. Other segment items in the Natural Gas and NGL Services segment include income from equity method investments, distributions and adjustments related to equity method investments, gains on sales-type leases and equity method investments, unrealized derivative gain/loss and other miscellaneous items.
(3) See below for the reconciliation from Segment Adjusted EBITDA to Net income.
(4) Investments in unconsolidated affiliates for the Crude Oil and Products Logistics segment include contributions of $92 million and $60 million for the years ended December 31, 2024 and 2022, respectively, to Dakota Access to fund our share of debt repayments by the joint venture and exclude $18 million related to the acquisition of additional interest in Wink to Webster Pipeline LLC for the year ended December 31, 2024. Investments in unconsolidated affiliates for the Natural Gas and NGL Services segment exclude $210 million related to the acquisition of additional interests in BANGL, LLC for the year ended December 31, 2024.
(5) Includes a $151 million gain related to the dilution of ownership interest in connection with the Whistler Joint Venture Transaction in 2024.
(6) Includes a $92 million gain on remeasurement of our existing equity investment in Torñado in conjunction with the purchase of the remaining joint venture interest in 2023. Includes a $509 million gain on a lease reclassification for the year ended December 31, 2022. See Note 21 in the Consolidated Financial Statements for additional information.
The table below provides a reconciliation of Segment Adjusted EBITDA for reportable segments to Net income.
| | | | | | | | | | | | | | | | | |
| (In millions) | 2024 | | 2023 | | 2022 |
| Reconciliation to Net income: | | | | | |
| Crude Oil and Products Logistics Segment Adjusted EBITDA | $ | 4,375 | | | $ | 4,134 | | | $ | 3,761 | |
| Natural Gas and NGL Services Segment Adjusted EBITDA | 2,389 | | | 2,135 | | | 2,014 | |
| Total reportable segments | 6,764 | | | 6,269 | | | 5,775 | |
Depreciation and amortization(1) | (1,283) | | | (1,213) | | | (1,230) | |
| Net interest and other financial costs | (921) | | | (923) | | | (925) | |
| Income from equity method investments | 802 | | | 600 | | | 476 | |
| Distributions/adjustments related to equity method investments | (928) | | | (774) | | | (652) | |
| Gain on sales-type leases and equity method investments | — | | | 92 | | | 509 | |
| Adjusted EBITDA attributable to noncontrolling interests | 44 | | | 42 | | | 38 | |
Garyville incident response costs(2) | — | | | (16) | | | — | |
Other(3) | (121) | | | (111) | | | (13) | |
| Net income | $ | 4,357 | | | $ | 3,966 | | | $ | 3,978 | |
(1) Depreciation and amortization attributable to Crude Oil and Products Logistics was $526 million, $530 million and $515 million for the years ended December 31, 2024, 2023 and 2022, respectively. Depreciation and amortization attributable to Natural Gas and NGL Services was $757 million, $683 million and $715 million for the years ended December 31, 2024, 2023 and 2022, respectively.
(2) In August 2023, a naphtha release and resulting fire occurred at our Garyville Tank Farm resulting in the loss of four storage tanks with a combined shell capacity of 894 thousand barrels. We incurred $16 million of incident response costs, net of insurance recoveries, during the year ended December 31, 2023.
(3) Includes unrealized derivative gain/(loss), equity-based compensation, provision for income taxes, and other miscellaneous items.
11. Major Customers and Concentration of Credit Risk
The table below shows, by segment, the percentage of total revenues and other income with MPC which is our most significant customer and our largest concentration of credit risk.
| | | | | | | | | | | | | | | | | |
| 2024 | | 2023 | | 2022 |
Total revenues and other income(1) | | | | | |
| Crude Oil and Products Logistics | 88 | % | | 88 | % | | 90 | % |
| Natural Gas and NGL Services | 4 | % | | 5 | % | | 4 | % |
| Total | 49 | % | | 50 | % | | 47 | % |
(1) The percent calculations for the year ended December 31, 2024 exclude a gain of $151 million related to the dilution of ownership interest in connection with the Whistler Joint Venture Transaction. The percent calculations for the year ended December 31, 2023 exclude a $92 million gain associated with the remeasurement of its existing equity investment in Torñado. The percent calculations for the year ended December 31, 2022 exclude a $509 million gain on a lease reclassification.
Revenue from the sale of products purchased after services are provided is reported as Product sales on the Consolidated Statements of Income and recognized on a gross basis, as MPLX takes control of the product and is the principal in the transaction. For the year ended December 31, 2023, revenues with one customer primarily related to these NGL transactions accounted for approximately 10 percent of our total revenues and other income, respectively.
MPLX has a concentration of trade receivables due from customers in the same industry: MPC, integrated oil companies, natural gas exploration and production companies, independent refining companies and other pipeline companies. These concentrations of customers may impact MPLX’s overall exposure to credit risk as they may be similarly affected by changes in economic, regulatory and other factors. MPLX manages its exposure to credit risk through credit analysis, credit limit approvals and monitoring procedures; and for certain transactions, it may request letters of credit, prepayments or guarantees.
12. Inventories
Inventories consist of the following:
| | | | | | | | | | | | | | |
| | December 31, |
| (In millions) | | 2024 | | 2023 |
| NGLs | | $ | 5 | | | $ | 8 | |
| Line fill | | 18 | | | 15 | |
| Spare parts, materials and supplies | | 157 | | | 136 | |
| Total inventories | | $ | 180 | | | $ | 159 | |
13. Property, Plant and Equipment
Property, plant and equipment with associated accumulated depreciation is shown below:
| | | | | | | | | | | | | | | | | | | | |
| | | Estimated
Useful Lives | | December 31, |
| (In millions) | | 2024 | | 2023 |
| Crude Oil and Products Logistics | | | | | | |
| Pipelines | | 15 - 50 years | | $ | 6,627 | | | $ | 6,455 | |
| Refining logistics | | 15 - 20 years | | 1,867 | | | 1,818 | |
| Terminals | | 15 - 40 years | | 1,726 | | | 1,651 | |
| Marine | | 15 - 20 years | | 1,149 | | | 1,100 | |
| Land, building and other | | 5 - 60 years | | 1,619 | | | 1,609 | |
| Construction-in-progress | | | | 201 | | | 146 | |
| Total Crude Oil and Products Logistics property, plant and equipment | | | | 13,189 | | | 12,779 | |
| Natural Gas and NGL Services | | | | | | |
| Gathering and transportation | | 5 - 40 years | | 7,789 | | | 7,484 | |
| Processing and fractionation | | 10 - 40 years | | 6,611 | | | 6,203 | |
| Land, building and other | | 5 - 40 years | | 541 | | | 525 | |
| Construction-in-progress | | | | 274 | | | 394 | |
| Total Natural Gas and NGL Services property, plant and equipment | | | | 15,215 | | | 14,606 | |
| Total property, plant and equipment | | | | 28,404 | | | 27,385 | |
| Less accumulated depreciation | | | | 9,250 | | | 8,121 | |
| Property, plant and equipment, net | | | | $ | 19,154 | | | $ | 19,264 | |
We capitalize interest as part of the cost of major projects during the construction period. Capitalized interest totaled $19 million, $15 million and $9 million for the years ended December 31, 2024, 2023 and 2022, respectively.
14. Goodwill and Intangibles
Goodwill
MPLX annually evaluates goodwill for impairment as of November 30, as well as whenever events or changes in circumstances indicate it is more likely than not that the fair value of a reporting unit with goodwill is less than its carrying amount.
Our reporting units are one level below our operating segments and are determined based on the way in which segment management operates and reviews each operating segment. We have five reporting units, three of which have goodwill allocated to them. For the annual impairment assessment as of November 30, 2024, management performed only a qualitative assessment for two reporting units as we determined it was more likely than not that the fair values of the reporting units exceeded their carrying values. The fair value of the crude gathering reporting unit for which a quantitative assessment was performed was determined based on applying both a discounted cash flow, or income approach, as well as a market approach which resulted in the fair value of the reporting unit exceeding its carrying value by greater than 10 percent.
The significant assumptions used to develop the estimate of the fair value under the discounted cash flow method included management’s best estimates of the discount rate of 8.5 percent as well as estimates of future cash flows, which are impacted primarily by producers’ development plans, which impact future volumes and capital requirements. Fair value determinations require considerable judgment and are sensitive to changes in underlying assumptions and factors. As a result, there can be no assurance that the estimates and assumptions made for purposes of the annual goodwill impairment test will prove to be an accurate prediction of the future. The fair value measurements for the individual reporting units represent Level 3 measurements. Total goodwill at December 31, 2024 was $7,645 million and no impairment was recorded as a result of our November 30, 2024 annual goodwill impairment analysis.
The changes in carrying amount of goodwill were as follows for the periods presented:
| | | | | | | | | | | | | | | | | |
| (In millions) | Crude Oil and Products Logistics | | Natural Gas and NGL Services | | Total |
| Gross goodwill as of December 31, 2022 | $ | 7,645 | | | $ | 3,141 | | | $ | 10,786 | |
| Accumulated impairment losses | — | | | (3,141) | | | (3,141) | |
| Balance as of December 31, 2022 | 7,645 | | | — | | | 7,645 | |
| | | | | |
| | | | | |
| Balance as of December 31, 2023 | 7,645 | | | — | | | 7,645 | |
| | | | | |
| | | | | |
| Balance as of December 31, 2024 | 7,645 | | | — | | | 7,645 | |
| | | | | |
| Gross goodwill as of December 31, 2024 | 7,645 | | | 3,141 | | | 10,786 | |
| Accumulated impairment losses | — | | | (3,141) | | | (3,141) | |
| Balance as of December 31, 2024 | $ | 7,645 | | | $ | — | | | $ | 7,645 | |
Intangible Assets
MPLX’s intangible assets are comprised of customer contracts and relationships. Gross intangible assets with accumulated amortization as of December 31, 2024 and 2023 is shown below:
| | | | | | | | | | | | | | | | | | | | | | | | | | | | | | | | | | | | | | |
| | December 31, 2024 | | December 31, 2023 |
| (In millions) | | Gross | | Accumulated Amortization(1) | | Net | | Gross | | Accumulated Amortization(1) | | Net |
| Crude Oil and Products Logistics | | $ | 283 | | | $ | (224) | | | $ | 59 | | | $ | 283 | | | $ | (189) | | | $ | 94 | |
| Natural Gas and NGL Services | | 1,363 | | | (904) | | | 459 | | | 1,365 | | | (805) | | | 560 | |
| | $ | 1,646 | | | $ | (1,128) | | | $ | 518 | | | $ | 1,648 | | | $ | (994) | | | $ | 654 | |
(1) Amortization expense attributable to the Crude Oil and Products Logistics segment for the years ended December 31, 2024 and 2023 was $35 million and $36 million, respectively. Amortization expense attributable to the Natural Gas and NGL Services segment for the years ended December 31, 2024 and 2023 was $99 million and $92 million, respectively.
Estimated future amortization expense related to the intangible assets at December 31, 2024 is as follows:
| | | | | | | | |
| (In millions) | | |
| 2025 | | $ | 121 | |
| 2026 | | 112 | |
| 2027 | | 84 | |
| 2028 | | 67 | |
| 2029 | | 16 | |
| 2030 and thereafter | | 118 | |
| Total | | $ | 518 | |
15. Fair Value Measurements
Fair Values – Recurring
The following table presents the impact on the Consolidated Balance Sheets of MPLX’s financial instruments carried at fair value on a recurring basis as of December 31, 2024 and 2023 by fair value hierarchy level.
| | | | | | | | | | | | | | | | | | | | | | | |
| December 31, |
| 2024 | | 2023 |
| (In millions) | Asset | | Liability | | Asset | | Liability |
| | | | | | | |
| | | | | | | |
| Embedded derivatives in commodity contracts (Level 3) | | | | | | | |
| Other current assets / Other current liabilities | $ | — | | | $ | 10 | | | $ | — | | | $ | 11 | |
| Other noncurrent assets / Other long-term liabilities | — | | | 48 | | | — | | | 50 | |
| Total carrying value in Consolidated Balance Sheets | $ | — | | | $ | 58 | | | $ | — | | | $ | 61 | |
Level 2 instruments include over-the-counter fixed swaps to mitigate the price risk from our sales of propane under certain percent-of-proceeds and keep-whole arrangements. The swap valuations are based on observable inputs in the form of forward
prices based on Mont Belvieu propane forward spot prices and contain no significant unobservable inputs. All of our Level 2 instruments were settled during 2024. There were no positions outstanding as of December 31, 2024.
Level 3 instruments relate to an embedded derivative liability for a natural gas purchase commitment embedded in a keep-whole processing agreement. The fair value calculation for these Level 3 instruments used significant unobservable inputs including: (1) NGL prices interpolated and extrapolated due to inactive markets ranging from $0.65 to $1.54 per gallon with a weighted average of $0.81 per gallon and (2) a 100 percent probability of renewal for the five-year renewal term of the gas purchase commitment and related keep-whole processing agreement. Increases or decreases in the fractionation spread result in an increase or decrease in the fair value of the embedded derivative liability, respectively.
Changes in Level 3 Fair Value Measurements
The following table is a reconciliation of the net beginning and ending balances recorded for net liabilities classified as Level 3 in the fair value hierarchy.
| | | | | | | | | | | | | | |
| (In millions) | | 2024 | | 2023 |
| Beginning balance | | $ | (61) | | | $ | (61) | |
Unrealized and realized (loss)/gain included in Net Income(1) | | (10) | | | (11) | |
| Settlements | | 13 | | | 11 | |
| | | | |
| Ending balance | | (58) | | | (61) | |
| | | | |
| The amount of total loss for the period included in earnings attributable to the change in unrealized gain relating to liabilities still held at end of period | | $ | (7) | | | $ | (9) | |
(1) (Loss)/gain on derivatives embedded in commodity contracts are recorded in Purchased product costs on the Consolidated Statements of Income.
Fair Values – Non-recurring
Non-recurring fair value measurements and disclosures in 2024 and 2023 relate to acquisitions and other transactions as discussed in Note 4.
Non-recurring fair value measurements and disclosures in 2022 relate primarily to MPLX’s sales-type leases as discussed in Note 21. The net investment in sales-type leases is recorded at the estimated fair value of the underlying leased assets at contract modification date. The leased assets were valued using a cost method valuation approach which utilizes Level 3 inputs.
Fair Values – Reported
We believe the carrying value of our other financial instruments, including cash and cash equivalents, receivables, receivables from related parties, lease receivables, lease receivables from related parties, accounts payable, and payables to related parties, approximate fair value. MPLX’s fair value assessment incorporates a variety of considerations, including the duration of the instruments, MPC’s investment-grade credit rating and the historical incurrence of and expected future insignificance of bad debt expense, which includes an evaluation of counterparty credit risk. The recorded value of the amounts outstanding under the bank revolving credit facility, if any, approximates fair value due to the variable interest rate that approximates current market rates. Derivative instruments are recorded at fair value, based on available market information (see Note 16).
The fair value of MPLX’s debt is estimated based on prices from recent trade activity and is categorized in Level 3 of the fair value hierarchy. The following table summarizes the fair value and carrying value of our third-party debt, excluding finance leases and unamortized debt issuance costs:
| | | | | | | | | | | | | | | | | | | | | | | |
| December 31, |
| 2024 | | 2023 |
| (In millions) | Fair Value | | Carrying Value | | Fair Value | | Carrying Value |
Outstanding debt(1) | $ | 19,574 | | | $ | 21,068 | | | $ | 19,377 | | | $ | 20,547 | |
(1) Any amounts outstanding under the MPC Loan Agreement are not included in the table above, as the carrying value approximates fair value. This balance is reflected in Current liabilities - related parties in the Consolidated Balance Sheets.
16. Derivative Financial Instruments
During the year ended December 31, 2024, MPLX entered into commodity contracts that were executed to manage price risk during 2024. All of those positions were settled during 2024, with the associated gains included in the table below. As of December 31, 2024, MPLX had no outstanding commodity contracts beyond the embedded derivative discussed below.
Embedded Derivative - MPLX has a natural gas purchase commitment embedded in a keep-whole processing agreement with a producer customer in the Southern Appalachia region expiring in December 2027. The customer has the unilateral option to extend the agreement for one five-year term through December 2032. For accounting purposes, the natural gas purchase commitment and the term extending option have been aggregated into a single compound embedded derivative. The probability
of the customer exercising its option is determined based on assumptions about the customer’s potential business strategy decision points that may exist at the time they would elect whether to renew the contract. The changes in fair value of this compound embedded derivative are based on the difference between the contractual and index pricing, the probability of the producer customer exercising its option to extend, and the estimated favorability of these contracts compared to current market conditions. The changes in fair value are recorded in earnings through Purchased product costs in the Consolidated Statements of Income. For further information regarding the fair value measurement of derivative instruments, see Note 15. See Note 2 for a discussion of derivatives MPLX may use and the reasons for them. At December 31, 2024 and 2023, the estimated fair value of this contract was a liability of $58 million and $61 million, respectively.
As of December 31, 2024 and 2023, there were no derivative assets or liabilities that were offset in the Consolidated Balance Sheets.
The impact of MPLX’s derivative contracts not designated as hedging instruments and the location of gains and losses recognized in the Consolidated Statements of Income is summarized below:
| | | | | | | | | | | | | | | | | |
| (In millions) | 2024 | | 2023 | | 2022 |
| Product sales | | | | | |
| Realized gain | $ | 1 | | | $ | 7 | | | $ | — | |
| | | | | |
| Product sales derivative gain | 1 | | | 7 | | | — | |
| Purchased product costs | | | | | |
| Realized loss | (13) | | | (11) | | | (12) | |
| Unrealized gain | 3 | | | — | | | 47 | |
| Purchased product cost derivative (loss)/gain | (10) | | | (11) | | | 35 | |
| | | | | |
| | | | | |
| | | | | |
| | | | | |
| Total derivative (loss)/gain included in Net Income | $ | (9) | | | $ | (4) | | | $ | 35 | |
17. Debt
MPLX’s outstanding borrowings consist of the following: | | | | | | | | | | | |
| | December 31, |
| (In millions) | 2024 | | 2023 |
| MPLX LP: | | | |
| Bank revolving credit facility | $ | — | | | $ | — | |
| 4.875% senior notes due December 1, 2024 | — | | | 1,149 | |
| 4.000% senior notes due February 15, 2025 | 500 | | | 500 | |
| 4.875% senior notes due June 1, 2025 | 1,189 | | | 1,189 | |
| 1.750% senior notes due March 1, 2026 | 1,500 | | | 1,500 | |
| 4.125% senior notes due March 1, 2027 | 1,250 | | | 1,250 | |
| 4.250% senior notes due December 1, 2027 | 732 | | | 732 | |
| 4.000% senior notes due March 15, 2028 | 1,250 | | | 1,250 | |
| 4.800% senior notes due February 15, 2029 | 750 | | | 750 | |
| 2.650% senior notes due August 15, 2030 | 1,500 | | | 1,500 | |
| 4.950% senior notes due September 1, 2032 | 1,000 | | | 1,000 | |
| 5.000% senior notes due March 1, 2033 | 1,100 | | | 1,100 | |
| 5.500% senior notes due June 1, 2034 | 1,650 | | | — | |
| 4.500% senior notes due April 15, 2038 | 1,750 | | | 1,750 | |
| 5.200% senior notes due March 1, 2047 | 1,000 | | | 1,000 | |
| 5.200% senior notes due December 1, 2047 | 487 | | | 487 | |
| 4.700% senior notes due April 15, 2048 | 1,500 | | | 1,500 | |
| 5.500% senior notes due February 15, 2049 | 1,500 | | | 1,500 | |
| 4.950% senior notes due March 14, 2052 | 1,500 | | | 1,500 | |
| 5.650% senior notes due March 1, 2053 | 500 | | | 500 | |
| 4.900% senior notes due April 15, 2058 | 500 | | | 500 | |
| Consolidated subsidiaries: | | | |
| MarkWest - 4.875% senior notes, due 2024-2025 | 11 | | | 12 | |
| ANDX - 4.250% - 5.200% senior notes, due 2027-2047 | 31 | | | 31 | |
Financing lease obligations(1) | 6 | | | 6 | |
| Total | 21,206 | | | 20,706 | |
| Unamortized debt issuance costs | (126) | | | (122) | |
| Unamortized discount | (132) | | | (153) | |
| Amounts due within one year | (1,693) | | | (1,135) | |
| Total long-term debt due after one year | $ | 19,255 | | | $ | 19,296 | |
(1) See Note 21 for lease information.
The following table shows five years of scheduled debt payments, including payments on finance lease obligations, as of December 31, 2024:
| | | | | |
| (In millions) | |
| 2025 | $ | 1,701 | |
| 2026 | 1,501 | |
| 2027 | 2,001 | |
| 2028 | 1,250 | |
| 2029 | $ | 750 | |
Credit Agreement
MPLX Credit Agreement
MPLX’s credit agreement (the “MPLX Credit Agreement”) matures in July 2027 and, among other things, provides for a $2.0 billion unsecured revolving credit facility and letter of credit issuing capacity under the facility of up to $150 million. Letter of credit issuing capacity is included in, not in addition to, the $2.0 billion borrowing capacity. Borrowings under the MPLX Credit Agreement bear interest, at MPLX’s election, at either the Adjusted Term SOFR or the Alternate Base Rate, both as defined in the MPLX Credit Agreement, plus an applicable margin.
The borrowing capacity under the MPLX Credit Agreement may be increased by up to an additional $1.0 billion, subject to certain conditions, including the consent of lenders whose commitments would increase. In addition, the maturity date may be extended,
for up to two additional one year periods, subject to, among other conditions, the approval of lenders holding the majority of the commitments then outstanding, provided that the commitments of any non-consenting lenders will terminate on the then-effective maturity date. MPLX is charged various fees and expenses in connection with the agreement, including administrative agent fees, commitment fees on the unused portion of the facility and fees with respect to issued and outstanding letters of credit. The applicable margins to the benchmark interest rates and certain fees fluctuate based on the credit ratings in effect from time to time on MPLX’s long-term debt.
The MPLX Credit Agreement contains certain representations and warranties, affirmative and restrictive covenants and events of default that MPLX considers to be usual and customary for an agreement of this type, including a financial covenant that requires MPLX to maintain a ratio of Consolidated Total Debt as of the end of each fiscal quarter to Consolidated EBITDA (both as defined in the MPLX Credit Agreement) for the prior four fiscal quarters of no greater than 5.0 to 1.0 (or 5.5 to 1.0 for up to two fiscal quarters following certain acquisitions). Consolidated EBITDA is subject to adjustments, including for certain acquisitions and dispositions completed and capital projects undertaken during the relevant period. Other covenants restrict MPLX and/or certain of its subsidiaries from incurring debt, creating liens on our assets and entering into transactions with affiliates. As of December 31, 2024, MPLX was in compliance with the covenants contained in the MPLX Credit Agreement.
There were no revolver borrowings or repayments under the MPLX Credit Agreement during the years ended December 31, 2024 and 2023.
Senior Notes
Interest on each series of MPLX LP, MarkWest and ANDX senior notes outstanding is payable semi-annually in arrears, according to the table below.
| | | | | | | | |
| Senior Notes | | Interest payable semi-annually in arrears |
| 4.000% senior notes due February 15, 2025 | | February 15th and August 15th |
| 4.875% senior notes due June 1, 2025 | | June 1st and December 1st |
| 1.750% senior notes due March 1, 2026 | | March 1st and September 1st |
| 4.125% senior notes due March 1, 2027 | | March 1st and September 1st |
| 4.250% senior notes due December 1, 2027 | | June 1st and December 1st |
| 4.000% senior notes due March 15, 2028 | | March 15th and September 15th |
| 4.800% senior notes due February 15, 2029 | | February 15th and August 15th |
| 2.650% senior notes due August 15, 2030 | | February 15th and August 15th |
| 4.950% senior notes due September 1, 2032 | | March 1st and September 1st |
| 5.000% senior notes due March 1, 2033 | | March 1st and September 1st |
| 5.500% senior notes due June 1, 2034 | | June 1st and December 1st |
| 4.500% senior notes due April 15, 2038 | | April 15th and October 15th |
| 5.200% senior notes due March 1, 2047 | | March 1st and September 1st |
| 5.200% senior notes due December 1, 2047 | | June 1st and December 1st |
| 4.700% senior notes due April 15, 2048 | | April 15th and October 15th |
| 5.500% senior notes due February 15, 2049 | | February 15th and August 15th |
| 4.950% senior notes due March 14, 2052 | | March 14th and September 14th |
| 5.650% senior notes due March 1, 2053 | | March 1st and September 1st |
| 4.900% senior notes due April 15, 2058 | | April 15th and October 15th |
On May 20, 2024, MPLX issued $1.65 billion aggregate principal amount of the 5.50 percent senior notes due June 2034 (the “2034 Senior Notes”) in an underwritten public offering. The 2034 Senior Notes were offered at a price to the public of 98.778 percent of par, with interest payable semi-annually in arrears, commencing on December 1, 2024. On December 1, 2024, MPLX used $1,150 million of the net proceeds from the issuance of the 2034 Senior Notes to repay all of (i) MPLX’s outstanding $1,149 million aggregate principal amount of 4.875 percent senior notes due December 2024 and (ii) MarkWest’s outstanding $1 million aggregate principal amount of 4.875 percent senior notes due December 2024. On February 18, 2025, MPLX used the remaining net proceeds from the issuance of the 2034 Senior Notes to repay all of MPLX’s outstanding $500 million aggregate principal amount of 4.000 percent senior notes due February 2025.
On February 9, 2023, MPLX issued $1.6 billion aggregate principal amount of notes, consisting of $1.1 billion principal amount of 5.00 percent senior notes due 2033 (the “2033 Senior Notes”) and $500 million principal amount of 5.65 percent senior notes due 2053 (the “2053 Senior Notes”). The 2033 Senior Notes were offered at a price to the public of 99.170 percent of par with interest payable semi-annually in arrears, commencing on September 1, 2023. The 2053 Senior Notes were offered at a price to the public of 99.536 percent of par with interest payable semi-annually in arrears, commencing on September 1, 2023. On February 15, 2023, MPLX used $600 million of the net proceeds to redeem all of the outstanding Series B preferred units. On March 13, 2023, MPLX used the remaining proceeds and cash on hand, to redeem all of MPLX’s and MarkWest’s $1.0 billion aggregate principal amount of 4.50 percent senior notes due July 2023, at par, plus accrued and unpaid interest. The redemption resulted in a loss of $9 million due to the immediate expense recognition of unamortized debt discount and issuance costs, which is included on the Consolidated Statements of Income as Net interest and other financial costs.
Subordination of Senior Notes
The MPLX senior notes are direct, unsecured unsubordinated obligations of MPLX LP. As such, they rank equally in right of payment with all of MPLX LP’s other unsubordinated debt and are not guaranteed by any of MPLX LP’s subsidiaries. The MPLX notes are effectively junior to MPLX LP’s secured indebtedness, if any, to the extent of the value of the relevant collateral. The MPLX notes are not obligations of any of MPLX’s subsidiaries and are effectively subordinated to all indebtedness and other obligations of such subsidiaries. The MPLX notes may be redeemed, in whole or part, at any time at the option of MPLX at a redemption price specified in the indenture governing the applicable notes, plus accrued and unpaid interest to the redemption date. The indenture governing the MPLX senior notes does not limit the amount of debt that MPLX may issue under the indenture, nor the amount of other debt that MPLX or any of its subsidiaries may issue or guaranty.
The ANDX senior notes are non-recourse to MPLX and its subsidiaries other than ANDX, the general partner of ANDX and other subsidiaries, if any, of ANDX that are a co-issuer or guarantor of the ANDX senior notes. The MarkWest senior notes are non-recourse to MPLX and its subsidiaries other than MarkWest, the general partner of MarkWest and other subsidiaries, if any, of MarkWest that are a co-issuer or guarantor of the MarkWest senior notes.
18. Net Interest and Other Financial Costs
Net interest and other financial costs were as follows:
| | | | | | | | | | | | | | | | | | | | |
| (In millions) | | 2024 | | 2023 | | 2022 |
| Interest expense | | $ | 963 | | | $ | 912 | | | $ | 852 | |
| Other financial costs | | 72 | | | 69 | | | 81 | |
| Interest income | | (95) | | | (43) | | | (4) | |
| Capitalized interest | | (19) | | | (15) | | | (9) | |
| Related-party interest and other financial costs | | — | | | — | | | 5 | |
| Net interest and other financial costs | | $ | 921 | | | $ | 923 | | | $ | 925 | |
19. Revenue
Disaggregation of Revenue
The following tables represent a disaggregation of revenue for each reportable segment for the years ended December 31, 2024, 2023 and 2022:
| | | | | | | | | | | | | | | | | |
| 2024 |
| (In millions) | Crude Oil and Products Logistics | | Natural Gas and NGL Services | | Total |
| Revenues and other income: | | | | | |
| Service revenue | $ | 391 | | | $ | 2,379 | | | $ | 2,770 | |
| Service revenue - related parties | 4,152 | | | 28 | | | 4,180 | |
| Service revenue - product related | — | | | 357 | | | 357 | |
| Product sales | 5 | | | 1,652 | | | 1,657 | |
| Product sales - related parties | 13 | | | 212 | | | 225 | |
| Total revenues from contracts with customers | $ | 4,561 | | | $ | 4,628 | | | 9,189 | |
Non-ASC 606 revenue(1) | | | | | 2,744 | |
| Total revenues and other income | | | | | $ | 11,933 | |
| | | | | | | | | | | | | | | | | |
| 2023 |
| (In millions) | Crude Oil and Products Logistics | | Natural Gas and NGL Services | | Total |
| Revenues and other income: | | | | | |
| Service revenue | $ | 369 | | | $ | 2,170 | | | $ | 2,539 | |
| Service revenue - related parties | 3,966 | | | 19 | | | 3,985 | |
| Service revenue - product related | — | | | 294 | | | 294 | |
| Product sales | 5 | | | 1,660 | | | 1,665 | |
| Product sales - related parties | 13 | | | 237 | | | 250 | |
| Total revenues from contracts with customers | $ | 4,353 | | | $ | 4,380 | | | 8,733 | |
Non-ASC 606 revenue(1) | | | | | 2,548 | |
| Total revenues and other income | | | | | $ | 11,281 | |
| | | | | | | | | | | | | | | | | |
| 2022 |
| (In millions) | Crude Oil and Products Logistics | | Natural Gas and NGL Services | | Total |
| Revenues and other income: | | | | | |
| Service revenue | $ | 320 | | | $ | 2,039 | | | $ | 2,359 | |
| Service revenue - related parties | 3,737 | | | 17 | | | 3,754 | |
| Service revenue - product related | — | | | 394 | | | 394 | |
| Product sales | 6 | | | 2,213 | | | 2,219 | |
| Product sales - related parties | 13 | | | 185 | | | 198 | |
| Total revenues from contracts with customers | $ | 4,076 | | | $ | 4,848 | | | 8,924 | |
Non-ASC 606 revenue(1) | | | | | 2,689 | |
| Total revenues and other income | | | | | $ | 11,613 | |
(1) Non-ASC 606 Revenue includes rental income, sales-type lease revenue, income from equity method investments, and other income.
Contract Balances
Our receivables are primarily associated with customer contracts. Payment terms vary by product or service type; however, the period between invoicing and payment is not significant. Included within the receivables are balances related to commodity sales on behalf of our producer customers, for which we remit the net sales price back to the producer customers upon completion of the sale.
Under certain of our contracts, we recognize revenues in excess of billings which we present as contract assets. Contract assets typically relate to deficiency payments related to minimum volume commitments and aid in construction agreements where the revenue recognized and MPLX’s rights to consideration for work completed exceeds the amount billed to the customer. Contract assets are included in Other current assets and Other noncurrent assets on the Consolidated Balance Sheets.
Under certain of our contracts, we receive payments in advance of satisfying our performance obligations, which are recorded as contract liabilities. Contract liabilities, which we present as Deferred revenue and Long-term deferred revenue, typically relate to advance payments for aid in construction agreements and deferred customer credits associated with makeup rights and minimum volume commitments. Related to minimum volume commitments, breakage is estimated and recognized into service revenue in instances where it is probable the customer will not use the credit in future periods. We classify contract liabilities as current or long-term based on the timing of when we expect to recognize revenue.
The tables below reflect the changes in ASC 606 contract balances for the years ended December 31, 2024 and 2023:
| | | | | | | | | | | | | | | | | | | | | | | |
| (In millions) | Balance at
December 31, 2023 | | Additions/ (Deletions) | | Revenue Recognized(1) | | Balance at
December 31, 2024 |
| Contract assets | $ | 3 | | | $ | — | | | $ | (1) | | | $ | 2 | |
| Long-term contract assets | 1 | | | (1) | | | — | | | — | |
| Deferred revenue | 59 | | | 86 | | | (61) | | | 84 | |
| Deferred revenue - related parties | 47 | | | 90 | | | (66) | | | 71 | |
| Long-term deferred revenue | 344 | | | (29) | | | — | | | 315 | |
| Long-term deferred revenue - related parties | $ | 29 | | | $ | 15 | | | $ | — | | | $ | 44 | |
| | | | | | | |
| | | | | | | | | | | | | | | | | | | | | | | |
| (In millions) | Balance at
December 31, 2022 | | Additions/ (Deletions) | | Revenue Recognized(1) | | Balance at
December 31, 2023 |
| Contract assets | $ | 21 | | | $ | (18) | | | $ | — | | | $ | 3 | |
| Long-term contract assets | 1 | | | — | | | — | | | 1 | |
| Deferred revenue | 57 | | | 42 | | | (40) | | | 59 | |
| Deferred revenue - related parties | 63 | | | 86 | | | (102) | | | 47 | |
| Long-term deferred revenue | 216 | | | 128 | | | — | | | 344 | |
| Long-term deferred revenue - related parties | 25 | | | 4 | | | — | | | 29 | |
| Long-term contract liabilities | $ | 2 | | | $ | (2) | | | $ | — | | | $ | — | |
(1) No significant revenue was recognized related to past performance obligations in the current periods.
Remaining Performance Obligations
The table below includes estimated revenue expected to be recognized in the future related to performance obligations that are unsatisfied (or partially unsatisfied) as of December 31, 2024. The amounts presented below are generally limited to fixed consideration from contracts with customers that contain minimum volume commitments.
A significant portion of our future contracted revenue is excluded from the amounts presented below in accordance with ASC 606. Variable consideration that is constrained or not required to be estimated as it reflects our efforts to perform is excluded from this disclosure. Additionally, we do not disclose information on the future performance obligations for any contract with an original expected duration of one year or less, or that are terminable by our customer with little or no termination penalties. Potential future performance obligations related to renewals that have not yet been exercised or are not certain of exercise are excluded from the amounts presented below. Revenues classified as Rental income and Sales-type lease revenue are also excluded from this table as they are disclosed in Note 21.
| | | | | |
| (In billions) | |
| 2025 | $ | 2.2 | |
| 2026 | 2.0 | |
| 2027 | 1.8 | |
| 2028 | 0.6 | |
| 2029 | 0.3 | |
| 2030 and thereafter | 0.5 | |
| Total revenue on remaining performance obligations | $ | 7.4 | |
As of December 31, 2024, unsatisfied performance obligations included in the Consolidated Balance Sheets are $514 million and will be recognized as revenue as the obligations are satisfied, which is generally expected to occur over the next 19 years. A portion of this amount is not disclosed in the table above as it is deemed variable consideration due to volume variability.
20. Supplemental Cash Flow Information
| | | | | | | | | | | | | | | | | | | | |
| (In millions) | | 2024 | | 2023 | | 2022 |
| Net cash provided by operating activities included: | | | | | | |
| Interest paid (net of amounts capitalized) | | $ | 940 | | | $ | 893 | | | $ | 813 | |
| Income taxes paid | | 6 | | | 7 | | | 3 | |
| Cash paid for amounts included in the measurement of lease liabilities: | | | | | | |
| Payments on operating leases | | 71 | | | 71 | | | 73 | |
| | | | | | |
| Net cash provided by financing activities included: | | | | | | |
| Principal payments under finance lease obligations | | 1 | | | 1 | | | 2 | |
| Non-cash investing and financing activities: | | | | | | |
| Net transfers of property, plant and equipment (to)/from materials and supplies inventories | | — | | | (8) | | | (1) | |
| ROU assets obtained in exchange for new operating lease obligations | | 47 | | | 21 | | | 78 | |
| ROU assets obtained in exchange for new finance lease obligations | | 1 | | | — | | | 1 | |
Book value of equity method investment(1) | | 4 | | | 311 | | | — | |
| | | | | | |
| | | | | | |
| | | | | | |
| | | | | | |
| | | | | | |
| | | | | | |
(1) Represents the book value of MPLX’s equity method investment in OCC in 2024 and Torñado in 2023 prior to MPLX buying out the remaining interest in these entities. See Note 4 for additional information.
The Consolidated Statements of Cash Flows exclude changes to the Consolidated Balance Sheets that did not affect cash. The following is a reconciliation of additions to property, plant and equipment to total capital expenditures:
| | | | | | | | | | | | | | | | | | | | |
| (In millions) | | 2024 | | 2023 | | 2022 |
| Additions to property, plant and equipment | | $ | 1,056 | | | $ | 937 | | | $ | 806 | |
| (Decrease)/Increase in capital accruals | | (6) | | | 82 | | | 47 | |
| | | | | | |
| Total capital expenditures | | $ | 1,050 | | | $ | 1,019 | | | $ | 853 | |
21. Leases
Lessee
We lease a wide variety of facilities and equipment under leases from third parties, including land and building space, office and field equipment, storage facilities and transportation equipment, while our related party leases primarily relate to ground leases associated with our refining logistics assets. Our remaining lease terms range from less than one year to 94 years. Some long-term leases include renewal options ranging from one year to 50 years and, in certain leases, also include purchase options. Renewal options and termination options were not included in the measurement of ROU assets and lease liabilities since it was determined they were not reasonably certain to be exercised.
The components of lease cost were as follows:
| | | | | | | | | | | | | | | | | | | | | | | | | | | | | | | | | | | |
| 2024 | | 2023 | | 2022 |
| (In millions) | Related Party | | Third
Party | | Related
Party | | Third
Party | | Related
Party | | Third
Party |
| Components of lease costs: | | | | | | | | | | | |
| Operating lease costs | $ | 14 | | | $ | 58 | | | $ | 14 | | | $ | 56 | | | $ | 15 | | | $ | 61 | |
| Finance lease cost: | | | | | | | | | | | |
| Amortization of ROU assets | — | | | 1 | | | — | | | 1 | | | — | | | 1 | |
| Interest on lease liabilities | — | | | — | | | — | | | — | | | — | | | 1 | |
| Total finance lease cost | — | | | 1 | | | — | | | 1 | | | — | | | 2 | |
| | | | | | | | | | | |
| Variable lease cost | 4 | | | 12 | | | 4 | | | 10 | | | 2 | | | 16 | |
| Short-term lease cost | 1 | | | 71 | | | 1 | | | 61 | | | — | | | 45 | |
| Total lease cost | $ | 19 | | | $ | 142 | | | $ | 19 | | | $ | 128 | | | $ | 17 | | | $ | 124 | |
Supplemental balance sheet data related to leases were as follows:
| | | | | | | | | | | | | | | | | | | | | | | |
| December 31, 2024 | | December 31, 2023 |
| (In millions, except % and years) | Related Party | | Third Party | | Related Party | | Third Party |
| Operating leases | | | | | | | |
| Assets | | | | | | | |
| Right of use assets | $ | 226 | | | $ | 273 | | | $ | 227 | | $ | 264 |
| Liabilities | | | | | | | |
| Operating lease liabilities | 2 | | | 45 | | | 1 | | 45 |
| Long-term operating lease liabilities | 224 | | | 217 | | | 226 | | 211 |
| Total operating lease liabilities | $ | 226 | | | $ | 262 | | | $ | 227 | | $ | 256 |
| Weighted average remaining lease term | 42 years | | 8 years | | 43 years | | 9 years |
| Weighted average discount rate | 5.8 | % | | 4.2 | % | | 5.8 | % | | 4.2 | % |
| | | | | | | |
| Finance leases | | | | | | | |
| Assets | | | | | | | |
| Property, plant and equipment, gross | | | $ | 10 | | | | | $ | 10 |
| Less: Accumulated depreciation | | | 5 | | | | | 5 |
| Property, plant and equipment, net | | | 5 | | | | | 5 |
| Liabilities | | | | | | | |
| Long-term debt due within one year | | | 1 | | | | | 1 |
| Long-term debt | | | 5 | | | | | 5 |
| Total finance lease liabilities | | | $ | 6 | | | | | $ | 6 |
| Weighted average remaining lease term | | | 22 years | | | | 20 years |
| Weighted average discount rate | | | 6.0 | % | | | | 6.0 | % |
As of December 31, 2024, maturities of lease liabilities for operating lease obligations and finance lease obligations having initial or remaining non-cancellable lease terms in excess of one year are as follows:
| | | | | | | | | | | | | | | | | |
| (In millions) | Related Party Operating
Leases | | Third Party Operating
Leases | | Finance
Leases |
| 2025 | $ | 15 | | | $ | 55 | | | $ | 2 | |
| 2026 | 15 | | | 48 | | | 2 | |
| 2027 | 14 | | | 40 | | | 1 | |
| 2028 | 14 | | | 37 | | | — | |
| 2029 | 14 | | | 30 | | | — | |
| 2030 and thereafter | 532 | | | 97 | | | 7 | |
| Gross lease payments | 604 | | | 307 | | | 12 | |
| Less: Imputed interest | 378 | | | 45 | | | 6 | |
| Total lease liabilities | $ | 226 | | | $ | 262 | | | $ | 6 | |
Lessor
Certain fee-based transportation and storage services agreements with MPC and third parties and certain fee-based natural gas transportation and processing agreements with third parties are accounted for as operating leases under ASC 842. These agreements have remaining terms ranging from less than one year to 11 years with renewal options ranging from one year to five years, with some agreements having multiple renewal options.
MPLX did not elect to use the practical expedient to combine lease and non-lease components for lessor arrangements. The tables below represent the portion of the contract allocated to the lease component based on relative standalone selling price. We elected the practical expedient to carry forward historical classification conclusions until a modification of an existing agreement occurs. Once a modification occurs, the amended agreement is required to be assessed under ASC 842, to determine whether a reclassification of the lease is required.
Lease revenues included on the Consolidated Statements of Income during 2024, 2023 and 2022 were as follows:
| | | | | | | | | | | | | | | | | | | | | | | | | | | | | | | | | | | |
| 2024 | | 2023 | | 2022 |
| (In millions) | Related Party | | Third
Party | | Related Party | | Third
Party | | Related Party | | Third
Party |
| Operating leases: | | | | | | | | | | | |
| Rental income | $ | 853 | | | $ | 251 | | | $ | 822 | | | $ | 243 | | | $ | 763 | | | $ | 327 | |
| Sales-type leases: | | | | | | | | | | | |
| | | | | | | | | | | |
| Interest income (Sales-type rental revenue - fixed minimum) | 455 | | | 114 | | | 467 | | | 114 | | | 447 | | | 46 | |
| Interest income (Revenue from variable lease payments) | 20 | | | 22 | | | 33 | | | 22 | | | 18 | | | 16 | |
| Sales-type lease revenue | $ | 475 | | | $ | 136 | | | $ | 500 | | | $ | 136 | | | $ | 465 | | | $ | 62 | |
During the third quarter of 2022, the approved expansion of a gathering and compression system triggered the first assessment of the related third-party agreement under ASC 842. Additionally, during the year ended December 31, 2022, we executed amendments to certain related party storage, transportation and terminal service agreements between MPLX and MPC to provide for reimbursements for projects, changes to minimum volume commitments or to extend the term of the agreement. The changes required the embedded leases within these agreements to be reassessed under ASC 842. As a result of these lease assessments, certain leases were reclassified from an operating lease to a sales-type lease. Accordingly, the underlying property, plant and equipment, net, and associated deferred revenue, if any, were derecognized and the present value of the future lease payments and the unguaranteed residual value of the assets were recorded as a net investment in sales-type lease during the respective periods.
The following presents the consolidated financial statement impact of related-party and third-party sales-type leases, on commencement or modification date. These transactions, including any related gains recognized in the Consolidated Statements of Income, were non-cash transactions. There were no significant transactions to report for the years ended December 31, 2024 and December 31, 2023.
| | | | | | | | | | | | | | | |
| | | 2022 |
| (In millions) | | | | | Related Party(1) | | Third Party(2) |
| Lease receivables | | | | | $ | 87 | | | $ | 914 | |
| Unguaranteed residual assets | | | | | 6 | | | 63 | |
| Property, plant and equipment, net | | | | | (50) | | | (745) | |
| Deferred revenue | | | | | — | | | 277 | |
| Amount recognized on commencement date | | | | | $ | 43 | | | $ | 509 | |
(1) The amount recognized on commencement date was recorded as a Contribution from MPC in the Consolidated Statements of Equity given the underlying agreements are between entities under common control.
(2) The amount recognized on commencement date was recorded as a gain in Other income in the Consolidated Statements of Income.
The following is a schedule of minimum future rental payments to be received on the non-cancellable operating leases as of December 31, 2024:
| | | | | | | | | | | | | | | | | |
| (In millions) | Related Party | | Third Party | | Total |
| 2025 | $ | 759 | | | $ | 98 | | | $ | 857 | |
| 2026 | 734 | | | 77 | | | 811 | |
| 2027 | 618 | | | 55 | | | 673 | |
| 2028 | 332 | | | 47 | | | 379 | |
| 2029 | 182 | | | 46 | | | 228 | |
| 2030 and thereafter | 235 | | | 214 | | | 449 | |
| Total minimum future rentals | $ | 2,860 | | | $ | 537 | | | $ | 3,397 | |
Annual minimum undiscounted lease payment receipts under our sales-type leases were as follows as of December 31, 2024:
| | | | | | | | | | | | | | | | | | | | | |
| (In millions) | Related Party | | Third Party | | Total | | | | |
| 2025 | $ | 496 | | | $ | 172 | | | $ | 668 | | | | | |
| 2026 | 479 | | | 157 | | | 636 | | | | | |
| 2027 | 381 | | | 147 | | | 528 | | | | | |
| 2028 | 107 | | | 138 | | | 245 | | | | | |
| 2029 | 56 | | | 130 | | | 186 | | | | | |
| 2030 and thereafter | 119 | | | 896 | | | 1,015 | | | | | |
| Total minimum future rentals | 1,638 | | | 1,640 | | | 3,278 | | | | | |
| Less: Imputed interest | 757 | | | 707 | | | 1,464 | | | | | |
Lease receivable(1) | $ | 881 | | | $ | 933 | | | $ | 1,814 | | | | | |
| | | | | | | | | |
Current lease receivables(2) | $ | 204 | | | $ | 102 | | | $ | 306 | | | | | |
Long-term lease receivables(3) | 677 | | | 831 | | | 1,508 | | | | | |
Unguaranteed residual assets(3) | 189 | | | 95 | | | 284 | | | | | |
| Total sales-type lease assets | $ | 1,070 | | | $ | 1,028 | | | $ | 2,098 | | | | | |
(1) This amount does not include the unguaranteed residual assets.
(2) The related-party balance is presented in Current assets - related parties and the third-party balance is presented in Receivables, net in the Consolidated Balance Sheets.
(3) The related-party balance is presented in Noncurrent assets - related parties and the third-party balance is presented in Other noncurrent assets in the Consolidated Balance Sheets.
The following schedule summarizes MPLX’s investment in assets held under operating lease by major classes as of December 31, 2024 and 2023:
| | | | | | | | | | | |
| December 31, |
| (In millions) | 2024 | | 2023 |
| Pipelines | $ | 689 | | | $ | 677 | |
| Refining logistics | 1,430 | | | 1,399 | |
| Terminals | 1,310 | | | 1,267 | |
| Marine | 126 | | | 126 | |
| Gathering and transportation | 86 | | | 86 | |
| Processing and fractionation | 1,039 | | | 1,000 | |
| Land, building and other | 171 | | | 165 | |
| Total property, plant and equipment | 4,851 | | | 4,720 | |
| Less: accumulated depreciation | 2,378 | | | 2,124 | |
| Property, plant and equipment, net | $ | 2,473 | | | $ | 2,596 | |
Capital expenditures related to assets subject to sales-type lease arrangements were $159 million, $85 million and $72 million for the years ended December 31, 2024, 2023 and 2022, respectively. These amounts are reflected as Additions to property, plant and equipment in the Consolidated Statements of Cash Flows.
22. Commitments and Contingencies
MPLX is the subject of, or a party to, a number of pending or threatened legal actions, contingencies and commitments involving a variety of matters, including laws and regulations relating to the environment. Some of these matters are discussed below. For matters for which MPLX has not recorded a liability, MPLX is unable to estimate a range of possible loss because the issues involved have not been fully developed through pleadings, discovery or court proceedings. However, the ultimate resolution of some of these contingencies could, individually or in the aggregate, be material.
Environmental Matters
MPLX is subject to federal, state and local laws and regulations relating to the environment. These laws generally provide for control of pollutants released into the environment and require responsible parties to undertake remediation of hazardous waste disposal sites. Penalties may be imposed for non-compliance.
At December 31, 2024 and 2023, accrued liabilities for remediation totaled $15 million and $19 million, respectively. It is not presently possible to estimate the ultimate amount of all remediation costs that might be incurred or the penalties, if any, that may be imposed.
MPLX is involved in environmental enforcement matters arising in the ordinary course of business. While the outcome and impact to MPLX cannot be predicted with certainty, management believes the resolution of these environmental matters will not, individually or collectively, have a material adverse effect on its consolidated results of operations, financial position or cash flows.
Other Legal Proceedings
In July 2020, Tesoro High Plains Pipeline Company, LLC (“THPP”), a subsidiary of MPLX, received a Notification of Trespass Determination from the Bureau of Indian Affairs (“BIA”) relating to a portion of the Tesoro High Plains Pipeline that crosses the Fort Berthold Reservation in North Dakota. The notification demanded the immediate cessation of pipeline operations and assessed trespass damages of approximately $187 million. After subsequent appeal proceedings and in compliance with a new order issued by the BIA, in December 2020, THPP paid approximately $4 million in assessed trespass damages and ceased use of the portion of the pipeline that crosses the property at issue. In March 2021, the BIA issued an order purporting to vacate the BIA's prior orders related to THPP’s alleged trespass and direct the Regional Director of the BIA to reconsider the issue of THPP’s alleged trespass and issue a new order. In April 2021, THPP filed a lawsuit in the District of North Dakota against the United States of America, the U.S. Department of the Interior and the BIA (collectively, the “U.S. Government Parties”) challenging the March 2021 order purporting to vacate all previous orders related to THPP’s alleged trespass. On February 8, 2022, the U.S. Government Parties filed their answer and counterclaims to THPP’s suit claiming THPP is in continued trespass with respect to the pipeline and seek disgorgement of pipeline profits from June 1, 2013 to present, removal of the pipeline and remediation. On November 8, 2023, the District Court of North Dakota granted THPP’s motion to sever and stay the U.S. Government Parties’ counterclaims. The case will proceed on the merits of THPP’s challenge to the March 2021 order purporting to vacate all previous orders related to THPP’s alleged trespass. THPP continues not to operate that portion of the pipeline that crosses the property at issue.
MPLX is also a party to a number of other lawsuits and other proceedings arising in the ordinary course of business. While the ultimate outcome and impact to MPLX cannot be predicted with certainty, management believes the resolution of these other lawsuits and proceedings will not, individually or collectively, have a material adverse effect on its consolidated financial position, results of operations or cash flows.
Guarantees
Over the years, MPLX has sold various assets in the normal course of its business. Certain of the related agreements contain performance and general guarantees, including guarantees regarding inaccuracies in representations, warranties, covenants and agreements, and environmental and general indemnifications that require MPLX to perform upon the occurrence of a triggering event or condition. These guarantees and indemnifications are part of the normal course of selling assets. MPLX is typically not able to calculate the maximum potential amount of future payments that could be made under such contractual provisions because of the variability inherent in the guarantees and indemnities. Most often, the nature of the guarantees and indemnities is such that there is no appropriate method for quantifying the exposure because the underlying triggering event has little or no past experience upon which a reasonable prediction of the outcome can be based.
Dakota Access
We hold a 9.19 percent indirect interest in Dakota Access, which owns and operates the Bakken Pipeline system. In 2020, the U.S. District Court for the District of Columbia (the “D.D.C.”) ordered the United States Army Corps of Engineers (“Army Corps”), which granted permits and an easement for the Bakken Pipeline system, to prepare an environmental impact statement (“EIS”) relating to an easement under Lake Oahe in North Dakota. The D.D.C. later vacated the easement. The Army Corps issued a draft EIS in September 2023 detailing various options for the easement going forward, including denying the easement, approving the easement with additional measures, rerouting the easement, or approving the easement with no changes. The Army Corps has not selected a preferred alternative, but will make a decision in its final review, after considering input from the
public and other agencies. The pipeline remains operational while the Army Corps finalizes its decision which will follow the issuance of the final EIS. According to public statements from Army Corps officials, the EIS is now expected to be issued in 2025.
We have entered into a Contingent Equity Contribution Agreement whereby MPLX LP, along with the other joint venture owners in the Bakken Pipeline system, has agreed to make equity contributions to the joint venture upon certain events occurring to allow the entities that own and operate the Bakken Pipeline system to satisfy their senior note payment obligations. The senior notes were issued to repay amounts owed by the pipeline companies to fund the cost of construction of the Bakken Pipeline system.
If the vacatur of the easement results in a temporary shutdown of the pipeline, MPLX would have to contribute its 9.19 percent pro rata share of funds required to pay interest accruing on the notes and any portion of the principal that matures while the pipeline is shut down. MPLX also expects to contribute its 9.19 percent pro rata share of any costs to remediate any deficiencies to reinstate the easement and/or return the pipeline into operation. If the vacatur of the easement results in a permanent shutdown of the pipeline, MPLX would have to contribute its 9.19 percent pro rata share of the cost to redeem the bonds (including the one percent redemption premium required pursuant to the indenture governing the notes) and any accrued and unpaid interest. As of December 31, 2024, our maximum potential undiscounted payments under the Contingent Equity Contribution Agreement were approximately $78 million.
WPC Parent, LLC
MPLX’s maximum exposure to loss for WPC Parent, LLC includes an $82 million commitment to indemnify a joint venture member for our pro rata share of any payments made under a performance guarantee for construction of a pipeline by an equity method investee.
Contractual Commitments and Contingencies
At December 31, 2024, MPLX’s contractual commitments to acquire property, plant and equipment totaled $128 million. In addition, from time to time and in the ordinary course of business, MPLX and its affiliates provide guarantees of MPLX’s subsidiaries payment and performance obligations in the Natural Gas and NGL Services segment. Certain natural gas processing and gathering arrangements require MPLX to construct new natural gas processing plants, natural gas gathering pipelines and NGL pipelines and contain certain fees and charges if specified construction milestones are not achieved for reasons other than force majeure. In certain cases, certain producers may have the right to cancel the processing arrangements if there are significant delays that are not due to force majeure. As of December 31, 2024, management does not believe there are any indications that MPLX will not be able to meet the construction milestones, that force majeure does not apply or that such fees and charges will otherwise be triggered.
Other Contractual Obligations
MPLX executed various third-party transportation, terminalling, and gathering and processing agreements that obligate us to minimum volume, throughput or payment commitments over the remaining terms, which range from less than one year to seven years. After the minimum volume commitments are met in these agreements, MPLX pays additional amounts based on throughput. These agreements may include escalation clauses based on various inflationary indices; however, those potential increases have not been incorporated in minimum fees due under these agreements presented below. The minimum future payments under these agreements as of December 31, 2024 are as follows:
| | | | | |
| (In millions) | |
| 2025 | $ | 166 | |
| 2026 | 152 | |
| 2027 | 136 | |
| 2028 | 125 | |
| 2029 | 87 | |
| 2030 and thereafter | 9 | |
| Total | $ | 675 | |
Item 9. Changes in and Disagreements with Accountants on Accounting and Financial Disclosures
None.
Item 9A. Controls and Procedures
Disclosure Controls and Procedures
An evaluation of the effectiveness of the design and operation of our disclosure controls and procedures (as defined in Rules 13a-15(e) and 15d-15(e) under the Securities Exchange Act of 1934, as amended) was carried out under the supervision and with the participation of our management, including the chief executive officer and chief financial officer of our general partner. Based upon that evaluation, the chief executive officer and chief financial officer of our general partner concluded that the design and operation of these disclosure controls and procedures were effective as of December 31, 2024, the end of the period covered by this Annual Report on Form 10-K.
Changes in Internal Control over Financial Reporting
Our “Management’s Report on Internal Control over Financial Reporting” and the “Report of Independent Registered Public Accounting Firm” are set forth in Item 8.
During the quarter ended December 31, 2024, there were no changes in our internal control over financial reporting that have materially affected, or are reasonably likely to materially affect, our internal control over financial reporting.
Item 9B. Other Information
During the quarter ended December 31, 2024, no director or officer (as defined in Rule 16a-1(f) promulgated under the Exchange Act) of MPLX adopted or terminated a “Rule 10b5-1 trading arrangement” or “non-Rule 10b5-1 trading arrangement” (as each term is defined in Item 408 of Regulation S-K).
Item 9C. Disclosures Regarding Foreign Jurisdictions that Prevent Inspections
Not applicable.
PART III
Item 10. Directors, Executive Officers and Corporate Governance
MANAGEMENT OF MPLX LP
MPLX GP LLC, our general partner, is a wholly owned subsidiary of MPC. Our general partner manages our operations and activities through its directors and executive officers. Our unitholders do not nominate candidates for, or vote for the election of, the directors of our general partner. Through its indirect ownership of all of the membership interests in our general partner, MPC elects all members of our general partner’s board of directors (the “Board”). Directors are elected by the sole member of our general partner and hold office until their successors have been elected or qualified or until their earlier death, resignation, removal or disqualification. Our general partner’s executive officers are appointed by, and serve at the discretion of, the Board.
References in this Part III to our “Board,” “directors” or “officers” refer to the Board, directors and officers of our general partner.
Neither we nor our subsidiaries directly employ any employees. Our general partner has the sole responsibility for providing the employees and other personnel necessary to conduct our operations. All of the employees who conduct our business are directly employed by affiliates of our general partner, but we sometimes refer to these individuals as our employees for ease of reference.
DIRECTORS AND EXECUTIVE OFFICERS OF MPLX GP LLC
Following is information about the directors, executive officers and corporate officers of MPLX GP LLC:
| | | | | | | | | | | | | | |
| Name | | Age as of February 1, 2025 | | Position with MPLX GP LLC |
| | | | |
| Maryann T. Mannen | | 62 | | Director, President and Chief Executive Officer |
| Michael J. Hennigan | | 65 | | Executive Chairman of the Board of Directors |
| C. Kristopher Hagedorn | | 48 | | Director, Executive Vice President and Chief Financial Officer |
| Christine S. Breves | | 68 | | Director |
| Christopher A. Helms | | 70 | | Director |
| | | | |
| Garry L. Peiffer | | 73 | | Director |
| John J. Quaid | | 53 | | Director |
| Frank M. Semple | | 73 | | Director |
| J. Michael Stice | | 65 | | Director |
| John P. Surma | | 70 | | Director |
| Gregory S. Floerke | | 61 | | Executive Vice President and Chief Operating Officer |
| Timothy J. Aydt* | | 61 | | Executive Vice President |
| Molly R. Benson | | 58 | | Chief Legal Officer and Corporate Secretary |
| David R. Heppner* | | 58 | | Senior Vice President |
| Rick D. Hessling* | | 58 | | Senior Vice President |
| Shawn M. Lyon | | 57 | | Senior Vice President Logistics and Storage |
| Brian K. Partee* | | 51 | | Senior Vice President |
| Kristina A. Kazarian* | | 42 | | Vice President Finance and Investor Relations |
| Kelly S. Niese* | | 45 | | Vice President Treasury |
| Kelly D. Wright** | | 42 | | Vice President and Controller |
* Corporate officer
** Effective March 3, 2025, Rebecca L. Iten will succeed Ms. Wright as Vice President and Controller.
Ms. Mannen was elected a member of the Board, effective February 2021, and was appointed President and Chief Executive Officer, effective August 1, 2024. She also was appointed President and Chief Executive Officer of MPC and elected as a member of MPC’s Board of Directors, effective August 1, 2024. Previously, she served as President of MPC since January 2024, and as Executive Vice President and Chief Financial Officer from January 2021 through December 2023. Before joining MPC, Ms. Mannen served as Executive Vice President and Chief Financial Officer of TechnipFMC (a successor to FMC Technologies, Inc.), an engineering services and energy technology company, since 2017, having previously served as Executive Vice President and Chief Financial Officer of FMC Technologies, Inc. since 2014, as Senior Vice President and Chief Financial Officer since 2011, and in various positions of increasing responsibility with FMC Technologies, Inc. since 1986. Ms. Mannen serves on the executive committee of the American Petroleum Institute (API), the executive committee of American Fuel and Petrochemical
Manufacturers (AFPM), and the executive committee of the Ohio Business Roundtable, and is a member of The Business Council. She also serves as secretary of the Cynthia Woods Mitchell Pavilion board of directors and is a member of its executive and finance committees. Ms. Mannen holds a bachelor's degree in accounting and a master’s degree in business administration from Rider University.
Qualifications: Ms. Mannen brings to the Board significant leadership experience in the energy industry, including in the areas of management, finance and international operations. In addition, her experience as Chief Financial Officer at large, publicly traded energy sector companies enables her to contribute important insights regarding finance, risk management and public company matters.
Other Public Company Directorships within Past Five Years: Marathon Petroleum Corporation (since 2024); Owens Corning (since 2014)
Mr. Hennigan was elected Executive Chairman of the Board of Directors, effective August 1, 2024, having previously served as Chairman of the Board since April 2020 and as a member of the Board since June 2017. He served as President and Chief Executive Officer from November 2019 through July 2024, and as President from June 2017 through October 2019. Mr. Hennigan also was elected Executive Chairman of MPC’s Board of Directors, effective August 1, 2024, having previously served as MPC’s Chief Executive Officer from January 2024 through July 2024, and as President and Chief Executive Officer from March 2020 through December 2023. He has served on MPC’s Board of Directors since April 2020. Prior to joining us in 2017, Mr. Hennigan was President, Crude, NGL and Refined Products of the general partner of Energy Transfer Partners L.P. He was President and Chief Executive Officer of Sunoco Logistics Partners L.P. from 2012 to 2017, President and Chief Operating Officer beginning in 2010, and Vice President, Business Development beginning in 2009. Mr. Hennigan holds a bachelor’s degree in chemical engineering from Drexel University.
Qualifications: Mr. Hennigan brings to the Board a unique perspective and valued guidance gained from nearly 40 years of industry experience, including as our Chairman, President and Chief Executive Officer, MPC’s President and Chief Executive Officer, and as the President and Chief Executive Officer of a successful growth-oriented master limited partnership. He leverages this expertise in advising on our strategic direction and apprising the Board on issues of significance to our industry and to us.
Other Public Company Directorships within Past Five Years: Marathon Petroleum Corporation (since 2020); Nutrien Ltd. (since 2022)
Mr. Hagedorn was appointed Executive Vice President and Chief Financial Officer, and was elected a member of the Board, effective January 1, 2024. He previously served as MPC’s Senior Vice President and Controller since September 2021, and as MPLX’s Vice President and Controller from October 2017 through August 2021. Before joining MPLX, he was Vice President and Controller at CONSOL Energy Inc., a Pennsylvania-based natural gas and coal producer and exporter, beginning in 2015, Assistant Controller beginning in 2014 and Director, Financial Accounting, beginning in 2012. Mr. Hagedorn was Chief Accounting Officer for CONE Midstream Partners LP, a publicly traded master limited partnership with gathering assets in the Appalachian Basin, from 2014 to 2015. Previously, he served in positions of increasing responsibility with PricewaterhouseCoopers LLP beginning in 1998. Mr. Hagedorn holds a bachelor’s degree in accounting from West Virginia University.
Qualifications: As our Chief Financial Officer, Mr. Hagedorn brings to the Board direct insight into all financial aspects of our business, including in the areas of accounting, risk management and financial management. His more than 25 years of financial accounting and audit expertise, including significant financial leadership experience in the midstream sector, affords him an extensive understanding of strategic and financial planning, accounting, internal controls, public company financial reporting requirements and related matters.
Other Public Company Directorships within Past Five Years: None
Ms. Breves was elected a member of the Board, effective November 2022. From 2013 until her retirement in December 2022, Ms. Breves held a number of senior roles at United States Steel Corporation (“U.S. Steel”), including as Executive Vice President, Business Transformation beginning August 2022, Senior Vice President and Chief Financial Officer from 2019 to August 2022, and Senior Vice President, Manufacturing Support and Chief Supply Chain Officer from 2017 to 2019. Prior to joining U.S. Steel, Ms. Breves was with Alcoa Corporation for 14 years, where she served in various leadership positions in the company’s global procurement organization, including as Chief Procurement Officer from 2004 to 2012. Ms. Breves holds a bachelor’s degree in management from College of Charleston and a master’s degree in business administration and management from The Citadel.
Qualifications: Ms. Breves brings to the Board significant executive experience in accounting and finance, strategy development and business transformation, procurement and operations management including extensive maintenance experience, as well as expertise in financial systems management, risk management and talent development. She has extensive experience in establishing internal controls, the review of financial statements and working capital.
Other Public Company Directorships within Past Five Years: RXO, Inc. (since 2022); Sylvamo Corporation (since 2021)
Mr. Helms was elected a member of the Board, effective October 2012. Mr. Helms is President and Chief Executive Officer of US Shale Management Company, a wholly-owned subsidiary of US Shale Energy Advisors LLC. Mr. Helms is the co-founder of US Shale Energy Advisors LLC, a privately owned entity engaged in the development, ownership and operation of midstream energy assets. Through subsidiaries it owns and operates Rocky Mountain Crude Oil LLC, a crude oil logistics company focused on the transportation of crude oil produced in the great plains and Rocky Mountain regions of the United States. From 2005 until his retirement in 2011, Mr. Helms served in various capacities with NiSource Inc. and its affiliate, NiSource Gas Transmission and Storage, including as Executive Vice President and Group Chief Executive Officer. He was Group President, Pipeline of NiSource Inc. from 2005 to 2008, where he was also a member of the Executive Council and the Corporate Risk Management Committee. He served as Chief Executive Officer and Executive Director of NiSource Gas Transmission and Storage from 2008 to 2011. At NiSource, Mr. Helms was responsible for leading the company’s interstate gas transmission, storage and midstream businesses. Prior to joining NiSource, Mr. Helms held senior executive positions with CMS Energy Corporation, and subsidiaries of Duke Energy Corporation and PanEnergy Corp. from 1990 to 2005. Mr. Helms holds a bachelor’s degree from Southern Illinois University at Edwardsville and a juris doctor degree from the Tulane University School of Law.
Qualifications: Mr. Helms brings to the Board considerable midstream energy expertise, particularly in operations and business combinations, as well as experience in finance, accounting, compliance, strategic planning and risk oversight. His background also includes overseeing joint ventures and mergers and acquisitions within the midstream energy sector and supervising financial reporting functions.
Other Public Company Directorships within Past Five Years: None
Mr. Peiffer was elected a member of the Board, effective June 2012, and served as our President from 2012 until his retirement in 2014. He also served as MPC’s Executive Vice President, Corporate Planning and Investor & Government Relations from 2011 until his retirement. Mr. Peiffer began his career with Marathon in 1974 as an internal auditor, and then held a variety of management positions with increasing responsibility, including as Supervisor of Employee Savings and Retirement Plans, Controller of Speedway Petroleum Corporation and numerous other marketing and logistics positions. In 1987, he was appointed to the President’s Commission on Executive Exchange serving for a year in the Pentagon as Special Assistant to the Assistant Secretary of Defense for Production and Logistics. In 1988, he returned to Marathon and was named Vice President of Finance and Administration for Emro Marketing Company. He served as Assistant Controller, Refining, Marketing and Transportation beginning in 1992. He was named Senior Vice President of Finance and Commercial Services for Marathon Ashland Petroleum LLC in 1998 and Executive Vice President of MPC in 2011. Mr. Peiffer is a member of the boards of the Catholic Community Foundation-Ohio and the Blanchard Valley Port Authority. He holds a bachelor’s degree in accounting from Bowling Green State University and passed the certified public accountant exam in Ohio.
Qualifications: As the retired President of our general partner and retired Executive Vice President, Corporate Planning and Investor & Government Relations of MPC, Mr. Peiffer brings to the Board extensive experience in the energy industry gained from his roles at MPC and its affiliates. His significant career accomplishments include leading us through the initial public offering process and our first year of operations, leading finance organizations, successfully completing several joint ventures and corporate reorganizations and implementing new information technology solutions.
Other Public Company Directorships within Past Five Years: None
Mr. Quaid was elected a member of the Board, effective January 2022. He was appointed Executive Vice President and Chief Financial Officer of MPC effective January 1, 2024, having previously served as Executive Vice President and Chief Financial Officer of MPLX since September 2021. Prior to his 2021 appointment, Mr. Quaid served as MPC’s Senior Vice President and Controller beginning in April 2020, and as Vice President and Controller beginning in 2014. Before joining MPC, Mr. Quaid was Vice President of Iron Ore at U.S. Steel, an integrated steel producer, beginning in 2014, and Vice President and Treasurer beginning in 2011, having previously served in various functions including investor relations, business planning, financial planning and analysis and project management. Mr. Quaid holds a bachelor’s degree in accounting from Lehigh University.
Qualifications: As our former Chief Financial Officer and MPC’s current Chief Financial Officer, Mr. Quaid brings to the Board direct insight into all financial aspects of our business, including in the areas of accounting, risk management and financial management. His background in business planning, treasury and finance affords him an extensive understanding of strategic and financial planning, accounting, internal controls, public company financial reporting requirements and related matters.
Other Public Company Directorships within Past Five Years: None
Mr. Semple was elected our Vice Chairman and as a member of the Board in December 2015, upon our acquisition of MarkWest Energy Partners, L.P. He served as Vice Chairman until his retirement in October 2016. He also served on MPC’s Board of Directors from December 2015 until October 2018. Prior to joining us, Mr. Semple served as President and Chief Executive Officer of MarkWest Energy Partners, L.P. beginning in 2003, and as Chairman of the Board beginning in 2008. Prior to his time at MarkWest, he served 22 years with The Williams Companies, Inc. and WilTel Communications, including as Chief Operating Officer of WilTel Communications, Senior Vice President/General Manager of Williams Natural Gas Company, Vice President of Operations and Engineering for Northwest Pipeline Company and division manager for Williams Pipe Line Company. Prior to joining Williams, Mr. Semple served in the United States Navy. He holds a bachelor’s degree in mechanical engineering from the United States Naval Academy and has completed the Program for Management Development at Harvard Business School.
Qualifications: Mr. Semple brings to the Board proven leadership ability in managing a complex business and a deep understanding of the midstream sector gained from his experience as Chairman and Chief Executive Officer of MarkWest, as well as significant experience regarding operations, strategic planning, finance and corporate governance matters.
Other Public Company Directorships within Past Five Years: Marathon Petroleum Corporation (since 2021); Tortoise Acquisition Corp (2019-2020)
Mr. Stice was elected a member of the Board, effective April 2018, and as a member of MPC’s Board of Directors in February 2017. He has served as a Professor at The University of Oklahoma since January 2023, having previously served as Dean of the Mewbourne College of Earth & Energy at The University of Oklahoma since 2015. Mr. Stice retired as the Chief Executive Officer of Access Midstream Partners L.P. in 2014 and from its board of directors in 2015. He had served as Chief Executive Officer of Access Midstream and previously, Chesapeake Midstream Partners, L.P., since 2009, and as President and Chief Operating Officer of Chesapeake Midstream Development, L.P. and Senior Vice President of natural gas projects of Chesapeake Energy Corporation since 2008. Mr. Stice began his career in 1981 with Conoco, serving in a variety of positions of increasing responsibility. He was named President of ConocoPhillips Qatar in 2003. Mr. Stice holds a bachelor’s degree in chemical engineering from the University of Oklahoma, a master’s degree in business from Stanford University and a doctorate in education from George Washington University.
Qualifications: Mr. Stice brings to the Board extensive experience with MLPs, including as Chief Executive Officer of one of the largest publicly traded gathering and processing MLPs, and as a member of the board of directors of MarkWest Energy Partners, L.P., which we acquired in 2015. He has forty years of experience in the upstream and midstream gas businesses.
Other Public Company Directorships within Past Five Years: Kosmos Energy Ltd. (since 2023); Marathon Petroleum Corporation (since 2017); Spartan Acquisition Corp. II (2020-2021); Spartan Acquisition Corp. III (2021-2022); Spartan Energy Acquisition Corporation (2018-2020); U.S. Silica Holdings, Inc. (2013-2021)
Mr. Surma was elected a member of the Board, effective October 2012, and as a member of MPC’s Board of Directors in July 2011. He served as MPC’s Chairman of the Board from April 2020 through July 2024, and currently serves as MPC’s independent Lead Director. Mr. Surma retired as the Chief Executive Officer and Executive Chairman of U.S. Steel in 2013. Prior to joining U.S. Steel, he served in several executive positions with Marathon, including as Senior Vice President, Finance & Accounting of Marathon Oil Company in 1997; President, Speedway SuperAmerica LLC in 1998; Senior Vice President, Supply & Transportation of Marathon Ashland Petroleum LLC in 2000; and President of Marathon Ashland Petroleum in 2001. Prior to joining Marathon, Mr. Surma worked for Price Waterhouse LLP, becoming a partner in 1987. In 1983, he participated in the President’s Executive Exchange Program in Washington, D.C., serving as Executive Staff Assistant to the Federal Reserve Board’s Vice Chairman. Mr. Surma chairs the board of the University of Pittsburgh Medical Center, and formerly chaired the boards of the Federal Reserve Bank of Cleveland and the National Safety Council. He was appointed by President Barack Obama to the President’s Advisory Committee for Trade Policy and Negotiations, serving from 2010 to 2014, including as Vice Chairman. Mr. Surma holds a bachelor’s degree in accounting from Pennsylvania State University.
Qualifications: Mr. Surma brings to the Board a broad range of experience as the retired Chairman and Chief Executive Officer of a large industrial firm, and the current Chairman of MPC, and provides valuable input on our strategic direction and operations. He also has significant experience in public accounting and in executive leadership in the energy and steel industries.
Other Public Company Directorships within Past Five Years: Marathon Petroleum Corporation (since 2011); Public Service Enterprise Group Inc. (since 2019); Trane Technologies plc (since 2013); Concho Resources Inc. (2014-2020)
Mr. Floerke was appointed Executive Vice President and Chief Operating Officer, effective February 2021, having previously served as Executive Vice President and Chief Operating Officer, Gathering and Processing, Trucks and Rail, since August 2020. Prior to his 2020 appointment, he served as Executive Vice President, Natural Gas and NGL Services, beginning in 2018, as Executive Vice President and Chief Operating Officer, MarkWest Operations, beginning in July 2017, and as Executive Vice President and Chief Commercial Officer, MarkWest Assets, beginning in December 2015, upon our acquisition of MarkWest Energy Partners, L.P. Before joining us, Mr. Floerke was Executive Vice President and Chief Commercial Officer at MarkWest beginning in 2015, and Senior Vice President, Northeast region, at MarkWest beginning in 2013. Previously, Mr. Floerke held senior management positions at Access Midstream Partners, L.P. from 2011 until 2013. Mr. Floerke is a member of the board of directors of TransTech Group, LLC.
Mr. Aydt was appointed our Executive Vice President and MPC’s Executive Vice President Refining, effective October 2022, having previously served as our Executive Vice President and Chief Commercial Officer since August 2020. Prior to his 2020 appointment, he served as Vice President, Business Development, beginning in November 2018, as Vice President, Operations, and President of Marathon Pipe Line LLC beginning in January 2017, as MPC’s Terminal, Transport and Rail General Manager beginning in 2013, and as Project Director for the $2.2 billion Detroit Heavy Oil Upgrade Project beginning in 2008.
Ms. Benson was appointed Chief Legal Officer and Corporate Secretary for MPC and us, effective January 1, 2024, having previously served as Vice President, Chief Securities, Governance & Compliance Officer and Corporate Secretary for MPC and us since June 2018, and as Vice President, Chief Compliance Officer and Corporate Secretary for MPC and us since March 2016. Prior to her 2016 appointment, Ms. Benson served as MPC’s Assistant General Counsel, Corporate and Finance beginning in 2012, and as Group Counsel, Corporate and Finance beginning in 2011.
Mr. Heppner was appointed Senior Vice President, effective September 2022. He has served as MPC’s Chief Strategy Officer and Senior Vice President Business Development since March 2024, having previously served as Senior Vice President Strategy and Business Development since February 2021. Prior to his 2021 appointment, he served as Vice President, Commercial and Business Development, beginning in October 2018, as Senior Vice President of Engineering Services and Corporate Support of Speedway LLC beginning in 2014, and as Director, Wholesale Marketing, beginning in 2010.
Mr. Hessling was appointed Senior Vice President, effective October 2018. He was appointed MPC’s Chief Commercial Officer, effective January 1, 2024, having previously served as MPC’s Senior Vice President, Global Feedstocks, since February 2021. Prior to his 2021 appointment, Mr. Hessling served as MPC’s Senior Vice President, Crude Oil Supply and Logistics beginning in 2018, as Manager, Crude Oil & Natural Gas Supply and Trading beginning in 2014, and as Crude Oil Logistics & Analysis Manager beginning in 2011.
Mr. Lyon was appointed Senior Vice President Logistics and Storage, effective September 2022, having previously served as Vice President, Operations, and President, Marathon Pipe Line LLC, since November 2018. Prior to his 2018 appointment, he served as Vice President of Operations for Marathon Pipe Line LLC beginning in 2011. Previously, Mr. Lyon served in various roles of increasing responsibility with MPC since 1989, including as Manager, Marketing and Transportation Engineering beginning in 2010, and as District Manager, Transport and Rail beginning in 2008. He served as board chair for Liquid Energy Pipeline Association in 2023 and chairs the board of the Louisiana Offshore Oil Port (LOOP).
Mr. Partee was appointed Senior Vice President, effective October 2018. He was appointed MPC’s Chief Global Optimization Officer, effective January 1, 2024, having previously served as MPC’s Senior Vice President, Global Clean Products, since February 2021. Prior to his 2021 appointment, Mr. Partee served as MPC’s Senior Vice President, Marketing, beginning in October 2018, as Vice President, Business Development, beginning in February 2018, as Director of Business Development beginning in January 2017, as Manager of Crude Oil Logistics beginning in 2014, and as Vice President, Business Development and Franchise, at Speedway beginning in 2012.
Ms. Kazarian was appointed Vice President Finance and Investor Relations, for MPC and us, effective January 2023. Prior to this appointment, she served as Vice President, Investor Relations beginning in April 2018. Before joining us, she was Managing Director and head of the MLP, Midstream and Refining Equity Research teams at Credit Suisse, a global investment bank and financial services company, beginning in September 2017. Previously, Ms. Kazarian was Managing Director of MLP, Midstream and Natural Gas Equity Research at Deutsche Bank beginning in 2014, and an analyst specializing on various energy industry subsectors with Fidelity Management & Research Company beginning in 2005.
Ms. Niese was appointed Vice President Treasury for MPC and us, effective January 2023. Prior to this appointment, she served as MPC’s Assistant Treasurer beginning in February 2017, as Corporate Finance Manager beginning in October 2014, and as Brand Coordinating Manager beginning in 2011, having previously served in various analytical roles within Crude Supply, Terminals, Transportation and Rail and Internal Audit since joining MPC in 2003.
Ms. Wright was appointed Vice President and Controller, effective September 2021. Prior to this appointment, she served as Assistant Controller of MPC since February 2019, having previously served as Senior Director Accounting Operations Excellence since October 2018. Prior to MPC’s acquisition of Andeavor in October 2018, Ms. Wright served in various roles of increasing responsibility at Andeavor, including as Deputy Controller of Value Chain Accounting from April 2018 to October 2018, as Director of M&A Finance Integration from January 2017 to April 2018, and as Assistant Controller Logistics from March 2015 to January 2017. Prior to joining Andeavor in 2010, she spent five years in public accounting with KPMG LLP.
GOVERNANCE FRAMEWORK
Our Governance Principles provide the functional framework of our Board. They address, among other things, the primary roles, responsibilities and oversight functions of the Board and its committees, director independence, committee composition, the process for director selection, director qualifications, outside commitments, director compensation and director retirement and resignation. Our Governance Principles provide that directors generally must retire from service once they reach age 75, unless otherwise approved by the general partner’s sole member.
Our Code of Business Conduct, which applies to all of our directors, officers and employees, defines our expectations for ethical decision-making, accountability and responsibility. Our Code of Ethics for Senior Financial Officers, which is specifically applicable to our Chief Executive Officer (“CEO”), Chief Financial Officer (“CFO”), Controller, Treasurer and other leaders performing similar functions, affirms the principle that the honesty, integrity and sound judgment of our senior executives with responsibility for preparation and certification of our financial statements are essential to the proper functioning and success of our company. These codes are available on our website as noted below, and printed copies are available upon request to our Corporate Secretary. We would post on our website any amendments to, or waivers from, either of these codes requiring disclosure under applicable rules within four business days following any such amendment or waiver.
Our Whistleblowing as to Accounting Matters Policy establishes procedures for the receipt, retention and treatment of complaints we receive regarding accounting, internal accounting controls or auditing matters, and provides for the confidential, anonymous submission of concerns by employees or others regarding questionable accounting or auditing matters.
Copies of the Governance Principles, the Code of Business Conduct, the Code of Ethics for Senior Financial Officers, and the Whistleblowing as to Accounting Matters Policy are available on the “Corporate Governance” page of our website at www.mplx.com/Investors/Corporate-Governance/.
INSIDER TRADING POLICIES AND PROCEDURES
We have adopted an insider trading policy applicable to our directors, officers and employees. Additionally, as stated in our insider trading policy, securities trading activity by and on behalf of MPLX is subject to oversight by our management pursuant to the guidelines and procedures in place from time to time. We believe our insider trading policy and the guidelines and procedures are reasonably designed to promote compliance with insider trading laws, rules and regulations, as well as NYSE listing standards. A copy of our insider trading policy is filed as an exhibit to this Annual Report on Form 10-K.
DIRECTOR INDEPENDENCE AND QUALIFICATIONS
The Board currently consists of ten directors. The NYSE does not require a publicly traded limited partnership like us to have a majority of independent directors on our Board. We are, however, required to have an Audit Committee comprised of at least three independent directors. The Board considered all relevant facts and circumstances including, without limitation, transactions between the director directly or organizations with which the director is affiliated and us, any service by the director on the board of a company with which we conduct business, and the frequency and dollar amounts associated with these transactions. In evaluating these criteria, the Board specifically considered an ordinary course business transaction with Rocky Mountain Crude Oil, LLC, for which Mr. Helms serves as an executive officer, and concluded that this transaction did not affect Mr. Helms’ independence. Based on these criteria and considerations, the Board has determined that each of the following directors meets the independence standards in our Governance Principles, has no material relationship with us other than as a director, and satisfies the independence requirements of the NYSE and applicable SEC rules.
| | | | | | | | |
| Christine S. Breves | Garry L. Peiffer | J. Michael Stice |
| Christopher A. Helms | Frank M. Semple | John P. Surma |
As stated above, our Governance Principles address qualifications for serving as a director. Directors must actively be engaged in their profession or otherwise regularly involved in business, professional or academic communities, and must normally be available for meetings of the Board and its committees. Directors are encouraged to serve on the boards of directors of other companies; however, each director’s outside directorships must be limited to a number that does not interfere with his or her ability to meet the responsibilities and expectations of service on our Board. Messrs. Semple, Stice and Surma currently serve on MPC’s Board of Directors. As MPLX GP LLC is a wholly owned subsidiary of MPC, we view such service as an extension of service on our Board for purposes of assessing the level of outside public board commitments.
BOARD LEADERSHIP STRUCTURE
Our Governance Principles provide the Board with the flexibility to determine from time to time the optimal leadership for the Board depending upon our particular needs and circumstances. The Board has determined that Mr. Hennigan is in the best position at this time to serve as Executive Chairman due to his extensive knowledge of all aspects of our business, as well as our continued relationship with MPC.
When a management director is elected Chairman, as is the case with Mr. Hennigan, the Board has appointed an independent director as “Lead Director” to provide independent director oversight and preside over executive sessions of the Board or other Board meetings when the Chairman is absent. Mr. Helms, an independent director, currently serves as Lead Director of the Board. The Board believes that this leadership structure is in the best interests of our unitholders and us at this time because it strikes an effective balance between management and independent director participation in the Board process.
COMMITTEES OF THE BOARD
Our Board has a standing Audit Committee and Conflicts Committee, and may have such other committees as the Board shall determine from time to time. Each committee operates under a written charter, which is available on the “Board of Directors” page of our website at www.mplx.com/About/Board-of-Directors/. Each charter requires the applicable committee to annually assess and report to the Board on the adequacy of the charter.
We have additionally established an executive committee of the Board, comprised of Messrs. Hennigan and Helms, to address matters that may arise between meetings of the Board. This executive committee may exercise the powers and authority of the Board subject to specific limitations consistent with applicable law.
As a limited partnership, we are not required to have a compensation committee or a nominating/corporate governance committee.
Audit Committee
Our Audit Committee assists the Board in its oversight of the integrity of our financial statements, and our compliance with legal and regulatory requirements and our disclosure controls and procedures. Our Audit Committee has the sole authority to retain
and terminate our independent registered public accounting firm, approve all auditing services and related fees and the terms thereof and pre-approve any non-audit services to be rendered by our independent registered public accounting firm. Our Audit Committee also is responsible for confirming the independence and objectivity of our independent registered public accounting firm. Our independent registered public accounting firm has unrestricted access to our Audit Committee.
Our Audit Committee is comprised of Messrs. Peiffer (Chair) and Helms and Ms. Breves. The Board has determined that each member of the Audit Committee meets the independence requirements of the NYSE and the SEC, as applicable, and that each is financially literate. The Board also has determined that each of Mr. Peiffer and Ms. Breves qualifies as an “audit committee financial expert,” as defined by SEC rules, based on the attributes, education and experience further described in each director’s biography under “Directors and Executive Officers of MPLX GP LLC” above.
Audit Committee Report
The Audit Committee has reviewed and discussed MPLX’s audited financial statements and its report on internal control over financial reporting for 2024 with the management of MPLX GP LLC, MPLX’s general partner. The Audit Committee discussed with the independent auditor, PricewaterhouseCoopers LLP (“PwC”), the matters required to be discussed by the applicable requirements of the Public Company Accounting Oversight Board and the SEC. The Audit Committee has received the written disclosures and the letter from PwC required by the applicable requirements of the Public Company Accounting Oversight Board regarding PwC’s communications with the Audit Committee concerning independence, and has discussed with PwC its independence. Based on the review and discussions referred to above, the Audit Committee recommended to the Board that the audited financial statements and the report on internal control over financial reporting for MPLX LP be included in MPLX’s Annual Report on Form 10-K for the year ended December 31, 2024, for filing with the SEC.
Garry L. Peiffer, Chair
Christine S. Breves
Christopher A. Helms
Conflicts Committee
Our Conflicts Committee reviews specific matters that may involve conflicts of interest in accordance with the terms of our Partnership Agreement. Any matters approved by our Conflicts Committee in good faith will be deemed to be approved by all of our partners and not a breach by our general partner of any duties it may owe our unitholders or us. The members of our Conflicts Committee may not be officers or employees of our general partner or directors, officers or employees of its affiliates, and must meet the independence and experience standards established by the NYSE and the SEC to serve on an audit committee. In addition, the members of our Conflicts Committee may not own any interest in our general partner or any interest in us, our subsidiaries or our affiliates other than common units or awards under our incentive compensation plan.
Our Conflicts Committee is comprised of Mr. Helms (Chair) and Ms. Breves. The Board has determined that each member of the Conflicts Committee meets the independence requirements of the NYSE and the SEC, as applicable.
BOARD ORIENTATION AND EDUCATION
We maintain an orientation program for new directors that includes meetings with and presentations by senior leadership. This offers a new director the opportunity to receive one-on-one time with leadership to discuss various aspects of our business. In addition, we encourage directors to attend, at our expense, director continuing education programs. In 2024, various of our directors attended programs sponsored by outside organizations that are designed as continuing director education on many topics relevant to public company board service. Directors make periodic site visits to our facilities. We also provide ongoing director education through presentations at Board and committee meetings, and regularly invite subject matter experts to speak to the Board.
COMMUNICATING WITH THE BOARD
All interested parties, including unitholders, may communicate directly with the Board, the Chairs of the Board’s standing committees and the independent directors as follows:
Mail: Communications may be sent by regular mail to our principal executive offices, to the attention of:
Chief Legal Officer and Corporate Secretary
MPLX GP LLC
200 East Hardin Street
Findlay, OH 45840
Email:
•Independent Directors (individually or as a group): non-managedirectors@mplx.com
•Audit Committee Chair: auditchair@mplx.com
•Conflicts Committee Chair: conflictschair@mplx.com
Our Chief Legal Officer and Corporate Secretary will forward to the directors all communications that, in her judgment, are appropriate for consideration by the directors. Examples of communications that would not be considered appropriate include commercial solicitations and matters not relevant to the Partnership’s affairs.
Item 11. Executive Compensation
COMPENSATION DISCUSSION AND ANALYSIS
This Compensation Discussion and Analysis (“CD&A”) provides an overview of our executive compensation program and explains how and why 2024 compensation decisions were made for our named executive officers (our “NEOs”). We recommend this CD&A be read together with the tables and related disclosures in the “Executive Compensation Tables” section of this Item 11, beginning on page 134. NAMED EXECUTIVE OFFICERS
Our NEOs for 2024 are:
| | | | | | | | |
| Name | | Title |
| | |
| Maryann T. Mannen | | President and CEO, effective August 1, 2024 |
| Michael J. Hennigan | | Executive Chairman, effective August 1, 2024 (former President and CEO through July 31, 2024) |
| C. Kristopher Hagedorn | | Executive Vice President and CFO |
| Molly R. Benson | | Chief Legal Officer and Corporate Secretary |
| Gregory S. Floerke | | Executive Vice President and Chief Operating Officer |
| Shawn M. Lyon | | Senior Vice President Logistics and Storage |
Effective August 1, 2024, Ms. Mannen, who previously served as President of MPC, was appointed as President and CEO of MPC and us. Mr. Hennigan, our previous President and CEO, was elected Executive Chairman of our Board, also effective August 1, 2024.
COMPENSATION DECISIONS AND ALLOCATION
Compensation Allocation
We do not directly employ any of the personnel responsible for managing and operating our business, including our NEOs. Instead, we contract with MPC to provide the necessary personnel, all of whom are directly employed by MPC. Under the terms of an omnibus agreement, described in Item 8. Financial Statements and Supplementary Data, Note 6 of this report, we pay MPC a fixed amount in return for services provided by our NEOs, which totaled approximately $13.2 million for 2024. Although we report in this CD&A 100% of the compensation our NEOs receive for their service to MPC and its affiliates (including us), the only direct compensation we provide to our NEOs is in the form of MPLX phantom unit awards, which are described in detail in the “2024 Grants of Plan-Based Awards” table and accompanying narrative on page 136. Compensation Decisions
We maintain the MPLX LP 2018 Incentive Compensation Plan (the “MPLX 2018 Plan”) for the benefit of eligible officers, employees and directors of our general partner and its affiliates, including MPC, who provide services to our business. The Compensation and Organization Development Committee of MPC’s Board of Directors (“MPC’s Compensation Committee”), currently comprised of seven independent directors, recommends awards under the MPLX 2018 Plan for our NEOs, subject to approval by a committee of our Board comprised of the independent directors (the “MPLX Committee”), which typically considers such awards on an annual basis. Our Board makes all final determinations with respect to awards under the MPLX 2018 Plan. All other compensation decisions for our NEOs are made by MPC's Compensation Committee and are not subject to approval by our Board or us.
Compensation Consultant
MPC’s Compensation Committee has engaged FW Cook as its independent compensation consultant to provide compensation consulting services and comparative compensation. The consultant reports directly to MPC’s Compensation Committee. MPC’s Compensation Committee has considered and assessed all relevant factors, including those required by the SEC, that could give rise to a potential conflict of interest and determined that its engagement of FW Cook as its independent compensation consultant for 2024 did not raise any conflicts of interest. Our Board does not have a standing compensation committee and has not hired its own compensation consultant.
EXECUTIVE COMPENSATION PROGRAM FOR 2024
2024 Base Salary
MPC pays our NEOs a base salary for their services to MPC and its affiliates, including us. In setting base salary for 2024, MPC’s Compensation Committee evaluated the 2024 compensation reference group and executive compensation survey data,
each individual’s performance and contributions over the prior year, where applicable, demonstrated performance and skills acquired over the course of each NEO’s career and MPC’s succession-planning needs.
| | | | | | | | | | | | | | | | | | | | | | | | | | | | | | | | |
| Name | Previous
Base Salary
($) | Base Salary for 2024 ($) | Increase
(%) | Base Salary Effective August 1, 2024 ($) | Increase (Decrease)
(%) |
| | | | | | | | | | |
| Mannen | 1,000,000 | | | 1,050,000 | | | 5.0 | | | 1,400,000 | | | 33 | | |
| Hennigan | 1,750,000 | | | 1,750,000 | | | — | | | 1,050,000 | | | (40) | | |
| Hagedorn | 450,000 | | | 525,000 | | | 16.7 | | | 525,000 | | | — | | |
| Benson | 485,000 | | | 650,000 | | | 34.0 | | | 650,000 | | | — | | |
| Floerke | 620,000 | | | 660,000 | | | 6.5 | | | 660,000 | | | — | | |
| Lyon | 575,000 | | | 650,000 | | | 13.0 | | | 650,000 | | | — | | |
As noted above in “Compensation Allocation,” under our omnibus agreement, we pay MPC a fixed amount in return for services provided by our NEOs. The amounts shown in this table were paid to our NEOs by MPC.
The 2024 base salary increase for Ms. Mannen, effective January 1, 2024, reflects her promotion to President. The 2024 base salary increases for Mr. Hagedorn and Ms. Benson, effective January 1, 2024, reflect each officer’s promotion to his or her current role. The 2024 base salary increase for Mr. Floerke, effective March 29, 2024, was made in recognition of his continued strong performance and as part of our annual merit program increases to maintain market competitiveness. The larger 2024 base salary increase for Mr. Lyon, effective March 29, 2024, reflects the MPC Compensation Committee’s determination to continue to progress his compensation toward the market 50th percentile.
Effective August 1, 2024, Ms. Mannen received a further base salary increase of 33%, from $1,050,000 to $1,400,000, to reflect her promotion to President and CEO. Concurrently, Mr. Hennigan’s base salary was decreased by 40%, from $1,750,000 to $1,050,000, to reflect his departure as President and CEO and assumption of his new role as Executive Chairman.
2024 Annual Cash Bonus Program
Our NEOs participated in MPC’s 2024 Annual Cash Bonus (“ACB”) program, which MPC’s Compensation Committee approved in November 2023, with a performance period of January 1, 2024 through December 31, 2024, as part of their compensation for the services they provide to MPC and its affiliates, including us. The primary purpose of the 2024 ACB program was to incentivize and reward eligible employees for executing on MPC’s strategy. MPC’s Compensation Committee determined awards to our NEOs under the ACB program without input from our Board. Awards under the ACB program for our NEOs were calculated as follows:
| | | | | | | | | | | | | | | | | |
ELIGIBLE EARNINGS ($) | | Generally refers to the NEO’s year-end base salary rate. In an NEO’s year of hire or separation, eligible earnings are calculated as the sum of base wages paid during the year plus compensation deferred during the year, which has the effect of prorating the award. | |
| × | | | |
| | | | |
| | | Expressed as a percentage, as in effect at year-end, of each NEO’s eligible earnings. MPC’s Compensation Committee approves target bonus opportunities for our NEOs based on analysis of market-competitive data sourced from MPC’s compensation reference group and executive compensation surveys, while also taking into consideration each executive’s experience, relative scope of responsibility and potential, other market data and any other information MPC’s Compensation Committee deems relevant in its discretion. | |
TARGET BONUS (%) | | |
| × | | | |
| | | | |
| | | MPC’s Compensation Committee establishes financial performance metrics and levels and non-financial performance measures at the beginning of the performance period. Once the performance period has ended, MPC’s Compensation Committee reviews and assesses company performance against the financial performance metrics and levels and the non-financial performance measures, as well as any other factors MPC’s Compensation Committee deems relevant in its discretion. | |
COMPANY
PERFORMANCE (%) | | |
| +/- | | | |
| | | | |
| | | Awards may be adjusted up or down based upon MPC’s Compensation Committee’s assessment of each NEO’s organizational and individual performance. While there is no limit on downward adjustment, no upward adjustments may be made for the CEO, and upward adjustments for other NEOs are capped at 15%. | |
INDIVIDUAL
PERFORMANCE | | |
| = | | | |
| | | | |
| | | There is no guaranteed minimum ACB payout. Payout results may be above or below target based on actual company and individual performance. Payouts are capped at 200% of each NEO’s target award. | |
FINAL AWARD ($) | | |
2024 MPC Company Metrics and Performance
MPC’s Compensation Committee believes it is important for the ACB program to emphasize both financial and non-financial performance and established the 2024 ACB financial performance metrics and levels and non-financial performance measures in January 2024.
2024 Financial Performance (80%)
The performance levels for each financial performance metric were established at the beginning of the performance period by evaluating factors such as performance achieved in the prior year(s), anticipated challenges for 2024, and MPC’s business plan and overall strategy. MPC’s Compensation Committee also reviewed disclosed peer methodologies of similar metrics when evaluating the rigor of the performance goals. The performance levels were set with threshold levels viewed as likely achievable, target levels viewed as challenging but achievable, and maximum levels viewed as difficult to achieve. The following table provides each financial performance metric’s target weighting, performance levels and actual performance achieved in 2024.
| | | | | | | | | | | | | | | | | | | | |
| 80% FINANCIAL PERFORMANCE |
Financial
Performance Metrics | Weight | Threshold
(50%) | Target
(100%) | Maximum
(200%) | Result | Performance Achieved |
| | | | | | |
| Relative Adjusted EBITDA per Barrel | 30% | 30th Percentile of peers | 50th Percentile of peers | 100th Percentile of peers | 100th Percentile (200.00% of target) | 60.00% |
ACB Adjusted EBITDA
(in millions) | 20% | $9,487 | $12,649 | $15,811 | $9,664
(52.80% of target) | 10.56% |
| Distributable Cash Flow at MPLX per Unit | 20% | $4.70 | $5.22 | $5.74 | $5.70
(192.31% of target) | 38.46% |
| Refining and Corporate Costs (in millions) | 10% | $6,858 | $6,532 | $6,205 | $6,456
(123.24% of target) | 12.32% |
| Total Financial Performance Achieved: | 121.34% |
| | |
|
Relative Adjusted EBITDA per Barrel of Total Throughput is derived from MPC’s ACB Adjusted EBITDA (see below), a non-GAAP performance metric, as compared to applicable reporting segments of a peer group of integrated and downstream companies: Chevron Corporation; Exxon Mobil Corporation; HF Sinclair Corporation; PBF Energy Inc.; Phillips 66; and Valero Energy Corporation. |
|
ACB Adjusted EBITDA is a non-GAAP performance metric derived from MPC’s consolidated financial statements. It is calculated as MPC’s earnings before interest and financing costs, interest income, income taxes, depreciation and amortization expense, adjusted to exclude the effects of impairments, inventory market valuation adjustments, acquisitions and divestitures and certain other charges and credits. |
|
Distributable Cash Flow (“DCF”) at MPLX per Unit is a non-GAAP performance metric reflecting cash flow available to be paid to our common unitholders, derived from our consolidated financial statements. Item 7. Management’s Discussion and Analysis of Financial Condition and Results of Operations – Non-GAAP Financial Information provides information about this measure and how it is calculated. DCF per unit is determined by dividing DCF by our average common unit count, adjusted for preferred unit conversions, during the performance period. |
|
Refining and Corporate Costs are MPC’s externally reported refining operating and corporate costs, excluding costs associated with MPC’s incentive programs and costs associated with acquisitions and divestitures. |
|
MPC’s Compensation Committee has sole discretion under the 2024 ACB program to adjust financial performance metric levels and/or the payout percentage to recognize instances where, due to unforeseen circumstances, the performance metrics results are not entirely indicative of overall company results. MPC’s Compensation Committee made no such adjustments to the 2024 financial performance metric levels or payout percentages.
2024 Non-Financial Performance (20%)
Non-financial performance measures are based on both qualitative and quantitative factors that provide a comprehensive perspective of our performance. For the 2024 ACB, MPC’s Compensation Committee established a broad set of measures tied to safety, environmental stewardship and human capital management. Performance under these measures is evaluated against pre-established criteria using a scorecard approach. When determining performance, MPC’s Compensation Committee considers the results and evaluates performance in totality, taking into consideration overall company performance for each measure and any mitigating factors, as well as historical performance and external reference data. The following table provides performance achieved for the non-financial performance measures in 2024.
| | | | | | | | |
| 20% NON-FINANCIAL PERFORMANCE SCORECARD |
Non-Financial
Performance Measures | | Performance Achieved |
| | |
| Safety | | |
| •Achieved Process Safety Events Score of 110, a 7% improvement compared to 2023 results •Improved Personal Safety Performance by 27% over 2023 |
| Reinforce our strong safety culture as our number-one priority | |
| 2024 Assessment: Above Expectations |
| | |
| Environmental Stewardship | | •Achieved GHG Intensity result of 21.4, in line with our 2024 reduction commitment •Achieved Designated Environmental Incidents result of 47, a 32% improvement compared to 2023 results; such incidents reached a six-year low |
| Reduce GHG intensity and lower our carbon footprint | |
| | 2024 Assessment: Well Above Expectations |
| | |
| Human Capital Management | | •High employee participation in career development activities •Exceeded expectations in developing executive succession role plans and increased bench strength in these roles, but lagged expectations in developing critical succession role plans •Employees achieved 98% on-time completion of training course requirements •Demonstrated employee commitment to ongoing learning opportunities |
| Ensure strong leadership succession pipeline through enhanced planning and promotion of employee engagement and development | |
| 2024 Assessment: Above Expectations |
| | |
| | TOTAL NON-FINANCIAL PERFORMANCE ACHIEVED: 35% |
| | |
|
Process Safety Events Score takes into account Tier 1 and Tier 2 events, with Tier 1 events multiplied by three to recognize their severity, and excludes the performance of any assets acquired during the performance period. |
|
Personal Safety Performance is measured by the Days Away Rate, calculated pursuant to a U.S. Occupational Safety and Health Administration (OSHA) formula, and includes work-related injuries that result in a worker being away from work for at least one calendar day. |
|
Greenhouse Gas (“GHG”) Intensity is based on Scope 1 and Scope 2 GHG emissions divided by the manufacturing inputs processed at MPC’s refineries and natural gas processing and fractionation plants. |
|
Designated Environmental Incidents measures MPC’s environmental performance through tracking Tier 3 and Tier 4 incidents, and excludes the performance of any assets acquired during the performance period. |
|
ACB Payouts for 2024
In February 2025, based on its assessment of MPC’s financial and non-financial performance shown above, MPC's Compensation Committee certified the overall performance achieved under the 2024 ACB program, as described above, at 156.34%.
Once it has assessed overall performance, MPC’s Compensation Committee has discretion under the 2024 ACB program to increase (by no more than 15%) or decrease payouts to certain of our officers, including our NEOs, based upon the Committee’s assessment of each individual’s performance and contributions; provided, that our CEO’s payout cannot be increased pursuant to this discretion. While MPC’s Compensation Committee determined that our NEOs’ contributions to the successful execution in 2024 of MPC’s business objectives and enhancement of MPC shareholder value were significant, it concluded that the high achievement of performance metrics under the 2024 ACB program adequately reflected these contributions and determined to make no individual adjustments, other than a discretionary downward adjustment to Ms. Mannen’s payout at her request, as described below.
As shown above, MPC’s Compensation Committee determined to fund the 20%-weighted non-financial performance scorecard at 35% for the organization based on the Committee’s holistic assessment of MPC’s performance relative to internal mileposts and external reference data. In making this determination, MPC’s Compensation Committee considered that MPC made year-over-year meaningful improvements in all categories measured under the non-financial performance scorecard (safety, environmental stewardship and human capital management). Both MPC’s Compensation Committee and Ms. Mannen believe that the 35% payout is reflective of the organization’s performance in 2024.
To reinforce the importance of safety as MPC’s highest priority as a company and to demonstrate her belief that continued safety improvement within the organization is possible and necessary, Ms. Mannen recommended that she receive no credit in her individual payout for the non-financial safety performance measure.
Taking into consideration MPC's overall performance, the MPC Compensation Committee’s evaluation of each NEO’s contributions to that performance, and Ms. Mannen’s recommendations, the Committee awarded the following amounts to our NEOs under the 2024 ACB program:
| | | | | | | | | | | | | | | | | | | | | | | | | | | | | | | | | | | | | | | | | | | | |
| Name | | 2024 Eligible Earnings ($) | | Bonus Target
as a % of Eligible Earnings | | Target Bonus
($) | | Final Award
as a % of Target | | Final Award
($) |
| | | | | | | | | | | | | | |
| Mannen | | 1,400,000 | | | | 165 | | | | 2,310,000 | | | | 146.34% | | 3,380,500 | |
| Hennigan | | 1,457,377 | | * | | 165 | | | | 2,404,672 | | | | 156.34% | | 3,759,500 | |
| Hagedorn | | 525,000 | | | | 75 | | | | 393,750 | | | | 156.34% | | 615,600 | |
| Benson | | 650,000 | | | | 90 | | | | 585,000 | | | | 156.34% | | 914,600 | |
| Floerke | | 660,000 | | | | 70 | | | | 462,000 | | | | 156.34% | | 722,300 | |
| Lyon | | 650,000 | | | | 70 | | | | 455,000 | | | | 156.34% | | 711,300 | |
* Mr. Hennigan’s eligible earnings for 2024 were prorated to reflect his base salary decrease, effective August 1, 2024, described under “2024 Base Salary” above.
As noted above in “Compensation Allocation,” under our omnibus agreement, we pay MPC a fixed amount in return for services provided by our NEOs. The amounts shown in this table have been or will be paid to our NEOs by MPC.
MPC’s Compensation Committee increased Ms. Mannen’s 2024 ACB target percentage opportunity, from 110% to 120% of eligible earnings, to reflect her promotion to President of MPC, effective January 1, 2024. Her target percentage opportunity was further increased to 165% of eligible earnings to reflect her promotion to President and CEO of MPC and MPLX, effective August 1, 2024. Mr. Hagedorn’s 2024 ACB target percentage opportunity was increased, from 60% to 75% of eligible earnings, to reflect his promotion to Executive Vice President and CFO of MPLX, effective January 1, 2024. Ms. Benson’s 2024 ACB target percentage opportunity was increased, from 65% to 90% of eligible earnings, to reflect her promotion to Chief Legal Officer and Corporate Secretary of MPC and MPLX, effective January 1, 2024. Target percentage opportunities for our other NEOs remained unchanged from the 2023 ACB target percentages.
2024 Long-Term Incentive Compensation Program
MPC’s long-term incentive (“LTI”) compensation program is comprised of MPC performance share units (“PSUs”), MPC restricted stock units (“RSUs”) and MPLX phantom units. This award mix places a substantial portion of our NEOs’ compensation at-risk and promotes achievement of MPC’s and our long-term business objectives by linking our NEOs’ compensation directly to long-term shareholder and unitholder value creation and financial results.
2024 Annual LTI Awards
MPC’s Compensation Committee approved the following 2024 LTI target award amounts for our NEOs during its annual compensation review process in early 2024. MPC’s Compensation Committee generally sets the annual LTI target award mix at 60% MPC PSUs, 20% MPC RSUs and 20% MPLX phantom units. To mitigate the effect of share price volatility, the number of awards granted is determined on the basis of the average closing share price for the trading days in the 30 calendar days immediately prior to the grant date. Thus, these amounts may differ from the accounting values shown in the “2024 Summary Compensation Table” and the “2024 Grants of Plan-Based Awards” table on pages 134 and 136, respectively. | | | | | | | | | | | | | | | | | | | | | | | | | | |
| Name | MPC PSUs
($) | MPC RSUs
($) | MPLX Phantom Units
($) | Total 2024 LTI Target ($) |
| | | | | | | | |
| Mannen | 4,750,200 | | | 2,166,800 | | | 1,000,000 | | | 7,917,000 | | |
| Hennigan | 8,880,000 | | | 2,960,000 | | | 2,960,000 | | | 14,800,000 | | |
| Hagedorn | 720,000 | | | 240,000 | | | 240,000 | | | 1,200,000 | | |
| Benson | 1,080,000 | | | 360,000 | | | 360,000 | | | 1,800,000 | | |
| Floerke | 960,000 | | | 320,000 | | | 320,000 | | | 1,600,000 | | |
| Lyon | 900,000 | | | 300,000 | | | 300,000 | | | 1,500,000 | | |
MPC’s Compensation Committee increased Ms. Mannen’s initial 2024 LTI target award opportunity by 25%, from $4,000,000 to $5,000,000, over her 2023 LTI target award to reflect her promotion to President of MPC, effective January 1, 2024. Upon her promotion to President and CEO of MPC and MPLX, effective August 1, 2024, she received an additional LTI award with a target value of $2,917,000 (composed of 60% MPC PSUs and 40% MPC RSUs), bringing her total 2024 LTI target award opportunity to $7,917,000, as reflected in the table above. On an annualized basis, this would represent a $12,000,000 LTI target award opportunity for Ms. Mannen as President and CEO.
MPC’s Compensation Committee increased Mr. Hennigan’s 2024 LTI target award opportunity by 10% over his 2023 LTI target award to reflect his experience and performance in his role as CEO. For 2025, his LTI target award opportunity has been reduced to $8,880,000 to reflect his departure as CEO and new role as Executive Chairman of MPC and MPLX.
Mr. Hagedorn’s 2024 LTI target award opportunity represents a 140% increase over his 2023 LTI target award to reflect his promotion to Executive Vice President and Chief Financial Officer of MPLX, effective January 1, 2024. Ms. Benson’s 2024 LTI target award opportunity represents a 125% increase over her 2023 LTI target award to reflect her promotion to Chief Legal
Officer and Corporate Secretary of MPC and MPLX, effective January 1, 2024. The 2024 LTI target award opportunities for Messrs. Floerke and Lyon represent increases of 23% and 25%, respectively, over their 2023 LTI target awards to continue to progress each executive’s compensation toward the market median.
MPC PSUs
MPC’s Compensation Committee awards MPC PSUs to align our NEOs’ long-term compensation interests with MPC’s shareholders’ long-term investment interests by conditioning payout on MPC’s three-year PSU Total Shareholder Return (“TSR”) performance relative to the peer group shown in the following table. Each PSU has a target value equal to the average MPC closing share price for the trading days in the 30 calendar days immediately prior to the grant date. PSUs vest in full at the end of the performance period and are settled in cash. The actual payout value is based on MPC’s PSU TSR performance (which can range from 0% to 200%) multiplied by: (i) for 2022 PSUs, MPC’s closing share price on the date MPC’s Compensation Committee certifies performance; and (ii) for 2023 and 2024 PSUs, MPC’s average closing share price for the trading days in the final 30 calendar days of the performance period. To provide greater alignment with MPC’s shareholders, payout is capped at 100% when MPC’s PSU TSR is negative for the performance period.
| | | | | | | | |
| PERFORMANCE PERIOD | |
| | |
| 2022 PSUs | 2023 PSUs | 2024 PSUs |
| January 1, 2022 - December 31, 2024 | January 1, 2023 - December 31, 2025 | January 1, 2024 - December 31, 2026 |
| | |
| | | | | | | | |
| PEER GROUP | |
| | |
BP p.l.c. Chevron Corporation CVR Energy, Inc. Delek US Holdings, Inc. | Exxon Mobil Corporation HF Sinclair Corporation* PBF Energy Inc. Phillips 66 | Valero Energy Corporation Median of Compensation Reference Group S&P 500 Index Alerian MLP Index |
| *For 2022 PSUs, HollyFrontier Corporation. For 2023 and 2024 PSUs, HF Sinclair Corporation. |
| | | | | | | | |
| PSU TSR CALCULATION |
| |
| (Ending Stock Price* - Beginning Stock Price*) + Cumulative Cash Dividends | |
| Beginning Stock Price* | |
| * For 2022 PSUs, calculated as the average of each company’s closing share price for the 20 trading days prior to each applicable date. For 2023 and 2024 PSUs, calculated as the average of each company’s closing share price for the trading days in the 30 calendar days prior to each applicable date. |
| | | | | | | | | | | | | | |
| MPC PSU TSR PERFORMANCE ASSESSMENT |
| | | | |
| Below Threshold | Threshold | Target | Maximum |
| PSU TSR Performance Percentile | Below 30th | 30th | 50th | 100th (Highest) |
| Payout Percentage (% of Target)* | 0% | 50% | 100% | 200% |
| *Payout for performance between percentiles is determined using linear interpolation. |
|
In January 2025, MPC’s Compensation Committee certified the final PSU TSR results for the MPC 2022 PSUs as follows:
| | | | | | | | | | | | | | |
MPC 2022 PSUs | Actual PSU TSR
(%) | Position Relative to Peer Group | PSU TSR Performance Percentile | Payout Percentage
(% of Target) |
| | | | |
| January 1, 2022 - December 31, 2024 | 139.72 | 2nd of 13 | 91.67th | 183.33 |
| | | | |
Each NEO’s 2022 PSU target award was multiplied by: (i) the Payout Percentage shown in the table above and (ii) MPC’s closing share price on the date MPC’s Compensation Committee certified performance, resulting in the following payouts:
| | | | | | | | | | | | | | | | | | | | | | | | | | | | | | | | | | | | | | |
| Name | MPC 2022 PSU Target Award ($) | MPC 2022 PSU Target Award* (#) | Payout Percentage
(%) | Performance-Adjusted PSUs
(#) | MPC Closing Share Price on Certification Date
($) | Payout
($) |
| | | | | | | | | | | | |
| Mannen | 2,460,000 | | 31,759 | | 183.33 | | 58,224 | | | 154.31 | | 8,984,545 | |
| Hennigan | 7,350,000 | | 94,888 | | 183.33 | | 173,959 | | | 154.31 | | 26,843,613 | |
| Hagedorn | 300,000 | | 3,873 | | 183.33 | | 7,101 | | | 154.31 | | 1,095,755 | |
| Benson | 420,000 | | 5,423 | | 183.33 | | 9,942 | | | 154.31 | | 1,534,150 | |
| Floerke | 780,000 | | 10,070 | | 183.33 | | 18,462 | | | 154.31 | | 2,848,871 | |
| Lyon | 250,000 | | 3,228 | | 183.33 | | 5,918 | | | 154.31 | | 913,207 | |
* Calculated as the target award value divided by the average MPC closing share price ($77.46) for the trading days in the 30 calendar days immediately prior to the grant date (March 1, 2022).
MPC PSUs granted in 2023 and 2024 to our NEOs remain outstanding. See “2024 Grants of Plan-Based Awards” on page 136 and “Outstanding Equity Awards at 2024 Fiscal Year-End” beginning on page 137 for additional information about these awards. MPC RSUs
MPC’s Compensation Committee awards MPC RSUs to promote our NEOs’ ownership of MPC’s common stock, aid in retention and help our NEOs comply with MPC’s stock ownership guidelines. Awards generally vest ratably over three years. See “2024 Grants of Plan-Based Awards” on page 136 for additional information about MPC RSUs granted to our NEOs in 2024. MPLX Phantom Units
MPC’s Compensation Committee includes MPLX phantom units in our NEOs’ LTI award mix to align our NEOs’ compensation interests with our unitholders’ investment interests, and help our NEOs comply with our unit ownership guidelines. MPLX phantom unit awards were recommended by MPC’s Compensation Committee and granted by the MPLX Committee. Awards generally vest ratably over three years. See “2024 Grants of Plan-Based Awards” on page 136 for additional information about MPLX phantom units granted to our NEOs in 2024. OTHER BENEFITS
We do not sponsor any benefit plans, programs or policies such as healthcare, life insurance, income protection or retirement benefits for our NEOs, and we do not provide perquisites. However, those types of benefits are generally provided to our NEOs by MPC (through its indirect wholly owned subsidiary Marathon Petroleum Company LP) consistent with market-based trends. MPC makes all determinations with respect to such benefits without input from our Board. MPC bears the full cost of these programs, and no portion is charged back to us. We have summarized the material elements of these programs below.
Health and Welfare Benefits
Our NEOs are generally eligible to participate in MPC’s market-competitive health and life insurance plans, and long-term and short-term disability programs.
Retirement Benefits
MPC has designed the retirement benefits it provides to its employees, including our NEOs, to be consistent in value and aligned with benefits offered by the other companies with which MPC competes for talent. Benefits under MPC’s qualified and nonqualified plans are described in more detail in “Post-Employment Benefits for 2024,” beginning on page 139, and “2024 Nonqualified Deferred Compensation,” beginning on page 142. Severance Benefits
We and MPC maintain change in control plans designed to (i) preserve executives’ economic motivation to consider a business combination that might result in job loss and (ii) compete effectively in attracting and retaining executives in an industry that features frequent mergers, acquisitions and divestitures. Our change in control benefits are described further in “Potential Payments Upon Termination or Change in Control,” beginning on page 143. Limited Perquisites
MPC provides our NEOs limited perquisites consistent with those offered by companies in MPC’s compensation reference group.
| | |
| Tax and Financial Planning Services |
| To offset the expense of obtaining professional tax, estate and financial planning services, MPC generally provides our NEOs with a $15,000 annual stipend. |
|
| | |
| Health and Well-being |
| Under MPC’s enhanced annual physical health program, our senior leaders, including our NEOs, are eligible for a comprehensive physical (generally in the form of a one-day appointment), with procedures similar to those available to all other employees under MPC’s health program. |
|
| | |
| Use of Corporate Aircraft |
| The primary use of MPC’s corporate aircraft is for business purposes. MPC’s Board of Directors has also authorized personal use of MPC’s corporate aircraft for each of Ms. Mannen, in her capacity as President and CEO, and Mr. Hennigan, in his capacity as Executive Chairman, in the interest of their safety, security and productivity. Certain other executives may be allowed limited personal use of MPC’s corporate aircraft, and occasionally, spouses or other guests may accompany executive officers on corporate aircraft when space is available on business-related flights. All such personal use must be authorized by MPC’s CEO. The cost of any such travel that does not meet the Internal Revenue Code standard for business use is imputed as income to the executive officer. |
|
| Additionally, MPC entered into aircraft time sharing agreements with Ms. Mannen and Mr. Hennigan, effective August 14, 2024, pursuant to which either executive may elect to use MPC’s corporate aircraft for transportation and personal use from time to time on a time sharing basis. Pursuant to the terms of the agreements, Ms. Mannen and Mr. Hennigan, as applicable, may elect to pay MPC for her or his personal use of the aircraft from time to time. These agreements were approved by MPC’s Corporate Governance and Nominating Committee and will be reviewed on an annual basis consistent with MPC’s Related Person Transactions Policy. Copies of these agreements were filed as exhibits to MPC’s Quarterly Report on Form 10-Q for the quarter ended September 30, 2024. |
| | |
| Safety and Security |
| Given the significant public profile of Ms. Mannen as MPC’s President and CEO, and Mr. Hennigan as MPC’s Executive Chairman, and the publicity given to those in the industry, MPC’s Board of Directors has authorized certain limited security benefits to each executive, including the maintenance, operation and monitoring of enhanced security systems. These benefits are monitored by MPC’s Compensation Committee and are taxable income to Ms. Mannen and Mr. Hennigan, as applicable. |
|
Reportable values for these benefits and perquisites, based on the incremental costs to MPC, are included in the “All Other Compensation” column of the “2024 Summary Compensation Table” on page 134. COMPENSATION GOVERNANCE
Unit Ownership Guidelines
Our unit ownership guidelines align our executive officers’ long-term interests with those of our unitholders. These guidelines require the executive officers in the positions shown below to retain MPLX common units with a value at least equal to a target multiple of their annualized base salary. The targeted multiples vary depending upon the executive’s position and responsibilities:
| | | | | | | | |
| Position | Multiple of Base Salary |
| | |
| President and CEO | 2x |
| Executive Chairman | 2x |
| MPC Executive Vice Presidents | 1x |
| Chief Officers | 0.75x |
| All Other Executives | 0.50x |
| | |
Compliance with these guidelines is reviewed annually by the Board. MPLX common units owned outright and MPLX phantom units are counted when determining whether an executive has met the required ownership level. Executives have five years following the establishment of, or an increase in, their applicable unit ownership guideline to achieve the applicable target multiple. Any executive who does not achieve the unit ownership guideline within this five-year window must hold all equity we grant until the applicable ownership guideline has been achieved. All NEOs either meet these guidelines or are on track to comply within the applicable five-year period.
Prohibition on Hedging and Pledging Our Common Units
Under our policy on trading of securities, none of our directors, officers (including our NEOs) or select MPC employees designated under the policy may purchase or sell any financial instrument, including but not limited to put or call options, the price of which is affected in whole or in part by changes in the price of our securities, unless such financial instrument was issued by us to such director, officer or covered employee. Further, no director, officer or covered employee may participate in any hedging transaction related to our securities. This policy ensures that our directors, officers and covered employees bear the full risk of MPLX common unit ownership.
Clawback Policy
Short-term and long-term compensation received by covered officers, including our NEOs, is subject to clawback provisions under the MPLX LP Officer Compensation Clawback Policy. If the MPLX Committee determines that a forfeiture event has occurred with respect to a covered officer, it may require recoupment from such covered officer of an amount up to the sum of all
LTI awards granted to, held by, earned by, or settled with respect to, such covered officer in the period during which the misconduct occurred. Forfeiture events include:
•MPLX is required to prepare an accounting restatement as a result of misconduct, and the MPLX Committee determines that a covered officer (i) knowingly engaged in misconduct, (ii) was grossly negligent with respect to misconduct, or (iii) knowingly failed or was grossly negligent in failing to prevent misconduct; or
•The MPLX Committee determines that a covered officer engaged in fraud, embezzlement or other similar misconduct materially detrimental to MPLX.
The MPLX LP Officer Compensation Clawback Policy additionally contains NYSE-compliant provisions. In the event we are required to prepare an accounting restatement of our financial statements due to material noncompliance with any financial reporting requirement under the federal securities laws, the MPLX Committee will recover the excess incentive-based compensation received by any executive officer, including our NEOs, during the prior three fiscal years that exceeds the amount of incentive-based compensation that the executive officer otherwise would have received had the incentive-based compensation been determined based on the restated financial statements.
The provisions in the MPLX LP Officer Compensation Clawback Policy are in addition to any clawback provisions under Section 304 of the Sarbanes-Oxley Act of 2002. The above summary of the MPLX LP Officer Compensation Clawback Policy is qualified in its entirety by reference to the full text of the MPLX LP Officer Compensation Clawback Policy, which was filed as an exhibit to our Annual Report on Form 10-K for the year ended December 31, 2023.
MPC maintains a similar clawback policy that applies to the compensation it awards our NEOs under the MPC ACB and LTI programs.
Compensation Risk Assessment
The independent members of our Board regularly review our policies and practices in compensating MPC’s employees (including both executive officers and non-executives, if any) as they relate to our risk management profile. At the most recent review in February 2025, our independent directors concluded that our compensation policies and practices do not motivate undue risk and are not reasonably likely to have a material adverse effect on MPLX.
Compensation Committee Interlocks and Insider Participation
Because we are a limited partnership, we are not required to have a compensation committee. Compensation matters are determined by the MPLX Committee, comprised of our independent directors. Compensation matters for 2024 were determined by Ms. Breves and Messrs. Helms, Peiffer, Semple, Stice and Surma. No member of the MPLX Committee was at any time during 2024 an officer or employee of MPLX or had any relationship with us requiring disclosure under Item 404 of Regulation
S-K of the Exchange Act. Mr. Peiffer previously served as our President from 2012 until his retirement in 2014. Mr. Semple previously served as our Vice Chairman from December 2015 until his retirement in October 2016. See Item 10. Directors, Executive Officers and Corporate Governance - Director Independence and Qualifications for more information about our independent directors. Our President and CEO, Ms. Mannen, and our Executive Chairman, Mr. Hennigan, each of whom is also an executive officer and director of MPC, provide input to the MPLX Committee on compensation matters. During 2024, none of our other executive officers served on the board of directors or compensation committee of any other entity that has an executive officer serving as a member of the MPLX Committee or the Board.
COMPENSATION COMMITTEE REPORT
Our independent directors have reviewed and discussed the Compensation Discussion and Analysis for 2024 with management and, based on such review and discussions, recommended to the Board that the Compensation Discussion and Analysis be included in this Annual Report on Form 10-K for the year ended December 31, 2024.
| | | | | | | | | | | | | | |
| Christine S. Breves | | Garry L. Peiffer | | J. Michael Stice |
| Christopher A. Helms | | Frank M. Semple | | John P. Surma |
EXECUTIVE COMPENSATION TABLES
2024 SUMMARY COMPENSATION TABLE
The following table provides information regarding compensation for our 2024 NEOs for the years shown:
| | | | | | | | | | | | | | | | | | | | | | | | | | | | | | | | | | | | | | |
| Name and Principal Position | | Salary | Stock
Awards | Non-Equity Incentive Plan Compensation | Change in Pension Value and Nonqualified Deferred Compensation Earnings | All Other Compensation | Total |
| Year | ($) | ($) | ($) | ($) | ($) | ($) |
| | | | | | | | | | | | |
Maryann T. Mannen President and CEO | 2024 | | 1,196,312 | | | 9,196,582 | | | 3,380,500 | | | 295,011 | | | 320,412 | | | 14,388,817 | |
Michael J. Hennigan Executive Chairman, Former President and CEO | 2024 | | 1,457,377 | | | 17,084,462 | | | 3,759,500 | | | 799,469 | | | 654,345 | | | 23,755,153 | |
| 2023 | | 1,737,809 | | | 16,200,864 | | | 4,688,700 | | | 741,763 | | | 685,356 | | | 24,054,492 | |
| 2022 | | 1,675,343 | | | 13,925,769 | | | 4,376,800 | | | 595,747 | | | 714,873 | | | 21,288,532 | |
C. Kristopher Hagedorn Executive Vice President and CFO | 2024 | | 525,000 | | | 1,385,103 | | | 615,600 | | | 88,150 | | | 92,781 | | | 2,706,634 | |
Molly R. Benson Chief Legal Officer and Corporate Secretary | 2024 | | 650,000 | | | 2,077,884 | | | 914,600 | | | 167,578 | | | 101,554 | | | 3,911,616 | |
Gregory S. Floerke Executive Vice President and Chief Operating Officer | 2024 | | 650,382 | | | 1,847,027 | | | 722,300 | | | 183,934 | | | 120,290 | | | 3,523,933 | |
| 2023 | | 612,685 | | | 1,571,827 | | | 704,700 | | | 186,873 | | | 109,762 | | | 3,185,847 | |
| 2022 | | 582,603 | | | 1,477,916 | | | 664,600 | | | 103,263 | | | 110,700 | | | 2,939,082 | |
Shawn M. Lyon Senior Vice President Logistics and Storage | 2024 | | 631,967 | | | 1,731,580 | | | 711,300 | | | 177,937 | | | 130,061 | | | 3,382,845 | |
| 2023 | | 550,617 | | | 1,450,727 | | | 653,600 | | | 237,649 | | | 123,112 | | | 3,015,705 | |
Salary shows the actual amount earned during the year. See "2024 Base Salary” on page 125 for additional information on base salaries for 2024, including the effective dates of any mid-year base salary adjustments. Stock Awards reflect the aggregate grant date fair value of LTI awarded for the year indicated, calculated in accordance with Financial Accounting Standards Board Accounting Standards Codification 718, Compensation—Stock Compensation (“FASB ASC Topic 718”). MPC’s Compensation Committee awards LTI to our NEOs based on intended target values, which reflect established compensation valuation methodologies that differ in some respects from the FASB ASC Topic 718 methodologies; thus, the amounts shown in this table may differ from the intended target award values. See “2024 Long-Term Incentive Compensation Program” beginning on page 129 for additional information about the intended target values for the 2024 LTI awards to our NEOs. For assumptions used to determine the values of LTI awards as shown in this table, see the “Grant Date Fair Value” note accompanying the “2024 Grants of Plan-Based Awards” table on page 136; Item 8. Financial Statements and Supplementary Data - Note 25 to MPC’s Annual Report on Form 10-K for the year ended December 31, 2024; and Item 8. Financial Statements and Supplementary Data - Note 2 of this report. MPC PSUs are included in this column at their target value because target was determined to be the probable outcome for the applicable performance period at the time of grant of each award, consistent with the accounting treatment under GAAP. The maximum grant date value of the PSUs granted in 2024, assuming the highest level of performance achieved, is: Ms. Mannen, $11,919,254; Mr. Hennigan, $22,102,085; Mr. Hagedorn, $1,791,891; Ms. Benson, $2,688,256; Mr. Floerke, $2,389,608; Mr. Lyon, $2,240,073.
Non-Equity Incentive Plan Compensation reflects the total ACB award earned for the year indicated, paid the following year. See “2024 Annual Cash Bonus Program” beginning on page 126 for additional information on payouts under this program for 2024. Change in Pension Value and Nonqualified Deferred Compensation Earnings reflects the annual change in actuarial present value of accumulated benefits under MPC’s retirement plans. See “Post-Employment Benefits for 2024” beginning on page 139 for more information about the defined benefit plans and the assumptions used to calculate these amounts. No deferred compensation earnings are reported as the nonqualified deferred compensation plans do not provide above-market or preferential earnings.
All Other Compensation aggregates MPC’s contributions to defined contribution plans and the limited perquisites MPC offers to our NEOs, which are described in more detail under “Other Benefits” beginning on page 131. | | | | | | | | | | | | | | | | | | | | | | | | | | | | | | | | | | | | | | | | | | | | |
| Name | Personal Use of Company Aircraft
($) | Company Physicals
($) | Tax and Financial Planning
($) | Security
($) | Company Contributions to Defined Contribution Plans
($) | Other
($) | Total All Other Compensation
($) |
| | | | | | | | | | | | | | |
| Mannen | 83,731 | | 4,806 | | 15,000 | | — | | | 208,673 | | 8,202 | | | 320,412 | |
| Hennigan | 187,480 | | 4,806 | | 15,000 | | 3,919 | | 432,719 | | 10,421 | | | 654,345 | |
| Hagedorn | — | | | 4,806 | | 15,000 | | — | | | 67,529 | | 5,446 | | | 92,781 | |
| Benson | — | | | 4,806 | | 15,000 | | — | | | 81,343 | | 405 | | | 101,554 | |
| Floerke | — | | | 4,806 | | 15,000 | | — | | | 95,057 | | 5,427 | | | 120,290 | |
| Lyon | 13,820 | | 4,806 | | 15,000 | | — | | | 90,115 | | 6,320 | | | 130,061 | |
“Personal Use of Company Aircraft” reflects MPC’s aggregate incremental cost of personal use of company aircraft by our NEOs, their spouses or other guests for 2024. MPC determines the incremental cost for personal use of its company aircraft based on the variable costs to operate the aircraft, including incremental aircraft fleet maintenance, but excluding fixed costs that do not change based on usage, such as pilot compensation and the purchase and lease of aircraft. MPC believes this method provides a reasonable estimate of its incremental cost. No income tax assistance or gross-ups are provided for personal use of company aircraft. See “Other Benefits” beginning on page 131 for additional information regarding personal use of MPC aircraft by our NEOs. “Company Contributions to Defined Contribution Plans” reflects MPC’s contributions under its tax-qualified retirement plans and related nonqualified deferred compensation plans. See “Post-Employment Benefits for 2024,” beginning on page 139, and “2024 Nonqualified Deferred Compensation,” beginning on page 142, for more information. “Other” reflects MPC’s aggregate incremental cost for (i) company-sponsored meals and activities at off-site Board meetings,
(ii) for Ms. Mannen and Messrs. Hennigan and Lyon, attendance by their respective spouses at selected business events where appropriate due to the nature of the event and the participant mix, and (iii) the provision of certain digital protection services.
2024 GRANTS OF PLAN-BASED AWARDS
The following table provides information regarding all MPC and MPLX plan-based awards, including cash-based incentive awards and equity-based awards, granted to our NEOs in 2024.
| | | | | | | | | | | | | | | | | | | | | | | | | | | | | | | | |
| Name | Type of Award | Grant Date | Estimated Possible Payouts Under Non-Equity Incentive Plan Awards | Estimated Future Payouts Under Equity Incentive Plan Awards | All Other Stock Awards: Number of Shares of Stock or Units
(#) | Grant Date Fair Value of Stock and Option Awards
($) |
Threshold
($) | Target
($) | Maximum
($) | Threshold
($) | Target
($) | Maximum
($) |
| | | | | | | | | | |
| Mannen | MPC ACB | | — | 2,310,000 | | 4,620,000 | | | | | | |
| MPC RSUs | 3/1/2024 | | | | | | | 5,926 | | 1,026,442 | |
| MPC RSUs | 8/1/2024 | | | | | | | 6,921 | | 1,198,579 | |
| MPC PSUs | 3/1/2024 | | | | 8,889 | | 17,777 | | 35,554 | | | 3,733,526 | |
| MPC PSUs | 8/1/2024 | | | | 5,191 | | 10,381 | | 20,762 | | | 2,226,102 | |
| MPLX Phantom Units | 3/1/2024 | | | | | | | 25,947 | | 1,011,933 | |
| Hennigan | MPC ACB | | — | 2,404,672 | | 4,809,344 | | | | | | |
| MPC RSUs | 3/1/2024 | | | | | | | 17,540 | | 3,038,103 | |
| MPC PSUs | 3/1/2024 | | | | 26,310 | | 52,619 | | 105,238 | | | 11,051,042 | |
| MPLX Phantom Units | 3/1/2024 | | | | | | | 76,803 | | 2,995,317 | |
| Hagedorn | MPC ACB | | — | 393,750 | | 787,500 | | | | | | |
| MPC RSUs | 3/1/2024 | | | | | | | 1,422 | | 246,305 | |
| MPC PSUs | 3/1/2024 | | | | 2,133 | | 4,266 | | 8,532 | | | 895,945 | |
| MPLX Phantom Units | 3/1/2024 | | | | | | | 6,227 | | 242,853 | |
| Benson | MPC ACB | | — | 585,000 | | 1,170,000 | | | | | | |
| MPC RSUs | 3/1/2024 | | | | | | | 2,133 | | 369,457 | |
| MPC PSUs | 3/1/2024 | | | | 3,200 | | 6,400 | | 12,800 | | | 1,344,128 | |
| MPLX Phantom Units | 3/1/2024 | | | | | | | 9,341 | | 364,299 | |
| Floerke | MPC ACB | | — | 462,000 | | 924,000 | | | | | | |
| MPC RSUs | 3/1/2024 | | | | | | | 1,896 | | 328,406 | |
| MPC PSUs | 3/1/2024 | | | | 2,845 | | 5,689 | | 11,378 | | | 1,194,804 | |
| MPLX Phantom Units | 3/1/2024 | | | | | | | 8,303 | | 323,817 | |
| Lyon | MPC ACB | | — | 455,000 | | 910,000 | | | | | | |
| MPC RSUs | 3/1/2024 | | | | | | | 1,778 | | 307,967 | |
| MPC PSUs | 3/1/2024 | | | | 2,667 | | 5,333 | | 10,666 | | | 1,120,037 | |
| MPLX Phantom Units | 3/1/2024 | | | | | | | 7,784 | | 303,576 | |
Approval Dates. The MPC RSUs and PSUs granted on March 1, 2024 and August 1, 2024, were approved by MPC’s Compensation Committee on January 25, 2024 and July 30, 2024, respectively. The MPLX phantom units granted on March 1, 2024 were approved by the MPLX Committee on January 25, 2024.
MPC RSUs generally vest in equal installments on the first, second and third anniversaries of the grant date and are settled in MPC common stock. Unvested RSUs accrue dividend equivalents, which are paid on the scheduled vesting dates. Holders of unvested RSUs do not have voting rights.
MPC PSUs generally vest following a 36-month performance period and are settled 100% in cash. Unvested PSUs do not accrue dividends or dividend equivalents and do not have voting rights. The target PSUs shown reflect the target dollar value of each award divided by the MPC common stock 30-day average closing price prior to the grant date. The threshold, which is the minimum possible payout, is met when the relative PSU TSR percentile achieved is 30th, resulting in a payout percentage of 50%. Performance below this threshold would result in no payout. The maximum payout percentage is 200% of target. MPC PSUs are described in further detail under “2024 Long-Term Incentive Compensation Program” beginning on page 129. MPLX Phantom Units generally vest in equal installments on the first, second and third anniversaries of the grant date and are settled in MPLX common units. Distribution equivalents accrue on the phantom unit awards and are paid on the scheduled vesting dates. Holders of unvested phantom units have no voting rights.
Grant Date Fair Value reflects the total grant date fair value of each equity award calculated in accordance with FASB ASC Topic 718. The MPC RSU values are based on the MPC common stock closing price on the grant date (or the prior business day if the grant date did not fall on a business day), which was $173.21 and $173.18 for the March 1, 2024 and August 1, 2024 awards, respectively . The MPC PSU values were $210.02 and $214.44 per unit, using a Monte Carlo valuation model, for the March 1, 2024 and August 1, 2024 awards, respectively. The MPLX phantom unit value is based on the MPLX common unit closing price on the grant date (or the prior business day if the grant date did not fall on a business day), which was $39.00 for the March 1, 2024 awards.
OUTSTANDING EQUITY AWARDS AT 2024 FISCAL YEAR-END
The following table provides information regarding the outstanding equity awards held by our NEOs as of December 31, 2024.
| | | | | | | | | | | | | | | | | | | | | | | | | | | | | | | | | | | | | | | | | | | | | | | | | | |
| Option Awards | | Stock Awards | |
| Name | Grant Date | Number of Securities Underlying Unexercised Options (#) Exercisable | Number of Securities Underlying Unexercised Options (#) Unexercisable | Option Exercise Price
($) | Option Exercise Date | | Number of Shares or Units of Stock That Have Not Vested
(#) | Market Value of Shares or Units of Stock That Have Not Vested
($) | Equity Incentive Plan Awards:
Number of Unearned Shares, Units or Other Rights that Have Not Vested
(#) | Equity Incentive Plan Awards: Market or Payout Value of Unearned Shares, Units or Other Rights that Have Not Vested
($) |
| | | | | | | | | | | | | | | | |
| Mannen | | — | | | — | | | | | MPC | 21,212 | | 2,959,074 | | 49,920 | | 13,927,680 | |
| | — | | | — | | | | | MPLX | 51,622 | | 2,470,629 | | — | | | — | | |
| Hennigan | | — | | | — | | | | | MPC | 40,781 | | 5,688,950 | | 117,421 | | 32,760,459 | |
| — | | | — | | | | | MPLX | 147,195 | | 7,044,753 | | — | | | — | | |
| Hagedorn | | — | | | — | | | | | MPC | 2,391 | | 333,545 | | 6,684 | | 1,864,836 | |
| — | | | — | | | | | MPLX | 9,171 | | 438,924 | | — | | | — | | |
| Benson | 3/1/2019 | 10,879 | | — | | | 62.68 | 3/1/2029 | MPC | 3,449 | | 481,136 | | 10,269 | | 2,865,051 | |
| 3/1/2020 | 17,196 | | — | | | 47.73 | 3/1/2030 | MPLX | 13,286 | | 635,868 | | — | | | — | | |
| Floerke | | — | | | — | | | | | MPC | 4,234 | | 590,643 | | 11,976 | | 3,341,304 | |
| — | | | — | | | | | MPLX | 51,793 | | 2,478,813 | | — | | | — | | |
| Lyon | | — | | | — | | | | | MPC | 4,018 | | 560,511 | | 11,136 | | 3,106,944 | |
| — | | | — | | | | | MPLX | 11,897 | | 569,390 | | — | | | — | | |
MPC Stock Options generally vest in equal installments on the first, second and third anniversaries of the grant date and expire 10 years after the grant date. The exercise price is generally equal to the closing price of MPC’s common stock on the grant date (or the prior business day if the grant date did not fall on a business day). Option holders do not have voting rights or receive dividends on the underlying stock. No stock options have been granted to any NEO since 2020.
Number of Shares or Units of Stock That Have Not Vested reflect the number of unvested MPC RSUs and MPLX phantom units held on December 31, 2024. MPC RSUs and MPLX phantom units generally vest in equal installments on the first, second and third anniversaries of the grant date.
| | | | | | | | | | | | | | | | | | | | | | | | | | |
| MPC RSUs | MPLX Phantom Units |
| Name | Grant Date | Number of RSUs That Have Not Vested (#) | Vesting Date | Grant Date | Number of Phantom Units That Have Not Vested (#) | Vesting Date |
| | | | | | | | |
| Mannen | 3/1/2022 | 3,529 | | | 3/1/2025 | 3/1/2022 | 8,359 | | | 3/1/2025 |
| 3/1/2023 | 4,836 | | | 3/1/2025, 3/1/2026 | 3/1/2023 | 17,316 | | | 3/1/2025, 3/1/2026 |
| 3/1/2024 | 5,926 | | | 3/1/2025, 3/1/2026, 3/1/2027 | 3/1/2024 | 25,947 | | | 3/1/2025, 3/1/2026, 3/1/2027 |
| 8/1/2024 | 6,921 | | | 8/1/2025, 8/1/2026, 8/1/2027 | | 51,622 | | | |
| 21,212 | | | | | | | |
| Hennigan | 3/1/2022 | 10,121 | | | 3/1/2025 | 3/1/2022 | 23,971 | | | 3/1/2025 |
| 3/1/2023 | 13,822 | | | 3/1/2025, 3/1/2026 | 3/1/2023 | 49,492 | | | 3/1/2025, 3/1/2026 |
| 3/1/2024 | 16,838 | | | 3/1/2025, 3/1/2026, 3/1/2027 | 3/1/2024 | 73,732 | | | 3/1/2025, 3/1/2026, 3/1/2027 |
| 40,781 | | | | | 147,195 | | | |
| Hagedorn | 3/1/2022 | 431 | | | 3/1/2025 | 3/1/2022 | 1,020 | | | 3/1/2025 |
| 3/1/2023 | 538 | | | 3/1/2025, 3/1/2026 | 3/1/2023 | 1,924 | | | 3/1/2025, 3/1/2026 |
| 3/1/2024 | 1,422 | | | 3/1/2025, 3/1/2026, 3/1/2027 | 3/1/2024 | 6,227 | | | 3/1/2025, 3/1/2026, 3/1/2027 |
| 2,391 | | | | | 9,171 | | | |
| Benson | 3/1/2022 | 578 | | | 3/1/2025 | 3/1/2022 | 1,371 | | | 3/1/2025 |
| 3/1/2023 | 825 | | | 3/1/2025, 3/1/2026 | 3/1/2023 | 2,955 | | | 3/1/2025, 3/1/2026 |
| 3/1/2024 | 2,046 | | | 3/1/2025, 3/1/2026, 3/1/2027 | 3/1/2024 | 8,960 | | | 3/1/2025, 3/1/2026, 3/1/2027 |
| 3,449 | | | | | 13,286 | | | |
| | | | | | | | | | | | | | | | | | | | | | | | | | |
| MPC RSUs | MPLX Phantom Units |
| Name | Grant Date | Number of RSUs That Have Not Vested (#) | Vesting Date | Grant Date | Number of Phantom Units That Have Not Vested (#) | Vesting Date |
| Floerke | 3/1/2022 | 1,074 | | | 3/1/2025 | 12/18/2015 | 36,476 | | | Upon termination without cause* |
| 3/1/2023 | 1,341 | | | 3/1/2025, 3/1/2026 | 3/1/2022 | 2,545 | | | 3/1/2025 |
| 3/1/2024 | 1,819 | | | 3/1/2025, 3/1/2026, 3/1/2027 | 3/1/2023 | 4,802 | | | 3/1/2025, 3/1/2026 |
| 4,234 | | | | 3/1/2024 | 7,970 | | | 3/1/2025, 3/1/2026, 3/1/2027 |
| | | | | 51,793 | | | |
| Lyon | 3/1/2022 | 1,076 | | | 3/1/2025 | 3/1/2023 | 4,430 | | | 3/1/2025, 3/1/2026 |
| 3/1/2023 | 1,237 | | | 3/1/2025, 3/1/2026 | 3/1/2024 | 7,467 | | | 3/1/2025, 3/1/2026, 3/1/2027 |
| 3/1/2024 | 1,705 | | | 3/1/2025, 3/1/2026, 3/1/2027 | | 11,897 | | | |
| 4,018 | | | | | | | |
* In the event of Mr. Floerke’s termination of employment for any reason other than for cause, the MPLX phantom units he received as part of his retention award in 2015 will become payable.
Market Value of Shares or Units of Stock That Have Not Vested reflects the aggregate value of all unvested MPC RSUs and MPLX phantom units held on December 31, 2024, using the MPC closing common stock price ($139.50) and the MPLX closing common unit price ($47.86) on December 31, 2024, the last trading day of the year.
Equity Incentive Plan Awards That Have Not Vested reflects the number of unvested MPC PSUs held on December 31, 2024. PSUs generally vest following a 36-month performance period.
| | | | | | | | | | | | | | | | | | | | | | | | | | | | | | | | | | | | | | |
| Name | Grant Date | Number of PSUs That Have Not Vested (#) | Performance Period | | | Name | Grant Date | Number of PSUs That Have Not Vested (#) | Performance Period | |
| | | | | | | | | | | | |
| Mannen | 3/1/2023 | 21,762 | | | 1/1/2023 - 12/31/2025 | | | Benson | 3/1/2023 | 3,869 | | | 1/1/2023 - 12/31/2025 | |
| 3/1/2024 | 17,777 | | | 1/1/2024 - 12/31/2026 | | | 3/1/2024 | 6,400 | | | 1/1/2024 - 12/31/2026 | |
| 8/1/2024 | 10,381 | | | 1/1/2024 - 12/31/2026 | | | | 10,269 | | | | |
| 49,920 | | | | | | | | | | |
| Hennigan | 3/1/2023 | 64,802 | | | 1/1/2023 - 12/31/2025 | | | Floerke | 3/1/2023 | 6,287 | | | 1/1/2023 - 12/31/2025 | |
| 3/1/2024 | 52,619 | | | 1/1/2024 - 12/31/2026 | | | 3/1/2024 | 5,689 | | | 1/1/2024 - 12/31/2026 | |
| 117,421 | | | | | | | 11,976 | | | | |
| Hagedorn | 3/1/2023 | 2,418 | | | 1/1/2023 - 12/31/2025 | | | Lyon | 3/1/2023 | 5,803 | | | 1/1/2023 - 12/31/2025 | |
| 3/1/2024 | 4,266 | | | 1/1/2024 - 12/31/2026 | | | 3/1/2024 | 5,333 | | | 1/1/2024 - 12/31/2026 | |
| 6,684 | | | | | | | 11,136 | | | | |
Market Value of Equity Incentive Plan Awards That Have Not Vested reflects the aggregate value of all unvested MPC PSUs held on December 31, 2024, calculated using the MPC closing common stock price ($139.50) on December 31, 2024, the last trading day of the year, and an assumed payout of 200% per unit, which is the next higher performance achievement that exceeds the performance for these awards measured as of December 31, 2024.
Nonforfeitability of Certain Awards. Each NEO (other than Ms. Mannen and Mr. Hagedorn) is eligible for an Approved Separation, under which their outstanding MPC RSUs, MPC PSUs and MPLX phantom units would become nonforfeitable should they resign under certain conditions, as further discussed below under “Potential Payments Upon Termination or Change in Control—Voluntary Termination—Approved Separation.”
When certain awards become nonforfeitable, applicable taxes are immediately due. So that the participants do not have an out-of-pocket expense for these awards that have not yet distributed, the award is instead reduced to cover the tax obligation. These awards continue to be reflected in the tables above as they remain subject to distribution on their original vesting dates; however, the portions used to pay any associated taxes have been excluded from these tables and are instead included in the “Option Exercises and Stock Vested in 2024” table on page 139.
OPTION EXERCISES AND STOCK VESTED IN 2024
The following table provides information regarding MPC stock options exercised by our NEOs in 2024, as well as MPC RSUs and MPLX phantom units vested in 2024.
| | | | | | | | | | | | | | | | | | | | | | | | | | | | | |
| | Option Awards | | Stock Awards | |
| Name | | Number of Shares Acquired on Exercise
(#) | Value Realized on Exercise
($) | Number of Shares/Units Acquired on Vesting
(#) | Value Realized on Vesting
($) |
| | | | | | | | | |
| Mannen | MPC | — | | | — | | | 37,504 | | 6,306,428 | |
| MPLX | — | | | — | | | 28,060 | | 1,090,692 | |
| Hennigan | MPC | — | | | — | | | 31,923 | | 5,482,810 | |
| MPLX | — | | | — | | | 81,596 | | 3,202,316 | |
| Hagedorn | MPC | — | | | — | | | 1,290 | | 222,319 | |
| MPLX | — | | | — | | | 1,982 | | 77,040 | |
| Benson | MPC | — | | | — | | | 3,118 | | 569,868 | |
| MPLX | — | | | — | | | 5,083 | | 201,382 | |
| Floerke | MPC | — | | | — | | | 3,208 | | 550,805 | |
| MPLX | — | | | — | | | 8,192 | | 321,750 | |
| Lyon | MPC | — | | | — | | | 2,786 | | 478,184 | |
| MPLX | — | | | — | | | 2,531 | | 101,547 | |
Option Awards: Value Realized on Exercise reflects the actual pre-tax gain realized by our NEOs upon exercise of MPC stock options, which is the fair market value of the shares at exercise less the per share grant price. No stock options have been granted since 2020.
Stock Awards: Number of Shares/Units Acquired on Vesting includes the following numbers of shares/units used to pay the taxes associated with the vesting of certain awards held by the NEOs as discussed further under “Outstanding Equity Awards at 2024 Fiscal Year-End”: Mr. Hennigan, 702 MPC RSUs, 3,071 MPLX phantom units; Ms. Benson, 87 MPC RSUs, 381 MPLX phantom units; Mr. Floerke, 77 RSUs, 333 MPLX phantom units; Mr. Lyon, 73 MPC RSUs, 317 MPLX phantom units.
Stock Awards: Value Realized on Vesting reflects the fair market value of the shares/units on the vesting date.
POST-EMPLOYMENT BENEFITS FOR 2024
2024 Pension Benefits
The following table reflects the actuarial present value of accumulated benefits payable to each NEO under MPC’s Retirement Plan (defined below) and the defined benefit portion of MPC’s Excess Benefit Plan (defined below) as of December 31, 2024. These values have been determined using actuarial assumptions consistent with those used in MPC’s financial statements.
| | | | | | | | | | | | | | | | | | | | | | | |
| Name | Plan Name | Number of Years Credited Service
(#) | Present Value of Accumulated Benefit
($) | Payments During Last Fiscal Year
($) |
| | | | | | | |
| Mannen | Retirement Plan | 4.00 | | 121,026 | | — | | |
| Excess Benefit Plan | 4.00 | | 739,218 | | — | | |
| Hennigan | Retirement Plan | 7.58 | | 253,488 | | — | | |
| Excess Benefit Plan | 7.58 | | 3,298,186 | | — | | |
| Hagedorn | Retirement Plan | 7.08 | | 176,354 | | — | | |
| Excess Benefit Plan | 7.08 | | 199,764 | | — | | |
| Benson | Retirement Plan | 26.67 | | 1,060,682 | | — | | |
| Excess Benefit Plan | 26.67 | | 647,400 | | — | | |
| Floerke | Retirement Plan | 11.42 | | 280,641 | | — | | |
| Excess Benefit Plan | 11.42 | | 826,098 | | — | | |
| Lyon | Retirement Plan | 35.67 | | 1,460,582 | | — | | |
| Excess Benefit Plan | 35.67 | | 739,070 | | — | | |
Number of Years Credited Service shows the number of years the NEO has participated in each plan. Plan participation service used to calculate each participant’s benefit under the Retirement Plan legacy benefit formula (applicable to Ms. Benson and Mr. Lyon only) was frozen as of December 31, 2009. Mr. Floerke’s credited service for purposes of the Retirement Plan and Excess Benefit Plan includes 2.42 years of service credited for his employment with a subsidiary of MarkWest Energy Partners, L.P., which MPC acquired in 2015.
Present Value of Accumulated Benefit for the legacy benefit under the Retirement Plan was calculated assuming an 85% lump sum election rate with a lump sum interest rate between 0.50% and 2.00% (based on anticipated year of retirement) and the RP-2000 mortality table, and a 15% annuity election rate with a discount rate of 5.65% and the Pri-2012 mortality table with generational mortality improvements in accordance with Scale MP-2021, both calculated assuming retirement at age 62 (or current age, if later). See "Retirement Plan" below for more detail on the legacy benefit formula.
The present value of accumulated benefits for the cash balance benefits under the Retirement Plan was calculated assuming retirement at age 62 (or current age, if later), a discount rate of 5.65%, a cash balance interest credit rating of 4.56% in 2024, 4.19% in 2025 and 4.78% in 2026 and beyond, and the Pri-2012 mortality table with generational mortality improvements in accordance with Scale MP-2021. See "Retirement Plan" below for more detail on the cash balance benefit formula under each plan.
Tax-Qualified Defined Benefit Retirement Plan
MPC’s employees, including our NEOs, participate in the Marathon Petroleum Retirement Plan (“Retirement Plan”), a tax-qualified defined benefit retirement plan primarily designed to provide participants with income after retirement. The Retirement Plan is sponsored by Marathon Petroleum Company LP (“MPC LP”), MPC’s indirect wholly owned subsidiary. Participants in the plan become fully vested upon completing three years of vesting service. Normal retirement age under the plan is 65. The plan has both a “legacy” retirement benefit and a “cash balance” retirement benefit.
Legacy Benefit
Prior to 2010, the monthly benefit was determined under the following legacy benefit formula:
| | |
Legacy Monthly Benefit = [(1.6% x Monthly Final Average Pay) – (1.33% x Monthly Estimated Primary Social Security Benefit)] x Years of Participation |
This formula was amended effective January 1, 2010, to cease future accruals of additional participation years and, as applied to eligible NEOs, cease further compensation updates. No more than 37.5 participation years may be recognized under the formula. Eligible earnings include, but are not limited to, pay for hours worked, pay for allowed hours, military leave allowance, commissions, bonuses and elective deferrals to the Thrift Plan (defined below). Age continues to be updated under the formula.
Under the legacy retirement benefit, a vested participant who is at least age 62 may retire prior to age 65 and receive an unreduced benefit. Ms. Benson and Mr. Lyon each have legacy retirement benefits under the plan that remain subject to reduction as neither executive has reached age 62. Available benefits include various annuity options and a lump sum distribution option. Participants are eligible for early retirement upon reaching age 50 and completing 10 years of vesting service. If an employee retires between the ages of 50 and 62 with sufficient vesting service, the amount of benefit under the legacy benefit formula is reduced as follows:
| | | | | | | | | | | | | | | | | | | | | | | | | | | | | | | | | | | | | | | | | | | | | | | | | | | | | | | | | | | | | | | | | | | | | | | | | | | | | |
| | | | | | | | | | | | | | | | | | | | | | | | | |
| Age at Retirement | 62 | | 61 | | 60 | | 59 | | 58 | | 57 | | 56 | | 55 | | 54 | | 53 | | 52 | | 51 | | 50 |
| | | | | | | | | | | | | | | | | | | | | | | | | |
| Early Retirement Factor | 100% | | 97% | | 94% | | 91% | | 87% | | 83% | | 79% | | 75% | | 71% | | 67% | | 63% | | 59% | | 55% |
| | | | | | | | | | | | | | | | | | | | | | | | | |
The plan was amended effective August 31, 2022, to allow an active participant who has attained age 59.5 to elect to take an in-service distribution of their legacy retirement benefit on or after December 1, 2022. As of December 31, 2024, no NEO was eligible to elect an in-service distribution.
Cash Balance Benefit
Starting in 2010, benefit accruals are determined under the following cash balance formula:
| | |
|
Cash Balance Annual Benefit = (Annual Compensation x Pay Credit Percentage) + (Account Balance x Interest Credit Rate) |
|
Participants receive pay credit percentages based on the sum of their age and cash balance service:
| | | | | | | | | | | | | | | | | | | | |
| | | | | | |
| Participant Points | Fewer than 50 Points | | 50-69 Points | | 70 Points or More | |
| | | | | | |
| Pay Credit Percentage | 7% | | 9% | | 11% | |
| | | | | | |
Annual compensation is limited to $345,000 for 2024 and generally includes wages and salary for time worked, with certain exclusions. Under the cash balance retirement benefit, a vested participant may retire at any age prior to 65 and receive an unreduced benefit. Each NEO has a vested cash balance retirement benefit under the plan that is not subject to reduction upon retirement. Under the cash balance formula, plan participants receive pay credits based on age and cash balance service. For 2024, Messrs. Hennigan, Floerke and Lyon and Ms. Benson received pay credits equal to 11% of compensation, and Ms. Mannen and Mr. Hagedorn received pay credits equal to 9% of compensation. There are no early retirement subsidies under the cash balance formula.
Excess Benefit Plan (Defined Benefit Portion)
The Marathon Petroleum Excess Benefit Plan (“Excess Benefit Plan”), sponsored by MPC LP, is an unfunded nonqualified deferred compensation plan maintained for the benefit of a select group of management or highly compensated employees, including our NEOs. This plan generally provides benefits that participants would have otherwise received under the tax-qualified Retirement Plan were it not for Internal Revenue Code limitations. For our NEOs, eligible earnings under the plan include the compensation items shown above for the Retirement Plan, but without regard to any Internal Revenue Code limit, as well as any salary and bonus amounts deferred by the NEO under the Executive Deferred Compensation Plan (defined below).
With respect to Ms. Benson and Mr. Lyon, who have frozen legacy-type benefits under the plan, eligible earnings for the legacy-type portion were determined using each NEO’s highest consecutive 36-month compensation (exclusive of bonuses) and three highest bonuses earned over the 10-year period up to December 31, 2012. None of the other NEOs have a legacy-type benefit under the plan.
The Excess Benefit Plan permits MPC’s Compensation Committee, on a discretionary basis, to extend a lump sum retirement benefit supplement (“Service Benefit”) to individual officers of MPC who have a frozen legacy-type benefit under the plan to offset the age-related erosion (if any) of the frozen legacy-type benefit from age 62 until such officer’s actual retirement date or date of death. An officer must be vested under the Retirement Plan to qualify for the Service Benefit. Ms. Benson and Mr. Lyon have frozen legacy-type benefits under the plan; however, MPC’s Compensation Committee has not extended eligibility for this benefit to either of them at this time.
Tax-Qualified Defined Contribution Retirement Plan
The Marathon Petroleum Thrift Plan (“Thrift Plan”), sponsored by MPC LP, is a tax-qualified, defined contribution retirement plan. In general, all of MPC’s employees, including our NEOs, are immediately eligible to participate in the plan. The purpose of the plan is to assist employees in maintaining a steady program of savings to supplement their retirement income and to meet other financial needs.
The Thrift Plan allows eligible employees, such as our NEOs, to make elective deferral contributions to their plan accounts on a pre-tax, after-tax or “Roth” basis from 1% to a maximum of 75% of their plan-considered gross pay, with such gross pay limited to the applicable Internal Revenue Code annual compensation limit ($345,000 for 2024). Eligible employees who are “highly compensated employees” as determined under the Internal Revenue Code, such as our NEOs, may make after-tax contributions to their plan accounts from only 1% to 6% of their plan-considered gross pay limited to the applicable Internal Revenue Code annual compensation limit ($345,000 for 2024). Employer matching contributions are made on such elective deferrals and after-tax contributions at a rate of 117% up to a maximum of 6% of an employee’s plan-considered gross pay. All employee elective deferrals and after-tax contributions, and all employer matching contributions made, are fully vested.
2024 NONQUALIFIED DEFERRED COMPENSATION
The following table provides information regarding MPC’s nonqualified savings and deferred compensation plans.
| | | | | | | | | | | | | | | | | | | | |
| Name | Plan | Executive Contributions in Last Fiscal Year
($) | MPC Company Contributions in Last Fiscal Year
($) | Aggregate Earnings in Last Fiscal Year
($) | Aggregate Withdrawals/Distributions
($) | Aggregate Balance at Last Fiscal Year-End
($) |
| | | | | | |
| Mannen | Deferred Compensation Plan | — | | — | | 3,002 | | — | | 40,906 |
| Executive Deferred Compensation Plan | — | | 184,454 | 32,816 | | — | | 558,530 |
| Hennigan | Deferred Compensation Plan | — | | — | | 1,031,550 | | — | | 6,378,128 |
| Executive Deferred Compensation Plan | — | | 408,500 | 176,288 | | — | | 1,703,804 |
| MPC 2012 Incentive Compensation Plan | — | | — | | 11,708 | | 115,373 | — | |
| MPC 2021 Incentive Compensation Plan | — | | — | | 139,999 | | 82,356 | 206,744 |
| MPLX LP 2018 Incentive Compensation Plan | — | | — | | 528,371 | | 522,708 | 700,738 |
| Hagedorn | Excess Benefit Plan | — | | — | | 899 | | — | | 43,670 |
| Executive Deferred Compensation Plan | — | | 43,310 | 26,521 | | — | | 166,010 |
| Benson | Excess Benefit Plan | — | | — | | 507 | | — | | 24,632 |
| Deferred Compensation Plan | — | | — | | 37,380 | | — | | 262,076 |
| Executive Deferred Compensation Plan | — | | 57,124 | 86,607 | | — | | 403,986 |
| MPC 2012 Incentive Compensation Plan | — | | — | | 1,682 | | 16,577 | — | |
| MPC 2021 Incentive Compensation Plan | — | | — | | 11,028 | | 4,886 | 14,789 |
| MPLX LP 2018 Incentive Compensation Plan | — | | — | | 43,980 | | 32,074 | 53,414 |
| Floerke | Deferred Compensation Plan | — | | — | | 104,952 | | — | | 620,156 |
| Executive Deferred Compensation Plan | 32,469 | 70,838 | 21,965 | | — | | 359,541 |
| MPC 2012 Incentive Compensation Plan | — | | — | | 1,144 | | 11,277 | — | |
| MPC 2021 Incentive Compensation Plan | — | | — | | 14,467 | | 8,545 | 21,307 |
| MPLX LP 2012 Incentive Compensation Plan | — | | — | | 127,903 | | — | | 913,505 |
| MPLX LP 2018 Incentive Compensation Plan | — | | — | | 54,499 | | 52,376 | 72,100 |
| Lyon | Excess Benefit Plan | — | | — | | 2,710 | | — | | 131,699 |
| Executive Deferred Compensation Plan | — | | 65,896 | 27,396 | | — | | 212,050 |
| MPC 2021 Incentive Compensation Plan | — | | — | | 9,249 | | 2,132 | 11,431 |
| MPLX LP 2018 Incentive Compensation Plan | — | | — | | 38,094 | | 8,037 | 46,003 |
Executive Contributions are also included in the “Salary” and “Non-Equity Incentive Plan Compensation” columns of the “2024 Summary Compensation Table” on page 134. Company Contributions are also included in the “All Other Compensation” column of the “2024 Summary Compensation Table” on page 134. Aggregate Earnings for long-term incentive and incentive compensation plans include accrued dividends/dividend equivalents and distribution equivalents on nonforfeitable MPC RSUs and MPLX phantom unit awards.
Aggregate Withdrawals/Distributions represent the payment of dividends/dividend equivalents and distribution equivalents accrued on nonforfeitable awards.
Aggregate Balance at Last Fiscal Year-End. Of the amounts shown in this column, the following amounts have been reported in our Summary Compensation Table for previous years:
| | | | | | | | | | | | | | | | | | | | |
| Mannen | Hennigan | Hagedorn | Benson | Floerke | Lyon |
| | | | | | |
| Deferred Compensation Plan | — | 3,366,198 | — | — | 281,099 | — |
| Executive Deferred Compensation Plan | — | 1,076,991 | — | — | 223,269 | 52,893 |
Excess Benefit Plan (Defined Contribution Portion)
The Excess Benefit Plan is an unfunded, nonqualified deferred compensation plan maintained for the benefit of a select group of management or highly compensated employees. Participants receive employer matching contributions equal to the amount they would have otherwise received under the tax-qualified Thrift Plan were it not for Internal Revenue Code limitations.
Defined contribution accruals in the Excess Benefit Plan are credited with interest equal to that paid in a specified investment option of the Thrift Plan, which was 2.10% for the year ended December 31, 2024. All plan distributions are paid in a lump sum following the participant’s separation from service. In general, our NEOs no longer actively participate in the defined contribution portion of the Excess Benefit Plan, and all subsequent-year nonqualified employer matching contributions for NEOs now accrue under the Executive Deferred Compensation Plan (defined below).
Deferred Compensation Plan
The Marathon Petroleum Deferred Compensation Plan (“Deferred Compensation Plan”), sponsored by MPC LP, is an unfunded, nonqualified deferred compensation plan maintained for the benefit of a select group of management or highly compensated employees, including our NEOs. Effective January 1, 2021, the plan was generally frozen with respect to any further MPC participant salary and bonus deferrals and additional company contribution credited amounts. Prior to the plan’s freeze, participants could defer up to 20% of their salary and bonus each year in a tax-advantaged manner, with irrevocable deferral elections made in December of each year for amounts to be earned in the following year. The plan credited matching contributions on a participant’s deferrals equal to the match under the Thrift Plan (117% as in effect prior to the plan’s freeze) plus an amount equal to the matching contributions the participant would have received, but for Internal Revenue Code limitations and compensation limits, under the Thrift Plan. Participants are fully vested in all amounts credited on their behalf under the plan. Participants may make notional investments of their notional plan accounts from among certain investment options offered under the Thrift Plan, and participants’ notional plan accounts are credited with notional earnings and losses based on the result of those investment elections. Participants generally receive payment of their plan benefits in a lump sum following separation from service.
Executive Deferred Compensation Plan
The Marathon Petroleum Executive Deferred Compensation Plan (“Executive Deferred Compensation Plan”), sponsored by MPC LP, is an unfunded, nonqualified deferred compensation plan maintained for the benefit of a select group of management or highly compensated employees, including our NEOs. Participants may defer 5% to 20% (in whole percentage increments) of their base salary and annual bonus each year in a tax-advantaged manner. Deferral elections are made each December for amounts to be earned in the following year and are irrevocable. The plan credits matching contributions on a participant’s deferrals equal to the match under the Thrift Plan plus an amount equal to the matching contributions the participant would have received, but for Internal Revenue Code limitations and compensation limits, under the Thrift Plan. Participants are fully vested in their deferrals and matching contributions. Participants may make notional investments of their notional plan accounts from among certain investment options offered under the Thrift Plan, and participants’ notional plan accounts are credited with notional earnings and losses based on the result of those investment elections. Participants may elect to receive payment of their plan benefits in a lump sum or in annual installments over two to five years on or beginning on a specified date while in service or following separation from service.
Section 409A Compliance
All of MPC’s nonqualified deferred compensation plans in which our NEOs participate are intended to comply with, or be exempt from, Section 409A of the Internal Revenue Code. As a result, distribution of amounts subject to Section 409A may be delayed for six months following retirement or other separation from service where the participant is considered a “specified employee” for purposes of Section 409A. All of our NEOs are “specified employees” for purposes of Section 409A.
POTENTIAL PAYMENTS UPON TERMINATION OR CHANGE IN CONTROL
The following discussion provides information regarding the compensation payable to our NEOs under each hypothetical termination scenario, assuming that the applicable termination event occurred on December 31, 2024, based on the plans and agreements in place on that date. The actual payments to which an NEO would be entitled may only be determined based upon the actual occurrence and circumstances surrounding the termination.
Our NEOs would be entitled under each termination scenario to receive their vested benefits that have accrued under MPC’s employee and qualified retirement and nonqualified deferred compensation plans. For more information about our retirement and deferred compensation programs, see “Post-Employment Benefits for 2024,” beginning on page 139, and “2024 Nonqualified Deferred Compensation,” beginning on page 142.
Voluntary Termination
Resignation
Neither we nor MPC generally enter into employment or severance agreements with our NEOs. An NEO who voluntarily resigns is not entitled to a severance payment in most circumstances, is generally only eligible for a bonus under the ACB program if he or she remained employed through the end of the ACB performance period, and will forfeit LTI awards still subject to forfeiture unless provided otherwise in the applicable award agreement.
Approved Separation
Our NEOs generally are eligible for an Approved Separation once they reach age 55 and have at least five years of employment with MPC or its subsidiaries. As of December 31, 2024, each of our NEOs (other than Ms. Mannen and Mr. Hagedorn) was eligible for an Approved Separation.
An NEO who resigns pursuant to an Approved Separation is generally only eligible for a bonus under the ACB program if he or she remained employed through the end of the ACB performance period, unless the NEO is also retirement-eligible, in which case he or she is eligible for a bonus in his or her year of retirement as discussed below.
Under the terms of their respective award agreements, MPC PSUs, MPC RSUs and MPLX phantom units generally become nonforfeitable upon an eligible NEO’s Approved Separation provided he or she has held the awards at least six months and provided notice at least three months (for awards granted in 2023 and 2024; six months for awards granted in 2022) prior to resignation. MPC’s Compensation Committee may, in its sole discretion, waive this notice requirement. See the tables and accompanying narrative under “Outstanding Equity Awards at 2024 Fiscal Year-End” beginning on page 137 for more information about these nonforfeitable awards and their respective vesting dates. Retirement
MPC’s employees, including our NEOs, generally are eligible for retirement once they reach age 50 and have at least 10 years of vesting service with MPC or its subsidiaries. As of December 31, 2024, Ms. Benson and Mr. Lyon were retirement eligible.
Additionally, MPC has a mandatory retirement policy that requires certain officers, including our NEOs, to retire from service with the company upon attaining age 65, absent a waiver or extension by MPC’s Board of Directors.
Retirement-eligible NEOs, and NEOs who retire due to the mandatory retirement policy, are eligible for a bonus under the ACB program in their year of retirement. This bonus is determined and paid in the normal course and prorated based on eligible earnings for the performance period.
LTI awards still subject to forfeiture generally are forfeited upon retirement, except in the case of mandatory retirement, whereupon they vest in full. Payout for MPC PSUs that vest pursuant to mandatory retirement will occur following the full performance cycle based on its certified results.
Involuntary Termination Without Cause
Neither we nor MPC generally enter into employment or severance agreements with our NEOs. An NEO whose employment is terminated without cause is eligible for (i) the same termination allowance plan available to all other MPC employees, which would pay an amount between eight and 62 weeks of salary based either on service or salary level, as well as (ii) a bonus under the ACB program determined and paid in the normal course and prorated for service up to the termination date. All unvested LTI awards would be forfeited unless provided otherwise in the applicable award agreement.
Involuntary Termination for Cause
An NEO who is involuntarily terminated for cause will not be entitled to a severance payment or a bonus under the ACB program and will forfeit all unvested LTI awards unless provided otherwise in the applicable award agreement.
Death
In the event of the death of an NEO during the ACB performance period, his or her bonus would be paid immediately at target and prorated based on eligible earnings for the performance period. LTI awards immediately vest in full upon death, with MPC PSUs vesting at the target level.
Change in Control
Our NEOs participate in two change in control severance plans: the MPC Senior Leader Change in Control Severance Benefits Plan (“MPC CIC Plan”) and the MPLX Senior Leader Change in Control Severance Benefits Plan (“MPLX CIC Plan”). These change in control plans are designed to (i) preserve executives’ economic motivation to consider a business combination that
might result in job loss and (ii) compete effectively in attracting and retaining executives in an industry that features frequent mergers, acquisitions and divestitures.
Upon a change in control (as defined in the applicable plan) of MPC or MPLX and a qualified termination (as defined in the applicable plan or LTI award), our NEOs would be eligible for the following benefits:
•A cash severance payment equal to three times the sum of the NEO’s current annual base salary and current target annual cash bonus;
•A cash welfare benefits payment equal to 18 months of the current monthly COBRA premium; and
•Accelerated vesting of all outstanding MPC LTI awards (in the case of an MPC change in control) and/or all outstanding MPLX LTI awards (in the case of an MPLX change in control).
Benefits under each plan are payable only upon a change in control and a qualified termination. A qualified termination generally occurs when an NEO’s employment with our affiliates and us ends in connection with, or within two years after, a change in control. A qualified termination for this purpose does not include an NEO’s:
•Separation due to death;
•Termination for cause (as defined in the applicable plan); or
•Voluntary termination without good reason (as defined in the applicable plan). “Good reason” generally includes a material reduction in base compensation, authority, duties or responsibilities, or being required to relocate more than 50 miles from one’s current location.
In the event of a change in control and qualified termination under both plans, our NEOs would receive benefits under only one plan – whichever provides the greater benefits at that time. NEOs who receive an offer for comparable employment from an acquirer or successor entity in an MPLX change in control will not be eligible to receive benefits under the MPLX CIC Plan.
The following table shows compensation payable to our NEOs as a direct result of each specified hypothetical termination scenario, assuming the applicable termination event occurred on December 31, 2024, based on the plans and agreements in place on that date.
| | | | | | | | | | | | | | | | | | | | | | | | | | | | | | | | |
| Name | Severance
($) | MPC RSUs/ MPLX Phantom Units Vested
($)(1)(2) | MPC PSUs Vested
($)(1)(3) | Life and Health Insurance Benefits
($)(4) | Total
($) |
| | | | | | | | | | |
| Mannen | | | | | | | | | | |
Resignation/Involuntary Termination(5) | — | | | — | | | — | | | — | | | — | | |
| Change in Control w/ Qualified Termination | 11,130,000 | | 5,429,703 | | 6,963,840 | | 25,430 | | 23,548,973 | |
| Death | — | | | 5,429,703 | | 6,963,840 | | 2,800,000 | | 15,193,543 | |
| Hennigan | | | | | | | | | | |
Resignation/Involuntary Termination(5) | — | | | — | | | — | | | — | | | — | | |
| Change in Control w/ Qualified Termination | 8,347,500 | | — | | | — | | | 35,689 | | 8,383,189 | |
| Death | — | | | — | | | — | | | 2,100,000 | | 2,100,000 | |
| Hagedorn | | | | | | | | | | |
Resignation/Involuntary Termination(5) | — | | | — | | | — | | | — | | | — | | |
| Change in Control w/ Qualified Termination | 2,756,250 | | 772,469 | | 932,418 | | 35,357 | | 4,496,494 | |
| Death | — | | | 772,469 | | 932,418 | | 1,050,000 | | 2,754,887 | |
| Benson | | | | | | | | | | |
Resignation/Involuntary Termination(5) | — | | | — | | | — | | | — | | | — | | |
| Change in Control w/ Qualified Termination | 3,705,000 | | — | | | — | | | 14,116 | | 3,719,116 | |
| Death | — | | | — | | | — | | | 1,300,000 | | 1,300,000 | |
| Floerke | | | | | | | | | | |
Resignation/Involuntary Termination(5) | — | | | — | | | — | | | — | | | — | | |
| Change in Control w/ Qualified Termination | 3,366,000 | | — | | | — | | | 25,230 | | 3,391,230 | |
| Death | — | | | — | | | — | | | 1,320,000 | | 1,320,000 | |
| Lyon | | | | | | | | | | |
Resignation/Involuntary Termination(5) | — | | | — | | | — | | | — | | | — | | |
| Change in Control w/ Qualified Termination | 3,315,000 | | — | | | — | | | 35,689 | | 3,350,689 | |
| Death | — | | | — | | | — | | | 1,300,000 | | 1,300,000 | |
(1) LTI amounts in this table reflect the value of equity that would vest on an accelerated basis as a direct result of each scenario. Because of their eligibility for an Approved Separation, as discussed above, each NEO (other than Ms. Mannen and Mr. Hagedorn) holds LTI awards that have become nonforfeitable by their terms. Awards no longer subject to forfeiture are not included in this table. See the tables and accompanying narrative under “Outstanding Equity Awards at 2024 Fiscal Year-End” beginning on page 137 for more information about these nonforfeitable awards and their respective vesting dates.
(2) Amounts shown are calculated based on the closing prices of MPC common stock ($139.50) and MPLX common units ($47.86) on December 31, 2024, the last trading day of the year.
(3) MPC PSUs would be paid out based on actual performance for the period from the grant date to the date of change in control/death, and target performance for the period from the date of change in control/death to the end of the performance period. Amounts shown are calculated using the MPC PSUs’ target value ($139.50, the closing price of MPC common stock on December 31, 2024, the last trading day of the year).
(4) Under a change of control with a qualified termination, this amount consists of 18 months of COBRA premiums. In the event of death, this amount consists of life insurance that would be paid out to the applicable NEO’s estate.
(5) Includes the following termination scenarios: Resignation; Approved Separation; Involuntary Termination without Cause; and Involuntary Termination for Cause.
CEO PAY RATIO
We do not determine the total compensation of our CEO or of any of the other personnel responsible for managing and operating our business, all of whom are employed by MPC and not by our general partner or us. Because we do not directly employ any employees and do not determine or pay total compensation to the employees of MPC who manage and operate our business, we do not have a median employee whose total compensation can be compared to the total compensation of our CEO.
DIRECTOR COMPENSATION
Officers or employees of our general partner or MPC who also serve as our directors do not receive additional compensation for their service as our director. Directors who are not officers or employees of our general partner or MPC receive compensation as “non-management directors.”
Annual Retainers
Our non-management directors received the following cash and equity retainers for their service on the Board in 2024.
| | | | | | | | | | | | | | |
| | Annual Total | |
| | | | |
| Cash Retainer | •Paid quarterly in equal installments: | | | |
| –Board Member | $100,000 | |
| | | | |
| Additional Leadership Cash Retainers | •Paid quarterly in equal installments (in addition to Board Member retainer): | | | |
–Lead Director | $25,000 | |
–Audit Committee Chair | $25,000 | |
–Conflicts Committee Chair | $25,000 | |
| | | | |
| Conflicts Committee Meeting Fee | •Per meeting, in excess of six meetings | $1,500 | |
| | | |
| | | | |
| Equity Retainer | •Granted quarterly in equal installments,* in the form of MPLX phantom units | $125,000 | |
| •Directors receive distribution equivalents in the form of additional MPLX phantom units | | | |
| | | | |
* Beginning in 2025, the equity retainer will consist of one annual grant in the amount of $125,000, generally made on the day following MPC’s annual meeting of shareholders.
Deferral of Equity Compensation
MPLX phantom units awarded to management directors for Board service in 2024, including those received as distribution equivalents, were automatically deferred, payable in MPLX common units only upon a director’s departure from the Board. Beginning in April 2025, MPLX phantom units awarded for Board service will vest on the first anniversary of the grant date unless a deferral election is made.
Director Unit Ownership Guidelines
Under our unit ownership guidelines, each non-management director is required to hold at least five times the value of the annual cash retainer in MPLX common units, including phantom units. Directors have five years from the commencement of their service on the Board to satisfy these guidelines. All non-management directors either meet these guidelines or are on track to comply within the applicable five-year period.
Matching Gifts
Under MPC’s matching gift programs, directors may elect to have MPC match up to $10,000 annually of their contributions to certain tax-exempt educational institutions and up to $10,000 annually of their contributions to certain eligible tax-exempt charitable organizations. The annual limit for each program is applied based on the date of the director’s gift to the institution or charitable organization.
2024 Director Compensation Table
The following table shows compensation earned by or paid to our non-management directors during 2024 for service on our Board.
| | | | | | | | | | | | | | | | | | | | | | | | | | | | | |
| Name | | Fees Earned or Paid in Cash
($) | Unit Awards
($) | All Other Compensation
($) | Total
($) |
| | | | | | | | | |
| Christine S. Breves | | 100,000 | | | 125,000 | | | — | | | 225,000 | | |
| Christopher A. Helms | | 150,000 | | | 125,000 | | | — | | | 275,000 | | |
| Garry L. Peiffer | | 125,000 | | | 125,000 | | | 20,000 | | | 270,000 | | |
| Frank M. Semple | | 100,000 | | | 125,000 | | | — | | | 225,000 | | |
| J. Michael Stice | | 100,000 | | | 125,000 | | | — | | | 225,000 | | |
| John P. Surma | | 100,000 | | | 125,000 | | | — | | | 225,000 | | |
Fees Earned or Paid in Cash reflect cash retainers earned for Board service in 2024.
Unit Awards reflect the aggregate grant date fair value of MPLX phantom units, calculated in accordance with financial accounting standards. For 2024, non-management directors generally received grants each quarter of MPLX phantom units valued at $31,250 based on the closing price of MPLX common units on each grant date. The aggregate number of MPLX phantom units outstanding for each non-management director as of December 31, 2024 is: Ms. Breves, 7,513; Mr. Helms, 60,264; Mr. Peiffer, 55,091; Mr. Semple, 45,249; Mr. Stice, 37,802; Mr. Surma, 60,264.
All Other Compensation reflects charitable contributions under MPC’s matching gifts programs, as described above. Each program is subject to an annual limit of $10,000, up to an aggregate of $20,000.
Item 12. Security Ownership of Certain Beneficial Owners and Management and Related Stockholder Matters
Security Ownership of Management
The following table sets forth the number of our common units and shares of MPC common stock beneficially owned as of February 1, 2025 by each director and NEO, and by all current directors and executive officers as a group. The address for each person named below is c/o MPLX LP, 200 East Hardin Street, Findlay, Ohio 45840. Unless otherwise indicated, to our knowledge, each person or member of the group listed has sole voting and investment power with respect to the securities shown, and none of the shares or units shown is pledged as security. As of February 1, 2025, there were 1,016,599,461 MPLX common units outstanding (including 647,415,452 common units held by MPC and its affiliates) and 313,805,638 shares of MPC common stock outstanding. | | | | | | | | | | | | | | | | | | | | |
| Name of Beneficial Owner | Amount and Nature of Beneficial Ownership | Percent of Total Outstanding (%) |
| MPLX Common Units | MPC Common Stock | MPLX | MPC |
| | | | | | |
| Current Directors | | | | | | |
| Christine S. Breves | 8,156 | | | — | | | * | * |
| Christopher A. Helms | 71,906 | | | — | | | * | * |
| Garry L. Peiffer | 124,231 | | | 63,394 | | | * | * |
| John J. Quaid | 44,539 | | | 32,434 | | | * | * |
| Frank M. Semple | 543,265 | | | 12,258 | | | * | * |
| J. Michael Stice | 46,228 | | | 21,992 | | | * | * |
| John P. Surma | 78,892 | | | 67,205 | | | * | * |
| Named Executive Officers | | | | | | |
| Maryann T. Mannen | 87,100 | | | 87,526 | | | * | * |
| Michael J. Hennigan | 357,249 | | | 219,040 | | | * | * |
| C. Kristopher Hagedorn | 14,750 | | | 4,304 | | | * | * |
| Molly R. Benson | 35,419 | | | 54,947 | | | * | * |
| Gregory S. Floerke | 89,620 | | | 29,740 | | | * | * |
| Shawn M. Lyon | 17,273 | | | 17,095 | | | * | * |
| All Current Directors and Executive Officers as a group (14 individuals) | 1,518,628 | | | 613,488 | | | * | * |
* Less than 1% of common units or common shares outstanding, as applicable.
MPLX Common Unit beneficial ownership amounts include:
•Phantom unit awards, which settle in common units upon a director’s retirement from service on the Board, as follows: Ms. Breves, 8,156; Mr. Helms, 60,906; Mr. Peiffer, 55,734; Mr. Semple, 49,971; Mr. Stice, 45,528; Mr. Surma, 71,392.
•Phantom unit awards as follows: Ms. Mannen, 51,622; Mr. Hennigan, 147,195; Mr. Hagedorn, 9,171; Ms. Benson, 13,286; Mr. Floerke, 51,793; Mr. Lyon, 11,897; Mr. Quaid, 24,714.
•Common units indirectly beneficially held in trust as follows: Mr. Peiffer, 68,497; Mr. Semple, 493,294; Mr. Stice, 700.
MPC Common Stock beneficial ownership amounts include:
•All stock options exercisable within 60 days of February 1, 2025 as follows: Ms. Benson, 28,075.
•Shares of common stock indirectly beneficially held in trust as follows: Mr. Peiffer, 63,394; Mr. Surma, 10,000.
•Restricted stock unit awards, which vest upon the director’s retirement from service on MPC’s Board of Directors, as follows: Mr. Semple, 12,258; Mr. Stice, 21,992; Mr. Surma, 57,205.
•RSUs as follows: Ms. Mannen, 21,212; Mr. Hennigan, 40,781; Mr. Hagedorn, 2,391; Ms. Benson, 3,449; Mr. Floerke, 4,234; Mr. Lyon, 4,018; Mr. Quaid, 6,491; all other executive officers, 1,405.
Security Ownership of Certain Beneficial Owners
The following table sets forth information as to each unitholder of whom we are aware that, based on filings with the SEC, beneficially owns 5% or more of our outstanding common units as of December 31, 2024:
| | | | | | | | |
Name and Address
of Beneficial Owner | Number of Common Units
Representing Limited Partner Interests | Percent of Common Units
Representing Limited Partner Interests |
| | |
Marathon Petroleum Corporation
539 S. Main Street
Findlay, Ohio 45840 | 647,415,452 | 64% |
Percent of Common Units is based on 1,016,599,461 MPLX common units outstanding as of February 1, 2025.
Marathon Petroleum Corporation. The MPLX common units are directly held by MPC Investment LLC, MPLX GP LLC, MPLX Logistics Holdings LLC and Giant Industries, Inc. Marathon Petroleum Corporation is the ultimate parent company of MPC Investment LLC, MPLX GP LLC, MPLX Logistics Holdings LLC and Giant Industries, Inc. and may be deemed to beneficially own the MPLX LP common units directly held by these entities.
Securities Authorized for Issuance Under Equity Compensation Plans
The following table provides information as of December 31, 2024, with respect to common units that may be issued under the MPLX LP 2018 Incentive Compensation Plan (the “MPLX 2018 Plan”) and the MPLX LP 2012 Incentive Compensation Plan (the “MPLX 2012 Plan”):
| | | | | | | | | | | | | | | | | | | | | | | | | | |
| Plan category | | Number of securities to be issued upon exercise of outstanding options, warrants and rights | | Weighted average
exercise price of
outstanding options, warrants and rights | | Number of securities remaining available for future issuance under equity compensation plans (excluding securities reflected in the first column) |
| Equity compensation plans approved by security holders | | 795,174 | | | | N/A | | 13,891,830 | | |
| Equity compensation plans not approved by security holders | | — | | | | — | | — | | |
| Total | | 795,174 | | | | | | 13,891,830 | | |
Number of securities to be issued upon exercise of outstanding options, warrants and rights reflects phantom unit awards granted pursuant to the MPLX 2018 Plan and the MPLX 2012 Plan for common units unissued and not forfeited, cancelled or expired as of December 31, 2024.
Weighted average exercise price of outstanding options, warrants and rights. There is no exercise price associated with phantom unit awards.
Number of Securities Remaining Available reflects the common units available for issuance pursuant to the MPLX 2018 Plan.
Item 13. Certain Relationships and Related Transactions, and Director Independence
Policy and Procedures with Respect to Related Person Transactions
The Board has adopted a formal written related person transactions policy establishing procedures for the notification, review, approval, ratification and disclosure of related person transactions. Under the policy, a “related person” includes any director, nominee for director, executive officer, or a known beneficial holder of more than five percent of any class of our voting securities (other than MPC or its affiliates) or any immediate family member of a director, nominee for director, executive officer or more than five percent owner. This procedure applies to any transaction, arrangement or relationship and any series of similar transactions, arrangements or relationships in which (i) we are a participant, (ii) the amount involved exceeds $120,000, and (iii) a related person has a direct or indirect material interest.
The Board has provided its standing pre-approval for the following transactions, arrangements and relationships:
•Payment of compensation to an executive officer or director of our general partner if the compensation is otherwise required to be disclosed in our filings with the SEC;
•Any transaction where the related person’s interest arises solely from the ownership of securities;
•Any ongoing employment relationship provided that such employment relationship will be subject to initial review and approval; and
•Any transaction between any of our subsidiaries and us, on the one hand, and our general partner or any of its affiliates, on the other hand; provided, however, that such transaction is approved consistent with our Partnership Agreement.
Any related person transaction identified prior to its consummation must be approved in advance by the Board. If the related person transaction is identified after it commences, it will be promptly submitted to the Board or the Chairman for ratification, amendment or rescission. If the transaction has been completed, the Board or the Chairman will evaluate the transaction to determine if rescission is appropriate. Transactions entered into prior to the closing of our initial public offering, when this policy was adopted, were approved by the Board apart from the policy.
In determining whether to approve or ratify a related person transaction, the Board or the Chairman will consider all relevant facts and circumstances, including but not limited to:
•The benefits to us, including the business justification;
•If the related person is a director or an immediate family member of a director, the impact on the director’s independence;
•The availability of other sources for comparable products or services;
•The terms of the transaction and the terms available to unrelated third parties or to employees generally; and
•Whether the transaction is consistent with our Code of Business Conduct.
This policy is available on the “Corporate Governance” page of our website at www.mplx.com/Investors/Corporate-Governance/.
Our Relationship with MPC
As of December 31, 2024, MPC owned through its affiliates 647,415,452 of our common units, representing approximately 64% of our common units outstanding, and 100% of MPLX GP, our general partner. MPLX GP manages our operations and activities through its officers and directors. In addition, various of our officers and directors also serve as officers and/or directors of MPC. Accordingly, we view transactions between MPC and us as related party transactions and have provided the following disclosures with respect to such transactions during 2024. Unless the context otherwise requires, references in the following discussion to “we” or “us” refer to our affiliates and us.
Distributions and Reimbursements to MPC
Pursuant to our Partnership Agreement, we make cash distributions to our unitholders, including MPC. During 2024, we distributed to MPC approximately $2,270 million with respect to the common units it holds.
Under our Partnership Agreement, we reimburse MPLX GP and its affiliates, including MPC, for all costs and expenses incurred on our behalf. The amount we reimbursed in 2024 was $2 million.
Transactions and Commercial and Other Agreements with MPC
We have multiple long-term, fee-based transportation and storage services agreements, as well as a variety of operating services agreements, management services agreements, licensing agreements, employee services agreements, omnibus agreements, a keep-whole commodity agreement and a loan agreement with MPC and its consolidated subsidiaries. See Item 1. Business – Our Crude Oil and Products Logistics Contracts with MPC and Third Parties, Item 1. Business – Our Natural Gas and
NGL Services Contracts with MPC and Third Parties, and Item 8. Financial Statements and Supplementary Data – Note 6, for information regarding related party activities with MPC.
Director Independence
The information appearing under “Director Independence and Qualifications” in Item 10. Directors, Executive Officers and Corporate Governance is incorporated herein by reference.
Item 14. Principal Accountant Fees and Services
Auditor Independence
Our Audit Committee has considered whether PricewaterhouseCoopers LLP is independent for purposes of providing external audit services to us and has determined that it is.
Auditor Fees
Following are the aggregate fees for professional services provided to us by PricewaterhouseCoopers LLP for the years ended December 31, 2024, and December 31, 2023:
| | | | | | | | | | | | | | | | | |
| (In thousands) | 2024 | | 2023 |
| Audit | $ | 4,963 | | | | $ | 4,931 | | |
| Audit-Related | — | | | | — | | |
| Tax | 1,744 | | | | 2,006 | | |
| All Other | — | | | | — | | |
| Total | $ | 6,707 | | | | $ | 6,937 | | |
Audit fees for the years ended December 31, 2024, and December 31, 2023, were primarily for professional services rendered for the audit of the financial statements and of internal control over financial reporting, the performance of regulatory audits, issuance of comfort letters, the provision of consents and the review of documents filed with the SEC.
Tax fees for the years ended December 31, 2024, and December 31, 2023, were for professional services rendered for the preparation of IRS Schedule K-1 tax forms for MPLX LP unitholders and for income tax consultation services.
Pre-Approval of Audit Services
Among other things, our Pre-Approval of Audit, Audit-Related, Tax and Permissible Non-Audit Services Policy sets forth the procedure for the Audit Committee to pre-approve all audit, audit-related, tax and permissible non-audit services, other than as provided under a de minimis exception. Under the policy, the Audit Committee may pre-approve any services to be performed by our independent auditor up to twelve months in advance and may approve in advance services by specific categories pursuant to a forecasted budget. Annually, the executive vice president and chief financial officer of our general partner will present a forecast of audit, audit-related, tax and permissible non-audit services for the ensuing fiscal year to the Audit Committee for approval in advance. The executive vice president and chief financial officer of our general partner, in coordination with the independent auditor, will provide an updated budget to the Audit Committee, as needed, throughout the ensuing fiscal year.
For unbudgeted items, the Audit Committee has delegated pre-approval authority of up to $250,000 to the Chair of the Audit Committee; such items are reported to the full Audit Committee at its next scheduled meeting.
In 2024 and 2023, the Audit Committee pre-approved all audit, audit-related, tax and permissible non-audit services pursuant to this policy and did not use the de minimis exception.
PART IV
Item 15. Exhibits and Financial Statement Schedules
A. Documents Filed as Part of the Report
1. Financial Statements (see Part II, Item 8. of this Annual Report on Form 10-K regarding financial statements)
2. Financial Statement Schedules
Financial statement schedules required under SEC rules but not included in this Annual Report on Form 10-K are omitted because they are not applicable or the required information is contained in the consolidated financial statements or notes thereto.
Exhibits:
| | | | | | | | | | | | | | | | | | | | | | | | | | | | | | | | | | | | | | | | | | | | |
| | Exhibit Description | | Incorporated by Reference | | Filed
Herewith | | Furnished
Herewith |
Exhibit
Number | | | Form | | Exhibit | | Filing Date | | SEC File No. | |
| 3.1 | | | | S-1 | | 3.1 | | 7/2/2012 | | 333-182500 | | | | |
| 3.2 | | | | S-1/A | | 3.2 | | 10/9/2012 | | 333-182500 | | | | |
| 3.3 | | | | 8-K | | 3.1 | | 2/3/2021 | | 001-35714 | | | | |
| 4 | | Instruments Defining the Rights of Security Holders, Including Indentures, and Description of Registrant’s Securities | | | | | | | | | | | | |
| Pursuant to Item 601(b)(4) of Regulation S-K, certain instruments with respect to long-term debt issues have been omitted where the amount of securities authorized under such instruments does not exceed 10 percent of the total consolidated assets of the Registrant. The Registrant hereby agrees to furnish a copy of any such instrument to the Securities and Exchange Commission upon its request. |
| 4.1 | | | | 8-K | | 4.1 | | 2/12/2015 | | 001-35714 | | | | |
| 4.2 | | | | 8-K | | 4.1 | | 5/16/2016 | | 001-35714 | | | | |
| 4.3 | | | | | | | | | | | | X | | |
| 10 | | Material Contracts | | | | | | | | | | | | |
| 10.1 | | Omnibus Agreement, dated as of October 31, 2012, among Marathon Petroleum Corporation, Marathon Petroleum Company LP, MPL Investment LLC, MPLX Operations LLC, MPLX Terminal and Storage LLC, MPLX Pipe Line Holdings LP, Marathon Pipe Line LLC, Ohio River Pipe Line LLC, MPLX LP and MPLX GP LLC | | 8-K | | 10.2 | | 11/6/2012 | | 001-35714 | | | | |
| 10.2 | | | | 8-K | | 10.5 | | 11/6/2012 | | 001-35714 | | | | |
| 10.3 | | | | 8-K | | 10.8 | | 11/6/2012 | | 001-35714 | | | | |
| 10.4 | | | | 8-K | | 10.11 | | 11/6/2012 | | 001-35714 | | | | |
| 10.5 | | | | 8-K | | 10.1 | | 4/6/2016 | | 001-35714 | | | | |
| 10.6 | | | | 8-K | | 10.2 | | 4/6/2016 | | 001-35714 | | | | |
| | | | | | | | | | | | | | | | | | | | | | | | | | | | | | | | | | | | | | | | | | | | |
| | Exhibit Description | | Incorporated by Reference | | Filed
Herewith | | Furnished
Herewith |
Exhibit
Number | | | Form | | Exhibit | | Filing Date | | SEC File No. | |
| 10.7 | | | | 8-K | | 10.1 | | 4/29/2016 | | 001-35714 | | | | |
| 10.8 | | | | 10-Q | | 10.2 | | 8/3/2016 | | 001-35714 | | | | |
| 10.9 | | | | 8-K | | 10.6 | | 3/2/2017 | | 001-35714 | | | | |
| 10.10+ | | | | 8-K | | 10.1 | | 2/2/2018 | | 001-35714 | | | | |
| 10.11+ | | | | 8-K | | 10.2 | | 2/2/2018 | | 001-35714 | | | | |
| 10.12 | | | | 8-K | | 10.3 | | 2/2/2018 | | 001-35714 | | | | |
| 10.13+ | | | | 8-K | | 10.4 | | 2/2/2018 | | 001-35714 | | | | |
| 10.14 | | | | 8-K | | 10.5 | | 2/2/2018 | | 001-35714 | | | | |
| 10.15 | | | | 8-K | | 10.2 | | 8/1/2019 | | 001-35714 | | | | |
| 10.16 | | | | 10-Q | | 10.1 | | 5/2/2023 | | 001-35714 | | | | |
| 10.17 | | | | 10-Q | | 10.2 | | 8/6/2024 | | 001-35714 | | | | |
| 10.18 | | | | 10-K | | 10.102 | | 2/28/2020 | | 001-35714 | | | | |
| 10.19 | | | | 10-K | | 10.103 | | 2/28/2020 | | 001-35714 | | | | |
| | | | | | | | | | | | | | | | | | | | | | | | | | | | | | | | | | | | | | | | | | | | |
| | Exhibit Description | | Incorporated by Reference | | Filed
Herewith | | Furnished
Herewith |
Exhibit
Number | | | Form | | Exhibit | | Filing Date | | SEC File No. | |
| 10.20 | | | | 10-Q | | 10.2 | | 11/6/2020 | | 001-35714 | | | | |
| 10.21 | | | | 10-Q | | 10.3 | | 8/2/2022 | | 001-35714 | | | | |
| 10.22 | | | | 8-K | | 10.1 | | 11/5/2020 | | 001-35714 | | | | |
| 10.23 | | | | 10-Q | | 10.3 | | 11/6/2020 | | 001-35714 | | | | |
| 10.24 | | | | 10-Q | | 10.5 | | 11/6/2020 | | 001-35714 | | | | |
| 10.25 | | | | 10-K | | 10.106 | | 2/26/2021 | | 001-35714 | | | | |
| 10.26 | | | | 10-Q | | 10.1 | | 11/2/2021 | | 001-35714 | | | | |
| 10.27 | | | | 8-K | | 10.1 | | 7/7/2022 | | 001-35714 | | | | |
| 10.28 | | Revolving Credit Agreement, dated as of July 7, 2022, by and among MPLX LP, as borrower, Wells Fargo Bank, National Association, as administrative agent, each of Wells Fargo Securities, LLC, JPMorgan Chase Bank, N.A., Barclays Bank PLC, BofA Securities, Inc., Citibank, N.A., Mizuho Bank, Ltd., MUFG Bank, Ltd., RBC Capital Markets and TD Securities (USA) LLC, as joint lead arrangers and joint bookrunners, JPMorgan Chase Bank, N.A., as syndication agent, each of Bank of America, N.A., Barclays Bank PLC, Citibank, N.A., Mizuho Bank, Ltd., MUFG Bank, Ltd., Royal Bank of Canada and The Toronto-Dominion Bank, New York Branch, as documentation agents, and the other lenders and issuing banks that are parties thereto | | 8-K | | 10.1 | | 7/12/2022 | | 001-35714 | | | | |
| | | | | | | | | | | | | | | | | | | | | | | | | | | | | | | | | | | | | | | | | | | | |
| | Exhibit Description | | Incorporated by Reference | | Filed
Herewith | | Furnished
Herewith |
Exhibit
Number | | | Form | | Exhibit | | Filing Date | | SEC File No. | |
| 10.29 | | | | 10-K | | 10.44 | | 2/23/2023 | | 001-35714 | | | | |
| 10.30 | | | | 10-Q | | 10.1 | | 8/1/2023 | | 001-35714 | | | | |
| 10.31 | | | | 10-Q | | 10.2 | | 8/1/2023 | | 001-35714 | | | | |
| 10.32 | | | | 10-Q | | 10.3 | | 8/1/2023 | | 001-35714 | | | | |
| 10.33 | | | | 10-Q | | 10.4 | | 8/1/2023 | | 001-35714 | | | | |
| 10.34 | | | | 10-Q | | 10.2 | | 4/30/2024 | | 001-35714 | | | | |
| 10.35 | | | | 10-Q | | 10.1 | | 8/6/2024 | | 001-35714 | | | | |
| 10.36 | | | | 10-Q | | 10.2 | | 11/5/2024 | | 001-35714 | | | | |
| 10.37 | | | | 10-Q | | 10.3 | | 11/5/2024 | | 001-35714 | | | | |
| 10.38* | | | | S-1/A | | 10.3 | | 10/9/2012 | | 333-182500 | | | | |
| 10.39* | | | | 10-K | | 10.26 | | 3/25/2013 | | 001-35714 | | | | |
| 10.40* | | | | 8-K | | 10.1 | | 3/5/2018 | | 001-35714 | | | | |
| 10.41* | | | | 10-K | | 10.75 | | 2/28/2020 | | 001-35714 | | | | |
| 10.42* | | | | 10-K | | 10.78 | | 2/28/2019 | | 001-35714 | | | | |
| 10.43* | | | | 10-Q | | 10.4 | | 11/5/2024 | | 001-35714 | | | | |
| | | | | | | | | | | | | | | | | | | | | | | | | | | | | | | | | | | | | | | | | | | | |
| | Exhibit Description | | Incorporated by Reference | | Filed
Herewith | | Furnished
Herewith |
Exhibit
Number | | | Form | | Exhibit | | Filing Date | | SEC File No. | |
| 10.44* | | | | 10-Q | | 10.1 | | 10/31/2023 | | 001-35714 | | | | |
| 10.45* | | | | 10-Q | | 10.1 | | 5/3/2022 | | 001-35714 | | | | |
| 10.46* | | | | 10-K | | 10.45 | | 2/23/2023 | | 001-35714 | | | | |
| 10.47* | | | | 10-Q | | 10.1 | | 4/30/2024 | | 001-35714 | | | | |
| 10.48* | | | | | | | | | | | | X | | |
| 10.49* | | | | | | | | | | | | X | | |
| 10.50* | | | | | | | | | | | | X | | |
| 19.1 | | | | | | | | | | | | X | | |
| 21.1 | | | | | | | | | | | | X | | |
| 23.1 | | | | | | | | | | | | X | | |
| 24.1 | | | | | | | | | | | | X | | |
| 31.1 | | | | | | | | | | | | X | | |
| 31.2 | | | | | | | | | | | | X | | |
| 32.1 | | | | | | | | | | | | | | X |
| 32.2 | | | | | | | | | | | | | | X |
| 97.1 | | | | 10-K | | 97.1 | | 2/28/2024 | | 001-35714 | | | | |
| 101.INS | | Inline XBRL Instance Document | | | | | | | | | | X | | |
| 101.SCH | | Inline XBRL Taxonomy Extension Schema | | | | | | | | | | X | | |
| 101.PRE | | Inline XBRL Taxonomy Extension Presentation Linkbase | | | | | | | | | | X | | |
| 101.CAL | | Inline XBRL Taxonomy Extension Calculation Linkbase | | | | | | | | | | X | | |
| 101.DEF | | Inline XBRL Taxonomy Extension Definition Linkbase | | | | | | | | | | X | | |
| 101.LAB | | Inline XBRL Taxonomy Extension Label Linkbase | | | | | | | | | | X | | |
| 104 | | Cover Page Interactive Data File (formatted as Inline XBRL and contained in Exhibit 101) | | | | | | | | | | | | |
* Indicates management contract or compensatory plan, contract or arrangement in which one or more directors or executive officers of the Registrant may be participants.
+ Application has been made to the Securities and Exchange Commission for confidential treatment of certain provisions of these exhibits. Omitted material for which confidential treatment has been requested and has been filed separately with the Securities and Exchange Commission.
SIGNATURES
Pursuant to the requirements of Section 13 or 15(d) of the Securities Exchange Act of 1934, the registrant has duly caused this report to be signed on its behalf by the undersigned, thereunto duly authorized.
| | | | | | | | |
| Date: February 27, 2025 | MPLX LP |
| | |
| By: | MPLX GP LLC
Its general partner |
| | |
| By: | /s/ Kelly D. Wright |
| | Kelly D. Wright
Vice President and Controller of MPLX GP LLC
(the general partner of MPLX LP) |
Pursuant to the requirements of the Securities Exchange Act of 1934, this report has been signed below by the following persons on February 27, 2025 on behalf of the registrant and in the capacities indicated.
| | | | | | | | |
| Signature | | Title |
| /s/ Maryann T. Mannen | | Director, President and Chief Executive Officer of MPLX GP LLC (the general partner of MPLX LP) (principal executive officer) |
| Maryann T. Mannen | |
| |
| /s/ C. Kristopher Hagedorn | | Director, Executive Vice President and Chief Financial Officer of MPLX GP LLC (the general partner of MPLX LP) (principal financial officer) |
| C. Kristopher Hagedorn | |
| |
| /s/ Kelly D. Wright | | Vice President and Controller of MPLX GP LLC (the general partner of MPLX LP) (principal accounting officer) |
| Kelly D. Wright | |
| | |
| * | | Director of MPLX GP LLC (the general partner of MPLX LP) |
| Christine S. Breves | |
| | |
| * | | Director of MPLX GP LLC (the general partner of MPLX LP) |
| Christopher A. Helms | |
| | |
| * | | Executive Chairman of the Board of Directors of MPLX GP LLC (the general partner of MPLX LP) |
| Michael J. Hennigan | |
| |
| * | | Director of MPLX GP LLC (the general partner of MPLX LP) |
| Garry L. Peiffer | |
| | |
| * | | Director of MPLX GP LLC (the general partner of MPLX LP) |
| John J. Quaid | |
| | |
| * | | Director of MPLX GP LLC (the general partner of MPLX LP) |
| Frank M. Semple | |
| |
| * | | Director of MPLX GP LLC (the general partner of MPLX LP) |
| J. Michael Stice | |
| | |
| * | | Director of MPLX GP LLC (the general partner of MPLX LP) |
| John P. Surma | |
| |
* The undersigned, by signing her name hereto, does sign and execute this report pursuant to the Power of Attorney executed by the above-named directors and officers of the general partner of the registrant, which is being filed herewith on behalf of such directors and officers.
| | | | | | | | | | | | | | |
| By: | | /s/ Maryann T. Mannen | | February 27, 2025 |
| | Maryann T. Mannen
Attorney-in-Fact | | |