Exhibit 99.1
DGPV HOLDCO 3 LLC AND SUBSIDIARIES
Table of Contents
| Page | |
| Independent Auditors' Report | 1 |
| Consolidated Balance Sheets — December 31, 2019 and 2018 | 2 |
| Consolidated Statements of Operations — Years ended December 31, 2019 and 2018 | 3 |
| Consolidated Statements of Member's Equity (Deficit) — Years ended December 31, 2019 and 2018 | 4 |
| Consolidated Statements of Cash Flows — Years ended December 31, 2019 and 2018 | 5 |
| Notes to Consolidated Financial Statements | 6 |
Exhibit 99.1
Independent Auditor's Report
The Members
DGPV HoldCo 3 LLC:
We have audited the accompanying consolidated financial statements of DGPV HoldCo 3 LLC and its subsidiaries, which comprise the consolidated balance sheets as of December 31, 2019 and 2018, and the related consolidated statements of operations, members’ equity (deficit), and cash flows for the years then ended, and the related notes to the consolidated financial statements.
Management’s Responsibility for the Financial Statements
Management is responsible for the preparation and fair presentation of these consolidated financial statements in accordance with U.S. generally accepted accounting principles; this includes the design, implementation, and maintenance of internal control relevant to the preparation and fair presentation of consolidated financial statements that are free from material misstatement, whether due to fraud or error.
Auditors’ Responsibility
Our responsibility is to express an opinion on these consolidated financial statements based on our audits. We conducted our audits in accordance with auditing standards generally accepted in the United States of America. Those standards require that we plan and perform the audit to obtain reasonable assurance about whether the consolidated financial statements are free from material misstatement.
An audit involves performing procedures to obtain audit evidence about the amounts and disclosures in the consolidated financial statements. The procedures selected depend on the auditors’ judgment, including the assessment of the risks of material misstatement of the consolidated financial statements, whether due to fraud or error. In making those risk assessments, the auditor considers internal control relevant to the entity’s preparation and fair presentation of the consolidated financial statements in order to design audit procedures that are appropriate in the circumstances, but not for the purpose of expressing an opinion on the effectiveness of the entity’s internal control. Accordingly, we express no such opinion. An audit also includes evaluating the appropriateness of accounting policies used and the reasonableness of significant accounting estimates made by management, as well as evaluating the overall presentation of the consolidated financial statements.
We believe that the audit evidence we have obtained is sufficient and appropriate to provide a basis for our audit opinion.
Opinion
In our opinion, the consolidated financial statements referred to above present fairly, in all material respects, the financial position of DGPV HoldCo 3 LLC and its subsidiaries as of December 31, 2019 and 2018, and the results of their operations and their cash flows for the years then ended in accordance with U.S. generally accepted accounting principles.
Change in Accounting Principle
As discussed in Note 2(h) to the consolidated financial statements, DGPV HoldCo 3 LLC changed its method of accounting for leases as of January 1, 2019, due to the adoption of Accounting Standards Update 2016-02, Leases (Topic 842) and related amendments. Our opinion is not modified with respect to this matter.
(signed) KPMG LLP
Philadelphia, Pennsylvania
March 30, 2020
1
Exhibit 99.1
| DGPV HOLDCO 3 LLC AND SUBSIDIARIES | ||||||||||||||
| Consolidated Balance Sheets | ||||||||||||||
| December 31, 2019 and 2018 | ||||||||||||||
| (In thousands) | ||||||||||||||
| Assets | 2019 | 2018 | ||||||||||||
| Current assets: | ||||||||||||||
| Cash | $ | 19,104 | $ | 5,035 | ||||||||||
| Restricted cash | 6,862 | 16,022 | ||||||||||||
| Accounts receivable – trade, net | 9,251 | 7,942 | ||||||||||||
| Accounts receivable – affiliate | 72 | — | ||||||||||||
| Derivative instruments | 155 | 184 | ||||||||||||
| Prepayments and other current assets | 3,153 | 758 | ||||||||||||
| Total current assets | 38,597 | 29,941 | ||||||||||||
| Property, plant, and equipment, net | 332,176 | 247,759 | ||||||||||||
| Intangible asset for power purchase agreement, net | 1,367 | 1,427 | ||||||||||||
| Derivative instruments | 2,599 | 1,489 | ||||||||||||
| Right-of-use assets, net | 34,767 | — | ||||||||||||
| Other non-current assets | 310 | 310 | ||||||||||||
| Total assets | $ | 409,816 | $ | 280,926 | ||||||||||
| Liabilities and Member's Equity | ||||||||||||||
| Current liabilities: | ||||||||||||||
| Short-term debt – affiliate | $ | 1,598 | $ | 1,604 | ||||||||||
| Current portion of long-term debt | 40,996 | 27,050 | ||||||||||||
| Accounts payable – trade | 3,765 | 13,342 | ||||||||||||
| Accounts payable – affiliate | 11,385 | 6,929 | ||||||||||||
| Accrued interest expense | 1,307 | 1,141 | ||||||||||||
| Derivative instruments | 862 | 72 | ||||||||||||
| Lease liabilities | 500 | — | ||||||||||||
| Accrued liabilities | 250 | 7 | ||||||||||||
| Total current liabilities | 60,663 | 50,145 | ||||||||||||
| Other liabilities: | ||||||||||||||
| Long-term debt | 169,612 | 133,277 | ||||||||||||
| Derivative instruments | 7,712 | 992 | ||||||||||||
| Other non-current liabilities | 153 | 411 | ||||||||||||
| Asset retirement obligations | 4,151 | 1,953 | ||||||||||||
| Long-term lease liabilities | 34,703 | — | ||||||||||||
| Total non-current liabilities | 216,331 | 136,633 | ||||||||||||
| Total liabilities | $ | 276,994 | $ | 186,778 | ||||||||||
| Redeemable noncontrolling interest | (737 | ) | (294 | ) | ||||||||||
| Commitments and contingencies | ||||||||||||||
| Equity: | ||||||||||||||
| Member's equity | 132,498 | 96,094 | ||||||||||||
| Noncontrolling interest | 1,061 | (1,652 | ) | |||||||||||
| Total equity | 133,559 | 94,442 | ||||||||||||
| Total liabilities and member's equity | $ | 409,816 | $ | 280,926 | ||||||||||
| See accompanying notes to consolidated financial statements. | ||||||||||||||
2
Exhibit 99.1
| DGPV HOLDCO 3 LLC AND SUBSIDIARIES | ||||||||||||||
| Consolidated Statements of Operations | ||||||||||||||
| Years ended December 31, 2019 and 2018 | ||||||||||||||
| (In thousands) | ||||||||||||||
| 2019 | 2018 | |||||||||||||
| Operating revenues: | ||||||||||||||
| Electric revenue | $ | 16,023 | $ | 7,417 | ||||||||||
| Renewable energy certificates | 11,534 | 9,699 | ||||||||||||
| Government incentives | 500 | 83 | ||||||||||||
| Total operating revenues | 28,057 | 17,199 | ||||||||||||
| Operating costs and expenses: | ||||||||||||||
| Cost of operations | 4,335 | 3,604 | ||||||||||||
| Cost of operations – affiliate | 2,073 | 1,199 | ||||||||||||
| Depreciation and accretion | 8,891 | 5,234 | ||||||||||||
| Total operating costs and expenses | 15,299 | 10,037 | ||||||||||||
| Operating income | 12,758 | 7,162 | ||||||||||||
| Other income (expense): | ||||||||||||||
| Interest income | 173 | 127 | ||||||||||||
| Interest expense | (19,120 | ) | (4,460 | ) | ||||||||||
| Total other expense | (18,947 | ) | (4,333 | ) | ||||||||||
| Net (loss) income before noncontrolling interest | (6,189 | ) | 2,829 | |||||||||||
| Less: noncontrolling interest | (53,058 | ) | (54,498 | ) | ||||||||||
| Net income attributable to DGPV Holdco 3 LLC | $ | 46,869 | $ | 57,327 | ||||||||||
| See accompanying notes to consolidated financial statements. | ||||||||||||||
3
Exhibit 99.1
| DGPV HOLDCO 3 LLC AND SUBSIDIARIES | ||||||||||||||||||||||
| Consolidated Statements of Members' Equity (Deficit) | ||||||||||||||||||||||
| Years ended December 31, 2019 and 2018 | ||||||||||||||||||||||
| (In thousands) | ||||||||||||||||||||||
| Total | ||||||||||||||||||||||
| Contributed | Retained | Noncontrolling | member's | |||||||||||||||||||
| capital | earnings | interest | equity (deficit) | |||||||||||||||||||
| Balance at December 31, 2017 | $ | (28,591 | ) | $ | $ | 28,579 | — | $ | (12 | ) | ||||||||||||
| Net income (loss) | — | 57,327 | (4,349 | ) | 52,978 | |||||||||||||||||
| Cash contributions | 120,782 | — | 5,066 | 125,848 | ||||||||||||||||||
| Cash distributions | (79,970 | ) | — | (2,369 | ) | (82,339 | ) | |||||||||||||||
| Distributions to Clearway Renew, non-cash | (2,033 | ) | — | — | (2,033 | ) | ||||||||||||||||
| Balance at December 31, 2018 | $ | 10,188 | $ | $ | 85,906 | $ | (1,652 | ) | $ | 94,442 | ||||||||||||
| Net income (loss) | — | 46,869 | (52,482 | ) | (5,613 | ) | ||||||||||||||||
| Cash contributions | 123,619 | — | 56,774 | 180,393 | ||||||||||||||||||
| Cash distributions | (135,719 | ) | — | (1,579 | ) | (137,298 | ) | |||||||||||||||
| Contributions, net of distributions, non-cash | 1,635 | — | — | 1,635 | ||||||||||||||||||
| Balance at December 31, 2019 | $ | (277 | ) | $ | $ | 132,775 | $ | 1,061 | $ | 133,559 | ||||||||||||
| See accompanying notes to consolidated financial statements. | ||||||||||||||||||||||
4
Exhibit 99.1
| DGPV HOLDCO 3 LLC AND SUBSIDIARIES | ||||||||||||
| Consolidated Statements of Cash Flows | ||||||||||||
| Years ended December 31, 2019 and 2018 | ||||||||||||
| (In thousands) | ||||||||||||
| 2019 | 2018 | |||||||||||
| Cash flows from operating activities: | ||||||||||||
| Net (loss) income | $ | (6,189 | ) | $ | 2,829 | |||||||
| Adjustments to reconcile net income (loss) to net cash provided by | ||||||||||||
| operating activities: | ||||||||||||
| Depreciation and accretion | 8,891 | 5,234 | ||||||||||
| Right-of-use asset amortization | 900 | — | ||||||||||
| Provision for losses on accounts receivable | 74 | — | ||||||||||
| Amortization of intangible asset | 60 | 60 | ||||||||||
| Amortization of debt issuance costs | 1,859 | 810 | ||||||||||
| Non-cash interest expense applied to long-term debt | 4,205 | — | ||||||||||
| Changes in derivative instruments | 6,429 | (468 | ) | |||||||||
| Cash provided (used) by changes in other working capital: | ||||||||||||
| Accounts receivable – trade | (5,273 | ) | (6,368 | ) | ||||||||
| Accounts receivable – affiliate | (2 | ) | 676 | |||||||||
| Prepayments and other current assets | 49 | (253 | ) | |||||||||
| Accounts payable – trade | (9,766 | ) | 1,687 | |||||||||
| Accounts payable – affiliate | 14,164 | (9,204 | ) | |||||||||
| Accrued interest expense | 166 | 902 | ||||||||||
| Accrued liabilities | 273 | (178 | ) | |||||||||
| Deferred rent | — | 313 | ||||||||||
| Operating lease liabilities | (484 | ) | — | |||||||||
| Net cash provided (used) by operating activities | 15,356 | (3,960 | ) | |||||||||
| Cash flows from investing activities: | ||||||||||||
| Capital expenditures | (91,909 | ) | (52,039 | ) | ||||||||
| Acquisition of membership interests | (6,032 | ) | (147,014 | ) | ||||||||
| Receipt of insurance proceeds | 59 | — | ||||||||||
| Net cash used by investing activities | (97,882 | ) | (199,053 | ) | ||||||||
| Cash flows from financing activities: | ||||||||||||
| Proceeds from short-term debt – affiliate, net of payments | (5 | ) | 500 | |||||||||
| Proceeds from issuance of long-term debt | 94,543 | 132,289 | ||||||||||
| Payments for long-term debt | (49,720 | ) | — | |||||||||
| Payment of debt issuance costs | (611 | ) | (5,680 | ) | ||||||||
| Contributions from noncontrolling interests, net of distributions | 55,328 | 46,035 | ||||||||||
| Contributions from member | 123,619 | 125,674 | ||||||||||
| Distributions to member | (135,719 | ) | (79,970 | ) | ||||||||
| Net cash provided by financing activities | 87,435 | 218,848 | ||||||||||
| Net increase in cash and restricted cash | 4,909 | 15,835 | ||||||||||
| Cash and restricted cash at beginning of period | 21,057 | 5,222 | ||||||||||
| Cash and restricted cash at end of period | $ | 25,966 | $ | 21,057 | ||||||||
| Supplemental disclosures: | ||||||||||||
| Interest paid | $ | 6,520 | $ | 2,703 | ||||||||
| Interest paid by affiliate | 44 | 513 | ||||||||||
| Non-cash investing and financing activities: | ||||||||||||
| Increase to fixed assets for capitalized asset retirement costs | 2,127 | 887 | ||||||||||
| Increase to fixed assets for capitalized debt issuance costs | 1,327 | 84 | ||||||||||
| Reduction to fixed assets for accrued government incentives | (2,835 | ) | (997 | ) | ||||||||
| Additions to fixed assets for accrued capital expenditures | 1,873 | 8,820 | ||||||||||
| Debt issuance costs incurred not paid | (4 | ) | 306 | |||||||||
| Interest added to long-term debt principal | 4,205 | — | ||||||||||
| Non-cash contributions | 2,220 | 1,776 | ||||||||||
| Non-cash distribution – developer fee on fixed assets | (1,549 | ) | (8,678 | ) | ||||||||
| Accounts payable – affiliate for capital expenditures | (5,773 | ) | (82,653 | ) | ||||||||
| See accompanying notes to consolidated financial statements. | ||||||||||||
5
Exhibit 99.1
DGPV HOLDCO 3 LLC AND SUBSIDIARIES
Notes to Consolidated Financial Statements
(1) Nature of Business
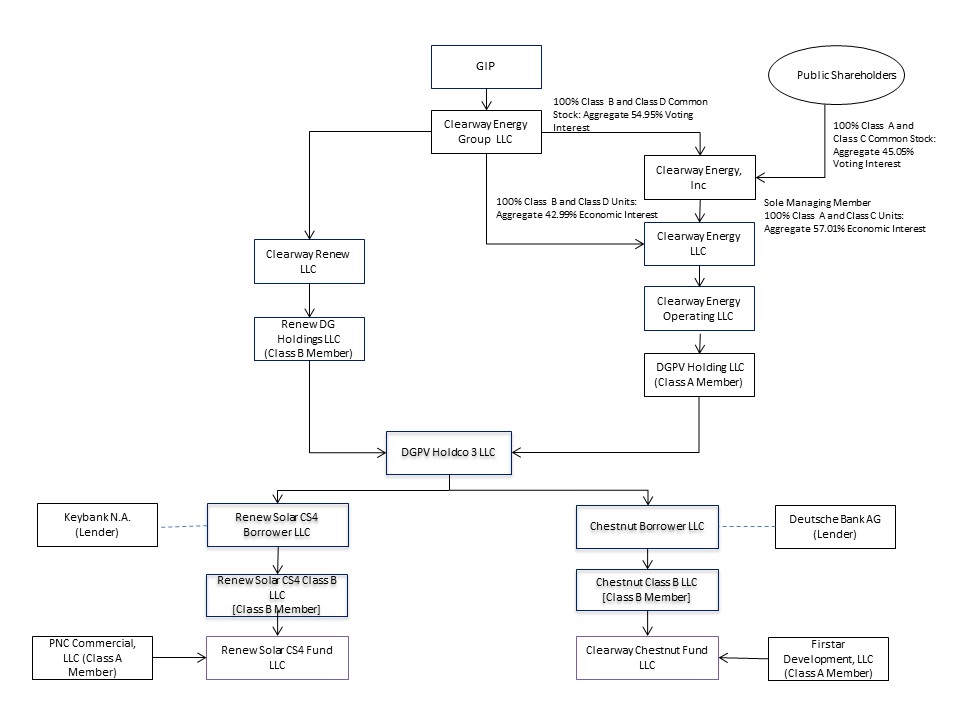
DGPV Holdco 3, LLC, or the Company, a Delaware limited liability company, is a partnership between Clearway Renew DG Holdings, LLC, a subsidiary of Clearway Renew LLC, and DGPV Holding LLC, a subsidiary of Clearway Energy Operating LLC. Clearway Renew LLC is a wholly owned subsidiary of Clearway Energy Group LLC, or Clearway Energy Group, which is a wholly owned subsidiary of Global Infrastructure Partners III, or GIP. Clearway Energy Operating LLC is a wholly owned subsidiary of Clearway Energy LLC, which is a partnership between Clearway Energy, Inc. and Clearway Energy Group.
On August 31, 2018, NRG Energy, Inc., or NRG, transferred its full ownership interest in Clearway Energy, Inc. to Clearway Energy Group, and subsequently sold 100% of its interest in Clearway Energy Group to GIP, including its interests in the Company, referred to as the GIP Transaction. The GIP Transaction did not impact the Company’s direct ownership structure.
The Company was formed on April 26, 2017 as a partnership to facilitate investment in an operating portfolio of distributed solar assets, primarily comprised of community solar projects and commercial distributed solar projects developed by Clearway Energy Group. The Company owns an interest in two portfolios of solar projects that participate in tax equity arrangements with tax equity investors, through its wholly owned subsidiaries, Chestnut Borrower, LLC, or Chestnut Borrower, and Renew Solar CS4 Borrower LLC, or CS4 Borrower. See Note 3, Tax Equity Arrangements, for a more detailed description of each tax equity arrangement. Each of the portfolios owns, operates and maintains solar energy systems that sell power to customers through long-term power purchase agreements, or PPAs. The commercial distributed solar projects sell power to a single commercial offtaker and the community solar projects sell power to a group of offtakers in one location.
The Company is governed by an Amended and Restated Operating Agreement, or Operating Agreement, where Clearway DGPV Holding LLC, or DGPV Holding, is the Class A Member and Clearway Renew DG Holdings, LLC, or Renew DG Holdings, is the Class B Member and the Manager of the Company. As Manager, Renew DG Holdings conducts and directs all operating activities of the Company. Contributions are made to the Company pursuant to requests made by the Manager on behalf of a fund company and calculated using specific modeling guidelines outlined in the Operating Agreement.
Contributions by DGPV Holding are calculated to equal an amount that enables DGPV Holding to achieve an annual yield based on available cash flow of 9.0% on average over the first ten years. Contributions by Renew DG Holdings are calculated based on the purchase price of a project less the relevant contribution from the Fund's tax equity partner and the contribution from DGPV Holding. Pursuant to the Operating Agreement, all tax basis income, gain, loss, deduction and credit, as well as all cash available for distribution, of the Company are allocated at 1% and 99% to the Class B Member and Class A Member, respectively.
(a) Chestnut Fund
The Company's wholly owned subsidiary, Chestnut Borrower, was formed on April 26, 2017 for the purpose of acting as a borrower of term loans for the Chestnut Fund, as described in note 6, Long-Term Debt, and Chestnut Borrower owns a 100% of Chestnut Class B LLC, the Class B Member of the Clearway Chestnut Fund LLC, or Chestnut Fund, tax equity arrangement. Chestnut Class B LLC, or Chestnut Class B, is the Managing Member of Chestnut Fund and conducts and directs all operating activities of the fund. The Class A Member of Chestnut Fund, or Investor Member, is Firstar Development, LLC, or Firstar, an affiliate of U.S. Bancorp.
6
Exhibit 99.1
Chestnut Fund's 100% owned subsidiaries and related solar facilities are listed below:
| Project company | Facility | Type | Location | Facility capacity (kWdc) | Commercial operations date | PPA offtaker | PPA term in years | ||||||||
| Black Cat Road Solar, LLC | 77 Black Cat Rd | Community | MA | 1,321 | 08/30/17 | Ahold USA/Various (a) | 20 | ||||||||
| Brook St Solar 1, LLC | 134 Brook St A, B & C | Community | MA | 6,480 | 09/06/17 | Target Ahold USA/Various (a) | 15 20 | ||||||||
| Solar Mule, LLC | Colby College | Commercial | ME | 1,811 | 09/18/17 | Colby College | 27 (b) | ||||||||
| Big Lake Holdco LLC | Big Lake | Community | MN | 6,912 | 10/01/17 | Various | 25 | ||||||||
| Solar West Shaft LLC | N Adams-West Shaft Rd | Community | MA | 1,346 | 10/10/17 | Ahold USA/Raytheon/Various (a) | 20 | ||||||||
| DG Foxborough Elm LLC | Elm Street | Community | MA | 2,614 | 10/12/17 | Town of Foxborough/Various (a) | 20 | ||||||||
| Redbrook Solar 1 LLC | Redbrook B, C & D | Community | MA | 5,568 | 11/09/17 | Ahold USA/Various (a) | 20 | ||||||||
| Northfield Holdco LLC | Northfield | Community | MN | 6,962 | 12/01/17 | Various | 25 | ||||||||
| Waterford Holdco LLC | Waterford | Community | MN | 3,767 | 12/01/17 | Various | 25 | ||||||||
| Center St Solar 1 LLC | 1077 Center St A, B & C | Community | MA | 3,870 | 12/21/2017 & 01/03/2018 | Target Raytheon/Various (a) | 15 20 | ||||||||
| TOS Solar 1, LLC | 725 Guelphwood | Community | MA | 646 | 12/30/17 | Target/Various (a) | 15/20 | ||||||||
| TOS Solar 2, LLC | 726 Guelphwood | Community | MA | 1,341 | 12/30/17 | Target/Various (a) | 15/20 | ||||||||
| Stafford St Solar 1, LLC | 466 Stafford St Site A | Community | MA | 2,776 | 12/31/17 | Target/Various (a) | 15/20 | ||||||||
| Stafford St Solar 3, LLC | 466 Stafford St Site C | Community | MA | 1,388 | 12/31/17 | Raytheon/Various (a) | 20 | ||||||||
| ETCAP NES CS MN 02 LLC | Nystuen | Community | MN | 1,055 | 05/01/18 | 100% residential | 25 | ||||||||
| ETCAP NES CS MN 06 LLC | Armstrong | Community | MN | 3,714 | 05/01/18 | Various | 25 | ||||||||
| Stafford St Solar 2, LLC | 466 Stafford St Site B | Community | MA | 2,776 | 05/09/18 | Target/Various (a) | 15/20 | ||||||||
| Bullock Road Solar 1, LLC | 247 & 249 Bullock | Community | MA | 5,754 | 07/25/18 | Various | 20 | ||||||||
| Mapleton Solar LLC | Mapleton | Community | MN | 5,080 | 09/01/18 | Various | 25 | ||||||||
| Osakis Solar LLC | Osakis | Community | MN | 7,213 | 09/01/18 | Various | 25 | ||||||||
| Solar Wauwinet LLC | 85 Wauwinet Rd-Barre | Community | MA | 1,294 | 09/17/18 | Target/Various (a) | 15/20 | ||||||||
| Minisink Solar 1 LLC | Minisink North | Community | NY | 2,495 | 10/26/18 | 100% residential | 20 | ||||||||
| Minisink Solar 2 LLC | Minisink South | Community | NY | 2,795 | 11/01/18 | 100% residential | 20 | ||||||||
| DG Marathon LLC | Sage Stone | Community | MA | 2,614 | 01/04/19 | Ahold USA/Various (a) | 20 | ||||||||
| 81,592 | |||||||||||||||
(a) 50% sold through community solar services agreements and 50% sold to named customer through net metering purchase agreements.
(b) The initial term of 27 years shall automatically extend for 3 years, then for 1 year in perpetuity unless terminated by either party.
(b) CS4 Fund
The Company's wholly owned subsidiary, CS4 Borrower, was formed on July 9, 2018 for the purpose of acting as the borrower under a credit agreement for the CS4 Fund, as described in note 6, Long-Term Debt, and CS4 Borrower owns 100% of Renew Solar CS4 Class B LLC, the Class B Member of the Renew Solar CS4 Fund LLC, or CS4 Fund, tax equity arrangement. Renew Solar CS4 Class B LLC, or CS4 Class B, is the Managing Member of CS4 Fund and conducts and directs all operating activities of the fund. The Class A Member of CS4 Fund, or Investor Member, is PNC Commercial, LLC, or PNC, an indirect wholly owned subsidiary of PNC Financial Services Group, Inc. CS4 Borrower's wholly owned subsidiary Renew Solar CS4 Seller LLC, or CS4 Seller, acquires the project entities from a subsidiary of Clearway Renew, funds the construction of the projects, and in turn, sells these projects to CS4 Fund.
7
Exhibit 99.1
CS4 Fund's 100% owned subsidiaries and related solar facilities are listed below:
| Facility | Commercial | ||||||||||
| capacity | operations | PPA | |||||||||
| Project company | Location | (kWdc) | date | PPA offtaker | terms | ||||||
| Montevideo Solar LLC | Minnesota | 7,497 | 1/1/2019 | Various | 25 years | ||||||
| Underhill Solar LLC | New York | 3,011 | 3/18/2019 | NYSERDA/Various (b) | 10/20 years | ||||||
| Bluestone Solar LLC | New York | 3,013 | 3/27/2019 | Various | 20 years | ||||||
| Chisago Holdco LLC | Minnesota | 3,937 | 5/1/2019 | Various | 25 years | ||||||
| Frontenac Holdco LLC | Minnesota | 7,208 | 5/1/2019 | Various | 25 years | ||||||
| CMR Solar LLC | New York | 2,808 | 5/10/2019 | NYSERDA/Various (b) | 10/20 years | ||||||
| Sartell Solar LLC | Minnesota | 7,501 | 6/1/2019 | Various | 25 years | ||||||
| Grabinski Solar LLC | New York | 3,002 | 7/25/2019 | Various | 20 years | ||||||
| Clara City Solar LLC | Minnesota | 1,400 | 9/1/2019 | Various | 25 years | ||||||
| New Munich Solar LLC | Minnesota | 1,400 | 9/1/2019 | Various | 25 years | ||||||
| Olinda Trail Solar LLC | Minnesota | 1,400 | 9/1/2019 | Various | 25 years | ||||||
| Rollingstone Holdco LLC | Minnesota | 7,005 | 9/1/2019 | Various | 25 years | ||||||
| Stearns Solar I LLC | Minnesota | 1,400 | 9/1/2019 | Various | 25 years | ||||||
| Wabasha Solar LLC | Minnesota | 1,400 | 9/1/2019 | Various | 25 years | ||||||
| Wabasha Solar II LLC | Minnesota | 1,400 | 9/1/2019 | Various | 25 years | ||||||
| Wabasha Solar III LLC | Minnesota | 1,400 | 9/1/2019 | Various | 25 years | ||||||
| Winona Solar I LLC | Minnesota | 1,400 | 9/1/2019 | Various | 25 years | ||||||
| Winona Solar II LLC | Minnesota | 1,400 | 9/1/2019 | Various | 25 years | ||||||
| Mount Hope Solar 1 LLC | New York | 2,793 | 10/9/2019 | Various | 20 years | ||||||
| Rounseville Solar 1, LLC | Massachusetts | 3,324 | 11/14/19 | Various | 20 years | ||||||
| Wilmarth Lane Solar 1 LLC | Massachusetts | 6,372 | N/A (a) | Various | 20 years | ||||||
| Partridgeville Road Solar 1 LLC | Massachusetts | 4,743 | N/A (a) | Various | 20 years | ||||||
| Eastman Street Solar 1 LLC | Massachusetts | 1,438 | N/A (a) | Various | 20 years | ||||||
| 76,252 | |||||||||||
(a) Projects have not yet begun commercial operations.
(b) 1,000 kWdc sold to New York State Energy Research and Development Authority, or NYSERDA, through the 10-year PPA and the remainder through community solar customer agreements.
8
Exhibit 99.1
The following diagram provides further information related to the Company’s ownership structure as of December 31, 2019:
(2) Summary of Significant Accounting Policies
(a) Basis of Presentation and Principles of Consolidation
The Company’s consolidated financial statements have been prepared in accordance with accounting principles generally accepted in the United States, or U.S. GAAP. The Accounting Standards Codification, or ASC, established by the Financial Accounting Standards Board, or FASB, is the source of authoritative U.S. GAAP to be applied by nongovernmental entities.
The consolidated financial statements include the Company's accounts and operations of those of its subsidiaries. All significant intercompany transactions and balances have been eliminated in the consolidated financial statements. The usual condition for a controlling financial interest is ownership of a majority of the voting interests of an entity. However, a controlling financial interest may also exist through arrangements that do not involve controlling voting interests. As such, the Company applies the guidance of ASC 810, Consolidations, to determine when an entity that is not controlled through its voting interests should be consolidated.
The Company has elected not to push down the effects of the GIP Transaction to its consolidated financial statements and accordingly, there was no change in basis of presentation related to the GIP Transaction.
9
Exhibit 99.1
(b) Restricted Cash
The following table provides a reconciliation of cash and restricted cash reported within the consolidated balance sheets that sum to the total of the same such amounts shown in the consolidated statements of cash flows as of December 31, 2019 and 2018 (in thousands):
| 2019 | 2018 | |||||||||||||
| Cash | $ | 19,104 | $ | $ | 5,035 | |||||||||
| Restricted cash | 6,862 | 16,022 | ||||||||||||
| Cash and restricted cash shown in the consolidated statements of cash flows | $ | 25,966 | $ | $ | 21,057 | |||||||||
As of December 31, 2019, restricted cash consists of $5 million held at Renew Solar CS4 Borrower LLC for debt service and $2 million held at Chestnut Class B Borrower LLC for distributions and to satisfy reserves for performance obligations. As of December 31, 2018, restricted cash consists of $5 million held at Renew Solar CS4 Borrower LLC for debt service and $10 million held at Chestnut Class B Borrower LLC for distributions and to satisfy reserves for performance obligations.
(c) Accounts Receivable – Trade
Accounts receivable represent trade receivables from sales of electricity to residential, commercial and municipal customers. Also included in accounts receivable – trade are receivables for the sale of renewable energy credits to a former affiliate, NRG Power Marketing LLC and receivables related to government incentives. The Company reviews its accounts receivable by aging category to identify significant customer balances with known collections issues. In evaluating the allowance, the Company makes judgments about the creditworthiness of its customers based on ongoing credit evaluations. The Company also considers current economic trends that might impact the level of future credit losses. As of December 31, 2019 and 2018, the allowance for doubtful accounts was $52 thousand and $11 thousand, respectively.
(d) Debt Issuance Costs
Debt issuance costs consist of legal fees and closing costs incurred by the Company in obtaining its financings. These costs are capitalized and amortized as interest expense on a basis which approximates the effective interest method over the term of the financing obligation and are presented as a direct deduction from the carrying amount of the related debt.
Amortization expense, included in interest expense in the consolidated statements of operations, was $1,859 thousand and $810 thousand for the years ended December 31, 2019 and 2018, respectively.
(e) Property, Plant, and Equipment
The Company purchased certain of its solar installations from Clearway Renew and its subsidiaries through its acquisitions of wholly owned project subsidiaries listed in note 1, Nature of Business. The acquisitions were recorded as a transfer of assets under common control and accordingly, the assets are recorded at Clearway Renew’s historical cost. The excess of the purchase price over the historical cost was recorded as a developer fee as a non-cash reduction to member's equity. Purchased solar installations from third parties are stated at cost.
Significant additions or improvements extending asset lives are capitalized as incurred, while repairs and maintenance that do not improve or extend the life of the respective asset are charged to expense as incurred. Depreciation is computed using the straight-line method over the estimated useful lives of the assets. Certain assets and their related accumulated depreciation amounts are adjusted for asset retirements and disposals with the resulting gain or loss included in cost of operations in the consolidated statements of operations. See note 4, Property, Plant, and Equipment, for additional information.
Interest incurred on funds borrowed to finance capital projects is capitalized until the project under construction is ready for its intended use. The amount of interest capitalized for the years ended December 31, 2019 and 2018 was $2,134 thousand and $506 thousand, respectively.
Construction in progress represents cumulative construction costs, including the costs incurred for the purchase of major equipment and engineering costs and capitalized interest. Once the project achieves commercial operation, the Company reclassifies the amounts recorded in construction in progress to plant equipment.
10
Exhibit 99.1
(f) Intangible Asset
Intangible asset for power purchase agreement represents the fair value of the out-of-market component of the PPA acquired at the DG Foxborough Elm LLC facility determined at acquisition date, when Clearway Renew acquired the project from a third party. The Company recognizes specifically identifiable intangible assets when specific rights and contracts are acquired. This definite-lived intangible asset is amortized as a reduction to operating revenues on a straight line basis over the term of the PPA (through October 2042), which is 25 years from the date the facility achieved commercial operations.
As of December 31, 2019 and 2018, the intangible asset subject to amortization consists of the following (in thousands):
| 2019 | 2018 | |||||||||||||
| Intangible asset for power purchase agreement | $ | 1,500 | $ | 1,500 | ||||||||||
| Less accumulated amortization | (133 | ) | (73 | ) | ||||||||||
| Net intangible asset for power purchase agreement | $ | 1,367 | $ | 1,427 | ||||||||||
Aggregate amortization expense was $60 thousand for each of the years ended December 31, 2019 and 2018, which was recorded as a reduction to operating revenues in the consolidated statements of operations. Estimated amortization expense for each of the next five years is $60 thousand.
(g) Asset Impairments
Long-lived assets that are held and used are reviewed for impairment whenever events or changes in circumstances indicate carrying values may not be recoverable. Such reviews are performed in accordance with ASC 360, Property, Plant, and Equipment. An impairment loss is indicated if the total future estimated undiscounted cash flows expected from an asset are less than its carrying value. An impairment charge is measured by the difference between an asset’s carrying amount and fair value with the difference recorded in operating costs and expenses in the consolidated statements of operations. Fair values are determined by a variety of valuation methods, including third-party appraisals, sales prices of similar assets, and present value techniques. There were no indicators of impairment loss as of December 31, 2019 and 2018.
(h) Leases
The Company adopted ASU No. 2016-02, Leases (Topic 842), or Topic 842, on January 1, 2019, using the modified retrospective transition method and therefore, prior period financial information has not been adjusted and continues to be reflected in accordance with the Company's historical accounting policy. Topic 842 requires the establishment of a lease liability and related right-of-use, or ROU, asset for all leases with a term longer than 12 months. The Company elected certain of the permitted practical expedients, including the expedient that permits the Company to retain its existing lease assessment and classification. The Company also elected to account for lease and non-lease components for specific asset classes as a single lease component.
The adoption of the standard resulted in the recording of operating lease liabilities of $30.4 million and related ROU assets of $30.4 million. There was no impact to the Company’s consolidated statement of operations or cash flows. The Company utilized its incremental borrowing rate at adoption date of 4.17% to determine the amount of the lease liabilities.
All of the Company’s leases are operating leases as of December 31, 2019.
For new leases, the Company records its operating lease liabilities at the present value at lease commencement date of the lease payments over the lease term. Lease payments include fixed payment amounts, as well as variable rate payments based on an index initially measured at lease commencement date. Variable payments, including payments based on future performance and based on index changes, are recorded as the expense is incurred. The Company determines the relevant lease term by evaluating whether renewal and termination options are reasonably certain to be exercised. The Company uses its incremental borrowing rate to calculate the present value of the lease payments, based on information available at the lease commencement date.
See note 2(k), Revenue Recognition below and note 8, Leases for information on the Company's leases.
(i) Deferred Rent
Prior to the adoption of Topic 842, the Company recorded rent expense on a straight line basis over the life of the lease term. The cumulative difference between the payments made and the expense recognized was recorded in deferred rent on the consolidated balance sheets.
11
Exhibit 99.1
(j) Income Taxes
The Company is classified as a partnership for federal and state income tax purposes. Therefore, federal and state income taxes are assessed at the partner level. Accordingly, no provision has been made for federal or state income taxes in the accompanying consolidated financial statements.
(k) Revenue Recognition
On January 1, 2018, the Company adopted the guidance in ASC 606, Revenue from Contracts with Customers, or ASC 606, using the modified retrospective method applied to contracts which were not completed as of the adoption date, with no adjustment required to the financial statements upon adoption. Following the adoption of ASC 606, the Company's revenue recognition of its contracts with customers remains materially consistent with its historical practice. The comparative information has not been restated and continues to be reported under the accounting standards in effect for those periods. The Company's policies with respect to its various revenue streams are detailed below. In general, the Company applies the invoicing practical expedient to recognize revenue for the revenue streams detailed below, except in circumstances where the invoiced amount does not represent the value transferred to the customer.
Electric Revenue
The Company's electric revenue is related to energy contract revenue from the PPAs listed in note 1, Nature of Business. The contractual rates could be fixed or increase annually during the terms of the PPAs, ranging from 10-27 years. Electric revenue is billed and paid on a monthly basis.
The PPA at Solar Mule, LLC is accounted for as an operating lease. Previously ASC 840, Leases, or ASC 840, and currently Topic 842, requires the minimum lease payments received to be amortized over the term of the lease and contingent rentals are recorded when the achievement of the contingency becomes probable. Judgment is required by management in determining the economic life of each generating facility, in evaluating whether certain lease provisions constitute minimum payments or represent contingent rent and other factors in determining whether a contract contains a lease and whether the lease is an operating lease or capital lease. The lease has no minimum lease payments and all of the rental income under this lease is recorded as contingent rent on an actual basis each period when electricity is produced by the solar facility and delivered to the offtaker at the rate billable per kWh under the terms of the PPA. The lease has renewal options at the end of the lease term. Termination may be allowed under specific circumstances in the lease arrangement, such as under an event of default.
For PPAs accounted for as executory contracts under ASC 606, revenue is recognized on an accrual basis each period, as electricity is produced by the solar facility and delivered to the offtaker at the rate billable per kWh under the terms of the PPA.
The Company's electric revenue for the years ended December 31, 2019 and 2018 is summarized as follows (in thousands):
| 2019 | 2018 | |||||||||||||
| Energy revenue | $ | 15,669 | $ | 7,205 | ||||||||||
| Lease revenue | 245 | 272 | ||||||||||||
| Contract amortization | (60 | ) | (60 | ) | ||||||||||
| Total electric revenue | $ | 15,854 | $ | 7,417 | ||||||||||
Renewable Energy Certificates, or RECs
The Company has entered into agreements with NRG Power Marketing LLC, or PML, a wholly owned subsidiary of NRG, to purchase and sell RECs generated from 2017 through 2028 by the Massachusetts projects in accordance with vintage years, quantities, and prices in the REC agreements with PML. Prices range between $123.16 and $270.00 per REC. PML sells the RECs to third parties. Revenue is recognized as the REC is generated based on actual production multiplied by the contract rates. REC revenue is billed and paid on a quarterly basis. REC revenue from PML is recorded as Renewable energy certificates – affiliate prior to the GIP Transaction, and as Renewable energy certificates after the GIP Transaction, in the consolidated statements of operations.
12
Exhibit 99.1
Government Incentives
The Company is entitled to state performance based incentives, or PBIs, paid by NYSERDA for the Minisink Solar 1 LLC and Minisink Solar 2 LLC projects, not to exceed $900,607 for Minisink Solar 1 LLC and $1,092,655 for Minisink Solar 2 LLC, as well as for five projects in the CS4 Fund, not to exceed $5.7 million. The incentive payments for each project will consist of one payment at commercial operation date for 50% of the awarded amount, which was recorded to property, plant, and equipment, and two annual performance-based payments each of which is estimated to be 25% of the incentive. For CS4 Fund, the commercial operation date payment of $2.8 million for all five projects was recorded to property, plant and equipment in 2019. The two annual performance based payments are earned monthly based upon the actual electricity produced by the project multiplied by a rate stipulated in the agreements. PBI revenue is recorded as Government incentives in the consolidated statements of operations. As of December 31, 2019, $2.8 million was recorded to prepayments and other currents related to the NYSERDA commercial operation date payment, which was collected during the first quarter of 2020.
Contract Balances
The following table reflects the contract assets in the Company's consolidated balance sheets as of December 31, 2019 and 2018 (in thousands):
| 2019 | 2018 | |||||||||||||
| Accounts receivable - contracts with customers | $ | 9,243 | $ | 7,927 | ||||||||||
| Accounts receivable - leases | 8 | 15 | ||||||||||||
| Total accounts receivable - trade, net | $ | 9,251 | $ | 7,942 | ||||||||||
(l) Derivative Financial Instruments
The Company accounts for derivative financial instruments in accordance with ASC 815, Derivatives and Hedging, which requires the Company to recognize all derivative instruments on the balance sheet as either assets or liabilities and to measure them at fair value each reporting period unless they qualify for a normal purchase normal sale exception. The Company uses interest rate swaps to manage its interest rate exposure on long-term debt, which are not designated as cash flow hedges. Changes in the fair value of non-hedge derivatives are immediately recognized in earnings. See note 5, Accounting for Derivative Instruments and Hedging Activities, for more information.
(m) Risks and Uncertainties
Financial instruments which potentially subject the Company to concentrations of credit risk consist primarily of accounts receivable – trade, accounts receivable – affiliate, and derivative instruments. Accounts receivable are concentrated with residential, commercial, and municipal customers. The energy industry may impact the Company’s overall exposure to credit risk, either positively or negatively, in that the customer may be similarly affected by changes in economic, industry, or other conditions. Municipal entities are generally subject to budget decisions made at superior governmental levels, which may impede or delay the Company’s collection of accounts receivable from these customers. However, the Company believes that the credit risk posed by such concentrations is offset by the diversification and creditworthiness of its customer base. The Company is exposed to credit losses in the event of noncompliance by counterparties on its derivative financial instruments.
Due to the concentration of sales of RECs to PML, the Company is exposed to credit risk of potential nonperformance by them, which could impact liquidity if this customer were to experience financial difficulties. As of December 31, 2019 and 2018, accounts receivable – trade with PML totaled $5.8 million and $5.5 million, respectively. The maximum amount of loss due to credit risk, should the customer fail to perform, is the amount of the outstanding receivable, and any losses associated with replacing this customer.
Risks associated with the Company’s operations include the performance of a solar installation below expected levels of efficiency and output, shutdowns due to the breakdown or failure of equipment, or catastrophic events such as fires, earthquakes, floods, explosions, pandemics, or other similar occurrences affecting a power generation installation or its energy purchaser.
(n) Fair Value of Financial Instruments
The Company accounts for the fair value of financial instruments in accordance with ASC 820, Fair Value Measurement, or ASC 820. The Company does not hold or issue financial instruments for trading purposes. The carrying amounts of cash, restricted cash, accounts receivable – trade, accounts receivable – affiliate, accounts payable – trade, accounts payable – affiliate and accrued liabilities approximate fair value because of the short-term maturity of these instruments and are classified as Level 1 within the fair value hierarchy.
13
Exhibit 99.1
Derivative instruments consisting of interest rate swaps are recorded at fair value on the Company’s consolidated balance sheet on a recurring basis and are classified as Level 2 within the fair value hierarchy as the fair value can be determined based on observable values of underlying interest rates. The fair value of each contract is discounted using a risk free interest rate. In addition, the Company applies a credit reserve to reflect credit risk, which for interest rate swaps is calculated utilizing the bilateral method based on published default probabilities. The credit reserve is added to the discounted fair value to reflect the exit price that a market participant would be willing to receive to assume the Company's liabilities or that a market participant would be willing to pay for the Company's assets. For further discussion of interest rate swaps, see note 5, Accounting for Derivatives Instruments and Hedging Activities.
The carrying value of long-term debt approximates fair value at December 31, 2019 and 2018 as the debt carries a variable interest rate. The carrying value of short-term debt – affiliate approximates fair value at December 31, 2019 and 2018 due to its short-term maturity. The fair values of long-term debt and short-term debt – affiliate are based on current interest rates for similar instruments with equivalent credit quality and is classified as Level 3 inputs within the fair value hierarchy.
ASC 820 establishes a fair value hierarchy that prioritizes the inputs to valuation techniques used to measure fair value into three levels as follows:
•Level 1 – Quoted prices (unadjusted) in active markets for identical assets or liabilities that the Company has the ability to access as of the measurement date.
• Level 2 – Inputs other than quoted prices included within Level 1 that are directly observable for the asset or liability or indirectly observable through corroboration with observable market data.
• Level 3 – Unobservable inputs for the asset or liability only used when there is little, if any, market activity for the asset or liability at the measurement date.
In accordance with ASC 820, the Company determines the level in the fair value hierarchy within which each fair value measurement in its entirety falls, based on the lowest level input that is significant to the fair value measurement in its entirety.
(o) Commitments and Contingencies
In the normal course of business, the Company is subject to various claims and litigation. Management of the Company expects that these various litigation items will not have a material adverse effect on the results of operations, cash flows, or financial position of the Company.
(p) Asset Retirement Obligations
The Company accounts for its asset retirement obligations, or AROs, in accordance with ASC 410-20, Asset Retirement Obligations, or ASC 410-20. Retirement obligations associated with long-lived assets included within the scope of ASC 410-20 are those for which a legal obligation exists under enacted laws, statutes, and written or oral contracts, including obligations arising under the doctrine of promissory estoppel, and for which the timing and/or method of settlement may be conditional on a future event. ASC 410-20 requires the Company to recognize the fair value of a liability for an ARO in the period in which it is incurred and a reasonable estimate of fair value can be made.
Upon initial recognition of a liability for an ARO, the Company capitalizes the asset retirement cost by increasing the carrying amount of the related long-lived asset by the same amount. Over time, the liability is accreted to its future value, while the capitalized cost is depreciated over the useful life of the related asset. The Company’s AROs are the estimated cost to remove the above ground solar equipment and restore the site to conditions similar to the surrounding parcels.
The following table represents the balance of the ARO obligation as of December 31, 2019 and 2018, along with the additions and accretion expense related to the Company's ARO for the year ended December 31, 2019 (in thousands):
| Balance as of December 31, 2018 | $ | 1,953 | |||
| Additions | 2,127 | ||||
| Accretion expense | 196 | ||||
| Balance as of December 31, 2019 | $ | 4,276 | |||
(q) Comprehensive Income
The Company’s total comprehensive income is equal to its net income for the years ended December 31, 2019 and 2018.
14
Exhibit 99.1
(r) Redeemable Noncontrolling Interests
The tax equity investor in the Chestnut Fund, Firstar, has the right to redeem its interests for cash or other assets and accordingly, the Company has included the noncontrolling interest attributable to Firstar as a component of temporary equity in the mezzanine section of the consolidated balance sheets. The following table reflects the changes in the Company's redeemable noncontrolling interest balance for the years ended December 31, 2019 and 2018 (in thousands):
| Balance as of December 31, 2017 | $ | 6,517 | |||
| Cash contributions | 44,266 | ||||
| Cash distributions | (928 | ) | |||
| Net loss attributable to noncontrolling interest | (50,149 | ) | |||
| Balance as of December 31, 2018 | $ | (294 | ) | ||
| Cash contributions | 1,724 | ||||
| Cash distributions | (1,591 | ) | |||
| Net loss attributable to noncontrolling interest | (576 | ) | |||
| Balance as of December 31, 2019 | $ | (737 | ) | ||
(s) Tax Equity Arrangements
The Company has determined that the appropriate methodology for calculating its noncontrolling interest and redeemable noncontrolling interest is a balance sheet approach using the hypothetical liquidation at book value, or HLBV, method. Under the HLBV method, the amount reported as noncontrolling interests and redeemable noncontrolling interests represent the amount that each tax equity investor would hypothetically receive at each balance sheet date under the liquidation provisions of the contractual agreements assuming the net assets were liquidated at their recorded amounts determined in accordance with GAAP. The tax equity investors' interest in the results of operations are determined as the difference in the noncontrolling interest or redeemable noncontrolling interest at the start and end of each reporting period, after taking into account any capital transactions. The calculations utilized to apply the HLBV method include estimated calculations of taxable income or losses for the reporting period. These amounts are reconciled to the taxable income or loss included within the tax return once the tax return is filed.
(t) Use of Estimates
The preparation of the consolidated financial statements in conformity with U.S. GAAP requires management to make estimates and assumptions that affect the reported amounts of assets and liabilities and disclosures of contingent assets and liabilities at the date of the consolidated financial statements, and the reported amounts of revenues and expenses during the reporting period. Actual results could differ from those estimates.
15
Exhibit 99.1
(3) Tax Equity Arrangements
(a) Chestnut Fund
The Company's wholly owned subsidiary Chestnut Class B LLC is the Class B Member and the Managing Member of the Chestnut Fund tax equity arrangement and it conducts and directs all operating activities of the fund. The Investor Member is Firstar. Chestnut Fund is a VIE and Chestnut Class B LLC is the primary beneficiary due to its role as Managing Member and the ability to direct the activities that most significantly impact the economics of the tax equity arrangement.
The summarized financial information for Chestnut Fund as of December 31, 2019 and 2018 is as follows (in thousands):
| 2019 | 2018 | ||||||||||
| Current assets | $ | 14,596 | $ | 13,490 | |||||||
| Property, plant, and equipment, net | 175,492 | 182,416 | |||||||||
| Intangible asset for power purchase agreement, net | 1,367 | 1,427 | |||||||||
| Right-of-use assets, net | 22,817 | — | |||||||||
| Other non-current assets | 311 | 310 | |||||||||
| Total assets | 214,583 | 197,643 | |||||||||
| Accounts payable – affiliate | 651 | 3,473 | |||||||||
| Long-term lease liabilities | 22,753 | — | |||||||||
| Other current and non-current liabilities | 3,110 | 7,290 | |||||||||
| Total liabilities | 26,514 | 10,763 | |||||||||
| Redeemable noncontrolling interests | (737 | ) | (294 | ) | |||||||
| Net assets less redeemable noncontrolling interests | $ | 188,806 | $ | 187,174 | |||||||
(b) CS4 Fund
The Company's wholly owned subsidiary Renew Solar CS4 Class B LLC is the Class B Member and Managing Member of the CS4 Fund tax equity arrangement, and conducts and directs all operating activities of the fund. The Investor Member is PNC. CS4 Fund is a VIE and Renew Solar CS4 Class B LLC is the primary beneficiary due to its role as Managing Member and the ability to direct the activities that most significantly impact the economics of the tax equity arrangement.
The summarized financial information for CS4 Fund as of December 31, 2019 and 2018 is as follows (in thousands):
| 2019 | 2018 | ||||||||||
| Current assets | $ | 6,573 | $ | — | |||||||
| Property, plant, and equipment, net | 156,684 | 43,274 | |||||||||
| Right-of-use assets, net | 11,950 | — | |||||||||
| Total assets | 175,207 | 43,274 | |||||||||
| Accounts payable – affiliate | 67,739 | 57,126 | |||||||||
| Long-term lease liabilities | 11,950 | — | |||||||||
| Other current and non-current liabilities | 6,283 | 2,750 | |||||||||
| Total liabilities | 85,972 | 59,876 | |||||||||
| Noncontrolling interests | 1,061 | (1,652 | ) | ||||||||
| Net assets less noncontrolling interests | $ | 88,174 | $ | (14,950 | ) | ||||||
16
Exhibit 99.1
(4) Property, Plant, and Equipment
The Company’s major classes of property, plant, and equipment as of December 31, 2019 and 2018 were as follows (in thousands):
| 2019 | 2018 | Depreciable lives | ||||||||||||||
| Plant equipment | $ | 300,747 | $ | 184,558 | 10 - 30 years | |||||||||||
| Construction in progress | 45,488 | 68,564 | — | |||||||||||||
| Total property, plant, and equipment | 346,235 | 253,122 | ||||||||||||||
| Less accumulated depreciation | (14,059 | ) | (5,363 | ) | ||||||||||||
| Net property, plant, and equipment | $ | 332,176 | $ | 247,759 | ||||||||||||
(a) Chestnut Fund
Chestnut Fund purchased its solar installations through the acquisition of membership interests in its subsidiaries from Clearway Renew. During 2017 through 2019, the purchase price of the acquired property, plant, and equipment was $259.4 million. As of December 31, 2018, $5.8 million of the purchase price was payable to Clearway Renew and was recorded on the Company's consolidated balance sheets in accounts payable – affiliate. As described in note 2, Summary of Significant Accounting Policies, the acquisitions were a transfer of assets under common control. Accordingly, the assets are recorded at Clearway Renew's historical cost. The purchase price less the historical cost is recorded as a developer fee and a corresponding reduction to equity. In addition, AROs totalling $1.5 million have been recorded by Chestnut Fund upon acquisitions and are included in property, plant, and equipment. In 2018, $997 thousand was recorded as a reduction to property, plant, and equipment for a NYSERDA government incentive award related to the Minisink Solar 1 LLC and Minisink Solar 2 LLC facilities reaching commercial operation. For additional information on the award, see note 2(k), Revenue Recognition.
17
Exhibit 99.1
Chestnut Fund completed the following acquisitions of membership interests in its subsidiaries with the purchase price allocated primarily to property, plant, and equipment (in thousands):
| Project company | Purchase price | Historical cost | Developer fee | Acquisition date | Placed in service date | |||||||||||
| Black Cat Road Solar, LLC | $ | 5,183 | $ | 3,666 | $ | 1,517 | August 14, 2017 | August 30, 2017 | ||||||||
| Brook St Solar 1, LLC | 25,593 | 18,192 | 7,401 | August 14, 2017 | September 6, 2017 | |||||||||||
| Solar Mule, LLC | 4,211 | 3,142 | 1,069 | September 1, 2017 | September 18, 2017 | |||||||||||
| Big Lake Holdco LLC | 18,583 | 14,559 | 4,024 | August 14, 2017 | October 1, 2017 | |||||||||||
| Solar West Shaft LLC | 4,550 | 3,189 | 1,361 | August 14, 2017 | October 10, 2017 | |||||||||||
DG Foxborough Elm LLC (a) | 10,183 | 7,838 | 2,345 | September 27, 2017 | October 12, 2017 | |||||||||||
| Redbrook Solar 1 LLC | 21,090 | 15,415 | 5,675 | September 27, 2017 | November 9, 2017 | |||||||||||
| Northfield Holdco LLC | 17,639 | 12,742 | 4,897 | October 27, 2017 | December 1, 2017 | |||||||||||
| Waterford Holdco LLC | 9,218 | 6,453 | 2,765 | October 27, 2017 | December 1, 2017 | |||||||||||
| Center St Solar 1 LLC | 13,529 | 10,042 | 3,487 | August 14, 2017 | December 21, 2017 | |||||||||||
| TOS Solar 1, LLC | 2,023 | 1,328 | 695 | October 27, 2017 | December 30, 2017 | |||||||||||
| TOS Solar 2, LLC | 4,210 | 3,014 | 1,196 | October 27, 2017 | December 30, 2017 | |||||||||||
| Stafford St Solar 1, LLC | 10,367 | 7,608 | 2,759 | August 14, 2017 | December 31, 2017 | |||||||||||
| Stafford St Solar 3, LLC | 5,448 | 4,002 | 1,446 | August 14, 2017 | December 31, 2017 | |||||||||||
| ETCAP NES CS MN 02 LLC | 3,147 | 2,301 | 846 | January 25, 2018 | May 1, 2018 | |||||||||||
| ETCAP NES CS MN 06 LLC | 10,684 | 7,680 | 3,004 | January 25, 2018 | May 1, 2018 | |||||||||||
| Stafford St Solar 2, LLC | 10,553 | 7,788 | 2,765 | August 14, 2017 | May 9, 2018 | |||||||||||
| Bullock Road Solar 1, LLC | 20,687 | 15,205 | 5,482 | August 14, 2017 | July 25, 2018 | |||||||||||
| Mapleton Solar LLC | 14,235 | 10,056 | 4,179 | March 29, 2018 | September 1, 2018 | |||||||||||
| Osakis Solar LLC | 18,993 | 13,663 | 5,330 | March 29, 2018 | September 1, 2018 | |||||||||||
| Solar Wauwinet LLC | 5,345 | 4,091 | 1,254 | October 27, 2017 | September 17, 2018 | |||||||||||
| Minisink Solar 1 LLC | 7,746 | 5,174 | 2,572 | January 25, 2018 | October 26, 2018 | |||||||||||
| Minisink Solar 2 LLC | 8,673 | 5,786 | 2,887 | January 25, 2018 | October 31, 2018 | |||||||||||
| DG Marathon LLC | 7,474 | 4,540 | 2,934 | September 27, 2017 | January 4, 2019 | |||||||||||
| Total acquisitions | 259,364 | 187,474 | 71,890 | |||||||||||||
| less: 2017 acquisitions | 194,744 | 133,081 | 61,663 | |||||||||||||
| less: 2018 acquisitions | 64,361 | 55,683 | 8,678 | |||||||||||||
| 2019 acquisitions | $ | 259 | $ | (1,290 | ) | $ | 1,549 | |||||||||
(a) Included in the historical cost of Foxborough is $1.5 million for an intangible asset, as described further in note 2(f), Summary of Significant Accounting Policies.
(b) CS4 Fund
CS4 Fund purchased its solar installations through the acquisition of membership interests in its subsidiaries from CS4 Seller, a wholly owned subsidiary of the Company. CS4 Seller funded the construction of the projects through borrowings under the financing arrangement for CS4 Borrower, as further described in note 6, Long-term Debt. The purchase price of the acquired property, plant, and equipment was $165.0 million and $71.2 million in 2019 and 2018. As described in note 2, Summary of Significant Accounting Policies, the acquisitions were transfers of assets under common control. Accordingly, the assets are recorded at CS4 Seller's historical cost. The purchase price less the historical cost was recorded as a developer fee and a corresponding reduction to equity. In addition, the Company recorded an ARO of $2.1 million and $274 thousand in 2019 and 2018, respectively, which is included in property, plant, and equipment. In 2019, $2.8 million was recorded as a reduction to property, plant, and equipment for a NYSERDA government incentive award related to the five New York solar facilities reaching commercial operation. For additional information on the award, see note 2(k), Revenue Recognition.
18
Exhibit 99.1
CS4 Fund completed the following acquisitions of membership interests in its subsidiaries, with the purchase price allocated primarily to property, plant, and equipment (in thousands):
| Project company | Purchase price | Historical cost | Developer fee | Acquisition date | Placed in service date | |||||||||||
| Montevideo Solar LLC | $ | 18,019 | $ | 12,059 | $ | 5,960 | November 29, 2018 | January 1, 2019 | ||||||||
| Underhill Solar LLC | 6,771 | 4,205 | 2,566 | December 20, 2018 | March 18, 2019 | |||||||||||
| Bluestone Solar LLC | 6,845 | 4,575 | 2,270 | December 20, 2018 | March 27, 2019 | |||||||||||
| Chisago Holdco LLC | 10,993 | 6,649 | 4,344 | December 20, 2018 | May 1, 2019 | |||||||||||
| Frontenac Holdco LLC | 19,121 | 12,006 | 7,115 | December 20, 2018 | May 1, 2019 | |||||||||||
| CMR Solar LLC | 8,484 | 4,944 | 3,540 | December 20, 2018 | May 10, 2019 | |||||||||||
| Sartell Solar LLC | 20,757 | 13,733 | 7,024 | February 19, 2019 | June 1, 2019 | |||||||||||
| Grabinski Solar LLC | 6,457 | 4,053 | 2,404 | June 27, 2019 | July 25, 2019 | |||||||||||
| Clara City Solar LLC | 4,226 | 2,670 | 1,556 | July 31, 2019 | September 1, 2019 | |||||||||||
| New Munich Solar LLC | 5,326 | 3,671 | 1,655 | July 31, 2019 | September 1, 2019 | |||||||||||
| Olinda Trail Solar LLC | 5,420 | 3,360 | 2,060 | July 31, 2019 | September 1, 2019 | |||||||||||
| Rollingstone Holdco LLC | 20,282 | 10,609 | 9,673 | June 27, 2019 | September 1, 2019 | |||||||||||
| Stearns Solar I LLC | 5,385 | 3,675 | 1,710 | July 31, 2019 | September 1, 2019 | |||||||||||
| Wabasha Solar LLC | 4,966 | 3,064 | 1,902 | July 31, 2019 | September 1, 2019 | |||||||||||
| Wabasha Solar II LLC | 4,998 | 2,566 | 2,432 | July 31, 2019 | September 1, 2019 | |||||||||||
| Wabasha Solar III LLC | 4,735 | 2,516 | 2,219 | July 31, 2019 | September 1, 2019 | |||||||||||
| Winona Solar I LLC | 4,632 | 2,985 | 1,647 | July 31, 2019 | September 1, 2019 | |||||||||||
| Winona Solar II LLC | 4,928 | 2,954 | 1,974 | July 31, 2019 | September 1, 2019 | |||||||||||
| Mount Hope Solar 1 LLC | 8,253 | 5,589 | 2,664 | June 27, 2019 | October 9, 2019 | |||||||||||
| Rounseville Solar 1, LLC | 13,417 | 8,137 | 5,280 | July 31, 2019 | November 14, 2019 | |||||||||||
| Wilmarth Lane Solar 1 LLC | 26,775 | 17,088 | 9,687 | May 31, 2019 | N/A (a) | |||||||||||
| Partridgeville Road Solar 1 LLC | 19,712 | 13,230 | 6,482 | November 30, 2019 | N/A (a) | |||||||||||
| Eastman Street Solar 1 LLC | 5,681 | 3,704 | 1,977 | June 27, 2019 | N/A (a) | |||||||||||
| Total acquisitions | 236,183 | 148,042 | 88,141 | |||||||||||||
| less: 2018 acquisitions | 71,160 | 40,365 | 30,795 | |||||||||||||
| 2019 acquisitions | $ | 165,023 | $ | 107,677 | $ | 57,346 | ||||||||||
(a) Projects have not yet been placed in service.
(5) Accounting for Derivative Instruments and Hedging Activities
(a) Interest Rate Swaps
In accordance with the financing agreements described in note 6, Long-Term Debt, Chestnut Fund Borrower and CS4 Borrower each entered into a series of fixed for floating forward interest rate swaps for at least 80% and not more than 105% of the expected borrowings under the term loans, intended to hedge the risks associated with floating interest rates. Chestnut Fund and CS4 Borrower will pay their counterparties the equivalent of a fixed interest payment on a predetermined notional value, and quarterly each borrower will receive the equivalent of a floating interest payment based on a three-month LIBOR from the effective date through the maturity date.
19
Exhibit 99.1
(b) Volumetric Underlying Derivative Transactions
The notional amount of the interest rate swaps decreases in proportion to the loans. The following table summarizes the outstanding notional amounts and terms of the interest rate swaps as of December 31, 2019 and 2018:
| Notional amount | ||||||||||||
| (in thousands) | ||||||||||||
| Effective date | 2019 | 2018 | Fixed Rate | Maturity Date | ||||||||
| January 31, 2019 | $ | 44,063 | $ | 46,869 | 2.380% | January 30, 2040 | ||||||
| January 31, 2019 | 11,341 | 11,755 | 2.502% | January 30, 2041 | ||||||||
| January 31, 2019 | 28,695 | 29,742 | 2.495% | January 30, 2041 | ||||||||
| January 30, 2019 | 9,921 | 7,709 | 3.065% | October 30, 2041 | ||||||||
| January 30, 2019 | 22,919 | — | 2.903% | October 30, 2041 | ||||||||
| April 15, 2019 | 5,179 | 5,252 | 3.181% | July 15, 2035 | ||||||||
| April 15, 2019 | 7,768 | 7,878 | 3.181% | July 15, 2035 | ||||||||
| April 15, 2019 | 7,768 | 7,878 | 3.181% | July 15, 2035 | ||||||||
| August 28, 2019 | 16,640 | — | 1.601% | January 15, 2043 | ||||||||
| August 28, 2019 | 24,960 | — | 1.601% | January 15, 2043 | ||||||||
| August 28, 2019 | 24,960 | — | 1.601% | January 15, 2043 | ||||||||
| $ | 204,214 | $ | 117,083 | |||||||||
(c) Fair Value of Derivative Transactions
The following table summarizes the Company’s derivative assets and liabilities on the consolidated balance sheets as of December 31, 2019 and 2018 (in thousands):
| 2019 | 2018 | |||||||||
| Derivatives not designated as cash flow hedges: | ||||||||||
| Derivative assets: | ||||||||||
| Interest rate contracts current | $ | 155 | $ | 184 | ||||||
| Interest rate contracts long-term | 2,599 | 1,489 | ||||||||
| Total assets | $ | 2,754 | $ | 1,673 | ||||||
| Derivative liabilities: | ||||||||||
| Interest rate contracts current | $ | 862 | $ | 72 | ||||||
| Interest rate contracts long-term | 7,712 | 992 | ||||||||
| Total liabilities | $ | 8,574 | $ | 1,064 | ||||||
(d) Impact of Derivative Instruments on the Consolidated Statements of Operations
The Company's interest rate derivative instruments are not designated as cash flow hedges. The effect of interest rate hedges is recorded to interest expense. For the years ended December 31, 2019 and 2018, the impact to the consolidated statements of operations was a loss of $6.4 million and a gain of $468 thousand, respectively.
20
Exhibit 99.1
(6) Long-Term Debt
(a) Chestnut Borrower Credit Agreement
In July 2017, the Company entered into a credit agreement with Deutsche Bank AG, (subsequently amended in June 2018), for term loans of up to $120.3 million and letters of credit of up to $7.5 million. In January 2019, the letters of credit commitment amount under the credit agreement was increased to $7.9 million. The loans bear annual interest at a rate of LIBOR plus an applicable margin, which is 2.50% per annum through the fifth anniversary of the financial closing date, or July 2022, and 2.75% per annum thereafter through the maturity date in March 2024. In addition to interest on the outstanding borrowings, the Company will pay a commitment fee on the unused portions of the term loan and letter of credit commitments equal to 0.75% per year. The borrowings are secured by the Company's interests in the project companies.
As of December 31, 2019, the Company had issued a letter of credit for a commitment of $7.9 million to support the Company’s debt service reserve requirements. The Company pays a letter of credit fee of 2.50% per annum on issued amounts under the letter of credit facility on a quarterly basis, which is recorded in interest expense in the consolidated statements of operations.
As of December 31, 2019 and 2018, long-term debt consists of the following (in thousands):
| 2019 | 2018 | |||||||||||||
| Total long-term debt (including current maturities) | $ | 115,576 | $ | 117,570 | ||||||||||
| Less current maturities | (8,483 | ) | (5,646 | ) | ||||||||||
| Less debt issuance costs, net | (3,661 | ) | (4,368 | ) | ||||||||||
| Long-term debt | $ | 103,432 | $ | 107,556 | ||||||||||
Distributions from the Company are subject to compliance with the terms and conditions defined in the credit agreement, including a covenant to meet a required debt service coverage ratio of at least 1.20 to 1.0. At December 31, 2019, the Company was in compliance with various restrictive covenants defined in the credit agreement.
Long-term debt maturities as of December 31, 2019 are summarized as follows (in thousands):
| Year ending December 31: | ||||
| 2020 | $ | 8,483 | ||
| 2021 | 8,168 | |||
| 2022 | 7,876 | |||
| 2023 | 6,641 | |||
| 2024 | 84,408 | |||
| $ | 115,576 | |||
21
Exhibit 99.1
(b) CS4 Borrower Credit Agreement
In September 2018, the Company entered into a credit agreement with three financial institutions for construction loans up to $97.4 million that partially converted to a term loan on June 27, 2019, an investment tax credit bridge loan, or ITC bridge loan, for up to $89.9 million and letter of credit facilities up to $4.9 million. The construction loan and the ITC bridge loan both have an interest rate of LIBOR plus an applicable margin of 1.75% per annum. The ITC bridge loan matures upon the conversion of the construction loans to a term loan. The Company pays quarterly commitment fees of 0.625% per annum on any unused portion of all of the financing commitments described above, with the exception of the term loan. The term loan will bear annual interest at a rate of LIBOR plus an applicable margin, which is 2.00% per annum through the third anniversary of the term conversion, and 2.25% per annum thereafter through the maturity date in June 2026. The construction loan and the ITC bridge loan, and the future term loan, will be secured by the Company's membership interests in the project companies.
As of December 31, 2019, the Company had issued a letter of credit for a commitment of $3.3 million to support the Company's debt service requirements. The Company pays an availability fee of 2.00% per annum on issued amounts under the letter of credit facility on a quarterly basis, which is recorded in interest expense in the consolidated statement of operations.
As of December 31, 2019, long-term debt consists of the following (in thousands):
| 2019 | 2018 | |||||||||||
| Term loan | $ | 53,777 | $ | — | ||||||||
| Construction loan | 20,483 | 20,387 | ||||||||||
| ITC bridge loan | 29,313 | 32,164 | ||||||||||
| Total long-term debt (including current maturities) | 103,573 | 52,551 | ||||||||||
| Less current maturities | (32,513 | ) | (21,404 | ) | ||||||||
| Less debt issuance costs | (4,880 | ) | (5,425 | ) | ||||||||
| Long-term debt | $ | 66,180 | $ | 25,722 | ||||||||
Distributions from the Company are subject to compliance with the terms and conditions defined in the credit agreement, including a covenant to meet a required debt service coverage ratio of at least 1.20 to 1.0. As of December 31, 2019, the Company was in compliance with the various restrictive covenants defined in the credit agreement.
Long-term debt maturities as of December 31, 2019 are summarized as follows (in thousands):
| Year ending December 31: | |||
| 2020 | $ | 32,513 | |
| 2021 | 3,513 | ||
| 2022 | 3,281 | ||
| 2023 | 2,408 | ||
| 2024 | 2,397 | ||
| Thereafter | 59,461 | ||
| $ | 103,573 | ||
22
Exhibit 99.1
(7) Related Party Transactions
The Company has the following related party transactions and relationships in addition to the acquisition of solar energy systems from Clearway Renew described in note 4, Property, Plant, and Equipment and renewable energy certificate revenue described in note 2(k), Summary of Significant Accounting Policies. Amounts due to related parties are recorded as accounts payable – affiliate and amounts due to the Company from related parties are recorded as accounts receivable – affiliate on the Company’s consolidated balance sheets. These account balances are netted by affiliate party.
Both Chestnut Fund and CS4 Fund have asset management agreements with Solar Asset Management LLC, a subsidiary of Clearway Renew, where Solar Asset Management LLC performs administrative services related to the acquired project companies and receives an asset management fee in an annual amount per project. The Funds will also reimburse Solar Asset Management LLC for certain out-of-pocket costs. Chestnut Fund incurred costs under the agreement of $196 thousand and $185 thousand for the years ended December 31, 2019 and 2018, respectively. CS4 Fund incurred costs under the agreement of $106 thousand and $0 thousand for the years ended December 31, 2019 and 2018, respectively. These costs are included in cost of operations – affiliate in the consolidated statements of operations.
Both Chestnut Fund and CS4 Fund have operations and maintenance agreements with Clearway Renewable Operation & Maintenance LLC, or RENOM, a subsidiary of Clearway Energy Group, to operate and maintain the PV Systems owned by the acquired project companies. RENOM receives a fee in a set annual amount for each project plus reimbursable costs, with an annual escalation of 2.25%. The fee is also subject to adjustments for additional site maintenance, panel washing and replacement costs. Chestnut Fund incurred costs under the agreement of $899 thousand and $488 thousand for the years ended December 31, 2019 and 2018, respectively. CS4 Fund incurred costs under the agreement of $201 thousand and $0 thousand for the years ended December 31, 2019 and 2018, respectively. These costs are included in cost of operations – affiliate in the consolidated statements of operations.
Subject to both the the Chestnut Fund and CS4 Fund Limited Liability Company Agreements, in the event that additional working capital is required by to cause the assets to be properly operated and maintained and to pay for the costs, expenses, obligations and liabilities of Chestnut Fund and CS4, then the Company shall have the right, but not the obligation, to provide all or part of the funds needed by the Company in the form of member loans. These loans were funded through intercompany borrowings from the Company's Class B Member, Renew DG Holdings. As of December 31, 2019 and 2018, $1.6 million was outstanding under member loans for each of the years, which was recorded in short-term debt – affiliate on the consolidated balance sheets.
(8) Leases
The projects owned by the Company entered into various land lease agreements where their respective solar energy facilities are located. During the terms of the leases, the Company will operate the solar energy facilities to supply electric energy to the customers of the previously described community solar installations. The Company is responsible for all operating costs, repairs and maintenance, and insurance related to the facilities. These costs are included in cost of operations in the consolidated statements of operations.
Lease expense for the year ended December 31, 2019 was comprised of the following (in thousands):
| 2019 | ||||||||||
| Operating lease cost | $ | 2,148 | ||||||||
| Variable lease cost | 90 | |||||||||
| Total lease cost | $ | 2,238 | ||||||||
Lease expense under operating leases was $2.4 million for the year ended December 31, 2018.
23
Exhibit 99.1
Operating lease information as of December 31, 2019 was as follows (in thousands, except term and rate):
| 2019 | |||||||||
| ROU assets - operating leases, net | $ | 34,767 | |||||||
| Short-term lease liability - operating leases | $ | 500 | |||||||
| Long-term lease liability - operating leases | 34,703 | ||||||||
| Total lease liability | $ | 35,203 | |||||||
| Cash paid for operating leases | $ | 1,875 | |||||||
| Weighted average remaining lease term | 25 years | ||||||||
| Weighted average discount rate | 4.17 | % | |||||||
Maturities of operating lease liabilities as of December 31, 2019 are as follows (in thousands):
| 2020 | $ | 1,925 | |
| 2021 | 1,966 | ||
| 2022 | 2,019 | ||
| 2023 | 2,051 | ||
| 2024 | 2,086 | ||
| Thereafter | 48,073 | ||
| Total lease payments | $ | 58,120 | |
| Less imputed interest | (22,917 | ) | |
| Total lease liability - operating leases | $ | 35,203 | |
Future minimum payments under noncancelable land leases as of December 31, 2018 under ASC 840 were as follows (in thousands):
| Year ending December 31: | |||
| 2019 | $ | 1,581 | |
| 2020 | 1,653 | ||
| 2021 | 1,680 | ||
| 2022 | 1,738 | ||
| 2023 | 1,766 | ||
| Thereafter | 37,521 | ||
| Total lease payments | $ | 45,939 | |
(9) Subsequent Events
The Company has evaluated subsequent events from the balance sheet date through March 30, 2020, the date at which the consolidated financial statements were available to be issued, and determined that there are no other items to disclose.
24