| | | | | |
| PROSPECTUS SUPPLEMENT NO. 7 | Filed pursuant to Rule 424(b)(3) |
| (To prospectus dated July 9, 2024) | Registration No. 333-280341 |
TALEN ENERGY CORPORATION
36,825,683 SHARES OF COMMON STOCK
This prospectus supplement is being filed to update and supplement the information contained in the prospectus dated July 9, 2024, as supplemented by Prospectus Supplement No. 1, dated August 13, 2024, Prospectus Supplement No. 2, dated November 14, 2024, Prospectus Supplement No. 3, dated December 13, 2024, Prospectus Supplement No. 4, dated December 20, 2024, Prospectus Supplement No. 5, dated January 7, 2025, and Prospectus Supplement No. 6, dated January 11, 2025 (as so supplemented, the “Prospectus”), with the information contained in our Annual Report on Form 10-K, filed with the Securities and Exchange Commission (the “SEC”) on February 27, 2025 (the “Annual Report”). Accordingly, we have attached the Annual Report to this prospectus supplement.
The Prospectus and this prospectus supplement relate to the resale from time to time of up to 36,825,683 shares of our common stock, par value $0.001 per share (the “Common Stock”), by the selling stockholders named in the Prospectus or their permitted transferees.
This prospectus supplement updates and supplements the information in the Prospectus and is not complete without, and may not be delivered or utilized except in combination with, the Prospectus, including any other amendments or supplements thereto. This prospectus supplement should be read in conjunction with the Prospectus, and if there is any inconsistency between the information in the Prospectus and this prospectus supplement, you should rely on the information in this prospectus supplement. The information in this prospectus supplement modifies and supersedes, in part, the information in the Prospectus. Any information in the Prospectus that is modified or superseded shall not be deemed to constitute a part of the Prospectus except as modified or superseded by this prospectus supplement.
You should not assume that the information provided in this prospectus supplement or the Prospectus is accurate as of any date other than their respective dates. Neither the delivery of this prospectus supplement and Prospectus, nor any sale made hereunder, shall under any circumstances create any implication that there has been no change in our affairs since the date of this prospectus supplement or that the information contained in this prospectus supplement or the Prospectus is correct as of any time after the date of that information.
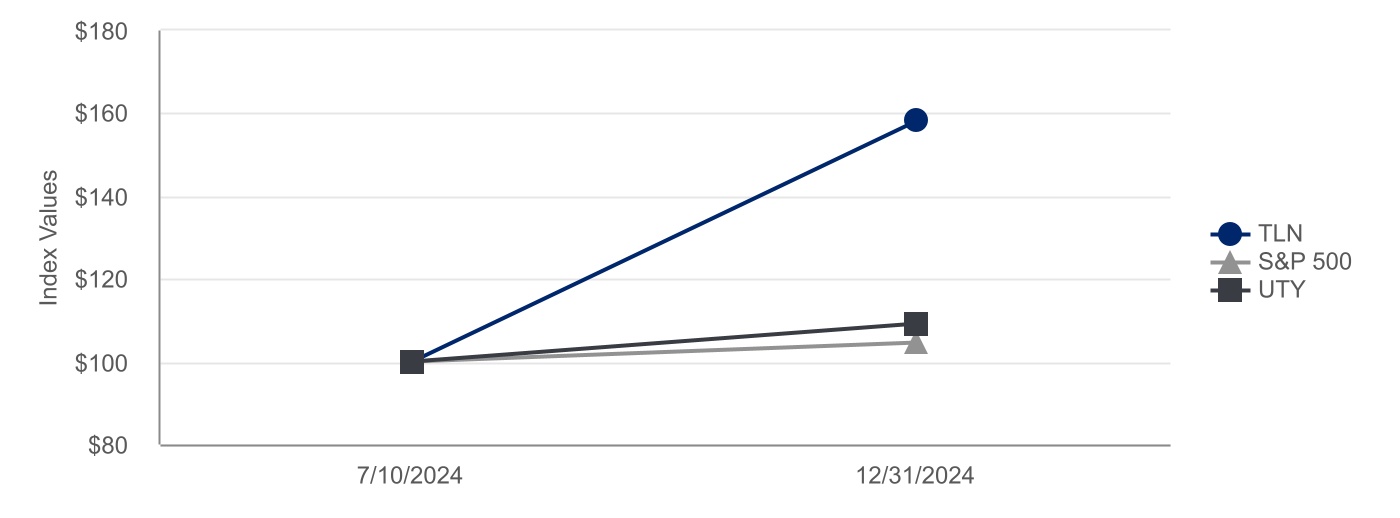
The Common Stock is listed on The Nasdaq Global Select Market (“Nasdaq”) under the symbol “TLN”. On February 27, 2025, the last sale price of the Common Stock as reported on Nasdaq was $201.82 per share.
Investing in our securities involves certain risks, including those that are described in the sections entitled “Risk Factors” beginning on page 19 of the Prospectus, as updated and supplemented by the section entitled “Risk Factors” beginning on page 12 of the Annual Report (which is attached to this prospectus supplement).
Neither the SEC nor any state securities commission has approved or disapproved of the securities to be issued under the Prospectus or determined if the Prospectus or this prospectus supplement is truthful or complete. Any representation to the contrary is a criminal offense.
The date of this prospectus supplement is February 28, 2025.
UNITED STATES
SECURITIES AND EXCHANGE COMMISSION
Washington, D.C. 20549
FORM 10-K
(Mark One)
| | | | | |
| ☒ | ANNUAL REPORT PURSUANT TO SECTION 13 OR 15(d) OF THE SECURITIES EXCHANGE ACT OF 1934 |
For the fiscal year ended December 31, 2024
OR
| | | | | |
| ☐ | TRANSITION REPORT PURSUANT TO SECTION 13 OR 15(d) OF THE SECURITIES EXCHANGE ACT OF 1934 |
For the transition period from __________ to __________
Commission File Number: 001-37388
Talen Energy Corporation
(Exact name of registrant as specified in its charter)
| | | | | |
| Delaware | 47-1197305 |
| (State or other jurisdiction of incorporation or organization) | (IRS Employer Identification No.) |
2929 Allen Pkwy, Suite 2200, Houston, TX 77019
(Address of principal executive offices) (Zip Code)
(888) 211-6011
(Registrant’s telephone number, including area code)
Not applicable
(Former name, former address and former fiscal year, if changed since last report)
Securities registered pursuant to Section 12(b) of the Act:
| | | | | | | | | | | | | | |
| Title of each class | | Trading Symbol(s) | | Name of each exchange on which registered |
| Common stock, par value $0.001 per share | | TLN | | The Nasdaq Global Select Market |
Securities registered pursuant to Section 12(g) of the Act: None
Indicate by check mark if the registrant is a well-known seasoned issuer, as defined in Rule 405 of the Securities Act. Yes ☐ No ☒
Indicate by check mark if the registrant is not required to file reports pursuant to Section 13 or Section 15(d) of the Act. Yes ☐ No ☒
Indicate by check mark whether the registrant (1) has filed all reports required to be filed by Section 13 or 15(d) of the Securities Exchange Act of 1934 during the preceding 12 months (or for such shorter period that the registrant was required to file such reports), and (2) has been subject to such filing requirements for the past 90 days. Yes ☒ No ☐
Indicate by check mark whether the registrant has submitted electronically every Interactive Data File required to be submitted pursuant to Rule 405 of Regulation S-T (§ 232.405 of this chapter) during the preceding 12 months (or for such shorter period that the registrant was required to submit such files). Yes ☒ No ☐
Indicate by check mark whether the registrant is a large accelerated filer, an accelerated filer, a non-accelerated filer, a smaller reporting company, or an emerging growth company. See the definitions of “large accelerated filer,” “accelerated filer,” “smaller reporting company,” and “emerging growth company” in Rule 12b-2 of the Exchange Act.
| | | | | | | | | | | | | | | | | | | | | | | | | | | | | |
| ☒ | Large accelerated filer | ☐ | Accelerated filer | ☐ | Non-accelerated filer | ☐ | Smaller reporting company | ☐ | Emerging growth company |
If an emerging growth company, indicate by check mark if the registrant has elected not to use the extended transition period for complying with any new or revised financial accounting standards provided pursuant to Section 13(a) of the Exchange Act. ☐
Indicate by check mark whether the registrant has filed a report on and attestation to its management’s assessment of the effectiveness of its internal control over financial reporting under Section 404(b) of the Sarbanes-Oxley Act (15 U.S.C. 7262(b)) by the registered public accounting firm that prepared or issued its audit report. ☐
If securities are registered pursuant to Section 12(b) of the Act, indicate by check mark whether the financial statements of the registrant included in the filing reflect the correction of an error to previously issued financial statements. ☐
Indicate by check mark whether any of those error corrections are restatements that required a recovery analysis of incentive-based compensation received by any of the registrant's executive officers during the relevant recovery period pursuant to §240.10D-1(b). ☐
Indicate by check mark whether the registrant is a shell company (as defined in Rule 12b-2 of the Exchange Act). Yes ☐ No ☒
Indicate by check mark whether the registrant has filed all documents and reports required to be filed by Sections 12, 13 or 15(d) of the Securities Exchange Act of 1934 subsequent to the distribution of securities under a plan confirmed by a court. Yes ☐ No ☒
The aggregate market value of the voting and non-voting common equity held by non-affiliates of the registrant was approximately 5.9 billion as of June 28, 2024, the last business day of the registrant’s most recently completed second fiscal quarter, based on 53254954 shares then outstanding at the OTCQX closing price of 111 per share.
As of February 27, 2025, the registrant had 45,961,910 shares outstanding of common stock, par value $0.001 per share (“common stock”).
Documents Incorporated by Reference
The information required pursuant to Part III of this Form 10-K will be set forth in, and incorporated by reference from, the registrant’s definitive proxy statement for the 2025 annual meeting of stockholders (the “2025 Proxy Statement”), which will be filed with the Securities and Exchange Commission not later than 120 days after the end of the fiscal year ended December 31, 2024.
TALEN ENERGY CORPORATION
ANNUAL REPORT ON FORM 10-K
Capitalized terms and abbreviations used but not defined in this Annual Report on Form 10-K are defined in the glossary.
CAUTIONARY NOTE REGARDING FORWARD-LOOKING INFORMATION
This Annual Report (this “Report”) contains forward-looking statements concerning expectations, beliefs, plans, objectives, goals, strategies, and (or) future performance or other events, as well as underlying assumptions and other statements, that are not statements of historical fact. These statements often include words such as “believe,” “expect,” “anticipate,” “intend,” “plan,” “estimate,” “target,” “project,” “forecast,” “seek,” “will,” “may,” “should,” “could,” “would,” or similar expressions. Although we believe that the expectations and assumptions reflected in these forward-looking statements are reasonable, there can be no assurance that these expectations and assumptions will prove to be correct. Forward-looking statements are subject to many risks and uncertainties. The results, events, or circumstances reflected in forward-looking statements may not be achieved or occur, and actual results, events, or circumstances may differ materially from those discussed in forward-looking statements.
The risks, uncertainties, and other factors that could cause actual results to differ materially from the forward-looking statements made by us include those discussed in this Report, including but not limited to “Item 1A. Risk Factors.” Moreover, we operate in a very competitive and rapidly changing environment. New risks and uncertainties emerge from time to time, and it is not possible for us to predict all risks and uncertainties that could have an impact on the forward-looking statements contained in this Report.
You should not rely on forward-looking statements as predictions of future events. We have based the forward-looking statements contained in this Report primarily on our current expectations and assumptions about future events. Furthermore, statements such as “we believe” and similar statements reflect our beliefs and opinions on the relevant subject. These statements are based on information available to us as of the date of this Report. While we believe such information provides a reasonable basis for these statements, such information may be limited or incomplete, and there can be no assurance that any expectations, assumptions, beliefs, or opinions will prove to be correct. Our statements should not be read to indicate that we have conducted an exhaustive inquiry into, or review of, all relevant information. These statements are inherently uncertain, and readers are cautioned not to unduly rely on these statements.
The forward-looking statements made in this Report relate only to events as of the date on which the statements are made. We undertake no obligation to update any forward-looking statements made in this Report to reflect events or circumstances after the date of this Report or to reflect new information, actual results, revised expectations, or the occurrence of unanticipated events, except as required by law. We may not actually achieve the plans, intentions, or expectations described in our forward-looking statements, and you should not place undue reliance on our forward-looking statements. Our forward-looking statements do not reflect the potential impact of any future acquisitions, mergers, dispositions, joint ventures, or investments.
MARKET AND INDUSTRY DATA
This Report includes estimates regarding market and industry data. Unless otherwise indicated, information concerning our industry and the markets in which we operate, including our general expectations, market position, market opportunity, and market size, are based on our management’s knowledge and experience in the markets in which we operate, together with currently available information obtained from various sources, including publicly available information, industry reports and publications, surveys, our customers, trade and business organizations, and other contacts in the markets in which we operate. Certain information is based on management estimates, which have been derived from third-party sources, as well as data from our internal research.
In presenting this information, we have made certain assumptions that we believe to be reasonable based on such data and other similar sources and on our knowledge of, and our experience to date in, the markets in which we operate. While we believe the estimated market and industry data included in this Report is generally reliable, such information is inherently uncertain and imprecise. Market and industry data is subject to change and may be limited by the availability of raw data, the voluntary nature of the data gathering process, and other limitations inherent in any statistical survey of such data. In addition, projections, assumptions, and estimates of the future performance of the markets in which we operate are necessarily subject to uncertainty and risk due to a variety of factors, including those described in “Cautionary Note Regarding Forward-Looking Information” and “Item 1A. Risk Factors.” These and other factors could cause results to differ materially from those expressed in the estimates made by third parties and by us. Accordingly, you are cautioned not to place undue reliance on such market and industry data or any other such estimates.
PART I.
ITEM 1. BUSINESS
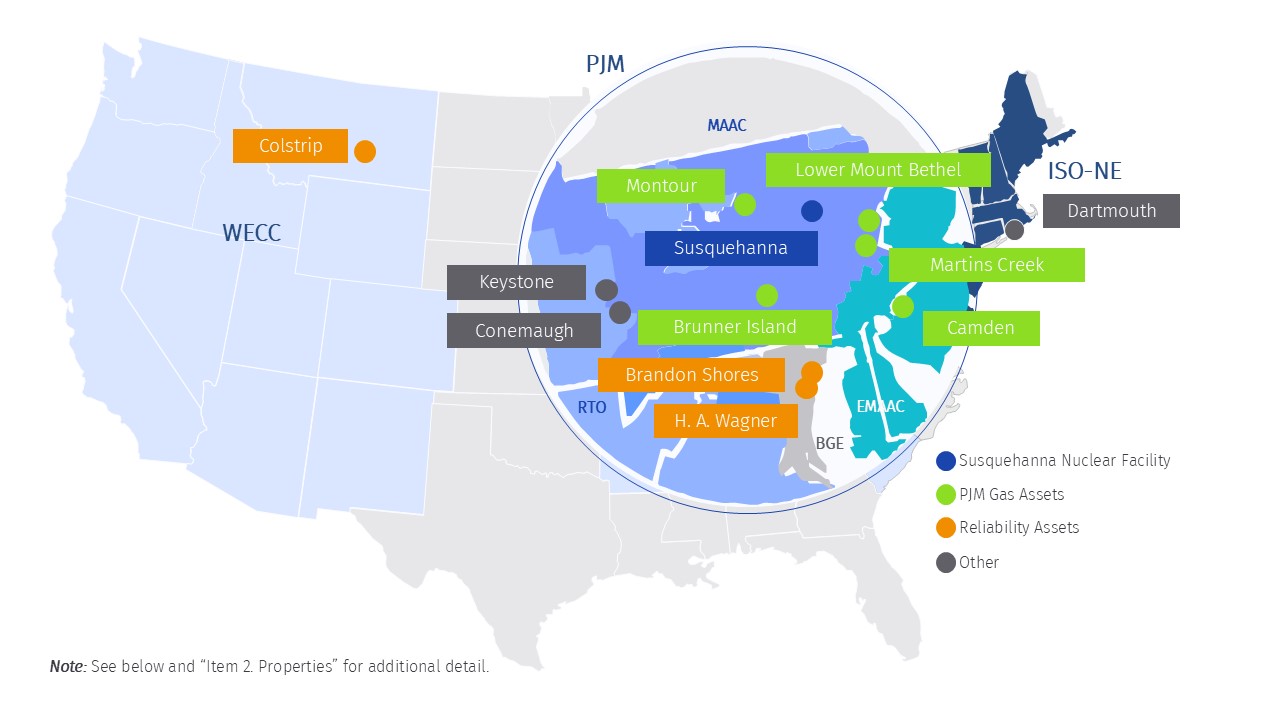
Talen is a leading independent power producer and energy infrastructure company dedicated to powering the future. We own and operate approximately 10.7 gigawatts of power infrastructure in the United States, including 2.2 gigawatts of nuclear power and a significant dispatchable generation fleet. We produce and sell electricity, capacity, and ancillary services into wholesale U.S. power markets, with our generation fleet principally located in the Mid-Atlantic and Montana. Our team is committed to generating power safely and reliably, delivering the most value per megawatt produced and driving the energy transition. Talen is also powering the digital infrastructure revolution. We are well-positioned to capture this significant growth opportunity, as data centers serving artificial intelligence increasingly demand more reliable, clean power.
Our Operations
Our Fleet
The following discussion provides a brief overview of our fleet. See “Item 2. Properties” for additional information on each of our facilities.
Baseload, carbon-free nuclear facility. We operate, and own a 90 interest in, the 2.5 GW Susquehanna facility, the sixth largest nuclear-powered generation facility in the U.S. Susquehanna typically comprises approximately half of our total annual generation. In 2024, Talen produced over 18 GWh of reliable, zero-carbon power from Susquehanna at a low all-in cost of less than $24 per MWh, while also maintaining excellent safety and operational performance (when measured by standards adopted by the nuclear industry). Susquehanna’s efficient cost structure is supported in part by a portfolio of supply contracts for all stages of the nuclear fuel cycle. See “—Fuel Supply—Nuclear” for additional information. Susquehanna’s two units are currently licensed through 2042 and 2044, respectively (with up to 20-year extensions possible with regulatory approval).
Susquehanna has historically generated revenues primarily from energy sales into the PJM wholesale market, PJM capacity sales, and strategic hedging. As part of the AWS Data Campus Sale in 2024, Susquehanna and AWS have contracted under the AWS PPA for the long-term, fixed-price supply of power directly from Susquehanna to the adjacent AWS Data Campus. See Note 20 to the Annual Financial Statements for additional information on the AWS Data Campus Sale and “—Our Key Markets and Revenue Streams—Contracted Revenues—AWS PPA” for additional information on the AWS PPA. Susquehanna also benefits from the Nuclear PTC included under the Inflation Reduction Act, which runs through 2032 and provides a tax credit of up to 44 per MW (indexed to inflation) for power produced from a nuclear generation source. See “—Our Key Markets and Revenue Streams—Nuclear PTC” for additional information on the Nuclear PTC.
Dispatchable natural gas and oil intermediate and peaking units. Our 6.3 GW natural gas and oil fleet (of which 3.2 GW is from Brunner Island, Montour, and H.A Wagner Unit 3 after conversion, as discussed below) includes seven technologically diverse natural gas and oil generation facilities across the generation stack (including intermediate and peaking dispatch). Certain units are capable of utilizing multiple fuel sources, providing meaningful operational flexibility. These strategically located assets include significant generation in attractive wholesale markets (primarily PJM), allowing them to generate predictable revenues on cleared capacity while also benefiting from varying market dynamics. See “Item 2. Properties” for additional information on each of these facilities.
Reliability assets and carbon deleveraging. Our coal-fired generation assets continue to be impacted by changing environmental regulations and power market economics. We have already completed the conversion of approximately 3.2 GW of our legacy coal fleet to lower-carbon fuels, including our Brunner Island and Montour facilities, which together represent over 25 of our total generation capacity, and Unit 3 of our H.A Wagner facility. We previously requested deactivation of both H.A Wagner and our wholly-owned 1.3 GW Brandon Shores facility in mid-2025. However, PJM subsequently notified us that both H.A Wagner and Brandon Shores are needed past their previously planned retirement dates to maintain reliability in PJM. In January 2025, we reached a settlement (which remains subject to FERC approval) with key stakeholders to continue running both facilities through May 2029 under an RMR arrangement. See “—Our Key Markets and Revenue Streams—Contracted Revenues—Brandon Shores and H.A Wagner RMR Arrangements” and Note 10 to the Annual Financial Statements for additional information on the RMR proceedings and settlement. We also own minority interests, totaling approximately 800 MW, in three coal-fired generation facilities in PJM and WECC, and we are exploring ways to maximize the value of these assets in the context of changing market conditions. See “Item 2. Properties” for additional information on each of these facilities.
Our Key Markets and Revenue Streams
Our operating revenues have historically consisted primarily of capacity revenues, energy/ancillary services revenues, and unrealized gain (loss) on hedging instruments. As further discussed below, we sell capacity and energy through a combination of forward auctions, bilateral contracts, and spot market sales (as applicable). See “—Our Strategies—Optimize risk management program and hedging” for a discussion of our commercial optimization strategy. Beginning in mid-2025, we expect our Brandon Shores and H.A. Wagner facilities to begin operating as reliability resources under an RMR agreement that will provide fixed payments to Talen in addition to reimbursement for certain costs and expenses. In addition, our Susquehanna facility is party to the AWS PPA for the supply of power from Susquehanna to AWS through long-term, fixed-price power commitments that increase over time. See “—Contracted Revenues” for additional information on both the RMR arrangements and the AWS PPA. We continue to evaluate business opportunities resulting from industrial load growth. See “—Demand Growth from Multiple Sources” for additional information. We also benefit from the Nuclear PTC under the Inflation Reduction Act. See “—Nuclear PTC” for additional information.
Wholesale Markets
The substantial majority of our generation capacity is located in, and accordingly the majority of our revenues are derived from, PJM. Specifically, a majority of our generation capacity (over 10 GW) is located in the MAAC (Mid-Atlantic Area Council) and BGE (Baltimore Gas and Electric) regions of PJM. The remainder of our generation capacity is in ISO-NE and WECC. See “Item 2. Properties” for additional information on the market location of each of our facilities.
PJM. PJM is an RTO responsible for the operation of wholesale electric markets and for centrally dispatching electric systems in all or parts of 13 states and the District of Columbia. It coordinates the dispatch of approximately 180000 MW of generating capacity to more than 65 million people and operates wholesale electricity markets with approximately 1090 members. Generators in PJM may earn revenues from sales of capacity, energy, and (or) ancillary services.
The PJM Reliability Pricing Model is intended to ensure that resources are available when needed for grid reliability. Under this model, PJM conducts a series of forward capacity auctions, which establish a long-term market for capacity. We sell capacity through PJM Base Residual Auctions and, to the extent we are unable to sell capacity through the PJM BRAs, we may sell uncleared capacity through PJM Incremental Auctions or bilateral capacity transactions. PJM BRAs are typically conducted three years prior to the start of the applicable capacity year (which runs from June 1–May 31), but FERC has recently accepted requests by PJM to delay certain PJM BRAs in order to propose additional changes to the PJM Reliability Pricing Model. See “Item 1A. Risk Factors—Regulatory, Environmental, and Legal Risks—We could be impacted by changes in, or state interference with, the structure or operation of the markets in which we operate, including ongoing market restructuring in PJM.” and Note 12 to the Annual Financial Statements for additional information on ongoing market reforms in PJM and related auction delays. PJM also operates day-ahead and real-time markets into which generators can bid to provide energy and ancillary services. We sell energy/ancillary services into these markets. We also enter into bilateral transactions for the sale of energy directly to power purchasers.
ISO-NE. ISO-NE is an ISO that manages the flow of electricity from approximately 30000 MW of generation capacity to approximately 15 million people in all or part of six states in New England. ISO-NE conducts forward capacity auctions and operates day-ahead and real-time energy/ancillary services markets. In ISO-NE, we both earn capacity revenues and sell energy/ancillary services into the spot markets from our Dartmouth generating facility.
WECC. WECC is a non-profit corporation that promotes a reliable and secure bulk electric system in the Western Interconnection, covering all or parts of Montana, 13 other U.S. States, Canada, and Mexico. WECC does not operate energy or capacity markets. The Colstrip facility in Montana operates within NorthWestern’s Balancing Authority within WECC. We enter into bilateral transactions for the direct sale of energy from our portion of the generation from Colstrip.
Contracted Revenues
Brandon Shores and H.A Wagner RMR Arrangements. In 2023, we notified PJM of our intent to deactivate electric generation at both our Brandon Shores and H.A. Wagner facilities on June 1, 2025. However, PJM subsequently notified us that both Brandon Shores and H.A Wagner are needed past their previously planned retirement dates to maintain reliability in PJM. In January 2025, we reached a settlement (which remains subject to FERC approval) with key stakeholders on the terms of an RMR arrangement and filed with FERC the resulting Joint Offers of Settlement regarding both facilities’ RMR Continuing Operations Rates Schedules (the “CORS”). If approved, the proposed RMR arrangements will extend the operating life of these plants through May 31, 2029, or until such time as the necessary transmission upgrades are placed into service. Beginning June 1, 2025, the CORS will provide a monthly fixed-cost payment of 12083333 (312/MW-day) for Brandon Shores and 2916667 (137/MW-day) for H.A Wagner, which includes a performance “hold back” of 416667 per month for Brandon Shores and 208333 per month for H.A Wagner, each to be paid out based on unit performance. We will also receive separate reimbursement for variable costs and approved project investments. See Note 10 to the Annual Financial Statements for additional information on the RMR proceedings and settlement.
AWS PPA. In connection with the AWS Data Campus Sale in 2024, we and AWS entered into the AWS PPA, pursuant to which we agreed to supply long-term, carbon-free power from Susquehanna to the AWS Data Campus through fixed-price power commitments. Under the AWS PPA, AWS has minimum contractual power commitments that increase in 120 MW increments annually (or earlier, at AWS’s option), with a one-time option to either cap commitments at 480 MW or otherwise purchase, in continuing annual steps, up to 960 MW. Each step up in capacity commitment has a fixed price for an initial 10-year term, after which AWS has the option to renew each step at a price that includes a fixed margin above then-applicable PJM energy and capacity prices. The initial term of the AWS PPA is 18 years, with two 10-year extensions at AWS’s option. Under a separate agreement, we will receive additional revenue from AWS related to the sales of carbon-free energy to the grid. We expect to begin receiving initial revenues from power sales in 2025. See Note 20 to the Annual Financial Statements for additional information on the AWS Data Campus Sale.
In November 2024, FERC issued an order denying the Susquehanna ISA Amendment between PJM, PPL Corporation, and Susquehanna that would permit Susquehanna to decrease the amount of power supply it would otherwise provide to the power grid. Such order does not have an impact on the existing ISA permitting 300 MW of co-located load at Susquehanna to supply power for the first phases of the AWS Data Campus. In December 2024, FERC issued an order stating that it would address our request for rehearing in a future order, which FERC has not yet issued. Due to FERC’s decision not to address the merits of our motion for rehearing, we have filed an appeal in the U.S. Court of Appeals for the Fifth Circuit. Delivery “behind-the-meter” of more than 300 MW of power under the AWS PPA requires that FERC approve an amended ISA between Susquehanna, PPL, and PJM. Without an amendment we will be unable to deliver the full amount of contract volume under the AWS PPA on a behind-the-meter basis, which may require a contract renegotiation to deliver the additional power “in-front-of-the-meter.” We are evaluating our commercial and legal options to provide the most efficient path to full development of the AWS Data Campus. Such options include, but are not limited to, potential submission of a revised form of Susquehanna ISA Amendment or alternative contract structures with AWS. See “Item 3. Legal Proceedings” and “Item 1A. Risk Factors—Regulatory, Environmental, and Legal Risks—Our business is subject to extensive energy-related regulation and oversight.” for additional information on the Susquehanna ISA Amendment.
Demand Growth from Multiple Sources
Power demand forecasts continue to rise over time in PJM compared to previous expectations. In January 2025, PJM released updated long-term load forecasts which point to RTO-wide load in summer 2030 and 2035 that is approximately 10 and 17 higher, respectively, than 2024 expectations. Fundamental demand growth in PJM is expected to come from multiple sources, most notably high-performance computing and data center demand, continued re-shoring in the wake of the COVID-19 pandemic and associated supply chain disruptions, and continued electrification of the U.S. economy. This demand growth is not currently well matched with increases in supply, as the PJM queue for new-build generation is predominately intermittent rather than dispatchable in nature. In addition, continued PJM coal plant retirements are expected through the end of the decade. These drivers of demand have had, and could continue to have, direct impacts on the overall supply/demand balance and resulting energy and capacity prices in the markets in which we operate, the profitability, value, and growth prospects of our business, and the regulatory framework under which we operate.
Nuclear PTC
The Inflation Reduction Act was signed into law in August 2022. Among the Act’s provisions are amendments to the Internal Revenue Code to create a nuclear production tax credit program. The Nuclear PTC program provides qualified nuclear power generation facilities with a transferable tax credit for electricity produced and sold to an unrelated party during each tax year. The credit provides support beginning when annual gross receipts decline below an equivalent 44/MWh, increases ratably up to $3/MWh when annual gross receipts are equivalent to 25/MWh, and is subject to potential adjustments including inflation escalators and a five-times increase in value (up to $15/MWh) for meeting prevailing wage requirements (which we expect to meet). Electricity produced and sold by Susquehanna to third parties from December 31, 2023 through December 31, 2032 will be eligible for the credit. This program serves as an important tool for mitigating power price exposure, effectively creating a minimum price that Susquehanna is expected to receive for its generation. We can monetize the credit by reducing our income taxes payable or selling the credits to a third-party. See Notes 6 and 7 to the Annual Financial Statements for additional information on Nuclear PTC revenue recognized and the Inflation Reduction Act.
Fuel Supply
Our power generation assets are advantaged by significant fuel diversity, including nuclear, natural gas, coal, oil, and various dual-fuel capabilities. Further, our natural gas generation assets are situated near the Marcellus shale region of Pennsylvania, which provides access to fuel from one of the largest producing natural gas regions in the U.S. See “Item 2. Properties” for additional information on the fuel capabilities of each of our facilities.
Nuclear. Susquehanna has a portfolio of supply contracts for raw uranium, conversion, enrichment, and fabrication. Our nuclear fuel cycle is fully contracted through the 2027 fuel load, almost entirely contracted through 2028, and over 70 contracted through 2029. We have no current fuel exposure to any Russian-affiliated counterparties. Susquehanna has an on-site dry-cask spent fuel storage facility that, together with its spent fuel pools, accommodates discharged SNF. We expect to continue expanding this storage facility in phases to accommodate additional SNF and, assuming receipt of appropriate approvals, we expect such expansion to accommodate all of the SNF discharged by Susquehanna through 2044, the current license life of unit 2. Federal law requires the U.S. government to provide for the permanent disposal of commercial SNF, but the government has not yet done so. Consequently, under a related settlement agreement, the government is required to reimburse Susquehanna for certain SNF storage costs through 2025. See Note 12 to the Annual Financial Statements for additional information on this arrangement.
Natural Gas and Oil. We manage our natural gas and oil supply utilizing a combination of contracted purchases, spot market purchases, and on-site storage for the commodities and pipeline capacity. The amount and duration of contracted purchases vary due to factors including fuel availability, economic considerations, and generation facility location on the pipeline grid. A significant portion of our natural gas need is satisfied through short-term transactions on a spot basis. Oil is generally supplied from on-site inventory and replenished through purchases on the spot market. The price risk associated with these transactions is managed via financial hedges.
Coal. We actively manage our coal requirements by purchasing coal from central and northern Appalachia for our PJM facilities and from a mine adjacent to Colstrip for that facility. Reliability of coal deliveries can be affected from time to time by a number of factors, including fluctuations in demand, coal mine production issues, and other supplier or transporter operating difficulties. We maintain coal inventory at levels estimated to be necessary to avoid operational disruptions at our coal-fired units. Short- and long-term supply contracts support adequate coal inventory levels and are augmented with spot market purchases as needed.
Seasonality/Scheduled Maintenance
The demand for and market prices of electricity and natural gas are affected considerably by weather and, as a result, our operating results may fluctuate significantly on a seasonal basis. In general, below-average temperatures in the winter and above-average temperatures in the summer tend to increase electricity demand, energy prices, and revenues. Alternatively, moderate temperatures tend to decrease electricity demand and may adversely affect resulting energy margins, particularly in PJM. In addition, our operating expenses typically fluctuate geographically on a seasonal basis, with peak power generation and expenses during the winter in the Mid-Atlantic. We ordinarily perform planned facility maintenance during milder non-peak demand periods in the spring and fall to ensure reliability during peak periods. The pattern of fluctuations in our operating results varies depending on the type and location of the facilities being serviced, the capacity markets served, the maintenance requirements of our facilities, and the terms of bilateral contracts to purchase or sell electricity. Our largest recurring maintenance project is the annual spring refueling outage at Susquehanna. We serve our fossil generation fleet through a combination of self-service and contracted maintenance activity (including long-term service agreements at certain facilities). See also “Item 1A. Risk Factors—Industry and Market Risks—Our business is subject to physical, market, economic, and regulatory risks relating to weather conditions and extreme weather events.”
Competition
Increased competition in U.S. energy markets exists in part due to federal and state competitive market initiatives. The power generation business is regionally varied in industry structure and fundamentals. PJM, the primary market in which we operate, is a competitive market and has from time-to-time considered new market rules, while some states have considered re-regulation measures that could result in more limited opportunities for competitive energy suppliers. See Note 12 to the Annual Financial Statements for additional information on ongoing market reforms in PJM. We face competition in wholesale markets from other suppliers of available energy, capacity, and ancillary services, which may include operators of various competing generation technologies, such as natural gas-fired, coal-fired, and nuclear generation, as well renewable and other alternative energy sources. Competition is affected by electricity and fuel prices, grid congestion, government subsidies for new and certain existing generation facilities (including some which might otherwise retire), new market entrants, construction of new generation assets, technological advances in power generation, environmental and regulatory matters, and various other factors. Competitors in wholesale power markets include other non-utility generators, regulated utilities and their competitive subsidiaries, industrial companies, financial institutions, and other energy marketers. See also “Item 1A. Risk Factors—Industry and Market Risks—We face intense competition in the competitive power generation market.” and “Item 1A. Risk Factors—Regulatory, Environmental, and Legal Risks—We could be impacted by changes in, or state interference with, the structure or operation of the markets in which we operate, including ongoing market restructuring in PJM.”
Insurance
Power generation involves hazardous activities, which could expose our assets, employees, contractors, customers, and the general public to various risks inherent in the nature of our operations. Various hazards, including but not limited to accidents or natural disasters, can cause damage or destruction of our assets or other property and equipment, personal injury or loss of life, pollution or environmental damage, and (or) suspension of operations. We maintain a portfolio of general liability, property, business interruption, pollution liability, workers’ compensation, nuclear, cybersecurity, financial lines, and other insurance policies (as applicable) with varying limits, deductibles, and self-insurance that we believe are reasonable and prudent under the circumstances to cover our operations and assets; however, we cannot provide any assurance that our insurance program will be sufficient or effective under all circumstances and against all hazards or liabilities to which we may be subject, or that insurance coverage will continue to be available at economic rates or at all. We will continue to periodically evaluate our policy limits and retentions as they relate to the overall cost and scope of our insurance program. See also “Item 1A. Risk Factors—Industry and Market Risks—Operation of power generation facilities involves significant risks and hazards customary to the power industry, which we cannot assure our insurance will be adequate to cover.,” “Item 1C. Cybersecurity,” and Note 12 to the Annual Financial Statements.
Our Strategies
We believe we are well-positioned to achieve our business objectives through the following strategies:
Focus and maintain our core generation fleet that provides stable earnings and cash flows. Our core fleet, anchored by our Susquehanna nuclear facility, generates stable earnings from cleared capacity and cash flows backed by multiple sources. Our integrated generation, wholesale marketing, and commercial capabilities enable us to produce significant recurring cash flow, and our commercial and risk management strategies provide cash flow stability while balancing operational, price, and liquidity risk through physical and financial commodity transactions. In today’s robust but volatile energy markets, our team has been able to capture high realized pricing through both reliable generation and strategic risk management. Capacity revenue is a key indicator of the important role that nuclear, natural gas, and peaking generation all play in PJM grid reliability. In 2024, our PJM fleet generated significant capacity revenues. See “Item 7. Management’s Discussion and Analysis of Financial Condition and Results of Operations—Results of Operations” for additional information on our energy and capacity revenues. We are now also poised to benefit from long-term, stable cash flows from both contractual revenues under the Brandon Shores and H.A. Wagner RMR arrangements and fixed-price power sales under the AWS PPA. See “—Our Key Markets and Revenue Streams—Contracted Revenues” for additional information on both the RMR arrangements and the AWS PPA. We now also have substantive federal support for nuclear generation, which is accretive to our portfolio, in the form of the Nuclear PTC. See “—Our Key Markets and Revenue Streams—Nuclear PTC” for additional information on the Nuclear PTC.
Continue our operational excellence, with focus on continued efficiencies. The foundation of our platform is safe, disciplined operational and commercial performance. We drive operational excellence by maximizing the safety, reliability, and efficiency of our core assets. While we will continue to evaluate ways to find the highest and best use of our assets and capital, we are committed to maintaining best-in-class operations at our core generation facilities, including a disciplined cost structure across all categories. To sustain our robust performance, our leadership team focuses on, among other priorities, maximizing reliability through carefully planned and periodic maintenance and upgrades of our equipment, retaining experienced facility managers and employees and positioning them on-site to address emerging issues quickly, capitalizing on procurement efficiencies across our platform, and implementing redundancy in our generation facility design. While prioritizing operational safety and excellence, we intend to continue evaluating and executing on available opportunities for additional cost efficiencies.
Optimize risk management program and hedging. We are focused on maintaining appropriate risk management policies in the context of a right-sized balance sheet and the cash flow stability provided by the Nuclear PTC. We maintain both an internal risk management committee, comprised of members of senior management from across the organization, and a Board-level risk oversight committee, comprised of members of our Board of Directors with extensive trading and risk backgrounds. Our commercial optimization strategy is focused on hedging commodity price volatility within appropriate risk tolerances while providing stable cash flow generation and preserving forward margin. We employ a variety of physical and financial instruments to manage risk and optimize the value of our assets. In some cases, we use a portfolio approach to manage risks, such as those associated with capacity and ancillary offerings. We target a hedge range of 60-80% of our expected generation for the prompt 12 months and ratably scale the hedge percentage down further out in time to align with our financial objectives. Our strong balance sheet provides ample capacity and counterparty appetite for lien-based hedging, which limits the use of margin posting requirements. We intend to continue employing a disciplined strategy focused on first-lien hedging while minimizing exchange-based hedging and the associated margin requirements. Importantly, we now have lower overall hedging needs given the cash-flow stability afforded by the Nuclear PTC (which provides a built-in hedging apparatus through the tax credit) and significantly reduced debt service requirements following the Restructuring and subsequent refinancing transactions.
Maintain disciplined financial policy and capital allocation. We actively manage our capital structure, future capital commitments, and asset base by following disciplined capital allocation principles focused on generating cash flow, maintaining reasonable leverage, and reducing our cost of capital. We have a strong balance sheet underpinned by modest leverage, robust liquidity, and no significant debt maturities until 2030. Our strong balance sheet also provides ample capacity and counterparty appetite for lien-based hedging, which does not require cash collateral posting, and we intend to prioritize balance sheet efficiency through the active preservation of liquidity, targeting a modest leverage profile with a go-forward net leverage ratio of 3.5x or less, depending on seasonal dynamics. In furtherance of our disciplined capital allocation strategy, we are targeting the return of 70% of our adjusted free cash flow to shareholders through the share repurchase program authorized by our Board of Directors. See “Item 5. Market for Registrant’s Common Equity, Related Shareholder Matters and Issuer Purchases of Equity Securities—Issuer Purchases of Equity Securities” and Note 18 to the Annual Financial Statements for additional information on the SRP and other share repurchases.
Maximize the value of our platform opportunities in a capital efficient manner. We believe there is significant value embedded in our platform, and that we have the flexibility to explore both organic and inorganic growth options. In addition to optimizing our core operations, we have unlocked previously unrecognized value from our existing assets and believe we have more opportunities to do so. Within our generation portfolio, we remain focused on delivering the most value per megawatt produced, including through long-term power sales to computing, industrial, or other end users, whether from our reliable, zero-carbon nuclear facility - Susquehanna - or our dispatchable fossil fleet. We expect to evolve our asset base both by continuing to evaluate opportunities to drive value uplift for our existing assets and by pursuing opportunistic acquisitions and divestitures in order to drive cash flow generation and investor returns, all in keeping with our commitment to appropriate leverage levels and a thoughtful capital allocation framework. We will continue exploring strategic opportunities if economically favorable, but any strategic investment will require a sound basis and an attractive returns profile when compared to other uses of capital.
Legal, Regulatory, and Environmental Matters
Legal Matters
We are involved in various legal and administrative proceedings, investigations, claims, and litigation from time to time in the course of our business. Such matters may include, but are not limited to, those relating to employment and benefits, commercial disputes, personal injury, property damage, regulatory matters, environmental matters, and various other claims for injuries and (or) damages. While we believe we have meritorious positions and will continue to appropriately respond to all legal matters, because of the inherently unpredictable nature of legal proceedings, there is a wide range of potential outcomes for any such matter. See “Item 1A. Risk Factors—Regulatory, Environmental, and Legal Risks” for additional information on legal risks related to our business. See “Item 3. Legal Proceedings” and Note 12 to the Annual Financial Statements for additional information on specific legal matters.
Energy Regulation
We are subject to regulation by federal and state agencies and other bodies that exercise regulatory authority in the various regions where we conduct business, including but not limited to FERC; the Department of Energy; the NRC; NERC; the Federal Communications Commission; and state public utility commissions. In addition, the RTOs and ISOs in the regions in which we conduct business inherently have complex rules that are intended to balance the interests of market stakeholders. See “Item 1A. Risk Factors—Regulatory, Environmental, and Legal Risks” for additional information on regulatory risks related to our business. The following discussion provides an overview of certain key regulatory matters applicable to our business. See Note 12 to the Annual Financial Statements for additional information on these and other regulatory topics.
FERC. Our subsidiaries that own or control electric generation facilities are defined as public utilities under the Federal Power Act and are subject to FERC’s exclusive ratemaking jurisdiction over wholesale sales of electricity and the transmission of electricity in interstate commerce. FERC has the authority to grant or deny market-based rate authority for wholesale sales of energy, capacity, and ancillary services to ensure that such sales are just and reasonable and not unduly discriminatory, and to suspend market-based rate authority and set cost-based rates if it finds that its previous grant of market-based rate authority is no longer just and reasonable. Other matters subject to FERC’s jurisdiction include, but are not limited to: review of certain public utility dispositions of jurisdictional facilities, mergers, acquisitions of other public utility securities, or acquisitions of existing generation facilities; review of certain holding company acquisitions of securities of, or mergers with, a public utility or other holding company; third-party financings; affiliate transactions; intercompany financings and cash management arrangements; and certain internal corporate reorganizations.
RTOs and ISOs. RTOs and ISOs are FERC-regulated entities that exist in several regions to provide transmission service across multiple transmission systems. FERC has approved PJM, MISO, ISO-NE, and SPP as RTOs and CAISO and NYISO as ISOs. These entities are responsible for regional planning, managing transmission congestion, developing wholesale markets for energy and capacity, maintaining reliability, market monitoring, the scheduling of physical power sales brokered through ICE and NYMEX, and managing transmission charges across multiple systems. With the exception of Colstrip in Montana, all of our generation facilities currently participate in wholesale electricity markets administered by PJM and ISO-NE. See “—Our Operations—Our Key Markets and Revenue Streams—Wholesale Markets” for additional information on the RTOs and ISOs in which we operate.
Nuclear. Under the Atomic Energy Act of 1954, as amended (the “Atomic Energy Act”), our operation and 90 ownership of Susquehanna are subject to regulation by the NRC, including requirements pertaining to, among other matters: licensing, inspection, and enforcement; testing, evaluation, and modification of all aspects of nuclear reactor power generation facility design and operation; environmental and safety performance; handling and storage of SNF; technical and financial qualifications; decommissioning funding assurance; and transfer and foreign ownership restrictions. The NRC may modify, suspend, or revoke operating licenses and impose civil or criminal penalties for failure to comply with the Atomic Energy Act or the terms of nuclear operating licenses. In addition, new or amended NRC safety and regulatory requirements may give rise to additional operation and maintenance costs and capital expenditures. The current facility operating licenses for our two units at Susquehanna expire in 2042 and 2044. See Note 9 to the Annual Financial Statements for additional information on the NDT. See “—Our Operations—Fuel Supply—Nuclear” for additional information on SNF.
Other Regulation. In addition to federal regulation, our operations are subject to various state and local laws and regulations. These include oversight of siting, permitting, and environmental compliance for our facilities, as well as participation in state-specific energy markets and programs. Our operations are also subject to compliance with reliability standards developed and enforced by NERC and its regional entities. Compliance with these standards is critical to maintaining the reliability of the bulk electric system and avoiding penalties for violations. See “—Environmental Regulation” for additional information on environmental regulation of our business.
Environmental Regulation
Our business is subject to extensive federal, state, and local environmental laws, regulations, and requirements, including but not limited to those related to air emissions, water discharges, hazardous substances, and solid waste management. These requirements have become more stringent over time and impose, among other things: (i) permitting requirements for regulated activities; (ii) costs to limit or prevent pollution or other contamination; and (iii) substantial liabilities and remedial obligations for pollution or contamination. Accordingly, in the ordinary course of our business, we may: (i) incur significant costs to comply with environmental requirements; (ii) be required to modify, curtail, replace, or cease certain operations for environmental reasons; (iii) be required to perform environmental remediation work; or (iv) become involved in other environmental matters, including government enforcement actions and citizen’s suit litigation. In addition, environmental requirements are rapidly evolving, and we may become subject to new or revised environmental laws, regulations, or requirements. Legal challenges to environmental regulations, rules, and requirements add to the uncertainty of estimating future compliance and remedial costs. In addition, in January 2025, President Trump issued executive orders directing the heads of all federal agencies to identify and begin the processes to suspend, revise, or rescind all agency actions, including existing regulations, that are unduly burdensome on the identification, development, or use of domestic energy resources. Consequently, future implementation and enforcement of these rules remains uncertain at this time.
See “Item 1A. Risk Factors—Regulatory, Environmental, and Legal Risks” for additional information on environmental risks related to our business. The following discussion provides an overview of certain key environmental matters. See Note 12 to the Annual Financial Statements for additional information on these and other environmental topics.
Air. Under the Clean Air Act, as well as comparable state laws and local ordinances, our plants are subject to extensive emission control, emission allowance, emission monitoring, and air reporting obligations. Compliance with these requirements impacts the operation of our plants as well as their operating costs. In addition, new or modified obligations could significantly impact how we produce electricity and the life of certain plants (in some cases resulting in premature unit retirements) and could impede strategic planning. Key air matters currently affecting our business include, but are not limited to, nitrogen oxides requirements (including potential implementation of the EPA’s Good Neighbor Plan or similar requirements) as well as the revised EPA MATS and GHG Rules, both of which could significantly impact certain facilities, including our Colstrip facility, and are being legally challenged by us and others.
Hazardous Substances and Waste Handling. Our business is subject to a range of waste laws and regulations at the federal, state, and local levels. These rules are designed to manage and mitigate the potential environmental and health impacts of waste generated by power plants during the production of electricity, and they put controls in place on waste disposal, management, transportation, and storage. The Comprehensive Environmental Response, Compensation, and Liability Act (“CERCLA”), also known as the “Superfund” law, and comparable state laws impose liability, without regard to fault or the legality of the original conduct, on certain classes of persons that are considered to have contributed to the release of a “hazardous substance” into the environment. These persons include the current and past owners or operators of the site where the release occurred and companies that transported or disposed, or arranged for the transport or disposal, of the hazardous substances at the site where the release occurred. Most states have also enacted statutes that contain provisions substantially similar to CERCLA. We generate materials in the course of our operations that may be regulated as hazardous substances based on their characteristics under CERCLA and analogous state laws.
The EPA’s regulation of CCRs under the Resource Conservation and Recovery Act is a currently evolving regulatory program under which we may incur significant costs impacting AROs. We have joined several parties to legally challenge the EPA’s new requirements for legacy CCR surface impoundments under the EPA CCR Rule, while also following the Rule’s timeline to assess applicability and define cost impacts to our business.
Water. Various statutes and regulations at the federal, state, regional, and local levels govern water use, discharge, protection, and influence and add challenge and uncertainty to our business. The Federal Water Pollution Control Act, known as the Clean Water Act (“CWA”), and comparable state laws impose restrictions and strict controls regarding the discharge of pollutants into federal and state waters. The discharge of pollutants into regulated waters is prohibited except in accordance with the terms of a permit issued by the EPA or a state equivalent agency. Compliance with existing and future requirements may increase costs, affect operations, and impede strategic planning. One of the most impactful CWA programs currently affecting our business is the EPA ELG Rule, under which certain of our generation facilities have incurred operating restrictions and committed to prematurely end the use of certain fuels. In the future, new permit conditions could be established to meet the EPA’s most recent revisions to the EPA ELG Rule, which will be defined following negotiations with state permitting authorities. We and other parties are legally challenging the EPA’s latest revisions to the EPA ELG Rule. Until litigation is complete and permit conditions are established, full cost impacts remain uncertain.
Health and Safety. We are also subject to the requirements of the federal Occupational Safety and Health Act and comparable state laws that regulate the protection of the health and safety of employees. In addition, the Occupational Health and Safety Administration's (“OSHA”) hazard communication standard, the Emergency Planning and Community Right to Know Act and implementing regulations and similar state statutes and regulations require us to maintain information about hazardous materials used or produced in our operations, and this information is required to be provided to employees, state and local government authorities, and citizens.
Corporate Responsibility
Through our core values of Excellence, No Harm, Integrity, and Continuous Improvement, we are committed to operating thoughtfully and ethically as we strive to consider impacts to our stakeholders, including communities, employees, customers, suppliers, investors, and the environment. Our approach to corporate responsibility, with oversight from our Board of Directors, is a key to the long-term success of our business.
Environmental
Our emission profile is firmly anchored by Susquehanna, which enabled us to generate over half of our electricity output carbon-free in 2024, and our natural gas portfolio also includes a number of energy-efficient assets with low heat rates, which provide a lower carbon intensity than traditional fossil fuel sources. We have reduced our environmental footprint over the past several years, investing heavily in environmental controls and switching to cleaner fuels in response to market and other conditions. We have already completed the conversion of our Brunner Island, Montour, and H.A. Wagner plants to lower-carbon fuels. See “—Our Fleet—Reliability assets and carbon deleveraging” for additional information.
As of December 31, 2024, we have reduced our annual carbon dioxide emissions by approximately 65 when compared to 2010 levels. We expect to continue reducing our carbon footprint through the recently-completed conversions of our legacy coal fleet discussed above and the eventual retirement of certain other legacy coal assets. See Note 10 to the Annual Financial Statements for additional information on ongoing RMR proceedings and a pending settlement related to our Brandon Shores and H.A. Wagner facilities. As we retire older, economically nonviable conventional power generation assets, we are continuing to explore opportunities to repurpose these sites to advance our carbon deleveraging while also extending the life and increasing the value of our legacy assets.
We are an innovator in the movement to power critical infrastructure and industry with carbon-free nuclear generation. Prior to its sale to AWS, we initially developed the data center campus adjacent to our Susquehanna facility, the world’s first 24x7 carbon-free, direct-connect data center campus, to provide digital infrastructure powered by generation from Susquehanna. We are well-positioned to continue leading the energy transition by responsibly providing zero- and low-carbon power to meet growing demand from energy consumers in a variety of sectors, many of whom have sustainability requirements.
Community Engagement
We generally focus our community engagement and philanthropic efforts in the local communities we serve and where our employees live and work. We believe that a decentralized approach to engagement and giving allows us to more effectively identify areas of need and have a greater local impact. Across our fleet and our corporate offices, our facilities and their employees, often in conjunction with charitable organizations such as United Way, Salvation Army, and local food banks, we strive to participate regularly in events supplying holiday toys, school supplies, food, winter coats, volunteer work, and monetary donations. For instance, to date, events hosted by Susquehanna have raised over $1.1 million for the Berwick Area United Way. Our plants also provide community education through both on-site and off-site programs and events with first responders, professional organizations, students, interns, scouts, and other groups. The majority of our operating facilities also provide nature preserves or other recreational sites that allow for community activities such as golf, fishing and boating, walking and hiking, outdoor education, sports, and other events.
Our business also provides significant support to the communities in which we operate in the form of critical services, high-quality jobs, economic development, and tax dollars. We have adopted a Supplier Code of Conduct (available on our website) to promote safe, ethical, and socially-conscious behavior among our suppliers. Throughout 2024, we worked with all stakeholders to reach an arrangement for the continued operation of our Brandon Shores and H.A. Wagner facilities past their initially planned retirement dates to support grid reliability in the greater Baltimore area. In January 2025, we reached a settlement (which remains subject to FERC approval) with key stakeholders to continue running both facilities through May 2029 under an RMR arrangement. The continued operation of these facilities maintains critical infrastructure, facilitates reliable electricity in Baltimore, and protects Maryland consumer electricity rates. See “—Our Key Markets and Revenue Streams—Contracted Revenues—Brandon Shores and H.A Wagner RMR Arrangements” and Note 10 to the Annual Financial Statements for additional information on the RMR proceedings and settlement.
We believe the emerging data economy and the growing importance of artificial intelligence and continued re-shoring will require an all-of-the-above approach to generating the electricity necessary to power load in a responsible and efficient manner. Our AWS PPA is an example of how we are powering the future in partnership with data center and artificial intelligence enterprises and, in the case of the AWS PPA, doing so with large volumes of clean, carbon-free energy. We are actively engaged in the policy discussions taking place between generators, PJM, political leaders, and consumer advocates to solve burgeoning resource adequacy issues and seek to ensure the availability of affordable and reliable power in the regions we serve.
Human Capital
We strive to maintain a culture that empowers our employees to influence operational decisions and to trust and rely on each other, while driving safety, operational excellence, and strong financial performance. We believe our people are a valuable asset. As key stakeholders in our business, we invest in our employees by prioritizing their safety, presenting numerous training and development opportunities, carefully considering employee feedback, offering competitive compensation that includes our employees in the success of our business, providing comprehensive health and wellness benefits, and fostering an inclusive and respectful workplace.
Safety. At Talen, safety is a core value. We strive for a “No Harm” culture for all our employees, suppliers, guests, and communities, and we strive to continuously improve our systems, processes, and communications to support the safe operation of our business. Our safety management system focuses on four key components: Safety Policy, Risk Management, Safety Assurance, and Promotion. Within our safety management framework, we take a decentralized approach to health and safety coupled with centralized reporting, information sharing, and oversight. This empowers our business units and operating plants to determine the most appropriate health and safety procedures, training, engagement, and incident resolution at their sites while facilitating knowledge sharing, enabling continuous improvement, and fostering a “No Harm” culture across our organization.
We track and (or) externally report OSHA recordable incidents, lost time injuries, and near miss incidents to enhance knowledge sharing and organizational learning. In 2024, we had seven OSHA recordable incidents and an OSHA Total Recordable Incident Rate (“TRIR”) of 0. Our overall safety performance is a result of an enhanced health and safety framework and training, increased leadership visibility and accountability, and a greater focus on incident reporting, including near misses and good catches. Our safety team reviews several proactive metrics to mitigate risks before they become safety incidents. All employees and contractors are required to immediately report all safety-related incidents and have a responsibility to stop work when there is a safety concern. Once a “stop work” situation has been identified, a corrective plan must be developed and the safety team determines a path to continue work. Prior to resumption of work, a supervisor or manager that is “one step removed” must review and concur with the plan to continue work. Susquehanna has an additional corrective action Employee Concerns Program that establishes procedures for reporting and resolving nuclear safety and general work environment concerns.
We continuously work to improve safety. In 2022, we implemented an annual Safety Assessment Program, under which safety professionals from across the organization inspect plants with a focus on workplace inspections, work observations, and regulatory compliance. Other recent safety enhancements have included improvements to our overall safety management system, as well as the addition of a company-wide safety summit, a strain/sprain program, a supervisor safety assessment program, and a human performance management program. We believe these initiatives will continue to support our strong safety culture. Our safety management system allows frequent analysis of all aspects of safety for continuous monitoring and improvement, and has been key to our safety performance in 2024.
Training, Development, and Feedback. We recognize that our success depends on our ability to attract, retain, motivate, and develop qualified personnel, and we strive to provide our employees with the tools they need to succeed personally and professionally. We provide training programs covering a wide range of relevant job- and Company-specific topics for employees in all positions, including continuing education resources for professional licenses, and we also regularly promote and train interested employees into new roles. To train the next generation of professionals, we offer apprenticeship programs, internships, and educational assistance. To further develop promising leadership across our organization, we offer programs such as the Talen Leadership Academy and the Union Leader Academy, which are seminars covering a variety of business, operational, leadership, and interpersonal skills.
Formal and informal feedback at Talen runs in all directions. In addition to this feedback, non-union employees annually receive a formal review to discuss their performance, development, and goals. Coaching and performance improvement plans are used when appropriate. We strive to thoughtfully consider and respond to ideas and feedback from all employees, including plant management teams, asset managers, and frontline workers, and we provide a variety of avenues for employee feedback, including through performance review dialogue, appropriate escalation of informal feedback, and various identifiable and anonymous formal reporting channels. In 2024, we conducted an anonymous employee engagement survey and, after reviewing the results, reported key themes and next steps to employees. We have already implemented a number of specific employee recommendations.
Compensation, Benefits, and Wellness. We are committed to maintaining a highly competitive compensation structure. We maintain short-term and long-term cash incentive programs for many employees, as well as a long-term equity compensation program that aligns the interests of key team members with our strategy and the interests of our stockholders. Starting in 2025, we also offer an employee stock purchase program, under which eligible employees can purchase our common stock at a discount through payroll deductions. Full- and part-time employees also qualify for our 401(k) plan, under which we make fixed, matching, and (or) additional discretionary contributions (depending on employment specifics).
We maintain a comprehensive benefits program, under which eligible employees and their dependents are offered healthcare coverage, life and accident insurance, short- and long-term disability, maternity and parental leave, and (or) identity theft protection. To further support employee wellness, we also offer virtual health screenings, diabetes management programs, and reduced pricing on specialty medications. All employees are also eligible for our employee assistance program, which provides mental and physical health resources and discounts on essentials such as childcare, education, and insurance, among other things.
Collective Bargaining Agreements. As of December 31, 2024, we had 1894 full-time employees, approximately 43 of which were represented by labor unions. Our collective bargaining agreements (“CBAs”) include: (i) a CBA with IBEW Local 1638, covering 193 Talen Montana employees, which is in effect until April 2026; (ii) a CBA with Teamsters Local 190, covering six Talen Montana employees, which is in effect until August 2027; and (iii) a CBA with IBEW Local 1600, covering 626 Pennsylvania employees, which is in effect until August 2025. We maintain generally constructive relationships with our labor unions.
Governance
We are committed to maintaining corporate governance policies and practices that support the interests of all our stakeholders. Our values of Excellence, No Harm, Integrity, and Continuous Improvement help foster a culture of robust governance from the Board of Directors and officers to each employee. Additional information about our corporate governance will be set forth in the 2025 Proxy Statement.
Emergence from Restructuring
Increased collateral posting requirements caused by rapid and sustained increases to wholesale natural gas and power prices in mid-2021 resulted in lower available cash and liquidity to operate our business. As a result, TES and 71 of its subsidiaries commenced the Restructuring in May 2022 and TEC joined the Restructuring in December 2022. The Company emerged from the Restructuring in May 2023 with a significantly deleveraged balance sheet. See Notes 3 and 4 to the Annual Financial Statements for additional information on the Restructuring.
Corporate and Other Available Information
We are a Delaware corporation with our principal executive office located at 2929 Allen Parkway, Suite 2200, Houston, TX 77019. The telephone number for our principal executive office is (888) 211-6011. We maintain a website at www.talenenergy.com. Information contained on or accessible from our website is not, and shall not be deemed to be, incorporated by reference into this Report or any other filings with the Securities and Exchange Commission (the “SEC”).
We file our Annual Reports on Form 10-K, Quarterly Reports on Form 10-Q, Current Reports on Form 8-K, and any amendments to those reports with the SEC. You may obtain copies of these documents, free of charge, on the SEC's website at www.sec.gov. In addition, as soon as reasonably practicable after such materials are filed or furnished with the SEC, we make copies available free of charge on the “Investor Relations” section of our website at https://ir.talenenergy.com. We also post important information, including press releases, investor presentations, and notices of upcoming events on our website, and utilize it as a channel for distributions to public investors and for disclosing material non-public information in compliance with Regulation FD. Investors may be notified of postings to our website by signing up for email alerts under the “Resources” tab on the “Investor Relations” section of our website.
ITEM 1A. RISK FACTORS
You should carefully read and consider all the risks and uncertainties described below, as well as the other information included in this Report, including the Annual Financial Statements. Although we believe the following discussion includes the key risks affecting our business, new risks and uncertainties emerge from time to time, and it is not possible for us to predict all risks and uncertainties that could have an impact on our business. The occurrence of any of the following risks, or additional risks and uncertainties not presently known to us or that we currently believe to be immaterial, could materially and adversely affect our business, financial condition, results of operations, cash flows, and (or) liquidity.
Industry and Market Risks
We may be adversely impacted by changes in the market prices, availability, and transmission of electricity, fuel, and other commodities.
Market prices for electricity, capacity, ancillary services, natural gas, uranium, coal, and fuel oil are unpredictable and fluctuate substantially over relatively short periods. Market prices for electricity are particularly volatile due to the inability to store electricity in large quantities (requiring it to be used as it is produced), which can result in significant price fluctuations based on supply and demand imbalances in the day-ahead and real-time markets. Because natural gas facilities often serve as the marginal, price-setting generating units, there is a strong positive correlation between the price of natural gas and the wholesale market price of electricity in the competitive power markets in which we operate. In recent years, the market price of natural gas has experienced substantial volatility, while prices for other fuels have also varied. Our energy margin is influenced by the relationship between the prices of electricity and natural gas and, to a lesser extent, other fuels like coal and uranium. A decline, or significant volatility, in the price of natural gas or other fuels could negatively impact energy margin and energy revenues.
Additionally, we purchase some of our fuel and other consumables such as water, lime, limestone, and other chemicals and sorbents on a short-term or spot market basis. Delivery of these products to our facilities depends on available transportation infrastructure and available shipping capacity. In certain market conditions, transportation costs to our facilities may be significant and fluctuate substantially. Accordingly, as the prices for our fuels, other consumables, and transportation fluctuate, the price we can obtain for the sale of electricity may not rise similarly or at all to match any increase in our costs. Any inability to obtain supply or delivery of necessary fuel or other products could impair our ability to operate our facilities profitably or at all.
Our business is subject to physical, market, economic, and regulatory risks relating to weather conditions and extreme weather events.
Because weather can influence actual and expected electricity demand, as well as current and future prices of electricity and fuel, mild or unexpected weather conditions could have an adverse effect on our business. Our operations are substantially concentrated in PJM, where sustained cold weather during the winter and sustained hot weather during the summer generally result in increased market demand and higher prices for electricity. Conversely, mild winter or summer temperatures in the Mid-Atlantic tend to suppress electric demand and may result in lower overall settled prices that reduce our energy margin. Additionally, extreme weather events or sustained mild weather could result in market conditions that generate substantial gains or losses. For example, certain market and operating conditions may require us to purchase electricity in the wholesale market during periods of unusually high prices to meet our supply obligations or to sell electricity in the wholesale market during periods of low prices.
The effects of storms, floods, and other climatic events could disrupt our operations and cause us to incur significant costs in preparing for or responding to these effects. These or other meteorological changes could lead to increased operating costs, capital expenses, or power purchase costs. Such climatic events could also affect the availability of a secure and economical water supply in some locations, which is essential for the continued operation of our generation facilities.
Furthermore, under PJM’s Capacity Performance model, we may be (and have in the past been) subject to substantial monetary penalties for failing to meet the Capacity Performance requirements set forth by PJM in certain emergency events, including extreme weather events. See also “—Commercial and Operational Risks—We may experience unplanned interruptions or periods of reduced output, which could result in lower energy margin, lost opportunities, monetary penalties, contractual damages, and (or) other losses.” Extreme weather events could also result (and in the past have resulted) in governmental investigations and changes in applicable laws and regulations, reliability requirements, and market rules, including efforts to reform PJM. See also “—Regulatory, Environmental, and Legal Risks—We could be impacted by changes in, or state interference with, the structure or operation of the markets in which we operate, including ongoing market restructuring in PJM.” and “—Regulatory, Environmental, and Legal Risks—We may be affected by changes in applicable laws and regulations.”
Expected demand growth from the technology sector, manufacturing, and other uses of electricity, which has driven recent improvements in the outlook for the competitive wholesale power generation market, may not actually occur or be sustained.
Recently, the market outlook for competitive wholesale power generation has improved largely based on expected future demand from several sources, including data centers and other technology sector requirements, re-shoring of manufacturing in the U.S., the electrification of industry, and other demand drivers. Various factors including but not limited to unfavorable macroeconomic conditions, increases in energy efficiency or supply, or advances in technology, could result in lower-than-expected electricity demand and unfavorable market conditions for our business. A general economic slowdown or recession, a downturn in technology, manufacturing, or other sectors, an oversupply of generation resources or natural gas, or various other economic conditions could reduce electricity demand and prices. Improvements in energy efficiency, conservation efforts, and demand-side power management technologies, as well as other shifts in energy consumption, may reduce demand or slow demand growth. Furthermore, the penetration of renewable generation resources has, and may continue to have, negative effects on wholesale power prices and the economics of dispatchable generation units. Advances in technology may also provide alternative methods to produce, dispatch, and store power, which could also lead to increased overall electricity supply. Any of these factors could impact the dispatch, capacity factors, and value of our generation facilities.
We face intense competition in the competitive power generation market.
Market competition may adversely affect our ability to operate profitably and generate positive cash flow. We sell our capacity, electricity, and ancillary services into competitive wholesale markets through a combination of capacity auctions, day-ahead and real-time spot markets, and bilateral agreements. Our business model depends on us successfully operating in a competitive environment and, unlike regulated utilities, we are not assured of any rate of return on capital investments through a regulated rate structure. Competitors in wholesale power markets include other non-utility generators, regulated utilities and their competitive subsidiaries, industrial companies, financial institutions, and other energy marketers. See also “Item 1. Business—Our Operations—Competition.” Some of our competitors may have advantages over us through access to greater resources, newer generation facilities, lower costs, or more experience. Our ability to compete is affected primarily by electricity prices, fuel prices, the relative cost of electric generation, and the reliability and availability of generation assets. These factors can be impacted by generation additions or retirements from the market, changes in natural gas distribution networks that affect the price and availability of fuel utilized for electric generation, changes in storage assets and transmission capacity, and technological advances in power generation and efficiency. Competition may also be impacted by the actions of environmental and other governmental authorities, including but not limited to the establishment of legislation or subsidies favoring one form of generation over another (such as investment tax credits, production tax credits, and other factors); for example, the Inflation Reduction Act contains a number of tax credits and incentives relating to renewable energy projects and clean energy technologies. Any negative impact on our ability to compete could adversely impact our business. See also “—Regulatory, Environmental, and Legal Risks—We could be impacted by changes in, or state interference with, the structure or operation of the markets in which we operate, including ongoing market restructuring in PJM.”
Our business is subject to extensive regulation, which may increase our costs, reduce our revenues, or limit operation of our facilities.
Our business is subject to extensive energy, reliability, market, nuclear, environmental, and safety laws, regulations, and requirements, among others. See also “Item 1. Business—Legal, Regulatory, and Environmental Matters.” Some of the key rules and regulations impacting our business include, among others, those set forth by: (i) FERC, relating to the generation, sale, and transmission of electricity, and its designated Electric Reliability Organization (currently NERC), relating to reliability standards for the bulk power system; (ii) PJM and ISO-NE, relating to the reliability and performance of generation facilities and operation of the energy and capacity markets; (iii) the NRC, relating to the licensing, operation, and ownership of nuclear facilities; (iv) the EPA, relating to environmental protection and permitting; and (v) various state and local jurisdictions, relating to similar and other matters. We may also from time-to-time become subject to new or revised laws, regulations, or requirements. The costs of compliance with these requirements may be substantial, and any non-compliance or inability to comply could result in the suspension or curtailment of our electricity sales and power delivery; the cessation, suspension, delay, or limitation of our operations; premature unit retirements; and (or) monetary penalties, increased compliance obligations, or other types of sanctions. See also “—Regulatory, Environmental, and Legal Risks.”
Our business could be adversely affected by events outside of our control, including armed conflicts, war, terrorist attacks or threats, pandemics, natural disasters, cyber-based attacks, or other significant events.
Instability and unrest, as well as war, other armed conflicts, economic sanctions, acts of terrorism, or threats thereof may lead to economic disruption that could adversely affect our business through high volatility in fuel and other commodity prices, difficulty obtaining products such as nuclear fuel, disruptions in supply chains, disruptions or volatility in financial markets, or other factors. In addition, we could be adversely affected by an epidemic, an infectious disease outbreak, or other public health events, which could impact our workforce and the availability of other resources, resulting in decreased service levels and increased costs. Furthermore, as a significant portion of our power generation facilities are geographically concentrated in the mid-Atlantic area of the United States, we face increased risk that a natural or man-made disaster in that area could adversely affect a large part of our operations.
We are also subject to cyber-based security disruption and integrity risk, which could result in an adverse impact to our results of operations or business reputation. The operation of our business relies on cyber-based technologies and is, therefore, subject to the risk that such systems could be the target of disruptive actions, particularly through cyberattack or cyberintrusion by hackers, foreign governments, state-sponsored actors, or cyberterrorists. Our cyber-based systems and technologies may otherwise also be compromised by unintentional errors or other events, including by vendors or third-parties. As a result, operations could be interrupted or impacted, property or other assets damaged, funds misappropriated, security compromised, or employee or third-party information lost or stolen, causing us to incur significant revenue losses, costs to replace or repair equipment, and other liabilities and damages, including regulatory actions, litigation, or reputational harm. In addition, we may also incur increased capital and operating costs to implement increased cybersecurity systems and protections throughout our business.
Commercial and Operational Risks
Operation of power generation facilities involves significant risks and hazards customary to the power industry, which we cannot assure our insurance will be adequate to cover.
Power generation involves hazardous activities, including transporting, storing and handling fuel, operating industrial, electrical and other equipment, and connecting to high voltage transmission and distribution systems. As a result, our assets, employees, contractors, customers, and the general public may be exposed to risks inherent in the nature of our operations, including hazards such as nuclear accidents, accidents involving high voltage electrical equipment, environmental hazards, fires or explosions, structural failures, machinery failures, and other dangerous incidents. These and other hazards can cause damage or destruction of our assets or other property and equipment, personal injury or loss of life, pollution or environmental damage, and (or) suspension of operations, and any such event may expose us to liability for substantial damages, fines, or penalties. Although we maintain insurance that we believe is reasonable and prudent under the circumstances to cover our operations and assets, we cannot provide any assurance that our insurance program will be sufficient or effective under all circumstances and against all hazards or liabilities to which we may be subject. See also “Item 1. Business—Our Operations—Insurance.” Even if we do have coverage for a particular incident, we may be subject to deductibles, caps, and (or) policy limits, and the amount recoverable under applicable insurance may not fully cover the impacts on our revenue or other potential consequences. Furthermore, due to rising insurance costs and changes in the insurance markets, we cannot provide any assurance that our insurance coverage will continue to be available at economic rates or at all.
Our activities related to hedging and asset management may result in economic losses and (or) volatility in our financial results.
We are exposed to price variability associated with future sales and (or) purchases of power products, fuel, environmental products, and other commodities in competitive wholesale markets, which contribute to uncertainty in the future performance and cash flows of our business. See also “—Industry and Market Risks—We may be adversely impacted by changes in the market prices, availability, and transmission of electricity, fuel, and other commodities.” We actively manage the market risk inherent in our business through our commercial risk management activities, which utilize a variety of physical and financial instruments to protect cash flow and preserve forward margin. See also “Item 1. Business—Our Strategies—Optimize risk management program and hedging.” Nonetheless, such activities may not effectively manage or fully eliminate risks as expected due to differing conditions than those assumed or forecasted, including those related to demand, pricing, volatility, market correlations, generation facility availability, unforeseen market disruptions, and weather events. Given the inherent uncertainty in developing future market expectations, actual market conditions could be materially different than our expectations. The financial markets in which we hedge may have insufficient liquidity or excessive counterparty risk, impairing our ability to enter into new transactions. Furthermore, when a commercial contract expires or is terminated, we may not secure replacement on acceptable terms or at all, and it is possible that subsequent commercial contracts may not be available at prices that permit the operation of our generation fleet on a profitable basis. If our commercial risk management activities are unable to predict or manage the market risk inherent in our operations, economic losses or other costs to our business could result.
Additionally, our commercial risk management activities could contribute to significant volatility in our financial results. Commercial transactions with future delivery dates may meet certain accounting criteria requiring them to be carried on the balance sheet at fair value. The “mark-to-market” effect, or remeasurement of these transactions to fair value at current market prices, is generally recognized in earnings through contract delivery. However, many commercial transactions with future delivery dates do not meet the criteria for “mark-to-market” accounting, and the income effect of these transactions is generally recognized at contract delivery. Accordingly, we are exposed to timing differences in the earnings recognition for commercial contracts with the same delivery date. As a result, during periods of extreme price volatility or significant changes in market prices, our quarterly and annual results may be subject to fluctuations due to changes in fair values of commercial transactions caused by changes in market prices.
We may experience unplanned interruptions or periods of reduced output, which could result in lower energy margin, lost opportunities, monetary penalties, contractual damages, and (or) other losses.
Our facilities require periodic planned outages to perform maintenance and repair activities, which are typically scheduled during seasonal non-peak demand periods to minimize their financial impacts to our business. However, our facilities may also experience unplanned outages, periods of reduced output, or other interruptions due to a number of factors, including but not limited to equipment failures, accidents, electrical delivery or transportation problems, fuel supply disruptions, acts of nature, environmental incidents, security or information technology breaches, labor disputes, intentional attacks, obsolescence, or below-expected performance. Any unexpected failure, including those associated with breakdowns or forced outages, could result in reduced profitability, including from lost energy margin, costs to cover power at then-current market prices to satisfy our commitments, and additional repair and (or) ongoing maintenance costs. Although we maintain customary insurance coverage for certain of these risks, no assurance can be given that our insurance coverage will be sufficient to fully compensate us for any such losses.
Facility outages could also subject us to market or contractual penalties. Under PJM’s Capacity Performance model, we may be (and have in the past been) subject to substantial monetary penalties for failing to meet the Capacity Performance requirements set forth by PJM in certain emergency events. For example, during Winter Storm Elliott in 2022, certain of our generation facilities failed to meet PJM’s Capacity Performance requirements and, as a result, we incurred final aggregate net Capacity Performance penalties of $29 million. See also “Item 7. Management’s Discussion and Analysis of Financial Condition and Results of Operations—Factors Affecting Our Financial Condition and Results of Operations—Capacity Markets—Capacity Performance Event” and “—Regulatory, Environmental, and Legal Risks.” Additionally, under the AWS PPA, Susquehanna has committed to certain delivery quantities over time and reliability standards and AWS may be entitled to contractual or other remedies in the event of Susquehanna’s non-performance.
Because our generation facilities are part of interconnected regional grids, we face the risk of congestion and other interruptions that could impact our operations.
Our operations depend on transmission and distribution facilities owned and operated by RTOs, ISOs, and other unaffiliated parties to transmit and deliver the electricity that we produce. If the transmission service from these facilities is unavailable or disrupted, or if the transmission capacity infrastructure is inadequate, our ability to sell and deliver power may be materially affected. Electric power blackouts are possible, have occurred, and can disrupt electrical service for extended periods of time, which could result in interruptions to our operations, increased costs to replace existing contractual obligations, possible regulatory investigations, and potential operational risks to our facilities. Furthermore, transmission constraints and outages, including line maintenance outages, can cause transmission congestion that negatively impacts energy prices at our facilities, which could affect the realized margins of our generation fleet. The rates for transmission capacity from our facilities are set by others and thus are subject to changes outside of our control, some of which could be significant.
Our ownership and operation of Susquehanna subjects us to substantial risks associated with nuclear generation.
Although the safety record of nuclear reactors generally has been very good, accidents and other unforeseen problems have occurred both in the United States and abroad. The consequences of a major incident could be significant, including loss of life, destruction of property, and environmental damage. Because Susquehanna accounts for a substantial amount of our generation and associated earnings, any adverse development in Susquehanna’s operations, such as an unplanned outage or catastrophic event, could have a significant impact on our business. The risks and uncertainties associated with our nuclear generation include, among other things:
•impairment of reactor operation and safety systems, unscheduled outages or unexpected costs due to equipment, mechanical, structural, or other problems, inadequacy or lapses in maintenance protocols, human error, or force majeure;
•costs and liabilities relating to the procurement, safeguarding, storage, handling, treatment, transport, release, use, and disposal of nuclear fuel and other radioactive materials, including the costs of storing and maintaining SNF at our on-site dry cask storage facility;
•potential impacts of natural disasters, terrorist or other attacks, cybersecurity threats and (or) cyber-related attacks, or other unforeseen events, and the costs of preventing, preparing for, and responding to any such events;
•limitations on the amounts and types of insurance coverage commercially available;
•the technological and financial aspects of modifying or decommissioning nuclear facilities at the end of their useful lives;
•extensive regulation associated with ownership and operation of nuclear facilities (see also “—Regulatory, Environmental, and Legal Risks—Our ownership and operation of a nuclear power facility subjects us to regulations, costs, and liabilities uniquely associated with these types of facilities.”); and
•uncertainties surrounding public perception of nuclear generation, as well as the potential for a serious incident at Susquehanna or another nuclear facility, which could adversely affect the demand for nuclear power and could lead to increased regulation of the nuclear power industry.
The frequency and duration of outages affect Susquehanna’s availability. If future refueling outages last longer than anticipated or Susquehanna experiences unplanned outages, our business could be adversely affected. In addition, a significant operational disruption at Susquehanna could impair our ability to meet our PJM Capacity Performance requirements and our obligations under long-term power supply contracts, including under the AWS PPA. See also “—We may experience unplanned interruptions or periods of reduced output, which could result in lower energy margin, lost opportunities, monetary penalties, contractual damages, and (or) other losses.”
In addition, the costs associated with the nuclear fuel cycle are substantial, and suppliers of certain components and other materials required to produce nuclear fuel are limited. Any disruption to the availability of these components and other materials, whether temporary or long-term, could cause unplanned outages and have a significant impact on the cost of nuclear fuel or otherwise impact our ability to profitably operate Susquehanna. Furthermore, there remains substantial uncertainty regarding the nuclear industry’s permanent disposal of SNF, which could result in substantial additional costs to us that cannot be predicted. See Note 12 to the Annual Financial Statements for additional information on SNF.
Our commercial and operational activities may constrain our liquidity or require excessive levels of financial support.
Many of our commercial counterparties require us to provide credit support in the form of guarantees, LCs, security interests, netting arrangements, and (or) cash collateral. Because we are required to collateralize hedges that settle in future delivery periods, but do not receive settlements for electric generation until delivery, collateral requirements could result in periods of lower available liquidity. Furthermore, significant movements in market prices may require us to provide cash collateral or LCs in very large amounts (for instance, as happened prior to the Restructuring). The effectiveness of our commercial strategy may be dependent on the amount of collateral available to support our hedging arrangements, and these collateral requirements may be greater than we anticipate or are able to meet. Without sufficient working capital or borrowing capacity, we may not be successful in managing market and price risks. Our ability to increase liquidity could be limited by the terms of our debt or other agreements, unwillingness of financing sources to extend us credit or other capital, overall financial market conditions, or other factors. As a result, we could be required to liquidate commercial positions at significant losses to mitigate collateral requirements.
From time-to-time in the ordinary course of our business, we are also required to provide financial assurance to third parties for the performance of certain obligations. This may include guarantees, stand-by LCs issued by financial institutions, surety bonds issued by insurance or surety companies, and indemnifications. Some of these assurance products may limit our available liquidity by requiring collateralization, reducing available borrowings under our credit facilities, or utilizing available basket capacity under our debt agreements. In addition, surety bond providers generally are under no obligation to provide sureties on commercial terms or at all and, upon certain events, have the right to request additional collateral or require replacement of their bonds by alternate surety providers. Among others, we currently have surety bonds posted to the State of Montana on behalf of our proportional share of remediation and closure activities at Colstrip and LCs posted to AWS to support our obligations under the AWS PPA. Any draw down on these or other financial assurances in an event of default could adversely affect our financial position and liquidity, credit ratings, and compliance with our debt agreements and other contractual obligations.
We are exposed to credit risk, concentrations of credit risk, and counterparty risk from RTOs and ISOs, other customers, commercial counterparties, financial institutions, suppliers, and other parties.
In the ordinary course of our business, we are subject to the risk of losses from nonpayment by our contractual counterparties, including RTOs/ISOs, PPA counterparties, other customers, commercial counterparties, and other parties to whom we supply certain products or services, as well as by other market participants whose defaults could indirectly impact our business. Although we have established policies and procedures to evaluate and manage counterparty credit risk, they may not be adequate to identify fully or manage these risks effectively. Furthermore, we cannot predict the impact to our business from any decline in economic conditions, including any deterioration in the creditworthiness of customers and hedging counterparties. Any increase in counterparty nonpayment or nonperformance could require us to reserve for or write-off uncollectible accounts. Additionally, we are exposed to concentrations of credit risk from suppliers and customers among electric utilities, financial institutions, marketing and trading companies, and the U.S. Government. These concentrations may impact our overall exposure to credit risk, positively or negatively, as counterparties may be similarly affected by changes in economic, regulatory, or other conditions. See Note 5 to the Annual Financial Statements for additional information.
We purchase fuel, other required consumables, equipment and parts, and other critical products from a number of suppliers. We also enter into service contracts relating to critical operational and maintenance activities. Continued delivery of vital supplies and equipment and performance of vital services is dependent upon the continuing viability of our contractual counterparties. If our suppliers, service providers, or other counterparties fail to perform their obligations to us, we may be forced to suspend or curtail operations, enter into alternative arrangements on less favorable terms, or incur coverage costs, penalties, or other losses. See also “—We may experience unplanned interruptions or periods of reduced output, which could result in lower energy margin, lost opportunities, monetary penalties, contractual damages, and (or) other losses.”
Completed, pending, and potential retirements of our coal assets could result in additional costs and adverse effects on our operating results.
Since 2016, we have retired three economically nonviable coal-fired units, while our remaining coal-fired generation assets continue to be impacted by changing environmental regulations and power market economics. Although we recently reached a settlement agreement for the continued RMR operation of our Brandon Shores (a coal asset) and H.A. Wagner (formerly a coal asset, now operating primarily on fuel oil) facilities through May 2029, we do not currently anticipate that those assets will run beyond that date unless PJM continues to require their operation to maintain grid reliability. In addition, although our Brunner Island facility has been converted and can now run on either coal or natural gas, it remains a legacy coal facility with associated remediation obligations. We likewise have remaining liabilities associated with historical coal-fired generation at other legacy sites. We also own minority interests in three additional coal-fired facilities, including the Colstrip facility in Montana, of which we are the operator. See “Item 7. Management’s Discussion and Analysis of Financial Condition and Results of Operations—Liquidity and Capital Resources—Forecasted Uses of Cash—Projected ARO and Accrued Environmental Liability Cash Flows” and Note 12 to the Annual Financial Statements for additional information on environmental remediation obligations. In connection with the closure and remediation of retired generation units, we have spent, and may in the future spend, a significant amount of capital, internal resources, and time to complete the required closure and reclamation.
The carrying value of our property, plant and equipment is subject to impairment charges.
PP&E used in operations is assessed for impairment whenever changes in facts and circumstances indicate that the carrying amount of a particular asset may not be recoverable. If we were to experience events, among others, such as a prolonged economic downturn, significant changes to generation facility useful lives, a decrease in the market price of an asset, increased costs, certain negative financial trends, or significant changes to market conditions or regulatory environment, we could experience future generation facility impairments.
Because we are minority owners in certain of our generation facilities, we cannot exercise complete control over their businesses or operations and are exposed to business, operational, and financial risks associated with co-owners.
We have limited control over the ownership and, in some cases, operation of our jointly-owned facilities. We own minority interests in the Conemaugh and Keystone generation facilities, which are operated by other co-owners, and in the Colstrip facility, which we operate. See Note 10 to the Annual Financial Statements for additional information on jointly owned facilities. While we seek to influence the business and affairs of these facilities, either by serving as operator (i.e., Colstrip) or negotiating certain management, information, or governance rights, we may not always succeed in doing so. We often depend on our co-owners to fulfill obligations important to the success of these joint operations, such as funding their share of capital and operating costs and, in the case of Conemaugh and Keystone, operating the facilities, and their ability to meet these obligations is outside our control. Our co-owners may not have the level of experience, technical expertise, human resources, and other attributes necessary to operate these projects optimally. Moreover, some of our co-owners, including rate-regulated utilities, may have economic incentives and obligations significantly different than ours. If our current or future co-owners are unwilling or unable to meet their obligations under our joint ownership arrangements, the performance, success, and value of these arrangements may be adversely affected. Furthermore, we (as a joint owner) may be forced to undertake the obligations ourselves or incur additional expenses as a result. In such cases, we may also be required to enforce our rights, which may cause disputes among us and our co-owners. Any of these events could adversely impact us, our joint operations, or our ability to enter into future joint operations.
Our success depends on our ability to attract and retain an appropriately qualified workforce.
Our ability to attract and retain key employees is important to both our operational and financial performance. We cannot guarantee that any member of our leadership or workforce will continue to serve in any capacity for any particular period of time. We could have difficulty retaining certain key members of management beyond May 2026, when a significant portion of our outstanding long-term equity-based incentive compensation is scheduled to vest. Furthermore, an aging workforce with significant retirement eligibility, mismatch of skill set, expectation of future needs, uncertainty around the future of our aging assets, or unavailability of short-term contract employees or contractors may lead to difficulty retaining our workforce, operating challenges, and increased costs. Additional challenges we could face include a lack of human resources, losses to our operational knowledge base, and the required time and other resources needed to develop new workers’ skills. In particular, our operations at Susquehanna largely depend on highly specialized personnel whose absence may adversely impact our ability to operate. We are also subject to the risk of organized actions by unionized employees which, as of December 31, 2024, represented approximately 43 of our workforce. If we are unable to negotiate future collective bargaining agreements on favorable terms, or if our union employees were to engage in strikes, work stoppages, slowdowns, or other forms of labor disruption, we would be responsible for obtaining replacement labor and could experience increased costs, reduced power generation, outages, other operational disruptions, or reputational harm.
We could be affected by increases in our labor and benefit expenses, including healthcare and pension costs.
We expect to continue facing increased cost pressures in our operations due to increased labor costs resulting from heightened inflation, the need for higher-cost expertise in the workforce, and other factors. In addition, we are required under collective bargaining agreements to provide specified levels of healthcare and pension benefits to certain current employees and retirees, and we provide similar benefits to our non-union employees. Due to general inflation in costs, the aging demographics of our workforce, healthcare cost trends, and other factors, we expect our healthcare costs, including prescription drug coverage, to continue increasing despite measures we have taken to reduce them.
As of December 31, 2024, our defined benefit pension plans, which cover certain of our retirees and employees, were underfunded by an estimated 291 million, with a total benefit liability of an estimated 1.2 billion, and we expect to continue incurring significant costs under these plans. The measurement of our expected future pension obligations and costs is highly dependent on a variety of assumptions, most of which relate to factors beyond our control, including investment returns, interest rates, inflation rates, salary increases, future government regulation, required or voluntary contributions made to the plans, and the demographics of plan participants. If our assumptions prove to be inaccurate, our costs and cash contribution requirements to fund these benefits could be significantly higher than anticipated. Further, without sustained growth in the pension investments over time, and depending upon the assumptions impacting costs listed above, we could be required to fund our plans with significant amounts of cash in advance of the time we would otherwise fund such payments. Under the Employee Retirement Income Security Act of 1974, as amended (“ERISA”), the Pension Benefit Guaranty Corporation (“PBGC”) can petition a court to terminate an underfunded defined benefit pension plan under limited circumstances. In the event our pension plans are terminated by the PBGC, we could be liable to the PBGC for the entire amount of the underfunding, as calculated by the PBGC based on its own assumptions (which may result in a significantly larger liability than the assumptions used for financial reporting purposes or in determining the annual funding requirements for the plans).
Acquisitions, divestitures, mergers, or other corporate transactions may expose us to additional risks.
From time to time, we may seek to acquire additional assets or businesses, which is subject to risks including delay or the inability to achieve completion; the failure to identify material problems during due diligence accurately or at all; potential over-payment; the inability to retain acquired employees, customers, or suppliers; and the inability to obtain required or desired financing. We may also acquire assets or businesses beyond our current geographies, markets, or lines of business, which could expose us to increased market, operational, or regulatory risks. There can be no assurance that any acquired assets or businesses will be integrated or perform as expected, provide the anticipated returns, support any related financing obligations, or generate the cash flows needed to operate them profitably. In addition, we may from time to time choose to divest certain assets or businesses, which is subject to risks relating to employment matters; customers, suppliers, and other counterparties; other stakeholders in the disposed business; separation of the disposed assets from our remaining business; management of our ongoing business; failure to realize the anticipated benefits; other financial, legal, and operational risks; and other risks unknown to us at the time. In connection with dispositions, we may also indemnify or guarantee counterparties against certain conditions or liabilities, which could result in disputes, litigation, and (or) future costs or liabilities to us. In addition, any disposition would likely decrease our earnings and cash flows.
We could also engage in mergers, business combinations, or similar corporate transactions. In addition to the types of risks discussed above, mergers and similar transactions may subject us to risks associated with: required stockholder approvals and other stockholder legal actions; changes or fluctuations in merger consideration that could affect the value our stockholders receive; changes in management or control of our business; challenges integrating or operating the combined company; or failure to realize the anticipated business opportunities, synergies, growth prospects, or other benefits. Any acquisition, divestiture, merger, or other corporate transaction could occupy a significant amount of our time and may strain our resources, increase our costs, and distract management. Furthermore, the extensive regulation of our business could delay, prevent, limit the scope of, or increase the costs associated with any such transaction. See also “Item 1. Business—Legal, Regulatory, and Environmental Matters” and “—Regulatory, Environmental, and Legal Risks.” Any failure to meet contractual terms, whether for regulatory or other reasons, could result in transaction cancellation, costly disputes or litigation, breakage or other fees, or other costs and liabilities. No assurance can be provided that any such transaction will result in the anticipated benefits to our business or stockholders.
Regulatory, Environmental, and Legal Risks
Our business is subject to extensive energy-related regulation and oversight.
We are subject to regulation by federal and state agencies and other bodies that exercise regulatory authority in the various regions where we conduct business, including but not limited to FERC; the Department of Energy; the NRC; NERC; the Federal Communications Commission; and state public utility commissions. See also “Item 1. Business—Legal, Regulatory, and Environmental Matters—Energy Regulation” and “—Our ownership and operation of a nuclear power facility subjects us to regulations, costs, and liabilities uniquely associated with these types of facilities.”
Certain of our subsidiaries sell electricity into the wholesale markets and are subject to rate, financial, and organizational regulation by FERC. FERC has authorized us to sell energy, capacity, and ancillary services at wholesale at market-based rates and has granted us various related customary waivers and blanket approvals, including a blanket authorization to issue securities and to assume liabilities. FERC retains the authority to modify or withdraw our market-based rate authority and impose cost-based rates if it determines that the market is not competitive, we possess market power in one or more markets, we are not charging just and reasonable and not unduly discriminatory rates, or we have violated FERC’s market behavior rules or engaged in market manipulation. Any reduction by FERC in the rates that we may receive, revocation of FERC’s waivers and blanket authorizations, or unfavorable changes to the regulation of our business by federal or state regulators could materially adversely affect our business. Delivery “behind-the-meter” of more than 300 MW of power under the AWS PPA requires that FERC approve an amended ISA between Susquehanna, PPL, and PJM. Without an amendment we will be unable to deliver the full amount of contract volume under the AWS PPA on a behind-the-meter basis, which may require a contract renegotiation to deliver the additional power “in-front-of-the-meter.” See "Item 3. Legal Proceedings” for additional information on the Susquehanna ISA Amendment. In addition, if we were found to have violated FERC’s market behavior rules or other FERC requirements, FERC could impose civil penalties or order us to disgorge associated profits. Our generation assets are also subject to the reliability standards promulgated by the FERC-designated Electric Reliability Organization (currently NERC) and approved by FERC. If we fail to comply with the mandatory reliability standards, we could be subject to sanctions, including substantial monetary penalties and increased compliance obligations.
In addition to federal regulation, our operations are subject to various state laws and regulations. These include oversight of siting, permitting, and environmental compliance for our facilities, as well as participation in state-specific energy markets and programs. In addition, the RTOs and ISOs in the regions in which we conduct business inherently have complex rules that are intended to balance the interests of market stakeholders. Proposed market structure modifications may lead to disputes among stakeholders that might not be resolved for a period of time as a result of regulatory and (or) legal proceedings. See also “—We could be impacted by changes in, or state interference with, the structure or operation of the markets in which we operate, including ongoing market restructuring in PJM.”
Our business is subject to extensive state, federal, and local statutes, rules, regulations, and permitting requirements relating to environmental protection and worker health and safety, which could limit our operations, increase our costs, result in other liabilities to us, or render continued operation of certain of our facilities uneconomic.
Our business is subject to extensive federal, state, and local laws, regulations, and requirements relating to environmental protection and human health and safety, which have become more stringent over time. These requirements impose, among other things, permitting requirements for regulated activities, costs to limit or prevent pollution or other contamination, substantial liabilities and remedial obligations for pollution or contamination, and specific standards addressing worker protection and process safety. See also “Item 1. Business—Legal, Regulatory, and Environmental Matters—Environmental Regulation.”
We are required to obtain and to comply with numerous permits, approvals, licenses, and certificates from various environmental agencies, which can be a lengthy and complex process that can sometimes result in permit conditions that make certain activities overly restrictive or uneconomic. Moreover, renewal of existing permits could be denied or jeopardized by various factors, including litigation, environmentalist or community opposition, and political pressures. Costs, conditions, denials or non-renewals, or non-compliance associated with any required permits or approvals could result in increased costs; the cessation, suspension, delay, or limitation of our operations; premature unit retirements; and monetary penalties, increased compliance obligations, or other types of sanctions.
Furthermore, certain of our operations pose risks of liability due to leakage, migration, emissions, releases, or spills of hazardous or otherwise regulated substances to the air, surface or subsurface soils, surface water, or groundwater. Certain environmental laws impose strict as well as joint and several liability for costs to remediate and restore sites. In addition, claims for personal or property damage may result from the environmental, health, and safety impacts of our operations. We could be held responsible for all liabilities associated with the environmental condition of our facilities, regardless of whether we were responsible for the creation of the environmental condition, it arose from the activities of predecessors or third parties, or our operations met previous industry standards at the time conducted.
New or more stringent enforcement of existing laws or regulations could also adversely affect our business. See also “—We may be affected by changes in applicable laws and regulations.” As a result of various factors, including existing and recently revised rules and regulations, such as those pertaining to air, waste, and water (including the EPA MATS, GHG, CCR, and ELG Rules) we have spent, and expect to continue to spend, substantial amounts on environmental compliance, controls, and remediation. See “Item 1. Business—Legal, Regulatory, and Environmental Matters—Environmental Regulation” and Note 12 to the Annual Financial Statements for additional information. Failure to comply with applicable environmental laws, regulations, and permits could result in liability for administrative, civil, or criminal fines or penalties or in other costs or obligations, including requirements to install additional equipment or make substantial changes to our operations. In addition, private parties may also have the right to pursue legal actions to enforce compliance and seek damages for non-compliance. These factors have also resulted in continuing uncertainty around the environmental costs, profitability, and continued operations of our fossil fuel-fired facilities, and coal-fired facilities in particular. See also “—There is uncertainty related to the future profitability of our fossil fuel-fired power generation business and the amount and timing of associated environmental costs.” and “—Existing and emerging legal and regulatory requirements related to coal-fired generation operations and CCR could adversely affect our business.”
We could be impacted by changes in, or state interference with, the structure or operation of the markets in which we operate, including ongoing market restructuring in PJM.
We do not own or control the transmission facilities required to deliver the wholesale power from our generation facilities to load. FERC has issued regulations that require wholesale electricity transmission services, even when offered by parties other than RTOs and ISOs, to be offered on an open-access, non-discriminatory basis. Although these regulations are designed to encourage competition in wholesale markets, there can be no assurance that transmission capacity will be available in the amounts we require. We cannot predict the timing of industry changes as a result of these initiatives, the adequacy of transmission facilities, or whether RTOs, ISOs, or other transmission providers will efficiently operate transmission networks and provide related services. Furthermore, regulatory approvals and orders that we have obtained may be subject to challenge and protest from time to time.
In most cases, RTOs and ISOs operate transmission facilities and provide related services, administer organized power markets, and maintain system reliability. Many of these RTOs and ISOs operate the real-time and day-ahead markets in which we sell electricity, as well as the forward markets in which we sell capacity, and may impose offer caps, price limitations, and other mechanisms to guard against the potential exercise of market power. These and other regulatory mechanisms may adversely affect our profitability. Changes in the rules, market operations, or geographic scope of existing RTOs, ISOs, and various regional power markets, as well as any challenges in the formation and operation of similar emerging market structures, could also affect our ability to sell, the prices we receive, or the costs to transmit electricity and capacity from our generation facilities.
The wholesale energy markets vary from region to region with distinct rules, practices, and procedures. Changes in these market rules, problems with rule implementation, and compliance or failure of any of these markets could adversely impact our business. The PJM market is undergoing significant restructuring due to projected increases in demand, projected retirements of supply, and recent weather events that have exposed systemic flaws. Ongoing market reforms have caused delays in the PJM Base Residual Auctions, which determine capacity prices in upcoming years, leading to unpredictability around capacity revenues due to lack of reliable pricing and on-schedule BRAs. While PJM has established dates for certain upcoming PJM BRAs based upon FERC orders establishing rules for such capacity markets, we cannot guarantee those auctions will take place on those dates or at all. In addition, under PJM’s Capacity Performance model, we may be (and have in the past been) subject to substantial monetary penalties for failing to meet the Capacity Performance requirements set forth by PJM in certain emergency events. Continued efforts to address perceived capacity market design issues are ongoing, and we cannot predict the outcome of these market reforms or their impact on future capacity revenues. See Note 12 to the Annual Financial Statements for additional information on the PJM capacity market, systemic risks, BRA delays, and related legal actions.
Our power generation business relies on a competitive marketplace. See also “—Industry and Market Risks—We face intense competition in the competitive power generation market.” The competitive wholesale marketplace may be undermined by changes in market structure as well as the actions of federal or state entities that interfere in the competitive marketplace, such as subsidies, out-of-market payments, incentives, or bailouts to new or uneconomic facilities; imports of power; permission for regulated utilities to build generation and add it to the rate base; renewable mandates or incentives; and mandates to sell power below cost. Actions that undermine the competitive marketplace could suppress capacity and energy prices or lead to premature retirement of existing facilities, among other things. See also “—We may be affected by changes in applicable laws and regulations.”
There is uncertainty related to the future profitability of our fossil fuel-fired power generation business and the amount and timing of associated environmental costs.
Many political and regulatory authorities, environmental groups, and investors are devoting substantial efforts to minimizing or eliminating fossil fuel-fired electricity generation, which could reduce demand and pricing for electricity generated at our fossil fuel-fired facilities and adversely impact our business, financial condition, growth prospects, and ability to raise capital. See also “—Financial and Equity Risks—We may not have sufficient access to financing for our business.”
These efforts are resulting in increased regulation of fossil fuel combustion, GHG emissions, and other related activities. Any resulting changes to the legal and regulatory framework governing electric generation could materially impact our business. For example, new air, waste, and water rules finalized by the EPA in 2024 could require us to incur significant costs if they withstand legal challenges and potential rescission or revision by the Trump administration. These costs include ARO revisions, potential asset modifications, including investments in environmental control equipment, premature retirement or reduced operations, and increased public reporting requirements. See “Item 1. Business—Legal, Regulatory, and Environmental Matters—Environmental Regulation” and Note 12 to the Annual Financial Statements for additional information. Furthermore, any new legislation or regulatory programs could also increase the cost of electricity production or make certain units unavailable or restricted, overall reducing the amount of reliable and affordable power available to meet our nation’s growing electricity demand.
For example, compliance with the recently revised EPA MATS Rule will require either investment in additional control equipment at Colstrip or retirement of the plant by 2027. We and the other Colstrip co-owners have not yet determined whether to install the equipment necessary to comply with the new EPA MATS Rule; meanwhile, we and others are actively challenging the EPA MATS Rule in ongoing litigation as well as advocating for changes administratively. Furthermore, if we and our co-owners elect to install additional control equipment at Colstrip, the recently revised EPA GHG Rule could still force the plant to retire by 2032, before the costs of installing the equipment can be recovered. We operate an aging fossil fuel fleet and many of our facilities require periodic maintenance and repair. If we significantly modify a unit such that regulated pollutants are increased beyond thresholds set by the EPA pursuant to New Source Review guidelines promulgated under the Clean Air Act, we may be required to install the best available control technology or to achieve the lowest achievable emission rates, which would likely result in substantial additional capital expenditures or premature retirement. However, the EPA MATS, GHG, CCR, and ELG Rules are currently subject to ongoing litigation. As a result, future implementation and enforcement of these rules remains uncertain. To the extent that new or amended laws or regulations further restrict emissions from the combustion of coal, natural gas, or oil, such requirements could result in further capital expenditures or premature retirements.
Existing and emerging legal and regulatory requirements related to coal-fired generation operations and CCR could adversely affect our business.
In accordance with the relevant legal and regulatory requirements, we perform certain activities to manage large quantities of CCR material resulting from decades of coal-fired electric generation. In particular, Talen Montana and Brunner Island have significant decommissioning and environmental remediation liabilities, primarily consisting of remediation, closure, and decommissioning costs for coal ash impoundments. Where applicable, across the fleet, we carry the expected cost of the known CCR and associated wastewater obligations within our ARO liabilities. Actual cash expenditures associated with these AROs are expected to materially increase over the next five years due to recent regulatory changes unless the rules do not withstand legal challenges or are rescinded by the Trump administration. These potential increases would be somewhat offset by ongoing remediation, closure, and decommissioning activities, which will reduce ARO liabilities as scopes are completed. See Note 12 to the Annual Financial Statements for additional information. Future adjustments to our coal ash ARO estimates may be required due to evolving regulatory programs and associated remediation requirements under federal rules and state obligations, which could have an adverse effect on our business. If the assumptions underlying these ARO estimates do not materialize as expected, actual cash expenditures and costs could be materially different. See Note 11 to the Annual Financial Statements for additional information on AROs.
In addition, the EPA recently finalized standards under the EPA GHG Rule for new and certain existing power plants. These regulations primarily affect baseload units in the national power fleet, including our coal-fired generation facilities that have not set near-term retirement dates (e.g., Colstrip). More stringent limits on carbon dioxide and other GHG emissions and carbon taxes could be implemented or expanded at the state or regional levels. Recently, certain state legislatures have considered bills that could materially affect our ability to operate our coal-fueled generation facilities. Furthermore, other recent EPA rules (e.g., the EPA MATS, CCR, and ELG Rules) could have a significant impact on our business as discussed herein. Each of these rules are currently subject to ongoing legal challenges. In addition, in January 2025, President Trump issued an executive order directing the heads of all federal agencies to identify and begin the processes to suspend, revise, or rescind all agency actions, including existing regulations, that are unduly burdensome on the identification, development, or use of domestic energy resources. Consequently, future implementation and enforcement of these rules remains uncertain at this time.
Our ownership and operation of a nuclear power facility subjects us to regulations, costs, and liabilities uniquely associated with these types of facilities.
Under the Atomic Energy Act, our operation and 90 ownership of Susquehanna are subject to regulation by the NRC, including requirements pertaining to, among other matters: licensing, inspection, and enforcement; testing, evaluation, and modification of all aspects of nuclear reactor power generation facility design and operation; environmental and safety performance; handling and storage of SNF; technical and financial qualifications; decommissioning funding assurance; and transfer and foreign ownership restrictions. The NRC may modify, suspend, or revoke operating licenses and impose civil or criminal penalties for failure to comply with the Atomic Energy Act or the terms of nuclear operating licenses. The current facility operating licenses for our two units at Susquehanna expire in 2042 and 2044.
The NRC could temporarily or permanently shut down Susquehanna, require it to modify its operations, or refuse to permit a unit to restart after any planned or unplanned outage. See also “—Commercial and Operational Risks—We may experience unplanned interruptions or periods of reduced output, which could result in lower energy margin, lost opportunities, monetary penalties, contractual damages, and (or) other losses.” As a result of any shutdown or forced outage, we may also face substantial costs related to the storage and disposal of radioactive materials and SNF. In addition, Susquehanna will be obligated to continue storing SNF if the Department of Energy continues to fail to meet its contractual obligations under the Nuclear Waste Policy Act of 1982 to accept and dispose of Susquehanna’s SNF. See Note 12 to the Annual Financial Statements for additional information on this obligation. NRC regulations also require us to demonstrate reasonable assurance that certain funds will be available to decommission each nuclear generation facility at the end of its life. There are uncertainties with respect to certain technological and financial aspects of decommissioning these facilities, and related costs may exceed the amounts available from the NDT funds. See Note 9 to the Annual Financial Statements for additional information on the NDT.
In addition, new or amended NRC safety and regulatory requirements may give rise to additional operation and maintenance costs and capital expenditures, and aging equipment may require more capital expenditures to keep Susquehanna operating efficiently. Any unexpected failure, including failure associated with breakdowns or any unanticipated capital expenditures, could result in reduced profitability. Costs associated with these risks could be substantial. See also “—Commercial and Operational Risks—Our ownership and operation of Susquehanna subjects us to substantial risks associated with nuclear generation.”
While Susquehanna maintains property and liability insurance and is subject to NRC insurance requirements and the Price-Anderson Act scheme, there may be limitations on the amounts and types of insurance commercially available to us or we may have insufficient coverage with respect to any losses. See Note 12 to the Annual Financial Statements for additional information on nuclear insurance. Uninsured losses and other liabilities and expenses resulting from an incident at Susquehanna, to the extent not recovered from insurers or the nuclear industry, could be borne by us. See also “—Industry and Market Risks—Operation of power generation facilities involves significant risks and hazards customary to the power industry, which we cannot assure our insurance will be adequate to cover.” Additionally, an accident or other significant event at a nuclear facility within the United States or abroad, whether owned by us or others, could result in increased regulation and reduced public support for nuclear-fueled energy. If an incident did occur at Susquehanna, any resulting operational loss, damages, and injuries would likely have a material adverse effect on our business.
We may be affected by changes in applicable laws and regulations.
Our business is subject to various laws and regulations administered by federal, state, and local governmental agencies. Changes in laws and regulations occur frequently, and sometimes dramatically, as a result of political, economic, or social events or in response to other significant events, and changes in state laws and regulations could be even less predictable, occur more rapidly, or have a more drastic effect than changes at the federal level. For example, economic downturns, periods of high energy supply costs, and other factors can lead to changes in, or the development of, legislative and regulatory policies designed to promote reductions in energy consumption, increased energy efficiency, renewable energy, and self-generation by customers. In addition, extreme weather events have resulted, and in the future may result, in governmental investigations and changes in applicable laws and regulations, reliability requirements, and market rules, including efforts to reform PJM. In the future, we are likely to face additional severe weather events, which are inherently unpredictable in nature, location, scope, and timing, and which may give rise to investigations or other efforts to determine the causes or consequences of such events. Any change in the legal and regulatory landscape for any reason (including but not limited to changes in administration or political climate, energy regulation and policy, environmental and permitting requirements and processes, employee healthcare and benefits obligations, health and safety standards, accounting standards, tax regulations and requirements, and competition laws) could impact our operations, competitive position, or outlook. See “Item 1. Business—Legal, Regulatory, and Environmental Matters—Environmental Regulation” and Note 12 to the Annual Financial Statements for additional information on new water, waste, air, and climate rules recently finalized by the EPA.
The availability and cost of emission allowances could negatively impact our operating costs.
We are required to maintain, through either allocations or purchases, sufficient emission allowances for sulfur dioxide, nitrogen oxide, and carbon dioxide to support the operation of our power generation facilities. These allowances are used to meet the obligations imposed on us by various applicable environmental laws and regulations. Given the historical correlation between rising natural gas prices and increasing prices for wholesale electricity, we may idle our units less as natural gas prices increase, resulting in increased emissions. If our operational needs require more than our allocated or otherwise acquired allowances, we may be forced to purchase additional allowances on the open market, which could be costly, if available at all. If we are unable to maintain sufficient emission allowances to match our operational needs, we may be required to curtail our operations or install costly new emission controls. In addition, laws and regulations governing emission allowance programs are changing and could continue to change in the future, which could have a negative impact on available allowances, our ability to purchase allowances, or the price of additional allowances. See Note 12 to the Annual Financial Statements for additional information on the EPA CSAPR and nitrogen oxides requirements.
Changes in tax law (including any elimination of the Nuclear PTC), the implementation regulations of certain tax provisions, adverse decisions by tax authorities, or the imposition of tariffs may adversely affect our business.
The laws and rules pertaining to U.S. federal, state, and local income taxation are routinely being reviewed and modified by governmental bodies, officials, and regulatory agencies, including the Internal Revenue Service (“IRS”) and the U.S. Treasury Department. It cannot be predicted whether, when, in what form, or with what effective dates tax laws, regulations, and rulings may be enacted, promulgated, or issued, which could result in changes in the estimated values of recorded deferred tax assets and liabilities and future income tax assets and liabilities and an increase in our effective tax rate and tax liability. For example, the Inflation Reduction Act was signed into law in August 2022. Among the Inflation Reduction Act’s provisions are changes to the U.S. corporate income tax system, including a one percent excise tax on certain repurchases of stock (and economically similar transactions) after December 31, 2022. The Inflation Reduction Act also includes amendments to the Internal Revenue Code of 1986, as amended (the “Code”), to create a nuclear production tax credit program. While electricity produced and sold by Susquehanna through December 31, 2032 may qualify for the Nuclear PTC, which is subject to potential adjustments, these provisions are subject to implementation regulations, the terms of which are not yet fully known. Accordingly, we cannot fully predict the impacts that any such tax credits may have on our liquidity or results of operations. Additional guidance expected to be issued from the U.S. Treasury and IRS may impact the credit value recognized, and any elimination of the Nuclear PTC may adversely affect our business and financial condition. See Note 2 to the Annual Financial Statements for our accounting policy related to Nuclear PTC and Note 6 to the Annual Financial Statements for Nuclear PTC revenue recognized. Additionally, the imposition of new tariffs by government authorities or the increase of existing tariffs could materially increase the prices we pay for fuel, materials, supplies, equipment, parts, and (or) other critical products that are integral to our operations.
Our tax reporting is subject to audit by tax authorities. We may enter into transactions and arrangements in the ordinary course of business in which the tax treatment is not entirely certain. We must therefore make estimates and judgments in determining our consolidated tax provisions and accruals. The final outcome of any audits by tax authorities may differ from estimates and assumptions used in determining our consolidated tax provisions and accruals, and the resolution of tax assessments or audits by tax authorities could impact our results of operations. This could result in a material and adverse effect on our consolidated income tax provision, financial position, and net income/loss for the period for which such determinations are made.
Our ability to utilize our tax attributes, including net operating loss carryforwards, remaining following Emergence, if any, may be limited.
As of December 31, 2024, we had 0.8 billion of U.S. federal net operating loss carryforwards and 1.4 billion of disallowed business interest expense carryforwards under Section 163(j) of the Code and certain other tax attributes (including significant tax basis in assets). Because the consummation of the Plan of Reorganization resulted in an ownership change for purposes of Sections 382 and 383 of the Code, our ability to utilize any remaining tax attributes after reduction and disallowed business interest expense carryforwards is subject to limitation under Sections 382 and 383 of the Code. As a result, certain of our tax attributes have been substantially reduced, eliminated, or otherwise restricted.
We are subject to the risk of litigation and similar legal proceedings.
We are, and in the future may be, subject to litigation or similar legal proceedings arising out of our business and operations. Damages or other remedies sought under such proceedings may be financially or operationally material, and a negative outcome could materially adversely impact our business, operations, and financial condition. While we will assess the merits of any legal proceedings and defend such matters accordingly, we may be required to incur significant expense and (or) devote significant management attention to such defenses. In addition, the adverse publicity surrounding such claims may negatively impact our business and reputation. Our insurance may not adequately cover losses for damages claimed against us, and we do not have insurance coverage for all litigation risks. See Note 12 to the Annual Financial Statements for additional information on our legal matters.
Financial and Equity Risks
We may not have sufficient access to financing for our business.
Our primary liquidity requirements, in addition to our ordinary course operating expenses, are for debt service, capital expenditures, and collateral for our commercial program and AROs. If our liquidity sources are not sufficient to fund our current or future needs, we may be required to take other actions, including refinancing, restructuring, or reorganizing all or a portion of our debt or capital structure, reducing or delaying capital investments, or obtaining alternative financing, which could result in a higher cost of capital and (or) require additional security, collateral, or other conditions. Our ability to raise capital and access liquidity is subject to numerous factors, including conditions in the capital markets, our current operations, credit ratings, and other events which we may not be able to predict or control. Furthermore, our ability to raise financing may be affected by current geopolitical-social views and investor expectations regarding fossil fuels and environmental matters, which have prompted unfavorable lending policies toward fossil fuel-fired generation facilities, guidelines preventing investors from increasing or taking new stakes in companies with exposure to fossil fuels, and divestment efforts affecting the investment community, all of which could negatively impact the demand for investments in our business. Applicable regulations could also impose additional requirements that may increase the costs of conducting our business or accessing sources of capital and liquidity. There can be no assurance that we will be able to obtain financing on commercially reasonable terms or at all, in compliance with the terms of our existing indebtedness, and (or) in a manner that does not negatively impact our business or that such actions, even if achieved, would allow us to meet our financial obligations and operating requirements.
Our historical financial information may not be indicative of our future financial performance.
Our capital structure was significantly altered in the Restructuring. Upon Emergence, we adopted fresh start accounting, which required us to adjust our assets and liabilities to fair value and restate our accumulated deficit to zero. We also adopted accounting policy changes that could result in material changes to our financial reporting and results. Accordingly, our financial condition and results of operations in Successor periods following the Restructuring are not comparable to our financial condition and results of operations in Predecessor periods prior to the Restructuring. See Notes 2 and 4 to the Audited Financial Statements for additional information on accounting policies and fresh start accounting.
The amount and terms of our indebtedness could adversely affect our financial condition and impair our ability to operate our business.
Our indebtedness could have important consequences to our future financial condition, operating results, and business, including: requiring that a substantial portion of our cash flows from operations be dedicated to payments on our indebtedness instead of operations, capital expenditures, future business opportunities, or other purposes; limiting our ability to obtain additional debt or equity financing for working capital, capital expenditures, debt service requirements, acquisitions, and general corporate or other purposes; increasing our cost of borrowing; and (or) limiting our ability to adjust to changing market and economic conditions and to carry out capital spending that is important to our business.
Our borrowings under the Credit Facilities incur interest at variable interest rates that expose us to interest rate risk. If interest rates increase, our debt service requirements would increase even though the amount borrowed remains the same. Furthermore, although the agreements governing our current indebtedness contain restrictions on the incurrence of additional indebtedness, these restrictions are subject to a number of qualifications and exceptions, and any additional indebtedness incurred in compliance with these restrictions could be substantial. If the principal or interest of our indebtedness were to increase, our ability to meet our debt service, operational, and other financial requirements may be adversely impacted. See also “Item 7. Management’s Discussion and Analysis of Financial Condition and Results of Operations—Liquidity and Capital Resources.”
In addition, the agreements governing our indebtedness contain covenants that limit our ability to, among other things: incur additional debt and liens; redeem and (or) prepay certain debt; pay dividends or repurchase stock; make certain investments; consolidate, merge, lease, or transfer all or substantially all of our assets; and enter into transactions with affiliates. These restrictions could harm our business by, among other things, limiting our ability to obtain other financing, to operate our business, and (or) to take advantage of mergers, acquisitions, or other corporate opportunities. Furthermore, various risks, uncertainties, and events beyond our control could affect our ability to comply with these covenants which could, among other things, result in events of default/cross-default under these agreements and permit lenders to accelerate amounts due and foreclose upon collateral. Any of these events could adversely affect our financial condition and results of operations and (or) cause us to become bankrupt or insolvent.
TEC is a holding company; its ability to obtain funds from its subsidiaries is structurally subordinated to existing and future liabilities and preferred equity of its subsidiaries, and the agreements governing TES’s indebtedness contain certain restrictions on distributions to TEC.
TEC is a holding company that does not (and does not intend to) conduct any business operations or incur material obligations of its own. While we do not expect TEC to incur obligations that it is unable to meet due to contractual restrictions on distributions from subsidiaries, certain subsidiaries are subject to such limitations. TEC’s cash flows are largely dependent on the operating cash flows of TES and TEC’s other subsidiaries and the payment of such operating cash flows to TEC in the form of dividends, distributions, loans, or otherwise. These subsidiaries are separate and distinct legal entities from TEC and have no obligation (other than any existing contractual obligations) to provide TEC with funds to satisfy its obligations. Any decision by a subsidiary to provide TEC with funds to satisfy its obligations will depend on, among other things, that subsidiary’s results of operations, financial condition, cash flows, cash requirements, contractual and other restrictions, applicable law, and other factors. The deterioration of income from, or other available assets of, any such subsidiary for any reason could limit or impair its ability to pay dividends or make other distributions to TEC.
Furthermore, the agreements governing TES’s indebtedness restrict the ability of TES and the Subsidiary Guarantors to pay dividends or distributions or otherwise transfer assets to TEC, subject to certain exceptions. Notable exceptions include the ability to pay dividends or distributions: (1) in an amount not to exceed the greater of 420 million and 40 of TES’s consolidated adjusted EBITDA, (2) in an unlimited amount so long as TES’s pro forma consolidated total net leverage ratio is less than or equal to 2.5 to 1.0, and (3) in an amount not to exceed the sum of: (a) the greater of 525 million and 50 of TES’s consolidated adjusted EBITDA, (b) TES’s consolidated adjusted EBITDA minus 140 of TES’s consolidated interest expense, in each case, for the period beginning June 1, 2023 (subject to compliance with either (x) a pro forma consolidated total net leverage ratio of less than or equal to 3.75 to 1.0 or (y) a fixed charge coverage ratio greater than or equal to 2.0 to 1.0), (c) equity contributions to TES, and (d) other customary “builder basket” components. See also “—The amount and terms of our indebtedness could adversely affect our financial condition and impair our ability to operate our business.”
We may not pay any dividends on our common stock in the future.
Any determination to pay dividends to holders of our common stock in the future will be at the sole discretion of the Board of Directors and will depend upon many factors, including our historical and anticipated financial condition, cash flows, liquidity, and results of operations; our capital requirements; market conditions; our growth strategy and the availability of growth opportunities; our level of indebtedness, contractual provisions, and other restrictions on our payment of dividends (including those imposed by the agreements governing our indebtedness); applicable law; and other factors that the Board of Directors deems relevant. See also “—TEC is a holding company; its ability to obtain funds from its subsidiaries is structurally subordinated to existing and future liabilities and preferred equity of its subsidiaries, and the agreements governing TES’s indebtedness contain certain restrictions on distributions to TEC.”
A number of factors could adversely affect the market price or trading volume of our common stock, even if our business is doing well, including but not limited to substantial sales of our common stock by existing stockholders, future issuances of equity or debt securities by us, and (or) research or reports published by financial analysts.
Sales of a substantial number of shares of our common stock in the public market could occur at any time. If at any time there are more shares of our common stock offered for sale than buyers are willing to purchase, then the market price of our common stock may decline, which could both affect our stockholders and also impair our ability to obtain capital (especially equity capital). Substantial sales of our common stock in the public market, or merely the market perception that large stockholders intend to sell shares (particularly with respect to our affiliates, directors, executive officers, or other insiders), could depress the market price or trading volume of our common stock. We currently expect a significant number of shares of our common stock to be issued in May 2025 and May 2026 upon the vesting of certain existing awards under equity compensation plans, and those shares will become unrestricted in May 2026. We may also issue additional shares under future grants of equity compensation awards, to raise capital, or in connection with future potential corporate alliances or acquisitions.
In the future, we may attempt to obtain financing or increase capital by issuing additional shares of our common stock or by offering debt or other equity securities. The issuance of equity securities or securities convertible into equity may dilute the value of our existing stockholders’ equity. Convertible securities could also be subject to conversion ratio adjustments pursuant to which certain events may increase the ultimate number of issuable equity securities. Any debt financing could involve covenants limiting our financial, operational, and strategic flexibility, make it more difficult for us to obtain additional capital, and (or) result in additional financial obligations to which our stockholders are structurally subordinated.
In addition, the trading market for our common stock is affected by information that industry and financial analysts publish about our business. If analysts cease coverage of us, or if they publish unfavorable or inaccurate information about us, the market price and trading volume of our common stock could be negatively impacted. There are many large, active companies established in our industry, and we could receive less favorable or widespread coverage than our competitors. If one or more analysts cease coverage of us, our common stock may lose visibility in the market. Furthermore, if one or more analysts downgrades their evaluations of our business, common stock, or indebtedness, the price of our common stock could decline. There can be no assurance that analysts will continue to cover our business or that any such coverage will be favorable or accurate.
Stockholders may have a limited ability to influence our business and affairs due to a number of factors.
The three largest TEC stockholders collectively own approximately 30 of our outstanding common stock. Large holders such as these may be able to significantly affect matters requiring approval by our stockholders, including but not limited to the election of directors and the approval of mergers or other business combination transactions. Furthermore, we are a Delaware corporation and the anti-takeover provisions of the Delaware General Corporation Law may discourage, delay, or prevent a change in control by prohibiting us from engaging in a business combination with an interested stockholder for a period of three years after the person becomes an interested stockholder, even if a change in control would be beneficial to our existing stockholders.
Additionally, our organizational documents contain provisions that could act to discourage, delay, or prevent a change in control or change of management of TEC that stockholders may deem advantageous. These provisions, among other things: authorize the Board of Directors to issue “blank check” preferred stock; require prior written consent of the Board of Directors for certain transfers (except for secondary market purchases) that would result in 10% or greater ownership of our outstanding voting securities; prohibit stockholder action by written consent unless signed by holders having at least the minimum voting power of all outstanding shares entitled to vote thereon; permit the Board of Directors to establish its number of members; eliminate the ability of stockholders to fill vacancies on the Board of Directors; authorize the Board of Directors to make, amend, or repeal our Bylaws; require advance notice for director nominations and other stockholder annual meeting proposals; and designate the Delaware Court of Chancery as the exclusive forum for certain types of stockholder actions. See the Description of Capital Stock included as Exhibit 4.1 to this Report for additional information.
All of these factors could significantly limit the ability of certain stockholders to influence our business and affairs and, in turn, depress the market price of our common stock, including through the influence of larger stockholders, discouraging proxy contests, and making it more difficult to elect directors or cause us to take other corporate actions. These factors could also make it more difficult for a third party to acquire us (even if considered beneficial by many of our stockholders) and, as a result, our stockholders may have a more limited ability to obtain a premium for their shares of common stock.
The requirements of being a public company may require significant resources, and we may be unable to comply with these requirements in a timely or cost-effective manner.
As a newly public company, we are or will be required to comply with additional laws, regulations, and requirements, including but not limited to applicable SEC rules and regulations, certain provisions of the Sarbanes-Oxley Act of 2002 (the “Sarbanes-Oxley Act”), and Nasdaq rules and requirements. These requirements cover a wide variety of topics including many aspects of disclosure, financial reporting, internal controls, and corporate governance, among others. Complying with these laws, regulations, and requirements will occupy a significant amount of our time and may strain our resources, increase our costs, and distract management, all of which may inhibit our ability to comply with these requirements in a timely or cost-effective manner.
In particular, the internal controls and procedures required for public company financial reporting under Section 404 of the Sarbanes-Oxley Act are significantly more stringent than those required for a private company. Fully implementing our internal control framework and testing will require significant resources, and management may not be able to timely and effectively implement the necessary controls and procedures. At any time, we may conclude that our internal controls, once tested, are not operating as designed or do not address all relevant financial reporting risks. In addition, once required to attest to control effectiveness, our independent registered public accounting firm may issue a report concluding that our internal controls over financial reporting are not effective. If we identify material weaknesses in the future or otherwise fail to implement or maintain effective internal controls over financial reporting, we may not be able to accurately or timely comply with our financial reporting obligations, which may subject us to adverse regulatory consequences, negatively affect our business, harm investor confidence, and (or) reduce the market price of our common stock.
ITEM 1B. UNRESOLVED STAFF COMMENTS
None.
ITEM 1C. CYBERSECURITY
We maintain policies and controls designed to identify, assess, manage, mitigate, protect against, and respond to cybersecurity threats. Our cybersecurity risk management strategy is established by management and is implemented by our IT professionals and the business units in which potential threats may occur. The Audit Committee of our Board of Directors (the “Audit Committee”) has primary responsibility for overseeing management’s strategy related to mitigating risk associated with cybersecurity threats. We maintain: (i) business continuity and disaster recovery plans that are expected to be deployed in response to a significant cyberattack; (ii) cyber incident response plans; and (iii) cybersecurity insurance that, subject to policy coverage and limitations, protects against financial harm to the Company caused by material cybersecurity events. While we believe our cybersecurity risk management strategy is appropriate for our current business, no strategy can fully protect against all possible adverse events. See “Item 1A. Risk Factors—Industry and Market Risks—Our business could be adversely affected by events outside of our control, including armed conflicts, war, terrorist attacks or threats, pandemics, natural disasters, cyber-based attacks, or other significant events.”
Cybersecurity and Risk Mitigation
Our cybersecurity policies are guided by standards or recommendations issued by, among others, the National Institute of Standards and Technology, the International Organization for Standardization, the NRC, and NERC. We deploy, configure, and maintain technologies and procedures designed to enforce security policies, detect and protect against cybersecurity threats, and help safeguard our material assets.
Our digital and cybersecurity controls are augmented with physical controls such as security systems, security site plans, security systems monitoring, and access control to mitigate physical security risks at our facilities. Our procurement policies and organizational controls require certain vendors to be assessed and vetted, with enhanced protocols on purchases and installations involving nuclear equipment. Additionally, cybersecurity reviews are performed on critical intellectual property vendors. Additionally, where warranted, we request a detailed cybersecurity questionnaire from our vendors to assess the vendor's practices and preparedness in addressing cyber threats.
Through a multi-functional coordinated effort, we assess and mitigate cybersecurity risks across our business units based on likelihood of the risk and potential impact to the business unit, the Company, and our stakeholders. These risks are identified using tactical, operational, and compliance-based approaches. Risks and associated consequences, should they materialize, are evaluated using likelihood of occurrence considering existing controls and technologies.
Our employees, as well as certain contractors, are required to complete cybersecurity awareness and training programs. Mandatory technical training is provided to employees and vendors performing, verifying, or managing cybersecurity activities. Mitigation efforts also include annual cyber crisis response simulations and annual training.
Third parties conduct periodic assessments on our cyber-related systems. To measure our non-nuclear cybersecurity framework maturity, we utilize internal and external audits and assessments, vulnerability testing, and governance processes. Our nuclear cybersecurity program is inspected biennially by the NRC and assessed annually by a quality assurance audit. Nuclear vulnerability management is implemented in collaboration with Department of Homeland Security and the Cybersecurity and Infrastructure Security Agency.
We have cyber incident response plans to manage significant cybersecurity incidents across different aspects of our operations. Cybersecurity incidents are escalated based on significance to our Chief Administrative Officer, Chief Nuclear Officer, Chief Fossil Officer, General Counsel, Chief Financial Officer, Chief Executive Officer, Audit Committee, and (or) Board of Directors.
Cybersecurity Governance
The Audit Committee oversees our cybersecurity risk exposures and the steps taken by management to monitor and mitigate cybersecurity risks. Periodic reports are given by senior management to the Audit Committee about material cyber events and our risk mitigation efforts.
Our senior executive team is responsible for the coordination of cybersecurity across the Company. Our cybersecurity teams, which include employees with appropriate professional certifications, are responsible for assessing and managing our cyber risk management protocols in their respective areas. These activities include the prevention, detection, mitigation, and remediation of material cybersecurity incidents as well as communicating risk management matters to key stakeholders. The cybersecurity teams have experience selecting, deploying, and operating cybersecurity technologies, initiatives, and processes, and rely on threat intelligence as well as other information obtained from governmental, public, or private sources. In coordination with our senior management, the relevant cybersecurity teams review risk management strategies to mitigate cybersecurity risks. Additionally, as needed, we engage specialists, consultants, auditors, and (or) other third parties to assist with assessing, identifying, and managing cybersecurity risks.
While cybersecurity incidents have not materially affected the Company or our business strategy, results of operations, or financial condition to date, no assurance can be provided that we will not be subject to a significant cybersecurity incident in the future. See “Item 1A. Risk Factors—Industry and Market Risks—Our business could be adversely affected by events outside of our control, including armed conflicts, war, terrorist attacks or threats, pandemics, natural disasters, cyber-based attacks, or other significant events.” for additional information on our cybersecurity risks.
ITEM 2. PROPERTIES
GENERATION FLEET AS OF DECEMBER 31, 2024
| | | | | | | | | | | | | | | | | | | | | | | | | | | | | | | | | | | | | | |
| Generation Facility | | MW Capacity (a) | | Percentage Ownership | | MW Ownership | | Fuel Type | | Plant Type | | State |
| PJM | | | | | | | | | | | | |
Susquehanna (b) | | 2,476 | | | 90 | % | | 2,228 | | | Nuclear | | Baseload | | PA |
| Martins Creek | | 1,705 | | | 100 | % | | 1,705 | | | Natural Gas/Oil | | Peaker | | PA |
| Montour | | 1,528 | | | 100 | % | | 1,528 | | | Natural Gas | | Peaker | | PA |
Brunner Island (c) (d) | | 1,429 | | | 100 | % | | 1,429 | | | Coal/Natural Gas | | Intermediate | | PA |
Brandon Shores (e) | | 1,289 | | | 100 | % | | 1,289 | | | Coal | | Peaker | | MD |
H.A. Wagner (e) | | 843 | | | 100 | % | | 843 | | | Natural Gas/Oil | | Peaker | | MD |
| Lower Mt. Bethel | | 608 | | | 100 | % | | 608 | | | Natural Gas | | Baseload | | PA |
Conemaugh (b) (d) | | 1,736 | | | 22.22 | % | | 386 | | | Coal | | Intermediate | | PA |
Keystone (b) (d) | | 1,724 | | | 12.34 | % | | 213 | | | Coal | | Intermediate | | PA |
| Camden | | 145 | | | 100 | % | | 145 | | | Natural Gas | | Peaker | | NJ |
| Total | | 13,483 | | | | | 10,374 | | | | | | | |
| | | | | | | | | | | | |
| Other Power Markets | | | | | | | | | | | | |
| WECC | | | | | | | | | | | | |
Colstrip Unit 3 (b) | | 740 | | | 30 | % | | 222 | | | Coal | | Baseload | | MT |
| ISO-NE | | | | | | | | | | | | |
| Dartmouth | | 80 | | | 100 | % | | 80 | | | Natural Gas/Oil | | Peaker | | MA |
| Total | | 820 | | | | | 302 | | | | | | | |
| | | | | | | | | | | | |
| Generation Fleet | | 14,303 | | | | | 10,676 | | | | | | | |
__________________
(a)Generation capacity (summer rating) is based on factors, among others, such as operating experience and physical conditions, which may be subject to revision.
(b)See Note 10 to the Annual Financial Statements for additional information on jointly owned facilities.
(c)Coal-fired electric generation is restricted during the EPA Ozone Season, which is May 1 to September 30 of each year.
(d)Coal-fired electric generation is required to cease at Brunner Island, Keystone, and Conemaugh by December 2028.
(e)See Note 10 to the Annual Financial Statements for additional information on the Brandon Shores and H.A. Wagner deactivations and RMR proceedings.
ITEM 3. LEGAL PROCEEDINGS
Susquehanna ISA Amendment. Under a prior, FERC-accepted ISA between PJM, Susquehanna, and a subsidiary of PPL Corporation (“PPL”) (collectively, the “ISA Parties”), Susquehanna is permitted to decrease by up to 300 MW the amount of power supply that it would otherwise provide to the power grid within PPL’s service area. Susquehanna currently provides that power to load via load-owned transmission directly connected to Susquehanna rather than supplying load from the power grid. In June 2024, PJM filed at FERC an Amended Interconnection Service Agreement (the “Susquehanna ISA Amendment”) executed between the ISA Parties permitting Susquehanna to decrease by up to 480 MW the amount of power supply that it would otherwise provide to the power grid and now intends to sell to AWS instead. PJM previously concluded such increase in the amount of withheld power would have no reliability impacts on the grid. In June 2024, despite the Susquehanna ISA Amendment being applicable solely to the PPL service area, Exelon Corporation (“Exelon”) and AEP filed a protest to the Susquehanna ISA Amendment at FERC and raised generic issues involving the direct connection of load service to generators. FERC responded by issuing a deficiency letter in August 2024 seeking more information about the arrangement described in the Susquehanna ISA Amendment and separately setting a Technical Conference for November 2024 to discuss broader issues related to (i) co-located load connected directly to generation; and (ii) emerging reliability issues resulting from the dramatic rise in data center demand for power. In September 2024, PJM provided a response to FERC’s August 2024 deficiency letter on the Susquehanna ISA Amendment and filed a Construction Service Agreement between the ISA Parties and Mid-Atlantic Interstate Transmission, LLC to facilitate certain network upgrades to ultimately accommodate a 960 MW decrease of power supply to the grid. Talen filed its own comments in September 2024 and written testimony in the FERC Technical Conference proceeding in October 2024. Shortly after the conclusion of the FERC Technical Conference in November 2024, FERC issued a 2-1 decision rejecting the Susquehanna ISA Amendment and Talen filed a motion for a rehearing of the FERC order within the 30-day deadline for such motions. In December, FERC issued an order stating that it would address the request for rehearing in a future order, which FERC has not yet issued. Due to FERC’s decision not to address the merits of the motion for rehearing, Talen has filed an appeal in the U.S. Court of Appeals for the Fifth Circuit.
The prior FERC-accepted ISA between the ISA Parties permitting Susquehanna to decrease 300 MW of its current power supply from the power grid remains in place and facilitates the initial sale of power to AWS under the AWS PPA. Delivery “behind-the-meter” of more than 300 MW of power under the AWS PPA requires that FERC approve an amended ISA between Susquehanna, PPL, and PJM. Without an amendment we will be unable to deliver the full amount of contract volume under the AWS PPA on a behind-the-meter basis, which may require a contract renegotiation to deliver the additional power “in-front-of-the-meter.”
We are evaluating our commercial and legal options to provide the most efficient path to full development of the AWS Data Campus. Such options include, but are not limited to, potential submission of a revised form of Susquehanna ISA Amendment or alternative contract structures with AWS. If the Company is unable commercially or legally to resolve the Susquehanna ISA Amendment approval impediments and realize the full development of the AWS Data Campus, there may be a material impact on our future results of operations, and (or) financial condition.
Separate and apart from the Susquehanna ISA proceeding, there are three other pending proceedings before FERC that could shape policy around co-located load, and thus impact the result of the Susquehanna ISA proceeding. First, in August 2024, Exelon made a series of filings on behalf of each of its electric utility subsidiaries to amend portions of the PJM tariff that would clarify that co-located load arrangements must be categorized as either network load or point-to-point service (the “Exelon 205 proceeding”). In effect, the proposed amendments intended to clarify that co-located load arrangements would be treated as either needing network or point-to-point service, making them subject to the same transmission charges and fees for transmission-related services that would be applicable if the same load had located at other points on the PJM grid. Exelon requested a December 2, 2024 effective date, but in November 2024, FERC issued a deficiency letter stating that FERC required more information to make a determination. Second, in November 2024, FERC held a technical conference on co-located load to discuss, among other things, the impacts of various co-location agreements, whether and how large co-located loads receive wholesale market services or benefits from the transmission system, the cost and impact of back-up services for large co-located load and state regulatory and policy issues (the “Co-Location Technical Conference proceeding”). Following the technical conference, FERC requested comments be filed by December 9, 2024. Talen both participated in the technical conference and filed comments. Third, in November 2024, Constellation filed a complaint at FERC alleging that PJM’s tariff is unjust and unreasonable because it is silent on how to treat fully isolated co-located load (the “Constellation 206 proceeding”). The complaint suggests that FERC import into the tariff certain terms and conditions from a non-binding guidance document PJM shared with stakeholders or set the proceeding for settlement discussions on an expedited basis with a mediator.
On February 20, 2025, FERC denied relief in the Exelon 205 proceeding and initiated a new Section 206 proceeding directing PJM to show cause within 30 days why its tariff is just and reasonable in light of potential discrimination around the treatment of co-located load or, in the alternative, to propose changes to its tariff to address the treatment of co-located load (the “Co-Located Load PJM Tariff proceeding”). The order initiating the Co-Located Load PJM Tariff proceeding consolidated the records and proceedings from the Co-Location Technical Conference and Constellation 206 proceedings into the Co-Located Load PJM Tariff proceeding, which will all be considered together by FERC. The order also established a timeline for comments to PJM’s to-be filed showing or proposed tariff revisions (30 days after PJM’s filing) and a tentative timeline for FERC to rule on the matter in the second half of 2025. The Company intends to be an active participant in the PJM and FERC process to revise PJM’s tariff.
See Note 12 to the Annual Financial Statements for information about other material legal proceedings to which we are subject.
ITEM 4. MINE SAFETY DISCLOSURES
Not applicable.
PART II.
ITEM 5. MARKET FOR REGISTRANT’S COMMON EQUITY, RELATED STOCKHOLDER MATTERS AND ISSUER PURCHASES OF EQUITY SECURITIES
Market Information and Holders
TEC’s common stock trades on the Nasdaq Global Select Market under the ticker symbol “TLN.” As of February 27, 2025, there was one shareholder of record of our common stock. The number of beneficial owners is substantially greater than the number of shareholders of record because all of our common stock is held in “street name” by brokers, banks, and other nominees on behalf of beneficial owners.
Stock Performance Graph
The following performance graph compares cumulative total stockholder return on TEC’s common stock from July 10, 2024, the first day TEC’s common stock began trading on Nasdaq, through December 31, 2024 with the cumulative returns of the S&P 500 Stock Market Index and the S&P 500 Utilities Index over the same period. The performance graph assumes an initial investment of $100 and reinvestment of all dividends in our common stock and in each of the indices. The performance graph and related text are based on historical data and are not necessarily indicative of future performance.
| | | | | | | | | | | | | | |
| Value of Investment |
| | 7/10/2024 | | 12/31/2024 |
| TLN | | $ | 100.00 | | | $ | 158.02 | |
| S&P 500 | | 100.00 | | | 104.40 | |
| S&P Utility | | 100.00 | | | 109.11 | |
The information in this “Stock Performance Graph” section is being furnished solely pursuant to Item 201(e) of Regulation S-K and shall not be deemed “filed” for the purpose of Section 18 of the Exchange Act, or otherwise subject to the liabilities of that Section. Such information shall not be incorporated by reference into any registration statement or other filings with the SEC, whether made before or after the date hereof, regardless of any general incorporation language in such filing.
Dividends
The holders of shares of common stock are entitled to receive dividends and other distributions (payable in cash, property, or capital stock of the Company) when, as, and if declared thereon by the Board of Directors from time-to-time out of any assets or funds of the Company legally available for the payment of dividends and shall share equally on a per share basis in such dividends and distributions. Any future determination regarding the declaration and payment of dividends will be at the discretion of our Board of Directors and will depend on then-existing conditions, including our financial condition, results of operations, contractual restrictions, capital requirements, business prospects, and other factors our Board of Directors may deem relevant. In addition, our ability to pay dividends may be restricted by agreements governing TES’s indebtedness, which place certain limitations on TES’s ability to pay dividends to TEC, and by other agreements we may enter into in the future. See “Item 1A. Risk Factors—Financial and Equity Risks—TEC is a holding company; its ability to obtain funds from its subsidiaries is structurally subordinated to existing and future liabilities and preferred equity of its subsidiaries, and the agreements governing TES’s indebtedness contain certain restrictions on distributions to TEC.”
Issuer Purchases of Equity Securities
In October 2023, we announced that the Board of Directors approved the SRP, initially authorizing the Company to repurchase up to $300 million of TEC’s outstanding common stock through December 31, 2025. In May 2024, the Board of Directors approved an increase in the then-remaining SRP capacity to $1 billion through the end of 2025. In September 2024, the Board of Directors again approved an increase in the then-remaining SRP capacity to $1.25 billion through December 31, 2026. Repurchases under the SRP may be made from time-to-time, at the Company’s discretion, in open market transactions at prevailing market prices, in negotiated transactions, or by other means in accordance with federal securities laws, and may be repurchased pursuant to a Rule 10b5-1 trading plan. The Company intends to fund repurchases under the SRP from cash on hand. Repurchases will be subject to a number of factors, including the market price of TEC’s common stock, alternative uses of capital, general market and economic conditions, and applicable legal requirements, and the SRP may be suspended, modified, or discontinued by the Board of Directors at any time without prior notice. The Company has no obligation to repurchase any amount of its common stock under the SRP.
In December 2024, the Board of Directors approved the repurchase of 4893507 shares of common stock from affiliates of Rubric Capital Management LP for an aggregate purchase price of $1 billion. $850 million of such shares were purchased outside the SRP with the proceeds of indebtedness and the remaining $150 million were purchased under the SRP. See Note 18 to the Annual Financial Statements for additional information on the SRP and other share repurchases.
The following table contains information regarding our purchases of our common stock during each month of 2024:
| | | | | | | | | | | | | | | | | | | | | | | | | | |
| Monthly Period | | Total number of shares purchased (a) | | Average price paid per share (b) | | Total number of shares purchased as part of publicly announced plan (c) | | Approximate dollar value that may yet be purchased under the plan (d) |
| January | | 225,000 | | | $ | 63.17 | | | 225,000 | | | $ | 286 | |
| February | | — | | | — | | | — | | | 286 | |
| March | | 268,000 | | | 90.38 | | | 268,000 | | | 262 | |
| April | | — | | | — | | | — | | | 262 | |
| May | | — | | | — | | | — | | | 1,000 | |
| June | | 5,280,889 | | | 115.99 | | | 5,280,889 | | | 387 | |
| July | | 2,413,793 | | | 116.00 | | | 2,413,793 | | | 107 | |
| August | | — | | | — | | | — | | | 107 | |
| September | | 146,033 | | | 144.83 | | | 146,033 | | | 1,229 | |
| October | | — | | | — | | | — | | | 1,229 | |
| November | | — | | | — | | | — | | | 1,229 | |
| December | | 4,893,507 | | | 204.35 | | | 734,026 | | | 1,079 | |
| Total | | 13,227,222 | | | $ | 147.58 | | | 9,067,741 | | | $ | 1,079 | |
| | | | | | | | |
__________________
(a)Includes 9,067,741 shares repurchased through the SRP, which includes 5,275,862 shares repurchased in an equity tender offer and 3791879 shares repurchased in bilateral transactions under the SRP. Also includes 4159481 shares repurchased in a bilateral transaction outside of the SRP. See Note 18 to the Annual Financial Statements for additional information on these transactions.
(b)Excludes transaction costs and excise taxes.
(c)Represents shares repurchased under the SRP. See above for a description of the SRP.
(d)Dollars in millions.
ITEM 6. RESERVED
Not Applicable.
ITEM 7. MANAGEMENT’S DISCUSSION AND ANALYSIS OF FINANCIAL CONDITION AND RESULTS OF OPERATIONS
The following Management’s Discussion and Analysis of Financial Condition and Results of Operations should be read in conjunction with the Annual Financial Statements and the accompanying notes. The discussion contains forward-looking statements as well as estimates regarding market and industry data, which involve risks, uncertainties, and assumptions. See “Cautionary Note Regarding Forward-Looking Information” and “Market and Industry Data” for additional information. Dollars are in millions, unless otherwise noted.
Recent Developments
Common Stock Transactions
Share Repurchases. During the year ended December 31, 2024 (Successor), we repurchased and retired a total of 13,227,222 shares, or approximately 22%, of TEC’s outstanding common stock through a combination of the SRP and direct repurchases from affiliates of Rubric Capital Management LP (collectively, “Rubric”). A total of: (i) 7,307,300 shares were purchased from Rubric; (ii) 5,275,862 shares through a tender offer; and (iii) 644060 shares in the open market. The aggregate purchase price after transaction fees and excise tax was approximately $2.0 billion at a weighted average price of $149.50 per share. As of December 31, 2024 (Successor), the remaining capacity under the SRP is approximately $1.1 billion through 2026.
See Note 18 to the Annual Financial Statements for additional information on the SRP, other share repurchases, and other common stock transactions.
Financing Transactions
Secured Notes Consent. In January 2025, we received consents from noteholders representing a majority in principal amount of the Secured Notes to adopt certain amendments to the Indenture to, among other things: (i) modify certain provisions, including certain covenants and related definitions, in order to substantially conform to the corresponding amendments to the Credit Agreement obtained in the December 2024 transactions discussed below; and (ii) waive TES’s right to optionally redeem up to 10% of the Secured Notes at a price of 103% of par prior to June 1, 2025.
December 2024 Financing Activities. In December 2024, we completed several financing transactions that resulted in the: (i) issuance of 380 million in net additional long-term indebtedness through full repayment of the TLC utilizing restricted cash collateralizing the TLC and issuance of the TLB-2 (at an initial rate of SOFR + 2.5%); (ii) issuance of the new 900 million LCF and termination of the TLC LCF and Bilateral LCF, which had the combined effect of increasing our LC capacity by $355 million; and (iii) favorable repricing and covenant improvements on the existing TLB-1 and RCF (repriced to initial rates of SOFR + 2.5% and SOFR + 2.0%, respectively) as well an extension of the RCF maturity. The proceeds of the TLB-2 issuance were used, together with cash on hand, to repurchase shares of our outstanding common stock held by Rubric.
See Note 13 to the Annual Financial Statements for additional information on long-term debt, other credit facilities, and recent financing activities.
Power Transactions
AWS PPA. In connection with the AWS Data Campus Sale in 2024, we and AWS entered into the AWS PPA, pursuant to which we agreed to supply long-term, carbon-free power from Susquehanna to the AWS Data Campus through fixed-price power commitments. Under the AWS PPA, AWS has minimum contractual power commitments that increase in 120 MW increments annually (or earlier, at AWS’s option), with a one-time option to either cap commitments at 480 MW or otherwise purchase, in continuing annual steps, up to 960 MW. Each step up in capacity commitment has a fixed price for an initial 10-year term, after which AWS has the option to renew each step at a price that includes a fixed margin above then-applicable PJM energy and capacity prices. The initial term of the AWS PPA is 18 years, with two 10-year extensions at AWS’s option. Under a separate agreement, we will receive additional revenue from AWS related to the sales of carbon-free energy to the grid. We expect to begin receiving initial revenues from power sales in 2025. See Note 20 to the Annual Financial Statements for additional information on the AWS Data Campus Sale.
Susquehanna ISA Amendment. In November 2024, FERC issued an order denying the Susquehanna ISA Amendment between PJM, PPL Corporation, and Susquehanna that would permit Susquehanna to decrease the amount of power supply it would otherwise provide to the power grid. Such order does not have an impact on the existing ISA permitting 300 MW of co-located load at Susquehanna to supply power for the first phases of the AWS Data Campus. In December 2024, FERC issued an order stating that it would address our request for rehearing in a future order, which FERC has not yet issued. Due to FERC’s decision not to address the merits of our motion for rehearing, we have filed an appeal in the U.S. Court of Appeals for the Fifth Circuit. Delivery “behind-the-meter” of more than 300 MW of power under the AWS PPA requires that FERC approve an amended ISA between Susquehanna, PPL, and PJM. Without an amendment we will be unable to deliver the full amount of contract volume under the AWS PPA on a behind-the-meter basis, which may require a contract renegotiation to deliver the additional power “in-front-of-the-meter.” See “Item 3. Legal Proceedings” and “Item 1A. Risk Factors—Regulatory, Environmental, and Legal Risks—Our business is subject to extensive energy-related regulation and oversight.” for additional information on the Susquehanna ISA Amendment.
Brandon Shores and H.A Wagner RMR Arrangements. In 2023, we notified PJM of our intent to deactivate electric generation at both our Brandon Shores and H.A. Wagner facilities on June 1, 2025. However, PJM subsequently notified us that both Brandon Shores and H.A Wagner are needed past their previously planned retirement dates to maintain reliability in PJM. In January 2025, we reached a settlement (which remains subject to FERC approval) with key stakeholders on the terms of an RMR arrangement and filed with FERC the resulting Joint Offers of Settlement regarding both facilities’ RMR Continuing Operations Rates Schedules. If approved, the proposed RMR arrangements will extend the operating life of these plants through May 31, 2029, or until such time as the necessary transmission upgrades are placed into service. See Note 10 to the Annual Financial Statements for additional information on the RMR proceedings and settlement and the related impairment of the Brandon Shores asset group.
Factors Affecting Our Financial Condition and Results of Operations
Earnings in future periods are subject to various uncertainties and risks. See “Cautionary Note Regarding Forward-Looking Information,” “Item 1A. Risk Factors,” and Notes 5 and 12 to the Annual Financial Statements for additional information on our risks.
Commodity Markets
During 2024, natural gas prices for Texas Eastern M-3 settled below their ten-year average as a result of natural gas storage levels above the five-year average and abundant natural gas supplies. In PJM, periodic below average temperatures during the winter and above average temperatures during the summer contributed to increased load demand that resulted in higher annual settled on-peak power prices compared with the prior year.
The weighted average settled on-peak power prices and natural gas prices for the PJM market for the years ended December 31, 2024 (Successor), December 31, 2023 (Successor), and December 31, 2022 (Predecessor) were:
| | | | | | | | | | | | | | | | | | | | |
| | December 31, 2024 | | December 31, 2023 | | December 31, 2022 |
| PJM West Hub Day Ahead Peak - $/MWh | | $ | 40.91 | | | $ | 39.22 | | | $ | 83.59 | |
| PJM PPL Zone Day Ahead Peak - $/MWh | | 31.51 | | | 29.59 | | | 76.06 | |
| | | | | | |
| Texas Eastern M-3 - $/MMBtu | | 2.07 | | | 1.90 | | | 6.80 | |
As of December 31, 2024 (Successor), the weighted average forward market prices for the following years were:
| | | | | | | | | | | | | | |
| | 2025 | | 2026 |
| PJM West Hub ATC - $/MWh | | $ | 47.43 | | | $ | 51.16 | |
| Texas Eastern M-3 - $/MMBtu | | 3.45 | | | 3.73 | |
PJM West Hub ATC Spark Spreads - $/MWh (a) | | 23.25 | | | 25.07 | |
__________________
(a)Spark spreads are computed based on day-ahead West Hub ATC prices, TETCO M-3 natural gas prices, and a heat rate of 7 MMBtu/MWh.
As of December 31, 2023 (Successor), the weighted average forward market prices for the following years were:
| | | | | | | | | | | | | | | | | | | | |
| | 2024 (b) | | 2025 | | 2026 |
| PJM West Hub ATC - $/MWh | | $ | 41.51 | | | $ | 46.38 | | | $ | 48.98 | |
| Texas Eastern M-3 - $/MMBtu | | 2.36 | | | 3.10 | | | 3.42 | |
PJM West Hub ATC Spark Spreads - $/MWh (a) | | 24.97 | | | 24.68 | | | 25.02 | |
__________________
(a)Spark spreads are computed based on day-ahead West Hub ATC prices, TETCO M-3 natural gas prices, and a heat rate of 7 MMBtu/MWh.
(b)Represents forward prices for 2024 as of December 31, 2023 (Successor). See weighted average settled prices table above for 2024 realized prices.
Capacity Markets
Our generation capacity is located primarily in markets with capacity products, which are intended to ensure long-term grid reliability for customers by securing sufficient power supply resources to meet predicted future demand. Capacity prices are affected by supply and demand fundamentals, such as generation facility additions and retirements, capacity imports from and exports to adjacent markets, generation facility retrofit costs, non-performance risk premium penalties, demand response products, RTO/ISO demand forecasts, reserve margin targets, and (in PJM) adjustments to the PJM Market Seller Offer Cap as determined by the PJM Independent Market Monitor.
PJM Capacity Auctions. Under the PJM Reliability Pricing Model, when held on schedule, the PJM Base Residual Auction is required to be conducted in the month of May three years prior to the start of the applicable PJM Capacity Year in order for PJM to secure commitments from capacity resources. The results of each PJM BRA impact our capacity revenues for the specific PJM Capacity Year. However, PJM has delayed its recent BRAs, which has resulted in less than 3 years between each auction and the start of the relevant PJM Capacity Year. The BRA for the 2025/2026 Capacity Year, which was the most recent auction, was held in July 2024. The BRA for the 2026/2027 Capacity Year is currently delayed until July 2025. The capacity market construct provides generation owners some opportunity for revenue visibility on a multiyear basis and is intended to provide a price signal for new generation to be built in the future. See Note 12 to the Annual Financial Statements for additional information on the PJM capacity market, systemic risks, BRA delays, and related legal actions.
Capacity Prices. The following table displays the cleared capacity prices for completed PJM BRAs for the markets and zones in which we primarily operate:
| | | | | | | | | | | | | | | | | | | | | | | | | | | | |
| | 2025/2026 | | 2024/2025 | | 2023/2024 | | 2022/2023 | | |
PJM Capacity Performance ($/MW-day) (a) | | | | | | | | | | |
| MAAC | | $ | 269.92 | | | $ | 49.49 | | | $ | 49.49 | | | $ | 95.79 | | | |
| PPL | | 269.92 | | | 49.49 | | | 49.49 | | | 95.79 | | | |
| | | | | | | | | | |
| | | | | | | | | | |
| | | | | | | | | | |
| | | | | | | | | | |
__________________(a)Displayed prices are from the applicable market publications.
For the 2025/2026 Capacity Year, we cleared a total of 6,820 MW at a clearing price of $269.92 per MW-day for the MAAC, PPL, and PSEG locational deliverability areas.
Capacity Performance Event. As a result of Winter Storm Elliott in December 2022, PJM experienced extreme cold weather conditions that resulted in PJM’s declaration of a Capacity Performance event requiring generators to operate at their maximum output capacity. Certain of our generation facilities failed to meet PJM’s Capacity Performance requirements while others met or exceeded their obligations. As a result, we incurred final aggregate net Capacity Performance penalties of $29 million, which were remitted during the period from May 18 through December 31, 2023 (Successor) and the period from January 1 through May 17, 2023 (Predecessor). See Note 12 to the Annual Financial Statements for additional information.
Nuclear Production Tax Credit
The Inflation Reduction Act was signed into law in August 2022. Among the Act’s provisions are amendments to the Internal Revenue Code to create a nuclear production tax credit program. The Nuclear PTC program provides qualified nuclear power generation facilities with a transferable tax credit for electricity produced and sold to an unrelated party during each tax year. The credit provides support beginning when annual gross receipts decline below an equivalent 44/MWh, increases ratably up to $3/MWh when annual gross receipts are equivalent to 25/MWh, and is subject to potential adjustments including inflation escalators and a five-times increase in value (up to $15/MWh) for meeting prevailing wage requirements (which we expect to meet). Electricity produced and sold by Susquehanna to third parties from December 31, 2023 through December 31, 2032 will be eligible for the credit. See Notes 6 and 7 to the Annual Financial Statements for additional information on Nuclear PTC revenue recognized and the Inflation Reduction Act.
Seasonality/Scheduled Maintenance
The demand for and market prices of electricity and natural gas are affected considerably by weather and, as a result, our operating results may fluctuate significantly on a seasonal basis. In general, below-average temperatures in the winter and above-average temperatures in the summer tend to increase electricity demand, energy prices, and revenues. Alternatively, moderate temperatures tend to decrease electricity demand and may adversely affect resulting energy margins, particularly in PJM. In addition, our operating expenses typically fluctuate geographically on a seasonal basis, with peak power generation and expenses during the winter in the Mid-Atlantic. We ordinarily perform planned facility maintenance during milder non-peak demand periods in the spring and fall to ensure reliability during peak periods. The pattern of fluctuations in our operating results varies depending on the type and location of the facilities being serviced, the capacity markets served, the maintenance requirements of our facilities, and the terms of bilateral contracts to purchase or sell electricity. Our largest recurring maintenance project is the annual spring refueling outage at Susquehanna. We serve our fossil generation fleet through a combination of self-service and contracted maintenance activity (including long-term service agreements at certain facilities). See also “Item 1A. Risk Factors—Industry and Market Risks—Our business is subject to physical, market, economic, and regulatory risks relating to weather conditions and extreme weather events.”
Results of Operations
The results of operations presented below should be reviewed in conjunction with the Annual Financial Statements and the related notes. Our financial results for the year ended December 31, 2024 (Successor) and for the period from May 18 through December 31, 2023 (Successor) are referred to as the “Successor” periods. Our financial results for the period from January 1 through May 17, 2023 (Predecessor) and the year ended December 31, 2022 (Predecessor) are referred to as the “Predecessor” periods. The operating results for the Successor Periods are not comparable with the operating results for the Predecessor Periods due to the application of fresh start accounting after Emergence in May 2023. See Notes 2, 3, and 4 to the Annual Financial Statements for additional information regarding the Restructuring and related accounting. Our results of operations as reported in the Annual Financial Statements are prepared in accordance with GAAP.
In the explanations below, “Energy and other revenues” and “Fuel and energy purchases” are evaluated collectively because the price for power is generally determined by the variable operating cost of the next marginal generator dispatched to meet demand. “Energy and other revenues” relate to sales to an RTO or ISO, sales under wholesale bilateral contracts, realized hedging activity, Bitcoin revenue, and Nuclear PTC revenue. “Fuel and energy purchases” includes costs for fuel to generate electricity and settlements of financial and physical transactions related to fuel and energy purchases.
In addition, unrealized gains (losses) on derivative instruments resulting from changes in fair value during the periods are presented separately as revenues within “Operating Revenues” and expenses within “Energy Expenses” in the Annual Financial Statements. We evaluate them collectively because they represent the changes in fair value of our economic hedging activities.
Results for the Year Ended December 31, 2024 (Successor), the Period from May 18 through December 31, 2023 (Successor), the Period from January 1 through May 17, 2023 (Predecessor), and the Year Ended December 31, 2022 (Predecessor)
The following table and subsequent sections display the results of operations for the Successor and Predecessor periods:
| | | | | | | | | | | | | | | | | | | | | | | | | | | | | | | | | |
| | | | | | Successor | | | Predecessor |
| | | | | | Year Ended December 31, 2024 | | May 18 through December 31, 2023 | | | January 1 through May 17, 2023 | | Year Ended December 31, 2022 |
| Capacity revenues | | | | | | $ | 192 | | | $ | 133 | | | | $ | 108 | | | $ | 377 | |
| Energy and other revenues | | | | | | 1,881 | | | 1,156 | | | | 1,042 | | | 2,035 | |
| Unrealized gain (loss) on derivative instruments (Note 5) | | | | | | 42 | | | 55 | | | | 60 | | | 677 | |
| Operating Revenues (Note 6) | | | | | | 2,115 | | | 1,344 | | | | 1,210 | | | 3,089 | |
| | | | | | | | | | | | | |
| Fuel and energy purchases | | | | | | (694) | | | (424) | | | | (176) | | | (938) | |
| Nuclear fuel amortization | | | | | | (123) | | | (108) | | | | (33) | | | (94) | |
| Unrealized gain (loss) on derivative instruments (Note 5) | | | | | | 20 | | | (3) | | | | (123) | | | (52) | |
| Energy Expenses | | | | | | (797) | | | (535) | | | | (332) | | | (1,084) | |
| | | | | | | | | | | | | |
| Operating Expenses | | | | | | | | | | | | | |
| Operation, maintenance and development | | | | | | (592) | | | (358) | | | | (285) | | | (610) | |
| General and administrative | | | | | | (163) | | | (93) | | | | (51) | | | (106) | |
| Depreciation, amortization and accretion (Note 10) | | | | | | (298) | | | (165) | | | | (200) | | | (520) | |
| Impairments (Note 10) | | | | | | (1) | | | (3) | | | | (381) | | | — | |
| Operational restructuring | | | | | | — | | | — | | | | — | | | (488) | |
| Other operating income (expense), net | | | | | | (38) | | | (30) | | | | (37) | | | (40) | |
| Operating Income (Loss) | | | | | | 226 | | | 160 | | | | (76) | | | 241 | |
| Nuclear decommissioning trust funds gain (loss), net (Note 9) | | | | | | 178 | | | 108 | | | | 57 | | | (184) | |
| Interest expense and other finance charges (Note 13) | | | | | | (238) | | | (176) | | | | (163) | | | (359) | |
| Reorganization income (expense), net (Note 4) | | | | | | — | | | — | | | | 799 | | | (812) | |
| Consolidation of subsidiary gain (loss) (Note 2) | | | | | | — | | | — | | | | — | | | (170) | |
| Gain (loss) on sale of assets, net | | | | | | 884 | | | 7 | | | | 50 | | | — | |
| Other non-operating income (expense), net | | | | | | 61 | | | 95 | | | | 10 | | | (44) | |
| Income (Loss) Before Income Taxes | | | | | | 1,111 | | | 194 | | | | 677 | | | (1,328) | |
| Income tax benefit (expense) (Note 7) | | | | | | (98) | | | (51) | | | | (212) | | | 35 | |
| Net Income (Loss) | | | | | | 1,013 | | | 143 | | | | 465 | | | (1,293) | |
| Less: Net income (loss) attributable to noncontrolling interest | | | | | | 15 | | | 9 | | | | (14) | | | (4) | |
| Net Income (Loss) Attributable to Stockholders (Successor) / Member (Predecessor) | | | | | | $ | 998 | | | $ | 134 | | | | $ | 479 | | | $ | (1,289) | |
Successor Period — Year Ended December 31, 2024
Net Income (Loss) Attributable to Stockholders totaled $998 million for the year ended December 31, 2024 (Successor). Results were driven by:
•Capacity Revenues totaled $192 million. This primarily included earned capacity awards based on resource clearing prices received from the PJM BRAs for the 2023/2024 and 2024/2025 PJM Capacity Years.
•Energy and Other Revenues, net of Fuel and Energy Purchases totaled $1.2 billion. This consisted of: (i) $1.3 billion in third-party wholesale electricity sales and ancillary revenues; (ii) $325 million in other revenue primarily related to Nuclear PTC and Bitcoin revenue; and (iii) $230 million in net realized gains from hedging activities. Such amounts were partially offset by $(659) million in fuel and purchased power costs.
•Unrealized Gain (Loss) on Derivative Instruments totaled $62 million gain, net. This consisted of: (i) unrealized gains from the reversal of positions previously recognized as mark-to-market liabilities which settled during the period; and (ii) unrealized gains incurred as a result of decreases in forward power prices.
•Nuclear Fuel Amortization totaled $(123) million. This consisted of the periodic expense of nuclear fuel costs capitalized as PP&E and $33 million of amortization on certain nuclear fuel contracts that were recognized at fair value at Emergence. See Note 4 to the Annual Financial Statements for additional information.
•Operation, Maintenance and Development totaled $(592) million. This consisted of generation facility operating costs, including employee wages and benefits, the costs of removal, repairs, and maintenance that are not capitalized, contractor costs, and certain materials and supplies.
•Depreciation, Amortization and Accretion totaled $(298) million. This consisted of depreciation of long-lived PP&E, intangibles, and ARO accretion.
•Nuclear Decommissioning Trust Funds Gain (Loss), net totaled $178 million. This consisted of realized and unrealized gains and losses on debt and equity securities, dividends, and interest income associated with NDT investments. See Notes 9 and 14 to the Annual Financial Statements for additional information.
•Interest Expense and Other Finance Charges totaled $(238) million. This primarily consisted of interest expense incurred on the Secured Notes, TLB-1, and TLB-2.
•Gain (Loss) on Sale of Assets, net totaled $884 million. This primarily consisted of the $564 million gain from the ERCOT Sale that closed in May 2024 and the $324 million gain from the AWS Data Campus Sale that closed in March 2024. See Note 20 to the Annual Financial Statements for additional information.
•Other Non-Operating Income (Expense), net totaled $61 million. This primarily consisted of interest income on cash deposits.
•Income Tax Benefit (Expense) totaled $(98) million. This primarily related to federal and state tax expense on pre-tax income, the release of the federal and state valuation allowance, and the exclusion of Nuclear PTC income as a permanent item.
Successor Period — May 18 through December 31, 2023
Net Income (Loss) Attributable to Stockholders totaled $134 million for the period from May 18 through December 31, 2023 (Successor). Results were driven by:
•Capacity Revenues totaled $133 million. This primarily consisted of earned capacity awards based on resource clearing prices received from the PJM BRA for the 2023/2024 PJM Capacity Year. Capacity revenues were positively impacted by $19 million as a result of the FERC-approved settlement agreement for net PJM Capacity Performance penalties assessed related to Winter Storm Elliot. See Note 12 to the Annual Financial Statements for additional information on PJM Capacity Performance penalties.
•Energy and Other Revenues, net of Fuel and Energy Purchases totaled $732 million. This consisted of: (i) $950 million in third-party wholesale electricity sales and ancillary revenues; (ii) $81 million in Bitcoin revenue; and (iii) $33 million in net realized gains from hedging activities. Such amounts were partially offset by $(332) million in fuel and purchased power costs.
•Unrealized Gain (Loss) on Derivative Instruments totaled $52 million gain, net. This consisted of unrealized gains incurred as a result of decreases in forward power prices; and (ii) unrealized gains from the reversal of positions previously recognized as mark-to-market liabilities which settled during the period.
•Nuclear Fuel Amortization totaled $(108) million. This consisted of the periodic expense of nuclear fuel costs capitalized as PP&E and $53 million of amortization on certain nuclear fuel contracts that were recognized at fair value at Emergence. See Note 4 to the Annual Financial Statements for additional information.
•Operation, Maintenance and Development totaled $(358) million. This consisted of generation facility operating costs, including employee wages and benefits, the costs of removal, repairs, and maintenance that are not capitalized, contractor costs, and certain materials and supplies.
•Depreciation, Amortization and Accretion totaled $(165) million. This consisted of depreciation of long-lived PP&E, intangibles, and ARO accretion.
•Nuclear Decommissioning Trust Funds Gain (Loss), net totaled $108 million. This consisted of realized and unrealized gains and losses on debt and equity securities, dividends, and interest income associated with NDT investments. See Notes 9 and 14 to the Annual Financial Statements for additional information.
•Interest Expense and Other Finance Charges totaled $(176) million. This primarily consisted of interest expense incurred on the Secured Notes and TLB-1.
•Other Non-Operating Income (Expense), net totaled $95 million. This primarily consisted of the gain on the PPL/Talen Montana litigation settlement. See Note 12 to the Annual Financial Statements for additional information.
•Income Tax Benefit (Expense) totaled $(51) million. This primarily related to federal and state tax expense on pre-tax income and changes in the valuation allowance. See Note 7 to the Annual Financial Statements for additional information.
Predecessor Period — January 1 through May 17, 2023
Net Income (Loss) Attributable to Member totaled $479 million for the period from January 1 through May 17, 2023 (Predecessor). Results were driven by:
•Capacity Revenues totaled $108 million. This primarily consisted of earned capacity awards based on resource clearing prices received from the PJM BRA for the 2022/2023 PJM Capacity Year. Capacity revenues were negatively impacted by $(13) million of net PJM Capacity Performance penalties related to Winter Storm Elliott. See Note 12 to the Annual Financial Statements for additional information on PJM Capacity Performance penalties.
•Energy and Other Revenues, net of Fuel and Energy Purchases totaled $866 million. This consisted of: (i) $637 million in net realized gains from hedging activities; (ii) $343 million in third-party wholesale electricity sales and ancillary revenues; and (iii) $27 million in Bitcoin revenue. Such amounts were partially offset by $(141) million in fuel and purchased power costs.
•Unrealized Gain (Loss) on Derivative Instruments totaled $(63) million loss, net. This consisted of unrealized losses from the reversal of positions previously recognized as mark-to-market assets which settled during the period, partially offset by unrealized gains incurred as a result of decreases in forward power prices.
•Nuclear Fuel Amortization totaled $(33) million. This consisted of the periodic expense of nuclear fuel costs capitalized as PP&E.
•Operation, Maintenance and Development totaled $(285) million. This consisted of generation facility operating costs, including employee wages and benefits, the costs of removal, repairs, and maintenance that are not capitalized, contractor costs, and certain materials and supplies.
•Depreciation, Amortization and Accretion totaled $(200) million. This consisted of depreciation of long-lived PP&E, intangibles, and ARO accretion.
•Impairments totaled $(381) million. This consisted of the assessment of Brandon Shores asset group recoverability associated with a decision to deactivate Brandon Shores on June 1, 2025. See Note 10 to the Annual Financial Statements for additional information.
•Other Operating Income (Expense), net totaled (37) million. This primarily consisted of non-cash charges for fuel inventory net realizable value adjustments. See Note 8 to the Annual Financial Statements for additional information.
•Nuclear Decommissioning Trust Funds Gain (Loss), net totaled $57 million. This consisted of realized and unrealized gains and losses on debt and equity securities, dividends, and interest income associated with NDT investments. See Notes 9 and 14 to the Annual Financial Statements for additional information.
•Interest Expense and Other Finance Charges totaled $(163) million. This primarily consisted of interest expense incurred on prepetition indebtedness of TES and the LMBE-MC TLB and certain LC fees.
•Reorganization Income (Expense), net totaled $799 million. This primarily consisted of: (i) a $1.5 billion gain on debt discharge recognized upon Emergence, partially offset by a $(460) million loss on revaluation adjustments; (ii) $(70) million in backstop commitment letters; (iii) $(84) million in professional fees; (iv) and (46) million for the write-off of the carrying value of prepetition debt issuance costs. See Note 2 to the Annual Financial Statements for additional information.
•Gain (loss) on Sale of Assets, net totaled $50 million. This primarily consisted of gains due to non-recurring sales during the period. See Note 20 to the Annual Financial Statements for additional information.
•Income Tax Benefit (Expense) totaled $(212) million. This primarily related to federal and state tax expense on pre-tax income, reorganization adjustments, and changes in the valuation allowance. See Note 7 to the Annual Financial Statements for additional information.
Predecessor Period — Year Ended December 31, 2022
Net Income (Loss) Attributable to Member totaled $(1.3) billion for the year ended December 31, 2022 (Predecessor). Results were driven by:
•Capacity Revenues totaled $377 million. This primarily consisted of earned capacity awards based on resource clearing prices received from the PJM BRAs for the 2021/2022 and 2022/2023 PJM Capacity Years. Capacity revenues were negatively impacted by $33 million of net PJM Capacity Performance penalties related to Winter Storm Elliott. See Note 12 to the Annual Financial Statements for additional information on PJM Capacity Performance penalties.
•Energy and Other Revenues, net of Fuel and Energy Purchases totaled $1.1 billion. This consisted of: (i) $2.8 billion in third-party wholesale electricity sales and ancillary revenues; (ii) $(513) million in net realized losses from hedging activities; and (iii) $(157) million in losses incurred on early terminated commodity contracts. Such amounts were partially offset by $(1.1) billion in fuel and purchased power costs.
•Unrealized Gain (Loss) on Derivative Instruments totaled $625 million gain, net. This consisted of unrealized gains from the reversal of positions previously recognized as mark-to-market liabilities which settled during the period, coupled with unrealized gains incurred as a result of decreases in forward power prices.
•Nuclear Fuel Amortization totaled $(94) million. This consisted of the periodic expense of nuclear fuel costs capitalized as PP&E.
•Operation, Maintenance and Development totaled $(610) million. This consisted of generation facility operating costs, including employee wages and benefits, the costs of removal, repairs, and maintenance that are not capitalized, contractor costs, and certain materials and supplies.
•Depreciation, Amortization and Accretion totaled $(520) million. This consisted of depreciation of long-lived PP&E, intangibles, and ARO accretion.
•Operational Restructuring totaled $(488) million. This consisted of: (i) a $(453) million loss resulting from charges related to retail power contracts in the PJM market that were rejected in connection with the Reorganization; and (ii) a $(35) million loss primarily due to charges related to long-term service agreements in the ERCOT market that were rejected in connection with the Reorganization.
•Other Operating Income (Expense), net totaled $(40) million. This primarily consisted of: (i) $(17) million of expenses related to environmental liability revisions in the PJM market; and (ii) $(18) million for the estimated costs of a legal settlement.
•Nuclear Decommissioning Trust Funds Gain (Loss), net totaled $(184) million. This consisted of realized and unrealized gains and losses on debt and equity securities, dividends, and interest income associated with NDT investments. See Notes 9 and 14 to the Annual Financial Statements for additional information.
•Interest Expense and Other Finance Charges totaled $(359) million. This primarily consisted of interest expense incurred on prepetition indebtedness of TES and the LMBE-MC TLB and certain LC fees.
•Reorganization Income (Expense), net totaled $(812) million. This consisted of (i) (310) million in backstop commitment letter premium; (ii) (210) million for professional fees related to the Restructuring; (iii) (183) million for make-whole premiums and accrued interest on certain indebtedness; (iv) (70) million for professional fees incurred to obtain the debtor-in-possession credit agreements; and (v) (30) million for the write-off of the carrying value of prepetition debt issuance costs.
•Consolidation of Subsidiary Gain (Loss) totaled $(170) million. This consisted of losses recognized from the consolidation of Cumulus Digital due to a change of control.
•Other Non-Operating Income (Expense), net totaled $(44) million. This primarily consisted of non-recurring corporate professional fees associated with liability and other management initiatives.
•Income Tax Benefit (Expense) totaled $35 million. This primarily related to federal and state tax benefit on pre-tax loss, changes in the valuation allowance, and non-deductible transaction costs.
Liquidity and Capital Resources
Our liquidity and capital requirements are generally a function of: (i) debt service requirements; (ii) capital expenditures; (iii) maintenance activities; (iv) liquidity requirements for our hedging activities including cash collateral and other forms of credit support; (v) legacy environmental obligations; (vi) other working capital requirements; and (or) (vii) discretionary expenditures, including share repurchase activities.
Our primary sources of liquidity and capital include available cash deposits, cash flows from operations, amounts available under our debt and credit facilities, and potential incremental financing proceeds. Generating sufficient cash flows for our business is primarily dependent on capacity revenue, the production and sale of power at margins sufficient to cover fixed and variable expenses, hedging strategies to manage price risk exposure, and the ability to access a wide range of capital market financing options.
Our hedging strategy is focused on maintaining appropriate risk tolerances with an emphasis on protecting cash flows across our generation fleet. Our strong balance sheet provides ample capacity and counterparty appetite for lien-based hedging, which limits the use of margin posting requirements. Specifically, our hedging strategy prioritizes a first lien-based hedging program, in which hedging counterparties are granted a lien in the same collateral securing our first-lien debt obligations, while minimizing exchange-based hedging and the associated margin requirements. Additionally, we now have lower overall hedging needs given the cash-flow stability afforded by the Nuclear PTC (which provides a built-in hedging apparatus through the tax credit) and significantly reduced debt service requirements following the Restructuring and subsequent refinancing transactions.
We are partially exposed to financial risks arising from natural business exposures including commodity price and interest rate volatility. Within the bounds of our risk management program and policies, we use a variety of derivative instruments to enhance the stability of future cash flows to maintain sufficient financial resources for working capital, debt service, capital expenditures, debt covenant compliance, and (or) other needs.
See the following Notes to the Annual Financial Statements for additional information on liquidity topics discussed below: Note 5 for derivatives and hedging, Note 11 for AROs and environmental obligations, Note 13 for long-term debt and credit facilities, and Note 19 for supplemental cash flow information.
Liquidity and Letter of Credit Capacity
| | | | | | | | | | | | | | |
| | Successor |
| | December 31, 2024 | | December 31, 2023 |
| Cash and cash equivalents, unrestricted | | $ | 328 | | | $ | 400 | |
Unutilized RCF capacity (a) | | 700 | | | 638 | |
| | | | |
| Total available liquidity | | $ | 1,028 | | | $ | 1,038 | |
Additional unutilized LC capacity (b) | | $ | 526 | | | $ | 67 | |
__________________
(a)As of December 31, 2024 (Successor), all RCF committed capacity can be used for direct cash borrowings and (or) LCs. As of December 31, 2023 (Successor). All RCF committed capacity could be used for direct cash borrowings and up to 475 million of such capacity could be used for LCs.
(b)Excludes LC capacity available under the RCF. Includes (i) LC capacity under the LCF as of December 31, 2024 (Successor); and (ii) aggregate LC capacity under the TLC LCF and Bilateral LCF as of December 31, 2023 (Successor).
Based on current and anticipated levels of operations, industry conditions, and market environments in which we transact, we believe available liquidity from financing activities, cash on hand, and cash flows from operations (including changes in working capital) will be adequate to meet working capital, debt service, capital expenditures, and (or) other future requirements for the next twelve months and beyond. See Note 13 to the Annual Financial Statements for additional information on the RCF and the issuance of the LCF and termination of the TLC LCF and Bilateral LCF in December 2024.
Guarantees and Other Assurances
Guarantees of Subsidiary Obligations. TES guarantees certain agreements and obligations for its subsidiaries. Certain agreements may contingently require payments to a guaranteed or indemnified party. See Note 12 to the Annual Financial Statements for additional information on guarantees.
Financial Performance Assurances. TES has provided financial performance assurances in the form of surety bonds to third parties on behalf of certain subsidiaries for obligations including but not limited to environmental obligations and AROs. Surety bond providers generally have the right to request additional collateral to backstop surety bonds.
| | | | | | | | | | | | | | |
| | Successor |
| | December 31, 2024 | | December 31, 2023 |
| Outstanding surety bonds | | $ | 234 | | | $ | 240 | |
Forecasted Uses of Cash
Capital Expenditures. Capital expenditure plans are revised periodically for changes in operational needs, market conditions, regulatory requirements, and cost projections. Accordingly, the expected cash requirements for capital expenditures are subject to revision.
| | | | | | | | | | | | | | |
| | 2025 | | 2026 |
| Nuclear fuel | | $ | 105 | | | $ | 127 | |
| PJM nuclear generation facility | | 41 | | | 47 | |
| PJM fossil generation facilities | | 40 | | | 53 | |
| Other | | 11 | | | 6 | |
Total (a) | | $ | 199 | | | $ | 233 | |
__________________
(a)Expected capitalized interest on capital expenditures is a non-material amount in 2025 and 2026.
Projected ARO and Accrued Environmental Liability Cash Flows. Certain of our subsidiaries have legal obligations to perform significant decommissioning and remediation activities associated with current operations and (or) at former generation facility sites. Our projected undiscounted spending on AROs and environmental liabilities is presented in the table below. The majority of the estimated non-nuclear spend is related to ash impoundments at Colstrip and Brunner Island. Beginning in 2025, we expect to increase our remediation spend associated with our obligations at Colstrip. The carrying value of these obligations includes certain assumptions, including a rate of inflation of 2.50. Projections are subject to revision based on changes in estimated inflation rates, changes in the estimated timing of settling AROs, and escalating retirement costs. Susquehanna’s AROs are expected to be settled with funds available from the NDT at the time of decommissioning. See Note 11 to the Annual Financial Statements for additional information.
As of December 31, 2024 (Successor), the expected undiscounted payments are estimated to be:
| | | | | | | | | | | | | | | | | | | | | | | | | | | | | | | | | | | | | | | | | | | | |
| | 2025 | | 2026 | | 2027 | | 2028 | | 2029 | | Thereafter | | Total |
| Accrued environmental liabilities | | $ | 4 | | | $ | 3 | | | $ | 3 | | | $ | 4 | | | $ | 4 | | | $ | 14 | | | $ | 32 | |
Non-nuclear AROs (a) | | 52 | | | 62 | | | 47 | | | 40 | | | 49 | | | 282 | | | 532 | |
__________________
(a)Certain obligations are: (i) partially supported by surety bonds, some of which have been collateralized with cash and (or) LCs; or (ii) partially prefunded under phased installment agreements.
Indebtedness. See Note 13 to the Annual Financial Statements and “—Recent Developments—Financing Transactions” above for additional information on our indebtedness.
Cash Flow Activities
The net cash provided by (used in) operating, investing, and financing activities for the periods were:
| | | | | | | | | | | | | | | | | | | | | | | | | | | | | |
| | Successor | | | Predecessor |
| | Year Ended December 31, 2024 | | May 18 through December 31, 2023 | | | January 1 through May 17, 2023 | | Year Ended December 31, 2022 |
| Operating activities | | $ | 256 | | | $ | 402 | | | | $ | 462 | | | $ | 187 | |
| Investing activities | | 1,171 | | | (171) | | | | (157) | | | (368) | |
| Financing activities | | (1,963) | | | (84) | | | | (539) | | | 426 | |
Successor Period — Year Ended December 31, 2024
•Operating Cash Flows. Cash provided by operating activities totaled $256 million.
•Investing Cash Flows. Cash provided by investing activities totaled $1.2 billion. This primarily consisted of $635 million of proceeds from the AWS Data Campus Sale and $763 million of proceeds from the ERCOT Sale. Such amounts were partially offset by: (i) net NDT fund investments of $(32) million; and (ii) capital expenditures of $(189) million, which primarily consisted of $(104) million for nuclear fuel and $(85) million for PP&E. See Note 20 to the Annual Financial Statements for additional information on the AWS Data Campus Sale and the ERCOT Sale.
•Financing Cash Flows. Cash used in financing activities totaled $(2.0) billion. This primarily consisted of: (i) $(2.0) billion for share repurchases; (ii) $(479) million to repay the TLC; (iii) $(182) million for the repayment of the Cumulus Digital TLF; (iv) $(125) million for the repurchases of noncontrolling interests (a) in Cumulus Digital from affiliates of Orion Energy Partners and two former members of Talen senior management, and (b) in Nautilus from TeraWulf; and (v) $(32) million to settle vested restricted stock units in cash. Such amounts were partially offset by $849 million in proceeds from the issuance of new debt. See Notes 13 and 18 to the Annual Financial Statements and “—Recent Developments” above for additional information on debt transactions and share repurchases.
Successor Period — May 18 through December 31, 2023
•Operating Cash Flows. Cash provided by operating activities totaled $402 million. This primarily consisted of: (i) cash provided from operations; and (ii) the net receipt of $104 million related to the settlement of the PPL/Talen Montana litigation. See Note 12 to the Annual Financial Statements for additional information on the PPL/Talen Montana settlement.
•Investing Cash Flows. Cash used in investing activities totaled $(171) million. This primarily consisted of capital expenditures totaling $(161) million, which consisted of: (i) $(116) million for then-current projects, including the Montour gas conversion project and the AWS Data Campus; and (ii) $(45) million related to nuclear fuel expenditures, as we purchased uranium for needs in future periods.
•Financing Cash Flows. Cash used by financing activities totaled $(84) million. This primarily consisted of $(59) million for payments to former affiliates to settle warrants and to repurchase affiliates’ noncontrolling interests in Cumulus Digital.
Predecessor Period — January 1 through May 17, 2023
•Operating Cash Flows. Cash provided by operating activities totaled $462 million.
•Investing Cash Flows. Cash used in investing activities totaled $(157) million. This primarily consisted of capital expenditures totaling $(187) million, which consisted of: (i) $(138) million for then-current projects, including the Montour gas conversion project, the AWS Data Campus, the Nautilus cryptocurrency project, and projects at Susquehanna; and (ii) $(49) million related to nuclear fuel expenditures. Such amounts were offset by $46 million in proceeds from the sale of assets.
•Financing Cash Flows. Cash used in financing activities totaled $(539) million. This primarily consisted of the net effect of issuances and repayments of prepetition debt and make-whole premiums of about $(1.9) billion net cash outflow, partially offset by $1.4 billion cash inflow for a contribution from member.
Predecessor Period — Year Ended December 31, 2022
•Operating Cash Flows. Cash provided by operating activities totaled $187 million.
•Investing Cash Flows. Cash used in investing activities totaled $(368) million. This primarily consisted of: (i) capital expenditures totaling $(312) million, which consisted of: (a) $(232) million for then-current projects, including the Montour gas conversion project and projects at Susquehanna, and (b) $(80) million related to nuclear fuel expenditures; and (ii) $(162) million in equity investments in affiliates. Such amounts were offset by a $123 million increase to cash due to the consolidation of Cumulus Digital.
•Financing Cash Flows. Cash used in financing activities totaled $426 million. This primarily consisted of net proceeds from debtor-in-possession credit facilities of $987 million, after discount and debt issuance costs, partially offset by: (i) repayments on prepetition deferred capacity obligations and inventory repurchase obligations of $(341) million; (ii) $(104) million related to terminations of certain derivative contracts; (iii) $(59) million of deferred financing costs; and (iv) $(52) million related payments of the LMBE-MC TLB.
Non-GAAP Financial Measure
Adjusted EBITDA, which we use as a measure of our performance, is not a financial measure prepared under GAAP. Non-GAAP financial measures do not have definitions under GAAP and may be defined and calculated differently by, and not be comparable to, similarly titled measures used by other companies. Non-GAAP measures are not intended to replace the most comparable GAAP measures as indicators of performance. Generally, a non-GAAP financial measure is a numerical measure of financial performance, financial position, or cash flows that excludes (or includes) amounts that are included in (or excluded from) the most directly comparable measure calculated and presented in accordance with GAAP. Management cautions readers not to place undue reliance on the following non-GAAP financial measure, but to also consider it along with its most directly comparable GAAP financial measure. Non-GAAP measures have limitations as analytical tools and should not be considered in isolation or as a substitute for analyzing our results as reported under GAAP.
Adjusted EBITDA
We use Adjusted EBITDA to: (i) assist in comparing operating performance and readily view operating trends on a consistent basis from period to period without certain items that may distort financial results; (ii) plan and forecast overall expectations and evaluate actual results against such expectations; (iii) communicate with our Board of Directors, shareholders, creditors, analysts, and the broader financial community concerning our financial performance; (iv) set performance metrics for our annual short-term incentive compensation; and (v) assess compliance with our indebtedness.
Adjusted EBITDA is computed as net income (loss) adjusted, among other things, for certain: (i) nonrecurring charges; (ii) non-recurring gains; (iii) non-cash and other items; (iv) unusual market events; (v) any depreciation, amortization, or accretion; (vi) mark-to-market gains or losses; (vii) gains and losses on the NDT; (viii) gains and losses on asset sales, dispositions, and asset retirement; (ix) impairments, obsolescence, and net realizable value charges; (x) interest expense; (xi) income taxes; (xii) legal settlements, liquidated damages, and contractual terminations; (xiii) development expenses; (xiv) noncontrolling interests, except where otherwise noted; and (xv) other adjustments. Such adjustments are computed consistently with the provisions of our indebtedness to the extent that they can be derived from the financial records of the business. Pursuant to TES’s debt agreements, Cumulus Digital contributes to Adjusted EBITDA beginning in the first quarter 2024, following termination of the Cumulus Digital TLF and associated cash flow sweep.
Additionally, we believe investors commonly adjust net income (loss) information to eliminate the effect of nonrecurring restructuring expenses and other non-cash charges, which can vary widely from company to company and from period to period and impair comparability. We believe Adjusted EBITDA is useful to investors and other users of our financial statements to evaluate our operating performance because it provides an additional tool to compare business performance across companies and between periods. Adjusted EBITDA is widely used by investors to measure a company’s operating performance without regard to such items described above. These adjustments can vary substantially from company to company and period to period depending upon accounting policies, book value of assets, capital structure, and the method by which assets were acquired.
The following table presents a reconciliation of the GAAP financial measure of “Net Income (Loss)” presented on the Consolidated Statements of Operations to the non-GAAP financial measure of Adjusted EBITDA:
| | | | | | | | | | | | | | | | | | | | | | | | | | | | | | | | | |
| | | | | | Successor | | | Predecessor |
| (Millions of Dollars) | | | | | | Year Ended December 31, 2024 | | May 18 through December 31, 2023 | | | January 1 through May 17, 2023 | | Year Ended December 31, 2022 |
| Net Income (Loss) | | | | | | $ | 1,013 | | | $ | 143 | | | | $ | 465 | | | $ | (1,293) | |
| Adjustments | | | | | | | | | | | | | |
| Interest expense and other finance charges | | | | | | 238 | | | 176 | | | | 163 | | | 359 | |
| Income tax (benefit) expense | | | | | | 98 | | | 51 | | | | 212 | | | (35) | |
| Depreciation, amortization and accretion | | | | | | 298 | | | 165 | | | | 200 | | | 520 | |
| Nuclear fuel amortization | | | | | | 123 | | | 108 | | | | 33 | | | 94 | |
Reorganization (gain) loss, net (a) | | | | | | — | | | — | | | | (799) | | | 812 | |
| Unrealized (gain) loss on commodity derivative contracts | | | | | | (62) | | | (52) | | | | 63 | | | (625) | |
| Nuclear decommissioning trust funds (gain) loss, net | | | | | | (178) | | | (108) | | | | (57) | | | 184 | |
| Stock-based compensation expense | | | | | | 33 | | | 19 | | | | — | | | — | |
| Long-term incentive compensation expense | | | | | | 21 | | | 2 | | | | — | | | — | |
| | | | | | | | | | | | | |
(Gain) loss on asset sales, net (b) | | | | | | (884) | | | (7) | | | | (50) | | | — | |
Non-cash impairments (c) | | | | | | 1 | | | 3 | | | | 381 | | | — | |
Legal settlements and litigation costs (d) | | | | | | (10) | | | (84) | | | | 1 | | | 20 | |
Unusual market events (d) | | | | | | (1) | | | (19) | | | | 14 | | | 29 | |
| Net periodic defined benefit cost | | | | | | 14 | | | 2 | | | | (3) | | | 12 | |
Operational and other restructuring activities (e) (f) (g) | | | | | | 76 | | | 48 | | | | 17 | | | 570 | |
| Development expenses | | | | | | 1 | | | 7 | | | | 10 | | | 17 | |
Non-cash inventory net realizable value, obsolescence, and other charges (h) | | | | | | 20 | | | 4 | | | | 56 | | | 3 | |
| Consolidation of subsidiary (gain) loss, net | | | | | | — | | | — | | | | — | | | 170 |
| Noncontrolling interest | | | | | | (21) | | | (42) | | | | (14) | | | 3 | |
| Other | | | | | | (10) | | | 10 | | | | 3 | | | 17 | |
| Total Adjusted EBITDA | | | | | | $ | 770 | | | $ | 426 | | | | $ | 695 | | | $ | 1,015 | |
__________________
(a)See Note 4 to the Annual Financial Statements for additional information.
(b)See Note 20 to the Annual Financial Statements for additional information.
(c)See Note 10 to the Annual Financial Statements for additional information.
(d)See Note 12 to the Annual Financial Statements for additional information.
(e)The year ended December 31, 2024 (Successor) primarily includes the effects of nonrecurring ERCOT hedge settlements that occurred after the ERCOT Sale and severance payments associated with cost reduction initiatives.
(f)The periods from May 18 through December 31, 2023 (Successor) and from January 1 through May 17, 2023 (Predecessor) include the effects of nonrecurring costs associated with exit from the Restructuring, severance costs associated with cost reduction initiatives, and nonrecurring post-Restructuring strategic initiative costs.
(g)The year ended December 31, 2022 (Predecessor) includes non-cash charges for retail contracts terminated in connection with the Restructuring. See Note 4 to the Annual Financial Statements for additional information.
(h)See Note 8 to the Annual Financial Statements for additional information.
Critical Accounting Policies and Estimates
Financial statements prepared in conformity with GAAP require the application of appropriate accounting policies to form the basis of estimates utilizing methods, judgments, and (or) assumptions that materially affect: (i) the measurement and carrying values of assets and liabilities as of the date of the financial statements; (ii) the revenues recognized and expenses incurred during the presented reporting periods; and (iii) financial statement disclosures of commitments, contingencies, and other significant matters. Such judgments and assumptions may include significant subjectivity due to the inherent uncertainties of future events which exist to such an extent that there is a reasonable likelihood that materially different amounts would have been reported under different conditions or if different assumptions had been used. We believe the following areas contain the most significant accounting judgments, the highest levels of subjectivity, or relate to uncertain matters that are susceptible to material changes in estimates that are critical to understanding the Company’s financial results. Due to such inherent uncertainties, actual results may differ substantially from estimates and (or) estimates may change materially in periods where new information becomes known. Management develops these estimates based on best available information, historical experience, and subject matter experts. See Note 2 to the Annual Financial Statements for additional information on accounting policies for each of the following topics.
Derivative Instruments
Derivative instruments, which are deployed by our commercial organization to manage and (or) mitigate market and commodity price risk, are presented on the Consolidated Balance Sheets at fair value and are comprised primarily of power and natural gas commodity contracts. Derivative identification is challenging. While a conventional financially settled contract, such as a swap or option, generally contains standard terms that facilitate its identification as a derivative instrument, judgment is required to determine whether contracts to buy or sell commodities with physical delivery requirements or contracts that contain certain embedded settlement or fluctuating price features meet the definition of a derivative instrument. This judgment typically includes, among other things, an evaluation of the contract, its expected cash flows, and the activity levels of its principal market. Additionally, judgment is required to determine if a commodity contract intended for physical delivery meets an allowable exemption prior to accounting for its income effects under the accrual accounting method rather than at fair value. This typically includes assumptions regarding the probability of physical delivery and the quantities used in normal business activities.
As our derivative contracts generally settle within future time periods supportable by commodity exchange markets and the frequent occurrence of commercial transactions, the majority of our derivative contracts utilize quoted prices in active markets or other observable market inputs to determine fair value. However, such prices are subject to volatility between periods based on weather, local market events, macroeconomic trends, and (or) other events and factors. Accordingly, changes in fair value for contracts identified as derivatives may result in material changes to unrealized gains or losses presented on the Consolidated Statements of Operations between periods. Changes in fair value of commodity derivatives are presented as “Unrealized gain (loss) on derivative instruments” as a component of either “Operating Revenues” or “Fuel and energy purchases” on the Consolidated Statements of Operations, in a consistent manner with the presentation of its realized net gains or losses.
See Note 5 to the Annual Financial Statements for additional information on derivative instruments.
Nuclear Decommissioning Asset Retirement Obligations
We have significant legal obligations associated with Susquehanna’s decommissioning. Susquehanna’s Unit 1 and Unit 2 licenses, if not renewed, will expire in 2042 and 2044, respectively, at or before which time the units will shut down.
Judgment is required to make reasonable ARO assumptions regarding the range of likely outcomes for cost estimates, as these obligations are not expected to be paid until years or decades in the future, and potentially many years after shutdown. Inflation rates and discount rates may be subject to revision until the ARO settlement date. As such, changes in assumptions to the range of likely outcomes could result in different cash outlay for AROs at the settlement date than the current carrying value of the ARO presented on the Consolidated Balance Sheets. Susquehanna periodically assesses its ARO through third-party engineering studies in order to determine expected scope, costs, and timing of decommissioning activities. Generally, its decommissioning cost study is updated approximately every seven years. As part of the cost study update process, we and the third-party engineering firm evaluate cost projections based on the latest engineering techniques and the latest information which incorporates nuclear plant retirements in the industry. We incorporate the results of the study as well as our experience, knowledge, and professional judgment to the specific characteristics of Susquehanna’s decommissioning plan to update the carrying value of the ARO.
AROs are recognized at fair value at the time of installation and as an increase to PP&E. The income effect of AROs is generally presented as “Depreciation, amortization and accretion” on the Consolidated Statements of Operations through the expected ARO settlement date. However, for an asset that has a fully depreciated PP&E carrying value, revisions in ARO estimates have an immediate effect in earnings. Revisions to the estimated ARO are presented as “Other operating income (expense), net” on the Consolidated Statements of Operations.
See Note 11 to the Annual Financial Statements for additional information on AROs.
Recoverability of Long-Lived Assets
PP&E used in operations are assessed for impairment whenever changes in facts and circumstances indicate the carrying amount of the asset group may not be recoverable. Judgment is required to identify these events. In certain instances, the events could be external to us and may include, among other events, changes in the economic environment, such as a decrease in the market price of an asset, significant changes to market rules and regulations in the power markets in which we operate, and changes in federal or state environmental regulations that would materially affect the cash flows of our generation fleet. In other instances, the events result from negative financial trends, physical damage to assets, or decisions of management regarding strategic initiatives, such as sales of assets, generation facility retirements, or significant changes in planned capital expenditures or operating costs.
Individual assets are grouped for impairment purposes at the lowest level for which there are identifiable cash flows that are largely independent of the cash flows of other assets and liabilities. There is significant judgment in identifying the lowest level of independent cash flows in the merchant power market, given that certain groups of our generation facilities participate in the same market. In determining the appropriate level of aggregation, we consider the manner in which we make economic decisions regarding the revenue and commercial activities of the generation facilities and the manner in which we make operational and maintenance decisions. Accordingly, we generally aggregate assets for impairment at the reporting unit level, unless there are additional facts and circumstances present which indicate that an asset should be tested for recoverability on a standalone basis. Periodically, we evaluate whether events such as changes in market conditions, regulatory changes, or other events require a change in aggregation.
If there is an indication that the carrying value of an asset group may not be recovered, we review the expected future cash flows of the asset group. If the sum of the undiscounted pre-tax cash flows is less than the carrying value of the asset group, the asset group is written down to its estimated fair value. Fair value for PP&E may be determined by a variety of valuation methods, including third-party appraisals, market prices of similar assets, and present value techniques. However, as there is generally a lack of quoted market prices for long-lived assets, the fair value of impaired assets is typically determined based on the present values of expected future cash flows using discount rates that are believed to be consistent with those used by principal market participants. The estimated cash flows and related fair value computations consider all available evidence as of the date of the review, such as estimated future generation volumes, capacity prices, energy prices, operating costs, and capital expenditures.
Impairment charges are presented on the Consolidated Statements of Operations in the period in which the impairment determination is made.
See Note 10 to the Annual Financial Statements for additional information on recognized impairments.
Postretirement Benefit Obligations
Certain of our subsidiaries sponsor postemployment benefits that include defined benefit pension plans. Accounting for defined benefit pensions involves significant estimates to determine projected benefit obligations and company contribution requirements, which inherently require assumptions be made regarding many uncertainties. Such uncertainties include discount rates, expected return on assets, expected wages for participants at retirement, estimated retirement dates, and mortality rates. Over a period of time, we are required to fund all vested benefits for postretirement defined benefit pension plans through plan assets, investment returns, or contributions to the plans.
Actuarial assumptions required under GAAP to determine the projected benefit obligations and actuarial assumptions required under ERISA to determine contribution assumptions differ in their objectives. Actuarial assumptions regarding projected benefit obligations under GAAP affect the net periodic defined benefit cost presented within our Consolidated Statements of Operations. Actuarial assumptions used in the computation to estimate required contributions to the defined benefit plans affect funding requirements over a period of time.
We are responsible for the estimates regarding our postemployment benefits. However, we engage actuarial firms, who apply professional standards in the determination of the judgmental assumptions for plan contributions, to estimate both the contribution requirements for postemployment benefits and the associated projected benefit obligations under GAAP.
Projected benefit obligations are particularly sensitive to expected return on plan assets and the discount rate. The expected return on plan assets is the estimated long-term rates of return on plan assets that will be earned over the life of each plan. These projected returns reduce the net periodic defined benefit costs. The discount rate is used to compute the present value of benefits, which is based on projections of benefit payments to be made in the future. The objective in selecting the discount rate is to measure the single amount that, if invested at the measurement date in a portfolio of high-quality debt instruments, would provide the necessary future cash flows to pay the accumulated benefits when due. Please see Note 15 to the Annual Financial Statements for the weighted-average assumptions used for the discount rate and expected return on plan assets for all plans.
A variance in the discount rate or expected return on plan assets could have a significant impact on postretirement benefit obligations and annual net periodic pension costs. The following table displays the estimated increase (decrease) for defined benefit pension plans of a 1% increase and a 1% decrease in the discount rate and expected return on plan assets on the postretirement benefit obligation and net periodic pension cost as of December 31, 2024 (Successor).
| | | | | | | | | | | | | | |
| | Sensitivity |
| Actuarial Assumption | | 1% Increase | | 1% Decrease |
| Discount rate | | | | |
| Postretirement benefit obligation | | $ | (100) | | | $ | 138 | |
| Net periodic pension cost | | 3 | | | (5) | |
| Expected return on plan assets | | | | |
| Net periodic pension cost | | (10) | | | 10 | |
Income Taxes
Significant management estimates and judgments are involved to determine the provision for income taxes, deferred tax assets and liabilities, and valuation allowances.
An assessment is performed on a quarterly basis to determine the likelihood of realizing deferred tax assets. We assess the probability of realizing deferred tax assets by evaluating historical income after adjusting for certain nonrecurring items for purposes of projecting future income, our intent and ability to implement tax planning strategies, and performing scheduling of the reversal of temporary differences. We also evaluate negative evidence, such as the expiration of historical operating loss or tax credit carryforwards, that could indicate an inability to realize deferred tax assets. Based on the combined assessment, we recognize valuation allowances for deferred tax assets when it is more likely than not such benefit will not be realized in future periods.
Actual income taxes could vary from estimated amounts due to the future impacts of various items, including changes in income tax laws, forecasted financial conditions, and results of operations in future periods, as well as results of audits and examinations of filed tax returns by taxing authorities. See Note 7 to the Annual Financial Statements for additional information on income taxes.
Recent Accounting Pronouncements
See Note 2 to the Annual Financial Statements for a description of recently adopted accounting pronouncements and recently issued accounting pronouncements not yet adopted.
ITEM 7A. QUANTITATIVE AND QUALITATIVE DISCLOSURES ABOUT MARKET RISK
The forward-looking information presented below provides estimates of what may occur in the future, assuming certain adverse market conditions and model assumptions. Actual future results may differ materially from those presented. These disclosures are not precise indicators of expected future losses, but only indicators of possible losses under normal market conditions at a given confidence level.
Commodity Price Risk
Volatility in the wholesale power generation markets provides uncertainty in the future performance and cash flows of the business. The price risk Talen is exposed to includes the price variability associated with future sales and (or) purchases of power, natural gas, coal, uranium, oil products, environmental products and other energy commodities in competitive wholesale markets. Several factors influence price volatility, including: seasonal changes in demand; weather conditions; available regional load-serving supply; regional transportation and (or) transmission availability; market liquidity; and federal, regional, and state regulations.
Within the parameters of our risk policy, we generally utilize conventional first lien, exchange-traded, and over-the-counter traded derivative instruments and, in certain instances, structured products, to economically hedge the commodity price risk of the forecasted future sales and purchases of commodities associated with our generation portfolio.
Margin Sensitivities
The table below displays sensitivities for changes in projected margins based upon consistent changes in power prices across our entire portfolio. Actual price changes may differ by market and commodity, which could result in different results than displayed.
The base case for these sensitivities incorporates market prices, our economic hedge position, expected Nuclear PTC, and expected generation (including cost inputs and planned outages) as of December 31, 2024 (Successor):
| | | | | | | | | | | | | | | | | | | | | | | | | | | | | |
| | Sensitivity Range | | 2025 Margin Effect (a) | | 2026 Margin Effect (a) |
| | Low | High | | Low $ | High $ | | Low $ | High $ |
Change in power price per $/MWh (b) | | $ | (5) | | $ | 5 | | | $ | 7 | | $ | 42 | | | $ | (115) | | $ | 119 | |
__________________
(a)Margin price sensitivities hold constant certain microeconomic and macroeconomic factors that may impact our margin and the impact of changes in prices; value in millions and includes expected value of Nuclear PTC.
(b)Power price sensitivities hold market heat rate constant for each month; therefore, natural gas prices are adjusted accordingly.
Interest Rate Risk
We are exposed to interest rate risk from the possibility that changes in interest rates will affect future cash flows associated with existing floating rate debt issuances. To reduce interest rate risk, derivative instruments are utilized to economically hedge the interest rates for a predetermined contractual notional amount, which results in a cash settlement between counterparties. To the extent possible, first lien interest rate fixed-for-floating swaps are utilized to hedge this risk.
The following table displays the net fair value of interest rate swaps (including accrued interest, if applicable) outstanding at December 31, 2024 (Successor):
| | | | | | | | | | | | | | | | | | | | | | | | | | |
| | Notional Exposure | | Asset (Liability) | | 10% Adverse Movement (a) | | Maturities Through |
| Interest rate swaps | | $ | 290 | | | $ | (2) | | | $ | 6 | | | 2026 |
__________________
(a)Effect of a 10% adverse interest rate movement decreases assets or increases liabilities, as applicable, which could result in an asset becoming a liability.
Additionally, we are exposed to a potential increase in interest expense and to changes in the fair value of debt. The estimated impact of a 10% adverse movement in interest rates were:
| | | | | | | | | | | | | | |
| | Successor |
| | December 31, 2024 | | December 31, 2023 |
| Increase in interest expense | | $ | 6 | | | $ | 6 | |
| Fair value of debt | | 46 | | | 53 | |
Credit Risk
Credit risk is the risk of financial loss if a customer, counterparty, or financial institution is unable to perform or pay amounts due, causing a financial loss to us. Financial assets are considered credit-impaired when facts and circumstances reasonably indicate an event has occurred where the carrying value of the asset will not be recovered through cash settlement. Such events may include deterioration of a customer’s or counterparty’s financial health leading to a probable bankruptcy or reorganization, a breach of contract, or other economic reasons. Credit risk may impact accounts receivable, derivative instruments, cash and cash equivalents, and restricted cash and cash equivalents. The maximum amount of credit exposure associated with financial assets is equal to the carrying value. The carrying values of derivative instruments consider the probability that a counterparty will default when contracts are out of the money (from the counterparty’s standpoint). Additionally, a credit impairment is recognized on receivables when facts indicate a high probability that amounts owed to us will not be paid. Such allowances are presented as part of “Accounts receivable” on the Consolidated Balance Sheets. As of December 31, 2024 (Successor) and December 31, 2023 (Successor), there were no material credit impairments.
We maintain credit procedures with respect to counterparty credit (including requirements that counterparties maintain specified credit standards) and require other assurances in the form of credit support or collateral in certain circumstances in order to limit counterparty credit risk. However, we have concentrations of suppliers and customers among electric utilities, financial institutions, marketing and trading companies, and the U.S. government. These concentrations may impact our overall exposure to credit risk, positively or negatively, as counterparties may be similarly affected by changes in economic, regulatory, or other conditions.
See Note 5 in the Annual Financial Statements for additional information on credit risk.
Investment Price Risk
In accordance with certain NRC requirements, we maintain trust funds comprised of restricted assets that were established in order to fund our proportional share of Susquehanna's future decommissioning obligations. As of December 31, 2024 (Successor), the NDT was invested primarily in domestic equity securities, fixed-rate, fixed-income securities, and short-term cash-equivalent securities and is presented as fair value on the Consolidated Balance Sheets. The mix of securities is intended to provide returns sufficient to fund our proportional share of Susquehanna's decommissioning and to compensate for inflationary increases in decommissioning costs. However, the equity securities included in the NDT are exposed to price fluctuation in equity markets, and the values of fixed-rate, fixed-income securities are primarily exposed to changes in interest rates. We actively monitor the investment performance and periodically review the asset allocation in accordance with our nuclear decommissioning trust investment policy statement.
The following table shows the impact of a hypothetical 10% increase in interest rates and a 10% decrease in equity values:
| | | | | | | | | | | | | | |
| | Successor |
| | December 31, 2024 | | December 31, 2023 |
| Estimated increase (decrease) in the fair value of NDT assets | | $ | (104) | | | $ | (91) | |
See Notes 9 and 14 to the Annual Financial Statements for additional information regarding the NDT.
ITEM 8. FINANCIAL STATEMENTS AND SUPPLEMENTARY DATA
TALEN ENERGY CORPORATION AND SUBSIDIARIES
ITEM 8. TABLE OF CONTENTS | | | | | | | | |
| | Page |
| | |
| | |
| | |
| | |
| | |
| Consolidated Statements of Equity | | |
| | |
| | |
| | |
| | |
| | |
| | |
| | |
| | |
| | |
| | |
| | |
| | |
| | |
| | |
| | |
| | |
| | |
| | |
| | |
| | |
| | |
| | |
REPORT OF INDEPENDENT REGISTERED PUBLIC ACCOUNTING FIRM
To the Board of Directors and Stockholders of Talen Energy Corporation
Opinion on the Financial Statements
We have audited the accompanying consolidated balance sheets of Talen Energy Corporation and its subsidiaries (Successor) (the "Company") as of December 31, 2024 and 2023, and the related consolidated statements of operations, comprehensive income (loss), equity and cash flows for the year then ended December 31, 2024 and for the period from May 18, 2023 through December 31, 2023, including the related notes and financial statement schedule listed in the accompanying index (collectively referred to as the "consolidated financial statements"). In our opinion, the consolidated financial statements present fairly, in all material respects, the financial position of the Company as of December 31, 2024 and 2023, and the results of its operations and its cash flows for the year ended December 31, 2024 and for the period from May 18, 2023 through December 31, 2023 in conformity with accounting principles generally accepted in the United States of America.
Basis of Accounting
As discussed in Note 3 to the consolidated financial statements, the United States Bankruptcy Court for Southern District of Texas confirmed the Company's Plan of Reorganization (the "plan") in December 2022. Confirmation of the plan resulted in the discharge of all claims against the Company that arose before May 9, 2022 and substantially alters rights and interests of equity security holders as provided for in the plan. The plan was substantially consummated on May 17, 2023 and the Company emerged from bankruptcy. In connection with its emergence from bankruptcy, the Company adopted fresh start accounting as of May 17, 2023.
Basis for Opinion
These consolidated financial statements are the responsibility of the Company’s management. Our responsibility is to express an opinion on the Company’s consolidated financial statements based on our audit. We are a public accounting firm registered with the Public Company Accounting Oversight Board (United States) (PCAOB) and are required to be independent with respect to the Company in accordance with the U.S. federal securities laws and the applicable rules and regulations of the Securities and Exchange Commission and the PCAOB.
We conducted our audit of these consolidated financial statements in accordance with the standards of the PCAOB. Those standards require that we plan and perform the audit to obtain reasonable assurance about whether the consolidated financial statements are free of material misstatement, whether due to error or fraud.
Our audit included performing procedures to assess the risks of material misstatement of the consolidated financial statements, whether due to error or fraud, and performing procedures that respond to those risks. Such procedures included examining, on a test basis, evidence regarding the amounts and disclosures in the consolidated financial statements. Our audit also included evaluating the accounting principles used and significant estimates made by management, as well as evaluating the overall presentation of the consolidated financial statements. We believe that our audit provides a reasonable basis for our opinion.
Critical Audit Matters
The critical audit matter communicated below is a matter arising from the current period audit of the consolidated financial statements that was communicated or required to be communicated to the audit committee and that (i) relates to accounts or disclosures that are material to the consolidated financial statements and (ii) involved our especially challenging, subjective, or complex judgments. The communication of critical audit matters does not alter in any way our opinion on the consolidated financial statements, taken as a whole, and we are not, by communicating the critical audit matter below, providing a separate opinion on the critical audit matter or on the accounts or disclosures to which it relates.
Commodity Derivatives Valuation
As described in Notes 2, 5 and 14 to the consolidated financial statements, the Company had a fair value net derivative asset position of $71 million and a fair value net derivative liability position of $7 million, as of December 31, 2024. As disclosed by management, the Company utilizes exchange-traded and over the-counter traded derivative instruments to economically hedge the commodity price risk of the forecasted future sales and purchases of commodities associated with their generation portfolio. Commodity derivative contracts are valued using inputs and assumptions such as contractual volumes, delivery location, forward commodity prices, commodity price volatility, discount rates, and credit worthiness of counterparties.
The principal considerations for our determination that performing procedures relating to commodity derivative valuation is a critical audit matter are (i) the significant judgment by management when developing the valuation of commodity derivatives; (ii) a high degree of auditor judgment and effort in performing procedures and evaluating management’s significant assumptions related to the forward commodity prices and commodity price volatility; and (iii) the audit effort involved the use of professionals with specialized skill and knowledge.
Addressing the matter involved performing procedures and evaluating audit evidence in connection with forming our overall opinion on the consolidated financial statements. These procedures included, among others, (i) testing management’s process for developing the valuation of commodity derivatives; (ii) evaluating the appropriateness of management’s model; (iii) testing, on a sample basis, the completeness and accuracy of the underlying contract terms and the accounting treatment conclusions; and (iv) evaluating, on a sample basis, the reasonableness of the significant assumptions used by management related to forward commodity prices and commodity price volatility. Professionals with specialized skill and knowledge were used to assist in evaluating the reasonableness of forward commodity prices and commodity price volatility assumptions.
/s/ PricewaterhouseCoopers LLP
Houston, Texas
February 27, 2025
We have served as the Company’s auditor since 2017.
REPORT OF INDEPENDENT REGISTERED PUBLIC ACCOUNTING FIRM
To the Board of Managers and Members of Talen Energy Supply, LLC
Opinion on the Financial Statements
We have audited the consolidated statements of operations, comprehensive income (loss), equity and cash flows of Talen Energy Supply, LLC and its subsidiaries (Predecessor) (the “Company”) for the period from January 1, 2023 through May 17, 2023 and for the year then ended December 31, 2022, including the related notes (collectively referred to as the “consolidated financial statements”). In our opinion, the consolidated financial statements present fairly, in all material respects, the results of operations and cash flows of the Company for the period from January 1, 2023 through May 17, 2023 and for the year then ended December 31, 2022 in conformity with accounting principles generally accepted in the United States of America.
Basis of Accounting
As discussed in Note 3 to the consolidated financial statements, the Company filed a petition on May 9, 2022 with the United States Bankruptcy Court for the Southern District of Texas for reorganization under the provisions of Chapter 11 of the Bankruptcy Code. The Company’s Plan of Reorganization was substantially consummated on May 17, 2023 and the Company emerged from bankruptcy. In connection with its emergence from bankruptcy, the Company adopted fresh start accounting.
Basis for Opinion
These consolidated financial statements are the responsibility of the Company’s management. Our responsibility is to express an opinion on the Company’s consolidated financial statements based on our audits. We are a public accounting firm registered with the Public Company Accounting Oversight Board (United States) (PCAOB) and are required to be independent with respect to the Company in accordance with the U.S. federal securities laws and the applicable rules and regulations of the Securities and Exchange Commission and the PCAOB.
We conducted our audits of these consolidated financial statements in accordance with the standards of the PCAOB and in accordance with auditing standards generally accepted in the United States of America. Those standards require that we plan and perform the audit to obtain reasonable assurance about whether the consolidated financial statements are free of material misstatement, whether due to error or fraud.
Our audits included performing procedures to assess the risks of material misstatement of the consolidated financial statements, whether due to error or fraud, and performing procedures that respond to those risks. Such procedures included examining, on a test basis, evidence regarding the amounts and disclosures in the consolidated financial statements. Our audits also included evaluating the accounting principles used and significant estimates made by management, as well as evaluating the overall presentation of the consolidated financial statements. We believe that our audits provide a reasonable basis for our opinion.
/s/ PricewaterhouseCoopers LLP
Houston, Texas
March 14, 2024
We have served as the Company’s auditor since 2017.
Item 8. Table of Contents
TALEN ENERGY CORPORATION AND SUBSIDIARIES
CONSOLIDATED STATEMENTS OF OPERATIONS
| | | | | | | | | | | | | | | | | | | | | | | | | | | | | | | | | |
| | | | | | Successor | | | Predecessor |
| (Millions of Dollars, except share data) | | | | | | Year Ended December 31, 2024 | | May 18 through December 31, 2023 | | | January 1 through May 17, 2023 | | Year Ended December 31, 2022 |
| Capacity revenues | | | | | | $ | 192 | | | $ | 133 | | | | $ | 108 | | | $ | 377 | |
| Energy and other revenues | | | | | | 1,881 | | | 1,156 | | | | 1,042 | | | 2,035 | |
| Unrealized gain (loss) on derivative instruments (Note 5) | | | | | | 42 | | | 55 | | | | 60 | | | 677 | |
| Operating Revenues (Note 6) | | | | | | 2,115 | | | 1,344 | | | | 1,210 | | | 3,089 | |
| | | | | | | | | | | | | |
| Fuel and energy purchases | | | | | | (694) | | | (424) | | | | (176) | | | (938) | |
| Nuclear fuel amortization | | | | | | (123) | | | (108) | | | | (33) | | | (94) | |
| Unrealized gain (loss) on derivative instruments (Note 5) | | | | | | 20 | | | (3) | | | | (123) | | | (52) | |
| Energy Expenses | | | | | | (797) | | | (535) | | | | (332) | | | (1,084) | |
| | | | | | | | | | | | | |
| Operating Expenses | | | | | | | | | | | | | |
| Operation, maintenance and development | | | | | | (592) | | | (358) | | | | (285) | | | (610) | |
| General and administrative | | | | | | (163) | | | (93) | | | | (51) | | | (106) | |
| Depreciation, amortization and accretion (Note 10) | | | | | | (298) | | | (165) | | | | (200) | | | (520) | |
| Impairments (Note 10) | | | | | | (1) | | | (3) | | | | (381) | | | — | |
| Operational restructuring | | | | | | — | | | — | | | | — | | | (488) | |
| Other operating income (expense), net | | | | | | (38) | | | (30) | | | | (37) | | | (40) | |
| Operating Income (Loss) | | | | | | 226 | | | 160 | | | | (76) | | | 241 | |
| Nuclear decommissioning trust funds gain (loss), net (Note 9) | | | | | | 178 | | | 108 | | | | 57 | | | (184) | |
| Interest expense and other finance charges (Note 13) | | | | | | (238) | | | (176) | | | | (163) | | | (359) | |
| Reorganization income (expense), net (Note 4) | | | | | | — | | | — | | | | 799 | | | (812) | |
| Consolidation of subsidiary gain (loss) (Note 2) | | | | | | — | | | — | | | | — | | | (170) | |
| Gain (loss) on sale of assets, net (Note 20) | | | | | | 884 | | | 7 | | | | 50 | | | — | |
| Other non-operating income (expense), net | | | | | | 61 | | | 95 | | | | 10 | | | (44) | |
| Income (Loss) Before Income Taxes | | | | | | 1,111 | | | 194 | | | | 677 | | | (1,328) | |
| Income tax benefit (expense) (Note 7) | | | | | | (98) | | | (51) | | | | (212) | | | 35 | |
| Net Income (Loss) | | | | | | 1,013 | | | 143 | | | | 465 | | | (1,293) | |
| Less: Net income (loss) attributable to noncontrolling interest | | | | | | 15 | | | 9 | | | | (14) | | | (4) | |
| Net Income (Loss) Attributable to Stockholders (Successor) / Member (Predecessor) | | | | | | $ | 998 | | | $ | 134 | | | | $ | 479 | | | $ | (1,289) | |
| Per Common Share (Successor) | | | | | | | | | | | | | |
| Net Income (Loss) Attributable to Stockholders - Basic | | | | | | $ | 18.40 | | | $ | 2.27 | | | | N/A | | N/A |
| Net Income (Loss) Attributable to Stockholders - Diluted | | | | | | $ | 17.67 | | | $ | 2.26 | | | | N/A | | N/A |
| Weighted-Average Number of Common Shares Outstanding - Basic (in thousands) | | | | | | 54,254 | | | 59,029 | | | | N/A | | N/A |
| Weighted-Average Number of Common Shares Outstanding - Diluted (in thousands) | | | | | | 56,486 | | | 59,399 | | | | N/A | | N/A |
The accompanying Notes to the Annual Financial Statements are an integral part of the financial statements.
Item 8. Table of Contents
TALEN ENERGY CORPORATION AND SUBSIDIARIES
CONSOLIDATED STATEMENTS OF COMPREHENSIVE INCOME (LOSS)
| | | | | | | | | | | | | | | | | | | | | | | | | | | | | | | | | |
| | | | | | Successor | | | Predecessor |
| (Millions of Dollars) | | | | | | Year Ended December 31, 2024 | | May 18 through December 31, 2023 | | | January 1 through May 17, 2023 | | Year Ended December 31, 2022 |
| Net Income (Loss) | | | | | | $ | 1,013 | | | $ | 143 | | | | $ | 465 | | | $ | (1,293) | |
| Other Comprehensive Income (Loss) | | | | | | | | | | | | | |
| Available-for-sale securities unrealized gain (loss), net (Note 9) | | | | | | (14) | | | 2 | | | | 6 | | | (69) | |
| Postretirement benefit actuarial (gain) loss, net (Note 15) | | | | | | 5 | | | (38) | | | | — | | | (15) | |
| Postretirement benefit prior service (credits) costs, net (Note 15) | | | | | | 21 | | | — | | | | — | | | — | |
| Income tax benefit (expense) | | | | | | 5 | | | 8 | | | | (2) | | | 31 | |
| Gains (losses) arising during the period, net of tax | | | | | | 17 | | | (28) | | | | 4 | | | (53) | |
| Available-for-sale securities unrealized (gain) loss, net (Note 9) | | | | | | 1 | | | 7 | | | | 4 | | | 33 | |
| Qualifying derivatives unrealized (gain) loss, net | | | | | | — | | | — | | | | (1) | | | (2) | |
| Postretirement benefit prior service (credits) costs, net (Note 15) | | | | | | (1) | | | — | | | | — | | | 1 | |
| Postretirement benefit actuarial (gain) loss, net (Note 15) | | | | | | — | | | — | | | | 2 | | | 27 | |
| Income tax (benefit) expense | | | | | | (6) | | | (2) | | | | (3) | | | (21) | |
| Reclassifications from AOCI, net of tax | | | | | | (6) | | | 5 | | | | 2 | | | 38 | |
| Total Other Comprehensive Income (Loss) | | | | | | 11 | | | (23) | | | | 6 | | | (15) | |
| Comprehensive Income (Loss) | | | | | | 1,024 | | | 120 | | | | 471 | | | (1,308) | |
| Less: Comprehensive income (loss) attributable to noncontrolling interest | | | | | | 15 | | | 9 | | | | (14) | | | (4) | |
| Comprehensive Income (Loss) Attributable to Stockholders (Successor) / Member (Predecessor) | | | | | | $ | 1,009 | | | $ | 111 | | | | $ | 485 | | | $ | (1,304) | |
The accompanying Notes to the Annual Financial Statements are an integral part of the financial statements.
Item 8. Table of Contents
TALEN ENERGY CORPORATION AND SUBSIDIARIES
CONSOLIDATED BALANCE SHEETS
| | | | | | | | | | | | | | |
| | Successor |
| (Millions of Dollars, except share data) | | December 31,
2024 | | December 31,
2023 |
| Assets | | | | |
| Cash and cash equivalents | | $ | 328 | | | $ | 400 | |
| Restricted cash and cash equivalents (Note 19) | | 37 | | | 501 | |
| Accounts receivable (Note 6) | | 123 | | | 137 | |
| Inventory, net (Note 8) | | 302 | | | 375 | |
| Derivative instruments (Notes 5 and 14) | | 66 | | | 89 | |
| | | | |
| Other current assets | | 184 | | | 52 | |
| Total current assets | | 1,040 | | | 1,554 | |
| Property, plant and equipment, net (Note 10) | | 3,154 | | | 3,839 | |
| Nuclear decommissioning trust funds (Notes 9 and 14) | | 1,724 | | | 1,575 | |
| Derivative instruments (Notes 5 and 14) | | 5 | | | 6 | |
| Other noncurrent assets | | 183 | | | 147 | |
| Total Assets | | $ | 6,106 | | | $ | 7,121 | |
| | | | |
| Liabilities and Equity | | | | |
| | | | |
| | | | |
| Long-term debt, due within one year (Notes 13 and 14) | | $ | 17 | | | $ | 9 | |
| | | | |
| | | | |
| Accrued interest | | 18 | | | 32 | |
| Accounts payable and other accrued liabilities | | 266 | | | 344 | |
| Derivative instruments (Notes 5 and 14) | | — | | | 32 | |
| | | | |
| Other current liabilities | | 154 | | | 69 | |
| Total current liabilities | | 455 | | | 486 | |
| Long-term debt (Notes 13 and 14) | | 2,987 | | | 2,811 | |
| | | | |
| Derivative instruments (Notes 5 and 14) | | 7 | | | 11 | |
| Postretirement benefit obligations (Note 15) | | 305 | | | 368 | |
| Asset retirement obligations and accrued environmental costs (Note 11) | | 468 | | | 469 | |
| Deferred income taxes (Note 7) | | 362 | | | 407 | |
| Other noncurrent liabilities | | 135 | | | 35 | |
| Total Liabilities | | $ | 4,719 | | | $ | 4,587 | |
| Commitments and Contingencies (Note 12) | | | | |
| | | | |
| Stockholders' Equity (Note 18) | | | | |
| | | | |
| | | | |
| | | | |
| Additional paid-in capital | | 1,725 | | | 2,346 | |
| Accumulated retained earnings (deficit) | | (326) | | | 134 | |
| Accumulated other comprehensive income (loss) | | (12) | | | (23) | |
| Total Stockholders' Equity | | 1,387 | | | 2,457 | |
| Noncontrolling interests | | — | | | 77 | |
| Total Equity | | 1,387 | | | 2,534 | |
| Total Liabilities and Equity | | $ | 6,106 | | | $ | 7,121 | |
__________________
(a)45,961,910 and 59,028,843 shares issued and outstanding as of December 31, 2024 (Successor) and December 31, 2023 (Successor), respectively.
The accompanying Notes to the Annual Financial Statements are an integral part of the financial statements.
Item 8. Table of Contents
TALEN ENERGY CORPORATION AND SUBSIDIARIES
CONSOLIDATED STATEMENTS OF CASH FLOWS
| | | | | | | | | | | | | | | | | | | | | | | | | | | | | |
| | Successor | | | Predecessor |
| (Millions of Dollars) | | Year Ended December 31, 2024 | | May 18 through December 31, 2023 | | | January 1 through May 17, 2023 | | Year Ended December 31, 2022 |
| Operating Activities | | | | | | | | | |
| Net income (loss) | | $ | 1,013 | | | $ | 143 | | | | $ | 465 | | | $ | (1,293) | |
| Non-cash reconciliation adjustments: | | | | | | | | | |
| (Gain) loss on AWS Data Campus Sale and ERCOT Sale (Note 20) | | (886) | | | — | | | | — | | | — | |
| Depreciation, amortization and accretion (Note 19) | | 285 | | | 157 | | | | 208 | | | 549 | |
| NDT funds (gain) loss, net (excluding interest and fees) (Note 9) | | (130) | | | (78) | | | | (43) | | | 227 | |
| Nuclear fuel amortization (Note 10) | | 123 | | | 108 | | | | 33 | | | 94 | |
| Unrealized (gains) losses on derivative instruments (Note 5) | | (69) | | | (40) | | | | 65 | | | (647) | |
| Deferred income taxes | | (46) | | | 55 | | | | 195 | | | (48) | |
| Impairments (Note 10) | | 1 | | | 3 | | | | 381 | | | — | |
| (Gain) loss on sales of assets, net | | — | | | (7) | | | | (50) | | | — | |
| Reorganization (income) expense, net (Note 4) | | — | | | — | | | | (933) | | | 99 | |
| Operational restructuring | | — | | | — | | | | — | | | 488 | |
| Consolidation of subsidiary (gain) loss (Note 2) | | — | | | — | | | | — | | | 170 | |
| Other (Note 19) | | (26) | | | 7 | | | | 7 | | | 200 | |
| Changes in assets and liabilities: | | | | | | | | | |
| Inventory, net | | 67 | | | (68) | | | | 10 | | | (55) | |
| Accounts receivable | | 14 | | | 8 | | | | 261 | | | (298) | |
| Other assets | | (61) | | | 147 | | | | 98 | | | (46) | |
| Accounts payable and accrued liabilities | | (69) | | | (49) | | | | (69) | | | 187 | |
| Accrued interest | | (15) | | | 28 | | | | (124) | | | 250 | |
| Other liabilities | | 55 | | | (12) | | | | (42) | | | 310 | |
| Net cash provided by (used in) operating activities | | 256 | | | 402 | | | | 462 | | | 187 | |
| | | | | | | | | |
| Investing Activities | | | | | | | | | |
| NDT funds investment purchases (Note 9) | | (2,295) | | | (1,290) | | | | (959) | | | (2,271) | |
| NDT funds investment sale proceeds (Note 9) | | 2,263 | | | 1,265 | | | | 949 | | | 2,243 | |
| Proceeds from AWS Data Campus Sale and ERCOT Sale (Note 20) | | 1,398 | | | — | | | | — | | | — | |
| Nuclear fuel expenditures (Note 10) | | (104) | | | (45) | | | | (49) | | | (80) | |
| Property, plant and equipment expenditures (Note 10) | | (85) | | | (116) | | | | (138) | | | (232) | |
| Equity investments in affiliates | | (10) | | | (5) | | | | (8) | | | (162) | |
| Proceeds from the sale of assets | | 2 | | | 8 | | | | 46 | | | — | |
| Increase (decrease) in cash and restricted cash due to consolidation of subsidiaries | | — | | | — | | | | — | | | 123 | |
| Other investing activities | | 2 | | | 12 | | | | 2 | | | 11 | |
| Net cash provided by (used in) investing activities | | 1,171 | | | (171) | | | | (157) | | | (368) | |
Item 8. Table of Contents
TALEN ENERGY CORPORATION AND SUBSIDIARIES
CONSOLIDATED STATEMENTS OF CASH FLOWS
| | | | | | | | | | | | | | | | | | | | | | | | | | | | | |
| | Successor | | | Predecessor |
| (Millions of Dollars) | | Year Ended December 31, 2024 | | May 18 through December 31, 2023 | | | January 1 through May 17, 2023 | | Year Ended December 31, 2022 |
| Financing Activities | | | | | | | | | |
| Share repurchases (Note 18) | | (1,958) | | | — | | | | — | | | — | |
| TES debt issuance (Note 13) | | 849 | | | — | | | | — | | | — | |
| TES debt repayments (Note 13) | | (479) | | | — | | | | — | | | — | |
| Cumulus Digital TLF repayment (Note 13) | | (182) | | | (15) | | | | — | | | — | |
| Repurchase of noncontrolling interest (Note 18) | | (125) | | | (19) | | | | — | | | — | |
| Cash settlement of restricted stock units | | (32) | | | — | | | | — | | | — | |
| Exercise or repurchase of warrants (Note 18) | | (16) | | | (40) | | | | — | | | — | |
| Deferred financing costs | | (13) | | | (7) | | | | (74) | | | (59) | |
| LMBE-MC TLB payments | | — | | | (294) | | | | (7) | | | (52) | |
| TLB-1 proceeds, net | | — | | | 288 | | | | — | | | — | |
| Repayment of prepetition secured indebtedness (Note 4) | | — | | | — | | | | (3,898) | | | — | |
| Financing proceeds at Emergence, net of discount (Note 4) | | — | | | — | | | | 2,219 | | | — | |
| Contributions from member | | — | | | — | | | | 1,393 | | | — | |
| Payment of make-whole premiums on prepetition secured indebtedness | | — | | | — | | | | (152) | | | — | |
| Derivatives with financing elements | | — | | | — | | | | (20) | | | (104) | |
| Debtor-in-possession credit facilities proceeds, net | | — | | | — | | | | — | | | 987 | |
| Prepetition deferred capacity obligations repayments | | — | | | — | | | | — | | | (176) | |
| Prepetition inventory repurchase obligations, net increase (decrease) | | — | | | — | | | | — | | | (165) | |
| | | | | | | | | |
| Prepetition senior secured revolving credit facility proceeds | | — | | | — | | | | — | | | 62 | |
| Prepetition senior secured revolving credit facility repayments | | — | | | — | | | | — | | | (62) | |
| | | | | | | | | |
| Other | | (7) | | | 3 | | | | — | | | (5) | |
| Net cash provided by (used in) financing activities | | (1,963) | | | (84) | | | | (539) | | | 426 | |
| Net Increase (Decrease) in Cash and Cash Equivalents and Restricted Cash and Cash Equivalents | | (536) | | | 147 | | | | (234) | | | 245 | |
| Beginning of period cash and cash equivalents and restricted cash and cash equivalents | | 901 | | | 754 | | | | 988 | | | 743 | |
| End of period cash and cash equivalents and restricted cash and cash equivalents | | $ | 365 | | | $ | 901 | | | | $ | 754 | | | $ | 988 | |
See Note 19 for supplemental cash flow information.
The accompanying Notes to the Annual Financial Statements are an integral part of the financial statements.
Item 8. Table of Contents
TALEN ENERGY CORPORATION AND SUBSIDIARIES
CONSOLIDATED STATEMENTS OF EQUITY
| | | | | | | | | | | | | | | | | | | | | | | | | | | | | | | | | | | | | | | | | | | | | | | | | | |
| (Millions of Dollars, except share data) | | Common stock shares (a) | | Additional paid-in capital | | Accumulated earnings (deficit) | | AOCI | | Treasury stock | | Member's Equity | | Non
controlling Interest | | Total Equity |
| December 31, 2021 (Predecessor) | | — | | | $ | — | | | $ | — | | | $ | — | | | $ | — | | | $ | 733 | | | $ | — | | | $ | 733 | |
| Net income (loss) | | — | | | — | | | — | | | — | | | — | | | (1,289) | | | (4) | | | (1,293) | |
| Other comprehensive income (loss) | | — | | | — | | | — | | | — | | | — | | | (15) | | | — | | | (15) | |
| Non-cash consolidation of affiliate subsidiary | | — | | | — | | | — | | | — | | | — | | | — | | | 71 | | | 71 | |
| Non-cash distribution to member | | — | | | — | | | — | | | — | | | — | | | (2) | | | — | | | (2) | |
| Non-cash contribution from member | | — | | | — | | | — | | | — | | | — | | | — | | | 17 | | | 17 | |
| Cash contribution | | — | | | — | | | — | | | — | | | — | | | — | | | 7 | | | 7 | |
| | | | | | | | | | | | | | | | |
| | | | | | | | | | | | | | | | |
| | | | | | | | | | | | | | | | |
| December 31, 2022 (Predecessor) | | — | | | $ | — | | | $ | — | | | $ | — | | | $ | — | | | $ | (573) | | | $ | 91 | | | $ | (482) | |
| | | | | | | | | | | | | | | | |
| Net income (loss) | | — | | | — | | | — | | | — | | | — | | | 479 | | | (14) | | | 465 | |
| Other comprehensive income (loss) | | — | | | — | | | — | | | — | | | — | | | 6 | | | — | | | 6 | |
Cancellation of member’s equity (b) | | — | | | — | | | — | | | — | | | — | | | 88 | | | — | | | 88 | |
Issuance of member’s equity (b) | | — | | | — | | | — | | | — | | | — | | | 2,313 | | | — | | | 2,313 | |
Issuance of warrants (b) | | — | | | — | | | — | | | — | | | — | | | 8 | | | — | | | 8 | |
| Common equity from member’s equity exchange | | 59,029 | | | 2,321 | | | — | | | — | | | — | | | (2,321) | | | — | | | — | |
Non-cash contributions (c) | | — | | | — | | | — | | | — | | | — | | | — | | | 38 | | | 38 | |
Non-cash distributions (d) | | — | | | — | | | — | | | — | | | — | | | — | | | (5) | | | (5) | |
| | | | | | | | | | | | | | | | |
| May 17, 2023 (Predecessor) | | 59,029 | | | $ | 2,321 | | | $ | — | | | $ | — | | | $ | — | | | $ | — | | | $ | 110 | | | $ | 2,431 | |
| | | | | | | | | | | | | | | | |
| | | | | | | | | | | | | | | | |
| May 18, 2023 (Successor) | | 59,029 | | | $ | 2,321 | | | $ | — | | | $ | — | | | $ | — | | | $ | — | | | $ | 110 | | | $ | 2,431 | |
| Net income (loss) | | — | | | — | | | 134 | | | — | | | — | | | — | | | 9 | | | 143 | |
| Other comprehensive income (loss) | | — | | | — | | | — | | | (23) | | | — | | | — | | | — | | | (23) | |
Purchase of noncontrolling interest (e) | | — | | | 5 | | | — | | | — | | | — | | | — | | | (24) | | | (19) | |
| Cash contribution | | — | | | — | | | — | | | — | | | — | | | — | | | 1 | | | 1 | |
Non-cash distributions (d) | | — | | | — | | | — | | | — | | | — | | | — | | | (20) | | | (20) | |
| Stock-based compensation expense | | — | | | 19 | | | — | | | — | | | — | | | — | | | — | | | 19 | |
| Other | | — | | | 1 | | | — | | | — | | | — | | | — | | | 1 | | | 2 | |
| | | | | | | | | | | | | | | | |
| | | | | | | | | | | | | | | | |
| December 31, 2023 (Successor) | | 59,029 | | | $ | 2,346 | | | $ | 134 | | | $ | (23) | | | $ | — | | | $ | — | | | $ | 77 | | | $ | 2,534 | |
| | | | | | | | | | | | | | | | |
| Net income (loss) | | — | | | — | | | 998 | | | — | | | — | | | — | | | 15 | | | 1,013 | |
| Other comprehensive income (loss) | | — | | | — | | | — | | | 11 | | | — | | | — | | | — | | | 11 | |
| Share repurchases | | (13,227) | | | — | | | — | | | — | | | (1,977) | | | — | | | — | | | (1,977) | |
| Retirement of treasury stock | | — | | | (519) | | | (1,458) | | | — | | | 1,977 | | | — | | | — | | | — | |
Purchase of noncontrolling interest (e) | | — | | | (87) | | | — | | | — | | | — | | | — | | | (38) | | | (125) | |
| Cash settlement of restricted stock units | | — | | | (32) | | | — | | | — | | | — | | | — | | | — | | | (32) | |
| Exercise of warrants | | 160 | | | (16) | | | — | | | — | | | — | | | — | | | — | | | (16) | |
Cash distributions (f) | | — | | | — | | | — | | | — | | | — | | | — | | | (2) | | | (2) | |
Non-cash distributions (g) | | — | | | — | | | — | | | — | | | — | | | — | | | (52) | | | (52) | |
| Stock-based compensation expense | | — | | | 33 | | | — | | | — | | | — | | | — | | | — | | | 33 | |
| December 31, 2024 (Successor) | | 45,962 | | | $ | 1,725 | | | $ | (326) | | | $ | (12) | | | $ | — | | | $ | — | | | $ | — | | | $ | 1,387 | |
__________________
(a)Shares in thousands.
(b)Pursuant to the Plan of Reorganization: (i) existing equity interests were canceled; and (ii) new equity interests and equity-classified warrants were issued.
(c)Related to contributions of cryptocurrency miners by TeraWulf to Nautilus.
(d)Related primarily to distributions of Bitcoin to TeraWulf.
(e)TES acquisition of remaining noncontrolling interests in Cumulus Digital and Nautilus. See Note 18 for additional information.
(f)Distributions to noncontrolling interest owners of Cumulus Digital and Nautilus.
(g)Related primarily to distribution of Bitcoin and cryptocurrency miners to TeraWulf.
The accompanying Notes to the Annual Financial Statements are an integral part of the financial statements.
Item 8. Table of Contents
TALEN ENERGY CORPORATION AND SUBSIDIARIES
NOTES TO THE ANNUAL FINANCIAL STATEMENTS
Capitalized terms and abbreviations appearing in these Notes to the Annual Financial Statements Financial Statements are defined in the glossary. Dollars are in millions, unless otherwise noted.
“TEC” refers to Talen Energy Corporation. “TES” refers to Talen Energy Supply, LLC. For periods after May 17, 2023, the terms “Talen,” “Successor,” the “Company,” “we,” “us,” and “our” refer to TEC and its consolidated subsidiaries (including TES), unless the context clearly indicates otherwise. For periods on or before May 17, 2023, the terms “Talen,” “Predecessor,” the “Company,” “we,” “us,” and “our” refer to TES and its consolidated subsidiaries, unless the context clearly indicates otherwise. See Note 2 for additional information. This presentation has been applied where identification of subsidiaries is not material to the matter being disclosed, and to conform narrative disclosures to the presentation of financial information on a consolidated basis. When identification of a subsidiary is considered important to understanding the matter being disclosed, the specific entity’s name is used. Each disclosure referring to a subsidiary also applies to TEC insofar as such subsidiary’s financial information is included in TEC’s consolidated financial information. TEC and each of its subsidiaries and affiliates are separate legal entities and, except by operation of law, are not liable for the debts or obligations of one another absent an express contractual undertaking to the contrary.
1. Organization and Operations
Talen is a leading independent power producer and energy infrastructure company dedicated to powering the future. We own and operate approximately 10.7 gigawatts of power infrastructure in the United States, including 2.2 gigawatts of nuclear power and a significant dispatchable generation fleet. We produce and sell electricity, capacity, and ancillary services into wholesale U.S. power markets, with our generation fleet principally located in the Mid-Atlantic and Montana. Talen is headquartered in Houston, Texas.
2. Basis of Presentation and Summary of Significant Accounting Policies
Basis of Presentation and Principles of Consolidation
These Annual Financial Statements, which are prepared in accordance with GAAP, include: (i) the accounts of all controlled subsidiaries; (ii) elimination adjustments for intercompany transactions between controlled subsidiaries; (iii) any undivided interests in jointly owned facilities consolidated on a proportionate basis; and (iv) all adjustments considered necessary for a fair presentation of the information set forth. All adjustments are of a normal recurring nature except as otherwise disclosed.
Emergence from Restructuring, Fresh Start Accounting, and Reverse Acquisition. In May 2022, TES and 71 of its subsidiaries voluntarily commenced the Restructuring under Chapter 11 of the U.S. Bankruptcy Code. TEC joined the Restructuring in December 2022. The Plan of Reorganization was approved by the requisite parties and confirmed by the bankruptcy court in late 2022, and was consummated and became effective in May 2023, when TEC, TES, and the other debtors emerged from the Restructuring.
Upon commencement of the Restructuring, TES was deconsolidated from TEC for financial reporting purposes because TEC no longer controlled TES. TEC regained control of TES at Emergence, which resulted in TEC’s reconsolidation of TES. The combination was accounted for as a reverse acquisition in which TEC was the legal acquirer and TES was the accounting acquirer. Accordingly, these Annual Financial Statements are issued under the name of TEC, the legal parent of TES and accounting acquiree, but represent the continuation of the financial statements of TES, the accounting acquirer.
After Emergence, TES applied fresh start accounting, which resulted in a new basis of accounting, as the Company became a new financial reporting entity. As a result of the application of fresh start accounting and the implementation of the Plan of Reorganization, our financial position and results of operations beginning after Emergence are not comparable to our financial position or results of operations prior to that date. The financial results are presented for: (i) the Predecessor periods from January 1 through May 17, 2023 (Predecessor) and the year ended December 31, 2022 (Predecessor); and (ii) the Successor periods from May 18 through December 31, 2023 (Successor) and the year ended December 31, 2024 (Successor). These Annual Financial Statements and notes hereto have been presented with a black line division to delineate the lack of comparability between the Predecessor and Successor.
See Note 3 for additional information on the Restructuring and Note 4 for additional information on fresh start accounting.
Consolidation of an Affiliate’s Subsidiary. In September 2022, as part of a settlement of certain matters in the Restructuring, TES exchanged preferred units in subsidiaries of Cumulus Digital for common units in Cumulus Digital. Following the consummation of the exchange and other related transactions, TES became the primary beneficiary of Cumulus Digital, a variable interest entity, due to its ability to control the activities that most significantly impacted Cumulus Digital. Accordingly, Cumulus Digital and its subsidiaries were consolidated by TES as of September 30, 2022. The difference between (i) the fair value of Cumulus Digital and its subsidiaries; and (ii) the carrying value of the preferred units immediately before the exchange resulted in a loss of 170 million presented as “Consolidation of subsidiary gain (loss)” on the Consolidated Statements of Operations for the year ended December 31, 2022 (Predecessor).
Item 8. Table of Contents
Summary of Significant Accounting Policies
Reclassifications. Certain amounts in the prior period financial statements were reclassified to conform to the current period’s presentation. The reclassifications did not affect operating income, net income, total assets, total liabilities, net equity, or cash flows.
Use of Estimates. The preparation of financial statements in conformity with GAAP requires management to make estimates and assumptions that affect the reported amounts of assets and liabilities, the disclosure of contingent liabilities at the date of the financial statements, and the reported amounts of revenues and expenses during the reporting period. Actual results could differ from those estimates.
Restructuring Effects. Income, expenses, gains, or losses that were incurred or realized as a direct result of the Restructuring since entering bankruptcy proceedings are presented as “Reorganization income (expense), net” on the Consolidated Statements of Operations.
See Notes 3 and 4 for additional information on the Restructuring and fresh start accounting.
Fair Value of Financial Instruments and Derivatives. We carry a portion of our assets and liabilities at fair value that are measured at a reporting date using an exit price (i.e., the price that would be received to sell an asset or paid to transfer a liability). An exit price may be developed under a market approach utilizing market transactions, an income approach utilizing present value techniques, or a replacement cost approach. The exit prices are disclosed according to the quality of valuation inputs under a three-tiered hierarchy comprised of: (i) Level 1 inputs that are quoted prices (unadjusted) in active markets for identical assets or liabilities; (ii) Level 2 inputs that are other than quoted prices that are directly or indirectly observable; and (iii) Level 3 inputs are unobservable inputs for assets or liabilities.
The classification of an asset or liability is based on the lowest level of input significant to its fair value. Those initially classified as Level 3 are subsequently reported as Level 2 when the fair value derived from unobservable inputs is inconsequential to the overall fair value, or if corroborated market data becomes available. Those initially classified as Level 2 are subsequently reported as Level 3 if corroborated market data is no longer available. Transfers occur at the end of the reporting period.
See Notes 5, 10, 14, and 15 for fair value disclosures.
Operating Revenues and Revenue Recognition. Operating revenues on the Consolidated Statements of Operations are primarily comprised of items presented as: (i) “Capacity revenues;” (ii) “Energy and other revenues;” and (iii) “Unrealized gain (loss) on derivative instruments” for certain electricity contracts.
Capacity revenues. Includes amounts earned from auctions in ISOs and RTOs and under bilateral contracts to provide available generation capacity that is needed to satisfy system reliability and integrity requirements. Capacity revenues are recognized ratably over the PJM Capacity Year by Talen-owned generation facilities that participate in the auctions and stand ready to deliver generated power. Capacity revenues are based on invoiced amounts corresponding directly to the value provided over a specific time interval.
Energy and other revenues.
Energy revenues primarily include: (i) amounts earned from sales to ISOs and RTOs for electric generation and ancillary services products that support transmission and grid operations; (ii) amounts earned for wholesale electricity sales to bilateral counterparties; and (iii) realized gains and losses on commodity derivative instruments.
Sales of each electric generation and ancillary services to ISOs and RTOs represent performance obligations recognized over time based on volumes delivered or services performed at contractually agreed upon day-ahead or real-time market prices.
Sales of wholesale electricity to bilateral counterparties represent performance obligations recognized over a contractually agreed period of time based on volumes delivered at the contractually agreed price.
Sales of electric generation, ancillary services, and wholesale electricity to bilateral counterparties are recognized based on invoiced amounts which corresponds directly with the value provided over a specific time interval.
Certain contracts constitute bundled agreements to sell energy, capacity, and (or) ancillary services. In such cases, all performance obligations are deemed to be delivered and (or) performed at the same time. Accordingly, as the timing of revenue recognition for all performance obligations is the same and occurs over a contractually agreed period of time, it is unnecessary to allocate transaction price to multiple performance obligations.
Item 8. Table of Contents
Realized gains and losses on commodity derivative instruments include the settlements of financial and physical power transactions utilized for the Company’s commercial risk management objectives. Realized settlements of these derivative instruments are recognized and presented net within “Energy and other revenues” on the Consolidated Statements of Operations based on the delivery period of the underlying contract at contractually agreed prices. See “Energy Expenses” below for additional information on realized gains and losses of derivative instruments presented as “Fuel and energy purchases” on the Consolidated Statements of Operations.
Other revenues primarily include: (i) Nuclear PTC revenues; and (ii) Nautilus revenues from Bitcoin mining.
The Nuclear PTC program provides qualified nuclear power generation facilities with transferable credits for electricity produced and sold to an unrelated party during each tax year. These credits, which are accounted for by analogy to income-based grants under international accounting standards for government grants and disclosure of government assistance, are recognized when there is reasonable assurance that the Company will comply with the applicable conditions and that the credit will be received, which is generally over the period of production. As the credits that are generated each tax year are based on annual gross receipts and production volumes, the measurement of the credit value is estimated at each period until the final value can be determined at the end of the year, which may be different than the estimated amount. The credit value includes a five-times multiplier (up to $15 per MWh) for meeting prevailing wage requirements. Accordingly, Nuclear PTCs are recognized based on production volumes generated during the period and measured at the credit value for the tax year. See Note 6 for amounts recognized, which are presented as “Energy and other revenues” on the Consolidated Statements of Operations and “Other current assets” on the Consolidated Balance Sheets. Credits that are utilized to reduce federal income taxes payable are presented as a reduction of “Other current liabilities” on the Consolidated Balance Sheets. There have been no transfers of Nuclear PTCs to third parties during the year ended December 31, 2024 (Successor). Additional guidance expected to be issued from the U.S. Treasury and IRS may impact the credit value recognized.
The primary output of Nautilus’s ordinary business activities is providing hash calculation services to solve complex cryptographic algorithms in support of blockchain mining. Nautilus is party to a mining pool arrangement to provide an unspecified amount of its available hash calculations to an unaffiliated mining pool operator. Nautilus is entitled to an enforceable right to compensation from the mining pool operator only for the duration of time over which Nautilus provides its hash calculations.
In exchange for providing hash calculation services to the mining pool operator, Nautilus is entitled to consideration, whether or not the mining pool operator successfully solves a block, based on a ‘full-pay-per-share’ payout methodology. Nautilus’s only performance obligation is to provide hash calculations to the mining pool operator. If Nautilus does not provide hash calculations to the mining pool operator, no consideration is earned by Nautilus nor does Nautilus incur any penalties from the mining pool operator. The Bitcoin earned by Nautilus is all variable noncash consideration. Accordingly, Nautilus recognizes revenue that is measured at fair value using the quoted price for Bitcoin in Nautilus’s principal market at the beginning of each day (Coordinated Universal Time). Nautilus operations were suspended in October 2024.
Unrealized gain (loss) on derivative instruments. Includes unrealized gains and losses resulting from changes in the fair value of certain power contracts that qualify as derivative instruments. See “Derivative Instruments” below for the recognition criteria of unrealized gains and losses on commodity derivative instruments. See “Energy Expenses” below for additional information on unrealized gains and losses of derivative instruments presented as “Energy Expenses” on the Consolidated Statements of Operations.
See Note 6 for additional information on revenue.
Energy Expenses. Energy expenses on the Consolidated Statements of Operations are primarily comprised of items presented as: (i) “Fuel and energy purchases;” (ii) “Nuclear fuel amortization;” and (iii) “Unrealized gain (loss) on derivative instruments” for certain commodity purchase contracts.
Fuel and energy purchases. Primarily includes: (i) fuel costs; (ii) environmental product costs; and (iii) realized gain (loss) on commodity derivative instruments.
Fuel costs include the costs incurred by Talen-owned generation facilities for the conversion of natural gas, coal, and (or) oil products to electricity. Fuel for electric generation from natural gas purchases are recognized at the agreed price for natural gas delivered to the applicable generation facility over a contractually agreed period of time. Fuel for electric generation from coal and oil product inventories are recognized at the applicable weighted average inventory cost of volumes consumed.
Environmental product costs primarily include RGGIs and other emission product compliance costs that are mandated by certain states. The estimated cost of compliance is accrued at the time an obligation under the applicable terms of each state's environmental compliance program arises.
Realized gains and losses on commodity derivative instruments primarily include the settlements of financial and physical fuel contracts utilized for the Company’s commercial risk management objectives. Realized settlements of these derivative instruments are recognized and presented net within “Fuel and energy purchases” on the Consolidated Statements of Operations based on the delivery period of the underlying contract at contractually agreed prices. See “Operating Revenues and Revenue Recognition” above for additional information on realized gains and losses on derivative instruments presented as “Energy and other revenues” on the Consolidated Statements of Operations.
Item 8. Table of Contents
Nuclear fuel amortization. Nuclear fuel-related costs, including procurement of uranium, conversion, enrichment, fabrication and assemblies, are capitalized and presented as “Property, plant and equipment, net” on the Consolidated Balance Sheets and presented as a cash outflow within the investing activities section on the Consolidated Statements of Cash Flows. Such costs are amortized as the fuel is consumed using the units-of-production method and presented as “Nuclear fuel amortization” on the Consolidated Statements of Operations.
Unrealized gain (loss) on derivative instruments. Includes unrealized gains and losses resulting from changes in the fair value of certain fuel contracts and environmental product contracts that qualify as derivative instruments. See “Derivative Instruments” below for the recognition criteria of unrealized gains and losses on commodity derivative instruments. See “Operating Revenues and Revenue Recognition” above for additional information on unrealized gains and losses of derivative instruments presented as “Operating Revenues” on the Consolidated Statements of Operations.
Derivative Instruments. The fair value of derivative contracts required to be measured at fair value are presented as “Derivative instruments” within assets or liabilities on the Consolidated Balance Sheets. The primary type of derivative instruments utilized are commodity derivatives. Commodity derivative contracts are valued using inputs and assumptions such as contractual volumes, delivery location, forward commodity prices, commodity price volatility, discount rates, and credit worthiness of counterparties. For derivatives that trade in liquid markets, such as generic forwards, swaps, and options, the inputs and assumptions are generally observable. Such instruments are categorized in Level 2.
In most instances, master netting agreements govern derivative transactions between parties and contain certain provisions for setoff rights. The fair value of derivative instruments is presented net of setoff rights and cash collateral deposits. The fair value of commercial contracts that are not subject to netting and (or) collateral provisions is presented gross. Prior to Emergence, the fair value of derivative instruments presented on the Consolidated Balance Sheets was presented gross of setoff rights and cash collateral deposits exchanged between parties under such arrangements.
Unrealized gains or losses associated with a derivative instrument that economically hedges certain risks but where qualified cash flow hedge accounting is not elected or not met are presented on the Consolidated Statements of Operations in the period when such gains or losses arise. As there are no derivatives where qualified hedge accounting has been elected, changes in the fair value of commodity derivatives are presented as “Unrealized gain (loss) on derivative instruments,” as a component of either “Operating Revenues” or “Energy Expenses” on the Consolidated Statements of Operations in a manner consistent with the presentation of net realized gains and losses. See “Operating Revenues” and “Energy Expenses” above for a discussion of net realized gains and losses on commodity derivatives. The cumulative net gains or losses for interest rate contracts are presented as “Interest expense and other finance charges” on the Consolidated Statements of Operations.
See Notes 5 and 14 for additional information on the presentation of derivative contracts and fair value measurements.
Operation, Maintenance and Development. The costs of removal, repairs, maintenance, and other operating costs, pre-commercial development activities, and salaries and benefits for operations personnel that each do not meet capitalization criteria are recognized as an expense when incurred. Materials and supplies inventories are recognized as an expense at the weighted average cost of materials consumed as they are used for repairs and maintenance. Costs for pre-commercial development stages of certain projects that are not capitalized as “Property, plant and equipment, net” on the Consolidated Balance Sheets and recurring operational and maintenance activities are each presented as “Operation, maintenance and development” on the Consolidated Statements of Operations. Development expenses incurred are primarily for pre-commercial activities at Nautilus and hyperscale construction activities at Cumulus Digital.
Stock-Based Compensation. TEC grants performance stock units (“PSUs”) and restricted stock units (“RSUs”) to certain employees and non-employee directors. The fair value of PSUs is estimated on the grant date utilizing a Monte Carlo Valuation Model, which contains significant unobservable inputs that are believed to be consistent with those used by principal market participants. The fair value of RSUs is derived from the closing price of TEC common stock at the grant date. Forfeitures are recognized as they occur. Unvested PSUs and RSUs are entitled to dividends or dividend equivalents, which are accrued and distributed to award recipients at the time such awards vest. Dividends and dividend equivalents are subject to the same vesting and forfeiture provisions as the underlying awards. Stock-based compensation expense is recognized for both graded and cliff vesting awards on a straight-line basis over the requisite service period for the entire award. Stock-based compensation expense is presented as “General and administrative” on the Consolidated Statements of Operations.
See Note 16 for additional information on stock-based compensation.
Income Taxes. TEC and its subsidiaries file a consolidated U.S. federal income tax return. Income taxes are accounted for under the asset and liability method. Deferred tax assets and liabilities are recognized for the future tax consequences attributable to differences between the financial statement carrying values of existing assets and liabilities and their respective tax basis, tax credits and NOL carryforwards. Deferred tax assets and liabilities are measured using enacted tax rates expected to apply to taxable income in the years in which temporary differences are expected to be recovered or settled. The effect on deferred tax assets and liabilities due to a change in tax rates is recognized as income in the period that includes the enactment date. Valuation allowances are recognized to reduce deferred tax assets to the extent necessary to result in an amount that is more likely than not to be realized. Disproportionate income tax effects are removed from AOCI when the circumstance upon which they are premised ceases to exist.
Item 8. Table of Contents
The financial statement effect of a tax position is recognized when it is more-likely-than-not, based on the technical merits, that the position will be sustained upon examination. A tax position that meets the more-likely-than-not recognition threshold is measured as the largest amount of tax benefit that is greater than 50% likely of being realized upon ultimate settlement with a taxing authority. A previously recognized tax position is reversed in the first period in which it is no longer more-likely-than-not that the tax position would be sustained upon examination. Interest and penalties from tax uncertainties are presented as “Income tax benefit (expense)” on the Consolidated Statements of Operations.
See Note 7 for additional information on income taxes.
Loss Contingencies. Potential losses are accrued when: (i) information is available that indicates it is probable (i.e., likely to occur) that a loss has been incurred, given the likelihood of the uncertain future events; and (ii) the amount of the loss can be reasonably estimated. We continuously assess potential loss contingencies for environmental remediation, litigation claims, regulatory penalties and other events. Loss contingencies are discounted when appropriate. Legal costs are expensed as incurred. See Note 12 for additional information.
Concentrations of Credit Risk. Concentrations of credit risk exist primarily within cash and cash equivalents, receivables, and commodity derivative assets. Cash and cash equivalents are generally held in accounts where the amounts deposited exceed the maximum deposit insurance provided by the Federal Deposit Insurance Corporation. Cash and cash equivalents and restricted cash balances are primarily deposited in accounts with major financial institutions with investment grade credit ratings. In certain instances, funds are invested in highly liquid U.S. Treasury securities or other obligations with original maturities of less than 90 days that are issued by or guaranteed by the U.S. Government. Concentrations of credit risk for receivables are primarily attributable to entities that reimburse Talen for certain capital expenditures and operating costs associated with jointly owned facilities. Concentrations of credit risk for commodity derivative assets are primarily attributable to unaffiliated investment grade counterparties which engage in energy marketing activities with Talen Energy Marketing. See Note 5 for additional information on concentrations of credit risk.
Cash and Cash Equivalents. Bank deposits, liquid investments, and other similar assets with original maturities of three months or less. Bank deposits, commodity exchange deposits, liquid investments, and other similar assets with original maturities of three months or less that are restricted by agreement are presented as “Restricted cash and cash equivalents” on the Consolidated Balance Sheets. See Note 19 for additional information.
Accounts Receivable. Receivables primarily consist of amounts due from customers or other contract counterparties, net of any collection allowances. Uncollected receivables greater than 30 days past due are assessed for collectability based on a variety of factors that include, but are not limited to, customer credit worthiness, duration receivables are outstanding, and (or) historical collection experience. Management continuously assesses and considers current economic trends that might impact the amount of future credit losses. Additionally, if it becomes known that a specific customer may have the inability to settle its obligation that is not yet past due, such receivables are assessed for collectability. If these assessments indicate a receivable collection is remote, its carrying value is reduced through an allowance for doubtful accounts measured at management’s best estimate, and a charge is presented on the Consolidated Statements of Operations. If any portion of the original carrying value of the receivable is recovered, the allowance and the associated charge are reversed in the period of collection.
Inventory. Inventory consists of fuel for generation (primarily coal and fuel oil), materials and supplies, and environmental products each of which are valued at the lower of weighted average cost or net realizable value. See Note 8 for additional information on inventory.
Variable Interest Entities. The primary beneficiary (a controlling financial interest) of a VIE is required to consolidate the VIE when it has both: (i) the power to direct the activities that most significantly impact the entity’s economic performance; and (ii) the obligation to absorb losses or receive benefits from the entity that could potentially be significant to the VIE. Talen consolidates a VIE when it is determined that it is the primary beneficiary of the VIE. Investments in entities in which Talen has the ability to exercise significant influence but does not have a controlling financial interest are accounted for under the equity method.
Investments in Debt and Equity Securities. The NDT holds investments in available-for-sale debt securities and equity securities, which are carried at fair value and presented as “Nuclear decommissioning trust funds” on the Consolidated Balance Sheets.
Unrealized gains and losses, net of income tax, on available-for-sale debt securities are presented as “Other Comprehensive Income (Loss)” on the Consolidated Statements of Comprehensive Income in the period when such gains and losses arise. Realized gains and losses on available-for-sale debt securities are transferred from AOCI to “Nuclear decommissioning trust funds gain (loss), net” on the Consolidated Statements of Operations in the period when the sale of the security occurs. The specific identification method is used to calculate realized gains and losses on debt and equity securities. If an available-for-sale debt security's fair value declines below cost and the decline is determined to be other-than-temporary, the unrealized loss is recognized on the Consolidated Statements of Comprehensive Income in the period when such determination arises.
Unrealized gains and losses and realized gains and losses on equity securities are presented as “Nuclear decommissioning trust funds gain (loss), net” on the Consolidated Statements of Operations in the period when such gains or losses arise.
See Notes 9 and 14 for additional information on investments in debt and equity securities.
Item 8. Table of Contents
Property, Plant and Equipment. Expenditures for land, the construction of facilities, the addition or refurbishment of major equipment, and commercially viable new development projects are capitalized at cost. Such capitalized amounts include interest costs, where appropriate. Facilities, land, and other equipment acquired in a business combination is recognized at fair value. In each case, such amounts are presented as “Property, plant and equipment, net” on the Consolidated Balance Sheets. Reductions in the carrying value of PP&E are accumulated over the estimated useful life of each depreciable unit using straight-line or group depreciation methods, where appropriate. Such periodic reduction is presented as a charge to “Depreciation, amortization and accretion” on the Consolidated Statements of Operations. Generally, upon normal retirement of PP&E under the group depreciation method, the costs of such assets are retired against accumulated depreciation in the period of the retirement and no gain or loss is recognized. Any remaining carrying value of PP&E at its retirement date that depreciated under the straight-line depreciation method is presented as a loss within “Other operating income (expense), net” on the Consolidated Statements of Operations. Any remaining carrying value of PP&E at its sale date and any proceeds from the disposition are presented as a gain or loss net on the Consolidated Statements of Operations.
Expenditures for intangible assets such as contractual rights, software and licenses are capitalized at cost and are presented as “Property, plant and equipment, net” on the Consolidated Balance Sheets. Reductions in the carrying value of intangible assets with finite useful lives are accumulated over the estimated useful life of each intangible asset using an amortization pattern which reflects the economic benefits of the intangible asset. Such periodic reduction is presented as a charge to “Depreciation, amortization and accretion” on the Consolidated Statements of Operations.
See “Impairments” below for additional information regarding impairments on the carrying values of PP&E.
See Note 10 for additional information on PP&E.
Impairments. PP&E used in operations are assessed for impairment whenever changes in facts and circumstances indicate the carrying value of the asset group may not be recoverable. Indicators of impairment may include changes in the economic environment, negative financial trends, physical damage to assets or decisions of management regarding strategic initiatives. Where applicable, individual assets are grouped for impairment purposes at the lowest level for which there are identifiable cash flows that are largely independent of the cash flows of other assets and liabilities. If there is an indication the carrying value of an asset group may not be recovered, management reviews the expected future cash flows of the asset group. If the sum of the undiscounted pre-tax cash flows is less than the carrying value of the asset group, the asset group is written down to its estimated fair value. Impairment charges are presented as “Impairments” on the Consolidated Statements of Operations in the period in which the impairment condition arises. If facts and circumstances indicate that the carrying value of an asset under construction will have no future economic benefit, such amounts are presented on the Consolidated Statements of Operations in the period in which such projects are abandoned, canceled, or management otherwise determines the costs to be unrecoverable.
Fair value may be determined by a variety of valuation methods including third-party appraisals, market prices of similar assets, and present value techniques. However, as there is generally a lack of quoted market prices for long-lived assets, the fair value of impaired assets is typically determined based on the present values of expected future cash flows using discount rates that are believed to be consistent with those used by principal market participants. The estimated cash flows and related fair value computations consider all available evidence at the date of the review, such as estimated future generation volumes, forward capacity and commodity prices, energy prices, operating costs, capital expenditures, and environmental costs.
See Note 10 for information on impairments.
Asset Retirement Obligations. A liability for an ARO or conditional ARO exists when a legal obligation arises from laws, regulations or other contractual requirements for the retirement of tangible long-lived assets. When an ARO liability is incurred, which is typically at asset construction or through assumption of the liability in connection with a business combination, it is initially recognized at fair value. Fair value measurements are estimated under a present value technique and are discounted using a credit-adjusted risk-free rate. Additionally, given the inherent uncertainty in estimating the amount of cash flows to settle an ARO liability or its settlement date, fair value estimates include a market risk premium and a range of possible cash flow outcomes, where applicable. At the initial recognition, the effects on the Consolidated Balance Sheets include: (i) an increase to “Asset retirement obligations and accrued environmental costs” for the portion of ARO to be settled after one year and (or) “Other current liabilities” for the portion of the ARO to be settled within one year; and (ii) an offsetting increase to “Property, plant and equipment, net” for the asset retirement capitalized cost. Estimated future ARO cash expenditures and settlement dates are reviewed periodically to identify any required amendments to the carrying value of each ARO liability.
ARO liabilities increase over a period of time through the recognition of accretion expense to recognize changes in the obligation due to the passage of time. The asset retirement capitalized cost is depreciated at a rate consistent with the useful life of the associated long-lived asset. The depreciation of the asset retirement capitalized cost and the accretion of the ARO liability are each presented as “Depreciation, amortization and accretion” on the Consolidated Statements of Operations. An ARO liability amendment associated with a long-lived asset that is not fully impaired or depreciated is recognized through an adjustment to the ARO liability and the asset retirement capitalized cost. Any revision to the asset retirement capitalized cost is generally depreciated over the remaining life of the associated long-lived asset. An ARO liability amendment associated with a fully impaired or depreciated asset is presented as “Other operating income (expense), net” on the Consolidated Statements of Operations. At settlement, a gain or loss will arise if the cash expenditures to settle the ARO liabilities are different than the carrying values. Such gains or losses are presented as “Other operating income (expense), net” on the Consolidated Statements of Operations.
Item 8. Table of Contents
A conditional ARO refers to an entity’s legal obligation to perform an asset retirement activity in which the timing or method of settlement is conditional on a future event that may or may not be within the entity’s control, including legal or regulatory requirements. There may also be instances when there is no available information regarding the ultimate ARO settlement timing or the fair value of the obligation may not be reasonably estimable. If sufficient information becomes available to reasonably estimate the fair value of the liability for an ARO or a conditional ARO, a liability is recognized in the period in which it is determined.
See Note 11 for additional information on AROs.
Contingencies. Management continuously assesses potential loss contingencies for environmental remediation, litigation claims, regulatory penalties and other events. Potential losses are accrued when: (i) information is available that indicates it is probable (i.e., likely to occur) that a loss has been incurred, given the likelihood of the uncertain future events; and (ii) the amount of the loss can be reasonably estimated. Loss contingencies are recognized at management's best estimate, which may be discounted, where appropriate. Loss contingencies exclude estimates for any legal fees, which are recognized as incurred when the legal services are performed. See Note 12 for additional information on loss contingencies.
Business interruption insurance proceeds are considered gain contingencies and not recognized until realized.
Debt. Proceeds received on the issuance of new term loans, secured notes, unsecured notes, bonds, and similar indebtedness are presented as “Long-term debt” or “Long-term debt, due within one year” on the Consolidated Balance Sheets. Interest incurred as paid-in-kind, whether accrued or capitalized as additional principal are presented as “Long-term debt” with the associated outstanding amounts of indebtedness. Costs incurred to issue new indebtedness and any original issuance discounts or premiums are deferred at issuance on the Consolidated Balance Sheets and presented together with the associated outstanding principal amounts of indebtedness.
Interest accrues on outstanding principal amounts of indebtedness based on contractually determined rates during each period. Costs incurred for the issuance of indebtedness and any original issuance discounts or premiums are subsequently amortized through the expected maturity date of the associated indebtedness under the effective interest rate method and are presented as “Interest expense and other finance charges” on the Consolidated Statements of Operations.
Gains and losses on the: (i) early redemption of indebtedness; or (ii) early termination and (or) reduction of revolving credit facility committed capacity are presented as a gain or loss on the Consolidated Statements of Operations. Such amounts include the proportional derecognition of any deferred financing costs, fees, discounts, and (or) premiums associated with the indebtedness.
Direct cash borrowings under secured lines of credit, revolving credit facilities, and similar indebtedness are presented as a current liability on the Consolidated Balance Sheets. Costs incurred to issue new arrangements are deferred and presented as “Other current assets” or “Other noncurrent assets” on the Consolidated Balance Sheets. Interest accrues on direct cash borrowings and LCs based on contractually determined rates during each period.
Costs incurred to issue new arrangements are subsequently amortized through the expected expiration of the associated arrangement under the straight-line method. Commitment fees on available but unused credit facility capacity are expensed as incurred. Such costs are presented as “Interest expense and other finance charges” on the Consolidated Statements of Operations.
See Note 13 for additional information on debt.
Postretirement Benefit Obligations. Certain Talen subsidiaries sponsor various defined benefit pension plans and other postretirement benefit plans. Gains and losses, net of income tax, that arise and are not a component of net periodic defined benefit costs are presented as “Other Comprehensive Income (Loss)” on the Consolidated Statements of Comprehensive Income.
Following Emergence, actuarial gains and losses in excess of the greater of 10% of the plan's projected benefit obligation or the market-related value of plan assets are amortized over (i) the expected average remaining service period of active plan participants for active plans; or (ii) the average future remaining lifetime of the plan participants of frozen plans. Prior to Emergence, Talen used an accelerated amortization method for the recognition of gains and losses for defined benefit pension plans: (i) actuarial gains and losses in excess of 30% of the plan's projected benefit obligation are amortized on a straight-line basis over one-half of the expected average remaining service of active plan participants; and (ii) actuarial gains and losses in excess of 10% of the greater of the plan's projected benefit obligation or the market-related value of plan assets and less than 30% of the plan's projected benefit obligation are amortized on a straight-line basis over the expected average remaining service period of active plan participants.
Following Emergence, a spot rate curve that represents a portfolio of high-quality corporate bonds is used to develop the discount rate utilized to measure the projected benefit obligations and service costs for benefit plans. Prior to Emergence, a bond matching methodology was utilized, based on a specific portfolio of bonds that closely match the overall cash flow timing and duration of the benefit plans.
Item 8. Table of Contents
Talen is obligated to provide health care benefits under the Coal Act and pneumoconiosis (black lung) benefits under the Black Lung Act for retired miners and eligible beneficiaries. Benefits are funded from a Voluntary Employees’ Benefit Association (“VEBA”) trust and a trust maintained under certain federal and state black lung legislation. Shortfalls in funded status of the plans are assessed as contingent liabilities. As such, Talen recognizes funding shortfalls on its balance sheet, where applicable, if benefit obligations of either plan exceed the fair value of available trust assets.
See Note 15 for additional information on the plans and the accounting for defined benefits.
Treasury Stock and Retirement of Treasury Shares. Share repurchases are accounted for under the cost method, which recognizes the entire cost of the acquired stock, including transaction costs and excise tax, as a reduction in additional paid-in-capital and are presented as “Treasury stock” on the Consolidated Balance Sheets. Share repurchases are recognized on a trade date basis when we are contractually obligated to purchase the shares. Treasury shares are retired on the settlement date of the transaction. At retirement, the common stock balance is reduced for the par value of the shares. The excess of the acquisition cost of repurchased shares over the par value is recognized in additional paid-in capital (up to the amount credited to additional paid-in capital upon original issuance of the shares), with any remaining cost deducted from retained earnings.
Recently Adopted Accounting Pronouncements
ASU 2023-07. In November 2023, the Financial Accounting Standards Board (the “FASB”) issued ASU 2023-07, Segment Reporting (Topic 280): Improvements to Reportable Segment Disclosures. This ASU requires enhanced disclosures about significant segment expenses. The ASU is effective for fiscal years beginning after December 15, 2023, and interim periods within fiscal years beginning after December 15, 2024. Early adoption is permitted. The Company adopted the fiscal year disclosure requirements for this ASU beginning January 1, 2024, and will adopt interim period disclosure requirements beginning January 1, 2025.
Recent Accounting Pronouncements Not Yet Adopted
ASU 2023-09. In December 2023, the FASB issued ASU 2023-09 Income Taxes (Topic 740): Improvements to Income Tax Disclosures. This ASU requires annual disclosures for specific categories in the rate reconciliation and additional information for reconciling items that meet a quantitative threshold. The ASU is effective for fiscal years beginning after December 15, 2024. Early adoption is permitted for annual financial statements that have not yet been issued. The Company is evaluating the disclosure impact of this ASU and expects to adopt it in the required period.
ASU 2024-03. In November 2024, the FASB issued ASU 2024-03, Expense Disaggregation Disclosures (Subtopic 220-40): Disaggregation of Income Statement Expenses. This ASU requires public companies to disclose, in the notes to financial statements, specified information about certain costs and expenses at each interim and annual reporting period. This ASU is effective for annual reporting periods beginning after December 15, 2026. Early adoption is permitted. The Company is evaluating the disclosure impact of this ASU and expects to adopt it in the required period.
3. Emergence from Restructuring
Voluntary Reorganization Under Chapter 11 of the U.S. Bankruptcy Code
In May 2022, TES and 71 of its subsidiaries voluntarily commenced the Restructuring under Chapter 11 of the U.S. Bankruptcy Code. TEC joined the Restructuring in December 2022. The Plan of Reorganization was approved by the requisite parties and confirmed by the bankruptcy court in late 2022, and was consummated and became effective in May 2023, when TEC, TES, and the other debtors emerged from the Restructuring.
Prior to and during the Restructuring, TES and its debtor subsidiaries reached a number of settlements with various stakeholders (including certain holders of claims under TES’s prepetition indebtedness, certain affiliates Riverstone Holdings, LLC (“Riverstone”) (which then held all of the equity in TEC), TEC, and the Official Committee of Unsecured Creditors), the terms of which were incorporated into the Plan of Reorganization. Under the settlements, the Company agreed to conduct a common equity rights offering, which certain holders of prepetition unsecured notes agreed to backstop in exchange for subscription rights to purchase 30% of the new equity issued plus a backstop premium payment in the form of cash and (or) new equity.
Restructuring Transactions and Emergence
The Restructuring transactions were completed, and the Company emerged from the Restructuring, on May 17, 2023. Pursuant to the Plan of Reorganization, among other things:
•Claims against TEC were paid in full in cash or reinstated. All existing equity interests in TEC were extinguished, and new equity interests in TEC were issued as follows:
•Holders of unsecured claims under TES’s prepetition indebtedness (including the backstopping holders) received: (i) TEC equity; and (ii) subscription rights to purchase additional TEC equity in the equity rights offering.
Item 8. Table of Contents
•The equity rights offering was consummated, resulting in $1.4 billion in net cash proceeds to the Company. The backstopping holders (i) fully exercised their subscription rights; (ii) were required to purchase additional unsubscribed-for TEC equity; and (iii) were paid the remaining portion of the backstop premium in the form of TEC equity.
•Riverstone received: (i) 1 of the equity in TEC; (ii) a contingent right to receive additional TEC equity or cash upon certain conditions following Emergence; and (iii) warrants to purchase additional TEC equity. In the third quarter 2023, Riverstone surrendered the warrants and waived its contingent right to additional TEC equity or cash in exchange for 40 million in cash.
•The existing intercompany ownership structure of the debtors remained in place and intercompany claims were extinguished.
•The Company consummated its exit financings, comprised of the RCF, TLB-1, TLC, TLC LCF, Bilateral LCF, and Secured Notes. The PEDFA 2009B and 2009C Bonds remained outstanding following the Restructuring.
•The proceeds of the equity rights offering and the exit financings, together with cash on hand, were used to fully repay the Company’s debtor-in-possession credit facilities and to pay $3.1 billion relating to other secured claims.
•Holders of other unsecured claims received interests in a designated $26 million pool of cash, to which Talen Montana subsequently contributed an additional $11 million from proceeds of the PPL/Talen Montana settlement. See Note 12 for additional information on the PPL/Talen Montana settlement.
4. Fresh Start Accounting
At Emergence, TES adopted fresh start accounting as: (i) the holders of existing voting shares before the consummation of the Plan of Reorganization received less than 50% of the voting shares of the Successor; and (ii) the reorganization value of TES’s assets immediately prior to confirmation of the Plan of Reorganization of $7.8 billion was less than the total of post-petition liabilities and allowed claims of $9.8 billion. Accordingly, TES allocated its reorganization value to its individual assets based on their estimated fair values.
Reorganization Value
Reorganization value is derived from an estimate of enterprise value, or the fair value of the Company’s interest-bearing debt and member’s equity. As negotiated in the Plan of Reorganization and related disclosure statement approved by the Bankruptcy Court, the enterprise value as of Emergence was $4.5 billion. Management engaged third-party valuation advisors to assist in estimating the enterprise value and allocating the enterprise value to the assets and liabilities for financial reporting purposes as of Emergence. Enterprise value assumptions incorporated: (i) economic and industry information relevant to the business; (ii) internal financial information and operating data; (iii) historical financial information; and (iv) financial projections and other applicable assumptions. The valuation techniques used to estimate the enterprise value as of Emergence included the income approach, market approach, and cost approach, with consideration of the exit market and nature of the applicable asset or liability subject to valuation.
The Company’s principal assets are generation facilities whose values were determined by a discounted cash flow analysis based on management’s latest outlook of the business through the end of their expected useful lives. The forward-looking projections considered: (i) company-specific factors, such as unit characteristics, plant dispatch, operating expenses, capital expenditures and estimated economic useful lives; and (ii) macroeconomic factors, such as capacity prices, energy prices, fuel prices, market supply and demand factors, inflation factors, and environmental regulations. Commodity prices used to estimate future cash flows in observable periods were primarily based on adjusted exchange prices, prices provided by brokers, or prices provided by price service companies that are corroborated by market data. Commodity prices for future unobservable periods used third party pricing services that incorporate industry standard methodologies that may consider the historical relationships among various commodities, modeled market prices, inflation assumptions, and other relevant economic measures. Future estimates for capital expenditures and operating expenses, such as major maintenance and employee compensation were estimated considering unit operating experience, recent historical financial information, and expected operating performance. The expected useful lives of the generation facilities were estimated through 2050 and incorporated expectations regarding the economic prospects of each unit, permitting and licensing, regulatory requirements, and (or) other considerations. The cash flow estimates incorporated a federal effective tax rate of 21% and the applicable state tax rate based on the location of each generation facility. The present value of expected future cash flows utilized a weighted average cost of capital discount rate that ranged from 8.5 to 46.5. The discount rate utilized for nuclear generation was 8.5% and certain natural gas generation facilities were estimated near the low end of the range. Certain coal and natural gas generation units were estimated near the high end of the range. Discount rates for each generation facility considered, among other things, unit characteristics, fuel type, and market location.
Item 8. Table of Contents
The assumptions used to estimate the reorganization value considered all available evidence as of Emergence and are believed to be consistent with those used by the principal market participants and outlook for each generation facility and represent management’s best estimate of reorganization value. However, such assumptions are inherently uncertain and require judgment. Accordingly, changes to sensitive assumptions, which primarily include commodity prices and discount rates, would have a reasonable possibility of significantly affecting the measurement of the reorganization value. See below under “Fresh Start Adjustments” for additional information regarding assumptions used in the measurement of the Company’s various other significant assets and liabilities.
Upon the application of fresh start accounting, the Company preliminarily allocated the reorganization value to its individual assets based on their estimated fair values. The following table reconciles the Company’s enterprise value to the estimated reorganization value at Emergence:
| | | | | | | | |
| | May 17, 2023 |
Enterprise value (a) | | $ | 4,500 | |
Plus: Cash and cash equivalents and Restricted cash and cash equivalents (b) | | 701 | |
| Plus: Current liabilities excluding long-term debt due within one year | | 514 | |
| Plus: Non-current liabilities excluding long-term debt and liability-classified warrants | | 1,234 | |
| Plus: Fair value of noncontrolling interest | | 110 | |
| Reorganization value to be allocated | | $ | 7,059 | |
__________________
(a)Excludes any value associated with noncontrolling interest.
(b)Excludes $52 million for payment of professional fees.
The following table reconciles TES’s enterprise value to the estimated fair value at Emergence:
| | | | | | | | |
| | May 17, 2023 |
Enterprise value (a) | | $ | 4,500 | |
Plus: Cash and cash equivalents and Restricted cash and cash equivalents (b) | | 701 | |
| Less: Fair value of debt | | (2,845) | |
| Less: Liability-classified warrants | | (35) | |
Fair value of member’s equity (c) | | 2,321 | |
| Plus: Fair value of noncontrolling interest | | 110 | |
| Fair value of equity | | $ | 2,431 | |
__________________
(a)Excludes any value associated with noncontrolling interest.
(b)Excludes $52 million for payment of professional fees.
(c)Issued in accordance with the Plan of Reorganization. Includes 59,028,843 shares of TEC common stock and $8 million of equity-classified warrants.
Item 8. Table of Contents
Consolidated Balance Sheet
The “Reorganization Adjustments” on the fresh start Consolidated Balance Sheet as of Emergence present the aggregate effect of the transactions contemplated by the Plan of Reorganization. The “Fresh Start Adjustments” present the preliminary fair value and other required adjustments as a result of applying fresh start accounting. The explanatory notes provide additional information related to the adjustments, the methods used to determine fair values, and significant assumptions.
| | | | | | | | | | | | | | | | | | | | | | | | | | |
| | May 17, 2023 |
| Assets | | Predecessor | | Reorganization Adjustments (a) | | Fresh Start
Adjustments | | Successor |
| Cash and cash equivalents | | $ | 1,302 | | | $ | (1,133) | | (b) | $ | — | | | $ | 169 | |
| Restricted cash and cash equivalents | | 240 | | | 426 | | (c) | (81) | | (q) | 585 | |
| Accounts receivable, net | | 148 | | | (3) | | (d) | — | | | 145 | |
| Inventory, net | | 448 | | | — | | | (141) | | (r) | 307 | |
| Derivative instruments | | 818 | | | — | | | (632) | | (q) | 186 | |
| Other current assets | | 135 | | | — | | | (5) | | (s) | 130 | |
| Total current assets | | 3,091 | | | (710) | | | (859) | | | 1,522 | |
| Property, plant and equipment, net | | 4,322 | | | — | | | (458) | | (t) | 3,864 | |
| Nuclear decommissioning trust funds | | 1,465 | | | — | | | — | | | 1,465 | |
| Derivative instruments | | 37 | | | — | | | (37) | | (q) | — | |
| Other noncurrent assets | | 146 | | | (12) | | (e) | 74 | | (u) | 208 | |
| Total Assets | | $ | 9,061 | | | $ | (722) | | | $ | (1,280) | | | $ | 7,059 | |
| | | | | | | | |
| Liabilities and Equity | | | | | | | | |
| Revolving credit facilities | | $ | 848 | | | $ | (848) | | (f) | $ | — | | | $ | — | |
| Long-term debt, due within one year | | 1,005 | | | (1,000) | | (g) | — | | | 5 | |
| Accrued interest | | 288 | | | (284) | | (h) | — | | | 4 | |
| Accounts payable and other accrued liabilities | | 382 | | | 3 | | (i) | — | | | 385 | |
| Derivative instruments | | 711 | | | — | | | (654) | | (q) | 57 | |
| Other current liabilities | | 414 | | | (349) | | (j) | 3 | | (v) | 68 | |
| Total current liabilities | | 3,648 | | | (2,478) | | | (651) | | | 519 | |
| Long-term debt | | 2,504 | | | 281 | | (k) | 55 | | (w) | 2,840 | |
| Liabilities subject to compromise | | 2,788 | | | (2,788) | | (l) | — | | | — | |
| Derivative instruments | | 135 | | | — | | | (93) | | (q) | 42 | |
| Postretirement benefit obligations | | (1) | | | 302 | | (m) | 34 | | (x) | 335 | |
| Asset retirement obligations and accrued environmental costs | | 580 | | | 202 | | (m) | (340) | | (y) | 442 | |
| Deferred income taxes | | 82 | | | 283 | | (n) | (8) | | (z) | 357 | |
| Other noncurrent liabilities | | 19 | | | 60 | | (o) | 14 | | (aa) | 93 | |
| Total Liabilities | | 9,755 | | | (4,138) | | | (989) | | | 4,628 | |
| Member’s equity | | (818) | | | 3,416 | | (p) | (277) | | (bb) | 2,321 | |
| Noncontrolling interests | | 124 | | | — | | | (14) | | (cc) | 110 | |
| Total Equity | | (694) | | | 3,416 | | | (291) | | | 2,431 | |
| Total Liabilities and Equity | | $ | 9,061 | | | $ | (722) | | | $ | (1,280) | | | $ | 7,059 | |
Reorganization Adjustments
The reorganization adjustments required in connection with the application of fresh start accounting and the allocation of the enterprise value were:
(a)Emergence adjustments for the implementation of the Plan of Reorganization. Such adjustments include: (i) settlement of prepetition liabilities subject to compromise; (ii) payment of certain prepetition indebtedness; (iii) issuances of member’s equity; (iv) recognition of new indebtedness and related restricted cash; and (v) other items.
Item 8. Table of Contents
(b)The uses of “Cash and cash equivalents” at Emergence resulting from the implementation of the Plan of Reorganization were:
| | | | | | | | |
| Proceeds from rights offering | | $ | 1,400 | |
| Proceeds from TLB-1 and TLC | | 1,019 | |
| Proceeds from Secured Notes | | 1,200 | |
| Release of restricted cash | | 89 | |
| Payment of claims under prepetition senior secured revolving credit facility | | (1,029) | |
| Payment of claims under other prepetition secured indebtedness | | (2,136) | |
| Payment of debtor-in-possession term loan | | (1,012) | |
| Restriction of cash relating to TLC LCF | | (470) | |
| Payment of debt issuance costs on exit financing (TLB-1, TLC, and Secured Notes) | | (54) | |
| Funding of professional fees escrow account | | (52) | |
| Payment of hedge rejections | | (42) | |
| Payment to general unsecured creditors trust | | (26) | |
| Payment of professional fees | | (22) | |
Other (a) | | 2 | |
| Total uses of Cash and cash equivalents | | $ | (1,133) | |
__________________
(a)Includes $1 million of proceeds from Riverstone for payment to general unsecured creditors trust.
(c)“Restricted cash and cash equivalents” net change:
| | | | | | | | |
| Restriction of cash relating to TLC LCF | | $ | 470 | |
| Funding of professional fees escrow account | | 52 | |
| Release of restricted cash | | (89) | |
| Payment of professional fees | | (7) | |
| Net change in Restricted cash and cash equivalents | | $ | 426 | |
(d)“Accounts receivable, net” net change related to settlement of affiliate receivables.
(e)“Other noncurrent assets” net change:
| | | | | | | | |
| Write-off of debt issuance costs associated with prepetition senior secured revolving credit facility | | $ | (22) | |
| Reclassification of previously capitalized debt issuance costs to Long-term debt | | (14) | |
| Capitalization of debt issuance costs | | 24 | |
| Net change in Other noncurrent assets | | $ | (12) | |
(f)Payment of principal amounts owed under prepetition senior secured revolving credit facility.
(g)Repayment of debtor-in-possession credit facilities.
(h)“Accrued interest” net change:
| | | | | | | | |
| Payment of accrued interest on prepetition senior secured revolving credit facility | | $ | (183) | |
| Payment of accrued interest on other prepetition secured indebtedness | | (89) | |
| Payment of accrued interest on debtor-in-possession credit facilities | | (12) | |
| Net change in Accrued interest | | $ | (284) | |
(i)“Accounts payable and other accrued liabilities” net change:
| | | | | | | | |
| Payment of hedge contract rejections | | $ | (42) | |
| Payment of professional fees | | (6) | |
| Reinstatement of liabilities subject to compromise | | 38 | |
| Accrual for professional fees incurred at Emergence | | 13 | |
| Net change in Accounts payable and other accrued liabilities | | $ | 3 | |
Item 8. Table of Contents
(j)“Other current liabilities” net change:
| | | | | | | | |
| Issuance of equity for backstop premium | | $ | (380) | |
| Reinstatement of liabilities subject to compromise | | 31 | |
| Net change in Other current liabilities | | $ | (349) | |
(k)“Long-term debt” net change:
| | | | | | | | |
| Payment of claims under prepetition secured indebtedness | | $ | (2,048) | |
Borrowings of 1.2 billion under the Secured Notes (a) | | 1,179 | |
Borrowings of 580 million under TLB-1 (b) | | 548 | |
Borrowings of 470 million under TLC (c) | | 446 | |
Reinstatement of PEDFA 2009B Bonds and PEDFA 2009C Bonds (d) | | 130 | |
| Write-off of prepetition secured indebtedness issuance costs | | 26 | |
| Net change in Long-term debt | | $ | 281 | |
______________
(a)Net of an aggregate initial purchaser discount and debt issuance costs of $21 million.
(b)Net of an aggregate original issue discount and debt issuance costs of $32 million.
(c)Net of an aggregate original issue discount and debt issuance costs of $24 million.
(d)Includes recognition of $4 million of interest expense.
(l)“Liabilities subject to compromise” settled or reinstated at Emergence in accordance with the Plan of Reorganization:
| | | | | | | | |
| Liabilities subject to compromise prior to Emergence | | |
| Debt | | $ | 1,555 | |
| Termination of retail contracts | | 447 | |
| Postretirement benefit obligations | | 305 | |
| Asset retirement obligations and accrued environmental costs | | 220 | |
| Other liabilities | | 92 | |
| Deferred tax liabilities | | 77 | |
| Accounts payable and accrued liabilities | | 51 | |
| Accrued interest | | 41 | |
| Total | | 2,788 | |
| | |
| Reinstatement and settlements of certain Liabilities subject to compromise | | |
Reinstatement of liabilities subject to compromise (a) | | (801) | |
| Excess fair value ascribed to lenders participating in rights offering | | (315) | |
| Issuance of member’s equity to holders of claims under prepetition unsecured notes and PEDFA 2009A Bonds | | (186) | |
| Payment to general unsecured creditors trust | | (24) | |
| Total | | (1,326) | |
Gain on derecognition of certain Liabilities subject to compromise (b) | | $ | 1,462 | |
______________
(a)Primarily includes postretirement benefit obligations, AROs, and deferred income taxes.
(b)Represents liabilities subject to compromise that were discharged in accordance with the Plan of Reorganization.
(m)Reinstatement of “Liabilities subject to compromise.”
(n)“Deferred income taxes” net change:
| | | | | | | | |
| Increase in deferred tax liabilities primarily due to estimated tax attribute reduction from the recognition of cancellation of debt income, partially offset by change in valuation allowance | | $ | 206 | |
| Reinstatement of liabilities subject to compromise | | 77 | |
| Net change in Deferred income taxes | | $ | 283 | |
Item 8. Table of Contents
(o)“Other noncurrent liabilities” net change:
| | | | | | | | |
| Issuance of liability-classified warrants | | $ | 35 | |
| Reinstatement of liabilities subject to compromise | | 25 | |
| Net change in Other noncurrent liabilities | | $ | 60 | |
The estimated fair value of liability-classified warrants was determined using a Black-Scholes Option Pricing Model with the following assumptions at Emergence:
| | | | | | | | |
| Expected volatility | | 30 | % |
| Expected term (years) | | 5 |
| Expected dividend yield | | — | % |
| Risk-free interest rate | | 3.6 | % |
| Strike price per share | | $ | 52.92 | |
| Fair value per share | | $ | 11.29 | |
(p)“Member’s equity” net change:
| | | | | | | | |
| Gain on settlement of liabilities subject to compromise | | $ | 1,462 | |
| Other losses attributable to gain on debt discharge | | (3) | |
| Gain on debt discharge | | 1,459 | |
| Write-off of deferred financing cost | | (46) | |
| Professional fees expensed at Emergence | | (27) | |
| Restructuring-related compensation expense | | (8) | |
| Total reorganization items from reorganization adjustments | | 1,378 | |
| Interest expense incurred at Emergence | | (4) | |
| Income from reorganization adjustments before income taxes | | 1,374 | |
| Income tax expense | | (206) | |
| Net income from reorganization adjustments | | 1,168 | |
| Issuance of member’s equity in connection with rights offering | | 1,715 | |
| Issuance of member’s equity for backstop premium | | 380 | |
| Issuance of member’s equity to holders of claims under prepetition unsecured notes and PEDFA 2009A Bonds | | 186 | |
| Issuance of equity-classified warrants | | 8 | |
| Issuance of liability-classified warrants | | (35) | |
Other (a) | | (6) | |
| Net change in Member’s equity | | $ | 3,416 | |
______________
(a)Includes $1 million of proceeds from Riverstone for payment to general unsecured creditors trust.
Fresh Start Adjustments
(q)Net presentation of derivatives on the Consolidated Balance Sheets. See Note 2 for additional information on the related accounting policy.
(r)“Inventory, net” fair value adjustments:
| | | | | | | | |
| Coal | | $ | (33) | |
| Oil products | | 11 | |
| Materials and supplies | | (133) | |
| Environmental products | | 14 | |
| Total adjustment to Inventory, net | | $ | (141) | |
The fair values for oil, coal and environmental products were estimated using current market prices. The fair values of materials and supplies were estimated using an indirect cost approach. The cost approach estimates fair value by considering the amount required to construct or purchase a new asset of equal utility at current prices, with adjustments for asset function, age, physical deterioration, and obsolescence.
(s)“Other current assets” primarily represents miscellaneous fair value adjustments.
Item 8. Table of Contents
(t)“Property, plant and equipment, net” fair value adjustments:
| | | | | | | | |
| Electric generation | | $ | (350) | |
| Other property and equipment | | (80) | |
| Intangible assets | | (65) | |
| Capitalized software | | (3) | |
| Construction work in progress | | 40 | |
| Total adjustment to Property, plant and equipment, net | | $ | (458) | |
The fair value of “Property, plant and equipment, net” was estimated using the income approach, market approach and cost approach, as applicable. The fair value of land was estimated utilizing the market approach, which considered comparable market-based transactions within a defined area based on size, use and utility.
(u)“Other noncurrent assets” fair value adjustments:
| | | | | | | | |
Favorable supply contracts (a) | | $ | 109 | |
| Fair value adjustment to equity method investments | | 3 | |
| Eliminate debt issuance costs associated with debtor-in-possession credit facilities | | (29) | |
| Fair value reduction to other miscellaneous assets | | (9) | |
| Total adjustment to Other noncurrent assets | | $ | 74 | |
__________________
(a)The fair value of supply contracts was determined utilizing the present value of the after-tax difference between the pricing of actual contracts in place and a current market benchmark.
(v)“Other current liabilities” fair value adjustments, primarily related to short-term AROs.
(w)“Long-term debt” fair value adjustments:
| | | | | | | | |
| Eliminate debt issuance costs associated with prepetition secured notes, prepetition TLB and LMBE-MC TLB | | $ | 48 | |
| Fair value adjustment to Cumulus Digital TLF | | 11 | |
| Fair value adjustment to LMBE-MC TLB | | (4) | |
| Total adjustment to Long-term debt | | $ | 55 | |
Fair value adjustments to “Long-term debt” were determined using a lattice model, given that the debt can be prepaid by the borrower prior to the maturity date.
(x)Change in accounting policy for discount rates used to estimate postretirement obligations from a bond-matching model to yield curve approach. See Note 2 for additional information.
(y)Adjustment to present at fair value AROs using assumptions as of Emergence, including an inflation factor of 2-3 and an estimated 5- to 20-year credit-adjusted risk-free rate of 8-12based on timing of cash flows for each underlying obligation.
(z)Adjustment to “Deferred income taxes” for the change in financial reporting basis of assets and liabilities as a result of the adoption of fresh start accounting.
(aa)Fair value adjustments primarily related to unfavorable supply contracts of $13 million and the recognition of unfavorable lease liabilities. The fair value of supply contracts was determined utilizing the present value of the after-tax difference between the pricing of actual contracts in place and current market benchmarks.
(bb)Cumulative impact of fresh start accounting adjustments presented herein.
(cc)“Noncontrolling interests” fair value adjustments for certain subsidiaries.
Item 8. Table of Contents
Liabilities Subject to Compromise
As of December 31, 2022 (Predecessor), prepetition liabilities and obligations whose treatment and satisfaction were dependent on the outcome of the Restructuring were presented as “Liabilities subject to compromise” on the Consolidated Balance Sheets. The carrying value of prepetition liabilities that were subject to compromise are presented at the best estimate of the claim amount permitted by the Bankruptcy Court. Such amounts presented as “Liabilities subject to compromise” on the Consolidated Balance Sheets were subject to adjustments depending on bankruptcy court actions, developments with respect to disputed claims, determination of secured status of certain claims, the determination as to the value of any collateral securing claims, proof of claims and (or) other events.
| | | | | | | | |
| | Predecessor |
| | December 31, 2022 |
Debt (a) | | $ | 1,558 | |
| Termination of retail power and other contracts | | 447 | |
Postretirement benefit obligations (a) | | 309 | |
Asset retirement obligations and accrued environmental costs (a) | | 219 | |
Other liabilities (a) | | 114 | |
| Deferred tax liabilities | | 83 | |
| Accounts payable and accrued liabilities | | 53 | |
| Accrued interest | | 41 | |
Derivatives (a) | | 1 | |
| Liabilities Subject to Compromise | | $ | 2,825 | |
__________________
(a)Includes both current and noncurrent amounts.
Reorganization Income (Expense), net
“Reorganization income (expense), net” for the relevant periods were:
| | | | | | | | | | | | | | | | | |
| | | | | Predecessor |
| | | | | January 1 through May 17, 2023 | | Year Ended December 31, 2022 |
| Backstop premium | | | | | $ | (70) | | | $ | (310) | |
| Gain (loss) on debt discharge | | | | | 1,459 | | | — | |
| Gain (loss) on revaluation adjustments | | | | | (460) | | | — | |
| Professional fees | | | | | (56) | | | (210) | |
| Make-whole premiums and accrued interest on certain indebtedness | | | | | (21) | | | (183) | |
| Professional fees incurred to obtain the debtor-in-possession credit facilities | | | | | — | | | (70) | |
| Write-off of deferred financing cost and original issue discount | | | | | (46) | | | (30) | |
| Other | | | | | (7) | | | (9) | |
| Reorganization Income (Expense), net | | | | | $ | 799 | | | $ | (812) | |
In the preceding table, make-whole premiums and accrued interest on certain indebtedness primarily represents charges recognized by the debtors for estimates related to make-whole premiums and accrued interest, where applicable, on the prepetition senior secured revolving credit facility and certain other prepetition secured indebtedness. As of the bankruptcy petition date, the debtors ceased recognizing interest expense on certain outstanding unsecured or under-secured prepetition indebtedness. Contractual interest expense represented amounts due under the terms of outstanding prepetition indebtedness. The charges are presented as “Reorganization income (expense), net” on the Consolidated Statements of Operations and included in “Accrued interest” on the Consolidated Balance Sheets.
Cash paid for certain reorganization expenses was $308 million for the period from January 1 through May 17, 2023 (Predecessor). Cash paid for the year ended December 31, 2022 (Predecessor) for debtor-in-possession credit facilities financing fees is presented as “Financing Activities” on the Consolidated Statements of Cash Flows.
Item 8. Table of Contents
5. Risk Management, Derivative Instruments and Hedging Activities
Risk Management Objectives
We are exposed to risks arising from our business, including but not limited to market and commodity price risk, credit and liquidity risk, and interest rate risk. The hedging strategies deployed by our commercial organization manage and (or) balance these risks within a structured risk management program in order to minimize near-term future cash flow volatility. Our risk management committee, comprised of certain senior management members across the organization, oversees the management of these risks in accordance with our risk policy. In turn, the risk management committee is overseen by the risk committee of the Board of Directors.
The Board of Directors, including the risk committee, and management have established procedures to monitor, measure, and manage hedging activities and credit risk in accordance with the risk policy.
Key risk control activities, which are designed to ensure compliance with the risk policy, include, among other activities, credit review and approval, validation of transactions and market prices, verification of risk and transaction limits, portfolio stress tests, analysis and monitoring of margin at risk, and daily portfolio reporting.
Market and Commodity Price Risk. Volatility in the wholesale power markets provides uncertainty in the future earnings and cash flows of the business. The price risk Talen is exposed to includes the price variability associated with future sales and (or) purchases of power, natural gas, coal, uranium, oil products, environmental products, and other energy commodities in competitive wholesale markets. Several factors influence price volatility, including: (i) seasonal changes in demand; (ii) weather conditions; (iii) available regional load-serving supply; (iv) regional transportation and (or) transmission availability; (v) market liquidity; and (vi) federal, regional, and state regulations.
Within the parameters of our risk policy, we generally utilize exchange-traded and over-the-counter traded derivative instruments and, in certain instances, structured products, to economically hedge the commodity price risk of the forecasted future sales and purchases of commodities associated with our generation portfolio.
Open commodity purchase (sales) derivatives range in maturity through 2026. The net notional volumes of open commodity derivatives were:
| | | | | | | | | | | | | | |
| | Successor |
| | December 31, 2024 (a) | | December 31, 2023 (a) |
| Power (MWh) | | (38,615,192) | | | (27,557,871) | |
| Natural gas (MMBtu) | | 32,405,460 | | | 8,314,060 | |
| Emission allowances (tons) | | 100,000 | | | 500,000 | |
__________________
(a)The volumes may be less than the contractual volumes, as the probability that option contracts will be exercised is considered in the volumes displayed.
Interest Rate Risk. Talen is exposed to interest rate risk from the possibility that changes in interest rates will affect future cash flows associated with existing floating rate debt issuances. To reduce interest rate risk, derivative instruments are utilized to economically hedge the interest rates for a predetermined contractual notional amount, which results in a cash settlement between counterparties. To the extent possible, first lien interest rate fixed-for-floating swaps are utilized to hedge this risk.
Open interest rate derivatives are related to the TLB-1 indebtedness and mature in 2026. The net notional volumes of open interest rate derivatives were: | | | | | | | | | | | | | | |
| | Successor |
| | December 31, 2024 | | December 31, 2023 |
| Interest rate (in millions) | | $ | 290 | | | $ | 290 | |
Credit Risk. Credit risk, which is the risk of financial loss if a customer, counterparty, or financial institution is unable to perform or pay amounts due, is applicable to cash and cash equivalents, restricted cash and cash equivalents, derivative instruments, and accounts receivable. The maximum amount of credit exposure associated with financial assets is equal to the carrying value of such assets. Credit risk, which cannot be completely eliminated, is managed through a number of practices such as ongoing reviews of counterparty creditworthiness, prepayment, inclusion of termination rights in contracts which are triggered by certain events of default, and executing master netting arrangements that permit amounts between parties to be offset. Additionally, credit enhancements such as cash deposits, LCs, and credit insurance may be employed to mitigate credit risk.
Item 8. Table of Contents
Cash and cash equivalents are placed in depository accounts or high-quality, short-term investments with major international banks and financial institutions. Individual counterparty exposure from over-the-counter derivative instruments is managed within predetermined credit limits and includes the use of master netting arrangements and cash-call margins, when appropriate, to reduce credit risk. Exchange-traded commodity contracts, which are executed through futures commission merchants, have minimal credit risk because they are subject to mandatory margin requirements and are cleared with an exchange. However, Talen is exposed to the credit risk of the futures commission merchants arising from daily variation margin cash calls. Restricted cash and cash equivalents deposited to meet initial margin requirements are held by futures commission merchants in segregated accounts for the benefit of Talen.
Outstanding accounts receivable include those from sales of capacity, generated electricity, and ancillary services through contracts directly with ISOs and RTOs and realized settlements of physical and financial derivative instruments with commodity marketers. Additionally, Talen carries accounts receivable due from joint owners for their portion of operating and capital costs for certain jointly owned facilities that are operated by the Company. The majority of outstanding receivables, which are continually monitored, have customary payment terms. The allowance for doubtful accounts was a non-material amount as of December 31, 2024 (Successor) and December 31, 2023 (Successor).
As of December 31, 2024 (Successor), Talen’s aggregate credit exposure, which excludes the effects of netting arrangements, cash collateral, LCs, and any allowances for doubtful collections, was $350 million and its credit exposure including such net effects was $91 million. Excluding ISO and RTO counterparties, whose accounts receivable settlements are subject to applicable market controls, the ten largest single net credit exposures account for 71% of Talen’s total net credit exposure, which are primarily with entities assigned investment grade credit ratings.
Certain derivative instruments contain credit risk-related contingent features, which may require us to provide cash collateral, LCs, or guarantees from a creditworthy entity if the fair value of a liability eclipses a certain threshold or upon a decline in Talen’s credit rating. The fair values of derivative instruments in a net liability position, and that contain credit risk-related contingent features, were non-material as of December 31, 2024 (Successor) and December 31, 2023 (Successor).
Derivative Instrument Presentation
Balance Sheets Presentation. The fair value of derivative instruments presented within assets and liabilities on the Consolidated Balance Sheets were:
| | | | | | | | | | | | | | | | | | | | | | | | | | |
| | Successor |
| | December 31, 2024 | | December 31, 2023 |
| | Assets | | Liabilities | | Assets | | Liabilities |
| Commodity contracts | | $ | 65 | | | $ | — | | | $ | 88 | | | $ | 32 | |
| Interest rate contracts | | 1 | | | — | | | 1 | | | — | |
| | | | | | | | |
| Total current derivative instruments | | 66 | | | — | | | 89 | | | 32 | |
| Commodity contracts | | 4 | | | 7 | | | 6 | | | 5 | |
| Interest rate contracts | | 1 | | | — | | | — | | | 6 | |
| Total non-current derivative instruments | | $ | 5 | | | $ | 7 | | | $ | 6 | | | $ | 11 | |
All commodity and interest rate derivatives are economic hedges where the changes in fair value are presented immediately in income as unrealized gains and losses. Changes in the fair value and realized settlements on commodity derivative instruments are presented as separate components of “Energy and other revenues” and “Fuel and energy purchases” on the Consolidated Statements of Operations. See Note 2 for additional information on derivative instruments and Note 14 for additional information on fair value.
Effect of Netting. Generally, the right of setoff within master netting arrangements permits the fair value of derivative assets to be offset with derivative liabilities. As an election, derivative assets and derivative liabilities are presented on the Consolidated Balance Sheets with the effect of such permitted netting as of December 31, 2024 (Successor) and December 31, 2023 (Successor).
Item 8. Table of Contents
The net amounts of “Derivative instruments” presented as assets and liabilities on the Consolidated Balance Sheets considering the effect of permitted netting and where cash collateral is pledged in accordance with the underlying agreement were:
| | | | | | | | | | | | | | | | | | | | | | | | | | | | | | | | | | |
| | Gross Derivative Instruments | | Eligible for Offset | | | | Net Derivative Instruments | | Collateral (Posted) Received | | Net Amounts |
| December 31, 2024 (Successor) | | | | | | | | | | | | |
| Assets | | $ | 227 | | | $ | (154) | | | | | $ | 73 | | | $ | (2) | | | $ | 71 | |
| Liabilities | | 173 | | | (154) | | | | | 19 | | | (12) | | | 7 | |
| December 31, 2023 (Successor) | | | | | | | | | | | | |
| Assets | | $ | 295 | | | $ | (198) | | | | | $ | 97 | | | $ | (2) | | | $ | 95 | |
| Liabilities | | 300 | | | (198) | | | | | 102 | | | (59) | | | 43 | |
Statements of Operations Presentation. The location and pre-tax effect of “Derivative instruments” presented on the Consolidated Statements of Operations for the periods were:
| | | | | | | | | | | | | | | | | | | | | | | | | | | | | | | | | |
| | | | | | Successor | | | Predecessor |
| | | | | | Year Ended December 31, 2024 | | May 18 through December 31, 2023 | | | January 1 through May 17, 2023 | | Year Ended December 31, 2022 |
| Realized gain (loss) on commodity contracts | | | | | | | | | | | | | |
Energy revenues (a) | | | | | | $ | 317 | | | $ | 360 | | | | $ | 644 | | | $ | (613) | |
Fuel and energy purchases (a) | | | | | | (35) | | | (91) | | | | (34) | | | 127 | |
| Unrealized gain (loss) on commodity contracts | | | | | | | | | | | | | |
Operating revenues (b) | | | | | | 42 | | | 55 | | | | 60 | | | 677 | |
Energy expenses (b) | | | | | | 20 | | | (3) | | | | (123) | | | (52) | |
| Realized and unrealized gain (loss) on interest rate contracts | | | | | | | | | | | | | |
| Interest expense and other finance charges | | | | | | 9 | | | (4) | | | | — | | | 30 | |
__________________
(a)Does not include those derivative instruments that settle through physical delivery.
(b)Presented as “Unrealized gain (loss) on derivative instruments” on the Consolidated Statements of Operations.
Contract Terminations
Commodity Hedge Terminations. In March and April 2022, Talen Energy Marketing and a counterparty terminated certain derivative contracts in a net liability position with a carrying value and fair value of $124 million prior to the agreements’ scheduled maturity dates. As the parties agreed to a monthly settlement through January 2023, repayments are presented as “Derivatives with financing elements” on the Consolidated Statements of Cash Flows.
In May 2022, certain commodity counterparties of Talen Energy Marketing terminated derivative contracts in a net liability position with a carrying value and fair value of $33 million prior to the agreements’ scheduled maturity dates. During 2022, Talen Energy Marketing received $7 million in net settlements from counterparties and, at Emergence, settled the remaining $40 million.
6. Revenue
The components of operating revenues for the periods were:
| | | | | | | | | | | | | | | | | | | | | | | | | | | | | | | | | |
| | | | | | Successor | | | Predecessor |
| | | | | | Year Ended December 31, 2024 | | May 18 through December 31, 2023 | | | January 1 through May 17, 2023 | | Year Ended December 31, 2022 |
| Capacity revenues | | | | | | $ | 192 | | | $ | 133 | | | | $ | 108 | | | $ | 377 | |
| Electricity sales and ancillary services, ISO/RTO | | | | | | 1,144 | | | 880 | | | | 281 | | | 2,534 | |
| Physical electricity sales, bilateral contracts, other | | | | | | 147 | | | 71 | | | | 62 | | | 298 | |
| Other revenue from customers | | | | | | 91 | | | 81 | | | | 27 | | | — | |
| Total revenue from contracts with customers | | | | | | 1,574 | | | 1,165 | | | | 478 | | | 3,209 | |
| Realized and unrealized gain (loss) on derivative instruments | | | | | | 307 | | | 179 | | | | 732 | | | (120) | |
Nuclear PTC (a) | | | | | | 220 | | | — | | | | — | | | — | |
| Other revenue | | | | | | 14 | | | — | | | | — | | | — | |
| Operating revenues | | | | | | $ | 2,115 | | | $ | 1,344 | | | | $ | 1,210 | | | $ | 3,089 | |
__________________(a)During the year ended December 31, 2024 (Successor), $70 million of estimated Nuclear PTCs were utilized as a credit against our federal income tax payable. See Note 7 for additional information on the tax impact of the Nuclear PTC.
Item 8. Table of Contents
Accounts Receivable
“Accounts receivable” presented on the Consolidated Balance Sheets were:
| | | | | | | | | | | | | | |
| | Successor |
| | December 31, 2024 | | December 31, 2023 |
| Customer accounts receivable | | $ | 66 | | | $ | 52 | |
| Other accounts receivable | | 57 | | | 85 | |
| Accounts receivable | | $ | 123 | | | $ | 137 | |
During the year ended December 31, 2024 (Successor), the period from May 18 through December 31, 2023 (Successor), and the period from January 1 through May 17, 2023 (Predecessor), there were no significant changes in accounts receivable other than normal receivable recognition and collection transactions. See Note 5 for additional information on Talen’s credit risk on the carrying value of its receivables and for additional information on a Talen Energy Marketing receivables sales arrangement that was terminated in May 2022.
Future Performance Obligations
In the normal course of business, Talen has future performance obligations for capacity sales awarded through market-based capacity auctions and (or) for capacity sales under bilateral contractual arrangements.
The PJM Base Residual Auction for the 2025/2026 PJM Capacity Year was held in July 2024. Talen cleared a total of 6,820 MW at a clearing price of $269.92 per MW-day for the MAAC, PPL, and PSEG locational deliverability areas. The PJM BRAs for any years thereafter have not yet been held, and the PJM BRA for delivery year 2026/2027 has been postponed to July 2025. See Note 12 for additional information on the PJM BRAs.
As of December 31, 2024 (Successor), the expected future period capacity revenues subject to unsatisfied or partially unsatisfied performance obligations were:
| | | | | | | | | | | | | | | | | | | | | | | | | | | | | | | | |
| | 2025 | | 2026 (a) | | 2027 | | 2028 | | 2029 |
| Expected capacity revenues | | $ | 478 | | | $ | 281 | | | $ | 3 | | | $ | 1 | | | $ | — | |
__________________
(a)Estimated through May 31, 2026. The PJM BRA for the 2026/2027 PJM Capacity Year has been delayed to July 2025.
7. Income Taxes
The components of “Income tax benefit (expense)” for the periods were:
| | | | | | | | | | | | | | | | | | | | | | | | | | | | | | | | | |
| | | | | | Successor | | | Predecessor |
| | | | | | Year Ended December 31, 2024 | | May 18 through December 31, 2023 | | | January 1 through May 17, 2023 | | Year Ended December 31, 2022 |
| Federal | | | | | | $ | (113) | | | $ | 3 | | | | $ | (15) | | | $ | (9) | |
| State | | | | | | (31) | | | 1 | | | | (2) | | | (4) | |
| Current income taxes | | | | | | (144) | | | 4 | | | | (17) | | | (13) | |
| Federal | | | | | | 47 | | | (55) | | | | (184) | | | 68 | |
| State | | | | | | (1) | | | — | | | | (11) | | | (21) | |
| Deferred income taxes | | | | | | 46 | | | (55) | | | | (195) | | | 47 | |
| Investment tax credit | | | | | | — | | | — | | | | — | | | 1 | |
| Income tax benefit (expense) | | | | | | $ | (98) | | | $ | (51) | | | | $ | (212) | | | $ | 35 | |
| | | | | | | | | | | | | |
| | | | | | | | | | | | | |
Item 8. Table of Contents
Effective Tax Rate Reconciliations
The reconciliations of the effective tax rate for the periods were:
| | | | | | | | | | | | | | | | | | | | | | | | | | | | | | | | | |
| | | | | | Successor | | | Predecessor |
| | | | | | Year Ended December 31, 2024 | | May 18 through December 31, 2023 | | | January 1 through May 17, 2023 | | Year Ended December 31, 2022 |
| | | | | | | | | | | | | |
| Income (loss) before income taxes | | | | | | $ | 1,111 | | | $ | 194 | | | | $ | 677 | | | $ | (1,328) | |
| Income tax benefit (expense) | | | | | | (98) | | | (51) | | | | (212) | | | 35 | |
| Effective tax rate | | | | | | 8.8 | % | | 26.3 | % | | | 31.3 | % | | 2.6 | % |
| Federal income tax statutory tax rate | | | | | | 21 | % | | 21 | % | | | 21 | % | | 21 | % |
| Income tax benefit (expense) computed at the federal income tax statutory tax rate | | | | | | $ | (234) | | | $ | (41) | | | | $ | (143) | | | $ | 279 | |
| Income tax increase (decrease) due to: | | | | | | | | | | | | | |
| Change in valuation allowance | | | | | | 128 | | | (43) | | | | 129 | | | (198) | |
| Nuclear PTC | | | | | | 46 | | | — | | | | — | | | — | |
| Reorganization adjustments | | | | | | 23 | | | 26 | | | | (138) | | | — | |
| Return to provision | | | | | | 11 | | | — | | | | — | | | — | |
| Other permanent differences | | | | | | 3 | | | 22 | | | | (16) | | | (94) | |
| Nuclear decommissioning trust taxes | | | | | | (27) | | | (16) | | | | (9) | | | 28 | |
| | | | | | | | | | | | | |
| State income taxes, net of federal benefit | | | | | | (48) | | | 1 | | | | (34) | | | 19 | |
| | | | | | | | | | | | | |
| Other | | | | | | — | | | — | | | | (1) | | | 1 | |
| Income tax benefit (expense) | | | | | | $ | (98) | | | $ | (51) | | | | $ | (212) | | | $ | 35 | |
Deferred Taxes
The components of deferred tax liabilities and deferred tax assets were:
| | | | | | | | | | | | | | |
| | Successor |
| | December 31, 2024 | | December 31, 2023 |
| | | | |
| Nuclear decommissioning trust | | $ | 502 | | $ | 443 |
| Property, plant and equipment, net | | 465 | | 560 |
| Unrealized gain on qualifying derivatives | | 32 | | 12 |
| Investment in subsidiaries | | — | | 14 |
| | | | |
| Deferred tax liabilities | | 999 | | 1,029 |
| Less: | | | | |
| Interest limitation carryforward | | 340 | | 336 |
| Federal net operating loss carryforwards | | 164 | | 273 |
| Accrued pension costs | | 80 | | 78 |
| Accrued liabilities | | 30 | | 26 |
| State net operating loss carryforwards | | 15 | | 26 |
| | | | |
| | | | |
| Other | | 8 | | 10 |
| Deferred tax assets | | 637 | | 749 |
| Valuation allowance | | — | | (128) |
| Deferred tax liabilities, net | | $ | 362 | | $ | 408 |
Item 8. Table of Contents
Net Operating Losses
The components of NOL carryforwards were:
| | | | | | | | | | | | | | |
| | Successor |
| | December 31, 2024 | | December 31, 2023 |
| Federal, expirations 2036 - 2037 | | $ | — | | $ | 43 |
| Federal, indefinite expiration, limited to annual utilization of 80% | | 783 | | 1,258 |
| State, expirations 2025 - 2043 | | 310 | | 555 |
See “Emergence from Restructuring” below for information on limitations on our NOLs.
Unrecognized Tax Benefits
Unrecognized tax benefits as of December 31, 2024 (Successor) and December 31, 2023 (Successor) were a non-material amount and it is not expected the total amount of unrecognized tax benefit will change significantly within one year.
All tax returns filed for years December 31, 2021 and forward are open to examination by the relevant taxing authorities.
Emergence from Restructuring
The Company evaluated, including the change in control resulting from its Emergence from bankruptcy, the tax impact of its Restructuring as described in Note 3. As part of the Restructuring, a substantial portion of the Company’s prepetition debt was extinguished, resulting in cancellation of debt income (“CODI”). A taxpayer emerging from bankruptcy may exclude CODI from taxable income but must first reduce its tax attributes by the amount of CODI realized. The Company realized CODI of $1.2 billion, which resulted in a partial reduction in tax basis in PP&E assets.
Upon Emergence, the Company experienced an ownership change under Section 382 of the Internal Revenue Code. The Internal Revenue Code Sections 382 and 383 impose limitations on the ability of a company to utilize tax attributes after experiencing an ownership change. States generally have similar tax attribute limitation rules following an ownership change. The Company also applied fresh start accounting. As a result, deferred tax assets and liabilities were adjusted based on the Successor GAAP financial statements. See Note 4 for additional information on fresh start accounting.
Valuation Allowance
The Company’s most significant deferred tax assets are its net operating losses and interest limitation carryforward. Management assesses the available positive and negative evidence to estimate whether it is more likely than not that sufficient future taxable income will be generated to permit the use of existing deferred tax assets. Such assessment includes the evaluation of historical earnings after adjusting for certain nonrecurring items for the purpose of projecting future taxable income. Negative evidence in the form of cumulative losses are no longer present as the Company has returned to profitability. The existence of objective positive evidence allows for consideration of other subjective evidence, including (but not limited to) Talen’s projections for future income which would allow for utilization of all net operating losses and interest limitation carryforwards. At each period, management will continue to assess the available positive and negative evidence to determine the need for a valuation allowance.
As a result of the assessment, it was determined that it is more likely than not that federal and state deferred tax assets will be fully utilized by future taxable income. As of December 31, 2024 (Successor), the entire federal and state valuation allowances were released, resulting in a $128 million tax benefit.
For the period from May 18 through December 31, 2023 (Successor), a 43 million tax expense was recognized for the increase in federal and state valuation allowances based on the realizability of deferred tax assets. For the period from January 1 through May 17, 2023 (Predecessor), a 129 million benefit was recognized for the reduction in federal and state valuation allowances. The change in valuation allowance estimates was the result of tax attribute reduction from the cancellation of debt income that was realized upon Emergence. For the year ended December 31, 2022 (Predecessor) a 198 million tax expense was recognized for the increase in federal and state valuation allowances based on realizability of deferred tax assets.
Item 8. Table of Contents
Inflation Reduction Act of 2022
The Inflation Reduction Act was signed into law in August 2022. Among the Act’s provisions are amendments to the Internal Revenue Code to create a nuclear production tax credit program.
The Nuclear PTC program provides qualified nuclear power generation facilities with a $3 per MWh transferable credit for electricity produced and sold to an unrelated party during each tax year. Electricity produced and sold by Susquehanna to third parties after December 31, 2023 through December 31, 2032 qualifies for the credit, which is subject to potential adjustments. Such adjustments include inflation escalators, a five-times increase in tax credit value (to $15 per MWh) if the qualifying generation facility meets prevailing wage requirements (which we expect to meet), and a pro-rata decrease in tax credit value once the annual gross receipts of a qualifying generation facility exceeds $25 per MWh. As the credit is eliminated when the annual gross receipts are equivalent to $43.75 per MWh (adjusted for inflation), the Nuclear PTC program is expected to create a minimum price Susquehanna is expected to receive for its generation. Susquehanna generated 17 million MWh sold to third parties in calendar year 2024.
The credit would be:
| | | | | | | | |
| Annual Gross Receipts | | Credit Amount |
| 25 per MWh or less | | 15 per MWh |
| Greater than 25 per MWh | | Ratably reduced until gross receipts equal 44 per MWh, 0 after that threshold |
The Inflation Reduction Act’s provisions are subject to implementation regulations, the terms of which are not yet fully known. No assurance can be provided as to the magnitude of the benefit to Susquehanna, as the Inflation Reduction Act’s provisions, including the computations of the Nuclear PTC, are subject to implementation regulations that could impact the credit value recognized to date and credit value available in future periods. Accordingly, Talen cannot fully predict the realization of any minimum price for Susquehanna’s generation and (or) impacts to Talen’s liquidity or results of operations. See Note 6 for additional information on Nuclear PTC revenue recognized.
Current Taxes Payable
Current tax liabilities presented as “Other current liabilities” on the Consolidated Balance Sheets were 53 million as of December 31, 2024 (Successor) and 2 million as of December 31, 2023 (Successor).
8. Inventory
| | | | | | | | | | | | | | |
| | Successor |
| | December 31, 2024 | | December 31, 2023 |
| Coal | | $ | 92 | | | $ | 152 | |
| Oil products | | 65 | | | 75 | |
| Fuel inventory for electric generation | | 157 | | | 227 | |
| Materials and supplies, net | | 88 | | | 72 | |
| Environmental products | | 57 | | | 76 | |
| Inventory, net | | $ | 302 | | | $ | 375 | |
Inventory net realizable value and obsolescence charges on coal and fuel oil inventories are presented as “Other operating income (expense), net” on the Consolidated Statements of Operations. Such non-cash charges were non-material for the year ended December 31, 2024 (Successor), non-material for the period from May 18 through December 31, 2023 (Successor), $37 million for the period from January 1 through May 17, 2023 (Predecessor), and non-material for the year ended December 31, 2022 (Predecessor).
During the period from January 1 through May 17, 2023 (Predecessor), $24 million of adjustments were related to Brandon Shores coal and materials and supplies inventories. See Note 10 for additional information on the Brandon Shores recoverability assessment.
Item 8. Table of Contents
9. Nuclear Decommissioning Trust Funds
| | | | | | | | | | | | | | | | | | | | | | | | | | | | | | | | | | | | | | | | | | | | | | | | | | |
| | Successor |
| | December 31, 2024 | | December 31, 2023 |
| | Amortized Cost | | Unrealized Gains | | Unrealized Losses | | Fair Value | | Amortized Cost | | Unrealized Gains | | Unrealized Losses | | Fair Value |
| Cash equivalents | | $ | 3 | | | $ | — | | | $ | — | | | $ | 3 | | | $ | 9 | | | $ | — | | | $ | — | | | $ | 9 | |
| Equity securities | | 509 | | | 651 | | | 55 | | | 1,105 | | | 491 | | | 575 | | | 53 | | | 1,013 | |
| Debt securities | | 615 | | | 3 | | | 7 | | | 611 | | | 570 | | | 10 | | | 1 | | | 579 | |
| Receivables (payables), net | | 5 | | | — | | | — | | | 5 | | | (26) | | | — | | | — | | | (26) | |
| NDT funds | | $ | 1,132 | | | $ | 654 | | | $ | 62 | | | $ | 1,724 | | | $ | 1,044 | | | $ | 585 | | | $ | 54 | | | $ | 1,575 | |
See Note 14 for additional information on the NDT fair value. There were no available-for-sale debt securities with credit losses as of December 31, 2024 (Successor) and December 31, 2023 (Successor).
As of December 31, 2024 (Successor), there was no intent to sell available-for-sale debt securities with unrealized losses, and it is not more likely than not that each of these investments will be required to be sold before the recovery of its amortized cost. The aggregate related fair value of available-for-sale debt securities with unrealized losses as of December 31, 2024 (Successor) were:
| | | | | | | | | | | | | | |
| | Fair Value | | Unrealized Losses |
| Corporate debt securities | | $ | 71 | | | $ | (2) | |
| Municipal debt securities | | 60 | | (1) | |
| U.S. Government debt securities | | 226 | | (4) | |
| Debt securities in unrealized loss position | | $ | 357 | | | $ | (7) | |
As of December 31, 2024 (Successor), the aggregate fair value of debt securities in a loss position for a duration of one year or longer were $15 million and the unrealized losses were non-material.
The contractual maturities for available-for-sale debt securities presented on the Consolidated Balance Sheets were:
| | | | | | | | | | | | | | |
| | Successor |
| | December 31, 2024 | | December 31, 2023 |
| Maturities within one year | | $ | 82 | | | $ | 105 | |
| Maturities within two to five years | | 220 | | | 194 | |
| Maturities thereafter | | 309 | | | 280 | |
| Debt securities, fair value | | $ | 611 | | | $ | 579 | |
The sales proceeds, gains, and losses for available-for-sale debt securities for the periods were:
| | | | | | | | | | | | | | | | | | | | | | | | | | | | | | | | | |
| | | | | | Successor | | | Predecessor |
| | | | | | Year Ended December 31, 2024 | | May 18 through December 31, 2023 | | | January 1 through May 17, 2023 | | Year Ended December 31, 2022 |
Sales proceeds of NDT funds investments (a) | | | | | | $ | 2,132 | | | $ | 1,259 | | | | $ | 839 | | | $ | 2,081 | |
| Gross realized gains | | | | | | 12 | | | 5 | | | | 7 | | | 10 | |
| Gross realized losses | | | | | | (13) | | | (11) | | | | (12) | | | (43) | |
__________________
(a)Sales proceeds are used to pay income taxes and trust management fees. Remaining proceeds are reinvested in the NDT.
Item 8. Table of Contents
10. Property, Plant and Equipment
| | | | | | | | | | | | | | | | | | | | | | | | | | | | | | | | | | | | | | | | | | | | |
| | | | Successor |
| | | | December 31, 2024 | | December 31, 2023 |
| | Estimated Useful Life (years) | | Gross Value | | Accumulated Depreciation | | Carrying Value | | Gross Value | | Accumulated Depreciation | | Carrying Value |
| Electric generation | | 3-27 | | $ | 3,030 | | | $ | (292) | | | $ | 2,738 | | | $ | 3,178 | | | $ | (109) | | | $ | 3,069 | |
| Nuclear fuel | | 1-6 | | 322 | | | (152) | | | 170 | | | 228 | | | (55) | | | 173 | |
| Other property and equipment | | 1-26 | | 90 | | | (18) | | | 72 | | | 358 | | | (21) | | | 337 | |
| | | | | | | | | | | | | | |
| Capitalized software | | 1-5 | | 8 | | | (3) | | | 5 | | | 6 | | | (1) | | | 5 | |
| Construction work in progress | | | | 169 | | | — | | | 169 | | | 255 | | | — | | | 255 | |
| Property, plant and equipment, net | | | | $ | 3,619 | | | $ | (465) | | | $ | 3,154 | | | $ | 4,025 | | | $ | (186) | | | $ | 3,839 | |
The components of “Depreciation, amortization and accretion” presented on the Consolidated Statements of Operations for the periods were:
| | | | | | | | | | | | | | | | | | | | | | | | | | | | | | | | | |
| | | | | | Successor | | | Predecessor |
| | | | | | Year Ended December 31, 2024 | | May 18 through December 31, 2023 | | | January 1 through May 17, 2023 | | Year Ended December 31, 2022 |
Depreciation expense (a) | | | | | | $ | 225 | | | $ | 133 | | | | $ | 173 | | | $ | 432 | |
Amortization expense (b) | | | | | | 16 | | | 1 | | | | 4 | | | 12 | |
Accretion expense (c) | | | | | | 57 | | | 31 | | | | 24 | | | 78 | |
| Other | | | | | | — | | | — | | | | (1) | | | (2) | |
| Depreciation, amortization and accretion | | | | | | $ | 298 | | | $ | 165 | | | | $ | 200 | | | $ | 520 | |
__________________
(a)Electric generation and other property and equipment.
(b)Intangible assets and capitalized software.
(c)ARO and accrued environmental cost accretion. See Note 11 for additional information.
The cost of nuclear fuel and the amortization of nuclear fuel intangible assets are presented as “Nuclear fuel amortization” on the Consolidated Statements of Operations.
Amortization expense related to nuclear fuel intangible assets was $33 million for the year ended December 31, 2024 (Successor) and $53 million for the period from May 18 through December 31, 2023 (Successor). Estimated intangible assets amortization expense for the next four years is:
| | | | | | | | | | | | | | | | | | | | | | | | | | |
| | 2025 | | 2026 | | 2027 | | 2028 (a) |
| Estimated amortization expense | | $ | 14 | | | $ | 5 | | | $ | 3 | | | $ | 1 | |
__________________
(a)Supply contracts underlying the nuclear fuel intangible assets expire in 2028.
The carrying value of nuclear fuel intangible assets presented as “Other noncurrent assets” on the Consolidated Balance Sheets was $23 million as of December 31, 2024 (Successor) and $56 million as of December 31, 2023 (Successor).
Jointly Owned Facilities
Certain of Talen's subsidiaries own undivided interests in jointly owned electric generation facilities and related assets. These generation facilities and other assets are maintained and operated pursuant to their joint ownership participation and operating agreements. Under such arrangements, each participant is responsible for funding its proportional share of costs and is entitled to its proportionate share of electric generation and (or) other attributes of the relevant jointly owned facilities. Talen's proportional share of gross margin and other operating costs for its undivided interests is presented within the Consolidated Statements of Operations.
Talen owns undivided interest of 90% in Susquehanna, 22.22% in Conemaugh, and 12.34% in Keystone. See below for information regarding the ownership of Colstrip in Montana. The carrying value of Colstrip, Conemaugh, and Keystone were non-material as of December 31, 2024 (Successor) and December 31, 2023 (Successor).
Item 8. Table of Contents
The proportionate share of “Property, plant and equipment, net” related to Susquehanna presented on the Consolidated Balance Sheets was:
| | | | | | | | | | | | | | |
| | Successor |
| | December 31, 2024 | | December 31, 2023 |
| Ownership interest | | 90% | | 90% |
| | | | |
| Electric generation | | $ | 2,206 | | | $ | 2,187 | |
| Nuclear fuel | | 322 | | | 228 | |
| Other property and equipment | | 25 | | | 19 | |
| Capitalized software | | 2 | | | 2 | |
| | | | |
| Construction work in progress | | 109 | | | 95 | |
| Proportionate property, plant and equipment, cost | | 2,664 | | | 2,531 | |
| Less: accumulated depreciation and amortization | | 326 | | | 121 | |
| Proportionate property, plant and equipment, net | | $ | 2,338 | | | $ | 2,410 | |
Talen Montana. Talen Montana owns 30% of Colstrip Unit 3 and does not own any portion of Colstrip Unit 4. However, it is a participant in a joint-owner sharing agreement which governs each party’s responsibilities and rights whereby Talen Montana is responsible for 15% of the total operating costs and expenditures of Colstrip Unit 3 and 15% of Colstrip Unit 4. Accordingly, it is entitled to 15% of the available generation from each of these units. In January 2020, Talen Montana and the other co-owner of Colstrip Units 1 and 2 permanently retired the units. Talen Montana is responsible for 50% of the decommissioning and other related costs of Colstrip Units 1 and 2.
Reliability Impact Assessments
Brandon Shores and H.A Wagner RMR Arrangements. In 2023, we notified PJM of our intent to deactivate electric generation at both our Brandon Shores and H.A. Wagner facilities on June 1, 2025. However, PJM subsequently notified us that both Brandon Shores and H.A Wagner are needed past their previously planned retirement dates to maintain reliability in PJM. In January 2025, we reached a settlement (which remains subject to FERC approval) with key stakeholders on the terms of an RMR arrangement and filed with FERC the resulting Joint Offers of Settlement regarding both facilities’ RMR Continuing Operations Rates Schedules (the “CORS”). If approved, the proposed RMR arrangements will extend the operating life of these plants through May 31, 2029, or until such time as the necessary transmission upgrades are placed into service. Beginning June 1, 2025, the CORS will provide a monthly fixed-cost payment of 12083333 (312/MW-day) for Brandon Shores and 2916667 (137/MW-day) for H.A Wagner, which includes a performance “hold back” of 416667 per month for Brandon Shores and 208333 per month for H.A Wagner, each to be paid out based on unit performance. We will also receive separate reimbursement for variable costs and approved project investments.
2023 Impairment
Brandon Shores Asset Group. Brandon Shores is required by contract and permit to cease coal combustion by December 31, 2025. In the first quarter 2023, Talen canceled its plan to convert Brandon Shores to an oil combustion facility due to an increase in expected conversion costs. This decision triggered a recoverability assessment of the carrying value of the Brandon Shores asset group. Brandon Shores notified PJM that it will deactivate electric generation on June 1, 2025. See above for additional information.
The recoverability analysis indicated that the Brandon Shores asset group carrying value exceeded its future estimated undiscounted cash flows, which required an impairment charge to amend the asset group’s carrying value of its PP&E to its estimated fair value. The estimated fair value of the asset group was determined by a discounted cash flow technique that utilized significant unobservable inputs including an 11% discount rate. We believe that the utilized discount rate and other discounted cash flow assumptions are consistent with those used by principal market participants. Such assumptions consider available evidence regarding the prospects of future cash flows for the Brandon Shores asset group, including but not limited to estimated available future generation volumes and useful lives, capacity prices, energy prices, operating costs, capital expenditures, and environmental costs. Accordingly, for the period from January 1 through May 17, 2023 (Predecessor), a $361 million non-cash pre-tax impairment charge on the asset group’s undepreciated PP&E is presented as “Impairments” on the Consolidated Statements of Operations.
Item 8. Table of Contents
Equity Method Investments
Talen holds equity interests in Conemaugh Fuels and Keystone Fuels equal to its respective undivided ownership interests in Conemaugh and Keystone. Conemaugh Fuels and Keystone Fuels were formed to purchase coal and sell it to Conemaugh and Keystone. Additionally, they may sell coal to any entity that manufactures or produces synthetic fuel from coal for resale to Conemaugh and Keystone. The aggregate affiliated fuel purchases by Talen from Conemaugh Fuels and Keystone Fuels is presented as “Fuel and energy purchases” on the Consolidated Statements of Operations. Talen’s aggregate fuel purchases for Conemaugh and Keystone Fuels were $35 million for the year ended December 31, 2024 (Successor), $23 million for the period from May 18 through December 31, 2023 (Successor) and $14 million for the period from January 1 through May 17, 2023 (Predecessor). For the year ended December 31, 2022 (Predecessor), Talen’s aggregate fuel purchases were $63 million.
11. Asset Retirement Obligations and Accrued Environmental Costs
| | | | | | | | | | | | | | |
| | Successor |
| | December 31, 2024 | | December 31, 2023 |
| Asset retirement obligations | | $ | 498 | | | $ | 464 | |
| Accrued environmental costs | | 21 | | | 23 | |
| Total asset retirement obligations and accrued environmental costs | | 519 | | | 487 | |
Less: asset retirement obligations and accrued environmental costs due within one year (a) | | 51 | | | 18 | |
| | | | |
| Asset retirement obligations and accrued environmental costs due after one year | | $ | 468 | | | $ | 469 | |
__________________
(a)Presented as “Other current liabilities” on the Consolidated Balance Sheets.
Asset Retirement Obligations
Certain subsidiaries of the Company have legal retirement obligations for the decommissioning and environmental remediation costs associated with our current and former generation, which include activities such as structure removal and remediation of coal piles, wastewater basins, and ash impoundments. Most of these obligations, except remediation of some ash impoundments, are not expected to be paid until several years, or decades, in the future. The most significant obligations are associated with the decommissioning of Susquehanna (for which the NDT is expected to fund) and coal ash disposal units associated with legacy coal-fired generation facilities (for which the Company has posted surety bonds and letters of credit for certain facilities). The carrying value of these obligations include assumptions of estimated future ARO cash expenditures, cost escalation rates, probabilistic cash flow models and discount rates. The ARO carrying value of AROs associated with legacy coal-fired generation facilities may be impacted by current or future EPA rulemaking. Additionally, as of December 31, 2024 (Successor), the fair values of certain AROs as a result of the EPA CCR Rule cannot be determined. See Note 12 for additional information on the EPA CCR Rule and the regulatory timeline that is expected to determine the associated scope of work.
Additionally, certain subsidiaries of the Company have legal retirement obligations associated with the removal, disposal, and (or) monitoring of asbestos-containing material at certain generation facilities. Given that the ultimate volume of asbestos-containing material is not yet known, the fair value of these obligations cannot be reasonably estimated. These obligations will be recognized upon a change in economic events or other circumstances which enables the fair value to be estimable.
Item 8. Table of Contents
The changes of the ARO carrying value during the periods were:
| | | | | | | | |
| | ARO
Rollforward |
| Carrying value, December 31, 2022 (Predecessor) | | $ | 751 | |
| Obligations settled | | (11) | |
| Changes in estimates and (or) settlement dates | | 3 | |
| Accretion expense | | 23 | |
| | |
| Carrying value, May 17, 2023 (Predecessor) | | $ | 766 | |
| | |
| | |
| Carrying value, May 18, 2023 (Successor) | | $ | 766 | |
| Fair value adjustment at Emergence | | (321) | |
| Obligations settled | | (11) | |
| Accretion expense | | 30 | |
| Carrying value, December 31, 2023 (Successor) | | $ | 464 | |
| | |
| | |
| | |
| Obligations settled | | (13) | |
| Changes in estimates and (or) settlement dates | | (17) | |
| Accretion expense | | 55 | |
| Obligations incurred | | 9 | |
| Carrying value, December 31, 2024 (Successor) | | $ | 498 | |
Supplemental information for the ARO:
| | | | | | | | | | | | | | |
| | Successor |
| | December 31, 2024 | | December 31, 2023 |
| Supplemental Information | | | | |
Nuclear (a) | | $ | 242 | | | $ | 214 | |
Non-Nuclear (b) | | 256 | | | 250 | |
| Carrying value | | $ | 498 | | | $ | 464 | |
__________________
(a)Obligations are expected to be settled with available funds in the NDT at the time of decommissioning. See Note 14 for additional information on the NDT.
(b)Certain obligations are: (i) partially supported by surety bonds, some of which have been collateralized with cash and (or) LCs; or (ii) partially prefunded under phased installment agreements.
Susquehanna. Each joint owner of Susquehanna is obligated to fund their proportional share of Susquehanna's ARO. Talen’s proportionate share of decommissioning activities will be funded from the NDT when decommissioning commences in connection with the expiration of Susquehanna’s licenses. The licenses for Susquehanna Unit 1 and Unit 2 expire in 2042 and 2044, respectively, and can be extended subject to NRC approval. The NRC has jurisdiction over the decommissioning of nuclear power generation facilities and requires minimum decommissioning funding based upon a formula. Under the most recent calculation in 2022, the NDT exceeds the NRC's minimum funding requirements. Each joint owner of Susquehanna is obligated to fund their proportional decommissioning costs if their respective nuclear decommissioning trusts do not contain sufficient funds. We believe the NDT will be adequate to fund the Company’s proportionate share of decommissioning costs. As of December 31, 2024 (Successor), the fair value of the NDT was $1.7 billion and the carrying value the Company’s proportionate share of the Susquehanna ARO, which is discounted under a present value technique, was $242 million. See Note 2 for additional information on the measurement of AROs.
Talen Montana. Talen Montana has significant decommissioning and environmental remediation liabilities primarily consisting of its proportionate share of remediation, closure and decommissioning costs for coal ash impoundments at Colstrip. Due to the expected timing and scope of anticipated remediation activities, actual cash expenditures associated with these obligations are expected to materially increase over the next five years and will continue at a reduced spending level for several decades. Talen Montana, along with the other co-owners of Colstrip, are working with the Montana Department of Environmental Quality (the “MDEQ”) to define the scope of required remediation, the scope of closure and decommissioning activities, and an estimate of the costs, including the amount of necessary financial assurance necessary to backstop these obligations. Talen Montana's decommissioning and environmental remediation is expected to be paid by funds available to Talen Montana at the time of decommissioning.
Talen Montana's estimate of its proportionate share of the AROs, discounted using a credit adjusted risk-free rate, was $98 million at December 31, 2024 (Successor) and $107 million at December 31, 2023 (Successor).
Item 8. Table of Contents
As a result of environmental regulations issued by the EPA or other regulatory entities, the Company may be required to revise and (or) recognize new AROs. Future adjustments may be required to the Talen Montana ARO estimates due to the ongoing remediation requirements under MDEQ obligations and the EPA CCR Rule. If the assumptions underlying Talen Montana's estimates do not materialize as expected, actual cash expenditures and costs could be materially different than currently estimated. Moreover, regulatory changes and (or) changes resulting from required scope revisions on remediation activities could affect these obligations. See Note 12 for information on Talen Montana’s requirement to provide financial assurance for certain environmental decommissioning and remediation liabilities related to Colstrip.
Accrued Environmental Costs
Under the Pennsylvania Clean Streams Law, a Talen subsidiary is obligated to remediate acid mine drainage at a former mine site and may be required to take additional steps to prevent acid mine drainage at this site. Liabilities related to the remediation were $21 million and $23 million as of December 31, 2024 (Successor) and December 31, 2023 (Successor), respectively, and were presented as “Other current liabilities” and “Asset retirement obligations and accrued environmental costs” on the Consolidated Balance Sheets. Such liabilities were discounted based on a credit adjusted risk-free rate that was in existence at the time of initial liability recognition of 8.41. The undiscounted amount of the liabilities was $32 million and $34 million as of December 31, 2024 (Successor) and December 31, 2023 (Successor).
12. Commitments and Contingencies
Legal, Regulatory, and Environmental Matters
We are regularly subject to various legal, regulatory, and environmental matters in connection with our business. While we believe we have meritorious positions and will continue to vigorously defend our positions in these matters, we may not be successful in our efforts, and we cannot predict the effect of an adverse outcome of any such matter. If an unfavorable outcome is probable and can be reasonably estimated, a liability is recognized. In the event of an unfavorable outcome, the liability may be in excess of amounts currently accrued. Because of the inherently unpredictable nature of legal, regulatory, and environmental matters and the wide range of potential outcomes for any such matter, no estimate of the possible losses in excess of amounts accrued, if any, can be made at this time regarding any matter specifically described below. As a result, additional losses actually incurred in excess of amounts accrued could be substantial. Unless otherwise disclosed below, we are unable to predict the outcome of any matter discussed below or reasonably estimate the amount of any associated costs and (or) potential liabilities. Additionally, it is possible that the outcome of any such matter, including market modifications, could materially impact our business, financial condition, results of operations, cash flows, and (or) liquidity.
Legal Matters
We are involved in various legal and administrative proceedings, investigations, claims, and litigation from time to time in the course of our business. Such matters may include, but are not limited to, those relating to employment and benefits, commercial disputes, personal injury, property damage, regulatory matters, environmental matters, and various other claims for injuries and (or) damages. While we believe we have meritorious positions and will continue to appropriately respond to all legal matters, because of the inherently unpredictable nature of legal proceedings, there is a wide range of potential outcomes for any such matter.
ERCOT Weather Event (Winter Storm Uri) Lawsuits. In connection with the ERCOT Sale (see Note 20 for additional information), the Company retained certain potential liabilities relating to claims filed from 2021 onward against its former Texas subsidiaries seeking unspecified damages for alleged losses caused by the defendants’ failure to provide sufficient power to the grid during Winter Storm Uri. The claims also allege similar liability against numerous other ERCOT power market participants. In December 2023, five multi-district litigation (“MDL”) bellwether lawsuits, which were selected by the MDL court as representative of all 58 cases filed in the Uri litigation, were dismissed by the MDL court, a ruling subsequently upheld by the Texas First Court of Appeals. On January 31 and February 3, 2025, the plaintiffs (in two groups) filed for mandamus relief in the Texas Supreme Court, seeking to overturn the lower courts. If affirmed by the Texas Supreme Court, Talen expects the dismissal ruling to apply broadly to all Uri cases against Talen’s former subsidiaries. Pursuant to the Plan of Reorganization, Talen’s maximum potential damages on prepetition Uri claims are expressly limited to payments from Talen’s insurers. However, claims filed after the Restructuring by plaintiffs who did not receive effective notice of the Restructuring, if any, may not be subject to the limitations in the Plan of Reorganization.
Spent Nuclear Fuel Litigation. Federal law requires the U.S. government to provide for the permanent disposal of commercial SNF, but the government has not yet done so. Until May 2014, the Department of Energy required nuclear generation facility operators to contribute to a fund intended to pay for the transportation and disposal of SNF, and Talen cannot predict if or when the government will reinstate any such fee in the future. In May 2023, an existing settlement agreement between Susquehanna and the U.S. government was extended through the end of 2025. The settlement agreement requires the government to reimburse Susquehanna for certain SNF storage costs through 2025 and requires Susquehanna to waive certain claims against the government relating to temporary SNF storage. As of December 31, 2024 (Successor), the Company has an accrued receivable of 14 million related to such reimbursements. During the period from May 18 through December 31, 2023 (Successor) and the year ended December 31, 2022 (Predecessor), Susquehanna received reimbursements of 24 million and 7 million for such costs. No assurance can be provided that this arrangement will be extended beyond 2025.
Item 8. Table of Contents
Regulatory Matters
We are subject to regulation by federal and state agencies and other bodies that exercise regulatory authority in the various regions where we conduct business, including but not limited to FERC; the Department of Energy; the NRC; NERC; the Federal Communications Commission; and state public utility commissions. In addition, the RTOs and ISOs in the regions in which we conduct business inherently have complex rules that are intended to balance the interests of market stakeholders. Proposed market structure modifications may lead to disputes among stakeholders that might not be resolved for a period of time as a result of regulatory and (or) legal proceedings. Accordingly, we are subject to uncertainty with respect to: (i) new or amended regulations issued by regulatory agencies; and (ii) changes in market design, tariff structure, capacity auctions, and (or) pricing rules.
PJM Capacity Market Reform. In June 2023, FERC accepted a request by PJM to delay certain PJM Base Residual Auctions in order for PJM to propose market reforms. PJM filed its market reform proposals with FERC in October 2023. In early 2024, FERC accepted portions of PJM’s proposed market changes. PJM held the PJM BRA for the 2025/2026 PJM Capacity Year in July 2024 which incorporated the FERC accepted changes. The PJM BRAs for the 2026/2027, 2027/2028, and 2028/2029 PJM Capacity Years were previously scheduled for December 2024, June 2025 (later changed to July 2025), and December 2025, respectively; however in September 2024, the Sierra Club and other organizations filed a complaint at FERC challenging PJM’s rules establishing must-offer exceptions for PJM BRA participation by RMR resources and seeking to delay the 2026/2027 PJM BRA pending resolution of its complaint. In October 2024, PJM announced it had concerns about FERC considering the Sierra Club’s complaints about RMR resources in isolation and therefore intended to file a Section 205 proceeding under the Federal Power Act seeking FERC’s approval of to-be-determined market reforms, including but not limited to potential revisions to the treatment of RMR resources. As a result, in October 2024 PJM formally requested that FERC approve six-month delays in the PJM BRAs for the 2026/2027, 2027/2028, 2028/2029, and 2029/2030 PJM Capacity Years and in November 2024, FERC approved the auction delays. The planning parameters for the 2026/2027 PJM BRA are expected in March 2025. Talen can provide no assurance that the four scheduled auctions will be held as scheduled or at all.
A series of filings aimed at reforming the PJM capacity market were filed at FERC. In November 2024, the Joint Consumer Advocates, comprised of consumer advocacy groups and government entities from Illinois, Maryland, New Jersey, Ohio, and the District of Columbia filed a complaint against PJM asking FERC to find that PJM’s existing capacity market rules are unjust and unreasonable and issue an order requiring certain short-term and longer-term changes to PJM’s capacity market rules.
In response, PJM made two FERC filings in December 2024 to address what they perceive as capacity market design issues (the “PJM Capacity Market 205 proceeding”). PJM proposed to retain the dual fuel combustion turbine as the reference resource and to implement a uniform non-performance charge throughout the RTO for the 2026/2027 and 2027/2028 delivery years, and to administratively include RMR units that meet certain criteria as price takers in the capacity auctions for the next two delivery years and will not assess penalties or pay bonuses to these RMR units. If approved, under PJM’s proposal, Talen’s Brandon Shores and H.A. Wagner plants may meet the criteria for RMR inclusion in the capacity auctions. PJM’s filing also clarifies that being excused from being required to offer into the capacity market is no defense to exercising market power by electing not to offer. Further, PJM proposed to make changes to the capacity market mitigation rules. This proposal will eliminate the must-offer exception for intermittent and limited duration resources that are eligible to participate in the capacity market and will allow market sellers to incorporate a risk component in their capacity market offers.
Following the above filings, in December 2024, the Pennsylvania Governor filed a complaint against PJM at FERC to address alleged elevated costs to consumers from the PJM capacity market in the 2026/2027 and 2027/2028 delivery years. Among other things, the Governor’s complaint proposed to lower the capacity price cap and reopen the closed interconnection queue to get new projects online. In January 2025, the Governor filed a motion to consolidate his complaint with the Joint Consumer Advocates complaint and two PJM filings referenced above. On January 28, 2025, the Governor and PJM announced they had reached an agreement to resolve the Governor’s complaint. That agreement would impose a collar on the capacity prices in the 2026/2027 and 2027/2028 BRAs, with a minimum capacity price of 175/Megawatt-day (“MWd”) and a maximum price of 325/MWd. On February 14, 2025, FERC accepted PJM’s proposals in the PJM Capacity Market 205 proceeding and as a result, the changes to the BRA parameters described above as part of that proceeding will be adopted for the 2026/2027 and 2027/2028 delivery years. Also on February 14, 2025, as a result of the agreement with PJM to collar the BRA results for the next two auction the Governor withdrew his complaints from FERC. On February 20, 2025, PJM initiated a new Section 205 proceeding seeking FERC’s approval of a settlement that will revise the relevant auction parameters and impose the capacity price collar agreed to with the Governor. The filing seeks expedited treatment intended to maintain the current auction schedule. At this time, it is unknown whether the collar arrangement will be approved by FERC or whether the auction schedule will remain unchanged. Talen filed comments in support of this proposal on February 24, 2025.
On February 20, 2025, FERC initiated a technical conference docket to consider broad resource adequacy issues across all RTOs, with the initial proceedings to take place on June 4 and 5, 2025. The Company intends to intervene in the new technical conference docket and participate in those proceedings.
Item 8. Table of Contents
Environmental Matters
Extensive federal, state, and local environmental laws and regulations are applicable to our business, including those related to air emissions, water discharges, and hazardous substances and solid waste management. From time to time, in the ordinary course of our business, Talen may be: (i) subject to environmental remediation work at its facilities; (ii) involved in other environmental matters; or (iii) become subject to other, new or revised environmental statutes, regulations, or requirements. It may be necessary for us to modify, curtail, replace, or cease operation of certain facilities or performance of certain operations to comply with statutes, regulations, and other requirements imposed by regulatory bodies, courts, or environmental groups. We may incur significant costs to comply with these requirements, including increased capital expenditures or operation and maintenance expenses, monetary fines, remediation costs, penalties, or other restrictions. Legal challenges to environmental rules or permits add to the uncertainty of estimating future compliance costs. In addition, in January 2025, President Trump issued executive orders directing the heads of all federal agencies to identify and begin the processes to suspend, revise, or rescind all agency actions, including existing regulations, that are unduly burdensome on the identification, development, or use of domestic energy resources. Consequently, future implementation and enforcement of these rules remains uncertain at this time. Further, costs may increase significantly if the requirements or scope of environmental laws or regulations, or similar rules, are expanded or changed.
EPA CSAPR and Nitrogen Oxides (“NOx”) Requirements. Coal-fired generation facilities, including those in which Talen has ownership, have been the subject of EPA regulations and efforts by certain states and other parties to strengthen applicable NOx emission limits under the Clean Air Act. In 2015, the EPA’s 2015 revision to the 8-hour ozone National Ambient Air Quality Standards for ground-level ozone to 70 parts per billion (the “EPA 2015 Ozone Standard”) was issued, which triggered updates to state-specific compliance requirements as well as provisions that are intended to limit cross-state emissions. In June 2023, the EPA published a rule in connection with the EPA 2015 Ozone Standard updating the EPA CSAPR ozone season NOx allowance trading program for 2023 and beyond (“Good Neighbor Plan”). Talen’s facilities in Maryland, Pennsylvania, and New Jersey are subject to the new rule; however, the entire rule has been challenged by multiple parties. The Good Neighbor Plan was stayed in its entirety by the U.S. Supreme Court in June 2024 pending a complete review of the rule by the D.C. Circuit Court of Appeals. In November 2024, the EPA issued an interim final rule indicating it plans to provide NOx allocations and budgets from the previously applicable and less restrictive Revised CSAPR Update rule until the Good Neighbor Plan matter is resolved. In February 2025, the D.C. Circuit Court of Appeals denied the EPA’s motion requesting the Good Neighbor Plan litigation be held in abeyance for 60 days and ordered the parties to complete supplemental briefing in March 2025. As a result, future implementation and enforcement of the Good Neighbor Plan remains uncertain at this time.
EPA MATS Rule. In May 2024, the EPA published a rule that requires coal-fired generation facilities to reduce particulate matter emissions by the middle of 2027 (or 2028, if an extension is approved). Colstrip is not expected to meet the new particulate matter standard without substantial upgrades to its control equipment. As a result, Talen Montana and the other Colstrip co-owners face the decision either to invest in new cost-prohibitive control equipment or retire the Colstrip facility. Such decision must be evaluated in conjunction with compliance requirements under the May 2024 EPA GHG Rule due to timing and costs. Challenges to the EPA MATS Rule have been filed in the D.C. Circuit Court of Appeals, including by Talen and 23 states. After motions to stay the EPA MATS Rule during the pendency of the litigation were denied by the D.C. Circuit Court of Appeals, Talen and other parties filed emergency stay request applications with the U.S. Supreme Court in September 2024, which were denied in October 2024. The appeal on the merits of the new rule remains pending in the D.C. Circuit Court of Appeals. In February 2025, the D.C. Circuit Court of Appeals granted the EPA’s unopposed motion to hold the MATS litigation in abeyance for 90 days. No assurance can be provided as to when the challenges to the EPA MATS Rule will be resolved or whether such challenges will be resolved in the Company’s favor. As the timeline for compliance with the new standards is accelerated and must be considered in tandem with the new EPA GHG Rule, which is also subject to ongoing legal challenges, it is possible the Company will need to make operating decisions about the future of Colstrip before the Company has clarity about the outcome of the litigation.
EPA GHG Rule. In May 2024, the EPA published a rule that establishes carbon dioxide limits for new electric generating units (“EGUs”) and GHG guidelines for certain existing EGUs. Under the guidelines, if existing coal-fired EGUs operate beyond 2031, GHG reductions, such as those achieved by the addition of carbon capture and sequestration (“CCS”), are required to be implemented by the end of 2031. Colstrip is not expected to meet the new rules without substantial technology upgrades and pipeline infrastructure build-out. As a result, Talen Montana and the other Colstrip co-owners face the decision either to invest in new cost-prohibitive controls (e.g., CCS technology) or retire the Colstrip facility by the end of 2031. Such decision must be evaluated in conjunction with compliance requirements under the May 2024 EPA MATS Rule. Petitions have been filed in the D.C. Circuit Court of Appeals, including by coalitions representing 27 states and an ad hoc coalition of power producers of which Talen is a member, requesting a review of the EPA GHG Rule. Stay motions were denied by the D.C. Circuit Court of Appeals in July 2024 and the U.S. Supreme Court in October 2024. Appeals of the EPA GHG Rule remain pending in the D.C. Circuit Court of Appeals. In February 2025, the D.C. Circuit Court of Appeals granted the EPA’s unopposed motion to hold the litigation in abeyance for 60 days. No assurance can be provided as to when the challenges to the EPA GHG Rule will be resolved or whether such challenges will be resolved in the Company’s favor. The EPA has also stated its intent to develop GHG regulations for existing natural gas combustion turbines; however, no rule has been proposed. As the timeline for compliance with the new standards is accelerated and must be considered in tandem with the new EPA MATS Rule, which is also subject to ongoing legal challenges, it is possible the Company will need to make operating decisions about the future of Colstrip before the Company has clarity about the outcome of the litigation.
Item 8. Table of Contents
Pennsylvania RGGI. In October 2019, the then-Governor of Pennsylvania signed an Executive Order directing the Pennsylvania Department of Environmental Protection (the “PDEP”) to draft regulations establishing a cap-and-trade program with the intent of enabling Pennsylvania to join the RGGI, a multi-state regional cap-and-trade program comprised of several Eastern U.S. states. In April 2022, Pennsylvania entered the RGGI program, with compliance set to begin on July 1, 2022. However, in November 2023, the Commonwealth Court of Pennsylvania ruled RGGI was an invalid tax and voided the rulemaking. The PDEP appealed this decision to the Pennsylvania Supreme Court and filed notice with the court that the RGGI program would not be implemented while the appeal is pending. In July 2024, the Pennsylvania Supreme Court permitted certain non-profit environmental groups to intervene in the litigation.
EPA ELG Rule. In November 2015, the EPA revised the effluent limitation guidelines for certain power generation facilities, which imposed more stringent standards for wastewater streams as facility discharge permits are renewed. In 2020, the EPA issued changes that would exempt coal generation facility operators from meeting certain wastewater standards if the facility would commit to cease coal-fired generation by the end of 2028, which Talen elected for its wholly owned coal operations. In May 2024, the EPA published revisions to the EPA ELG Rule, which imposed additional requirements for legacy wastewater and combustion residual leachate. Such EPA ELG Rule revisions impact Talen’s active generation facilities that have both CCR units and hold National Pollutant Discharge Elimination System (“NPDES”) discharge permits. These sites include Brandon Shores, Brunner Island, Montour, and potentially Martins Creek. Talen is evaluating what: (i) potential discharge limits may apply; (ii) treatment may be required; and (iii) the implementation timeline may be. Obligations for installing any new wastewater treatment equipment, if necessary, will not be known until each applicable state where the active generation facilities operate makes their own determination with respect to NPDES permit renewals with new limits and associated timing. As a result of the future permit conditions, additional capital expenditures and (or) AROs may be required, which may have a material impact on our results of operations and (or) financial condition.
Multiple challenges, including stay requests, to the EPA ELG Rule have been filed in various U.S. Courts of Appeal by parties that include 15 states, environmental groups, and industry groups, including the Utility Water Act Group, of which Talen is a member. The appeals have been consolidated in the U.S. Court of Appeals for the Eighth Circuit, and in October 2024, stay requests were denied. In February 2025, the EPA filed a motion in the U.S. Court of Appeals for the Eight Circuit requesting that the litigation be held in abeyance for a period of 60 days with a motion to govern due at the end of that period. No assurance can be provided as to when the challenges to the EPA ELG Rule merits will be resolved or whether such challenges will be resolved in the Company’s favor.
EPA CCR Rule. In April 2015, the EPA established regulations under the Resource Conservation and Recovery Act (“RCRA”) to identify CCRs as nonhazardous solid waste and provided CCR management and siting requirements. The 2015 rule was modified in 2020 after a 2018 D.C. Circuit Court of Appeals ruling found that, among other things, the EPA did not adequately regulate unlined impoundments. In its 2020 rulemaking, the EPA specified procedures for owners to extend the operating timeline of certain unlined impoundments. Talen submitted an extension request under this process for an unlined impoundment at Montour, which was withdrawn in December 2024, following the end of basin operations and the initiation of basin closure. The 2018 D.C. Circuit Court of Appeals ruling also found that the EPA did not properly address legacy surface impoundments in the 2015 CCR rule. As a result of the finding, in May 2024, the EPA finalized additional federal CCR regulations effective in November 2024, which provided new requirements for legacy CCR surface impoundments and new requirements for other CCR disposal and management areas at active power plants (“CCR Management Units” or “CCRMUs”). This rule has been challenged in the D.C. Circuit Court of Appeals by multiple parties, including two industry groups of which Talen is a member. In December 2024, the U.S. Supreme Court denied a requested stay of the legacy EPA CCR Rule. In February 2025, the D.C Circuit Court of Appeals granted EPA’s unopposed motion to hold the litigation in abeyance for 120 days. Additionally, the EPA is being challenged by other industry parties on new regulatory interpretations that could be consequential to CCR unit closure practices and costs. No assurance can be provided at this time as to when the legal challenges to the EPA CCR Rule and interpretations will be resolved or whether such challenges will be decided in the Company’s favor.
Talen continues to review the new EPA CCR Rule provisions that went into effect in 2024, perform the required applicability assessments, and await additional information and guidance from the EPA concerning the rule’s requirements. Pursuant to the regulations, initial facility evaluation reports to identify CCR areas which may become regulated and subject to the rule’s requirements are due in February 2026. Following that, site investigation may be required to further investigate applicability, and a subsequent facility report is due in February 2027. The Company has initiated reviews under the facility evaluation report requirements at locations with ash impoundments that have long since ceased coal operations as well as at locations with current coal operations. No assurance can be provided as to whether any specific ash impoundments owned by the Company may or may not be within scope of the updated EPA CCR Rule until the Company completes its assessments within the regulatory timeframe.
As of December 31, 2024 (Successor), the Company has recognized required cost estimates in order to comply with the EPA CCR Rule’s initial compliance requirements and deadlines, including the initial groundwater monitoring requirements. The Company does not yet have sufficient information available to estimate costs for the future compliance obligations under the rule. As the Company continues its applicability evaluations and site assessments to determine the scope of work on its properties imposed by the new rule, additional new AROs and (or) revisions could be required. It is expected estimates will be available, under the timeline provided for by the regulations, as described above, at the completion of the initial facility evaluation reports or at the completion of a subsequent site investigation. Such AROs or ARO changes could be material and, as a result, may have a material impact on our results of operations and (or) financial condition.
Item 8. Table of Contents
Certain Resolved Matters
Pension Litigation. In July 2024, a U.S. District Court in Pennsylvania approved the settlement of a class action lawsuit brought by former Talen employees alleging they were owed enhanced benefits under the TERP. Pursuant to the settlement, Talen agreed to pay: (i) $6 million for settlement administrative costs and plaintiff attorneys fees, which were partially offset by insurance recoveries; and (ii) $14 million to class members from the TERP. Both payment obligations were substantially completed during the year ended December 31, 2024 (Successor).
PPL/Talen Montana Litigation. In December 2023, a settlement was reached in (i) a 2018 class action lawsuit filed by the Talen Montana Retirement Plan against PPL and its affiliates claiming that an improper $733 million distribution to PPL left Talen Montana insolvent; and (ii) a related 2018 lawsuit filed by PPL against Talen and affiliates seeking various substantive and procedural relief in the first case. Under the terms of the settlement, PPL paid Talen Montana $115 million in exchange for a full release of claims, with $11 million of that amount remitted to the general unsecured creditors trust established under the Plan of Reorganization. As a result, a $104 million net gain is presented as “Other non-operating income (expense), net” on the Consolidated Statements of Operations for the year ended December 31, 2023 (Successor).
Winter Storm Elliott. During December 2022, as a result of Winter Storm Elliott, PJM experienced conditions that resulted in PJM declaring a Capacity Performance event. In April 2023, we and certain other market participants filed FERC complaints against PJM disputing a portion of the penalties charged by PJM to generators (including us) for failing to meet PJM’s Capacity Performance requirements. In December 2023, FERC approved a market-wide settlement resolving all Winter Storm Elliot complaints, including ours, which reduced our net aggregate penalties to an estimated 28 million. Utilizing the best available information of PJM’s assessments: (i) an initial penalty of 33 million was recognized for the year ended December 31, 2022 (Predecessor); (ii) an increase of 13 million for the period from January 1 through May 17, 2023 (Predecessor); and (iii) an increase of 2 million for the period from May 18 through December 31, 2023 (Successor). At the time of FERC’s approval, aggregate net penalty payments of 29 million had been remitted to PJM. Accordingly, in December 2023 as a result of FERC’s approval, the remaining 19 million estimated liability was derecognized.
Guarantees and Other Assurances
In the normal course of business, the Company enters into agreements to provide financial performance assurance to third parties on behalf of certain subsidiaries. These agreements primarily support or enhance the stand-alone creditworthiness attributed to a subsidiary or facilitate the commercial activities in which these subsidiaries engage. Such agreements may include guarantees, stand-by LCs, and (or) surety bonds. Additionally, they may include customary indemnifications to third parties related to asset sales and other transactions. The probability of expected material payment and (or) performance for these assurance agreements is believed to be remote.
Surety Bonds. Surety bonds provide financial performance assurance to third parties on behalf of certain Company subsidiaries for obligations including but not limited to environmental obligations and AROs. In the event of nonperformance by the applicable subsidiary, the beneficiary would make a claim to the surety, and the Company would be required to reimburse any payment by the surety. Talen’s liability with respect to any particular surety bond is released once the obligations secured by the surety bond are performed. Surety bond providers generally have the right to request additional collateral or request that such bonds be replaced by alternate surety providers. As of December 31, 2024 (Successor) and December 31, 2023 (Successor), the aggregate amount of surety bonds outstanding was $234 million and $240 million, respectively, including surety bonds posted on behalf of Talen Montana as discussed below.
Talen Montana Financial Assurance. Pursuant to the Colstrip Administrative Order on Consent (the “Colstrip AOC”), Talen Montana, in its capacity as the Colstrip operator, is obligated to close and remediate coal ash disposal impoundments at Colstrip. The Colstrip AOC specifies an evaluation process between Talen Montana and the MDEQ on the scope of remediation and closure activities, requires the MDEQ to approve such scope, and requires financial assurance to be provided to the MDEQ on approved plans. Each of the co-owners of Colstrip has provided its proportionate share of financial assurance to the MDEQ for estimates of coal ash disposal impoundments remediation and closure activities approved by the MDEQ.
The aggregate amount of surety bonds posted to the MDEQ on behalf of Talen Montana’s proportionate share of such activities was $125 million and $115 million as of December 31, 2024 (Successor) and December 31, 2023 (Successor), respectively. Talen Montana’s surety bond requirements may increase due to scope changes, cost revisions, and (or) other factors when the MDEQ conducts annual reviews of approved remediation and closure plans as required under the Colstrip AOC. The surety bond requirements are expected to decrease as Colstrip’s coal ash impoundments remediation and closure activities are completed. See Note 11 for additional information on Colstrip AROs.
Other Commitments and Contingencies
Nuclear Insurance. The Price-Anderson Act is a federal law that governs liability-related issues and ensures the availability of funds for public liability claims arising from a nuclear incident at any U.S. licensed nuclear facility. It also seeks to limit the liability of nuclear reactor owners for such claims from any single incident. As of December 31, 2024 (Successor), the liability limit per incident is $16.3 billion for such claims, which is funded by insurance coverage from American Nuclear Insurers ($500 million in coverage), with the remainder covered by an industry retrospective assessment program.
Item 8. Table of Contents
As of December 31, 2024 (Successor), under the industry retrospective assessment program, in the event of a nuclear incident at any of the reactors covered by the Price-Anderson Act, Susquehanna could be assessed deferred premiums of up to $332 million per incident, payable at a maximum of $49 million per year.
Additionally, Susquehanna purchases property insurance programs from Nuclear Electric Insurance Limited (“NEIL”), an industry mutual insurance company of which Susquehanna is a member. As of December 31, 2024 (Successor), facilities at Susquehanna are insured against nuclear property damage losses up to $2 billion and non-nuclear property damage losses up to $1 billion. Susquehanna also purchases an insurance program that provides coverage for the cost of replacement power during prolonged outages of nuclear units caused by certain specified conditions.
Under the NEIL property and replacement power insurance programs, Susquehanna could be assessed retrospective premiums in the event of the insurers’ adverse loss experience. The maximum assessment for this premium is $48 million as of December 31, 2024 (Successor). Talen has additional coverage that, under certain conditions, may reduce this exposure.
Talen Montana Fuel Supply. Talen Montana purchases coal from a mine owned by Westmoreland Rosebud Mining, LLC (the “Rosebud Mine”) for its interest in Colstrip Units 3 and 4 under a full requirements contract with the mine operator. Two lawsuits have been brought against the Rosebud Mine challenging permits issued to it by the State of Montana. Talen Montana is not party to either lawsuit, but is monitoring the progress of each to assess the impact to its operations. In the first lawsuit, the Montana Supreme Court affirmed a lower court’s ruling to vacate a mining permit and require the Montana Board of Environmental Review to perform an additional review of the permit. In the second lawsuit, the Montana Federal District Court ordered a branch of the U.S. Department of the Interior to complete an updated Environmental Impact Statement (“EIS”). In December 2024, the Montana Federal District Court granted an extension to the EIS completion date to October 7, 2025. At this time, Talen cannot predict the effect that an adverse outcome of these lawsuits to Rosebud Mine would have on: (i) Talen Montana’s ability to source fuel for its share of Colstrip operations; or (ii) Talen Montana’s operations, results of operations, or liquidity.
13. Long-term Debt and Other Credit Facilities
TES is the borrower/issuer under all the Company’s debt and credit facilities. As of December 31, 2024 (Successor), TES was not in default under any of its debt or credit agreements.
Long-Term Debt
| | | | | | | | | | | | | | | | | | | | |
| | | | Successor |
| | Interest Rate (a) | | December 31, 2024 | | December 31, 2023 |
| TLB-1 | | 7.02 % | | $ | 857 | | | $ | 866 | |
| TLB-2 | | 7.02 % | | 850 | | | — | |
TLC (b) | | N/A | | — | | | 470 | |
| Secured Notes | | 8.63 % | | 1,200 | | | 1,200 | |
| PEDFA 2009B Bonds | | 5.25 % | | 50 | | | 50 | |
| PEDFA 2009C Bonds | | 5.25 % | | 81 | | | 81 | |
Cumulus Digital TLF (b) | | N/A | | — | | | 182 | |
| Total principal | | | | 3,038 | | | 2,849 | |
| Unamortized deferred financing costs and original issuance discounts | | | | (34) | | | (29) | |
| Total carrying value | | | | 3,004 | | | 2,820 | |
| Less: long-term debt, due within one year | | | | 17 | | | 9 | |
| Long-term debt | | | | $ | 2,987 | | | $ | 2,811 | |
__________________
(a)Computed interest rate as of December 31, 2024 (Successor).
(b)See “Recent Transactions” below for additional information on extinguishments of indebtedness.
Long-term debt maturities as of December 31, 2024 (Successor) were:
| | | | | | | | | | | | | | | | | | | | | | | | | | | | | | | | | | | | | | | | | | | | |
| | 2025 | | 2026 | | 2027 | | 2028 | | 2029 | | Thereafter | | Total |
| Principal debt maturities | | $ | 17 | | | $ | 17 | | | $ | 17 | | | $ | 17 | | | $ | 17 | | | $ | 2,952 | | | $ | 3,038 | |
Item 8. Table of Contents
Revolving Credit and Other Facilities
| | | | | | | | | | | | | | | | | | | | | | | | | | | | | | | | | | | | | |
| | | | Successor |
| | | | December 31, 2024 | | | |
| | Maturity | | Committed Capacity (a) | | Direct Cash Borrowings | | LCs Issued | | Unused Capacity | | | | | |
| RCF | | December 2029 | | $ | 700 | | | $ | — | | | $ | — | | | $ | 700 | | | | | | |
| LCF | | December 2026 | | 900 | | | — | | | 374 | | | 526 | | | | | | |
| | | | | | | | | | | | | | | |
| | | | | | | | | | | | | | | |
| Total | | | | $ | 1,600 | | | $ | — | | | $ | 374 | | | $ | 1,226 | | | | | | |
__________________
(a)RCF committed capacity can be used for direct cash borrowings and (or) LCs.
In December 2024, the TLC LCF and Bilateral LCF were terminated. However, as certain LCs remained outstanding under these facilities pending their transition to the LCF, corresponding backstop LCs were issued under the LCF. As of December 31, 2024 (Successor), the amount of such backstop LCs issued under the LCF were $297 million.
As of December 31, 2023 (Successor): (i) the aggregate LCs issued under the TLC LCF and Bilateral LCF were $478 million; and (ii) LCs issued under TLC LCF were collateralized by $472 million of cash presented as “Restricted cash and cash equivalents” on the Consolidated Balance Sheets. The restricted cash was released in connection with the TLC LCF termination.
See “Recent Transactions–Credit Facilities” below for additional information on LC facility terminations.
Long-Term Debt, Revolving Credit, and Other Facilities
Certain key terms of our indebtedness include:
| | | | | | | | | | | | | | | | | | | | |
| Secured Notes | TLB-1 | TLB-2 | RCF | LCF | PEDFA Bonds |
| Maturity: | June 2030 | May 2030 | December 2031 | December 2029 | December 2026 | 2009B: December 2038
2009C: December 2037 |
| Index: | None | Term SOFR | Term SOFR | Term SOFR | None | None |
| Rate, Applicable Margin, and Amortization: | 8.625 per annum fixed rate
No applicable margin
No amortization | 2.50% per annum applicable margin; leverage-based step-downs to 2.25 and 2.00
Amortization 1.00 per annum; paid quarterly | Same as TLB-1 | Cash borrowings: 2.00 per annum applicable margin; leverage-based step-downs to 1.75 and 1.50
LCs: LC fee equal to applicable margin above + fronting fee of 0.125
Unused commitments: 0.375; leverage-based step-down to 0.25
No amortization | LCs: Same as RCF
Unused commitments: Same as RCF | 5.25 per annum fixed rate
No applicable margin
No amortization |
| Prepayment Penalty: | Prior to June 1, 2026: Redeemable at par plus a customary “make-whole” premium. 40 redeemable from the proceeds of certain equity offerings at 108.625. 10 redeemable at 103 from June 1, 2025 – May 31, 2026
On or after June 1 of the following years: 2026: 104.313; 2027: 102.156; 2028 and after: 100 | 1.00 to the extent prepaid prior to June 20, 2025 in connection with a repricing transaction | 1.00 to the extent prepaid prior to June 13, 2025 in connection with a repricing transaction | None | None | Prior to June 1, 2026: Par plus a customary “make-whole” premium
On or after June 1, 2026: Par |
Credit Agreement. The Credit Agreement governs the RCF, TLB-1, TLB-2, and LCF. The Credit Agreement contains customary negative covenants including but not limited to limitations on incurrence of liens and additional indebtedness, making investments, payment of dividends, and asset sales. The Credit Agreement also contains customary affirmative covenants. Solely with respect to the RCF and LCF, and solely during a compliance period (i.e., when RCF cash borrowings exceed 50 of revolving commitments), the Credit Agreement requires TES’s consolidated first lien net leverage ratio not to exceed 4.25x. This financial covenant does not apply to the TLB-1 or TLB-2. The Credit Agreement also contains customary representations and warranties, events of default, and remedies (including acceleration of amounts due and (or) termination of commitments).
Item 8. Table of Contents
Secured Notes. Interest on the Secured Notes is payable semi-annually on June 1 and December 1 of each year and at maturity. The Secured Notes are subject to customary negative covenants, including but not limited to certain limitations on incurrence of liens and additional indebtedness, making investments, payment of dividends, and transactions involving the Susquehanna assets, but do not contain any financial covenants. The Secured Notes also contain customary affirmative covenants, events of default, and remedies (including acceleration).
PEDFA Bonds. The PEDFA 2009B and 2009C Bonds were issued by the PEDFA on behalf of TES, and TES then received the proceeds under corresponding back-to-back exempt facilities loan agreements with the PEDFA. Corresponding TES unsecured promissory notes for each series contain the applicable principal, interest, and prepayment provisions. The PEDFA Bonds bear interest at a fixed rate until the end of the current term rate period on June 1, 2027, at which time they are subject to mandatory remarketing during which TES may elect a different interest rate mode. Aside from principal amount and final maturity, the terms of the PEDFA 2009B Bonds and 2009C Bonds are substantially identical. The PEDFA Bonds are subject to customary affirmative and negative covenants appropriate for such tax-exempt facilities, including but not limited to limitations on incurrence of liens (but not unsecured indebtedness), and asset sales. The PEDFA Bonds are also subject customary events of default and remedies (including acceleration).
Secured ISDAs. Talen Energy Marketing is party to certain Secured ISDAs, under which TES and the Subsidiary Guarantors provide the applicable counterparties with a first priority lien on and security interest (which ranks pari passu with the liens securing the Credit Facilities and the Secured Notes) in certain assets in lieu of posting collateral in the form of cash equivalents or LCs. The secured obligations under the Secured ISDAs were $17 million as of December 31, 2024 (Successor).
Security Interests, Guarantees, and Cross-Defaults
Secured Obligations. The obligations under the Credit Facilities, Secured Notes, and Secured ISDAs are secured by a first-priority lien on and security interest in substantially all of the assets of TES and the Subsidiary Guarantors. The Subsidiary Guarantors guarantee TES’s obligations under the Credit Facilities and the Secured Notes. TES and the Subsidiary Guarantors guarantee Talen Energy Marketing’s obligations under the Secured ISDAs. The amount for which TES and the Subsidiary Guarantors may be liable is equal to the amount of obligations outstanding under such agreements and may also include unpaid interest, premiums, penalties, and (or) other fees and expenses. An event of default under the Credit Facilities, Secured Notes, or Secured ISDAs, if not cured or waived, may result in a cross acceleration of amounts due and (or) cross termination across all these agreements.
Unsecured Obligations. The PEDFA Bonds are senior unsecured obligations of TES that are effectively subordinated to TES’s secured obligations, including the Credit Facilities, Secured Notes, and Secured ISDAs, to the extent of the value of the assets securing those obligations. Certain of the Subsidiary Guarantors also guarantee TES’s obligations under the PEDFA Bonds. These guarantees are the general unsecured obligations of such Subsidiary Guarantors, rank equally with all of their other senior unsecured indebtedness, and are effectively subordinated to their secured obligations, including guarantees under the Credit Facilities, Secured Notes, and Secured ISDAs, to the extent of the value of the assets securing those obligations.
Recent Transactions
Secured Notes. In January 2025, the indenture governing the Secured Notes was amended to, among other things: (i) modify certain provisions, including certain covenants and related definitions, in order to substantially conform to the corresponding amendments to the Credit Agreement obtained in the December 2024 transactions discussed below; and (ii) waive TES’s right to optionally redeem up to 10% of the Secured Notes at a price of 103% of par prior to June 1, 2025.
Credit Facilities. In December 2024, TES completed several refinancing transactions:
•TLB-2: Issued a new $850 million TLB-2, the proceeds of which were used, together with cash on hand, to repurchase shares of our outstanding common stock from Rubric. See Note 18 for additional information on repurchases of common stock.
•TLB-1: Repriced the existing $857 million TLB-1 to reduce the current interest rate margin by 100 basis points (to SOFR plus 250 basis points, with further leverage-based step downs available) to align pricing with the new TLB-2.
•RCF: Repriced the existing $700 million RCF to reduce the current interest rate margin by 100 basis points (to SOFR plus 200 basis points, with further leverage-based step downs available), increased revolving LC capacity from $475 million to $700 million, and extended the maturity from May 2028 to December 2029.
•LCF: Issued a new $900 million standalone secured LCF to transition LCs from the TLC LCF and Bilateral LCF. LCs issued under the LCF are subject to an LC fee of 2.00% per annum (with leverage-based step downs available) plus a fronting fee of 0.125% per annum.
•TLC/TLC LCF: Repaid in full the $470 million TLC utilizing the restricted cash collateralizing the TLC LCF, and terminated the TLC and associated $470 million TLC LCF.
Item 8. Table of Contents
•Bilateral LCF: Terminated the $75 million Bilateral LCF.
In connection with these transactions, the requisite lenders under the Credit Agreement also consented to certain amendments, among other things, increasing the Company’s flexibility for restricted payments, investments, and dispositions under the Credit Facilities. As a result of these transactions, the Company derecognized the carrying value of the extinguished TLC and presents the carrying value of the newly issued TLB-2 on the Consolidated Balance Sheet.
In May 2024, TES repriced the TLB-1 and TLC, and the lenders, as part of these debt modifications, agreed to waive mandatory prepayment obligations related to the ERCOT Sale. See Note 20 for additional information on the ERCOT Sale. Additionally, the lenders under the TLB-1, TLC, and RCF consented to certain other covenant improvements.
PEDFA Bonds. In June 2024, TES completed the remarketing of its outstanding $50 million in PEDFA 2009B Bonds and $81 million in PEDFA 2009C Bonds. As part of the remarketing, (i) the PEDFA Bonds were transitioned from a variable daily interest rate to a fixed term rate of 5.25% until June 1, 2027, at which time they are subject to mandatory remarketing during which TES may elect a different interest rate mode; (ii) $133 million of TES LCs that had previously supported the PEDFA Bonds were terminated; (iii) mandatory repurchase and optional redemption provisions were modified; and (iv) certain covenants relating to changes of control, incurrence of liens, and asset sales were amended and became operative. The remarketing transaction is excluded from the Consolidated Statements of Cash Flows as a non-cash item.
Cumulus Digital TLF Repayment. In connection with the AWS Data Campus Sale, the Cumulus Digital TLF was paid in full in March 2024, together with all accrued interest and other outstanding amounts, and related liens, guarantees, and LCs were released and terminated. See Note 20 for additional information on the AWS Data Campus Sale.
14. Fair Value
Recurring Fair Value Measurements
Financial assets and liabilities reported at fair value on a recurring basis primarily include energy commodity derivatives, interest rate derivatives, and investments held within the NDT.
The classifications of recurring fair value measurements within the fair value hierarchy were:
| | | | | | | | | | | | | | | | | | | | | | | | | | | | | | | | | | | | | | | | | | | | | | | | | | | | | | | | | | | | | | | | | | |
| | Successor |
| | December 31, 2024 | | December 31, 2023 |
| | Level 1 | | Level 2 | | | | NAV | | Netting (a) | | Total | | Level 1 | | Level 2 | | | | NAV | | Netting (a) | | Total |
| Assets | | | | | | | | | | | | | | | | | | | | | | | | |
| Cash equivalents | | $ | — | | | $ | — | | | | | $ | 3 | | | $ | — | | | $ | 3 | | | $ | — | | | $ | — | | | | | $ | 9 | | | $ | — | | | $ | 9 | |
Equity securities (b) | | 758 | | — | | | | | 347 | | | — | | | 1,105 | | | 629 | | | — | | | | | 384 | | | — | | | 1,013 | |
| U.S. Government debt securities | | 353 | | — | | | | | — | | | — | | | 353 | | | 337 | | | — | | | | | — | | | — | | | 337 | |
| Municipal debt securities | | — | | | 85 | | | | | — | | | — | | | 85 | | | — | | | 86 | | | | | — | | | — | | | 86 | |
| Corporate debt securities | | — | | | 173 | | | | | — | | | — | | | 173 | | | — | | | 156 | | | | | — | | | — | | | 156 | |
| | | | | | | | | | | | | | | | | | | | | | | | |
Receivables (payables), net (c) | | — | | | — | | | | | — | | | — | | | 5 | | | — | | | — | | | | | — | | | — | | | (26) | |
| NDT funds | | 1,111 | | | 258 | | | | | 350 | | | — | | | 1,724 | | | 966 | | | 242 | | | | | 393 | | | — | | | 1,575 | |
| | | | | | | | | | | | | | | | | | | | | | | | |
| Commodity derivatives | | 134 | | | 91 | | | | | — | | | (156) | | | 69 | | | 98 | | | 196 | | | | | — | | | (200) | | | 94 | |
| Interest rate derivatives | | — | | | 2 | | | | | — | | | — | | | 2 | | | — | | | 1 | | | | | — | | | — | | | 1 | |
| Total assets | | $ | 1,245 | | | $ | 351 | | | | | $ | 350 | | | $ | (156) | | | $ | 1,795 | | | $ | 1,064 | | | $ | 439 | | | | | $ | 393 | | | $ | (200) | | | $ | 1,670 | |
| | | | | | | | | | | | | | | | | | | | | | | | |
| Liabilities | | | | | | | | | | | | | | | | | | | | | | | | |
| Commodity derivatives | | $ | 145 | | | $ | 29 | | | | | $ | — | | | $ | (167) | | | $ | 7 | | | $ | 155 | | | $ | 139 | | | | | $ | — | | | $ | (257) | | | $ | 37 | |
| Interest rate derivatives | | — | | | — | | | | | — | | | — | | | — | | | — | | | 6 | | | | | — | | | — | | | 6 | |
| | | | | | | | | | | | | | | | | | | | | | | | |
| Total liabilities | | $ | 145 | | | $ | 29 | | | | | $ | — | | | $ | (167) | | | $ | 7 | | | $ | 155 | | | $ | 145 | | | | | $ | — | | | $ | (257) | | | $ | 43 | |
__________________(a)Amounts represent netting pursuant to master netting arrangements and cash collateral held or placed with the same counterparty.
(b)Includes commingled equity and fixed income funds and real estate investment trusts.
(c)Represents: (i) interest and dividends earned but not received; and (ii) net sold or purchased investments, but not settled.
There were no recurring fair value measurements classified as Level 3 as of December 31, 2024 (Successor) and December 31, 2023 (Successor).
Item 8. Table of Contents
Nonrecurring Fair Value Measurements
There were no nonrecurring fair value measurements related to impairments of long-lived assets during the year ended December 31, 2024 (Successor) and for the period from May 18 through December 31, 2023 (Successor). See Note 4 for information on the nonrecurring fair value measurements resulting in the application of fresh start accounting and Note 10 for information on the nonrecurring fair value measurement of Brandon Shores during the period from January 1 through May 17, 2023 (Predecessor).
Reported Fair Value
The carrying value of certain financial assets and liabilities on the Consolidated Balance Sheets, including “Cash and cash equivalents,” “Restricted cash and cash equivalents,” “Accounts receivable,” and “Accounts payable and other accrued liabilities” approximate fair value.
The fair value measurements of indebtedness are classified as Level 2 within the fair value hierarchy. The fair value of fixed rate debt was estimated primarily by utilizing an income approach whereby the future cash flows of the obligations are discounted at the estimated current cost of funding rates, which incorporates the credit risk associated with the obligations. The carrying value of variable rate indebtedness approximates fair value.
The carrying value and fair value of indebtedness presented on the Consolidated Balance Sheets were:
| | | | | | | | | | | | | | | | | | | | | | | | | | |
| | Successor |
| | December 31, 2024 | | December 31, 2023 |
| | Carrying Value | | Fair Value | | Carrying Value | | Fair Value |
| | | | | | | | |
Long-term debt (a) | | $ | 3,004 | | | $ | 3,120 | | | $ | 2,820 | | | $ | 2,934 | |
Other short-term indebtedness (b) | | — | | | — | | | 6 | | | 6 | |
__________________
(a)Aggregate value of “Long-term debt” and “Long-term debt, due within one year” presented on the Consolidated Balance Sheets.
(b)Presented as “Other current liabilities” on the Consolidated Balance Sheets.
15. Postretirement Benefit Obligations
TES and certain subsidiaries sponsor postemployment benefits which include defined benefit pension plans, health and welfare postretirement plans (other postretirement benefit plans), and a defined contribution plan.
Pension and Other Postretirement Defined Benefit Plans
Obligations under the defined benefit pension and other postretirement plans are generally based on factors, among others, such as age of the participants, years of service, and compensation. The pension and other postretirement plans are closed to new participants. Effective December 31, 2018, all participants ceased accruing additional benefits in the TERP, the Company’s largest defined benefit pension plan.
Funded Status. The net fair value of underfunded defined benefit pension and other postretirement plans are presented as “Postretirement benefit obligations” on the Consolidated Balance Sheets. Certain other postretirement plans were overfunded by $36 million and $33 million as of December 31, 2024 (Successor) and 2023 (Successor), respectively, and are presented as “Other noncurrent assets” on the Consolidated Balance Sheets. The current portion of certain unfunded postretirement obligations were non-material.
Item 8. Table of Contents
The aggregate funded status and the weighted average assumptions for the periods were:
| | | | | | | | | | | | | | | | | | | | | | | |
| | Pension Benefits |
| | Successor | | | Predecessor |
| | Year Ended December 31, 2024 | | May 18 through December 31, 2023 | | | January 1 through May 17, 2023 |
| | | | | | | |
| Change in benefit obligation | | | | | | | |
| Benefit obligation beginning balance | | $ | 1,308 | | | $ | 1,300 | | | | $ | 1,273 | |
| Service cost | | 2 | | | 2 | | | | 1 | |
| Interest cost | | 63 | | | 40 | | | | 25 | |
| Actuarial (gain) loss | | (81) | | | 20 | | | | 6 | |
| Actual benefits paid | | (105) | | | (55) | | | | (34) | |
| Resolved litigation settlement and other charges | | 15 | | | 1 | | | | — | |
| Benefit obligation ending balance | | $ | 1,202 | | | $ | 1,308 | | | | $ | 1,271 | |
| Change in plan assets | | | | | | | |
| Plan assets fair value beginning balance | | 975 | | | 997 | | | | 994 | |
| Actual return on plan assets | | (13) | | | 24 | | | | 35 | |
| Employer contributions | | 54 | | | 9 | | | | 2 | |
| Actual benefits paid | | (105) | | | (55) | | | | (34) | |
| Plan assets fair value ending balance | | $ | 911 | | | $ | 975 | | | | $ | 997 | |
| Funded status | | $ | (291) | | | $ | (333) | | | | $ | (274) | |
| Accumulated benefit obligation | | $ | 1,202 | | | $ | 1,308 | | | | $ | 1,271 | |
| Aggregate amounts of underfunded plans | | | | | | | |
| Benefit obligation/Accumulated benefit obligation | | 1,202 | | | 1,308 | | | | 1,271 | |
| Fair value of plan assets | | 911 | | | 975 | | | | 997 | |
| Amounts recognized in accumulated other comprehensive income | | | | | | | |
| Net (gain) loss | | 34 | | | 37 | | | | 238 | |
| Total accumulated other comprehensive income | | $ | 34 | | | $ | 37 | | | | $ | 238 | |
| Assumptions | | | | | | | |
| Discount rate | | 5.65 | % | | 5.00 | % | | | 5.37 | % |
| Interest crediting rate | | 6.00 | % | | 6.00 | % | | | 6.00 | % |
| Rate of compensation increase | | 3.45 | % | | 3.45 | % | | | 3.45 | % |
Item 8. Table of Contents
| | | | | | | | | | | | | | | | | | | | | | | |
| | Other Postretirement Benefits |
| | Successor | | | Predecessor |
| | Year Ended December 31, 2024 | | May 18 through December 31, 2023 | | | January 1 through May 17, 2023 |
| | | | | | | |
| Change in benefit obligation | | | | | | | |
| Benefit obligation beginning balance | | $ | 79 | | | $ | 78 | | | | $ | 77 | |
| Service cost | | 1 | | | 1 | | | | — | |
| Interest cost | | 3 | | | 2 | | | | 1 | |
| Plan amendments | | (21) | | | — | | | | — | |
| Actuarial (gain) loss | | (3) | | | 1 | | | | 1 | |
| Plan participant contributions | | 2 | | | 2 | | | | 1 | |
| Actual benefits paid | | (9) | | | (5) | | | | (4) | |
| Benefit obligation ending balance | | $ | 52 | | | $ | 79 | | | | $ | 76 | |
| Change in plan assets | | | | | | | |
| Plan assets fair value beginning balance | | 75 | | | 74 | | | | 75 | |
| Actual return on plan assets | | 3 | | | 4 | | | | 2 | |
| | | | | | | |
| Plan participant contributions | | 2 | | | 2 | | | | 1 | |
| Actual benefits paid | | (9) | | | (5) | | | | (4) | |
| Plan assets fair value ending balance | | $ | 71 | | | $ | 75 | | | | $ | 74 | |
| Funded status | | $ | 19 | | | $ | (4) | | | | $ | (2) | |
| | | | | | | |
| Aggregate amounts of underfunded plans | | | | | | | |
| Benefit obligation / Accumulated benefit obligation | | $ | 52 | | | $ | 78 | | | | $ | 76 | |
| Fair value of plan assets | | 71 | | | 75 | | | | 74 | |
| Amounts recognized in accumulated other comprehensive income | | | | | | | |
| Net (gain) loss | | (2) | | | (1) | | | | 4 | |
| Prior service cost (credit) | | (20) | | | — | | | | (4) | |
| Total accumulated other comprehensive income | | $ | (22) | | | $ | (1) | | | | $ | — | |
| Assumptions | | | | | | | |
| Discount rate | | 5.63 | % | | 5.01 | % | | | 5.36 | % |
| Rate of compensation increase | | 2.31 | % | | 2.31 | % | | | 2.31 | % |
During the year ended December 31, 2024 (Successor), the decrease in postretirement benefit obligations was primarily attributable to increasing interest rates, offset by actual returns being less than expected returns on plan assets.
In March 2024, $10 million of excess assets from the PA Mines United Mine Workers of America (“UMWA”) Plan VEBA were transferred to a separate VEBA, which provides benefits for participants in Talen’s health and welfare “wrap plan.” As such assets were not presented on the Consolidated Balance Sheets prior to the transfer of the assets from the VEBA, a transfer gain of $10 million was recognized for the year ended December 31, 2024 (Successor) and presented as “Other non-operating income (expense), net” on the Consolidated Statements of Operations.
Net Periodic Benefit Cost and Amounts Recognized in OCI. Service cost is presented as “Postretirement benefits service (credit) costs, net,” while the other components of net periodic defined benefit cost (credit) for pension and other postretirement plans are presented as “Operation, maintenance and development” on the Consolidated Statements of Operations. The portion of net periodic benefit cost capitalized during the year ended December 31, 2024 (Successor) and during the periods from May 18 through December 31, 2023 (Successor), and during the periods from January 1 through May 17, 2023 (Predecessor) was not material.
Item 8. Table of Contents
The components of net periodic benefit cost (credit), the amounts recognized in OCI and the associated weighted average assumptions for pension and other postretirement plans for the periods were:
| | | | | | | | | | | | | | | | | | | | | | | | | | | | | | |
| | Pension Benefits |
| | Successor | | | Predecessor |
| | Year Ended December 31, 2024 | | May 18 through December 31, 2023 | | | January 1 through May 17, 2023 | | | Year Ended December 31, 2022 |
| Net periodic benefit costs (credits): | | | | | | | | | | |
| Service cost | | $ | 2 | | | $ | 2 | | | | $ | 1 | | | | $ | 4 | |
| Interest cost | | 63 | | | 40 | | | | 25 | | | | 50 | |
| Expected return on plan assets | | (66) | | | (41) | | | | (30) | | | | (68) | |
| Amortization of net (gain) loss | | — | | | — | | | | 2 | | | | 27 | |
| Resolved litigation settlement and other charges | | 15 | | | 1 | | | | — | | | | — | |
| Net periodic defined benefit cost (credit) | | 14 | | | 2 | | | | (2) | | | | 13 | |
| Net actuarial (gain) loss | | (3) | | | 38 | | | | 2 | | | | 19 | |
| Reclassifications due to settlement and (or) curtailment: | | | | | | | | | | |
| Amortization of net (gain) loss | | — | | | — | | | | — | | | | (27) | |
| Total recognized in OCI | | $ | (3) | | | $ | 38 | | | | $ | 2 | | | | $ | (8) | |
| Total recognized in net periodic costs and OCI | | $ | 11 | | | $ | 40 | | | | $ | — | | | | $ | 5 | |
| Assumptions | | | | | | | | | | |
| Discount rate | | 5.00 | % | | 5.12 | % | | | 5.41 | % | | | 2.97 | % |
| Rate of compensation increase | | 3.45 | % | | 3.45 | % | | | 3.45 | % | | | 3.45 | % |
| Expected return on plan assets | | 7.25 | % | | 7.25 | % | | | 7.50 | % | | | 5.75 | % |
| | | | | | | | | | | | | | | | | | | | | | | | | | | | | | |
| | Other Postretirement Benefits |
| | Successor | | | Predecessor |
| | Year Ended December 31, 2024 | | May 18 through December 31, 2023 | | | January 1 through May 17, 2023 | | | Year Ended December 31, 2022 |
| Net periodic benefit costs (credits): | | | | | | | | | | |
| Service cost | | $ | 1 | | | $ | 1 | | | | $ | 1 | | | | $ | 1 | |
| Interest cost | | 3 | | | 2 | | | | 1 | | | | 3 | |
| Expected return on plan assets | | (4) | | | (2) | | | | (2) | | | | (4) | |
| Amortization of prior service cost (credit) | | (1) | | | — | | | | — | | | | (1) | |
| Net periodic defined benefit cost (credit) | | (1) | | | 1 | | | | — | | | | (1) | |
| Net actuarial (gain) loss | | (2) | | | (1) | | | | — | | | | (3) | |
| Prior service credit | | (21) | | | — | | | | — | | | | — | |
| Reclassifications due to settlement and (or) curtailment: | | | | | | | | | | |
| Amortization of prior service cost (credit) | | 1 | | | — | | | | — | | | | 1 | |
| Amortization of net (gain) loss | | — | | | — | | | | — | | | | (1) | |
| Total recognized in OCI | | $ | (22) | | | $ | (1) | | | | $ | — | | | | $ | (3) | |
| Total recognized in net periodic costs and OCI | | $ | (23) | | | $ | — | | | | $ | — | | | | $ | (4) | |
| Assumptions | | | | | | | | | | |
| Discount rate | | 5.01 | % | | 5.13 | % | | | 5.41 | % | | | 2.94 | % |
| Rate of compensation increase | | 2.31 | % | | 2.31 | % | | | 2.31 | % | | | 2.31 | % |
| Expected return on plan assets | | 5.49 | % | | 5.49 | % | | | 5.74 | % | | | 3.89 | % |
Health care grading trend rates (a) | | 7.10 to 4.40 | | 6.50 to 4.50 | | | 6.50 to 4.50 | | | 4.50 | % |
__________________(a)Trend rates grading to 2027.
In September 2024, the Company approved a plan amendment for certain other postretirement benefit plans, resulting in the recognition of prior service credits of $21 million and presented as “Postretirement benefit prior service (credits) costs, net” on the Consolidated Statements of Comprehensive Income (Loss).
See Note 12 for additional information on recently resolved litigation regarding certain of our defined benefit pension obligations.
Item 8. Table of Contents
The expected long-term rates of return for pension and other postretirement plans are based on management's projections using a best-estimate of expected returns, volatilities, and correlations for each asset class. Each plan’s specific current and expected asset allocations are also considered in developing a reasonable return assumption.
Contributions and Payments. TES contributed $43 million and $5 million to the TES sponsored pension plan during the year ended December 31, 2024 (Successor) and the period from May 18 through December 31, 2023 (Successor), respectively. There were no contributions for the pension plans during the period from January 1 through May 17, 2023 (Predecessor). Talen Montana contributed $10 million, $4 million, and $2 million of discretionary contributions to the Talen Montana sponsored pension plan during the year ended December 31, 2024 (Successor) and for the periods from May 18 through December 31, 2023 (Successor), and January 1 through May 17, 2023 (Predecessor), respectively, to the Talen Montana pension plan.
TES expects to contribute $65 million to the TES sponsored pension plan in 2025. Talen Montana expects to contribute $8 million of discretionary contributions to the Talen Montana sponsored pension plan in 2025, of which $4 million is expected to be collected by Talen Montana from the other joint owners of Colstrip.
The aggregate benefits paid to pension and other postretirement plan participants was $114 million for year ended December 31, 2024 (Successor), $60 million during the period from May 18 through December 31, 2023 (Successor), and $38 million during the period from January 1 through May 17, 2023 (Predecessor).
The forecasted undiscounted benefit payments to plan participants as of December 31, 2024 (Successor) were:
| | | | | | | | | | | | | | | | | | | | | | | | | | | | | | | | | | | | | | | | |
| | 2025 | | | 2026 | | 2027 | | | 2028 | | 2029 | | 2030-2034 |
| Pension plans | | $ | 97 | | | | $ | 94 | | | $ | 94 | | | | $ | 93 | | | $ | 93 | | | $ | 452 | |
| Other postretirement plans | | 6 | | | | 6 | | | 5 | | | | 5 | | | 4 | | | 18 | |
Pension plan assets. Pension plan assets are held in external trusts, including a master trust, which includes a 401(h) account that is restricted for certain other postretirement benefit obligations of Talen Energy Supply. The plans’ investment policies outline investment objectives.
The risk management framework categorizes the plan assets within three sub-portfolios: growth, immunizing, and liquidity. The trust investments within these portfolios are routinely monitored to seek a risk-adjusted return on a mix of assets that, in combination with our funding policy, will provide sufficient assets to provide long-term growth and liquidity for benefit payments, match asset duration with the expected liability duration, and mitigate concentrations of risk with asset diversification.
The weighted-average target asset allocations for the pension plan assets as of December 31, 2024 (Successor) were:
| | | | | | | | |
| | December 31, 2024 |
| Equity securities | | 32 | % |
| Debt securities | | 10 | % |
| Other | | 7 | % |
| Growth portfolio | | 48 | % |
| Debt securities | | 35 | % |
| Other | | 12 | % |
| Immunizing portfolio | | 47 | % |
| Liquidity portfolio | | 4 | % |
| Total | | 100 | % |
Item 8. Table of Contents
The classifications of pension plan asset fair value measurements within the fair value hierarchy were:
| | | | | | | | | | | | | | | | | | | | | | | | | | | | | | |
| | Successor |
| | December 31, 2024 | | December 31, 2023 |
| | Level 1 | | | NAV | Total | | Level 1 | | | NAV | Total |
| Cash equivalents | | $ | — | | | | $ | 100 | | $ | 100 | | | $ | — | | | | $ | 169 | | $ | 169 | |
| Commingled equity securities | | — | | | | 274 | | 274 | | | — | | | | 288 | | 288 | |
| Commingled debt securities | | — | | | | 286 | | 286 | | | — | | | | 301 | | 301 | |
| Alternative and other investments | | (15) | | | | 231 | | 216 | | | 52 | | | | 191 | | 243 | |
Receivables (payables), net (a) | | — | | | | — | | 35 | | | — | | | | — | | (25) | |
| Total trust funds | | (15) | | | | 891 | | 911 | | | 52 | | | | 949 | | 976 | |
Restricted 401(h) assets (b) | | — | | | | | — | | | — | | | | — | | (1) | |
| Total plan assets | | $ | (15) | | | | $ | 891 | | $ | 911 | | | $ | 52 | | | | $ | 949 | | $ | 975 | |
__________________
(a) Represents: (i) interest and dividends earned but not received; and (ii) net sold or purchased investments, but not settled.
(b) Other postretirement 401(h) benefits assets are a component of the pension plan master trust. Accordingly, these are excluded from pension plan assets.
Level 1 investments consist of exchange-traded futures contracts, which are valued using unadjusted prices available from the underlying market.
Certain investments in cash equivalent funds, commingled equity securities, commingled debt securities, and alternative investments are not classified within the fair value hierarchy. The fair value measurement of these funds is based on firm quotes of NAV per share, as a practical expedient for valuation, which are not obtained from a quoted price in an active market.
Investments in cash equivalent funds consist of short-term investment funds and commingled cash equivalent funds. Investments in equity funds consist of large and small cap U.S. and international funds that can be redeemed daily. Investments in commingled debt funds consist of funds that invest in investment-grade intermediate and long-duration corporate and government fixed-income securities. These investments can be redeemed daily.
Alternative and other investments consist of investments in funds that invest in a portfolio of exchange-traded futures and forward contracts, hedge funds of funds that employ investment strategies including long/short equity, market neutral, distressed debt, and relative value, private equity partnerships, with limited lives ranging from ten to fifteen years, and real estate investment partnerships. Investments in real estate partnerships have redemption limitations based on available funding and investments in private equity partnerships that cannot be redeemed with the partnership prior to the end of the partnerships’ lives; however, the interest may be sold to other parties. Redemptions of hedge funds, private equity, and real estate partnerships are also subject to the respective general partner's approval.
Other postretirement benefit plan assets. The investment strategy with respect to most of the other postretirement benefit obligations is to fund VEBA or similar trusts with voluntary contributions, when appropriate, and to invest in a tax efficient manner. Other postretirement benefit plans are invested in a mix of assets for long-term growth with an objective of earning returns that provide liquidity as required for benefit payments. These plans benefit from diversification of asset types, investment fund strategies and investment fund managers, and therefore, have no significant concentration of risk. Equity securities include investments in domestic large-cap commingled funds. Ownership interests in commingled funds that invest entirely in debt securities are classified as equity securities but treated as debt securities for asset allocation and target allocation purposes. Ownership interests in money market funds are treated as cash and cash equivalents for asset allocation and target allocation purposes.
The target asset allocations for other postretirement benefit assets as of December 31, 2024 (Successor) were:
| | | | | | | | |
| | 2024 |
| Cash and cash equivalents | | 4 | % |
| Equity securities | | 11 | % |
| Debt securities | | 84 | % |
| Total | | 100 | % |
Item 8. Table of Contents
The classifications of other postretirement benefit plan asset fair value measurements within the fair value hierarchy were:
| | | | | | | | | | | | | | | | | | | | | | | | | | | | | | | | | | |
| | Successor |
| | December 31, 2024 | | December 31, 2023 |
| | Level 1 | Level 2 | | NAV | Total | | Level 1 | Level 2 | | NAV | Total |
| Cash equivalents | | $ | — | | $ | — | | | $ | 4 | | $ | 4 | | | $ | — | | $ | — | | | $ | 7 | | $ | 7 | |
| Commingled equity securities | | — | | — | | | 10 | | 10 | | | — | | — | | | 9 | | 9 | |
| U.S. Government debt securities | | 7 | | — | | | — | | 7 | | | 8 | | — | | | — | | 8 | |
| Corporate debt securities | | — | | 18 | | | — | | 18 | | | — | | 16 | | | — | | 16 | |
| Commingled debt securities | | — | | — | | | 32 | | 32 | | | — | | — | | | 34 | | 34 | |
| Total trust funds | | 7 | | 18 | | | 46 | | 71 | | | 8 | | 16 | | | 50 | | 74 | |
Restricted 401(h) assets (a) | | — | | — | | | — | | — | | | — | | — | | | — | | 1 | |
| Total plan assets | | $ | 7 | | $ | 18 | | | $ | 46 | | $ | 71 | | | $ | 8 | | $ | 16 | | | $ | 50 | | $ | 75 | |
__________________(a) Other postretirement 401(h) benefits assets are a component of the pension plan master trust. Accordingly, these are reported as postretirement assets.
Level 1 investments consist of U.S. Treasury and (or) U.S. government debt securities, which are valued using unadjusted prices available from the underlying market.
Level 2 investments consist of corporate debt securities, which are valued using observable inputs such as benchmark yields, relevant trade data, broker/dealer bid/ask prices, benchmark securities, and credit valuation adjustments.
Certain investments in money market funds, commingled equity securities, and commingled debt securities are not classified within the fair value hierarchy. The fair value measurements of these funds are based on firm quotes of NAV per share, as a practical expedient for valuation, which are not obtained from a quoted price in an active market.
Investments in equity securities consist of investments in a passively managed equity index fund that invests in securities and a combination of other collective funds. Investments in debt securities represent investments in funds that invest in a diversified portfolio of investment grade fixed income securities.
Defined Contribution Plan
Substantially all Company employees are eligible to participate in the Company’s 401(k) deferred savings plans. Employer contributions to the plans were $25 million, $9 million, and $10 million during the year ended December 31, 2024 (Successor), for the period from May 18 through December 31, 2023 (Successor), and from the period January 1 through May 17, 2023 (Predecessor).
Coal Industry Retiree Benefit Plans
Talen is obligated under the Coal Act and the Black Lung Act to pay for certain health care and black lung benefits of retired miners and allowable beneficiaries. These obligations are funded from medical VEBAs and a black lung trust.
The funded status of each plan as of December 31, 2024 (Successor) was:
| | | | | | | | | | | | | | | | | | | | | |
| | Trust Asset Fair Value | | | Obligation Fair Value | | Overfunded Status |
| Benefit Plan for UMWA Represented Retirees of Pennsylvania Mines, LLC | | $ | 21 | | | | $ | 16 | | | $ | 5 | |
| Coal Worker's Pneumoconiosis (Black Lung) Benefit Plan | | 9 | | | | 5 | | | 4 | |
Shortfalls in funded status of the plans are assessed as contingent liabilities. As the fair value of VEBA and black lung trust assets exceed the plan obligations, both VEBA and black lung trust assets and the plan obligations are not reported on the Talen Consolidated Balance Sheets. See in Note 2 for our accounting policy related to postretirement benefits.
16. Stock-Based Compensation
In June 2023, TEC began granting PSUs and RSUs to certain employees and non-employee directors under the 2023 Equity Incentive Plan. The aggregate number of shares authorized for issuance under the 2023 Talen Equity Plan is 7083461 shares.
Item 8. Table of Contents
Stock-based Compensation Expense
Stock-based compensation expense presented as “General and administrative” on the Consolidated Statement of Operations for the periods was:
| | | | | | | | | | | | | | |
| | Successor |
| | Year Ended December 31, 2024 | | May 18 through December 31, 2023 |
| Stock-based compensation expense | | $ | 33 | | | $ | 19 | |
| Income tax benefit | | (8) | | | (2) | |
| After-tax stock-based compensation expense | | $ | 25 | | | $ | 17 | |
Performance Stock Units
PSUs vest three years after Emergence or a consummation of a change in control event based on the satisfaction of a continued employment condition and the achievement of certain market conditions over a performance period. Participants will be awarded additional PSUs if market conditions exceed targets at the time of vesting. If the Company declares any cash dividends while the PSUs are outstanding, participants will be credited a dividend, payable at the time of vesting, based on the number of shares of common stock underlying the PSUs. The following table summarizes the Company’s non-vested PSUs and changes during the year:
| | | | | | | | | | | | | | |
| | Successor |
| | Units | | Weighted-Average
Grant Date
Fair Value per Unit |
| Non-vested as of December 31, 2023 (Successor) | | 968,793 | | | $ | 54.35 | |
| Granted | | 4,945 | | | 96.00 | |
| Forfeited | | (17,391) | | | 72.75 | |
| | | | |
| Non-vested as of December 31, 2024 (Successor) | | 956,347 | | | $ | 54.23 | |
As of December 31, 2024, 24 million of unrecognized compensation cost related to unvested PSUs granted are expected to be recognized over a weighted average period of approximately 2 years.
The fair value of the PSUs was determined using a Monte Carlo valuation methodology based on the fair value of the underlying stock price at the grant date and the significant inputs and assumptions summarized below:
| | | | | | | | | | | | | | |
| | Successor |
| | Year Ended December 31, 2024 | | May 18 through December 31, 2023 |
Volatility (a) | | 25 | % | | 25 | % |
| Expected term (in years) | | 2.4 | | 3 |
Risk-free rate (b) | | 4.29 | % | | 4.35 - 4.59 |
__________________(a) Derived from an option pricing method based on the average asset volatility of peer companies and the Company’s leverage ratio.
(b) Based on the U.S. constant maturity treasury rate with a term matching the expected time to the end of the performance measurement period.
Item 8. Table of Contents
Restricted Stock Units
RSUs have three-year ratable vesting schedules beginning on the grant date, with restrictions on transferring settled shares prior to the final scheduled vesting date for each award. The fair value of the RSUs granted is derived from the closing price of TEC common stock on the grant date. The following table summarizes the Company’s non-vested RSUs and changes during the year:
| | | | | | | | | | | | | | |
| | Successor |
| | Units | | Weighted-Average
Grant Date
Fair Value per Unit |
| Non-vested as of December 31, 2023 (Successor) | | 845,269 | | | $ | 48.46 | |
| Granted | | 56,346 | | | 121.89 | |
| Forfeited | | (56,594) | | | 55.01 | |
| Vested | | (295,616) | | | 48.90 | |
| Non-vested as of December 31, 2024 (Successor) | | 549,405 | | | $ | 55.07 | |
RSUs vested during the year ended December 31, 2024 (Successor) were settled in cash for 32 million.
As of December 31, 2024, 22 million of unrecognized compensation cost related to unvested RSUs granted are expected to be recognized over a weighted average period of approximately 2 years.
17. Earnings Per Share
Basic EPS is computed by dividing net income (loss) by the weighted average number of shares of common stock outstanding during the applicable period. Diluted EPS is computed by dividing income by the weighted-average number of shares of common stock outstanding, increased by incremental shares that would be outstanding if potentially dilutive non-participating securities were converted to common stock as calculated using the treasury stock method. EPS for the periods were:
| | | | | | | | | | | | | | | | | | | | | | | | | | | | | | | | | |
| | | | | | Successor | | | Predecessor |
| | | | | | Year Ended December 31, 2024 | | May 18 through December 31, 2023 | | | January 1 through May 17, 2023 | | Year Ended December 31, 2022 |
| Numerator: (Millions of Dollars) | | | | | | | | | | | | | |
| Net Income (Loss) | | | | | | $ | 1,013 | | | $ | 143 | | | | $ | 465 | | | $ | (1,293) | |
| Less: | | | | | | | | | | | | | |
| Net income (loss) attributable to noncontrolling interest | | | | | | 15 | | | 9 | | | | (14) | | | (4) | |
| Net Income (Loss) Attributable to Stockholders (Successor) / Member (Predecessor) | | | | | | $ | 998 | | | $ | 134 | | | | $ | 479 | | | $ | (1,289) | |
| | | | | | | | | | | | | |
| Denominator: (Thousands) | | | | | | | | | | | | | |
| Weighted-Average Number of Common Shares Outstanding - Basic | | | | | | 54,254 | | | 59,029 | | | | — | | | — | |
| Warrants | | | | | | — | | | 84 | | | | — | | | — | |
| Restricted stock units | | | | | | 354 | | | 166 | | | | — | | | — | |
| Performance stock units | | | | | | 1,878 | | | 120 | | | | — | | | — | |
| Weighted-Average Number of Common Shares Outstanding - Diluted | | | | | | 56,486 | | | 59,399 | | | | — | | | — | |
| | | | | | | | | | | | | |
| Earnings per Share - Basic | | | | | | $ | 18.40 | | | $ | 2.27 | | | | N/A | | N/A |
| Earnings per Share - Diluted | | | | | | 17.67 | | | 2.26 | | | | N/A | | N/A |
For the period from January 1 through May 17, 2023 (Predecessor) and year ended December 31, 2022 (Predecessor), there were no outstanding shares of common stock.
There were no shares excluded from diluted EPS for the year ended December 31, 2024 (Successor). 134,798 PSUs were excluded from diluted EPS for the period from May 18 through December 31, 2023 (Successor) due to their anti-dilutive nature. These awards are excluded from the calculation of EPS because the performance conditions have not been met during the reporting period.
Item 8. Table of Contents
18. Stockholders’ Equity
Common Stock Transactions
Share Repurchases and Retirements. Summary of activity under the SRP and direct repurchases:
| | | | | | | | | | | | | | | | | | | | | | | | | | |
| | | | | | | | Successor |
| | | | Year Ended December 31, 2024 |
| | | | | | | | Number of Shares (a) (b) | | Share Price (c) | | Total Amount |
| Share repurchases | | | | | | | | 13,227,222 | | | $ | 149.50 | | | $ | 1,977 | |
| Share retirements | | | | | | | | (13,227,222) | | | 149.50 | | | (1,977) | |
__________________(a)Includes 7,307,300 shares repurchased from affiliates of Rubric in July 2024 and December 2024 at a weighted average price of $177.16 per share. Of the total shares repurchased by the Company, 850 million purchased from affiliates of Rubric were not under the SRP.
(b)Includes 5,275,862 shares repurchased as result of a tender offer in June 2024 at a weighted average price of $117.16 per share.
(c)Weighted average price per share, including transaction costs and excise taxes.
As of December 31, 2024 (Successor), all repurchased shares have been retired. See Note 2 for the accounting policy related to treasury stock and retirement of treasury shares.
As of February 27, 2025, TEC had 45,961,910 shares of common stock outstanding.
Exercise of Warrants. In July 2024, a former executive exercised equity-classified warrants to 457,142 shares of the Company’s common stock in a non-cash transaction. After giving effect to the non-cash exercise and related tax withholding, the Company issued 160,289 shares of the Company’s common stock.
Share Repurchases
In May 2024, the Board of Directors approved an increase of the SRP from $300 million to a remaining capacity of $1 billion. In September 2024, the Board of Directors approved an increase of the remaining capacity to $1.25 billion through December 31, 2026. As of December 31, 2024 (Successor), the Company had repurchased approximately 22% of its outstanding shares of common stock for a total of $1.95 billion, exclusive of transaction costs and excise taxes. The Board of Directors approved a portion of the share repurchases executed with Rubric in December 2024 outside of the existing authorization in the SRP. The remaining capacity of the SRP as of December 31, 2024 (Successor) is 1.1 billion.
Employee Stock Purchase Plan
In November 2024, the Board of Directors approved the Company’s 2025 Employee Stock Purchase Plan (“ESPP”), which is subject to approval by shareholders. Effective January 1, 2025, eligible employees can withhold between 1 and 10 of their eligible compensation to purchase TEC common stock at the lesser of 85 of its market value on the offering date or 85 of the market value on the exercise date. Offering dates will occur each January 1 and July 1 and exercise dates each June 30 and December 31. Initially, 500000 shares may be issued pursuant to the ESPP, with automatic increases in the number of shares authorized for issuance beginning on January 1, 2026 and ending on January 1, 2034. The maximum number of shares that may be issued under the ESPP is 5000000 shares.
Acquisition of Noncontrolling Interests
Purchase of Equity in Nautilus. In October 2024, the Company acquired TeraWulf’s 25% equity interest in Nautilus in exchange for $85 million and the distribution by Nautilus of its Bitcoin mining equipment to TeraWulf. As a result of the transaction, the Company owns 100% of the equity of Nautilus. In conjunction with the transaction, we suspended Bitcoin mining operations at the facility.
Purchase of Equity in Cumulus Digital. In March 2024, TES acquired all of the equity of Cumulus Digital held by affiliates of Orion Energy Partners and two former members of Talen senior management in exchange for an aggregate of $39 million. Following these transactions, TES owns 100% of the equity of Cumulus Digital.
Item 8. Table of Contents
Accumulated Other Comprehensive Income
Changes in AOCI for the periods were:
| | | | | | | | | | | | | | | | | | | | | | | | | | | | | |
| | Successor | | | Predecessor |
| | Year Ended December 31, 2024 | | May 18 through December 31, 2023 | | | January 1 through May 17, 2023 | | Year Ended December 31, 2022 |
| Beginning balance | | $ | (23) | | | $ | — | | | | $ | (167) | | | $ | (152) | |
Gains (losses) arising during the period (a) | | 12 | | | (36) | | | | 6 | | | (84) | |
Reclassifications to Consolidated Statements of Operations (b) | | — | | | 7 | | | | 5 | | | 59 | |
| Income tax benefit (expense) | | (1) | | | 6 | | | | (5) | | | 10 | |
| Other comprehensive income (loss) | | 11 | | | (23) | | | | 6 | | | (15) | |
| Cancellation of equity at Emergence | | — | | | — | | | | 161 | | | — | |
| Accumulated other comprehensive income (loss) | | $ | (12) | | | $ | (23) | | | | $ | — | | | $ | (167) | |
__________________(a)Primarily related to “Postretirement benefit actuarial (gain) loss, net” for the period from May 18 through December 31, 2023 (Successor) and “Available-for-sale securities unrealized gain (loss), net” and “Postretirement benefit actuarial (gain) loss, net” for the year ended December 31, 2022 (Predecessor).
(b)Primarily related to “Available-for-sale securities unrealized gain (loss), net” and “Postretirement benefit actuarial (gain) loss, net” for the year ended December 31, 2022 (Predecessor).
The components of AOCI, net of tax, were:
| | | | | | | | | | | | | | | | | |
| | Successor | | | |
| | December 31, 2024 | | December 31, 2023 | | | |
| Available-for-sale securities unrealized gain (loss), net | | $ | (3) | | | $ | 5 | | | | |
| | | | | | | |
| Postretirement benefit prior service credits (costs), net | | 14 | | | — | | | | |
| Postretirement benefit actuarial gain (loss), net | | (23) | | | (28) | | | | |
| Accumulated other comprehensive income (loss) | | $ | (12) | | | $ | (23) | | | | |
The locations of pre-tax gains (losses) reclassified from AOCI and included on the Consolidated Statements of Operations for the periods were:
| | | | | | | | | | | | | | | | | | | | | | | | | | | | | | | | | |
| | | | | | Successor | | | Predecessor |
| | | | | | Year Ended December 31, 2024 | | May 18 through December 31, 2023 | | | January 1 through May 17, 2023 | | Year Ended December 31, 2022 |
Nuclear decommissioning trust funds gain (loss), net (a) | | | | | | $ | (1) | | | $ | (7) | | | | $ | (4) | | | $ | (33) | |
Depreciation, amortization and accretion (b) | | | | | | — | | | — | | | | 1 | | | 2 | |
Operation, maintenance and development (c) | | | | | | 1 | | | — | | | | — | | | (1) | |
Other non-operating income (expense), net (d) | | | | | | — | | | — | | | | (2) | | | (27) | |
| Total | | | | | | $ | — | | | $ | (7) | | | | $ | (5) | | | $ | (59) | |
__________________(a)Available-for-sale securities unrealized gain (loss), net.
(b)Qualifying derivatives unrealized gain (loss).
(c)Postretirement benefit prior service credits (costs), net.
(d)Postretirement benefit actuarial gain (loss), net.
The postretirement obligations components of AOCI are not presented in their entirety on the Consolidated Statements of Operations during the periods; rather, they are included in the computation of net periodic defined benefit costs (credits). See Note 15 for additional information.
Item 8. Table of Contents
19. Supplemental Cash Flow Information
Supplemental information for the Consolidated Statements of Cash Flows for the periods was:
| | | | | | | | | | | | | | | | | | | | | | | | | | | | | |
| | Successor | | | Predecessor |
| | Year Ended December 31, 2024 | | May 18 through December 31, 2023 | | | January 1 through May 17, 2023 | | Year Ended December 31, 2022 |
| Cash paid during the period | | | | | | | | | |
Interest and other finance charges, net of capitalized interest (a) | | $ | 255 | | | $ | 133 | | | | $ | 283 | | | $ | 277 | |
| Income taxes, net | | 20 | | | 12 | | | | 7 | | | 14 | |
| | | | | | | | | |
| Unrealized (gain) loss on derivative instruments included on the Statements of Cash Flows | | | | | | | | | |
| Commodity contracts | | $ | (62) | | | $ | (52) | | | | $ | 63 | | | $ | (625) | |
| Interest rate swap contracts (interest expense) | | (7) | | | 12 | | | | 2 | | | (23) | |
| Unrealized (gain) loss on derivative instruments | | $ | (69) | | | $ | (40) | | | | $ | 65 | | | $ | (648) | |
| | | | | | | | | |
| Depreciation, amortization and accretion included on the Statements of Cash Flows | | | | | | | | | |
| Depreciation, amortization and accretion | | $ | 298 | | | $ | 165 | | | | $ | 200 | | | $ | 520 | |
| | | | | | | | | |
| Other | | (13) | | | (8) | | | | 8 | | | 29 | |
| Depreciation, amortization and accretion | | $ | 285 | | | $ | 157 | | | | $ | 208 | | | $ | 549 | |
| | | | | | | | | |
| Reconciliation of other non-cash operating activities | | | | | | | | | |
| | | | | | | | | |
| Bitcoin revenue | | $ | (91) | | | $ | (81) | | | | $ | (27) | | | $ | — | |
| Stock-based compensation | | 33 | | | 19 | | | | — | | | — | |
| Fair value adjustment on distribution of miners | | 14 | | | — | | | | — | | | — | |
| Derivative option premium amortization | | 11 | | | 52 | | | | 29 | | | 67 | |
| Derivatives with financing elements | | — | | | — | | | | — | | | 104 | |
| Non-cash environmental liability revisions | | — | | | — | | | | — | | | 13 | |
| | | | | | | | | |
| | | | | | | | | |
| | | | | | | | | |
| | | | | | | | | |
| | | | | | | | | |
| | | | | | | | | |
| Other | | 7 | | | 17 | | | | 5 | | | 16 | |
| Total | | $ | (26) | | | $ | 7 | | | | $ | 7 | | | $ | 200 | |
| | | | | | | | | |
| Non-cash investing activities | | | | | | | | | |
| Capital expenditure accrual increase (decrease) | | $ | 6 | | | $ | 7 | | | | $ | (28) | | | 2 | |
| Accounts receivable contributed to equity method investment | | — | | | — | | | | — | | | 2 | |
| | | | | | | | | |
| Non-cash financing activities | | | | | | | | | |
Non-cash increase to PP&E and decrease to other current assets for contribution of Bitcoin miners to Nautilus (b) | | $ | — | | | $ | — | | | | $ | 14 | | | $ | 30 | |
Non-cash decrease to PP&E and decrease to noncontrolling interest for distribution of Bitcoin miners to TeraWulf (c) | | 43 | | | — | | | | 3 | | | — | |
Non-cash increase to PP&E and increase to noncontrolling interest for contribution of Bitcoin miners by TeraWulf (b) | | — | | | — | | | | 38 | | | 14 | |
__________________(a)Capitalized interest totaled $5 million for the year ended December 31, 2024 (Successor); $10 million for the period from May 18 through December 31, 2023 (Successor); and $12 million for the period from January 1 through May 17, 2023 (Predecessor), and $12 million for the year ended December 31, 2022 (Predecessor).
(b)In 2023, each of the joint venture partners of Nautilus made non-cash contributions to Nautilus of Bitcoin miners that increased PP&E.
(c)In 2024, Nautilus distributed Bitcoin miners to TeraWulf as part of the buyout of TeraWulf’s noncontrolling interest.
Item 8. Table of Contents
Cash and Restricted Cash
The following provides a reconciliation of “Cash and cash equivalents” and “Restricted cash and cash equivalents” presented on the Consolidated Statements of Cash Flows to line items within the Consolidated Balance Sheets:
| | | | | | | | | | | | | | |
| | Successor |
| | December 31, 2024 | | December 31, 2023 |
| Cash and cash equivalents | | $ | 328 | | | $ | 400 | |
| | | | |
| Restricted cash and cash equivalents: | | | | |
| TES TLC debt restricted deposits | | — | | | 472 | |
| Nautilus project restricted deposits | | — | | | 10 | |
| Commodity exchange margin deposits | | 37 | | | — | |
| Cumulus Digital restricted deposits | | — | | | 19 | |
| Restricted cash and cash equivalents | | 37 | | | 501 | |
| Total | | $ | 365 | | | $ | 901 | |
20. Acquisitions and Divestitures
2024 Activities
ERCOT Sale. In May 2024, we sold our 1,710 MW Texas generation portfolio to CPS Energy for $785 million, subject to customary net working capital adjustments. A gain on sale of $564 million is presented as “Gain (loss) on sale of assets, net” on the Consolidated Statements of Operations for the year ended December 31, 2024 (Successor).
AWS Data Campus Sale. In March 2024, AWS purchased substantially all the assets related to the AWS Data Campus and certain other assets for gross proceeds of $650 million, of which $350 million were received at closing with the remaining $300 million held in escrow until August 2024. For the year ended December 31, 2024 (Successor), a $324 million gain on sale is presented as “Gain (loss) on sale of assets, net” on the Consolidated Statements of Operations. In connection with the AWS Data Campus Sale, the Company entered into the AWS PPA.
2023 Activities
Western Gas Book Divestiture. In April 2023, Talen sold certain contracts relating to the transportation of natural gas in the southwestern United States for $15 million. For the period from January 1 through May 17, 2023 (Predecessor), a $15 million gain was presented as “Gain (loss) on sale of assets, net” on the Consolidated Statements of Operations.
Pennsylvania Minerals Divestiture. In March 2023, Talen sold certain mineral interests located in Pennsylvania for $29 million, while preserving the right to certain royalty payments from existing and future producing natural gas wells. For the period from January 1 through May 17, 2023 (Predecessor), a $29 million gain was presented as “Gain (loss) on sale of assets, net” on the Consolidated Statements of Operations.
21. Segments
Talen’s operating segments are based on the market areas in which our generation facilities operate and reflect the manner in which our Chief Executive Officer, who is the chief operating decision maker, reviews results and allocate resources. Adjusted EBITDA is the key profit metric used to measure financial performance of each segment. Total assets or other asset metrics are not considered a key metric or reviewed by the chief operating decision maker.
“PJM” is engaged in electricity generation, marketing activities, commodity risk and fuel management within the PJM RTO or ISO markets and is comprised of Susquehanna and Talen’s natural gas and coal generation facilities.
“Other” represents an operating segment that includes the operating and marketing activities of Talen Montana’s proportionate share of Colstrip in the WECC market and other non-material operating and development activities. “Other” also includes the operating activities of Nautilus until Bitcoin mining operations were suspended in October 2024 and the operating activities of our Texas power generation facilities in the ERCOT market prior to their disposal in May 2024. We have determined it appropriate to aggregate results of Talen’s remaining non-reportable segments and other operating activities.
“Corporate and Eliminations” represents a non-reportable segment that includes: (i) general and administrative expenses incurred by our corporate function; (ii) interest expense and other corporate activities not allocated to our operating segments; and (iii) intercompany eliminations. This grouping is presented to reconcile the reportable segments to our consolidated results.
Item 8. Table of Contents
Financial results for the segments and reconciliation to consolidated results:
| | | | | | | | | | | | | | | | | | | | | | | | | | |
| | PJM | | Other | | Corporate and Eliminations | | Total |
| Year Ended December 31, 2024 (Successor) | | | | | | | | |
| Operating revenues | | $ | 1,866 | | | $ | 367 | | | $ | (118) | | | $ | 2,115 | |
Operation, maintenance and development expenses (a) | | 518 | | | 74 | | | — | | | 592 | |
| Interest expense and other finance charges | | — | | | — | | | 238 | | | 238 | |
Other segment items (b) | | 573 | | | | | | | |
| Adjusted EBITDA | | 775 | | | | | | | |
| Capital expenditures | | 164 | | | 24 | | | 1 | | | 189 | |
| | | | | | | | |
| May 18 through December 31, 2023 (Successor) | | | | | | | | |
| Operating revenues | | $ | 1,120 | | | $ | 397 | | | $ | (173) | | | $ | 1,344 | |
Operation, maintenance and development expenses (a) | | 294 | | | 78 | | | (14) | | | 358 | |
| Interest expense and other finance charges | | — | | | — | | | 176 | | | 176 | |
Other segment items (b) | | 449 | | | | | | | |
| Adjusted EBITDA | | 377 | | | | | | | |
| Capital expenditures | | 110 | | | 45 | | | 6 | | | 161 | |
| | | | | | | | |
| | | | | | | | |
| January 1 through May 17, 2023 (Predecessor) | | | | | | | | |
| Operating revenues | | $ | 1,052 | | | $ | 195 | | | $ | (37) | | | $ | 1,210 | |
Operation, maintenance and development expenses (a) | | 245 | | | 47 | | | (7) | | | 285 | |
| Interest expense and other finance charges | | — | | | — | | | 163 | | | 163 | |
Other segment items (b) | | 119 | | | | | | | |
| Adjusted EBITDA | | 688 | | | | | | | |
| Capital expenditures | | 132 | | | 53 | | | 2 | | | 187 | |
| | | | | | | | |
| Year ended December 31, 2022 (Predecessor) | | | | | | | | |
| Operating revenues | | $ | 2,902 | | | $ | 194 | | | $ | (7) | | | $ | 3,089 | |
Operation, maintenance and development expenses (a) | | 519 | | | 97 | | | (6) | | | 610 | |
| Interest expense and other finance charges | | — | | | — | | | 359 | | | 359 | |
Other segment items (b) | | 1,402 | | | | | | | |
| Adjusted EBITDA | | 981 | | | | | | | |
| Capital expenditures | | 237 | | | 69 | | | 6 | | | 312 | |
__________________
(a)This significant segment expense category aligns with the segment-level information that is regularly provided to the CODM.
(b)Other segment items are primarily comprised of fuel and energy purchases.
Item 8. Table of Contents
Reconciliation of segment Adjusted EBITDA to Net Income (Loss):
| | | | | | | | | | | | | | | | | | | | | | | | | | | | | | | | | |
| | | | | | Successor | | | Predecessor |
| | | | | | Year Ended December 31, 2024 | | May 18 through December 31, 2023 | | | January 1 through May 17, 2023 | | Year Ended December 31, 2022 |
| Adjusted EBITDA: | | | | | | | | | | | | | |
| PJM | | | | | | $ | 775 | | | $ | 377 | | | | $ | 688 | | | $ | 981 | |
| Total Segment Adjusted EBITDA | | | | | | $ | 775 | | | $ | 377 | | | | $ | 688 | | | $ | 981 | |
| Reconciling Items: | | | | | | | | | | | | | |
| Interest expense and other finance charges | | | | | | $ | (238) | | | $ | (176) | | | | $ | (163) | | | $ | (359) | |
| Income tax benefit (expense) | | | | | | (98) | | | (51) | | | | (212) | | | 35 | |
| Depreciation, amortization and accretion | | | | | | (298) | | | (165) | | | | (200) | | | (520) | |
| Nuclear fuel amortization | | | | | | (123) | | | (108) | | | | (33) | | | (94) | |
| Reorganization (gain) loss, net | | | | | | — | | | — | | | | 799 | | | (812) | |
| Unrealized (gain) loss on commodity derivative contracts | | | | | | 62 | | | 52 | | | | (63) | | | 625 | |
| Nuclear decommissioning trust funds gain (loss), net | | | | | | 178 | | | 108 | | | | 57 | | | (184) | |
| Stock-based compensation expense | | | | | | (33) | | | (19) | | | | — | | | — | |
| Long-term incentive compensation expense | | | | | | (21) | | | (2) | | | | — | | | — | |
| | | | | | | | | | | | | |
| Gain (loss) on asset sales, net | | | | | | 884 | | | 7 | | | | 50 | | | — | |
| Non-cash impairments | | | | | | (1) | | | (3) | | | | (381) | | | — | |
| Legal settlements and litigation costs | | | | | | 10 | | | 84 | | | | (1) | | | (20) | |
| Unusual market events | | | | | | 1 | | | 19 | | | | (14) | | | (29) | |
| Net periodic defined benefit cost | | | | | | (14) | | | (2) | | | | 3 | | | (12) | |
| Operational and other restructuring activities | | | | | | (76) | | | (48) | | | | (17) | | | (570) | |
| Hedge termination losses, net | | | | | | — | | | — | | | | — | | | (158) | |
| Development expenses | | | | | | (1) | | | (7) | | | | (10) | | | (17) | |
| Non-cash inventory net realizable value, obsolescence, and other charges | | | | | | (20) | | | (4) | | | | (56) | | | (3) | |
| Consolidation of subsidiary gain (loss), net | | | | | | — | | | — | | | | — | | | (170) | |
| "Other" operating segment | | | | | | 71 | | | 113 | | | | 37 | | | 103 | |
| Noncontrolling interest | | | | | | 21 | | | 42 | | | | 14 | | | (3) | |
| Corporate and Eliminations | | | | | | (76) | | | (64) | | | | (30) | | | (69) | |
| Other items | | | | | | 10 | | | (10) | | | | (3) | | | (17) | |
| Net Income (Loss) | | | | | | $ | 1,013 | | | $ | 143 | | | | $ | 465 | | | $ | (1,293) | |
ITEM 9. CHANGES IN AND DISAGREEMENTS WITH ACCOUNTANTS ON ACCOUNTING AND FINANCIAL DISCLOSURE
None.
ITEM 9A. CONTROLS AND PROCEDURES
Disclosure Controls and Procedures
As required by Rule 13a-15(b) under the Exchange Act, we have evaluated, under the supervision and with the participation of management, including our principal executive officer and principal financial officer, the effectiveness of the design and operation of our disclosure controls and procedures (as defined in Rules 13a-15(e) and 15d-15(e) under the Exchange Act) as of the end of the period covered by this Report. Our disclosure controls and procedures are designed to provide reasonable assurance that the information required to be disclosed by us in reports that we file or submit under the Exchange Act is accumulated and communicated to management, including our principal executive officer and principal financial officer, as appropriate, to allow timely decisions regarding required disclosure and is recorded, processed, summarized, and reported within the time periods specified in the rules and forms of the SEC. Based upon that evaluation, our principal executive officer and principal financial officer concluded that our disclosure controls and procedures were effective as of December 31, 2024 (Successor).
Internal Control Over Financial Reporting
This Report does not include a report of management’s assessment regarding internal control over financial reporting or an attestation report of the Company’s registered public accounting firm due to a transition period established by rules of the SEC for newly public companies. These reports will be required and provided in our Annual Report on Form 10-K for the year ended December 31, 2025.
Changes in Internal Control Over Financial Reporting
There were no changes in our internal control over financial reporting that occurred during the year ended December 31, 2024 (Successor) that materially affected, or are reasonably likely to materially affect, our internal control over financial reporting.
ITEM 9B. OTHER INFORMATION
During the three months ended December 31, 2024, none of our directors or “officers” (as such term is defined in Rule 16(a)-1(f) under the Exchange Act) adopted or terminated a “Rule 10b5-1 trading agreement” or “non-Rule 10b5-1 trading arrangement” (each as defined in Item 408 of Regulation S-K).
ITEM 9C. DISCLOSURE REGARDING FOREIGN JURISDICTIONS THAT PREVENT INSPECTIONS
Not applicable.
PART III
ITEM 10. DIRECTORS, EXECUTIVE OFFICERS, AND CORPORATE GOVERNANCE
We have adopted a code of ethics called the “Talen Energy Corporation Code of Business Conduct and Ethics” that applies to all of our directors, officers, and employees, including our principal executive officer, principal financial officer, principal accounting officer, and persons performing similar functions. It can be accessed under the “Governance” tab on the “Investor Relations” section of our website at https://ir.talenenergy.com. A copy will also be made available in print to any stockholder who requests it. We also intend to satisfy the disclosure requirement under Item 5.05 of Form 8-K regarding any amendment to, or waiver from, a provision of our code of ethics applicable to those individuals by posting such information on our website. We will disclose the required information within four business days, and such information will remain available on our website for at least a 12-month period. There have not been any waivers granted to any of our officers or employees to date. Information contained on or accessible from our website is not, and shall not be deemed to be, incorporated by reference into this Report or any other filings with the SEC.
The other information required pursuant to this item will be set forth in the 2025 Proxy Statement and is incorporated herein by reference.
ITEM 11. EXECUTIVE COMPENSATION
The information required pursuant to this item will be set forth in the 2025 Proxy Statement and is incorporated herein by reference.
ITEM 12. SECURITY OWNERSHIP OF CERTAIN BENEFICIAL OWNERS AND MANAGEMENT AND RELATED STOCKHOLDER MATTERS
The information required pursuant to this item will be set forth in the 2025 Proxy Statement and is incorporated herein by reference.
ITEM 13. CERTAIN RELATIONSHIPS AND RELATED TRANSACTIONS, AND DIRECTOR INDEPENDENCE
The information required pursuant to this item will be set forth in the 2025 Proxy Statement and is incorporated herein by reference.
ITEM 14. PRINCIPAL ACCOUNTANT FEES AND SERVICES
The information required pursuant to this item will be set forth in the 2025 Proxy Statement and is incorporated herein by reference.
PART IV.
ITEM 15. EXHIBITS AND FINANCIALS STATEMENT SCHEDULES
(a) The following documents are filed as a part of this Report:
(1) Financial Statements: The Annual Financial Statements are included with a separate index in Part II, Item 8 of this report.
(2) Financial Statement Schedules: Schedule I—Condensed Financial Information of Registrant for the year ended December 31, 2024 (Successor) and the period from May 18 through December 31, 2023 (Successor) is included below in subsection (c) of this Item 15. All other schedules are omitted because they are not applicable or because the required information is already contained in the Annual Financial Statements.
(3) Exhibits: | | | | | | | | | | | | | | | | | | | | | | | | | | | | | | | | |
| | | | Incorporated by Reference |
| Exhibit No. | | Description | | Form | | File Number | | Date of Filing | | Exhibit Number |
| | | | | | | | | | |
| 3.1 | | | | S-1 | | 333-280341 | | June 20, 2024 | | 3.1 |
| 3.2 | | | | S-1 | | 333-280341 | | June 20, 2024 | | 3.2 |
| 4.1* | | | | — | | — | | — | | — |
| 4.2 | | | | S-1 | | 333-280341 | | June 20, 2024 | | 4.2 |
| 4.3 | | | | S-1 | | 333-280341 | | June 20, 2024 | | 4.1 |
| 4.4 | | | | S-1 | | 333-280341 | | June 20, 2024 | | 10.5 |
| 4.5 | | | | S-1 | | 333-280341 | | June 20, 2024 | | 10.6 |
| 4.6 | | | | S-1 | | 333-280341 | | June 20, 2024 | | 10.7 |
| 4.7* | | | | — | | — | | — | | — |
| 4.8 | | | | 8-K | | 001-37388 | | January 13, 2025 | | 4.1 |
| 10.1 | | Credit Agreement, dated as of May 17, 2023, by and among Talen Energy Supply, LLC, the lending institutions from time to time parties thereto, Citibank, N.A., as administrative agent and collateral agent, and Citibank, N.A., BMO Capital Markets Corp., Deutsche Bank Securities Inc., Goldman Sachs Bank USA, RBC Capital Markets, LLC, MUFG Bank, Ltd., Credit Suisse Loan Funding LLC and Morgan Stanley Senior Funding, Inc., as joint lead arrangers and joint bookrunners. | | S-1 | | 333-280341 | | June 20, 2024 | | 10.1 |
| 10.2 | | | | S-1 | | 333-280341 | | June 20, 2024 | | 10.2 |
| 10.3 | | | | S-1 | | 333-280341 | | June 20, 2024 | | 10.3 |
| | | | | | | | | | | | | | | | | | | | | | | | | | | | | | | | |
| | | | Incorporated by Reference |
| Exhibit No. | | Description | | Form | | File Number | | Date of Filing | | Exhibit Number |
| 10.4 | | | | 8-K | | 001-37388 | | December 13, 2024 | | 10.1 |
| 10.5 | | | | 8-K | | 001-37388 | | December 20, 2024 | | 10.1 |
10.6† | | | | S-8 | | 333-283230 | | November 14, 2024 | | 10.1 |
10.7† | | | | S-1 | | 333-280341 | | June 20, 2024 | | 10.9 |
10.8† | | | | S-1 | | 333-280341 | | June 20, 2024 | | 10.10 |
10.9† | | | | S-1 | | 333-280341 | | June 20, 2024 | | 10.11 |
10.10† | | | | S-1 | | 333-280341 | | June 20, 2024 | | 10.12 |
10.11† | | | | S-1 | | 333-280341 | | June 20, 2024 | | 10.13 |
10.12† | | | | S-1 | | 333-280341 | | June 20, 2024 | | 10.14 |
10.13† | | | | S-1 | | 333-280341 | | June 20, 2024 | | 10.15 |
10.14*†# | | | | — | | — | | — | | — |
10.15*† | | | | — | | — | | — | | — |
10.16*† | | | | — | | — | | — | | — |
10.17† | | | | S-1 | | 333-280341 | | June 20, 2024 | | 10.8 |
10.18† | | | | S-1 | | 333-280341 | | June 20, 2024 | | 10.16 |
10.19† | | | | S-1 | | 333-280341 | | June 20, 2024 | | 10.17 |
10.20† | | | | S-1 | | 333-280341 | | June 20, 2024 | | 10.18 |
10.21† | | | | S-1 | | 333-280341 | | June 20, 2024 | | 10.20 |
10.22*†## | | | | — | | — | | — | | — |
| 10.23* | | | | — | | — | | — | | — |
| 19.1* | | | | — | | — | | — | | — |
| 21.1* | | | | — | | — | | — | | — |
| 23.1* | | | | — | | — | | — | | — |
| 23.2* | | | | — | | — | | — | | — |
| 24.1* | | Power of Attorney (included on signature page hereto). | | — | | — | | — | | — |
| 31.1* | | | | — | | — | | — | | — |
| 31.2* | | | | — | | — | | — | | — |
| 32.1** | | | | — | | — | | — | | — |
| 97.1* | | | | — | | — | | — | | — |
| 101.INS* | | Inline XBRL Instance Document. | | — | | — | | — | | — |
| 101.SCH* | | Inline XBRL Taxonomy Extension Schema Document. | | — | | — | | — | | — |
| 101.CAL* | | Inline XBRL Taxonomy Extension Calculation Linkbase Document. | | — | | — | | — | | — |
| 101.DEF* | | Inline XBRL Taxonomy Extension Definition Linkbase Document. | | — | | — | | — | | — |
| 101.LAB* | | Inline XBRL Taxonomy Extension Label Linkbase Document. | | — | | — | | — | | — |
| | | | | | | | | | | | | | | | | | | | | | | | | | | | | | | | |
| | | | Incorporated by Reference |
| Exhibit No. | | Description | | Form | | File Number | | Date of Filing | | Exhibit Number |
| 101.PRE* | | Inline XBRL Taxonomy Extension Presentation Linkbase Document. | | — | | — | | — | | — |
| 104* | | Cover Page Interactive Data File (embedded within the Inline XBRL document). | | — | | — | | — | | — |
| | | | | | | | | | |
| | | | | | | | | | |
| | | | | | | | | | |
| | | | | | | | | | |
| | | | | | | | | | |
________________
* Filed herewith.
** Furnished herewith.
† Management contract or compensatory plan or arrangement.
# Certain of the schedules and attachments to the exhibit have been omitted pursuant to Item 601(a)(5) of Regulation S-K. A copy of any omitted schedule or attachment will be furnished to the SEC upon request.
## Certain private and immaterial portions of the exhibit have been redacted pursuant to Item 601(a)(6) of Regulation S-K.
(c) Schedule I—Condensed Financial Information of Registrant
TALEN ENERGY CORPORATION
SCHEDULE I—CONDENSED FINANCIAL INFORMATION OF REGISTRANT
CONDENSED UNCONSOLIDATED STATEMENTS OF COMPREHENSIVE INCOME
| | | | | | | | | | | | | | |
| | Successor |
| (Millions of Dollars, except share data) | | Year Ended December 31, 2024 | | May 18 through December 31, 2023 |
| Operating Revenue | | $ | — | | | $ | — | |
| Operating Expenses | | — | | | — | |
| Operating Income | | — | | | — | |
| Equity in earnings of TES | | 998 | | | 134 | |
| Income (Loss) Before Income Taxes | | 998 | | | 134 | |
| Income tax benefit (expense) | | — | | | — | |
| Net Income (Loss) | | 998 | | | 134 | |
| Other comprehensive income (loss) | | 11 | | | (23) | |
| Comprehensive Income (Loss) | | $ | 1,009 | | | $ | 111 | |
| Earnings Per Share of Common Stock: | | | | |
| Net Income (Loss) Attributable to Stockholders - Basic | | $ | 18.40 | | | $ | 2.27 | |
| Net Income (Loss) Attributable to Stockholders - Diluted | | $ | 17.67 | | | $ | 2.26 | |
| Weighted-Average Number of Common Shares Outstanding - Basic (in thousands) | | 54,254 | | | 59,029 | |
| Weighted-Average Number of Common Shares Outstanding - Diluted (in thousands) | | 56,486 | | | 59,399 | |
The accompanying Notes to the Condensed Unconsolidated Financial Statements are an integral part of the financial statements.
TALEN ENERGY CORPORATION
SCHEDULE I—CONDENSED FINANCIAL INFORMATION OF REGISTRANT
CONDENSED UNCONSOLIDATED BALANCE SHEETS
| | | | | | | | | | | | | | |
| | Successor |
| (Millions of Dollars, except share data) | | December 31,
2024 | | December 31,
2023 |
| Assets | | | | |
| Investment in TES | | $ | 1,387 | | | $ | 2,457 | |
| Total Assets | | $ | 1,387 | | | $ | 2,457 | |
| | | | |
| | | | |
| | | | |
| | | | |
| Total Liabilities | | $ | — | | | $ | — | |
| | | | |
| Stockholders’ Equity | | | | |
Common stock (0.001 par value, 350000000 shares authorized) (a) | | — | | | — | |
| Additional paid-in capital | | 1,725 | | | 2,346 | |
| Accumulated retained earnings (deficit) | | (326) | | | 134 | |
| Accumulated other comprehensive income (loss) | | (12) | | | (23) | |
| Stockholders’ Equity | | 1,387 | | | 2,457 | |
| Total Liabilities and Stockholders’ Equity | | $ | 1,387 | | | $ | 2,457 | |
__________________
(a)Shares issued and outstanding were 45961910 and 59028843 as of December 31, 2024 (Successor) and December 31, 2023 (Successor), respectively.
The accompanying Notes to the Condensed Unconsolidated Financial Statements are an integral part of the financial statements.
TALEN ENERGY CORPORATION
SCHEDULE I—CONDENSED FINANCIAL INFORMATION OF REGISTRANT
NOTES TO CONDENSED UNCONSOLIDATED FINANCIAL STATEMENTS
1. Basis of Presentation
Talen Energy Corporation is a holding company whose only material businesses and properties are held through its direct and wholly owned subsidiary, Talen Energy Supply. Certain of TES’s debt agreements include covenants that restrict the payment of dividends or other distributions to TEC, restricting in excess of 25% of TEC’s consolidated net assets. Accordingly, these condensed unconsolidated financial statements and related footnotes have been prepared in accordance with Sections 5-04 and 12-04 of Regulation S-X. These statements should be read in conjunction with the Annual Financial Statements.
In May 2023, TEC and the majority of its subsidiaries emerged from the Restructuring and adopted fresh start accounting. See Notes 2, 3, and 4 to the Annual Financial Statements for additional information regarding the Restructuring and related accounting. Unconsolidated financial results are presented for TEC for the Successor periods for the year ended December 31, 2024 and the period from May 18 through December 31, 2023. Because the results presented in the Annual Financial Statements for Predecessor periods (prior to May 18, 2023) represent the operating results TES, such results are not repeated here. TEC held no cash nor had any cash activity during the year ended December 31, 2024 and the period from May 18 through December 31, 2023; therefore, a statement of cash flows has not been included.
Pursuant to the Internal Revenue Code, TEC and TES are each taxable entities. TEC files a consolidated U.S. federal income tax return on behalf of all its subsidiaries. The provision for income taxes and the effect of any recognition and (or) remeasurement are recognized as if: (i) TES and its subsidiaries file a consolidated income tax return; and (ii) TEC files a standalone income tax return. Additionally, the Company has elected to present accrued excise tax liabilities as a result of the repurchase of TEC common stock on the TES consolidated balance sheets. Accordingly, substantially all income taxes are recognized at TES.
2. TEC Indebtedness
For a general description of the material terms of TES’s indebtedness, see Note 13 to the Annual Financial Statements.
The agreements governing TES’s indebtedness restrict the ability of TES and the Subsidiary Guarantors to pay dividends or distributions or otherwise transfer assets to TEC, subject to certain exceptions. Notable exceptions include the ability to pay dividends or distributions: (1) in an amount not to exceed the greater of 420 million and 40 of TES’s consolidated adjusted EBITDA, (2) in an unlimited amount so long as TES’s pro forma consolidated total net leverage ratio is less than or equal to 2.5 to 1.0, and (3) in an amount not to exceed the sum of: (a) the greater of 525 million and 50 of TES’s consolidated adjusted EBITDA, (b) TES’s consolidated adjusted EBITDA minus 140 of TES’s consolidated interest expense, in each case, for the period beginning June 1, 2023 (subject to compliance with either (x) a pro forma consolidated total net leverage ratio of less than or equal to 3.75 to 1.0 or (y) a fixed charge coverage ratio greater than or equal to 2.0 to 1.0), (c) equity contributions to TES, and (d) other customary “builder basket” components.
TEC does not have any separate indebtedness, other long-term obligations, or mandatory dividend or redemption requirements of redeemable stocks.
As of December 31, 2024, no cash dividends have been paid to TEC in the last three fiscal years by any other entity.
3. Commitments and Contingencies
See Note 12 to the Annual Financial Statements for commitments and contingencies of TEC.
ITEM 16. FORM 10-K SUMMARY
None.
GLOSSARY OF TERMS AND ABBREVIATIONS
Adjusted EBITDA. Net income (loss) adjusted, among other things, for certain: (i) nonrecurring charges; (ii) non-recurring gains; (iii) non-cash and other items; (iv) unusual market events; (v) any depreciation, amortization, or accretion; (vi) mark-to-market gains or losses; (vii) gains and losses on the NDT; (viii) gains and losses on asset sales, dispositions, and asset retirement; (ix) impairments, obsolescence, and net realizable value charges; (x) interest expense; (xi) income taxes; (xii) legal settlements, liquidated damages, and contractual terminations; (xiii) development expenses; (xiv) noncontrolling interests, except where otherwise noted; and (xv) other adjustments. Such adjustments are computed consistently with the provisions of our indebtedness to the extent that they can be derived from the financial records of the business. Pursuant to TES’s debt agreements, Cumulus Digital contributes to Adjusted EBITDA beginning in the first quarter 2024, following termination of the Cumulus Digital TLF and associated cash flow sweep.
Annual Financial Statements. The audited Consolidated Balance Sheets of TEC as of December 31, 2024 (Successor) and December 31, 2023 (Successor); the related audited consolidated statements of operations, statements of comprehensive income, statements of cash flows, and statements of equity for the year ended December 31, 2024 (Successor), for the period from May 18, 2023 through December 31, 2023 (Successor), and for the period from January 1, 2023 through May 17, 2023 (Predecessor) and the year ended December 31, 2022 (Predecessor); and the related notes.
AOCI. Accumulated other comprehensive income or loss, which is a component of stockholder’s equity on the Consolidated Balance Sheets.
ARO. Asset retirement obligation.
AWS. Amazon Web Services, Inc. and its affiliates.
AWS Data Campus. The zero-carbon data center campus initially developed by a subsidiary of Cumulus Digital adjacent to Susquehanna. See Note 20 for information on the AWS Data Campus Sale.
AWS Data Campus Sale. The Company’s sale of the AWS Data Campus to AWS in March 2024 to AWS for gross proceeds of $650 million. See Note 20 for additional information.
AWS PPA. The March 2024 power purchase agreement between the Company and AWS pursuant to which (i) the Company agreed to supply up to 960 MW of long-term, carbon-free power to the AWS Data Campus from Susquehanna; (ii) the parties agreed to fixed-price power commitments that increase in 120 MW increments over several years; and (iii) AWS, under certain conditions, has the option to cap their commitments at 480 MW.
Bilateral LCF. The $75 million senior secured bilateral LC facility provided by Barclays Bank PLC. The Bilateral LCF was terminated in December 2024.
Board of Directors. The board of directors of Talen Energy Corporation.
Brandon Shores. A Talen-owned and operated generation facility in Curtis Bay, Maryland.
Brunner Island. A Talen-owned and operated generation facility in York Haven, Pennsylvania.
Capacity Performance. The sole class of capacity product that electricity providers within PJM can offer to satisfy PJM’s capacity obligation and thereby receive capacity payments from PJM. Auctions for this opportunity, generally referred to as capacity auctions, are scheduled by PJM periodically, up to three years in advance of the applicable PJM Capacity Year and in accordance with the terms of PJM’s Tariff and FERC’s orders. Capacity Performance providers assume higher performance requirements during system emergencies and are subject to penalties for non-performance.
CCR. Coal Combustion Residuals, including but not limited to fly ash, bottom ash, and gypsum, that are produced from coal-fired electric generation facilities.
Colstrip. A generation facility comprised of four coal-fired generation units located in Colstrip, Montana. Talen Montana operates Colstrip, owns an undivided interest in Colstrip Unit 3, and has an economic interest in Colstrip Unit 4. Colstrip Units 1 and 2 were permanently retired in January 2020. See Note 10 to the Annual Financial Statements for additional information on jointly owned facilities and Talen Montana’s ownership interests in Colstrip.
Credit Agreement. The Credit Agreement, dated as of May 17, 2023, by and among TES, as borrower, the lending institutions from time to time parties thereto, Citibank, N.A., as administrative agent and collateral agent, and the joint lead arrangers and joint bookrunners parties thereto, which governs the RCF, TLB-1, TLB-2, and LCF, as the same may be amended, amended and restated, supplemented, or otherwise modified from time-to-time.
Credit Facilities. Collectively, the RCF, TLB-1, TLB-2, and LCF,
Cumulus Digital. Cumulus Digital Holdings LLC, a subsidiary of TES that, through its subsidiaries, (i) initially developed the AWS Data Campus; and (ii) holds the Company’s interest in Nautilus.
Cumulus Digital TLF. The term loan facility under which a subsidiary of Cumulus Digital borrowed $175 million to support the development of Nautilus and the AWS Data Campus. The Cumulus Digital TLF was repaid in full and terminated in March 2024.
Emergence. May 17, 2023, the date that the Plan of Reorganization became effective in accordance with the terms thereof and TEC, TES, and the other debtors emerged from the Restructuring.
EPA. U.S. Environmental Protection Agency.
EPA CCR Rule. The national regulatory standards required by the EPA for the management of CCRs in landfills and surface impoundments.
EPA CSAPR. The Cross-State Air Pollution Rule, a federal program that aims to reduce power plant emissions that cross state lines and contribute to ground-level ozone and fine particle pollution in other states. A cap-and-trade system for both annual and ozone season periods is used to reduce the target pollutants—sulfur dioxide and nitrogen oxides. CSAPR regulations have been changed over time, and different versions of the regulations have been referred to as the “CSAPR Update,” the “Revised CSAPR Update,” and the “Good Neighbor Plan.”
EPA ELG Rule. The effluent limitation guidelines, which are national regulatory standards required by the EPA for wastewater discharged from specific industrial categories, including but not limited to coal-fired electric generation facilities, to surface waters and municipal sewage treatment plants.
EPA GHG Rule. An EPA rule that establishes carbon dioxide limits for new electric generating units and GHG guidelines for certain existing electric generating units.
EPA MATS Rule. The Mercury and Air Toxics Standards, EPA technology-based emissions standards for mercury and other hazardous air pollutants emitted by generation units with a capacity of more than 25 MWs.
EPS. Earnings per share.
ERCOT. The Electric Reliability Council of Texas, operator of the electricity transmission network and electricity energy market in most of Texas.
ERCOT Sale. The sale of our Texas fleet to CPS Energy in May 2024.
Exchange Act. The Securities Exchange Act of 1934, as amended.
FERC. U.S. Federal Energy Regulatory Commission.
GAAP. Generally Accepted Accounting Principles in the United States.
GW. Gigawatt.
GWh. Gigawatt-hour.
H.A. Wagner. A Talen-owned and operated generation facility in Curtis Bay, Maryland.
Indenture. The Indenture, dated as of May 12, 2023, as supplemented by the First Supplemental Indenture, dated as of May 17, 2023, the Second Supplemental Indenture, dated as of October 6, 2023, the Third Supplemental Indenture, dated as of June 22, 2024, and the Fourth Supplemental Indenture, dated as of January 13, 2025, each between TES, the Subsidiary Guarantors and Wilmington Savings Fund Society, FSB, as trustee, which governs the Secured Notes, as the same may be further amended, amended and restated, supplemented or otherwise modified from time-to-time.
Inflation Reduction Act. The Inflation Reduction Act of 2022, which was signed into law in August 2022. Among the Inflation Reduction Act’s provisions are: (i) amendments to the Internal Revenue Code of 1986 to create a nuclear production tax credit program; (ii) the creation, extension and modification of tax credit programs for certain clean energy projects, such as solar, wind, and battery storage; and (iii) adjustments to corporate tax rates.
ISA. Interconnection Service Agreement.
ISO. Independent System Operator.
ISO-NE. ISO New England, a non-profit regional transmission organization serving Connecticut, Maine, Massachusetts, New Hampshire, Rhode Island, and Vermont.
LC. Letter of credit.
LCF. The $900 million stand-alone letter of credit facility established under the Credit Agreement.
LMBE-MC TLB. The term loan B facility under which certain subsidiaries holding the Lower Mt. Bethel and Martins Creek facilities borrowed $290 million from affiliates of MUFG. The LMBE-MC TLB was repaid in full and terminated in August 2023.
Lower Mt. Bethel. A Talen-owned and operated generation facility in Bangor, Pennsylvania.
Martins Creek. A Talen-owned and operated generation facility in Bangor, Pennsylvania.
MMBtu. One million British Thermal Units.
Montour. A Talen-owned and operated generation facility in Washingtonville, Pennsylvania.
MW. Megawatt.
MWh. Megawatt-hour.
Nautilus. Nautilus Cryptomine LLC, a cryptocurrency project that was previously a joint venture between the Company and TeraWulf. The Company purchased TeraWulf’s interest in October 2024 and now owns 100% of Nautilus. See Note 18 for additional information.
NAV. Net asset value.
NDT. Nuclear facility decommissioning trust that is expected to fund Talen’s proportional costs associated with the future decommissioning activities of Susquehanna.
NERC. North American Electric Reliability Corporation.
NRC. U.S. Nuclear Regulatory Commission.
Nuclear PTC. The nuclear production tax credit under the Inflation Reduction Act.
PEDFA Bonds. The following series of Pennsylvania Economic Development Financing Authority (“PEDFA”) Exempt Facilities Revenue Refunding Bonds: Series 2009A, due December 2038 (“PEDFA 2009A Bonds”); Series 2009B, due December 2038 (“PEDFA 2009B Bonds”); and Series 2009C, due December 2037 (“PEDFA 2009C Bonds”). The PEDFA 2009A Bonds were extinguished in the Restructuring; the PEDFA 2009B Bonds and PEDFA 2009C Bonds remain outstanding and are guaranteed by certain of the Subsidiary Guarantors.
PJM. PJM Interconnection, L.L.C., the RTO that coordinates the movement of wholesale electricity in all or parts of Pennsylvania, New Jersey, Maryland, 10 other states, and the District of Columbia.
PJM BRA (or “BRA”). PJM Base Residual Auction, a component of PJM’s capacity market intended to secure power supply resources from market participants in advance of the PJM Capacity Year. It is usually held during the month of May three years prior to the start of the PJM Capacity Year. Under PJM’s “pay-for-performance” model, generation resources are required to deliver on demand during system emergencies or owe a payment for non-performance.
PJM Capacity Year. PJM capacity revenues for each delivery year covering the period from June 1 to May 31.
Plan of Reorganization. The Joint Chapter 11 Plan of Reorganization of Talen Energy Supply, LLC and Its Affiliated Debtors (Docket No. 1206), as subsequently amended, supplemented, or otherwise modified, and any exhibits or schedules thereto.
PP&E. Property, plant and equipment.
Predecessor. Relates to the financial position or results of operations of Talen Energy Supply for periods prior to Emergence, or May 17, 2023.
RCF. The senior secured revolving credit facility that provides $700 million in aggregate revolving loan and LC commitments under the Credit Agreement.
Restructuring. The voluntary cases commenced by TEC, TES, and the other debtors under Chapter 11 of the U.S Bankruptcy Code, together with the related financial restructuring of the existing debt, existing equity interests, and certain other obligations pursuant to the Plan of Reorganization.
RGGI. The Regional Greenhouse Gas Initiative, a mandatory market-based program among certain states, including Maryland, New Jersey and Massachusetts, to cap and reduce carbon dioxide emissions from the power sector. RGGI requires certain electric power generators to hold allowances equal to their carbon dioxide emissions over a three-year control period. Pennsylvania has proposed joining this program.
RMR. A generation unit that is otherwise slated to be retired but agrees with PJM to remain operational beyond its requested deactivation date as a reliability-must-run resource to mitigate reliability concerns until necessary upgrades can be established.
RTO. Regional Transmission Organization.
Secured ISDAs. Certain bilateral secured International Swaps and Derivatives Association (“ISDA”) agreements and Base Contracts for Sale and Purchase of Natural Gas as published by the North American Energy Standards Board (“NAESB”) of Talen Energy Marketing.
SNF. Spent nuclear fuel.
SOFR. Secured Overnight Financing Rate, a broad measure of the cost of borrowing cash overnight collateralized by U.S. Treasury securities.
Secured Notes. The 8.625% Senior Secured Notes, due 2030, issued by Talen Energy Supply.
SRP. The share repurchase program, under which the Board of Directors has authorized the Company to repurchase shares of TEC’s outstanding common stock.
Subsidiary Guarantors. The subsidiaries of TES that guarantee: (i) the obligations of TES under the Credit Facilities and the Secured Notes; and (ii) the obligations of Talen Energy Marketing under the Secured ISDAs.
Successor. Relates to the financial position or results of operations of Talen Energy Corporation for periods after Emergence, or May 18, 2023.
Susquehanna. A nuclear-powered generation facility located near Berwick, Pennsylvania. A subsidiary of Talen Energy Supply operates and owns a 90% undivided interest in Susquehanna.
Talen (or the “Company,” “we,” “us,” or “our”). (i) for periods after May 17, 2023, Talen Energy Corporation and its consolidated subsidiaries, unless the context clearly indicates otherwise; and (ii) for periods on or before May 17, 2023, Talen Energy Supply and its consolidated subsidiaries, unless the context clearly indicates otherwise.
Talen Energy Corporation (or “TEC”). Talen Energy Corporation, the parent company of Talen Energy Supply and its consolidated subsidiaries.
Talen Energy Marketing. Talen Energy Marketing, LLC, a direct subsidiary of Talen Energy Supply that provides energy management services to Talen-owned and operated generation facilities and engages in wholesale commodity marketing activities.
Talen Energy Supply (or “TES”). Talen Energy Supply, LLC, a direct subsidiary of Talen Energy Corporation that, thorough subsidiaries, indirectly holds all of Talen’s assets and operations.
Talen Montana. Talen Montana, LLC, a Talen subsidiary that operates Colstrip, owns an undivided interest in Colstrip Unit 3, and is party to a contractual economic sharing agreement for Colstrip Units 3 and 4.
TeraWulf. TeraWulf (Thales) LLC, a wholly owned subsidiary of TeraWulf Inc. and an unaffiliated third party.
TERP. The Talen Energy Retirement Plan, Talen’s principal defined-benefit pension plan.
TLB-1. The $580 million (subsequently increased to $870) million senior secured term loan B facility, due May 2030, under the Credit Agreement.
TLB-2. The $850 million senior secured term loan B facility, due December 2031, under the Credit Agreement.
TLC. The $470 million senior secured term loan C facility under the Credit Agreement, the proceeds of which were used to cash collateralize TLC LCF. The TLC was repaid in full and terminated in December 2024.
TLC LCF. The $470 million cash collateralized LC facility under the Credit Agreement. The TLC LCF was terminated in December 2024.
WECC. The Western Electricity Coordinating Council, a non-profit corporation that assures a reliable and secure bulk electric system in the Western Interconnection, covering all or parts of Montana, 13 other U.S. States, Canada, and Mexico.
SIGNATURES
Pursuant to the requirements of Section 13 or 15(d) of the Securities Exchange Act of 1934, the registrant has duly caused this Report to be signed on its behalf by the undersigned, thereunto duly authorized, on February 27, 2025.
| | | | | |
| TALEN ENERGY CORPORATION |
| |
| By: | /s/ Mark A. McFarland |
| Mark A. McFarland |
| President and Chief Executive Officer |
POWER OF ATTORNEY
KNOW ALL BY THESE PRESENTS, that each person whose signature appears below hereby constitutes and appoints Mark A. McFarland and Terry L. Nutt and each of them, as his or her true and lawful agents, proxies, and attorneys-in-fact, with full power of substitution and re-substitution, for him or her and in his or her name, place, and stead, in any and all capacities, to act on, sign, and file with the Securities and Exchange Commission any and all documents relating to this Report, including any amendments, exhibits, and supplements hereto and other documents in connection herewith or therewith, granting to each of them full power and authority to take any and all actions which may be necessary or appropriate to be done, as fully for all intents and purposes as he might or could do in person, hereby approving, ratifying and confirming that each that such agent, proxy, and attorney-in-fact or any of his substitutes may lawfully do or cause to be done by virtue hereof.
Pursuant to the requirements of the Securities Exchange Act of 1934, this Report has been signed below by the following persons on behalf of the registrant and in the capacities indicated on February 27, 2025.
| | | | | | | | |
| Signature | | Title |
| | |
| /s/ Mark A. McFarland | | President, Chief Executive Officer, and Director (Principal Executive Officer) |
| Mark A. McFarland | |
| | |
| /s/ Terry L. Nutt | | Chief Financial Officer (Principal Financial Officer) |
| Terry L. Nutt | |
| | |
| /s/ Tony Plagens | | Chief Accounting Officer (Principal Accounting Officer) |
| Tony Plagens | |
| | |
| /s/ Stephen Schaefer | | Chairperson of the Board and Director |
| Stephen Schaefer | |
| | |
| /s/ Gizman Abbas | | Director |
| Gizman Abbas | |
| | |
| /s/ Anthony Horton | | Director |
| Anthony Horton | |
| | |
| /s/ Karen Hyde | | Director |
| Karen Hyde | |
| | |
| /s/ Joseph Nigro | | Director |
| Joseph Nigro | |
| | |
| /s/ Christine Benson Schwartzstein | | Director |
| Christine Benson Schwartzstein | |