UNITED STATES
SECURITIES AND EXCHANGE COMMISSION
WASHINGTON, D.C. 20549
FORM 20-F
(Mark One)
| |
☐ | Registration statement pursuant to section 12(b) or 12(g) of the Securities Exchange Act of 1934 |
or
| |
☐ | Transition report pursuant to section 13 or 15(d) of the Securities Exchange Act of 1934 |
For the transition period from to
| |
☒ | Annual report pursuant to section 13 or 15(d) of the Securities Exchange Act of 1934 |
For the fiscal year ended March 31, 2021
or
| |
☐ | Shell company report pursuant to section 13 or 15(d) of the Securities Exchange Act of 1934 |
Date of event requiring this shell company report
Commission file number 001-37909
Azure Power Global Limited
(Exact name of Registrant as specified in its charter)
Mauritius
(Jurisdiction of Incorporation or Organization)
5th Floor, Southern Park, D-II,
Saket Place, Saket, New Delhi 110017, India
Telephone: (91-11) 49409800
(Address and Telephone Number of Principal Executive Offices)
Ranjit Gupta
Chief Executive Officer
5th Floor, Southern Park, D-II,
Saket Place, Saket, New Delhi 110017, India
Telephone: (91-11) 49409800
Facsimile: Fax: +91- 49409807
(Name, Telephone, email and/or Facsimile Number and Address of Company Contact Person)
Securities registered or to be registered pursuant to Section 12(b) of the Act:
Title of each class | | Trading symbol(s) | | Name of each exchange on which registered |
Equity Shares, par value US$0.000625 per share | | AZRE | | New York Stock Exchange |
Securities registered or to be registered pursuant to Section 12(g) of the Act.
None
(Title of Class)
Securities for which there is a reporting obligation pursuant to Section 15(d) of the Act.
None
(Title of Class)
Indicate the number of outstanding shares of each of the issuer’s classes of capital or common stock as of the close of the period covered by the annual report.
As of March 31, 2021, 48,195,962 equity shares, par value US$0.000625 per share, were issued and outstanding.
Indicate by check mark if the registrant is a well-known seasoned issuer, as defined in Rule 405 of the Securities Act. Yes ☐ No ☒
If this annual report is an annual or transition report, indicate by check mark if the registrant is not required to file reports pursuant to Section 13 or 15(d) of the Securities Exchange Act of 1934. Yes ☐ No ☒
Indicate by check mark whether the registrant has filed a report on and attestation to its management’s assessment of the effectiveness of its internal control over financial reporting under Section 404(b) of the Sarbanes-Oxley Act (15 U.S.C. 7262(b)) by the registered public accounting firm that prepared or issued its audit report. ☐
Indicate by check mark whether the registrant (1) has filed all reports required to be filed by Section 13 or 15(d) of the Securities Exchange Act of 1934 during the preceding 12 months (or for such shorter period that the registrant was required to file such reports), and (2) has been subject to such filing requirements for the past 90 days. Yes ☒ No ☐
Indicate by check mark whether the registrant has submitted electronically every Interactive Data File required to be submitted pursuant to Rule 405 of Regulation S-T (§232.405 of this chapter) during the preceding 12 months (or for such shorter period that the registrant was required to submit such files). Yes ☒ No ☐
Indicate by check mark whether the registrant is a large accelerated filer, an accelerated filer or an emerging growth company. See the definitions of “large accelerated filer”, “accelerated filer” and “emerging growth company” in Rule 12b-2 of the Exchange Act. (Check one):
Large accelerated filer ☐ | | Accelerated filer ☒ | | Non-accelerated filer ☐ | | Emerging Growth Company ☒ |
If an emerging growth company that prepares its financial statements in accordance with U.S. GAAP, indicate by check mark if the registrant has elected not to use the extended transition period for complying with any new or revised financial accounting standards provided pursuant to Section 13(a) of the Exchange Act. ☐
Indicate by check mark which basis of accounting the registrant has used to prepare the financial statements included in this filing:
U.S. GAAP ☒ | | International Financial Reporting Standards as issued by the International Accounting Standards Board ☐ | | Other ☐ |
If “Other” has been checked in the previous question, indicate by check mark which financial statement item the registrant has elected to follow. Item 17 ☐ Item 18 ☐
If this is an annual report, indicate by check mark whether the registrant is a shell company (as defined in Rule 12b-2 of the Securities Exchange Act of 1934). Yes ☐ No ☒
(APPLICABLE ONLY TO ISSUERS INVOLVED IN BANKRUPTCY PROCEEDINGS DURING THE PAST FIVE YEARS)
Indicate by check mark whether the registrant has filed all documents and reports required to be filed by Sections 12, 13 or 15(d) of the Securities Exchange Act of 1934 subsequent to the distribution of securities under a plan confirmed by a court: Yes ☐ No ☐
TABLE OF CONTENTS
CONVENTIONS USED IN THIS ANNUAL REPORT
Except where the context requires otherwise and for purposes of this annual report only:
| • • | “Our Company” or “Our holding company” refers to Azure Power Global Limited on a standalone basis. “We,” “us,” the “Group,” “Azure” or “our” refers to Azure Power Global Limited, a company organized under the laws of Mauritius, together with its subsidiaries (including Azure Power Rooftop Private Limited (“AZR”), and Azure Power India Private Limited, or AZI, its predecessor and current subsidiaries). |
| • | AZI, a company organized under the laws of India, refers to Azure Power India Private Limited |
| • | APGL, a company organized under the laws of India, refers to Azure Power Global Limited |
| • | “CERC” refers to the Central Electricity Regulatory Commission of India, the state level counterparts of which are referred to as “State Electricity Regulatory Commission,” or “SERC”. |
| • | “INR,” “rupees,” or “Indian rupees” refers to the legal currency of India. |
| • | “MNRE” refers to Indian Ministry of New and Renewable Energy. |
| • | “NSM” refers to the Jawaharlal Nehru National Solar Mission. |
| • | “U.S. GAAP” refers to the Generally Accepted Accounting Principles in the United States. |
| • | “US$” or “U.S. dollars” refers to the legal currency of the United States. |
| • | “SECI” refers to Solar Energy Corporation of India |
| • | “PGCIL” refers to Power Grid Corporation of India Limited |
| • | “APDC” refers to Assam Power Distribution Company |
| • | “LPSC” refers to Late Payment Surcharge |
| • • • • • • • • • • • • • • • • • • • • • • | “MOP” refers to Ministry of Power “RPO” refers to Renewable Purchase Obligation “LOA” refers to Letters of Award “PPA” refers to Power Purchase Agreement ”PSA” refers to Power Sales Agreement “VGF” refers to Viability Gap Funding “APERC” refers to Andhra Pradesh Electricity Regulatory Commission “KERC” refers to Karnataka Electricity Regulatory Commission “APTEL” refers to Appellate Tribunal for Electricity “CUF” refers to Capacity Utilization Factor “EPC” refers to Engineering, Procurement and Construction “PSPCL” refers to Punjab State Power Corporation Limited “PSERC” refers to Punjab State Electricity Regulatory Commission “CDPQ” refers to Caisse De Dépôt Et Placement Du Québec "CDPQ Infrastructures" refers to CDPQ Infrastructures Asia Pte Ltd. “ALMM” refers to Approved List of Models & Manufacturers “NISE” refers to National Institute of Solar Energy “NRE” refers to New & Renewable Energy “PFIC” refers to Passive Foreign Investment Company “RG” refers to Restricted Groups “ISTS” refers to Inter State Transmission System “IREDA” refers to Indian Renewable Energy Development Agency Limited |
In this annual report, references to “U.S.” or the “United States” are to the United States of America, its territories and its possessions. References to “India” are to the Republic of India, its territories and its possessions. References to “Mauritius” are to the Republic of Mauritius.
1
Unless otherwise indicated, the consolidated financial statements and related notes included in this annual report have been presented in Indian rupees and prepared in accordance with U.S. GAAP. References to a particular “fiscal” year are to our fiscal year ended March 31 of that year, which is typical in our industry and in the jurisdictions in which we operate.
This annual report contains translations of certain Indian rupee amounts into U.S. dollars at specified rates solely for the convenience of the reader. Unless otherwise stated, the translation of Indian rupees into U.S. dollars has been made at INR 73.14 to US$1.00, which is the noon buying rate in New York City for cable transfer in non-U.S. currencies as certified for customs purposes by the Federal Reserve Bank of New York on March 31, 2021. We make no representation that the Indian rupee or U.S. dollar amounts referred to in this annual report could have been converted into U.S. dollars or Indian rupees, as the case may be, at any particular rate or at all.
As used in this annual report, all references to watts (e.g., megawatts, gigawatts, kilowatt hour, terawatt hour, MW, GW, kWh, etc.) refer to measurements of power generated.
2
SPECIAL NOTE REGARDING FORWARD-LOOKING STATEMENTS
This annual report contains forward looking statements about our current expectations and views of future events. All statements, other than statements of historical facts, contained in this annual report, including statements about our strategy, future operations, future financial position, future revenues, projected costs, prospects, plans and future megawatt goals of management, are forward looking statements. These statements relate to events that involve known and unknown risks, uncertainties and other factors, including those listed under “Item 3. Key Information — D. Risk Factors,” which may cause our actual results, performance or achievements to be materially different from any future results, performance or achievements expressed or implied by the forward-looking statements. In some cases, these forward looking statements can be identified by words or phrases such as “may,” “will,” “expect,” “anticipate,” “aim,” “estimate,” “intend,” “plan,” “believe,” “potential,” “continue,” “is/are likely to” or other similar expressions.
These forward-looking statements are subject to risks, uncertainties and assumptions, some of which are beyond our control. In addition, these forward-looking statements reflect our current views about future events and are not a guarantee of future performance. Actual outcomes may differ materially from the information contained in the forward-looking statements because of a number of factors, including, without limitation, the risk factors set forth in “Item 3. Key Information — D. Risk Factors” and the following:
| • | the pace of government sponsored auctions; |
| • | changes in auction rules; |
| • | the Indian government’s willingness to enforce Renewable Purchase Obligations, or RPOs; |
| • | permitting, development and construction of our project pipeline according to schedule; |
| • | solar radiation in the regions in which we operate; |
| • | developments in, or changes to, laws, regulations, governmental policies, incentives, and taxation affecting our operations; |
| • | adverse changes or developments in the industry in which we operate; |
| • • | our ability to maintain and enhance our market position; our ability to enter new segments of the renewable energy market; |
| • | our ability to successfully implement any of our business strategies, including acquiring other companies and sale of our assets; |
| • | our ability to enter into power purchasing agreements, or PPAs, on acceptable terms, the occurrence of any event that may expose us to certain risks under our PPAs and the willingness and ability of counterparties to our PPAs to fulfill their obligations; |
| • | our ability to borrow additional funds and access capital markets, as well as our substantial indebtedness and the possibility that we may incur additional indebtedness going forward; |
| • • | solar power curtailments by state electricity authorities; our ability to establish and operate new renewable energy projects; |
| • | our ability to compete against traditional and renewable energy companies; |
| • | the loss of one or more members of our senior management or key employees; |
| • • | impact of the COVID-19 pandemic and lockdowns in India and globally; political and economic conditions in India; |
| • | material changes in the costs and availability of solar panels, raw materials, and other equipment required for our operations; |
| • | fluctuations in inflation, interest rates and exchange rates; |
| • • | global economic conditions; disruptions in our supply chain; and |
| • | other risks and uncertainties, including those listed under the caption “Item 3. Key Information — D. Risk Factors.” |
The forward-looking statements made in this annual report relate only to events or information as of the date on which the statements are made in this annual report. Except as required by law, we undertake no obligation to update or revise publicly any forward-looking statements, whether as a result of new information, future events or otherwise, after the date on which the statements are made or to reflect the occurrence of unanticipated events. You should read this annual report and the documents that we reference in this annual report and have filed as exhibits with the SEC, of which this annual report is a part, completely and with the understanding that our actual future results or performance may be materially different from what we expect.
3
This annual report also contains statistical data and estimates, including those relating to the renewable energy industry and our competition from market research, analyst reports and other publicly available sources. These publications include forward looking statements being made by the authors of such reports. These forward-looking statements are subject to a number of risks, uncertainties and assumptions. Actual results could differ materially and adversely from those anticipated or implied in the forward-looking statements.
4
PART I
ITEM 1. IDENTITY OF DIRECTORS, SENIOR MANAGEMENT AND ADVISERS
Not applicable
ITEM 2. OFFER STATISTICS AND EXPECTED TIMETABLE
Not applicable
ITEM 3. KEY INFORMATION
A. Selected Financial Data
The following selected consolidated statement of operations data for the fiscal years ended March 31, 2019, 2020 and 2021 and the selected consolidated balance sheet data as of March 31, 2020 and 2021, have been derived from our audited consolidated financial statements included elsewhere in this annual report. The selected consolidated statement of operations data for the fiscal years ended March 31, 2017 and 2018 and selected consolidated balance sheet data as of March 31, 2017, 2018 and 2019 have been derived from our audited consolidated financial statements of the respective periods not included in this annual report. Our consolidated financial statements are prepared and presented in accordance with U.S. GAAP. Our historical results do not necessarily indicate our results expected for any future period.
5
The following information should be read in conjunction with, and is qualified in its entirety by reference to, “Item 5. Operating and Financial Review and Prospects” and the audited consolidated financial statements and the notes thereto included elsewhere in this annual report.
| | Fiscal Year Ended March 31, | |
| | 2017 | | | 2018 | | | 2019 | | | 2020 | | | 2021 | | | 2021 (1) | |
Consolidated Statement of Operations data: | | (INR) | | | (INR) | | | (INR) | | | (INR) | | | (INR) | | | (US$) | |
| | | | | | | | | | | | | | | | | | (In millions except for per share amounts) | |
Operating revenues: | | | | | | | | | | | | | | | | | | | | | | | | |
Revenue from customers | | | 4,183 | | | | 7,701 | | | | 9,926 | | | | 12,958 | | | | 15,236 | | | 208.3 | |
Operating costs and expenses: | | | | | | | | | | | | | | | | | | | | | | | | |
Cost of operations (exclusive of depreciation and amortization shown separately below) | | | 376 | | | | 692 | | | | 869 | | | | 1,146 | | | | 1,261 | | | 17.2 | |
General and administrative | | | 797 | | | | 1,188 | | | | 1,306 | | | | 2,422 | | | | 2,988 | | | 40.9 | |
Depreciation and amortization | | | 1,047 | | | | 1,883 | | | | 2,137 | | | | 2,860 | | | | 3,202 | | | 43.8 | |
Impairment loss | | | — | | | | — | | | | — | | | | — | | | | 3,255 | | | 44.5 | |
Total operating costs and expenses: | | | 2,220 | | | | 3,763 | | | | 4,312 | | | | 6,428 | | | | 10,706 | | | 146.4 | |
Operating income | | | 1,963 | | | | 3,938 | | | | 5,614 | | | | 6,530 | | | | 4,530 | | | 61.9 | |
Other expense, net: | | | | | | | | | | | | | | | | | | | | | | | | |
Interest expense, net | | | 2,444 | | | | 5,335 | | | | 5,022 | | | | 7,962 | | | | 8,410 | | | 114.8 | |
Other (income)/expense | | | (72 | ) | | | (167 | ) | | | (140 | ) | | | (96 | ) | | 18 | | | 0.2 | |
Loss (gain) on foreign currency exchange, net | | | (109 | ) | | | 46 | | | | 441 | | | | 512 | | | 7 | | | 0.1 | |
Total other expenses, net | | | 2,263 | | | | 5,214 | | | | 5,323 | | | | 8,378 | | | | 8,435 | | | 115.1 | |
(Loss)/ profit before income tax | | | (300 | ) | | | (1,276 | ) | | | 291 | | | | (1,848 | ) | | | (3,905 | ) | | | (53.2 | ) |
Income tax (expense)/ benefit | | | (892 | ) | | | 253 | | | | (153 | ) | | | (489 | ) | | | (296 | ) | | | (4.0 | ) |
Net (loss)/ profit | | | (1,192 | ) | | | (1,023 | ) | | | 138 | | | | (2,337 | ) | | | (4,201 | ) | | | (57.2 | ) |
Less: Net (loss) / profit attributable to non-controlling interest | | | (19 | ) | | | (202 | ) | | | 60 | | | | (68 | ) | | 5 | | | 0.1 | |
Net (loss)/ profit attributable to APGL | | | (1,173 | ) | | | (821 | ) | | | 78 | | | | (2,269 | ) | | | (4,206 | ) | | | (57.3 | ) |
Accretion to Mezzanine CCPS | | | (236 | ) | | | — | | | | — | | | | — | | | — | | | — | |
Accretion to redeemable non-controlling interest | | | (44 | ) | | | (6 | ) | | | — | | | | — | | | — | | | — | |
Net (loss)/ profit attributable to APGL equity shareholders | | | (1,453 | ) | | | (827 | ) | | | 78 | | | | (2,269 | ) | | | (4,206 | ) | | | (57.3 | ) |
Net (loss)/ profit per share attributable to APGL equity stockholders | | | | | | | | | | | | | | | | | | | | | | | | |
Basic | | | (111.39 | ) | | | (31.84 | ) | | | 2.37 | | | | (52.71 | ) | | | (87.66 | ) | | | (1.20 | ) |
Diluted | | | (111.39 | ) | | | (31.84 | ) | | | 2.31 | | | | (52.71 | ) | | | (87.66 | ) | | | (1.20 | ) |
Shares used in computing basic and diluted per share amounts: | | | | | | | | | | | | | | | | | | | | | | | | |
Weighted average shares used in basic | | | 13,040,618 | | | | 25,974,111 | | | | 33,063,832 | | | | 43,048,026 | | | | 47,979,581 | | | | 47,979,581 | |
Weighted average shares used in diluted | | | 13,040,618 | | | | 25,974,111 | | | | 33,968,127 | | | | 43,048,026 | | | | 47,979,581 | | | | 47,979,581 | |
The following table sets forth a summary of our consolidated statement of financial position as of March 31, 2017, 2018, 2019, 2020 and 2021:
| | As of March 31, | |
Balance Sheet data: | | 2017 | | | 2018 | | | 2019 | | | 2020 | | | 2021 | | | 2021 (1) | |
| | (INR) | | | (INR) | | | (INR) | | | (INR) | | | (INR) | | | (US$) | |
| | | | | | | | | | | | | | | | | | (in millions) | |
Cash, cash equivalents, and current investments available for sale | | | 8,757 | | | | 9,730 | | | | 10,545 | | | | 9,972 | | | | 11,107 | | | 151.8 | |
Property, plant and equipment, net | | | 40,943 | | | | 56,581 | | | | 83,445 | | | | 95,993 | | | | 108,847 | | | | 1,488.2 | |
Total assets | | | 57,494 | | | | 73,984 | | | | 108,864 | | | | 132,401 | | | | 148,465 | | | | 2,029.6 | |
Project level and other debt (2) | | | 35,158 | | | | 53,944 | | | | 71,772 | | | | 89,864 | | | | 103,523 | | | | 1,415.4 | |
Total APGL shareholders’ equity | | | 13,222 | | | | 12,117 | | | | 25,129 | | | | 27,018 | | | | 24,248 | | | 331.5 | |
Total shareholders’ equity and liabilities | | | 57,494 | | | | 73,984 | | | | 108,864 | | | | 132,401 | | | | 148,465 | | | | 2,029.6 | |
6
Notes:
(1) | Translation of balances in the consolidated balance sheets and the consolidated statements of operations, comprehensive loss, shareholders’ equity and cash flows from INR into US$, as of and for the fiscal year ended March 31, 2021 are solely for the convenience of the readers and were calculated at the rate of US$1.00 = INR 73.14, the noon buying rate in New York City for cable transfers in non U.S. currencies, as certified for customs purposes by the Federal Reserve Bank of New York on March 31, 2021. No representation is made that the INR amounts could have been, or could be, converted, realized or settled into US$ at that rate on March 31, 2021, or at any other rate. |
(2) | This balance represents the short term and long-term portion of project level secured term loans and other secured bank loans. This balance is net of ancillary cost of borrowing of INR 909 million as of March 31, 2017, INR 828 million as of March 31, 2018, INR 851 million as of March 31, 2019, INR 1,145 million as of March 31, 2020 and INR 1,107 million (US$ 15.1 million) as of March 31, 2021. |
Note: There may be differences due to rounding
B. Capitalization and Indebtedness
Not applicable
C. Reasons for the Offer and Use of Proceeds
Not applicable
D. Risk Factors
If any of the following risks actually occur, our business, financial condition, results of operations and cash flows could be materially and adversely affected. In that event, the trading price of our equity shares could decline, and you may lose part or all of your investment. This annual report also contains forward-looking information that involves risks and uncertainties. Our actual results could differ materially from those anticipated in these forward-looking statements as a result of many factors, including the risks described below and elsewhere in this annual report
Risks to our Business related to the COVID-19 pandemic
The COVID-19 pandemic’s adverse impacts on our business, financial position, results of operations, and prospects could be significant.
The COVID-19 pandemic has created disruptions to the global economy and to the lives of individuals throughout the world. Governments, businesses, and the public have taken unprecedented actions to contain the spread of COVID-19 and to mitigate its effects, including quarantines, travel bans, shelter-in-place orders, closures of businesses and schools, fiscal stimulus, and other regulatory changes. The Government of India imposed a nationwide lockdown in India on March 25, 2020 which continued until May 31, 2020, while gradually relaxing restriction during the period. Due to this lockdown, construction work on our solar projects stopped for several weeks, which resulted in some impact to our construction timelines. A second wave of COVID-19 infections have severely impacted India in April, May and June 2021. This second wave in India has seen new peaks in daily cases, daily deaths, active cases and positivity rates. The second wave has resulted in significant strain on the health infrastructure in the country resulting in several states announcing lockdown measures. Due to this second wave of infection in India, several state governments including Maharashtra, Rajasthan and the National Capital Region announced partial lockdowns during the months of April, May and June 2021. These lock downs and the COVID-19
7
pandemic have impacted and continue to impact construction work on our projects and the availability of labor, components and material. Even after the lockdowns are lifted or eased, we may continue to experience disruption in our construction activities and supply of components and materials till the supply chains are fully restored. Several of our employees have also been infected with the COVID-19 virus over in Fiscal 2021 and in Fiscal 2022 during the first and second wave. Accordingly, we have and may continue to lose key management and employee hours due to COVID-19 related illness and related issues.
Governments and organizations have broadly revised Gross Domestic Product (“GDP”) growth forecasts downward in response to the economic slowdown caused by the spread of COVID-19 and it is possible that the COVID-19 outbreak may cause a prolonged economic crisis or recession. While the scope, duration and full effects of the second wave of COVID-19 are rapidly evolving and not fully known, the pandemic and related efforts to contain it have disrupted global and domestic economic activity, adversely affected the functioning of financial markets, impacted interest rates, increased economic and market uncertainty, and disrupted trade and supply chains. While these impacts continue, they will result in sustained economic stress or recession in India and many of the risk factors identified in this Risk Factors section of our annual report could be exacerbated and such effects could have a material adverse impact on us in a number of ways related to liquidity, operations, customer demand, interest rate risk, and human capital, as described in more detail below.
| • | Liquidity risk: Our success may be affected by a variety of external factors that may affect the price or marketability of our products and services, including disruptions in the capital markets, changes in interest rates that may increase our funding costs, reduced demand for our solar products due to economic conditions and the various response of governmental and nongovernmental authorities. The COVID-19 pandemic has significantly increased economic and demand uncertainty and has led to disruption and volatility in the global and domestic capital markets, which could increase the cost of capital and adversely impact access to capital. A period of extremely volatile and unstable market conditions would likely increase our funding costs and negatively affect market risk mitigation strategies. Furthermore, the volatility in global and domestic capital markets may cause increased volatility in currency exchange rates reducing our ability, or increase the costs, to mitigate these risks. Any depreciation of the Indian rupee could result in higher hedging cost and increased costs of imports for us. In addition, foreign exchange hedges on our restricted groups have a cap and heightened volatility in foreign exchange rates may result in additional payments. |
| • | Strategic risk: As a result of the business shutdown and facilities closures, the global and domestic economy has significantly slowed down, resulting in reduced electricity demand in India and globally. Customer demand for electricity may not swiftly recover to pre-COVID-19 level or at all, due to the potential of a prolonged global or domestic economic crisis or recession. Economic downturns may alter the priorities of governments (including the Government of India) to subsidize and/or incentivize participation in markets in which we operate. The global economic crisis may also prompt the Indian government to enact emergency measures such as electricity tariff adjustments to ease the financial burden on economically disadvantaged customers, each of which could have an adverse impact on our financial conditions, results of operations, and cash flows. |
| • | Operational risk: Current and future restrictions on our workforce’s access to any of our facilities and the health and availability of our workforce in constructing our solar projects could limit our ability to meet customer expectations and have a material adverse effect on our operations. We may experience increased difficulties in receiving payments from our distribution customers. These customers may not have adequate liquidity or may have greater difficulties in settling their electricity bills. Further, in response to COVID-19, our employees are working remotely from their homes but technology in employees’ homes may not be as robust as in our offices and could cause the networks, information systems, applications, and other tools available to employees to be more limited or less reliable than in our offices. The continuation of work-from-home measures introduces additional operational risk, especially cybersecurity risk. These cyber risks include greater phishing, malware, and other cybersecurity attacks, vulnerability to disruptions of our information technology infrastructure and telecommunications systems for remote operations, increased risk of unauthorized dissemination of confidential information, limited ability to restore systems in the event of |
8
| | a systems failure or interruption, and a greater risk of a security breach resulting in destruction or misuse of valuable information. |
Due to inadequate medical infrastructure in India, our employees may be at risk of not being able to access healthcare to treat COVID. Several of our employees have also been infected with the COVID-19 virus over in Fiscal 2021 and in Fiscal 2022 during the second wave.
Moreover, we rely on many suppliers and contractors. During the current year, we have faced several challenges and continue to face challenges currently to obtain materials from our suppliers and materials we do obtain often are at higher prices than in the past year. Certain suppliers have refused to provide material at the prices agreed under the terms of our supply agreements with them and have asked for price increases. Any further, fluctuations in prices of material could have a material adverse effect on our business, financial condition, results of operations and cash flows. We also rely on local and federal government agencies, offices, and other third parties in obtaining permits, conducting construction of our projects and transporting our solar products. In light of responses to the pandemic, these entities may limit the availability and access of their services. For example, we rely on frequent facility maintenance and improvement through operation and maintenance (“O&M”) activities to maintain efficient operation of our facilities. The COVID-19 pandemic could potentially limit our O&M activities due to labor shortages, materials, and limited availability of third-party service providers, resulting in an adverse impact on our revenues which may not be covered through insurance, as COVID-19 related risks are not covered under several of our existing insurance policies. If suppliers and third-party service providers continue to have limited capacities for a prolonged period or if additional limitations or potential disruptions in these services materialize, it may negatively affect our operations. Further, we may have disputes with suppliers, contractors or customers that could lead to litigation or arbitration due to contractual force majeure notices.
| • | Delay in legal matters: The extension of the nationwide lockdown due to COVID-19 or other localised lockdowns/disruptions pandemic have delayed important legal hearings relating to legal proceedings to which we are a party. The commissions and courts during such period have only been hearing matters of urgent nature. If courts and commissions continue to have limited hearings for a prolonged period, it may lead to delay in finalization of our legal cases and may have negative impact on our operations. |
Because there have been no comparable recent global pandemics that resulted in a similar global impact, we do not yet know the full extent of COVID-19’s effects on our business, operations, or the global economy as a whole. The extent to which the COVID-19 outbreak impacts our business, results of operations and financial condition will depend on future developments, including the timeliness and effectiveness of actions taken or not taken to contain and mitigate the effects of COVID-19 both in India and internationally by governments, central banks, healthcare providers, health system participants, other businesses, and individuals, which are highly uncertain and cannot be predicted. The uncertain future development of this crisis could materially and adversely affect our business, operations, operating results, financial condition, liquidity or capital levels.
Risks Related to our Business and Our Industry
We may not be able to sign PPAs in respect of the 4,000 MWs manufacturing linked tender for which letter of award has already been received.
During fiscal year 2020, we won a bid for 2,000 MWs manufacturing linked project with SECI and also elected to exercise a greenshoe option for an additional 2,000 MWs as per auction guidelines. We have received a Letter of Award (“LOA”) for the 4,000 MWs projects including for the greenshoe option for 2,000 MWs. We continue to work towards signing PPAs for these 4,000 MWs projects. SECI has informed us that so far there has not been adequate response from the DISCOMs for SECI to be able to sign the PSAs at this stage even though a LOA has been received. SECI has mentioned that they will be unable to sign PPAs until PSAs have been signed, and they have committed to inform us of developments in their efforts with the DISCOMS. Capital costs, interest rates and foreign exchange rates have improved since we won the 4 GWs auction in fiscal year 2020 which have resulted in lower tariffs in other recent SECI auctions. We expect these savings likely will be passed on to the DISCOMs. We expect a tariff markdown from the price achieved in the auction, which will facilitate signing of PSAs. We will continue
9
our discussions with SECI towards signing PPAs in respect of the 4,000 MWs projects and expect the PPAs to be signed in tranches over a period. In case we are unable to sign PPAs in respect of these LOAs, it could have a material adverse effect on our cash flows projections.
Our long-term growth depends in part on the Indian government’s continued commitment to solar and renewable energy.
In 2015 the Government of India (the “Government” or “GoI”) set a target of 175 GW renewable energy capacity by 2022. However, actual capacity additions historically have been lower than the GoI’s announced targeted capacity additions. According to the MNRE, the installed capacity as of March 31, 2021 was approximately 94 GW, which includes approximately 39 GW of solar capacity. In 2020, Prime Minister of India announced a target of 450 GWs for India’s renewable energy capacity to be achieved by the year 2030. Any subsequent revision of targets by the GoI including a change in focus on other alternative sources for any reason (due to an economic slowdown resulting from the COVID-19 pandemic or other policy reasons), may have material impact on our long term growth and adversely affect our ability to achieve our long-term business objectives, targets and goals.
The reduction, modification or elimination of central and state government incentives may reduce the economic benefits of our existing solar projects and our opportunities to develop or acquire suitable new renewable energy projects.
The development and profitability of renewable energy projects in the locations in which we operate are dependent on policy and regulatory frameworks that support such developments. Further, the Indian Income Tax Act, 1961 as amended, provides for certain tax benefits, including 100% tax deductions of the profits derived from generation of power for any 10 consecutive years, out of the first 15 years, beginning from the year in which project is completed. However, the exemption was only available to the projects completed on or before March 31, 2017. In addition, certain state policies also provide economic incentives like single window clearance system and setting up of solar parks. In addition, as per The Taxation Laws (Amendment) Act, 2019, the Government reduced corporate taxes for certain companies to 25%. However, any companies that benefit from the reduced tax rate are not able to avail themselves of any exemptions or incentives such as an 80IA exemption or additional depreciation. As per 80-IA exemption, projects which were completed on or before March 31, 2017, qualified for a tax holiday for a period of ten consecutive years out of 15 years beginning from the year in which the undertaking first generates power (referred to as the tax holiday period). For newly incorporated manufacturing companies incorporated after October 1, 2019, the rate had been reduced to 15%. Further, there is also a reduction in the Minimum Alternate Tax (“MAT”). However, income tax rules are subject to change and such benefits may not be available in the future.
The availability and size of such incentives depend, to a large extent, on political and policy developments relating to environmental concerns in India and are typically available only for a specified time. Generally, the amount of government incentives for solar projects has been decreasing as the cost of producing energy has dropped below grid parity. None of the projects we have won in the last three fiscal years have received direct incentives or subsidies other than ISTS waiver.
Changes in central and state policies could lead to a significant reduction in or a discontinuation of the support for renewable energy. Reductions in economic incentives that apply to future solar projects could diminish the availability of our opportunities to continue to develop or acquire suitable renewable energy projects. Such reductions may also apply to existing renewable energy projects, which could significantly reduce the economic benefits we receive from our existing solar projects. Moreover, some of the renewable energy program incentives expire or decline over time, are limited in total funding, require renewal from regulatory authorities or require us to meet certain investment or performance criteria. In addition, although various SERCs have specified Renewable Purchase Obligation (RPOs) for their distribution companies, the implementation of RPO schemes has not been uniform across Indian states.
10
Additionally, we may not continue to qualify for such incentives. We may choose to implement other renewable energy projects that are outside the scope of such incentives. Further, increased emphasis on reducing greenhouse gas emissions and the possibility of trading carbon dioxide emission quotas has led to extra duties being levied on sources of energy, primarily fossil fuels, which cause carbon dioxide pollution. The imposition of these duties has indirectly supported the expansion of power generated from renewable energy and, in turn, solar projects in general. If such direct and indirect government support for renewable energy were terminated or reduced, it would make producing electricity from renewable energy projects less competitive and may reduce demand for renewable energy projects.
A significant reduction in the scope or discontinuation of government incentive programs in our markets could have a material adverse effect on our business, financial condition, results of operations, cash flows and prospects.
Our operations are subject to governmental, health, safety and environmental regulations, which require us to obtain and comply with the terms of various approvals, licenses and permits. Any failure to obtain, renew or comply with the terms of such approvals, licenses and permits in a timely manner or at all may have a material adverse effect on our results of operations, cash flows and financial condition.
The power generation business in India is subject to a broad range of environmental, health, safety and other laws and regulations. These laws and regulations require us to obtain and maintain a number of approvals, licenses, registrations and permits for developing and operating power projects. Additionally, we may need to apply for more approvals in the future, including renewal of approvals that may expire from time to time. For example, we require various approvals during construction of our solar projects and prior to the commissioning certificate is issued, including capacity allocation and capacity transfer approvals, approvals from the local pollution control boards, evacuation and grid connectivity approvals and approval from the chief electrical inspector for installation and energization of electrical installations at the solar project sites. In addition, we are required to comply with state-specific requirements. Certain approvals may not be obtained in a timely manner, as a global crisis such as the COVID-19 pandemic may lead to limited operations or no operations at Government offices, resulting in delays in obtaining approvals. Certain approvals may also be granted on a provisional basis or for a limited duration and require renewal. If the conditions specified therein are not satisfied at a later date, we may not be able to evacuate power from these projects. For example, with respect to our Assam 1 project, there were delays in obtaining an approval to adopt the discovered tariff and to approve the PPA from the appropriate commission.
In addition, we could be affected by the adoption or implementation of new safety, health and environmental laws and regulations, new interpretations of existing laws, increased governmental enforcement of environmental laws or other similar developments in the future. For instance, we currently fall under an exemption granted to solar photovoltaic projects that exempts us from complying with the Environment Impact Assessment Notification, 2006, issued under the Environment (Protection) Act, 1986. While we are not required to obtain consents under the Water (Prevention and Control of Pollution) Act, 1974, Air (Prevention and Control of Pollution) Act, 1981 and the Hazardous Waste (Management, Handling and Transboundary Movement) Rules, 2008, certain procedural requirements, such as informing the Pollution Control Board, exists. However, there can be no assurance that we will not be subject to any such consent requirements in the future, and that we will be able to obtain and maintain such consents or clearances in a timely manner, or at all, or that we will not become subject to any regulatory action on account of not having obtained or renewed such clearances in any past periods. Furthermore, our government approvals and licenses are subject to numerous conditions, some of which are onerous and require us to make substantial expenditure. We may incur substantial costs, including clean up or remediation costs, fines and civil or criminal sanctions, and third-party property damage or personal injury claims, as a result of any violations of or liabilities under environmental or health and safety laws or noncompliance with permits and approvals, which, as a result, may have an adverse effect on our business and financial condition. In addition, during a global crisis such as the COVID-19 pandemic, we may be required to obtain special permits from Government authorities to start construction at project sites, and we may not be able to obtain such consents or clearances in a timely manner leading to an adverse impact on us.
We cannot assure you that we will be able to apply for or renew any approvals, licenses, registrations or permits in a timely manner, or at all, and that the relevant authorities will issue any of such approvals, licenses, registrations or permits in the time frames anticipated by us. Further, we cannot assure you that the approvals, licenses, registrations and permits issued to us would not be subject to suspension or revocation for non-compliance or alleged
11
non-compliance with any terms or conditions thereof, or pursuant to any regulatory action. Any failure to apply for, renew and obtain the required approvals, licenses, registrations or permits, or any suspension or revocation of any of the approvals, licenses, registrations and permits that have been or may be issued to us, or any onerous conditions made applicable to us in terms of such approvals, licenses, registrations or permits may impede the successful commissioning and operations of our power projects, which may adversely affect our business, results of operations and cash flows. For instance, a petition had been filed in 2019 before the Supreme Court of India aimed at the conservation of two species of birds, the Great Indian Bustard and the Lesser Florican, which are endangered species majorly existing in the states of Rajasthan and Gujarat. The petitioner through an Interlocutory Appeal (“IA”) had further sought directions to ensure predator proof fencing, barring installation of overhead power lines, and installation of solar infrastructure in priority and potential habitats for conservation of these two species. In an interim order in the IA proceedings, the Supreme Court on April 19, 2021, has ordered for immediate installation of diverters, as well as conversion of all overhead power lines to underground lines in priority and potential areas. However, for high voltage line due to complexity any technical non feasibility if identified can be referred for technical evaluation by a committee set up by the Supreme Court in this regard. The conversion of overhead cables into underground power lines, wherever considered feasible by such committee, is to take place within a period of one year. As per the order, any costs incurred on account of implementation of such steps would be compensated by the respective state governments/ authorities, and such cost could be passed on to the ultimate consumer, subject to approval of the competent regulatory authority. If the order necessitates for implementation of undergrounding after all provisions under the order are exercised and or otherwise, then we might face difficulties in recovering costs for such corrective measures from the respective state governments/authorities in a timely manner and may also face resistance from the regulators when we seek an increase in tariff rates. This may lead to disputes and impact our business, financial condition, results of operations and cash flows. We estimate majority of our projects currently located in Rajasthan, may be adversely impacted by the order. It may also impact our current awarded capacity, which we may install in the region.
The generation of electricity from solar and wind sources depends on suitable meteorological conditions. If weather conditions are unfavorable, our electricity generation, and therefore revenue from our renewable energy projects, may be below our expectations.
The electricity produced and revenues generated by our renewable energy projects are highly dependent on suitable solar and wind conditions and associated weather conditions and air pollution, which are beyond our control. Furthermore, components of our systems, such as solar panels and inverters, could be damaged by severe weather, such as dust-storms, tornadoes or lightning strikes. We generally will be obligated to bear the expense of repairing the damaged solar energy systems that we own, and replacement and spare parts for key components may be difficult or costly to acquire or may be unavailable. Unfavorable weather, high levels of air pollution and atmospheric conditions could impair the effectiveness of our assets or reduce their output beneath their rated capacity or require shutdown of key equipment, impeding operation of our solar assets and our ability to achieve certain performance guarantees pursuant to our PPAs, forecasted revenues and cash flows. Sustained unfavorable weather could also unexpectedly delay the installation of renewable energy systems, which could result in a delay in us acquiring new projects or increase the cost of such projects. We guarantee the performance of our solar power plants and could suffer monetary consequences if our plants do not produce to our contracted levels. Generally, our plants are in remote locations, that are far from densely populated and polluted areas; however, such areas may be subject to pollution from sources for which we may not have the visibility at the time of setting up of plants.
We base our investment decisions with respect to each solar project on the findings of related solar studies conducted on-site prior to construction. However, actual climatic conditions at a project site may not conform to the findings of these studies and therefore, our facilities may not meet anticipated production levels or the rated capacity of our generation assets, which could adversely affect our business, financial condition, results of operations and cash flows.
12
Our limited operating history, especially with large-scale solar projects or managing such a large portfolio, may not serve as an adequate basis to judge our future prospects, results of operations and cash flows.
We began our business in 2008 and have a limited operating history. We established our first utility scale solar plant in India in 2009. As of March 31, 2021, we operated 45 utility scale projects with a combined rated capacity of 1,990 MWs. As of March 31, 2021, we were also constructing a combined rated capacity of 965 MWs comprising utility scale projects of 65 MWs of Assam 1, 300 MWs of Rajasthan 6, 300 MWs of Rajasthan 8 and 300 MWs of Rajasthan 9. We also had an additional 4,000 MWs Contracted & Awarded, bringing our total Operating, Contracted & Awarded capacity to 6,955 MWs. Contracted & Awarded megawatts include 4,000 MWs for which we have received Letters of Award (“LOA”), but the Power Purchase Agreements (“PPAs”) have yet to be signed. Accordingly, our relatively limited operating history, especially with large-scale projects, or managing such a large portfolio may not be an adequate basis for evaluating our business prospects and financial performance and makes it difficult to predict the future results of our operations. Period-to-period comparisons of our operating results, and our results of operations for any period should not be relied upon as an indication of our performance for any future period. In particular, our results of operations, financial condition, cash flows and future success depend, to a significant extent, on our ability to continue to identify suitable sites, acquire land for solar projects, obtain required regulatory approvals, arrange financing from various sources, construct solar projects in a cost-effective and timely manner, expand our project pipeline and manage and operate solar projects that we develop. If we cannot do so, we may not be able to expand our business at a profit or at all, maintain our competitive position, satisfy our contractual obligations, or sustain growth and profitability.
The delay between making significant upfront investments in our solar and other renewable energy projects and receiving revenue could materially and adversely affect our liquidity, business, results of operations and cash flows.
There are generally several months between our initial bid in renewable energy auctions to build solar or other renewable energy projects and the date on which we begin to recognize revenue from the sale of electricity generated by such projects. Our initial investments include, without limitation, legal, accounting and other third-party fees, costs associated with project analysis and feasibility study, payments for land rights, payments for interconnection and grid connectivity arrangements, government permits, engineering and procurement of solar panels, balance of system costs or other payments, which may be non-refundable. Our projects may not be fully monetized for 25 years given the average length of our PPAs, but we bear the costs of our initial investment upfront. Furthermore, we have historically relied on our own equity contribution, international lenders and bank loans to pay for costs and expenses incurred during project development. Solar and other renewable energy projects typically generate revenue only after becoming commercially operational and starting to sell electricity to the power grid through offtakers. There may be long delays from the initial bid to projects becoming shovel-ready, due to the timing of auctions, obtaining permits and the grid connectivity process. Between our initial investment in the development of permits for solar projects and their connection to the transmission grid, there may be adverse developments, such as unfavorable environmental or geological conditions, pandemics, labor strikes, panel shortages or monsoon weather. For instance, in respect of some of our rooftop projects, we had faced several operational challenges resulting further delays in sign-off of Joint Meter Readings (JMR) by customers and ultimate collections of revenues. Same had also resulted in financial issues amid high operational and maintenance cost. Furthermore, we may not be able to obtain all of the permits as anticipated, permits that were obtained may expire or become ineffective and we may not be able to obtain project level debt financing as anticipated. In addition, the timing gap between our upfront investments and actual generation of revenue, or any added delay due to unforeseen events, such as delays associated with COVID-19 could put strains on our liquidity and resources, and materially and adversely affect our profitability, results of operations and cash flows. For a full discussion of the risks to our business associated with the COVID-19 pandemic, see “Risks to our Business related to the COVID-19 pandemic”.
13
Renewable energy project development is challenging, and our growth strategy may ultimately not be successful, which can have a material adverse effect on our business, financial condition, results of operations and cash flows.
The development and construction of renewable energy projects involve numerous risks and uncertainties and require extensive research, planning and due diligence. As a result, we may be required to incur significant capital expenditures for land and interconnection rights, regulatory approvals, preliminary engineering, permits, and legal and other expenses before we can determine whether a renewable energy project is economically, technologically, or otherwise feasible. The projects which are now awarded may not be viable in the future.
We may expand our business significantly with several new projects in both new and existing jurisdictions in the future. As we adopt new projects, we expect to encounter additional challenges to our internal processes, external construction management, capital commitment process, project funding infrastructure, financing capabilities and regulatory approvals and compliance. Our existing operations, personnel, systems, and internal controls may not be adequate to support our growth and expansion and may require us to make additional unanticipated investments in our infrastructure. To manage the future growth of our operations, we will be required to improve our administrative, operational, and financial systems, procedures, and controls, and maintain, expand, train, and manage our growing employee base. We will need to hire and train project development personnel to expand and manage our project development efforts. If we are unable to manage our growth effectively, we may not be able to take advantage of market opportunities, execute our business strategies successfully or respond to competitive pressures. As a result, our business, prospects, financial condition, results of operations and cash flows could be materially and adversely affected.
Success in executing our growth strategy is contingent upon, among others:
| • | accurately prioritizing geographic markets for entry, including estimates on addressable market demand; |
| • | managing local operations, capital investment or components sourcing in compliance with regulatory requirements; |
| • | negotiating favorable payment terms with suppliers; |
| • | collecting economic incentives as expected, and |
| • | signing PPAs or other arrangements that are commercially acceptable, including adequate financing. |
We may not be able to find suitable sites for the development of renewable energy projects.
Renewable energy projects require resource availability (for example wind resource for wind projects and solar insolation for solar projects) that is not uniformly available in all areas. Further, large utility scale renewable projects must be interconnected to the power grid to deliver electricity, which requires us to find suitable sites with capacity on the power grid available. We may encounter difficulties registering certain leasehold/sale interest in such sites. Even when we have identified a desirable site for a project, our ability to obtain site control with respect to the site is subject to growing competition from other renewable power producers that may have better access to local government support or financial support or other resources. If we are unable to find or obtain site control for suitable sites on commercially acceptable terms, our ability to develop new projects on a timely basis or at all might be harmed, which could have a material adverse effect on our business, financial condition, and results of operations. Moreover, our land leases for projects are typically for 30 to 35 years, but our PPAs are generally for a term of 25 years. If we are not able to sell the power produced by our systems after the initial PPA has expired, it may impact our future cash flows.
COVID-19 and related lockdowns have subjected and may continue to subject our construction activities to delays and cost overruns as well as component shortages and supply delays from suppliers.
Our contracts with our suppliers and contractors all contain provisions for force majeure. Due to the impact of COVID -19 related lockdowns in India and other parts of the world some of our suppliers have issued force majeure
14
notices to us requesting a suitable time extension for delivery. In case the situation continues for a long period of time we may have to terminate these contracts.
The commissioning of our 65 MW projects in Assam faced delays due to force majeure reasons due to the COVID-19 and lockdowns in fiscal 2021, for which we had filed extension petitions in the regulatory commission, which was not admitted. We have filed an appeal against the said order before APTEL, disposal of which is pending. We believe in the merits of the case, however, we cannot provide assurances, that such proceedings will ultimately be decided in our favor. For a full discussion of the risks to our business associated with the COVID-19 pandemic, see “Risks to our Business related to the COVID-19 pandemic”.
During fiscal 2021, vide notification dated June 30, 2020, the MNRE directed all Renewable Energy (RE) implementing agencies of the MNRE to treat the lockdown due to COVID-19, as force majeure, and provided that these agencies may grant extensions of time for RE projects equivalent to the period of lockdown and additional 30 (thirty) days for normalization after end of such lockdown. Further, as per notification dated August 13, 2020, the MNRE conveyed that all RE projects under implementation as on the date of lockdown, i.e. 25th March 2020, through RE implementing agencies designated by the MNRE or under various schemes of the MNRE, shall be given a time extension of five months from March 25, 2020 to August 24, 2020. This blanket extension, if invoked by the RE developers, will be given without case-to-case examination and no documents or evidence will be asked for such extension. The developers of the projects may also pass on the benefit of such time-extension by way of granting similar time-extensions to other stakeholders down the value chain like engineering procurement construction (EPC) contractors, material equipment suppliers and original equipment manufacturers (OEMs). Further MNRE through its subsequent clarifications dated February 9, 2021 and March 30, 2021 communicated that further time-extension beyond 5 months can be granted by implementing agencies in exceptional cases. However, for any time-extension totaling beyond 6 months, a reference shall be made to MNRE.
Subsequent to year end, amid outbreak of second wave of COVID-19, MNRE vide their notification dated May 12, 2021, clarified that RE projects having their Scheduled Commissioning date (SCOD) on or after 1st April 2021 will be eligible to claim time-extension for completion of their project activities, provided such time-extensions are not used as a ground for claiming termination of Power Purchase Agreement (PPA) or for claiming any increase in the project cost. The actual quantum of time-extension shall be decided in due course depending on the COVID-19 related developments that take place in the coming future. However, implementing agency/ off taker shall not initiate any coercive action on the project for recovery of penalty on delayed commissioning, till the time-extension request is decided upon. We are uncertain what additional extensions will be allowed by the MNRE in light of the second wave and related state lockdowns. If MNRE, does not provide support to the RE developers in providing extension, our business, results of operations, could be adversely affected in the form of penalties for delays and other costs.
We may incur unexpected cost overruns and expenses if the suppliers of components in our solar projects default in their warranty obligations or delay in the delivery of products and services for any reason.
We enter into contracts with our suppliers to supply components in our solar projects. If our suppliers do not perform their obligations, we may have to enter into new contracts with other suppliers at a higher cost or may suffer schedule disruptions. In addition, our suppliers may have difficulty fulfilling our orders and incur delivery delays, or charge us higher prices, higher up-front payments and deposits, which would result in higher-than-expected prices or less favorable payment terms to develop our projects. Delays in the delivery of ordered components in our solar projects could delay the completion of our under-construction projects. In addition, our relationship with our suppliers may worsen or lead to disagreements or litigation which could have a material adverse effect on our business, financial condition, results of operations and cash flows.
Fluctuations in prices of material and the inability to secure the on-time delivery of components and raw materials could have a material adverse effect on our business, financial condition, results of operations and cash flows. In fiscal 2021, we faced several challenges in receipt of material from its suppliers relating to the Rajasthan-6 and Assam projects. In a high demand environment, certain suppliers refused to provide material at the prices agreed under the terms of our agreements and asked for price increases. We have agreed to certain price increases in this
15
regard, but, if the prices continue to climb, returns on our projects could be impacted and our business, financial condition, results of operations, cash flows could be adversely affected.
In addition, COVID-19 and related lockdowns has and continue to impact our supply of components and raw materials for our projects. See “COVID-19 and related lockdowns have subjected and may continue to subject our construction activities to delays and cost overruns as well as component shortages and supply delays from suppliers” and “Risks to our Business related to the COVID-19 pandemic” above.
Furthermore, the solar panels, inverters and other system components utilized in our solar projects are generally covered by manufacturers’ warranties, which are typically for 5 to 25 years. In the event any such components fail to operate as required, we may be able to make a claim against the applicable warranty to cover all or a portion of the expense or losses associated with the faulty component. However, the warranties may not be sufficient to cover all of our expense and losses. In addition, these suppliers could cease operations and no longer honor the warranties, which would leave us to cover the expense and losses associated with the faulty component. Our business, financial condition, results of operations and cash flows could be materially and adversely affected if we cannot recover the expense and losses associated with the faulty component from these warranty providers.
Further during the year, we also received notices related to the non-execution of contracts, however, no legal proceedings have been commenced against us. Our business, financial condition, results of operations and cash flows could be materially and adversely affected in case such claim is settled against the Company.
Our construction activities may be subject to cost overruns or delays which may adversely affect our business, financial condition, results of operations and cash flows.
Construction of our solar and other renewable energy projects may be adversely affected by circumstances outside of our control, including inclement weather, adverse geological and environmental conditions, failure to receive regulatory approvals on schedule or third-party delays in providing supplies and other materials. Changes in project plans or designs, or defective or late execution may increase our costs from our initial estimates and cause delays. Increases in the prices of our materials may increase procurement costs. In particular, we have not yet placed orders for all equipment required to construct and operate all of our power projects that are presently Contracted and under construction. There can be no assurance that the prices of the equipment required for our power projects that are presently Contracted and under construction will not change, which may cause the economic returns available from these projects to differ from our initial projections. For example, during last two quarters of current year, there had been increase in price of components mainly due to a shortage of raw material such as poly silicon, glass and ethylene-vinyl acetate (EVA). Also, we faced several challenges in receipt of raw material from its suppliers mainly in respect of our Rajasthan 6 and Assam projects, where our suppliers refused to provide raw materials at the prices agreed under the terms of our agreements with these suppliers. Any further, fluctuations in prices of raw material could have a material adverse effect on our business, financial condition, results of operations and cash flows. If we experience unexpected increases in procurement costs, our forecasted revenues and cash flows could be materially adversely affected.
Labor shortages, work stoppages, labor disputes or disruptions in transportation bringing in labor for projects could also significantly delay a project, increase our costs or cause us to breach our performance guarantees under our PPAs, particularly because strikes and labor transportation disruptions are not considered a force majeure event under many of our PPAs. Moreover, local political changes and delays, for instance, caused by state and local elections, as well as demonstrations or protests by local communities and special interest groups could result in, or contribute to, project time and cost overruns for us.
In addition, we sometimes utilize and rely on third-party sub-contractors to construct and install portions of our renewable energy projects. If our sub-contractors do not satisfy their obligations or do not perform work that meets our quality standards or if there is a shortage of third-party sub-contractors or if there are labor strikes that interfere with the ability of our employees or contractors to complete their work on time or within budget, we could experience significant delays or cost overruns.
16
We may not be able to recover any of these losses in connection with construction cost overruns or delays. Certain PPAs require that we connect to the transmission grid by a certain date. If a project is significantly delayed, such PPAs may be terminated or require us to pay liquidated damages computed based on number of days of delay in commissioning of the projects or reduction in the PPA tariff. In addition, if we are unable to meet our performance guarantees, most of our PPAs require us to pay liquidated damages to the offtaker in proportion to the amount of power not supplied, and also grant the offtaker a right to draw on bank guarantees posted by us, including up to 100% of certain bank guarantees. Also, certain PPAs provide that we are liable for government fines and penalties if we fail to deliver electricity required by the offtakers to meet their RPO requirements. Furthermore, in the case of projects with viability gap funding (“VGF”), 50% of which is paid out in the first year with the remaining 50% paid out over the course of next five years, if the project fails to generate power for a long period of time, the government agency can suspend the VGF and demand repayment of previously paid sums. During fiscal 2021, we faced various operational challenges in respect of our rooftop projects like delays in site clearances resulting in further delays in construction of projects, including short closure of projects, lower PLF reported on projects, higher maintenance cost and lower operational efficiencies in comparison to the size of the rooftop sites. Also, in some cases relating to rooftop projects, our customers forfeited VGF entitlements as we were not able to meet the conditions. Further, there can be no assurance that we will be able to perform at a level that we are able to claim VGF in the future for our projects, as there have been instances in the past wherein we have been unable to claim the benefit on certain projects.
Any of the contingencies discussed above could lead us to fail to generate our expected return from our solar and other renewable energy projects and result in unanticipated and significant revenue and earnings losses.
Our operating results may fluctuate from quarter to quarter, which could make our future performance difficult to predict and could cause our operating results for a particular period to fall below expectations, which may result in a severe decline in the price of our equity shares.
Our quarterly operating results are difficult to predict and may fluctuate significantly in the future. We have experienced seasonal and quarterly fluctuations in the past, especially in the winter months and we may experience similar fluctuations in the future. However, given that we are a rapidly growing industry, those fluctuations may be masked by our recent growth rates and thus may not be readily apparent from our historical operating results. As such, our past quarterly operating results may not be good indicators of future performance.
In addition to the other risks described in this “Risk Factors” section, the following factors could cause our operating results to fluctuate:
| • | the expiration or initiation of any central or state subsidies or incentives; |
| • | our ability to complete installations in a timely manner due to market conditions or due to unavailable financing; |
| • | our ability to continue to expand our operations, and the amount and timing of expenditures related to such expansions; |
| • | announcements by us or our competitors of significant acquisitions, strategic partnerships, joint ventures or capital-raising activities or commitments; |
| • | changes in auction rules; |
| • | changes in feed-in tariff rates for solar power, VGF, our pricing policies or terms or those of our competitors; |
| • | actual or anticipated developments in our competitors' businesses or the competitive landscape; |
| • | an occurrence of low global horizontal irradiation that affects our generation of solar power; |
| • | fluctuations due to the COVID-19 pandemic, related lockdowns and resulting operational disruptions; |
17
| • • | change in law or adoption of new accounting pronouncements; and significant volatility in market conditions (including, but not limited to foreign currency rates, interest rates and our share price) can directly impact our expenses such as foreign exchange gains and losses, derivative gains and losses, interest costs and Stock Appreciation Rights (SARs) expense. |
For these or other reasons, the results of any prior quarterly or annual periods should not be relied upon as indications of our future performance. In addition, with respect to the above factors our actual revenue, key operating and financial metrics and other operating results in future quarters may fall short of the expectations of investors and financial analysts, which could have a material adverse effect on the trading price of our equity shares.
Counterparties to our PPAs may not fulfill their obligations which could result in a material adverse impact on our business, financial condition, results of operations and cash flows.
We generate electricity income primarily pursuant to PPAs entered into with central and state government-run utilities. Some of the customers may become subject to insolvency or liquidation proceedings during the term of the relevant contracts, and the credit support received from such customers may not be sufficient to cover our losses in the event of a failure to perform. There may also be delays associated with collection of receivables from government owned or controlled entities on account of the financial condition of these entities that deteriorated significantly in the past. Where we are selling power to non-governmental entities, we take into account the credit ratings assigned by rating agencies and our ability to collect when assessing the counterparties’ creditworthiness. The Governmental entities to which we sell power generally may not have credit ratings for us to consider. For illustrative purposes, Moody’s Investor Services Inc. and Standard and Poor’s Financial Services LLC have rated the Indian government Baa3 during June’2020 and BBB-, respectively. As a result, many of the state governments in India, if rated, would likely rate lower than the Indian government. Although the central and state governments in India have taken steps to improve the liquidity, financial condition and viability of state electricity distribution utility companies, there can be no assurance that the utility companies that are currently our customers will have the resources to pay on time or at all.
In addition, our PPA customers may, for any reason, become unable or unwilling to fulfil their related contractual obligations, refuse to accept delivery of power delivered thereunder or otherwise terminate such agreements prior to the expiration thereof. If such events occur, our assets, liabilities, business, financial condition, results of operations and cash flows could be materially and adversely affected. For instance, Gujarat Urja Vikas Nigam Limited had filed a petition with the Gujarat Electricity Regulatory Commission, seeking recalculation of the tariff under its PPA based on actual cash flow required for development of solar projects and consequent revision of the tariff payable by it, in relation to certain solar power projects including our 10 MWs Gujarat 1 project. While the Gujarat Electricity Regulatory Commission and the Appellate Tribunal for Electricity dismissed the claims made by Gujarat Urja Vikas Nigam Limited, an appeal filed by Gujarat Urja Vikas Nigam Limited is pending before the Supreme Court of India. Further, On July 7, 2019, the Government of Andhra Pradesh vide an order bearing no. GO RT No 63 (“Order”), constituted a High-Level Negotiation Committee to revisit and review PPAs for solar & wind projects in the state of Andhra Pradesh with a view to bring down the tariffs. Pursuant to the same, a letter dated July 12, 2019, was issued by Andhra Pradesh Distribution Company to the developers to reduce the quoted tariff to INR 2.43 per unit for wind projects for the pending bills, and INR 2.44 per unit for solar projects from the date of commissioning and threatened termination of the PPA in case of refusal of the developers to accede to such reduction (“Letter”). The developers challenged both the Order and the Letter in the High Court at Vijayawada. The High Court vide order dated September 24, 2019, set aside both the Order and the Letter. However, as an interim measure, until the issue of possibility of reduction of existing tariff is decided by the Andhra Pradesh Electricity Regulatory Commission (“APERC”), directed to honor the outstanding and future bills of the developers, and pay at an interim rate of INR 2.43 and INR 2.44 per unit for wind and solar projects, respectively. This order of the single judge had been challenged in an appeal filed by the developers including Azure Power. The matter is listed for further hearing in the court and matter had been adjourned until disposal of the writ appeals before Vijayawada.
18
For instance, in connection with an extension of the date of commissioning of the 40 MWs project in Karnataka of one of our subsidiaries, our distribution company customer reduced its payable tariff under the PPA. After certain litigation, the subsidiary executed a supplementary PPA with the customer allowing extension of time without reducing the PPA tariff, however when the supplementary PPA went for the approval of the Karnataka Electricity Regulatory Commission (“KERC”) the KERC, pursuant to an order directed our customer to retrospectively withdraw the extensions, and to enforce a reduced tariff and recover liquidated damages due to delay based on “actual commercial operation date”. Against the order of the KERC, we filed an appeal before the Appellate Tribunal for Electricity (“APTEL”). The matter is pending adjudication before APTEL. Although, in a similar matter, pertaining to the same issue, we have received a favorable order from APTEL vide order dated February 28, 2020, where APTEL set aside the order of KERC, wherein the KERC had reduced the extension of time and reduced the tariff and imposed liquidated damages. We cannot provide any assurances, however, that our appeal at APTEL will ultimately be decided in our favor. Further, the commissioning of a 10 MWs project in Punjab by another of our subsidiaries faced delays due to a delay by the customer, and our subsidiary had sought an extension of the commercial operation date at the same tariff rate as per the PPA. This matter is also currently pending before the APTEL. We cannot provide assurances, however, that such proceedings will ultimately be decided in our favor. In respect of our 222 MWs capacity projects in Punjab, our offtaker Punjab State Power Corporation Limited (PSPCL) had refused to accept power generated from these projects for the first week of April 2020 on account of COVID-19. Further, PSPCL had also deducted 5% of billed amount relating to the months of April-June 2020. We had filed petition before Punjab State Electricity Regulatory Commission (PSERC) through the Solar Power Developer Association against the same. The matter is currently pending with the appellant authority. However, we cannot provide assurances that such proceedings will ultimately be decided in our favor.
Furthermore, to the extent any of our customers are, or are controlled by, governmental entities, bringing actions against them to enforce their contractual obligations is often difficult. Also, our counterparties may be subject to legislative or other political action that may impair their contractual performance.
Our obligations under our PPAs and the tariffs set under our PPAs may expose us to certain risks that may affect our future results of operations and cash flows.
Our profitability is largely a function of our ability to manage our costs during the terms of our PPAs and operate our power projects at optimal levels. If we are unable to manage our costs effectively or operate our power projects at optimal levels, our business and results of operations may be adversely affected. In the event we default in fulfilling our obligations under the PPAs, such as supplying the minimum amount of power specified in some of the PPAs or failing to obtain regulatory approvals, licenses and clearances with respect to our solar projects, we may be liable for penalties and in certain specified events, customers may also terminate such PPAs. Further, any failure to supply power from the scheduled commercial operation date may result in levy of liquidated damages and encashment of bank guarantees provided by us under the terms of certain PPAs. The termination of any of our projects by our customers would adversely affect our reputation, business, results of operations and cash flows.
Further, the tender which involves manufacturing of solar modules, wherein we had entered into a joint venture agreement with a local solar panel manufacturer, to set up a new facility in accordance with the terms of the contract, any deviation from the contract terms, or non-performance by the joint venture partner could cause adverse impact to us financially as well as reputationally.
Under a long-term PPA, we typically sell power generated from a power plant to state distribution companies at pre-determined tariffs. Our PPAs are generally not subject to downward revisions unless we elect to utilize accelerated rate of depreciation or if there is a delay in commissioning our projects, although we have entered into contracts that provide for downward adjustments in the past and may do so in the future. Accordingly, if there is an industry-wide increase in tariffs or if we are seeking an extension of the term of the PPA, we will not be able to renegotiate the terms of the PPA to take advantage of the increased tariffs. In addition, in the event of increased operational costs, we will not have the ability to reflect a corresponding increase in our tariffs. Further, any delay in commissioning projects or supplying electricity during the term of the PPA may result in reduction in tariffs, based on the terms of the PPA.
19
Therefore, the prices at which we supply power may have little or no relationship with the costs incurred in generating power, which may lead to fluctuations in our margins. All the above factors limit our business flexibility, expose us to an increased risk of unforeseen business and industry changes and could have an adverse effect on our business, results of operations and cash flows.
The term of most of our PPAs are also less than the life of the power projects they are tied to. We will need to enter into other offtake agreements, or seek renewals or extensions of the existing PPAs, for the balance of the life of those power projects. Moreover, there are often other restrictions on our ability to, among other things, sell power to third parties and undertake expansion initiatives with other consumers. Failure to enter into or renew offtake arrangements in a timely manner and on terms that are acceptable to us could adversely affect our business, results of operations and cash flows. There could also be negative accounting consequences if we are unable to extend or replace expiring PPAs, including writing down the carrying value of assets at such power project sites.
The Government also provides Viability Gap Funding (“VGF”) to various companies to support infrastructure projects that are economically justified but fall short of financial viability. Benefits under VGF are linked to certain conditions as set by the Government like achievement of minimum Capacity Utilization Factor (“CUF”) during the fiscal year. We have obtained VGF benefits in some of our projects. During fiscal year ended March 31, 2020, we could not avail the VGF for our Uttar Pradesh 40 MWs project due to our inability to meet the conditions. Further, there can be no assurance that we will be able to perform at a level that we are able to claim VGF in the future for our projects.
Additionally, under the PPAs, our remedies in case of delays in payment by our customers may also be limited. For example, certain PPAs only permit us to terminate the PPA on account of non-payment of dues upon 90 days of our inability to recover such dues. Such risks limit our business flexibility, expose us to an increased risk of unforeseen business and industry changes and could have an adverse effect on our business, results of operations and cash flows.
In addition, most of the government agencies we enter into PPAs with under the NSM or the relevant state policies require us to agree to their standard form contracts and we cannot negotiate for commercial terms or other terms of funding that are more favorable to us.
In respect of some of our rooftop projects, we faced several operational challenges in fiscal 2021 resulting further delays in the sign-off of Joint Meter Readings (JMR) by customers and delay in collections of revenues.
Our substantial indebtedness could adversely affect our business, financial condition, results of operations and cash flows.
As of March 31, 2021, we had INR 10,462 million (US$ 143.2 million) in current liabilities, excluding the current portion of long-term debt and short-term debt, and INR 103,523 million (US$ 1,415.4 million) in outstanding long-term borrowings, including the current portion of long-term debt and short-term debt. Generally, these borrowings relate to the financing for our projects and are secured by project assets.
Our debt could have significant consequences on our operations, including:
| • | reducing the availability of our cash flow to fund working capital, capital expenditures, acquisitions and other general corporate purposes as a result of our debt service obligations; |
| • | limiting our ability to obtain additional financing; |
| • | limiting our flexibility in planning for, or reacting to, changes in our business, the industry in which we operate and the general economy; |
20
| • | potentially increasing the cost of any additional financing; and |
| • | limiting the ability of our project operating subsidiaries to pay dividends to us for working capital or return on our investment. |
In addition, our borrowings under certain project-specific financing arrangement have floating rates of interest. Therefore, an increase or decrease in interest rates will increase or decrease our interest expense associated with such borrowing. A significant increase in interest expense could have an adverse effect on our business, financial condition, results of operations and cash flows impacting our ability to meet our payment obligations under our debt.
Any of these factors and other consequences that may result from our substantial indebtedness could have an adverse effect on our business, financial condition, results of operations and cash flows impacting our ability to meet our payment obligations under our debt. Our ability to meet our payment obligations under our outstanding debt depends on our ability to generate significant cash flow in the future. This, to some extent, is subject to general economic, financial, competitive, legislative and regulatory factors as well as other factors that are beyond our control. In addition, US$850.0 million of our debt is in the form of Green Solar bonds, which may be subject to refinancing risk, when they become due, as market conditions may not be possible to refinance the bonds at all or to refinance the bonds on favorable terms. In addition, our hedges on these bonds are covered up to INR 90.0/US$ and INR 93.0/US$ for the US$ 500.0 million and US$ 350.0 million bonds, respectively, which may expose us to additional hedging costs in the future. There has been a rating downgrade of the Government of India by Moody’s during June’2020. In case there is a negative outlook for the Government of India, it may make global access to funds difficult.
In addition, US$500.0 million of our debt in form of solar green bonds are due for refinancing in fiscal 2023. We are unable to make any assurance that we will be able to refinance these solar green bonds or refinance the bonds on favorable terms.
The Interest rates under our credit facilities may be adjusted for the phase-out of LIBOR
LIBOR, the London Interbank Offered Rate, is the rate of interest used in lending between banks on the London interbank market and is widely used as a reference for setting the interest rates on loans globally. We generally use LIBOR as a reference rate to calculate interest rates under our credit facilities. In 2017, the United Kingdom’s Financial Conduct Authority, which regulated LIBOR, announced that it intends to phase out LIBOR by the end of 2021. The U.S. Federal Reserve, in conjunction with the Alternative Reference Rates Committee, a steering committee comprised of large U.S. financial institutions, is considering replacing LIBOR with a new index, the Secured Overnight Financing Rate (SOFR), calculated using short-term repurchase agreements backed by Treasury securities. SOFR may be more volatile than LIBOR. If LIBOR ceases to exist, we may need to renegotiate our credit agreements to replace LIBOR, and the interest rates under certain of our credit agreements may change. The new rates may not be as favorable to us as those currently in effect. We may also find it desirable to engage in more frequent interest rate hedging transactions.
Our growth prospects and future profitability depend to a significant extent on global liquidity and the availability of additional funding options with acceptable terms.
We require a significant amount of cash to fund the installation and construction of our projects and other aspects of our operations, and expect to incur additional borrowings in the future, as our business and operations grow. We may also require additional cash due to changing business conditions or other future developments, including any investments or acquisitions we may decide to pursue in order to remain competitive.
Historically, we have used loans, equity contributions, and government subsidies to fund our project development. We expect to expand our business with proceeds from third-party financing options, including any bank loans, equity partners, financial leases and securitization. However, we cannot guarantee that we will be successful in
21
locating additional suitable sources of financing in the time periods required or at all, or on terms or at costs that we find attractive or acceptable, which may render it impossible for us to fully execute our growth plan. In addition, rising interest rates could adversely impact our ability to secure financing on favorable terms. In addition, a global or domestic economic crisis such as the current crises related to the COVID-19 pandemic, can cause a global or domestic recession or could adversely impact our ability to secure financing on favorable terms. Exchange rate fluctuations impact our ability to import capital goods as per the budget cost or on favorable terms. For a full discussion of the risks to our business associated with the COVID-19 pandemic, see “Risks to our Business related to the COVID-19 pandemic”.
Installing and constructing solar projects requires significant upfront capital expenditure and there may be a significant delay before we can recoup our investments through the long-term recurring revenue of our solar projects. Our ability to obtain external financing is subject to a number of uncertainties, including:
| • | our future financial condition, results of operations and cash flows; |
| • | the general condition of global equity and debt capital markets; |
| • | our credit ratings and past credit history; |
| • | the prevailing exchange rate of Indian rupee against major currencies, in particular, the U.S. dollar; |
| • | regulatory and government support in the form of tax incentives, preferential tariffs, project cost subsidies and other incentives; |
| • | the continued confidence of banks and other financial institutions in Azure Power and the solar power industry; |
| • | economic, political and other conditions in the jurisdictions where we operate; and |
| • | our ability to comply with any financial covenants under our debt financing. |
Any additional equity financing may be dilutive to our Company’s shareholders and any debt financing may contain restrictive covenants that limit our flexibility going forward. Furthermore, our credit ratings may be downgraded, which would adversely affect our ability to refinance debt and increase our cost of borrowing. Failure to manage discretionary spending and raise additional capital or debt financing as required may adversely impact our ability to achieve our intended business objectives.
If we fail to comply with financial and other covenants under our loan agreements, our financial condition, results of operations, cash flows and business prospects may be materially and adversely affected.
We expect to continue to finance a significant portion of our project development and construction costs with project financing. The agreements with respect to our existing project-level indebtedness contain financial and other covenants that require us to maintain certain financial ratios or impose certain restrictions on the disposition of our assets or the conduct of our business. In addition, we typically pledge our solar project assets or accounts or trade receivables, and in certain cases, shares of the special purpose vehicles, to raise debt financing, and we are restricted from creating additional security over our assets. Such accounts or trade receivables generally includes all income generated from the sale of electricity in the solar projects.
Our financing agreements also include certain restrictive covenants whereby we may be required to obtain approval from our lenders to, among other things, incur additional debt, undertake guarantee obligations, enter into any scheme of merger, amalgamation, compromise, demerger or reconstruction, change our capital structure and controlling interest, dispose of or sell assets, transfer shares held by major shareholders to third parties, invest by way of share capital, lend and advance funds, make payments, declare dividends in the event of any default in repayment of debts or failure to maintain financial ratios, place deposits and change our management structure. Most of our lenders
22
also impose significant restrictions in relation to our solar projects, under the terms of the relevant project loans taken by our respective subsidiaries. For example, we are required to obtain lenders’ consent to make any changes to, or terminate, project documents, waive any material claims or defaults under the project documents, make any changes to financing plans relating to our projects, and replace suppliers or other material project participants. There can be no assurance that such consent will be granted in a timely manner, or at all. In the event that such lender consents are granted, they may impose certain additional conditions on us, which may limit our operational flexibility or subject us to increased scrutiny by the relevant lenders. The time required to secure consents may hinder us from taking advantage of a dynamic market environment. These agreements also grant certain lenders the right to appoint nominee directors on the Board of Directors of AZI or its subsidiaries and require us to maintain certain ratings or other levels of credit worthiness. If we breach any financial or other covenants contained in any of our financing arrangements, we may be required to immediately repay our borrowings either in whole or in part, together with any related costs.
Our failure to comply with financial or restrictive covenants or periodic reporting requirements or to obtain our lenders’ consent to take restricted actions in a timely manner or at all may result in the declaration of an event of default by one or more of our lenders, which may accelerate repayment of the relevant loans or trigger cross defaults under other financing agreements. We cannot assure you that, in the event of any such acceleration or cross-default, we will have sufficient resources to repay these borrowings. Failure to meet our obligations under the debt financing agreements could have an adverse effect on our cash flows, business and results of operations. Furthermore, a breach of those financial and other covenants or a failure to meet certain financial ratios under these financing agreements could also restrict our ability to pay dividends.
We have issued two Solar Green Bonds, consisting of 5.65% Solar Green Bonds for US$ 350.0 million in September 2019 and 5.5% Solar Green Bonds for US$ 500.0 million in August 2017, collectively (“the Green Bonds”). If we are unable to comply with the covenants as per the Green Bond indentures, or future debt obligations and other agreements, there could be a default under the terms of these agreements. In the event of a default under these agreements, the holders of the debt could accelerate repayment of the principal and interest accrued on the outstanding debt and declare all outstanding amounts due and payable or terminate the agreements, as the case may be. Furthermore, some of our debt agreements, including the Indenture for the green bonds, contain cross-acceleration provisions. As a result, our default under one debt agreement may cause the acceleration of repayment of not only such debt but also other debt, result in a default under our other debt agreements, increase pricing of loans or lender’s holding debt disbursement. If any of these events occur, our assets and cash flow may not be sufficient to repay in full all of our indebtedness, and we may not be able to find alternative financing on terms that are favorable or acceptable to us.
We may not be able to successfully complete its Rooftop asset sale entered into subsequent to March 2021 and may not complete other asset sales or complete such asset sales at the prices that we desire.
To optimize cost and to enhance returns on invested capital, in Fiscal 2021, we had decided to sell off certain subsidiaries on a going concern basis, which currently form part of our Rooftop business. Out of this identified portfolio, subsequent to March 2021, we entered a sales contract (the “Rooftop Sale Agreement”) with Radiance Renewables Pvt. Ltd. (“Radiance”) to sell certain subsidiaries (the “Rooftop Subsidiaries”) having an operating capacity of 153 MW, for INR 5,350 million (US$ 73.1 million), subject to certain purchase price adjustments. Pursuant to the Rooftop Sale Agreement, Radiance will acquire 100% of the equity ownership of the Rooftop Subsidiaries owned by the Company’s subsidiaries Azure Power India Pvt. Ltd. and Azure Power Rooftop Pvt. Ltd, as more fully described below.
The sale of Rooftop Subsidiaries having 94.4 MWs operating capacity is expected to be consummated within the next 12 months and accordingly the assets and related liabilities of these subsidiaries are shown as “Assets classified as held for sale” in our consolidated balance sheet as of March 31, 2021. We recognized an impairment loss of INR 2,498 million (US$ 34.1 million) in our Consolidated Statement of Operations in this regard.
23
Further, under the terms of our Rooftop Sale Agreement with Radiance, 48.6% of the equity ownership in the 43.2 MWs operating capacity will be transferred to Radiance within next 12 months, and pursuant to the terms of the Green Bond Indentures, the remaining 51.4% may only be transferred to Radiance after our obligations under our Green Bonds are satisfied or such Green Bonds are refinanced. All of the cash flows related to such 43.2 MWs will continue to service our Green Bond obligations until the remaining 51.4% equity ownership in the 43.2 MWs is transferred to Radiance. As the refinancing of our Green Bonds is not anticipated to occur within 12 months, the assets and liabilities of these subsidiaries are not presented as “Assets classified as held for sale” and instead continue to be classified within the respective balance sheet captions as of March 31, 2021. In the event transference does not occur, we must reimburse Radiance the equity value of the assets not transferred along with an 10.5% per annum equity return, which could have a material adverse effect on our financial condition, results of operations and cash flows. Based on management’s assessment the above sale transactions are probable over the period defined in the agreement.
There is also a restriction on transfer of equity ownership relating to the 16 MW project with Delhi Jal Board (DJB), wherein 49% of the equity ownership will be transferred to Radiance by the closing date with in next 12 months, and the remaining 51% will be transferred on or after March 31, 2024. Accordingly, the related assets and liabilities of the DJB 16 MW project are not presented as “Assets classified as held for sale” and instead continue to be classified within the respective balance sheet captions as of March 31, 2021.
We determined that the decision to sell the Rooftop Subsidiaries and the subsequent execution of the Rooftop Sale Agreement are indicators of impairment, and therefore, we undertook an impairment assessment for the Rooftop Subsidiaries. Management used the sale price in the Rooftop Sale Agreement as our best estimate of the recoverable value of the Rooftop Subsidiaries. The impairment loss recorded in relation to the Property, Plant and Equipment of the Rooftop Subsidiaries not shown as “Assets classified as held for sale” was INR 657 (US$ 9.0 million).
The Company has further identified a subsidiary for sale, on a going concern basis at expected consideration of INR 123 million (US$ 1.7 million). Subsequent to year end, Company has entered into a sale agreement with buyer and pursuant there to, 100% of the ownership of this subsidiary was transferred to the buyer on receipt of consideration. The Company has recognized an impairment loss of INR 100 million (US$ 1.4 million) in the Consolidated Statement of Operations in this respect.
We recognized an impairment loss in relation to the rooftop subsidiaries aggregating to INR 3,255 million (US$ 44.5 million) during the fiscal year ended March 31, 2021 on account of the sale of the Rooftop Subsidiaries.
In addition, we may sell other assets when suitable opportunities arise to recycle capital for future growth. However, our ability to consummate divestitures is subject to various risks and uncertainties, including:
| | |
| • | failure to identify suitable investors and reach agreement on commercially reasonable terms; |
| • | failure to obtain regulatory approvals and third-party (lenders, offtakers etc.) consents necessary to consummate the proposed divestiture; and |
| • | other companies may provide similar assets depressing valuations for the targeted assets. |
We are not profitable in the current fiscal year, previous fiscal year or past several fiscal years and we may not be able to continue to be profitable in the foreseeable future.
We have incurred losses since our inception. Although we had a net profit for the fiscal year ended March 31, 2019, we were not profitable in the current fiscal year ended March 31, 2021, previous fiscal year ended March 31, 2020 or for the fiscal years prior to the fiscal year ended March 31, 2019. During the fiscal year ended March 31, 2020 and March 31, 2021, we had a net loss of INR 2,337 million and INR 4,201 million (US$ 57.2 million), respectively and we may not be profitable in future periods. In addition, our costs may increase in the future, reducing our margins for our significant future investment in renewable projects.
24
A significant number of power projects are presently Contracted and under construction, and we may be only able to monetize them, if at all, after each project is completed, which is subject to several factors, including receiving regulatory approvals, obtaining project funding, entering into transmission arrangements with the central or state transmission utilities, and acquiring land for projects. In addition, even after a project is operational, the monetization process may be quite long term with contracts running up to 25 years. Moreover, we may not succeed in addressing certain risks, including our ability to successfully develop or supervise the commissioning, operations and maintenance of our projects or maintain adequate control of our costs and expenses. Also, we may find that our growth plans are costlier than we anticipate and that they do not ultimately result in commensurate increases in revenue. Our results of operations will depend upon numerous factors, some of which are beyond our control, including the availability of other subsidies, global liquidity and competition. In addition, the global crisis due to the COVID-19 pandemic, could hamper growth, increase our costs, and may result in losses. As a result, we may not be profitable in the foreseeable future. For a full discussion of the risks to our business associated with the COVID-19 pandemic, see “Risks to our Business related to the COVID-19 pandemic”.
For instance, to optimize cost and to enhance returns on invested capital, in Fiscal 2021, we identified certain subsidiaries to sell off on a going concern basis which currently form part of our Rooftop business. Out of this identified portfolio, subsequent to March 2021, we entered a sales contract with Radiance to the Rooftop Subsidiaries having an operating capacity of 153 MW for INR 5,350 million (US$ 73.1 million), subject to certain purchase price adjustments. We reported a loss of INR 2,598 million (US$ 35.5 million) on assets classified as held for sale, which is reported separately in our Consolidated Statement of Operations and related assets (net) are reported at their fair value. Further, we also recognized an impairment loss of INR 657 million (US$ 9.0 million) in relation to the Property, Plant and Equipment of the Rooftop Subsidiaries not shown as “Assets classified as held for sale”, which are expected to be settled beyond 12 months after March 31, 2021. For detailed information relating to loss on rooftop business sale, see “Our Company may not be able to successfully complete its Rooftop asset sale entered into in March 2021 and may not complete other asset sales or at the price that we desire”.
We face uncertainties in our ability to acquire the rights to develop and generate power from new solar projects due to highly competitive PPA auctions and possible changes in the auction process.
We acquire the rights to develop and generate power from new projects through a competitive bidding process, in which we compete for project awards based on, among other things, pricing, technical and engineering expertise, financial conditions, including specified minimum net worth criteria, availability of land, financing capabilities and track record. The bidding and selection processes are also affected by a number of factors, including factors which may be beyond our control, such as market conditions or government incentive programs. If we misjudge our competitiveness when submitting our bids or if we fail to lower our costs to submit competitive bids, we may not acquire the rights on new solar projects. Furthermore, we have expected prices for system components to decline as part of our bidding process, and if that does not occur, our project economics may be harmed, and we may not remain economically viable.
In addition, rules of the auction process may change. Each state in India has its own regulatory framework and several states have their own renewable energy policy. The rules governing the various regional power markets may change from time to time, in some cases, in a way that is contrary to our interests and adverse to our financial returns. For example, most national auctions currently use the reverse auction structure, in which several winners take part in the same project. There can be no assurance that the central and state governments will continue to allow us to utilize such bidding structures and any shift away from the current structures, such as to a Dutch auction, could increase the competition and adversely affect our business, results of operations and cash flows.
For information on the risk of not executing PPAs in respect of our 4GW manufacturing linked tender, see “We may not be able to sign PPAs in respect of the 4 GWs manufacturing linked tender for which a letter of award has been received.”
25
We face significant competition from traditional and renewable energy companies.
We face significant competition in the markets in which we operate. Our primary competitors are local and international developers and operators of solar projects and other renewable energy sources. We also compete with utilities generating power from conventional fossil fuels. Recent deregulation of the Indian power sector and increased private sector investment have intensified the competition we face. The Electricity Act, 2003, or the Electricity Act, removed certain licensing requirements for power generation companies, provided for open access to transmission and distribution networks and also facilitated additional capacity through captive power projects. These reforms provide opportunities for increased private sector participation in power generation. Specifically, the open access reform enables private power generators to sell power directly to distribution companies and, ultimately, to the end consumers, enhancing the financial viability of private investment in power generation. Competitive bidding for power procurement further increases competition among power generators and there have been bids that were less than INR 2.00 per kWh, almost 20% lower than our lowest PPA. Furthermore, given the decline in electricity demand in India including due to COVID-19, there could potentially be surplus power capacity. We cannot assure you that we will be able to compete effectively, and our failure to do so could result in an adverse effect on our business, results of operations and cash flows.
Furthermore, our competitors may have greater operational, financial, technical, management or other resources than we do and may be able to achieve better economies of scale and lower cost of capital, allowing them to bid in the same auction at more competitive rates. Our competitors may also have a more effective or established localized business presence or a greater willingness or ability to operate with little or no operating margins for sustained periods of time. Our market position depends on our financing, development and operation capabilities, reputation and track record. Any increase in competition during the bidding process or reduction in our competitive capabilities could have a significant adverse impact on our market share and on the margins, we generate from our projects.
Our competitors may also enter into strategic alliances or form affiliates with other competitors to our detriment. As our competitors grow in scale, they may establish in-house engineering, procurement and construction (“EPC”), and O&M capabilities, which may offset a current advantage we may have over them. Moreover, suppliers or contractors may merge with our competitors which may limit our choices of suppliers or contractors and hence the flexibility of our overall project execution capabilities. For example, some of our competitors may have their own internal solar panel manufacturing capabilities. As the renewable energy industry grows and evolves, we may also face new competitors who are not currently in the market. There can be no assurance that our current or potential competitors will not win bids for projects or offer services comparable or superior to those that we offer at the same or lower prices or adapt to market demand more quickly than we do. Increased competition may result in price reductions, reduced profit margins and loss of market share.
In addition, we face competition from developers of other renewable energy facilities, including biomass and nuclear , as well as other forms of renewable electricity generation. Competition from such producers may increase if the technology used to generate electricity from these other renewable energy sources becomes more sophisticated, or if the Indian government elects to further strengthen its support of such renewable energy sources. As we also compete with utilities generating power from conventional fossil fuels, a reduction in the price of coal or diesel would make the development of solar energy less economically attractive and we would be at a competitive disadvantage. Hence, we cannot guarantee that some of our competitors do not or will not have advantages over us in terms of larger size, internal access to solar panels and greater operational, financial, technical, management, lower cost of capital or other resources. For example, French state-controlled energy group, Electricité de France (EDF) has made a binding offer to build six third-generation European Pressurised Reactor (EPR) nuclear reactors at Jaitapur in Maharashtra, which will be “world’s most powerful” nuclear plant in India. On April 22, 2021, EDF submitted to the Nuclear Power Corporation of India (NPCIL), the offer to supply engineering studies and equipment for the construction of six, third-generation EPR reactors at the Jaitapur in Maharashtra. The project once completed will produce 10 gigawatts (GW) of electricity enough to power 70 million Indian households. Considering, the Indian Government’s commitment to grow India’s nuclear power capacity as part of its infrastructure development programme a shift of
26
focus to other sources of renewable energy in future years may adversely impact our ability to achieve our intended business objectives.
We face significant risk of curtailment/refusal to take electricity by DISCOMs.
Certain DISCOMs have been curtailing/refusing to take electricity from renewable electricity generation companies on the pretext of grid security whereas during the same duration they are buying cheap electricity from conventional sources. In this regard, we have experienced such curtailments in our Andhra Pradesh projects. We have challenged these curtailments and have filed a petition in Andhra Pradesh Electricity Regulatory Commission which is currently pending adjudication. We have also filed a contempt petition on illegal curtailment in the Andhra Pradesh High Court since the single judge had in its order dated September 24, 2019 stated that curtailment should happen only upon prior notice and only for reasons strong and germane. Our contempt petition is pending adjudication.
Further, in respect of our 222 MWs capacity projects in Punjab, our offtaker Punjab State Power Corporation Limited (PSPCL) had refused to accept power generated from these projects in the first week of April 2020 on account of COVID-19. Further, PSPCL had also deducted 5% of billed amount relating to the months of April-June 2020. We filed a petition before Punjab State Electricity Regulatory Commission (PSERC) through the Solar Power Developer Association against the same. The matter is currently pending with the appellant authority. However, we cannot provide assurances that such proceedings will ultimately be decided in our favor.
Any constraints in the availability of the electricity grid, including our inability to obtain access to transmission lines in a timely and cost-efficient manner could adversely affect our business, results of operations and cash flows.
Delivering power to our power purchasing customer is our responsibility. We generally rely on transmission lines and other transmission and distribution facilities that are owned and operated by transmission or distribution utilities. Where we do not have access to available transmission and distribution networks, we may engage contractors to build transmission lines and other related infrastructure. In such a case, we will be exposed to additional costs and risks associated with developing transmission lines and other related infrastructure, such as the ability to obtain right of way from land owners for the construction of our transmission lines, which may delay and increase the costs of our projects. We may not be able to secure access to the available transmission and distribution networks at reasonable prices, in a timely manner or at all.
In addition, India’s physical infrastructure, including its electricity grid, is less developed than that of many developed countries. As a result of grid constraints, such as grid congestion and restrictions on transmission capacity of the grid, the transmission and dispatch of the full output of our projects may be curtailed. We may have to stop producing electricity during the period when electricity cannot be transmitted. Such events could reduce the net power generation of our projects. If construction of renewable energy projects outpaces transmission capacity of electricity grids, we may be dependent on the construction and upgrade of grid infrastructure by the transmission utilities. We cannot assure you that the relevant Transmission utilities will do so in a timely manner, or at all. The curtailment of our power projects’ output levels will reduce our electricity output and limit operational efficiencies, which in turn could have an adverse effect on our business, results of operations and cash flows.
There are a limited number of strong credit purchasers of utility scale quantities of electricity which exposes us, and our utility scale projects to risk.
In fiscal year 2020 and 2021, we derived 72.2% and 71.5%, respectively, of our revenue from our top five customers. Since the transmission and distribution of electricity are either monopolized or highly concentrated in most jurisdictions, there are a limited number of possible purchasers for utility scale quantities of electricity in a given geographic location, including transmission grid operators and central and state-run utilities. For instance, for projects established pursuant to the NSM, solar project developers are required to enter into PPAs with specified implementation agencies/DISCOMs. As a result, there is a concentrated pool of potential buyers for electricity generated by our plants and projects, which may restrict our ability to negotiate favorable terms under new PPAs and could impact our ability to find new customers for the electricity generated by our generation facilities should this become necessary.
27
Furthermore, if the financial condition of these utilities and/or power purchasers deteriorate or the NSM or other solar policy to which they are currently subject and that compel them to source renewable energy supplies change, demand for electricity produced by our plants could be negatively impacted.
Land title in India can be uncertain and we may not be able to identify or correct defects or irregularities in title of the landowner in respect of the land which we own, lease or intend to acquire in connection with the development or acquisition of our power projects. Additionally, certain land on which our power projects are located may be subject to onerous conditions which may adversely affect its use.
There is no central title registry for real property in India and the documentation of land records in India has not been fully computerized. Property records in India are generally maintained at the state and district level and in local languages and are updated manually through physical records. Therefore, property records may not be available online for inspection or updated in a timely manner, may be illegible, untraceable, incomplete or inaccurate in certain respects, or may have been kept in poor condition, which may impede title investigations or our ability to rely on such property records. In addition, there may be a discrepancy between the duration of the principal lease under different orders issued by state governments in respect of a particular parcel of revenue land. Furthermore, title to land in India is often fragmented, and in many cases, land may have multiple owners. Title may also suffer from irregularities, such as non-execution or non-registration of conveyance deeds and inadequate stamping and may be subjected to encumbrances of which we are unaware. Any defects in, or irregularities of, title may result in a loss of development or operating rights over the land, which may prejudice the success of our power projects and require us to write off substantial expenditures in respect of our power projects.
A portion of land leased from the government of Rajasthan for our projects in Nagaur, Rajasthan, is presently disputed by third parties claiming mining rights through the Mining Department of the State of Rajasthan. We had filed a petition with the High Court of Rajasthan to disallow the renewal of such mining lease and the High Court of Rajasthan had issued an injunction over the alleged claims on this land for mining. Further, the lease for our Andhra Pradesh 3 project is pending completion of formalities for development of the land. Currently, we are also facing multiple land related civil disputes in our Assam project, although procurement of land under the same has been made entirely as per the set procedures of law by registered title deeds in our favor and there is no restraining order from any court on completion of the project.
In addition, in March 2021, a civil suit was filed against us in relation to certain land parcels admeasuring around 8 acres of undivided land parcel of 47 acres (the entire land of 47 acres is referred to as “Suit land”) out of around 3,300 acres of land for our SECI 600MW solar project in Rajasthan (the “Rajasthan 600MW Project”). We have partially commissioned the project and are in the final stages of commissioning the remaining MWs. An Indian district court had issued a temporary restraining order in the civil suit requiring that status quo be maintained on the entire Suit Land. In the appeal filed by us against the said order, the high court has permitted us to undertake work on the land and has set aside the finding of the district court prohibiting undertaking work on the entire Suit Land, however, has asked us to maintain status quo only on 7.80 acres of land. If this order is further contested and we are unsuccessful in any subsequent appeal, it may adversely affect our business and results of operations. Further, in June 2021, a report was filed with a local police department making allegations against certain members of our management for trespass on the Suit Land. The said members of the management had taken appropriate legal actions to contest this report before the High Court. The High Court has disposed of the matter by taking on record the statement of the public prosecutor that a case closure report has been filed.
In addition, improperly executed, unregistered or insufficiently stamped conveyance instruments in a property’s chain of title, unregistered encumbrances in favor of third parties, rights of adverse possessors, ownership claims of family members of prior owners or third parties, or other defects that a purchaser may not be aware of can affect title to a property. As a result, potential disputes or claims over title to the land on which our power projects are or will be constructed may arise. However, an adverse decision from a court or the absence of an agreement with such third parties may result in additional costs and delays in the construction and operating phases of any solar projects situated on such land. Also, such disputes, whether resolved in our favor or not, may divert management’s attention, incur extra-legal cost, harm our reputation or otherwise disrupt our business. For instance, we have filed civil suits in UP and Gujarat seeking directions from the court to the counterparty to execute Sale Deeds in our favor.
28
Further, some properties used for our solar projects are subject to other third-party rights such as right of passage and rights to place cables and other equipment on the properties, which may result in certain interferences with our use of the properties. Our rights to the properties used for our solar projects may be challenged by property owners and other third parties for various other reasons as well. Any such challenge, if successful, could impair the development or operations of our solar projects on such properties.
In the case of land acquired from private parties, which may be agricultural land, the transfer of such land from agricultural to non-agricultural and the use of such land for non-agricultural purposes may require an order from the concerned state or revenue authority allowing such transfer or use. For instance, for our Gujarat 2 projects, we are awaiting approval for use of land for industrial/non-agricultural purposes. Similarly, for revenue land, we obtain a lease from the relevant government authority with some restrictions with it.
Additionally, the power projects that we may develop or acquire in the future may be located on land that may be subject to onerous conditions under the lease agreements through which we acquire rights to use such land and rights of way. Furthermore, the government may exercise its rights of eminent domain, or compulsory acquisition in respect of land on which our projects are or will be located. Any of this may adversely affect our business, results of operations and cash flows in the future.
A certain portion of the land on which our renewable energy projects are or will be located, are not owned by us. In the event we are unable to purchase the land, or enter into or renew lease agreements, our business, results of operations, cash flows and financial condition could be adversely affected.
Some of our solar projects are located, or will be located, on land that is owned by the state governments or on land acquired/leased or to be acquired/leased from private parties. The timeline for transfer of title in the land is dependent on the type of land on which the power projects are, or will be, located, and the policies of the relevant state government in which such land is located.
We cannot assure you that the outstanding approvals would be received, or that lease or sub-lease deeds would be executed in a timely manner, such that the operation of our solar projects will continue unaffected. Further, the terms of lease and sub-lease agreements may also not be co-terminus with the lifetime of the power projects, taken together with the period of time required for construction and commissioning of the project. Accordingly, we will have to obtain extensions of the terms of such leases and sub-leases for the remainder of the terms of the corresponding PPAs. In the event, that the relevant state authorities/ private parties do not wish to renew the lease or sub-lease agreements, we may be forced to remove our equipment at the end of the lease, and we may not be able to find an alternative location in the short term or at all. Any of the foregoing factors could lead to a material adverse effect on our business, results of operations, cash flows and financial condition.
29
If we are unsuccessful in our efforts to establish and/or maintain our compliance with the local content requirements in certain states, our financial results could be adversely affected.
In some cases, we are required by the central government in national auctions to procure solar panels solely from Indian manufacturers. Certain states or others may, in the future, require us to procure a defined portion of our solar system components from their designated geographical locales. Such requirements are commonly referred to as “local content requirements.” In order to satisfy these local content requirements, we may need to undertake localization initiatives in such geographical locale. Some of our competitors with more significant capital resources may implement or expedite their own localization efforts in these geographical locales, and those efforts may result in competitive advantages for them. We may be faced with shortages or quality issues if projects we bid on impose local content requirements. Our costs may also be higher as a result of these requirements. Our failure to successfully implement appropriate localization initiatives, or otherwise acquire and maintain the capability to satisfy applicable local content requirements, could result in our losing business to our competitors and/or our breaching the terms of agreements, potentially resulting in damages, including monetary penalties. Depending on the value to us of lost business or the amounts of any contractual penalties, these consequences could have a material adverse effect on our results of operations and cash flows.
Construction and operation of power generation facilities involves significant environmental risks and hazards that could be materially adverse to our business, financial condition, results of operations and cash flows. We may not have adequate insurance to cover these risks and hazards.
Construction and generation of power from solar power generation facilities and plants involves the use of large tracts of land. Although the Company undertakes to comply with all applicable laws including environmental laws, construction and generation of solar power risks contamination of, or damage to the environment. In addition, power generation involves hazardous activities, including delivering electricity to transmission and distribution systems. Natural risks such as earthquake, flood, lightning, hurricane and wind, other hazards, such as fire, structural collapse and machinery failure are inherent risks in our operations. These and other hazards can cause significant personal injury or loss of life, severe damage to and destruction of property, plant and equipment and contamination of, or damage to, the environment and suspension of operations. The occurrence of any one of these events may result in our being named as a defendant in lawsuits asserting claims for substantial damages, including for environmental cleanup costs, personal injury and property damage and fines and/or penalties. We maintain an amount of insurance protection that we consider adequate, but we cannot provide any assurance that our insurance will be sufficient or effective under all circumstances and against all hazards or liabilities to which we may be subject. Furthermore, our insurance coverage is subject to deductibles, caps, exclusions and other limitations. A loss for which we are not fully insured could be materially adverse to our business, financial condition, results of operations or cash flows. Further, due to rising insurance costs and changes in the insurance markets, we cannot provide any assurance that our insurance coverage will continue to be available at all or at rates or on terms similar to those presently available. Any losses not covered by insurance could have a material adverse effect on our business, financial condition, results of operations and cash flows.
Maintenance and expansion of power generation facilities involve significant risks that could result in reduced power generation and financial results.
Our facilities may require periodic upgrading and improvement. Any unexpected operational or mechanical failure, including failure associated with breakdowns and forced outages, and any decreased operational or management performance, could reduce our facilities’ generating capacity below expected levels and reduce our revenues as a result of generating and selling less power. Degradation of the performance of our projects above levels provided for in the related PPAs may also reduce our revenues. Unanticipated capital expenditures associated with maintaining, upgrading or repairing our facilities may also reduce profitability, especially because our costs are fixed in the PPAs and we may not be able to pass through any unexpected costs in relation to the projects to our customers. Furthermore, we are not able to mitigate such project risks by shifting some or all of the risk to a third-party EPC or O&M contractor since we provide most of these services in-house. A global crisis such as the recent COVID-19 pandemic has caused the lock downs ordered by the Ministry of Home Affairs, which had impacted the free movement
30
of goods and services. This had impacted some of our O&M activities, and adversely affected our revenues. For example, in case of our rooftop business, we were unable to get the access of various sites and in several cases, we faced delays in getting approval for site access. Due to this, our maintenance and power generation facilities were negatively which resulted in reduced power generation and adverse impact on financial results. This impact we may not be able to recover through insurance. If the situation worsens there could be a further adverse impact on our revenues.
Changes in technology may require us to make additional capital expenditures to upgrade our facilities. The development and implementation of such technology entails technical and business risks and significant costs of employee implementation.
Our ability to implement our strategy and our future success depend significantly on the continued service of our senior management team and our ability to attract, train and retain qualified personnel.
Our future success depends on the continued services and performances of the members of our management in our business for project implementations, management and running of our daily operations and the planning and execution of our business strategy. We depend on our experienced management team, and the loss of one or more key executives could have a negative impact on our business. We also depend on our ability to retain and motivate key employees and attract qualified new employees. Other than our Chief Executive Officer (“CEO”) and Chief Operating Officer (“COO”), none of our executive officers nor our key employees are bound by employment agreements for any specific term, and we may be unable to replace key members of our management team and key employees in the event we lose their services. There is intense competition for experienced management personnel with technical and industry expertise in the renewable energy business and if we lose the services of any of these individuals and are unable to find suitable replacements in a timely manner, our ability to realize our strategic objectives could be impaired. Integrating new employees into our management team could prove disruptive to our operations, require substantial resources and management attention and ultimately prove unsuccessful. An inability to attract and retain sufficient managerial personnel who have critical industry experience and relationships could limit or delay our strategic efforts, which could have a material adverse effect on our business, financial condition, results of operations and cash flows.
Fluctuations in foreign currency exchange rates may negatively affect our revenue, cost of sales and gross margins and could result in exchange losses.
As the functional currency of our Indian subsidiaries is the Indian rupee, our operating expenses are denominated primarily in Indian rupees. However, some of our capital expenditures, and particularly those for equipment imported from international suppliers, such as solar panels, are denominated in foreign currencies. To the extent that we are unable to match revenue received in our functional currency with costs paid in foreign currencies, exchange rate fluctuations in any such currency could have an adverse effect on our profitability. Substantially all of our cash flows are generated in Indian rupees and, therefore, significant changes in the value of the Indian rupee relative to the other foreign currencies could have a material adverse effect on our financial condition and our ability to meet interest and principal payments on debts. In addition to currency translation risks, we incur currency transaction risks whenever we or one of our projects enter into a purchase or sales transaction using a currency other than the Indian rupee. We expect our future capital expenditures in connection with our proposed expansion plans to include significant expenditures in foreign currencies for imported equipment and machinery.
A significant fluctuation in the Indian rupee to U.S. dollar or other foreign currency exchange rates therefore could have a significant impact on our results of operations. The exchange rate between the Indian rupee and these currencies, primarily the U.S. dollar, has fluctuated in the past and any appreciation or depreciation of the Indian rupee against these currencies can impact our profitability and results of operations. Our results of operations have been impacted by such fluctuations in the past and may be impacted by such fluctuations in the future. For example, the Indian rupee had depreciated against the U.S. dollar in four of the last five years, which may impact our results of operations in future periods. Such depreciation impacts the value of your investment. Furthermore, we have borrowings denominated in U.S. dollars and, as such, an annual decline in the Indian rupee against the U.S. dollar effectively adds to the functional interest rate of our borrowings and the INR equivalent needed to repay the
31
borrowings, when they fall due. Any amounts we spend in order to hedge the risks to our business due to fluctuations in currencies may not adequately hedge against any losses we incur due to such fluctuations. Further, depreciation of the Indian rupee to the U.S. dollar, could result an increase in foreign currency related transaction and translation losses.
The accounting treatment for many aspects of our solar projects is complex and any changes to the accounting interpretations or accounting rules governing our solar projects could have a material adverse effect on our U.S. GAAP reported results of operations and financial condition.
The accounting treatment for many aspects of our solar projects is complex, and our future results could be adversely affected by changes in the accounting treatment applicable to our solar projects. In particular, any changes to the accounting rules regarding the following matters may require us to change the manner in which we operate, finance and account for our solar projects:
| | | |
| • | foreign loans accounting; | |
| • | derivative contracts; | |
| • | asset retirement obligations; | |
| • | share based compensation including ESOPs, SARs and RSs; | |
| • | revenue recognition and related timing; | |
| • | accounting for convertible debt and equity instruments; | |
| • | income taxes; | |
| • | foreign holding company tax treatment; | |
| • | useful lives of project assets; | |
| • | government grants; | |
| • | leases; |
| • | estimated credit losses; and |
| • | investment in joint ventures/subsidiaries. |
Our international corporate structure and operations require us to comply with anti-corruption laws and regulations of the United States government and various non-U.S. jurisdictions. If we are not in compliance with applicable legal requirements, we may be subject to civil or criminal penalties and other remedial measures.
We are subject to the U.S. Foreign Corrupt Practices Act, or the FCPA, which prohibits, in relevant part, U.S. nationals, companies that have securities registered in the U.S. and any officer, director, employee, or agent of such issuer or any shareholder thereof acting on behalf of such issuer from bribing foreign officials for the purpose of obtaining or keeping business or otherwise obtaining favorable treatment and imposes obligations to keep accurate books and records and maintain appropriate internal controls. We have been and will continue to be subject to anti-corruption, anti-bribery and anti-facilitation payment legislation in other jurisdictions, which in certain circumstances go beyond the scope of the FCPA rules and regulations, including in India.
The current and future jurisdictions in which we operate our business may have experienced governmental corruption to some degree, and in certain circumstances, strict compliance with anti-bribery and anti-facilitation payment laws may conflict with local customs and practices, which is likely to negatively impact our results of operations. We have developed and implemented formal controls and procedures to ensure that we are in compliance with the FCPA as well as anti-corruption, anti-bribery and anti-facilitation payment laws. However, compliance with
32
these new controls and procedures could make it more difficult for us to obtain timely permits or otherwise complete our projects on schedule in jurisdictions where strict compliance with anti-corruption and anti-bribery laws may conflict with local customs and practices.
Any historic or future violations of these laws, regulations and procedures by our employees, independent contractors, subcontractors and agents could be costly and time-consuming to investigate and expose us to administrative, civil or criminal penalties or fines (including under U.S. and Indian laws and regulations as well as foreign laws). If we were to be investigated for, charged with, or convicted of, violating these laws and regulations, our reputation could be harmed and it could cause some of our investors to sell their interests in our company to be consistent with their internal investment policies or to avoid reputational damage, and some investors might forego the purchase of our equity shares, all of which may negatively impact the trading prices of our equity shares. In addition, any administrative, civil or criminal penalties or fines could have a material adverse effect on our business results of operations and cash flows.
We may become involved in costly and time-consuming litigation and other regulatory proceedings, which require significant attention from our management.
We may, in the ordinary course of our business, become involved in litigation, administrative or arbitral proceedings. For example, we are, and may become subject to additional demands from Indian governmental or tax authorities, including, but not limited to, on account of differing interpretations of central and state tax statutes in India, which are extensive and subject to change from time to time. Changes in regulations or tax policies, or adoption of differing interpretations of existing provisions, and enforcement thereof by governmental, taxation or judicial authorities in India may become the subject of legal proceedings involving us from time to time.
Additionally, claims may be brought against or by us from time to time regarding, for example, defective or incomplete work, defective products, personal injuries or deaths, damage to or destruction of property, breach of warranty, late completion of work, delayed payments, breach of module supply contracts, intellectual property rights or regulatory compliance labor issues, environmental issues and ownership rights. These claims may subject us to litigation, arbitration and other legal proceedings, which may be expensive, lengthy, disruptive to normal business operations and require significant attention from our management.
If we were found to be liable on any of the claims against us, we would incur a charge against earnings to the extent a reserve had not been established for coverage. If amounts ultimately realized from the claims by us were materially lower than the balances included in our financial statements, we would incur a charge against earnings to the extent profit had already been accrued. Charges and write-downs associated with such legal proceedings could have a material adverse effect on our financial condition, results of operations and cash flow. Moreover, legal proceedings, particularly those resulting in judgments or findings against us, may harm our reputation and competitiveness in the market.
For example, Gujarat Urja Vikas Nigam Limited had filed a petition with the Gujarat Electricity Regulatory Commission, seeking recalculation of the tariff under the PPA on the basis of actual cash flow required for development of solar projects and consequent revision of the tariff payable by it, in relation to certain solar power projects including our 10 MWs Gujarat 1 project. While the Gujarat Electricity Regulatory Commission and the Appellate Tribunal for Electricity dismissed the claims made by Gujarat Urja Vikas Nigam Limited, an appeal filed by Gujarat Urja Vikas Nigam Limited is pending before the Supreme Court of India. An unfavorable outcome in this appeal will result in significant cost to us.
Further, in Andhra Pradesh, on July 7, 2019, the Government of Andhra Pradesh vide an order set up a High-Level Negotiation Committee to revisit and review PPAs for solar and wind projects in the state of Andhra Pradesh with a view to reduce tariffs in these PPAs. A letter dated July 12, 2019, was issued by Andhra Pradesh Distribution Company to developers to reduce tariffs to INR 2.43 per unit for wind projects, and INR 2.44 per unit for solar projects from the date of commissioning and threatened termination of the PPA in the case of the refusal of the developers to accede to the reduction.
33
The developers challenged both the order and the letter in the High Court at Vijayawada. The High Court vide order dated September 24, 2019, set aside both the order and the letter and as an interim measure until the issue is decided by the APERC, directed the Andhra Pradesh Distribution Company to honor outstanding and future bills of the developers and pay at an interim rate of INR 2.43 and INR 2.44 per unit for wind and solar projects respectively. This above-mentioned Court order of single judge had been challenged in an appeal filed by the developers including Azure Power. The matter is listed for further hearing in the court and the matter adjourned in APERC till disposal of writ appeals before High Court at Vijayawada. An unfavorable outcome could potentially result in a significant expense to us. Further, other states might also violate binding contractual PPA tariffs following the unfavorable outcome.
Rising employee costs may harm our business and increase our operation costs.
As of March 31, 2021, we employed 471 persons to perform a variety of functions in our daily operations. Failure to obtain stable and dedicated employee support may cause disruption to our business that harms our operations. Furthermore, employee costs have increased in India in recent years and may continue to increase in the near future. To remain competitive, we may need to increase the salaries of our employees to attract and retain them. Our employee payroll and related costs (excluding SAR expense) amounted to INR 871 million, INR 864 million and INR 652 million (US$ 8.9 million) for the years ended March 31, 2019, 2020 and 2021, respectively. The SAR expense for the years ended March 31, 2020 and 2021 was 170 million and INR 1,319 million (US$ 18.0 million). Any abnormal increase in employee costs may harm our operating results, cash flows and financial condition. During fiscal 2021, there has been significant fluctuations to the trading price of our Company’s shares which impacted our Stock Appreciation Rights (SARs) expense. Any significant volatility in share price of our Company in future years may have impact on SARs expense, which could have an adverse impact on our financial condition, results of operations, and cash flows.
The COVID-19 pandemic and associated lockdowns and stay-at-home orders may impact the availability of skilled labor at a reasonable cost, as there have been mass movements of labor during the period. For a full discussion of the risks to our business associated with the COVID-19 pandemic, see “Risks to our Business related to the COVID-19 pandemic”.
Any damages caused by fraud or other misconduct by our employees could adversely affect our business, results of operations and financial condition.
We are exposed to operational risk arising from inadequacy or failure of internal processes or systems. In addition, we are exposed from risk associated with fraud or misconduct of our employees. In the past five fiscal years we have not experienced any fraud or misconduct by employees which has materially affected our business, results of operations or financial condition. However, we may not be safeguarded against all fraud or misconduct by employees or outsiders, unauthorized transactions by employees and operational errors. Employee or executive misconduct could also involve the improper use or disclosure of confidential information, data breach or other illegal acts, which could result in regulatory sanctions and reputational or financial harm, including harm to our brand. Our management information systems and internal control procedures are designed to monitor our operations and overall compliance. However, they may not be able to identify non-compliance and/or suspicious transactions in a timely manner or at all. In addition, certain internal control processes are carried out manually, which may increase the risk that human error, tampering or manipulation will result in losses that may be difficult to detect. For example, the Company has recently received complaints and several anonymous whistleblower reports, which made various claims against certain of the Company’s Key Managerial Personnel, related to their and the Company’s actions in relation to the acquisition of and use of land in Rajasthan, Assam, and Uttar Pradesh, as well as certain other corporate actions. The Company, through its Audit Committee, and with the assistance of external counsel and forensic auditors, has undertaken an investigation to determine whether the allegations made in the complaints or contained in the whistleblower reports are substantive. The investigation did not substantiate the allegations made in the complaints or contained in the whistleblower reports. Nevertheless, the Company has determined that a review of certain of its processes is required to ensure continued compliance with its internal policies and procedures.
34
Were our employees, including Key Managerial Personnel, to commit fraud or other misconduct, we may suffer monetary losses, including contractual liabilities and penalties, which may not be covered by our insurance and may thereby adversely affect our business, results of operations and financial condition.
Weaknesses, disruptions, failures of cyber security events in our IT systems could adversely impact our business.
We rely on IT systems in connection with financial controls, risk management and transaction processing. We may be subject to disruptions of our IT systems, arising from events that are wholly or partially beyond our control (for example, damage or incapacitation by human error, natural disasters, electrical or telecommunication outages, sabotage, computer viruses, or loss of support services from third parties such as internet backbone providers). We may also be subject to attempted hacking or phishing incidents. In the past five fiscal years, we have not had incidents of system failures, cyber-attacks and frauds, hacking, phishing, trojans and theft of data with a material adverse effect on our business, results of operations or financial condition. In the event we experience systems interruptions, errors, downtime, incidents of hacking, phishing, or breaches of our data security systems, this may give rise to deterioration in customer service and loss or liability to us and it may materially and adversely affect our reputation, business, results of operations and financial condition.
Further, we are dependent on various external vendors for certain elements of our operations and are exposed to the risk that external vendors or service providers may be unable to fulfil their contractual obligations to us (or will be subject to the same risk of operational errors by their respective employees) and the risk that their (or their vendors) business continuity and data security systems prove to be inadequate. If our external vendors or service providers fail to perform any of these functions, it could materially and adversely affect our business and results of operations.
We rely on the security of such platforms for the secure processing, storage and transmission of confidential information. Examples of significant cyber security events are unauthorized access, computer viruses, deceptive communications (phishing), ransom ware, malware or other malicious code or cyber-attack, catastrophic events, system failures and disruptions and other events that could have security consequences (each, a “Cyber Security Event”). A Cyber Security Event could materially impact our ability to adequately manage and value our loan portfolio, provide efficient and secure services to our customers, and regulators, and to timely and accurately report our financial results. Although we have implemented controls and have taken protective measures to reduce the risk of Cyber Security Events, we cannot reasonably anticipate or prevent rapidly evolving types of cyber-attacks and such measures may be insufficient to prevent a Cyber Security Event. Cyber Security Events could expose us to a risk of loss or misuse of our information, litigation, reputational damage, violations of applicable privacy and other laws, fines, penalties or losses that are either not insured against or not fully covered by insurance maintained. We may be required to expend significant additional resources to modify our protective measures or to investigate and remediate vulnerabilities. Further, in response to COVID-19, we had to modify our business practices with several of employees of the Company work remotely from their homes. Moreover, technology in employees’ homes may not be as robust as in our offices and could cause additional operational risk, especially including increased cybersecurity risk. For a full discussion of the risks to our business associated with the COVID-19 pandemic, see “Risks to our Business related to the COVID-19 pandemic”.
35
The global economy may be adversely affected by economic developments and major events in some markets.
The global financial and securities markets, and also the global economy, are influenced by economic and market conditions in some markets worldwide. The global economy may be influenced by shocks from some markets. Although economic conditions vary from country to country, investors’ reactions to events occurring in one country sometimes demonstrate a “contagion” effect in which an entire region or class of investment is avoided by international investors. Consequently, there can be no assurance that the global and India’s financial system and securities markets will not continue to be adversely affected by events in developed countries’ economies or events in other emerging markets, which could in turn, adversely affect the global and India’s economy and, indirectly, our business, financial condition and results of operations, and the market value of our equity shares. Furthermore, global events like the COVID-19 pandemic can materially impact the global economic conditions and reduce the flow of funds through equity or debt in India. For a full discussion of the risks to our business associated with the COVID-19 pandemic, see “Risks to our Business related to the COVID-19 pandemic”.
Our Company largest shareholder owns 50.36% of our Company, as of March 31, 2021 and may exercise control of our Company.
As of March 31, 2021, our Company’s largest shareholder CDPQ Infrastructures Asia Pte Ltd. (“CDPQ Infrastructures”), owned 50.36% of our Company’s equity shares. CDPQ Infrastructures is a company organized and existing under the laws of Singapore and is a wholly owned subsidiary of the Caisse de dépôt et placement du Québec, a body constituted by the Act Respecting the Caisse De Dépôt Et Placement Du Québec. Consequently, CDPQ Infrastructures has the ability to exercise control over our Company and may have the power to elect and remove the Directors and may determine the outcome proposals for corporate action requiring ordinary resolution of our Company’s equity shareholders. The interests of CDPQ Infrastructures, may be different from our interests or the interests of other shareholders of our Company. As a result, CDPQ Infrastructures, may delay or defer or initiate a change of control of our Company or a change in our capital structure, delay or defer a merger, sale of assets, or consolidation, or delay or defer the payment of dividends, or delay or defer fresh capital raise, or seek to determine or direct the price at which new capital is raised. At present, CDPQ Infrastructures has three nominee Directors on our Company’s Board of Directors.
We are subject to claims, arbitration claims and other legal proceedings pertaining to executive compensation or other stock-related matters in addition to other litigation in the ordinary course of business.
As further discussed under Item 8 of this Annual Report, we are involved in two arbitration proceedings concerning matters of executive compensation and stock purchase with former chief executive officer. Our Company and our subsidiary, Azure Power India Private Limited, are respondents in arbitration proceedings initiated by our former Chairman, CEO and Managing Director of our Company, Mr. Inderpreet Singh Wadhwa (“IW”) and erstwhile COO Mr. H.S Wadhwa (“HSW”), in relation to the purchase price of the shares of IW’s and HSW’s in Azure Power India Private Limited before Singapore International Arbitration Centre (SIAC). The arbitration has been concluded and the award is awaited. We believe in the merits of our case; however, an unfavorable outcome in these proceedings could potentially have a material adverse effect on our results of operations, cash flows and financial condition.
In addition, our Company and our subsidiary Azure Power India Private Limited are respondents to arbitration proceedings initiated by IW in relation to his transition agreement before the Mumbai Centre for International Arbitration (“MCIA”). The arbitration has been concluded and the award is awaited. We believe in the merits of our case; however, we cannot ensure the outcome of the proceedings. The claim could have an adverse impact on our results however, the amount is not material to our financial position.
In addition to the arbitration proceedings pertaining to executive compensation and the stock purchase, we are regularly involved in other litigation matters in the ordinary course of business. While we believe that these litigation matters should not have a material adverse impact on our business, financial condition, results of operations or future prospects, we may be unable to successfully defend or resolve any current or future litigation matters.
36
Risks Related to Operations in India
Substantially all of our business and operations are located in India and we are subject to regulatory, economic, social and political uncertainties in India.
Substantially all of our business and employees are located in India, and we intend to continue to develop and expand our business in India. Consequently, our financial performance will be affected by changes in exchange rates and controls, interest rates, changes in government policies, including taxation policies, social and civil unrest and other political, social and economic developments in or affecting India.
The Indian government has exercised and continues to exercise significant influence over many aspects of the Indian economy. The Indian governments have generally pursued policies of economic liberalization and financial sector reforms, including by significantly relaxing restrictions on the private sector. Nevertheless, the role of the Indian central and state governments in the Indian economy as producers, consumers and regulators has remained significant and we cannot assure you that such liberalization policies will continue. The rate of economic liberalization could change, and specific laws and policies affecting solar power producers, foreign investments, currency exchange rates and other matters affecting investments in India could change as well, including exposure to possible expropriation, nationalization or other governmental actions.
A significant change in India’s policy of economic liberalization and deregulation or any social or political uncertainties could significantly harm business and economic conditions in India generally and our business and prospects. Recently there have been ongoing mass protest by farmers, against three farm acts which were passed by the Parliament of India in September 2020. The introduction of the law caused protests in several parts of the country like Delhi, Haryana and Punjab. In case there are mass protests leading to civil unrest, such incidents could impact both our construction as well as operations and maintenance activities.
The extent and reliability of Indian infrastructure could significantly harm our results of operations, cash flows and financial conditions.
India’s physical infrastructure is less developed than that of many developed nations. Any congestion or disruption with respect to communication systems or any public facility, including transportation infrastructure, could disrupt our normal business activity. Any deterioration of India’s physical infrastructure would harm the national economy, disrupt the transportation of people, goods and supplies, and add costs to doing business in India. These disruptions could interrupt our business operations and significantly harm our results of operations, cash flows and financial condition. For the risk of congestion or disruption with respect to India’s electricity grid and transmission lines, see “— Risks Relating to Us and Our Industry — Any constraints in the availability of the electricity grid, including our inability to obtain access to transmission lines in a timely and cost-efficient manner, could adversely affect our business, results of operations and cash flows.” Further, on account of COVID-19, a number of Government and state government offices have not been operating at full capacity. Due to the COVID-19 crisis, there also may be a delay in the receipt of cash from the Government or state governments, which could potentially impact our operations and cash flows. Although, we have been successful in collecting a large part of our receivables so far, there can be no assurance that we will continue to successfully collect the receivables in the future. For a full discussion of the risks to our business associated with the COVID-19 pandemic, see “Risks to our Business related to the COVID-19 pandemic”.
A decline in India’s foreign exchange reserves may adversely affect liquidity and interest rates in the Indian economy.
According to the weekly statistical supplement of the Reserve Bank of India Bulletin, India’s foreign exchange reserves totalled US$ 579.3 billion as of March 26, 2021. A sharp decline in these reserves could result in reduced liquidity and higher interest rates in the Indian economy. Reduced liquidity or an increase in interest rates in the economy following a decline in foreign exchange reserves could have a material adverse effect on our financial performance and ability to obtain financing to fund our growth on favorable terms or at all.
37
A slowdown in economic growth in India could cause our business to suffer.
Since inception, all of our revenue has been derived directly from sales in India. The performance and growth of our business are necessarily dependent on economic conditions prevalent in India, which may be significantly harmed by political instability or regional conflicts, a general rise in interest rates, inflation and economic slowdown including due to COVID-19 elsewhere in the world or otherwise. The Indian economy also remains largely driven by the performance of the agriculture sector which depends on the quality of monsoon, which is difficult to predict. Although the Indian economy has continued to grow in the past few years, any future slowdown in the Indian economy or a further increase in inflation could have a material adverse effect on the demand for power and, as a result, on our financial condition, results of operations and cash flows.
India’s trade relationships with other countries and its trade deficit may significantly harm Indian economic conditions. If trade deficits increase or are no longer manageable, the Indian economy, and therefore our business and our financial performance could be significantly harmed.
India also faces major challenges in sustaining its growth, which include the need for substantial infrastructure development and improving access to healthcare and education. If India’s economic growth cannot be sustained or otherwise slows down significantly, our business and prospects could be significantly harmed.
Stringent labor laws may harm our ability to have flexible human resource policies and labor union problems could negatively affect our processing capacity, construction schedules, cash flows and overall profitability.
India has stringent labor legislation that protects the interests of workers, including legislation that sets forth detailed procedures for dispute resolution and employee removal, imposes financial obligations on employers upon employee layoffs and regulates contract labor. These laws may restrict our ability to have human resource policies that would allow us to react swiftly to the needs of our business, discharge employees or downsize. We may also experience labor unrest in the future, which may delay our construction schedules or disrupt our operations. If such delays or disruptions occur or continue for a prolonged period of time, our processing capacity and overall profitability could be negatively affected. We also depend on third party contract labor. It is possible under Indian law that we may be held responsible for wage payments to these laborers if their contractors’ default on payment. We may be held liable for any non-payment by contractors and any such order or direction from a court or any other regulatory authority may harm our business, results of our operations and cash flows.
Further during the current year, the Social Security Code, 2020 (“SS Code”) has been passed by the Parliament of India and also received Presidential assent on September 28, 2020. The SS Code has been enacted to amend and consolidate the laws relating to social security with the goal of extending social security to all employees and workers. However, due to second wave of COVID-19 pandemic, implementation of these labour reforms has been delayed and now are expected to be implemented in fiscal 2022. We are awaiting the issuance of final guidelines by central and state governments on the new SS code, we are under process of evaluating related impacts of these codes.
Foreign investment laws in India include certain restrictions, which may affect our future assets sales, acquisitions or investments in India.
India regulates ownership of Indian companies by non-residents, and although some restrictions on foreign investment have been relaxed in recent years others, such as investments from countries bordering India, have been subject to more regulation. Pursuant to the Consolidated Foreign Direct Investment Policy, 2020 (the “FDI Policy”), investments can be made by non-residents in Indian companies to the extent of the percentage of the total capital of the Indian company specified in the FDI Policy. At present, the FDI Policy permits 100% foreign direct investment in Indian companies engaged in the power sector. Under current Indian regulations, transfers of shares between non-residents and residents are permitted (subject to certain exceptions) if they comply with, among other things, the Foreign Exchange Management (Non-debt Instruments) Rules, 2019, as amended from time to time, in relation to pricing and valuation of such shares and certain reporting requirements for such transactions specified by the Reserve Bank of India. If the transfer of shares is not in compliance with such pricing guidelines or reporting requirements or falls under any of the exceptions specified by the Reserve Bank of India, the prior approval of the Reserve Bank of India will be required before any such transfer may be consummated. We may not be able to obtain any required approval from the Reserve Bank of India or any other Indian regulatory authority on any particular terms or at all.
38
For example, under the FDI policy, the Indian government provides additional requirements for foreign investments in India, including requirements with respect to downstream investments by Indian companies owned or controlled by non-resident entities and the transfer of ownership or control, from resident Indian persons or entities to non-residents, of Indian companies in sectors with limits on foreign investment. As substantially all of AZI’s and AZR’s equity shares are directly held by Azure Power Global Limited, it would be considered an entity owned and controlled by non-residents under applicable Indian laws. Accordingly, any downstream investment by AZI or AZR into another Indian company will have to be in compliance with conditions applicable to such Indian entity, in accordance with the FDI policy. In addition, there may be investors who may not be able to buy assets we wish to sell in future. There are guidelines in relation to pricing and valuation of shares and restrictions on sources of funding for such investments. While these guidelines currently do not materially limit our planned investments or asset sales in our Indian subsidiaries, to the extent they become more restrictive, they may restrict our ability to make further equity investments in India, including through Azure Power Global Limited.
Further, India’s Foreign Exchange Management Act, 1999, as amended, and the rules and regulations promulgated thereunder (“FEMA”) prohibit us from borrowing from our Indian subsidiaries. We are permitted to lend to our Indian subsidiaries subject to compliance with India’s policy on external commercial borrowings as notified by the Reserve Bank of India from time to time, which specifies certain conditions, including in relation to eligible lenders and borrowers, permitted end use and limits on the all-in-cost.
Our ability to raise foreign capital may be constrained by Indian law.
Our Indian subsidiaries are subject to exchange controls that regulate borrowing in foreign currencies. Such regulatory restrictions limit our financing sources and hence could constrain our ability to obtain financings on competitive terms and refinance existing indebtedness. In addition, we cannot assure you that the required approvals will be granted to us without onerous conditions, or at all. Limitations on raising foreign debt may have an adverse impact on our business growth, financial condition, results of operations and cash flows.
Imposition of anti-dumping, safeguard duties or basic custom duties on solar equipment imports may increase our costs and adversely impact our margins.
The Ministry of Finance of the Indian government imposed a 25% safeguard duty on import of solar panels from July 30, 2018 to July 29, 2019, which has been gradually lowered to 14.5% up to July 29, 2021 and nil after July 29, 2021. While certain solar power producers approached the High Court of Orissa and obtained an interim stay in July 2018, the Supreme Court of India overturned the stay order on September 11, 2018. Although the issue on the validity of the imposition of this safeguard duty is pending in Supreme Court of India, the safeguard duty continues to be in effect. The Ministry of Commerce and Industry issued a notification dated March 3, 2020, whereby the Director General, initiated a review investigation, for examining the need for continued imposition of safeguard duty on solar cells whether or not assembled in modules or panels. Further, vide notification dated July 29, 2020, the designated authority in its final findings has recommended continued imposition of the safeguard duty on imports of the subject goods, in order to remove injury to the domestic industry.
The Finance Act, 2020, enacted by the parliament of India, implemented a Basic Custom Duty on imports of solar cells and modules as a replacement for the safeguard duty. The Finance Act, 2020, levied a tax of 20% on the import of Solar Modules, which had been exempted for Solar Modules through till March 31, 2021. The MNRE post approval from Ministry of Finance, through its notification dated March 9, 2021, extended the exemption for Basic Custom Duty on solar cells and modules further up to March 31, 2022. Effective April 1, 2022, the Basic Custom Duty shall be levied on import of solar modules at the rate 40% and on solar cells at the rate of 25%. Further, the MNRE vide its notification, dated February 25, 2021, discontinued the benefit of concessional custom duty in respect of items imported for initial setting up of solar power projects with effect from February 2, 2021. Our PPAs typically contain change-in-law provisions which permit us to pass on such increases to our offtakers with an upward revision of tariff by obtaining an order to this effect from the relevant electricity regulatory commissions. We are in process of filing change-in-law petitions before relevant electricity regulatory commissions. However, we cannot assure you that the offtaker/ electricity regulatory commissions will revise relevant tariffs or allow lump sum payment along with late payment surcharge, sufficiently to cover our increased expenses from the tariffs. To the extent we are unable to pass on
39
the impact of the imposition of safeguard duty to our offtakers in part or in whole under any of our PPAs, our increased costs of purchase of solar panels could adversely affect our operating results, cash flows and financial condition.
Further, with the objective of building energy security for the country and ensuring reliability of Solar PV Cells and Modules, the MNRE had issued Order dated January 2, 2020, regarding an approved list of Models & Manufacturers (ALMM) for Solar PV cells & modules, providing for enlistment of models and manufacturers of solar PV cells and modules, complying with the BIS Standards. The ALMM Order stipulates that after effective date, all Solar PV Power Projects which are Government owned/Government assisted/bid out as per Central Govt’s Standard Bidding Guidelines, shall mandatorily procurer solar PV cells and modules for such projects from the manufacturers approved and included in the ALMM Lists after effective date. Considering the recommendations of a committee constituted to review the implementation of ALMM order and inspections reports submitted by National Institute of Solar Energy (NISE), the Minister for Power and New & Renewable Energy (NRE) has approved the ALMM list for Solar PV Modules and Manufacturers for Solar PV Modules. Accordingly, ALMM order in respect of Listed Modules shall be applicable on all such bids whose last date of bid submission is on or after April 10, 2021. Since most of our purchases are made from import vendors and because several of our existing module manufacturers may not be empaneled under ALMM, we may not be able to procure modules from foreign vendors for new project. Considering the same, we may not be able to procure modules of desired quality from Indian suppliers at competitive prices. This may have a consequential impact on increase in project cost and higher tariffs, which may reduce attractiveness of solar power.
Investors may not be able to enforce a judgment of a foreign court against our Indian subsidiaries, certain of our Company’s directors, or our key management, except by way of a suit in India on such judgment.
All of our operating subsidiaries are incorporated under the laws of India. In addition, certain of our Company’s directors and substantially all of our key management personnel reside in India, and all or a substantial portion of our assets and such persons are located in India. As a result, it may not be possible for investors to effect service of process upon such persons outside India, or to enforce judgments obtained against such parties outside India. In India, recognition and enforcement of foreign judgments are provided for under Section 13 and Section 44A of the Civil Procedure Code, 1908 (the “Civil Code”) on a statutory basis. Section 13 of the Civil Code provides that a foreign judgment shall be conclusive regarding any matter directly adjudicated upon, except: (i) where the judgment has not been pronounced by a court of competent jurisdiction; (ii) where the judgment has not been given on the merits of the case; (iii) where it appears on the face of the proceedings that the judgment is founded on an incorrect view of international law or a refusal to recognize the law of India in cases to which such law is applicable; (iv) where the proceedings in which the judgment was obtained were opposed to natural justice; (v) where the judgment has been obtained by fraud; and (vi) where the judgment sustains a claim founded on a breach of any law then in force in India.
Under the Civil Code, a court in India shall, upon the production of any document purporting to be a certified copy of a foreign judgment, presume that the judgment was pronounced by a court of competent jurisdiction unless the contrary appears on record.
India is not a party to any international treaty in relation to the recognition or enforcement of foreign judgments. Section 44A of the Civil Code provides that where a foreign judgment has been rendered by a superior court, within the meaning of such section, in any country or territory outside India, which the Indian government has by notification declared to be a reciprocating territory, it may be enforced in India by proceedings in execution as if the judgment had been rendered by the relevant court in India. However, Section 44A of the Civil Code is applicable only to monetary decrees not being in the nature of any amounts payable in respect of taxes, other charges of a like nature or in respect of a fine or other penalty and does not apply to arbitration awards. Further, the execution of the foreign decree under Section 44A of the Civil Code is also subject to the exceptions under Section 13 of the Civil Code.
The United Kingdom, Singapore and Hong Kong (among others) have been declared by the Indian government to be reciprocating territories for the purposes of Section 44A. However, the United States has not been declared by the Indian government to be a reciprocating territory for the purposes of Section 44A of the Civil Code. Accordingly, a judgment of a court in a country which is not a reciprocating territory may be enforced in India only by a fresh proceeding suit instituted in a court of India and not by proceedings in execution. Such a suit has to be filed in India within three years from the date of the judgment in the same manner as any other suit filed in India to enforce a civil
40
liability in India. It is unlikely that a court in India would award damages on the same basis as a foreign court would, if an action were brought in India. Further, it is unlikely that an Indian court would enforce foreign judgments if that court were of the view that the amount of damages awarded was excessive or inconsistent with Indian public policy. A party seeking to enforce a foreign judgment in India is required to obtain approval from the RBI to repatriate outside India any amount recovered pursuant to the execution of such judgment and such amount may be subject to income tax in accordance with applicable laws. In addition, any judgment awarding damages in a foreign currency would be converted into Indian Rupees on the date of the judgment and not the date of payment. We cannot predict whether a suit instituted in an Indian court will be disposed of in a timely manner or be subject to considerable delay.
41
Changing laws, rules and regulations and legal uncertainties, including adverse application of corporate and tax laws, may adversely affect our business, financial condition, results of operations, cash flows and prospects.
The regulatory and policy environment in which we operate is evolving and subject to change. Such changes, including the instances mentioned below, may adversely affect our business, financial condition, results of operations, cash flows and prospects, to the extent that we are unable to suitably respond to and comply with any such changes in applicable law and policy.
| • | A comprehensive national goods and services tax (“GST”) regime that combines taxes and levies by the central and state governments into a unified rate structure has been in effect since July 1, 2017, unifying and replacing various indirect taxes applicable earlier. The GST rules were amended multiple times since the effective date. The GST led to an increase in the cost of operations of the Indian subsidiaries part of the Green Bond (“Restricted Subsidiaries”) at increased rates of GST ranging from 5% to 18%. Under the earlier value added tax (“VAT”) regime, the VAT rate on major items like modules and invertors was Nil and the VAT rate on various other items like mounting structure, transmission lines, AC cable, DC cable, AC electrical materials, DC electrical materials, combiner boxes, connectors and Balance of System (“BOS”) was 2%. However, under the current GST regime, the GST rate on these items was increased to 5%. We have filed change-in-law petitions before relevant electricity regulatory commissions, and we have also received favorable orders allowing our change in law petitions from some of the electricity regulatory commissions. We have incurred incremental costs due to the introduction of GST in connection with our Telangana 100 MW project and started receiving monthly annuities for the projects Andhra Pradesh 3 (50 MW) and Uttar Pradesh 3 (40 MW). We, however, can make no assurances that our offtakers and the electricity regulatory commissions will revise relevant tariffs or allow lump sum payment along with late payment surcharge, sufficiently to cover our increased expenses from GST. To the extent we are unable to pass on the impact of the imposition of GST to our offtakers in part or in whole under any of our PPAs, our increased costs of purchase of products and services due to GST could adversely affect our operating results, cash flows and financial condition. While electricity regulatory commissions have allowed pass through on projects under construction, it rejected claims on O&M contracts except for Chhattisgarh 1.1, 1.2 and 1.3 (30 MW) projects in which we have received favorable order. While the impact of GST on O&M is minor and going forward, we have eliminated margins on O&M operations by shifting O&M operations to project SPVs, we have also filed appeals before APTEL. On December 31, 2018, the Ministry of Finance issued a notice that 70% of the gross consideration of the supplies under a Composite EPC Contract will be taxed at 5% (GST rate applicable on the supply of specified renewable energy goods) and 30% of the gross consideration of the supplies under the Composite EPC Contract will be taxed at 18%, (GST rate applicable on the supply of construction, engineering, installation, or other technical services in relation to renewable power generating devices), an increase from the earlier tax rate of 5%. The notification resulted in an increase in the effective tax rates under the GST laws from 5% to 8.9% (on gross consideration) on the Composite EPC Contracts with effect from January 1, 2019. While our change in law petitions are pending before electricity regulatory commissions seeking pass through of the additional tax under the Composite EPC Contracts, the Maharashtra Electricity Regulatory Commission has rejected our claim, and hence there can be no assurances that we will get favorable orders in other cases. |
42
| • | The Indian government also amended the Income Tax Act, 1961 in respect of the manner of determining the ‘tax residency’ of a company in India with effect from April 1, 2017. Previously, a foreign company could be a tax resident of India only if its control and management was situated wholly in India. Under the amended rules, a company will be treated as tax resident of India if (i) it is an Indian company; or (ii) its place of effective management (“POEM”) is in India. POEM is defined in the Income Tax Act, 1961, to mean a place where key management and commercial decisions that are necessary for the conduct of the business of an entity as a whole are, in substance, made. The Indian government also issued the final guidelines for determining the POEM of a company on January 24, 2017. The applicability of the amended provisions and the treatment of our subsidiaries under such provisions is uncertain. |
| • | The provisions of the General Anti-Avoidance Rules (“GAAR”) came into effect on April 1, 2017. The GAAR provisions can be invoked once an arrangement is regarded as an “impermissible avoidance arrangement”, which is any arrangement, or a part of it, the main purpose of which is to obtain a tax benefit and which satisfies at least one of the following tests: (i) creates rights, or obligations, which are not ordinarily created between persons dealing at arm’s length; (ii) results, directly or indirectly, in misuse, or abuse, of the provisions of the Income Tax Act, 1961; (iii) lacks commercial substance or is deemed to lack commercial substance, in whole or in part; or (iv) is entered into, or carried out, by means, or in a manner, which is not ordinarily employed for bona fide purposes. The onus to prove that the transaction is not an “impermissible avoidance agreement” is on the assessee, i.e. an arrangement shall be presumed, unless it is proved to the contrary by the assessee. If GAAR provisions are invoked, then the tax authorities have wide powers, including denial of tax benefit or a benefit under a tax treaty the consequences and effects of which are not determinable at present. Such effects could materially and adversely affect our business, prospects, cash flows, financial condition and results of operations. |
| • | The Indian Government has proposed to replace the existing Income Tax Act, 1961 with a new Direct Tax Code. A draft report on the Direct Tax Code, which is currently not in the public domain, was placed before the Indian Finance Minister for her consideration. The consequences and effects of changes in India’s income tax policy and law on this account are not determinable at present. |
Uncertainty in the applicability, interpretation or implementation of any amendment to, or change in, governing law, regulation or policy in the jurisdictions in which we operate, including by reason of an absence, or a limited body, of administrative or judicial precedent may be time consuming as well as costly for us to resolve and may impact the viability of our current business or restrict our ability to grow our business in the future.
Natural calamities could have a negative impact on the Indian economy and adversely affect our business and project operations.
India experienced natural calamities such as earthquakes, tsunamis, floods and drought in the past few years. In May 2020, massive forest fires broke out in Srinagar of Pauri Garhwal district in Uttarakhand, India and during August 2020, heavy rainfalls in the monsoon season caused severe floods that affected several areas in Kerala, India. The extent and severity of these natural disasters determines their impact on the Indian economy. If climatic conditions or natural disasters occur in areas where our projects and project teams are located, project development, connectivity to the power grid and the provision of O&M services may be adversely affected. In particular, materials may not be delivered as scheduled and labor may not be available. Substantially all of our operations and employees are located in India and there can be no assurance that we will not be adversely affected by natural disasters in the future. Furthermore, the COVID-19 pandemic has significantly impaired the Indian and world economy. For a full discussion of the risks to our business associated with the COVID-19 pandemic, see “Risks to our Business related to the COVID-19 pandemic”.
War, terrorist acts and other acts of violence involving India or other neighboring countries could significantly harm our operations directly or may result in a more general loss of customer confidence and reduced investment in these countries that causes significant harm to our business, results of operations, cash flows and financial condition.
Terrorist attacks and other acts of violence or war involving India or other neighbouring countries may significantly harm the Indian markets and the worldwide financial markets. The occurrence of any of these events may result in a loss of business confidence, which could potentially lead to economic recession and generally cause significant harm to our business, results of operations, cash flows and financial condition. In addition, any deterioration in international relations may result in investor concern regarding regional stability, which could decrease the price of our equity shares.
43
South Asia has also experienced instances of civil unrest and hostilities among neighbouring countries from time to time. There have also been incidents in and near India such as terrorist attacks in Kashmir, troop mobilizations along the Pakistan and Chinese borders and an aggravated geopolitical situation in the region. Such military activity or terrorist attacks in the future could significantly harm the Indian economy by disrupting communications and making travel more difficult. Resulting political tensions could create a greater perception that investments in Indian companies involve a high degree of risk. Furthermore, if India were to become engaged in armed hostilities, particularly hostilities that were protracted or involved the threat or use of nuclear weapons, we might not be able to continue our operations. Our insurance policies for a certain part of our business do not cover terrorist attacks or business interruptions from terrorist attacks or for other reasons.
Risks Related to Investments in Mauritian Companies
As a shareholder in our Company, you may have greater difficulties in protecting your interests than as a shareholder of a United States corporation.
Our Company is incorporated under the laws of Mauritius. The laws generally applicable to United States corporations and their shareholders may provide shareholders of United States corporations with rights and protection for which there may be no corresponding or similar provisions under the Companies Act 2001 of Mauritius, as amended, or the Mauritius Companies Act. As such, being shareholder of our Company’s equity shares, you may or may not be accorded the same level of shareholder rights and protection that a shareholder of a United States corporation may be accorded under the laws generally applicable to United States corporations and their shareholders. Taken together with the provisions of our Company’s constitution, which our Company adopted with effect upon completion of its public offering in October 2016, or Constitution, some of these differences may result in you having greater difficulties in protecting your interests as our Company’s shareholder than you would have as a shareholder of a United States corporation. This affects, among other things, the circumstances under which transactions involving an interested director are voidable, whether an interested director can be held accountable for any benefit realized in a transaction with us, what rights you may have as a shareholder to enforce specified provisions of the Mauritius Companies Act or our Company’s Constitution, and the circumstances under which we may indemnify our Company’s directors and officers.
Our Company may become subject to unanticipated tax liabilities that may have a material adverse effect on our Company’s results of operations.
Our Company is structured as a Global Business Company (“GBC”) in Mauritius. A GBC must at all times:
| | |
| (i) | Carry out its core income generating activities in or from Mauritius by: |
- employing either directly or indirectly a reasonable number of qualified persons to carry out the core activities, and
- having a minimum level of expenditure, which is proportionate to its level of activities
| | | |
| (ii) | Be managed and controlled from Mauritius; and |
| (iii) | Be administered by a Management Company. |
44
In a circular addressed to Management Companies dated October 12, 2018, the Financial Services Commission in Mauritius have advised that going forward, in assessing the exact substance requirements to be met by a GBC, they shall consider the nature and level of core income generating activities conducted (including the use of technology) by the GBC and taking into account the circumstances of each GBC, based on the following indicative guidelines:
Non-financial services activities | | Minimum expenditure | | | Employment in Mauritius (direct or indirect) |
| | (U.S. dollar) | | | |
Investment holding (excluding IP rights) | | | 12,000 | | | No minimum employment specified |
Non-investment holding | | | 15,000 | | | If annual turnover is: -Less than US$100 million – minimum of one -More than US$100 million – minimum of two |
After 30 June 2021, the Deemed Tax Credit will not be applicable to our Company and will be replaced with a new tax regime. The income tax rate for GBCs is at 15%, but subject to meeting certain prescribed conditions, and meeting the substance requirements issued by the Financial Services Commission for a GBC, our Company may benefit from a partial exemption of 80% on certain types of income such as foreign source dividend and interest. Where our Company derives income, which is subject to foreign tax, and where the said partial exemption has not been applied, the amount of foreign tax paid may be allowed as a credit against income tax payable in Mauritius in respect of that income.
Anti-takeover provisions in our Company’s constitutional documents and under Mauritius law could make an acquisition of us, which may be beneficial to our Company’s shareholders, more difficult and may prevent attempts by our Company’s shareholders to replace or remove our Company’s current management and limit the market price of our Company’s equity shares.
Provisions in our Company’s Constitution may have the effect of delaying or preventing a change in control or changes in our management. Our Company’s Constitution includes the following provisions which may be regarded as defensive measures:
| | |
| • | a staggered Board of Directors; |
| • | the ability to issue additional equity shares (including “blank check” preferred stock); |
| • | granting directors, the absolute discretion to decline to register a transfer of any shares; |
| • | requiring that amendments to our Company’s Constitution be approved by a special resolution of the shareholders of our Company; and |
| • | limiting the liability of, and providing indemnification to, our Company’s directors and officers. |
These provisions may restrict or prevent any attempts by our Company’s shareholders to replace or remove our Company’s current management by making it more difficult for shareholders to replace members of our Company’s Board of Directors, which is responsible for appointing the members of our Company’s management team. The provisions could also deprive our shareholders of the opportunity to sell their shares at a premium over the prevailing market price by discouraging third parties from seeking to obtain control of our Company in a tender offer or similar transactions.
45
Risks Related to Our Company’s Equity Shares
An active or liquid trading market for our Company’s equity shares may not be maintained.
Our Company’s shares historically had low trading volumes and an active liquid trading market for our Company’s equity shares may not be maintained in the long term and we cannot be certain that any trading market for our Company’s equity shares will be sustained or that the present price will correspond to the future price at which our Company’s equity shares will trade. Loss of liquidity could increase the price volatility of our Company’s equity shares.
Any additional issuance of equity shares or other equity-related securities would dilute the positions of existing investors in the equity shares and could adversely affect the market price of our Company’s equity shares. We cannot assure you that our Company’s equity shares will not decline below their prevailing market price. You may be unable to sell your equity shares at a price that is attractive to you.
The market price of our Company’s equity shares has been and may continue to be volatile, and you could lose all or part of your investment.
The trading price of our Company’s equity shares has been volatile since our Company’s initial public offering and is likely to continue to be volatile. Factors that could cause fluctuations in the market price of our Company’s equity shares include — trading volume, prices of other securities, market trends, growth of other comparable companies, changes in operating performance, sale of additional shares in the market by us or by other investors, coverage by security analysts, changes in financial estimates, failure to meet analyst or market expectations, press releases by us or our competitors, market speculations, changes in tax and other incentives, regulatory and policy changes, litigations, business acquisitions, changes in accounting standards and economic conditions.
Further, in recent years the stock markets have experienced extreme price and volume fluctuations that have affected and continue to affect the market prices of equity securities of many companies. These fluctuations often have been unrelated or disproportionate to the operating performance of those companies. In addition, the stock prices of many renewable energy companies have experienced wide fluctuations that have often been unrelated to the operating performance of those companies. These broad market and industry fluctuations, as well as general economic, political and market conditions such as recessions, government shutdowns, interest rate changes, or international currency fluctuations, may cause the market price of our Company’s equity shares to decline. Furthermore, the COVID-19 crisis has resulted in frequent share market price fluctuations and price volatility in all parts of the world and may also impact the share price of our Company. Any such crisis in future can also significantly impair the share price of our Company.
Sales of a substantial number of our Company’s equity shares in the public market, including by our Company’s existing shareholders, could cause our Company’s share price to fall.
Sales of a substantial number of our equity shares in the public market, or the perception that the sales might occur, could depress the market price of our Company’s equity shares and could impair our ability to raise capital through the issuance of additional equity securities of our Company. We are unable to predict the effect that these sales and others may have on the prevailing market price of our Company’s equity shares.
In addition, certain of our Company’s shareholders can require us to register shares owned by them for public sale in the United States. Our Company also has filed a registration statement to register our Company’s equity shares reserved for future issuance under our Company’s equity compensation plans. Subject to the satisfaction of applicable exercise periods and applicable volume and restrictions that apply to affiliates, our Company’s equity shares issued upon exercise of outstanding options will become available for immediate resale in the public market upon issuance.
46
Future sales of our Company’s equity shares may make it more difficult for us to sell equity securities in the future at a time and at a price that we deem appropriate. These sales also could cause the market price of our Company’s equity shares to decline and make it more difficult for you to sell our Company’s equity shares.
You may have difficulty enforcing judgments against our Company, our Company’s directors and management.
Our Company is incorporated under the laws of Mauritius. Further, we conduct substantially all of our operations in India through our key operating subsidiaries in India. The majority of our Company’s directors and officers reside outside the United States, and a majority of our assets and some or all of the assets of such persons are located outside the United States. As a result, it may be difficult or impossible to effect service of process within the United States upon our Company or those persons, or to recover against our Company or them on judgments of United States courts, including judgments predicated upon the civil liability provisions of the United States federal securities laws. An award of punitive damages under a United States court judgment based upon United States federal securities laws is likely to be construed by Mauritian and Indian courts to be penal in nature and therefore unenforceable in both Mauritius and India. Further, no claim may be brought in Mauritius or India against our Company or our Company’s directors and officers in the first instance for violation of United States federal securities laws because these laws have no extraterritorial application under Mauritian or Indian law and do not have force of law in Mauritius or India. However, a Mauritian or Indian court may impose civil liability, including the possibility of monetary damages, on our Company or our Company’s directors and officers if the facts alleged in a complaint constitute or give rise to a cause of action under Mauritian or Indian law. Moreover, it is unlikely that a court in Mauritius or India would award damages on the same basis as a foreign court if an action were brought in Mauritius or India or that a Mauritian or Indian court would enforce foreign judgments if it viewed the amount of damages as excessive or inconsistent with Mauritius or Indian practice or public policy.
The courts of Mauritius or India would not automatically enforce judgments of United States courts obtained in actions against our Company or our Company’s directors and officers, predicated upon the civil liability provisions of the United States federal securities laws, or entertain actions brought in Mauritius or India against our Company or such persons predicated solely upon United States federal securities laws. Further, there is no treaty in effect between the United States and Mauritius providing for the enforcement of judgments of United States courts in civil and commercial matters and the United States has not been declared by the Indian government to be a reciprocating territory for the purposes of enforcement of foreign judgments, and there are grounds upon which Mauritian or Indian courts may decline to enforce the judgments of United States courts. Some remedies available under the laws of United States jurisdictions, including remedies available under the United States federal securities laws, may not be allowed in Mauritian or Indian courts if contrary to public policy in Mauritius or India. Because judgments of United States courts are not automatically enforceable in Mauritius or India, it may be difficult for you to recover against us or our Company’s directors and officers based upon such judgments. In India, prior approval of the Reserve Bank of India is required in order to repatriate any amount recovered pursuant to such judgments.
Our Company does not expect to pay any cash dividends on our Company’s equity shares.
Our Company has not paid dividends on any of our Company’s equity shares to date and our Company currently intends to retain our future earnings, if any, to fund the development and growth of our Company’s business. As a result, capital appreciation, if any, of our Company’s equity shares are likely to be your sole source of gain for the foreseeable future. Consequently, you will likely only experience a gain from your investment in our Company’s equity shares if the price of our Company’s equity shares increases.
In addition, our Company’s ability and decisions whether to pay dividends in the future will depend on our earnings, financial condition and capital requirements. Dividends to U.S. holders may be negatively affected by foreign currency fluctuations. We may not generate sufficient income to cover our operating expenses and pay dividends to our Company’s shareholders, or at all. Our Company’s ability to pay dividends also could be restricted under financing arrangements that our Company may enter into in the future and our Company may be required to obtain the approval of lenders in the event it is in default of its repayment obligations. Our Company may be unable to
47
pay dividends in the near or medium term, and our Company’s future dividend policy will depend on our capital requirements, financing arrangements, results of operations and financial condition. As per Amendment in Finance Act, 2020 during previous year, Indian Companies are required to deduct tax at source in respect of dividend paid at rates applicable from time to time. Considering the same from Fiscal year 2020-21 onwards, dividend payments to its shareholders by companies are taxable in the hands of shareholders.
Our Company will have to rely principally on dividends and other distributions on equity paid by its operating subsidiaries and limitations on their ability to pay dividends to our Company could adversely impact your ability to receive dividends on our Company’s equity shares.
Since our Company cannot borrow from our Indian subsidiaries, dividends and other distributions on equity paid by our operating subsidiaries will be our Company’s principal source for cash in order for it to fund its operations including corporate expenses. Accordingly, our Company may need to issue additional equity or borrow funds, either of which may be unavailable on attractive terms, if at all.
If our Company’s operating subsidiaries incur debt on their own behalf in the future, the instruments governing the debt may restrict their ability to pay dividends or make other distributions to our Company. As our key operating subsidiary is established in India, it is also subject to certain limitations with respect to dividend payments. As of the date of this annual report, AZI has not paid any cash dividends on its equity shares and does not intend to pay dividends to its equity shareholders, including our Company, in the foreseeable future. Moreover, as our Company does not own 100% of AZI, any dividend payment made by AZI to our Company will also involve a payment to the other shareholders of AZI.
As a foreign private issuer, our Company is permitted to, and it will, follow certain home country corporate governance practices in lieu of certain requirements applicable to U.S. issuers. This may afford less protection to holders of our Company’s equity shares.
As a foreign private issuer listed on the New York Stock Exchange, or NYSE, our Company permitted to follow certain home country corporate governance practices in lieu of certain NYSE requirements. A foreign private issuer must disclose in its annual reports filed with the SEC, each NYSE requirement with which it does not comply followed by a description of its applicable home country practice. As a company incorporated in Mauritius and which is listed on the NYSE, our Company may follow its home country practice with respect to the composition of its Board of Directors and executive sessions and composition of our compensation committee and our nominating and corporate governance committee. Unlike the requirements of the NYSE, the corporate governance practice and requirements in Mauritius do not require our Company to have the majority of its Board of Directors be independent or to hold regular executive sessions where only independent directors shall be present. In addition, Mauritius law does not require our compensation committee or our nominating and corporate governance committee to be comprised of only independent directors. Such Mauritian home country practices may afford less protection to holders of our Company’s equity shares than would be available to the shareholders of a U.S. corporation.
If our Company ceases to qualify as a foreign private issuer, our Company would be required to comply fully with the reporting requirements of the Exchange Act applicable to U.S. domestic issuers, and our Company could incur additional legal, accounting and other expenses that our Company would not incur as a foreign private issuer.
As a foreign private issuer, our Company is exempt from a number of rules and regulations under the Securities Exchange Act of 1934, or the Exchange Act, applicable to U.S. domestic issuers, including the furnishing and content of proxy statements, compliance with the reporting and short-swing profit recovery provisions contained in Section 16 of the Exchange Act applicable to executive officers, directors and principal shareholders. Our Company is not required under the Exchange Act to file periodic reports and financial statements with the SEC as frequently or as promptly as U.S. domestic issuers, and we are not required to disclose in our periodic reports all of the information that U.S. domestic issuers are required to disclose. If our Company does not qualify as a foreign private issuer, our Company will be required to comply fully with the reporting requirements of the Exchange Act applicable to U.S.
48
domestic issuers, and our Company will incur significant additional legal, accounting and other expenses that our Company would not incur as a foreign private issuer.
For as long as our Company is an “emerging growth company,” our Company will not be required to comply with certain reporting requirements that apply to other public companies.
Our Company is an “emerging growth company,” as defined in the JOBS Act, enacted on April 5, 2012. For as long as our Company continues to be an emerging growth company, our Company may choose to take advantage of certain exemptions from reporting requirements applicable to other public companies that are not emerging growth companies. These include: (1) not being required to comply with the auditor attestation requirements of Section 404 of the Sarbanes-Oxley Act, (2) not being required to comply with any new requirements adopted by the Public Company Accounting Oversight Board, or the PCAOB, requiring mandatory audit firm rotation or a supplement to the auditor’s report in which the auditor would be required to provide additional information about the audit and the financial statements of the issuer, (3) not being required to comply with any new audit rules adopted by the PCAOB after April 5, 2012 unless the SEC determines otherwise, and (4) not being required to provide certain disclosure regarding executive compensation required of larger public companies. Our Company could be an emerging growth company for up to five years from the end of fiscal year 2017, although, if the market value of our common equity shares that is held by non-affiliates (referred as “Public Float”) exceeds US$ 700.0 million as of any September 30 before the end of that five-year period, our Company would cease to be an emerging growth company as of the following April 1, 2021. During the previous year, our Company has early adopted certain new accounting pronouncements that were applicable for public companies and irrevocably elected to follow the public company accounting requirements. This will result in adoption of Financial Accounting Standards Board (“FASB”)’s Accounting Standard Updates (“ASU”), as it would be applicable for other public companies. We cannot predict if investors will find our equity shares less attractive if we choose to rely on these exemptions. If some investors find our equity shares less attractive as a result of any choices to reduce future disclosure, there may be a less active trading market for our equity shares and our share price may be more volatile. Further, as a result of these scaled regulatory requirements, our disclosure may be more limited than that of other public companies and you may not have the same protections afforded to shareholders of such companies. The Company completes its fifth anniversary from the first sale of common equity shares during the fiscal year ended March 31, 2022 and the exemptions available for the Emerging Growth Company will no longer be available effective March 31, 2022. From that date, the Company will be required to comply with all reporting requirements as applicable to other public companies including the requirement to comply with the auditor attestation requirements of Section 404 of the Sarbanes-Oxley Act.
You may be subject to Indian taxes on income arising through the sale of our equity shares.
Pursuant to recent amendments to the Indian Income Tax Act, 1961, as amended, income arising directly or indirectly through the sale of a capital asset, including any share or interest in a company or entity registered or incorporated outside of India, will be liable to tax in India, if such share or interest derives, directly or indirectly, its value substantially from assets (whether tangible or intangible) located in India and whether or not the seller of such share or interest has a residence, place of business, business connection, or any other presence in India. The share or interest of the company or entity registered or incorporated outside of India is deemed to derive its value substantially from the assets located in India if the value of such Indian assets exceeds INR 100 million and represents at least 50% of the value of all the assets owned by the company or entity registered or incorporated outside of India. Substantially all of our assets are located in India.
However, if the transferor of share or interest in a company or entity registered or incorporated outside of India (along with its associated enterprises), neither holds the right of management or control in the company or entity registered or incorporated outside of India nor holds voting power or share capital or interest exceeding 5% of the total voting power or total share capital or interest in the company or entity registered or incorporated outside of India, at any time during the twelve months preceding the date of transfer, such small shareholders are exempt from the indirect transfer provisions mentioned above. The amendments also do not deal with the interplay between the amendments to the Indian Income Tax Act, 1961, as amended, and the existing Double Taxation Avoidance Agreements that India has
49
entered into with countries such as the United States in case of an indirect transfer. Accordingly, the implications of the recent amendments are presently unclear. If it is determined that these amendments apply to a holder of our equity shares, such holder could be liable to pay taxes in India on such income.
If securities or industry analysts do not publish or cease publishing research or reports about us, our business or our market, or if they change their recommendations regarding our equity shares adversely, our stock price and trading volume could decline.
The trading market for our equity shares is influenced by the research and reports that industry or securities analysts publish about us, our business, our market or our competitors. If any of the analysts who cover us or may cover us in the future change their recommendation regarding our stock adversely, or provide more favorable relative recommendations about our competitors, our stock price would likely decline. If any analyst who covers us or may cover us in the future were to cease coverage of our company or fail to regularly publish reports on us, we could lose visibility in the financial markets, which in turn could cause our stock price or trading volume to decline.
Future issuances of any equity securities may cause a dilution in your shareholding, decrease the trading price of our equity shares, and restrictions agreed to as part of debt financing arrangements may place restrictions on our operations.
Any issuance of equity securities after our initial offering could dilute the interests of our shareholders and could substantially decrease the trading price of our equity shares. our Company may issue equity or equity-linked securities in the future for a number of reasons, including to finance our operations and business strategy (including in connection with acquisitions and other transactions), to adjust our ratio of debt to equity, to satisfy our obligations upon the exercise of then-outstanding options or other equity-linked securities, if any, or for other reasons. Issuance of such additional securities may significantly dilute the equity interests of investors, since initial offering who will not have pre-emptive rights with respect to such an issuance, subordinate the rights of holders of equity shares if preferred shares are issued with rights senior to those afforded to our Company’s equity shares, or harm prevailing market prices for our Company’s equity shares.
Our Company may be classified as a passive foreign investment company, which could result in adverse U.S. federal income tax consequences to certain U.S. investors of our Company’s equity shares.
Our Company believes that it was not a passive foreign investment company (“PFIC”) for our taxable year ending March 31, 2021 and that, based on the present composition of its income and assets and the manner in which it conducts its business, our Company will not be a PFIC in our Company’s current taxable year or in the foreseeable future. Whether our Company is a PFIC is a factual determination made annually, and our Company’s status could change depending, among other things, upon changes in the composition and amount of our gross income and the relative quarterly average value of its assets. In particular, if our Company generate a small amount of gross income that is attributable to passive income in a taxable year, then there is a risk that our Company may be a PFIC for that year. If our Company was a PFIC for any taxable year in which you hold our Company’s equity shares, you generally would be subject to additional taxes on certain distributions and any gain realized from the sale or other taxable disposition of our equity shares regardless of whether our Company continued to be a PFIC in any subsequent year, unless you mark your equity shares to market for tax purposes on an annual basis. You are encouraged to consult your own tax advisor as to our Company’s status as a PFIC and the tax consequences to you of such status. A U.S. Holder will not be able to elect to treat us as a qualified electing fund (“QEF”) because we do not intend to prepare the information needed to make a QEF election. See “Item 10. Additional Information — E. Taxation — U.S. Federal Income Taxation — Passive Foreign Investment Company Status.”
If a United States person is treated as owning at least 10% of our equity shares, the holder may be required to include amounts in its U.S. taxable income even if our Company does not make distributions to its shareholders.
50
If a United States person is treated as owning (directly, indirectly, or constructively) at least 10% of the value or voting power of our Company's equity shares, that person may be required to include certain amounts in its U.S. taxable income even if our Company make no distributions to our Company’s shareholders. A United States person that is treated as owning (directly, indirectly, or constructively) at least 10% of the value or voting power of our Company’s equity shares will be treated as a “United States shareholder” with respect to each “controlled foreign corporation” in our Group. As a result of tax legislation enacted in 2017, it is not certain under what circumstances our non-U.S. subsidiaries will be treated as controlled foreign corporations. However, because our Group includes U.S. subsidiaries, our non-U.S. subsidiaries could be treated as controlled foreign corporations with respect to any United States shareholders (regardless of whether or not our Company are treated as a controlled foreign corporation). A United States shareholder of a controlled foreign corporation in our Group would be required to report annually and include in its U.S. taxable income its pro rata share of “Subpart F income”, “global intangible low-taxed income,” and investments in United States property, if any, related to that controlled foreign corporation, regardless of whether our Company make any distributions. Failure to comply with these reporting obligations may subject a United States shareholder to significant monetary penalties and may prevent the statute of limitations with respect to such shareholder’s U.S. federal income tax return for the year for which reporting was due from starting. An individual that is a United States shareholder with respect to a controlled foreign corporation generally would not be allowed certain tax deductions or foreign tax credits that would be allowed to a United States shareholder that is a U.S. corporation. Because our Company does not maintain U.S. tax books and records, our Company does not expect to be able to furnish to any United States shareholders the information that may be necessary to comply with the shareholder’s reporting and taxpaying obligations under these rules. A U.S. investor should consult its advisors regarding the potential application of these rules to an investment in our Company’s equity shares, including the possibility that the investor may be treated as a “United States shareholder” as a result of direct, indirect or constructive ownership of our Company’s equity shares.
ITEM 4. INFORMATION ON THE COMPANY
A. History and Development of the Company
Our Company’s legal and commercial name is Azure Power Global Limited. Our Company is a public company limited by shares incorporated in Mauritius on January 30, 2015. Our Company’s registered office is located at c/o AAA Global Services Ltd., 1st Floor, The Exchange 18 Cybercity, Ebene, Mauritius. Our Company’s principal executive offices are located at: 5th Floor, Southern Park, D-II, Saket Place, Saket, New Delhi - 110017, India, and our Company’s telephone number at this location is (91-11) 49409800. Our principal website address is www.azurepower.com. The SEC also maintains an internet site at www.sec.gov that contains reports, proxy and information statements, and other information regarding registrants that make electronic filings with the SEC. Our Company’s agent for service of process in the United States is CT Corporation System, located at 28 Liberty Street, New York, NY 10005.
Our Group was founded in 2008, and we developed India’s first utility scale solar project in 2009. As of March 31, 2021, we operated 45 utility scale projects with a combined rated capacity of 1,990 MWs as of March 31, 2021 which represents a compound annual growth rate or CAGR, of 78%, since March 2009. As of March 31, 2021, we were also constructing a combined rated capacity of 965 MWs comprising of utility scale projects of 65 MWs of Assam 1 and 300 MWs of Rajasthan 6, 300 MWs of Rajasthan 8 and 300 MWs of Rajasthan 9. We also had an additional 4,000 MWs Contracted & Awarded, bringing our total Operating, Contracted & Awarded capacity to 6,955 MWs. Contracted & Awarded megawatts include 4,000 MWs for which we have received Letters of Award (“LOA”) but the Power Purchase Agreements (“PPAs”) have not yet been signed. Our portfolio currently comprises of solar assets, however, we are exploring opportunities across other renewable assets as well.
B. Business Overview
We sell renewable power in India on long-term fixed price contracts to our customers, at prices which in many cases are at or below prevailing alternatives for these customers.
51
According to the Central Electricity Authority, Indian renewable capacity installed reached 95 GW at the end of April 30, 2021 with a target to achieve 175 GW of installed solar capacity by 2022. Keeping in view India’s commitment for a healthy planet with a less carbon intensive economy, in 2015 the Government of India (the “Government” or “GOI”) decided that 175 GW of renewable energy capacity will be installed by the year 2022. This includes 100 GW from solar, 60 GW from wind, 10 GW from biomass and 5 GW from small hydro power. In 2020, Prime Minister of India announced that India’s renewable energy capacity will seek to achieve a target of 450 GWs by year 2030. The substantial higher capacity target will ensure greater energy security, improved energy access and enhanced employment opportunities. With the accomplishment of these ambitious targets, India will become one of the largest Green Energy producers in the world, surpassing several developed countries.
The renewable sources of power are a cleaner, faster-to-build and cost-effective alternative energy solution to most traditional sources of power, the economic and climate costs of which continue to increase every year. Through our use of renewable power, we estimate that we may have avoided 3.0 million tons of CO2 in current fiscal, and 9.5 million ton equivalents since inception.
Our current portfolio comprises of utility scale solar projects that are typically awarded through government auctions. We believe this strong presence in India’s competitive renewable energy market is a result of the following:
| • | Low levelized cost of energy. Our in-house EPC expertise, advanced in-house O&M capability and efficient financial strategy allow us to offer low-cost solutions of energy. |
| • | Our integrated profile supports growth. Our integrated profile affords us greater control over project development, construction and operation, which provides us with greater insight and certainty on our construction costs and timeline. |
| • | Strong value proposition for our customers. We manage the entire development and operation process, providing customers with long term fixed price PPAs in addition to high levels of availability and service. This helps us win customer confidence and repeat business. |
| • | Strong community partnerships. We hire from local communities and generally lease land with few alternative uses, providing local communities with a stream of discretionary cash flow without displacing alternative business. As a result, we are able to build long term community relationships, which allows us to improve our time of completion, further reducing project development risk. |
We generate revenue largely from a mix of leading Indian central and state government utilities. Because we have our own EPC and O&M capabilities, we can be more competitive than those that need to pay an EPC and O&M margin to third-party providers.
Market Opportunity
India is one of the most populous democracy in the world with a population of around 1.4 billion. India’s real GDP contracted by 8.7% in 2020 on the back of a COVID-19 induced economic crisis. The Indian economy recorded growth in the six months ended March 31, 2021, following negative growth in the six months ended September 30, 2020. According to the revised estimates of Reserve Bank of India, India’s projected GDP grew 0.4% in the third quarter of fiscal year 2021. (Source: https://rbidocs.rbi.org.in/rdocs/Publications/PDFs/MPRA202113A99DAD95344334BF6145CCBB26A744.PDF). The Indian economy is expected to contract in the three months ended June 30, 2021 due to the impact of the second wave of the COVID-19 pandemic and related state lockdowns and healthcare crisis.
52
An efficient, resilient, and financially robust power sector is essential for the growth of the Indian economy. A series of reforms in the 1990s and the Electricity Act 2003 have moved the Indian power sector towards being a competitive market with multiple buyers and sellers supported by regulatory and oversight bodies. India’s annual per capita electricity consumption reached 1.2 MWh in fiscal year 2019-2020. (Source: https://cea.nic.in/wp-content/uploads/executive/2021/02/exe_summary.pdf). Although the annual per capita power consumption of India has grown significantly from 0.8 MWh in fiscal year 2010-11 to 1.2 MWh in 2019-20, it is among the lowest in the world. (Source: https://cea.nic.in/wp-content/uploads/executive/2021/02/exe_summary.pdf). According to the International Energy Agency, the annual per capita electricity consumption of India was 1.0 MWh in fiscal year 2018, whereas countries like China and the United States had a per capita electricity consumption of 4.9 MWh and 13.1 MWh, respectively, in fiscal year 2018. (Source: http://energyatlas.iea.org/#!/tellmap/-1118783123). There are various factors such as electrification rates, purchasing power, market saturation and electrical heating or cooling requirements, which impacts the per capita consumption levels globally. The electricity consumption and peak demand have grown at a CAGR of 5.0% and 4.6%, respectively, in the last 10 years (February 2011 to February 2021). (Source : https://cea.nic.in/wp-content/uploads/executive/2021/02/exe_summary.pdf)
Electricity demand is expected to rise in the future due to increased electrification. Major efforts are being taken by the Government to meet the targets of renewable energy in the country, including:
| • | permitting Foreign Direct Investment up to 100 percent under the automatic route; |
| • | strengthening the terms of PPAs; introduction of guidelines on power curtailments, policies on tariff adoption, force majeure event guidelines; |
| • | mandating the requirement of Letter of Credit (“LC”) as payment security mechanism by distribution licensees for ensuring timely payments to renewable energy generators; |
| • | setting up of Ultra Mega Renewable Energy Parks to provide land and transmission on plug and play basis to investors; |
| • | waiver of Inter State Transmission System (“ISTS”) charges and losses for inter-state sale of solar and wind power for projects to be commissioned by June 30, 2023; |
| • | notification of standard bidding guidelines to enable distribution licensee to procure solar and wind power at competitive rates in cost effective manner; |
| • | declaration of trajectory of Renewable Purchase Obligation (“RPO”) for Solar as well as Non-solar, uniformly for all States/ Union Territories, reaching 21% of RPO by 2022 with 10.5% for solar based electricity; |
| • | laying of transmission lines under the Green Energy Corridor Scheme for evacuation of Power in renewable rich states; |
| • | launching of new schemes, such as, Pradhan Mantri Kisan Urja Suraksha evem Utthan Mahabhiyan (“PM-KUSUM”), for farmers to install solar pumps and grid connected solar and other renewable power plants in the country; |
| • | setting up 12,000 MWs of grid connected solar photovoltaic (“PV”) power projects for use by the Government and Government entities as part of the Central Public Sector Undertaking (“CPSU”) Scheme Phase II to facilitate national energy security and environment sustainability for Government purposes; |
| • | setting up scheme for procurement of blended wind power from 2500 MW ISTS connected projects; |
| • | renewable energy projects with priority sector lending status for loans up to a limit of Rs 30 crore. |
| • | launching of Production linked Incentive Scheme– ‘National Programme on Advanced Chemistry Cell (ACC) Battery Storage’ for achieving manufacturing capacity of 50 Giga Watt Hour (GWh) of ACC and 5 GWh of "Niche" ACC with an outlay of INR 18,100 crores; |
| • | launching of Production linked Incentive Scheme- ‘National Programme on High Efficiency Solar PV Modules’, aiming to build self sufficiency in Solar Modules. |
53
Climate change has become a major concern for the world. India has committed to the global climate change initiative and has ratified the Paris Agreement on Climate Change in October 2016. As part of the Nationally Determined Contributions (“NDC”), India has made a pledge that by 2030, 40% of its installed power generation capacity shall be from non-fossil fuel sources and will reduce its carbon emission intensity of GDP by 33-35 % considering 2005 levels.
During the last 6 years, India has witnessed the fastest rate of growth in renewable energy capacity addition among all large economies, with renewable energy capacity growing by 2.5 times and solar energy expanding by over 13 times. (Source: https://pib.gov.in/PressReleasePage.aspx?PRID=1685046). RE installed capacity increased by 165% from 35.5 GW in March 2014 to 95 GW in April 2021, excluding large hydro above 25 MWs. (Source: https://mnre.gov.in/the-ministry/physical-progress). During the same period, the share of RE capacity in the overall generation capacity mix increased from 14% to 25%. (Source: https://cea.nic.in/wp-content/uploads/installed/2021/02/installed_capacity_02.pdf) to bolster the renewable energy supply in the entire energy mix, the MNRE has issued a National Wind-Solar Hybrid Policy. The Policy seeks to promote new hybrid projects as well as hybridization of existing wind and solar projects. Due to its favorable location in the solar belt, India has one of the best irradiation rates of any large economy. About 5,000 trillion kWh per year energy is incident over India's land area with most parts receiving 4-7 kWh per square meter per day. The solar power potential of India remains largely underutilized with only 39 GW of installed power compared with 749 GW of potential power (Source: https://mnre.gov.in/the-ministry/physical-progress). The MNRE has suggested that the highest solar energy potential is in Rajasthan at 142 GW followed by Jammu and Kashmir with 111 GW (Source: https://mnre.gov.in/solar/current-status/).
As per Central Electricity Authority’s National Electricity Plan, contribution of renewable energy sources is estimated to be around 21% of the total electricity demand of the country in the year 2021-22 and 24% by 2026-27. (Source: https://pib.gov.in/PressReleseDetailm.aspx?PRID=1602274). The share of solar energy of overall RE installed capacity has increased from 7.5% in 2014 to around 42% in 2021. (Source: https://mnre.gov.in/the-ministry/physical-progress). The sector is supported by a well-established institutional framework with specific roles and responsibilities assigned to various stakeholders. For example, the MNRE devises key policies in the solar sector. Power from solar projects can be sold to DISCOMs under central or state schemes or to end consumers through open access or captive route. Further, large scale adoption of RE capacity additions in India is primarily driven by various fiscal and regulatory incentives provided by the Government of India. Some of these measures are:
| • | National Solar Mission (“NSM”). A major initiative of the Indian government is to promote ecologically sustainable growth while addressing India’s energy security challenge. NSM was introduced as part of India’s National Action Plan on Climate Change (“NAPCC”) in 2010 with a view to deploy 20 GWs of solar capacity by fiscal year 2022. The targets were subsequently revised to 100 GW by 2022 in June 2015. |
| • | Renewable Purchase Obligation (“RPO”). RPO was one of the important instruments of the MOP to achieve the goal of installing 175 GW of renewable energy by fiscal year 2022. The MNRE, Government of India, along with all the State Nodal Agencies (SNAs) have taken appropriate policy initiatives for achieving the target of 175 GW of renewable energy by 2022. SERCs are required to fix a minimum percentage of the total consumption of electricity in the area of a distribution licensee for purchase of energy from renewable energy sources. With the amendment of Tariff Policy in January 2016, the SERCs are required to reserve a minimum percentage for purchase of solar energy which shall be such that it reaches 8% of total consumption of energy, excluding hydro power, by March 2022 or as notified by the Central Government from time to time. The Government of India in July 2018 notified the Long-Term growth trajectory of RPOs for Solar as well as Non-solar, uniformly for all States/ Union Territories, reaching ~21% of RPO by 2022 with ~10.5% for solar based electricity. |
| • | Waiver of interstates transmission system charges and losses for solar and wind energy projects: There are no interstate charges and losses for the sale of solar and wind power for projects commissioned by June 30, 2023. The waiver will apply for a period of 25 years from the date of commissioning. The waiver is applicable for only those projects awarded through competitive bidding under the guidelines issued by the Government and projects entering into PPAs with entities for compliance of their RPO. |
54
| • | Ultra Mega Renewable Energy Power Parks (“UMREPPS”). The Ministry has undertaken a scheme to develop Ultra Mega Renewable Energy Power Parks (UMREPPs) under the existing Solar Park Scheme. The objective of the UMREPP is to provide land upfront to the project developer and facilitate transmission infrastructure for developing renewable energy based UMREPPs with solar/wind/hybrid and also with storage systems, if required. This scheme aims to set up 25 solar parks and ultra-mega solar power projects targeting 40,000MW of solar power installed capacity by March 2022. So far, 40 solar parks have been sanctioned with a cumulative capacity of 26.3 GW in 15 states. Solar power projects of an aggregate capacity of around 8 GW have already been commissioned in these parks. (Source: MNRE, Year-end Review 2020). |
| • | Standard Bidding Guidelines. MNRE has issued Guidelines for Tariff Based Competitive Bidding Process for Procurement of Power from Grid Connected Solar & Wind Power Projects with an objective to provide a framework for procurement of solar & wind power through a transparent process of bidding including standardization of the process and defining of roles and responsibilities of various stakeholders. |
| • | Dispute Resolution Mechanism. The MNRE has set up a Dispute Resolution Mechanism for wind and solar projects to consider the unforeseen disputes between solar and wind power developers and SECI/NTPC, beyond contractual agreement. This mechanism will help in the smooth implementation of solar/wind energy projects in India by expeditiously resolving unforeseen disputes that may arise beyond the scope of contractual agreements. |
| • | Retirement of old polluting coal-based power plants. In order to become self-reliant in power generation and achieving energy transition towards clean energy, the ministry of power has planned a phase-wise retirement of old polluting coal based power plants. |
| • | The Green Energy Corridor. Power Grid Corporation of India is establishing a Green Energy transmission corridor for evacuation of renewable power from renewable energy rich states to load centres. The eight renewable rich states (including Tamil Nadu, Karnataka, Andhra Pradesh, Maharashtra, Gujarat, Rajasthan, Himachal Pradesh and Jammu and Kashmir). With the implementation of the Green Corridor, the pockets of the renewable energy generation would become grid interactive and thereby the restrictions on renewable energy evacuation, losses would reduce. The first component of the scheme, Inter-state GEC with target capacity of 3200 circuit kilometer (ckm) transmission lines and 17,000 MVA capacity sub-stations, was completed in March 2020. |
| • | Production linked incentive (PLI) scheme. The PLI scheme was announced in the budget 2021-22. The Finance Minister announced capital Augmentation of Solar Energy Corporation of India Limited (SECI) and Indian Renewable Energy Development Agency Limited (IREDA). To give a further boost to the non-conventional energy sector, additional capital infusion of INR1,000 crores to Solar Energy Corporation of India and INR 1,500 crores to Indian Renewable Energy Development Agency will be provided. |
| • | RE Equipment Manufacturing Parks. MNRE has initiated action towards setting up new hubs for manufacturing renewable energy equipment in the country to meet both domestic and also cater to global demand. With this objective in view, the MNRE has written to various State Governments and various Port Authorities to identify land parcels of 50-500 acres for setting up such Parks. Tuticorin Port Trust, States of Madhya Pradesh and Odisha have already expressed their keen interest in setting up RE Manufacturing Parks. |
| • | E-Invoicing w.r.t. Renewable Energy (RE) supplied by Renewable Energy Generating Stations. The Ministry provided for a waiver on submission of hard copy of invoice/bill for monthly energy supplied by RE power projects being implemented through MNRE designated implementing agencies from 1st April 2021, considering the then prevailing lockdown due to COVID-19. This arrangement shall continue for a period to be decided in due course depending on the COVID-19 related developments that take place in the coming weeks. |
| • | Central Public Sector Undertaking (CPSU) Scheme Phase-II. The Cabinet Committee on Economic Affairs (CCEA) has approved the MNRE's proposal for implementation of the Central Public Sector Undertaking (CPSU) Scheme Phase-II for setting up 12,000 MW grid-connected solar photovoltaic (PV) power projects with Viability Gap Funding (VGF) support of INR858 million for self-use or use by Government or Government entities, of both Central and State Governments. The scheme mandates the use of both solar photovoltaic (SPV) cells and modules manufactured domestically as per specifications and testing requirements fixed by MNRE. |
55
| • | Phase-II of Grid Connected Rooftop Solar Programme. The GoI has approved Phase-II of the Grid Connected Rooftop Solar Programme for achieving cumulative capacity of 40,000 MW from rooftop solar projects by Fiscal 2022. This scheme is expected to act as catalyst for adding solar cell and module manufacturing capacity in India. So far, a cumulative 4.4 GW solar roof top projects have been set up in the country. (Source: MNRE, Year-end Review 2020). |
| • | Pradham Mantri Kisan Urja Suraksha evam Utthaan Mahabhiyan (“PM-KUSUM”). The PM-KUSUM Scheme is an ambitious scheme for providing water and energy security to farmers and enhancing their income. The proposed scheme consists of three components: (i) 10,000 MW of decentralized ground mounted grid connected renewable power plants; (ii) installation of standalone solar powered agriculture pumps; and (iii) solarization of grid-connected solar powered agriculture pumps. |
The energy sector has also benefited from tariffs that are the lowest cost source of new electricity capacity driven by continued declines in PV module costs, improvement in efficiency due to greater scale of projects, access to long tenure financing and a drop in interest rates to finance solar projects.
Our Business Strategy and Approach
We sell energy to central and state government utilities at predictable fixed prices. Since our energy generation does not rely on fossil fuels, our electricity prices are insulated from the volatility of commodity pricing. We also provide delivery commitments for the electricity production of our power plants to our customers.
The typical project plan timeline for our projects is approximately eighteen months. The major stages of project life cycle are bidding, land acquisition, financing, material delivery and installation, as well as monitoring and maintenance. Once a bid is won, a LOA is issued and all of our departments initiate their activities. After that, the PPA is signed, which determines the scheduled commercial operation date before which a plant should be commissioned. Generally, once the LOA is received, we obtain the relevant land permits depending on whether the land is government-owned or private. Once land is obtained, our Engineering, Procurement and Construction teams works closely to construct and deliver the plant in the most efficient manner. Once commissioned, our O&M team monitors performance of all the projects in real time. We finance our projects with a mix of equity and project debt.
We utilize our integrated project development, EPC, financing and O&M services without involving multiple third-party services. This approach has allowed us to generate efficiencies of scale that further drive down system costs and improve our returns.
As the first developer and operator of utility scale solar assets in India, we believe that we are a well-established brand that has grown alongside the burgeoning Indian renewable energy market since 2009. We have proven to be a reliable developer that successfully and expediently executes on our development pipeline and wins repeat business. As a result, we believe we have become one of the largest renewable energy operators in the space, which affords us greater negotiating power with original equipment manufacturers and project finance lenders. This in turn improves our cost and capital structure, which benefits our bid win rate.
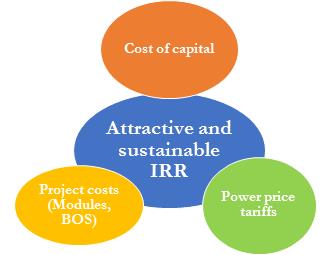
56
Power Yield Improvement. We also utilize our in-house operational capabilities maximize project yield and performance through analytics platform. We expect to innovate further to reduce the cost of energy for our customers and compete with local alternatives in the utility market.
Project Cost Reduction. Our in-house EPC capabilities enhance our ability to be flexible with our choice of technology, which allows us to choose high quality equipment while optimizing the combination of total system cost and yield. In the past fiscal year, we have evaluated and implemented superior technology and taken several engineering optimization initiatives that led to BOS cost reduction and yield improvements.
We lower the levelized project cost of energy through our three-pronged approach as follows:
| • | Value engineering. Our in-house EPC allows us to enhance our system design expertise with each successive project, be flexible with our choice of technology while ensuring sourcing from top-tier suppliers that optimizes both the system cost and power yield of the total solar block. We are able to negotiate pricing as we have significant economies of scale, built a well-recognized brand, and strong supplier relationships. As a result of our value engineering, we have seen a significant reduction in balance of system costs. |
| • | Operational performance monitoring. We operate a system that allows us to monitor project performance in real-time and allows us to respond rapidly to potential generation anomalies. Feedback from our operating projects also serves to further enhance our project designs, resulting in enhancements for current and new plants. |
| • | Financial strategy. We are able to access international capital markets, in addition to domestic lenders to enhance access to and lower the cost of capital leading to enhanced economics for our customers and shareholders. |
Capital Cost Reduction. Our long-standing global relationships and strategic partnership has enabled us to diversify our capital sources. We have raised capital from various sources including export credits institutions, development finance institutions, domestic and international lenders, and public equity. We also issued two Green Bonds, one of which was India’s first ever that allowed us to access international bond markets at attractive financing rates. In addition, we are pursuing project equity and mezzanine as a way to lower our cost of capital, enhance returns and to optimize the efficiency of our capital.
Our Competitive Strengths
We believe we differentiate ourselves from the competition in a number of key ways.
| * | Capital discipline. We are focused on delivering returns above our cost of capital and all new projects are expected to deliver returns that are above our cost of capital before we begin committing capital. During earlier years, we determined that several of our projects that we had bid for and won in auctions did not satisfy our minimum return thresholds and we exited these projects. |
| * | Local expertise and scale. We have 1,990 MWs operational which is one of the largest operational solar portfolios pan India, and with which we operate using a highly experienced and dedicated team. At present, our operational portfolio is primarily located in the highest irradiation zones and are well diversified with no state making up more than 32% of the operational portfolio. |
| * | We believe in empowering the community we work with. We hire from local communities and generally lease land with few alternative uses, providing local communities with a stream of discretionary cash flow without displacing alternative businesses. As a result, we build long-term community relationships, which allows us to improve our time of completion, further reducing project development risk. Altogether, these efforts and experiences have enabled us to have a better understanding of the market and develop good relationships with our stakeholders. |
| * | Portfolio with customers that have strong credit ratings. We have a strong track record in project development across utility scale and commercial rooftop. We have rapidly grown our project portfolio with high credit rating offtakers, which has enabled us to be competitive in the market with higher returns. We have a strong off-taker mix with 95% of the total operational portfolio rated investment grade and 85% of the portfolio are with customers owner or controlled by Government of India. |
57
| * | Superior technical and execution capabilities. We have developed proprietary systems that significantly reduce the time it takes to design, finance, commission, operate and maintain projects. Our lean and efficient execution expertise facilitates completion of our plants, enables us to easily scale our operations without significant increases to headcount, and allows us to construct several projects in parallel without compromising on efficiency. Because of our operational capabilities, we have been able to increase our operational capacity from 55 MWs as of March 31, 2014 to 1,990 MWs as of March 31, 2021. |
| * | Strong Track Record of Execution Completion. Integrated in-house teams for development, engineering, finance and operations have also played a vital role in making us competitive. We estimate that we have commissioned more than 420 kms of transmission, with interconnects at various voltage levels and land holdings by Azure for its project (commissioned and under constructions) is over 16,500 acres. |
| * | Access to international capital. The majority of our equity and debt funding is from international investors which we believe provides a larger and financially attractive pool of capital to access. |
| * | Strong Governance and Disclosure. We have strong corporate governance generally in line with NYSE and SGX-ST standards, which includes decision-making through various committees and an experienced Board of Directors. We are governed by key policies including our anti-bribery and corruption policy, whistle blower policy, code of business conduct and ethics and corporate social responsibility. |
| * | Strong management. Our senior leadership team and Board of Directors are experienced experts in renewable energy, finance and energy policy, with strong track records. Our Board of Directors also includes Arno Harris, Barney S. Rush, Cyril Cabanes, Deepak Malhotra, Supriya Prakash Sen, M.S. Unnikrishnana, Muhammad Khalid Peyrye and Yung Oy Pin (Jane) Lun Leung who are well-respected global authorities in energy, finance and public policy. |
Project Development
Typical Project Plan Timeline is Approximately 18 Months
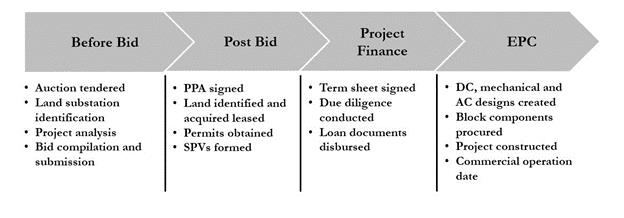
We participate in central- and state-level renewable energy auctions to build our utility scale portfolio and expects to focus primarily on renewable energy auctions with central government counterparties going forward.
The major stages of project sourcing, development and operation:
| • | Bidding. We have a well-organized process to effectively track all the policies and bid updates in the market. Once a tender is tracked, relevant information sourced from the Request for Proposal (RfP) document is discussed with the finance and technical teams and approved by the relevant committees before a strategic decision is made to participate in the bid. All new projects are planned such that they deliver returns above our cost of capital before we participate in an auction. We also have an in-house project development information database which help us predict and bid the most effective tariff in the market. Once the bid is won, a Letter of Award (LoA) is issued. Afterwards, the PPA is signed, which reflects the terms of sale of power to the Buyer and the commercial operation date by which a plant should be commissioned. |
58
| • | Land acquisition. Generally, once the letter of award is received, we obtain the relevant land permits depending on whether the land is government-owned or private. When the land is privately owned, we identify the appropriate parcels of land and due diligence is conducted by a local legal counsel. We also undertake certain compliance measures, including technical diligence, soil testing, local advertisement, stakeholder consultation and land registration after which acquisition is complete. When the land is government-owned, we identify the suitable parcels of land from the responsible agency and obtain approval from the relevant authority. Given that land is one of the most critical resource to be able to build a project successfully, Azure’s land acquisition experience is a key differentiator |
| • | Financing. To enable rapid execution of our projects, we sometimes use short term credit facilities that are refinanced with long term project finance facilities. We invest equity from internal cash generation, new capital raise and sale of assets to help growth and lower financing costs. |
| • | Material delivery and installation. Our engineering, procurement and construction teams work closely to construct and deliver the plant in the most efficient manner. A detailed project plan is made and the progress tracker on the delivery and construction is reviewed continually. |
| • | Monitoring and maintenance. Our operations team monitors performance of all the projects in real time through our analytics platform, which allow us to respond rapidly to potential generation anomalies and to repair any failures that might happen. They also perform scheduled preventive maintenance tasks on daily, weekly, monthly, and annual intervals to ensure our plants run smoothly and at high efficiency levels. Currently, we are able to monitor the performance of our solar power generation plants spread over 90 cities remotely |
New business area development opportunities: Other renewable sources
During the year, we have participated in hybrid and wind bids and believe that wind as well as perhaps other sources of renewable energy could also provide projects which have good returns. Even at a macro level there is an increased demand for consistent power supply and hence, the importance of hybrid tenders (wind and solar) is becoming more popular. Wind-Solar hybrid projects are also getting popular due to the issues such as grid balancing, matching India’s demand curve, Grid integrity and stabilisation, limited transmission resources and significant backdown of traditional sources such as thermal.
Wind-Solar hybrid projects can help mitigate a lot of challenges which are there at grid level:
| • | Improved PLF (“or CUF”) of plants, due to consistent power supply; |
| • | Efficient power transmission due to round the clock supply; |
| • | Stable and predictable generation curves as wind and solar complement each other; |
| • | Bundling of power with other sources such as thermal power, which provides dispatchable RTC power, reducing grid balancing requirements; |
| • | Catering to peak demands loads: Solar generation during afternoon and wind during evening; |
| • | Reduce demand for storage as Wind-solar provide the right balance of consistent power. |
While about 7.5 GW of Solar (auctioned in the last 1-1.5 years and to be commissioned in the next couple of years) is still awaiting PSA, PPA consents from end procurers (DISCOMs), close to 3.5 GW of Wind/ Hybrid capacities auctioned in the last 1 year have already been mapped to interested DISCOMs. In line with the above, MNRE & SECI have been increasing Hybrid, Firm/Dispatchable & RTC power tenders. All such ‘new’ categories of tenders, require IPPs to be competitive in Solar as well Wind, now.
59
In the Solar/Wind Hybrid projects, Solar is supposed to be about 65% of the contracted capacity. However, in other structures, like the ‘RTC’ tender, our assessment suggested that Wind may have a higher % of installed capacity. For example, in last year’s “RTC” tender (which was a high CUF tender, requiring 80% annual CUF & 70% monthly CUF), its envisaged that Wind would be approx. 65% of the installed capacity. A plain wind-solar hybrid/ wind power project is hence a good starting point, since it prepares us for the likely upcoming tender categories and cater to the evolving demands of the grid. Moreover, this foray into wind is aligned to Azure’s vision and mission, which is to provide affordable renewable power for generations, and to be the lowest cost producer of power. We shall continue to be primarily a solar focused IPP, but capable of catering to the evolving demands of the grid.
Our Management’s experience with wind
Azure has a strong leadership team, having significant experience of Wind, Hydro, as well as Thermal power projects, including on-ground country wide RE execution experience. Prior to joining Azure, our CEO & COO co-founded Ostro Energy, where they financed, developed and executed a 1100 MW Wind heavy renewable energy platform. With strong in-house EPC & O&M teams, Azure is well positioned to take the opportunity and be competitive in all the emerging tender categories.
Sale of Assets
To optimize cost and to enhance returns on invested capital, in Fiscal 2021, we had decided to sell off certain subsidiaries on a going concern basis, which currently form part of our Rooftop business. Out of this identified portfolio, subsequent to March 2021, we entered the Rooftop Sale Agreement with Radiance to sell the “Rooftop Subsidiaries” having an operating capacity of 153 MW, for INR 5,350 million (US$ 73.1 million), subject to certain purchase price adjustments. Pursuant to the Rooftop Sale Agreement, Radiance will acquire 100% of the equity ownership of the Rooftop Subsidiaries owned by the Company’s subsidiaries Azure Power India Pvt. Ltd. and Azure Power Rooftop Pvt. Ltd, as more fully described below.
The sale of Rooftop Subsidiaries having 94.4 MWs operating capacity is expected to be consummated within the next 12 months and accordingly the assets and related liabilities of these subsidiaries are shown as “Assets classified as held for sale” in our consolidated balance sheet as of March 31, 2021. We recognized an impairment loss of INR 2,498 million (US$ 34.1 million) in our Consolidated Statement of Operations in this regard.
Further, under the terms of our Rooftop Sale Agreement with Radiance, 48.6% of the equity ownership in the 43.2 MWs operating capacity will be transferred to Radiance within next 12 months, and pursuant to the terms of the Green Bond Indentures, the remaining 51.4% may only be transferred to Radiance after our obligations under our Green Bonds are satisfied or such Green Bonds are refinanced. All of the cash flows related to such 43.2 MWs will continue to service our Green Bond obligations until the remaining 51.4% equity ownership in the 43.2 MWs is transferred to Radiance. As the refinancing of our Green Bonds is not anticipated to occur within 12 months, the assets and liabilities of these subsidiaries are not presented as “Assets classified as held for sale” and instead continue to be classified within the respective balance sheet captions as of March 31, 2021. In the event transference does not occur, we must reimburse Radiance the equity value of the assets not transferred along with an 10.5% per annum equity return. Based on management’s assessment the above sale transactions are probable over the period defined in the agreement.
There is also a restriction on transfer of equity ownership relating to the 16 MW project with Delhi Jal Board (DJB), wherein 49% of the equity ownership will be transferred to Radiance by the closing date with in next 12 months, and the remaining 51% will be transferred on or after March 31, 2024. Accordingly, the related assets and liabilities of the DJB 16 MW project are not presented as “Assets classified as held for sale” and instead continue to be classified within the respective balance sheet captions as of March 31, 2021.
We determined that the decision to sell the Rooftop Subsidiaries and the subsequent execution of the Rooftop Sale Agreement are indicators of impairment, and therefore, we undertook an impairment assessment for the Rooftop Subsidiaries. Management used the sale price in the Rooftop Sale Agreement as its best estimate of the recoverable
60
value of the Rooftop Subsidiaries. The impairment loss recorded in relation to the Property, Plant and Equipment of the Rooftop Subsidiaries not shown as “Assets classified as held for sale” was INR 657 (US$ 9.0 million).
The Company has further identified a subsidiary for sale, on a going concern basis at expected consideration of INR 123 million (US$ 1.7 million). Subsequent to year end, Company has entered into a sale agreement with buyer and pursuant there to, 100% of the ownership of this subsidiary was transferred to the buyer on receipt of consideration. The Company has recognized an impairment loss of INR 100 million (US$ 1.4 million) in the Consolidated Statement of Operations in this respect”
We recognized an impairment loss in relation to the rooftop subsidiaries aggregating to INR 3,255 million (US$ 44.5 million) during the fiscal year ended March 31, 2021 on account of above transactions.
Suppliers and Service Providers
We purchase major components such as solar panels and inverters directly from multiple manufacturers with industry standard warranty and guarantee terms. As of April 30, 2021, we had made over US$1.4 billion in purchases from our suppliers since inception. There are several suppliers in the market, and we select our suppliers based on quality, technology provided, expected cost, reliability, warranty coverage, ease of installation and other ancillary costs. As of the date of this annual report, our primary solar panel suppliers were Jinko Solar, First Solar FE Holdings PTE Ltd., Canadian Solar, Suntech, JA Solar, Waaree Energies Pvt. Ltd., Hanwha Q CELLS Co. Ltd, Risen Energy Co Ltd., GCL System Integration Technology Co Ltd., and our primary inverter suppliers were SMA Solar Technology AG, Huawei, Schneider Electric India Pvt. Ltd., Sungrow Power Supply Company, Solis Inverters, ABB India Limited. We also engage the engineering services of Lahmeyer Group, TÜV Rheinland, Black & Veatch, L&T SNL, Sgurr Energy and Fichtner Consulting Engineers. We typically enter into master contractual arrangements with our major suppliers that define the general terms and conditions of our purchases, including warranties, product specifications, indemnities, delivery and other customary terms. We normally purchase solar panels and the balance of system components on an as-needed basis from our suppliers at then-prevailing prices pursuant to purchase orders issued under our master contractual arrangements. We generally do not have any supplier arrangements that contain long-term pricing or volume commitments, although at times in the past we have made limited purchase commitments to ensure sufficient supply of components. The prices of components for our solar power plants have declined over longer time horizon as the manufacturers have lowered their cost of production. However, there was a shortage and price increase for certain raw materials in last two quarters of fiscal year ended March 31, 2021 including poly silicon, glass and ethylene-vinyl acetate (EVA).
We source lender technical due diligence and supplier third party certification from TUV and equivalent agencies.
Seasonality
The energy output performance of our plants is dependent in part on the amount of sunlight. As a result, there is a slight variation in quarterly revenues based on seasonality. Typically, any given fiscal year, which for us ends on March 31, our plant load factor (“PLF”) is lower in the second and third fiscal quarter due to monsoon and winters and higher in the first and fourth quarter due to clear sky and high irradiation.
61
Competition
We believe our primary competitors are other renewable energy developers such as ReNew Power Limited, Tata Power Solar Systems Limited, Adani Green Energy Limited, Softbank Energy, O2 Power private Limited and ACME Cleantech Solutions Private Limited. Competition to acquire new projects occurs at the development stage as we bid for long term PPAs in central and state renewable energy auctions. We compete with other renewable energy developers based on a number of factors, including the sourcing of equipment for renewable energy projects, reputation and track record, relationship with government authorities, access to capital, access to project land, efficiency and reliability in project development and ability to execute large projects. Our reputation, track record, shareholder base, governance framework help in securing the best financing terms and aid our relationship with government authorities while developing, constructing and operating renewable energy projects. Based on these factors, we believe that we compete favorably with our competitors in the regions we service. Approximately 95% of the counterparties of our total portfolio is rated investment grade, which we believe is a leading position among utility scale project developers with installed capacity of over 1 GW.
.
We also compete with utilities generating power from conventional fossil fuels. Utilities generating conventional energy face rising costs as the constraints on domestic fuel supply continue and these energy sources do not benefit from various governmental incentives available to renewable energy producers. As we reduce our levelized cost and achieve parity with conventional energy suppliers, we expect to compete favorably with these suppliers on the basis of cost and reliability.
Research and Development
Our intellectual property is an essential element of our business, and our success depends, at least in part, on our ability to protect our core technology and intellectual property. To accomplish this, we rely on a combination of patent, trade secret, trademark and other intellectual property laws, confidentiality agreements and license agreements to establish and protect our intellectual property rights.
Insurance
We maintain adequate insurance coverage to mitigate various business risks. Our insurance policies include, but are not limited to, erection all risk insurance, industrial all risk insurance, burglary insurance, fire and special perils insurance and directors and officer’s liability insurance. We acknowledge that adequate insurance is a very important part of risk mitigation and we follow industry best practices while securing insurance for our projects.
Regulation
Due to the industry and geographic diversity of our projects, our operations are subject to a variety of rules and regulations. If we are not in compliance with applicable legal requirements, we may be subject to civil or criminal penalties and other remedial measures. Set forth below is a brief overview of the principal laws and regulations currently governing the businesses of our Indian subsidiaries. The laws and regulations set out below are not exhaustive and are only intended to provide general information to the investors and are neither designed nor intended to be a substitute for professional legal advice.
The Electricity Act, 2003
The Electricity Act, 2003, as amended, (the “Electricity Act”) is a central unified legislation relating to generation, transmission, distribution, trading and use of electricity. The Electricity Act governs the establishment, operation and maintenance of any generating company and prescribes technical standards in relation to its connectivity with the grid. Further, in accordance with Section 7 of the Electricity Act, a generating company may establish, operate and maintain a generating station without obtaining a license under the Electricity Act in the event it complies with the technical standards relating to connectivity with the grid prescribed under clause (b) of Section 73 of the Electricity Act.
Under the Electricity Act, the State Electricity Regulatory Commissions, or “SERCs,” are required to promote
62
co‑generation and generation of electricity from renewable sources of energy and sale of electricity to any person from sources other than the incumbent distribution licensee under the provisions of open access. The Electricity Act further requires the SERCs to specify, for the purchase of electricity from renewable sources, a percentage of the total consumption of electricity within the area of a distribution licensee, which has been implemented in the form of renewable purchase obligations, or “RPOs.”
Further, we may supply electricity to any licensee or even directly to consumers, subject to availing open access to the transmission and distribution systems and payment of transmission charges, including wheeling charges and open access charges, as may be determined by the relevant electricity regulatory commission. In terms of the Electricity Act, open access means the non-discriminatory provision for the use of transmission lines or distribution system or associated facilities with such lines or system, by any licensee or consumer or a person engaged in generation in accordance with the regulations specified by the relevant electricity regulatory commission.
Broadly, tariffs may be determined in the following ways:
(i) | In terms of Section 62(1) of the Electricity Act, the Central Electricity Regulatory Commission (“CERC”) is empowered to determine the tariff for the supply of electricity by a generating company to a distribution licensee. The appropriate electricity regulatory commission is guided by certain principles while determining the tariff applicable to power generating companies which include amongst other things, principles and methodologies specified by the CERC for tariff determination, safeguarding consumer interest and other multiyear tariff principles and the implementation of the NEP, Tariff Policy and NTP 2016; |
(ii) | Under Section 63 of the Electricity Act, tariff may be determined through the process of bidding in accordance with the guidelines issued by the Government of India and the appropriate regulatory commission shall adopt tariffs in accordance with the provisions of the Electricity Act; and |
(iii) | The tariff that shall be determined through competitive bidding under section 63 of the Electricity Act or by the appropriate state electricity regulatory commission under section 62 of the Electricity Act shall reflect under a PPA executed between the State Government owned distribution licensee and the generating company which shall be approved by the appropriate regulatory commission. |
Additionally, the Electricity Rules, 2005 (the “Electricity Rules”) also prescribe a regulatory framework for developing captive generating plants. Pursuant to the Electricity Rules, a power plant shall qualify as a captive power plant only if not less than 26% of the ownership is held by captive users and not less than 51% of the aggregate electricity generated in such plant, determined on an annual basis, is consumed for captive use. Further, in case of association of persons, captive users are required to hold not less than 26% of the ownership of the plant in aggregate and consume not less than 51% of the electricity generated, determined on an annual basis, in proportion to their share ownership in the power plant within a variation not exceeding 10%.
In case of a generating station owned by a company formed as a special purpose vehicle for such generating station, the electricity required to be consumed by captive users is to be determined with reference to such unit or units identified for captive use and not with reference to the generating station as a whole, and equity shares to be held by the captive users must not be less than 26% of the proportionate equity interest of the company related to the generating unit or units identified as the captive generating plant.
The Ministry of Power introduced the Electricity Act (Amendment) Bill, 2020 (“Amendment Bill”) to amend the Electricity Act to promote the generation of electricity from renewable sources of energy. The Ministry of Power also introduced Electricity (Rights to Consumers) Rules, 2020 (“2020 Electricity Rules”) to empower consumers of electricity and confer rights upon the consumers to be entitled to reliable services and quality electricity. The 2020 Electricity Rules proposes to introduce, inter alia, installation of smart or pre-payment meter. Further, the Rules intend to ensure availability of 24x7 power to all the consumers with some exceptions for lower hours that the relevant State Electricity Regulatory Commission may specify for certain categories of consumers and introduces robust grievance redressal mechanism to be introduced by the distribution licensees.
63
The National Electricity Policy, 2005
The Government of India notified the National Electricity Policy on February 12, 2005 (“NEP”), under Section 3 of the Electricity Act, further amended in 2008 and 2011. The key objectives of the NEP, amongst other things are, stipulating guidelines for accelerated development of the power sector, providing supply of electricity to all areas and protecting interests of consumers and other stakeholders, keeping in view availability of energy resources, technology available to exploit these resources, economics of generation using different resources and energy security issues. The NEP provides that the network expansion be planned and implemented keeping in view anticipated transmission needs that would be incident on the system in the open access regime. The NEP encourages private investment in the transmission sector, and states that prior agreement with beneficiaries would not be a pre-condition for network expansion and the central transmission utility and the state transmission utility should undertake network expansion after identifying requirements in consultation with stakeholders and obtaining due regulatory approvals.
Further, NEP emphasizes the need to promote generation of electricity based on non-conventional sources of energy. The NEP provides that State Electricity Regulatory Commissions (“SERCs”) should specify appropriate tariffs in order to promote renewable energy (until renewable energy power producers (“REPPs”) relying on non-conventional technologies can compete within the competitive bidding system). SERCs are required to specify percentages of the total consumption of electricity in the area of a distribution licensee that progressively increase the share of electricity generated from renewable sources. Furthermore, the NEP provides that such purchase of electricity by distribution companies should be through competitive bidding.
The National Tariff Policy 2016
The Government of India notified the Tariff Policy on January 6, 2006, or the “Tariff Policy 2006,” under Section 3 of the Electricity Act, to ensure availability of electricity to consumers at reasonable and competitive rates, financial viability of the sector and to attract investment, promote transparency, consistency and predictability in regulatory approaches across jurisdictions, minimize perceptions of regulatory risks and promote competition and to guide CERC and the SERCs in discharging their functions.
In exercise of the powers conferred under Section 3 of the Electricity Act, the Government of India has notified the revised tariff policy to be applicable from January 28, 2016 (“NTP 2016”). NTP 2016 specifies that any action taken under the provisions of Tariff Policy, shall, in so far as it is not inconsistent with NTP 2016, be deemed to have been done or taken under the provisions of this NTP 2016. NTP 2016 has introduced several measures of reform and has an increased focus on renewable energy, sourcing power through competitive bidding and the need for ‘reasonable rates’ The objective of NTP 2016 inter alia, include:
(a) | Ensure availability of electricity to consumers at reasonable and competitive rates; |
(b) | Ensure financial viability of the sector and attract investments; |
(c) | Promote transparency, consistency and predictability in regulatory approaches across jurisdictions and minimise perceptions of regulatory risks; |
(d) | Promote competition, efficiency in operations and improvement in quality of supply; |
(e) | Promote generation of electricity from renewable sources; |
(f) | Evolve a dynamic and robust electricity infrastructure for better consumer services; |
(g) | Facilitate supply of adequate and uninterrupted power to all categories of consumers; and |
(h) | Ensure creation of adequate capacity including reserves in generation, transmission, and distribution in advance, for reliability of supply of electricity to consumers. |
The NTP 2016 has removed the ambiguity on applicability of the RPOs on co-generation as it has been clarified that co-generation from sources other than renewable sources shall not be excluded from the applicability of the RPO.NTP 2016 specifies that the renewable energy produced by each generator may be bundled with its thermal generation for the purpose of sale. In case an obligated entity procures such bundled power, then the SERCs will
64
consider the obligated entity to have met the RPO to the extent of power bought from such renewable energy generating stations.
Given the focus that NTP 2016 has on renewable power and competitive tariffs, the states have been mandated to make necessary endeavors to procure power from renewable energy through competitive bidding to keep the tariff low. The state governments can notify a policy to encourage investment in the state by allowing setting up of generating plants, including from renewable energy sources out of which a maximum of 35% of the installed capacity can be procured by distribution licensees of that state for which the tariff may be determined under pursuant to the Electricity Act. The tariff for such 35% of the installed capacity shall be determined by SERC.
Further, to encourage the renewable power sector, the Ministry of Power (“MoP”), vide order dated August 5, 2020, has waived the inter-state transmission charges and losses on transmission of electricity generated from the power plants for a period of 25 years from the date of commissioning of such power plants, which meet the following criteria: (a) Power plants using solar sources of energy with or without storage commissioned till June 30, 2023 for sale to entities having a RPO, irrespective of whether this power is within RPO or not, provided that in case of distribution licensees, the power has been procured competitively under the guidelines issued by the Central Government; (b) Solar PV power plants commissioned under “MNRE’s Central Public Sector Undertaking (CPSU) Scheme Phase-II (Government Producer Scheme) dated March 5, 2019”; and (c) Solar PV power plants commissioned under SECI Tender for manufacturing linked capacity scheme (RFS No. SECI/C&P/RfS/2GW Manufacturing/P-3/R1/062019 dated June 25, 2019) for sale to entities having RPO, irrespective of whether this power is within RPO or not. This waiver on ISTS charges has been further extended to June 30, 2025 vide MoP order June 21, 2021.
Further, to provide the required impetus to the renewable power sector, in accordance with suggestions made by NTP 2016, the MoP, vide notification bearing no. 23/12/2016/R&R, dated February 13, 2018, exempts solar projects from the applicability of charges and losses for use of inter-state transmission system for a period of 25 years from the date of commissioning of such solar projects, subject to fulfilment of certain conditions.
Award of contracts for supply of equipment and construction of the project, either through a turnkey or through well-defined packages, shall be done on the basis of international competitive bidding. NTP 2016 inter alia takes into account the following factors in determining the tariff:
(b) | Equity norm of 70:30 debt to equity ratio; |
(e) | Cost of management of foreign exchange risk i.e., the costs incurred on account of hedging and swapping to take care of foreign exchange variations; and |
(f) | Operating norms (to be evolved based on the incentives and disincentives along with appropriate arrangement for sharing the gains of efficient operations with the consumers). |
NTP 2016 also discusses the implementation of Multi-Year Tariff Framework, this framework is likely to minimize the risks for utilities and consumers, promoter efficiency and appropriate reduction of system losses and attract investments.
Guidelines for Tariff Based Competitive Bidding Process for Procurement of Solar Power
The Ministry of Power has issued guidelines on August 3, 2017, as amended on September 25, 2020, for procurement of solar power through tariff based competitive bidding process (“Competitive Bidding Guidelines”). The Competitive Bidding Guidelines aim to enable the distribution licensees to procure solar power at competitive rates in a cost-effective manner.
These Guidelines have been issued under the provisions of Section 63 of the Electricity Act for long term procurement of electricity, determined through the competitive bidding process, by the procurers, the distribution licensees, or the authorized representatives(s), or an intermediary procurer from grid-connected Solar PV Power
65
Projects having size of 5 MW and above or 50 MW and above, respectively. New Guidelines for Tariff Based Competitive Bidding Process will help to reduce risk, enhance transparency, and increase affordability of Solar Power.
Guidelines for Tariff Based Competitive Bidding Process for Procurement of Round-The-Clock Power from Grid Connected Renewable Energy Power Projects, complemented with Power from any other source or storage
The Ministry of Power has issued guidelines on July 22, 2020, as amended on November 3, 2020, and February 5, 2021, for procurement of round-the-clock power by DISCOMs from grid-connected renewable energy sources, complemented with firm power from any other source (“Round-The-Clock Guidelines”). The Round-The-Clock Guidelines mandate supply of at least 85% energy annually and 85% availability during peak hours, of which at least 51% of the annual energy offered corresponds to renewable energy power and the rest is from other sources. The obligation to supply energy during peak hours provides flexibility to DISCOMs and drives the need to integrate renewable energy with other sources.
Central Electricity Regulatory Commission (Terms and Conditions for Tariff Determination from Renewable Energy Sources) Regulations, 2020
CERC notified the Central Electricity Regulatory Commission (Terms and Conditions of Tariff Determination from Renewable Energy Sources) Regulations, 2020 (the “Tariff Regulations 2020”) on June 23, 2020. These regulations came into force from July 1, 2020, and shall remain effective till March 31, 2023, unless reviewed earlier or extended by CERC. The Tariff Regulations 2020 superseded the Central Electricity Regulatory Commission (Terms and Conditions for Tariff Determination from Renewable Energy Sources) Regulations, 2017 with effect from July 1, 2020. Under the Tariff Regulations 2020, CERC has specified certain parameters for determination of tariff for new sources of renewable energy such as floating solar project, renewable hybrid energy project and renewable energy project with storage in addition to those covered in past tariff regulations. In case of renewable energy projects for which generic tariff has to be determined as per these regulations, it will be done through a tariff order at least one month before the commencement of the year for each year of the control period, which is from July 2020 to March 2023. The other tariff, which is project specific, shall be determined by the CERC on a case-to-case basis for, amongst others, solar PV power projects, floating solar projects, solar thermal power projects, renewable hybrid energy projects and renewable energy with storage projects.
Central Electricity Regulatory Commission (Indian Electricity Grid Code) Regulations, 2010
The CERC in terms of the abovementioned regulations, as amended from time to time, has laid down the rules, guidelines and standards to be followed for planning, developing, maintaining and operating the power systems, in the most secure, reliable, economic and efficient manner. These regulations have been amended to require solar power generators to forecast and schedule their power generation on a day ahead basis. Further, the Grid Code provides a ‘must-run’ status to all solar power plants and exempts such power plants from ‘merit order dispatch’ principles. The schedule by solar generators which are regional entities may be revised by giving advance notice to the relevant Regional Load Despatch Centre.
Central Electricity Regulatory Commission (Open Access in Inter-State Transmission) Regulations, 2008 (the “CERC Open Access Regulations”)
The CERC Open Access Regulations, as amended from time to time, for inter-state transmission provide for a framework which not only facilitates traditional bilateral transactions (negotiated directly or through electricity traders), but also caters to collective transactions discovered in a power exchange through anonymous, simultaneous competitive bidding by sellers and buyers. Applicable to short-term open access transactions up to one month at a time, the emphasis of the CERC Open Access Regulations is on scheduling rather than reservation to ensure that the request of an open access customer is included in the dispatch schedules released by RLDCs. Further, certain types of transmission services by payment of transmission charges (to be levied in Rupees per MWh) shall be available to open access customers based on the type of transactions, i.e., bilateral or collective. In addition to transmission charges,
66
certain operating charges shall also be levied. The CERC Open Access Regulations enable entities connected to inter-state transmission as well as intra-state transmission and distribution systems to purchase power from a source other than the incumbent distribution licensee situated outside the relevant state. Further, the CERC Open Access Regulations also lay down the procedure for scheduling of transactions in Real-time market.
Central Electricity Regulatory Commission (Grant of Connectivity, Long term Access and Medium-term Open Access in inter State Transmission and related matters) Regulations, 2009 (“CERC Connectivity & Access Regulations”)
The CERC Connectivity & Access Regulations, as amended from time to time, provide a framework for granting connectivity, medium and long-term access to the inter-state transmission system (“ISTS”) Any power generating station, including a captive generating plant or a bulk consumer, is authorized to seek connectivity, medium and long-term access to the ISTS in accordance with the provisions made under these Regulations. CERC Connectivity & Access Regulations identifies Central Transmission Utility (“CTU”) as the nodal agency for grant of connectivity. With respect to medium and long-term access to ISTS, CTU is mandated to frame procedures concurrent to the CERC Connectivity & Access Regulations covering all the aspects as envisaged in the CERC Connectivity & Access Regulations in detail.
Central Electricity Regulatory Commission (Sharing of Inter State Transmission Charges and Losses) Regulations, 2020 (“CERC Transmission Charges Regulations 2020”)
The CERC, pursuant to the notification dated May 4, 2020, has announced the CERC Transmission Charges Regulations 2020. As per the CERC Transmission Charges Regulations 2020, transmission charges and losses for the use of ISTS are not payable for solar power-based projects whose useful life has been commissioned during the period from July 1, 2011, to June 30, 2017. The CERC Transmission Charges Regulations 2020 has come into force from November 1, 2020 and has superseded the CERC Transmission Charges Regulations 2010. On June 21, 2021, while superseding its notifications dated January 15, 2021, November 6, 2019 and August 5, 2020, the Ministry of Power, inter alia, exempted solar based generating projects commissioned until June 30, 2025 which were selling power to distribution licensees, whether under RPO or not, from the applicability of ISTS transmission charges for a period of 25 years from the date of commissioning of the power plants, provided the power has been competitively procured under the guidelines issued by the Central Government.
Central Electricity Regulatory Commission (Deviation settlement Mechanism and related matters) Regulations, 2014 (“F&S Regulations”)
The CERC in these regulations has laid down rules, guidelines, and standards for maintaining grid discipline and grid security as envisaged under the Grid Code through the commercial mechanism for Deviation Settlement through withdrawal and injection of electricity by the users of the grid including solar based plants connected to an interstate transmission network. The solar generators connected to interstate transmission networks are required to provide a daily 15 minutes time block wise generation schedule. The schedule may be revised by giving advance notice to the relevant Regional Load Despatch Centre. Any deviations between actual generation with respect to the schedule generation in the 15 minute time block is liable to attract commercial charges as per the formula prescribed in the F&S Regulations.
Central Electricity Regulatory Commission (Terms and Conditions for Recognition and Issuance of Renewable Energy Certificate for Renewable Energy Generation) Regulations, 2010 (“REC Regulations”
The CERC notified the REC Regulations on January 14, 2010 and the same was amended on March 28, 2016. The REC Regulations aim at the development of markets for power from non-conventional energy sources by issuance of transferable and saleable credit certificates. The REC Regulations facilitate fungibility and inter-state transaction of renewable energy with least cost and technicality involved. The CERC has nominated the National Load Despatch Centre as the central agency to perform the functions, including, inter alia, registration of eligible entities, issuance of certificates, maintaining and settling accounts in respect of certificates, acting as repository of transactions
67
in certificates and such other functions incidental to the implementation of REC mechanism as may be assigned by the CERC. The REC mechanism provides a market-based instrument which can be traded freely and provides means for fulfilment of RPOs by the distribution utilities/consumers.
The Ministry of New and Renewable Energy
The Ministry of New and Renewable Energy (the “MNRE”) is the nodal ministry of the Government of India at the national level for all matters relating to non-conventional sources of energy and renewable energy. The mandate of MNRE includes research, development, commercialization and deployment of renewable energy systems/devices for various applications in rural, urban, industrial and commercial sector.
Jawaharlal Nehru National Solar Mission
The National Solar Mission (“NSM”) was approved by the GoI on November 19, 2009 and launched on January 11, 2010. The NSM has set a target of 20,000 MW of solar power in India by 2022 and seeks to implement and achieve the target in three phases (Phase I from 2012 to 2013, Phase II from 2013 to 2017 and Phase III from 2017 to 2022). NSM aims at creating conditions for rapid scale up of capacity and technological innovation to drive down costs towards grid parity. The first phase (up to 2013) focused on promoting scale-up in grid-connected solar power capacity addition of 1,000 MW through scheme of bundling with thermal power operated through National Thermal Power Corporation’s Vidyut Vyapar Nigam Limited, to minimize the financial burden on the GoI, and a small component of 100 MW with generation-based incentive support through IREDA. The GoI has, in July 2015, enhanced the target to 100 GW solar capacity to be set up by 2021 — 22. Out of this, 60 GW will come through large and medium scale grid connected solar power projects and 40 GW through grid connected solar rooftops.
Viability Gap Funding Support from National Clean Energy Fund
Under the Jawaharlal Nehru National Solar Mission Phase II, MNRE had issued the state specific Viability Gap Funding (“VGF”) Scheme which envisages VGF through Solar Energy Corporation of India (“SECI”) to the bidders selected through a transparent bidding process to procure solar power at a pre-determined fixed tariff, so as to enable the provision of solar power at a reduced price. The VGF will be released in six tranches, 50% on successful commissioning of full capacity of the project (COD) and the balance 50% progressively over next five years subject to the project meeting generation requirements. If the project fails to generate any power continuously for any one-year within 25 years or its major assets (components) are sold or the project is dismantled during this tenure, SECI will have a right to refund VGF on a pro-rata basis and if not paid by the developer, then a claim on assets equal to the value of VGF released on pro-rata basis as specified in the Scheme.
National Institute of Solar Energy (“NISE”)
NISE is an autonomous research and development institution under the MNRE, Government of India, established to facilitate the research and development, testing, certification and skill development activities in the field of solar energy. NISE also supports the MNRE in the implementation of NSM.
Indian Renewable Energy Development Agency Limited
In 1987, MNRE established the Indian Renewable Energy Development Agency Limited (“IREDA”), a financial institution to complement the role of MNRE and make finance available to renewable energy projects. IREDA functions under the administrative control of MNRE. IREDA is involved in extending financial assistance and related services to promote deployment of renewable energy systems in India.
Renewable Purchase Obligations
The Electricity Act promotes the development of renewable sources of energy by requiring the SERCs to ensure grid connectivity and the sale of electricity generated from renewable sources. In addition, the Electricity Act and the
68
Tariff Policy require the SERCs to specify, for the purchase of electricity from renewable sources, a percentage of the total consumption of electricity within the area of a distribution licensee, which are known as RPOs. RPOs are required to be met by obligated entities (distribution licensees, captive power plants and open access consumers) by purchasing renewable energy, either by renewable energy power producers such as the Group, or by purchasing renewable energy certificates (“RECs”). The RPO regulations require the obligated entities to purchase power from renewable energy power producers such as our company. In the event of default by an obligated entity in any financial year, the SERC may direct the obligated entity to pay a penalty or to deposit an amount determined by the relevant SERC, into a fund to be utilized for, among others, the purchase of RECs.
In May 2015, the Supreme Court of India upheld a regulation that made it compulsory for captive power plants and open access customers to purchase electricity to fulfill their RPOs. This landmark judgment is expected to boost the demand for renewable energy by captive players and improve the marketability of RECs in India.
Ujjwal Discom Assurance Yojana (“UDAY”)
UDAY is a scheme formulated by the Ministry of Power, Government of India, vide Office Memorandum dated November 20, 2015. It provides for the financial turnaround of turnaround and revival of Power Distribution companies (“DISCOMs”) with an objective to improve the operational and financial efficiency of state-owned DISCOMs. The scheme is applicable only to state-owned DISCOMs including combined generation, transmission, and distribution undertakings.
Various state governments, their respective DISCOMs and the Government of India will enter into agreements which stipulate responsibilities of the entities towards achieving the operational and financial milestones under the scheme. One of the features of this scheme is that the states shall take over 75% of the debt of the DISCOMs as on September 30, 2015, over a period of 2 years — 50% of the DISCOM debt in 2015-16 and 25% in 2016-17 as per the mechanism provide for in the scheme.
Integrated Power Development Scheme
The Integrated Power Development Scheme (IPD Scheme) was launched pursuant to the Office Memorandum of the Ministry of Power, Government of India, dated December 3, 2014, by the Prime Minister of India on June 28, 2015, for urban areas, to ensure 24/7 power for all. The objective of the IPD Scheme is to (i) strengthen sub transmission and distribution network in the urban areas; (ii) meter distribution transformers/feeders/consumers in urban areas; and (iii) enable IT of the distribution sector and to strengthen the distribution network as per CCEA approval dated June 21, 2013 for completion of targets laid down under the Restructured Accelerated Power Development and Reforms Programme (RAPDRP) for the 12th and 13th Five Year Plans by carrying forward the approved outlay for RAPDRP to IPD Scheme. It aims to help in the reduction of AT&C losses, the establishment of IT enabled energy accounting/auditing system, improvement in billed energy based on metered consumption and improvement in collection efficiency. Central Electricity Regulatory Commission (Terms and Conditions for Recognition and Issuance of Renewable Energy Certificate for Renewable Energy Generation) Regulations, 2010.
The CERC notified the Central Electricity Regulatory Commission (Terms and Conditions for Recognition and Issuance of Renewable Energy Certificate for Renewable Energy Generation) Regulations, 2010 (the “REC Regulations”) on January 14, 2010 and was most recently amended on March 28, 2016. The REC Regulations aim at the development of market for power from non-conventional energy sources by issuance of transferable and saleable credit certificates. The REC Regulations facilitate fungibility and inter-state transaction of renewable energy with least cost and technicality involved. The CERC has nominated the National Load Despatch Centre as the central agency to perform the functions, including, inter alia registration of eligible entities, issuance of certificates, maintaining and settling accounts in respect of certificates, acting as repository of transactions in certificates and such other functions incidental to the implementation of the REC mechanism as may be assigned by the CERC. The REC mechanism provides a market-based instrument which can be traded freely and provides means for fulfilment of renewable purchase obligations by the distribution utilities/ consumers.
Integrated Day Ahead Market
69
Pursuant to a notification dated March 24, 2021, the Ministry of Power, India, an integrated day-ahead market (“Integrated DAM”) is expected to be launched at the power exchanges with separate price formation for power generated from renewable energy and conventional power. According to this notification, the proposed market structure should allow the buyer to meet the RPO target by directly buying green power from the exchange. The notification is proposed to be implemented by June 30, 2021.
Green Term Ahead Market
Indian Power Market commenced trading in Green Term Ahead Market (GTAM) on August 21, 2020. GTAM contracts will allow additional avenues to the RE generators for sale of renewable energy; enable Obligated entities to procure renewable power at competitive prices to meet their Renewable Purchase Obligations (RPO). Transactions through GTAM will be bilateral in nature with clear identification of corresponding buyers and sellers, there will not be any difficulty in accounting for RPO. GTAM contracts will be segregated into Solar RPO & Non-Solar RPO as RPO targets are also segregated. Energy scheduled through GTAM contract shall be considered as deemed RPO compliance of the buyer. This will also allow renewable energy rich states to trade the surplus power into the power exchange and RE deficit states would buy to balance their RPO targets.
Safety and Environmental Laws
We are governed by certain safety and environmental legislations, including the Hazardous Wastes and Other (Management and Transboundary Movement) Rules, 2016. The failure to comply with the Hazardous and Other Waste (Management and Transboundary Movement) Rules, 2016 may attract monetary penalties as levied by the State Pollution Control Board and a liability for any damage to the environment or third parties.
The three major statutes in India which seek to regulate and protect the environment against pollution and related activities in India are the Water (Prevention and Control of Pollution) Act 1974, the Air (Prevention and Control of Pollution) Act, 1981 and the Environment (Protection) Act, 1986. The basic purpose of these statutes is to control, abate and prevent pollution. In order to achieve these objectives, Pollution Control Boards (“PCB”) which are vested with diverse powers to deal with water and air pollution, have been set up in each state. The PCBs are responsible for setting the standards for maintenance of clean air and water, directing the installation of pollution control devices in industries and undertaking investigations to ensure that industries are functioning in compliance with the standards prescribed. These authorities also have the power of search, seizure, and investigation if the authorities are aware of or suspect pollution.
The Environment (Protection) Act, 1986 (“EPA”) vests the Government of India with the power to take any measure it deems necessary or expedient for protecting and improving the quality of the environment and preventing and controlling environmental pollution, including the power to prescribe standards for emission of environmental pollutants or handling of hazardous substances, inspection of any premises, plant, equipment or machinery, and examination of manufacturing processes and materials likely to cause pollution. In addition, there are obligations to furnish information to the authorities in certain cases, establishment of environment laboratories and appointment of Government analysts. The Ministry of Environment and Forest and Climate Change (“MoEF”) has issued notifications under the EPA in 1994, 1999 and 2006 (collectively, the “EIA Notifications”), prescribing the procedure with respect to environmental impact assessment for the commencement, expansion or modernization of industrial or mining operations.
Penalties for violation of the EPA includes fine up to Rs. 0.10 million or imprisonment of up to five years or both. Further, in case operations involve acquisition of forest land, prior clearance of the Indian government, through the MoEF shall be required in accordance with the provisions of the Forest (Conservation) Act, 1980, as amended (“Forest Conservation Act”). The penalties for non-compliance under the EPA and the Forest Conservation Act range from closure or prohibition of operations as well as monetary penalties on and imprisonment of the persons in charge of the conduct of the business of the company.
70
MoEF notification dated February 5, 2013, under the Scheduled Tribes and Other Traditional Forest Dwellers (Recognition of Forest Rights) Act, 2006, exempts companies from obtaining a resolution from Gram Sabhas for transmission projects using the forest land for non-forest purposes, in the interest of people living on the forest land, provided that it recognized rights of primitive tribal groups and pre-agricultural communities are not affected.
The Central Pollution Control Board of India (“CPCB”), a statutory organization established in 1974 under MoEF&CC is responsible for setting the standards for maintenance of clean air and water and providing technical services to the MoEF&CC. CPCB has classified industrial sectors under the red, orange and green categories.
The CPCB, vide notification dated March 7, 2016, released a new categorization of industries based on its pollution load (“Exemption Notification”). The Exemption Notification has introduced a new category of ‘White’ category industries which are generally are non-polluting, and therefore should not require consent to operate. The ‘White’ category of industries inter alia includes solar power projects generating power through photovoltaic cell. The White category of industries need not obtain a ‘Consent to Operate’ but should intimate the concerned State Pollution Control Board or the Pollution Control Committee. Each state is required to give effect to this notification of the Central Pollution Control Board and notify the category of industries in the state, which fall under the White List. The state pollution control boards of Gujarat, Andhra Pradesh, Karnataka, Telangana, Uttar Pradesh and Rajasthan have notified the categories of industries (which includes white category) following the order of the Central Pollution Control Board.
National Action Plan on Climate Change
The National Action Plan on Climate Change (the “NAPCC”) issued by the Government of India in 2008 has recommended that the national renewable energy generation standard be set at 5% of total grid purchase and that it be increased by 1% each year for ten (10) years, with the option for the SERCs to set higher minimum percentages than 5%, to ensure that by 2020, 15% of the total power capacity is generated from renewable energy sources. NAPCC also recommends imposition of penalty under the Electricity Act in case of utilities falling short to meet their RPOs.
Labor Laws
We are required to comply with certain labor and industrial laws, which include the Factories Act, 1948, the Industrial Disputes Act, 1947, the Employees State Insurance Act, 1948, the Employees’ Provident Funds and Miscellaneous Provisions Act, 1952, the Minimum Wages Act, 1948, the Payment of Bonus Act, 1965, the Workmen’s Compensation Act, 1923, the Payment of Gratuity Act, 1972, the Contract Labor (Regulation and Abolition) Act, 1970 and the Payment of Wages Act, 1936.
The Code on Wages, 2019 (“Wage Code”) regulates and amalgamates wage and bonus payments and subsumes four existing legislations, namely, the Payment of Wages Act, 1936, the Minimum Wages Act, 1948, the Payment of Bonus Act, 1965, and the Equal Remuneration Act, 1976. The Wage Code received assent from the President of India on August 8, 2019, however, is yet to be notified in the official gazette. The Wage Code provides for a minimum national wage rate fixed by the central governments. The appropriate governments are required to fix the minimum wage rate for their respective states above the floor wage set by the central government. In the event that the existing minimum wage rate of the appropriate governments is more than the floor wage set by the central government, such wage rates cannot be reduced. Further, the central government may fix different floor wages for different geographical areas and the appropriate governments shall fix the minimum rate of wages either on the basis of duration or piece of work. The Wage Code also prohibits gender discrimination in matters related to wages and recruitment in relation to same work of similar nature. The Wage Code further provides that all employees whose wages do not exceed a specific monthly amount, notified by the central or state government, will be entitled to an annual bonus. Under the Wage Code, in the event that any dispute arises between employer and employees with respect to fixation of or eligibility for payment of bonus under the Wage Code, such dispute shall be deemed to be an industrial dispute within the meaning of the Industrial Disputes Act, 1947.
71
Key policy notifications
ALMM List I notification, Notification dated March 10, 2021 - The Govt. has notified its first list of approved Solar PV modules (List I) under the Approved List of Models and Manufacturers (ALMM) order. This has been a long awaited step for the domestic solar manufacturing industry and is considered to be equivalent to a non-tariff import barrier. Foreign solar PV manufacturers are absent from the first list.
Basic custom duty imposition on solar cells & modules, Notification dated March 9, 2021 – The Government has notified its approval and decision to impose a basic customs duty (“BCD”) of 40% on solar modules, and 25% on solar cells, with effect from April 1, 2022, to curb imports and promote domestic manufacturing. The Government further clarified that solar developers need to take this into account for bidding going forward, and that this BCD imposition shall no longer be considered to be a change in law event, for future bids.
Inter-state transmission system waiver expiration– The Ministry of Power, in August 2020, waived inter-state transmission system (“ISTS)” charges and losses on all solar and wind projects commissioned before June 30, 2023. In January 2021, the Ministry of Power announced that it will not deprive renewable power projects of a waiver on charges and losses if they are commissioned after June 20, 2023, due to delays caused by the transmission provider or the government agency or due to force majeure.
State Regulations
Various states in India have from time to time, announced administrative policies and regulations in relation to solar power projects and related matters. These state-specific policies and regulations have material effects on our business because PPAs between project developers and state offtakers are entered into in accordance with the relevant state policies and regulations. Accordingly, these PPAs are standard form contracts and the project developers have no flexibility in negotiating the terms of the PPAs. The majority of our solar power plant generation occurs in Rajasthan, Gujarat, Punjab and Karnataka.
For instance, for the projects of the Restricted Subsidiaries in the states of Punjab, Karnataka, Maharashtra, Delhi, Odisha, Andhra Pradesh, Gujarat, Uttar Pradesh, Assam and Telangana, these projects are subject to certain state policies as discussed below.
In respect of rooftop projects of the Restricted Subsidiaries in the states of Maharashtra, Delhi and Odisha, we are required to comply with prudent utility practices and other specifications as provided in the power purchase agreements.
72
Rajasthan
Rajasthan Solar Energy Policy, 2019
The Rajasthan Renewable Energy Corporation Limited is the nodal agency responsible for promoting and developing renewable energy in the state of Rajasthan. The Government of Rajasthan has formulated the Rajasthan Solar Energy Policy, 2019 which has come into effect on December 18, 2019, and will remain in force until superseded or modified by another policy. The Rajasthan Solar Energy Policy, 2019 aims for the state of Rajasthan to be a major contributor for achieving the national target of 100 GW capacity of solar energy as a part of global commitment. All such power projects have been considered to be eligible industry unit by Industries Department of Government of Rajasthan.
Rajasthan Electricity Regulatory Commission (Forecasting, Scheduling, Deviation Settlement and Related Matters of Solar and Wind Generation Sources), 2017.
The Rajasthan Electricity Regulatory Commission (Forecasting, Scheduling, Deviation Settlement and Related Matters of Solar and Wind Generation Sources) 2017 (“RERC Forecasting Regulations”) were notified with an aim to facilitate large scale grid integration of solar projects while maintaining the grid security, reliability and security as envisaged under the grid code through forecasting, scheduling and commercial mechanism for settlement of deviations for solar projects.
Karnataka
Draft Karnataka Renewable Energy Policy 2021-2026
The Karnataka Renewable Energy Development Limited (“KREDL”) is the agency responsible for promoting and developing renewable energy in the state of Karnataka. KREDL has issued the draft Karnataka Renewable Energy Policy 2021-2026 (“Karnataka RE Policy”). Upon coming into force, the Karnataka RE Policy will be valid for a period of five years and will supersede all other solar and renewable energy policies in Karnataka, including the Karnataka Solar Policy 2014-2021 summarized below. The Karnataka RE Policy aims at developing 20GW of renewable energy projects with the option of adding energy storage systems. As per the policy, a target of 2GW has been set for rooftop solar installations over the next five years. Additionally, the policy focuses on the development and promotion of grid connected MW scale solar power projects, rooftop solar PV power projects, distributed solar generation, rooftop solar PV power projects for charging electric vehicles and battery swap stations and floating solar projects. In terms of policy incentives, KREDL aims to improve the ease of developing projects, through easier access to land, grid connectivity, project allotment, clearances, energy storage and metering and connectivity. The Karnataka RE Policy also aims to encourage private sector investment and public-private partnerships to develop transmission networks and green energy corridors. Further, solar projects with a minimum 1MW capacity shall be considered to be MW scale grid connected projects.
Karnataka Solar Policy 2014-2021
The Government of Karnataka has formulated the Karnataka Solar Policy 2014-2021 (“Karnataka Solar Policy”), which will remain in effect until 2021 or until notified. The Karnataka Solar Policy as amended aims to harness a minimum of 6,000 MW by 2021 in multiple phases. The Karnataka Solar Policy provides incentives such as tax concessions under the Karnataka Industrial Policy, 2014-2019 and central excise duty and customs duty exemptions. Solar energy projects below the capacity of 5 MW are further exempt from obtaining consent from the Karnataka Pollution Control Board, which is otherwise required under the pollution control laws of the state of Karnataka.
Karnataka Electricity Regulatory Commission (Terms and Conditions for Open Access) Regulations 2004 (“KERC Open Access Regulations”)
The KERC Open Access Regulations apply to open access customers for use of the intra state transmission systems and distribution systems of licensees in the State of Karnataka. The KERC Open Access Regulations, inter
73
alia, set out the procedure for grant of open access by the nodal agency, the priority for allowing open access and the charges payable for the use of such open access.
The Karnataka Electricity Regulatory Commission (Power Procurement from Renewable Sources by Distribution Licensee and Renewable Energy Certificate Framework) Regulations 2011 (“KERC Regulations”)
The KERC Regulations, as amended, apply to distribution licensees and any consumer consuming electricity generated from captive generating plant(s) or with a contract demand procured by open access, having a total installed capacity exceeding 5.0 MW within the state of Karnataka, and using fuel sources other than renewable sources. The KERC Regulations specify that every distribution licensee is required to purchase a minimum quantity of electricity from renewable sources of energy expressed as a percentage of its total procurement during a year.
The KERC Regulations grant power to the Karnataka Electricity Regulatory Commission to determine tariff for renewable sources of energy including biomass, which is subject to review every five years.
Punjab
In the Indian state of Punjab, the Punjab Energy Development Agency is the agency responsible for promotion and development of renewable energy development projects and energy conservation schemes. The government of Punjab has formulated the New and Renewable Sources of Energy Policy- 2012, (Punjab Solar Policy, 2012) and aims to harness 1,000 MWs of solar power generation capacity by 2022. All solar power projects developed under the Punjab Solar Policy, 2012 are treated as an industry in terms of industrial policy of Punjab and all the industrial incentives available to new industrial units will be applicable to solar power plants subject to the approval of Department of Industries and Commerce, government of Punjab. The Punjab State Power Corporation Limited reserves the right of first refusal on the power generated from renewable energy certificate based solar power projects and in case of refusal, the developer is permitted to sell the power under open access.
The predecessor of the Punjab Solar Policy, 2012 is the Punjab Solar Policy of 2006, which was operative up to 2012 and provided similar incentives to solar power developers, including in relation to land rent concessions, tax exemptions, exemptions from electricity duty, and single window mechanisms for government approvals.
Andhra Pradesh
APERC-Renewable Purchase Obligation (Compliance by purchase of Renewable Energy/ Renewable Energy Certificates) Regulation, 2017
The APERC-Renewable Purchase Obligation (Compliance by purchase of Renewable Energy/ Renewable Energy Certificates) Regulation, 2017 (“RPO Regulation 2017”) regulates the renewable purchase obligations of the distribution companies, captive consumers and third party. The RPO Regulation 2017 requires every distribution licensee and open access consumer to purchase such percentage of its total consumption of energy as specified separately for solar and non-solar sources as mentioned in the RPO Regulation 2017 during each of financial years from 2017-2018 to 2021-2022. This obligation will be on total consumption of electricity by an obligated entity. Purchase of RECs issued under the CERC (Terms and Conditions of Recognition and Issuance Renewable Energy Certificates for Renewable Energy Generation) Regulation, 2010 is also treated as fulfillment of RPO. A distribution licensee can also purchase renewable energy from another distribution licensee in the state to fulfill their RPO.
Andhra Pradesh Solar Power Policy, 2018
The New and Renewable Energy Development Corporation of Andhra Pradesh Limited is the nodal agency responsible for the development and promotion of renewable energy in the state of Andhra Pradesh. The Government of Andhra Pradesh has issued the Andhra Pradesh Solar Power Policy, 2018 (“AP Solar Policy 2018”) with a view to achieve total solar power capacity addition of 5,000 MW in the forthcoming five years, develop solar parks with the requisite infrastructure to encourage developers to set up solar power projects in Andhra Pradesh and to promote distributed generation to avoid upstream network cost and achieve loss reduction. All registered companies, government entities, partnership firms, individuals and all consumers of distribution companies located in Andhra
74
Pradesh will be eligible for setting up of solar power projects within for the sale of electricity or for captive use.
Andhra Pradesh Electricity Regulatory Commission Regulatory Commission Forecasting, Scheduling and Deviation Settlement of Solar and Wind Generation Regulations, 2017
The Andhra Pradesh Electricity Regulatory Commission Forecasting, Scheduling and Deviation Settlement of Solar and Wind Generation Regulations, 2017 (the “AP Forecasting Regulations”) apply to every solar energy generator in Andhra Pradesh connected to the transmission network of the Transmission Corporation of Andhra Pradesh and/or the distribution network of the DISCOMs (including those connected through pooling stations) and supplying power to DISCOMs or to third parties through open access or for captive consumption through open access, and selling power within or outside the state.
Andhra Pradesh Renewable Energy Export Policy, 2020
The Andhra Pradesh Renewable Energy Export Policy, 2020 (the “AP RE Export Policy”) is applicable to solar projects in the state of Andhra Pradesh and will remain in force for five years from July 17, 2020. It aims at developing and promoting renewable energy projects for the purpose of export of energy outside Andhra Pradesh without any obligation on the state DISCOMs to procure power. The primary objectives of AP RE Export Policy are to facilitate 120GW of renewable energy projects for export, lease five lakh acres of land for the production of renewable power, attract private investments in this sector and promote renewable energy manufacturing facilities in the state.
Gujarat
Gujarat Solar Power Policy, 2021
The Gujarat Energy Development Agency is the nodal agency responsible for promoting and developing renewable energy in the state of Gujarat. The State Government has announced Gujarat Solar Power Policy, 2021 on December 29, 2020, to align the solar power policy generation in the state with expansion of India’s solar power generation goals. This policy shall remain effective until December 31, 2025, and all the solar power systems installed and commissioned during the period of this policy are entitled to the incentives offered under this policy for a period of 25 years from the date of commissioning. The key incentives offered under this policy include removal of restriction on installed capacity, offering of power at a pre-fixed prices by the self-owned systems, no banking charges on solar power consumed by residential consumers from projects other than those for captive use, no transmission and wheeling charges and exemption from cross subsidy and additional surcharges.
Gujarat Electricity Regulatory Commission (Forecasting, Scheduling, Deviation Settlement and Related Matters for Solar and Wind Generation Sources) Regulations, 2019
The Gujarat Electricity Regulatory Commission (Forecasting, Scheduling, Deviation Settlement and Related Matters for Solar and Wind Generation Sources) Regulations, 2019 apply to every solar power generator having combined installed capacity of 1 MW and above and connected to the state grid, whether independently or through pooling substations, and generating power whether for self-consumption or for sale within or outside the state.
Uttar Pradesh
Uttar Pradesh Solar Energy Policy, 2017
Electricity generation from solar power projects is regulated by the Uttar Pradesh New and Renewable Energy Development Agency (“UPNREDA”) under the Uttar Pradesh Solar Energy Policy, 2017 (“UP Solar Policy”). The key objectives of the UP Solar Policy are to achieve solar power generation target of 10.7GW, out of which 4.3GW will be from rooftop solar projects and 6.4GW from utility-scale PV projects, and to achieve the target of 8% solar renewable purchase obligation by 2022. The UP Solar Policy introduces the net metering system with subsequent financial support and lowers the administrative burden for smaller scale projects. Grid connected power plants with capacity up to 10kW re exempted from inspection by the State Electrical Inspector. Land ceiling of 5.058 hectares has been removed for setting up solar power plants. There is a 100% exemption from payment of stamp duties and electricity duties. Private solar power generators have the freedom to sell the generated power inside or outside the state and are given a full waiver in transmission charges. Further, grid connected solar PV projects are exempted from
75
obtaining consents under pollution control laws from the U.P. State Pollution Control Board. UPNREDA will implement single window clearance systems for obtaining government approvals.
Telangana
Telangana Solar Power Policy 2015 (“Telangana Solar Policy”)
The Telangana New and Renewable Energy Development Corporation Limited is the agency responsible for the promotion and development of renewable energy in the state of Telangana. The Telangana Solar Policy, which became effective on June 1, 2015, aims at creating an enabling environment for prospective solar power developers to harness substantial quantum of solar power in the best possible manner. Its objective includes promotion of solar powers, decentralized and distributed generation, technologies of harnessing solar energy and public as well as private investment in solar power generation. It shall remain applicable for a period of five years. All solar projects that are commissioned during the operative period shall be eligible for the incentives declared under this policy, for a period of 10 years from the date of commissioning. The Telangana Solar Policy shall be applicable to the solar projects and solar roof-top projects set up within the state, as further described therein.
The Telangana Solar Policy provides for a single window clearance to facilitate and expedite approvals required for setting up solar power projects. Land acquired for grid-connected solar projects for sale to DISCOMs/captive use/group captive/third party sale or for solar parks shall be deemed to be converted to non-agricultural land status, on payment of applicable conversion charges. Solar projects using photovoltaic or solar thermal technology would be given clearances under the pollution control laws within a week by the Telangana State Pollution Control Board. Further, the ceiling limit as per the Land Ceiling Act will not be applicable for any land acquisition for solar power projects and solar parks.
The Government of Telangana proposes to incentivize development of solar power projects by 100% refund of stamp duty for land purchased for solar power projects and solar parks, 100% refund of VAT/SGST for all the inputs required for solar power projects for five years, etc.
Assam
In the Indian state of Assam, electricity generation from solar power projects is regulated by the Assam Energy Development Agency (“AEDA”) under the Assam Solar Energy Policy, 2017 (“Assam Solar Policy”). The Assam Solar Policy was issued by the government of Assam with effect from January 16, 2018 with the aim of fulfill its commitment under sustainable development goals by promoting clean, accessible, affordable and equitable solar energy availability to its citizens. To create an enabling environment for businesses and developers to participate and invest in the process of targeted solar power capacity expansion of 590 MWs by 2019-20 in the state of Assam by means of multiple models of solar power generation. MNRE has also allocated a target of 663 MWs of solar capacity to Assam to be achieved by 2022. The incentives under the Assam Solar Policy includes, among others, exemption from wheeling charges and transmission charges, exemption from electricity duty, exemption for a period of three years from the date of commissioning of a project and exemption of cross subsidy charges for third-party sales for three years.
Maharashtra
In the Indian state of Maharashtra, the Maharashtra Energy Development Agency (“MEDA”) is the nodal agency in renewable energy and state designated agency in energy conservation sector. The government of Maharashtra has formulated the Comprehensive Policy for Grid-connected Power Projects based on New and Renewable (Non-conventional) Energy Sources – 2015 to meet the target set by the Indian government for installation of solar power projects of 100GW capacity in the country by 2022. The policy aims to develop a total of 7,500MWs capacity of solar projects of which 2,500MWs will be developed by MAHAGENECO in public private partnership mode to fulfil the renewable energy generation obligation, while the remaining will be developed by other developers. The policy grants certain benefits such as allocation of land on concessional rates to eligible projects.
76
Bihar
Bihar Policy for Promotion of New and Renewable Energy Sources, 2017
The Bihar Renewable Energy Development Agency (“BREDA”) is the nodal agency responsible for the development of non-conventional sources of energy in the state of Bihar. With the aim of promoting such power generation, the government of Bihar has implemented the Bihar Policy for Promotion of New and Renewable Energy Sources, 2017 (“Bihar Policy”). The Bihar Policy will remain in effect for five years or until a new policy is notified. The primary aim is to target 2969MW of solar power generation by 2022, of which 1000MW will be from grid-connected rooftop solar PV projects. The generated power may be sold within the state to DISCOMs, through the renewable energy certificate mechanism or through open access mechanism to third parties or outside the state of Bihar. Solar power projects will be treated as an eligible industry for incentives under the schemes administered by the Industries Department. Further, incentives under the Bihar Industrial Investment Promotion Policy, 2016 will also be available to solar power producers, including stamp duty and tax related incentives. BREDA will also create a single window mechanism for obtaining approvals.
C. Organizational Structure
The following diagram illustrates our corporate structure as of the date of this annual report.
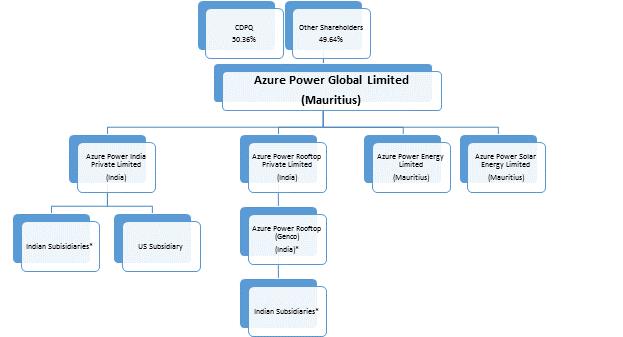
* To optimize cost and to enhance returns on invested capital, in Fiscal 2021, we identified certain subsidiaries to sell off on a going concern basis, which currently form part of our Rooftop business. Out of this identified portfolio, subsequent to March 2021, we entered a sales contract with Radiance Renewables Pvt. Ltd. (“Radiance”) to sell certain subsidiaries having an operating capacity of 153 MW for INR 5,350 million (US$ 73.1 million), subject to certain purchase price adjustments. For further information, see “Item 4. Information on the Company - B. Business Overview – Sale of Assets”.
77
The following table sets out our Company’s significant subsidiaries on the basis of operating capacity during the fiscal year ended March 31, 2021:
Name | | Country of Incorporation | | Percentage of Ownership | | |
Azure Power India Private Limited (Multiple projects) | | India | | | 99.99 | % | # |
Azure Power Pluto Private Limited (Punjab 4.1, 4.2 and 4.3) | | India | | | 99.99 | % | |
Azure Power Thirty-Seven Private limited (Telangana 1) | | India | | | 99.40 | % | |
Azure Power Thirty-Four Private Limited (Maharashtra 3) | | India | | | 99.99 | % | |
Azure Power Thirty-Three Private Limited (Gujarat 2) | | India | | | 99.99 | % | |
Azure Power Forty-Three Private Limited (Rajasthan 6) | | India | | | 99.99 | % | |
# Azure Power Global Limited has exercised its option to buy the shares it did not hold in AZI. However, the transaction has not been completed as the purchase of shares by Azure Power India from the Founder shareholders is under arbitration. For further details, please see “Item 3 Key Information - D. Risk Factors- we are subject to claims, arbitration claims and other legal proceedings pertaining to executive compensation or other stock-related matters in addition to other litigation in the ordinary course of business”.
D. Property, Plants and Equipment
Our Company’s principal executive offices are located at 5th Floor, Southern Park, D-II, Saket Place, Saket, New Delhi 110017, India which occupies approximately 20,550 square feet of space. Our power projects are located primarily on land leased from the state governments and third parties and freehold land purchased by us from private individuals and entities. Further, we source the land required for construction of plants under the land lease arrangement or procure at the required locations of the plant. Our land lease arrangements range typically from 25 to 35 years, but our PPAs are generally for a term of 25 years. We believe that our facilities are in good condition and generally suitable and adequate for our needs in the foreseeable future. However, we will continue to seek additional space as needed to satisfy our growth.
None
ITEM 5. OPERATING AND FINANCIAL REVIEW AND PROSPECTS
The following discussion of our business, financial condition and results of operations should be read in conjunction with “Item 3. Key Information — A. Selected Consolidated Financial Data” and our consolidated financial statements and the related notes included elsewhere in this annual report. This discussion contains forward-looking statements and involves numerous risks and uncertainties, including, but not limited to, those described in “Item 3. Key Information — D. Risk Factors” and elsewhere in this annual report. Actual results could differ materially from those contained in any forward-looking statements.
Overview
Our mission is to be the lowest-cost renewable energy power producer. We sell renewable power in India on long term fixed price contracts to our customers, at prices which in many cases are at or below prevailing alternatives for our customers.
78
We generate revenue from a mix of leading government entities such as NTPC Limited, NTPC Vidyut Vyapar Nigam Limited, a subsidiary of NTPC Limited, and the SECI as well as commercial establishments under our rooftop business. We typically enter into 25year power purchase agreements, or PPAs with these customers who pay a fixed rate for electricity generated by our RE plants. Our financial strategy is to build our RE assets with the most efficient cost of capital available to us. Because we have our own engineering, procurement and construction, or EPC, as well as O&M capabilities, we retain the profit margins associated with those services that other project developers normally pay to third party providers. Through value engineering, operational performance monitoring and efficient financial strategy, we are able to deliver cost-effective energy to our customers.
We recognize revenue from renewable energy sold to our customers on a per kilowatt hour basis based on the energy actually supplied by our renewable power plant. The price at which we sell renewable energy depends on our bidding strategy, as most auctions award bids starting from the lowest bidder until the total capacity is awarded.
We recognize revenue on a monthly basis from the solar energy kilowatt hours sold to our customers post the installation of the system and approval of the energy grid connections. The energy output performance of our plants is dependent in part on the amount of sunlight. As a result, our revenue in the past has been impacted by shorter daylight hours in winters. Typically, our PLF from operational solar power plants is lowest in the third quarter and highest in the first quarter of any given fiscal year which ends on March 31.
A significant portion of the cost of our solar power plants consists of solar photovoltaic panels, inverters and other plant equipment. Other less significant costs of our solar power plants include land or leasehold land costs, financing costs and installation costs. Our cost of operations primarily consists of expenses pertaining to operations and maintenance of our solar power plants. These expenses include payroll and related costs for plant maintenance staff, plant maintenance, insurance and, if applicable, lease costs.
Under U.S. GAAP, we depreciate the capital cost of solar power plants over the estimated useful life of 25-35 years. We typically fund our projects through a mix of project finance and sponsor equity. Our project financing agreements typically restrict the ability of our project subsidiaries to distribute funds to us unless specific financial thresholds are met on specified dates. Some of our project finance borrowings are denominated in U.S. dollars and therefore foreign currency exchange rate fluctuations (which are not hedged) can adversely impact our profitability. Some of our borrowings have variable interest rates and changes in such rates may lead to an adverse effect on our overall cost of capital.
79
Power Purchase Agreements
The material terms of the PPAs we have entered into and bids we have won as of March 31, 2021 are summarized in the following table.
Project Names | | Commercial Operation Date (1) | | PPA Capacity (MW) | | | DC Capacity (MW) | | | Tariff (INR / kWh) | | | (6) | | Offtaker | | Duration of PPA in Years | |
Utility | |
Operational | |
Gujarat 1.1 | | Q2 2011 | | | 5 | | | | 5 | | | 15.00 | | (2) | | | Gujarat Urja Vikas Nigam Limited | | | 25 | |
Gujarat 1.2 | | Q4 2011 | | | 5 | | | | 5 | | | 15.00 | | (2) | | | Gujarat Urja Vikas Nigam Limited | | | 25 | |
Punjab 1 | | Q4 2009 | | | 2 | | | | 2 | | | | 17.91 | | | | | NTPC Vidyut Vyapar Nigam Limited | | | 25 | |
Rajasthan 1 | | Q4 2011 | | | 5 | | | | 5 | | | | 11.94 | | | | | NTPC Vidyut Vyapar Nigam Limited | | | 25 | |
Rajasthan 2.1 | | Q1 2013 | | | 20 | | | | 22 | | | | 8.21 | | | | | NTPC Vidyut Vyapar Nigam Limited | | | 25 | |
Rajasthan 2.2 | | Q1 2013 | | | 15 | | | | 18 | | | | 8.21 | | | | | NTPC Vidyut Vyapar Nigam Limited | | | 25 | |
Punjab 2.1 | | Q3 2014 | | | 15 | | | | 15 | | | | 7.67 | | | | | Punjab State Power Corporation Limited | | | 25 | |
Punjab 2.2 | | Q4 2014 | | | 15 | | | | 15 | | | | 7.97 | | | | | Punjab State Power Corporation Limited | | | 25 | |
Punjab 2.3 | | Q4 2014 | | | 4 | | | | 4 | | | | 8.28 | | | | | Punjab State Power Corporation Limited | | | 25 | |
Karnataka 1 | | Q1 2015 | | | 10 | | | | 10 | | | | 7.47 | | | | | Bangalore Electricity Supply Company Limited | | | 25 | |
Uttar Pradesh 1 | | Q1 2015 | | | 10 | | | | 12 | | | | 8.99 | | | | | Uttar Pradesh Power Corporation Limited | | | 12 | |
Rajasthan 3.1 | | Q2 2015 | | | 20 | | | | 23 | | | 5.45 | | (3) | | | Solar Energy Corporation of India Limited | | | 25 | |
Rajasthan 3.2 | | Q2 2015 | | | 40 | | | | 43 | | | 5.45 | | (3) | | | Solar Energy Corporation of India Limited | | | 25 | |
Rajasthan 3.3 | | Q2 2015 | | | 40 | | | | 41 | | | 5.45 | | (3) | | | Solar Energy Corporation of India Limited | | | 25 | |
Chhattisgarh 1.1 | | Q2 2015 | | | 10 | | | | 10 | | | | 6.44 | | | | | Chhattisgarh State Power Distribution Company Limited | | | 25 | |
Chhattisgarh 1.2 | | Q2 2015 | | | 10 | | | | 10 | | | | 6.45 | | | | | Chhattisgarh State Power Distribution Company Limited | | | 25 | |
Chhattisgarh 1.3 | | Q3 2015 | | | 10 | | | | 10 | | | | 6.46 | | | | | Chhattisgarh State Power Distribution Company Limited | | | 25 | |
Rajasthan 4 | | Q4 2015 | | | 5 | | | | 6 | | | 5.45 | | (3) | | | Solar Energy Corporation of India Limited | | | 25 | |
Delhi 1.1 | | Q4 2015 | | | 2 | | | | 2 | | | 5.43 | | (3) | | | Solar Energy Corporation of India Limited | | | 25 | |
Karnataka 2 | | Q1 2016 | | | 10 | | | | 12 | | | | 6.66 | | | | | Bangalore Electricity Supply Company Limited | | | 25 | |
Andhra Pradesh 1 (4) | | Q1 2016 | | | 50 | | | | 54 | | | | 6.63 | | (2) | | | Southern Power Distribution Company of Andhra Pradesh Limited | | | 25 | |
Punjab 3.1 | | Q1 2016 | | | 24 | | | | 25 | | | | 7.19 | | | | | Punjab State Power Corporation Limited | | | 25 | |
Punjab 3.2 | | Q1 2016 | | | 4 | | | | 4 | | | | 7.33 | | | | | Punjab State Power Corporation Limited | | | 25 | |
Bihar 1 | | Q3 2016 | | | 10 | | | | 11 | | | | 8.39 | | | | | North & South Bihar Power Distribution Company Limited | | | 25 | |
Punjab 4.1 | | Q4 2016 | | | 50 | | | | 52 | | | | 5.62 | | | | | Punjab State Power Corporation Limited | | | 25 | |
Punjab 4.2 | | Q4 2016 | | | 50 | | | | 52 | | | | 5.63 | | | | | Punjab State Power Corporation Limited | | | 25 | |
Punjab 4.3 | | Q4 2016 | | | 50 | | | | 52 | | | | 5.64 | | | | | Punjab State Power Corporation Limited | | | 25 | |
Karnataka 3.1 | | Q1 2017 | | | 50 | | | | 54 | | | | 6.51 | | | | | Chamundeshwari Electricity Supply Company Limited | | | 25 | |
Karnataka 3.2 | | Q1 2017 | | | 40 | | | | 42 | | | | 6.51 | | | | | Hubli Electricity Supply Company Limited | | | 25 | |
Karnataka 3.3 | | Q1 2017 | | | 40 | | | | 42 | | | | 6.51 | | | | | Gulbarga Electricity Supply Company Limited | | | 25 | |
Maharashtra 1.1 | | Q1 2017 | | | 2 | | | | 2 | | | 5.50 | | (3) | | | Ordinance Factory, Bhandara | | | 25 | |
Maharashtra 1.2 | | Q1 2017 | | | 5 | | | | 6 | | | | 5.31 | | | | | Ordinance Factory, Ambajhari | | | 25 | |
Andhra Pradesh 2 (5) | | Q2 2017 | | | 100 | | | | 130 | | | | 5.12 | | | | | NTPC Limited | | | 25 | |
Uttar Pradesh 2 | | Q2-Q3 2017 | | | 50 | | | | 59 | | | | 4.78 | | | | | NTPC Limited | | | 25 | |
Telangana 1 | | Q1 2018 | | | 100 | | | | 128 | | | | 4.67 | | | | | NTPC Limited | | | 25 | |
Uttar Pradesh 3 | | Q2 2018 | | | 40 | | | | 51 | | | | 4.43 | | (3) | | | Solar Energy Corporation of India Limited | | | 25 | |
Andhra Pradesh 3 | | Q2 2018 | | | 50 | | | | 59 | | | | 4.43 | | (3) | | | Solar Energy Corporation of India Limited | | | 25 | |
Gujarat 2 | | Q4 2018 – Q1 2019 | | | 260 | | | | 363 | | | | 2.67 | | | | | Gujarat Urja Vikas Nigam Limited | | | 25 | |
Karnataka 4.1 | | Q1 2019 | | | 50 | | | | 75 | | | | 2.93 | | | | | Bangalore Electricity Supply Company | | | 25 | |
Karnataka 4.2 | | Q1 2019 | | | 50 | | | | 75 | | | | 2.93 | | | | | Hubli Electricity Supply Company Limited | | | 25 | |
Rajasthan 5 | | Q2-Q3 2019 | | | 200 | | | | 262 | | | | 2.48 | | | | | Solar Energy Corporation of India Limited | | | 25 | |
Maharashtra 3 | | Q3 2019 | | | 130 | | | | 195 | | | | 2.72 | | | | | Maharashtra State Electricity Distribution Company Limited | | | 25 | |
Assam 1 | | Q3 2020 | | | 25 | | | | 37 | | | | 3.34 | | | | | Assam Power Distribution Company | | | 25 | |
Rajasthan 6 | | Q4 2020- Q1 2021 | | | 300 | | | | 448 | | | | 2.53 | | | | | Solar Energy Corporation of India Limited | | | 25 | |
Others (8) | | Q1 2018-Q4 2019 | | 7 | | | | 10 | | | 3.36 | | (4) | | | Various | | | 25 | |
Total Operational Capacity | | | | | 1,990 | | | | 2,558 | | | | | | | | | | | | | |
Under Construction | | | | | | | | | | | | | | | | | | | | | | |
Assam 1# | | Q1-Q4 2021 | | | 65 | | | | | | | | 3.34 | | | | | Assam Power Distribution Company | | | 25 | |
Rajasthan 6# | | Q1 -Q3 2021 | | | 300 | | | | | | | | 2.53 | | | | | Solar Energy Corporation of India Limited | | | 25 | |
80
Rajasthan 8# | | Q4 2021 | | | 300 | | | | | | | | 2.58 | | | | | Solar Energy Corporation of India Limited | | | 25 | |
Rajasthan 9# | | Q1 2022 | | | 300 | | | | | | | | 2.54 | | | | | Solar Energy Corporation of India Limited | | | 25 | |
Total Under Construction- Utility | | | | | 965 | | | | | | | | | | | | | | | | | |
| | | | | | | | | | | | | | | | | | | | | | |
2 GW Project 1 | | | | | 2,000 | | (7) | | | | | 2.92 | | | | | Solar Energy Corporation of India Limited | | | 25 | |
2 GW Project 2 | | | | | 2,000 | | (7) | | | | | 2.92 | | | | | Solar Energy Corporation of India Limited | | | 25 | |
Total Contracted & Awarded Capacity – Utility | | | | | 4,000 | | | | | | | | | | | | | | | | | |
Total Portfolio* | | | | | 6,955 | | | | | | | | | | | | | | | | | |
Notes:
(1) | Refers to the applicable quarter of the calendar year in which commercial operations commenced or are scheduled to commence based on AC capacity. There can be no assurance that our projects under construction and our Contracted projects will be completed on time or at all. |
(2) | Current tariff, subject to escalation. Please also see “—Tariff structure” |
(3) | Projects are supported by VGF, in addition to the tariff. Please also see “—VGF for projects” |
(4) | Levelized tariff; includes capital incentive. |
(5) | Projects under accelerated depreciation per the Indian Income tax regulation. |
(6) | In the case of projects with more than one PPA, tariff is calculated as the weighted average of the PPAs for such project. |
(7) | LOA received. PPA yet to be signed. |
(8) | Others include projects with Hindustan Aeronautics Limited (HAL), Decathlon and other offtakers. |
# | Due to the COVID-19 pandemic, there is uncertainty around the timing of construction of projects and this is our best estimate of completion. |
* | In Fiscal 2021, we identified certain subsidiaries to sell off on a going concern basis, which currently form part of our Rooftop business. Out of this identified portfolio, subsequent to March 2021, we entered a sales contract with Radiance to sell certain subsidiaries having an operating capacity of 153 MW for INR 5,350 million (US$ 73.1 million), subject to certain purchase price adjustments. Hence, the Company has not considered these rooftop portfolios for reporting under its total portfolio as at year end. |
Our PPA’s typically require certain conditions are met including, among others, that we have obtained all necessary consents and permits, financing arrangements have been made and an agreement has been entered into to provide for the transmission of power. Furthermore, the PPAs contain customary termination provisions and negative and affirmative covenants, including the provision of performance bank guarantees and minimum guarantees of power to be sold and restrictions on changing the controlling shareholder of the project subsidiaries.
Megawatts Allotted or Won at Auction
During fiscal year 2020, we won a bid for 2,000 MWs manufacturing linked project with SECI and also elected to exercise a greenshoe option for an additional 2,000 MWs as per auction guidelines. During fiscal 2020, we received a Letter of Award (“LOA”) for the 2,000 MWs project and also received a LOA for the greenshoe option for 2,000 MWs, during Fiscal 2021. We continue to work towards signing PPAs for these 4,000 MWs projects. SECI has informed us that so far there has not been adequate response from the DISCOMs for SECI to be able to sign the PSAs at this stage even though LOAs have been received. SECI has mentioned that they will be unable to sign PPAs until PSAs have been signed, and they have committed to inform us of developments in their efforts with the DISCOMS. Capital costs, interest rates and foreign exchange rates have improved since we won the 4 GWs auction in fiscal year 2020 which have resulted in lower tariffs in other recent SECI auctions. We expect these savings likely will be passed on to the DISCOMs. We expect a tariff markdown from the price achieved in the auction, which will facilitate signing of PSAs. We will continue our discussions with SECI towards signing PPAs in respect of the 4,000 MWs projects and expect the PPAs to be signed in tranches over a period of time. For information on the risk of not executing PPAs in respect of our 4 GWs manufacturing linked tender, see “Item 3 Key Information – D. Risk Factors - We may not be able to sign PPAs in respect of the 4GW manufacturing linked tender for which a letter of award has been received.”
81
Tariff structure
The tariff for Gujarat 1.1 and Gujarat 1.2 is INR 15.0 per kilowatt hour for the first 12 years and INR 5.0 per kilowatt hour for remainder of the contract term. The tariff for Andhra Pradesh 1 is INR 5.89 per kilowatt hour for first year, increasing by 3% each year from the second year to the tenth year and thereafter with the same tariff as that in year ten for the remainder of the 25-year term. For the other projects we have a fixed rate structure.
VGF for projects
The VGF for Rajasthan 3.1 project is INR 23.0 million per MW, for Rajasthan 3.2 it is INR 22.0 million per MW, for Rajasthan 3.3 it is INR 13.0 million per MW and Rajasthan 4 it is INR 12.9 million per MW. The VGF for Andhra Pradesh 3 project is INR 7.4 million per MW. The VGF for Maharashtra 1 project is INR 0.9 million per MW. The VGF for Uttar Pradesh 3 is INR 8.0 million per MW. The VGF for Delhi 1 is INR 4.6 million per MW.
Key Operating and Financial Metrics
Use of certain Non-US GAAP measures
We use certain financial and non-financial, non- GAAP measures to provide a comparison of our performances. The non-financial metrices include electricity generation, Plant load factor, MW operating, MW contracted & awarded and MW Operating, Contracted & Awarded. We also use certain non-USGAAP financial metrices such as Cost per MW operating, nominal contracted payments, portfolio revenue run-rate, Adjusted EBITDA and Cash Flow to Equity to provide a comparison of our financial results. We also provide non-financial metrices, which are commonly used in the industry to help users compare us with our peers and better demonstrate growth in terms of our current capacity, as well as our future capacity. The use of non-U.S.GAAP measures help the users in comparing our performance period over period and see how we have improved its productivity in reducing the cost of building a plant through cost per megawatt as well as measure the output of the plants through Plant Load Factors. The non-financial metrices are used by analysts and investors in arriving at the fair valuation of the company through projecting future revenue as well as predicting the results of the company. We have been using and providing the metrices consistently over a period of time and believe that our investors not only find the metrices useful but also understand the methodology of computation.
The metrices are detailed below:
Summary of key metrices
We regularly review a number of specific metrics, including the following key operating and financial metrics, to evaluate our business performance, identify trends affecting our business and make strategic decisions.
Key metrics | | Unit of Measurement | | Fiscal Year 2019 | | | Fiscal Year 2020 | | | Fiscal Year 2021 | | |
Revenue (1) | | INR in millions | | | 9,926 | | | | 12,958 | | | | 15,236 | | |
Revenue (2) | | US$ in millions | | | 143.5 | | | | 171.9 | | | 208.3 | | |
Electricity generation (3) | | kWh in millions | | | 1,733 | | | | 2,870 | | | | 3,495 | | |
Plant load factor | | % | | | 18.6 | | | | 19.5 | | | | 20.9 | | |
Cost per MW Operating (4) | | INR in millions | | | 40.7 | | | | 35.5 | | | | 28.8 | | |
MW Operating | | MW | | | 1,441 | | | | 1,808 | | | | 1,990 | | (5) |
MW Contracted & Awarded | | MW | | | 1,915 | | | | 5,307 | | | | 4,965 | | |
MW Operating, Contracted & Awarded | | MW | | | 3,356 | | | | 7,115 | | | | 6,955 | | (5) |
(1) | Revenue consists of revenue from the sale of power, including other revenue items related to generation from renewable power. |
82
(2) | Translation of balances in the key operating and financial matrices from INR into US$, as of and for the fiscal year ended March 31, 2021 are solely for the convenience of the readers and were calculated at the rate of US$1.00 = INR 73.14, the noon buying rate in New York City for cable transfers in non U.S. currencies, as certified for customs purposes by the Federal Reserve Bank of New York on March 31, 2021. No representation is made that the INR amounts could have been, or could be, converted, realized or settled into US$ at that rate on March 31, 2021, or at any other rate. |
(3) | Electricity generation represents the actual amount of power generated by our solar power plants over the reporting period and is the product of plant load factor during the reporting period and the average megawatts operating. |
(4) | Installation per MW of DC capacity and includes INR 2.7 million (US$0.04 million) per MW operating of safe-guard duties which we expect to recover. |
(5) | In Fiscal 2021, we identified certain subsidiaries to sell off on a going concern basis, which currently form part of our Rooftop business. Out of this identified portfolio, subsequent to March 2021, we entered a sales contract with Radiance to sell certain subsidiaries having an operating capacity of 153 MW for INR 5,350 million (US$ 73.1 million), subject to certain purchase price adjustments. Hence, we have not considered these rooftop portfolios for reporting under its total portfolio as at year end. |
Operating Metrics
Megawatts Operating and Megawatts Contracted & Awarded
We measure the rated capacity of our plants in megawatts. Rated capacity is the expected maximum output that a solar power plant can produce without exceeding its design limits. We believe that tracking the growth in aggregate megawatt rated capacity is a measure of the growth rate of our business.
Megawatts Operating represents the aggregate cumulative megawatt rated capacity of solar power plants that are commissioned and operational as of the reporting date.
Megawatts Contracted & Awarded represents the aggregate megawatt rated capacity of solar power plants pursuant to customer PPAs signed, allotted or won in an auction but not commissioned and operational as of the reporting date.
The following table represents the megawatts Operating and megawatts Contracted & Awarded as of the end of the respective periods presented:
| | As of March 31, | |
| | 2019 | | | 2020 | | | 2021* | |
Megawatts Operating | | | 1,441 | | | | 1,808 | | | | 1,990 | |
Megawatts Contracted & Awarded | | | 1,915 | | | | 5,307 | | | | 4,965 | |
Megawatts Operating, Contracted & Awarded | | | 3,356 | | | | 7,115 | | | | 6,955 | |
| * | The decrease in Megawatts Operating, Contracted & Awarded from March 31, 2020 to March 31, 2021 reflects the agreement to sell our non-core rooftop portfolio of assets. |
We target having 2,750 MWs to 2,955 MWs (excluding the rooftop portfolio, for which we have entered into an agreement to sell subsequent to the year-end) operating by March 31, 2022, but this is subject to risks related to the current COVID-19 situation. Our ability to achieve this guidance will depend on, among other things, our ability to acquire the required land for the new capacity (on lease or direct purchase), raising adequate project financing and working capital, our ability to further strengthen our operations team to execute the increased capacity, and our ability to further strengthen our systems and processes to manage the ensuing growth opportunities, as well as the other risks and challenges discussed in “Item 3. Key Information—D. Risk Factors.”
83
Plant Load Factor
The plant load factor is the ratio of the actual output of all our solar power plants over the reporting period to their potential output if it were possible for them to operate at full rated capacity. The plant load factor is not the same as the availability factor. Our solar power plants have high availability, that is, when the sun is shining our plants are almost always able to produce electricity. The variability in our plant load factor is a result of seasonality, cloud covers, air pollution, the daily rotation of the earth, equipment efficiency losses, breakdown of our transmission system and grid availability. We compute PLF on the basis of PPA capacity (or AC), which may be lower than the actual installed (DC) capacity.
We track plant load factor as a measure of the performance of our power plants. It indicates effective utilization of resources and also validates our value engineering and operation research. Higher plant load factor at a plant indicates increased electricity generation. Monitoring plant load factor on real time allows us to respond rapidly to potential generation anomalies. Plant load factor (AC) was 19.5% for the fiscal year 2020 compared with 20.9% for the fiscal year 2021, primarily due to greater optimization of new facilities by adding additional DC capacity to our existing facilities.
| | Fiscal Year Ended March 31, | |
| | 2019 | | | 2020 | | | 2021 | |
Plant Load Factor (AC) (%) | | | 18.6 | | | | 19.5 | | | | 20.9 | |
Electricity Generation
Electricity generation represents the actual amount of power generated by our solar power plants over the reporting period and is the product of reporting period plant load factor and the average megawatts operating. This is a measure of the periodic performance of our solar power plants.
| | Fiscal Year Ended March 31, | |
| | 2019 | | | 2020 | | | 2021 | |
Electricity Generation (kilowatt hours in millions) | | | 1,733 | | | | 2,870 | | | | 3,495 | |
Financial Metrics
Adjusted EBITDA
Adjusted EBITDA is a non-U.S. GAAP financial measure. We classify a financial measure as being a non-U.S. GAAP financial measure if that financial measure excludes or includes amounts, or is subject to adjustments that have the effect of excluding or including amounts, that are not included or excluded in the most directly comparable measure calculated and presented in accordance with GAAP as in effect from time to time in the United States in our statements of operations, balance sheets or statements of cash flows. The non-GAAP financial measures are supplemental measures that are not required by, or are not presented in accordance with, U.S. GAAP. Non-GAAP financial measures do not include operating, other statistical measures or ratios calculated using exclusively financial measures calculated in accordance with GAAP. We present Adjusted EBITDA as a supplemental measure of our performance. This measurement is not recognized in accordance with U.S. GAAP and should not be viewed as an alternative to U.S. GAAP measures of performance. Moreover, the way we calculate the non-GAAP financial measures may differ from that of other companies reporting measures with similar names, which may limit these measures’ usefulness as a comparative measure. The presentation of Adjusted EBITDA should not be construed as an inference that our future results will be unaffected by unusual or non-recurring items.
We define Adjusted EBITDA as net loss/(income) plus (a) income tax expense/(benefit), (b) interest expense, net, (c) depreciation and amortization (d) loss/(gain) on foreign currency exchange (net) (e) other expense/(income) and (f) Impairment loss. We believe Adjusted EBITDA is useful to investors in assessing our ongoing financial performance and provides improved comparability between periods through the exclusion of certain items that management believes are not indicative of our operational profitability and that may obscure underlying business results and trends. However, this measure should not be considered in isolation or viewed as a substitute for net
84
income or other measures of performance determined in accordance with U.S. GAAP. Moreover, Adjusted EBITDA as used herein is not necessarily comparable to other similarly titled measures of other companies due to potential inconsistencies in the methods of calculation.
Our management believes this measure is useful to compare general operating performance from period to period and to make certain related management decisions. Adjusted EBITDA is also used by securities analysts, lenders and others in their evaluation of different companies because it excludes certain items that can vary widely across different industries or among companies within the same industry. For example, interest expense can be highly dependent on a company’s capital structure, debt levels and credit ratings. Therefore, the impact of interest expense on earnings can vary significantly among companies. In addition, the tax positions of companies can vary because of their differing abilities to take advantage of tax benefits and because of the tax policies of the various jurisdictions in which they operate. As a result, effective tax rates and tax expense can vary considerably among companies.
Adjusted EBITDA has limitations as an analytical tool, and you should not consider it in isolation or as a substitute for analysis of our results as reported under U.S. GAAP. Some of these limitations include:
| • | it does not reflect our cash expenditures or future requirements for capital expenditures or contractual commitments or foreign exchange gain/loss; |
| • | it does not reflect changes in, or cash requirements for, working capital; |
| • | it does not reflect significant interest expense or the cash requirements necessary to service interest or principal payments on our outstanding debt; |
| • | it does not reflect payments made or future requirements for income taxes; and |
| • | although depreciation, amortization and impairment are non-cash charges, the assets being depreciated and amortized will often have to be replaced or paid in the future and Adjusted EBITDA does not reflect cash requirements for such replacements or payments. |
Investors are encouraged to evaluate each adjustment and the reasons we consider it appropriate for supplemental analysis.
The following table presents a reconciliation of net (loss)/profit to Adjusted EBITDA:
| | Fiscal Year Ended March 31, | |
| | 2019 | | | 2020 | | | 2021 | |
| | INR | | | INR | | | INR | | | US$ | |
| | (In millions) | |
Net profit / (loss) | | | 138 | | | | (2,337 | ) | | | (4,201 | ) | | | (57.2 | ) |
Income tax expense | | | 153 | | | | 489 | | | | 296 | | | | 4.0 | |
Interest expense, net | | | 5,022 | | | | 7,962 | | | | 8,410 | | | | 114.8 | |
Other (income)/expense, net | | | (148 | ) | | | (96 | ) | | | 18 | | | | 0.2 | |
Depreciation and amortization | | | 2,137 | | | | 2,860 | | | | 3,202 | | | | 43.8 | |
Impairment loss | | | — | | | | — | | | | 3,255 | | | | 44.5 | |
Loss on foreign currency exchange (net) | | | 441 | | | | 512 | | | | 7 | | | | 0.1 | |
Adjusted EBITDA | | | 7,743 | | | | 9,390 | | | | 10,987 | | | | 150.2 | |
Note:
(1) | Translation of balances in the financial information table above from INR into US$, as of and for fiscal year ended March 31, 2021 are solely for the convenience of the readers and were calculated at the rate of US$1.00 = INR 73.14, the noon buying rate in New York City for cable transfers in non U.S. currencies, as certified for customs purposes by the Federal Reserve Bank of New York on March 31, 2021. No representation is made that the INR amounts could have been, or could be, converted, realized or settled into US$ at that rate on March 31, 2021, or at any other rate. |
85
Project Cost per Megawatt Operating
Project cost per megawatt operating consists of solar photovoltaic panels, inverters, balance of plant equipment, freehold land or leasehold land, capitalizable financing costs, and installation costs incurred for installing one megawatt of DC capacity during the reporting period. It is an indicator of our strong engineering, procurement and construction capabilities, market cost of material and our ability to procure such material at competitive prices. A reduction in project cost per megawatt helps reduce the cost of power and thereby improves our ability to win new projects. The project cost per megawatt (DC) operating for the year ended March 31, 2021 decreased by INR 6.7 million (US$ 0.09 million), or 19%, to INR 28.8 million (US$ 0.39 million) primarily due to lower costs on account of the reduction in solar module prices for the projects commissioned during the period. The project cost per megawatt (AC) operating for the year ended March 31, 2021 was INR 42.9 million (US$ 0.59 million), compared to INR 48.9 million, for the year ended March 31, 2020, on account of a reduction in solar module prices. Excluding the impact of safeguard duties, the DC and the AC costs per megawatt for the year ended March 31, 2021 would have been lower by approximately INR 2.7 million (US$ 0.04 million) and INR 2.8 million (US$ 0.04 million), respectively, and for the prior year ended March 31, 2020, the DC and the AC costs per megawatt would have been lower by approximately INR 2.9 million and INR 4.9 million, respectively.
Nominal Contracted Payments
Our PPAs create long-term recurring customer payments. Nominal contracted payments equal the sum of the estimated payments that the customer is likely to make, subject to discounts or rebates, over the remaining term of the PPAs. When calculating nominal contracted payments, we include those PPAs for projects that are operating or contracted or awarded. To calculate the nominal contracted payments, we multiply the contract price per kilowatt hour as per the respective PPA by the estimated annual energy output for the remaining life of the PPA period. In estimating the nominal contracted payments, we multiply the PPA contract price per kilowatt hour by the estimated annual energy output for all solar projects Operating, Contracted & Awarded and operating as of the reporting date. The estimated annual energy output of our solar projects is calculated using power generation simulation software and validated by independent engineering firms. The main assumption used in the calculation is the project location, which enables the software to derive the estimated annual energy output from certain meteorological data, including the temperature and solar radiation based on the project location. Our power generation simulation software calculates the estimated annual energy output by using the following formula:
E = A * r * H * PR
E = Energy (kWh)
A = Total solar panel Area (m²)
r = Solar panel efficiency (%)
H = Annual global radiation at collector plane
PR = Performance ratio, coefficient for losses (range between 0.50 and 0.95)
Performance ratio is a quantity which represents the ratio of the effectively produced (used) energy to the energy which would be produced by a “perfect” system continuously operating at standard test condition under the same radiation, taking into account losses such as array losses (shadings, incident angle modifier, photovoltaic conversion, module quality, mismatch and wiring) and system losses (inverter efficiency, transformer efficiency and transmission losses).
86
The calculation of the estimated annual energy output also takes into account the total rated capacity of all the solar panels to be installed for the remaining life of the PPA, net of the annual estimated decrease in rated capacity based on technology installed. The decrease in rated capacity includes various losses caused by soiling, temperature changes, inverter and transformer inefficiency, incidence angle, wire, shading and mismatch losses. The technology used for each project is assessed based on geographical conditions of the project, cost economics and the availability of such technology for construction. We assume an annual decrease in rated capacity ranging from 0.5% to 0.7% depending on the technology used, which is based on the specifications given by the manufacturer of the solar panels.
To calculate nominal contracted payments for operating, contracted & awarded projects, we assume a 50% probability of achieving the generation numbers projected by the power generation software, which is net of the annual estimated decrease in rated capacity based on the technology installed. For operating projects, instead of the formula described above, we use the actual full year energy generated net of the annual estimated decrease in rated capacity based on the technology installed. We have used this method of calculation since the inception of all projects, including scheduled price changes where applicable.
If we were to receive government grants under any PPA, such grants would be included as nominal contracted payments in the period when received. We account for VGF as an income-type government grant. The proceeds received from VGF grants upon fulfilment of certain conditions are initially recorded as deferred revenue. This deferred VGF revenue is recognized as sale of power in proportion to (x) the actual sale of solar energy kilowatts during the period to (y) the total estimated sale of solar energy kilowatts during the tenure of the applicable PPA (as described in Note 2(q) to our consolidated financial statements) pursuant to our revenue recognition policy.
Nominal contracted payments are a forward-looking number and we use judgment in developing the assumptions used to calculate it. Those assumptions may not prove to be accurate over time. Underperformance of the solar power plants, payment defaults by our customers or other factors described under the heading “Item 3. Key Information—D. Risk Factors” could cause our actual results to differ materially from our calculation of nominal contracted payments.
The following table sets forth, with respect to our PPAs, the aggregate nominal contracted payments and total estimated energy output as of the reporting dates. These nominal contracted payments have not been discounted to arrive at the present value.
| | As of March 31, | |
| | 2019 | | | 2020 | | | 2021 | |
| | INR | | | INR | | | INR | | | US$ | |
Nominal contracted payments for projects with PPAs (in millions)* | | | 584,196 | | | | 513,690 | | | | 486,729 | | | | 6,654.8 | |
| | | | | | | | | | | | | | | | |
| | As of March 31, | |
| | 2019 | | | 2020 | | | 2021 | |
Total estimated energy output (kilowatt hours in millions)* | | | 170,718 | | | | 149,384 | | | 144,195 | |
* Nominal contracted payments for projects with PPAs does not include 4 GWs project, since the PPAs have not been signed.
The decrease in Nominal contracted payments as of March 31, 2021 as compared to March 31, 2020 is due to exclusion of rooftop business of 160 MWs (read with explanations given under “Summary of key matrices” above) and current year revenue generation. Over time, we have seen a trend towards a decline in the Central Electricity Regulatory Commission benchmark tariff for solar power procurement. For fiscal year 2011, the Central Electricity Regulatory Commission benchmark tariff for solar power procurement was INR 17.91 per kilowatt hour. It was reduced to INR 10.39 per kilowatt hour for fiscal year 2013, which was further reduced to INR 7.72 per kilowatt hour for fiscal year 2015 and to INR 3.53 per kilowatt hour for fiscal year 2019. The overall trend of solar power tariffs is that the tariffs are declining in line with solar module prices.
87
Our nominal contracted payments are not impacted from delays in construction related to COVID-19 as revenues from PPAs start after the date of commissioning of the project.
Portfolio Revenue Run-Rate
Portfolio revenue run-rate equals our annualized payments from customers extrapolated based on the operating, contracted & awarded capacity as of the reporting date. In estimating the portfolio revenue run-rate, we multiply the PPA contract price per kilowatt hour by the estimated annual energy output for all operating, contracted & awarded solar projects as of the reporting date. The estimated annual energy output of our solar projects is calculated using power generation simulation software and validated by independent engineering firms. The main assumption used in the calculation is the project location, which enables the software to derive the estimated annual energy output from certain metrological data, including the temperature, wind speed and solar radiation based on the project location. Our power generation simulation software calculates the estimated annual energy output by using the formula described above.
The calculation of the estimated annual energy output also takes into account the total rated capacity of all the solar panels to be installed for the remaining life of the PPA, net of the annual estimated decrease in rated capacity based on technology installed. The decrease in rated capacity includes various losses caused by soiling, temperature changes, inverter and transformer inefficiency, incidence angle, wire, shading and mismatch losses.
To calculate portfolio revenue run-rate for operating, contracted & awarded projects, we assume a 50% probability of achieving the generation numbers projected by the power generation software, which is net of the annual estimated decrease in rated capacity based on the technology installed. For operating projects, instead of the formula described above, we use the actual full year energy generated net of the annual estimated decrease in rated capacity based on the technology installed. We have used this method of calculation since the inception of all projects, including scheduled price changes where applicable.
Portfolio revenue run-rate is a forward-looking number, and we use judgment in developing the assumptions used to calculate it. Those assumptions may not prove to be accurate over time. Underperformance of the solar power plants or other factors described under the heading “Item 3. Key Information—D. Risk Factors” could cause our actual results to differ materially from our calculation of portfolio revenue run-rate.
The following table sets forth, with respect to our PPAs, the aggregate portfolio revenue run-rate and estimated annual energy output as of the reporting dates. The portfolio revenue run-rate has not been discounted to arrive at the present value.
| | As of March 31, | |
| | 2019 | | | 2020 | | | 2021 | |
| | INR | | | INR | | | INR | | | US$ | |
Portfolio Revenue run-rate for projects with PPAs (in millions)* | | | 25,940 | | | | 23,817 | | | | 22,656 | | | | 309.8 | |
| | | | | | | | | | | | | | | | |
| | As of March 31, | |
| | 2019 | | | 2020 | | | 2021 | |
Estimated annual energy output (kilowatt hours in millions)* | | | 7,468 | | | | 6,772 | | | 6,528 | |
* Portfolio revenue run-rate for projects with PPAs does not include the revenue for 4 GWs project as the PPAs have not been signed.
The decrease in portfolio revenue run-rate as of March 31, 2021 as compared to March 31, 2020 is due to exclusion of rooftop business of 160 MWs (read with explanations given under “Summary of key matrices” above).
88
Cash Flow to Equity (CFe)
Cash Flows to Equity is a Non-GAAP financial measure. We present CFe as a supplemental measure of our performance. This measurement is not recognized in accordance with U.S. GAAP and should not be viewed as an alternative to U.S. GAAP measures of performance. The presentation of CFe should not be construed as an inference that our future results will be unaffected by unusual or non-recurring items.
We believe GAAP metrics, such as net income (loss) and cash from operating activities, do not provide the same level of visibility into the performance and prospects of our operating business as a result of the long-term capital-intensive nature of our businesses, non-cash depreciation and amortization cash used for debt servicing as well as investments and costs related to the growth of our business.
Our business owns high-value, long-lived assets capable of generating substantial Cash Flows to Equity over time. We define CFe as profit before tax (the most comparable GAAP metric), adjusted for net cash provided for used/in operating activities, other than changes in operating assets and liabilities, income and deferred taxes and amortization of hedging costs; less: cash paid for income taxes, debt amortization and maintenance capital expenditure.
We believe that changes in operating assets and liabilities is cyclical for cash flow generation of our assets, due to high growth environment. Furthermore, to reflect the actual cash outflows for income tax, we deduct income and deferred taxes computed under US GAAP presented in our consolidated financial statements and instead include the actual cash tax outflow during the period, are considered as part of tax expense.
We believe that external consumers of our financial statements, including investors and research analysts, use CFe both to assess Azure Power’s performance and as an indicator of its success in generating an attractive risk-adjusted total return, assess the value of the business and the platform. This has been a widely used metric by analysts to value our business, and hence we believe this will help potential investors in analyzing the cash generation from our operating assets.
We have disclosed CFe for our operational assets on a consolidated basis, which is not the cash from operations on a consolidated basis. We believe CFe supplements GAAP results to provide a more complete understanding of the financial and operating performance of our businesses than would not otherwise be achieved using GAAP results alone. CFe should be used as a supplemental measure and not in lieu of our financial results reported under GAAP.
We have also bifurcated the CFe into “Operational Assets” and “Others”, as defined below, so that users of our financial statements are able to understand the Cash generation from our operational assets.
We define our “Operational Assets”, as the projects which had commenced operations on or before March 31, 2021, (as provided in Item 5: operating and financial review and prospects - Power Purchase Agreement summary in this form 20F). The operational assets represent the MWs operating as on the date.
We define “Others” as (i) the project SPV’s which are under construction, or under development - as provided in the Power Purchase Agreement table in this Form 20-F, (ii) “corporate” which includes our three Mauritius entities, (iii) other projects not covered under operational assets, (iv) a company incorporated in the United States and (v) other entities under the group which are newly incorporated.
We define “debt amortization” as the current portion of long-term debt which has been repaid during the period as part of debt repayment obligations, excluding the debt which has been repaid before maturity or refinanced. It does not include the amortization of debt financing costs or interest paid during the period.
Other items from the Statement of Cash Flows include most of the items that reconcile “Net (loss) gain” and “Changes in operating assets and liabilities” from the Statement of Cash Flows, other than deferred taxes, non-cash employee benefit and amortization of hedging costs.
89
Following is the CFe computation for the current periods:
| | For the year ended | | | For the year ended | |
| | March 31, 2020 | | | March 31, 2021 | |
| | Total | | | Other | | | Operating | | | Total | | | Other | | | Operating | | | Operating | |
| | INR | | | INR | | | INR | | | INR | | | INR | | | INR | | | US$ | |
Revenue from customers | | | 12,958 | | | | — | | | | 12,958 | | | | 15,236 | | | | — | | | | 15,236 | | | | 208.3 | |
Cost of operations | | | 1,146 | | | | — | | | | 1,146 | | | | 1,261 | | | | — | | | | 1,261 | | | | 17.2 | |
General and administrative | | | 2,422 | | | | 1,280 | | | | 1,142 | | | | 2,988 | | | | 2,159 | | | | 829 | | | | 11.3 | |
Depreciation and amortization | | | 2,860 | | | | 52 | | | | 2,808 | | | | 3,202 | | | | 36 | | | | 3,166 | | | | 43.3 | |
Impairment loss | | | — | | | | — | | | | — | | | | 3,255 | | | | — | | | | 3,255 | | | | 44.5 | |
Operating income/(loss) | | | 6,530 | | | | (1,332 | ) | | | 7,862 | | | | 4,530 | | | | (2,195 | ) | | | 6,725 | | | | 92.0 | |
Interest expense, net | | | 7,962 | | | | 453 | | | | 7,509 | | | | 8,410 | | | | 1,024 | | | | 7,386 | | | | 101.0 | |
Other (income)/expense | | | (96 | ) | | | (57 | ) | | | (39 | ) | | | 18 | | | | — | | | | 18 | | | | 0.2 | |
Loss on foreign currency exchange, net | | | 512 | | | | 96 | | | | 416 | | | | 7 | | | | 3 | | | | 4 | | | 0.1 | |
Loss before Income Tax | | | (1,848 | ) | | | (1,824 | ) | | | (24 | ) | | | (3.905 | ) | | | (3,222 | ) | | | (683 | ) | | | (9.3 | ) |
Add: Depreciation and amortization | | | 2,860 | | | | 52 | | | | 2,808 | | | | 3,202 | | | | 36 | | | | 3,166 | | | | 43.3 | |
Add: Impairment loss | | | — | | | | — | | | | — | | | | 3,255 | | | | — | | | | 3,255 | | | | 44.5 | |
Add: Loss on foreign currency exchange, net | | | 512 | | | | 96 | | | | 416 | | | | 7 | | | | 3 | | | | 4 | | | | 0.1 | |
Add: Amortization of debt financing costs | | | 709 | | | | 319 | | | | 390 | | | | 369 | | | | 74 | | | | 295 | | | | 4.0 | |
Add: Other items from Statement of Cash Flows (1) | | | 944 | | | | 188 | | | | 756 | | | | 1,840 | | | | 1,062 | | | | 778 | | | | 10.6 | |
Less: Cash paid for income taxes | | | (697 | ) | | | (208 | ) | | | (489 | ) | | | (488 | ) | | | (43 | ) | | | (445 | ) | | | (6.1 | ) |
Less: Debt amortization (2) | | | (620 | ) | | | — | | | | (620 | ) | | | (698 | ) | | | — | | | | (698 | ) | | | (9.5 | ) |
Less: Maintenance capital expenditure (3) | | | — | | | | — | | | | — | | | | — | | | | — | | | | — | | | | — | |
CFe | | | 1,860 | | (4) | | (1,377 | ) | | | 3,237 | | | | 3,582 | | (4) | | (2,090 | ) | | | 5,672 | | | | 77.6 | |
(1) | Other items from the Statement of Cash Flows. For the year ended March 31, 2020 and March 31, 2021, respectively, other items include: loss on disposal of property plant and equipment of INR 52 million and INR 32 million, share based compensation of INR 186 million and INR 1,001 million, realized gain on investment of INR 108 million and INR Nil, non-cash rent expense of INR 193 million and INR 169 million, allowance for doubtful debts of INR 303 million and INR 294 million, employee benefit expense of INR Nil, and INR 45 million, loan prepayment charges of INR 282 million and INR 257 million and ARO accretion of INR 36 million and INR 42 million. |
(2) | Debt Amortization: Repayments of term and other loans during the year ended March 31, 2021, was INR 10,563 million (refer to the Statement of Cash Flows) which includes INR 9,865 million related to refinancing of loans or early repayment of debt before maturity and have been excluded to determine debt amortization of INR 698 million (US$ 9.5 million). Repayments of term and other loans during the year ended March 31, 2020, was INR 32,827 million (refer to the Statement of Cash Flows) which includes INR 32,207 million related to refinancing of loans or early prepayment of debt before maturity and has been excluded to determine debt amortization of INR 620 million. |
(3) | Classification of Maintenance capital expenditures and Growth capital expenditures |
All our capital expenditures are considered Growth Capital Expenditures. In broad terms, we expense all expenditures in the current period that would primarily maintain our businesses at current levels of operations, capability, profitability or cash flow in operations and maintenance and therefore there are no Maintenance Capital Expenditures. Growth capital expenditures primarily provide new or enhanced levels of operations, capability, profitability or cash flows.
90
(4) | Reconciliation of total CFe to GAAP cash from Operating Activities: |
| For the year ended March 31, 2020 | | | For the year ended March 31, 2021 | |
CFe (Non-GAAP) | | 1,860 | | | | 3,582 | |
Items included in GAAP Cash from Operating Activities but not considered in CFe | | | | | | | |
Change in current assets and liabilities as per statement of cash flows | | (39 | ) | | | (838 | ) |
Current income taxes | | (340 | ) | | | (625 | ) |
Prepaid lease payments and employee benefits | | (548 | ) | | | (246 | ) |
Amortization of hedging costs | | 1,428 | | | | 1,918 | |
Items included in CFe but not considered in GAAP Cash Flow from Operating Activities: | | | | | | | |
Debt amortization | | 620 | | | | 698 | |
Cash taxes paid | | 697 | | | | 488 | |
Cash from Operating Activities (GAAP) | | 3,678 | | | | 4,977 | |
Components of Results of Operations
Operating Revenue
Operating revenue consists of solar energy sold to customers under long term PPAs, which generally have a term of 25 years. We have one customer for each solar power plant. Our customers are Government of India, power distribution companies and, to a lesser extent, commercial and industrial enterprises.
We recognize revenue on PPAs when the solar power plant generates power, and it is supplied to the customer in accordance with the respective PPA. Revenue is recognized in each period based on the volume of solar energy supplied to the customer at the price stated in the PPA, once the solar energy kilowatts are supplied and collectability is reasonably assured. The solar energy kilowatts we supplied are validated by the customer prior to billing and recognition of revenue.
Where PPAs include scheduled price changes, revenue is recognized by applying the average rate to the energy output estimated over the term of the PPA. We estimate the total kilowatt hour units expected to be generated annually during the tenure of PPA using budgeted plant load factors, rated capacity of the project and annual estimated decrease in rated capability of solar panels. The contractual rates are applied to this annual estimate to determine the total estimated revenue over the term of the PPA. We then use the total estimated revenue and the total estimated kilowatt hours to compute the average rate used to record revenue on the actual energy output supplied. We compare the actual energy supplied to the estimate of the energy expected to be generated over the remaining term of the PPA on a periodic basis, but at least annually. Based on this evaluation, we reassess the energy output estimated over the remaining term of the PPA and adjust the revenue recognized and deferred to date. Through March 31, 2021, the adjustments have not been significant, and the difference between the actual billing and revenue recognized is recorded as deferred revenue.
Cost of Operations (Exclusive of Depreciation and Amortization)
Our cost of operations primarily consists of expenses pertaining to operations and maintenance of our solar power plants. These expenses include payroll and related costs for maintenance staff, plant maintenance, insurance, and, if applicable, lease costs.
General and Administrative Expenses
Our general and administrative expenses include payroll and related costs for corporate, finance and other support staff, including bonus and share based compensation expense, professional fees and other corporate expenses. We anticipate that we will incur additional general and administrative costs, including headcount and expansion related costs, to support the growth in our business as well as additional costs of being a public reporting company.
91
Depreciation and Amortization
Depreciation and Amortization expense are recognized using the straight-line method over the estimated useful life of our solar power plants and other assets. Leasehold improvements related to solar power plants are amortized over the shorter of the lease term or the underlying period of the PPA for that particular solar power plant. Leasehold improvements related to office facilities are amortized over the shorter of the lease period or the estimated useful life. Freehold land is not depreciated. Construction in progress is not depreciated until such projects are commissioned.
Impairment loss
Impairment loss relates to our non-core solar rooftop portfolio, for which we entered into a sales agreement post March 31, 2021. For further information, please see “Item 4. Information on the Company - B. Business Overview – Sale of Assets”.
Interest Expense, Net
Interest expense, net consists of interest incurred on term loans for projects under our fixed and variable rate financing arrangements including interest expense on the Green Bonds, cost of hedging the foreign currency risk on the solar green bond transactions, and interest expense on non-convertible debentures. Interest cost also includes the cost of swaps and option contracts entered to mitigate the foreign exchange risk for solar green bond transactions. We have designated the swaps and option contracts as a cash flow hedge and are tested for effectiveness on a quarterly basis or as determined at the time of designation of hedge. Interest expense also includes bank fees and other borrowing costs, which are typically amortized over the life of the loan using the effective interest rate method. Interest expense is presented net of capitalized financing costs and interest income earned from bank deposits. Interest incurred in connection with a project that has been commissioned is expensed while interest incurred prior to commissioning is capitalized.
Other expense/ (income)
Other expense/ (income) primarily consists of mutual fund income net of certain expense.
Gain/Loss on Foreign Currency Exchange (Net)
We are exposed to movements in currency exchange rates, particularly to changes in exchange rates between U.S. dollars and Indian rupees. While our functional currency is the U.S. dollar, the functional currency of AZI is Indian rupees and a portion of AZI’s borrowings from financial institutions are denominated in U.S. dollars. Foreign exchange gain/loss includes the unrealized and realized loss from foreign currency fluctuations on our non-functional currency denominated borrowings.
We also enter into foreign currency option contracts to mitigate and manage the risk of changes in foreign exchange rates on our borrowings denominated in currencies other than our functional currency. Some of these hedges do not qualify as cash flow hedges under Accounting Standards Codification, or “ASC”, Topic 815, “Derivatives and Hedging.” Changes in the fair value of these option contracts are recognized in the consolidated statements of operations and are included in loss on foreign currency exchange.
Income Tax Expense/ (Income)
Our income tax expense/ (income) consists of current and deferred income tax as per applicable jurisdictions in Mauritius, India and the United States. Income tax for our current and prior periods is measured at the amount expected to be recovered from or paid to taxation authorities based on our taxable income or loss for that period.
Deferred income taxes and changes in related valuation allowance, if any, reflect the net tax effects of temporary differences between the carrying amounts of assets and liabilities for financial reporting purposes and the amounts used for income tax purposes.
92
Internal Control over Financial Reporting
We qualify as an emerging growth company pursuant to the Jumpstart Our Business Startups Act of 2012, or the JOBS Act for the fiscal year ended March 31, 2021. An emerging growth company may take advantage of specified reduced reporting and other requirements that are otherwise applicable generally to public companies. These provisions include exemption from the auditor attestation requirement under Section 404 of the Sarbanes-Oxley Act of 2002 in the assessment of the emerging growth company’s internal control over financial reporting. The JOBS Act also provides that an emerging growth company does not need to comply with any new or revised financial accounting standards until such date that a private company is otherwise required to comply with such new or revised accounting standards. We may adopt new or revised accounting standards on the relevant dates on which adoption of such standard is required. Our Company completes its fifth anniversary from the first sale of common equity shares during the fiscal year ended March 31, 2022 and the exemptions available for the Emerging Growth Company will no longer be available effective March 31, 2022. From that date, we will be required to comply with all reporting requirements as applicable to other public companies.
Critical Accounting Policies and Estimates
Our consolidated financial statements are prepared in accordance with U.S. GAAP. We have identified certain accounting policies that we believe are the most critical to the presentation of our consolidated financial information over a period of time. These accounting policies may require our management to take decisions on subjective and/or complex matters relating to reported amounts of assets, liabilities, revenue, costs, expenses and related disclosures. These would further lead us to estimate the effect of matters that may inherently be uncertain.
The judgment on such estimates and underlying assumptions is based on our experience, historical trends, understanding of the business, industry and various other factors that we believe are reasonable under the circumstances. These form the basis of our judgment on matters that may not be apparent from other available sources of information. In many instances changes in the accounting estimates are likely to occur from period-to-period. Actual results may differ from the estimates. The future financial statement presentation, financial condition, results of operations and cash flows may be affected to the extent that the actual results differ materially from our estimates.
Our significant accounting policies are summarized in Note 2—Summary of Significant Accounting Policies to our consolidated financial statements included in this annual report. Our various critical accounting policies and estimates are discussed in the following paragraphs.
Income Taxes
Income tax expense/ (income) consists of (i) current income tax expense arising from income from operations (ii) deferred income tax expense/(benefit) arising from temporary differences and (iii) income tax expense as a result of certain intercompany transactions.
We use the asset and liability method in accounting for income taxes. Under this method, deferred income tax assets and liabilities are determined based on the difference between financial reporting and tax bases of assets and liabilities and are measured using the enacted tax rates and laws that will be in effect when the differences are expected to reverse.
The tax rates on reversal of temporary differences might be different from the tax rates used for creation of the respective deferred tax assets/liabilities.
As of March 31, 2020, and 2021, we had net deferred tax assets of INR 2,205 million and INR 1,748 million (US$ 23.9 million), respectively, and net deferred tax liabilities of INR 2,622 million and INR 2,046 million (US$ 28.0 million), respectively.
93
We apply a two-step approach to recognize and measure uncertainty in income taxes in accordance with ASC Topic 740. The first step is to evaluate the tax position for recognition by determining if the weight of available evidence indicates that it is more likely than not that the position will be sustained on audit, including resolution of related appeals or litigation processes, if any. The second step is to measure the tax benefit as the largest amount, which is more than 50% likely of being realized upon ultimate settlement. We re-evaluate these uncertain tax positions on an annual basis. This evaluation is based on factors including changes in facts or circumstances, changes in tax law and effectively settled issues under tax-audit. Such a change in recognition or measurement could result in the recognition of a tax benefit or an additional charge to the tax provision in the relevant period. As of March 31, 2020, and 2021, we did not have any material uncertain tax positions.
We establish valuation allowances against our deferred tax assets when it is more likely than not that all or a portion of a deferred tax asset will not be realized. The valuation allowance as on March 31, 2020 and 2021 were INR 217 million and INR 1,088 million (US$ 14.9 million), respectively.
A portion of our Indian operations qualifies for tax holiday related to their operating income attributable to undertakings, as defined, in operating solar power plants under section 80-IA of the Indian Income Tax Act, 1961. This holiday is available for a period of ten consecutive years out of fifteen years beginning from the year in which the undertaking first generates power (referred to as the Tax Holiday period), however, the exemption is available only to the projects completed on or before March 31, 2017. We assess the election of the Tax Holiday period on an annual basis for each of our undertakings. We believe these undertakings will generate higher taxable profits due to lower interest cost as debt balances are paid down in the later years of operations and therefore, we plan to defer the Tax Holiday election to later years in order to maximize the benefits. As of March 31, 2021, we are claiming tax holiday benefits for ten of our subsidiaries. Deferred tax assets are recognized to the extent probable of realization outside the anticipated Tax Holiday period. For example, if we choose years six through 15 as the tax holiday period, we recognize deferred tax assets only to the extent that they will be realized either in years one through five or from year 16 onwards. As a result, all temporary differences do not result in creation of a deferred tax asset or liability.
During the previous year, The Taxation Laws (Amendment) Act, 2019 received the assent of the President on December 11, 2019 and published in the Gazette of India on December 12, 2019. The amendment provided an option for the companies to opt for a reduced corporate tax rate of 22% provided they do not claim certain tax benefits under the Income Tax Act. We had opted for the reduced tax rate for the subsidiaries which are not eligible for deduction under section 80IA of the Income Tax Act. Further, new domestic Companies incorporated on or after October 1, 2019 making fresh investment in manufacturing can opt for an option to pay income-tax at the rate of 15%. This benefit is available to companies which do not avail any exemption/incentive and commences their production on or before March 31, 2023. Also, such companies shall not be required to pay Minimum Alternate Tax.
AZI and AZR provide EPC and related support services to other group subsidiaries and as a result incur income taxes on profits from the services provided. The services provided to the group subsidiaries are in the nature of capitalizable costs and are therefore capitalized as part of property, plant and equipment in the standalone financial statements of such subsidiaries. However, these capitalized costs are eliminated for the purposes of the consolidated financial statements. The costs capitalized in the standalone financial statements are however eligible for income tax deductions in the tax records of the respective group subsidiaries. We started recording Deferred Tax Asset on the intra-entity transfer of assets pursuant to ASU 2016-16, from April 1, 2017. We assess that the probability of realizing the benefit on an annual basis and its recognition is limited to the extent probable of realization outside of the anticipated Tax Holiday period. Our estimate is that such benefit is limited to approximately 30% to 55% of the tax expense incurred by AZI and the subsidiary. As a result, while all the profits on inter-company transactions are eliminated during consolidation, it does not result in a complete reversal of tax expense on such inter-company transactions. Accordingly, while we may not be profitable, we report income tax expense / benefit that may fluctuate from period to period. Further, EPC services by AZI to other group subsidiaries were provided up-till previous year ended March 31, 2020 only. Now all subsidiaries are managing these EPC services by themselves with dedicated team of field-service engineers, technicians and other employees. However, for the rooftop business, we are continuing with the earlier model of EPC services.
94
Contracts Designated as Cashflow Hedges for Solar Green Bonds
We have issued U.S. dollar denominated 5.65% Solar Green Bonds in September, 2019 and 5.5% Solar Green Bonds in August 2017 (collectively “Green Bonds”), listed on the Singapore Exchange Limited (“SGX”). The proceeds were used for repayment of project level debt of certain projects in India and for growth capital in certain projects under construction, in the form of intercompany Non-Convertible Debentures (“NCD”) and External Commercial Borrowings (“ECB’s”) denominated in INR. The exchange rate risk on the proceeds invested from the Green Bonds are hedged through cross currency swap for payment of coupons and through call spread option contracts for repayment of principal (collectively “option contracts”). We have designated these option contracts as a cashflow hedge. These options contracts mitigate the exchange rate risk associated with the forecasted transaction for semi-annual repayment of coupon and for repayment of the principal balance at the end of five years.
The cashflow from the underlying agreement match the terms of a hedge such as—notional amount, maturity of the option contracts, mitigation of exchange rate risk, and there are no significant changes in the counter party risk, hence they are designated as a cashflow hedge in accordance with ASC Topic 815— Derivatives and Hedging. Fair value of the hedge at the time of inception of the contract was nil and the cost of the hedge is recorded as an expense over the period of the contract on a straight-line basis. Changes in fair value of the option contracts designated as cash flow hedge are recorded in Other Comprehensive Income/(Loss), net of tax, until the hedge transactions occur. We evaluate hedge effectiveness of cash flow hedges at the time a contract is entered into as well as on a quarterly basis. We test the effectiveness of the hedge relationship on a quarterly basis and the hedge was effective as of March 31, 2021.
In August 2017, the FASB issued ASU 2017-12, "Derivatives and Hedging (Topic 815): Targeted Improvements to Accounting for Hedging Activities", including certain transitional guidance and subsequent amendments including amendments to presentation and disclosure guidance within ASU 2019-04 (collectively, "ASU 2017-12"). ASU 2017-12 permits a qualitative effectiveness assessment for certain hedges instead of a quantitative test after the initial qualification, if we can reasonably support an expectation of high effectiveness throughout the term of the hedge. Also, for cash flow hedges, if the hedge is highly effective, all changes in the fair value of the derivative hedging instrument are recorded in other comprehensive income. We early adopted the guidance under ASU 2017-12 during the year ended March 31, 2018 and designated certain option contracts entered during the period as cash flow hedges. We classify the option contracts as cash flow hedge.
We used the derivatives option pricing model based on the principles of the Black-Scholes model to determine the fair value of the foreign exchange option contracts. The inputs considered in this model include the theoretical value of a call option, the underlying spot exchange rate as of the balance sheet date, the contracted price of the respective option contract, the term of the option contract, the implied volatility of the underlying foreign exchange rates and the risk-free interest rate as of the balance sheet date. The techniques and models incorporate various inputs including the credit worthiness of counterparties, foreign exchange spot and forward rates, interest rate yield curves, forward rate yield curves of the underlying. We classify the fair value of these foreign exchange option contracts as Level 2 because the inputs used in the valuation model are observable in active markets over the term of the respective contracts. Fair value of the hypothetical derivative is computed based on the above inputs from Bloomberg or other reputed banks.
| | As of March 31, 2020 (in millions) | |
| | Notional Amount | | | Current Liabilities (Fair value) | | | Other Assets (Fair value) | | | Other Assets (Fair value) | |
| | (US$) | | | (INR) | | | (INR) | | | (US$) | |
Foreign currency option contracts | | | 849.7 | | | | — | | | | 6,177 | | | | 81.9 | |
| | | | | | | | | | | | | | | | |
| | As of March 31, 2021 (in millions) | |
| | Notional Amount | | | Current Liabilities (Fair value) | | | Other Assets (Fair value) | | | Other Assets (Fair value) | |
| | (US$) | | | (INR) | | | (INR) | | | (US$) | |
Foreign currency option contracts | | | 849.7 | | | | — | | | | 5,766 | | | | 78.8 | |
95
A. Results of Operations
Azure Power Global Limited’s functional currency is the U.S. dollar and reporting currency is the Indian rupee. Solely for the convenience of the reader, we have translated the financial information for the fiscal year ended March 31, 2021. The rate used for this translation is INR 73.14 to US$1.00, which is the noon buying rate in New York City for cable transfer in non-U.S. dollar currencies as certified for customs purposes by the Federal Reserve Bank of New York as of March 31, 2021, which is the last available rate in the period of reported financial statements. No representation is made that the Indian rupee amounts could have been, or could be, converted, realized or settled into U.S. dollars at that rate.
| | Fiscal Year Ended March 31, | |
| | 2019 | | | 2020 | | | 2021 | | | 2021 | |
Consolidated Statement of Operations data: | | (INR) | | | (INR) | | | (INR) | | | (US$) | |
| | (in million except for per share amounts) | |
Operating revenues: | | | | | | | | | | | | | | | | |
Revenue from customers | | | 9,926 | | | | 12,958 | | | | 15,236 | | | | 208.3 | |
Operating costs and expenses: | | | | | | | | | | | | | | | | |
Cost of operations (exclusive of depreciation and amortization shown separately below) | | | 869 | | | | 1,146 | | | | 1,261 | | | | 17.2 | |
General and administrative | | | 1,306 | | | | 2,422 | | | | 2,988 | | | | 40.9 | |
Depreciation and amortization | | | 2,137 | | | | 2,860 | | | | 3,202 | | | | 43.8 | |
Impairment loss | | | — | | | | — | | | | 3,255 | | | | 44.5 | |
Total operating costs and expenses: | | | 4,312 | | | | 6,428 | | | | 10,706 | | | | 146.4 | |
Operating income | | | 5,614 | | | | 6,530 | | | | 4,530 | | | | 61.9 | |
Other expense, net: | | | | | | | | | | | | | | | | |
Interest expense, net | | | 5,022 | | | | 7,962 | | | | 8,410 | | | | 114.8 | |
Other (income)/expenses | | | (140 | ) | | | (96 | ) | | | 18 | | | | 0.2 | |
Loss on foreign currency exchange, net | | | 441 | | | | 512 | | | | 7 | | | | 0.1 | |
Total other expenses, net | | | 5,323 | | | | 8,378 | | | | 8,435 | | | | 115.1 | |
Profit / (loss) before income tax | | | 291 | | | | (1,848 | ) | | | (3,905 | ) | | | (53.2 | ) |
Income tax expense | | | (153 | ) | | | (489 | ) | | | (296 | ) | | | (4.0 | ) |
Net profit / (loss) | | | 138 | | | | (2,337 | ) | | | (4,201 | ) | | | (57.2 | ) |
Less: Net profit/ (loss) attributable to non-controlling interest | | | 60 | | | | (68 | ) | | | 5 | | | | 0.1 | |
Net profit / (loss) attributable to APGL equity shareholders | | | 78 | | | | (2,269 | ) | | | (4,206 | ) | | | (57.3 | ) |
Net profit / (loss) per share attributable to APGL equity stockholders | | | | | | | | | | | | | | | | |
Basic | | | 2.37 | | | | (52.71 | ) | | | (87.66 | ) | | | (1.20 | ) |
Diluted | | | 2.31 | | | | (52.71 | ) | | | (87.66 | ) | | | (1.20 | ) |
Shares used in computing basic and diluted per share amounts: | | | | | | | | | | | | | | | | |
Weighted average shares | | | | | | | | | | | | | | | | |
Basic | | | 33,063,832 | | | | 43,048,026 | | | | 47,979,581 | | | | 47,979,581 | |
Diluted | | | 33,968,127 | | | | 43,048,026 | | | | 47,979,581 | | | | 47,979,581 | |
Fiscal Year Ended March 31, 2021 Compared to Fiscal Year Ended March 31, 2020
Operating Revenue
Operating revenues during the fiscal year ended March 31, 2021 increased by INR 2,278 million, or 17.6%, to INR 15,236 million (US$ 208.3 million) compared to fiscal year ended March 31, 2020. The principal reasons for the increase in revenue during the fiscal year ended March 31, 2021 was the incremental revenue from projects that commenced operations at various dates during fiscal year ended March 31, 2020 and fiscal year ended March 31,
96
2021. These include Rajasthan 5 and Maharashtra 3 solar power projects, which commenced operation during fiscal year 2020 and contributed incremental operating revenue of INR 312 million, and INR 617 million, respectively, in fiscal year 2021. In addition, Rajasthan 6 and Assam 1 projects commenced their operations during the fiscal year ended March 31, 2021 and contributed incremental operating revenue of INR 335 million and INR 63 million respectively. Further, there was an additional revenue of INR 381 million for the recovery of Safe-Guard Duties and Goods and Service Tax under the change in law provision of our PPAs for four of our projects. The remaining increase in revenue was from existing projects, including repowering.
Cost of Operations (Exclusive of Depreciation and Amortization)
Cost of operations during the fiscal year ended March 31, 2021 increased by INR 115 million, or 10.0%, to INR 1,261 million (US$ 17.2 million), compared to the fiscal year ended March 31, 2020, and remained consistent at 8% - 9% of revenue recognized during the respective periods in both years.
The net increase was primarily due to an increase in plant maintenance cost related to newly operational projects and partial commissioned projects during the previous fiscal year 2020, partially offset by lower module cleaning and other operation and maintenance activities due to COVID-19.
General and Administrative Expenses
General and administrative expenses during the fiscal year ended March 31, 2021 increased by INR 566 million, or 23.4%, to INR 2,988 million (US$ 40.9 million) compared to the fiscal year ended March 31, 2020. The higher General and administrative expenses was primarily due to an increase in stock appreciation rights (SARs) expense of INR 1,150 million compared to the year ended March 31, 2020, partially offset by absence of management transition expense of INR 323 million, absence of interest charges on the safeguard duty on the import of modules of INR 125 million and lower other cost due to cost reductions initiatives in travel, professional and other administrative expenses.
Depreciation and Amortization
Depreciation and amortization expenses during the fiscal year ended March 31, 2021 increased by INR 342 million, or 12.0%, to INR 3,202 million (US$ 43.8 million) compared to the fiscal year ended March 31, 2020. The principal reason for the increase in depreciation was the full year effect of projects that commenced operations on various dates during fiscal year 2020. Plants which were commissioned commercial operation during part of fiscal year 2020, which primarily includes Rajasthan 5 and Maharashtra 3 solar power projects contributing an incremental depreciation expense of INR 41 million and INR 87 million, respectively, in fiscal year 2021. Further, there is incremental depreciation on projects commissioned during fiscal year 2021, which includes the Rajasthan 6 and Assam 1 amounting to INR 103 million and INR 19 million respectively.
Impairment loss
We have reported an impairment loss during the fiscal year ended March 31, 2021 of INR 3,255 million (US$ 44.5 million) primarily relating to the planned disposal of our rooftop projects and other identified assets. For further information on the sale of our Rooftop assets, please see “Item 4. Information on the Company - B. Business Overview – Sale of Assets”.
Interest Expense, Net
Net interest expense during the fiscal year ended March 31, 2021 increased by INR 448 million, or 5.6 %, to INR 8,410 million (US$ 114.8 million) compared to the fiscal year ended March 31, 2020. The increase was primarily due to incremental interest expense (net) of INR 753 million on borrowing related to new projects, refinancing of existing loans during current year causing an increase of INR 257 million, partially offset by prior year charges that did not repeat, comprising INR 385 million of prepayment charges to settle existing loans from the proceeds from the
97
issuance of a solar green bond, INR 124 million related to the extinguishment of a debt facility, and INR 96 million relating to the refinancing of a loan.
Other Expense/ (Income)
Other expenses/ (income) during the fiscal year ended March 31, 2021 increased by INR 114 million to INR 18 million (US$ 0.2 million) as compared to the fiscal year ended March 31, 2020. The lower income is primarily on account of lower investment in mutual funds due to lower free cash available during the year ended March 31, 2021.
Loss on Foreign Currency Exchange
The foreign exchange loss during the fiscal year ended March 31, 2021 decreased by INR 505 million to a loss of INR 7 million (US$ 0.1 million) compared to the fiscal year ended March 31, 2020. During the current fiscal year, we refinanced a foreign currency loan of INR 3,099 million (US$ 42.4 million) into an INR denominated loan, which had reduced the impact of Gain /Loss on Foreign Currency Exchange.
Income Tax Expense/ (benefit)
Income tax expense decreased during the fiscal year ended March 31, 2021 by INR 193 million to an income tax expense of INR 296 million (US$ 4.0 million), compared to fiscal year ended March 31, 2020, the details of which are summarized below.
| | Year ended March 31, (in millions) | | |
| | 2019 | | | 2020 | | | 2021 | | | 2021 | | |
| | INR | | | INR | | | INR | | | US$ | | |
Current tax expense | | | 128 | | | | 120 | | | | 242 | | | | 3.3 | | * |
Withholding Tax on interest on restricted group debt | | | 192 | | | | 258 | | | | 383 | | | | 5.2 | | |
Deferred income tax (benefit)/expense | | | (167 | ) | | | 111 | | | | (329 | ) | | | (4.5 | ) | |
Total | | | 153 | | | | 489 | | | | 296 | | | | 4.0 | | |
| |
* | Current tax on profit before tax. |
The total income tax expense for the fiscal year ended March 31, 2021 was INR 296 million, which decreased by INR 193 million compared to fiscal year ended March 31, 2020.
The current tax expense for the fiscal year ended March 31, 2021 increased by INR 122 million compared to fiscal year ended March 31, 2020 primarily on account of (i) increase in the taxable income of the entities that are outside Tax holiday period; and (ii) increase in the Other Income (primarily interest income) of entities utilizing the 80-IA exemption, as the benefit of the tax holiday period is not available for such other income items.
The Withholding tax on interest on restricted group debt relates to the tax on intercompany interest on Solar Green Bond entities for which the Tax credit is not available under Mauritius tax laws. Amount for the fiscal year ended March 31, 2021 has increased by INR 125 million compared to fiscal year ended March 31, 2020 primarily due to the reason that during the previous year withholding tax on the Company’s 5.65% Solar Green Bond was booked for part of the year as these bonds were issued in September 2019, whereas in the current year withholding tax is recognized for the full year for these bonds.
During the fiscal year ended March 31, 2021, we recorded a deferred tax benefit of INR 329 million (after considering valuation allowance of INR 269 million relating to the impairment loss related to the rooftop entities we are disposing of), whereas for the fiscal year ended March 31, 2020, we recorded a deferred tax expense of INR 111 million. The deferred tax benefit in the current year is primarily due to an increase in deferred tax asset of INR 280 million from the inter-company margin on projects under capital work in progress (including, but not limited to Rajasthan 6, Rajasthan 8 and Rajasthan 9) and the remaining increase is due to movement in other temporary timing
98
difference between the book and tax basis of our assets and liabilities. We pay taxes on taxable profits at the individual entity level, in accordance with the tax rates in the relevant jurisdictions. While at the consolidated level, we had only been profitable in fiscal year 2019, AZI and certain Indian and non-Indian subsidiaries at the individual entity level have generated taxable profits, previously. These taxable profits result from services provided by these entities to other subsidiaries and are taxed at the applicable tax rates in the jurisdiction of the entity providing the services. These inter-company transactions and profits are eliminated during consolidation, while the related income tax expense is not eliminated. We started recording deferred tax asset on the intra-entity transfer of assets pursuant to ASU 2016-16, from April 1, 2017. Subsequent thereto, there is decrease in tax expense, which is primarily attributable to adoption of a new accounting standard on “Intra-entity transfer of assets”, resulting in recognition of deferred tax asset on the income taxes paid on the intra entity transfer of assets to the extent these are expected to be realized by the subsidiary outside of the tax holiday period. Furthermore, a portion of our Indian operations qualifies for a tax holiday related to their operating income attributable to undertakings, as defined, in operating solar power plants under section 80-IA of the Indian Income Tax Act, 1961. This holiday is available for a period of ten consecutive years out of 15 years beginning from the year in which the undertaking first generates power (referred to as the tax holiday period); however, the exemption is available only to the projects completed on or before March 31, 2017. We anticipate that we will claim the aforesaid deduction in the last ten years out of 15 years beginning with the year in which we generate power and when we have taxable income. Accordingly, our current operations are taxable at the normally applicable tax rates. Due to the tax holiday period, a substantial portion of the temporary differences between the book and tax basis of our assets and liabilities do not have any tax consequences as they are expected to reverse within the tax holiday period.
Our tax expenses are further described in Note 13—Income Taxes to our consolidated financial statements included in this annual report.
Fiscal Year Ended March 31, 2019 Compared to Fiscal Year Ended March 31, 2020
Operating Revenue
Operating revenues during the fiscal year ended March 31, 2020 increased by INR 3,032 million, or 30.5%, to INR 12,958 million (US$ 171.9 million) compared to fiscal year ended March 31, 2019. The principal reasons for the increase in revenue during the fiscal year ended March 31, 2020 was the incremental revenue from projects that commenced operations at various dates during fiscal year 2019 and 2020. These include Uttar Pradesh 3, Andhra Pradesh 3, Gujarat 2 and Karnataka 4.1 and 4.2 projects solar power projects, which commenced operation during fiscal year 2019 and contributed incremental operating revenue of INR 43 million, INR 86 million, INR 1,012 million, and INR 607 million respectively, in fiscal year 2020. In addition, Rajasthan 5 and Maharashtra 3 projects commenced their operations during the fiscal year ended March 31, 2020 and contributed incremental operating revenue of INR 773 million and INR 429 million respectively. The balance of the increase in revenue was from the commencement of operations of certain rooftop projects.
Cost of Operations (Exclusive of Depreciation and Amortization)
Cost of operations during the fiscal year ended March 31, 2020 increased by INR 277 million, or 31.9%, to INR 1,146 million (US$ 15.2 million), compared to the fiscal year ended March 31, 2019, and remained consistent at 8.8% of revenue recognized during the respective periods in both years.
The increase was primarily due to an increase in plant maintenance cost related to newly operational projects and partial commissioned projects during the previous fiscal year 2019, by INR 140 million, an increase in land development charges of INR 90 million and an increase in payroll related expenses of INR 28 million.
General and Administrative Expenses
General and administrative expenses during the fiscal year ended March 31, 2020 increased by INR 1,108 million, or 84.3%, to INR 2,422 million (US$ 32.1 million) compared to the fiscal year ended March 31, 2019. The higher general and administrative expenses included INR 273 million due to higher payroll charges related to management transition (including remuneration to new management), INR 169 million related to the grant of stock appreciation rights to our Company’s CEO and COO, INR 235 million on account of impact of additional leases, INR
99
196 million on account of provision for doubtful receivables, INR 62 million on account of provision for doubtful advances and INR 125 million for interest charges on safeguard duty on import of modules.
Depreciation and Amortization
Depreciation and amortization expenses during the fiscal year ended March 31, 2020 increased by INR 723 million, or 33.8%, to INR 2,860 million (US$ 37.9 million) compared to the fiscal year ended March 31, 2019. The principal reason for the increase in depreciation was the full year effect of projects that commenced operations on various dates during fiscal year 2020. These projects include the Rajasthan 5 project which contributed additional depreciation of INR 228 million. Further, plants which commissioned commercial operation in fiscal year 2019, contributed additional depreciation expense, which include Andhra Pradesh 3, Gujarat 2 and Karnataka 4.1 and 4.2 solar power projects which contributed an incremental depreciation expense of INR 2 million, INR 270 million and INR 131 million respectively, in fiscal year 2020.
Interest Expense, Net
Net interest expense during the fiscal year ended March 31, 2020 increased by INR 2,940 million, or 58.5%, to INR 7,962 million (US$ 105.6 million) compared to the fiscal year ended March 31, 2019. The increase in net interest expense was primarily due to interest expense (net) of INR 1,988 million on borrowing related to new projects, charges of INR 584 million related to settlement of existing loans from the proceeds of our issuance of Green Bonds issued and refinancing of existing loans and lower interest income of INR 368 million on account of lower free cash available during the year ended March 31, 2020. The new projects include the Uttar Pradesh 3, Andhra Pradesh 3, Karnataka 4 and Assam projects.
Other Expense/ (Income)
Other Income during the fiscal year ended March 31, 2020 decreased by INR 52 million (US$ 0.7 million) during the year ended March 31, 2020 to INR 96 million (US$ 1.3 million) as compared to the fiscal year ended March 31, 2019. The lower income is primarily on account of lower investment in mutual funds due to lower free cash available during the year ended March 31, 2020.
Loss on Foreign Currency Exchange
The foreign exchange loss during the fiscal year ended March 31, 2020 increased by INR 71 million (US$ 0.9 million) to a loss of INR 512 million (US$ 6.7 million) compared to the fiscal year ended March 31, 2019.
The Indian rupee depreciated against the U.S. dollar by INR 6.23 to US$ 1.00, or 9.0%, during the period from March 31, 2019 to March 31, 2020. This depreciation during the period from March 31, 2019 to March 31, 2020 resulted in an increase in unrealized foreign exchange loss of INR 32 million (US$ 0.4 million) on foreign currency loans, an increase in loss of INR 104 million (US$ 1.4 million) on foreign currency option contracts used to hedge the foreign currency exposure and a decrease in other foreign exchange loss of INR 65 million (US$ 0.9 million).
Income Tax Expense
Income tax expense increased during the fiscal year ended March 31, 2020 by INR 336 million to an income tax expense of INR 489 million (US$ 6.5 million), compared to fiscal year ended March 31, 2019, the details of which are summarized below.
100
| | Year ended March 31, (in millions) | | |
| | 2018 | | | 2019 | | | 2020 | | | 2020 | | |
| | INR | | | INR | | | INR | | | US$ | | |
Current tax (benefit)/expense | | | (117 | ) | | | 128 | | | | 120 | | | | 1.6 | | * |
Withholding Tax on interest on restricted group debt | | | 133 | | | | 192 | | | | 258 | | | | 3.4 | | |
Deferred income tax (benefit)/expense | | | (269 | ) | | | (167 | ) | | | 111 | | | | 1.5 | | |
Total | | | (253 | ) | | | 153 | | | | 489 | | | | 6.5 | | |
| |
* | Current tax on profit before tax. |
The current income tax expense for the fiscal year ended March 31, 2020 was INR 378 million, which increased by INR 58 million compared to fiscal year ended March 31, 2019. The effective income tax rate during the year ended March 31, 2020 was higher in the current period due to inclusion of withholding tax on restricted group debt, which are a cheaper source of financing, (even after including withholding tax).
During the fiscal year ended March 31, 2020, we recorded a deferred tax expense of INR 111 million, whereas for the fiscal year ended March 31, 2019, we recorded a deferred tax benefit of INR 167 million. This change was primarily attributable to reversal of temporary timing difference between the book and tax basis of our assets and liabilities. We pay taxes on taxable profits at the individual entity level, in accordance with the tax rates in the relevant jurisdictions. While at the consolidated level, we have only been profitable in fiscal year 2019, AZI and certain Indian and non-Indian subsidiaries at the individual entity level have generated taxable profits. These taxable profits result from services provided by these entities to other subsidiaries and are taxed at the applicable tax rates in the jurisdiction of the entity providing the services. These inter-company transactions and profits are eliminated during consolidation, while the related income tax expense is not eliminated. We started recording deferred tax asset on the intra-entity transfer of assets pursuant to ASU 2016-16, from April 1, 2017. This decrease was primarily attributable to adoption of a new accounting standard on “Intra-entity transfer of assets”, resulting in recognition of deferred tax asset on the income taxes paid on the intra entity transfer of assets to the extent these are expected to be realized by the subsidiary outside of the tax holiday period. Furthermore, a portion of our Indian operations qualifies for a tax holiday related to their operating income attributable to undertakings, as defined, in operating solar power plants under section 80-IA of the Indian Income Tax Act, 1961. This holiday is available for a period of ten consecutive years out of 15 years beginning from the year in which the undertaking first generates power (referred to as the tax holiday period); however, the exemption is available only to the projects completed on or before March 31, 2017. We anticipate that we will claim the aforesaid deduction in the last ten years out of 15 years beginning with the year in which we generate power and when we have taxable income. Accordingly, our current operations are taxable at the normally applicable tax rates. Due to the tax holiday period, a substantial portion of the temporary differences between the book and tax basis of our assets and liabilities do not have any tax consequences as they are expected to reverse within the tax holiday period.
Our tax expenses are further described in Note 13—Income Taxes to our consolidated financial statements included in this annual report.
B. Liquidity and Capital Resources
We do not generate cash from operations in order to fund its expenses. Restrictions on the ability of our subsidiaries to pay us cash dividends as a result of certain regulatory and contractual restrictions may make it impracticable to use such dividends as a means of funding the expenses of Azure Power Global Limited. For a further discussion on our ability to issue and receive dividends, see “Item 8. Financial Information — A. Consolidated Statements and Other Financial Information”
Our principal liquidity requirements are to finance current operations, service our debt and support our growth in India. We will continue to use capital in the future to finance the construction of solar power plants. Historically, our operations largely relied on project-level long term borrowings, proceeds from issuance of compulsorily convertible preferred shares and compulsorily convertible debentures, and internally generated cash flows to meet capital expenditure requirements. As a normal part of our business and depending on market conditions, we will from time to time consider opportunities to repay, redeem, repurchase or refinance our indebtedness. Changes in our operating plans, lower than anticipated electricity sales, increased expenses or other events may cause us to seek additional debt
101
or financing in future periods. There can be no guarantee that financing will be available on acceptable terms or at all. Debt financing, if available, could impose additional cash payment obligations, additional covenants and operating restrictions. Future financings could result in the dilution of our existing shareholding. In addition, any of the items discussed in detail under “Risk Factors” elsewhere in this annual report may also significantly impact our liquidity.
Liquidity Position
As of March 31, 2021, our liquid assets totaled INR 11,107 million (US$ 151.8 million), which was comprised of cash and cash equivalents. In addition, we have INR 4,881 million (US$ 66.7 million) of short-term restricted cash as of March 31, 2021 that we expect to be utilized primarily for capital expenditures over the next twelve months. As of March 31, 2021, we carried cash and cash equivalent of INR 10,442 million (US$ 142.8 million) held by our foreign subsidiaries, which are not readily available to Azure Power Global Limited.
We also have commitments from financial institutions that we can draw upon in the future upon the achievement of specific funding criteria. As of March 31, 2021, we have such undrawn commitments excluding rooftop projects amounting to INR 19,055 million (US$ 260.5 million) under project-level financing arrangements.
We are subject to business and operational risks that could adversely affect our cash flows. A material decrease in our cash flows would likely produce a corresponding adverse effect on our borrowing capacity.
Sources of Liquidity
Our ability to meet our debt service obligations and other capital requirements will depend on our future operating performance which, in turn, will be subject to general economic, financial, business, competitive, legislative, regulatory and other conditions, many of which are beyond our control. Our financing arrangements as of March 31, 2021 consist of project- level financing arrangements and other borrowings. For a full discussion of the Liquidity risks to our business associated with the COVID-19 pandemic, see “Risks to our Business related to the COVID-19 pandemic”.
102
Project-level Financing Arrangements
Our borrowings include project-specific financing arrangements collateralized by the underlying solar power plants. The table below summarizes certain terms of our project-level financing arrangements as of March 31, 2021:
| | Outstanding principal Amount (in millions) | | | | | | | |
Name of project | | INR | | | US$ | | | Type of Interest | | Currency | | Maturity Date (1) |
Andhra Pradesh 1 | | | 2,508 | | | | 34.3 | | | Fixed | | INR | | 2022 |
Bihar 1 | | | 439 | | | | 6.0 | | | Fixed | | INR | | 2022 |
Gujarat 1 | | | 928 | | | | 12.7 | | | Fixed | | INR | | 2022 |
Karnataka 1 | | | 528 | | | | 7.2 | | | Fixed | | INR | | 2022 |
Karnataka 3.1 | | | 1,382 | | | | 18.9 | | | Fixed | | INR | | 2022 |
Karnataka 3.2 | | | 1,428 | | | | 19.5 | | | Fixed | | INR | | 2022 |
Karnataka 3.3 | | | 6,544 | | | | 89.5 | | | Fixed | | INR | | 2022 |
Punjab 1 | | | 174 | | | | 2.4 | | | Fixed | | INR | | 2022 |
Punjab 2 | | | 1,699 | | | | 23.2 | | | Fixed | | INR | | 2022 |
Punjab 4 | | | 5,810 | | | | 79.4 | | | Fixed | | INR | | 2022 |
Rajasthan 3.1 | | | 867 | | | | 11.9 | | | Fixed | | INR | | 2022 |
Rajasthan 3.2 | | | 1,700 | | | | 23.2 | | | Fixed | | INR | | 2022 |
Rajasthan 3.3 | | | 1,804 | | | | 24.7 | | | Fixed | | INR | | 2022 |
Rajasthan 4 | | | 236 | | | | 3.2 | | | Fixed | | INR | | 2022 |
Telangana 1 | | | 4,610 | | | | 63.0 | | | Fixed | | INR | | 2022 |
Uttar Pradesh 1 | | | 512 | | | | 7.0 | | | Fixed | | INR | | 2022 |
Gujarat 2 | | | 9,188 | | | | 125.6 | | | Fixed | | INR | | 2024 |
Maharashtra 3 | | | 5,238 | | | | 71.6 | | | Fixed | | INR | | 2024 |
Karnataka 4 | | | 3,934 | | | | 53.8 | | | Fixed | | INR | | 2024 |
Maharashtra 1.1 & 1.2 | | | 325 | | | | 4.4 | | | Fixed | | INR | | 2024 |
Uttar Pradesh 3 | | | 1,778 | | | | 24.3 | | | Fixed | | INR | | 2024 |
Andhra Pradesh 3 | | | 2,179 | | | | 29.8 | | | Fixed | | INR | | 2024 |
Punjab 3.1 and 3.2 | | | 1,219 | | | | 16.7 | | | Fixed | | INR | | 2024 |
Chhattisgarh 1.1,1.2 & 1.3 | | | 1,215 | | | | 16.6 | | | Floating | | INR | | 2029 |
Rajasthan 1 | | | 443 | | | | 6.1 | | | Fixed | | INR | | 2031 |
Rajasthan 2 | | | 2,437 | | | | 33.3 | | | Fixed | | INR | | 2033 |
Karnataka 2 | | | 397 | | | | 5.4 | | | Floating | | INR | | 2034 |
Andhra Pradesh 2 | | | 5,125 | | | | 70.1 | | | Floating | | INR | | 2036 |
Uttar Pradesh 2 | | | 2,033 | | | | 27.8 | | | Floating | | INR | | 2037 |
Rajasthan 5 | | | 5,874 | | | | 80.3 | | | Mixed | | INR/US$ | | 2022-2038 |
Assam 1 | | | 1,786 | | | | 24.4 | | | Floating | | INR | | 2039 |
Rajasthan 6 | | | 11,522 | | | | 157.5 | | | Floating | | INR/US$ | | 2021-2040 |
Rooftop Projects (4), (5) | | | 3,401 | | | | 46.5 | | | Mixed | | INR/US$ | | 2022-2032 |
Total Amount | | 89,262 (2), (3) | | | | 1,220.4 | | | | | | | |
| |
(1) | This represents the last repayment period. These loans are repayable on a quarterly or semi-annual basis. For repayment by period of the above-mentioned loans, refer to contractual obligation and commercial commitments. |
(2) | This amount is presented in the financials as, net of ancillary cost of borrowing of INR 1,107 million (US$ 15.1 million). |
(3) | Further, non-project level debt of INR 15,790 million (US$ 215.9 million) and working capital loans for INR 1,529 million (US$ 20.9 million), are excluded from the above table. The non-project level debt balance includes INR 7,054 million (US$ 96.4 million) of foreign exchange impact on project debt against which the company has taken a hedge. |
(4) | Project level debt of INR 1,950 million (US$ 26.7 million) pertaining to rooftop entities under sale have been classified under liabilities directly associated with assets classified as held for sale. |
(5) | Rooftop Projects includes Delhi Rooftop 4, Gujarat rooftop, Punjab Rooftop 2, Railway 1 and SECI 50. |
Our outstanding project-level borrowings have been secured by certain movable and immovable properties, including property, plant and equipment, as well as a pledge of the shares of the project-level SPVs.
The financing agreements governing our project-level borrowings contain financial and other restrictive covenants that limit our project subsidiaries’ ability to make distributions to us unless certain specific conditions are met, including the satisfaction of certain financial ratios. As of March 31, 2021, certain subsidiaries of the Company were not in compliance with the financial covenants related to this borrowing and had obtained suitable waivers for the non-compliance prior to the issuance of these financial statements. See also, Note 12 to the consolidated financial statements.
103
Uses of Liquidity
Our principal requirements for liquidity and capital resources can be categorized into investment for developing solar power plants and debt service obligations. Generally, once operational, our solar power generation assets do not require significant capital expenditures to maintain their operating performance and the working capital is sufficient to meet the operations. For principal and interest payments on our debt outstanding as of March 31, 2021, refer to Contractual Obligations and Commercial Commitments included elsewhere in this annual report.
Capital Expenditures
As of March 31, 2021, we operated 45 utility scale projects with a combined rated capacity of 1,990 MWs. As of such date, we were also constructing projects with a combined rated capacity of 965 MWs.
All our capital expenditures are considered Growth Capital Expenditures. In broad terms, we expense all expenditures in the current period that would primarily maintain our businesses at current levels of operations, capability, profitability or cash flow in operations and maintenance and therefore there are no Maintenance Capital Expenditures. Growth capital expenditures primarily provide new or enhanced levels of operations, capability, profitability or cash flows.
Our capital expenditure requirements consist of:
| | | |
| (i) | Expansion capital expenditures for new projects; and |
| (ii) | Working capital spent for building a pipeline of projects for the coming year(s). | |
Expansion capital expenditures also include interest expense associated with borrowings used to fund expansion during the construction phase of the projects.
Our capital expenditure amounted to INR 18,909 million (US$ 258.8 million) for the fiscal year ended March 31, 2021, primarily for construction of Assam 1 and Rajasthan 6.
Cash Flow Discussion
We also use traditional measures of cash flow, including net cash provided by operating activities, net cash used in investing activities and net cash provided by financing activities, as well as cash available for distribution to evaluate our periodic cash flow results.
Cash and cash equivalents include cash on hand, demand deposits with banks, term deposits and all other highly liquid investments purchased with an original maturity of three months or less at the date of acquisition and that are readily convertible to cash. It does not include restricted cash which consists of cash balances restricted as to withdrawal or usage and relate to cash used to collateralize bank letters of credit supporting the purchase of equipment for solar power plants, bank guarantees issued in relation to the construction of the solar power plants within the timelines stipulated in PPAs and for certain debt service reserves required under our loan agreements.
Fiscal Year Ended March 31, 2021 Compared to Fiscal Year Ended March 31, 2020
The following table reflects the changes in cash flows for the comparative periods:
| | For fiscal year ended March 31, | |
| | 2020 | | | 2021 | | | | | | | Change | |
| | INR | | | INR | | | US$ | | | INR | |
| | (In millions) | |
Cash flow data | | | | | | | | | | | | | | | | |
Net cash provided by operating activities | | | 3,678 | | | | 4,977 | | | | 68.3 | | | | 1,299 | |
Net cash used in investing activities | | | (18,256 | ) | | | (18,919 | ) | | | (258.9 | ) | | | (663 | ) |
Net cash provided by financing activities | | | 16,146 | | | | 15,092 | | | | 206.2 | | | | (1,054 | ) |
104
Operating Activities
During the fiscal year ended March 31, 2021, we generated INR 4,977 million (US$ 68.3 million) of cash from operating activities. This cash generated from operating activities primarily resulted from a net loss during the fiscal year ended March 31, 2021 of INR 4,201 million increased by non-cash items including a derivative instrument of INR 1,918 million, depreciation and amortization of INR 3,202 million, Impairment loss of INR 3,255 million, allowance for doubtful accounts of INR 294 million and share based compensation of INR 1,001 million, offset by deferred income taxes of INR 329 million, in addition to changes in working capital including, a INR 61 million decrease in other liabilities, an INR 224 million increase in deferred revenue, a INR 20 million decrease in prepaid expenses and other current assets, a INR 112 million decrease in other assets primarily resulting from prepaid income taxes and interest receivable on term deposits and INR 83 million decrease in interest payable offset by an INR 874 million increase in accounts receivable.
During the fiscal year ended March 31, 2020, we generated INR 3,678 million (US$ 49.2 million) of cash from operating activities. This cash generated from operating activities primarily resulted from a net loss during the fiscal year ended March 31, 2020 of INR 2,337 million increased by non-cash items including a derivative instrument of INR 1,428 million, depreciation and amortization of INR 2,860 million, allowance for doubtful accounts of INR 303 million and deferred income taxes of INR 149 million, offset by realized gain on investments of INR 108 million, in addition to changes in working capital including, an INR 164 million increase in other liabilities, an INR 340 million increase in deferred revenue, an INR 247 million decrease in prepaid expenses and other current assets, an INR 335 million increase in other assets primarily resulting from prepaid income taxes and interest receivable on term deposits and INR 699 million increase in interest payable offset by an INR 1,390 million increase in accounts receivable.
Investing Activities
During the fiscal year ended March 31, 2021, we utilized INR 18,919 million (US$ 258.9 million) in our investing activities. This cash outflow was primarily due to INR 18,909 million (US$ 258.8 million) incurred to purchase property, plant and equipment primarily related to the construction of our following projects Rajasthan 6 and Assam 1.
During the fiscal year ended March 31, 2020, we utilized INR 18,256 million (US$ 242.7 million) in our investing activities. This cash outflow was primarily due to INR 18,321 million (US$ 243.0 million) incurred to purchase property, plant and equipment primarily related to the construction of our following projects Assam 1, Rajasthan 6, Rajasthan 5, Maharashtra 3, Gujarat 2 and Karnataka 4.1 and 4.2, offset by a net sale of INR 108 million (US$ 1.4 million) of available-for-sale current investments.
Financing Activities
During the fiscal year ended March 31, 2021, we generated INR 15,092 million (US$ 206.2 million) from financing activities. This cash inflow was primarily due to new loan proceeds of INR 25,510 million (US$ 348.7 million) for our Assam 1, Rajasthan 6, Rajasthan 2, Rajasthan 5 and Karnataka 2 projects and certain rooftop solar power plants, offset by repayment of term loan amounting to INR 10,563 million (US$ 144.5 million), which includes INR 2,279 million (US$ 31.2 million) paid towards hedging costs for Green Bonds and import of goods and a INR 257 million (US$ 3.5 million) decrease due to loan prepayment charges.
During the fiscal year ended March 31, 2020, we generated INR 16,146 million (US$ 214.3 million) from financing activities. This cash inflow was primarily due to issuance of Green Bonds for INR 24,400 million (US$ 323.7 million), new loan proceeds of INR 19,538 million (US$ 259.2 million) for our Uttar Pradesh 3, Andhra Pradesh 3 and Karnataka 4 projects and certain rooftop solar power plants and private placement for issuance of 6,493,506 equity shares at US$ 11.55 per share to Caisse de depot et placement du Quebec, from which we raised INR 5,317 million (US$ 70.5 million) offset by repayment of term loan amounting to INR 32,827 million (US$ 435.4 million), which includes INR 1,058 million (US$ 14.0 million) paid towards hedging costs for Green Bonds and an INR 282 million (US$ 3.7 million) decrease due to loan prepayment charges.
105
Fiscal Year Ended March 31, 2020 Compared to Fiscal Year Ended March 31, 2019
The following table reflects the changes in cash flows for the comparative periods:
| | For fiscal year ended March 31, | |
| | 2019 | | | 2020 | | | | | | | Change | |
| | INR | | | INR | | | US$ | | | INR | |
| | (In millions) | |
Cash flow data | | | | | | | | | | | | | | | | |
Net cash provided by operating activities | | | 2,138 | | | | 3,678 | | | | 49.2 | | | | 1,540 | |
Net cash used in investing activities | | | (26,053 | ) | | | (18,256 | ) | | | (242.7 | ) | | | 7,797 | |
Net cash provided by financing activities | | | 26,887 | | | | 16,146 | | | | 214.3 | | | | (10,741 | ) |
Operating Activities
During the fiscal year ended March 31, 2020, we generated INR 3,678 million (US$ 49.2 million) of cash from operating activities. This cash generated from operating activities primarily resulted from a net loss during the fiscal year ended March 31, 2020 of INR 2,337 million increased by non-cash items including a derivative instrument of INR 1,428 million, depreciation and amortization of INR 2,860 million, allowance for doubtful accounts of INR 303 million and deferred income taxes of INR 149 million, offset by realized gain on investments of INR 108 million, in addition to changes in working capital including, an INR 164 million increase in other liabilities, an INR 340 million increase in deferred revenue, an INR 247 million decrease in prepaid expenses and other current assets, an INR 335 million increase in other assets primarily resulting from prepaid income taxes and interest receivable on term deposits and INR 699 million increase in interest payable offset by an INR 1,390 million increase in accounts receivable.
During the fiscal year ended March 31, 2019, we generated INR 2,138 million of cash from operating activities. This cash generated from operating activities primarily resulted from a net profit during the fiscal year ended March 31, 2019 of INR 138 million increased by non-cash items including cashflow hedge of INR 1,037 million and depreciation and amortization of INR 2,137 million, offset by deferred income taxes of INR 508 million, a realized gain on investments of INR 148 million, in addition to changes in working capital including, a INR 532 million increase in other liabilities, an INR 399 million increase in deferred revenue, offset by an INR 1,124 million increase in accounts receivable, and an INR 991 million increase in prepaid expenses and other current assets primarily resulting from prepaid income taxes and debt financing cost and interest receivable on term deposits and INR 301 million decrease in interest payable.
Investing Activities
During the fiscal year ended March 31, 2020, we utilized INR 18,256 million (US$ 242.7 million) in our investing activities. This cash outflow was primarily due to INR 18,321 million (US$ 243.0 million) incurred to purchase property, plant and equipment primarily related to the construction of our following projects Assam 1, Rajasthan 6, Rajasthan 5, Maharashtra 3, Gujarat 2 and Karnataka 4.1 and 4.2, offset by a net sale of INR 108 million (US$ 1.4 million) of available-for-sale current investments.
During the fiscal year ended March 31, 2019, we utilized INR 26,053 million in our investing activities. This cash outflow was primarily due to INR 26,029 million incurred to purchase property, plant and equipment primarily related to the construction of our following projects Gujarat 2, Andhra Pradesh 3, Uttar Pradesh 3, Karnataka 4 and Rajasthan 5, offset by a net sale of INR 1,497 million of available-for-sale non-current investments. Further, we paid INR 1,474 million, to purchase the 48.37% ownership interest in a subsidiary, with a 150 MWs Punjab project, which was not held by us previously.
Financing Activities
During the fiscal year ended March 31, 2020, we generated INR 16,146 million (US$ 214.3 million) from financing activities. This cash inflow was primarily due to issuance of Green Bonds for INR 24,400 million (US$ 323.7 million), new loan proceeds of INR 19,538 million (US$ 259.2 million) for our Uttar Pradesh 3, Andhra Pradesh 3 and Karnataka 4 projects and certain rooftop solar power plants and private placement for issuance of 6,493,506 equity shares at US$ 11.55 per share to Caisse de depot et placement du Quebec, from which we raised INR 5,317 million
106
(US$ 70.5 million) offset by repayment of term loan amounting to INR 32,827 million (US$ 435.4 million), which includes INR 1,058 million (US$ 14.0 million) paid towards hedging costs for Green Bonds and an INR 282 million (US$ 3.7 million) decrease due to loan prepayment charges.
During the fiscal year ended March 31, 2019, we generated INR 26,887 million from financing activities. This cash inflow was primarily due to issuance of 14,915,542 shares at US$ 12.50 per share, in a Follow-on Public Offering (“FPO”) from which we raised INR 13,637 million, issuance of Non-Convertible Debentures for INR 1,478 million and new loan proceeds of INR 15,558 million for our Gujrat 2, Karnataka 4 and Rajasthan 5 projects offset by repayment of term loan amounting to INR 3,786 million, which includes INR 1,305 million paid towards hedges for Green Bonds.
C. Research and Development, Patents and Licenses
Our intellectual property is an essential element of our business, and our success depends, at least in part, on our ability to protect our core technology and intellectual property. To accomplish this, we rely on a combination of patent, trade secret, trademark and other intellectual property laws, confidentiality agreements and license agreements to establish and protect our intellectual property rights.
D. Trend Information
Other than as disclosed elsewhere in this annual report, we are not aware of any trends, uncertainties, demands, commitments or events since March 31, 2021 that are reasonably likely to have a material adverse effect on our net revenues, income, profitability, liquidity or capital resources, or that caused the disclosed financial information to be not necessarily indicative of future operating results or financial conditions.
The COVID-19 pandemic’s adverse impacts on our business, financial position, results of operations, and prospects could be significant.
The COVID-19 pandemic has created disruptions to the global economy and to the lives of individuals throughout the world. Governments, businesses, and the public have taken unprecedented actions to contain the spread of COVID-19 and to mitigate its effects, including quarantines, travel bans, shelter-in-place orders, closures of businesses and schools, fiscal stimulus, and other regulatory changes, even after a little over one year since COVID-19 virus first surfaced. The Government of India imposed a nationwide lockdown in India on March 25, 2020 which continued until May 31, 2020, while gradually relaxing restriction during the period. Due to this lockdown, construction work on our solar projects stopped for several weeks, which resulted in some impact to our construction timelines. A second wave of COVID-19 infections have severely impacted India in April, May and June 2021. This second wave in India has seen new peaks in daily cases, daily deaths, active cases and positivity rates. The second wave has resulted in significant strain on the health infrastructure in the country resulting in several states announcing lockdown measures. Due to this second wave of infection in India, several state governments including Maharashtra, Rajasthan and the National Capital Region announced partial lockdowns during the months of April, May and June 2021. These lock downs and the COVID-19 pandemic have impacted and continue to impact construction work on our projects and the availability of labor, components and material till the supply chains are fully restored. Even after the lockdowns are lifted or eased, we may continue to experience disruption in our construction activities and supply of components and materials. Several of our employees have also been infected with the COVID-19 virus over in Fiscal 2021 and in Fiscal 2022 during the second wave. Accordingly, we may also lose key management and employee hours due to COVID-19 related illness and related issues. Even though a number of governments and organizations have revised Gross Domestic Product (“GDP”) growth for 2021 upward as against downward forecasts for 2020 in response to the economic slowdown caused by the spread of COVID-19. However, considering second wave of COVID-19 and announcement of partial lockdowns during the month of April 2021 by several states, it is possible that the COVID-19 outbreak may cause a prolonged economic crisis or recession. In spite of the vaccination drive being introduced in India, a large portion of the population remains unvaccinated and vulnerable to the virus. While the scope, duration and full effects of the second wave of COVID-19 are rapidly evolving and not fully known, the pandemic and related efforts to contain it have disrupted global and domestic economic activity, adversely affected the functioning of financial markets, impacted interest rates, increased economic and market uncertainty, and disrupted trade and supply chains. While these impacts continue, they will result in sustained economic stress or recession in India and many of the risk factors identified in in this Risk Factors section of our annual report could be exacerbated
107
and such effects could have a material adverse impact on us in a number of ways related to liquidity, operations, customer demand, interest rate risk, and human capital.
For further information, see “Item 3 Key Information, D. Risk Factors - Risks to our Business related to the COVID-19 pandemic”.
E. Off-Balance Sheet Arrangements
The terms of our PPAs provide for the annual delivery of a minimum amount of electricity at fixed prices. Under the terms of the PPAs, we have issued irrevocable performance bank guarantees.
We have issued irrevocable performance bank guarantees in relation to its obligation towards construction and transmission infrastructure of solar power plants as required by the PPA such outstanding guarantees are INR 5,366 million (US$ 73.4 million).
Further, INR 516 million (US$ 7.1 million) is in relation to commissioned plants (including INR 388 million relating to rooftop projects) and INR 10 million (US$ 0.1 million) is a bank guarantee towards other commitments and bank guarantees amounting to INR 906 million (US$ 12.4 million) as of March 31, 2021 to meet Debt-Service Reserve Account (DSRA) requirements for outstanding loans. The funds released from maturity/settlement of existing bank guarantees can be used for future operational activities.
We have obtained guarantees from financial institutions as a part of the bidding process for establishing solar projects amounting to INR 932 million (US$ 12.7 million) as of March 31, 2021. We have given term deposits as collateral for those guarantees which are classified as restricted cash on the consolidated balance sheet.
F. Tabular Disclosure of Contractual Obligations
We have contractual obligations and other commercial commitments that represent prospective cash requirements. The following table summarizes our outstanding contractual obligations and commercial commitments as of March 31, 2021.
| | Payment due by Period | |
| | Under 1 year | | | 1-3 Years | | | 3-5 Years | | | Over 5 years | | | Total | |
| | (INR in millions) | |
Contractual cash obligations | | | | | | | | | | | | | | | | | | | | |
Long-term debt (principal) (1) | | | 4,731 | | | | 44,812 | | | | 31,221 | | | | 14,855 | | | | 95,619 | |
Long-term debt (interest) (2) | | | 6,521 | | | | 9,081 | | | | 4,702 | | | | 8,234 | | | | 28,538 | |
Operating lease obligations | | | 295 | | | | 616 | | | | 653 | | | | 11,804 | | | | 13,368 | |
Purchase obligations (3) | | | 12,931 | | | | — | | | | — | | | | — | | | | 12,931 | |
Asset retirement obligations | | | — | | | | — | | | | — | | | | 811 | | | | 811 | |
Total contractual obligations | | | 24,478 | | | | 54,509 | | | | 36,576 | | | | 35,704 | | | | 151,267 | |
Total contractual obligations (US$) | | | 334.7 | | | | 745.3 | | | | 500.1 | | | | 488.2 | | | | 2,068.3 | |
(1) | The long-term debt includes project secured term loans and, other secured bank loans. The long-term debt (principal) obligations for foreign currency denominated project borrowings have been converted to Indian rupees using the closing exchange rate as of March 31, 2021 as per Reserve Bank of India. |
(2) | Interest on long-term debt is calculated based on the outstanding balance of the debt at the prevailing interest rate for the corresponding periods. |
(3) | Consists of asset purchase commitment for construction of solar power plants. |
108
G. Safe Harbor
This information contains forward-looking statements within the meaning of Section 21E of the Securities Exchange Act of 1934 and the Private Securities Litigation Reform Act of 1995, including statements regarding our future financial and operating guidance, operational and financial results such as estimates of nominal contracted payments remaining and portfolio run rate, and the assumptions related to the calculation of the foregoing metrics. Forward-looking statements are generally identifiable by use of forward-looking terminology such as “may”, “will”, “should”, “potential”, “intend”, “expect”, “seek”, “anticipate”, “estimate”, “believe”, “could”, “plan”, “project”, “predict”, “continue”, “future”, “forecast”, “target”, “guideline” or other similar words or expressions. Our ability to predict results or the actual effect of plans or strategies is inherently uncertain, particularly given the economic environment. Although we believe that the expectations reflected in such forward-looking statements are based on reasonable assumptions, our actual results and performance could differ materially from those set forth in the forward-looking statements and you should not unduly rely on these statements. These forward-looking statements involve risks, uncertainties and other factors that may cause our actual results in future periods to differ materially from those forward-looking statements.
The risks and uncertainties that could cause our results to differ materially from those expressed or implied by such forward-looking statements include, but not limited to:
| | |
| • | the pace of government sponsored auctions; |
| • • • • • • • • • • • • • • | changes in auction rules; the Indian government’s willingness to enforce Renewable Purchase Obligations, or RPOs; permitting, development and construction of our project pipeline according to schedule; solar radiation in the regions in which we operate; developments in, or changes to, laws, regulations, governmental policies, incentives and taxation affecting our operations; adverse changes or developments in the industry in which we operate; our ability to maintain and enhance our market position; our ability to enter new segments of the renewable energy market; our ability to successfully implement any of our business strategies, including acquiring other companies and sale of our assets; our ability to enter into power purchasing agreements, or PPAs, on acceptable terms, the occurrence of any event that may expose us to certain risks under our PPAs and the willingness and ability of counterparties to our PPAs to fulfill their obligations; our ability to borrow additional funds and access capital markets, as well as our substantial indebtedness and the possibility that we may incur additional indebtedness going forward; solar power curtailments by state electricity authorities; our ability to establish and operate new renewable energy projects; our ability to compete against traditional and renewable energy companies; |
| • | the loss of one or more members of our senior management or key employees; |
| • | impact of the COVID-19 pandemic and lockdowns in India and globally; |
| • | political and economic conditions in India; |
| • | material changes in the costs of solar panels and other equipment required for our operations; |
| • | fluctuations in inflation, interest rates and exchange rates; |
| • | global economic conditions; |
| • | disruptions in our supply chain; and |
| • | other risks and uncertainties, including those listed under the caption “Item 3. Key Information — D. Risk Factors.” |
All forward-looking statements in this press release are based on information available to us as of the date hereof, and we assume no obligation to update these forward-looking statements.
109
Recent Accounting Pronouncements
In December 2019, the FASB issued ASU 2019-12, Simplifying the Accounting for Income Taxes (“ASU 2019-12”). This ASU eliminates certain exceptions to the general principles in ASC 740, Income Taxes and adds guidance to reduce complexity in accounting for income taxes. The ASU eliminates, inter alia, the general methodology for calculating income taxes in an interim period when a year-to-date loss exceeds the anticipated loss for the year. The ASU requires that an entity reflect the effect of an enacted change in tax laws or rates in the annual effective tax rate computation in the interim period that includes the enactment date. ASU 2019-12 will be effective for the annual periods beginning after December 15, 2020, including interim periods within those fiscal years. Early adoption is permitted. We have completed a preliminary assessment for evaluating the impact of the guidance and expects that its adoption will not have a material impact on our future financial statements.
In March 2020, the FASB issued ASU 2020-04, "Reference Rate Reform (Topic 848) - Facilitation of the Effects of Reference Rate Reform on Financial Reporting" which provides companies with optional financial reporting alternatives to reduce the cost and complexity associated with the accounting for contracts and hedging relationships affected by reference rate reform. The guidance applies to contracts that:
| – | reference LIBOR or another rate that is expected to be discontinued as a result of rate reform; and |
| – | have modified terms that affect, or have the potential to affect, the amount and timing of contractual cash flows resulting from the discontinuance of the reference rate. |
The amendments in this ASU are effective for all entities as of March 12, 2020 through December 31, 2022.
In addition, in January 2021, the FASB issued ASU 2021-01, “Reference Rate Reform – Scope,” which clarified the scope of ASC 848 relating to contract modifications.
We are currently evaluating the impact of the guidance on our future financial statements.
Other recent accounting pronouncements issued by the FASB (including its Emerging Issues Task Force) and the United States Securities and Exchange Commission did not or are not believed by management to have a material impact on our present or future financial statements.
ITEM 6. DIRECTORS, SENIOR MANAGEMENT AND EMPLOYEES
A. Directors and Senior Management
The following discussion sets forth information regarding our Company’s directors and senior management as of the date of this annual report. Our Company’s Board of Directors is authorized to appoint officers as it deems appropriate. Provided below is a brief description of our Company’s directors’ and officers’ business experience.
110
Mr. Barney S. Rush was nominated as a director by IFC GIF Investment Company, but his affiliation was closed with effect from August 31, 2019 and now he is an independent director of our Company. Mr. Cyril Cabanes and Mr. Deepak Malhotra were nominated by CDPQ Infrastructures. Additionally, Mr. Arno Harris and Mr. Muhammad Khalid Peyrye joined our Company’s Board of Directors on May 30, 2016 and January 30, 2015, respectively as independent directors. Ms. Yung Oy Pin Lun Leung, joined as an independent director on the Board of Directors of our Company on November 08, 2019. Ms. Supriya Prakash Sen and Mr. Panicker Unnikrishnan Mangalath Sukumara joined as director on the Board of Directors of our Company on August 5, 2020 and August 21, 2020, respectively.
Name | | Age | | | Position |
Directors: | | | | | | |
Ranjit Gupta | | | 50 | | | Chief Executive Officer/Managing Director |
Barney S. Rush | | | 69 | | | Chairman of the Board of Directors |
Arno Lockheart Harris | | | 51 | | | Director |
Cyril Sebastien Dominique Cabanes | | | 46 | | | Director |
Deepak Malhotra | | | 41 | | | Director |
Supriya Prakash Sen | | | 55 | | | Director |
Panicker Unnikrishnan Mangalath Sukumara | | | 60 | | | Director |
Muhammad Khalid Peyrye | | | 42 | | | Director |
Yung Oy Pin Lun Leung | | | 54 | | | Director |
Senior Management: | | | | | | |
Murali Subramanian | | | 49 | | | Chief Operating Officer |
Pawan Kumar Agrawal | | | 42 | | | Chief Financial Officer |
Vikas Bansal | | | 36 | | | Head Investor Relations |
Kuldeep Jain | | | 57 | | | Head Construction |
Kapil Kumar | | | 38 | | | Head Operation & Maintenance |
Gaurang Sethi | | | 35 | | | Head Bidding |
Samitla Subba | | | 35 | | | Head Policy |
Akriti Gandotra | | 35 | | | Head Legal |
Sumit Barat | | 42 | | | Chief Sustainability Officer |
Sarvesh Kumar Singh | | 46 | | | Head Supply Chain Management |
Priya Chakrabarti | | 40 | | | Head Human Resource |
Directors
Ranjit Gupta joined our Company as Chief Executive Officer and Managing Director of our Company and AZI on July 2019. He has extensive experience in Renewable Energy, Thermal Power and the Oil & Gas industry with specialties in Project Management, Business Development, Bidding, and Project Finance.
Prior to Azure Power, Mr. Gupta co-founded and served as the Chief Executive Officer of Ostro Energy where he spearheaded growth through a prudent renewable energy auction strategy with an equity investment of $280 million and debt of about $900 million to build a 1,100 MWs renewables platform. Prior to Ostro, Mr. Gupta co-founded Orange Renewable where he steered a capital raise of $65 million of equity and executed renewable energy projects of 180 MWs and developed a pipeline of another 350 MWs. He has also served as the founding CEO of Indiabulls Power, leading construction of over 5,000 MWs of Thermal Power projects. Prior to this, Mr. Gupta worked at Schlumberger for 12 years in various field and management positions across various geographies. Mr. Gupta holds a Bachelor’s in Mechanical Engineering from Indian Institute of Technology, Mumbai.
111
Barney S. Rush has been a member of our Company’s Board of Directors since January 2016. He has served on the board of ISO — New England, the electric grid and wholesale market operator for six U.S. states, since October 2013. Since November 2015, he has also been the Senior Representative of Fieldstone Africa, an investment bank raising capital for power projects in Africa. From July 2010 to December 2013, he served as an Operating Partner at Denham Capital Management, L.P., and from July 2003 to November 2009, he served as the CEO of H2Gen Innovations, Inc., a venture capital backed start-up which developed and manufactured skid-mounted hydrogen generators. In addition, Mr. Rush was Group CEO of Mirant Europe and Chairman of the Supervisory Board of Bewag, the electric utility serving Berlin, Germany, from August 1999 to May 2002. Mr. Rush holds a Bachelor’s degree in Social Studies from Harvard College and a Master’s degree in Public Affairs from Woodrow Wilson School of Princeton University.
Arno Harris has been a member of our Company’s Board of Directors since May 2016. He currently serves as chairman emeritus of the Solar Energy Industry Association and as a board member of Advanced Energy Economy Institute. He founded Recurrent Energy, LLC, in 2006 and held the position of CEO until March 30, 2015, growing it into one of North America’s largest solar project developers before selling the company to Sharp in 2010 and subsequently sold to Canadian Solar in 2015. Prior to his work at Recurrent Energy, LLC, he was CEO of Prevalent Power, Inc. and El Solutions, Inc. (now Suntech Energy Solutions) in addition to founding Novo Media Group. Mr. Harris holds a Bachelor’s degree in English Literature from the University of California, Berkeley.”.
Cyril Cabanes has been a member of our Company’s Board of Directors since December 2016. He is currently the Vice‑President, Head of Infrastructure Transactions, Asia-Pacific at CDPQ. He has over 20 years of experience across all facets of infrastructure transactions including acquisitions, financing and fundraising. This includes his term at Marubeni Corp., where he led the Asian IPP investment team in Singapore. Previously, Mr. Cabanes was Director and Portfolio Manager at Deutsche Bank, where he was responsible for acquisitions, capital raising and product development for Asia-Pacific. Prior to that, Mr. Cabanes spent 10 years in investment banking and financial markets with RBS, BNP Paribas and UBS. Mr. Cabanes holds a Masters from ESCP‑Europe and an MBA from Drexel University.
Deepak Malhotra was appointed to our Company’s Board of Directors in November, 2019. Mr. Malhotra is Director, Infrastructure, South Asia at Caisse de dépôt et placement du Québec (CDPQ). He has over 18 years of experience across all facets of infrastructure. Before joining CDPQ in 2018, Mr. Malhotra worked with International Finance Corporation (IFC), World Bank Group, where he led many debt and equity investments in the infrastructure sector. Prior to IFC, Mr. Malhotra worked with one of the leading credit rating agencies in India and in the Merchant Navy. Mr. Malhotra holds a Bachelor’s Degree from Delhi University and an MBA from Vanderbilt University.
Supriya Prakash Sen joined as Board of Director of our Company from August 2020. Ms. Sen has over 30 years of experience in banking, private equity, capital markets and multilateral funding and investment as well as significant involvement in sustainability initiatives globally and in India. Currently, a Senior Advisor with Mckinsey & Co, Ms. Sen also serves as an independent director for firms and non-profit organizations in Asia where her emphasis has been on strategy, governance and fund-raising. As a strategy consultant, Ms. Sen has advised clients in South East Asia, South Asia and China on innovative financing, policy and strategy development in transport, energy, urban and sustainable finance projects. Ms. Sen has also worked on differentiated funding models for enabling private investment in green infrastructure.
Previously, Ms. Sen worked as a private equity investor and project finance banker on climate- smart transactions in energy, mobility, telecom, urban & water, social infrastructure, and banking sectors in India, China, South East Asia and Middle East. She also has been in advisory and investment roles within Public Private Partnership (PPP) infrastructure projects for banks and financial institutions, such as Citigroup Global Markets, Asian Development Bank, and the World Bank Group.
Ms. Sen holds an honours undergraduate degree in engineering from Bangalore University and an MBA from Indian Institute of Management Calcutta. Over the years, she also completed various executive development programs in strategic innovation, public policy and governance at Kennedy School of Government, Singapore Institute of Directors and Harvard Business School.
112
M.S Unnikrishnan has over 30 years of experience in the energy and environmental sector. In his most recent role as Managing Director and CEO of Thermax Ltd., he led the implementation of a strategy to accelerate Thermax's growth and position it as one of the leading suppliers of power systems and equipment with a market capitalisation of over US$1 billion. Thermax Ltd has been recognized for having exemplary management, strong corporate governance, excellent transparency and stringent ethical practices. Mr. Unnikrishnan has received numerous accolades for his leadership including Asia Innovator of the Year by CNBC Asia, one of the best CEOs in India by Grant Thorton, and India Innovator of the Year by CNBC India. Mr. Unnikrishnan is also actively involved with various industry bodies to help in policy making and technology development for India.
Mr. Unnikrishnan holds a Bachelor of Engineering (Mechanical) from Visveswaraiya National Institute of Technology, Nagpur and has completed an Advanced Management Program from Harvard Business School.
Muhammad Khalid Peyrye has been a member of our Company’s Board of Directors since January 2015 and is one of our resident directors in Mauritius. Mr. Peyrye heads the Corporate Secretarial and Administration cluster of AAA Global Services Ltd, having joined the organization in 2007. Prior to joining AAA Global Services Ltd., Mr. Peyrye worked for several years with a leading financial services company and accountancy firm. Mr. Peyrye received his Bachelor’s degree in Law and Management from the University of Mauritius and is a member of the Institute of Chartered Secretaries and Administrators of the United Kingdom. He has been involved extensively on company formations, company administration, corporate secretarial services, cross-border investment activities and corporate organizational transactions such as mergers and acquisitions, in addition to serving as director on the board of several companies in Mauritius. Mr. Peyrye has, in his career, been involved as Money Laundering Reporting Officer and Compliance officer of various companies involved in the financial services sector.
Yung Oy Pin (Jane) Lun Leung joined as Board of Director of our Company from November 2019, has extensive experience as a professional in the financial services sector, particularly in accounting, auditing, taxation, corporate secretarial and administration, of the United Kingdom & Mauritius. Previously she has worked with Ascough Ward Chartered Accountants, Kingston Marks Chartered Certified Accountants and Deloitte & Touche across various sectors including financing, trading, manufacturing, property, construction, engineering & PPP projects, telecommunication, mining, gaming & hospitality. She also sits on the board of several global business companies. Mrs. Lun Leung holds a Bachelor’s degree from South Bank University, London and is a Fellow Member of the Institute of Chartered Accountants in England & Wales.
Executive Officers
Murali Subramanian joined as our Company’s President from July 18, 2019. He took over the role of Chief Operating Officer from April 04, 2020. Mr. Subramanian comes with leadership experience in both structured and entrepreneurial environments in managing operations and building businesses in Energy, Power, Renewables and Infrastructure space.
Prior to Azure Power, Mr. Subramanian, co-founded and served as the Chief Operating Officer (COO) of Ostro Energy and oversaw the deployment of US$280 million of equity capital raised from the global private equity firm Actis for the development and execution of 1,100 MWs of renewable energy capacity. Prior to Ostro, Mr. Subramanian also co-founded Orange Renewable where he steered the enterprise from a start-up stage into a profitable company, together with developing and executing projects of 180 MWs of capacity. Earlier, Mr. Subramanian worked with Indiabulls Power as COO where he executed the Group’s vision and strategy to become a large IPP in the India power sector. Prior to this, Mr. Subramanian worked in Schlumberger in various field and management positions.
Mr. Subramanian holds a Bachelor’s in Electrical Engineering from Indian Institute of Technology, Mumbai and a Master’s degree in Business Administration from INSEAD, Fontainebleau, France.
113
Pawan Kumar Agrawal is our Company’s chief financial officer and leads our capital, investor relations, finance and accounts functions. Mr. Agrawal has experience in corporate and structured finance, portfolio monitoring, financial analysis, credit rating, business development and relationship management in the infrastructure sector with a special focus on renewable energy. Previously, he was the Chief Investment Officer of the Company and overlooked the capital and investment portfolios for our Company. Prior to joining our Company, Mr. Agrawal served as Group President II & Dy. Head – Corporate Finance Infrastructure Banking and National Head Renewable Energy at YES Bank Limited. Mr. Agrawal was instrumental in the issuance of India’s first Green Bond as well as India’s first IIFCL/ADB braced Partial Credit Enhanced Bond in the Indian Solar Sector. Mr. Agrawal has also worked with CRISIL, Indian-Oil and Ernst & Young.
Mr. Agrawal is a Rank holder Chartered Accountant and Cost Accountant. He holds a Master’s degree in Business Administration from Faculty of Management Studies, Delhi University, and is a Chartered Financial Analyst (CFA, USA).
Vikas Bansal is our Company’s Head of Investor Relations. He brings 14 years of experience in structured and project finance, risk management in infrastructure sectors with focus on renewable energy during the last decade. He has been a part of the Capital team at Azure Power during last 2 years, managing foreign debt providers and M&A transactions. Prior to Azure Power, Mr. Bansal served as Group Executive Vice President, Corporate Finance at YES Bank. Mr. Bansal was instrumental in YES BANK’s leadership in Renewable Energy finance and Policy Advocacy. He also worked with ICICI Bank in the credit risk management team.
Mr. Bansal holds a Bachelor’s degree in Commerce (Hons) from Sri Ram College of Commerce, Delhi University and an MBA in International Business from Dept. of Commerce, Delhi University.
Kuldeep Jain is our Company’s Senior Vice President of Project Development and Construction at the Company. He brings 34+ years of rich experience in the power sector. Most recently he was associated with Vikram Solar, and prior to this he has completed successful stints at Sangam Renewables, Astonfield, Lanco Solar, and Wartsila. He has handled various Solar PV projects and 3rd party EPC projects. Mr. Jain holds a degree in Electrical Engineering and has completed his Executive MBA from SP Jain Institute of Management.
Kapil Kumar is our Company’s Senior General Manager of Operations & Maintenance at the Company. Kapil brings with him 14+ years of rich experience in the energy sector. Prior to joining Azure Power, he was associated with Fortum Solar India Private Limited. Earlier he had worked with ETA Engineering and Platinum Sustainable Development International. Kapil holds a B. Tech (Mech) degree from IIT, Bombay and he is a Certified Expert for Solar Simulation from PVSyst SA, Switzerland.
Gaurang Sethi is our Company’s Vice President of Bidding and heads the bidding function at the Company. Mr. Sethi has cross functional experience across the power and renewables sector, which covers bidding strategy, sustainability and energy markets. Under his leadership at the Company, the Company’s portfolio has grown by over 5,000 MWs. Prior to joining the Company, Mr. Sethi worked with Vestas Wind India, Caterpillar Inc., and other clean energy start-ups.
Mr. Sethi holds a Bachelor’s degree in Mechanical Engineering from Vellore Institute of Technology. He also holds a Master’s degree in Business Administration with a specialization in Finance & Strategy and another Master’s degree in Energy & Sustainability, from University of Michigan, Ann Arbor.
Samitla Subba is our Company’s Vice President of Corporate Affairs—Policy and communications and heads the corporate affairs – policy and communications functions. Mrs. Subba has experience in marketing strategy, public relations and communications. She was a key member in taking the Company to its initial public offering on the NYSE in 2016 and in building relationships with the Company’s key stakeholders, including investors, customers and the media. Prior to joining the Company, Mrs. Subba worked with Northern Trust as a financial analyst.
Mrs. Subba holds a Bachelor’s degree from Bangalore University and a Master’s degree in Business Administration with a specialization in Marketing from Indian Institute of Management, Lucknow.
114
Akriti Gandotra is our Head of Legal. Ms. Gandotra has rich and diverse experience in undertaking complex legal and regulatory issues. She has been involved in several crucial projects in diverse areas of law including Power and Energy, Corporate and Commercial Laws, Intellectual Property, and Alternative Dispute Resolution. At the Company, Ms. Gandotra has been instrumental in strategizing and driving litigations and non-adversarial tariff claims before various Electricity Regulatory Commissions, negotiating complex documentation, providing cross-functional strategic support by advancing business interest within the legal parameters. Prior to joining Azure Power, Akriti has worked with S&R Associates, A&M Law offices and at Chambers of Senior Advocate, Mr. Ritin Rai. She has also represented the Government of India before Delhi High Court and the Supreme Court of India in Service, Tax and Constitutional matters.
Ms. Gandotra holds a Bachelor’s degree in Political Science (Hons) from Lady Shri Ram College, Delhi University, and a Bachelor’s degree in Law from Faculty of Law, Delhi University. She is registered with the Bar Council of India.
Sumit Barat is our Chief Sustainability Officer and leads our - CSR Strategy and SHES. Mr. Barat has a strong track record of improving ESG performance of large-scale infrastructure projects. At the Company, he leads the sustainability initiative of the company. He frequently interacts with lenders, consultants and other key stakeholders on ways to enhance sustainability and improving ESG performance of the company and leads implementation of such sustainability initiatives. He also heads the Health and Safety department and plays active role in CSR activities of the Company.
Prior to joining the Company, Mr. Barat was the Associate Director of Arcadis India, and advised more than 5 GW renewable energy projects on meeting and exceeding their ESG targets. He also acted as the project director of Resettlement Action Plan and Social Impact Assessment including land acquisition support for implementation of the first High Speed Rail (Mumbai Ahmedabad) project in India.
Mr. Barat holds a Bachelor in Planning from School of Planning and Architecture, New Delhi and holds a M.B.A from K.J. Somaiya Institute of Management Studies and Research, Mumbai. In addition, he has undertaken number of diploma / certification course on health, safety, environment and social aspect.
Sarvesh Kumar Singh is our Head of Procurement. Mr. Singh brings with him 24 years of techno-commercial experience in the power sector, including 10+ years of experience as head of contracts, commercial, and business development. Prior to joining the Company, he was associated with Sarkun Solar Private Limited where he was instrumental in developing a 290 MW solar business for the group and leading the business development for a 1,320 MW thermal project. Earlier he had worked with Hindalco, Reliance Energy, Bajaj Energy, and Indiabulls Power Limited in various management roles across procurement, project management, and O&M of solar power.
Mr. Singh holds a B.E. degree from Motilal Nehru Institute of Technology and has completed his Post Graduate Diploma in Business Management from MDI, Gurugram.
Priya Chakrabarti is our Company’s Head of Human Resources and comes with a rich experience across multiple domains of HR having worked with market leading organizations in the FMCG and Technology sectors such as GSK, Alcatel Lucent, AkzoNobel. A trained coach and facilitator, she has partnered with CXOs and business heads at regional and global levels to drive people agenda, across handling integration arising out of a global acquisition, setting up business verticals to designing right sized org structures. Prior to joining our company, she served as Vice President HR at Oyo to head Human Resources functional for their growth businesses and was instrumental in setting up their real estate fund in India and US.
Priya is an IIT, XLRI alumnus having completed Masters in Physics from IIT Roorkee and MBA in Human Resources from XLRI Jamshedpur.
115
B. Compensation
Directors and Officers Compensation
For the fiscal year 2021, the aggregate compensation (excluding grants of stock options) to our executive officers included in the list herein was INR 128 million (US$1.7 million), and INR 21 million (US$ 0.3 million) towards fee paid to our Directors. Our agreements with each of the members of senior management are listed herein under “— Employment Agreement.” Except as otherwise disclosed, the above cash compensation does not include stock compensation and employee benefits to our directors and senior management.
During the previous year, our Company’s Board of Directors approved the Amended Directors Compensation Plan 2019 which was effective from September 1, 2019 for non-executive Directors not drawing salaries before and the policy is as follows:
| A. | Annual Retainer for board membership - US$ 40,000 per director |
| B. | Annual Retainer for committee membership - US$ 5,000 per committee for Audit, Compensation and Capital Committees. None for Nomination & Governance and CSR Committees. |
| C. | Annual Retainer for board and committee chairs – |
| a) | Chairman of the Board (non-executive): US$ 20,000 |
| c) | Compensation and Capital: US$ 10,000 |
| d) | Nomination & Governance and CSR: None at this time. |
| E. | Restricted Stock (“RS”) will be granted to directors in accordance with the following schedule: |
| a. | A scale of the RS grants as follows: |
| 1. | Year 1: from October 1 (the beginning of the first full year of the board service) to September 30 of the next year: USD 15,000. |
| 2. | Year 2 at the outset of the second full year on October 1: USD 30,000. |
| 3. | Year 3 at the outset of the third full year on October 1: USD 45,000. |
| 4. | Year 4 and beyond at the outset of the fourth full year on October 1: USD 60,000. |
| b. | The amount of the RS granted will be valued as of October 1 of the year in question, with the RS equal to the corresponding USD value, divided by the FMV of the stock price on October 1 (or the next business day) of that year, determined as set out in the Equity Incentive Plan 2016, as amended from time to time. |
| c. | RS grants will be administered as per the Equity Incentive Plan 2016, as amended. |
| d. | The RS grants will be subject to a Period of Restriction of 18 months from the day of grant provided the director remains on the Azure board; and provided further that: |
| 1. | if the director voluntarily resigns (or leave the board for other reasons other than for Cause) from the board during a year of service, the Period of Restriction on RS granted for that year will lapse immediately on a pro-rata basis determined as a percentage of days served for that year, and further, the Period of Restriction on the prior year’s award will also lapse if it has not lapsed already; |
| 2. | if a director is removed for Cause, all RS for which the Period of Restriction has not lapsed, regardless of when granted, will be forfeit; and |
116
| e. | The RS under Period of Restriction will not have voting rights or rights to any dividends or any other distribution from the Company. |
| f. | It is hereby clarified that the granting of RS will be in the form of a letter of grant and RS shall only be transferable to the name of the director when they are earned by the director, which shall be deemed to occur at the end of the Period of Restriction (provided the director remains on the Azure Board) or upon the lapsing of the Period of Restriction as evoked in paragraph d1 above. On account of the possibility (albeit remote) that RS may have to be forfeited (as evoked in paragraph d2), the director shall be deemed not to be owed any RS or any other form of emoluments in lieu of the RS until the end of the Period of Restriction / lapsing of the Period of Restriction as stated above. |
As part of the Directors Remuneration Plan set out above, we granted 4,273 Restricted Stock, to three of our directors, during the year to be vested in 18 months from grant date but accelerated for retirement at the end of a term or involuntary retirement if not for cause. On exercise of these RSs, equivalent number of common equity shares will be issued by our Company subject to adjustments as to Mauritius withholding tax.
Remuneration payable under the Directors Remuneration Plan are subject to following respective conditions:
| a) | Mr. Arno Harris has agreed that, in regard to any compensation received through this program for the period up to May 2, 2020, such amount will be deducted from what he would receive upon exercising the stock options that he has been granted for the 4 years of service that began May 2, 2016. |
| b) | CDPQ Infrastructures nominated Directors have not opted for remuneration |
| c) | RSU awards granted before October 1, 2020 will be replaced with RS and shall be treated in accordance with terms stated in Section (E) as above. |
Our CEO and COO, appointed on July 18, 2019, have entered into an employment contracts (refer exhibit 4.28 and 4.29) with the Company, which was later amended as on July 20, 2020. As part of their compensation, they shall be entitled to long term incentive compensation as set forth below. All such compensation shall be in the form of Stock Appreciation Rights (“SARs”), as defined in our Company’s 2016 Equity Incentive Plan, as amended in 2020. The SARs shall not have any voting rights:
| a. | Tranche 1 SARs. On the Joining Date i.e. July 18, 2019 (such date, the "Grant Date"), our Company shall grant to the Executive a one-time nonrecurring grant of 100,000 SARs. The exercise price per SAR for Tranche 1 SARs will be US$ 10.48. The 100,000 Tranche 1 SARs will vest upon the occurrence of the “Restructuring Event” and may be exercised, at the Executive’s option, either within sixty (60) days from the occurrence of the Restructuring Event (the “Restructuring Event Exercise”) or, if there is no Restructuring Event, Exercise after the occurrence of the Restructuring Event in accordance with the terms of this Section 2 (iii) provided that if the Restructuring Event does not occur by December 31, 2020, then (i) 25,000 Tranche 1 SARs will vest on March 31, 2021 and 12,500 Tranche 1 SARs will vest on March 31 of each of the six (6) years subsequent to March 31, 2021, and (ii) vested Tranche 1 SARs may be exercised after March 31, 2024. |
| b. | Tranche 2 SARs. On the Grant Date, our Company shall grant to the Executive a one-time nonrecurring grant of 800,000 SARs. The exercise price per SAR for Tranche 2 SARs will be the Initial Exercise Price. 75,000 Tranche 2 SARs will vest on March 31, 2020, 100,000 Tranche 2 SARs will vest on March 31, 2021, 100,000 Tranche 2 SARs will vest on March 31 of each of the six (6) years subsequent to March 31, 2021, and the final 25,000 Tranche 2 SARs will vest on July 31, 2027. Vested Tranche 2 SARs may be exercised after March 31, 2024; provided however, that if (i) a Change of Control (as defined in APGL’s Change of Control Policy dated February 5, 2018, as may be amended from time to time (“Change of Control Policy”)) occurs prior to March 31, 2024, (ii) Caisse de dépôt et placement du Québec (CDPQ) no longer has a nominee on the APGL Board, and (iii) the Executive is not entitled to any Change of Control Severance Benefits (as defined in the Change of Control Policy), then vested Tranche 2 SARs may be exercised upon the earlier of March 31, 2024 and the one year anniversary of such Change of Control. For the avoidance of doubt, nothing herein changes the vesting schedule of Tranche 2 SARs as set forth above. |
117
| c. | Tranche 3 SARs. Our Company shall grant to the Executive (i) a minimum of 70,000* SARs on March 31, 2020 and (ii) a minimum of 40,000 SARs on March 31 of each subsequent year. The number of SARs granted each year may be increased by the Board taking into consideration our Company, APGL and the Executive’s performance. The exercise price per SAR for Tranche 3 SARs will be the Fair Market Value# per share as of the date of the grant of the subject SAR. Tranche 3 SARs will vest over a period of four (4) years beginning twelve months after the date of grant in the proportion of 25% of such SARs per year and may be exercised upon vesting. |
| * | For the year ended March 31, 2020, our Company granted additional 15,000 SAR’s each to the CEO and COO. |
Further, during the previous year the Tranche 1 SAR fully vested as the vesting conditions got triggered due to acquisition of more than 50% stake by CDPQ Infrastructures. During current year, CEO and COO exercised part of the SARs out of Tranche 1 vested in previous year.
# Fair Market Value definition was amended vide amendment in Employment Agreement dated 20 July, 2020 and as approved by Compensation Committee vide resolution dated 02 July, 2020 and provides as under:
For the purposes of determining the exercise price for Tranche 3 SARs, the Fair Market Value per share means:
i. If APGL’s shares (the “Shares”) are listed and traded on any stock exchange as of the exercise date, its Fair Market Value per share will be the 10-Day Volume Weighted Closing Price Average for the 10 trading days up to and including the day being the exercise date. For avoidance of doubt “10-Day Volume Weighted Closing Price Average” shall mean the number mathematically computed by (A) multiplying (i) the closing price of the Common Stock, as reported in The Wall Street Journal or such other source as the Administrator deems reliable, for each of the ten (10) Trading Days, including date of determination by, (ii) the trading volume of the Common Stock, as reported in The Wall Street Journal or such other source as the administrator deems reliable, for each such Trading Day; (B) determining the sum of the product of (A) above for such 10-day period; and (C) dividing such sum by the cumulative trading volume, which is the sum of the trading volume of the Common Stock for each Trading day in such 10-day period as defined in Section (ii) herein.
If the Common Stock is regularly quoted by a recognized securities dealer but selling prices are not reported, the Fair Market Value of a Share will be the mean between the high bid and low asked prices for the Common Stock on the day of determination (or, if no bids and asks were reported on that date, as applicable, on the last trading date such bids and asks were reported), as reported in The Wall Street Journal or such other source as the Administrator deems reliable; or
ii. If the Shares are not listed and publicly traded on any stock exchange as of the exercise date, the fair market value per Share determined by the “Appraiser” (as defined below) using generally recognized methodologies, including discounted cash flow and multiples of earnings or EBITDA of comparable companies, and also considering any recent fund raising or liquidity event undertaken by APGL. The Board shall retain the Appraiser to prepare the fair market valuation report (the “FMV Report”) for each fiscal year after the audited full year financial statements for the subject fiscal year of APGL are finalized and approved by the APGL Board of Directors.”
Employee Benefit Plans
For the fiscal year 2021, the aggregate compensation, including directors’ fees but excluding grants of stock option to our directors and executive officers included in the list herein, was INR 21 million (US$ 0.3 million). Our agreements with each of the members of senior management are listed herein under “— Employment Agreement.” Except as otherwise disclosed, the above cash compensation does not include stock compensation and employee benefits to our directors and senior management.
118
Provident Fund
In accordance with Indian law, all of our employees in India are entitled to receive benefits under the Employees’ Provident Fund Scheme, 1952, as amended, a retirement benefit scheme under which an equal amount as required under the Employees’ Provident Funds and Miscellaneous Provisions Act, 1952, of the base salary of an employee is contributed both by employer and employee in a fund with government/trust with company.
Gratuity
In accordance with Indian law, we pay gratuity to our eligible employees in India. Under our gratuity plan, an employee is entitled to receive a gratuity payment on his superannuation or on his retirement or on the termination of his or her employment if the employee has rendered continuous service to our Company for not less than five years, or if the termination of employment is due to death or disability due to accident or disease. The amount of gratuity payable to an eligible employee is equal to 15 days’ salary based on the last drawn salary for every completed year of employment (or any portion of a year exceeding six months).
Leave Encashment Policy
Under our leave encashment policy, an employee is entitled to accumulate upto 45 days of leave Employees are encouraged to avail of the leave and hence, any balance over 45 days lapses of April 1 of each fiscal year. In the event of resignation, termination of employment or retirement, an employee is entitled to a payment for the accrued leave of absence up to a maximum of 45 days if the employee has spent at least 240 working days. The amount of payment to be made for each day of such accrued leave of absence shall be calculated by dividing the last drawn monthly base salary by 30 days.
Employment Agreements
Most of our executive officers have entered into an employment agreement with our Company. Aside from the employee benefit plans, our employment agreements do not provide for any special termination benefits, nor do we have any other arrangements with our directors for special termination benefits.
Each executive officer has acknowledged that ownership of any intellectual property created by him for our Company shall remain at our Company. Additionally, the founder of the Company had also agreed to transfer and assign to the Company all rights, title and interest in and to all the trademarks, trade names, brand names, patents, designs, domain names and other intellectual property rights created by them for our Company.
In addition, each executive officer has agreed to be bound by the non-competition and non-solicit restrictions set forth in his employment agreement. Specifically, each executive officer has agreed, while employed by us and for a period of one year after termination of his employment, not to:
| • | directly or indirectly, enter into the employment of, tender consulting or other services to, acquire any interest in, or otherwise participate in any business that competes, directly or indirectly, with any of the companies or entities in the same lines of business that our Company is engaged in at the time the employment is terminated; nor |
| • | solicit, encourage, or induce or attempt to solicit, encourage, or induce any employee or customer, or prospective employees and customers with whom our Company has had discussions or negotiations within the last six months of the termination of his employment not to establish a relationship with our Company. |
119
Equity-Based Compensation
Our Company, during Fiscal Year 2017, adopted the amended Equity Incentive Plan “2016 Equity Incentive Plan (as amended in 2017)” with due approval of the shareholders of the Company obtained at the Annual General Meeting held on September 25, 2017. The Company increased the pool size of the existing Stock Option pool by one million shares which took the total pool size to 2,023,744 shares. On April 30, 2020, Company further adopted the amended Equity Incentive Plan “2016 by Equity Incentive Plan (as amended on March 31, 2020). The amendment will require that the fair market value of the Grants to be based on the 10-day daily volume weighted closing price average up to and including the date of determination and some minimal drafting corrections of the Plan.
Our 2016 Equity Incentive Plan (as amended on March 31, 2020) is a comprehensive incentive compensation plan under which we can grant equity-based and other incentive awards to our officers, employees and directors.
The objective of the plan is (i) to provide means to enable us to attract and retain high quality human resources in our employment; (ii) to make the compensations and rewards competitive in the market; and (iii) to achieve sustained growth and create shareholder value by aligning the interests of the employees with our long term interests.
Pursuant to the U.S. securities laws and regulations, we have filed Form S-8 for registration of equity shares issuable upon exercise of ESOP grants under our 2016 Equity Incentive Plan (as amended in 2017) with the SEC.
As of March 31, 2021, we had 703,708 equity shares issuable pursuant to the exercise of any outstanding options granted under the ESOP plans, the 2016 Equity Incentive Plan and the 2016 Equity Incentive Plan (as amended on March 31, 2020).
The following paragraphs further describe the principal terms of the 2016 Equity Incentive Plan (as amended on March 31, 2020).
Administration
The Compensation Committee of the Company is the sole administrator for the administration of options, including the ESOPs. Computershare Trust Company, N.A. has been appointed as plan partial administrator. Company has total 2,280,527 shares which are Authorized for Grant as of March 31, 2021.
Under the terms of the 2016 Equity Incentive Plan (as amended on March 31, 2020), which may be amended from time to time, the sum of all grants made under the equity incentive plan shall not exceed 10% of our total issued and subscribed equity capital.
Eligibility
Our compensation committee may grant options to all eligible employees on the basis of the following criteria: position, role and performance of the employee, tenure in organization and such other factors as the compensation committee may decide from time to time.
Vesting Schedule
The grants made to any individual shall be vested in the following manner:
| • | 25% on the expiry of 12 months from the date of grant; |
| • | 25% on the expiry of 24 months from the date of grant; |
| • | 25% on the expiry of 36 months from the date of grant; and |
| • | 25% on the expiry of 48 months from the date of grant. |
120
Option Exercise
There shall be no lock-in period after the options have vested and the options must be exercised by the employees before the end of the tenure of the plan. In case of termination of services other than not for cause as per the Plan, employees can exercise the options vested as on the last day of employment, as per the respective Post Termination Exercise Period Policy as stated in their letter of awards.
Stock Appreciation Rights and Restricted Stock Unit
As per the Executive Employment Agreement of the CEO and COO of the Company, they both are entitled to Stock Appreciation Rights (as provided above) each as part of long-term incentive compensation, which is to be vested by and before July 31, 2027. The value of SARs payable to the Executive in cash upon exercise of vested SARs will be the fair market value per share as of the exercise date less the exercise price/grant price multiplied by the number of SARs being exercised. For a full disclosure of the terms and conditions relating to Stock Appreciation Rights, see section above “B. Compensation, (Directors and Officers Compensation)”.
Also, as part of the Directors Remuneration Plan our Company also granted shadow Restricted Stock Units (as provided above) during the fiscal year ended March 31, 2020 to be vested in 18 months from grant date but accelerated for retirement at the end of a term or involuntary retirement if not for cause. On exercise of these RSUs, amount payable by our Company will be the number of shadow RSUs awarded multiplied by the price of the common stock on the date the shadow RSU’s are exercised. See section above “B. Compensation, (Directors and Officers Compensation)”.
Amendment or Termination
Our Company’s Board of Directors may in its absolute discretion amend, alter or terminate the 2016 Equity Incentive Plan (as amended on March 31, 2020) from time to time, provided that no amendment, alteration or termination in any grant would impair or prejudice the rights of the employee without the consent of the employee, and provided further that the Board of Directors may not, without the approval of the shareholders, amend the 2016 Equity Incentive Plan (as amended on March 31, 2020) (1) to increase the aggregate number of shares which may be issued pursuant to the provisions of the equity incentive plan on exercise, surrender of options or upon grants; (2) to change the option exercise price; or (3) to extend the maximum period during which the grants may be made under the plan.
121
Outstanding options for directors and senior management
Outstanding options as of March 31, 2021 under our ESOP/RS plans are as follows:
Name | | Equity Shares Underlying Outstanding Options | | | Exercise Price per share (US$ per share) | | | Date of expiration (1) |
Arno Harris | | | 10,292 | | | | 11.90 | | | July 20, 2025 |
| | | 1,899 | | | | 31.61 | | | March 31, 2022 |
Barney Sheppard Rush | | | 1,899 | | | | 31.61 | | | March 31, 2022 |
Supriya Prakash Sen | | | 475 | | | | 31.61 | | | March 31, 2022 |
Pawan Kumar Agrawal | | | 51,794 | | | | 10.73 | | | August 30, 2027 |
| | | 99,000 | | | | 14.19 | | | August 30, 2027 |
| | | 10,000 | | | | 27.98 | | | August 30, 2027 |
Kapil Kumar | | | 12,000 | | | | 14.40 | | | August 30, 2027 |
| | | 3,000 | | | | 27.98 | | | August 30, 2027 |
Kuldeep Jain | | | 20,000 | | | | 14.19 | | | August 30, 2027 |
Akriti Gandotra | | | 1,563 | | | | 11.27 | | | August 30, 2027 |
| | | 9,917 | | | | 14.19 | | | August 30, 2027 |
| | | 5,000 | | | | 27.98 | | | August 30, 2027 |
Samitla Subba | | | 944 | | | | 11.90 | | | August 30, 2027 |
| | | 6,175 | | | | 11.27 | | | August 30, 2027 |
Gaurang Sethi | | | 7,536 | | | | 11.27 | | | August 30, 2027 |
| | | 1,102 | | | | 11.90 | | | August 30, 2027 |
| | | 3,000 | | | | 27.98 | | | August 30, 2027 |
Sarvesh Kumar Singh | | | 12,000 | | | | 14.19 | | | August 30, 2027 |
| | | 3,000 | | | | 27.98 | | | August 30, 2027 |
Sumit Barat | | | 10,000 | | | | 27.98 | | | August 30, 2027 |
Others | | | 433,112 | | | 10.73 to 27.98 | | | July 20, 2025 - August 30, 2027 |
Total | | | 703,708 | | | | | | | |
Note:
(1) | For all the grants issued prior to March 31, 2020, in the event that a participant of our ESOP plan terminates their service with our Company, the Post Termination Exercise Period shall be: i) 90 days if they served for less than 3 years; ii) 2 years if the service period was more than 3 years but less than 4 years; or iii) an incremental year will be added to the exercise period for each year of service beyond 4 years up to a maximum period co-terminus with the Equity Incentive Plan 2016 (as amended on March 31, 2020). However, for all the grants issued post March 31, 2020, the Post Termination Stock Option Exercise Periods (“PTEP”) policy was amended to six-month expiration on all new grants awarded. |
| As per the Executive Employment Agreement of CEO and COO of our Company including the subsequent Amendment Agreement entered into as of July 20, 2020, they both shall be entitled to Stock Appreciation Rights (as provided above) each as part long term incentive compensation, which is to be vested by and before July 31, 2027. The value of SARs payable to the Executive in cash upon exercise of vested SARs will be (i) the “Fair Market Value per share” as of the exercise date less the “Exercise Price” (as defined in the Amended Agreement) multiplied by (ii) the number of SARs being exercised. All cash payments related to the SARs shall be in INR and the SAR value shall be calculated from USD to INR at the noon buying rate in New York City for cable transfer in non-U.S. currencies as certified for customs purposes by the Federal Reserve Bank of New York on the exercise date of the SARs. |
122
For purposes of SAR Value, Fair Market Value per share means:
i. | If APGL’s shares are listed and traded on any stock exchange as of the exercise date, the closing price per share (or the closing bid, if no sales were reported) on the stock exchange where the Shares are traded during the regular trading session (and excluding premarket and after-hours trading) on the day the subject SARs are exercised; provided that for the Restructuring Event Exercise, it will be the per share price at which the Restructuring Event is undertaken. |
ii. | If the Shares are not listed and publicly traded on any stock exchange as of the exercise date, the fair market value per Share determined by the “Appraiser” using generally recognized methodologies, including discounted cash flow and multiples of earnings or EBITDA of comparable companies, and also considering any recent fund raising or liquidity event undertaken by APGL. The Board shall retain the Appraiser to prepare the fair market valuation report for each fiscal year after the audited full year financial statements for the subject fiscal year of APGL are finalized and approved by the APGL Board of Directors. |
Also, as part of the Amended Directors Remuneration Plan 2019, the Company also granted 4,273 Restricted Stock during the fiscal year ended March 31, 2021 to be vested in 18 months from grant date but accelerated for retirement at the end of a term or involuntary retirement if not for Cause. On exercise of these RSUs, equivalent number of common equity shares will be issued by cash payment payable by our Company subject to adjustments as to Mauritius withholding tax.
Indemnification Agreements
We have obtained Directors’ and Officers’ liability Insurance to indemnify the Directors and executive officers of our Company against certain liabilities and expenses arising from their being a director or officers.
C. Board Practices
Board of Directors
Our Company is managed and controlled by its Board of Directors. Our Company’s Board of Directors consists of nine directors. Our Company’s Board of Directors has a majority of independent directors. As a foreign private issuer, we are permitted to follow home country corporate governance practices. Certain corporate practice in Mauritius, which is our home country, may differ significantly from the NYSE corporate governance listing standards. Unlike the requirements of the NYSE, the corporate governance practice and requirements in Mauritius do not require us as a GBC to have the majority of our Board of Directors be independent; not mandatory to have all our members of our compensation committee or our nominating and corporate governance committee to be independent directors, not mandatory to have a nominations committee; and not mandatory to hold regular executive sessions where only independent directors shall be present.
Terms of Directors and Executive Officers
In accordance with our Company’s Constitution, one-third of our Company’s directors (or, if their number is not a multiple of three, the number nearest to but not greater than one-third) shall be up for re-election by rotation at each annual meeting of our company. The Chairman of the Board and/or the managing director during the tenure shall not be subject to retirement by rotation or be taken into account in determining the number of directors to retire in each year. The directors up for re-election in each year shall be those who have been in office longest since their last re-election or appointment and as between persons who became or were last re-elected directors on the same day, those up for re-election shall (unless they otherwise agree among themselves) be determined by lot. Any director may be removed by either an ordinary resolution of our shareholders or by the majority vote of the Board of Directors in the following circumstances: for cause, which refers to wilful misconduct, fraud, conviction of a felony, gross negligence or breach of a written policy of the company; or if the director becomes mentally unsound or bankrupt or becomes disqualified from being a director under Mauritius law.
Under Mauritius law, the office of a director of our company is required to become vacant at the conclusion of the annual meeting of our company commencing next after the director attains the age of 70 years. However, a person
123
of or over the age of 70 years may, by ordinary resolution of which no shorter notice is given than that required to be given for the holding of a meeting of shareholders, be appointed or re‑appointed or authorized to continue to hold office as a director until the next annual meeting at which such director’s class is up for re-election.
A vacancy on the Board of Directors must be filled by a majority vote of our Board of Directors or by ordinary resolution of the shareholders.
Executive officers are selected by and serve at the discretion of the Board of Directors.
Duties of Directors
Under Mauritius law, our Company’s directors have a duty to our Company to exercise their powers honestly in good faith in the best interests of our Company. Our Company’s directors also have a duty to our Company to exercise the degree of care, diligence and skill that a reasonably prudent person would exercise in comparable circumstances. Where a director of a public company also holds office as an executive, the director is required under Mauritius law to exercise that degree of care, diligence and skill which a reasonably prudent and competent executive in that position would exercise. In fulfilling their duty of care to our Company, our Company’s directors must ensure compliance with the Mauritius Companies Act and our Company’s Constitution, as amended from time to time. A shareholder has the right to seek damages against our directors if a duty owed by our directors to him as a shareholder is breached.
The functions and powers of our Company’s Board of Directors include, among others:
| • | Convening shareholders’ annual meetings and reporting its work to shareholders at such meetings; |
| • | Authorizing dividends and distributions; |
| • | Appointing officers and determining the term of office of officers; |
| • | Exercising the borrowing powers of our Company and mortgaging the property of our Company, provided that shareholders’ approval shall be required if any transaction is a major transaction for our Company under section 130 of the Mauritius Companies Act, which includes, among others, acquisitions and dispositions worth more than 75% of the value of our Company’s assets; and |
| • | Approving the issuance and transfer of shares of our Company, including the recording of such shares in our share register. |
Subject to the Mauritius Companies Act, our Company’s Board of Directors may delegate to a committee of directors, a director or employee of the Company, or any other person, any one or more of its powers.
Additional Restrictions
For so long as International Finance Corporation and IFC GIF Investment Company I together hold at least 5% (five percent) of the share capital of our Company, the decisions on the following matters shall not be taken and/ or implemented by our Company unless approved by way of a special resolution of shareholders:
| (a) | amendment to the articles of association or memorandum of association of Azure Power India Private Limited and its subsidiaries, provided that any amendment to the articles of association or memorandum of association of our Company’s subsidiaries (other than Azure Power India Private Limited) shall not require approval of the shareholders of our Company if such amendment is carried out pursuant to a project finance, working capital limits, non-fund based facilities, mezzanine financing (if the amount raised is less than 20% of the paid-up share capital of our Company) or any other financing arrangements (if the amount raised is less than 20% of the paid-up share capital of our Company) raised for our Company’s subsidiaries (other than Azure Power India Private Limited) that have been approved by the Board or Board delegated committee of the Company; |
| (b) | disposal or sale, in a single transaction or a series of related transactions, of more than 50% of our Company’s assets (on a consolidated basis), or entry into a single transaction or a series of related transactions where the |
124
| | Company will incur obligations or liabilities (on a consolidated basis) the value of which is more than 50% of our Company’s assets (on a consolidated basis) before such transaction or series of related transactions; |
| (c) | any change in the business of our Company or its subsidiaries, such business being understood to mean and include the activities that Azure Power India Private Limited is authorized to carry out under the Main Objects clause of the memorandum of association of Azure Power India Private Limited in effect on 22 July 2015; and |
| (d) | any amendment to the ESOP plan approved by the Board, except as would not be a “material revision” as such term is defined in Section 303A.08 of the New York Stock Exchange Listed Company Manual. |
For so long as International Finance Corporation and/or IFC GIF Investment Company I hold any equity shares of our Company, our Company shall not, in a single transaction, issue equity shares or share equivalents that are more than 10% (ten percent) of the share capital of the Company, unless approved by the shareholders of our Company by way of an ordinary resolution.
Committees
Our Company’s Board of Directors has established the following committees: audit committee, nominating and corporate governance committee, compensation committee and corporate social responsibility committee. Each committee’s members and functions are described below.
Audit Committee
Our audit committee consists of Mr. Barney Sheppard Rush, Mr. Arno Lockheart Harris and Ms. Supriya Prakash Sen. Ms. Sen has been appointed as a new member of the Committee with effect from October 1, 2020. Mr. Rush was appointed as a member of the Committee and Mr. Harris was appointed as Chairman of the Committee with effect from August 8, 2019. Each of these individuals satisfies the independence requirements set forth in the New York Stock Exchange’s Listed Company Manual. They also satisfy the independence requirements of Rule 10A-3 under the Securities Exchange Act of 1934, as amended (the “Exchange Act”). Our audit committee oversees our accounting and financial reporting processes and the audits of the financial statements of our company. Our audit committee is responsible for, among other things:
| • | Selecting our independent auditors and pre‑approving all auditing and non-auditing services permitted to be performed by our independent auditors; |
| • | Reviewing with the independent auditors any audit problems or difficulties and management’s response; |
| • | Regularly reviewing the independence of our independent auditors; |
| • | Reviewing and approving all related party transactions on an ongoing basis; |
| • | Discussing the annual audited financial statements with management and our independent auditors; |
| • | Reviewing the adequacy and effectiveness of our accounting and internal control policies and procedures and any steps taken to monitor and control major financial risk exposures; |
| • | Monitoring compliance with our code of business conduct and ethics, including reviewing the adequacy and effectiveness of our procedures to ensure proper compliance; |
| • | Meeting separately and periodically with management and our internal and independent auditors; |
| • | Reporting regularly to our full Board of Directors; and |
| • | Such other matters that are specifically delegated to our audit committee by our Board of Directors from time to time. |
125
Compensation Committee
Our compensation committee consists of Mr. Barney Sheppard Rush, Mr. Cyril Sebastien Dominique Cabanes, Ms. Supriya Sen and Mr. Panicker Unnikrishnan Mangalath Sukumara. Mr. Barney S. Rush is the Chairman of the Committee. We rely upon the home country exemption of the New York Stock Exchange Listed Company Manual and Rule10C-1(b)(1) (iii) (A) (4) under the Exchange Act in respect of the composition of the compensation committee as Mauritius law does not require all members of the committee to be independent. Each of our compensation committee members qualify as a “non-employee director” within the meaning of Rule 16b-3 of the Exchange Act and qualify as an “outside director” under the regulations promulgated under Section 162(m) of the Internal Revenue Code of 1986, as amended.
Our compensation committee assists our Board of Directors in reviewing and approving the compensation structure of our directors and executive officers, including all forms of compensation to be provided to our directors and executive officers. Members of the compensation committee are not prohibited from direct involvement in determining their own compensation.
Our Company’s chief executive officer may not be present at any committee meeting during which his compensation is deliberated. The compensation committee is responsible for, among other things:
| • | Reviewing and approving the compensation package for our executive officers; |
| • | Reviewing the compensation of our executive officers and directors and making recommendations to the board with respect to the compensation; |
| • | Reviewing and approving corporate goals and objectives relevant to the compensation of our chief executive officer, other executive officers and directors evaluating the performance of our chief executive officer, other executive officers and directors in light of those goals and objectives, and setting the compensation level of our chief executive officer, other executive officers and directors based on such evaluation; and |
| • | Reviewing periodically and making recommendations to the board regarding any long-term incentive compensation or equity plans, programs or similar arrangements, annual bonuses, employee pension and welfare benefit plans. |
Nominating and Corporate Governance Committee
The Nominating and Corporate Governance Committee consists of Mr. Barney Sheppard Rush, Mr. Cyril Sebastien Dominique Cabanes and Ms. Supriya Prakash Sen. Mr. Rush is the Chairman of the Nominating and Corporate Governance Committee. We rely upon the home country exemption of the New York Stock Exchange Listed Company Manual in respect of the composition of have Nominating and Corporate Governance committee as Mauritius law does not require all members of the committee to be independent. The purpose of the Nominating and Corporate Governance Committee is to assist the Board by fulfilling the following responsibilities:
| • | Reviewing and making recommendations to the Board of Directors with respect to corporate governance guidelines and issues; |
| • | Identifying qualified candidates as consistent with the criteria approved by the Board for director nominees and recommending such candidates to the Board for selection for all directorships to be filled by the Board, in conjunction with the Chairman of the Board; |
| • | Nominating the chairs and members of the Board committees, in conjunction with the Chairman of the Board; and |
| • | Conducting annual reviews of the Board’s independence, qualifications and experiences in light of the availability of potential Board members; and oversee the evaluation of the Board of Directors. |
Corporate Social Responsibility Committee
The Corporate Social Responsibility (CSR) Committee consists of Mr. Panicker Unnikrishnan Mangalath Sukumara, Ms. Supriya Prakash Sen and Mr. Deepak Malhotra. Mr. Mangalath Sukumara is the Chairman of the
126
Committee. The purpose of the Corporate Social Responsibility Committee is to assist the Board by fulfilling the following responsibilities:
| • | Formulate and recommend a CSR policy to the Board for approval; |
| • | Approve projects and geographical locations of CSR activities; |
| • | Take note of impact evaluation report; |
| • | Ensure that the CSR projects are not undertaken in the normal course of business; and |
| • | Perform such other functions as may be delegated and/or assigned by the Board from time to time with respect to CSR. |
Code of Business Conduct and Ethics
Our Company’s Code of Business Conduct and Ethics provides that our directors, officers and employees are expected to avoid any action, position or interest that conflicts with the interests of our company or gives the appearance of a conflict. Directors, officers and employees have an obligation under our Code of Business Conduct and Ethics to advance our Company’s interests when the opportunity to do so arises.
D. Employees
As of March 31, 2021, we had 471 full time employees. We consider our relations with our employees to be amicable. The following table sets forth the number of our employees for each of the major functions as of March 31, 2021:
| | Number of Employees | |
Infrastructure | | | 121 | |
Bidding and land strategy | | | 13 | |
Operations and maintenance | | | 248 | |
F&A, Capital, Legal and HRM | | | 89 | |
Total | | | 471 | |
127
E. Share Ownership
The following table sets forth information with respect to the beneficial ownership of our Company’s equity shares as of March 31, 2021 by each of our directors and all our directors and executive officers as a group and by each person known to us to own beneficially more than 5% of the equity shares. As used in this table, beneficial ownership means the sole or shared power to vote or direct the voting or to dispose of or direct the sale of any security. A person is deemed to be the beneficial owner of securities that can be acquired within 60 days upon the exercise of any option, warrant or right as on March 31, 2021. Equity Shares subject to options, warrants or rights that are currently exercisable or exercisable within 60 days are deemed outstanding for computing the ownership percentage of the person holding the options, warrants or rights, but are not deemed outstanding for computing the ownership percentage of any other person. The amounts and percentages as of March 31, 2021 is based on 48,195,962 equity shares outstanding as of this date:
Name | Number shares beneficially owned | | | (%) | | |
Directors and Officers: | | | | | | | | | |
Ranjit Gupta | | | — | | | * | | |
Murali Subramanian | | | — | | | * | | |
Pawan Kumar Agrawal | | | 9,939 | | | | 0.02 | | % |
Akriti Gandotra | | | 3,000 | | | * | | |
Kapil Kumar | | | 3,000 | | | * | | |
Gaurang Sethi | | | 2,943 | | | * | | |
Samitla Subba | | | 2,421 | | | * | | |
Sarvesh K Singh | | | 3,000 | | | * | | |
Barney S. Rush (1) | | | 4,603 | | | * | | |
Arno Harris (2) | | | 14,895 | | | | 0.03 | | % |
Cyril Sebastien Dominique Cabanes | | | — | | | | — | | |
Yung Oy Pin (Jane) Lun Leung (3) | | | — | | | | — | | |
Deepak Malhotra | | | — | | | | — | | |
Muhammad Khalid Peyrye (4) | | | — | | | | — | | |
Vikas Bansal | | | — | | | | — | | |
Kuldeep Jain | | | 5,000 | | | | 0.01 | | % |
All Directors and Officers as a Group | | | 195,165 | | | | 0.40 | | % |
5% or Greater Shareholders: | | | | | | | | | |
International Finance Corporation (5) | | | 2,640,344 | | | | 5.48 | | % |
IFC GIF Investment Company I (6) | | | 7,005,656 | | | | 14.54 | | % |
CDPQ Infrastructures Asia Pte Ltd. (7) | | | 24,259,272 | | | | 50.36 | | % |
(1) | Mr. Rush’s business address is 6917 Maple Avenue, Chevy Chase, Maryland 20815. 4,603 shares were allotted pursuant to vesting of Restricted Stocks on March 01, 2021. |
(2) | Mr. Harris’ business address is 135 Main Street, Suite 1320, San Francisco, California 94105. 4,603 shares were allotted pursuant to vesting of Restricted Stocks on March 01, 2021 and the rest 10,292 are vested and outstanding Stock Options. |
(3) | Ms. Lun Leung’s business address is c/o AAA Global Services Ltd., 1st Floor, The Exchange 18 Cybercity, Ebene, Mauritius. |
(4) | Mr. Peyrye’s business address is c/o AAA Global Services Ltd., 1st Floor, The Exchange 18 Cybercity, Ebene, Mauritius. |
128
(5) | International Finance Corporation is an international organization established by Articles of Agreements among its member countries. Its principal address is 2121, Pennsylvania Avenue, NW, Washington, District of Columbia 20433, United States. |
(6) | IFC Global Infrastructure Fund, LP is the beneficial owner of all equity interests of IFC GIF Investment Company I, while IFC Global Infrastructure (GP) LLC and IFC Global Infrastructure (Alternate GP) LLP control the management and operations of with IFC Global Infrastructure Fund, LP. The principal address of IFC GIF Investment Company I is c/o Cim Fund Services Ltd., 33 Edith Cavell Street, Port Louis, Mauritius. |
(7) | CDPQ Infrastructures Asia Pte Ltd., a company organized and existing under the laws of Singapore, is a wholly-owned subsidiary of the Caisse de dépôt et placement du Québec, a body constituted by the Act Respecting the Caisse De Dépôt Et Placement Du Québec. The principal address of the Caisse de dépôt et placement du Québec is 1000, Place Jean-Paul-Riopelle, Montréal, Québec, H2Z 2B3. |
ITEM 7. MAJOR SHAREHOLDERS AND RELATED PARTY TRANSACTIONS
A. Major Shareholders
Please refer to “Item 6. Directors, Senior Management and Employees—E. Share Ownership”
B. Related Party Transactions
We believe that the terms of our related party transactions are comparable to the terms we could obtain from independent third parties. Our Company’s related party transactions are subject to the review and approval of the audit committee of our Company’s Board of Directors. Our Company’s audit committee will consider whether the transaction is to be conducted on an arms-length basis and whether the services can be procured from an independent third party. The charter of our audit committee as adopted by our Company’s Board of Directors provides that we may not enter into any related-party transaction unless and until it has been approved by the audit committee. Refer “Note 20. Related Party Disclosures” of F pages section in 20-F for details of transactions with related parties.
Lease Agreement
During the earlier years, AZI terminated the lease agreement for our registered office and for the guest house and the security deposits were returned back to AZI. During the current year, no such transaction has been entered into by our Company.
Shareholders Agreements
Our Company did not have any changes to its shareholders agreement.
C. Interest of Experts and Counsel
Not applicable
129
ITEM 8. FINANCI AL INFORMATION
A. Consolidated Statements and Other Financial Information
See “Item 18. Financial Statements” for a list of the financial statements filed as part of this annual report.
Legal Proceedings
We are currently involved in and may from time to time, become involved in legal, arbitration or governmental proceedings or be subject to claims arising in the ordinary course of our business. We are not presently party to any legal proceedings that, in the opinion of our management, would reasonably be expected to have a material adverse effect on our business, financial condition, operating results or cash flows if determined adversely to us. Regardless of the outcome, litigation can have an adverse impact on us because of defense and settlement costs, diversion of management resources and other factors.
Our Company and our subsidiary, Azure Power India Private Limited, are respondents in arbitration proceedings initiated by our former Chairman, CEO and Managing Director of the Company, Mr. Inderpreet Singh Wadhwa (“IW”) and erstwhile COO Mr. H.S Wadhwa (“HSW”), in relation to the purchase price of the shares of IW’s and HSW’s in Azure Power India Private Limited before the Singapore International Arbitration Centre (SIAC). The arbitration has been concluded and the award is awaited. We believe in the merits of our case; however, an unfavorable outcome in these proceedings could potentially have a material adverse effect on our results of operations, cash flows and financial condition.
In addition, our Company and our subsidiary Azure Power India Private Limited are respondents to arbitration proceedings initiated by IW in relation to his transition agreement before the Mumbai Centre for International Arbitration (“MCIA”). The arbitration has been concluded and the award is awaited. We believe in the merits of our case; however, we cannot ensure the outcome of the proceedings. The claim could have an adverse impact on our results however, the amount is not material to our financial position.
Dividend Policy and Dividend Distribution
Our Company has never declared or paid dividends, nor does our Company have any present plan to pay any cash dividends on our equity shares in the foreseeable future. Our Company currently intend to retain our available funds and any future earnings to operate and expand our business.
B. Significant Changes
Except as disclosed elsewhere in this annual report, we have not experienced any significant changes since the date of the annual financial statement included in this annual report.
ITEM 9. THE OFFER AND LISTING
A. Offer and Listing Details
Our Company’s equity shares are listed on the New York Stock Exchange since October 12, 2016 under the symbol “AZRE.”
B. Plan of Distribution
Not Applicable
C. Markets
Our Company’s equity shares are listed on the New York Stock Exchange under the symbol “AZRE”.
130
D. Selling Shareholders
Not applicable
E. Dilution
Not applicable
F. Expenses of the Issue
Not applicable
ITEM 10. ADDITIONAL INFORMATION
A. Share Capital
Not applicable
B. Constitution
We incorporate by reference into this annual report on Form 20-F the description of our Amended and Restated Constitution contained in our Form F-1 registration statement on Form F-1 (Registration No. 333-208584), as amended, initially filed with the SEC on December 16, 2015.
C. Material Contracts
We have not entered into any material contracts other than those in the ordinary course of business and other than those described in “Item 4. Information on the Company” or elsewhere in this annual report.
D. Exchange Controls
Foreign Direct Investment
Foreign investments in Indian are primarily governed by the Foreign Exchange Management Act, 1999, as amended, the rules, regulations and notifications made thereunder, including the Foreign Exchange Management (Transfer or issue of security by a person resident outside India) Regulations, 2000, as amended, and the consolidated foreign direct investment policy (effective as of June 7, 2016) (the “FDI Policy”) issued by the Department of Industrial Policy and Promotion, Ministry of Commerce and Industry, Government of India.
Pursuant to the FDI Policy, investments can be made by non-residents in Indian companies to the extent of the percentage of the total capital of the Indian company specified in the FDI Policy. The FDI Policy currently allows 100% foreign direct investment in Indian companies engaged in the solar power sector. The FDI Policy also prescribes certain pricing and reporting requirements in respect of issue and transfer of shares of an Indian company to a non-resident person and vice-versa and regulates downstream investments by Indian companies that are not owned or controlled by Indian resident persons. The Government of India amended the method of calculating foreign investment in an Indian company pursuant to Press Note No. 2 (2009 Series) dated February 13, 2009, Press Note No. 4 (2009 Series) dated February 25, 2009 and Foreign Exchange Management (Non-Debt Instrument) Rules, 2019 vide notification dated 17 October 2019.
131
A person residing outside India (other than the beneficial owner of an investment into India who is situated in or is a citizen of country which shares land border with India) or any entity incorporated outside India (other than an entity incorporated in a country which shares land border with India and an Overseas Corporate Body as defined in FEMA) has general permission to purchase shares, convertible debentures or preference shares of an Indian company, subject to certain terms and conditions.
Currently, subject to certain exceptions, FDI and investment by Non-Resident Indians, or NRIs (as such term is defined in FEMA), in Indian companies do not require the prior approval of the FIPB or the RBI. The Government of India has indicated that in all cases where FDI is allowed on an automatic basis without FIPB approval, the RBI would continue to be the primary agency for the purposes of monitoring and regulating foreign investment.
E. Taxation
Mauritius Taxation
Our Company is a company holding a Global Business Company License issued by the Financial Services Commission and is a tax resident in Mauritius. The Income Tax Act 1995 of Mauritius imposes a tax in Mauritius on our chargeable income at the rate of 15%. However, under the Income Tax (Foreign Tax Credit) Regulations 1996 of Mauritius, subject to the Income Tax Act 1995 and the regulations under the Income Tax (Foreign Tax Credit) Regulations 1996, credit is allowed for foreign tax on the foreign source income of a resident of Mauritius against Mauritius tax computed by reference to the same income, and where credit is allowed against Mauritius tax chargeable in respect of any income, the amount of Mauritius tax so chargeable shall be reduced by the amount of the credit.
Under the Income Tax (Foreign Tax Credit) Regulations 1996, “foreign source income” means income which is not derived from Mauritius and includes in the case of a corporation holding a GBC, income derived in the course of a global business. Subject to the provisions of the Income Tax (Foreign Tax Credit) Regulations 1996, no credit is allowed in respect of foreign tax unless written evidence is presented to the Mauritius Revenue Authority showing the amount of foreign tax which has been charged and for this purpose, “written evidence” includes a receipt of the relevant authorities of the foreign country for the foreign tax or any other evidence that the foreign tax has been deducted or paid to the relevant authorities of that country. However, pursuant to regulation 8 of the Income Tax (Foreign Tax Credit) Regulations 1996, if written evidence is not presented to the Mauritius Revenue Authority showing the amount of foreign tax charged on our company’s foreign source income, the amount of foreign tax shall nevertheless be conclusively presumed to be equal to 80% of the Mauritius tax chargeable with respect to that income and in such circumstance, the effective tax rate in Mauritius on our chargeable income would be 3% (“Deemed Tax Credit”).
GBC are permitted to conduct business both in and outside Mauritius (instead of outside Mauritius only). The operations of a GBC Company in Mauritius will be subject to tax on chargeable income at the rate of 15% in Mauritius.
Following amendments to the Financial Services Act 2007 of Mauritius pursuant to the Finance Act 2018, the existing regulatory regime applicable to a GBC incorporated prior to October 16, 2017 has been grandfathered until 30 June 2021 and therefore the above tax regime and the Deemed Tax Credit will continue to apply to the Company until 30 June 2021, being incorporated on 30 January 2015.
Pursuant to the amendments to the Financial Services Act 2007 of Mauritius under the Finance Act 2018, the Company will as from 1 July 2021 be governed by the new regulatory regime applicable to Global Business Companies. Generally, income tax rate for GBCs is at 15%, but subject to meeting certain prescribed conditions, a partial exemption of 80% may be allowed against certain types of income such as foreign source dividend and interest. Where the GBC derives income which is subject to foreign tax, and where the said partial exemption has not been applied, the amount of foreign tax paid may be allowed as a credit against income tax payable in Mauritius in respect of that income.
Our Company holds tax residence certificates issued by the Mauritius Revenue Authority. These certificates are required for the avoidance of double taxation under the Agreements for the Avoidance of Double Taxation signed between Mauritius and other jurisdictions, including India.
132
Mauritius has no capital gains tax and has no withholding tax on the payment of dividends.
Prospective investors are urged to consult their own tax advisers in order to fully understand the tax consequences of an investment in the equity shares.
US Federal Income Taxation
The following is a summary of certain U.S. federal income tax considerations that may be relevant to the purchase, ownership and disposition of our equity shares by a U.S. Holder (as defined below).
This summary is based on provisions of the Internal Revenue Code of 1986, as amended (the “Code”), and published regulations, rulings and judicial interpretations thereof, in force as of the date hereof. Those authorities may be changed at any time, perhaps retroactively, so as to result in U.S. federal income tax consequences different from those summarized below.
This summary is not a comprehensive discussion of all of the tax considerations that may be relevant to a particular investor’s decision to purchase, hold, or dispose of equity shares. In particular, this summary is directed only to U.S. Holders that hold equity shares as capital assets (generally, property held for investment). This summary does not address tax consequences to U.S. Holders who may be subject to special tax rules, such as banks, brokers or dealers in securities or currencies, traders in securities electing to mark to market, financial institutions, life insurance companies, regulated investment companies, real estate investment trusts, tax exempt entities, qualified retirement plans, individual retirement accounts or other tax-deferred accounts entities that are treated as partnerships for U.S. federal income tax purposes (or partners therein), U.S. Holders that acquired equity shares through the exercise of employee stock options or otherwise as compensation for services, U.S. Holders that own or are treated as owning 10% or more of our equity shares by vote or value, persons holding equity shares as part of a hedging or conversion transaction or a straddle, or persons whose functional currency is not the U.S. dollar. Moreover, this summary does not address state, local or non-U.S. taxes, the U.S. federal estate and gift taxes, or the Medicare contribution tax applicable to net investment income of certain non-corporate U.S. Holders, or alternative minimum tax consequences of acquiring, holding or disposing of equity shares. For purposes of this summary, a “U.S. Holder” is a beneficial owner of equity shares that , for U.S. federal income tax purposes, is a citizen or resident of the United States, a U.S. domestic corporation , a trust if a U.S. court is able to exercise primary supervision over its administration and one or more U.S. persons have the authority to control all of its substantial decisions, a trust that has a valid election is in effect to be treated as a U.S. person, or an estate the income of which is subject to U.S. federal income taxation regardless of its sources.
U.S. Holders should consult their own tax advisors about the consequences of the acquisition, ownership, and disposition of the equity shares, including the relevance to their particular situation of the considerations discussed below and any consequences arising under foreign, state, local or other tax laws.
Taxation of Dividends
Subject to the discussion below under “—Passive Foreign Investment Company Status,” the gross amount of any distribution of cash or property with respect to our equity shares that is paid out of our current or accumulated earnings and profits (as determined for U.S. federal income tax purposes) will generally be includible in a U.S. Holder’s taxable income as ordinary dividend income on the day on which the dividend is received and will not be eligible for the dividends-received deduction allowed to corporations under the Code.
Our Company does not expect to maintain calculations of its earnings and profits in accordance with U.S. federal income tax principles. U.S. Holders therefore should expect that distributions generally will be treated as dividends for U.S. federal income tax purposes.
Subject to certain exceptions for short-term positions, the U.S. dollar amount of dividends received by an individual with respect to the equity shares will be subject to taxation at a preferential rate if the dividends are “qualified dividends.” Dividends paid on the equity shares will be treated as qualified dividends if:
133
| | |
| • | the equity shares are readily tradable on an established securities market in the United States or we are eligible for the benefits of a comprehensive tax treaty with the United States that the U.S. Treasury determines is satisfactory for purposes of this provision and that includes an exchange of information program; and |
| • | Our Company was not, in the year prior to the year in which the dividend was paid, and are not, in the year in which the dividend is paid, a passive foreign investment company (a “PFIC”). |
Our Company’s equity shares are listed on the New York Stock Exchange and will qualify as readily tradable on an established securities market in the United States so long as they are so listed. Non-corporate U.S. Holders that elect to treat the dividend income as “investment income” pursuant to Section 163(d)(4) of the Code will not be eligible for the reduced rates of taxation for qualified dividends. In addition, the rate reduction will not apply to dividends if the recipient of a dividend is obligated to make related payments with respect to positions in substantially similar or related property. As discussed below, our Company does not believe it was a PFIC for the taxable year ended March 31, 2020 and does not anticipate becoming a PFIC for its current taxable year or in the foreseeable future. U.S. Holders should consult their own tax advisers regarding the availability of the reduced dividend tax rate in light of their own particular circumstances.
Dividend distributions with respect to our Company’s equity shares generally will be treated as “passive category” income from sources outside the United States for purposes of determining a U.S. Holder’s U.S. foreign tax credit limitation.
Dividends paid in a currency other than U.S. dollars will be includable in income in a U.S. dollar amount based on the exchange rate in effect on the date of receipt whether or not the payment is converted into U.S. dollars at that time. A U.S. Holder’s tax basis in the non-U.S. currency will equal the U.S. dollar amount included in income. Any gain or loss on a subsequent conversion of the non-U.S. currency into U.S. dollars for a different amount generally will be U.S. source ordinary income or loss.
Taxation of Dispositions of Equity Shares
Subject to the discussion below under “—Passive Foreign Investment Company Status,” if a U.S. Holder realizes gain or loss on the sale, exchange or other disposition of equity shares, that gain or loss will be capital gain or loss and generally will be long-term capital gain or loss if the equity shares have been held for more than one year. Long-term capital gain realized by a U.S. Holder that is an individual generally is subject to taxation at a preferential rate. The deductibility of capital losses is subject to limitations. The amount of gain or loss will be equal to the difference, if any, between the amount realized and the U.S. Holder’s adjusted tax basis in shares. A U.S. Holder’s initial tax basis in shares generally will equal the cost of such shares.
Gain, if any, realized by a U.S. Holder on the sale or other disposition of the equity shares generally will be treated as U.S. source income for U.S. foreign tax credit purposes. Consequently, if an Indian withholding tax is imposed on the sale or disposition of the shares, a U.S. Holder that does not receive significant foreign source income from other sources may not be able to derive effective U.S. foreign tax credit benefits in respect of such Indian taxes. U.S. Holders should consult their own tax advisors regarding the application of the foreign tax credit rules to their investment in, and disposition of, the equity shares.
Passive Foreign Investment Company Status
Special U.S. tax rules apply to companies that are considered to be PFIC. Our Company will be classified as a PFIC in a particular taxable year if, taking into account our proportionate share of the income and assets of its subsidiaries under applicable “look-through” rules, either
| | |
| • | 75 percent or more of our Company’s gross income for the taxable year is passive income; or |
| • | the average percentage of the value of our assets that produce or are held for the production of passive income is at least 50 percent. |
For this purpose, passive income generally includes dividends, interest, gains from certain commodities transactions, rents, royalties and the excess of gains over losses from the disposition of assets that produce passive income. Our Company believes, and the other paragraphs in this disclosure generally assume, that our Company was not a PFIC for our taxable year ending March 31, 2020 and that, based on the present composition of our Company’s
134
income and assets and the manner in which our Company conducts its business, our Company will not be a PFIC in its current taxable year or in the foreseeable future. Whether our Company is a PFIC is a factual determination made annually, and our Company’s status could change depending, among other things, upon changes in the composition and amount of its gross income and the relative quarterly average value of its assets. In particular, if our Company generates a small amount of gross income that is attributable to passive income in a taxable year, then there is a risk that our Company may be a PFIC for that taxable year. If our Company was a PFIC for any taxable year in which a U.S. Holder hold our Company’s equity shares, the U.S. Holder generally would be subject to additional taxes on certain distributions and any gain realized from the sale or other taxable disposition of our Company’s equity shares regardless of whether our Company continued to be a PFIC in any subsequent year, unless the U.S. Holder mark its equity shares to market for tax purposes on an annual basis. A U.S. Holder will not be able to elect to treat us as a qualified electing fund (“QEF”) because we do not intend to prepare the information needed to make a QEF election. U.S. Holders are encouraged to consult their own tax advisor as to our Company’s status as a PFIC and the tax consequences to them of such status.
Foreign Financial Asset Reporting
Certain U.S. Holders that own “specified foreign financial assets” with an aggregate value in excess of the applicable reporting threshold (generally, US$50,000 for unmarried individuals) are generally required to file an information statement along with their tax returns, currently on IRS Form 8938, with respect to such assets. “Specified foreign financial assets” include any financial accounts held at a non-U.S. financial institution, as well as securities issued by a non-U.S. issuer that are not held in accounts maintained by financial institutions. The understatement of income attributable to “specified foreign financial assets” in excess of U.S.$5,000 extends the statute of limitations with respect to the tax return to six years after the return was filed. U.S. Holders who fail to report the required information could be subject to substantial penalties. Prospective investors are encouraged to consult with their own tax advisors regarding the possible application of these rules.
Backup Withholding and Information Reporting
Dividends paid on, and proceeds from the sale or other disposition of, the equity shares to a U.S. Holder generally may be subject to the information reporting requirements of the Code and may be subject to backup withholding unless the U.S. Holder provides an accurate taxpayer identification number and makes any other required certification or otherwise establishes an exemption. Backup withholding is not an additional tax. The amount of any backup withholding from a payment to a U.S. Holder will be allowed as a refund or credit against the U.S. Holder’s U.S. federal income tax liability, provided the required information is furnished to the U.S. Internal Revenue Service in a timely manner.
Indian Taxation
The discussion contained herein is based on the applicable tax laws of India as in effect on the date hereof and is subject to possible changes in Indian law that may come into effect after such date. Prospective investors should consult their own tax advisers as to the consequences of purchasing the equity shares, including, without limitation, the consequences of the receipt of dividend and the sale, transfer or disposition of the equity shares.
Before Amendment in Finance Act, 2020 i.e. up to March 31, 2020, dividend payments by companies to its shareholders, were subject to dividend distribution tax in India payable by companies at a rate of 17.47% (effective rate of TDS after grossing up is 21.17%) on the total amount distributed as a dividend as grossed up by the amount of such dividend distribution tax.
Pursuant to the amendment, Dividend Distribution tax (“DDT”) payable by Indian Companies has been abolished and dividend income is taxable in the hands of shareholders as per income tax rates applicable on them. However, Indian Companies are required to deduct tax at source in respect of dividend paid. Considering the same from Fiscal year 2020-21 onwards, dividend payments to its shareholders by companies are taxable in the hands of shareholders. However, withholding tax shall be deducted at source by companies at the applicable rate under Indian tax law pursuant to amendments to the Indian Income Tax Act, 1961, as amended, income arising directly or indirectly through the transfer of a capital asset, including any share or interest in a company or entity registered or incorporated outside India, will be liable to tax in India, if such share or interest derives, directly or indirectly, its value substantially from assets (whether tangible or intangible) located in India and whether or not the seller of such share or interest has a residence, place of business, business connection, or any other presence in India. The share or interest of the company or entity registered or incorporated outside of India, shall be deemed to derive its value substantially from the assets located in India, if the value of such Indian assets exceeds INR 100 million, and represents at least 50% of the
135
value of all the assets owned by the company or entity registered or incorporated outside of India. Substantially all of our assets are located in India. However, if the transferor of share or interest in a company or entity registered or incorporated outside of India (along with its associated enterprises), neither holds the right of management or control in the company or entity registered or incorporated outside of India nor holds voting power or share capital or interest exceeding 5% of the total voting power or total share capital or interest in the company or entity registered or incorporated outside of India, at any time during the twelve months preceding the date of transfer, such small shareholders are exempt from the indirect transfer provisions mentioned above.
The amendments also do not deal with the interplay between the Indian Income Tax Act, 1961, as amended, and the double taxation avoidance agreements that India has entered into with countries such as the United States, in case of an indirect transfer. Accordingly, the implications of these amendments are presently unclear. If it is determined that these amendments apply to a holder of our equity shares, such holder could be liable to pay tax in India on such income.
The Taxation Laws (Amendment) Act, 2019 received the assent of the President on December 11, 2019 and published in the Gazette of India on December 12, 2019. The amendment provides an option for the companies to opt for reduced corporate tax rate of 22% provided they do not claim certain tax benefits under the Income Tax Act. The Company has opted for the reduced tax rate for the subsidiaries which are not eligible for deduction under section 80IA of the Income Tax Act. Further, New domestic Companies incorporated on or after October 1, 2019 making fresh investment in manufacturing can opt an option to pay income-tax at the rate of 15%. This benefit is available to companies which do not avail any exemption/incentive and commences their production on or before March 31, 2023. Also, such companies shall not be required to pay Minimum Alternate Tax.
F. Dividends and Paying Agents
Not applicable
G. Statements by Experts
Not applicable
H. Documents on Display
All information filed with the SEC can be inspected and copied at the public reference facilities maintained by the SEC at 100 F Street, N.E., Washington, D.C. 20549. You can request copies of these documents upon payment of a duplicating fee, by writing to the SEC. Please call the SEC at 1-800-SEC-0330 for further information on the operation of the public reference rooms. The SEC maintains a website at www.sec.gov that contains reports, proxy and information statements and other information regarding registrants that make electronic filings through its Electronic Data Gathering, Analysis, and Retrieval, or EDGAR, system. All our Exchange Act reports and other SEC filings will be available through the EDGAR system.
I. Subsidiary Information
Not applicable
ITEM 11. QUANTITATIVE AND QUALITATIVE DISCLOSURES ABOUT MARKET RISK
Quantitative and Qualitative Disclosures about Market Risk
We are exposed to several market risks in our normal business activities. Market risk is the potential loss that may result from market changes associated with our business or with an existing or forecasted financial or commodity transaction. The types of market risks we are exposed to include interest rate risk and foreign currency risk.
136
Interest Rate Risk
As of March 31, 2021, our long-term debt was both fixed and variable interest rates. Exposure to interest rate fluctuations will depend on the amount of debt that bears interest at variable rates, the time at which the interest rate is adjusted and the quantum of fluctuation in the interest rate.
Our results of operations are subject to interest rate fluctuations on our variable rate borrowings. The sensitivity analysis below has been determined based on the exposure to interest rates for non-derivative financial instruments at the balance sheet date. For floating rate liabilities, the analysis is prepared assuming the amount of liability outstanding at the balance sheet date was outstanding for the whole period.
A hypothetical increase or decrease in our variable interest rates by 1% would not have had a significant increase or decrease in interest cost for the Company, for the fiscal year ended March 31, 2021.
We intend to use hedging strategies to mitigate our exposure to interest rate fluctuations, we may not hedge all of our interest rate risk and, to the extent we enter into interest rate hedges, our hedges may not necessarily have the same duration as the associated indebtedness. Our exposure to interest rate fluctuations will depend on the amount of indebtedness that bears interest at variable rates, the time at which the interest rate is adjusted, the amount of the adjustment, our ability to prepay or refinance variable rate indebtedness when fixed rate debt matures and needs to be refinanced and hedging strategies we may use to reduce the impact of any increases in rates.
Foreign Currency Risk
The functional currency of Indian subsidiaries is Indian rupees, where we have long term debts denominated in U.S. dollars and Indian rupees. We are hedged against exchange rate risk for both of our Green Bonds and other foreign currency exposures. The fluctuations in the exchange rates between U.S. dollars and Indian rupees may result in higher fair value adjustments on our outstanding foreign currency loans or payables.
Our Company and its three international subsidiaries have a functional currency which is the U.S. dollar and consequently, we are exposed to foreign exchange risk on routine transactions entered locally by these subsidiaries. The exchange rate between Indian rupees and U.S. dollars has fluctuated significantly in recent years and may continue to fluctuate in the future. Depreciation of the Indian rupee against the U.S. dollar may result in translation loss in the Consolidated financial statements.
We have hedged against exchange rate risk for both of our Green Bonds so as to minimize the effect of any adverse movement in the exchange rates. Further, we have partially hedged against debts denominated in U.S. dollars in Indian subsidiaries, in order to minimize the adverse impact of a large currency movement. These hedges are for a period of up to 5.5 years. We have taken foreign currency loans for our Rajasthan 1, Rajasthan 2 and Oberoi Rooftop projects.
Fair Value hedges with notional amounts of US$ 189.6 million and US$ 265.1 million were outstanding as of March 31, 2020 and 2021, respectively, with the balance maturity period ranging from 0.5 months to 1 year as of March 31, 2021. Changes in the fair value of derivatives designated and qualifying as fair value hedges, together with any changes in the fair value of the hedged firm commitments attributable to the hedged risk, are recorded in in the consolidated balance sheet and consolidated statements of operations. Further, Cash flow hedges with notional amounts of US$ 923.1 million and US$ 1,103.0 million were outstanding as of March 31, 2020 and 2021, respectively, with the balance maturity period ranging from 0. 5 months to 4.5 years as of March 31, 2021. The fair value of these cash flow hedges as of March 31, 2020 and 2021 were US$ 83.0 million and US$ 74.2 million of net assets, respectively, and are included in accumulated other comprehensive loss on our consolidated balance sheets. The changes in the fair value of these option contracts are recognized in the Consolidated Statements of Operations and are included in interest expense.
We continue to monitor our risks and will consider hedging significant foreign currency exposures on an ongoing basis.
137
ITEM 12. DESCRIPTION OF SECURITIES OTHER THAN EQUITY SECURITIES
Not applicable
138
PART II
ITEM 13. DEFAULTS, DIVIDEND ARREARAGES AND DELINQUENCIES
None
ITEM 14. MATERIAL MODIFICATIONS TO THE RIGHTS OF SECURITY HOLDERS AND USE OF PROCEEDS
Material modifications to the rights of the security holders
There have been no material modifications to the rights of securities holders or the use of proceeds.
Use of proceeds
During November – December 2019, we completed a US$75 million private placement. An aggregate 6,493,506 shares were sold by us in the offering at a price of US$11.55 per share to CDPQ Infrastructures. The offering by our Company resulted in aggregate gross proceeds before expense of US$ 75.0 million. We have used the net proceeds to fund capital expenditure for projects in its pipeline.
During October – November, 2018, our Company completed our follow-on to our public offering of our Company’s equity shares pursuant to a Registration Statement on Form F-3, as amended (File No. 333-227164), which became effective on September 10, 2018. Credit Suisse Securities (USA) LLC., Barclays Capital Inc., and HSBC Securities (USA) Inc., acted as managing underwriters for the issue. An aggregate of 14,915,542 shares (including 115,542 shares exercised by underwriters subsequent to our offering) were sold by our Company in the offering at a price of US$12.50 per share. The initial offering by our Company resulted in aggregate gross proceeds before expense of US$186.4 million and incurred an underwriter’s commission and other expenses of US$1.3 million. Our Company has used US$182.0 million of the net proceeds to purchase equity shares of our subsidiary AZI and Azure Power Rooftop Private Limited, as outlined in the registration statement and prospectus.
ITEM 15. CONTROLS AND PROCEDURES
A. Disclosure Controls and Procedures
As required by Rules 13a-15 and 15d-15 under the Exchange Act, management, including our Group’s Chief Executive Officer, our Group’s Chief Financial Officer and Group’s Chief Operating Officer, has evaluated the effectiveness of our disclosure controls and procedures as of the end of the period covered by this annual report. Disclosure controls and procedures refer to controls and other procedures designed to ensure that information required to be disclosed in the reports we file or submit under the Exchange Act is recorded, processed, summarized and reported, within the time periods specified in the rules and forms of the SEC. Disclosure controls and procedures include, without limitation, controls and procedures designed to ensure that information required to be disclosed by us in our reports that we file or submit under the Exchange Act is accumulated and communicated to management, including our Group’s principal executive and principal financial officers, or persons performing similar functions, as appropriate to allow timely decisions regarding our required disclosure.
Based on the foregoing, our Group’s Chief Executive Officer, our Group’s Chief Financial Officer and Group’s Chief Operating Officer have concluded that, as of March 31, 2021, our disclosure controls and procedures were effective.
139
B. Management’s Report on Internal Control over Financial Reporting
Management is responsible for establishing and maintaining adequate internal control over financial reporting as defined in Rules 13a-15(f) and 15d-15(f) of the Exchange Act. Internal control over financial reporting includes maintaining records that, in reasonable detail, accurately and fairly reflect our transactions; providing reasonable assurance that transactions are recorded as necessary for preparation of our financial statements; providing reasonable assurance that receipts and expenditures of company assets are made in accordance with management authorization; and providing reasonable assurance that unauthorized acquisition, use or disposition of company assets that could have a material effect on our financial statements would be prevented or detected on a timely basis. Because of its inherent limitations, internal control over financial reporting is not intended to provide absolute assurance that a misstatement of our financial statements would be prevented or detected. Also, projections of any evaluation of the effectiveness of internal control over financial reporting to future periods are subject to the risk that the controls may become inadequate because of changes in conditions, or that the degree of compliance with the policies or procedures may deteriorate.
Management used the Committee of Sponsoring Organizations of the Treadway Commission Internal Control—Integrated Framework (2013), or the COSO framework, to evaluate the effectiveness of internal control over financial reporting. Management has assessed the effectiveness of our internal control over financial reporting as of March 31, 2021 and has concluded that such internal control over financial reporting is effective.
C. Attestation Report of the Registered Public Accounting Firm
This annual report does not include an attestation report of our Company’s Registered Public Accounting firm, as our Company is an emerging growth company under JOBS Act is exempted from such attestation requirement.
D. Changes in Internal Control over Financial Reporting
During the period covered by this annual report, there were no changes in our internal control over financial reporting that have materially affected, or are reasonably likely to materially affect, our internal control over financial reporting.
ITEM 16A. AUDIT COMMITTEE FINANCIAL EXPERT
We have determined that Mr. Arno Harris is an “audit committee financial expert” as defined in Item 16A(b) of Form 20-F by the Securities and Exchange Commission’s rules and “independent” as that term is defined in the New York Stock Exchange listing standards.
ITEM 16B. CODE OF ETHICS
The Company has a whistle blower policy in place which defines guidelines for employees and directors to report concerns related to unethical conduct. Under the policy, the Ethics Committee may determine to investigate the matter only if the complaint has the minimum required information, such as location of the incident, timing, person involved, specific evidence, and detailed description of the incident. All protected disclosures reported under the whistleblower policy are thoroughly investigated by a compliance officer designated by the Company under the oversight of a director. The designated compliance officer may, at his/her discretion, consider appointing an investigator or investigation team internally and/or external parties for the purpose of investigation. The decision to conduct an investigation is treated as a neutral fact-finding process.
The Company has recently received complaints and several anonymous whistleblower reports, which made various claims against certain of the Company’s Key Managerial Personnel, related to their and the Company’s actions in relation to the acquisition of and use of land in Rajasthan, Assam, and Uttar Pradesh, as well as certain other corporate actions. These whistleblower complaints did not include the minimum required information required under the policy; however, the reports were investigated. For further information, see “ Item 3. Key Information — D. Risk Factors Risk Factors - Any damages caused by fraud or other misconduct by our employees could adversely affect our business, results of operations and financial condition.”
140
The Company has a Code of Conduct policy for all employees and a Code of Ethics policy that applies to our principal executive officer, our principal financial and accounting officer and our other senior officers. Copies of our Code of Business Conduct and Ethics are available on the “Investor Relations” page of our corporate website www.azurepower.com or at http://investors.azurepower.com/~/media/Files/A/Azure-Power-IR/governance-documents/code-of-business-conduct-and-ethics.pdf
ITEM 16C. P RINCIPAL ACCOUNTANT FEES AND SERVICES
Ernst and Young Associates, LLP, has served as our independent registered public accountant for each of the years ended March 31, 2020 and March 31, 2021 for which audited statements appear in this annual report.
The following table shows the aggregate fees for professional services and other services rendered by Ernst and Young Associates, LLP, and the various member firms of Ernst and Young Associates, LLP to us, including some of our subsidiaries, in fiscal years 2020 and 2021.
| | 2020 | | | 2021 | | | 2021 | |
Particulars | | (INR millions) | | | (INR millions) | | | (US$ millions) | |
Audit fees (audit and review of financial statements and offerings) | | | 62 | | | | 49 | | | | 0.7 | |
All other fees (tax advisory services) | | | 3 | | | | 3 | | | | 0.0 | |
Total | | | 65 | | | | 52 | | | | 0.7 | |
The policy of our audit committee is to pre-approve all audit and non-audit services provided by Ernst and Young Associates, LLP, including audit services, audit-related services and tax services. We have a written policy on the engagement of an external auditor.
ITEM 16D. EXEMPTIONS FROM THE LISTING STANDARDS FOR AUDIT COMMITTEES
Not applicable
ITEM 16E. PURCHASES OF EQUITY SECURITIES BY THE ISSUER AND AFFILIATED PURCHASERS
Not applicable
ITEM 16F. CHANGE IN REGISTRANT’S CERTIFYING ACCOUNTANT
Not applicable
ITEM 16G. CORPORATE GOVERNANCE
Our Company is a “foreign private issuer” (as such term is defined in Rule 3b-4 under the Exchange Act) and our Company’s equity shares are listed on the New York Stock Exchange. Under Section 303A of the New York Stock Exchange Listed Company Manual, New York Stock Exchange listed companies that are foreign private issuers are permitted to follow home country practice in lieu of the corporate governance provisions specified by the New York Stock Exchange, with limited exceptions. As required by the New York Stock Exchange Listed Company Manual, we note the following significant differences between our Company’s corporate governance practices and the corporate governance practices required to be followed by U.S. domestic companies under the New York Stock Exchange Listed Company Manual:
| • | Under the New York Stock Exchange Listed Company Manual, the Board of Directors of U.S. domestic listed companies are required to have a majority of independent directors. Our Company is not subject to this requirement under Mauritius law and have decided to follow home country practice on this matter. However, our Board of Directors currently has a majority of independent directors. |
141
| • | The New York Stock Exchange Listed Company Manual also requires U.S. domestic listed companies to regularly hold executive sessions for non-management directors, or an executive session that only includes independent directors at least once a year. Our Company is not subject to this requirement under Mauritius law and have decided to follow our Company’s home country practice on this matter. However, our Board of Directors regularly holds executive sessions. |
| • | The New York Stock Exchange Listed Company Manual and Rule10C-1(b)(1) (iii) (A) (4) under the Exchange Act also require U.S. domestic listed companies to have compensation committees that only include independent directors. Our Company is not subject to this requirement under Mauritius law and have decided to follow our Company’s home country practice on this matter. |
| • | The New York Stock Exchange Listed Company Manual also requires U.S. domestic listed companies to have nominating and corporate governance committees that only include independent directors. Our Company is not subject to this requirement under Mauritius law and have decided to follow our Company’s home country practice on this matter. |
ITEM 16H. MINE SAFETY DISCLOSURE
Not applicable
142
PART III
ITEM 17. FINANCIAL STATEMENTS
See “Item 18. Financial Statements” for a list of the financial statements filed as part of this annual report.
ITEM 18. FINANCIAL STATEMENTS
The following financial statements are filed as part of this annual report, together with the report of the independent registered public accounting firms:
| • | Report of Independent Registered Public Accounting Firm. |
| • | Consolidated Balance Sheets as of March 31, 2020 and 2021. |
| • | Consolidated Statements of Operations for the years ended March 31, 2019, 2020 and 2021. |
| • | Consolidated Statements of Comprehensive loss for the years ended March 31, 2019, 2020 and 2021. |
| • | Consolidated Statements of Shareholder’s Equity for the years ended March 31, 2019, 2020 and 2021. |
| • | Consolidated Statements of Cash Flows for the years ended March 31, 2019, 2020 and 2021 |
| • | Notes to Consolidated Financial Statements. |
143
ITEM 19. EXHIBITS
Exhibit Number | | Description |
| | |
1.1† | | The Constitution of Azure Power Global Limited, as currently in effect (incorporated by reference to Exhibit 3.2 of our Registration Statement on Form F-1 (File No. 333-208584) filed with the Securities and Exchange Commission on March 31, 2016) |
| | |
2.1† | | Form of Equity Share Certificate of Azure Power Global Limited (incorporated by reference to Exhibit 4.1 of our Registration Statement on Form F-1 (file No. 333-208584) filed with the Securities and Exchange Commission on December 16, 2015) |
| | |
4.1#† | | 2016 Equity Incentive Plan (as amended in 2017) (incorporated by reference to Exhibit 10.2 of our Registration Statement on Form F-1 (file No. 333-208584) filed with the Securities and Exchange Commission on June 30, 2016) |
| | |
4.2† | | Shareholders Agreement, dated July 22, 2015, by and among the shareholders named therein and Azure Power Global Limited (incorporated by reference to Exhibit 10.3 of our Registration Statement on Form F-1 (file No. 333-208584) filed with the Securities and Exchange Commission on December 16, 2015) |
| | |
4.3† | | Shareholders Agreement, dated July 22, 2015, by and among Azure Power Global Limited, AZI, Inderpreet Singh Wadhwa and Harkanwal Singh Wadhwa (incorporated by reference to Exhibit 10.3 of our Registration Statement on Form F-1 (file No. 333-208584) filed with the Securities and Exchange Commission on March 1, 2016) |
| | |
4.4† | | Amendment to the Shareholders Agreement, dated March 30, 2016, by and among the shareholders named therein and Azure Power Global Limited (incorporated by reference to Exhibit 10.5 of our Registration Statement on Form F-1 (file No. 333-208584) filed with the Securities and Exchange Commission on April 19, 2016) |
| | |
4.5† | | Second Amendment to the Shareholders Agreement, dated September 5, 2016, by and among the shareholders named therein and Azure Power Global Limited (incorporated by reference to Exhibit 10.6 of our Registration Statement on Form F-1 (file No. 333-208584) filed with the Securities and Exchange Commission on September 22, 2016) |
| | |
4.6† | | Sponsor Lock-in Agreement, dated July 22, 2015, by and among the shareholders named therein and IW Green Inc. and Inderpreet Singh Wadhwa (incorporated by reference to Exhibit 10.6 of our Registration Statement on Form F-1 (file No. 333-208584) filed with the Securities and Exchange Commission on April 19, 2016) |
| | |
4.7† | | Amendment to the Sponsor Lock-in Agreement, dated April 16, 2016, by and among the shareholders named therein and IW Green Inc. and Inderpreet Singh Wadhwa (incorporated by reference to Exhibit 10.7 of our Registration Statement on Form F-1 (file No. 333-208584) filed with the Securities and Exchange Commission on April 19, 2016) |
| | |
4.8† | | Second Amendment to the Sponsor Lock-in Agreement, dated September 5, 2016, by and among the shareholders named therein and IW Green Inc. and Inderpreet Singh Wadhwa (incorporated by reference to Exhibit 10.9 of our Registration Statement on Form F-1 (file No. 333-208584) filed with the Securities and Exchange Commission on September 22, 2016) |
| | |
4.9† | | Form of Registration Rights Agreement by and among the shareholders named therein and Azure Power Global Limited (incorporated by reference to Exhibit 10.8 of our Registration Statement on Form F-1 (file No. 333-208584) filed with the Securities and Exchange Commission on June 30, 2016) |
| | |
4.10#† | | Employment Agreement, dated November 7, 2008, by and between AZI and Inderpreet Singh Wadhwa (incorporated by reference to Exhibit 10.5 of our Registration Statement on Form F-1 (file No. 333-208584) filed with the Securities and Exchange Commission on December 16, 2015) |
| | |
144
Exhibit Number | | Description |
| | |
4.11#† | | Employment Agreement, dated May 5, 2011, by and between AZI and Surendra Kumar Gupta (incorporated by reference to Exhibit 10.6 of our Registration Statement on Form F-1 (file No. 333-208584) filed with the Securities and Exchange Commission on December 16, 2015) |
| | |
4.12#† | | Employment Agreement, dated November 1, 2009, by and between AZI and Preet Sandhu (incorporated by reference to Exhibit 10.8 of our Registration Statement on Form F-1 (file No. 333-208584) filed with the Securities and Exchange Commission on December 16, 2015) |
| | |
4.13#† | | Employment Agreement, dated August 31, 2011, by and between AZI and Glen Minyard (incorporated by reference to Exhibit 10.9 of our Registration Statement on Form F-1 (file No. 333-208584) filed with the Securities and Exchange Commission on December 16, 2015) |
| | |
4.14#† | | Employment Agreement, dated February 1, 2014, by and between AZI and Mohor Sen (incorporated by reference to Exhibit 10.10 of our Registration Statement on Form F-1 (file No. 333-208584) filed with the Securities and Exchange Commission on December 16, 2015) |
| | |
4.15† | | Indenture of Lease, dated October 15, 2013, by and between AZI and Sunbir Singh Wadhwa and Kulwinder Wadhwa (incorporated by reference to Exhibit 10.11 of our Registration Statement on Form F-1 (file No. 333-208584) filed with the Securities and Exchange Commission on December 16, 2015) |
| | |
4.16† | | Form of Indemnification Agreement by and between Azure Power Global Limited and each of the Officers and Directors of Azure Power Global Limited (incorporated by reference to Exhibit 10.16 of our Registration Statement on Form F-1 (file No. 333-208584) filed with the Securities and Exchange Commission on June 15, 2016) |
| | |
4.17† | | Subscription Agreement, dated June 24, 2015, by and among AZI, Inderpreet Singh Wadhwa, Harkanwal Singh Wadhwa and International Finance Corporation (incorporated by reference to Exhibit 10.14 of our Registration Statement on Form F-1 (file No. 333-208584) filed with the Securities and Exchange Commission on December 16, 2015) |
| | |
4.18† | | Subscription Agreement, dated June 24, 2015, by and among Azure Power Global Limited, Inderpreet Singh Wadhwa, Harkanwal Singh Wadhwa, IW Green Inc. (which has since been converted to IW Green LLC) and IFC GIF Investment Company I (incorporated by reference to Exhibit 10.13 of our Registration Statement on Form F-1 (file No. 333-208584) filed with the Securities and Exchange Commission on December 16, 2015) |
| | |
4.19† | | CCPS Subscription Agreement, dated July 22, 2015, by and among Azure Power Global Limited, Sponsors and Société de Promotion et de Participation pour la Coopération Économique S.A. (incorporated by reference to Exhibit 10.15 of our Registration Statement on Form F-1 (file No. 333-208584) filed with the Securities and Exchange Commission on December 16, 2015) |
| | |
4.20† | | Letter Agreement, dated July 27, 2015, by and among Azure Power Global Limited, International Finance Corporation, AZI, IW Green Inc. (which has since been converted to IW Green LLC), Inderpreet Singh Wadhwa and Harkanwal Singh Wadhwa (incorporated by reference to Exhibit 10.16 of our Registration Statement on Form F-1 (file No. 333-208584) filed with the Securities and Exchange Commission on December 16, 2015) |
| | |
4.21† | | Third Amendment to the Shareholders Agreement, dated September 28, 2016, by and among the shareholders named therein and Azure Power Global Limited (incorporated by reference to Exhibit 10.23 of our Registration Statement on Form F-1 (file No. 333-208584) filed with the Securities and Exchange Commission on October 3, 2016) |
| | |
145
Exhibit Number | | Description |
| | |
4.22† | | CCPS Subscription Agreement, dated September 19, 2016, by and among Azure Power Global Limited, the Sponsors named therein and IFC GIF Investment Company I (incorporated by reference to Exhibit 10.24 of our Registration Statement on Form F-1 (file No. 333-208584) filed with the Securities and Exchange Commission on October 3, 2016) |
| | |
4.23† | | Amendment to CCPS Subscription Agreement, dated September 28, 2016, by and among Azure Power Global Limited, the Sponsors named therein and IFC GIF Investment Company I (incorporated by reference to Exhibit 10.25 of our Registration Statement on Form F-1 (file No. 333-208584) filed with the Securities and Exchange Commission on October 3, 2016) |
| | |
4.24† | | Share Purchase Agreement, dated September 30, 2016, by and between Azure Power Global Limited and CDPQ Infrastructures Asia Pte Ltd. (incorporated by reference to Exhibit 10.26 of our Registration Statement on Form F-1 (file No. 333-208584) filed with the Securities and Exchange Commission on October 3, 2016) |
| | |
4.25† | | Amended and Restated Shareholders Agreement, dated March 28, 2017, by and among Azure Power Global Limited, AZI, Inderpreet Singh Wadhwa and Harkanwal Singh Wadhwa. (incorporated by reference to Exhibit 4.26 of our annual report on Form 20-F (file No. 001-37909) filed with the Securities and Exchange Commission on June 19, 2017) |
| | |
4.26† | | Indenture among Azure Power Energy Ltd, Azure Power Global Limited and Citicorp International Limited dated August 3, 2017 (incorporated by reference to Exhibit 4.26 of our annual report on Form 20-F (file No. 001-37909) filed with the Securities and Exchange Commission on June 15, 2018) |
| | |
4.27†# | | 2016 Equity Incentive Plan (as amended in 2017) (incorporated by reference to Exhibit 4.3 of our Registration Statement on Form S-8 (file No. 333-222331) filed with the Securities and Exchange Commission on December 28, 2017) |
| | |
4.28†# | | Employment Agreement, dated November 18, 2019, by and between AZI and Ranjit Gupta (incorporated by reference to Exhibit 4.28 of our annual report on Form 20-F (file No. 001-37909) filed with the Securities and Exchange Commission on June 19, 2020). |
| | |
4.29†# | | Employment Agreement, dated November 18, 2019, by and between AZI and Murali Subramanian (incorporated by reference to Exhibit 4.29 of our annual report on Form 20-F (file No. 001-37909) filed with the Securities and Exchange Commission on June 19, 2020). |
| | |
4.30† | | Subscription Agreement, dated November 6, 2019, by and between Azure Power Global Limited and CDPQ Infrastructures Asia Pte Ltd (incorporated by reference to Exhibit 4.30 of our annual report on Form 20-F (file No. 001-37909) filed with the Securities and Exchange Commission on June 19, 2020). |
| | |
4.31† | | Indenture among Azure Power Solar Energy Private Limited, Azure Power Global Limited and HSBC Bank USA, National Association dated September 24, 2019 (incorporated by reference to Exhibit 4.31 of our annual report on Form 20-F (file No. 001-37909) filed with the Securities and Exchange Commission on June 19, 2020) |
| | |
4.32†# | | 2016 Equity Incentive Plan (as amended on March 31, 2020) (incorporated by reference to Exhibit 4.32 of our annual report on Form 20-F (file No. 001-37909) filed with the Securities and Exchange Commission on June 19, 2020) |
| | |
4.33* | | Master Share Purchase agreement dated April 1, 2021, by and between Radiance Renewables Private Limited and AZI, AZR and entities as mentioned in Schedule 1 of the agreement |
| | |
4.34* | | Amendment to Employment Agreement, dated July 20, 2020, by and between AZI and Ranjit Gupta. |
| | |
4.35* | | Amendment to Employment Agreement, dated July 20, 2020, by and between AZI and Murali Subramanian. |
| | |
8.1* | | List of Subsidiaries of Azure Power Global Limited |
| | |
146
# | Indicates management contract or compensatory plan. |
† | Previously filed |
* | Filed with this annual report on Form 20-F |
** | Furnished with this annual report on Form 20-F |
147
SIGNATURES
The registrant hereby certifies that it meets all of the requirements for filing on Form 20-F and that it has duly caused and authorized the undersigned to sign this annual report on this Form 20-F on its behalf.
Azure Power Global Limited |
| |
By: | | /s/ Ranjit Gupta |
Name: | | Ranjit Gupta |
Title: | | Chief Executive Officer |
Date: July 28, 2021
148
INDEX TO CONSOLIDATED FINANCIAL STATEMENTS
F-1
Report of Independent Registered Public Accounting Firm
To the Shareholders and the Board of Directors of Azure Power Global Limited
Opinion on the Financial Statements
We have audited the accompanying consolidated balance sheets of Azure Power Global Limited (the “Company”) as of March 31, 2021 and 2020, the related consolidated statements of operations, comprehensive loss, shareholders’ equity, and cash flows for each of the three years in the period ended March 31, 2021, and the related notes (collectively referred to as the “consolidated financial statements”). In our opinion, the consolidated financial statements present fairly, in all material respects, the financial position of the Company at March 31, 2021 and 2020, and the results of its operations and its cash flows for each of the three years in the period ended March 31, 2021, in conformity with U.S. generally accepted accounting principles.
Basis for Opinion
These financial statements are the responsibility of the Company’s management. Our responsibility is to express an opinion on the Company’s financial statements based on our audits. We are a public accounting firm registered with the Public Company Accounting Oversight Board (United States) (PCAOB) and are required to be independent with respect to the Company in accordance with the U.S. federal securities laws and the applicable rules and regulations of the Securities and Exchange Commission and the PCAOB.
We conducted our audits in accordance with the standards of the PCAOB. Those standards require that we plan and perform the audit to obtain reasonable assurance about whether the financial statements are free of material misstatement, whether due to error or fraud. The Company is not required to have, nor were we engaged to perform, an audit of its internal control over financial reporting. As part of our audits we are required to obtain an understanding of internal control over financial reporting but not for the purpose of expressing an opinion on the effectiveness of the Company’s internal control over financial reporting. Accordingly, we express no such opinion.
Our audits included performing procedures to assess the risks of material misstatement of the financial statements, whether due to error or fraud, and performing procedures that respond to those risks. Such procedures included examining, on a test basis, evidence regarding the amounts and disclosures in the financial statements. Our audits also included evaluating the accounting principles used and significant estimates made by management, as well as evaluating the overall presentation of the financial statements. We believe that our audits provide a reasonable basis for our opinion.
/s/ Ernst & Young Associates LLP
We have served as the Company‘s auditor since 2009
Gurugram, India
July 28, 2021
F-2
AZURE POWER GLOBAL LIMITED
Consolidated Balance Sheets
(INR and US$ amounts in millions, except share and par value data)
| | As of March 31, | |
| | 2020 | | | 2021 | | | 2021 | |
| | (INR) | | | (INR) | | | (US$) | |
| | | | | | | | | | (Note 2d) | |
Assets | | | | | | | | | | | | |
Current assets: | | | | | | | | | | | | |
Cash and cash equivalents | | | 9,792 | | | | 11,107 | | | | 151.8 | |
Restricted cash | | | 4,877 | | | | 4,881 | | | | 66.7 | |
Accounts receivable, net | | | 4,456 | | | | 4,887 | | | | 66.8 | |
Prepaid expenses and other current assets | | | 1,619 | | | | 2,190 | | | | 29.9 | |
Assets classified as held for sale (1) | | | - | | | | 3,301 | | | | 45.1 | |
Total current assets | | | 20,744 | | | | 26,366 | | | | 360.3 | |
Restricted cash | | | 848 | | | | 170 | | | | 2.3 | |
Property, plant and equipment, net | | | 95,993 | | | | 108,847 | | | | 1,488.2 | |
Software, net | | | 55 | | | | 29 | | | | 0.4 | |
Deferred income taxes | | | 2,205 | | | | 1,748 | | | | 23.9 | |
Right-of-use assets | | | 4,434 | | | | 4,214 | | | | 57.6 | |
Other assets | | | 8,115 | | | | 7,084 | | | | 96.8 | |
Investments in held to maturity securities | | | 7 | | | | 7 | | | | 0.1 | |
Total assets | | | 132,401 | | | | 148,465 | | | | 2,029.6 | |
Liabilities and shareholders’ equity | | | | | | | | | | | | |
Current liabilities: | | | | | | | | | | | | |
Short-term debt | | | 975 | | | | 8,943 | | | | 122.3 | |
Accounts payable | | | 1,795 | | | | 4,294 | | | | 58.7 | |
Current portion of long-term debt | | | 2,303 | | | | 4,658 | | | | 63.7 | |
Income taxes payable | | | 50 | | | | 46 | | | | 0.6 | |
Interest payable | | | 1,716 | | | | 1,530 | | | | 20.9 | |
Deferred revenue | | | 110 | | | | 110 | | | | 1.5 | |
Lease liabilities | | | 256 | | | | 283 | | | | 3.9 | |
Other liabilities | | | 2,020 | | | | 1,927 | | | | 26.5 | |
Liabilities directly associated with assets classified as held for sale (1) | | | - | | | | 2,272 | | | | 31.1 | |
Total current liabilities | | | 9,225 | | | | 24,063 | | | | 329.2 | |
Non-current liabilities: | | | | | | | | | | | | |
Long-term debt | | | 86,586 | | | | 89,922 | | | | 1,229.4 | |
Deferred revenue | | | 2,129 | | | | 2,353 | | | | 32.2 | |
Deferred income taxes | | | 2,622 | | | | 2,046 | | | | 28.0 | |
Asset retirement obligations | | | 741 | | | | 811 | | | | 11.1 | |
Leases liabilities | | | 3,592 | | | | 3,359 | | | | 45.9 | |
Other liabilities | | | 289 | | | | 1,459 | | | | 19.5 | |
Total liabilities | | | 105,184 | | | | 124,013 | | | | 1,695.3 | |
Shareholders’ equity | | | | | | | | | | | | |
Equity shares, US$ 0.000625 par value; 47,650,750 and 48,195,962 shares issued and outstanding as of March 31, 2020, and March 31, 2021, respectively | | | 2 | | | | 2 | | | | 0.0 | |
Additional paid-in capital | | | 37,533 | | | | 38,004 | | | | 519.6 | |
Accumulated deficit | | | (8,580 | ) | | | (12,786 | ) | | | (174.8 | ) |
Accumulated other comprehensive loss | | | (1,937 | ) | | | (972 | ) | | | (13.3 | ) |
Total APGL shareholders’ equity | | | 27,018 | | | | 24,248 | | | | 331.5 | |
Non-controlling interest | | | 199 | | | | 204 | | | | 2.8 | |
Total shareholders’ equity | | | 27,217 | | | | 24,452 | | | | 334.3 | |
Total liabilities and shareholders’ equity | | | 132,401 | | | | 148,465 | | | | 2,029.6 | |
(1) Also refer note 2(u) and note 23 relating to assets and liabilities directly associated with assets classified as held for sale.
See accompanying notes.
F-3
AZURE POWER GLOBAL LIMITED
Consolidated Statements of Operations
(INR and US$ amounts in millions, except share and per share data)
| | March 31, | |
| | 2019 | | | 2020 | | | 2021 | | | 2021 | |
| | (INR) | | | (INR) | | | (INR) | | | (US$) | |
| | | | | | | | | | | | | | (Note 2d) | |
Operating revenues: | | | | | | | | | | | | | | | | |
Revenue from customers | | | 9,926 | | | | 12,958 | | | | 15,236 | | | | 208.3 | |
Operating costs and expenses: | | | | | | | | | | | | | | | | |
Cost of operations (exclusive of depreciation and amortization shown separately below) | | | 869 | | | | 1,146 | | | | 1,261 | | | | 17.2 | |
General and administrative | | | 1,306 | | | | 2,422 | | | | 2,988 | | | | 40.9 | |
Depreciation and amortization | | | 2,137 | | | | 2,860 | | | | 3,202 | | | | 43.8 | |
Impairment loss | | | - | | | | - | | | | 3,255 | | | | 44.5 | |
Total operating costs and expenses: | | | 4,312 | | | | 6,428 | | | | 10,706 | | | | 146.4 | |
Operating income | | | 5,614 | | | | 6,530 | | | | 4,530 | | | | 61.9 | |
Other expense, net: | | | | | | | | | | | | | | | | |
Interest expense, net | | | 5,022 | | | | 7,962 | | | | 8,410 | | | | 114.8 | |
Other (income) / expenses | | | (140 | ) | | | (96 | ) | | | 18 | | | | 0.2 | |
Loss on foreign currency exchange, net | | | 441 | | | | 512 | | | | 7 | | | | 0.1 | |
Total other expenses, net | | | 5,323 | | | | 8,378 | | | | 8,435 | | | | 115.1 | |
Profit / (loss) before income tax | | | 291 | | | | (1,848 | ) | | | (3,905 | ) | | | (53.2 | ) |
Income tax expense | | | (153 | ) | | | (489 | ) | | | (296 | ) | | | (4.0 | ) |
Net profit / (loss) | | | 138 | | | | (2,337 | ) | | | (4,201 | ) | | | (57.2 | ) |
Less: Net profit / (loss) attributable to non-controlling interest | | | 60 | | | | (68 | ) | | | 5 | | | | 0.1 | |
Net profit / (loss) attributable to APGL equity Shareholders | | | 78 | | | | (2,269 | ) | | | (4,206 | ) | | | (57.3 | ) |
Net profit / (loss) per share attributable to APGL equity Shareholders | | | | | | | | | | | | | | | | |
Basic | | | 2.37 | | | | (52.71 | ) | | | (87.66 | ) | | | (1.20 | ) |
Diluted | | | 2.31 | | | | (52.71 | ) | | | (87.66 | ) | | | (1.20 | ) |
Shares used in computing basic and diluted per share amounts | | | | | | | | | | | | | | | | |
Basic | | | 33,063,832 | | | | 43,048,026 | | | | 47,979,581 | | | | 47,979,581 | |
Diluted | | | 33,968,127 | | | | 43,048,026 | | | | 47,979,581 | | | | 47,979,581 | |
See accompanying notes.
F-4
AZURE POWER GLOBAL LIMITED
Consolidated Statements of Comprehensive Loss
(INR and US$ amounts in millions)
| | March 31, | |
| | 2019 | | | 2020 | | | 2021 | | | 2021 | |
| | (INR) | | | (INR) | | | (INR) | | | (US$) | |
| | | | | | | | | | | | | | (Note 2d) | |
Net (loss)/profit | | | 78 | | | | (2,269 | ) | | | (4,206 | ) | | | (57.3 | ) |
Add: Non-controlling interest | | | 60 | | | | (68 | ) | | | 5 | | | | 0.1 | |
Less: Total comprehensive income attributable to non-controlling interest, included in other comprehensive loss/(gain) | | | 0 | | | | 0 | | | | 0 | | | | 0 | |
Other comprehensive (loss)/gain, net of tax | | | | | | | | | | | | | | | | |
Foreign currency translation | | | (2,343 | ) | | | (4,811 | ) | | | 1,600 | | | | 21.9 | |
Effective portion of cashflow hedge | | | 2,227 | | | | 4,243 | | | | (778 | ) | | | (10.6 | ) |
Income tax effect on effective portion of cash flow hedge | | | (314 | ) | | | (621 | ) | | | 143 | | | | 2.0 | |
Unrealized loss on available-for-sale securities | | | (23 | ) | | | — | | | | — | | | | — | |
Income tax effect on unrealized gain/(loss) on available for sale of securities | | | — | | | | — | | | | — | | | | — | |
Total other comprehensive (loss)/gain | | | (453 | ) | | | (1,189 | ) | | | 965 | | | | 13.3 | |
Total comprehensive loss | | | (315 | ) | | | (3,526 | ) | | | (3,236 | ) | | | (43.9 | ) |
See accompanying notes.
F-5
AZURE POWER GLOBAL LIMITED
Consolidated Statements of Shareholders’ Equity
(INR and US$ amounts in millions)
| Equity shares | | | Additional paid-in capital | | | Accumulated other comprehensive loss (1) | | | Accumulated deficit | | | Total APGL shareholders' equity | | | Non- controlling interests | | | Total shareholders' equity | |
Balance as of March 31, 2018 | | 1 | | | | 19,004 | | | | (295 | ) | | | (6,593 | ) | | | 12,117 | | | | 1,158 | | | | 13,275 | |
Proceeds from issuance of equity shares (refer note 16) | | 1 | | | | 13,609 | | | | — | | | | — | | | | 13,610 | | | | — | | | | 13,610 | |
Impact of change in non-controlling Interest | | — | | | | 63 | | | | — | | | | (14 | ) | | | 49 | | | | (49 | ) | | | — | |
Net profit | | — | | | | — | | | | — | | | | 78 | | | | 78 | | | | 60 | | | | 138 | |
Impact on buy back of stake in subsidiary (note 2 (z)) | | — | | | | (573 | ) | | | — | | | | — | | | | (573 | ) | | | (902 | ) | | | (1,475 | ) |
Transition impact of ASC 606, Revenue from Contracts with Customers (note 2(q)) | | — | | | | — | | | | — | | | | 218 | | | | 218 | | | | — | | | | 218 | |
Other comprehensive loss | | — | | | | — | | | | (453 | ) | | | — | | | | (453 | ) | | | — | | | | (453 | ) |
Share based compensation | | — | | | | 83 | | | | — | | | | — | | | | 83 | | | | — | | | | 83 | |
Balance as of March 31, 2019 | | 2 | | | | 32,186 | | | | (748 | ) | | | (6,311 | ) | | | 25,129 | | | | 267 | | | | 25,396 | |
| | Equity Shares | | | Additional paid-in capital | | | Accumulated other comprehensive loss (1) | | | Accumulated deficit | | | Total APGL shareholders' equity | | | Non- controlling interests | | | Total shareholders' equity | |
Balance as of March 31, 2019 | | | 2 | | | | 32,186 | | | | (748 | ) | | | (6,311 | ) | | | 25,129 | | | | 267 | | | | 25,396 | |
Proceeds from issuance of equity shares (refer note 16) | | | 0 | | | | 5,317 | | | | — | | | | — | | | | 5,317 | | | | — | | | | 5,317 | |
Net loss | | | — | | | | — | | | | — | | | | (2,269 | ) | | | (2,269 | ) | | | (68 | ) | | | (2,337 | ) |
Other comprehensive loss | | | — | | | | — | | | | (1,189 | ) | | | — | | | | (1,189 | ) | | | — | | | | (1,189 | ) |
Share based compensation | | | — | | | | 30 | | | | — | | | | — | | | | 30 | | | | — | | | | 30 | |
Balance as of March 31, 2020 | | | 2 | | | | 37,533 | | | | (1,937 | ) | | | (8,580 | ) | | | 27,018 | | | | 199 | | | | 27,217 | |
| | Equity Shares | | | Additional paid-in capital | | | Accumulated other comprehensive loss (1) | | | Accumulated deficit | | | Total APGL shareholders' equity | | | Non- controlling interests | | | Total shareholders' equity | |
Balance as of March 31, 2020 | | | 2 | | | | 37,533 | | | | (1,937 | ) | | | (8,580 | ) | | | 27,018 | | | | 199 | | | | 27,217 | |
Proceeds from issuance of equity shares (2),(3) | | | 0 | | | | 424 | | | | — | | | | — | | | | 424 | | | | — | | | | 424 | |
Net loss | | | — | | | | — | | | | — | | | | (4,206 | ) | | | (4,206 | ) | | | 5 | | | | (4,201 | ) |
Other comprehensive income | | | — | | | | — | | | | 965 | | | | — | | | | 965 | | | | — | | | | 965 | |
Share based compensation | | | — | | | | 47 | | | | — | | | | — | | | | 47 | | | | — | | | | 47 | |
Balance as of March 31, 2021 | | | 2 | | | | 38,004 | | | | (972 | ) | | | (12,786 | ) | | | 24,248 | | | | 204 | | | | 24,452 | |
Balance as of March 31, 2021 ((US$) (Note 2(d)) | | | 0.0 | | | | 519.6 | | | | (13.3 | ) | | | (174.8 | ) | | | 331.5 | | | | 2.8 | | | | 334.3 | |
(1) Refer note 16 for components of accumulated other comprehensive loss.
(2) Refer note 16 for reconciliation of number of equity shares.
(3) Includes the related immaterial impact of restricted stock units (“RSU”) which has been converted into restricted stock (“RS”)/ share-based settlement in current year.
See accompanying notes.
F-6
AZURE POWER GLOBAL LIMITED
Consolidated Statements of Cash Flows
(INR and US$ amounts in millions)
| | Year ended March 31, | |
| | 2019 | | | 2020 | | | 2021 | | | 2021 | |
| | (INR) | | | (INR) | | | (INR) | | | US$ | |
Cash flow from operating activities | | | | | | | | | | | | | | | | |
Net profit/(loss) | | | 138 | | | | (2,337 | ) | | | (4,201 | ) | | | (57.2 | ) |
Adjustments to reconcile net (loss)/profit to net cash provided by/(used in) operating activities: | | | | | | | | | | | | | | | | |
Income taxes and deferred tax | | | (508 | ) | | | 149 | | | | (329 | ) | | | (4.5 | ) |
Depreciation and amortization | | | 2,137 | | | | 2,860 | | | | 3,202 | | | | 43.8 | |
Impairment loss | | | - | | | | - | | | | 3,255 | | | | 44.5 | |
Amortization of derivative instrument | | | 1,037 | | | | 1,428 | | | | 1,918 | | | | 26.2 | |
Loss on disposal of property plant and equipment | | | 55 | | | | 52 | | | | 32 | | | | 0.4 | |
Share based compensation | | | 83 | | | | 186 | | | | 1,001 | | | | 13.7 | |
Amortization of debt financing costs | | | 267 | | | | 709 | | | | 369 | | | | 5.0 | |
Realized gain on short term investments | | | (148 | ) | | | (108 | ) | | | - | | | | - | |
ARO accretion | | | 23 | | | | 36 | | | | 42 | | | | 0.6 | |
Non-cash rent expense | | | 81 | | | | 193 | | | | 169 | | | | 2.3 | |
Allowance for doubtful accounts/ credit losses | | | 40 | | | | 303 | | | | 294 | | | | 4.0 | |
Employee benefit | | | 11 | | | | (11 | ) | | | 45 | | | | 0.6 | |
Loan prepayment charges | | | - | | | | 282 | | | | 257 | | | | 3.5 | |
Foreign exchange loss, net | | | 441 | | | | 512 | | | | 7 | | | | 0.1 | |
Change in Operating lease right-of-use assets | | | - | | | | 718 | | | | (371 | ) | | | (5.1 | ) |
Change in Operating lease liabilities | | | - | | | | (1,255 | ) | | | 125 | | | | 1.7 | |
Changes in operating assets and liabilities | | | | | | | | | | | | | | | | |
Accounts receivable, net | | | (1,124 | ) | | | (1,390 | ) | | | (874 | ) | | | (11.9 | ) |
Prepaid expenses and other current assets | | | (266 | ) | | | 247 | | | | 20 | | | | 0.3 | |
Other assets | | | (725 | ) | | | (335 | ) | | | 112 | | | | 1.5 | |
Accounts payable | | | (34 | ) | | | 236 | | | | (176 | ) | | | (2.4 | ) |
Interest payable | | | (301 | ) | | | 699 | | | | (83 | ) | | | (1.1 | ) |
Deferred revenue | | | 399 | | | | 340 | | | | 224 | | | | 3.1 | |
Other liabilities | | | 532 | | | | 164 | | | | (61 | ) | | | (0.8 | ) |
Net cash provided by operating activities | | | 2,138 | | | | 3,678 | | | | 4,977 | | | | 68.3 | |
Cash flows from investing activities | | | | | | | | | | | | | | | | |
Purchase of property plant and equipment | | | (26,029 | ) | | | (18,321 | ) | | | (18,909 | ) | | | (258.8 | ) |
Purchase of software | | | (47 | ) | | | (43 | ) | | | (10 | ) | | | (0.1 | ) |
Purchase of available for sale securities | | | (12,085 | ) | | | (32,224 | ) | | | - | | | | - | |
Sale of available for sale securities | | | 13,582 | | | | 32,332 | | | | - | | | | - | |
Investment in subsidiary | | | (1,474 | ) | | | - | | | | - | | | | - | |
Net cash used in investing activities | | | (26,053 | ) | | | (18,256 | ) | | | (18,919 | ) | | | (258.9 | ) |
Cash flows from financing activities | | | | | | | | | | | | | | | | |
Proceeds from issuance of Green Bonds | | | - | | | | 24,400 | | | | - | | | | - | |
Proceeds from term and other debt | | | 15,558 | | | | 19,538 | | | | 25,510 | | | | 348.7 | |
Proceeds from issuance of debentures | | | 1,478 | | | | - | | | | - | | | | - | |
Repayments of term and other debt (1) | | | (3,786 | ) | | | (32,827 | ) | | | (10,563 | ) | | | (144.5 | ) |
Loan prepayment charges | | | - | | | | (282 | ) | | | (257 | ) | | | (3.5 | ) |
Proceeds from issuance of equity shares | | | 13,706 | | | | 5,330 | | | | 402 | | | | 5.5 | |
Cost of issuance of equity shares | | | (69 | ) | | | (13 | ) | | | - | | | | - | |
Net cash provided by financing activities | | | 26,887 | | | | 16,146 | | | | 15,092 | | | | 206.2 | |
Effect of exchange rate changes on cash and cash equivalents, and restricted cash | | | (69 | ) | | | (37 | ) | | | 8 | | | | 0.1 | |
Net increase in cash and cash equivalents, and restricted cash (refer note 2 (f)) | | | 2,972 | | | | 1,568 | | | | 1,150 | | | | 15.6 | |
Cash and cash equivalents and restricted cash at the beginning of the period | | | 11,083 | | | | 13,986 | | | | 15,517 | | | | 212.2 | |
Less: Cash and cash equivalents and restricted cash, held for sale | | | - | | | | - | | | | (517 | ) | | | (7.1 | ) |
Cash and cash equivalents and restricted cash at the end of the period | | | 13,986 | | | | 15,517 | | | | 16,158 | | | | 220.8 | |
Supplemental disclosure of cash flow information | | | | | | | | | | | | | | | | |
Cash paid during the year for interest | | | 6,237 | | | | 7,209 | | | | 8,918 | | | | 121.9 | |
Cash paid during the year for income taxes | | | 615 | | | | 697 | | | | 488 | | | | 6.7 | |
(1) | Includes INR 1,305 million, INR 1,058 million and INR 2,117 million (US$ 28.9 million) paid towards hedging costs for Solar Green Bonds for the year ended March 31, 2019, 2020, and 2021, respectively |
F-7
Notes to consolidated financial statements
1. Organization
Azure Power Global Limited (“APGL” or “Azure”) organized under the laws of Mauritius was incorporated on January 30, 2015. APGL’s subsidiaries are organized under the laws of India (except for one U.S. subsidiary and two subsidiaries in Mauritius) and are engaged in the development, construction, ownership, operation, maintenance and management of renewable energy assets based on long-term contracts (Power Purchase Agreements or “PPA”) with Indian Government energy distribution companies as well as other Indian non-governmental energy distribution companies and Indian commercial customers. APGL and its subsidiaries are hereinafter referred to as the “Company”. During the current year the Company has entered into a sale agreement for the disposal of its rooftop business. See also Note 23.
2. Summary of significant accounting policies
(a) Basis of presentation
The accompanying consolidated financial statements have been prepared in accordance with accounting principles generally accepted in the United States (“U.S. GAAP”) and are presented in Indian rupees (“INR”), unless otherwise stated. The consolidated financial statements include the accounts of APGL and companies which are directly or indirectly controlled by APGL. All intercompany accounts and transactions have been eliminated upon consolidation. Certain balances relating to prior years have been reclassified to conform to the current year presentation.
All share and per share amounts presented in the consolidated financial statements have been adjusted to reflect the 16-for-1 stock split of the Company’s equity shares that was effective on October 6, 2016.
(b) Use of estimates
The preparation of consolidated financial statements in conformity with U.S. GAAP requires management to make estimates and assumptions that affect the reported amounts of assets, liabilities, revenues, costs, expenses and comprehensive loss/ gain that are reported and disclosed in the consolidated financial statements and accompanying notes. These estimates are based on management’s best knowledge of current events, historical experience, actions the Company may undertake in the future and on various other assumptions that are believed to be prudent and reasonable under the circumstances. Significant estimates and assumptions are used for, but not limited to impairment of and useful lives of property, plant and equipment, determination of asset retirement obligations, valuation of derivative instruments, hedge accounting, lease liabilities, right to use asset, allowances for doubtful accounts based on payment history, credit rating, valuation of share-based compensation, income taxes, energy kilowatts expected to be generated over the useful life of the solar power plant, estimated transaction price, including variable consideration, of the Company’s revenue contracts, impairment of other assets, impairment of net assets classified as held for sale and other contingencies and commitments. Although these estimates are based upon management’s best knowledge of current events and actions, actual results could differ from these estimates, and such differences may be material to the consolidated financial statements.
Estimation uncertainty relating to COVID-19 pandemic
In evaluating the recoverability of accounts receivable including unbilled revenue, contract assets, long-lived assets and investments, the Company has considered, at the date of approval of these consolidated financial statements, internal and external information in the preparation of the consolidated financial statements including the economic outlook. The Company has performed sensitivity analysis on the assumptions used to assess the recoverability of these assets and based on current estimates, expects the carrying amount of these assets will be recovered. The impact of COVID-19 may be different from that estimated on preparation of these consolidated financial statements and the Company will continue to closely monitor any material changes to future economic conditions. See also Note 2 ac - Impact of COVID-19 Pandemic.
F-8
Principles of Consolidation
The accompanying consolidated financial statements include the accounts of APGL, its subsidiaries, and variable interest entities (“VIE”), where the Company has determined it is the primary beneficiary and are prepared in conformity with accounting principles generally accepted in the United States of America (“U.S. GAAP”). The Company uses the equity method to account for its investments in entities where it exercises significant influence over operating and financial policies but does not retain control under either the voting interest model (generally 20% to 50% ownership interest) or the variable interest model. In 2020, the Company entered into a joint venture agreement as further described in Note 10—Investments, and the investment is accounted for using the equity method. The Company has eliminated all significant intercompany accounts and transactions.
(c) Foreign currency translation and transactions
The functional currency of APGL is the United States Dollar (“US$”) and reporting currency is Indian rupees (“INR”). The Company’s subsidiaries with operations in India use INR as the functional currency and the subsidiaries in the United States and Mauritius use US$ as the functional currency. The financial statements of APGL and its subsidiaries, other than subsidiaries with a functional currency of INR, are translated into INR using the exchange rate as of the balance sheet date for assets and liabilities, historical exchange rates for equity transactions and average exchange rate for the year for income and expense items. Translation gains and losses are recorded in accumulated other comprehensive income or expenses as a component of shareholders’ equity.
Transactions in currencies other than the functional currency are measured and recorded in the functional currency using the exchange rate in effect at the date of the transaction. At the balance sheet date, monetary assets and liabilities that are denominated in currencies other than the functional currency are translated into the functional currency using the exchange rate at the balance sheet date. All gains and losses arising from foreign currency transactions are recorded in the determination of net income or loss/(gain) during the year in which they occur.
Revenue, expense and cash flow items are translated using the average exchange rates for the respective period. The resulting gains and losses from such translations are excluded from the determination of earnings and are recognized instead in accumulated other comprehensive loss/ gain, which is a separate component of shareholders’ equity.
Realized and unrealized foreign currency transaction gains and losses, other than those hedged by the Company, arising from exchange rate fluctuations on balances denominated in currencies other than the functional currency of an entity, such as those resulting from the Company’s borrowings in other than functional currency are included in Loss/(Gain) on foreign currency exchange, net in the consolidated statements of operations.
(d) Convenience translation
Translation of balances in the consolidated balance sheets and the consolidated statements of operations, comprehensive loss, shareholders’ equity and cash flows from INR into US$, as of and for the year ended March 31, 2021 are solely for the convenience of the readers and were calculated at the rate of US$ 1.00 = INR 73.14, the noon buying rate in New York City for cable transfers in non U.S. currencies, as certified for customs purposes by the Federal Reserve Bank of New York on March 31, 2021. No representation is made that the INR amounts could have been, or could be, converted, realized or settled into US$ at that rate on March 31, 2021, or at any other rate.
(e) Cash and cash equivalents
Cash and cash equivalents include demand deposits with banks, term deposits and all other highly liquid investments purchased with an original maturity of three months or less at the date of acquisition and that are readily convertible to cash. The Company has classified term deposits totaling INR 6,890 million and INR 9,936 million (US$ 135.8 million) as of March 31, 2020 and 2021, respectively, as cash and cash equivalents, because the Company has the ability to redeem these deposits at any time subject to an immaterial interest rate forfeiture. All term deposits are readily convertible into known amount of cash with no more than one day notice.
F-9
(f) Restricted cash
Restricted cash consists of cash balances restricted as to withdrawal or usage and relates to cash used to collateralize bank letters of credit supporting the purchase of equipment for solar power plants, bank guarantees issued in relation to the construction of the solar power plants within the timelines stipulated in PPAs and for certain debt service reserves required under the Company’s loan agreements. Restricted cash is classified into current and non-current portions based on the term of the deposit and the expiration date of the underlying restriction.
The following table presents the components of cash and cash equivalents and restricted cash included in the consolidated balance sheets that sums to the total of such amounts in the Consolidated Statements of Cash Flows:
| | March 31, | |
| | 2019 | | | 2020 | | | 2021 | | | 2021 | |
| | (INR) | | | (INR) | | | (INR) | | | (US$) | |
| | (In million) | |
Current Assets | | | | | | | | | | | | | | | | |
Cash and cash equivalents | | | 10,538 | | | | 9,792 | | | | 11,107 | | | | 151.8 | |
Restricted cash | | | 2,168 | | | | 4,877 | | | | 4,881 | | | | 66.7 | |
Non-Current Assets | | | | | | | | | | | | | | | | |
Restricted cash | | | 1,280 | | | | 848 | | | | 170 | | | | 2.3 | |
Cash and cash equivalents and restricted cash | | | 13,986 | | | | 15,517 | | | | 16,158 | | | | 220.8 | |
(g) Investments
The Company determines the appropriate classification of investment securities at the time of purchase and re-evaluates such designation at each balance sheet date. The investment securities held by the Company during the periods presented in the accompanying consolidated financial statements are classified as available-for-sale (short-term investments), consisting of liquid mutual funds units and held-to-maturity investments (long-term investments), consisting of Notes of the Bank of Mauritius.
The Company accounts for its investments in accordance with Financial Accounting Standards Board (“FASB”) ASC Topic 320, Accounting for Certain Investments in Debt and Equity Securities. These investments are considered as available-for-sale and held-to-maturity. Investments classified as available for sale are recorded at fair value, with the unrealized gains or losses, net of tax, reported as a component of accumulated other comprehensive income or expenses in the consolidated statement of shareholders’ equity. Realized gains and proceeds from the sale of available-for-sale securities during the year ended March 31, 2020 were INR 108 million and INR 32,332 million respectively and during the year ended March 31, 2021 were INR Nil and INR Nil, respectively.
Securities that the Company has positive intent and ability to hold until maturity are classified as held-to-maturity securities and stated at amortized cost. As of March 31, 2020, and March 31, 2021, amortized cost of held-to-maturity investments was INR 7 million and INR 7 million (US$ 0.1 million), respectively. The maturity date of the investment is January 31, 2023.
Realized gains and losses and a decline in value judged to be other than temporary on these investments are included in the consolidated statements of operations. The cost of securities sold or disposed is determined on the First in First Out (“FIFO”) method.
Investment in equity investee
The Company holds equity investments where it does not have a controlling financial interest but has the ability to exercise significant influence over the operating and financial policies of the investee. These investments are accounted for under the equity method of accounting wherein the Company records its proportionate share of the investee’s income or loss in its consolidated financial statements.
During the previous year ended March 31, 2020, the Company had invested INR 0.026 million (US$ 0.0003 million) to acquire 26% of equity shares in a newly formed Company incorporated to establish a manufacturing
F-10
facility (investee) and the Company is committed to further invest 26% of the equity required for construction of the manufacturing facility.
(h) Accounts receivable, net
The Company adopted "ASC Topic 326" Financial Instruments — Credit Losses, effective April 1, 2020 using the modified retrospective transition approach. The new guidance requires the measurement and recognition of expected credit losses (ECL) for financial assets held at amortized cost and replaces the existing incurred loss impairment model with an expected loss model using the forward-looking information to calculate credit loss estimates. The new model requires consideration of a broader range of relevant information, such as offtake ratings historical loss experience, current economic conditions, and reasonable and supportable forecasts. The impact of adoption of this guidance did not have a material effect on the Company's financial statements.
Credit Risk
Credit risk is the risk that counterparty will not meet its obligations under a financial instrument which consists principally of accounts receivables, cash and cash equivalents and restricted cash, leading to a financial loss. Customer credit risk is managed using the Company's established policy, procedures and control relating to customer credit risk management. Outstanding accounts receivables are regularly monitored.
The Company’s accounts receivables are generated by selling energy to customers and are reported net of any allowance for uncollectible accounts. The allowance for credit losses is based on various factors, including the length of time receivables are past due, significant one-time events, the financial health of customers and historical experience. The allowance for credit losses at March 31, 2020, and March 31, 2021, was INR 246 million and INR 475 million (US$ 6.5 million), respectively. Accounts receivable serve as collateral for borrowings under the Company’s working capital facility, described in Note 12.
(i) Property, plant and equipment
Property, plant and equipment represents the costs of completed and operational solar power plants, as well as the cost of furniture and fixtures, vehicles, office and computer equipment, leasehold improvements, freehold land and construction in progress. Construction in progress represents the accumulated cost of solar power plants that have not been placed into service at the date of the balance sheet. Construction in progress includes the cost of solar modules for which the Company has taken legal title, civil engineering, electrical and other related costs incurred during the construction of a solar power plant. Construction in progress is reclassified to property, plant and equipment when the project begins its commercial operations.
Property, plant and equipment are stated at cost, less accumulated depreciation and accumulated impairment losses. Depreciation is calculated using the straight-line method over the assets’ estimated useful lives as follows:
Plant and machinery (solar power plants) | | 25-35 years |
Furniture and fixtures | | 5 years |
Vehicles | | 5 years |
Office equipment | | 1-5 years |
Computers | | 3 years |
Leasehold improvements related to office facilities are depreciated over the shorter of the lease period or the estimated useful life of the improvement. Lease hold improvements on the solar power plant sites are depreciated over the shorter of the lease term or the remaining period of the PPAs undertaken with the respective customer. Freehold land is not depreciated. Construction in progress is not depreciated until it is ready to be used.
F-11
Improvements to property, plant and equipment deemed to extend the useful economic life of an asset are capitalized. Maintenance and repairs that do not improve efficiency or extend the estimated economic life of an asset are expensed as incurred. Additional capacity, if any, added to property plant and equipment is depreciated over the remaining estimated useful live.
Capitalized interest
Interest incurred on funds borrowed to finance construction of solar power plants is capitalized until the plant is ready for its intended use. The amount of interest capitalized during the years ended March 31, 2019, 2020 and 2021 were INR 467 million, INR 355 million and INR 333 million (US$ 4.6 million), respectively.
(j) Accounting for impairment of long-lived assets
The Company periodically evaluates whether events have occurred that would require revision of the remaining useful life of property, plant and equipment and improvements, or render their carrying value not recoverable. If such circumstances arise, the Company uses an estimate of the undiscounted value of expected future operating cash flows to determine whether the long-lived assets are impaired. If the aggregate undiscounted cash flows are less than the carrying amount of the assets, the resulting impairment charge to be recorded is calculated based on the excess of the carrying value of the assets over the fair value of such assets, with the fair value determined based on an estimate of discounted future cash flows, appraisals, or other valuation techniques. Other than as it relates to the planned disposal of the Company’s rooftop business, there were 0 impairment charges related to remaining long-lived assets recognized during the years ended March 31, 2020, and 2021. See also note 23.
(k) Leases and land use rights
In February 2016, the FASB issued ASU 2016-02, Leases (“ASC Topic 842”), to increase transparency and comparability among organizations by recognizing a right-of-use asset and a lease liability on the balance sheet for all leases with terms longer than 12 months and disclosing key information about leasing transactions. Leases are classified as either operating or financing, with such classification affecting the pattern of expense recognition in the income statement. In July 2018, the FASB issued ASU 2018-11, Leases (Topic 842) – Targeted Improvements, which provided an optional transition method to apply the new lease requirements through a cumulative-effect adjustment in the period of adoption.
The Company adopted the guidance effective April 1, 2019 using the modified retrospective approach and elected certain practical expedients permitted under the transition guidance.
The majority of the Company’s leases relate to leasehold land on which the solar power plants are constructed on and leases related to office facilities. The leasehold land related to solar power plants has a lease term ranging between 25 to 35 year which is further extendable on mutual agreement by both lessor and lessee. Where applicable, the company has the consent from the lessors to extend the leases up to 35 years. These leases have rent escalation ranging between 5% to 10%, over the tenure of the lease. All existing leases on the date of adoption of ASC Topic 842, were classified as operating leases as they were concluded at their inception under previous guidance of ASC Topic 840, as permitted by the practical expedient package elected. As the implicit rate in the lease contract is not readily determinable, the company has used its average incremental rate of borrowing for the purposes of the determination of discount rate. The discount rate for operating leases is 10%. The weighted average remaining lease term for operating leases is 30 years.
The results of reporting periods beginning April 1, 2019 are presented in accordance with ASC Topic 842, whereas the prior period amounts are reported in accordance with ASC Topic 840 and have therefore not been reinstated. Upon adoption of ASC Topic 842, and by availing the exemption under the modified retrospective approach, the Company did not have a material impact to consolidated statements of operations and consolidated statements of cash flows. However, the adoption resulted in increasing the assets, by recognizing the Right of Use asset, on consolidated balance sheet by INR 3,182 million (US$ 42.2 million) as well as Lease Liabilities by INR 2,939 million (US$ 38.9 million) and derecognition of historical prepaid rent and land use right balances. During the year ended March 31, 2020 and 2021, the Company recorded lease cost of INR 540 million and INR 502 million (US$ 6.9 million). See Note 18 to the consolidated financial statements.
F-12
On Adoption of ASC 842, all the lease arrangements entered prior to adoption continued to be classified as operating leases. The Company has made an assessment for lease arrangements entered during the year and classified them as operating leases. The Company did 0t have any finance lease during any of the periods presented in the accompanying consolidated financial statements.
The Company is a lessee in several non-cancellable operating leases, primarily for construction of solar power plants and for office facilities.
The Company determines if an arrangement is or contains a lease at contract inception. The Company recognizes a right-of-use (“ROU”) asset and a lease liability at the lease commencement date. For operating leases, the lease liability is initially and subsequently measured at the present value of the unpaid lease payments at the lease commencement date.
Key estimates and judgments include how the Company determines (1) the discount rate it uses to discount the unpaid lease payments to present value, (2) lease term and (3) lease payments.
ASC Topic 842 requires a lessee to discount its unpaid lease payments using the interest rate implicit in the lease or, if that rate cannot be readily determined, its incremental borrowing rate. Generally, the Company cannot determine the interest rate implicit in the lease because it does not have access to the lessor’s estimated residual value or the amount of the lessor’s deferred initial direct costs. Therefore, the Company generally uses its incremental borrowing rate as the discount rate for the lease. The Company’s incremental borrowing rate for a lease is the rate of interest it would have to pay on a collateralized basis to borrow an amount equal to the lease payments under similar terms.
The lease term for all of the Company’s leases includes the non-cancellable period of the lease plus any additional periods covered by either a Company option to extend (or not to terminate) the lease that the Company is reasonably certain to exercise, or an option to extend (or not to terminate) the lease controlled by the lessor.
Lease payments included in the measurement of the lease liability comprise of the following:
| ▪ | Fixed payments, including in-substance fixed payments, owed over the lease term (which includes termination penalties the Company would owe if the lease term assumes Company exercise of a termination option); |
| ▪ | Variable lease payments, if any, that depend on an index or rate, initially measured using the index or rate at the lease commencement date; |
| ▪ | Amounts expected to be payable under a Company-provided residual value guarantee; and |
| ▪ | The exercise price of a Company option to purchase the underlying asset if the Company is reasonably certain to exercise the option. |
The ROU asset is initially measured at cost, which comprises the initial amount of the lease liability adjusted for lease payments made at or before the lease commencement date, plus any initial direct costs incurred less any lease incentives received.
For operating leases, the ROU asset is subsequently measured throughout the lease term at the carrying amount of the lease liability, plus initial direct costs, plus (minus) any prepaid (accrued) lease payments, less the unamortized balance of lease incentives received. Lease expense for lease payments is recognized on a straight-line basis over the lease term.
F-13
ROU assets for operating leases are periodically reduced by impairment losses. The Company uses the long-lived assets impairment guidance in ASC Subtopic 360-10, Property, Plant, and Equipment – Overall, to determine whether a ROU asset is impaired, and if so, the amount of the impairment loss to be recognized. See Note 2(j).
The Company monitors for events or changes in circumstances that require a reassessment of one of its leases. When a reassessment results in the remeasurement of a lease liability, a corresponding adjustment is made to the carrying amount of the corresponding ROU asset unless doing so would reduce the carrying amount of the ROU asset to an amount less than 0. In that case, the amount of the adjustment that would result in a negative ROU asset balance is recorded in the consolidated statements of operations.
Operating lease ROU assets are presented as operating lease right -of -use assets on the consolidated balance sheet. The current portion of operating lease liabilities is included in other current liabilities and the long-term portion is presented separately as operating lease liabilities on the consolidated balance sheet.
The Company has elected not to recognize ROU assets and lease liabilities for short-term leases of warehouses, office, machinery etc. that have a lease term of 12 months or less. The Company recognizes the lease payments associated with its short-term leases as an expense on a straight-line basis over the lease term.
The Company’s corporate office leases generally also include non-lease maintenance services (i.e. common area maintenance). The Company allocates the consideration in the contract to the lease and non-lease maintenance component based on each component’s relative standalone price. The Company determines stand-alone prices for the lease components based on the prices for which other lessors lease similar assets on a stand-alone basis. The Company determines stand-alone prices for the non-lease components (i.e. maintenance services) based on the prices that several suppliers charge for maintenance services for similar assets on a stand-alone basis.
(l) Asset retirement obligations (ARO)
Upon the expiration of the land lease arrangement for solar power plants located on leasehold land, the Company is required to remove the solar power plant and restore the land. The Company records the fair value of the liability for the legal obligation to retire the asset in the period in which the obligation is incurred, which is generally when the asset is constructed. When a new liability is recognized, the Company capitalizes it by increasing the carrying amount of the related long-lived asset, which results in an ARO asset being depreciated over the remaining useful life of the solar power plant. The liability is accreted and expensed to its present expected future value each period based on a credit adjusted risk free interest rate. Upon settlement of the obligation, the Company eliminates the liability and based on the actual cost to retire, may incur a gain or loss.
The Company’s asset retirement obligations were INR 741 million and INR 811 million (US$ 11.1 million) as of March 31, 2020 and 2021, respectively. The accretion expense incurred during the years ended March 31, 2019, 2020 and 2021 was INR 23 million, INR 36 million and INR 42 million (US$ 0.6 million), respectively. The depreciation expense incurred during the years ended March 31, 2019, 2020 and 2021 was INR 10 million, INR 21 million and INR 23 million (US$ 0.3 million), respectively.
During the current year, due to revision of estimates of costs, the carrying amount of the ARO liability is reduced by INR 183 million (US$ 2.5 million) with a corresponding adjustment to the related long-lived asset.
F-14
The movement in liability during the current year as of March 31, 2021 and comparative year is as below:
| | 2020 (INR) | | | 2021 (INR) | | | 2021 (US$) | |
| | (In million) | |
Beginning balance | | | 665 | | | | 741 | | | | 10.1 | |
Addition during the year | | | 40 | | | | 211 | | | | 2.9 | |
Impact of change in estimate | | | — | | | | (183 | ) | | | (2.5 | ) |
Liabilities settled during the year | | | — | | | | — | | | | — | |
Accretion expense during the year | | | 36 | | | | 42 | | | | 0.6 | |
Ending balance | | | 741 | | | | 811 | | | | 11.1 | |
(m) Software
The Company capitalizes certain internal software development cost under the provision of ASC Topic 350-40 Internal-Use Software. As of March 31, 2021, the amount capitalized as software includes the cost of software licenses, as well as related implementation costs, which primarily relate to third party consulting fees. Such license and implementation costs are capitalized and amortized over their estimated useful lives of three years using the straight-line method. On an ongoing basis, the Company assesses the recoverability of its capitalized software intangible assets. Capitalized software costs determined to be unrecoverable are expensed in the period in which the determination is made. As of March 31, 2021, all capitalized software is considered fully recoverable.
(n) Debt financing costs
Financing costs incurred in connection with obtaining construction and term financing loans are deferred and amortized over the term of the respective loan using the effective interest rate method. Amortization of debt financing costs is capitalized during construction and recorded as interest expense in the consolidated statements of operations, following commencement of commercial operations of the respective solar power plants.
Amortization of debt financing costs for the years ended March 31, 2019, 2020 and 2021 was INR 267 million, INR 709 million and INR 369 million (US$ 5.0 million), including debt financing costs written off related to the debt refinancing amounting to INR Nil, INR 271 million and INR 30 million (US$ 0.4 million), respectively. See Note 12.
The carrying value of debt financing costs as on March 31, 2020 and 2021 was INR 1,145 million and INR 1,107 million (US$ 15.1 million). See Note 12.
Further, the Company had debt financing costs of INR 364 million and INR 367 million (US$ 5.0 million) under other assets and other current assets, as on March 31, 2020 and 2021, respectively for facilities not yet drawn. See notes 6 and 9.
(o) Income taxes
Income taxes are recorded under the asset and liability method, as prescribed under ASC Topic 740 Income Taxes, whereby deferred tax assets and liabilities are recognized for the future tax consequences attributable to differences between the financial statement carrying amounts of existing assets and liabilities and their respective tax base. Deferred tax assets and liabilities are measured using enacted tax rates expected to apply to taxable income in the years in which those temporary differences are expected to be recovered or settled.
The Company establishes valuation allowances against its deferred tax assets when it is more likely than not that all or a portion of a deferred tax asset will not be realized.
The computation of tax liabilities involves dealing with uncertainties in the application of complex tax regulations. The Company applies a two-step approach to recognize and measure uncertainty in income taxes in accordance with ASC Topic 740. The first step is to evaluate the tax position for recognition by determining if the weight of available evidence indicates that it is more likely than not that the position will be sustained on audit,
F-15
including resolution of related appeals or litigation processes, if any. The second step is to measure the tax benefit as the largest amount which is more than 50% likely of being realized upon ultimate settlement through March 31, 2021, the Company does not have any unrecognized tax benefits, nor has it recognized any interest or penalties.
During the previous year, the Taxation Laws (Amendment) Act, 2019 brought key changes to corporate tax rates in the Income Tax Act, 1961, which reduced the tax rate for certain subsidiaries within the group to 25.17%. Azure Power India Private Limited and several of its subsidiaries which are claiming tax benefits under section 80-IA of the Income Tax Act had decided not to opt for this lower tax benefit and have continued under the old regime for the fiscal year ended March 31, 2021, the statutory income tax rate as per the Income Tax Act, 1961 ranges between 25.17% to 34.94%, depending on the tax regime chosen by the particular subsidiary. Based on future projection of Azure Power India Private Limited, management has decided to claim a lower tax rate under the new regime from FY 2033-34 onwards.
During the previous year, the above adoption resulted in the remeasurement of deferred tax balances impacted by the change in regime. Deferred tax assets and deferred tax liabilities were reduced by INR 281 million (US$ 3.7 million) and INR 278 million (US$ 3.7 million) respectively having a net impact of INR 3 million (US$ 0.0 million) in the previous year financial statements.
(p) Employee benefits
Defined contribution plan
Eligible employees of the Company in India receive benefits from the Provident Fund, administered by the Government of India, which is a defined contribution plan. Both the employees and the Company make monthly contributions to the Provident Fund equal to a specified percentage of the eligible employees’ salary.
The Company has no further funding obligation under the Provident Fund, beyond the contributions elected or required to be made thereunder. Contributions to the Provident Fund by the Company are charged to expense in the period in which services are rendered by the covered employees and amounted to INR 32 million, INR 37 million and INR 27 million (US$ 0.4 million) for the years ended March 31, 2019, 2020 and 2021, respectively.
Defined benefit plan
Employees in India are entitled to benefits under the Gratuity Act, a defined benefit post-employment plan covering eligible employees of the Company. This plan provides for a lump-sum payment to eligible employees at retirement, death, and incapacitation or on termination of employment, of an amount based on the respective employee’s salary and tenure of employment. As of March 31, 2021, this plan is unfunded.
Current service costs for defined benefit plans are accrued in the period to which they relate. In accordance with ASC Topic 715, Compensation Retirement Benefit- the liability in respect of defined benefit plans is calculated annually by the Company using the projected unit credit method and amounted to INR 34 million and INR 50 million (US$ 0.7 million) as of March 31, 2020 and 2021, respectively. Prior service cost, if any, resulting from an amendment to a plan is recognized and amortized over the remaining period of service of the covered employees. Interest costs for the period ended March 31, 2020 and 2021 were not significant. See also, Note 22.
Compensated absences
The Company recognizes its liabilities for compensated absences in accordance with ASC Topic 710, Compensation-General. The Company accrues the liability for its employee rights to compensated absence in the year in which it is earned.
F-16
(q) Revenue recognition
Sale of power consists of solar energy sold to customers under long term Power Purchase Agreements (PPAs), which generally have a term of 25 years. The Company’s customers are generally the Government of India, power distribution companies and, to a lesser extent, commercial and industrial enterprises.
The Company recognizes revenue on PPAs when the solar power plant generates power and is supplied to the customer in accordance with the respective PPA. The company recognizes revenue each period based on the volume of solar energy supplied to the customer at the price stated in the PPA once the solar energy kilowatts are supplied and collectability is reasonably assured. The solar energy kilowatts supplied by the Company are validated by the customer prior to billing and recognition of revenue. Revenue from the recovery of Safe-guard duties and Goods and Service Tax under the change in law provision are recognized over the PPA period based on terms agreed with customers or unless agreed otherwise. Revenue from the sale of carbon credit emission are recognized at the time of transfer of credits to customers.
The Company adopted “ASC Topic 606” Revenue from Contracts with Customers, being effective for fiscal years, and interim periods within those fiscal years, beginning after December 15, 2017. The Company adopted the guidance effective April 1, 2018 using the modified retrospective approach, which was applied to those contracts which were not completed as of April 1, 2018. Under Topic 606, total consideration for PPAs with scheduled price changes (price escalation in a solar power plant with 50 MWs of operating capacity and price decrease in a solar power plant with 10 MWs of operating capacity) and for significant financing components, is estimated and recognized over the term of the agreement. Price escalations create an unbilled receivable, and the price decreases create deferred revenue. The time value of the significant financing component is recorded as interest expense. The Company uses the discount rate that would be reflected in a separate financing transaction between the entity and its customer at contract inception and recognizes the revenue amount on a straight-line basis over the term of the PPAs, and interest expense using the effective interest rate method. The Company also recognizes incremental costs incurred to obtain a contract in Other Assets in the consolidated balance sheet. These amounts are amortized on a straight-line basis over the term of the PPAs and are included as a reduction to revenue in the consolidated statements of operations.
The Company also records the proceeds received from Viability Gap Funding (‘VGF’) on fulfilment of the underlying conditions as deferred revenue. Such deferred VGF revenue is recognized as sale of power in proportion to the actual sale of solar energy kilowatts during the period to the total estimated sale of solar energy kilowatts during the tenure of the applicable power purchase agreement pursuant to the revenue recognition policy.
Revenue from customers
Revenue from customers, net consists of the following:
| | Year ended March 31, | |
| | 2019 | | | 2020 | | | 2021 | | | 2021 | |
| | (INR) | | | (INR) | | | (INR) | | | (US$) | |
| | (In million) | |
Revenue from Customers: | | | | | | | | | | | | | | | | |
Sale of Power (1) | | | 9,926 | | | | 12,958 | | | | 15,133 | | | | 206.9 | |
Others (2) | | | — | | | | — | | | | 103 | | | | 1.4 | |
Total | | | 9,926 | | | | 12,958 | | | | 15,236 | | | | 208.3 | |
| (1) | Sale of power includes revenue for the recovery of Safe-Guard Duties and Goods and Service Tax, which is linked to generation of Solar units, resulting from the change in law provision of our PPAs, which was recognised for the first time during the year ended March 31, 2021 amounting to INR 381 million (US$ 5.2 million). |
| (2) | Others includes revenue from the sale of carbon credits recognized at the time of transfer of credits to customers. |
F-17
Contract balances
The following table provides information about receivables, unbilled receivables, contract acquisition cost and deferred revenue from customers as at March 31, 2020 and 2021, respectively.
| | As at March 31, | |
| | 2020 | | | 2021 | | | 2021 | |
| | INR | | | INR | | | US$ | |
| | (In million) | |
Current assets | | | | | | | | | | | | |
Accounts receivable, net | | | 4,456 | | | | 4,887 | | | | 66.8 | |
Non-current assets | | | | | | | | | | | | |
Unbilled receivable | | | 196 | | | | 223 | | | | 3.0 | |
Contract acquisition cost | | | 147 | | | | 141 | | | | 1.9 | |
Current liabilities | | | | | | | | | | | | |
Deferred revenue | | | 110 | | | | 110 | | | | 1.5 | |
Non-current liabilities | | | | | | | | | | | | |
Deferred revenue | | | 2,129 | | | | 2,353 | | | | 32.2 | |
Movement in deferred revenue:
| | As at March 31, | |
| | 2020 | | | 2021 | | | 2021 | |
| | INR | | | INR | | | US$ | |
| | (In million) | |
Beginning balance | | | 1,899 | | | | 2,239 | | | | 30.6 | |
Increased as a result of additional cash received against VGF | | | 385 | | | | 236 | | | | 3.2 | |
Deferred revenue recognized | | | 73 | | | | 93 | | | | 1.3 | |
Amount recognized into revenue | | | (118 | ) | | | (105 | ) | | | (1.4 | ) |
Ending balance | | | 2,239 | | | | 2,463 | | | | 33.7 | |
Accounts receivable – from sale of power consist of accrued revenues due under the PPA, based on the sale of power transferred to the customer, generally requiring payment within 30 to 60 days of sale. As per terms of PPA, payment is unconditional once performance obligations have been satisfied and does not contains any future, unsatisfied performance obligation to be included in this disclosure.
(r) Cost of operations (exclusive of depreciation and amortization)
The Company’s cost of operations consists of expenses pertaining to operations and maintenance of its solar power plants. These expenses include payroll and related costs for maintenance staff, plant maintenance, insurance, and if applicable, lease costs etc.
Depreciation expense is not included in cost of operations but is included within “Depreciation and amortization” expense, shown separately in the consolidated statements of operations.
(s) General and administrative expenses
General and administrative expenses include payroll and related costs for corporate, finance and other support staff, including bonus and share based compensation expense, professional fees and other corporate expenses.
(t) Share based compensation
The Company follows guidance under ASC Topic 718, Compensation — Stock Compensation, which requires compensation costs related to share-based transactions, including employee share options, to be recognized in the financial statements based on their fair value. The Company recognizes compensation expense for equity share
F-18
options including Restricted stocks (RSs) net of estimated forfeitures. Forfeitures are estimated at the time of grant and revised, if necessary, in subsequent periods if actual forfeitures differ from those estimates. Share-based compensation is included in general and administrative expenses and recognized in the consolidated statements of operations based on awards ultimately expected to vest, except the cost of services which is initially capitalized by the Company as part of the cost of property, plant and equipment.
The Company recognizes compensation expense for SARs and RSUs based on the fair value of the amount payable to employees in respect of SARs and RSUs, which are settled in cash, with a corresponding increase in liabilities, over the period that the employees unconditionally becomes entitled to the payment. The liability is remeasured at each reporting date and at settlement date based on the fair value of the SARs. Any changes in the fair value of the liability are recognized in consolidated statements of operations, except the cost of services which is initially capitalized by the Company as part of the cost of property, plant and equipment.
The Company has elected to use the Black-Scholes-Merton valuation model to determine the fair value of share-based awards on the date of grant for employee share options with a fixed exercise price and fixed service-based vesting.
The Company has elected to use the Black-Scholes-Merton valuation model to determine the fair value of SARs at each reporting date. The Company uses the market price of its equity share to determine the fair value of the RSUs at each reporting date.
Employee Stock Option and Restricted Stocks
Effective November 2018, the Company revised the exercise price of 692,507 options from US$13.25 to US$ 11.90 per option. The impact to share-based compensation expense on account of the revision in the exercise price is not material. The share-based compensation expense related to share-based compensation is recorded as a component of general and administrative expenses in the Company’s consolidated statements of operations and totaled INR 83 million, INR 17 million and INR 44 million (US$ 0.6 million) for the years ended March 31, 2019, March 31, 2020 and 2021, respectively. The amount of share-based compensation expense capitalized during the year ended March 31, 2020 and 2021 was INR 13 million and INR 8 million (US$ 0.1 million), respectively.
Stock Appreciation Rights
The share-based compensation expense related to SARs is recorded as a component of general and administrative expenses in the Company’s consolidated statements of operations totaled INR 169 million and INR 1,319 million (US$ 18.0 million) for the year ended March 31, 2020 and 2021, respectively. The amount of share-based compensation expense capitalized during the years ended March 31, 2020 and 2021 was INR 104 million and INR Nil, respectively. Refer to Note 21 for details on the Share based compensation.
(u) Assets held-for-sale
Assets and asset disposal group are classified as held-for-sale if their carrying amount will be recovered principally through a sale transaction rather than through continuing use. This condition is regarded as met only when management commits to a plan to sell the asset; the asset is available for immediate sale in its present condition; an active program to locate a buyer and other actions required to complete the plan have been initiated; the sale of the asset is probable within one year; the asset is being actively marketed for sale at a reasonable price in relation to its current fair value; and it is unlikely that significant changes to the plan will be made or that the plan will be withdrawn. Assets and liabilities classified as held-for-sale are measured at lower of their carrying amount and fair value less costs to sell and depreciation (amortization) ceases once the asset is classified as held for sale. See also, Note 23.
F-19
(v) Contingencies
Liabilities for loss contingencies arising from claims, tax assessments, litigation, fines and penalties and other sources are recorded when it is probable that a liability has been incurred and the amount of the assessment and/or remediation can be reasonably estimated. Legal costs incurred with respect to these items are expensed as incurred.
(w) Fair value of financial instruments
ASC Topic 820, Fair Value Measurements and Disclosures -, defines fair value as the price at which an asset could be exchanged or a liability transferred in an orderly transaction between knowledgeable, willing parties in the principal or most advantageous market for the asset or liability. Where available, fair value is based on observable market prices or derived from such prices. Where observable prices or inputs are not available, valuation models are applied. These valuation techniques involve some level of management estimation and judgment, the degree of which is dependent on the price transparency for the instruments or market and the instruments’ complexity.
When considering market participant assumptions in fair value measurements, the following fair value hierarchy distinguishes between observable and unobservable inputs, which are categorized in one of the following levels
• Level 1 inputs: Unadjusted quoted prices in active markets for identical assets or liabilities accessible to the reporting entity at the measurement date.
• Level 2 inputs: Other than quoted prices included in Level 1 inputs that are observable for the asset or liability, either directly or indirectly, for substantially the full term of the asset or liability.
• Level 3 inputs: Unobservable inputs for the asset or liability used to measure fair value to the extent that observable inputs are not available, thereby allowing for situations in which there is little, if any, market activity for the asset or liability at measurement date.
(x) Derivatives and Hedging
In the normal course of business, the Company uses derivative instruments for the purpose of mitigating the exposure from foreign currency fluctuation risks associated with forecasted transactions denominated in certain foreign currencies and to minimize earnings and cash flow volatility associated with changes in foreign currency exchange rates, and not for speculative trading purposes. These derivative contracts are purchased within the Company’s policy and are with counterparties that are highly rated financial institutions.
Contracts designated as Cash Flow Hedge
Cash flow hedge accounting is followed for derivative instruments to mitigate the exchange rate risk on foreign currency denominated debt instruments. Changes in fair value of derivative contracts designated as cash flow hedges are recorded in other comprehensive income/(loss), net of tax, until the hedge transaction occurs. The Company evaluates hedge effectiveness of cash flow hedges at the time a contract is entered into as well as on an ongoing basis or as required. When the relationship between the hedged items and hedging instrument is highly effective at achieving offsetting changes in cashflows attributable to the hedged risk, the Company records in other comprehensive income the entire change in fair value of the designated hedging instrument that is included in the assessment of hedge effectiveness. The cost of the hedge is recorded as an expense over the period of the contract on a straight-line basis.
Fair value hedges: hedging of foreign exchange exposure
Fair value hedge accounting is followed for foreign exchange risk with the objective to reduce the exposure to fluctuations in the fair value of firm commitments due to changes in foreign exchange rates.
Fair value adjustments related to non-financial instruments will be recognized in the hedged item upon recognition and will eventually affect earnings as and when the hedged item is derecognized. Changes in the fair value of derivatives designated and qualifying as fair value hedges, together with any changes in the fair value of the hedged
F-20
firm commitments attributable to the hedged risk, will be recorded in in the consolidated balance sheet. The gain or loss on the hedging derivative in a hedge of a foreign-currency-denominated firm commitment and the offsetting loss or gain on the hedged firm commitment is recognized in earnings in the accounting period, post the recognition of the hedged item in the balance sheet.
Undesignated contracts
Changes in fair value of undesignated derivative contracts are reported directly in earnings along with the corresponding transaction gains and losses on the items being economically hedged. The Company enters into foreign exchange currency contracts to mitigate and manage the risk of changes in foreign exchange rates. These foreign exchange derivative contracts were entered into to hedge the fluctuations in foreign exchange rates for recognized balance sheet items such as the Company’s U.S. dollar denominated borrowings. The Company has not designated the derivative contracts as hedges for accounting purposes. Realized gains (losses) and changes in the fair value of these foreign exchange derivative contracts are recorded in Loss (gain) on foreign currency exchange, net in the consolidated statements of operations. These derivatives are not held for speculative or trading purposes.
(y) Segment information
Operating segments are defined as components of a company about which separate financial information is available that is evaluated regularly by the chief operating decision maker, or decision-making group, in deciding how to allocate resources and in assessing performance. The Company’s chief executive officer is the chief operating decision maker. Based on the financial information presented to and reviewed by the chief operating decision maker in deciding how to allocate the resources and in assessing the performance of the Company, the Company has determined that it has a single operating and reporting segment: Sale of power. The Company’s principal operations, revenue and decision-making functions are located in India.
(z) Non-controlling interest
The non-controlling interest recorded in the consolidated financial statements relates to (i) a 0.83% ownership interest in a subsidiary, a 10MW Gujarat power plant, not held by the Company, (ii) a 49.00% ownership interest in a subsidiary, a 50MW Uttar Pradesh power plant, not held by the Company, (iii) a 0.60% ownership interest in a subsidiary, a 100 MW Telangana power plant, not held by the Company and (iv) 0.01% ownership interest in Azure Power India Private Limited* not held by the Company. As of March 31, 2021, the Company recorded a non-controlling interest amounting to INR 204 million (US$ 2.8 million) including INR 5 million (US$ 0.1 million) of net profit for the year ended March 31, 2021. As of March 31, 2020, the Company recorded a non-controlling interest amounting to INR 199 million including INR 68 million of net loss for the year.
* This remaining ownership by the founders is subject to an arbitration proceeding, refer to note 20.
During March 2019, the Company paid INR 1,474 million (US$ 21.2 million), to purchase a 48.37% ownership interest in a subsidiary, with a 150 MW Punjab project, which was not held by the Company previously.
(aa) Recent accounting pronouncements
In December 2019, the FASB issued ASU 2019-12, Simplifying the Accounting for Income Taxes (“ASU 2019-12”). This ASU eliminates certain exceptions to the general principles in ASC 740, Income Taxes and adds guidance to reduce complexity in accounting for income taxes. The ASU eliminates, inter alia, the general methodology for calculating income taxes in an interim period when a year-to-date loss exceeds the anticipated loss for the year. The ASU requires that an entity reflect the effect of an enacted change in tax laws or rates in the annual effective tax rate computation in the interim period that includes the enactment date. ASU 2019-12 will be effective for the annual periods beginning after December 15, 2020, including interim periods within those fiscal years. Early adoption is permitted. The Company has completed a preliminary assessment for evaluating the impact of the guidance and expects that its adoption will not have a material impact on the Company’s future financial statements.
F-21
In March 2020, the FASB issued ASU 2020-04, "Reference Rate Reform (Topic 848) - Facilitation of the Effects of Reference Rate Reform on Financial Reporting" which provides companies with optional financial reporting alternatives to reduce the cost and complexity associated with the accounting for contracts and hedging relationships affected by reference rate reform. The guidance applies to contracts that:
| – | reference LIBOR or another rate that is expected to be discontinued as a result of rate reform; and |
| – | have modified terms that affect, or have the potential to affect, the amount and timing of contractual cash flows resulting from the discontinuance of the reference rate. |
The amendments in this ASU are effective for all entities as of March 12, 2020 through December 31, 2022.
In addition, in January 2021, the FASB issued ASU 2021-01, “Reference Rate Reform – Scope,” which clarified the scope of ASC 848 relating to contract modifications.
The Company is currently evaluating the impact of the guidance on the Company’s future financial statements.
Other recent accounting pronouncements issued by the FASB (including its Emerging Issues Task Force) and the United States Securities and Exchange Commission did not or are not believed by management to have a material impact on the Company’s present or future financial statements.
(ab) Impact of COVID-19 Pandemic
The Company has considered internal and external information in the preparation of the financial statements including the economic outlook and believes that it has taken into account the possible impact of currently known events arising out of the COVID-19 pandemic. However, the impact assessment of COVID-19 is a continuing process given the uncertainties associated with its nature and duration. The Company will continue to monitor any material changes to future economic conditions.
3. Cash and cash equivalents
Cash and cash equivalents consists of the following:
| | As of March 31, | |
| | 2020 | | | 2021 | | | 2021 | |
| | (INR) | | | (INR) | | | (US$) | |
| | (In million) | |
Bank deposits | | | 2,902 | | | | 1,171 | | | | 16.0 | |
Term deposits | | | 6,890 | | | | 9,936 | | | | 135.8 | |
Total | | | 9,792 | | | | 11,107 | | | | 151.8 | |
4. Restricted cash
Restricted cash consists of the following:
| | As of March 31, | |
| | 2020 | | | 2021 | | | 2021 | |
| | (INR) | | | (INR) | | | (US$) | |
| | (In million) | |
Bank deposits | | | 4,877 | | | | 4,881 | | | | 66.7 | |
Term deposits | | | 848 | | | | 170 | | | | 2.3 | |
| | | 5,725 | | | | 5,051 | | | | 69.0 | |
Restricted cash — current | | | 4,877 | | | | 4,881 | | | | 66.7 | |
Restricted cash — non-current | | | 848 | | | | 170 | | | | 2.3 | |
F-22
5. Accounts receivable
The Company’s accounts receivables are generated by selling energy to customers and are reported net of any allowance for uncollectible accounts. The Company uses ageing analysis, probability of default methods, past facts, significant one-time events, guidelines issued by government authorities, credit rating of customers, current economic conditions and reasonable forecasts that are most relevant in evaluating and estimating the expected credit losses.
The Company writes-off an account receivable in the period that it is deemed uncollectible and records a reduction in the ECL and the balance of the account receivables in the balance sheet.
The Company evaluates the concentration of risk with respect to its accounts receivables as high, due to the limited number of counterparts for its services, being mainly state utilities and government entities. However, the Company does not foresee any significant credit risk attached to receivables from such state utilities/government entities (also refer note 26 below).
The Company analyzed its historical loss information for its accounts receivables and adjusted for forward looking information and determined the following credit loss percentages:
| | March 31, 2021 | |
Ageing of accounts receivables | | Expected Credit Losses % | |
Not Due (including unbilled receivables) | | | 0.73 | % |
0-90 days | | | 2.80 | % |
90-180 days | | | 3.82 | % |
180-365 days | | | 3.99 | % |
Above 365 days | | | 11.79 | % |
The impact on credit risk due to COVID-19 has been additionally considered by the management, wherever required.
| | March 31, 2021 | |
| | (INR) | |
| | Audited | |
Ageing of accounts receivables* | | (In million) | |
Not Due (including unbilled receivables) | | | 2,924 | |
0-90 days | | | 516 | |
90-180 days | | | 388 | |
180-365 days | | | 423 | |
Above 365 days | | | 1,275 | |
Total accounts receivables | | | 5,524 | |
*Includes INR 162 million (US$ 2.2 million) relating to receivables of the Company’s rooftop business classified as Assets held for sale.
Accounts receivable, net consists of the following:
| | As of March 31, | |
| | 2020 | | | 2021 | | | 2021 | |
| | (INR) | | | (INR) | | | (US$) | |
| | (In million) | |
Accounts receivable (1) | | | 4,702 | | | | 5,362 | | | | 73.3 | |
Less: Allowance for doubtful accounts/ credit losses | | | (246 | ) | | | (475 | ) | | | (6.5 | ) |
Total | | | 4,456 | | | | 4,887 | | | | 66.8 | |
F-23
(1) Includes INR 1,394 million and INR 1,558 million (US$ 21.3 million) of unbilled receivables for the year ended March 31, 2020 and 2021, respectively.
Activity for the allowance for doubtful accounts/ credit losses is as follows:
| | As of March 31, | |
| | 2020 | | | 2021 | | | 2021 | |
| | (INR) | | | (INR) | | | (US$) | |
| | (In million) | |
Balance at the beginning of the year | | | 40 | | | | 246 | | | | 3.4 | |
| | | | | | | | | | | | |
Provision for doubtful debts/ expected credit losses (net) | | | 241 | | | | 286 | | | | 3.9 | |
Write offs charged against the allowance | | | (35 | ) | | | (44 | ) | | | (0.6 | ) |
Less: Reclassified as held for sale | | - | | | | (13 | ) | | | (0.2 | ) |
| | | | | | | | | | | | |
Balance at the end of the year | | | 246 | | | | 475 | | | | 6.5 | |
In relation to the Company’s 50 MWs project in Andhra Pradesh, the Andhra Pradesh DISCOM, Southern Power Distribution Company of Andhra Pradesh Ltd (“APSPDCL”) had issued a letter to the Company requesting the reduction of quoted tariff to INR 2.44 per unit as against the PPA rate of 5.89 per unit for solar projects from the date of commissioning and threatened termination of the PPA in case of refusal to accede to such reduction (“Letter”). The Company had challenged the Letter before the High Court at Vijayawada. The High Court vide its judgment dated September 24, 2019 (“Judgment”), whilst quashing the aforesaid Letter, directed DISCOM to approach the Andhra Pradesh Electricity Regulatory Commission (“APERC”) for reduction of tariff by directing DISCOM to make payment of outstanding and future invoices at the “interim” rate of Rs. 2.44/- per unit, until the dispute is resolved by the APERC. Accordingly, the Company has filed a writ appeal challenging the Judgment, whereby the Company has inter alia sought: (i) setting aside of the Judgment to the limited extent of the direction to DICOMS to make payment at the “interim” rate of Rs. 2.44 per unit and the implied blessing granted by the High Court to approach the APERC for reduction of tariff; and (ii) quashing of all actions undertaken by the respondents and/or restrain the respondents from taking any action seeking reduction of tariff under the concluded PPA and/or unilateral alteration of the terms of such PPA, pursuant to the directions in the Judgment, including quashing of the proceedings. Based on a legal opinion obtained by management, the Company is invoicing and recognizing revenue as per the PPA rate since management has assessed that matter is likely to be decided in favor of the Company. Further, the Company has recognized allowance for doubtful debts on this receivable as per the expected credit loss model.
6. Prepaid expenses and other current assets
Prepaid expenses and other current assets consists of the following:
| | As of March 31, | |
| | 2020 | | | 2021 | | | 2021 | |
| | (INR) | | | (INR) | | | (US$) | |
| | (In million) | |
Derivative asset - current (Note 25) | | | 672 | | | | 914 | | | | 12.5 | |
Interest receivable on term deposits | | | 236 | | | | 305 | | | | 4.2 | |
Prepaid debt financing costs | | | - | | | | 367 | | | | 5.0 | |
Balance with statutory authorities | | | 504 | | | | 396 | | | | 5.4 | |
Prepaid bank guarantee charges | | | 88 | | | | 68 | | | | 0.9 | |
Prepaid insurance and other expenses | | | 61 | | | | 82 | | | | 1.1 | |
Advance to suppliers | | | 39 | | | | 44 | | | | 0.6 | |
Other | | | 19 | | | | 14 | | | | 0.2 | |
Total | | | 1,619 | | | | 2,190 | | | | 29.9 | |
F-24
7. Property, plant and equipment, net
Property, plant and equipment, net consists of the following:
| | Estimated | | | As of March 31, | |
| | Useful Life | | | 2020 | | | 2021 | | | 2021 | |
| | (in years) | | | (INR) | | | (INR) | | | (US$) | |
| | (In million) | |
Plant and machinery (solar power plants) | | 25-35 | | | | 90,995 | | | | 101,331 | | | | 1,385.4 | |
Leasehold improvements — solar power plant | | 25-35 | | | | 5,483 | | | | 5,970 | | | | 81.6 | |
Furniture and fixtures | | | 5 | | | | 12 | | | | 13 | | | | 0.2 | |
Vehicles | | | 5 | | | | 69 | | | | 72 | | | | 1.0 | |
Office equipment | | 1-5 | | | | 27 | | | | 38 | | | | 0.5 | |
Computers | | | 3 | | | | 91 | | | | 96 | | | | 1.3 | |
Leasehold improvements — office | | 1-3 | | | | 126 | | | | 147 | | | | 2.0 | |
| | | | | | | 96,803 | | | | 107,667 | | | | 1,472.0 | |
Less: Accumulated depreciation | | | | | | | 9,246 | | | | 11,966 | | | | 163.6 | |
Less: Accumulated impairment | | | | | | | - | | | | 657 | | | | 9.0 | |
| | | | | | | 87,557 | | | | 95,044 | | | | 1,299.4 | |
Freehold land | | | | | | | 2,910 | | | | 3,193 | | | | 43.7 | |
Construction in progress | | | | | | | 5,526 | | | | 10,610 | | | | 145.1 | |
Total | | | | | | | 95,993 | | | | 108,847 | | | | 1,488.2 | |
Depreciation expense on property, plant and equipment was INR 2,114 million, INR 2,808 million and INR 3,165 million (US$ 43.3 million) for the years ended March 31, 2019, 2020 and 2021, respectively. Refer note 23 for impairment recognized and classification of assets held for sale during the current year.
The Company has received government grants for the construction of rooftop projects amounting to INR 34 million and INR 115 million (US$ 1.6 million) for the years ended March 31, 2020 and 2021, respectively. The proceeds from these grants have been recorded as a reduction to the carrying value of the related projects.
8. Software, net
| | Estimated | | As of March 31, | |
| | Useful Life | | 2020 | | | 2021 | | | 2021 | |
| | (in years) | | (INR) | | | (INR) | | | (US$) | |
| | (In million) | |
Software licenses and related implementation costs | | 3 Years | | | 165 | | | | 164 | | | | 2.2 | |
Less: Accumulated amortization | | | | | 110 | | | | 135 | | | | 1.8 | |
Total | | | | | 55 | | | | 29 | | | | 0.4 | |
Aggregate amortization expense for software was INR 23 million, INR 52 million and INR 37 million (US$ 0.5 million) for the years ended March 31, 2019, 2020 and 2021, respectively.
Estimated amortization expense for the years ending March 31, 2022, 2023 and 2024 is INR 24 million, INR 4 million, and INR 1 million respectively.
F-25
9. Other assets
Other assets consist of the following:
| | As of March 31, | |
| | 2020 | | | 2021 | | | 2021 | |
| | (INR) | | | (INR) | | | (US$) | |
| | (In million) | |
Prepaid income taxes | | | 593 | | | | 502 | | | | 6.9 | |
Derivative asset (Note 25) | | | 6,292 | | | | 5,786 | | | | 79.1 | |
Interest receivable on term deposits | | | 95 | | | | 22 | | | | 0.3 | |
Security deposits | | | 411 | | | | 381 | | | | 5.2 | |
Contract acquisition cost | | | 147 | | | | 141 | | | | 1.9 | |
Unbilled receivables | | | 196 | | | | 223 | | | | 3.0 | |
Prepaid debt financing cost | | | 364 | | | | - | | | | - | |
Other | | | 17 | | | | 29 | | | | 0.4 | |
Total | | | 8,115 | | | | 7,084 | | | | 96.8 | |
10. Investment in equity investee
Investment in equity investee, consists of the following:
| | As of March 31, | |
| | 2020 | | | 2021 | | 2021 | |
| | (INR) | | | (INR) | | (US$) | |
| | (In thousand) | |
Investment in associate | | | 26 | | | 26 | | | 0.4 | |
Total | | | 26 | | | 26 | | | 0.4 | |
During the year ended March 31, 2020, Azure Power India Private Limited (“APIPL”) won a tender issued by Solar Energy Corporation of India Limited (SECI) pursuant to which APIPL has agreed to a firm purchase commitment with a solar module manufacturer to procure 2,800 MWs of modules. Pursuant to the terms of the tender, APIPL was required to enter into a joint venture agreement on January 6, 2020 with a third party to establish a manufacturing facility with a capacity of manufacturing 500 MW solar PV modules per annum. Currently, the Company is in the process of agreeing the terms of the PPA with SECI.
Accordingly, the Company had invested INR 0.026 million (US$ 0.0004 million) to acquire 26% of the equity shares in a newly formed company incorporated as part of the joint venture agreement to establish a manufacturing facility (investee) and is committed to further invest 26% of the equity required for construction of the manufacturing facility, and procure modules, in compliance with the terms of the aforementioned tender.
11. Other liabilities
Other current liabilities, consists of the following:
| | As of March 31, | |
| | 2020 | | | 2021 | | | 2021 | |
| | (INR) | | | (INR) | | | (US$) | |
| | (In million) | |
Derivative liability | | | 669 | | | | 961 | | | | 13.1 | |
Provision for employee benefits | | | 14 | | | | 8 | | | | 0.1 | |
Provision for SAR to employees | | | 78 | | | | 95 | | | | 1.3 | |
Payable to statutory authorities | | | 176 | | | | 126 | | | | 1.7 | |
Other payables | | | 1,083 | | | | 737 | | | | 10.3 | |
Total | | | 2,020 | | | | 1,927 | | | | 26.5 | |
F-26
Other non-current liabilities, consists of the following:
| | As of March 31, | |
| | 2020 | | | 2021 | | | 2021 | |
| | (INR) | | | (INR) | | | (US$) | |
| | (In million) | |
Derivative liability | | | 29 | | | | 251 | | | | 3.4 | |
Provision for SAR to employees | | | 201 | | | | 1,122 | | | | 15.0 | |
Provision for gratuity | | | 29 | | | | 46 | | | | 0.6 | |
Provision for compensated absences | | | 30 | | | | 40 | | | | 0.5 | |
Total | | | 289 | | | | 1,459 | | | | 19.5 | |
12. Long term debt
Long term debt, consists of the following:
| | | | | | | | | | | | |
| | As of March 31, | |
| | 2020 | | | 2021 | | | 2021 | |
| | (INR) | | | (INR) | | | (US$) | |
| | (In million) | |
Secured term loans: | | | | | | | | | | | | |
Foreign currency loans | | | 71,944 | | | | 73,200 | | | | 1000.8 | |
Indian rupee loans | | | 16,945 | | | | 21,380 | | | | 292.3 | |
Total debt | | | 88,889 | | | | 94,580 | | | | 1,293.1 | |
Less current portion | | | 2,303 | | | | 4,658 | | | | 63.7 | |
Long-term debt | | | 86,586 | | | | 89,922 | | | | 1,229.4 | |
Foreign currency term loans
5.5% Senior Notes
During the year ended March 31, 2018, Azure Power Energy Limited (one of the subsidiaries of APGL) issued 5.5% US$ denominated Senior Notes (“5.5% Senior Notes” or “Green Bonds”) and raised INR 31,260 million net of discount of INR 9 million at 0.03% and issuance expense of INR 586 million. The discount on issuance of the Green Bonds and the issuance expenses have been recorded as finance cost, using the effective interest rate method and the unamortized balance of such amounts is netted with the carrying value of the Green Bonds. The Green Bonds are listed on the Singapore Exchange Securities Trading Limited (SGX-ST). In accordance with the terms of the issue, the proceeds were used for repayment of project level loans. The interest on the 5.5% Senior Notes are payable on a semi-annual basis and the principal amount is payable in November 2022. As of March 31, 2021, the net carrying value of the Green Bonds was INR 36,519 million (US$ 499.3 million). The Company had guaranteed the principal and interest repayments to the investors; however, the guarantee has been cancelled during the current year on May 7, 2020, upon the Company satisfying certain financial covenants, on the basis of the financial statements for the year ended March 31, 2019. The Green Bonds are secured by a pledge of Azure Power Energy Limited’s shares.
5.65% Senior Notes
During the previous year ended March 31, 2020, Azure Power Solar Energy Private Limited (one of the subsidiaries of APGL) issued 5.65% US$ denominated Senior Notes (“5.65% Senior Notes” or “Green Bonds”) and raised INR 24,400 million net of discount of INR 7 million at 0.03% and issuance expense of INR 397 million. The discount on issuance of the Green Bonds and the issuance expenses have been recorded as finance cost, using the effective interest rate method and the unamortized balance of such amounts is netted with the carrying value of the Green Bonds. The Green Bonds are listed on the Singapore Exchange Securities Trading Limited (SGX-ST).
In accordance with the terms of the issue, the proceeds were used for repayment of project level loans. The interest on the 5.65% Senior Notes are payable on a semi-annual basis and the principal amount is payable in December 2024. As of March 31, 2021, the net carrying value of the Green Bonds was INR 25,413 million (US$ 347.5 million). The Company continues to guarantee the principal and interest repayments to the investors and the guarantee
F-27
shall become ineffective on meeting certain financial covenants. The Green Bonds are secured fixed charge by the Company over the capital stock of Azure Power Solar Energy Private Limited.
Loan from Export Development Canada and Standard Chartered Bank (Singapore) Limited
During the year ended March 31, 2021, the Company borrowed INR 6,931 million (US$ 93.0 million) from Export Development Canada and Standard Chartered Bank (Singapore) Limited. The funds were provided to project SPVs as shareholder loans or through other instrument for capital expenditure or for payment of capital expenditure in respect of various specified projects. These facilities are foreign currency loans and carry an interest rate of LIBOR+Margin of 3.95% and the loan is repayable in 8 half yearly instalments commencing November 2021. The borrowing is collateralized by the shares of project SPVs and a hypothecation/charge over receivables of the Company. The net carrying value of the loan as of March 31, 2021 is INR 6,722 million (US$ 91.9 million).
Indian Rupee Non-Convertible Debentures
During the year ended March 31, 2018, the Company issued Non-Convertible Debentures in one of its subsidiaries and borrowed INR 1,865 million, net of issuance expense of INR 35 million. The debentures carry an interest rate of 12.30% per annum. The debentures are repayable in 11 equalized semi-annual instalments beginning September 2022 until September 2027 and interest payments are payable semi-annually. The issuance expenses are amortized over the term of the contract using the effective interest rate method. As of March 31, 2021, the net carrying value of the Non-Convertible Debentures was INR 1,873 million (US$ 25.6 million).
During the year ended March 31, 2019, the Company issued Non-Convertible Debentures in one of its subsidiaries and borrowed INR 1,478 million, net of issuance expense of INR 22 million which was renewed during the previous year. The debentures carried an interest rate of 10.50% per annum. The debentures were repayable on the expiry of a period of 15 months from the date of allotment and interest payments are payable every three months and commenced December 2019. The Non-Convertible Debentures were collateralized with the shares of nine of the Company’s subsidiaries as per terms of the debentures deed and total assets of one of its subsidiaries with a net carrying value of INR 1,688 million (US$ 22.4 million) and a charge over loans and advances amounting to INR 758 million (US$ 10.0 million) as of March 31, 2020. The loan has been repaid during the current year.
During the year ended March 31, 2019, the Company issued Non-Convertible Debentures in two of its subsidiaries and borrowed INR 548 million, net of issuance expense of INR 14 million. The debentures carry an interest rate of 10.32% per annum. The debentures are repayable on October 2024 and interest payments are payable every three months commencing from April 2019. During the year ended March 31, 2020, the Company issued further Non-Convertible Debentures in four of its subsidiaries and borrowed INR 439 million (US$ 5.8 million), net of issuance expenses of INR 19 million (US$ 0.3 million) under the same facility. The debentures carry an interest rate of 9.85% to 10.87% per annum. The debentures are repayable starting October 2024 and interest payments are payable every three months commencing from March 2020. The issuance expenses are amortized over the term of the contract using the effective interest rate method. The borrowing is collateralized by first ranking pari passu mortgage charge on all immovable and movable properties of related subsidiary within the group with a net carrying value of INR 1,971 million (US$ 26.9 million). As of March 31, 2021, the net carrying value of the Non-Convertible Debentures was INR 993 million (US$ 13.6 million). As of March 31, 2021, the Company was not in compliance with the financial covenants related to this borrowing and had obtained suitable waivers for the non-compliance prior to the issuance of these financial statements. Out of this total debt, INR 864 million (US$ 11.8 million) relates to rooftop business and hence has been classified as liabilities directly associated with assets classified as held for sale. See also note 23.
Project level secured term loans
Foreign currency loans
The net carrying value of the loan as of March 31,2020 was INR 3,059 million (US$ 40.6 million), which was borrowed in foreign currency from Export-Import Bank of the United States (EXIM) for the financing of a 35 MW
F-28
solar power project with NTPC Vidyut Vyapar Nigam Limited. The loan carried a fixed interest rate of 4.07% per annum. The loan was repayable in 36 semi-annual instalments which commenced on August 20, 2013. The borrowing was collateralized by underlying solar power project assets with a net carrying value of INR 2,514 million (US$ 33.3 million) as of March 31, 2020. This loan has been prepaid during the current period.
The net carrying value of the loan of INR 44 million (US$ 0.6 million) as of March 31, 2021 which was borrowed in foreign currency for financing its future rooftop solar power projects and carries a fixed interest rate of 4.42% per annum. The loan is repayable in 54 quarterly instalments which commenced from October 15, 2017. The borrowing is collateralized by the leasehold land, movable/immovable properties and underlying solar power project assets with a net carrying value of INR 46 million (US$ 0.6 million) as of March 31, 2021 and is guaranteed by Azure Power India Private Limited. As of March 31, 2021, the Company was not in compliance with the financial covenants related to this borrowing and had obtained suitable waivers for the non -compliance prior to the issuance of these financial statements. This debt is related to rooftop business and hence has been classified as liabilities directly associated with assets classified as held for sale. See also note 23.
During the year ended March 31, 2019, the Company borrowed INR 552 million, as project level financing for some of its rooftop projects. During the year ended March 31, 2020, the Company further borrowed INR 135 million (US$ 1.8 million) and INR 271 million (US$ 3.6 million) under the same facility. These foreign currency facilities carry an annual interest rate of LIBOR + 2.75%. The facility is repayable starting October 2024 and interest payments are payable every three months commencing from April 2019. The borrowing is collateralized by first ranking pari passu mortgage charge on all immovable and movable properties of the borrower with a net carrying value of INR 1,971 million (US$ 26.9 million). The net carrying value of the loan as of March 31, 2021 is INR 957 million (US$ 13.1 million). As of March 31, 2021, the Company was not in compliance with the financial covenants related to this borrowing and had obtained suitable waivers for the non-compliance prior to the issuance of these financial statements. Out of this total debt, INR 846 million (US$ 11.6 million) relates to rooftop business and hence has been classified as liabilities directly associated with assets classified as held for sale. See also note 23.
Indian rupee loans
The net carrying value of the loan as of March 31, 2021 is INR 437 million (US$ 6.0 million), borrowed for financing of a 5 MW solar power project with NTPC Vidyut Vyapar Nigam Limited, which has been refinanced during the year ended March 31, 2020, from L&T Infra Debt Fund Limited and unamortized carrying value of ancillary cost of borrowing was expensed. The loan carries a fixed rate of 9.70% per annum. The loan is repayable in 49 quarterly instalments commenced December 31, 2019. The borrowing is collateralized by the underlying solar power project assets with a net carrying value of INR 497 million (US$ 6.8 million) as of March 31, 2021 and pledge of 51% shares of the Promoter Company.
The net carrying value of the loan as of March 31, 2021 is INR 75 million (US$ 1.0 million), borrowed for the financing of a 2.5 MW rooftop solar power project. The interest rate as of March 31, 2021 was 12.15% per annum. The loan is repayable in 29 semi-annual instalments which commenced on January 15, 2014. The borrowing is collateralized by first charge on Company's movable and immovable properties of the underlying solar power project assets with a net carrying value of INR 97 million (US$ 1.3 million) as of March 31, 2021 and is guaranteed by Azure Power India Private Limited. This debt is related to rooftop business and hence has been classified as liabilities directly associated with assets classified as held for sale. See also note 23.
The net carrying value of the loan as of March 31, 2021 is INR 1,189 million (US$ 16.3 million), borrowed for financing of a 30 MW solar power project with Chhattisgarh State Power Distribution Company Ltd. The loan was borrowed from a consortium of bank led by Yes Bank, which carries a floating rate of interest at a YES Bank Base Rate plus 1.50% per annum. As of March 31, 2021, the loan carries interest rate of 11.25% per annum. The loan is repayable in 58 quarterly instalments commenced December 2015. The borrowing is collateralized by the underlying solar power project assets with a net carrying value of INR 1,544 million (US$ 21.1 million) as of March 31, 2021.
F-29
The net carrying value of the loan as of March 31, 2021 is INR 2,010 million (US$ 27.5 million), borrowed or financing of a 50 MW solar power project with NTPC Limited. The loan has been refinanced from TATA Capital Financial Services Limited (TCCL) and unamortized carrying value of ancillary cost of borrowing was expensed. The annual floating interest rate is at the TCCL Prime Lending Rate less 8.15%. As of March 31, 2021, the loan carries interest rate of 8.75% per annum. The loan is repayable in 71 quarterly instalments and commenced March 31, 2020. The borrowing is collateralized by a first charge on the Company's movable and immovable properties of the underlying solar power project assets with a net carrying value of INR 2,645 million (US$ 36.2 million) as of March 31, 2021 and the loan had been guaranteed by the corporate guarantee and pledge of 51% shares of Azure Power India Private Limited, the holding company.
The net carrying value of the loan as of March 31, 2020 was INR 427 million (US$ 5.6 million), borrowed from REC Limited (formerly known as Rural Electrification Corporation Limited) (‘REC’) for financing of a 10 MW solar power project with Bangalore Electricity Supply Company Limited. The rate of interest applicable was for a Grade-III borrower for the financing and will reset after 10 years. The floating interest rate was at the REC lending rate. The loan was repayable in 60 quarterly instalments and commenced June 2017. The borrowing was collateralized by the underlying solar power project assets with a net carrying value of INR 581 million (US$ 7.7 million) as of March 31, 2020. This loan has been prepaid during the current period.
The net carrying value of the loan borrowed from Indian Renewable Energy Development Agency Limited (IREDA) for financing a 100 MW solar power project with NTPC Limited as of March 31, 2021 is INR 5,113 million (US$ 69.9 million). The floating interest rate at Grade-II as per IREDA. As of March 31, 2021, the loan carries interest rate of 10.50% per annum. The loan is repayable in 73 quarterly instalments and commenced June 30, 2018. The borrowing is collateralized by the underlying solar power project assets with a net carrying value of INR 5,247 million (US$ 71.7 million) as of March 31, 2021.
During the year ended March 31, 2019 and March 31, 2020, the Company borrowed INR 1,070 million and INR 400 million (US$ 5.3 million), respectively, for financing a 200 MW solar power project from Yes Bank. The annual floating interest rate was at MCLR (Marginal cost of funds-based lending rate) plus 0.55%. The loan was repayable in 74 quarterly instalments and commenced March 2020. The borrowing was collateralized by the underlying under construction solar power project assets with a net carrying value of INR 9,262 million (US$ 122.9 million) as of March 31, 2020. The net carrying value of the loan as of March 31, 2020 was INR 1,399 million (US$ 18.5 million). This loan has been prepaid during the current period.
During the year ended March 31, 2021, the Company borrowed amount of INR 1,734 million (US$ 23.7 million) from Aditya Birla finance Limited and Tata Cleantech Capital Limited for financing of its 200 MW solar project with Solar Energy Corporation of India. The loan was borrowed from a consortium of banks led by Yes Bank, which carries an annual floating rate of interest at a MCLR plus 0.55%. The loan is repayable in 72 quarterly instalments commencing September 2020. The borrowing is collateralized by the underlying solar power project assets with a net carrying value of INR 9,238 million (US$ 126.3 million) as of March 31, 2021. The net carrying value of the loan as of March 31, 2021 is INR 1,572 million (US$ 21.5 million).
During the year ended March 31, 2019, the Company borrowed INR 124 million (US$ 1.8 million) as an External Commercial Borrowings from International Finance Corporation (IFC, a shareholder in the Company) for some of its rooftop projects. These facilities carry an interest rate of 10.74% and interest payments are payable every three months which commenced April 2019. The borrowing is collateralized by first ranking pari paasu mortgage charge on all immovable and movable properties of the borrower with a net carrying value of INR 1,597 million (US$ 21.8 million) as of March 31, 2021. The loan is repayable on October 15, 2024. The net carrying value of the loan as of March 31, 2021 is INR 121 million (US$ 1.6 million). As of March 31, 2021, the Company was not in compliance with the financial covenants related to this borrowing and had obtained suitable waivers for the non-compliance prior to the issuance of these financial statements. This debt is related to rooftop business and hence has been classified as liabilities directly associated with assets classified as held for sale. See also note 23.
During the year ended March 31, 2020 and March 31, 2021, the Company borrowed INR 463 million (US$ 6.1 million) and INR 56 million (US$ 0.8 million) as a project level financing for financing of a 16 MW rooftop solar power project from the State Bank of India (‘SBI’). These facilities carry an annual interest rate of 6 months MCLR +
F-30
1.45%. As of March 31, 2021, the loan carries interest rate of 8.40% per annum. The loan is repayable in 52 quarterly installments commencing June 2020. The borrowing is collateralized by first charge on Company's movable and immovable properties of the underlying solar power project assets with a net carrying value of INR 574 million (US$ 7.8 million) as of March 31, 2021 and pledge of 51% shares of the Promoter company and Corporate Guarantee which shall terminate as per conditions stipulated in the Rupee Term Loan Agreement. The net carrying value of the loan as of March 31, 2021 is INR 441 million (US$ 6.0 million).
During the year ended March 31, 2020 and March 31, 2021, the Company borrowed INR 1,000 million (US$ 13.3 million) and INR 786 million (US$ 10.6 million) from REC Limited (formerly known as Rural Electrification Corporation Limited) (‘REC’) for financing of its 90 MW solar project with Assam Power Distribution Company Limited. The rate of interest shall be applicable for a Grade-III borrower and will reset after 1 year. The floating interest rate is at the REC lending rate. As of March 31, 2021, the loan carries interest rate of 10.65% per annum. The loan is repayable in 204 monthly instalments commencing April 2022. The borrowing is collateralized by the underlying solar power project assets with a net carrying value of INR 2,843 million (US$ 38.9 million) as of March 31, 2021 and pledge of 100% shares held by the Promoter company in the SPV and Corporate Guarantee of the Promoter Company which shall terminate as per conditions stipulated in the Facility Agreement. The net carrying value of the loan as of March 31, 2021 is INR 1,774 million (US$ 24.3 million).
During the year ended March 31, 2021, the Company borrowed an amount of INR 2,560 million (US$ 34.8 million) from L&T Infra Debt Fund Limited for financing of its 35 MW solar project with NTPC Vidyut Vyapar Nigam Limited. These facilities carry an interest rate of 9.60% and the loan is repayable in 52 quarterly instalments commencing June 2020. The borrowing is collateralized by the underlying solar power project assets with a net carrying value of INR 2,411 million (US$ 33.0 million) as of March 31, 2021 and pledge of 92.31% of total equity shares/ preference shares/ Compulsorily convertible debentures (CCDs)/ Non- Convertible debentures (NCDs). The net carrying value of the loan as of March 31, 2021 is INR 2,410 million (US$ 33.0 million).
During the year ended March 31, 2021, the Company borrowed an amount of INR 4,095 million (US$ 56.0 million) from Power Finance Corporation Limited (PFC) for financing of its 600 MW solar project with Solar Energy Corporation of India. The applicable interest rate is 10.30% per annum payable monthly. This interest rate is applicable for Renewable Energy Projects with an Integrated Rating of IR-2, with 3 year reset as per PFC policy. The loan is repayable in 228 monthly instalments commencing November 2021. The borrowing is collateralized by the underlying solar power project assets with a net carrying value of INR 19,283 million (US$ 263.6 million) as of March 31, 2021. The net carrying value of the loan as of March 31, 2021 is INR 4,043 million (US$ 55.3 million).
During the year ended March 31, 2021, the Company borrowed an amount of INR 413 million (US$ 5.6 million) from Kotak Infrastructure Debt Fund Limited for financing of a 10 MW solar power project with Bangalore Electricity Supply Company Limited. The loan is disbursed to refinance the previous lender REC Limited. These facilities carry an interest rate of 8.50% per annum fixed till September 30, 2022 and shall be reset every two years thereafter. The loan is repayable in 54 quarterly instalments commencing December 2020. The borrowing is collateralized by movable and immovable properties of the underlying solar power project assets with a net carrying value of INR 615 million (US$ 8.4 million) as of March 31, 2021, operating working capital and pledge of at least 51% issued equity shares and CCDs of the borrower company. The net carrying value of the loan as of March 31, 2021 is INR 389 million (US$ 5.3 million).
As of March 31, 2021, the Company has unused commitments excluding Rooftop portfolio for long-term financing arrangements amounting to INR 19,055 million (US$ 260.5 million) for solar power projects.
Trade credit
As of March 31, 2021, the Company has multiple buyer’s credit facilities amounting to INR 4,140 million (US$ 56.6 million) jointly from Yes Bank and State bank of India, including INR 2,641 million (US$ 35.0 million) availed during the year ended March 31, 2020, for financing of a 200 MW solar power project with Solar Energy Corporation of India. These facilities carry a floating interest rate of LIBOR+ 0.38%-0.50%, for its solar power projects. The trade credits are required to be repaid in 2.7 -2.8 years from the date of shipment of the products from the suppliers, with semi-annual interest payments.
F-31
As of March 31, 2021, the Company has buyer’s credit facility amounting to INR 295 million (US$ 4.0 million), from Yes bank, for certain of its operational SPV’s, entered during the year ended March 31, 2019. These facilities carry a floating interest rate of six months LIBOR plus 0.8% spread.
As of March 31, 2021, the Company has a buyer’s credit facility amounting to INR 7,428 million (US$ 101.6 million) for one of its under construction SPVs for 600 MW solar power project with Solar Energy Corporation of India, entered during the current period. This facility carries a floating interest rate of six months LIBOR plus spread (45 basis points, 60 basis points or 11 basis points) as applicable.
Short term credit
For the year ended March 31, 2020, the Company entered into a working capital facility in the amount of INR 1,690 million. Borrowings under this facility are repayable within 12 months of disbursement, unless renewed by the lenders thereafter, and the facility will be available until July 2022. The facility bears an interest rate of 10.15% per annum. The Company had repaid INR 709 million as of March 31, 2020 and remaining amounts were repaid during the current year.
For the year ended March 31, 2021, the Company has obtained a short-term loan facility of INR 1,529 million. Borrowings under this facility are repayable within 12 months of disbursement. The facility bears an interest rate of 8.75% per annum, payable monthly. The net carrying value of the loan as of March 31, 2021 is INR 1,516 million (US$ 20.7 million).
Covenants and debt financing costs
These aforementioned borrowings are subject to certain financial and non-financial covenants. Financial covenants include cash flow to debt service, indebtedness to net worth ratio, debt equity ratio and maintenance of debt service balances.
As of March 31, 2021, the Company was in compliance with the financial covenants or remediated the non-compliance prior to the issuance of these financial statements.
Generally, under the terms of the loan agreements entered into by the Company’s project subsidiaries, the project subsidiaries are restricted from paying dividends, if they default in payment of their principal, interest and other amounts due to the lenders under their respective loan agreements. Certain of APGL’s project subsidiaries also may not pay dividends out of restricted cash.
The carrying value of debt financing costs as on March 31, 2020 and 2021 was INR 1,145 million and INR 1,107 million (US$ 15.1 million), respectively, for the above loans, which is amortized over the term of the contract using the effective interest rate method.
Restricted cash
The Company is required to maintain principal and interest, both as defined in the respective agreements, as a reserve with banks specified by the respective lenders. Such amounts, totaling INR 936 million and INR 906 million (US$ 12.4 million) as of March 31, 2020 and March 31, 2021, respectively, are classified as restricted cash on the consolidated balance sheets.
F-32
As of March 31, 2021, the aggregate maturities of long-term debt are as follows:
| | Annual maturities (1) | |
As of March 31, | | INR | | | US$ | |
| | (In million) | |
2022 | | | 4,731 | | | | 64.7 | |
2023 | | | 41,848 | | | | 572.2 | |
2024 | | | 2,964 | | | | 40.5 | |
2025 | | | 28,767 | | | | 393.3 | |
2026 | | | 2,454 | | | | 33.6 | |
Thereafter | | | 14,855 | | | | 203.1 | |
Total: aggregate maturities of long-term debt | | | 95,619 | | | | 1,307.4 | |
Less: carrying value of unamortized debt financing costs | | | (1,039 | ) | | | (14.3 | ) |
Net maturities of long-term debt | | | 94,580 | | | | 1,293.1 | |
Less: current portion of long-term debt | | | (4,658 | ) | | | (63.7 | ) |
Long-term debt | | | 89,922 | | | | 1,229.4 | |
(1) Long term debt (principal) obligations for foreign currency denominated borrowings have been translated to Indian rupees using the closing exchange rate as of March 31, 2021 as per Reserve Bank of India.
13. Income Taxes
The individual entities within the Company file individual tax returns as per the regulations existing in their respective jurisdictions.
The fiscal year under the Indian Income Tax Act ends on March 31. A portion of the Company’s Indian operations qualify for deduction from taxable income because its profits are attributable to undertakings engaged in development of solar power projects under section 80-IA of the Indian Income Tax Act, 1961. This holiday is available for a period of ten consecutive years out of fifteen years beginning from the year in which the Company generates power (“Tax Holiday Period”). However, the exemption is only available to the projects completed on or before March 31, 2017. The Company anticipates that it will claim the aforesaid deduction in the last ten years out of fifteen years beginning with the year in which the Company generates power and when it has taxable income. Accordingly, its current operations are taxable at the applicable tax rates, based on eligibility criteria.
The Company had adopted the provisions of ASC Topic 740 as they relate to uncertain income tax positions. Tax exposures can involve complex issues and may require extended periods to resolve. The Company does not have any uncertain tax positions requiring recognition. The Company reassesses its tax positions in light of changing facts and circumstances, such as the closing of a tax audit, refinement of an estimate, or changes in tax codes. To the extent that the final tax outcome of these matters differs from the amounts recorded, such differences will impact the provision for income taxes in the period in which such determination is made.
The provision (benefit) for income taxes consists of the following:
| | Year ended March 31, | |
| | 2019 | | | 2020 | | | 2021 | | | 2021 | |
| | INR | | | INR | | | INR | | | US$ | |
| | (In million) | |
Current tax expense (1) | | | 128 | | | | 120 | | | | 242 | | | | 3.3 | |
Withholding tax on interest on Inter-Company debt related to green bonds | | | 192 | | | | 258 | | | | 384 | | | | 5.2 | |
Deferred income tax (benefit)/expense | | | (167 | ) | | | 111 | | | | (330 | ) | | | (4.5 | ) |
Total | | | 153 | | | | 489 | | | | 296 | | | | 4.0 | |
F-33
| |
| (1) Current tax on profit before tax. |
Income/(loss) before income taxes is as follows:
| | March 31, | |
| | 2019 | | | 2020 | | | 2021 | | | 2021 | |
| | (INR) | | | (INR) | | | (INR) | | | (US$) | |
| | (In million) | |
Domestic operations | | | 262 | | | | 326 | | | | 8 | | | | 0.1 | |
Foreign operations | | | 29 | | | | (2,174 | ) | | | (3,913 | ) | | | (53.3 | ) |
Total | | | 291 | | | | (1,848 | ) | | | (3,905 | ) | | | (53.2 | ) |
Net deferred income taxes on the consolidated balance sheet is as follows:
| | March 31, | |
| | 2020 | | | 2021 | | | 2021 | |
| | (INR) | | | (INR) | | | (US$) | |
| | (In million) | |
Deferred tax assets | | | 2,422 | | | | 2,836 | | | | 38.8 | |
Less: valuation allowance* | | | (217 | ) | | | (1,088 | ) | | | (14.9 | ) |
Net deferred tax assets | | | 2,205 | | | | 1,748 | | | | 23.9 | |
Deferred tax liability | | | 2,622 | | | | 2,046 | | | | 28.0 | |
* For 2021, the valuation allowance includes INR 741 million relating to the capital loss on rooftop and other assets classified as held for sale. The movement also includes INR 269 million relating to other rooftop assets that are part of the sale agreement which are expected to be settled beyond 12 months.
At March 31, 2021, the Company performed an analysis of the recoverability of the deferred tax asset. Based on the analysis, the Company has concluded that a valuation allowance offsetting the deferred tax assets is required as of March 31, 2021. Change in the valuation allowance for deferred tax assets as of March 31, 2020 and March 31, 2021 is as follows:
| | March 31, | |
| | 2020 | | | 2021 | | | 2021 | |
| | (INR) | | | (INR) | | | (US$) | |
| | (In million) | |
Opening valuation allowance | | | 328 | | | | 217 | | | | 3.0 | |
Movement during the Year* | | | (111 | ) | | | 871 | | | | 11.9 | |
Closing valuation allowance | | | 217 | | | | 1,088 | | | | 14.9 | |
* The movement includes INR 741 million relating to capital loss on rooftop and other asset classified as held for sale. The movement also includes INR 269 million relating to other rooftop assets that are part of the sale agreement which are expected to be settled beyond 12 months.
F-34
The significant components of the net deferred income tax assets and liabilities exclusive of amounts that would not have any tax consequences because they will reverse within the Tax Holiday Period, are as follows:
| | As of March 31, | |
| | 2020 | | | 2021 | | | 2021 | |
| | (INR) | | | (INR) | | | (US$) | |
| | (In million) | |
Deferred tax assets: | | | | | | | | | | | | |
Net operating loss (1) | | | 4,926 | | | | 8,620 | | | | 117.9 | |
Tax on Inter — Company margin | | | 55 | | | | 320 | | | | 4.4 | |
Deferred revenue | | | 377 | | | | 466 | | | | 6.4 | |
Asset retirement obligation | | | 179 | | | | 191 | | | | 2.6 | |
Depreciation and amortization | | | 288 | | | | 102 | | | | 1.4 | |
Minimum alternate tax credit | | | 643 | | | | 612 | | | | 8.4 | |
Other deductible temporary difference | | | 336 | | | | 280 | | | | 3.8 | |
Capital loss on investment in rooftop and other assets | | | - | | | | 741 | | | | 10.1 | |
Valuation allowance* | | | (217 | ) | | | (1,088 | ) | | | (14.9 | ) |
Deferred tax liabilities: | | | | | | | | | | | | |
Depreciation and amortization | | | (6,033 | ) | | | (9,697 | ) | | | (132.6 | ) |
Other comprehensive income | | | (971 | ) | | | (845 | ) | | | (11.5 | ) |
Net deferred tax (liability) asset | | | (417 | ) | | | (298 | ) | | | (4.0 | ) |
| (1) | Includes deferred tax on unabsorbed depreciation that can be carried forward indefinitely for set off as per income tax laws. |
| * | The valuation allowance includes INR 741 million relating to capital loss on rooftop and other asset classified as held for sale. The movement also includes INR 269 million relating to other rooftop assets that are part of the sale agreement which are expected to be settled beyond 12 months. |
APGL, the holding company and two of its subsidiaries incorporated in Mauritius have an applicable income tax rate of 15%. However, the group's significant operations are based in India and are taxable as per the Indian Income Tax Act, 1961. For effective tax reconciliation purposes, the applicable tax rate in India has been considered. The income tax rate differs from the amount computed by applying the statutory income tax rate to loss before income taxes and is as follows:
| | For the Year ended March 31, | |
| | 2019 | | | 2020 | | | 2021 | |
| | Tax (INR) | | | % | | | Tax (INR) | | | % | | | Tax (INR) | | | % | | | US$ | |
| | (In million except for %) | |
Statutory income tax (benefit)/expense | | | 102 | | | | 34.94 | % | | | (646 | ) | | | 34.94 | % | | | (1,365 | ) | | | 34.94 | % | | | (18.7 | ) |
Temporary differences reversing in the Tax Holiday Period | | | 304 | | | | (103.92 | %) | | | (386 | ) | | | 20.88 | % | | | (1,070 | ) | | | 27.40 | % | | | (14.6 | ) |
Impact of changes in tax rate | | | — | | | | — | | | | 3 | | | | (0.16 | %) | | | - | | | | - | | | | - | |
Permanent timing differences | | | 29 | | | | 9.92 | % | | | 1,327 | | | | (71.81 | %) | | | 1,423 | | | | (36.44 | %) | | | 19.4 | |
Valuation allowance created / (reversed) during the year | | | (387 | ) | | | (112.73 | %) | | | (111 | ) | | | 6.03 | % | | | 871 | | | | (22.30 | %) | | | 11.9 | |
Other difference | | | 105 | | | | 224.03 | % | | | 302 | | | | (16.34 | %) | | | 437 | | | | (11.19 | %) | | | 6.0 | |
Total | | | 153 | | | | 52.24 | % | | | 489 | | | | (26.46 | %) | | | 296 | | | | (7.59 | %) | | | (4.0 | ) |
During the year end March 31, 2020, The Taxation Laws (Amendment) Act, 2019 has brought key changes to corporate tax rates in the Income Tax Act, 1961, which reduced the tax rate for certain subsidiaries within the group to 25.17%. Azure Power India Private Limited and several of its subsidiaries which are claiming tax benefits under section 80-IA of the Income Tax Act had decided not to opt for this lower tax benefit and have continued under the old regime For the fiscal year ended March 31, 2021, the statutory income tax rate as per the Income Tax Act, 1961 ranges
F-35
between 25.17% to 34.94%, depending on the tax regime chosen by the particular subsidiary. Based on the future projections of Azure Power India Private Limited, management has decided to claim the lower tax rate under the new regime from FY 2033-34 onwards.
Accordingly, the above adoption resulted in the remeasurement of deferred tax balances impacted by the change in regime. Deferred tax assets and deferred tax liabilities have been reduced by INR 281 million (US$ 3.7 million) and INR 278 million (US$ 3.7 million) respectively having a net impact of INR 3 million (US$ 0.0 million) in the year end March 31, 2020 financial statements.
As of March 31, 2019, 2020, and 2021, deferred income taxes have not been provided for the Company’s share of undistributed net earnings of foreign operations due to management’s intent to reinvest such amounts indefinitely.
14. Interest expense, net
Interest expense, net consists of the following:
| | Year ended March 31, | |
| | 2019 | | | 2020 | | | 2021 | | | 2021 | |
| | (INR) | | | (INR) | | | (INR) | | | (US$) | |
| | (In million) | |
Interest expense: | | | | | | | | | | | | | | | | |
Term loans | | | 5,469 | | | | 7,655 | | | | 8,399 | | | | 114.8 | |
Bank charges and other (1) | | | 485 | | | | 871 | | | | 598 | | | | 8.2 | |
| | | 5,954 | | | | 8,526 | | | | 8,997 | | | | 123.0 | |
Interest income: | | | | | | | | | | | | | | | | |
Term and fixed deposits | | | 932 | | | | 564 | | | | 554 | | | | 7.7 | |
Others | | - | | | - | | | | 33 | | | | 0.5 | |
| | | 932 | | | | 564 | | | | 587 | | | | 8.2 | |
Total | | | 5,022 | | | | 7,962 | | | | 8,410 | | | | 114.8 | |
(1) | Bank charges and other includes amortization of debt financing costs of INR 267 million, INR 709 million and INR 369 million (US$ 5.0 million) for the years ended March 31, 2019, 2020 and 2021, respectively, and includes debt financing costs written off related to the debt refinancing amounting to INR Nil, INR 271 million and INR 30 million (US$ 0.4 million), respectively. |
15. Loss on foreign currency exchange
Loss on foreign currency exchange consists of the following:
| | | | | | | | | | | | | | | | |
| | Year ended March 31, | |
| | 2019 | | | 2020 | | | 2021 | | | 2021 | |
| | (INR) | | | (INR) | | | (INR) | | | (US$) | |
| | (In million) | |
Unrealized loss/ (gain) on foreign currency loans | | | 226 | | | | 258 | | | | (12 | ) | | | (0.2 | ) |
Realized (gain) loss on foreign currency loans | | | (48 | ) | | | 18 | | | | 13 | | | | 0.2 | |
Unrealized loss on derivative instruments | | | 21 | | | | — | | | | — | | | | — | |
Realized loss/ (gain) on derivative instruments | | | 49 | | | | 109 | | | | (1 | ) | | | (0.0 | ) |
Other loss on foreign currency exchange | | | 193 | | | | 127 | | | | 7 | | | | 0.1 | |
Total | | | 441 | | | | 512 | | | | 7 | | | | 0.1 | |
F-36
16. Equity shares
Equity shares
Equity shares have a par value of US$0.000625 per share at APGL. There is no limit on the number of equity shares authorized. As of March 31, 2020, and 2021, there were 47,650,750 and 48,195,962 equity shares issued and outstanding.
| | | | | | | | | | | | | | | | | | |
| | As of March 31, | |
| | 2020 | | | 2020 | | | 2021 | | | 2021 | |
| | Number of shares | | | INR in thousands | | | Number of shares | | | INR in thousands | |
Issued: | | | | | |
Outstanding and fully paid: | | | | | | | | | | | | | | | | |
Equity shares of US$ 0.000625 par value each | | | | | | | | | | | | | | | | |
Beginning balance | | | 41,040,028 | | | | 1,773 | | | | 47,650,750 | | | | 2,065 | |
Issuance of new shares (1) | | | 6,493,506 | | | | 287 | | | | - | | | | - | |
Exercise of ESOPs (2) | | | 117,216 | | | | 5 | | | | 545,212 | | | | 25 | |
Ending balance | | | 47,650,750 | | | | 2,065 | | | | 48,195,962 | | | | 2,090 | |
(1) During the year ended March 31, 2020, the Company made a US$75.0 million private placement and issued 6,493,506 equity shares at US$ 11.55 per share to Caisse de depot et placement du Quebec (CDPQ), a shareholder with an 41.4% holding in the Company prior to the private placement resulting in net proceeds of INR 5,317 million (US$ 70.5 million). The proceeds from the private placement have been invested in AZI.
(2) Refer Note 21 for details of ESOPs exercised during the year.
Accumulated other comprehensive loss
The following represents the changes and balances to the components of accumulated other comprehensive loss:
| | | | | | | | | | | | | | | | |
| | | |
| | Foreign currency translation, net of taxes | | | Cashflow Hedge, net of taxes | | | Unrealized (loss)/gain on Available-for-Sale Securities, net of taxes | | | Total accumulated other comprehensive loss, net of taxes | |
| | (INR) | | | (INR) | | | (INR) | | | (INR) | |
| | (In million) | |
Balance as of March 31, 2018 | | | (528) | | | | 210 | | | | 23 | | | | (295) | |
Adjustments during the year | | | (2,343) | | | | 1,913 | | | | (23) | | | | (453) | |
Balance as of March 31, 2019 | | | (2,871) | | | | 2,123 | | | | — | | | | (748) | |
Adjustments during the year | | | (4,811) | | | | 3,622 | | | | — | | | | (1,189) | |
Balance as of March 31, 2020 | | | (7,682) | | | | 5,745 | | | | — | | | | (1,937) | |
Adjustments during the year | | | 1,600 | | | | (635) | | | | — | | | | 965 | |
Balance as of March 31, 2021 | | | (6,082) | | | | 5,110 | | | | — | | | | (972) | |
Balance as of March 31, 2021 ((US$) (Note 2(d)) | | | (83.2) | | | | 69.9 | | | | — | | | | (13.3) | |
F-37
17. Earnings per share
The Company calculates earnings per share in accordance with FASB ASC Topic 260 Earnings Per Share and FASB ASC Topic 260-10-45 Determining Whether Instruments Granted in Share-Based Payment Transactions Are Participating Securities. Basic and diluted earnings losses per equity share give effect to the change in the number of equity shares of the Company. The calculation of basic earnings per equity share is determined by dividing net profit/loss attributable to APGL equity shareholders by the weighted average number of equity shares outstanding during the respective periods. The potentially dilutive shares, consisting of employee share options have been included in the computation of diluted net earnings per share and the weighted average shares outstanding, except where the result would be anti-dilutive.
Net (loss)/profit per share is presented below:
| | Year ended March 31 | |
| | 2019 | | | 2020 | | | 2021 | | | 2021 | |
| | (INR) | | | (INR) | | | (INR) | | | (US$) | |
| | (amounts in millions, except share and per share data) | |
Net profit / (loss) attributable to APGL equity shareholders (A) | | | 78 | | | | (2,269 | ) | | | (4,206 | ) | | | (57.3 | ) |
Shares outstanding for allocation of undistributed income: | | | | | | | | | | | | | | | | |
Equity shares | | | 41,040,028 | | | | 47,650,750 | | | | 48,195,962 | | | | 48,195,962 | |
Weighted average shares outstanding | | | | | | | | | | | | | | | | |
Equity shares – Basic (B) | | | 33,063,832 | | | | 43,048,026 | | | | 47,979,581 | | | | 47,979,581 | |
Equity shares – Diluted (C) | | | 33,968,127 | | | | 43,048,026 | | | | 47,979,581 | | | | 47,979,581 | |
Net (loss)/profit per share — basic and diluted | | | | | | | | | | | | | | | | |
Equity earnings/(loss) per share – Basic (D=A/B) | | | 2.37 | | | | (52.71 | ) | | | (87.66 | ) | | | (1.20 | ) |
Equity earnings/(loss) per share – Diluted (E=A/C) | | | 2.31 | | | | (52.71 | ) | | | (87.66 | ) | | | (1.20 | ) |
Refer to Note 16 for details of shares issued.
The number of share options outstanding but not included in the computation of diluted earnings per equity share because their effect was antidilutive is 870,065 and 703,708 for years ended March 31, 2020 and 2021, respectively.
18. Leases
The Company has several non-cancellable operating leases, primarily for construction of solar power plants and for office facilities, warehouses, and office space that have a lease term ranging between 3 to 35 years which is further extendable on mutual agreement by both lessor and lessee. The Company has considered the renewal options in determining the lease term to the extent it was reasonably certain to exercise those renewal options and accordingly, associated potential option payments are included as part of lease payments.
The components of lease cost for the year ended March 31, 2020 and March 31, 2021 were as follows:
| | For the year ended March 31, | |
| | 2020 | | | 2021 | | | 2021 | |
| | INR | | | INR | | | US$ | |
| | (In million) | |
Operating lease cost | | | 540 | | | | 502 | | | | 6.9 | |
Short-term lease cost | | | 15 | | | | 13 | | | | 0.2 | |
Total lease cost | | | 555 | | | | 515 | | | | 7.1 | |
F-38
Amounts reported in the consolidated balance sheet as of March 31, 2020 and March 31, 2021 were as follows:
| | As at March 31, | | | As at March 31, | | | As at March 31, | |
| | 2020 | | | 2021 | | | 2021 | |
| | INR | | | INR | | | US$ | |
| | (In million) | |
Non-current assets | | | | | | | | | | | | |
Right-of-use assets | | | 4,434 | | | | 4,214 | | | | 57.6 | |
Non-current liabilities | | | | | | | | | | | | |
Lease liabilities | | | 3,592 | | | | 3,359 | | | | 45.9 | |
Current liabilities | | | | | | | | | | | | |
Lease liabilities | | | 256 | | | | 283 | | | | 3.9 | |
Total operating lease liabilities | | | 3,848 | | | | 3,642 | | | | 49.8 | |
Other information related to leases as of March 31, 2020 and March 31, 2021 was as follows:
| | As at March 31, | | | As at March 31, | | | As at March 31, | |
| | 2020 | | | 2021 | | | 2021 | |
| | INR | | | INR | | | US$ | |
| | (In million) | |
Supplemental cash flow information: | | | | | | | | | | | | |
Cash paid for amounts included in the measurement of lease liabilities | | | 342 | | | | 331 | | | | 4.5 | |
Weighted average remaining lease term | | 31 years | | | 30 years | | | | | |
Incremental borrowing rate | | | 10 | % | | | 10 | % | | | | |
Maturities of lease liabilities under non-cancellable leases as of March 31, 2021 are as follows:
Year ended March 31, 2021 | | Amount (INR) | | | US$ | |
| | (In million) | |
Fiscal 2022 | | | 295 | | | | 4.0 | |
Fiscal 2023 | | | 304 | | | | 4.2 | |
Fiscal 2024 | | | 312 | | | | 4.3 | |
Fiscal 2025 | | | 322 | | | | 4.4 | |
Fiscal 2026 | | | 331 | | | | 4.5 | |
Thereafter | | | 11,804 | | | | 161.4 | |
Total undiscounted lease payments | | | 13,368 | | | | 182.8 | |
Less: Imputed interest | | | 9,726 | | | | 133.0 | |
Total lease liabilities | | | 3,642 | | | | 49.8 | |
19. Commitments, guarantees and contingencies
As of March 31, 2021, the commitments for the purchase of property, plant and equipment were INR 12,931 million (US$ 176.8 million).
The Company issues irrevocable performance bank guarantees in relation to its obligation towards construction and transmission infrastructure of solar power plants as required by the PPA and such outstanding guarantees are INR 5,366 million (US$ 73.4 million) as of March 31, 2021.
F-39
Further, INR 516 million (US$ 7.1 million) is in relation to commissioned plants and INR 10 million (US$ 0.1 million) is bank guarantee towards other commitments. The funds released from maturity/settlement of existing bank guarantees can be used for future operational activities.
The Company issued bank guarantees amounting to INR 906 million (US$ 12.4 million) as of March 31, 2021 to meet its Debt-Service Reserve Account (DSRA) requirements for its outstanding loans.
The Company has obtained guarantees from financial institutions as a part of the bidding process for establishing solar projects amounting to INR 932 million (US$ 12.7 million) as of March 31, 2021. The Company has given term deposits as collateral for those guarantees which are classified as restricted cash on the consolidated balance sheet.
The terms of the PPAs provide for the delivery of a minimum quantum of electricity at fixed prices.
As of March 31, 2021, the Company had received claims from its customers of INR 415 million (US$ 5.7 million) for certain of its Karnataka projects which were completed beyond the contractually agreed dates. The Company had filed an appeal against such demands and had received stay orders from the appellant authorities. During the year ended March 31, 2020, the Company has received a favorable order from the appellate authorities in respect of its 50 MW Karnataka project. Management believes the reason for delay was not attributable to the Company. Further, based on advice from its legal advisors and the facts underlying the Company’s position, management believes that the Company will ultimately not be found liable for these assessments and has not accrued any amount with respect to these matters in its consolidated financial statements.
During the year ended March 31, 2020, the Company received a demand of INR 120 million (US$ 1.6 million), related to services tax assessment through July 31, 2017. The company is contesting the demand and is confident that there should not be a tax outflow related to this claim.
Refer Note 20 for details of arbitration proceedings with the former CEO and Managing Director of the Company and former COO of the Company.
The Company has recently received complaints and several anonymous whistleblower reports, which made various claims against certain of the Company’s Key Managerial Personnel, related to their and the Company’s actions in relation to the acquisition of and use of land in Rajasthan, Assam, and Uttar Pradesh, as well as other corporate actions. The Company, through its Audit Committee, and with the assistance of external counsel and forensic auditors, has undertaken an investigation to determine whether the allegations made in the complaints or contained in the whistleblower reports are substantive. The investigation did not substantiate the allegations made in the complaints or contained in the whistleblower reports. Nevertheless, the Company has determined that a review of certain of its processes is required to ensure continued compliance with its internal policies and procedures.
20. Related Party Disclosures
For the year ended March 31, 2019, the Company incurred rent expense on office facilities and guest house facilities totaling INR 3 million, where the lessors are related to the Ex-CEO and erstwhile COO and director of the Company. As of March 31, 2020, and 2021, the Company did 0t have any security deposits with these lessors. The contract for guest house facilities was cancelled with effect from March 29, 2019.
The Company has certain loan facilities with International Finance Corporation (“IFC”), which is a substantial shareholder of the Company having significant influence. During the year ended March 31, 2020, the Company has drawn INR 262 million (US$ 3.5 million) against these loan facilities, net of repayments and has an outstanding loan against these facilities totaling INR 766 million (US$ 10.2 million) as of March 31, 2020, which includes a current portion of the loan totaling INR 9 million (US$ 0.1 million). During the year ended March 31, 2021, the Company has drawn INR NIL (US$ NIL) against these loan facilities, net of repayments and has an outstanding loan against these facilities totaling INR 757 million (US$ 10.3 million) as of March 31, 2021, which includes a current portion of the loan totaling INR 10 million (US$ 0.1 million). The Company incurred INR 21 million, INR 54 million and INR 78
F-40
million (US$ 1.1 million) of interest expense for the years ended March 31, 2019, 2020 and 2021, respectively. The Company has outstanding interest accrued against these facilities totaling INR 24 million and INR 34 million (US$ 1.6 million) as of March 31, 2020 and 2021, respectively. These loans are also hedged with IFC with outstanding notional amount of US $ 13.4 million as of March 31, 2021 (also see note 12 above).
The Company and its subsidiary, Azure Power India Private Limited, are respondents in arbitration proceedings initiated by the former Chairman, CEO and Managing Director of the Company, Mr. Inderpreet Singh Wadhwa (“IW”) and former COO Mr. H.S Wadhwa (“HSW”), in relation to the purchase price of the shares of IW’s and HSW’s in Azure Power India Private Limited at Singapore International Arbitration Centre (SIAC) with the seat of arbitration in Singapore. The matter is concluded and the award is awaited. Management strongly believes in the merits of the case; however, an unfavorable outcome in these proceedings could potentially have a material adverse effect on the results of operations, cash flows and financial condition. As management believes it will be successful in the arbitration, the Company has not accrued any amount with respect to this arbitration in its consolidated financial statements.
In addition, the Company and its subsidiary Azure Power India Private Limited are respondents to arbitration proceedings initiated by IW in relation to his transition agreement before MCIA. The matter is concluded and the awarded is awaited. We believe in the merits of our case however we cannot ensure the outcome of the proceedings. The claim amount is not significant to the financial position of the Company.
Refer Note 16 for equity shares issued during the previous year to Caisse de depot et placement du Quebec (CDPQ).
21. Share based compensation
The Company has a 2015 Stock Option Plan and 2016 Equity Incentive Plan and as amended on March 31, 2020 (collectively “ESOP Plans”) duly approved by the Board of Directors and had 2,023,744 stock options in the employee stock option pool as of March 31, 2021. Under the ESOP Plans, the Compensation Committee on behalf of Board of Directors (the “Directors”) may from time to time make grants to one or more employees, determined by it to be eligible for participation under the plans.
The Compensation Committee determines which employees are eligible to receive the equity awards, the number of equity awards to be granted, the exercise price, the vesting period and the exercise period. The vesting period will be decided by the Compensation Committee as and when any grant takes place. All options granted under these plans shall vest over a period of 4 years from the date of grant with 25% vesting at the end of year one, 25% vesting at the end of year two, 25% vesting at the end of year three and 25% vesting at the end of year four unless specified otherwise. Shares forfeited by the Company are transferred back to the employee stock pool and shall be available for new grants. During the previous year, due to CDPQ acquiring the majority stake in the company which resulted in a change in the vesting schedule of ESOPs/SARs for certain senior employees from yearly vesting to monthly vesting for the grants made till the date of the event. In addition, for the CEO and COO of the company, one of the tranches vested immediately as per their employment agreements.
Options are deemed to have been issued under these plans only to the extent actually issued and delivered pursuant to a grant. To the extent that a grant lapses or the rights of its grantee terminate, any equity shares subject to such grant are again available for new grants.
The option grant price may be determined by the Compensation Committee and is specified in the option grant. The grant is in writing and specifies the number of options granted the price payable for exercising the options, the date/s on which some or all of the options shall be eligible for vesting, fulfillment of the performance and other conditions, if any, subject to when vesting shall take place and other terms and conditions thereto. The option grant can be exercised only by the employees/ Key Managerial personal (KMP) of the Company.
Employee Stock Option Plan and Restricted Stocks (RS)
Options granted under the plan are exercisable into equity shares of the Company, have a contractual life equal to the shorter of ten years, or July 20, 2025, or July 20, 2027, as the case may be, and vest equitably over four years,
F-41
unless specified otherwise in the applicable award agreement. The Company recognizes compensation cost, reduced by the estimated forfeiture rate, over the vesting period of the option. A summary of share option activity during the years ended March 31, 2020 and March 31, 2021 is set out below:
| | Number of options | | | Weighted average exercise price in INR | |
Options outstanding as of March 31, 2019 | | | 1,493,237 | | | | 726 | |
Granted | | | 25,760 | | | | 918 | |
Exercised | | | (117,216 | ) | | | 129 | |
Forfeited | | | (531,716 | ) | | | 832 | |
Expired | | | - | | | | - | |
Options outstanding as of March 31, 2020 | | | 870,065 | | | | 756 | |
Vested and exercisable as of March 31, 2020 | | | 601,636 | | | | 727 | |
| | Number of options | | | Weighted average exercise price in INR | |
Options outstanding as of March 31, 2020 | | | 870,065 | | | | 756 | |
Granted (1) | | | 443,772 | | | | 1,466 | |
Converted from RSU* | | | 10,920 | | | | - | |
Exercised | | | (545,212 | ) | | | 709 | |
Forfeited | | | (75,837 | ) | | | 861 | |
Expired | | | - | | | | - | |
Options outstanding as of March 31, 2021 | | | 703,708 | | | | 1,217 | |
Vested and exercisable as of March 31, 2021 | | | 231,712 | | | | 852 | |
| (1) | Includes 4,273 RS granted during the year to its Directors. |
* During the year, the Company has converted RSU issued to its Board members into Restricted Shares (RS) at the then current share price on the date of conversion to be settled into equity shares of the Company.
Total options available for grant as of March 31, 2021 was 448,843.
The Black-Scholes-Merton option pricing model includes assumptions regarding dividend yields, expected volatility, expected option term, and risk-free interest rates. The Company estimates expected volatility based on the historical volatility of comparable publicly traded companies for a period that is equal to the expected term of the options because it does not have sufficient history of its own volatility. The risk-free interest rate is based on the yield of relevant time period based on US government bonds in effect at the time of grant for a period commensurate with the estimated expected life. The expected term of options granted is derived using the “simplified” method as allowed under the provisions of ASC Topic 718 due to insufficient historical exercise history data to provide a reasonable basis upon which to estimate expected term.
The fair value of each share option granted to employees/ RS is estimated on the date of grant using the Black- Scholes option-pricing model with the following weighted average assumptions:
| | Year ended March 31, | |
| | 2020 | | | 2021 | |
Dividend yield | | | 0 | % | | | 0 | % |
Expected term (in years) | | 4.2 – 5.7 | | | 3.7 – 7.4 | |
Expected volatility | | 31.1% - 32.1% | | | 34.0% - 45.6% | |
Risk free interest rate | | 0.47% - 0.62% | | | 0.49% - 1.01% | |
F-42
As of March 31, 2020, and 2021, the aggregate intrinsic value of all outstanding options was INR 35 million and INR Nil, respectively.
The share-based compensation expense related to share options (including RS) is recorded as a component of general and administrative expenses in the Company’s consolidated statements of operations and totaled, INR 83 million, INR 17 million and INR 36 million (US$ 0.5 million) for the years ended March 31, 2019, 2020 and 2021, respectively. The amount of share-based compensation expense capitalized during the year ended March 31, 2020 and 2021 was INR 13 million and INR 8 million (US$ 0.1 million), respectively.
Unrecognized compensation cost for unvested options as of March 31, 2021 is INR 204 million (US$ 2.8 million), which is expected to be expensed over a weighted average period of 3.5 years.
The intrinsic value of options exercised during the year ended March 31, 2020, and March 31, 2021 was INR 48 million and INR 35 million (US$ 0.5 million).
During November 2018, the Company repriced the exercise price for 692,507 options, which were previously awarded to certain officers, employees and directors under the ESOP plans from US$ 13.25 to US$ 11.90 per share. All terms and conditions of the eligible options, including the vesting schedule, service condition and other terms remain the same. The impact of the repricing of the options has been considered in the company’s financial statements.
The intrinsic value per option at the date of grant during the years ended March 31, 2020 and 2021 is as follows:
Date of grant | | No. of options granted* | | | Deemed fair value of equity shares (INR) | | | Intrinsic value per option at the time of grant (INR) | | | Valuation used |
July 2, 2019 | | | 13,760 | | | | 778 | | | | — | | | Market price |
March 22, 2020 | | | 12,000 | | | | 1,080 | | | | — | | | Market price |
March 31, 2020 | | | 256,699 | | | | 1,070 | | | | — | | | Market price |
October 01, 2020* | | | 4,273 | | | | 2,320 | | | | — | | | Market price |
March 31, 2021 | | | 182,800 | | | | 2,057 | | | | — | | | Market price |
*Pertains to RSUs converted into RSs at the prevailing market price.
F-43
Stock Appreciation Rights (SARs)
The Company granted incentive compensation in the form of Stock Appreciation Rights (“SARs”), as defined in the Company’s 2016 Equity Incentive Plan, as amended on March 31, 2020, to its CEO and COO. The SARs have been granted in 3 tranches with maturity dates up to financial year March 31, 2028.
A summary of SARs activity during the periods ending March 31, 2020 and 2021 is set out below:
| | Number of SARs | | | Weighted average exercise price in INR | |
SAR outstanding as of March 31, 2019 | | | - | | | | - | |
Granted | | | 1,970,000 | | | | 752 | |
Exercised | | | - | | | | - | |
Forfeited | | | - | | | | - | |
Expired | | | - | | | | - | |
Options outstanding as of March 31, 2020 | | | 1,970,000 | | | | 752 | |
Vested as of March 31, 2020 | | | 350,000 | | | | 722 | |
Exercisable as of March 31, 2020 | | | 200,000 | | | | 722 | |
| | Number of SARs | | | Weighted average exercise price in INR | |
SAR outstanding as of March 31, 2020 | | | 1,970,000 | | | | 752 | |
Granted | | | 80,000 | | | | 2,056 | |
Exercised | | | (175,000 | ) | | | 722 | |
Forfeited | | | - | | | | - | |
Expired | | | - | | | | - | |
Options outstanding as of March 31, 2021 | | | 1,875,000 | | | | 810 | |
Vested as of March 31, 2021 | | | 417,500 | | | | 757 | |
Exercisable as of March 31, 2021 | | | 67,500 | | | | 940 | |
The fair value of each SAR granted to employees is estimated at each reporting date using the Black- Scholes option-pricing model with the following weighted average assumptions:
| | Year ended March 31, | |
| | 2020 | | | 2021 | |
Dividend yield | | | 0 | % | | | 0 | % |
Expected term (in years) | | 4.0 – 7.3 | | | 3.7 – 5.2 | |
Expected volatility | | 27.06% - 34.43% | | | 45.20% - 45.64% | |
Risk free interest rate | | 0.15% - 0.58% | | | 0.63% - 1.01% | |
The share-based compensation expense related to SARs is recorded as a component of general and administrative expenses in the Company’s consolidated statements of operations totaled INR 169 million and INR 1,319 million (US$ 18.0 million) for the year ended March 31, 2020 and 2021, respectively. The amount of share-based compensation expense capitalized during the year ended March 31, 2020 and 2021 was INR 104 million and INR Nil, respectively. The carrying value of the liability recorded for SARs as at March 31, 2020 and 2021 was INR 279 million and INR 1,217 million (US$ 16.3 million), respectively.
F-44
Unrecognized compensation cost for unvested SARs as of March 31, 2021 is INR 1,244 million (US$ 17.0 million), which is expected to be expensed over a weighted average period of 3.8 years.
The fair value per SAR at the date of grant during the year ended March 31, 2021 is as follows:
Date of grant | | No. of SARs granted | | | Deemed fair value of SAR (INR) | | | Vesting period | | Valuation used |
July 18, 2019 | | | 200,000 | | | | 722 | | | February 2020 | | Market price |
July 18, 2019 | | | 1,600,000 | | | | 722 | | | March 31, 2020 to July 31, 2027 | | Market price |
March 30, 2020 | | | 170,000 | | | | 1,069 | | | March 31, 2021 to March 31, 2024 | | Market price |
March 31, 2021 | | | 80,000 | | | | 2,056 | | | March 31, 2022 to March 31, 2025 | | Market price |
Restricted Stock Units (RSUs)
During the year ended March 31, 2020, the Company granted restricted stock units of 10,920 equity shares to be settled into cash to some of its directors, pursuant to Restricted Stock Unit ESOP plans with maturity dates up to February 28, 2021.
A summary of RSUs activity during the periods ending March 31, 2021 is set out below:
| | Number of RSUs | |
RSUs outstanding as of March 31, 2020 | | | 10,920 | |
Granted | | | - | |
Converted to RS* | | | (10,920 | ) |
Exercised | | | - | |
Forfeited | | | - | |
Expired | | | - | |
Options outstanding as of March 31, 2021 | | | - | |
Vested and exercisable as of March 31, 2021 | | | - | |
* During the year, the Company has converted RSU issued to its Board members into Restricted Shares (RS) at the share price on the date of conversion which will be settled into equity shares of the Company.
The share-based compensation expense related to RSUs is recorded as a component of general and administrative expenses in the Company’s consolidated statements of operations totaled INR 5 million and INR 12 million (US$ 0.2 million) for the year ended March 31, 2020 and March 31, 2021, respectively.
22. Post retirement plans
The Company has a defined benefit gratuity plan. Every employee who has completed five years or more of service is entitled to a gratuity on departure at 15 days salary (last drawn salary) for each completed year of service. The Scheme is unfunded and accrued cost is recognized through a provision in the accounts of the company.
F-45
The following table sets forth the changes in projected benefit obligations -
As of March 31
| | 2020 (INR) | | | 2021 (INR) | | | 2021 (US$) | |
| | (In million) | |
Benefit obligation at beginning of year | | | 33 | | | | 34 | | | | 0.5 | |
Service cost | | | 12 | | | | 13 | | | | 0.2 | |
Interest cost | | | 3 | | | | 3 | | | | 0.0 | |
Net actuarial loss (gain) | | | 4 | | | | 16 | | | | 0.2 | |
Benefits paid | | | (17) | | | | (16) | | | | (0.2) | |
Benefit obligation at end of year | | | 34 | | | | 50 | | | | 0.7 | |
Amounts recognized in statement of financial position at March 31 consist of: | | | | | | | | | | | | |
Other non-current liabilities | | | 29 | | | | 47 | | | | 0.6 | |
Other current liabilities | | | 5 | | | | 3 | | | | 0.1 | |
Net amount recognized | | | 34 | | | | 50 | | | | 0.7 | |
| | | | | | | | | |
Components of Net Periodic Benefit Cost (Income)
Net periodic benefit cost (income) for our postretirement benefit plans consisted of the following and is recorded as a component of general and administrative expenses in the Company’s consolidated statement of operations:
Year ended March 31
| | 2020 (INR) | | | 2021 (INR) | | | 2021 (US$) | |
| | (In million) | |
Service Cost | | | 12 | | | | 13 | | | | 0.2 | |
Interest Cost | | | 3 | | | | 3 | | | | 0.0 | |
Amortization of: | | | | | | | | | | | | |
Net actuarial loss (gain) | | | 4 | | | | 16 | | | | 0.2 | |
Net periodic benefit cost (income) | | | 19 | | | | 32 | | | | 0.4 | |
The principal assumptions used in determining gratuity for the Company’s plans are shown below:
Year ended March 31
| | 2020 | | | 2021 | | | |
Discount rate | | | 7.15% | | | | 7.53% | | | |
Salary escalation rate | | | 7.00% | | | | 10.00% | | | |
Employee turnover rate | | | 12.00% | | | | 9.00% | | | |
Retirement age | | | 58 years | | | | 58 years | | | |
F-46
The following estimated payments to the defined benefit plan in future years:
Year ended March 31
| | 2020 (INR) | | | 2021 (INR) | | | 2021 (US$) | |
| | (In million) | |
Within the next | | | | | | | | | | | | |
- 1 year | | | 5 | | | | 3 | | | | 0.0 | |
- 1 and 2 years | | | 4 | | | | 3 | | | | 0.0 | |
- 2 and 3 years | | | 4 | | | | 3 | | | | 0.0 | |
- 3 and 4 years | | | 4 | | | | 4 | | | | 0.1 | |
- 4 and 5 years | | | 5 | | | | 4 | | | | 0.1 | |
- 5 and 10 years | | | 24 | | | | 25 | | | | 0.3 | |
23. Impairment of assets and Assets held for sale
The Company has recognized an impairment loss in relation to the Rooftop Subsidiaries aggregating to INR 3,255 million (US$ 44.5 million) during fiscal year March 31, 2021, as described below:
During fiscal year ended March 31, 2021, we identified certain subsidiaries to sell off on a going concern basis, which currently form part of our Rooftop business. Out of this identified portfolio, subsequent to March 2021, we entered into a contract with Radiance Renewables Pvt. Ltd. (“Radiance”) to sell certain subsidiaries (the “Rooftop Subsidiaries”) with an operating capacity of 153 MW, for INR 5,350 million (US$ 73.1 million), subject to certain purchase price adjustments (the “Rooftop Sale Agreement”). Pursuant to the Rooftop Sale Agreement, Radiance will acquire 100% of the equity ownership of the Rooftop Subsidiaries owned by the Company’s subsidiaries, Azure Power India Pvt. Ltd. and Azure Power Rooftop Pvt. Ltd, as more fully described below.
The sale of Rooftop Subsidiaries having 94.4 MWs operating capacity is expected to be consummated within the next 12 months and accordingly the assets and related liabilities of these subsidiaries are shown as “Assets classified as held for sale” in the consolidated balance sheet at March 31, 2021. The Company has recognized an impairment loss of INR 2,498 million (US$ 34.1 million) in the Consolidated Statement of Operations in this respect, as shown below.
Further, as per the terms of the Rooftop Sale Agreement in respect of the 43.2 MWs operating capacity that are part of the Restricted Groups (as defined in the respective Green Bond Indentures) 48.6% of the equity ownership will be transferred to Radiance on the closing date, and pursuant to the terms of the Green Bond Indentures, the remaining 51.4% may only be transferred post refinancing of our Green Bonds. As the refinancing of our Green Bonds is not anticipated to occur within 12 months, the assets and liabilities of these subsidiaries are not presented as “Assets classified as held for sale” and instead continue to be classified within the respective balance sheet captions at March 31, 2021. There is also a restriction on transfer of equity ownership relating to the 16 MW project with Delhi Jal Board (DJB), wherein 49% of the equity ownership will be transferred to Radiance on closing date, and the remaining 51% will be transferred on or after March 31, 2024. Accordingly, the related assets and liabilities of the DJB 16 MW project are not presented as “Assets classified as held for sale” and instead continue to be classified within the respective balance sheet captions at March 31, 2021.
In the event the sale of the Rooftop Subsidiaries does not occur, the Company must reimburse Radiance the equity value of the assets not transferred along with an 10.5% per annum equity return.
The Company has further identified a subsidiary for sale, on a going concern basis at expected consideration of INR 123 million (US$ 1.7 million). Subsequent to year end, Company has entered into a sale agreement with buyer
F-47
and pursuant there to, 100% of the ownership of this subsidiary was transferred to the buyer on receipt of consideration. The Company has recognized an impairment loss of INR 100 million (US$ 1.4 million) in the Consolidated Statement of Operations in this respect.
The Company has determined that the decision to sell the Rooftop Subsidiaries and the subsequent execution of the Rooftop Sale Agreement are indicators of impairment and therefore the Company has undertaken an impairment assessment for the Rooftop Subsidiaries. Management used the Sale price in the Rooftop Sale Agreement as its best estimate of the recoverable vale of the Rooftop Subsidiaries. The assets and liabilities of the Rooftop Subsidiaries classified as held for sale, together with the calculation of the related impairment loss is shown below.
| | As of March 31, | |
| | | | | 2021 | | | 2021 | |
| | | | | (INR) | | | (US$) | |
| | | | | | | | (Note 2d) | |
Assets | | | | | | | | | | | | |
Current assets: | | | | | | | | | | | | |
Cash and cash equivalents | | | | | | | 290 | | | | 4.0 | |
Restricted cash | | | | | | | 84 | | | | 1.1 | |
Accounts receivable, net | | | | | | | 149 | | | | 2.0 | |
Prepaid expenses and other current assets | | | | | | | 44 | | | | 0.6 | |
Total current assets | | | | | | | 567 | | | | 7.7 | |
Restricted cash | | | | | | | 143 | | | | 2.0 | |
Property, plant and equipment, net | | | | | | | 4,576 | | | | 62.6 | |
Deferred income taxes | | | | | | | 359 | | | | 4.9 | |
Right-of-use assets | | | | | | | 87 | | | | 1.2 | |
Other assets | | | | | | | 23 | | | | 0.3 | |
Total assets (A) | | | | | | | 5,755 | | | | 78.7 | |
Liabilities | | | | | | | | | | | | |
Current liabilities: | | | | | | | | | | | | |
Accounts payable | | | | | | | 13 | | | | 0.2 | |
Current portion of long-term debt | | | | | | | 12 | | | | 0.2 | |
Interest payable | | | | | | | 91 | | | | 1.2 | |
Other liabilities | | | | | | | 159 | | | | 2.2 | |
Total current liabilities | | | | | | | 275 | | | | 3.8 | |
Non-current liabilities: | | | | | | | | | | | | |
Long-term debt | | | | | | | 1,939 | | | | 26.5 | |
Deferred income taxes | | | | | | | 6 | | | | 0.1 | |
Other liabilities | | | | | | | 59 | | | | 0.8 | |
Total liabilities (B) | | | | | | | 2,279 | | | | 31.2 | |
Net Assets (C=A-B) | | | | | | | 3,476 | | | | 47.5 | |
Fair value* (D) | | | | | | | 878 | | | | 12.0 | |
Impairment loss (E=C-D) | | | | | | | 2,598 | | | | 35.5 | |
*Fair value is calculated after adjusting for the expected timing of the proceeds from the sale and other costs related to the Rooftop Sale Agreement amounting to INR 201 million (US$ 2.8 million).
F-48
The impairment loss recorded in relation to the Property, plant and equipment of the Rooftop Subsidiaries not classified as held for sale was INR 657 (US$ 9.0 million), as shown below.
| | As of March 31, | |
| | 2021 | | | 2021 | |
| | (INR) | | | (US$) | |
| | | | | | (Note 2d) | |
Carrying value of Property Plant and Equipment | | | 3,020 | | | 41.3 | |
Fair Value * | | | 2,363 | | | 32.3 | |
Impairment loss | | 657 | | | | 9.0 | |
*Fair value is calculated after adjustment for the expected timing of the proceeds from the sale and other costs related to the Rooftop Sale Agreement amounting to INR 55 million (US$ 0.8 million).
The fair value of consideration related to the rooftop sale includes expected recovery of VGF for INR 463 million (US$ 6.3 million). The Company has undertaken to refund to the purchaser an amount equivalent to 85% of any shortfall in recovery of VGF. Based on the current circumstances, management has assessed that they have complied with the conditions associated with the grant of VGF and hence have determined that the recovery of the VGF is likely.
24. Fair Value Measurements
ASC Topic 820 Fair Value Measurements and Disclosures defines fair value as the price that would be received to sell an asset or paid to transfer a liability in an orderly, hypothetical transaction between market participants at the measurement date. ASC Topic 820 establishes a three-tier value hierarchy of fair value measurement based upon the whether the inputs to that measurement are observable or unobservable. Observable inputs reflect data obtained from independent sources while unobservable inputs reflect the Company’s market assumptions. ASC Topic 820 prioritizes the inputs used in the valuation methodologies in measuring fair value as follows:
Level 1 — Observable inputs that reflect quoted prices (unadjusted) for identical assets or liabilities in active markets.
Level 2 — Includes other inputs that are directly or indirectly observable in the marketplace. Observable inputs, other than Level 1 quoted prices for similar instruments in active markets; quoted prices for similar or identical instruments in markets that are not active; and valuations using models in which all significant inputs are observable in active markets.
Level 3 — Unobservable inputs which are supported by little or no market activity.
The fair value hierarchy also requires an entity to maximize the use of observable inputs and minimize the use of unobservable inputs when measuring fair value.
In accordance with ASC Topic 820, assets and liabilities are to be measured based on the following valuation techniques:
Market approach — Prices and other relevant information generated by market transactions involving identical or comparable assets or liabilities.
Income approach — converting the future amounts based on the market expectations to its present value using the discounting methodology.
Cost approach — Replacement cost method.
F-49
The valuation techniques used by the Company to measure and report the fair value of certain financial assets and liabilities on a recurring basis are as follows;
Foreign exchange derivative contracts
The Company enters into foreign exchange option contracts to hedge fluctuations in foreign exchange rates for recognized balance sheet items such as foreign exchange term loans. The Company mitigates the credit risk of these foreign exchange option contracts by transacting with highly rated counterparties which are major banks. The Company uses valuation models to determine the fair value of the foreign exchange option contracts. The inputs considered include the theoretical value of a call option, the underlying spot exchange rate as of the balance sheet date, the contracted price of the respective option contract, the term of the option contract, the implied volatility of the underlying foreign exchange rates and the risk-free interest rate as of the balance sheet date. The techniques and models incorporate various inputs including the credit worthiness of counterparties, foreign exchange spot and forward rates, interest rate yield curves, forward rate yield curves of the underlying option contracts. The Company classifies the fair value of these foreign exchange option contracts in Level 2 because the inputs used in the valuation model are observable in active markets over the term of the respective option contracts.
| | Fair value measurement at reporting date using |
| | | | | | Quoted Prices | | | | | | |
| | | | | | in Active | | Significant | | | |
| | | | | | Markets for | | Other | | | Significant |
| | As of | | | Identical | | Observable | | | Unobservable |
| | March 31, | | | Assets | | Inputs | | | Inputs |
| | 2020 | | | (Level 1) | | (Level 2) | | | (Level 3) |
Description | | | | | | | | | | | | |
| | (In million) |
Assets | | | | | | | | | | | | |
Current assets | | | | | | | | | | | | |
Forward exchange derivative contracts (INR) | | | 668 | | | - | | | 668 | | | - |
Forward exchange option contracts (INR) | | | 4 | | | - | | | 4 | | | - |
Non-current assets | | | | | | | | | | | | |
Fair valuation of swaps and options (INR) | | | 6,177 | | | - | | | 6,177 | | | - |
Forward exchange derivative contracts (INR) | | | 115 | | | - | | | 115 | | | - |
Total assets (INR) | | | 6,964 | | | - | | | 6,964 | | | - |
Total assets (US$) | | | 92.4 | | | - | | | 92.4 | | | - |
| | | | | | | | | | | | |
| | Fair value measurement at reporting date using |
| | | | | | Quoted Prices | | | | | | |
| | | | | | in Active | | Significant | | | |
| | | | | | Markets for | | Other | | | Significant |
| | As of | | | Identical | | Observable | | | Unobservable |
| | March 31, | | | Assets | | Inputs | | | Inputs |
| | 2020 | | | (Level 1) | | (Level 2) | | | (Level 3) |
Description | | | | | | | | | | | | |
| | (In million) |
Non-current liabilities | | | | | | | | | | | | |
Other Liabilities | | | | | | | | | | | | |
Fair valuation of swaps and forward (INR) | | | 29 | | | - | | | 29 | | | - |
Total Liabilities (INR) | | | 29 | | | - | | | 29 | | | - |
Total Liabilities (US$) | | | 0.4 | | | - | | | 0.4 | | | - |
F-50
| | Fair value measurement at reporting date using |
| | | | | | Quoted Prices | | | | | | |
| | | | | | in Active | | Significant | | | |
| | | | | | Markets for | | Other | | | Significant |
| | As of | | | Identical | | Observable | | | Unobservable |
| | March 31, | | | Assets | | Inputs | | | Inputs |
| | 2021 | | | (Level 1) | | (Level 2) | | | (Level 3) |
Description | | | | | | | | | | | | |
| | (In million) |
Assets | | | | | | | | | | | | |
Current assets | | | | | | | | | | | | |
Forward exchange derivative contracts (INR) | | | 914 | | | - | | | 914 | | | - |
Non-current assets | | | | | | | | | | | | |
Fair valuation of swaps and options (INR) | | | 5,765 | | | - | | | 5,765 | | | - |
Forward exchange derivative contracts (INR) | | | 21 | | | - | | | 21 | | | - |
Total assets (INR) | | | 6,700 | | | - | | | 6,700 | | | - |
Total assets (US$) | | | 91.6 | | | - | | | 91.6 | | | - |
| | | | | | | | | | | | |
| | Fair value measurement at reporting date using |
| | | | | | Quoted Prices | | | | | | |
| | | | | | in Active | | Significant | | | |
| | | | | | Markets for | | Other | | | Significant |
| | As of | | | Identical | | Observable | | | Unobservable |
| | March 31, | | | Assets | | Inputs | | | Inputs |
| | 2021 | | | (Level 1) | | (Level 2) | | | (Level 3) |
Description | | | | | | | | | | | | |
| | (In million) |
Liabilities | | | | | | | | | | | | |
Current liabilities | | | | | | | | | | | | |
Forward exchange derivative contracts | | | 961 | | | - | | | 961 | | | - |
Non-current liabilities | | | | | | | | | | | | |
Other Liabilities | | | | | | | | | | | | |
Fair valuation of swaps and forward (INR) | | | 251 | | | - | | | 251 | | | - |
Total Liabilities (INR) | | | 1,212 | | | - | | | 1,212 | | | - |
Total Liabilities (US$) | | | 16.5 | | | - | | | 16.5 | | | - |
The carrying amount of cash and cash equivalents, including restricted cash, accounts receivable, accounts payables, and other current financial assets and liabilities approximate their fair value largely due to the short-term maturities of these instruments and are classified as level 2. There have been no transfers between categories during the current year.
F-51
The carrying value and fair value of the Company’s fixed rate project financing term loans is as follows:
| | As of March 31, | |
| | 2020 | |
| | Carrying Value | | | Fair Value * | | | | | |
| | (INR) | | | (INR) | | | US$ | |
| | (In million) | |
Fixed rate project financing loans: | | | | | | | | | | | | |
Foreign currency loans | | | 66,428 | | | | 61,856 | | | | 820.5 | |
Indian rupee loans | | | 3,445 | | | | 3,398 | | | | 45.1 | |
| | | | | | | | | | | | |
| | As of March 31, | |
| | 2021 | |
| | Carrying Value | | | Fair Value * | | | | | |
| | (INR) | | | (INR) | | | US$ | |
| | (In million) | |
Fixed rate project financing loans: | | | | | | | | | | | | |
Foreign currency loans | | | 61,993 | | | | 66,255 | | | | 905.9 | |
Indian rupee loans | | | 5,910 | | | | 5,628 | | | | 76.9 | |
The Company uses the yield method to estimate the fair value of fixed rate loans using interest rate change as an input. The carrying amount of the Company’s variable rate project financing terms loans approximate, their fair values due to their variable interest rates.
The carrying value and fair value of the Company’s investment in the Bank of Mauritius notes, classified as held to maturity securities is as follows:
| | As of March 31, | |
| | 2020 | |
| | Carrying Value | | | Fair Value * | | | | | |
| | (INR) | | | (INR) | | | US$ | |
| | (In million) | |
Non-current investments: | | | | | | | | | | | | |
Fixed rate Bank of Mauritius notes | | | 7 | | | | 7 | | | | 0.1 | |
| | | | | | | | | | | | |
| | As of March 31, | |
| | 2021 | |
| | Carrying Value | | | Fair Value * | | | | | |
| | (INR) | | | (INR) | | | US$ | |
| | (In million) | |
Non-current investments: | | | | | | | | | | | | |
Fixed rate Bank of Mauritius notes | | | 7 | | | | 7 | | | | 0.1 | |
The Company uses the yield method to estimate the fair value of fixed rate Bank of Mauritius notes by using interest rate as an input. The carrying amount of the Company’s investment in fixed rate Bank of Mauritius notes approximate, their fair values relative to variable interest rates.
* Fair value measurement at reporting date using significant unobservable inputs (Level 3).
25. Derivative instruments and hedging activities
Option Contracts Undesignated as Hedge
(Gains)/Losses on foreign exchange derivative contracts for the year ended March 31, 2019, 2020 and 2021 aggregated INR 70 million, INR 109 million and INR Nil, respectively.
F-52
Contracts designated as a Cashflow Hedge
The Company hedged the foreign currency exposure risk related to certain intercompany loans denominated in foreign currency through a call spread option with a full swap for coupon payments. The Company also availed trade credit facilities denominated in foreign currencies which were fully hedged through interest rate swaps. The foreign currency forward contracts and options were not entered into for trading or speculative purposes.
The Company documented each hedging relationship and assessed its initial effectiveness on inception date and the subsequent effectiveness was tested as determined at the time of inception of the contract. The gain or loss on the hedge contracts was recorded in accumulated other comprehensive income to the extent the hedge contracts were effective. The gain or loss on the hedge contracts shall be reclassified to interest expense when the coupon payments and principal repayments are made on the related investments. The hedge contracts were effective as of March 31, 2021.
The following table presents outstanding notional amount and balance sheet location information related to foreign exchange derivative contracts as of March 31, 2020 and 2021:
| | As of March 31, 2020 | |
| | Notional | | | Current Liabilities | | | Other Asset | | | Other Assets | | | Current Liabilities | |
| | Amount | | | (Fair value) | | | (Fair value) | | | (Fair value) | | | (Fair value) | |
| | (US$) | | | (INR) | | | (INR) | | | (US$) | | | (US$) | |
| | Audited | |
| | (In million) | |
Forward exchange option contracts | | | 2.6 | | | | - | | | | 4 | | | 0.0 | | | | - | |
Fair valuation of swaps and options | | | 849.7 | | | | - | | | 6177 | | | | 81.9 | | | | - | |
Forward exchange derivative contracts | | | 57.4 | | | | - | | | 115 | | | | 1.5 | | | | - | |
Fair valuation of swaps and forward | | | 13.4 | | | 29 | | | | | | | | - | | | 0.4 | |
| | As of March 31, 2021 | | | | | |
| | Notional Amount | | | Non- Current Liabilities (Fair Value) | | | Prepaid expenses and other current assets (Fair Value) | | | Other Assets (Fair Value) | | | Other Assets (Fair Value) | | | Non- Current Liabilities (Fair Value) | | | Prepaid expenses and other current assets (Fair Value) | |
| | (US$) | | | (INR) | | | (INR) | | | (INR) | | | (US$) | | | (US$) | | | (US$) | |
| | Audited | |
| | (In million) | |
Fair valuation of swaps and options | | 849.7 | | | | - | | | | - | | | | 5,765 | | | | 78.8 | | | | - | | | | - | |
Forward exchange derivative contracts | | 11.2 | | | | - | | | | - | | | | 21 | | | | 0.3 | | | | - | | | | - | |
Fair valuation of swaps and forward | | 94.6 | | | 251 | | | | - | | | | - | | | | - | | | | 3.4 | | | | - | |
Forward exchange derivative contracts | | | 46.1 | | | | - | | | | 38 | | | | - | | | | - | | | | - | | | | 0.5 | |
| | March 31, 2021 | |
| | Notional | | | Current Liabilities | | | Other Assets | | | Current Liabilities | |
| | (US$) | | | (INR) | | | (INR) | | | (US$) | |
| | (In million) | |
Forward exchange derivative contracts | | | 101.4 | | | | 74 | | | | — | | | | 1.0 | |
The company recorded the net fair value of derivative asset of INR 4,047 million and derivative liability of INR 827 million (US$ 11.3 million) in the Other comprehensive income for the year ended March 31, 2020 and 2021, respectively and recorded an expense of INR 1,428 million and INR 1,918 million (US$ 26.2 million) related to the amortization of the cost of the hedge for the year ended March 31, 2020 and 2021, respectively.
F-53
The foreign exchange derivative contracts mature generally over a period of 0.1 – 4.5 years.
Contracts designated as fair value hedge
The Company hedged the exposure to fluctuations in the fair value of firm commitments denominated in foreign currency through forward exchange derivative contracts. Fair value adjustments related to non-financial instruments will be recognized in the hedged item upon recognition and will eventually affect earnings as and when the hedged item is derecognized. Changes in the fair value of derivatives designated and qualifying as fair value hedges, together with any changes in the fair value of the hedged firm commitments attributable to the hedged risk, will be recorded in in the consolidated balance sheet. The gain or loss on the hedging derivative in a hedge of a foreign-currency-denominated firm commitment and the offsetting loss or gain on the hedged firm commitment is recognized in earnings in the accounting period, post the recognition of the hedged item in the balance sheet. The forward exchange derivative contracts were not entered into for trading or speculative purposes.
The foreign exchange derivative contracts mature generally over a period of 1 months – 3 months.
The Company documented each hedging relationship and assessed its initial effectiveness on inception date and the subsequent effectiveness was tested as determined at the time of inception of the contract. The hedge contracts were effective as of March 31, 2021.
| | As of March 31, 2020 |
| | Notional | | | Current Liabilities (Fair value) | | Prepaid expenses and other current assets (Fair value) | | Prepaid expenses and other current assets (Fair value) | | | Current Liabilities (Fair value) |
| | (US$) | | | (INR) | | (INR) | | (US$) | | | (US$) |
| | Audited |
| | (In million) |
Forward exchange derivative contracts | | | 189.6 | | | 669 | | 668 | | 8.9 | | | 8.9 |
| | | | | | | | | | | | | | |
| | As of March 31, 2021 |
| | Notional | | | Current Liabilities (Fair value) | | Prepaid expenses and other current assets (Fair value) | | Prepaid expenses and other current assets (Fair value) | | | Current Liabilities (Fair value) |
| | (US$) | | | (INR) | | (INR) | | (US$) | | | (US$) |
| | Audited |
| | (In million) |
Forward exchange derivative contracts | | | 265.1 | | | 887 | | 876 | | | 12.0 | | | 12.1 |
The company recorded the fair value of derivative asset/liability of INR 669 million and INR 887 million (US$ 12.1 million) as at March 31, 2020 and 2021, respectively and incurred an amount of INR Nil and INR 200 million (US$ 2.7 million) related to acquisition of capital assets during the year ended March 31, 2020 and 2021, respectively.
26. Concentrations of credit risk
Financial instruments that potentially subject the Company to significant concentrations of credit risk consist principally of cash and cash equivalents, restricted cash, accounts receivables and derivative instruments. The Company mitigates the risk of credit losses from financing instruments, other than accounts receivables, by selecting counter parties that are well known Indian or international banks.
F-54
The following customers account for more than 10% of the Company’s accounts receivable and sale of power as of and for the year ended March 31, 2020 and 2021:
| | March 31, 2020 | | | | March 31, 2021 | | |
| | % of Sale | | | | % of Accounts | | | | % of Sale | | | | % of Accounts | | |
Customer Name | | of Power | | | | Receivable | | | | of Power | | | | Receivable * | | |
Solar Energy Corporation of India | | | 19.48 | | % | | | 11.70 | | % | | | 21.47 | | % | | | 13.17 | | % |
Punjab State Power Corporation Limited | | | 15.25 | | % | | | 12.25 | | % | | | 13.46 | | % | | | 11.60 | | % |
NTPC Vidyut Vyapar Nigam Limited | | | 20.70 | | % | | | 10.66 | | % | | | 20.36 | | % | | | 10.54 | | % |
Hubli Electricity Supply Company Limited | | | 5.82 | | % | | | 13.98 | | % | | | 5.08 | | % | | | 9.45 | | % |
Chamundeshwari Electricity Supply Company | | | 4.37 | | % | | | 13.08 | | % | | | 3.62 | | % | | | 14.41 | | % |
Andhra Pradesh Power Coordination Committee | | | 4.01 | | % | | | 12.80 | | % | | | 3.53 | | % | | | 18.32 | | % |
Gujarat Urja Vikas Nigam Limited | | | 11.48 | | % | | | 3.54 | | % | | | 11.17 | | % | | | 3.16 | | % |
* Includes receivables for Rooftop entities
27. Subsequent event
Due to the second wave of infection in the country, several state governments have again had to announce partial lockdowns, subsequent to March 31, 2021. The Company implemented a number of initiatives to ensure business continuity, including ensuring the safety and health of its employees. The situation of the COVID-19 outbreak is very fluid and management is closely monitoring its impact on the Company including, but not limited to the impact on the availability of labor, components and material. Such effects could therefore also have an adverse impact related to timely completion of projects which are under development and related operational and liquidity issues. The impact assessment of COVID-19 is a continuing process given the uncertainties associated with its nature and duration. The Company will continue to monitor any material changes to future economic conditions. Subsequent to the year end the Company has entered into a binding agreement to sell off certain assets. See also note 23.
Subsequent to year end, the Company’s Subsidiary APEL (“Azure Power Energy Limited”) has also elected to redeem the 5.50% Senior Notes (the “Notes”) having aggregate principal amount of US$500,000,000, which were maturing in 2022. APEL has served the notice to the bondholders as on July 20, 2021.
Further, subsequent to the year end, the Supreme Court of India while disposing petition filed under public interest litigation (PIL) aimed at the conservation of two species of birds, the Great Indian Bustard and the Lesser Florican, which are protected species in the states of Rajasthan and Gujarat vide its order dated April 19, 2021 instructed the states to install diverters, as well as the conversion of overhead power lines to underground lines, subject to technical evaluation of such conversion by a committee set up by the Supreme Court in this regard. Further, the conversion of overhead cables into underground power lines, wherever considered feasible by such committee, is to take place within a period of one year. The order mentioned the pass through of portion of such expenses incurred by the Company to the ultimate consumer, subject to approval of the Competent Regulatory Authority. Management has preliminarily assessed that any costs incurred to comply with the said order are likely to be substantially or wholly recoverable by the Company under provisions of change in law and/or force majeure of their respective PPAs. Given the preliminary nature of the order and the ongoing assessment by the aforementioned committee, the Company has not provided any amount for this matter at March 31, 2021.
F-55