Crow Point Global Dividend Plus Fund (GDPIX) Inactive
Filed: 6 Jan 17, 12:00am
UNITED STATES
SECURITIES AND EXCHANGE COMMISSION
Washington, D.C. 20549
FORM N-CSR
CERTIFIED SHAREHOLDER REPORT OF REGISTERED
MANAGEMENT INVESTMENT COMPANIES
Investment Company Act file number: 811-23030
Crow Point Global Dividend Plus Fund
(Exact name of registrant as specified in charter)
| 145 Mason Street, 2nd Floor, Greenwich, CT | 06830 | |
| (Address of principal executive offices) | (Zip code) | |
Gemini Fund Services, LLC 80 Arkay Drive, Ste 110, Hauppauge, NY 11788
(Name and address of agent for service)
Registrant’s telephone number, including area code: 631-470-2619
Date of fiscal year end: 10/31
Date of reporting period: 10/31/16
Item 1. Reports to Stockholders.
| Crow Point Global Dividend Plus Fund | ||
| Annual Report | ||
| October 31, 2016 | ||
| GDPIX | ||
| 1-855-282-1100 | ||
| www.cppfunds.com | ||
| Distributed by Northern Lights Distributors, LLC | ||
| Member FINRA | ||
| This report is authorized for distribution only to shareholders and to others who have received a copy of the Fund’s prospectus. | ||
Dear Shareholder:
Crow Point Global Dividend Plus Fund seeks to provide a level of dividend income which is higher than the global equity markets but with a level of volatility that is lower than the global equity markets. The Fund invests both long and short domestically and internationally, including in developed as well as emerging and frontier markets, and in all industry sectors. The Fund invests long in higher yielding stocks which we also deem to be attractive on a total return basis. Short portfolio consists primarily of stocks which we deem to be unattractive on a total return basis and offer low or no dividends. Our objective in shorting stocks is to reduce market exposures and volatility as well as seek to profit from stocks we hold in negative view. In doing so, we seek to capture more of the market’s upside than the downside and contain volatility. Management of the Fund is guided by bottom-up security selection, rather than top-down country, sector, or other allocations.
Since inception on July 27, 2016, the Fund (NAV) returned (2.68%).
Long portfolio had a strong performance and contributed positively, while the short portfolio detracted from performance. Australia, Japan, and Hong Kong contributed the most to the long portfolio, while the US, UK, and Canada detracted. With respect to the industry sectors, Financials, Energy, and Information Technology contributed the most to the long portfolio, while Telecommunication Services, Utilities, and Healthcare were the biggest detractors. On the short side, the US, China, and Canada were the countries that contributed the most to performance, while Hong Kong, Japan, and Germany detracted. With respect to the industry sectors, Utilities, Healthcare, and Materials contributed the most to the short portfolio, while Information Technology, Financials, and Consumer Staples were the biggest detractors. Biggest individual contributors to the performance of the long portfolio were: Downer EDI Limited (Industrials, Australia), Western Refining, Inc. (Energy, US), and Leidos Holdings, Inc. (Information Technology, US). Biggest individual detractors from the performance of the long portfolio were: R.R. Donnelley & Sons Company (Industrials, US), Seven West Media Limited (Consumer Discretionary, Australia), and Verizon Communications Inc. (Telecommunication Services, US). Biggest individual contributors from the performance of the short portfolio were: G-III Apparel Group, Ltd. (Consumer Discretionary, US), Stericycle, Inc. (Industrials, US), and Houghton Mifflin Harcourt Company (Consumer Discretionary, US). Biggest individual detractors from the performance of the short portfolio were: Topcon Corp. (Information Technology, Japan), Petroleo Brasileiro (Energy, Brazil), and Tingyi Holding Corp. (Consumer Staples, Hong Kong).
Accommodative monetary policy has kept interest rates at historically low levels for an extended period, which have recently begun to rise. Consensus expectation is for a high level of volatility around the yield curve. At the same time, dividend payout ratios continue to be low and cash on corporate balance sheets continue to be high. We believe that equity strategies that rely upon a disciplined, systematic approach to construct a risk-controlled, well-diversified and high-yielding portfolio will be well-positioned to offer attractive alternatives to investors looking for income.
1
We appreciate the opportunity to manage your money and are committed to the harvesting of global market inefficiencies, creating alpha and delivering a high dividend yield in the same disciplined manner that we always have.
Sincerely,
Amit Chandra, Ph.D., CFA
Portfolio Manager
Northern Lights Review Code: 3906-NLD-12/27/2016
2
Crow Point Global Dividend Plus Fund
PORTFOLIO REVIEW (Unaudited)
October 31, 2016
The Fund’s performance figures* for each of the periods ended October 31, 2016, as compared to its benchmark:
| Since Inception** | |
| Crow Point Global Dividend Plus Fund | (2.68)% |
| MSCI AC World Index Net | 3.51% |
| MSCI World Minimum Volatility Index | (4.06)% |
Comparison of the Change in Value of a $10,000 Investment
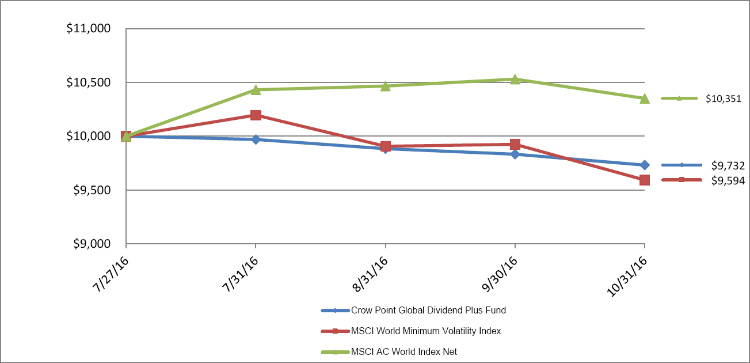
| * | The Performance data quoted is historical. Past performance is no guarantee of future results. Current performance may be higher or lower than the performance data quoted. The principal value and investment return of an investment will fluctuate so that your shares, when redeemed, may be worth more or less than their original cost. Total returns would have been lower had the Advisor not waived its fees and reimbursed a portion of the Fund’s expenses. The Fund’s total gross annual operating expenses, including underlying funds, is 2.63% per the Fund’s June 30, 2016 prospectus. The returns shown do not reflect the deduction of taxes that a shareholder would pay on Fund distributions or on the redemptions of Fund shares. Returns greater than one year are annualized. For performance information current to the most recent month-end, please call 1-855-282-1100. |
| ** | Inception date is July 27, 2016. |
MSCI AC World Index is a free float-adjusted market capitalization weighted index that is designed to measure the equity market performance of developed and emerging markets. Investors can not invest directly in an index.
MSCI World Minimum Volatility Index is a free float-adjusted market capitalization weighted index that is designed to measure the equity market performance of developed markets. Investors can not invest direction in an index.
| Top Ten Holdings by Asset Class or Industry as of October 31, 2016 | % of Net Assets | |||
| Oil & Gas | 10.7 | % | ||
| REITS | 9.7 | % | ||
| Retail | 8.3 | % | ||
| Insurance | 8.0 | % | ||
| Telecommunications | 7.2 | % | ||
| Banks | 7.2 | % | ||
| Electric | 6.8 | % | ||
| Pharmaceuticals | 5.1 | % | ||
| Healthcare-Services | 4.3 | % | ||
| Semiconductors | 3.7 | % | ||
| Other, Cash & Cash Equivalents | 29.0 | % | ||
| 100.0 | % | |||
Please refer to the Portfolio of Investments in this annual report for a detailed analysis of the Fund’s holdings.
3
| Crow Point Global Dividend Plus Fund |
| PORTFOLIO REVIEW (Unaudited)(Continued) |
| October 31, 2016 |
| Top Ten Countries as of October 31, 2016 | % of Total Investments | |||
| United States | 45.5 | % | ||
| Australia | 14.4 | % | ||
| Britain | 8.8 | % | ||
| Japan | 6.0 | % | ||
| France | 4.9 | % | ||
| Indonesia | 2.7 | % | ||
| Hong Kong | 2.6 | % | ||
| South Korea | 2.4 | % | ||
| China | 2.3 | % | ||
| Taiwan | 2.0 | % | ||
| Other Countries | 8.4 | % | ||
| 100.0 | % | |||
The Fund is subject to additional foreign exposure through short sale activity.
Please refer to the Portfolio of Investments in this annual report for a detailed analysis of the Fund’s holdings.
4
| Crow Point Global Dividend Plus Fund |
| PORTFOLIO OF INVESTMENTS |
| October 31, 2016 |
| Shares | Value | |||||||
| COMMON STOCK - 130.8% | ||||||||
| ADVERTISING - 0.6% | ||||||||
| 5,045 | Aimia, Inc. + | $ | 27,291 | |||||
| AEROSPACE / DEFENSE - 1.5% | ||||||||
| 295 | Boeing Co. + | 42,017 | ||||||
| 205 | General Dynamics Corp. + | 30,902 | ||||||
| 72,919 | ||||||||
| AGRICULTURE - 2.4% | ||||||||
| 743 | Archer-Daniels-Midland Co. + | 32,373 | ||||||
| 484 | Japan Tobacco, Inc. + | 18,396 | ||||||
| 1,228 | Universal Corp. + | 66,557 | ||||||
| 117,326 | ||||||||
| AIRLINES - 1.3% | ||||||||
| 736 | American Airlines Group, Inc. + | 29,882 | ||||||
| 1,047 | Japan Airlines Co. Ltd. + | 30,846 | ||||||
| 60,728 | ||||||||
| AUTO MANUFACTURERS - 1.4% | ||||||||
| 978 | Ford Motor Co. + | 11,482 | ||||||
| 1,423 | Nissan Motor Co. Ltd. + | 14,469 | ||||||
| 200 | Renault SA + | 17,344 | ||||||
| 650 | Tata Motors Ltd. + | 25,616 | ||||||
| 68,911 | ||||||||
| AUTO PARTS & EQUIPMENT - 1.3% | ||||||||
| 925 | Exedy Corp. + | 26,328 | ||||||
| 44,353 | Xinyi Glass Holdings Ltd. + | 38,148 | ||||||
| 64,476 | ||||||||
| BANKS - 7.1% | ||||||||
| 89,522 | Bank Negara Indonesia Persero Tbk PT + | 38,250 | ||||||
| 116,674 | Bank of China Ltd. + | 52,358 | ||||||
| 6,219 | Bendigo & Adelaide Bank Ltd. + | 52,671 | ||||||
| 56,453 | China CITIC Bank Corp. Ltd. + | 36,471 | ||||||
| 43,863 | China Construction Bank Corp. + | 32,127 | ||||||
| 3,233 | HSBC Holdings PLC + | 24,322 | ||||||
| 4,530 | Nishi-Nippon Financial Holdings, Inc. * | 45,009 | ||||||
| 2,428 | Regions Financial Corp. + | 26,004 | ||||||
| 624 | Societe Generale SA + | 24,324 | ||||||
| 11,180 | Thanachart Capital PCL + | 12,618 | ||||||
| 344,154 | ||||||||
| BEVERAGES - 1.3% | ||||||||
| 5,917 | Coca-Cola Amatil Ltd. + | 42,954 | ||||||
| 1,197 | Kirin Holdings Co. Ltd. + | 20,589 | ||||||
| 63,543 | ||||||||
| BIOTECHNOLOGY - 0.5% | ||||||||
| 301 | Gilead Sciences, Inc. + | 22,163 | ||||||
| BUILDING MATERIALS - 0.5% | ||||||||
| 544 | Simpson Manufacturing Co., Inc. + | 23,283 | ||||||
| CHEMICALS - 3.5% | ||||||||
| 263 | BASF SE + | 23,151 | ||||||
| 1,527 | Braskem SA - ADR + | 27,104 | ||||||
| 6,085 | Denka Co. Ltd. | 27,621 | ||||||
| 16,200 | Kingboard Chemical Holdings Ltd. + | 47,943 | ||||||
| 503 | LyondellBasell Industries NV + | 40,013 | ||||||
| 165,832 | ||||||||
| COAL - 0.7% | ||||||||
| 281,237 | Adaro Energy Tbk PT + | 34,163 | ||||||
See accompanying notes to financial statements.
5
| Crow Point Global Dividend Plus Fund |
| PORTFOLIO OF INVESTMENTS (Continued) |
| October 31, 2016 |
| Shares | Value | |||||||
| COMMERCIAL SERVICES - 2.9% | ||||||||
| 1,677 | Abertis Infraestructuras SA + | $ | 24,863 | |||||
| 439 | LSC Communications, Inc. * + | 10,641 | ||||||
| 339 | Macquarie Infrastructure Corp. + | 27,734 | ||||||
| 655 | RR Donnelley & Sons Co. + | 11,626 | ||||||
| 2,162 | Western Union Co. + | 43,391 | ||||||
| 21,272 | Zhejiang Expressway Co. Ltd. + | 22,301 | ||||||
| 140,556 | ||||||||
| COMPUTERS - 3.0% | ||||||||
| 309 | International Business Machines Corp. + | 47,490 | ||||||
| 925 | Leidos Holdings, Inc. + | 38,452 | ||||||
| 1,477 | Mentor Graphics Corp. + | 42,685 | ||||||
| 162 | Sopra Steria Group + | 16,455 | ||||||
| 145,082 | ||||||||
| DISTRIBUTION / WHOLESALE - 1.7% | ||||||||
| 2,694 | ITOCHU Corp. + | 34,058 | ||||||
| 1,120 | PALTAC Corp. + | 27,476 | ||||||
| 97 | WW Grainger, Inc. + | 20,188 | ||||||
| 81,722 | ||||||||
| DIVERSIFIED FINANCIAL SERVICES - 3.5% | ||||||||
| 1,863 | Ellington Financial LLC - MLP + | 29,547 | ||||||
| 10,991 | Genworth Mortgage Insurance Ltd. + | 25,593 | ||||||
| 667 | KB Financial Group, Inc. - ADR + | 24,666 | ||||||
| 859 | Macquarie Group Ltd. + | 52,162 | ||||||
| 2,803 | Navient Corp. + | 35,822 | ||||||
| 167,790 | ||||||||
| ELECTRIC - 6.8% | ||||||||
| 558 | Avangrid, Inc. + | 21,991 | ||||||
| 1,690 | Capital Power Corp. + | 26,039 | ||||||
| 101,738 | China Power International Development Ltd. + | 37,128 | ||||||
| 1,626 | Cia Paranaense de Energia - ADR + | 18,553 | ||||||
| 6,719 | Enel SpA + | 28,872 | ||||||
| 1,840 | Enersis Americas SA - ADR + | 15,953 | ||||||
| 477 | Entergy Corp. + | 35,145 | ||||||
| 1,052 | Exelon Corp. + | 35,842 | ||||||
| 899 | Korea Electric Power Corp. - ADR + | 19,607 | ||||||
| 557 | Public Service Enterprise Group, Inc. + | 23,439 | ||||||
| 7,574 | REN - Redes Energeticas Nacionais SGPS SA + | 22,102 | ||||||
| 2,219 | SSE PLC + | 43,101 | ||||||
| 327,772 | ||||||||
| ELECTRICAL COMPONENTS & EQUIPMENT - 1.4% | ||||||||
| 642 | Energizer Holdings, Inc. + | 29,859 | ||||||
| 26,049 | Xinjiang Goldwind Science & Technology Co. Ltd. + | 36,009 | ||||||
| 65,868 | ||||||||
| ELECTRONICS - 1.0% | ||||||||
| 4,098 | AU Optronics Corp. + | 15,490 | ||||||
| 913 | Kuroda Electric Co. Ltd. + | 17,767 | ||||||
| 2,506 | Venture Corp. Ltd. + | 17,104 | ||||||
| 50,361 | ||||||||
| ENERGY-ALTERNATE SOURCES - 0.4% | ||||||||
| 155,369 | GCL-Poly Energy Holdings Ltd. + | 21,037 | ||||||
| ENGINEERING & CONSTRUCTION - 3.4% | ||||||||
| 13,950 | Carillion PLC + | 42,766 | ||||||
| 15,178 | Downer EDI Ltd. + | 67,335 | ||||||
| 2,328 | Kyowa Exeo Corp. + | 35,003 | ||||||
| 942 | Skanska AB + | 20,486 | ||||||
| 165,590 | ||||||||
| ENTERTAINMENT - 0.4% | ||||||||
| 666 | International Game Technology PLC + | 19,128 | ||||||
See accompanying notes to financial statements.
6
| Crow Point Global Dividend Plus Fund |
| PORTFOLIO OF INVESTMENTS (Continued) |
| October 31, 2016 |
| Shares | Value | |||||||
| FOOD - 3.4% | ||||||||
| 1,051 | Axfood AB + | $ | 16,450 | |||||
| 856 | Bakkafrost P/F | 35,956 | ||||||
| 1,180 | Cencosud SA + | 11,670 | ||||||
| 468 | Kesko OYJ + | 23,230 | ||||||
| 26,539 | Sonae SGPS SA + | 21,092 | ||||||
| 410 | Sysco Corp. + | 19,728 | ||||||
| 482 | Tyson Foods, Inc. + | 34,150 | ||||||
| 162,276 | ||||||||
| FOREST PRODUCTS & PAPER - 2.1% | ||||||||
| 2,633 | Fibria Celulose SA - ADR + | 21,011 | ||||||
| 520 | Holmen AB + | 17,822 | ||||||
| 874 | International Paper Co. + | 39,356 | ||||||
| 1,051 | UMP-Kymmene Oyj + | 24,425 | ||||||
| 102,614 | ||||||||
| GAS - 1.2% | ||||||||
| 1,638 | CenterPoint Energy, Inc. + | 37,346 | ||||||
| 1,448 | National Grid PLC | 18,828 | ||||||
| 56,174 | ||||||||
| HEALTHCARE-PRODUCTS - 0.5% | ||||||||
| 453 | Masimo Corp. * + | 24,915 | ||||||
| HEALTHCARE-SERVICES - 4.3% | ||||||||
| 416 | Aetna, Inc. + | 44,658 | ||||||
| 392 | HCA Holdings, Inc. * + | 30,000 | ||||||
| 776 | Healthsouth Corp. + | 31,156 | ||||||
| 940 | RHOEN-KLINIKUM AG + | 26,127 | ||||||
| 1,777 | Sonic Healthcare Ltd. + | 27,707 | ||||||
| 355 | UnitedHealth Group, Inc. + | 50,172 | ||||||
| 209,820 | ||||||||
| HOME BUILDERS - 2.2% | ||||||||
| 8,342 | Crest Nicholson Holdings PLC + | 41,442 | ||||||
| 2,337 | Galliford Try PLC + | 34,981 | ||||||
| 797 | Persimmon PLC + | 16,484 | ||||||
| 8,574 | Taylor Wimpey PLC + | 14,833 | ||||||
| 107,740 | ||||||||
| INSURANCE - 8.0% | ||||||||
| 1,184 | Assured Guaranty Ltd. + | 35,390 | ||||||
| 1,021 | AXA SA + | 22,983 | ||||||
| 3,223 | Beazley PLC + | 14,323 | ||||||
| 1,351 | CNP Assurances + | 23,377 | ||||||
| 2,077 | Dai-ichi Life Insurance Co. Ltd. + | 30,458 | ||||||
| 994 | Genworth MI Canada, Inc. + | 21,604 | ||||||
| 901 | MS&AD Insurance Group Holdings, Inc. + | 26,768 | ||||||
| 693 | NN Group NV + | 20,853 | ||||||
| 7,578 | Old Mutual PLC + | 18,643 | ||||||
| 1,197 | Power Corp. of Canada + | 25,695 | ||||||
| 294 | Prudential Financial, Inc. + | 24,928 | ||||||
| 89 | Swiss Life Holding AG + | 23,580 | ||||||
| 237 | Swiss Re AG + | 22,025 | ||||||
| 2,710 | UNIQA Insurance Group AG + | 17,444 | ||||||
| 957 | Unum Group + | 33,878 | ||||||
| 84 | Zurich Insurance Group AG + | 21,991 | ||||||
| 383,940 | ||||||||
| INTERNET - 0.9% | ||||||||
| 539 | Mixi, Inc. + | 19,824 | ||||||
| 1,657 | New Media Investment Group, Inc. + | 23,861 | ||||||
| 43,685 | ||||||||
| INVESTMENT COMPANIES - 0.7% | ||||||||
| 1,654 | Solar Capital Ltd. + | 33,278 | ||||||
See accompanying notes to financial statements.
7
| Crow Point Global Dividend Plus Fund |
| PORTFOLIO OF INVESTMENTS (Continued) |
| October 31, 2016 |
| Shares | Value | |||||||
| IRON / STEEL - 1.8% | ||||||||
| 328 | POSCO - ADR + | $ | 17,040 | |||||
| 294 | Reliance Steel & Aluminum Co. + | 20,221 | ||||||
| 895 | Steel Dynamics, Inc. + | 24,577 | ||||||
| 954 | Ternium SA - ADR + | 22,810 | ||||||
| 84,648 | ||||||||
| MACHINERY-DIVERSIFIED - 0.5% | ||||||||
| 202 | Cummins, Inc. + | 25,820 | ||||||
| MEDIA - 0.7% | ||||||||
| 30,872 | Seven West Media Ltd. + | 15,975 | ||||||
| 1,898 | Television Francaise 1 + | 17,473 | ||||||
| 33,448 | ||||||||
| METAL FABRICATE / HARDWARE - 0.8% | ||||||||
| 1,138 | Timken Co. + | 37,611 | ||||||
| MINING - 0.9% | ||||||||
| 9,046 | Nippon Light Metal Holdings Co. Ltd. + | 20,574 | ||||||
| 624 | Rio Tinto PLC + | 21,633 | ||||||
| 42,207 | ||||||||
| MISCELLANEOUS MANUFACTURING - 0.9% | ||||||||
| 404 | Siemens AG + | 45,814 | ||||||
| MULTI-NATIONAL - 0.3% | ||||||||
| 466 | Banco Latinoamericano de Comercio Exterior SA + | 12,568 | ||||||
| OFFICE FURNISHINGS - 0.6% | ||||||||
| 1,438 | Knoll, Inc. + | 31,118 | ||||||
| OFFICE / BUSINESS EQUIPMENT - 1.3% | ||||||||
| 787 | Neopost SA + | 23,794 | ||||||
| 4,057 | Xerox Corp. + | 39,637 | ||||||
| 63,431 | ||||||||
| OIL & GAS - 10.7% | ||||||||
| 504 | Chevron Corp. + | 52,794 | ||||||
| 45,768 | CNOOC Ltd. + | 58,251 | ||||||
| 939 | Exxon Mobil Corp. + | 78,237 | ||||||
| 700 | Lukoil PJSC - ADR + | 34,027 | ||||||
| 1,864 | Marathon Oil Corp. + | 24,568 | ||||||
| 792 | OMV AG + | 24,722 | ||||||
| 818 | Royal Dutch Shell PLC + | 20,358 | ||||||
| 18,597 | Saras SpA + | 32,251 | ||||||
| 8,761 | Thai Oil PCL - NVDR + | 17,523 | ||||||
| 339 | TOTAL SA + | 16,247 | ||||||
| 538 | Valero Energy Corp. + | 31,871 | ||||||
| 2,369 | Western Refining, Inc. + | 68,346 | ||||||
| 2,565 | Woodside Petroleum Ltd. + | 55,374 | ||||||
| 514,569 | ||||||||
| OIL & GAS SERVICES - 0.9% | ||||||||
| 49,248 | Sinopec Engineering Group Co. Ltd. + | 43,565 | ||||||
| PHARMACEUTICALS - 5.1% | ||||||||
| 341 | AstraZeneca PLC + | 19,101 | ||||||
| 788 | Daiichi Sankyo Co. Ltd. + | 18,942 | ||||||
| 2,150 | GlaxoSmithKline PLC + | 42,485 | ||||||
| 298 | Johnson & Johnson + | 34,565 | ||||||
| 433 | Merck & Co., Inc. + | 25,426 | ||||||
| 1,147 | Mitsubishi Tanable Pharma Corp. + | 22,332 | ||||||
See accompanying notes to financial statements.
8
| Crow Point Global Dividend Plus Fund |
| PORTFOLIO OF INVESTMENTS (Continued) |
| October 31, 2016 |
| Shares | Value | |||||||
| PHARMACEUTICALS (Continued) - 5.1% | ||||||||
| 493 | Orion OYJ + | $ | 20,963 | |||||
| 1,029 | Pfizer, Inc. + | 32,630 | ||||||
| 240 | Sanofi + | 18,668 | ||||||
| 281 | Teva Pharmaceutical Industries Ltd. + | 12,010 | ||||||
| 247,122 | ||||||||
| PRIVATE EQUITY - 1.0% | ||||||||
| 2,753 | Apollo Global Management LLC + | 50,325 | ||||||
| REAL ESTATE - 0.8% | ||||||||
| 25,714 | Guangzhou R&F Properties Co. Ltd. + | 36,342 | ||||||
| REITS - 9.7% | ||||||||
| 3,217 | Annaly Capital Management, Inc. + | 33,328 | ||||||
| 456 | Camden Property Trust + | 37,137 | ||||||
| 33,966 | Champion REIT + | 19,316 | ||||||
| 2,760 | Chimera Investment Corp. + | 43,249 | ||||||
| 2,079 | Colony Capital, Inc. + | 39,522 | ||||||
| 3,287 | CYS Investments, Inc. + | 28,334 | ||||||
| 757 | Equity Residential + | 46,745 | ||||||
| 912 | Hospitality Properties Trust + | 24,952 | ||||||
| 1,697 | Host Hotels & Resorts, Inc. + | 26,270 | ||||||
| 19,092 | Mapletree Industrial Trust + | 23,592 | ||||||
| 4,713 | MFA Financial, Inc. + | 34,452 | ||||||
| 842 | Omega Healthcare Investors, Inc. + | 26,801 | ||||||
| 1,272 | Outfront Media, Inc. + | 27,361 | ||||||
| 1,027 | Select Income REIT + | 25,408 | ||||||
| 1,330 | Starwood Property Trust, Inc. + | 29,579 | ||||||
| 466,046 | ||||||||
| RETAIL - 8.3% | ||||||||
| 1,903 | American Eagle Outfitters, Inc. + | 32,427 | ||||||
| 448 | Aoyama Trading Co. Ltd. + | 15,774 | ||||||
| 1,020 | Best Buy Co. Inc. + | 39,688 | ||||||
| 614 | Big Lots, Inc. + | 26,648 | ||||||
| 14,065 | Harvey Norman Holdings Ltd. + | 54,049 | ||||||
| 3,661 | Marks & Spencer Group PLC | 15,219 | ||||||
| 210 | McDonald’s Corp. + | 23,640 | ||||||
| 3,534 | Staples, Inc. + | 26,152 | ||||||
| 6,739 | Super Retail Group Ltd. + | 50,255 | ||||||
| 437 | Target Corp. + | 30,035 | ||||||
| 6,930 | Wal-Mart de Mexico SAB de CV + | 14,731 | ||||||
| 1,002 | Wal-Mart Stores, Inc. + | 70,160 | ||||||
| 398,778 | ||||||||
| SEMICONDUCTORS - 3.7% | ||||||||
| 1,305 | Intel Corp. + | 45,505 | ||||||
| 412 | KLA-Tencor Corp. + | 30,945 | ||||||
| 568 | Qualcomm, Inc. + | 39,033 | ||||||
| 246 | Silicon Motion Technology Corp. - ADR + | 9,990 | ||||||
| 2,737 | STMicroelectronics NV + | 26,064 | ||||||
| 800 | Taiwan Semiconductor Manufacturing Co. Ltd. - ADR + | 24,880 | ||||||
| 176,417 | ||||||||
| SHIPBUILDING - 0.5% | ||||||||
| 47,138 | Yangzijiang Shipbuilding Holdings Ltd. | 25,230 | ||||||
| SOFTWARE - 3.0% | ||||||||
| 1,126 | CA, Inc. + | 34,613 | ||||||
| 439 | Donnelley Financial Solutions, Inc. * + | 9,417 | ||||||
| 741 | Micro Focus International PLC + | 19,369 | ||||||
| 679 | Microsoft Corp. + | 40,686 | ||||||
| 343 | Oracle Corp. Japan + | 18,670 | ||||||
| 639 | Software AG + | 23,186 | ||||||
| 145,941 | ||||||||
See accompanying notes to financial statements.
9
| Crow Point Global Dividend Plus Fund |
| PORTFOLIO OF INVESTMENTS (Continued) |
| October 31, 2016 |
| Shares | Value | |||||||
| TELECOMMUNICATIONS - 7.2% | ||||||||
| 9,919 | Advanced Info Service PCL | $ | 43,505 | |||||
| 908 | AT&T, Inc. + | 33,405 | ||||||
| 425 | Chunghwa Telecom Co. Ltd. - ADR + | 14,514 | ||||||
| 1,048 | Cisco Systems, Inc. + | 32,153 | ||||||
| 7,311 | Frontier Communications Corp. + | 29,390 | ||||||
| 527 | Nippon Telegraph & Telephone Corp. - ADR + | 23,394 | ||||||
| 1,520 | Orange SA + | 23,910 | ||||||
| 807 | SK Telecom Co. Ltd. - ADR + | 17,633 | ||||||
| 7,478 | Spark New Zealand Ltd. + | 19,580 | ||||||
| 466 | Telekomunikasi Indonesia Persero Tbk PT - ADR + | 15,140 | ||||||
| 3,411 | Telia Co AB + | 13,649 | ||||||
| 1,414 | Verizon Communications, Inc. + | 68,013 | ||||||
| 534 | Vodafone Group PLC - ADR + | 14,867 | ||||||
| 349,153 | ||||||||
| TRANSPORTATION - 2.2% | ||||||||
| 12,177 | Aurizon Holdings Ltd. + | 45,219 | ||||||
| 1,676 | Euronav NV + | 13,116 | ||||||
| 496 | Oesterreichische Post AG + | 17,103 | ||||||
| 168 | Ryder System, Inc. + | 11,658 | ||||||
| 6,138 | Super Group Ltd. * | 18,118 | ||||||
| 105,214 | ||||||||
| TOTAL COMMON STOCK (Cost - $6,358,849) | 6,309,504 | |||||||
| Contracts ** | ||||||||
| PURCHASED CALL OPTIONS * - 0.0% | ||||||||
| 6 | S&P 500 Mini XSP | |||||||
| Expiration November 2016, Exercise Price $219.00 | 246 | |||||||
| 20 | SPDR S&P 500 ETF | |||||||
| Expiration November 2016, Exercise Price $219.00 | 940 | |||||||
| 1,186 | ||||||||
| PURCHASED PUT OPTIONS * - 0.0% | ||||||||
| 6 | S&P 500 Mini XSP | |||||||
| Expiration November 2016, Exercise Price $210.00 | 1,407 | |||||||
| TOTAL PURCHASED OPTIONS (Cost - $3,204) | 2,593 | |||||||
| TOTAL INVESTMENTS - 130.8% (Cost - $6,362,053) (a) | $ | 6,312,097 | ||||||
| SECURITIES SOLD SHORT - (62.8)% (Proceeds - $2,991,595) (a) | (3,028,192 | ) | ||||||
| WRITTEN OPTIONS - (0.1)% (Premiums - $8,078) (a) | (6,692 | ) | ||||||
| OTHER ASSETS LESS LIABILITIES - NET - 32.1% | 1,547,455 | |||||||
| NET ASSETS - 100.0% | $ | 4,824,668 | ||||||
| Shares | ||||||||
| SECURITIES SOLD SHORT * - 62.8% | ||||||||
| COMMON STOCK - 62.8% | ||||||||
| AEROSPACE/DEFENSE - 0.8% | ||||||||
| 6,809 | IHI Corp. | 17,948 | ||||||
| 893 | Zodiac Aerospace | 21,702 | ||||||
| 39,650 | ||||||||
| APPAREL - 0.4% | ||||||||
| 379 | Deckers Outdoor Corp. | 19,780 | ||||||
| AUTO MANUFACTURERS - 1.1% | ||||||||
| 20,729 | Brilliance China Automotive Holdings Ltd. | 24,619 | ||||||
| 839 | Kandi Technologies Group, Inc. | 4,195 | ||||||
| 647 | Suzuki Motor Corp. | 22,965 | ||||||
| 51,779 | ||||||||
See accompanying notes to financial statements.
10
| Crow Point Global Dividend Plus Fund |
| PORTFOLIO OF INVESTMENTS (Continued) |
| October 31, 2016 |
| Shares | Value | |||||||
| AUTO PARTS & EQUIPMENT - 0.2% | ||||||||
| 535 | ElringKlinger AG | $ | 8,275 | |||||
| BANKS - 3.2% | ||||||||
| 59,546 | Bank of Ireland | 12,729 | ||||||
| 22,233 | Bankia SA | 19,546 | ||||||
| 8,691 | Barclays PLC | 20,192 | ||||||
| 64 | Credicorp Ltd. | 9,516 | ||||||
| 1,399 | Deutsche Bank AG | 20,174 | ||||||
| 1,769 | Grupo Financiero Banorte SAB de CV | 10,470 | ||||||
| 6,986 | Royal Bank of Scotland Group PLC | 16,129 | ||||||
| 132 | SVB Financial Group | 16,140 | ||||||
| 266 | Texas Capital Bancshares, Inc. | 15,774 | ||||||
| 393 | Webster Financial Corp. | 15,877 | ||||||
| 156,547 | ||||||||
| BEVERAGES - 0.8% | ||||||||
| 2,178 | Ambev SA - ADR | 12,850 | ||||||
| 6,002 | Tsingtao Brewery Co. Ltd. | 23,993 | ||||||
| 36,843 | ||||||||
| BIOTECHNOLOGY - 1.0% | ||||||||
| 236 | Bluebird Bio, Inc. | 11,269 | ||||||
| 133 | Incyte Corp. | 11,567 | ||||||
| 937 | Insmed, Inc. | 12,162 | ||||||
| 150 | Vertex Pharmaceuticals, Inc. | 11,379 | ||||||
| 46,377 | ||||||||
| CHEMICALS - 1.6% | ||||||||
| 796 | Axalta Coating Systems Ltd. | 19,996 | ||||||
| 784 | Mosaic Co. | 18,448 | ||||||
| 305 | Symrise AG | 20,900 | ||||||
| 292 | WR Grace & Co. | 19,552 | ||||||
| 78,896 | ||||||||
| COMMERCIAL SERVICES - 1.4% | ||||||||
| 461 | Live Nation Entertainment, Inc. | 12,756 | ||||||
| 296 | Monro Muffler Brake, Inc. | 16,280 | ||||||
| 221 | TAL Education Corp. - ADR | 17,998 | ||||||
| 469 | Team Health Holdings, Inc. | 20,097 | ||||||
| 67,131 | ||||||||
| COMPUTERS - 0.4% | ||||||||
| 1,534 | Indra Sistemas SA | 18,977 | ||||||
| COSMETICS / PERSONAL CARE - 0.9% | ||||||||
| 766 | Pigeon Corp. | 21,576 | ||||||
| 999 | Unicharm Corp. | 23,752 | ||||||
| 45,328 | ||||||||
| DISTRIBUTION / WHOLESALE - 0.6% | ||||||||
| 401 | G-III Apparel Group Ltd. | 10,474 | ||||||
| 445 | Ingram Micro, Inc. | 16,554 | ||||||
| 27,028 | ||||||||
| DIVERSIFIED FINANCIAL SERVICES - 2.6% | ||||||||
| 3,864 | Acom Co. Ltd. | 17,797 | ||||||
| 541 | Hong Kong Exchanges & Clearing Ltd. | 14,329 | ||||||
| 9,858 | Huatai Securities Co. Ltd. ^ | 20,848 | ||||||
| 2,712 | Nomura Holdings, Inc. | 13,588 | ||||||
| 2,492 | Okasan Securities Group, Inc. | 13,256 | ||||||
| 915 | PHH Corp. | 13,286 | ||||||
| 406 | Stifel Financial Corp. | 15,891 | ||||||
| 8,473 | Value Partners Group Ltd. | 8,107 | ||||||
| 1,162 | WisdomTree Investments, Inc. | 9,970 | ||||||
| 127,072 | ||||||||
See accompanying notes to financial statements.
11
| Crow Point Global Dividend Plus Fund |
| PORTFOLIO OF INVESTMENTS (Continued) |
| October 31, 2016 |
| Shares | Value | |||||||
| ELECTRIC - 1.0% | ||||||||
| 1,104 | Atlantica Yield PLC | $ | 19,850 | |||||
| 747 | Calpine Corp. | 8,889 | ||||||
| 1,906 | Shikoku Electric Power Co., Inc. | 17,920 | ||||||
| 46,659 | ||||||||
| ELECTRICAL COMPONENT & EQUIPMENT - 0.7% | ||||||||
| 571 | Leoni AG | 21,648 | ||||||
| 142 | Nidec Corp. | 13,742 | ||||||
| 35,390 | ||||||||
| ELECTRONICS - 1.6% | ||||||||
| 640 | Hamamatsu Photonics KK | 19,367 | ||||||
| 435 | National Instruments Corp. | 12,219 | ||||||
| 369 | OSI Systems, Inc. | 25,878 | ||||||
| 1,203 | Yaskawa Electric Corp. | 19,198 | ||||||
| 76,662 | ||||||||
| ENERGY-ALTERNATE SOURCES - 0.7% | ||||||||
| 14,261 | China Longyuan Power Group Corp. Ltd. | 10,905 | ||||||
| 13,168 | Energy Absolute PCL | 10,629 | ||||||
| 453 | Nordex SE | 11,896 | ||||||
| 33,430 | ||||||||
| ENGINEERING & CONSTRUCTION - 1.3% | ||||||||
| 7,374 | Balfour Beatty PLC | 24,398 | ||||||
| 553 | Bilfinger Berger AG | 19,456 | ||||||
| 4,226 | Koninklijke BAM Groep NV | 19,647 | ||||||
| 63,501 | ||||||||
| ENVIRONMENTAL CONTROL - 0.7% | ||||||||
| 314 | Clean Harbors, Inc. | 14,858 | ||||||
| 224 | Stericycle, Inc. | 17,940 | ||||||
| 32,798 | ||||||||
| EQUITY FUND - 8.5% | ||||||||
| 1,240 | iShares MSCI EAFE ETF | 71,697 | ||||||
| 2,954 | iShares MSCI Emerging Markets ETF | 109,712 | ||||||
| 1,065 | SPDR S&P 500 ETF Trust | 226,365 | ||||||
| 407,774 | ||||||||
| FOOD - 0.8% | ||||||||
| 21,316 | Tingyi Cayman Islands Holding Corp. | 23,007 | ||||||
| 955 | Woolworths Ltd. | 17,187 | ||||||
| 40,194 | ||||||||
| FOREST PRODUCTS & PAPER - 0.4% | ||||||||
| 2,947 | Metsa Board OYJ - Class B | 16,912 | ||||||
| GAS - 0.5% | ||||||||
| 11,728 | Hong Kong & China Gas Co. Ltd. | 22,988 | ||||||
| HEALTHCARE-PRODUCTS - 2.6% | ||||||||
| 2,919 | Accuray, Inc. | 14,303 | ||||||
| 2,655 | Elekta AB | 23,058 | ||||||
| 1,123 | Endologix, Inc. | 11,747 | ||||||
| 1,009 | Getinge AB | 16,553 | ||||||
| 556 | Insulet Corp. | 20,639 | ||||||
| 648 | Quidel Corp. | 12,506 | ||||||
| 992 | Topcon Corp. | 14,830 | ||||||
| 348 | Zeltiq Aesthetics, Inc. | 11,519 | ||||||
| 125,155 | ||||||||
| HEALTHCARE-SERVICES - 1.0% | ||||||||
| 37 | Eurofins Scientific SE | 16,788 | ||||||
| 201 | LifePoint Health, Inc. | 12,030 | ||||||
| 2,618 | UDG Healthcare PLC | 20,888 | ||||||
| 49,706 | ||||||||
See accompanying notes to financial statements.
12
| Crow Point Global Dividend Plus Fund |
| PORTFOLIO OF INVESTMENTS (Continued) |
| October 31, 2016 |
| Shares | Value | |||||||
| HOLDING COMPANIES DIVERSIFIED - 0.6% | ||||||||
| 102 | Ackermans & van Haaren NV | $ | 14,150 | |||||
| 3,814 | Grupo Carso SAB de CV | 16,750 | ||||||
| 30,900 | ||||||||
| INSURANCE - 2.1% | ||||||||
| 8,395 | China Life Insurance Co. Ltd. | 20,850 | ||||||
| 39 | Fairfax Financial Holdings Ltd. | 19,990 | ||||||
| 395 | Kemper Corp. | 14,832 | ||||||
| 147 | Navigators Group, Inc. | 13,700 | ||||||
| 1,272 | Third Point Reinsurance Ltd. | 14,946 | ||||||
| 677 | Topdanmark A/S | 18,207 | ||||||
| 102,525 | ||||||||
| INTERNET - 1.8% | ||||||||
| 1,281 | 21Vianet Group, Inc. - ADR | 9,364 | ||||||
| 81 | Baidu, Inc. - ADR | 14,326 | ||||||
| 171 | Ctrip.com International Ltd. - ADR | 7,550 | ||||||
| 1,488 | Fang Holdings Ltd. | 4,955 | ||||||
| 722 | JD.com, Inc. - ADR | 18,736 | ||||||
| 664 | SMS Co. Ltd. | 17,320 | ||||||
| 240 | TripAdvisor, Inc. | 15,474 | ||||||
| 87,725 | ||||||||
| INVESTMENT COMPANIES - 0.4% | ||||||||
| 442 | Exor SpA | 18,756 | ||||||
| IRON / STEEL - 0.4% | ||||||||
| 3,068 | Outokumpu OYJ | 21,356 | ||||||
| LEISURE TIME - 0.7% | ||||||||
| 10,116 | Piaggio & C SpA | 17,632 | ||||||
| 139 | Qunar Cayman Islands Ltd. | 4,110 | ||||||
| 68 | Shimano, Inc. | 11,622 | ||||||
| 33,364 | ||||||||
| LODGING - 1.0% | ||||||||
| 1,670 | City Developments Ltd | 10,186 | ||||||
| 125,674 | Macau Legend Development Ltd. | 22,040 | ||||||
| 3,792 | NH Hotel Group SA | 16,731 | ||||||
| 48,957 | ||||||||
| MACHINERY-DIVERSIFIED - 1.3% | ||||||||
| 878 | Alstom SA | 23,551 | ||||||
| 415 | Chart Industries, Inc. | 11,512 | ||||||
| 50 | FANUC Corp. | 9,364 | ||||||
| 34,952 | Shanghai Electric Group Co. Ltd. | 16,181 | ||||||
| �� | 60,608 | |||||||
| MEDIA - 1.1% | ||||||||
| 835 | Altice NV | 15,378 | ||||||
| 1,289 | Houghton Mifflin Harcourt Co. | 16,306 | ||||||
| 602 | Tribune Media Co. | 19,625 | ||||||
| 51,309 | ||||||||
| METAL FABRICATE / HARDWARE - 0.4% | ||||||||
| 628 | Sun Hydraulics Corp. | 18,482 | ||||||
| MINING - 1.8% | ||||||||
| 40,795 | Aluminum Corp of China Ltd. | 15,150 | ||||||
| 3,182 | Antofagasta PLC | 21,095 | ||||||
| 6,650 | Glencore PLC | 20,297 | ||||||
| 23,914 | Minera Frisco SAB de CV | 18,666 | ||||||
| 329 | Southern Copper Corp. | 9,340 | ||||||
| 84,548 | ||||||||
See accompanying notes to financial statements.
13
| Crow Point Global Dividend Plus Fund |
| PORTFOLIO OF INVESTMENTS (Continued) |
| October 31, 2016 |
| Shares | Value | |||||||
| MISCELLANEOUS MANUFACTURING - 0.8% | ||||||||
| 17,694 | Bombardier, Inc. | $ | 23,500 | |||||
| 300 | Proto Labs, Inc. | 13,410 | ||||||
| 36,910 | ||||||||
| OIL & GAS - 1.5% | ||||||||
| 644 | Imperial Oil Ltd. | 20,902 | ||||||
| 262 | Occidental Petroleum Corp. | 19,102 | ||||||
| 234 | PetroChina Co. Ltd. - ADR | 15,849 | ||||||
| 1,332 | Petroleo Brasileiro SA - ADR | 14,732 | ||||||
| 70,585 | ||||||||
| OIL & GAS SERVICES - 2.7% | ||||||||
| 445 | Baker Hughes, Inc. | 24,653 | ||||||
| 24,651 | China Oilfield Services Ltd. | 23,841 | ||||||
| 3,118 | Hunting PLC | 19,167 | ||||||
| 495 | Oil States International, Inc. | 14,479 | ||||||
| 358 | SEACOR Holdings, Inc. | 17,653 | ||||||
| 888 | Thermon Group Holdings, Inc. | 16,277 | ||||||
| 3,438 | Weatherford International Ltd. | 16,571 | ||||||
| 132,641 | ||||||||
| PHARMACEUTICALS - 1.3% | ||||||||
| 472 | Catalent, Inc. | 10,766 | ||||||
| 330 | Chugai Pharmaceutical Co. Ltd | 11,242 | ||||||
| 173 | DexCom, Inc. | 13,536 | ||||||
| 1,056 | Ironwood Pharmaceuticals, Inc. | 13,485 | ||||||
| 21,365 | Luye Pharma Group Ltd. | 14,381 | ||||||
| 63,410 | ||||||||
| PRIVATE EQUITY - 0.4% | ||||||||
| 285 | Onex Corp. | 18,449 | ||||||
| REAL ESTATE - 0.6% | ||||||||
| 28,655 | Poly Property Group Co. Ltd. | 9,090 | ||||||
| 623 | Realogy Holdings Corp. | 14,260 | ||||||
| 312 | St. Joe Co. | 5,522 | ||||||
| 28,872 | ||||||||
| REITS - 0.8% | ||||||||
| 623 | American Homes 4 Rent | 13,152 | ||||||
| 1,315 | Hispania Activos Inmobiliarios SOCIMI SA | 16,174 | ||||||
| 1,000 | Shaftesbury PLC | 11,195 | ||||||
| 40,521 | ||||||||
| RETAIL - 1.5% | ||||||||
| 3,595 | Alsea SAB de CV | 13,480 | ||||||
| 176 | Dufry AG | 21,428 | ||||||
| 2,380 | IDOM, Inc. | 12,411 | ||||||
| 555 | Zalando SE ^ | 24,330 | ||||||
| 71,649 | ||||||||
| SEMICONDUCTORS - 1.1% | ||||||||
| 1,052 | Cypress Semiconductor Corp. | 10,488 | ||||||
| 549 | Dialog Semiconductor PLC | 21,515 | ||||||
| 906 | Veeco Instruments, Inc. | 19,660 | ||||||
| 51,663 | ||||||||
| SOFTWARE - 2.7% | ||||||||
| 201 | ANSYS, Inc. | 18,361 | ||||||
| 297 | Autodesk, Inc. | 21,467 | ||||||
| 834 | Callidus Software, Inc. | 15,221 | ||||||
| 172 | Cerner Corp. | 10,076 | ||||||
| 225 | Medidata Solutions, Inc. | 10,798 | ||||||
| 2,245 | Mitel Networks Corp. | 15,019 | ||||||
| 114 | PTC, Inc. | 5,408 | ||||||
See accompanying notes to financial statements.
14
| Crow Point Global Dividend Plus Fund |
| PORTFOLIO OF INVESTMENTS (Continued) |
| October 31, 2016 |
| Shares | Value | |||||||
| SOFTWARE (Continued) - 2.7% | ||||||||
| 307 | SimCorp A/S | $ | 16,942 | |||||
| 130 | Tyler Technologies, Inc. | 20,852 | ||||||
| 134,144 | ||||||||
| TELECOMMUNICATIONS - 2.2% | ||||||||
| 179 | ATN International, Inc. | 12,108 | ||||||
| 1,388 | General Communication, Inc. | 21,986 | ||||||
| 1,298 | Infinera Corp. | 10,124 | ||||||
| 290 | Sunrise Communications Group AG ^ | 19,824 | ||||||
| 22,544 | Telecom Italia SpA | 19,535 | ||||||
| 30,785 | True Corp PCL | 5,938 | ||||||
| 227 | ViaSat, Inc. | 16,040 | ||||||
| 105,555 | ||||||||
| TRANSPORTATION - 0.8% | ||||||||
| 370 | Kirby Corp. | 21,811 | ||||||
| 3,925 | Nishi-Nippon Railroad Co., Ltd. * | 18,600 | ||||||
| 40,411 | ||||||||
| SECURITIES SOLD SHORT (Proceeds - $2,991,595)(a) | 3,028,192 | |||||||
| Contracts ** | ||||||||
| WRITTEN CALL OPTIONS *- 0.1% | ||||||||
| 6 | S&P 500 Mini XSP | |||||||
| Expiration November 2016, Exercise Price $215.00 | 1,053 | |||||||
| 20 | SPDR S&P 500 ETF | |||||||
| Expiration November 2016, Exercise Price $215.00 | 3,860 | |||||||
| 4,913 | ||||||||
| WRITTEN PUT OPTIONS * - 0.0% | ||||||||
| 6 | S&P 500 Mini XSP | |||||||
| Expiration November 2016, Exercise Price $212.00 | 1,779 | |||||||
| TOTAL WRITTEN OPTIONS (Premiums - $8,078) (a) | 6,692 | |||||||
| ADR | American Depositary Receipt |
| PCL | Public Company Limited (Thailand) |
| PLC | Public Limited Company |
| REIT | Real Estate Investment Trust |
| ETF | Exchange Traded Fund |
| + | All or a portion of the security is held as collateral for covered shorts. Total value of pledged securities at October 31, 2016 is $5,257,420 or 109% of net assets. |
| * | Non-income producing security |
| ** | Each option contract allows the holder to purchase or sell 100 shares of the underlying stock. |
| ^ | Security exempt from registration under Rule 144A of the Securities Act of 1933. These securities may be resold in transactions exempt from registration to qualified institutional buyers. These securities sold short had a fair value of ($65,002) and 1.3% of net assets. |
| (a) | Represents cost for financial reporting purposes. The cost for federal income tax purposes (including securities sold short and written options) is $3,369,408 and differs from fair value by net unrealized appreciation (depreciation) of securities as follows: |
| Unrealized appreciation: | $ | 389,277 | ||
| Unrealized depreciation: | (481,472 | ) | ||
| Net unrealized depreciation: | $ | (92,195 | ) |
See accompanying notes to financial statements.
15
| Crow Point Global Dividend Plus Fund |
| STATEMENT OF ASSETS AND LIABILITIES |
| October 31, 2016 |
| ASSETS | ||||
| Investment securities: | ||||
| at Cost | $ | 6,362,053 | ||
| at Value | $ | 6,312,097 | ||
| Cash | 6,313,365 | |||
| Receivable for securities sold | 152,243 | |||
| Dividends and interest receivable | 20,142 | |||
| TOTAL ASSETS | 12,797,847 | |||
| LIABILITIES | ||||
| Due to Broker - foreign currency, at value (cost - $36,594) | 30,926 | |||
| Securities Sold Short (proceeds - $2,991,595) | 3,028,192 | |||
| Options written, at value (premiums received $8,078) | 6,692 | |||
| Payable for Fund shares repurchased | 4,872,511 | |||
| Investment advisory fees payable | 5,657 | |||
| Investment advisory administration fees payable | 824 | |||
| Payable to related parties | 4,467 | |||
| Dividends payable on securities sold short | 3,305 | |||
| Accrued expenses and other liabilities | 20,605 | |||
| TOTAL LIABILITIES | 7,973,179 | |||
| NET ASSETS | $ | 4,824,668 | ||
| Net Assets Consist Of: | ||||
| Paid in capital | $ | 5,047,348 | ||
| Accumulated net investment income | 3,599 | |||
| Accumulated net realized loss from investments, option contracts, securities sold short and foreign currency transactions | (146,402 | ) | ||
| Net unrealized depreciation on investments, option contracts, securities sold short and foreign currency translations | (79,877 | ) | ||
| NET ASSETS | $ | 4,824,668 | ||
| Investor Class | ||||
| Net Assets | $ | 4,824,668 | ||
| Shares of beneficial interest outstanding (2,000,000 shares authorized without par value) | 501,058 | |||
| Net asset value, offering price and redemption price per share (Net assets / Shares of Beneficial Interest Outstanding) | $ | 9.63 |
See accompanying notes to financial statements.
16
| Crow Point Global Dividend Plus Fund |
| STATEMENT OF OPERATIONS |
| For the Period Ended October 31, 2016 (a) |
| INVESTMENT INCOME | ||||
| Dividends (net of $8,966 foreign taxes) | $ | 175,060 | ||
| Interest | 744 | |||
| TOTAL INVESTMENT INCOME | 175,804 | |||
| EXPENSES | ||||
| Investment advisory fees | 52,610 | |||
| Interest expense | 20,491 | |||
| Dividends and fees on securities sold short | 13,377 | |||
| Audit fees | 12,605 | |||
| Administrative services fees | 9,426 | |||
| Accounting services fees | 7,642 | |||
| Insurance expense | 5,384 | |||
| Transfer agent fees | 5,281 | |||
| Legal fees | 2,889 | |||
| Investment advisory administration fees | 2,472 | |||
| Compliance officer fees | 2,144 | |||
| Registration fees | 1,734 | |||
| Custodian fees | 1,684 | |||
| Trustees’ fees and expenses | 1,585 | |||
| Printing and postage expenses | 1,352 | |||
| Other expenses | 1,127 | |||
| TOTAL EXPENSES | 141,803 | |||
| Less: Expense waived and/or reimbursed by the Advisor | (34,344 | ) | ||
| NET EXPENSES | 107,459 | |||
| NET INVESTMENT INCOME | 68,345 | |||
| REALIZED AND UNREALIZED GAIN (LOSS) ON INVESTMENTS | ||||
| Net realized gain (loss) from: | ||||
| Investments | (21,707 | ) | ||
| Securities sold short | (141,606 | ) | ||
| Options written | 21,930 | |||
| Options purchased | (9,545 | ) | ||
| Foreign currency transactions | (94,748 | ) | ||
| Net change in unrealized appreciation (depreciation) on: | ||||
| Investments | (49,345 | ) | ||
| Securities sold short | (36,597 | ) | ||
| Options written | 1,386 | |||
| Options purchased | (611 | ) | ||
| Foreign currency translations | 5,290 | |||
| NET REALIZED AND UNREALIZED LOSS ON INVESTMENTS | (325,553 | ) | ||
| NET DECREASE IN NET ASSETS RESULTING FROM OPERATIONS | $ | (257,208 | ) |
| (a) | The Fund commenced operations on July 27, 2016. |
See accompanying notes to financial statements.
17
| Crow Point Global Dividend Plus Fund |
| STATEMENTS OF CHANGES IN NET ASSETS |
| For the | ||||
| Period Ended | ||||
| October 31, 2016 (a) | ||||
| FROM OPERATIONS: | ||||
| Net investment income | $ | 68,345 | ||
| Net realized loss from investments, securities sold short, option contracts and foreign currency transactions | (245,676 | ) | ||
| Net change in unrealized depreciation on investments, securities sold short, option contracts and foreign currency translations | (79,877 | ) | ||
| Net decrease in net assets resulting from operations | (257,208 | ) | ||
| DISTRIBUTIONS TO SHAREHOLDERS: | ||||
| From return of capital | (96,649 | ) | ||
| FROM SHARES OF BENEFICIAL INTEREST : | ||||
| Proceeds from shares sold | 9,950,000 | |||
| Reinvestment of distributions | 1,036 | |||
| Payments for shares redeemed | (4,872,511 | ) | ||
| Net increase in net assets from shares of beneficial interest | 5,078,525 | |||
| TOTAL INCREASE IN NET ASSETS | 4,724,668 | |||
| NET ASSETS | ||||
| Beginning of Period | 100,000 | |||
| End of Period * | $ | 4,824,668 | ||
| * Includes accumulated net investment income of: | $ | 3,599 | ||
| SHARE ACTIVITY | ||||
| Shares sold | 997,450 | |||
| Shares reinvested | 106 | |||
| Shares redeemed | (506,498 | ) | ||
| Net increase in shares of beneficial interest outstanding | 491,058 | |||
| (a) | The Fund commenced operations on July 27, 2016. |
See accompanying notes to financial statements.
18
| Crow Point Global Dividend Plus Fund |
| FINANCIAL HIGHLIGHTS |
Per Share Data and Ratios for a Share of Beneficial Interest Outstanding Throughout the Period Presented
| Period Ended | ||||
| October 31, 2016 * | ||||
| Net asset value, beginning of period | $ | 10.00 | ||
| Activity from investment operations: | ||||
| Net investment income (1) | 0.07 | |||
| Net realized and unrealized loss on investments | (0.34 | ) | ||
| Total from investment operations | (0.27 | ) | ||
| Less distributions: | ||||
| From return of capital | (0.10 | ) | ||
| Net asset value, end of period | $ | 9.63 | ||
| Total return (2) | (2.68 | )% (3) | ||
| Net assets, end of period (000s) | $ | 4,825 | ||
| Ratio of expenses to average net assets (5) | ||||
| before reimbursement | 5.70 | % (4) | ||
| net of reimbursement | 4.32 | % (4) | ||
| Ratio of expenses to average net assets (excluding dividends and interest on margin account) (5) | ||||
| before reimbursement | 4.33 | % (4) | ||
| net of reimbursement | 2.95 | % (4) | ||
| Ratio of net investment income to average net assets (5)(6) | 2.78 | % (4) | ||
| Portfolio turnover rate | 60 | % (3) | ||
| * | For the period July 27, 2016 (commencement of operations) through October 31, 2016. |
| (1) | Per share amounts calculated using the average shares method, which more appropriately presents the per share data for the period. |
| (2) | Total returns are historical in nature and assume changes in share price, reinvestment of dividends and capital gains distributions, if any, and does not reflect the impact of sales charges. Had the advisor not absorbed a portion of Fund expenses, total returns would have been lower. |
| (3) | Not annualized. |
| (4) | Annualized. |
| (5) | The ratios of expenses to average net assets and net investment income to average net assets do not reflect the expenses of the underlying investment companies in which the Fund invests. |
| (6) | Recognition of net investment income by the Fund is affected by the timing and declaration of dividends by the underlying investment companies in which the Fund invests. |
See accompanying notes to financial statements.
19
| Crow Point Global Dividend Plus Fund |
| NOTES TO FINANCIAL STATEMENTS |
| October 31, 2016 |
| 1. | ORGANIZATION |
The Crow Point Global Dividend Plus Fund (the “Fund” or the “Trust”) is a trust organized under the laws of the State of Delaware on February 23, 2015, and registered under the Investment Company Act of 1940, as amended (the “1940 Act”), as a closed-end management investment company. The inception date of the Fund is July 27, 2016. Because the Fund makes repurchase offers of a limited number of its outstanding shares to its shareholders each quarter, it is sometimes called an “Interval Fund”. The Fund’s investment objective is to provide a high level of income and seek capital preservation.
| 2. | SIGNIFICANT ACCOUNTING POLICIES |
The following is a summary of significant accounting policies followed by the Fund in preparation of its financial statements. These policies are in conformity with accounting principles generally accepted in the United States of America (“GAAP”). The preparation of financial statements in conformity GAAP requires management to make estimates and assumptions that affect the reported amounts of assets and liabilities and disclosure of contingent assets and liabilities at the date of the financial statements and the reported amounts of increases and decreases in net assets from operations during the reporting period. Actual results could differ from those estimates. The Fund follows the specialized accounting and reporting requirements under GAAP that are applicable to investment companies.
Securities Valuation – Securities listed on an exchange are valued at the last reported sale price at the close of the regular trading session of the primary exchange on the business day the value is being determined, or in the case of securities listed on NASDAQ at the NASDAQ Official Closing Price (“NOCP”). In the absence of a sale such securities shall be valued at the mean between the current bid and ask prices on the primary exchange on the day of valuation. Futures and future options are valued at the final settled price or, in the absence of a settled price, at the last sale price on the day of valuation. Debt securities (other than short-term obligations) are valued each day by an independent pricing service approved by the Board of Trustees of the Trust (the “Board”) based on methods which include consideration of: yields or prices of securities of comparable quality, coupon, maturity and type, indications as to values from dealers, and general market conditions or market quotations from a major market maker in the securities. Investments valued in currencies other than the U.S. dollar are converted to U.S. dollars using exchange rates obtained from pricing services. Short-term debt obligations having 60 days or less remaining until maturity, at time of purchase, may be valued at amortized cost.
The Fund may invest in portfolios of open-end or closed-end investment companies (the “Underlying Funds”). Underlying open-end investment companies are valued at their respective net asset values as reported by such investment companies. The Underlying Funds value securities in their portfolios for which market quotations are readily available at their market values (generally the last reported sale price) and all other securities and assets at their fair value by the methods established by the boards of the Underlying Funds. The shares of many closed-end investment companies, after their initial public offering, frequently trade at a price per share, which is different than the net asset value per share. The difference represents a market premium or market discount of such shares. There can be no assurances that the market discount or market premium on shares of any closed-end investment company purchased by the Fund will not change.
When price quotations for certain securities are not readily available, or if the available quotations are not believed to be reflective of market value by the Advisor (defined below), those securities will be valued at “fair value” in accordance with procedures adopted by and under the supervision of the Fund’s Board of Trustees (the “Board”). There can be no assurance that the Fund could purchase or sell a portfolio security at the price used to calculate a Fund’s net asset value (“NAV”).
The Fund may use the fair value of a security to calculate its NAV when, for example (1) a portfolio security is not traded in a public market or the principal market in which the security trades is closed, (2) trading in a portfolio security is suspended and not resumed prior to the normal close, (3) a portfolio security is not traded in significant volume for a substantial period, or (4) the Advisor determines that the quotation or price for a portfolio security provided by a broker-dealer or independent pricing service is inaccurate.
The “fair value” of securities may be difficult to determine and thus judgement plays a greater role in the valuation process. The fair valuation methodology may include or consider the following guidelines, as appropriate: (1) evaluation of all relevant factors; (2) comparison to the values and current pricing of securities that have comparable characteristics; (3) knowledge of historical market information with respect to the security; (4) other factors relevant to the security which would include, but not be limited to, duration, yield, fundamental analytical data, the Treasury yield curve, and credit quality.
20
| Crow Point Global Dividend Plus Fund |
| NOTES TO FINANCIAL STATEMENTS (Continued) |
| October 31, 2016 |
The Fund utilizes various methods to measure the fair value of all of its investments on a recurring basis. GAAP establishes a hierarchy that prioritizes inputs to valuation methods. The three levels of input are:
Level 1 – Unadjusted quoted prices in active markets for identical assets and liabilities that the Fund has the ability to access.
Level 2 – Observable inputs other than quoted prices included in Level 1 for the asset or liability, either directly or indirectly. These inputs may include quoted prices for the identical instrument on an inactive market, prices for similar instruments, interest rates, prepayment speeds, credit risk, yield curves, default rates and similar data.
Level 3 – Unobservable inputs for the asset or liability, to the extent relevant observable inputs are not available, representing the Fund’s own assumptions about the assumptions a market participant would use in valuing the asset or liability, and would be based on the best information available.
The availability of observable inputs can vary from security to security and is affected by a wide variety of factors, including, for example, the type of security, whether the security is new and not yet established in the marketplace, the liquidity of markets, and other characteristics particular to the security. To the extent that valuation is based on models or inputs that are less observable or unobservable in the market, the determination of fair value requires more judgment. Accordingly, the degree of judgment exercised in determining fair value is greatest for instruments categorized in Level 3.
The inputs used to measure fair value may fall into different levels of the fair value hierarchy. In such cases, for disclosure purposes, the level in the fair value hierarchy within which the fair value measurement falls in its entirety, is determined based on the lowest level input that is significant to the fair value measurement in its entirety.
The inputs or methodology used for valuing securities are not necessarily an indication of the risk associated with investing in those securities. The following table summarizes the inputs used as of October 31, 2016 for the Fund’s investments measured at fair value:
| Assets * | Level 1 | Level 2 | Level 3 | Total | ||||||||||||
| Common Stock | $ | 6,309,504 | $ | — | $ | — | $ | 6,309,504 | ||||||||
| Purchased Call Options | 940 | 246 | — | 1,186 | ||||||||||||
| Purchased Put Options | — | 1,407 | — | 1,407 | ||||||||||||
| Total | $ | 6,310,444 | $ | 1,653 | $ | — | $ | 6,312,097 | ||||||||
| Liabilities * | Level 1 | Level 2 | Level 3 | Total | ||||||||||||
| Written Call Options | $ | 3,860 | $ | 1,053 | $ | — | $ | 4,913 | ||||||||
| Written Put Options | — | 1,779 | — | 1,779 | ||||||||||||
| Securities Sold Short | 3,028,192 | — | — | 3,028,192 | ||||||||||||
| Total | $ | 3,032,052 | $ | 2,832 | $ | — | $ | 3,034,884 | ||||||||
The Fund did not hold any Level 3 securities during the period. There were no transfers into or out of Level 1 and 2 during the current period presented. It is the Fund’s policy to recognize transfers into or out of Level 1 and Level 2 at the end of the reporting period.
| * | Refer to the Portfolio of Investments for industry classification. |
Offsetting of Financial Assets and Derivative Assets – The Fund’s policy is to recognize a net asset or liability equal to the unrealized appreciation (depreciation) for swap contracts and futures contracts. The following table presents financial instruments that are subject to enforceable netting arrangements or other similar agreements as of October 31, 2016:
| Liabilities: | ||||||||||||||||
| Gross Amounts of | Financial Instruments | Cash Collateral | Net Amount | |||||||||||||
| Description | Recognized Liabilities (1) | Pledged (2) | Pledged | of Assets | ||||||||||||
| Written Options | $ | 6,692 | $ | 6,692 | $ | — | $ | — | ||||||||
| Total | $ | 6,692 | $ | 6,692 | $ | — | $ | — | ||||||||
| (1) | Written options at value as presented in the Portfolio of Investments. |
| (2) | The amount is limited to the derivative liability balance and accordingly, does not include excess collateral pledged. |
21
| Crow Point Global Dividend Plus Fund |
| NOTES TO FINANCIAL STATEMENTS (Continued) |
| October 31, 2016 |
Security Transactions and Related Income – Security transactions are accounted for on the trade date. Interest income is recognized on an accrual basis. Discounts are accreted and premiums are amortized on securities purchased over the lives of the respective securities. Dividend income is recorded on the ex-dividend date. Realized gains or losses from sales of securities are determined by comparing the identified cost of the security lot sold with the net sales proceeds. The accounting records are maintained in U.S. dollars.
Exchange Traded Funds – The Fund may invest in exchange traded funds (“ETFs”). ETFs are a type of index fund bought and sold on a securities exchange. An ETF trades like common stock and represents a fixed portfolio of securities designed to track the performance and dividend yield of a particular domestic or foreign market index. The risks of owning an ETF generally reflect the risks of owning the underlying securities they are designed to track, although the lack of liquidity on an ETF could result in it being more volatile. Additionally, ETFs have fees and expenses that reduce their value.
Foreign Currency Translations – The accounting records of the Fund are maintained in U.S. dollars. Investment securities and other assets and liabilities denominated in a foreign currency, and income receipts and expense payments, are translated into U.S. dollars using the prevailing exchange rate at the London market close. Purchases and sales of securities are translated into U.S. dollars at the contractual currency rates established at the approximate time of the trade.
Net realized gains and losses on foreign currency transactions represent net gains and losses from currency realized between the trade and settlement dates on securities transactions and the difference between income accrued versus income received. The effects of changes in foreign currency exchange rates on investments in securities are included with the net realized and unrealized gain or loss on investment securities.
Options Transactions – Options contracts listed on a securities exchange or board of trade for which market quotations are readily available shall be valued at the last quoted sales price or, in the absence of a sale, at the mean between the current bid and ask prices on the day of valuation. Option contracts not listed on a securities exchange or board of trade for which over-the-counter market quotations are readily available shall be valued at the mean between the current bid and ask prices on the day of valuation. Index options shall be valued at the mean between the current bid and ask prices on the day of valuation.
When the Fund writes a put or call option, an amount equal to the premium received is included in the statement of assets and liabilities as a liability. The amount of the liability is subsequently marked-to-market to reflect the current market value of the option. If an option expires on its stipulated expiration date or if the Fund enters into a closing purchase transaction, a gain or loss is realized. If a written call option is exercised, a gain or loss is realized for the sale of the underlying security and the proceeds from the sale are increased by the premium originally received. As writer of an option, the Fund has no control over whether the option will be exercised and, as a result, retains the market risk of an unfavorable change in the price of the security underlying the written option.
The Fund may purchase put and call options. Put options are purchased to hedge against a decline in the value of securities held in the Fund’s portfolio. If such a decline occurs, the put options will permit the Fund to sell the securities underlying such options at the exercise price, or to close out the options at a profit. The premium paid for a put or call option plus any transaction costs will reduce the benefit, if any, realized by the Fund upon exercise of the option, and, unless the price of the underlying security rises or declines sufficiently, the option may expire worthless to the Fund. In addition, in the event that the price of the security in connection with which an option was purchased moves in a direction favorable to the Fund, the benefits realized by the Fund as a result of such favorable movement will be reduced by the amount of the premium paid for the option and related transaction costs. Written and purchased options are non-income producing securities. With purchased options, there is minimal counterparty risk to the Fund since these options are exchange traded and the exchange’s clearinghouse, as counterparty to all exchange traded options, guarantees against a possible default.
Short Sales – A “short sale” is a transaction in which the Fund sells a security it does not own but has borrowed in anticipation that the market price of the security will decline. The Fund is obligated to replace the security borrowed by purchasing it on the open market at a later date. If the price of the security sold short increases between the time of the short sale and the time the Fund replaces the borrowed security, the Fund will incur a loss, unlimited in size. Conversely, if the
22
| Crow Point Global Dividend Plus Fund |
| NOTES TO FINANCIAL STATEMENTS (Continued) |
| October 31, 2016 |
price declines, the Fund will realize a gain, limited to the price at which the Fund sold the security short. Certain cash and securities are held as collateral against the securities sold short.
Dividends and Distributions to Shareholders – Dividends from net investment income, if any, are declared and paid monthly. Distributable net realized capital gains, if any, are declared and distributed annually. Dividends from net investment income and distributions from net realized gains are determined in accordance with Federal income tax regulations, which may differ from GAAP. These “book/tax” differences are considered either temporary (e.g., deferred losses, capital loss carryforwards) or permanent in nature. To the extent these differences are permanent in nature, such amounts are reclassified within the composition of net assets based on their Federal tax-basis treatment; temporary differences do not require reclassification. Any such reclassifications will have no effect on net assets, results of operations, or net asset values per share of the Fund.
Federal Income Tax – It is the policy of the Fund to qualify as a regulated investment company by complying with the provisions of the Internal Revenue Code that are applicable to regulated investment companies and to distribute substantially all of its taxable income and net realized gains to shareholders. Therefore, no Federal income tax provision is required.
The Fund recognizes the tax benefits of uncertain tax positions only where the position is “more likely than not” to be sustained assuming examination by tax authorities. Management has analyzed the Fund’s tax positions, and has concluded that no liability for unrecognized tax benefits is expected to be taken in the Fund’s 2016 tax returns. The Fund identifies its major tax jurisdictions as U.S. Federal; however the Fund is not aware of any tax positions for which it is reasonably possible that the total amounts of unrecognized tax benefits will change materially in the next twelve months.
Indemnification – The Trust indemnifies its officers and Trustees for certain liabilities that may arise from the performance of their duties to the Trust. Additionally, in the normal course of business, the Fund enters into contracts that contain a variety of representations and warranties and which provide general indemnities. The Fund’s maximum exposure under these arrangements is unknown, as this would involve future claims that may be made against the Fund that have not yet occurred. However, based on industry experience, the risk of loss due to these warranties and indemnities appears to be remote.
| 3. | INVESTMENT TRANSACTIONS |
For the period ended October 31, 2016, cost of purchases and proceeds from sales of portfolio securities, other than short-term investments, amounted to $12,154,985 and $5,774,294, respectively.
| 4. | DERIVATIVE TRANSACTIONS |
Transactions in option contracts written during the period ended October 31, 2016 were as follows:
| Options Written | ||||||||
| Contracts | Premium | |||||||
| Outstanding at Beginning of Period | — | $ | — | |||||
| Options written | 789 | 51,758 | ||||||
| Options closed | (757 | ) | (43,680 | ) | ||||
| Outstanding at End of Period | 32 | $ | 8,078 | |||||
For the period ended October 31, 2016, the change in net unrealized appreciation and amount of net realized gains on written options subject to equity price risk amounted to $1,386 and $21,930, respectively. The figures for written options can be found in the Statement of Operations under the line items net change in unrealized appreciation (depreciation) on options written and net realized gain (loss) from options written. For the period ended October 31, 2016, the change in net unrealized depreciation and amount of net realized loss from purchased options subject to equity price risk amounted to $(611) and $(9,545), respectively. The figures for purchased options can be found in the Statement of Operations under the line items
23
| Crow Point Global Dividend Plus Fund |
| NOTES TO FINANCIAL STATEMENTS (Continued) |
| October 31, 2016 |
net change in unrealized appreciation (depreciation) on options purchased and net realized gain (loss) from options purchased.
The amounts realized and changes in unrealized gains and losses on derivative instruments during the year as disclosed above and within the Statement of Operations serve as indicators of the volume of derivative activity for the Fund.
| 3. | INVESTMENT ADVISORY AGREEMENT / TRANSACTIONS WITH RELATED PARTIES |
Recon Capital Partners, LLC (the “Advisor”), serves as the investment advisor to the Fund. Pursuant to an advisory agreement between the Advisor and the Trust, on behalf of the Fund, the Advisor, under the oversight of the Board, provides investment advisory services to the Fund. As compensation for its services and the related expenses borne by the Advisor, the Fund pays the Advisor a management fee, computed and accrued daily and paid monthly, at an annual rate of 1.20% of the Fund’s average daily gross invested assets. For the period ended October 31, 2016, the Fund incurred $52,610 of advisory fees payable to the Advisor.
Under a separate administration agreement, the Fund also pays the Advisor a fee of 0.10% of the Fund’s average daily net assets for providing certain administration services. For the period ended October 31, 2016, the Fund incurred $2,472 of advisory administration fees payable to the Advisor.
Sub-Advisor
Crow Point Partners, LLC, serves as the sub-advisor to the Fund and is registered as such with the SEC under the Investment Advisors Act of 1940.
The Sub-Advisor provides investment advisory services to the Fund, under the oversight of the Advisor and the Board of Trustees, pursuant to a sub-advisory agreement, dated June 1, 2016 (the “Sub-Advisory Agreement”). Under the terms of the Sub-Advisory Agreement, the Sub-Advisor, under the oversight of the Advisor and the Board of Trustees, provides a continuous investment program for the Fund’s portfolio; provides investment research and makes and executes recommendations for the purchase and sale of securities; provides facilities and personnel, including officers required for the operation of the Fund; facilitates the preparation of various regulatory filings; liaises with regulators or exchange personnel as appropriate; and fulfills certain regulatory compliance responsibilities. In consideration of the sub-advisory services provided by the Sub-Advisor to the Fund, the Advisor pays to the Sub-Advisor 50% of the Advisory Fee that the Advisor receives from the Fund at the end of each calendar month.
The Advisor, pursuant to an Expense Limitation Agreement (the “Agreement”) has contractually agreed to reduce its fees and/or absorb expenses of the Fund, at least until February 28, 2018 to ensure that Net Annual Operating Expenses (including organizational and offering expenses, but excluding taxes, borrowing costs (such as interest and dividend expense on securities sold short), brokerage commission, acquired fund fees and expenses and extraordinary expenses) will not exceed 2.95% of the Fund’s average daily net assets. The Agreement will allow the Advisor to recover amounts previously reimbursed for operating expense to the Fund to the extent that the Fund’s expense ratio falls below the above indicated expense limitation. The amount that can be recovered will be limited to the difference between the actual expense ratio and the amount of the expense limitation. Under such agreement, the Advisor can only recover such amounts for a period of up to three years. During the period ended October 31, 2016, the Advisor waived fees and reimbursed expenses of $34,344 subject to recapture, which will expire on October 31, 2019.
Distributor – The distributor of the Fund is Northern Lights Distributors, LLC (the “Distributor”). Under the terms of a distribution agreement (the “Distribution Agreement”) with the Distributor, the Distributor will directly distribute Shares to investors, and is authorized to retain brokers, dealers and certain financial advisors for distribution services and to provide ongoing investor services and account maintenances services to Shareholders holding Shares. The Fund will pay a monthly fee out of the net assets of Shares at the annual rate of up to 0.10% of the aggregate net asset value of the Shares. During the period ended October 31, 2016, the Fund did not pay any distribution fees.
In addition, certain affiliates of the Distributor provide services to the Fund as follows:
24
| Crow Point Global Dividend Plus Fund |
| NOTES TO FINANCIAL STATEMENTS (Continued) |
| October 31, 2016 |
Gemini Fund Services, LLC (“GFS”) – GFS, an affiliate of the Distributor, provides administration, fund accounting, and transfer agent services to the Trust. Pursuant to separate servicing agreements with GFS, the Fund pays GFS customary fees for providing administration, fund accounting and transfer agency services to the Fund.
Blu Giant, LLC (“Blu Giant”) – Blu Giant, an affiliate of GFS and the Distributor, provides EDGAR conversion and filing services as well as print management services for the Fund on an ad-hoc basis. For the provision of these services, Blu Giant receives customary fees from the Fund.
Trustees – The Fund pays each Trustee who is not affiliated with the Trust or Advisor a quarterly fee of $750, as well as reimbursement for any reasonable expenses incurred attending meetings. The “interested persons” who serve as Trustees of the trust receive no compensation for their services as Trustees. None of the executive officers receive compensation from the Trust.
| 4. | REPURCHASE OFFERS / SHARES OF BENEFICIAL INTEREST |
Repurchases of Shares – The Fund may from time to time offer to repurchase Shares pursuant to written tenders by Shareholders. The Advisors will recommend to the Board (subject to its discretion) that the Fund offer to repurchase Shares from Shareholders on a quarterly basis in an amount not to exceed 25% of the Fund’s NAV (the “Share Repurchase Program”). Upon commencement of the Share Repurchase Program, any repurchase of Shares from a Shareholder which were held for less than one year (on a first-in, first-out basis) will be subject to an early repurchase fee equal to 2% of the NAV of any Shares repurchased by the Fund (the “Early Repurchase Fee”). If an Early Repurchase Fee is charged to a Shareholder, the amount of such fee will be retained by the Fund.
At a special meeting held on October 4, 2016, the Board of Trustees, after considering all the relevant factors provided by Recon Capital Partners, LLC and Crow Point Partners, LLC, the Fund’s investment advisor and sub-advisor, respectively, authorized the Fund to conduct a tender offer for up to 51% of its outstanding shares on or about October 4, 2016 and may accept and over subscription of 5%.
| Repurchase Offer #1 | ||||
| Commencement Date | 9/26/2016 | |||
| Repurchase Request Deadline | 10/31/2016 | |||
| Repuchase Pricing Date | 10/31/2016 | |||
| Net Asset Value of Repurchase Pricing Date | $ | 9.62 | ||
| Amount Repurchased | $ | 4,872,510.76 | ||
| Percentage of Outstanding Shares Repurchased | 50.27 | % | ||
| 5. | CONTROL OWNERSHIP |
The beneficial ownership, either directly or indirectly, of more than 25% of the voting securities of a portfolio creates presumption of the control of the portfolio, under section 2(a)(9) of the 1940 Act. As of October 31, 2016, Ray Bartoszek, an affiliate of the Advisor, held approximately 78% of the voting securities of the Crow Point Global Dividend Plus Fund.
| 6. | DISTRIBUTIONS TO SHAREHOLDERS AND TAX COMPONENTS OF CAPITAL |
The tax character of distributions paid during the period ended October 31, 2016 was as follows:
| Period Ended | ||||
| October 31, 2016 | ||||
| Ordinary Income | $ | — | ||
| Long-Term Capital Gain | — | |||
| Return of Capital | 96,649 | |||
| $ | 96,649 | |||
25
| Crow Point Global Dividend Plus Fund |
| NOTES TO FINANCIAL STATEMENTS (Continued) |
| October 31, 2016 |
As of October 31, 2016, the components of accumulated earnings/ (deficit) on a tax basis as follows:
| Total | ||||||||||||||||||||||||
| Post October Loss | Capital Loss | Other | Unrealized | Accumulated | ||||||||||||||||||||
| Undistributed | Undistributed Long- | and Late Year | Carry | Book/Tax | Appreciation/ | Earnings/ | ||||||||||||||||||
| Ordinary Income | Term Gains | Loss | Forwards | Differences | (Depreciation) | (Deficits) | ||||||||||||||||||
| $ | — | $- | $ | — | $ | (135,775 | ) | $ | — | $ | (86,905 | ) | $ | (222,680 | ) | |||||||||
The difference between book basis and tax basis undistributed net investment income, accumulated net realized gain (loss), and unrealized depreciation from investments is primarily attributable to MTM on open 1256 contracts and passive foreign investment companies, adjustments for real estate investment trusts, partnerships, and C-Corporation return of capital distributions.
At October 31, 2016, the Fund had capital loss carry forwards for federal income tax purposes available to offset future capital gains as follows:
| Non-Expiring | Non-Expiring | |||||||||
| Short-Term | Long-Term | Total | ||||||||
| $ | 135,775 | $ | — | $ | 135,775 | |||||
Permanent book and tax differences, primarily attributable to the book/tax basis treatment of net operating losses and foreign currency gains/ (losses), tax adjustments pfic, for real estate investment trusts, return of capital from C-Corporation and capitalization in lieu of dividend payments, resulted in reclassification for the period ended October 31, 2016 as follows:
| Undistributed Net | Accumulated Net | |||||||||
| Investment Income | Realized Gains | |||||||||
| Paid In Capital | (Loss) | (Loss) | ||||||||
| $ | (34,528 | ) | $ | (64,746 | ) | $ | 99,274 | |||
| 7. | NEW ACCOUNTING PRONOUNCEMENT |
On October 13, 2016 the Securities and Exchange Commission amended existing rules intended to modernize reporting and disclosure of information. These amendments relate to Regulation S-X which sets forth the form and content of financial statements. At this time, management is evaluating the implications of adopting these amendments and their impact on the financial statements and accompanying notes.
| 8. | SUBSEQUENT EVENTS |
Subsequent events after the balance sheet date have been evaluated through the date the financial statements were issued. Management has concluded that there is no impact requiring adjustment or disclosure in the financial statements.
26

REPORT OF INDEPENDENT REGISTERED PUBLIC ACCOUNTING FIRM
To the Board of Trustees and the Shareholders of
Crow Point Global Dividend Plus Fund
We have audited the accompanying statement of assets and liabilities of Crow Point Global Dividend Plus Fund (the “Fund”) including the portfolio of investments, as of October 31, 2016, and the related statements of operations and changes in net assets and the financial highlights for the period July 27, 2016 (commencement of operations) through October 31, 2016. These financial statements and financial highlights are the responsibility of the Fund’s management. Our responsibility is to express an opinion on these financial statements and financial highlights based on our audit.
We conducted our audit in accordance with the standards of the Public Company Accounting Oversight Board (United States). Those standards require that we plan and perform the audit to obtain reasonable assurance about whether the financial statements and financial highlights are free of material misstatement. An audit includes examining, on a test basis, evidence supporting the amounts and disclosures in the financial statements. Our procedures included confirmation of securities owned as of October 31, 2016 by correspondence with the custodian and brokers. An audit also includes assessing the accounting principles used and significant estimates made by management, as well as evaluating the overall financial statement presentation. We believe that our audit provides a reasonable basis for our opinion.
In our opinion, the financial statements and financial highlights referred to above present fairly, in all material respects, the financial position of Crow Point Global Dividend Plus Fund as of October 31, 2016, and the results of its operations, the changes in its net assets and its financial highlights for the period July 27, 2016 through October 31, 2016, in conformity with accounting principles generally accepted in the United States of America.

BBD, LLP
Philadelphia, Pennsylvania
December 29, 2016
27
FACTORS CONSIDERED BY THE TRUSTEES IN APPROVAL OF INVESTMENT ADVISORY AND SUB-ADVISORY AGREEMENTS
At the organizational meeting (the “Meeting”) of the Board of Trustees (the “Board”) of Crow Point Global Dividend Plus Fund (the “Fund”) held on May 24, 2016, the Board, including the disinterested Trustees (the “Independent Trustees”), considered the approval of the Investment Advisory Agreement between the Fund and Recon Capital Partners, LLC (“Recon” or the “Adviser”) (“Advisory Agreement”). The Board further considered the approval of the Sub-Advisory Agreement between Recon and Crow Point Capital Partners, LLC (“Crow Point” or the “Sub-Adviser”) with respect to the Fund (“Sub-Advisory Agreement”).
Based on their evaluation of the information provided by Recon and Crow Point, in conjunction with the Fund’s other service providers, the Board, by a unanimous vote (including a separate vote of the Independent Trustees), approved the Advisory Agreement and Sub-Advisory Agreement with respect to the Fund.
In advance of the meeting, the Board requested and received materials to assist them in considering the Advisory Agreement and the Sub-Advisory Agreement. The materials provided contained information with respect to the factors enumerated below, including the Advisory Agreement and the Sub-Advisory Agreement, a memorandum prepared by the Independent Trustees’ outside legal counsel discussing in detail the Trustees’ fiduciary obligations and the factors they should assess in considering the approval of each of the Advisory Agreements and comparative information relating to the advisory fees and other expenses of the Fund. The materials also included due diligence materials relating to Recon and Crow Point (including due diligence questionnaires completed by Recon and Crow Point, select financial information of Recon and Crow Point, bibliographic information regarding Recon’s and Crow Point’s key management and investment advisory personnel, and comparative fee information relating to the Fund) and other pertinent information. At the Meeting, the Independent Trustees were advised by counsel that is experienced in Investment Company Act of 1940 matters and that is independent of fund management and met with such counsel separately from fund management.
The Board then reviewed and discussed the written materials that were provided in advance of the Meeting and deliberated on the approval of the Advisory Agreement with respect to the Fund. The Board relied upon the advice of independent legal counsel and their own business judgment in determining the material factors to be considered in evaluating the Advisory Agreement and Sub-Advisory Agreement and the weight to be given to each such factor. The conclusions reached by the Board were based on a comprehensive evaluation of all of the information provided and were not the result of any one factor. Moreover, each Trustee may have afforded different weight to the various factors in reaching his conclusions with respect to the Advisory Agreement and Sub-Advisory Agreement. In considering the approval of the Advisory Agreement and Sub-Advisory Agreement with respect to the Fund, the Board reviewed and analyzed various factors that they determined were relevant, including the factors enumerated below.
Nature, Extent and Quality of Services
The Board reviewed materials provided by Recon related to the proposed approval of the Advisory Agreement, including a description of the manner in which investment decisions will be made and executed with respect to the options strategy, a review of the professional personnel who will be performing services for the Fund, including the team of individuals that primarily monitors and executes the investment process and oversees the Aub-Adviser. The Board discussed the extent of Recon’s research capabilities, the quality of its compliance infrastructure and the experience of its fund management personnel. Additionally, the Board received satisfactory responses from the representatives of the Adviser with respect to a series of important questions, including: whether Recon was involved in any lawsuits or pending regulatory actions; whether the management of other accounts would conflict with its management of the Fund; and whether there are procedures in place to adequately allocate trades among its respective clients. The Board reviewed the description provided on the practices for monitoring compliance with the Fund’s investment limitations. The Board concluded that Recon had sufficient quality and depth of personnel, resources, investment methods and compliance
28
policies and procedures essential to performing its duties under the Advisory Agreement and that the nature, overall quality and extent of the management services to be provided by Recon to the Fund would be satisfactory.
Performance
Because the Fund had not yet commenced operations, the Trustees could not consider its past performance. The Board did note, as discussed below, that the Sub-Adviser has successfully managed a private fund with a similar strategy.
Fees and Expenses
As to the costs of the services provided by Recon, the Board discussed the comparison of advisory fees and total operating expense data and reviewed the Fund’s advisory fee and overall expenses compared to a peer group comprised of funds constructed by Recon and the Sub-Adviser with similar investment objectives and strategies. The Board noted that the advisory fee for the Fund was below the peer group average. The Board reviewed the contractual arrangements for the Fund, which stated that Recon had agreed to waive or limit its advisory fee and/or reimburse expenses at least until February 28, 2018, in order to limit net annual operating expenses, exclusive of certain fees, so as not to exceed 2.95%, of the Fund’s average net assets and found such arrangements to be beneficial to shareholders. The Board concluded that based on Recon’s experience, expertise and services to be provided to the Fund, the advisory fee charged by Recon and the expense cap for the Fund were reasonable.
Profitability
The Board also considered the level of profits that could be expected to accrue to the Adviser with respect to the Fund based on profitability reports and analyses reviewed by the Board and the selected financial information of the Adviser provided by the Adviser. After review and discussion, the Board concluded that the Advisory Agreement would initially be unprofitable to the Adviser and, once the Fund had sufficient assets, the anticipated profit from Recon’s relationship with the Fund would not be excessive.
Economies of Scale
As to the extent to which the Fund will realize economies of scale as it grows, and whether the fee levels reflect these economies of scale for the benefit of investors, the Board discussed Recon’s expectations for growth of the Fund. After consideration, the Board concluded that any material economies of scale would not be achieved in the near term
The Board then reviewed and discussed the written materials that were provided by Crow Point in advance of the Meeting and deliberated on the approval of the Sub-Advisory Agreement. In addition to the materials described above, the Board reviewed: (i) the nature and quality of the investment advisory services to be provided by Crow Point, including the experience and qualifications of the personnel providing such services; (ii) the investment strategies and style of investing of Crow Point; (iii) the performance history of Crow Point; and (iv) Crow Point’s financial condition, history of operations and ownership structure. In considering the approval of the Sub-Advisory Agreement, the Board reviewed and analyzed various factors that they determined were relevant, including the factors enumerated below.
Nature, Extent and Quality of Services.
As to the nature, quality and extent of the services to be provided by Crow Point, the Board noted the experience of the portfolio management and research personnel of Crow Point, including their experience in the investment field, education and industry credentials. The Board reviewed the presentation materials prepared by Crow Point describing its investment process. The Board received satisfactory responses from Crow Point with respect to a series of important questions, including: whether Crow Point is involved in any lawsuits or pending regulatory actions. The Board discussed Crow Point’s compliance structure and broker selection process. In consideration of the compliance policies and
29
procedures for Crow Point included in the Board Materials, the Board concluded that Crow Point had sufficient quality and depth of personnel, resources, investment methods and compliance policies and procedures essential to performing their duties under the Sub-Advisory Agreement and that the nature, overall quality and extent of investment management services to be provided to the Fund would be satisfactory.
Performance
The Board considered and reviewed the performance of a private fund with a similar investment objective and managed pursuant to a similar investment strategy by Crow Point as well as other factors relating to Crow Point’s track record. The Board concluded that the prior performance track record of Crow Point suggested that Crow Point has the wherewithal to manage the Fund, which uses a substantially similar investment strategy to achieve its objective.
Fees and Expenses
As to the costs of the services to be provided by Crow Point, the Board discussed the sub-advisory fee payable to Crow Point. The Board considered that Crow Point is to be paid by the Adviser and not by the Fund. The Adviser confirmed to the Board that the Adviser was of the opinion that the sub-advisory fee to be paid to Crow Point would be reasonable in light of the anticipated quality of the services to be performed by them and the proposed division of services between the Adviser and Sub-Adviser. The Trustees discussed the total fees expected to be paid to Crow Point, and noted that Crow Point will receive no other compensation from the Fund or the Adviser except the sub-advisory fee earned pursuant to the Sub-Advisory Agreement and payable by the Adviser. Based on the representations of the Adviser and the materials provided, the Board concluded that the sub-advisory fee to be paid to Crow Point was reasonable.
Profitability
As to profits to be realized by Crow Point, the Trustees noted that all sub-advisory fees will be paid by the Adviser, and not directly paid by the Fund. Consequently, the Board did not consider the costs of services provided by Crow Point or its profitability to be significant factors.
Economies of Scale.
Since the sub-advisory fees are not paid by the Fund, the Board did not consider whether the sub-advisory fees should reflect any potential economies of scale that might be realized as the assets of the Fund increase.
Conclusion.
Counsel again assisted the Board throughout the agreement review process. The Board relied upon the advice of counsel, and their own business judgment in determining the material factors to be considered in evaluating the Advisory Agreement and the Sub-Advisory Agreement and the weight to be given to each such factor. Accordingly, having requested and received such information from Recon and Crow Point, as the Board believed to be reasonably necessary to evaluate the terms of the Advisory Agreement and Sub-Advisory Agreement as appropriate, and as assisted by the advice of independent counsel, the Board, including a majority of the Independent Trustees, determined that, with respect to the Advisory Agreement and Sub-Advisory Agreement separately, (a) the terms of the Advisory Agreement and Sub-Advisory Agreement are reasonable; (b) the advisory fee and sub-advisory fee are reasonable; and (c) the Advisory Agreement and Sub-Advisory Agreement is in the best interests of the Fund and its shareholders, as appropriate. In considering the approval of each Advisory Agreement, the Board did not identify any one factor as all important, but rather considered these factors collectively and determined that approval of the Advisory Agreement and Sub-Advisory Agreement was in the best interests of the Fund and its respective shareholders as appropriate. Moreover, the Board noted that each Trustee may have afforded different weight to the various factors in reaching his conclusions with respect to the Advisory Agreement and Sub-Advisory Agreement.
30
| Crow Point Global Dividend Plus Fund |
| SUPPLEMENTAL INFORMATION (Unaudited) |
| October 31, 2016 |
Information Regarding Independent Trustees
| Name, Address and Age1 | Position with the Fund | Term of Office and Length of Time Served* | Principal Occupation(s) and Other Directorships/Trusteeships During Past Five Years | Number of Portfolios in Fund Complex Overseen by Trustee |
| Mark W. Buckley-Jones, 36 | Independent Trustee | Since 2016 | Controller and Chief Compliance Officer, Numina Capital Management, LLC (January 2014-Present); Chief Financial Officer, VS Capital Partners, LP (August 2011-December 2013) and Berman Capital Management, LP (May 2007-July 2011). | 1 |
| John L. Jacobs, 57 | Independent Trustee | Since 2016 | Independent Consultant (January 2015-Present); Executive Vice President, Global Information Services, of The NASDAQ OMX Group (January 2010-January 2015). | 1 |
| Robinson C. Jacobs, 37 | Independent Trustee | Since 2016 | Analyst, Gagnon Securities (September 2012-Present); Vice President, CSL Capital (April 2011-May 2012); Consultant to various hedge fund groups. | 1 |
| Garrett K. Paolella, 30 | Interested Trustee | Since 2016 | Managing Partner, Recon Capital Partners, LLC (October 2011-Present); Executive Director, MKM Partners (research, sales and trading firm) (June 2008-January 2011). | 1 |
| Peter J. DeCaprio, 54 | Interested Trustee | Since 2016 | Member, Crow Point Partners, LLC (2006-Present). | 1 |
Information Regarding Officers
| Name, Address and Age1 | Position with the Fund | Length of Time Served | Principal Occupation(s) During Past Five Years |
| Troy M. Cates, 39 | Secretary | Since 2016 | Rider A |
| James B. Craver, 72 | Chief Compliance Officer | Since 2016 | Attorney, James B. Craver & Associates Pc (law firm) (2009–Present). |
| 1. | The address for each Trustee and officer is 1 Landmark Square, 8th Floor, Stamford, Connecticut 06901. |
31
Privacy Policy
May 2016
| FACTS | WHAT DOES CROW POINT GLOBAL DIVIDEND PLUS FUND (“CROW POINT”) DO WITH YOUR PERSONAL INFORMATION? | |
| Why? | Financial companies choose how they share your personal information. Federal law gives consumers the right to limit some but not all sharing. Federal law also requires us to tell you how we collect, share, and protect your personal information. Please read this notice carefully to understand what we do. | |
| What? | The types of personal information we collect and share depend on the product or service you have with us. This information can include: | |
● Social Security number
● Employment information
● Account balances | ● Account transactions
● Income
● Investment experience | |
When you are no longer our customer, we continue to share your information as described in this notice. | ||
| How? | All financial companies need to share a customer’s personal information to run their everyday business - to process transactions, maintain customer accounts, and report to credit bureaus. In the section below, we list the reasons financial companies can share their customer’s personal information; the reasons Crow Point chooses to share; and whether you can limit this sharing. | |
| Reasons we can share your personal information | Does Crow Point share? | Can you limit this sharing? |
For our everyday business purposes — such as to process your transactions, maintain your account(s), respond to court orders and legal investigations, or report to credit bureaus | Yes | No |
For our marketing purposes — to offer our products and services to you | Yes | No |
For joint marketing with other financial companies | Yes | No |
For our affiliates’ everyday business purposes — information about your transactions and experiences | Yes | No |
For our affiliates’ everyday business purposes — information about your creditworthiness | No | We don’t share |
For nonaffiliates to market to you | No | We don’t share |
| Questions? | Call 1-402-493-4603 |
| Who we are | ||
| Who is providing this notice? | Crow Point Global Dividend Plus Fund (“Crow Point”) | |
| What we do | ||
| How does Crow Point protect my personal information? | To protect your personal information from unauthorized access and use, we use security measures that comply with federal law. These measures include computer safeguards and secured files and buildings. | |
| How does Crow Point collect my personal information? | We collect your personal information, for example, when you: | |
● open an account
● give us your income information
● provide employment information
| ● provide account information
● give us your contact information | |
| We also collect your personal information from others, such as credit bureaus, affiliates, or other companies. | ||
| Why can’t I limit all sharing? | Federal law gives you the right to limit only
● sharing for affiliates’ everyday business purposes—information about your creditworthiness
● affiliates from using your information to market to you
● sharing for nonaffiliates to market to you
State laws and individual companies may give you additional rights to limit sharing. | |
| Definitions | ||
| Affiliates | Companies related by common ownership or control. They can be financial and nonfinancial companies.
● Crow Point does not share with our affiliates | |
| Nonaffiliates | Companies not related by common ownership or control. They can be financial and nonfinancial companies.
● Crow Point does not share with nonaffiliates so they can market to you. | |
| Joint marketing | A formal agreement between nonaffiliated financial companies that together market financial products and services to you.
● Crow Point does not jointly market. | |
PROXY VOTING POLICY
Information regarding how the Fund voted proxies relating to portfolio securities for the most recent twelve month period ended June 30 as well as a description of the policies and procedures that the Fund uses to determine how to vote proxies is available without charge, upon request, by calling 1-855-282-1100 or by referring to the Securities and Exchange Commission’s (“SEC”) website at http://www.sec.gov.
PORTFOLIO HOLDINGS
The Fund files its complete schedule of portfolio holdings with the SEC for the first and third quarters of each fiscal year on Form N-Q. Form N-Q is available on the SEC’s website at http://www.sec.gov and may be reviewed and copied at the SEC’s Public Reference Room in Washington, DC (1-800-SEC-0330). The information on Form N-Q is available without charge, upon request, by calling 1-855-282-1100.
INVESTMENT ADVISOR
Recon Capital Partners
1 Landmark Square, 8th Floor
Stamford, CT 06901
SUB-ADVISOR
Crow Point Partners, LLC
25 Recreation Park Drive, Suite 110
Hingham, MA 02043
ADMINISTRATOR
Gemini Fund Services, LLC
80 Arkay Drive, Suite 110
Hauppauge, NY 11788
Item 2. Code of Ethics.
| (a) | The registrant has adopted a code of ethics that applies to the registrant’s principal executive officer, principal financial officer, principal accounting officer or controller, or persons performing similar functions. The Code of Ethics may be obtained without charge by calling 844-798-3838. | |
| (b) | During the period covered by the report, with respect to the registrant’s code of ethics that applies to its principal executive officer, principal financial officer, principal accounting officer or controller, or persons performing similar functions; there have been no amendments to, nor any waivers granted from any provision thereof.
|
Item 3. Audit Committee Financial Expert.
| 3(a)(1) | The registrant’s board of trustees has determined that the registrant has at least one audit committee financial expert serving on its audit committee. | ||||||||||
| 3(a)(2) | The audit committee financial expert is Mark W. Buckley-Jones, who is “independent” for purposes of this Item 3 of Form N-CSR. | ||||||||||
| Item 4. Principal Accountant Fees and Services. | |||||||||||
| Current Year | Previous Year | ||||||||||
| (a) Audit Fees | $ | 16,500 | $0 | ||||||||
| (b) Audit-Related Fees | $ | 0 | N/A | ||||||||
| (c) Tax Fees | $ | 3,000 | N/A | ||||||||
| (d) All Other Fees | $ | 0 | N/A | ||||||||
Audit fees include fees associated with the audit of the registrant’s annual financial statements and include fees associated with annual audits for providing a report in connection with the registrant’s report on Form N-CSR. Tax fees include fees for tax compliance, tax advice and tax planning, and include fees for assisting management in preparation of tax estimates.
| (e)(1) | The registrant’s audit committee pre-approves the principal accountant’s engagements for audit and non-audit services to the registrant, and certain non-audit services that are required to be pre-approved on a case by case basis. Pre-approval considerations include whether the proposed services are compatible with maintaining the principal accountant’s independence. | |||
| (e)(2) | There were no services described in each of paragraphs (b) through (d) of this Item that were approved by the audit committee pursuant to paragraph (c)(7)(i)(C) of Rule 2-01 of Regulation S-X, because such services were pre-approved. | |||
| (f) | Not applicable. | |||
| (g) | Not applicable. | |||
| (h) | Not applicable. | |||
Item 5. Audit Committee of Listed Registrants.
Not applicable.
Item 6. Schedule of Investments.
| (a) | Schedule of Investments in securities of unaffiliated issuers as of the close of the reporting period is included in the report to shareholders filed under item 1 of this form. | |
| (b) | Not applicable.
|
ITEM 7. DISCLOSURE OF PROXY VOTING POLICIES AND PROCEDURES FOR CLOSED-END MANAGEMENT INVESTMENT COMPANIES.
LIMITATIONS
Crow Point will generally vote on all proxies it receives. However, Crow Point may refrain from voting a proxy if the shares are no longer held by the client at the time of the meeting. Unsupervised securities, or securities held below the line, will also be excluded.
ANNUAL REVIEW OF PROXY POLICY
On an annual basis, Crow Point will amend or update, as necessary, to remain consistent and current with its proxy practices. Client interests, compliance, and regulatory requirements will be reviewed and addressed. Changes to the Proxy voting will be disclosed to the board of trustees during its annual 15(c) meeting.
DISCLOSURE
Crow Point discloses a summary of its proxy voting policy in its Form ADV Part 2.
PROXY VOTING GUIDELINES
When voting proxies, Crow Point looks at each company independently. It applies its own criteria as voting guidelines, and generally vote in accordance with issuer recommendations. However, Crow Point reviews each issue on the proxy ballet and vote on a case-by-case basis.
Item 8. Portfolio Managers of Closed-End Management Investment Companies.
Timothy P. O’Brien, CFA
Co-Founder, Principal and Co-Chief Investment Officer, Crow Point Partners, LLC.
Mr. O’Brien has been with Crow Point Partners, LLC, Inc. since he founded it in 2006. Prior to that, he was lead portfolio manager at Evergreen Investments, Gabelli Management and Eaton Vance. Mr. O’Brien holds an undergraduate degree from the University of Massachusetts, Amherst, and an MBA from the University of Pennsylvania’s Wharton School of Business. Mr. O’Brien has been a professional investor for almost 30 years and has been a featured guest on Bloomberg TV and CNBC. Mr. O’Brien is often quoted in such financial media such as the Wall Street Journal, Dow Jones Newswires, Bloomberg, Fortune and Barron’s.
Andrew Tuttle
Portfolio Manager/Research Analyst, Crow Point Partners, LLC.
Mr. Tuttle has been with Crow Point Partners, LLC, Inc. since 2007. Mr. Tuttle has more than 13 years’ experience in investment banking, distressed debt and equity research. Currently, he is a co-portfolio manager on the Crow Point Defined Risk Global Equity Income fund and the EAS Crow Point Alternatives fund. Previously, he was head of equity research at Crow Point. He has also worked at Cantor Fitzgerald, Jeffries & Co., Thomas Weisel Partners, and First Union National Bank. He is a graduate of Columbia University, where he received his MBA, and the College of William and Mary, where he received a Bachelor of Arts degree.
Peter DeCaprio
Principal, Portfolio Manager, Co-Founder, Crow Point Partners, LLC.
Mr. DeCaprio co-founded Crow Point Partners in 2006. He serves as the firm’s Head of Trading and is a co-portfolio manager on the Crow Point Defined Risk Global Equity Income fund, the EAS Crow Point Alternatives fund, and other private L.P. vehicle. Previously, Mr. DeCaprio worked at Evergreen Investments as a senior analyst covering the utility, telecommunications, and media sectors. Prior to Evergreen, Mr. DeCaprio was a senior equity analyst at Thomas Weisel Partners. He has also worked as an analysts at BancBoston Robertson Stephens, Dillon Read and Co. Inc., Houlihan Lockey Howard and Zukin, and TIAA-CREF. He is a graduate of Duke University’s Fuqua School of Business, where is received his MBA, and Tufts University, where he received a Bachelor of Arts degree.
Charles Chen
Portfolio Manager, Chief Investment Officer, Crow Point Investment Management, LLC.
Charles Chen is Chief Investment Officer at Crow Point Investment Management, LLC. (CPIM), a strategic partnership between Crow Point Partners, LLC and 20 Gates Management LLC. Mr. Chen joined CPIM from his position as Chief Investment Officer at 20 gates, and has 19 years’ experience in fixed income and derivatives markets. Most recently, he was the President & Chief Investment Officer at Newfleet Asset Management, overseeing all aspects of the institutional asset management business. Prior to founding Newfleet, Mr. Chen headed the asset management division of Securities Finance Trust Company (formerly Old Mutual US Trust Company) with over $50 Billion in assets under management. Mr. Chen has also been a Portfolio Manager with Credit Suisse First Boston, managing the $40 billion internal portfolio of its Investment Banking Division which included bank loans, credit derivatives, two landmark CLOs and five off-balance sheet conduit portfolios He is a seasoned portfolio manager with expertise in the management, trading and structuring of credit-risk; possessing in-depth knowledge of fixed income and derivative markets. Charles received a BA in Economics from the University of Wisconsin-Madison.
As of October 31, 2016, Tim O’Brien was responsible for the management of the following types of accounts in addition to the Fund:
| Other Accounts By Type | Total Number of Accounts by Account Type | Total Assets By Account Type | Number of Accounts by Type Subject to a Performance Fee | Total Assets By Account Type Subject to a Performance Fee |
| Registered Investment Companies | 3 | $850 mil | 0 | $0 |
| Other Pooled Investment Vehicles | 0 | $0 | 0 | $0 |
| Other Accounts | 0 | $0 | 0 | $0 |
As of October 31, 2016, Peter DeCaprio was responsible for the management of the following types of accounts in addition to the Fund:
| Other Accounts By Type | Total Number of Accounts by Account Type | Total Assets By Account Type | Number of Accounts by Type Subject to a Performance Fee | Total Assets By Account Type Subject to a Performance Fee |
| Registered Investment Companies | 4 | $50 mil | 0 | $0 |
| Other Pooled Investment Vehicles | 0 | $0 | 0 | $0 |
| Other Accounts | 0 | $0 | 0 | $0 |
As of October 31, 2016, Andrew Tuttle was responsible for the management of the following types of accounts in addition to the Fund:
| Other Accounts By Type | Total Number of Accounts by Account Type | Total Assets By Account Type | Number of Accounts by Type Subject to a Performance Fee | Total Assets By Account Type Subject to a Performance Fee |
| Registered Investment Companies | 4 | $50 mil | 0 | $0 |
| Other Pooled Investment Vehicles | 0 | $0 | 0 | $0 |
| Other Accounts | 0 | $0 | 0 | $0 |
As of October 31, 2016, Charles Chen was responsible for the management of the following types of accounts in addition to the Fund:
| Other Accounts By Type | Total Number of Accounts by Account Type | Total Assets By Account Type | Number of Accounts by Type Subject to a Performance Fee | Total Assets By Account Type Subject to a Performance Fee |
| Registered Investment Companies | 2 | $16 mil | 0 | $0 |
| Other Pooled Investment Vehicles | 1 | $15 mil | 0 | $0 |
| Other Accounts | 0 | $0 | 0 | $0 |
Item 9. Purchases of Equity Securities by Closed-End Management Investment Company and Affiliated Purchasers.
Not applicable.
Item 10. Submission of Matters to a Vote of Security Holders.
Not applicable.
Item 11. Controls and Procedures.
(a)The registrant’s principal executive officer and principal financial officer have concluded, based on their evaluation of the registrant’s disclosure controls and procedures as conducted within 90 days of the filing date of this report, that these disclosure controls and procedures are adequately designed and are operating effectively to ensure that information required to be disclosed by the registrant on Form N-CSR is recorded, processed, summarized and reported within the time periods specified in the Securities and Exchange Commission’s rules and forms.
(b)There were no changes in the registrant’s internal control over financial reporting (as defined in Rule 30a-3(d) under the Act (17 CFR 270.30a-3(d)) that occurred during the second fiscal quarter of the period covered by this report that have materially affected or are reasonably likely to materially affect, the registrant’s internal control over financial reporting.
Item 12. Exhibits.
(a)(1) Not applicable. See Item 2.
(a)(2) Certifications pursuant to Rule 30a-2(a) are attached hereto.
(c) Certifications pursuant to Rule 30a-2(b) are furnished herewith.
SIGNATURES
Pursuant to the requirements of the Securities Exchange Act of 1934 and the Investment Company Act of 1940, the registrant has duly caused this report to be signed on its behalf by the undersigned, thereunto duly authorized.
(Registrant) Crow Point Global Dividend Plus Fund
By /s/ Peter DeCaprio Portfolio Manager
Date January 5, 2017
|