Exhibit 99.3

MANAGEMENT’S DISCUSSION AND ANALYSIS
FOR THE YEAR ENDED
DECEMBER 31, 2018
March 6, 2019
TABLE OF CONTENTS
1 | |
2 | |
3 | |
4 | |
10 | |
11 | |
12 | |
17 | |
25 | |
30 | |
35 | |
36 | |
39 | |
Off Balance Sheet Arrangements and Related Party Transactions | 44 |
45 | |
46 | |
Disclosure Controls and Procedures and Internal Control over Financial Reporting | 46 |
49 |
MANAGEMENT’S DISCUSSION AND ANALYSIS
This Management’s Discussion and Analysis (this “MD&A”) provides a review of the results of operations, financial condition and cash flows for The Stars Group Inc. on a consolidated basis for the quarter and year ended December 31, 2018. References to “The Stars Group” or the “Corporation” in this MD&A refer to The Stars Group Inc. and its subsidiaries or any one or more of them, unless the context requires otherwise. This document should be read in conjunction with the information contained in the Corporation’s audited consolidated financial statements and related notes for the year ended December 31, 2018 (the “2018 Annual Financial Statements”), and the Corporation’s annual information form for the year ended December 31, 2018 (the “2018 Annual Information Form” and together with this MD&A and the 2018 Annual Financial Statements, the “2018 Annual Reports”). These documents and additional information regarding the business of the Corporation are available on the System for Electronic Document Analysis and Retrieval (“SEDAR”) at www.sedar.com, the Electronic Data Gathering, Analysis, and Retrieval system (“EDGAR”) at www.sec.gov, and the Corporation’s website at www.starsgroup.com.
For reporting purposes, the Corporation prepared the 2018 Annual Financial Statements in U.S. dollars and, unless otherwise indicated, in conformity with International Financial Reporting Standards (“IFRS”) as issued by the International Accounting Standards Board (“IASB”). The financial information contained in this MD&A was derived from the 2018 Annual Financial Statements. Unless otherwise indicated, all references to “USD” and “$” are to U.S. dollars, “EUR” or “€” are to European Euros, “GBP” or “£” are to British pound sterling, “CDN” or “CDN $” are to Canadian dollars and “AUD” or “AUD $” are to Australian dollars. Unless otherwise indicated, all references to a specific “note” refer to the notes to the 2018 Annual Financial Statements.
As at December 31, 2018, the Corporation had three reporting segments, “International”, “United Kingdom” and “Australia”, each with certain major lines of operations, and a “Corporate” cost center, all as further described below. The International segment currently includes the business operations of Stars Interactive Group, the United Kingdom segment currently includes the business operations of Sky Betting & Gaming, and the Australia segment currently includes the business operations of BetEasy (each as defined below). Prior quarterly and annual segmental results and information presented in this MD&A have been recast to be presented in a manner consistent with these reporting segments. See “Segment Results of Operations” below and note 7 of the 2018 Annual Financial Statements for additional information on the Corporation’s reporting segments.
As at December 31, 2018, the Corporation had up to four major lines of operations within each of its reporting segments, as applicable: real-money online poker (“Poker”), real-money online betting (“Betting”), real-money online casino and, where applicable, bingo (collectively, “Gaming”), and other gaming-related revenue, including revenue from social and play-money gaming, live poker events, branded poker rooms, Oddschecker and other nominal sources of revenue (collectively, “Other”). As it relates to these lines of operation, online revenue includes revenue generated through the Corporation’s online, mobile and desktop client platforms, as applicable.
For purposes of this MD&A: (i) the term “gaming license” refers collectively to all the different licenses, consents, permits, authorizations, and other regulatory approvals that are necessary to be obtained in order for the recipient to lawfully conduct (or be associated with) gaming in a particular jurisdiction; and (ii) unless the context requires otherwise or otherwise defined (particularly as it relates to the Gaming line of operation as used in this MD&A and the 2018 Annual Financial Statements, which currently only includes real-money online casino and, where applicable, bingo revenue), all references in this MD&A to “gaming” include all online gaming (e.g., poker, casino and bingo) and betting.
Unless otherwise stated, in preparing this MD&A the Corporation has considered information available to it up to March 6, 2019, the date the Corporation’s board of directors (the “Board”) approved the 2018 Annual Reports, including this MD&A.
1
CAUTION REGARDING FORWARD-LOOKING STATEMENTS
The 2018 Annual Reports, including this MD&A, contain certain information that may constitute forward-looking information and statements (collectively, “forward-looking statements”) within the meaning of the Private Securities Litigation Reform Act of 1995 and applicable securities laws, including financial and operational expectations and projections. These statements, other than statements of historical fact, are based on management’s current expectations and are subject to a number of risks, uncertainties, and assumptions, including market and economic conditions, business prospects or opportunities, future plans and strategies, projections, technological developments, anticipated events and trends and regulatory changes that affect the Corporation, its subsidiaries and their respective customers and industries. Although the Corporation and management believe the expectations reflected in such forward-looking statements are reasonable and are based on reasonable assumptions and estimates as at the date hereof, there can be no assurance that these assumptions or estimates are accurate or that any of these expectations will prove accurate. Forward-looking statements are inherently subject to significant business, regulatory, economic and competitive risks, uncertainties and contingencies that could cause actual events to differ materially from those expressed or implied in such statements. Forward-looking statements are often, but not always, identified by the use of words such as “seek”, “anticipate”, “plan”, “continue”, “estimate”, “expect”, “may”, “will”, “project”, “predict”, “potential”, “targeting”, “intend”, “could”, “might”, “would”, “should”, “believe”, “objective”, “ongoing”, “imply” or the negative of these words or other variations or synonyms of these words or comparable terminology and similar expressions. For example, see “Non-IFRS Measures, Key Metrics and Other Data”, “Overview and Outlook”, “Liquidity and Capital Resources” and “Recent Accounting Pronouncements”.
Specific factors and assumptions include the following: the heavily regulated industry in which the Corporation carries on its business; risks associated with interactive entertainment and online and mobile gaming generally; current and future laws or regulations and new interpretations of existing laws or regulations, or potential prohibitions, with respect to interactive entertainment or online gaming or activities related to or necessary for the operation and offering of online gaming; potential changes to the gaming regulatory framework; legal and regulatory requirements; ability to obtain, maintain and comply with all applicable and required licenses, permits and certifications to offer, operate, and market its product offerings, including difficulties or delays in the same; significant barriers to entry; competition and the competitive environment within addressable markets and industries; impact of inability to complete future or announced acquisitions or to integrate businesses successfully, including Sky Betting & Gaming and BetEasy; the Corporation’s substantial indebtedness requires that it use a significant portion of its cash flow to make debt service payments; the Corporation’s secured credit facilities contain covenants and other restrictions that may limit the Corporation’s flexibility in operating its business; risks associated with advancements in technology, including artificial intelligence; ability to develop and enhance existing product offerings and new commercially viable product offerings; ability to mitigate foreign exchange and currency risks; ability to mitigate tax risks and adverse tax consequences, including changes in tax laws or administrative policies relating to tax and the imposition of new or additional taxes, such as value-added (“VAT”) and point of consumption taxes, and gaming duties; the Corporation’s exposure to greater than anticipated tax liability; risks of foreign operations generally; protection of proprietary technology and intellectual property rights; ability to recruit and retain management and other qualified personnel, including key technical, sales and marketing personnel; defects in product offerings; losses due to fraudulent activities; management of growth; contract awards; potential financial opportunities in addressable markets and with respect to individual contracts; ability of technology infrastructure to meet applicable demand and reliance on online and mobile telecommunications operators; systems, networks, telecommunications or service disruptions or failures or cyber-attacks and failure to protect customer data, including personal and financial information; regulations and laws that may be adopted with respect to the Internet and electronic commerce or that may otherwise impact the Corporation in the jurisdictions where it is currently doing business or intends to do business, particularly those related to online gaming or that could impact the ability to provide online product offerings, including as it relates to payment processing; ability to obtain additional financing or to complete any refinancing on reasonable terms or at all; customer and operator preferences and changes in the economy; dependency on customers’ acceptance of its product offerings; consolidation within the gaming industry; litigation costs and outcomes; expansion within existing and into new markets; relationships with vendors and distributors; natural events; contractual relationships of SBG (as defined below) or the Corporation with Sky plc and/or its subsidiaries; counterparty risks; failure of systems and controls of the Corporation to restrict access to its products; reliance on scheduling and live broadcasting of major sporting events; macroeconomic conditions and trends in the gaming industry; bookmaking risks; an ability to realize projected financial increases attributable to acquisitions and the Corporation’s business strategies; and an ability to realize all or any of the Corporation’s estimated synergies and cost savings in connection with acquisitions, including the SBG Acquisition and Australian Acquisitions (each as defined below). These factors are not intended to represent a complete list of the factors that could affect the Corporation; however, these factors, as well as those risk factors presented under the heading “Risk Factors and Uncertainties” in the 2018 Annual Information Form, elsewhere in this
2
MD&A and the 2018 Annual Reports and in other filings that The Stars Group has made and may make in the future with applicable securities authorities, should be considered carefully.
The foregoing list of important factors and assumptions may not contain all the material factors and assumptions that are important to shareholders and investors. Shareholders and investors should not place undue reliance on forward-looking statements as the plans, assumptions, intentions or expectations upon which they are based might not occur. The forward-looking statements contained in this MD&A are expressly qualified by this cautionary statement. Unless otherwise indicated by the Corporation, forward-looking statements in this MD&A describe the Corporation’s expectations as at March 6, 2019, and, accordingly, are subject to change after such date. The Corporation does not undertake to update or revise any forward-looking statements to reflect events and circumstances after the date hereof or to reflect the occurrence of unanticipated events, except in accordance with applicable securities laws.
RISK FACTORS AND UNCERTAINTIES
Certain factors may have a material adverse effect on the Corporation’s business, financial condition and results of operations. Current and prospective investors should carefully consider the risks and uncertainties and other information contained in this MD&A and the 2018 Annual Reports, particularly under the heading “Risk Factors and Uncertainties” in the 2018 Annual Information Form, and in other filings that the Corporation has made and may make in the future with applicable securities authorities, including those available on SEDAR at www.sedar.com, EDGAR at www.sec.gov or The Stars Group’s website at www.starsgroup.com. The risks and uncertainties described herein and therein are not the only ones the Corporation may face. Additional risks and uncertainties that the Corporation is unaware of, or that the Corporation currently believes are not material, may also become important factors that could adversely affect the Corporation’s business. If any of such risks actually occur, the Corporation’s business, financial condition, results of operations, and future prospects could be materially and adversely affected. In that event, the trading price of the common shares of the Corporation (the “Common Shares”) (or the value of any other securities of the Corporation) could decline, and the Corporation’s securityholders could lose part or all of their investment.
3
NON-IFRS MEASURES, KEY METRICS AND OTHER DATA
This MD&A references non-IFRS financial measures and key metric operational performance measures, including those under the headings “Consolidated Results of Operations and Cash Flows”, “Segment Results of Operations”, and “Reconciliations” below. The Corporation believes these measures and metrics will provide investors with useful supplemental information about the financial and operational performance of its business, enable comparison of financial results between periods where certain items may vary independent of business performance, and allow for greater transparency with respect to key metrics used by management in operating its business, identifying and evaluating trends, and making decisions. The Corporation believes that such non-IFRS financial measures provide useful information about its underlying, core operating results and trends, enhance the overall understanding of its past performance and future prospects and allow for greater transparency with respect to metrics and measures used by management in its financial and operational decision-making.
Although management believes these non-IFRS financial measures and key metrics are important in evaluating the Corporation, they are not intended to be considered in isolation or as a substitute for, or superior to, financial information prepared and presented in accordance with IFRS. They are not recognized measures under IFRS and do not have standardized meanings prescribed by IFRS. These measures may be different from non-IFRS financial measures and key metrics used by other companies and may not be comparable to similar meanings prescribed by other companies, limiting their usefulness for comparison purposes. Moreover, presentation of certain of these measures is provided for period-over-period comparison purposes, and investors should be cautioned that the effect of the adjustments thereto provided herein have an actual effect on the Corporation’s operating results.
Non-IFRS Measures
The Corporation presents the following non-IFRS measures in this MD&A, reconciliations of which to their nearest IFRS measures are provided, as applicable, under “Reconciliations” below:
Adjusted EBITDA
The Corporation defines Adjusted EBITDA as net earnings before financial expenses, income taxes expense (recovery), depreciation and amortization, stock-based compensation, restructuring, net earnings (loss) on associate and certain other items as set out in the reconciliation tables under “Reconciliations” below.
The Corporation believes Adjusted EBITDA is a useful performance measure as it provides information regarding the Corporation’s ongoing core operating activities, and trends in underlying performance and growth, and is used by management primarily to forecast and budget the allocation of applicable resources, particularly in light of its current strategic initiatives, including its geographic and product expansion strategy.
Adjusted EBITDA Margin
The Corporation defines Adjusted EBITDA Margin as Adjusted EBITDA as a proportion of total revenue.
The Corporation believes Adjusted EBITDA Margin is a useful performance measure as it is representative of the Corporation’s ongoing core business activities and assists management in monitoring the impact of any significant change in revenue generation (e.g., as a result of geographic or product changes, sporting results, or seasonality) or costs (e.g., a change in gaming duty rates or gaming regulatory fees or costs) on the Corporation’s operating performance.
Adjusted Net Earnings
The Corporation defines Adjusted Net Earnings as net earnings before interest accretion, amortization of intangible assets resulting from purchase price allocations following acquisitions, stock-based compensation, restructuring, net earnings (loss) on associate, and certain other items. In addition, as previously disclosed, the Corporation makes adjustments for (i) the re-measurement of contingent consideration, which was previously included in, and adjusted for through, interest accretion, but starting with the Corporation’s interim condensed consolidated financial statements and related notes for the three and nine months ended September 30, 2018 (the “Q3 2018 Financial Statements”), it is a separate line item, (ii) the re-measurement of embedded derivatives and ineffectiveness on cash flow hedges, each of which were new line items in the Q3 2018 Financial Statements, and (iii) certain non-recurring tax adjustments and settlements. Each adjustment to net earnings is then adjusted for the tax impact, where applicable, in the respective
4
jurisdiction to which the adjustment relates. Adjusted Net Earnings and any other non-IFRS measures used by the Corporation that relies on or otherwise incorporates Adjusted Net Earnings that was reported for previous periods have not been restated under the updated definition on the basis that the Corporation believes that the impact of the change to those periods would not be material.
The Corporation believes Adjusted Net Earnings is also a useful performance measure as, similar to Adjusted EBITDA, it provides meaningful information relating to the Corporation’s trends in underlying performance and growth, but it also takes into account the Corporation’s current capital structure, the impact of its geographic diversity on taxes and the Corporation’s historical investments in technology.
Adjusted Diluted Net Earnings per Share
The Corporation defines Adjusted Diluted Net Earnings per Share as Adjusted Net Earnings attributable to the Shareholders of The Stars Group Inc. divided by Diluted Shares. Diluted Shares means the weighted average number of Common Shares on a fully diluted basis, including options, other equity-based awards such as warrants and any convertible preferred shares of the Corporation then outstanding. The effects of anti-dilutive potential Common Shares are ignored in calculating Diluted Shares. Diluted Shares used in the calculation of diluted earnings per share may differ from diluted shares used in the calculation of Adjusted Diluted Net Earnings per Share where the dilutive effects of the potential Common Shares differ. See note 10 in the 2018 Annual Financial Statements. For the quarter and year ended December 31, 2018, Diluted Shares used for the calculation of Adjusted Diluted Net Earnings per Share equalled 273,294,532 and 242,768,766, respectively, compared with 206,807,485 and 203,707,589 for the same periods in 2017, respectively.
The Corporation believes Adjusted Diluted Net Earnings per Share is a useful measure for the same reasons as Adjusted Net Earnings as well as providing a per share measure that factors in the dilutive effect of the Corporation’s outstanding equity and equity-based awards and instruments.
Constant Currency Revenue
The Corporation defines Constant Currency Revenue as IFRS reported revenue for the relevant period calculated using the prior year’s monthly average exchange rates for its local currencies other than the U.S. dollar. Currently, the Corporation provides Constant Currency Revenue for the International segment and its applicable lines of operations. It does not currently provide Constant Currency Revenue for the United Kingdom and Australia segments because the Corporation does not have comparative periods for these segments.
The Corporation believes providing Constant Currency Revenue for the International segment is useful because it helps show the foreign exchange impact due to translation and purchasing power, and it facilitates comparison to its historical performance mainly because the U.S. dollar is the primary currency of gameplay on the International segment’s product offerings and the majority of the segment’s customers are from European Union jurisdictions. The Corporation is also exposed to foreign exchange risk as a result of the Acquisitions (as defined below), primarily when translating the functional currencies of the United Kingdom segment (i.e., GBP) and Australia segment (i.e., AUD) into U.S. dollars for financial reporting purposes. The Corporation intends to provide information on the impact of foreign exchange for these segments either individually or on a consolidated basis when applicable reported comparative period information is available.
Free Cash Flow
The Corporation defines Free Cash Flow as net cash flows from operating activities after adding back customer deposit liability movements, and after capital expenditures and debt servicing cash flows (excluding voluntary prepayments).
The Corporation believes that Free Cash Flow is a useful liquidity measure because it believes that removing movements in customer deposit liabilities provides a meaningful understanding of its underlying cash flows as customer deposits are not available funds that the Corporation can use for financial or operational purposes, and removing capital expenditures and debt servicing costs shows cash potentially available for voluntary debt repayments and other financial or operational purposes including to pursue strategic initiatives.
5
The Corporation currently considers the below noted key metrics in this MD&A for its reporting segments, as applicable. The Corporation does not currently provide consolidated key metrics because management analyzes these metrics primarily on a segment-by-segment basis due to differences in the nature of the applicable segment’s market, customer base and product offerings. Notwithstanding and unless the context otherwise requires, the Corporation believes that readers should consider the applicable metrics together for each segment (but not on a consolidated basis) as customer growth and monetization trends reflected in such metrics are key factors that affect the Corporation’s revenue for the applicable segment. The Corporation is also in the process of integrating its recent acquisitions, as applicable, and implementing its recently changed operating and reporting segments, and once complete, the Corporation may revise or remove currently presented key metrics or report certain additional or other measures in the future.
Quarterly Real-Money Active Uniques (QAUs)
The Corporation defines QAUs for the International and Australia reporting segments as active unique customers (online, mobile and desktop client) who (i) made a deposit or transferred funds into their real-money account with the Corporation at any time, and (ii) generated real-money online rake or placed a real-money online bet or wager on during the applicable quarterly period. The Corporation defines “active unique customer” as a customer who played or used one of its real-money offerings at least once during the period, and excludes duplicate counting, even if that customer is active across multiple lines of operation (Poker, Gaming and/or Betting, as applicable) within the applicable reporting segment. The definition of QAUs excludes customer activity from certain low-stakes, non-raked real-money poker games, but includes real-money activity by customers using funds (cash and cash equivalents) deposited by the Corporation into such customers’ previously funded accounts as promotions to increase their lifetime value.
The Corporation currently defines QAUs for the United Kingdom reporting segment (which currently includes the SBG business operations only) as active unique customers (online and mobile) who have settled a Stake (as defined below) or made a wager on any betting or gaming product within the applicable quarterly period. The Corporation defines active unique customer for the United Kingdom reporting segment as a customer who played at least once on one of its real-money offerings during the period, and excludes duplicate counting, even if that customer is active across more than one line of operation. For the quarter ended September 30, 2018, QAUs for the United Kingdom reporting segment also include the applicable pre-acquisition period of July 1, 2018 through July 9, 2018.
QAUs are a measure of the player liquidity on the Corporation’s real-money poker product offerings and level of usage on all its real-money product offerings, collectively. Trends in QAUs affect revenue and financial results by influencing the volume of activity, the Corporation’s product offerings, and its expenses and capital expenditures.
The Corporation has faced and may continue to face challenges in increasing the size of its active customer base within its reporting segments, as applicable, due to, among other things, competition from alternative products and services for all verticals, as well as regulatory changes, payment processing or other restrictions that may impact customer acquisition or the ability of customers to make a deposit or play certain products, high-volume, net-withdrawing customers who detract from the overall poker ecosystem and discourage recreational customers, the use of certain sophisticated technology that may provide an artificial competitive advantage for certain online poker customers over others, and past and potential future weakness in certain global currencies against the U.S. dollar, which decreases the purchasing power of the Corporation’s customer base as the U.S. dollar is the primary currency of gameplay on many of its International segment product offerings. Notwithstanding, the Corporation intends to retain and grow its reporting segments’ customer bases and reactivate dormant users by, as applicable, continuing to improve the poker ecosystem to benefit recreational players, continuing to introduce new and innovative product offerings, features and enhancements for all verticals, improving the user interfaces, platforms and user experience across its lines of operations, investing in customer relationship management (“CRM”) initiatives, improving the effectiveness of its marketing and promotional efforts, and expanding the availability of its offerings geographically, including through potential acquisitions and strategic transactions, among other things. To the extent the growth of the customer base of a reporting segment of the Corporation continues to decline, that segment’s revenue growth will become increasingly dependent on its ability to increase levels of customer engagement and monetization.
6
Quarterly Net Yield (QNY)
The Corporation defines QNY as combined revenue for its lines of operation (i.e., Poker, Gaming and/or Betting, as applicable) for each reporting segment, excluding Other revenue, as reported during the applicable quarterly period (or as adjusted to the extent any accounting reallocations are made in later periods) divided by the total QAUs during the same period. For the quarter ended September 30, 2018, QNY for the United Kingdom reporting segment also includes the applicable pre-acquisition period of July 1, 2018 through July 9, 2018. The numerator of QNY is a non-IFRS measure.
Trends in QNY are a measure of growth as the Corporation continues to expand its applicable core real-money online product offerings. In addition, the trends in the Corporation’s ability to generate revenue on a per customer basis across its real-money online product offerings are reflected in QNY and are key factors that affect the Corporation’s revenue. The Corporation also provides QNY using Constant Currency Revenue for the International reporting segment.
Many variables can impact a reporting segment’s QNY, including, as applicable, the rake and fees charged in real-money online poker, the applicable margin of online casino games, Stakes and Betting Net Win Margin, the amount of time customers play on its product offerings, offsets to gross revenue for loyalty program rebates, rewards, bonuses, and promotions, VAT and similar taxes in certain jurisdictions, and the amount the applicable reporting segment spends on advertising and other similar expenses. The Corporation currently intends to increase QNY for its reporting segments in future periods by, among other things, and as applicable, (i) continuing to introduce new and innovative product offerings and other initiatives to enhance the customer experience and increase customer engagement, including through CRM initiatives to attract and retain high-value customers, (ii) capitalizing on its existing online poker platforms and offerings, which provides customers with the highest level of player liquidity globally, (iii) cross-selling its online offerings to both existing and new customers, and (iv) continuing to expand and improve its online gaming offerings.
Net Deposits
The Corporation defines Net Deposits for the International segment as the aggregate of gross deposits or transfer of funds made by customers into their real-money online accounts less withdrawals or transfer of funds by such customers from such accounts, in each case during the applicable quarterly period. Gross deposits exclude (i) any deposits, transfers or other payments made by such customers into the Corporation’s play-money and social gaming offerings, and (ii) any real-money funds (cash and cash equivalents) deposited by the Corporation into such customers’ previously funded accounts as promotions to increase their lifetime value.
Net Deposits are representative of the money the Corporation’s customers hold in their accounts to potentially play with. Net Deposits are correlated to the International segment’s reported revenue, as some, all or none of such deposits may eventually be used and become revenue. Trends in Net Deposits are used by management to gauge expected revenue performance across the International segment’s applicable lines of operations and are considered by management when making decisions with respect to applicable product offering changes, including the recent and continuing changes to the Corporation’s online poker ecosystem to benefit and attract high-value, net-depositing customers (primarily recreational players).
Net Deposits are not, and should not be considered, representative of revenue bookings or deferred revenue. Many variables impact the International segment’s Net Deposits, most of which are substantially similar to those noted above impacting the monetization of a product offering as evidenced through QNY. In addition, certain factors have impacted, and may in the future impact, Net Deposits that are not indicative of the performance or underlying health of that segment’s business. For example, as it relates to online poker and following the implementation of certain previously disclosed changes to the poker ecosystem, the movement in customer real-money account balances (i.e., customer deposits on the consolidated statements of financial position) by high-volume, net-withdrawing customers has reduced, and may in the future reduce, Net Deposits as a result of increased withdrawals by such customers, but the Corporation believes that such movements will ultimately create a more attractive environment and experience for recreational players, which in turn may lead to increased Net Deposits. The Corporation believes that the funds in the accounts of the high-volume, net-withdrawing customers are generally not additive to the overall poker ecosystem or to the Corporation’s revenue as such customers generally use only a small portion of them to bet or wager. As the Corporation continues to adjust and improve its product offerings, it expects that such customers may continue to
7
withdraw at greater rates and amounts immediately following such adjustments and improvements, which would impact Net Deposits accordingly.
Stakes and Betting Net Win Margin
The Corporation defines Stakes as betting amounts wagered on the Corporation’s applicable online betting product offerings, and is also an industry term that represents the aggregate amount of funds wagered by customers within the Betting line of operation for the period specified. Betting Net Win Margin is calculated as Betting revenue as a proportion of Stakes. The Corporation uses Stakes and Betting Net Win Margin as measures of the scale of its operations, the engagement of its customers and performance of its operations across its product offerings and geographic regions. Trends in Stakes are a measure of growth in the Corporation’s Betting line of operations as the Corporation continues to expand its applicable core real-money online betting offerings. Trends in Betting Net Win Margin are primarily a measure of the favorability of the outcomes of sporting and other events and the impact of promotional offerings related to the Corporation’s betting offerings.
Many variables impact a reporting segment’s Stakes, including, as applicable, that segment’s QAUs, the seasonality of sporting events throughout the year (such as timing of European football (or soccer) including English Premier League, horse races, rugby seasons, tennis, and others) and major tournaments, such as the 2018 FIFA World Cup (“World Cup”) and UEFA European Championships. For example, the World Cup, and other major sporting events provide a unique opportunity to drive both customer acquisition and engagement. Furthermore, the amount of external marketing and CRM promotions including free bets and offers and the Corporation’s pricing strategy can lead to positive or negative “recycling of winnings”. Similarly, betting outcomes can also lead to positive or negative “recycling of winnings”. Recycling of winnings refers to customer winnings earned from prior bets that are subsequently used to place additional bets or play other products. The mix of products and markets is also an important driver of total Stakes.
Like Stakes, many variables also impact a reporting segment’s Betting Net Win Margin, including client management and bet limits, sporting results, the mix of Stakes and bet types, and the use of offers, promotions and pricing strategy. For example, the International segment’s Betting Net Win Margin is less exposed to the English Premier League and UK horse racing, and as such, is generally not impacted to the same extent by the operator-unfavorable (or customer-favorable) results seen within the United Kingdom segment as a whole. Betting Net Win Margin can vary significantly from quarter to quarter depending on the variables noted above; however, over the long term, the Corporation believes these margins tend to become more predictable.
Limitations of Non-IFRS Measures, Key Metrics and Other Data
There are a number of limitations related to the use of such non-IFRS measures as opposed to their nearest IFRS equivalent. Some of these limitations are:
| • | these non-IFRS financial measures exclude or are otherwise adjusted for the applicable items listed in the reconciliation tables under “Reconciliations” below and as set forth in the definitions of such measures; and |
| • | the income or expenses that the Corporation excludes in its calculation of these non-IFRS financial measures may differ from the income or expenses that its peer companies may exclude from similarly-titled non-IFRS measures that they report. In addition, although certain excluded income or expenses may have been incurred in the past or may be expected to recur in the future, management believes it is appropriate to exclude such income or expenses at this time as it does not consider them as on-going core operating income or expenses of the Corporation. Moreover, certain integration and related costs of the Acquisitions are or will be excluded as being more similar to acquisition-related costs rather than on-going core operating expenses. Management currently believes that, subject to unanticipated events or impacts of anticipated events, over time it should have fewer adjustments or the amounts of such adjustments should decrease, except for acquisition-related or integration costs, which the Corporation may incur in the future based on the Corporation’s strategic initiatives. |
While management may have provided other non-IFRS financial measures and key metrics in the past, it continues to review and assess the importance, completeness and accuracy of such measures as it relates to its evaluation of the Corporation’s business, performance and trends affecting the same. This includes customer engagement, gameplay,
8
depositing activity and various other customer trends, particularly following the introduction of certain previously announced improvements in the poker ecosystem to benefit and attract recreational customers and reduce incentives for high-volume, net-withdrawing customers, the introduction of certain customer acquisition initiatives, and the Corporation’s expansion in real-money online casino and sportsbook. As such, management may determine that particular measures that it may have presented in the past are no longer helpful or relevant to understanding the Corporation’s current and future business, performance or trends affecting the same, and as a result it may remove or redefine any such measures, or introduce new or alternative measures. For each applicable period, management intends to provide such metrics and measures that it believes may be the most helpful and relevant to an understanding of the Corporation’s business and performance, including on a consolidated and segmental basis and normalized measures of the same, and trends affecting the foregoing.
The numbers for the Corporation’s key metrics and related information are calculated using internal company data based on the activity of customer accounts. While these numbers are based on what the Corporation believes to be reasonable judgments and estimates of its customer base for the applicable period of measurement, there are certain challenges and limitations in measuring the usage of its product offerings across its customer base. Such challenges and limitations may also affect the Corporation’s understanding of certain details of its business. In addition, the Corporation’s key metrics and related estimates, including the definitions and calculations of the same, may differ among reporting segments, from estimates published by third parties or from similarly-titled metrics of its competitors due to differences in operations, product offerings, methodology and access to information. The Corporation continually seeks to improve its estimates of its active customer base and the level of customer activity, and such estimates may change due to improvements or changes in the Corporation’s methodology.
For example, the methodologies used to measure the Corporation’s customer metrics may be susceptible to algorithm, calculation or other technical or human errors, including how certain metrics may be defined (and the assumptions and considerations made and included in, or excluded from, such definitions) and how certain data may be, among other things, integrated, analyzed and reported after the Corporation completes an acquisition or strategic transaction. Moreover, the Corporation’s business intelligence tools may experience glitches or fail on a particular data backup or upload, which could lead to certain customer activity not being properly included in the calculation of a particular key metrics. Another challenge with respect to certain key metrics is that customers could create multiple real-money accounts with the Corporation (in nearly all instances such account creation would violate the Corporation’s applicable terms and conditions of use), and customers could take advantage of certain customer acquisition incentives to register and interact with the Corporation’s product offerings without actually depositing or transferring funds into their real-money accounts. Furthermore, customers may have more than one account across the Corporation’s brands that currently do not have common or shared account structure, which could lead to such customers being counted more than once for a particular key metric. Although the Corporation typically addresses and corrects any such failures, duplications and inaccuracies relatively quickly, its metrics are still susceptible to the same and its estimations of such metrics may be lower or higher than the actual numbers.
The Corporation regularly reviews its processes for calculating and defining these metrics, and from time to time it may make adjustments to improve their accuracy that may result in the recalculation or replacement of historical metrics or introduction of new metrics. These changes may also include adjustments to underlying data, such as changes to historical figures as a result of accounting adjustments and revisions to definitions in an effort to provide what management believes may be the most helpful and relevant data. These changes may arise as a result of, among other things, the Corporation implementing new technology, software or accounting methods, engaging third-party advisors or consultants, or acquiring or integrating new assets, businesses or business units. The Corporation also continuously seeks to improve its ability to identify irregularities and inaccuracies (and suspend any customer accounts that violate its terms and conditions of use and limit or eliminate promotional incentives that are susceptible to abuse), and its key metrics or estimates of key metrics may change due to improvements or changes in its methodology. Notwithstanding, the Corporation believes that any such irregularities, inaccuracies or adjustments are immaterial unless otherwise stated.
9
Business Overview and Background
The Stars Group is a global leader in the online and mobile gaming and interactive entertainment industries, entertaining millions of customers across its online real- and play-money poker, gaming and betting product offerings, which are delivered through mobile, web and desktop applications. The Stars Group offers these products directly or indirectly under several ultimately owned or licensed gaming and related consumer businesses and brands, including, among others, PokerStars, PokerStars Casino, BetStars, Full Tilt, BetEasy, Sky Bet, Sky Vegas, Sky Casino, Sky Bingo, Sky Poker, and Oddschecker, as well as live poker tour and events brands, including the PokerStars Players No Limit Hold’em Championship, European Poker Tour, PokerStars Caribbean Adventure, Latin American Poker Tour, Asia Pacific Poker Tour, PokerStars Festival and PokerStars MEGASTACK. The Stars Group is one of the world’s most licensed online gaming operators with its subsidiaries collectively holding licenses or approvals in 21 jurisdictions throughout the world, including in Europe, Australia, and the Americas. The Stars Group’s vision is to become the world’s favorite iGaming destination and its mission is to provide its customers with winning moments.
The Stars Group’s primary business and source of revenue is its online gaming and betting businesses. These currently consist of the operations of Stars Interactive Holdings (IOM) Limited and its subsidiaries and affiliates (collectively, “Stars Interactive Group”), which it acquired in August 2014 (the ‘‘Stars Interactive Group Acquisition’’), the operations of Cyan Blue Topco Limited and its subsidiaries and affiliates (collectively, “Sky Betting & Gaming” or “SBG”), which it acquired in July 2018 (the “SBG Acquisition”), and the operations of TSG Australia Pty Ltd (formerly CrownBet Holdings Pty Limited) and its subsidiaries and affiliates, including TSGA Holdco Pty Limited (formerly William Hill Australia Holdings Pty Ltd) and its subsidiaries and affiliates (“TSGA” and where the context requires, collectively, “BetEasy”), which it acquired an 80% equity interest in between February 2018 and April 2018 (BetEasy acquired TSGA in April 2018) (collectively, the “Australian Acquisitions”). The Stars Interactive Group is headquartered in the Isle of Man and Malta and operates globally, with certain exceptions; SBG is headquartered in and primarily operates in the United Kingdom; and BetEasy is headquartered in and primarily operates in Australia.
For additional information about The Stars Group, including a detailed overview of the business, current strategies and a discussion of the competitive landscape affecting The Stars Group, see the disclosure and discussion elsewhere in this MD&A and the 2018 Annual Reports, particularly in the 2018 Annual Information Form. For risks and uncertainties relating to, among other things, The Stars Group, its business, its customers, its regulatory and tax environment and the industries and geographies in which it operates or where its customers are located, see “Risk Factors and Uncertainties” above and in the 2018 Annual Information Form as well as the risks and uncertainties contained elsewhere herein, the 2018 Annual Reports and in other filings that The Stars Group has made and may make in the future with applicable securities authorities. For information about The Stars Group’s outlook, see the 2018 Annual Reports, particularly in the 2018 Annual Information Form, including under the headings “Business of the Corporation—Business Strategy of the Corporation” and “—Markets and Customers”.
Recent Corporate and Other Developments
Below is a general summary of certain recent corporate and other developments from the beginning of the fourth quarter of 2018 through the date hereof. For additional corporate and other developments and highlights, see the 2018 Annual Reports, particularly the 2018 Annual Information Form, and “Further Information” below.
UK CMA Clearance of SBG Acquisition
On October 11, 2018, the UK Competition and Markets Authority cleared the SBG Acquisition following its Phase 1 review under the Enterprise Act 2002, which permitted the Corporation to begin executing on its integration plans.
Eldorado Market Access Agreement
On November 26, 2018, the Corporation announced it entered into an
agreement with Eldorado Resorts, Inc. (Nasdaq: ERI) (“Eldorado”) that grants the Corporation the option to operate online betting and gaming in the states where Eldorado currently or in the future owns or operates casino properties. The agreement currently covers 11 states (Colorado, Florida, Illinois, Indiana, Iowa, Louisiana, Mississippi, Missouri, Nevada, Ohio and West Virginia) which, when combined with the Corporation’s existing market access deals in New
10
Jersey and Pennsylvania, gives the Corporation potential access to 13 states. The agreement grants the Corporation the option to own, operate and brand real-money online sports betting, poker and casino offerings in each of the applicable states subject to license availability, state law and regulatory approvals. As it relates to sports betting, the Corporation’s options will provide first skin access in states where Eldorado owns or operates more than one casino property and second skin access in all other applicable states.
Under the terms of the agreement, Eldorado will receive a revenue share from the operation of the applicable offerings by the Corporation, and the Corporation issued Eldorado 1,076,658 Common Shares at a contractual price of $23.22 per share for a value of $25 million and the Corporation will issue an additional $5 million of Common Shares upon the Corporation’s exercise of the first option and following the satisfaction of certain conditions. Further, Eldorado would be entitled to additional Common Shares at a price of $23.22 per share beginning in five years. The number of additional shares potentially issuable to Eldorado would be solely based on the success of the Corporation’s online gaming offerings in applicable states as measured by net gaming revenue generated in each applicable state.
On December 21, 2018, the Kentucky Court of Appeals ruled in The Stars Group’s favor and reversed in its entirety the $870 million judgment issued against it by a trial court judge in December 2015 under a centuries old statute and relating to alleged losses by Kentucky residents who played real-money online poker on PokerStars’ website during a period between 2006 and 2011. The Supreme Court of Kentucky is currently considering whether to hear the Commonwealth’s appeal of the reversal and The Stars Group intends to vigorously dispute any and all liability in the event the Kentucky Supreme Court grants review and hears the appeal. For additional information regarding the Kentucky proceeding, see the 2018 Annual Information Form, particularly under the heading “Legal Proceedings and Regulatory Actions”, and note 28 to the 2018 Annual Financial Statements.
Prepayment of First Lien Term Loans
On February 22, 2019, the Corporation prepaid $100.0 million of its USD First Lien Term Loan (as defined below), including accrued and unpaid interest, using cash on its balance sheet. For additional information, see “Liquidity and Capital Resources” below.
SELECTED FINANCIAL INFORMATION
Selected financial information of the Corporation for the three months ended December 31, 2018 and 2017, and for the years ended December 31, 2018, 2017 and 2016 is set forth below.
|
| Quarter ended December 31 |
|
|
| Year ended December 31, |
| ||||||||||||||
In thousands of U.S. Dollars, except per share amounts |
| 2018 |
|
| 2017 |
|
|
| 2018 |
|
| 2017 |
|
| 2016 |
| |||||
Revenue |
|
| 652,852 |
|
|
| 360,250 |
|
|
|
| 2,029,238 |
|
|
| 1,312,315 |
|
|
| 1,155,247 |
|
Net (loss) earnings |
|
| (38,173 | ) |
|
| 47,175 |
|
|
|
| (108,906 | ) |
|
| 259,285 |
|
|
| 135,550 |
|
Basic net (loss) earnings per Common Share |
| $ | (0.14 | ) |
| $ | 0.32 |
|
|
| $ | (0.49 | ) |
| $ | 1.77 |
|
| $ | 0.96 |
|
Diluted net (loss) earnings per Common Share |
| $ | (0.14 | ) |
| $ | 0.23 |
|
|
| $ | (0.49 | ) |
| $ | 1.27 |
|
| $ | 0.70 |
|
Total assets (as at) |
|
| 11,265,538 |
|
|
| 5,415,126 |
|
|
|
| 11,265,538 |
|
|
| 5,415,126 |
|
|
| 5,462,475 |
|
Total long-term liabilities (as at) |
|
| 6,100,164 |
|
|
| 2,509,221 |
|
|
|
| 6,100,164 |
|
|
| 2,509,221 |
|
|
| 2,412,579 |
|
Revenue increased in both the quarter and year ended December 31, 2018 as compared to the applicable prior year periods and as compared to the year ended December 31, 2016 primarily as a result of the SBG Acquisition and Australian Acquisitions (collectively, the “Acquisitions”) as well as growth of the Corporation’s online Poker, Gaming and Betting and product offerings. For additional variance analysis on revenue, see “Consolidated Results of Operations and Cash Flows”, and “Segment Results of Operations” below.
The increase in the Corporation’s total assets as at December 31, 2018 compared to December 31, 2017 and 2016 was primarily the result of an increase in goodwill and intangible assets following the Acquisitions. The increase in outstanding long-term liabilities as at December 31, 2018 compared to December 31, 2017 and 2016 was primarily to
11
the result of an increase to long-term debt resulting from the SBG Financing. For additional variance analysis on total assets and non-current liabilities, see “Consolidated Results of Operations and Cash Flows” below.
CONSOLIDATED RESULTS OF OPERATIONS AND CASH FLOWS
Summary consolidated results of the Corporation’s operations, cash flows and certain other items for the quarters and years ended December 31, 2018 and 2017 are set forth below:
|
| Quarter Ended December 31, |
|
| Year Ended December 31, |
| ||||||||||||||||||
In thousands of U.S. Dollars (except otherwise noted) |
| 2018 |
|
| 2017 |
|
| % Change |
|
| 2018 |
|
| 2017 |
|
| % Change |
| ||||||
Revenue |
|
|
|
|
|
|
|
|
|
|
|
|
|
|
|
|
|
|
|
|
|
|
|
|
Poker |
|
| 213,985 |
|
|
| 234,350 |
|
|
| (8.7 | %) |
|
| 892,557 |
|
|
| 877,296 |
|
|
| 1.7 | % |
Gaming |
|
| 196,275 |
|
|
| 90,822 |
|
|
| 116.1 | % |
|
| 585,846 |
|
|
| 334,781 |
|
|
| 75.0 | % |
Betting |
|
| 224,040 |
|
|
| 21,690 |
|
|
| 932.9 | % |
|
| 491,139 |
|
|
| 49,231 |
|
|
| 897.6 | % |
Other |
|
| 18,552 |
|
|
| 13,388 |
|
|
| 38.6 | % |
|
| 59,696 |
|
|
| 51,007 |
|
|
| 17.0 | % |
Total revenue |
|
| 652,852 |
|
|
| 360,250 |
|
|
| 81.2 | % |
|
| 2,029,238 |
|
|
| 1,312,315 |
|
|
| 54.6 | % |
|
|
|
|
|
|
|
|
|
|
|
|
|
|
|
|
|
|
|
|
|
|
|
|
|
Gross profit (excluding depreciation and amortization) |
|
| 486,815 |
|
|
| 290,358 |
|
|
| 67.7 | % |
|
| 1,570,074 |
|
|
| 1,064,818 |
|
|
| 47.4 | % |
Gross profit margin (%) |
|
| 74.6 | % |
|
| 80.6 | % |
|
| (7.5 | %) |
|
| 77.4 | % |
|
| 81.1 | % |
|
| (4.6 | %) |
|
|
|
|
|
|
|
|
|
|
|
|
|
|
|
|
|
|
|
|
|
|
|
|
|
Operating expenses |
|
|
|
|
|
|
|
|
|
|
|
|
|
|
|
|
|
|
|
|
|
|
|
|
General and administrative |
|
| 312,638 |
|
|
| 115,542 |
|
|
| 170.6 | % |
|
| 984,194 |
|
|
| 437,886 |
|
|
| 124.8 | % |
Sales and marketing |
|
| 96,115 |
|
|
| 55,883 |
|
|
| 72.0 | % |
|
| 292,963 |
|
|
| 154,358 |
|
|
| 89.8 | % |
Research and development |
|
| 10,972 |
|
|
| 6,667 |
|
|
| 64.6 | % |
|
| 39,995 |
|
|
| 25,180 |
|
|
| 58.8 | % |
Operating income |
|
| 67,090 |
|
|
| 112,266 |
|
|
| (40.2 | %) |
|
| 252,922 |
|
|
| 447,394 |
|
|
| (43.5 | %) |
Net (earnings) loss from associates |
|
| — |
|
|
| — |
|
|
| — |
|
|
| (1,068 | ) |
|
| 2,569 |
|
|
| (141.6 | %) |
Net financing charges |
|
| 90,813 |
|
|
| 38,739 |
|
|
| 134.4 | % |
|
| 363,884 |
|
|
| 158,332 |
|
|
| 129.8 | % |
Income tax expense (recovery) |
|
| 14,450 |
|
|
| 26,352 |
|
|
| (45.2 | %) |
|
| (988 | ) |
|
| 27,208 |
|
|
| (103.6 | %) |
Net (loss) earnings |
|
| (38,173 | ) |
|
| 47,175 |
|
|
| (180.9 | %) |
|
| (108,906 | ) |
|
| 259,285 |
|
|
| (142.0 | %) |
Adjusted Net Earnings ¹ |
|
| 144,663 |
|
|
| 111,951 |
|
|
| 29.2 | % |
|
| 533,948 |
|
|
| 458,940 |
|
|
| 16.3 | % |
|
|
|
|
|
|
|
|
|
|
|
|
|
|
|
|
|
|
|
|
|
|
|
|
|
Adjusted EBITDA ¹ |
|
| 239,404 |
|
|
| 147,002 |
|
|
| 62.9 | % |
|
| 780,949 |
|
|
| 600,306 |
|
|
| 30.1 | % |
Adjusted EBITDA Margin ¹ |
|
| 36.7 | % |
|
| 40.8 | % |
|
| (10.1 | %) |
|
| 38.5 | % |
|
| 45.7 | % |
|
| (15.9 | %) |
|
|
|
|
|
|
|
|
|
|
|
|
|
|
|
|
|
|
|
|
|
|
|
|
|
(Loss) earnings per share |
|
|
|
|
|
|
|
|
|
|
|
|
|
|
|
|
|
|
|
|
|
|
|
|
Basic ($/Share) |
|
| (0.14 | ) |
|
| 0.32 |
|
|
| (145.1 | %) |
|
| (0.49 | ) |
|
| 1.77 |
|
|
| (127.9 | %) |
Diluted ($/Share) |
|
| (0.14 | ) |
|
| 0.23 |
|
|
| (162.8 | %) |
|
| (0.49 | ) |
|
| 1.27 |
|
|
| (138.7 | %) |
Adjusted Diluted Net Earnings per Share ($/Share) ¹ |
|
| 0.52 |
|
|
| 0.54 |
|
|
| (4.2 | %) |
|
| 2.19 |
|
|
| 2.25 |
|
|
| (2.9 | %) |
|
|
|
|
|
|
|
|
|
|
|
|
|
|
|
|
|
|
|
|
|
|
|
|
|
Net cash inflows from operating activities |
|
| 190,537 |
|
|
| 123,757 |
|
|
| 54.0 | % |
|
| 559,844 |
|
|
| 494,600 |
|
|
| 13.2 | % |
Net cash (outflows) inflows from investing activities |
|
| (54,703 | ) |
|
| 184,958 |
|
|
| (129.6 | %) |
|
| (1,934,173 | ) |
|
| 174,850 |
|
|
| (1206.2 | %) |
Net cash (outflows) inflows from financing activities |
|
| (166,214 | ) |
|
| (28,275 | ) |
|
| (487.8 | %) |
|
| 1,592,579 |
|
|
| (443,802 | ) |
|
| 458.8 | % |
Free Cash Flow ¹ |
|
| 82,558 |
|
|
| 84,854 |
|
|
| (2.7 | %) |
|
| 222,950 |
|
|
| 339,882 |
|
|
| (34.4 | %) |
|
|
|
|
|
|
|
|
|
|
|
|
|
|
|
|
|
|
|
|
|
|
|
|
|
As at |
| December 31, 2018 |
|
| December 31, 2017 |
|
| % Change |
| |||||||||||||||
Total assets |
|
|
|
|
|
| 11,265,538 |
|
|
|
|
|
|
| 5,415,126 |
|
|
|
|
|
|
| 108.0 | % |
Total non-current liabilities |
|
|
|
|
|
| 6,100,164 |
|
|
|
|
|
|
| 2,509,221 |
|
|
|
|
|
|
| 143.1 | % |
¹ Non-IFRS measure. A reconciliation to its nearest IFRS measure is provided under “Reconciliations” below.
The discussion below sets forth a summary of the results, trends and variances of the Corporation on a consolidated basis. For further discussion and detail of the individual segment results, trends and variances, including details of
12
separate trends in revenue by individual line of operation for each segment, as applicable, and the Corporate cost center, see the section “Segment Results of Operations”.
Revenue
Revenue for the quarter and year ended December 31, 2018 increased $292.6 million, or 81.2% and $716.9 million, or 54.6%, respectively, compared to the applicable prior year period. The increase for both periods was primarily driven by the Acquisitions, which added $298.1 million and $591.1 million to revenue for the respective periods. With respect to the International segment, revenue increased in all lines of operation for the year but decreased in Poker for the quarter, which was partially offset by increased revenue across Gaming and Betting, in each case primarily driven by those factors set forth under “Segment Results of Operations—International—Revenue”.
With respect to Canada, the jurisdiction where its registered office is located, and based solely on calculations derived from internal records, the Corporation estimates that revenue derived from customers in Canada, which currently relates only to peer-to-peer Poker, represented less than 3% of its total consolidated revenue for the quarter and year ended December 31, 2018 and less than 5% for the applicable prior year periods. These estimations are neither itemized nor otherwise separated from the revenue the Corporation reports under IFRS or otherwise, and as such, they cannot be reconciled to a reported IFRS measure.
Foreign Exchange Impact on Revenue
The U.S. dollar, which is the primary currency of gameplay for the International segment, was stronger during the quarter ended December 31, 2018 and weaker during the year ended December 31, 2018, against certain foreign currencies, particularly the Euro, which is the primary depositing currency of the International segment’s customers. This impact to customer purchasing power and translation of foreign currency gameplay, had a negative impact on revenue across all lines of operations during the quarter and had a positive impact on revenue across all lines of operations during the year. By including Constant Currency Revenue for the International segment in the consolidated results of operations for the quarter and year ended December 31, 2018, revenue would have been $672.9 million and $2.01 billion, respectively, and would have increased by 86.8% and 53.5%, as opposed to 81.2% and 54.6%, respectively, compared to the applicable prior year period. For discussion of Constant Currency Revenue for the International segment, see discussion under “Segment Results of Operations—International—Revenue”.
Gross Profit (Excluding Depreciation and Amortization) and Gross Profit Margin
Gross profit for the quarter and year ended December 31, 2018 increased $196.5 million, or 67.7%, and $505.3 million, or 47.4%, respectively, compared to the applicable prior year period. The increase in both periods was primarily driven by the Acquisitions, which added $201.6 million and $412.5 million to gross profit for the respective periods, and solely related to the full year period, the increase in revenue within the International segment.
Gross profit margin for the quarter ended December 31, 2018 was 74.6%, a decrease of 7.5% compared to the prior year period. Gross profit margin for the year ended December 31, 2018 was 77.4%, a decrease of 4.6% compared to the prior year period. The decrease in both periods was primarily driven by the change in revenue mix among and across geographies and lines of operations. For instance, revenue in locally regulated or taxed geographies, which generally impose higher rates of taxes, gaming duties, levies and fees represented 76% of revenue in the quarter ended December 31, 2018, compared to 54% of revenue in the prior year period. In addition, Betting and Gaming revenue as a result of the Acquisitions, which generally have lower gross profit margins than Poker, represented 64.4% of revenue in the quarter ended December 31, 2018, compared to 31.2% of revenue in the prior year period.
Operating Expenses
General and Administrative
General and administrative expenses for the quarter and year ended December 31, 2018 increased $197.1 million, or 170.6%, and $546.3 million, or 124.8%, respectively, compared to the applicable prior year period. The increase in both periods was primarily the result of (i) additional general and administrative expenses resulting from the Acquisitions, which added $168.3 million and $357.5 million to general and administrative expenses for the respective periods, (ii) increased salary and wages of $11.2 million and $27.3 million within the International segment and Corporate cost center for the respective periods as the result of investment in additional headcount, (iii) increased information technology and software costs within the International segment driven by increased cloud storage space
13
and additional leased data center spaces, and (iv) solely in respect of the full year period, acquisition-related costs and deal contingent forwards in relation to the Acquisitions of $115.7 million within the Corporate cost center.
Sales and Marketing
Sales and marketing expenses for the quarter and year ended December 31, 2018 increased $40.2 million, or 72.0%, and $138.6 million, or 89.8%, respectively, compared to the applicable prior year period. The increase in both periods was primarily the result of (i) additional sales and marketing expenses resulting from the Acquisitions, which added $51.3 million and $129.0 million to sales and marketing expenses for the respective periods, and (ii) timing of certain advertising costs and other marketing initiatives during the year related to certain sporting events, including an increase in advertising costs during the second and third quarter related to the World Cup, and the launch of some or all lines of operations in certain new markets, as applicable.
Research and Development
Research and development expenses for the quarter and year ended December 31, 2018 increased $4.3 million, or 64.6%, and $14.8 million, 58.8%, respectively, compared to the applicable prior year period. The increase in both periods was primarily the result of (i) additional research and development expenses resulting from the Acquisitions, which added $6.1 million and $12.1 million to research and development expenses for the respective periods, (ii) increased salary and wages within the International segment as a result of investment in additional headcount and (iii) increased costs in relation to investment in technology including new product development, mainly in PokerStars and PokerStars Casino.
Foreign Exchange Impact on Operating Expenses
The Corporation’s expenses are impacted by currency fluctuations. Almost all of its expenses are incurred in either the Euro, British Pound Sterling, U.S. dollar, Canadian dollar or Australian dollar. There are some natural hedges as a result of customer deposits and revenue made in such currencies; however, the Corporation also enters into certain economic hedges to mitigate the impact of foreign currency fluctuations as it deems necessary. See “Liquidity and Capital Resources—Market Risk—Foreign Currency Exchange Risk” for further information on foreign currency risk.
Net Financing Charges
Net financing charges for the quarter and year ended December 31, 2018 increased $52.1 million, or 134.4%, and $205.6 million, or 129.8% compared to the applicable prior year period. The increase in both periods was primarily the result of (i) increased interest expense primarily related to the First Lien Term Loans and Senior Notes (each as defined below) after the effects of hedging activities, and (ii) solely in respect of the full year period, losses on extinguishment of $147.0 million recorded in respect of the amendment and extension and the subsequent early repayment of debt in connection with the Acquisitions.
Income Taxes
Income tax expense for the quarter ended December 31, 2018 was $14.5 million and income tax recovery for the year ended December 31, 2018 was $(1.0) million (quarter and year ended December 31, 2017, income tax expense of $26.4 million and $27.2 million, respectively), which resulted in effective tax rates for those periods of (60.9%) and 0.9%, respectively (quarter and year ended December 31, 2017, 35.8% and 9.5%, respectively). The income tax expense and recovery for the quarter and year ended December 31, 2018, respectively, includes $12.9 million and $27.3 million, respectively (quarter and year ended December 31, 2017, $nil) in relation to the income tax recovery on the amortization expense of acquired intangible assets from the Acquisitions.
The Corporation’s income taxes for the current period were impacted by the tax recovery on amortization as noted above and the mix of taxable earnings among and across geographies, with an increase in taxable earnings following the Acquisitions in geographies with higher statutory corporate tax rates. The Corporation expects the mix of taxable earnings to continue to impact income tax expense in future periods as the acquired businesses operate primarily in
14
Australia and the United Kingdom, where statutory corporate income tax rates are higher than those in the Isle of Man and Malta, where the Corporation primarily operated from prior to the Acquisitions.
Net (Loss) Earnings
Net loss for the quarter ended December 31, 2018 was $38.2 million, a decrease of 180.9%, compared to net earnings of $47.2 million in the prior year period. Net loss for the year ended December 31, 2018 was $108.9 million, a decrease of 142.0%, compared to net earnings of $259.3 million in the prior year period. The losses in both periods were primarily the result of (i) increased amortization of acquisition intangibles due to the Acquisitions of $55.6 million and $117.4 million, respectively, and (ii) solely in relation to the full year, the above noted losses on extinguishment, acquisition-related costs, deal contingent forwards, and integration costs, each in connection with the Acquisitions and recorded through general and administrative expenses.
Basic and Diluted Net (Loss) Earnings per Share
Basic net loss per share for the quarter ended December 31, 2018 was $(0.14), a decrease of 145.1%, compared to basic net earnings per share of $0.32 for the prior year period, based on weighted average Common Shares outstanding of 272,636,266 and 147,678,824, respectively. Basic net loss per share for the year ended December 31, 2018 was $(0.49), a decrease of 127.9%, compared to basic net earnings per share of $1.77 for the prior year period, based on weighted average Common Shares outstanding of 208,269,905 and 146,818,764, respectively. The decreases in both periods were due to the net losses incurred as noted above and were partially offset by increases in the weighted average Common Shares outstanding, which was primarily the result of the issuance of Common Shares in connection with the Equity Offering (as defined below), the Corporation’s mandatory conversion of its preferred shares and the Acquisitions.
Diluted net loss per share for the quarter ended December 31, 2018 was $(0.14), a decrease of 162.8%, compared to diluted net earnings per share of $0.23 for the prior year period, based on weighted average Common Shares outstanding of 272,636,266 and 206,807,485, respectively. Diluted net loss per share for the year ended December 31, 2018 was $(0.49), a decrease of 138.7%, compared to diluted net earnings per share of $1.27 for the prior year period, based on weighted average Common Shares outstanding of 208,269,905 and 203,707,589, respectively. The decreases in both periods were due to the net losses incurred as noted above. The decreases were further negatively impacted as all potentially dilutive securities of the Corporation (i.e., securities exercisable or convertible into Common Shares or equity-based awards that can be settled into Common Shares), were not included in the weighted average diluted Common Share amount above used to calculate diluted loss per share because the exercise, conversion or settlement of such securities would be anti-dilutive. This compares to the same period in 2017 where dilutive securities were primarily impacted by dilutive impact of its then outstanding preferred shares.
Adjusted EBITDA, Adjusted Net Earnings, and Adjusted Diluted Net Earnings per Share
For additional information regarding Adjusted EBITDA, Adjusted Net Earnings and Adjusted Diluted Net Earnings per Share, including applicable definitions and explanations of the relative usefulness of such measures, see “Non-IFRS Measures, Key Metrics and Other Data—Non-IFRS Measures” above. For quantitative reconciliations of such measures to their nearest IFRS measures, see “Reconciliations” below.
The primary adjustment from operating income to Adjusted EBITDA for the applicable quarterly and full year periods was depreciation and amortization, which increased by $61.8 million and $135.6 million for the quarter and year ended December 31, 2018, respectively, primarily as a result of the Acquisitions. In addition to depreciation and amortization, total adjustments and reconciling items also collectively increased by $75.8 million and $239.5 million for the quarter and year ended December 31, 2018, respectively, compared to the applicable prior year period primarily driven by (i) acquisition-related costs and deal contingent forwards incurred in connection with the Acquisitions of $3.1 million and $115.6 million, respectively, (ii) integration-related costs also in connection with the Acquisitions of $17.0 million and $45.6 million, respectively, and (iii) costs incurred in respect of the market access agreement with Eldorado of $20.7 million.
As it relates to Adjusted Net Earnings and Adjusted Diluted Net Earnings per Share for the applicable quarterly and full year periods, the primary adjustments from net (loss) earnings and diluted net (loss) earnings per share were the amortization of acquisition intangibles and acquisition- and integration-related costs, together with the losses on debt extinguishment for the applicable periods, all as noted above. Adjusted Diluted Net Earnings per Share for the quarter and the year were also impacted by the increase in Common Shares issued and outstanding primarily as a result of the
15
Equity Offering and the Acquisitions, which included the issuance of a total 59,924,398 Common Shares. In addition, all potentially dilutive securities of the Corporation were not included in the weighted average diluted Common Share amount used to calculate the nearest IFRS measure because the exercise, conversion or settlement of such securities would be anti-dilutive, as noted above. However, these dilutive securities, and in particular the then-outstanding convertible preferred shares of the Corporation, were included in the weighted average Common Share amount used in the calculation of Adjusted Diluted Net Earnings per Share.
Cash Flows by Activity
Cash from Operating Activities
Cash from operating activities for the year ended December 31, 2018 increased $65.2 million, or 13.2%, compared to the prior year period. The increase in the year was primarily the result of (i) the above noted increase in revenue and gross profit generated from the underlying operations of the Corporation, including the impacts of the Acquisitions, and (ii) movements in customer deposit liabilities relative to the prior year period. This was partially offset by increased general and administrative expenses and sales and marketing costs, as described above and in particular resulting from acquisition-related costs and integration costs incurred in respect of the Acquisitions.
Cash used in Investing Activities
The Corporation’s cash outflows from investing activities during the year ended December 31, 2018 were primarily the result of (i) $1.87 billion in aggregate cash consideration (net of cash acquired) paid in connection with the SBG Acquisition and the acquisition of a 62% equity interest in BetEasy, and (ii) capital expenditures, primarily consisting of investments in online gaming development, in each case partially offset by the inflow of cash from the sale of certain investments made with customer deposits.
Cash from (used in) Financing Activities
The Corporation’s cash inflows from financing activities during the year ended December 31, 2018 were primarily the result of (i) $5.67 billion incurred in connection with the debt portion of the SBG Financing (as defined below), (ii) $425.0 million of first lien term loans incurred in connection with the Australian Acquisitions, and (iii) $715.5 million related to the issuance of Common Shares in connection with the Equity Offering, including the proceeds from the exercise of the over-allotment option in full and net of transaction costs, and the exercise of employee stock options. These inflows were partially offset by outflows related to (i) interest and principal repayments on the First Lien Term Loans, Revolving Facility (as defined below) and previous first lien term loans, (ii) $3.93 billion related to the repayment of the previous first lien term loans and the second lien term loan, and the repayment of long-term debt of SBG assumed in connection with the SBG Acquisition, and (iii) $48.2 million in cash consideration (net of cash acquired) paid for the acquisition of an incremental 18% interest in BetEasy.
Free Cash Flow
Free Cash Flow for the quarter and year ended December 31, 2018 decreased $2.3 million, or 2.7%, and $116.9 million, or 34.4%, respectively, compared to the applicable prior year period. The decrease in both periods was primarily the result of (i) increased cash interest and non-voluntary principal payments, and (ii) increased capital expenditures as the Corporation continued to invest in future product improvements and market expansion. This was partially offset by increased cash flow from operating activities, excluding the impact of movements in customer deposit liabilities. As noted above, solely in relation to the full year period, cash flow from operating activities was negatively impacted by acquisition-related and integration costs.
For additional information regarding Free Cash Flow, including an applicable definition and explanation of the relative usefulness of this measure, see “Non-IFRS Measures, Key Metrics and Other Data—Non-IFRS Measures” above. For a quantitative reconciliation of this measure to its nearest IFRS measure, see “Reconciliations” below
Total Assets
Total assets as at December 31, 2018 increased by $5.85 billion, or 108.0%, compared to the same as at December 31, 2017. The increase was primarily the result of increases in (i) goodwill and intangible assets relating primarily to the Acquisitions, and (ii) operational cash and customer deposits.
16
Total non-current liabilities as at December 31, 2018 increased $3.59 billion, or 143.1%, compared to the same as at December 31, 2017. This was primarily the result of increases in (i) long-term debt resulting from the SBG Financing, (ii) deferred tax liabilities as a result of deferred taxes recorded on the intangibles acquired through the Acquisitions, and (iii) contingent consideration relating to the Corporation’s acquisition of an incremental 18% interest in BetEasy. See note 5 to the 2018 Annual Financial Statements. This was partially offset by a decrease in the liability for the Swap Agreements (as defined below) resulting from changes in fair value and settlements during the year ended December 31, 2018.
During the second and third fiscal quarters of 2018, the Corporation added additional reporting segments, and it currently has three reporting segments, International, United Kingdom and Australia, each with certain major lines of operations, including Poker, Gaming, Betting and Other, as applicable, and a Corporate cost center. See above under “Managements Discussion and Analysis” and note 7 of the 2018 Annual Financial Statements. Prior quarterly and annual segmental results and information presented in this MD&A have been recast to be presented in a manner consistent with the changed reporting segments.
As at December 31, 2018, the International reporting segment included the Stars Interactive Group business (i.e., the Corporation’s existing business prior to the Acquisitions), which operates across all lines of operations and in various jurisdictions around the world, including in the United Kingdom, under the brands identified above under “Overview and Outlook”.
|
| Quarter Ended December 31, |
|
| Year Ended December 31, |
| ||||||||||||||||||
In thousands of U.S. Dollars (except otherwise noted) |
| 2018 |
|
| 2017 |
|
| % Change |
|
| 2018 |
|
| 2017 |
|
| % Change |
| ||||||
Stakes |
|
| 261,055 |
|
|
| 195,714 |
|
|
| 33.4 | % |
|
| 966,306 |
|
|
| 647,413 |
|
|
| 49.3 | % |
Betting Net Win Margin (%) |
|
| 8.3 | % |
|
| 11.1 | % |
|
| (24.8 | %) |
|
| 8.2 | % |
|
| 7.6 | % |
|
| 7.7 | % |
|
|
|
|
|
|
|
|
|
|
|
|
|
|
|
|
|
|
|
|
|
|
|
|
|
Revenue |
|
|
|
|
|
|
|
|
|
|
|
|
|
|
|
|
|
|
|
|
|
|
|
|
Poker |
|
| 210,940 |
|
|
| 234,350 |
|
|
| (10.0 | %) |
|
| 886,628 |
|
|
| 877,296 |
|
|
| 1.1 | % |
Gaming |
|
| 112,111 |
|
|
| 90,822 |
|
|
| 23.4 | % |
|
| 428,364 |
|
|
| 334,781 |
|
|
| 28.0 | % |
Betting |
|
| 21,766 |
|
|
| 21,690 |
|
|
| 0.4 | % |
|
| 79,117 |
|
|
| 49,231 |
|
|
| 60.7 | % |
Other 2 |
|
| 10,913 |
|
|
| 13,388 |
|
|
| (18.5 | %) |
|
| 46,068 |
|
|
| 51,007 |
|
|
| (9.7 | %) |
Total revenue |
|
| 355,730 |
|
|
| 360,250 |
|
|
| (1.3 | %) |
|
| 1,440,177 |
|
|
| 1,312,315 |
|
|
| 9.7 | % |
|
|
|
|
|
|
|
|
|
|
|
|
|
|
|
|
|
|
|
|
|
|
|
|
|
Gross profit (excluding depreciation and amortization) |
|
| 286,167 |
|
|
| 290,358 |
|
|
| (1.4 | %) |
|
| 1,159,611 |
|
|
| 1,064,818 |
|
|
| 8.9 | % |
Gross profit margin (%) |
|
| 80.4 | % |
|
| 80.6 | % |
|
| (0.2 | %) |
|
| 80.5 | % |
|
| 81.1 | % |
|
| (0.8 | %) |
|
|
|
|
|
|
|
|
|
|
|
|
|
|
|
|
|
|
|
|
|
|
|
|
|
General and administrative |
|
| 141,500 |
|
|
| 92,912 |
|
|
| 52.3 | % |
|
| 461,168 |
|
|
| 369,710 |
|
|
| 24.7 | % |
Sales and marketing |
|
| 45,464 |
|
|
| 55,626 |
|
|
| (18.3 | %) |
|
| 164,600 |
|
|
| 153,540 |
|
|
| 7.2 | % |
Research and development |
|
| 4,880 |
|
|
| 6,667 |
|
|
| (26.8 | %) |
|
| 27,865 |
|
|
| 25,180 |
|
|
| 10.7 | % |
Operating income |
|
| 94,323 |
|
|
| 135,153 |
|
|
| (30.2 | %) |
|
| 505,978 |
|
|
| 516,388 |
|
|
| (2.0 | %) |
|
|
|
|
|
|
|
|
|
|
|
|
|
|
|
|
|
|
|
|
|
|
|
|
|
Adjusted EBITDA ¹ |
|
| 167,862 |
|
|
| 158,140 |
|
|
| 6.1 | % |
|
| 700,887 |
|
|
| 636,404 |
|
|
| 10.1 | % |
Adjusted EBITDA Margin (%) ¹ |
|
| 47.2 | % |
|
| 43.9 | % |
|
| 7.5 | % |
|
| 48.7 | % |
|
| 48.5 | % |
|
| 0.4 | % |
1 Non-IFRS measure. A reconciliation to its nearest IFRS measure is provided under “Reconciliations” below.
2 Other revenue includes $1.0 million and $2.0 million for the quarter and year ended December 31, 2018, respectively, that the Corporation excluded from its consolidated results as it related to certain non-gaming related transactions with the United Kingdom segment. A corresponding exclusion in the consolidated results is recorded to sales and marketing expense for amounts included in the United Kingdom segment in respect of these transactions.
17
a) | Poker |
Poker revenue for the quarter ended December 31, 2018 decreased $23.4 million, or 10.0%, compared to the prior year period. Constant Currency Revenue for the quarter was $224.1 million, which is $13.1 million higher than actual IFRS revenue. Excluding the impact of year-over-year changes in foreign exchange rates, such revenue for the quarter would have decreased by 4.4%. This decrease was primarily the result of (i) reduced deposits in certain markets as a result of local restrictions on some methods of payment processing and on certain methods of downloading The Stars Group’s poker applications, and (ii) increased cross-selling of customers to the Stars Group’s online casino offerings. This was partially offset by the continued positive impact of shared poker liquidity in Southern Europe (i.e., France, Spain, and Portugal).
Poker revenue for the year ended December 31, 2018 increased $9.3 million, or 1.1%, compared to the prior year period. Constant Currency Revenue for the year was $880.5 million, which is $6.1 million lower than actual IFRS revenue. Excluding the impact of year-over-year changes in foreign exchange rates, such revenue for the year would have increased by 0.4%. The increase was primarily the result of (i) the Stars Rewards loyalty program and continued focus on high-value, net-depositing customers (primarily recreational players), and (ii) the positive impact of shared poker liquidity in Southern Europe, with France and Spain beginning in the first quarter of 2018 and Portugal joining in the second quarter of 2018. This was partially offset by (i) the cessation of operations in certain markets (notably Australia from September 2017), and (ii) reduced deposits in certain markets as noted above.
b) | Gaming |
Gaming revenue for the quarter and year ended December 31, 2018 increased $21.3 million, or 23.4%, and $93.6 million, or 28.0%, respectively, compared to the applicable prior year period. Constant Currency Revenue for the quarter and year ended December 31, 2018 was $117.5 million or $5.4 million higher than the actual IFRS revenue and $421.2 million or $7.2 million lower than the actual IFRS revenue, respectively. Excluding the impact of foreign currency fluctuations, the increase in both periods was primarily the result of (i) product and content improvements to its real-money online casino offerings, including the introduction of over 350 new casino games throughout the year, and (ii) the launch of its real-money online casino offerings in certain new markets during the year.
c) | Betting |
Betting revenue for the quarter and year ended December 31, 2018 increased $0.1 million, or 0.4%, and $29.9 million, or 60.7% respectively compared to the prior year period. Constant Currency Revenue for the quarter and year ended December 31, 2018 was $22.7 million or $0.9 million higher than the actual IFRS revenue and $77.6 million or $1.5 million lower than the actual IFRS revenue, respectively. Excluding the impact of foreign currency fluctuations, the increase in revenue was primarily due to increased Stakes which in turn was primarily the result of an increase in wagering activity and QAUs, driven in part by the World Cup, product and content improvements, and the launch of its real-money online sports betting offerings in certain new markets during the year. Revenue for the quarter and the year ended December 31, 2018 was also impacted by Betting Net Win Margin with a decrease in Betting Net Win Margin for the quarter and an increase for the year, in each case primarily driven by sporting results.
Gross Profit (Excluding Depreciation and Amortization) and Gross Profit Margin
Gross profit for the quarter and year ended December 31, 2018 decreased $4.2 million, or 1.4%, and increased $94.8 million, or 8.9%, respectively, compared to the applicable prior year period. The change in both periods was primarily the result of the movements in total revenue as noted above.
Gross profit margin for the quarter and year ended December 31, 2018 was 80.4%, a decrease of 0.2% and 80.5%, a decrease of 0.8%, respectively, compared to the applicable prior year period. The decrease in both periods was primarily driven by an increase in the proportion of Gaming and Betting revenue within the International segment, which generally have lower gross profit margins than Poker and, solely in relation to the full year period, as a result of increased gaming duties, levies and fees of $16.9 million incurred due to expanded operations in existing markets, including as a result of shared liquidity among Spain, France and Portugal.
18
General and Administrative
General and administrative expenses for the quarter and year ended December 31, 2018 increased $48.6 million, or 52.3%, and $91.5 million, or 24.7%, respectively, compared to the applicable prior year period. The increase in both periods was primarily due to (i) the acquisition of option rights relating to the market access agreement with Eldorado, which added $20.7 million of costs, (ii) increased salary and wages of $7.6 million for the quarter and $21.5 million for the year, respectively, as the result of investment in additional headcount, and (iii) increased information technology and software costs.
Sales and Marketing
Sales and marketing expenses for the quarter and year ended December 31, 2018 decreased $10.2 million, or 18.3%, and increased $11.1 million, or 7.2%, respectively, compared to the applicable prior year period. The decrease in the quarter and the increase in the year was primarily due to the timing of advertising costs and other marketing initiatives as described above including an increase in advertising costs during the second and third quarter related to the World Cup.
Research and Development
Research and development expenses for the quarter and year ended December 31, 2018 decreased $1.8 million, or 26.8%, and increased $2.7 million or 10.7%, respectively, compared to the applicable prior year period. The decrease in the quarter was primarily due to the timing of certain costs. The increase for the year was due to increased salary and wages as the result of investment in additional headcount and increased costs in relation to investment in technology, including new product development.
Key Metrics
International Segment QAUs

The segment’s combined QAUs for the quarter ended December 31, 2018 was 2.1 million, a decrease of 3% over the prior year period. The Corporation believes that this was primarily the result of (i) reduced activity in certain markets as a result of local restrictions on some methods of payment processing and on certain methods of downloading The Stars Group’s poker applications and (ii) its continued strategy of focusing on positive return CRM initiatives to attract high-value, net depositing customers (primarily recreational players), which has resulted, and may continue to result, in a decrease in certain lower value customers. Notwithstanding, the Corporation’s QAUs were positively impacted by the growth and expansion of its real-money online casino and betting product offerings within the International segment. Historically, QAUs have generally been higher in the first and fourth fiscal quarters. For a description of the variables and other factors that can impact QAUs, see “Non-IFRS Measures, Key Metrics and Other Data—Key Metrics and Other Data” above.
19
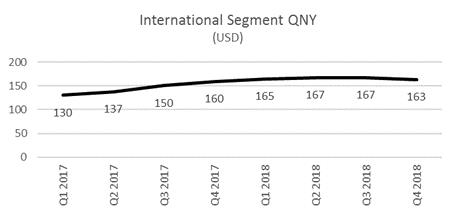

The segment’s QNY for the quarter ended December 31, 2018 was $163, an increase of 2% over the prior year period, which reflects growth across the Corporation’s betting and gaming offerings within the segment primarily driven by the cross-selling of poker customers to those products. This cross-selling is driven in part by the Corporation’s strategy of focusing on higher value recreational players, with the Stars Rewards loyalty programme encouraging gameplay across all products and lines of operations. The segment QNY calculated using Constant Currency Revenue for the quarter ended December 31, 2018 was $173, an increase of 8% over the prior year period. For a description of the variables and other factors that can impact QNY, see “Non-IFRS Measures, Key Metrics and Other Data—Key Metrics and Other Data” above.
International Segment Net Deposits

The segment’s Net Deposits for the quarter ended December 31, 2018 were $338 million, an increase of 3% over the prior year period. The Corporation believes that this was primarily driven by the implementation of the Stars Rewards loyalty program and initiatives to enhance the customer experience and increase customer engagement, including through CRM initiatives to attract and retain high-value customers, the continued development of the casino and sports betting product offerings, including through additional third-party slots under the PokerStars Casino brand and
20
improvement of the user experience and user interface under the BetStars brand. This was partially offset by loss of deposits from markets that were impacted by local restrictions on select methods of payment processing and on certain methods of downloading The Stars Group’s poker applications as noted above and the negative impacts from foreign exchange fluctuations. For a description of the variables and other factors that can impact Net Deposits, see “Non-IFRS Measures, Key Metrics and Other Data—Key Metrics and Other Data” above.
International Segment Stakes and Betting Net Win Margin
The segment’s Stakes for the quarter and year ended December 31, 2018 were $261.1 million, an increase of 33.4%, and $966.3 million, an increase of 49.3%, respectively, over the applicable prior year period. The increases in both periods were primarily the result of: (i) an increase in QAUs active on the International segments sportsbetting offerings, driven by an improved product offering with an enhanced user experience as well as the launch of its real-money online sports betting offerings in certain new markets during the year; and (ii) increased customer activity due to the World Cup. Although the World Cup had a greater impact on the second and third fiscal quarters, newly acquired QAUs during, or as a result of, the World Cup contributed to the increase in Stakes for the quarter ended December 31, 2018.
The segment’s Betting Net Win Margin for the quarter ended December 31, 2018 was 8.3%, a decrease of 2.8 percentage points over the prior year period. This decrease was primarily the result of the sustained run of operator-favorable sporting results in the prior year period resulting in a Betting Net Win Margin of 11.1% in that period. The segment’s Betting Net Win Margin for the year ended December 31, 2018 was 8.2%, an increase of 0.6 percentage points over the prior year period, which was primarily the result of operator favorable results compared to the prior year period. For a description of the variables and other factors that can impact Stakes and Betting Net Win Margin, see “Non-IFRS Measures, Key Metrics and Other Data—Key Metrics and Other Data” above.
United Kingdom
As at December 31, 2018, the United Kingdom reporting segment consisted of the SBG business.
|
| Quarter Ended December 31, |
| Year Ended December 31, | ||||||||
In thousands of U.S. Dollars (except otherwise noted) |
| 2018 |
| 2017 |
| % Change |
| 2018 |
| 2017 |
| % Change |
Stakes |
| 1,289,374 |
| — |
| — |
| 2,511,228 |
| — |
| — |
Betting Net Win Margin (%) |
| 10.1% |
| — |
| — |
| 8.6% |
| — |
| — |
|
|
|
|
|
|
|
|
|
|
|
|
|
Revenue |
|
|
|
|
|
|
|
|
|
|
|
|
Poker |
| 3,045 |
| — |
| — |
| 5,929 |
| — |
| — |
Gaming |
| 84,164 |
| — |
| — |
| 157,482 |
| — |
| — |
Betting |
| 130,732 |
| — |
| — |
| 215,921 |
| — |
| — |
Other |
| 7,810 |
| — |
| — |
| 14,799 |
| — |
| — |
Total revenue |
| 225,751 |
| — |
| — |
| 394,131 |
| — |
| — |
|
|
|
|
|
|
|
|
|
|
|
|
|
Gross profit (excluding depreciation and amortization) |
| 153,880 |
| — |
| — |
| 275,106 |
| — |
| — |
Gross profit margin (%) |
| 68.2% |
| — |
| — |
| 69.8% |
| — |
| — |
|
|
|
|
|
| — |
|
|
|
|
| — |
General and administrative |
| 135,326 |
| — |
| — |
| 240,023 |
| — |
| — |
Sales and marketing 2 |
| 35,413 |
| — |
| — |
| 75,637 |
| — |
| — |
Research and development |
| 5,660 |
| — |
| — |
| 10,600 |
| — |
| — |
Operating loss |
| (22,519) |
| — |
| — |
| (51,154) |
| — |
| — |
|
|
|
|
|
|
|
|
|
|
|
|
|
Adjusted EBITDA ¹ |
| 72,017 |
| — |
| — |
| 99,960 |
| — |
| — |
Adjusted EBITDA Margin (%) ¹ |
| 31.9% |
| — |
| — |
| 25.4% |
| — |
| — |
1 Non-IFRS measure. A reconciliation to its nearest IFRS measure is provided under “Reconciliations” below.
2 Sales and marketing includes $1.0 million and $2.0 million for the quarter and year ended December 31, 2018, respectively, that the Corporation excluded from its consolidated results as it related to certain non-gaming related
21
transactions with the International segment. A corresponding exclusion in the consolidated results is recorded to Other revenue for amounts included in the International segment in respect of these transactions.
As previously disclosed, on July 10, 2018, the Corporation completed the SBG Acquisition. SBG operates mobile-led betting, poker and gaming platforms primarily in the United Kingdom. Revenue for the quarter and year ended December 31, 2018 were $225.8 million and $394.1 million, respectively. Gross profit for the same periods was $153.9 million and $275.1 million, respectively, resulting in a gross profit margin of 68.2% and 69.8%, respectively. Revenue and gross profit for the quarter were impacted by a significantly lower Betting Net Win Margin (albeit still above the long-term average of 9%) than the prior year period of 14%. For a description of seasonal trends and other factors impacting this segment’s results, see “Summary of Quarterly Results” below.
Key Metrics
United Kingdom Segment QAUs and QNY
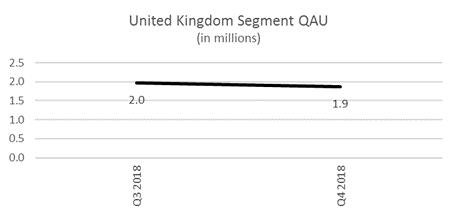
The segment’s combined QAUs for the quarter ended December 31, 2018 was 1.9 million. The Corporation believes that this was primarily the result of increased activity around the World Cup and the start of the European football season in August 2018, which continued into the quarter. For a description of the variables and other factors that can impact QAUs, see “Non-IFRS Measures, Key Metrics and Other Data—Key Metrics and Other Data” above.
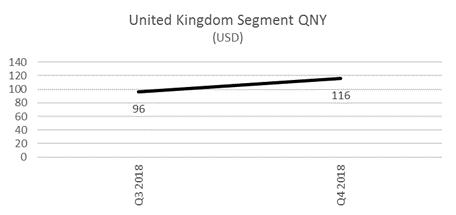
The segment’s QNY for the quarter ended December 31, 2018 was $116, which the Corporation believes was positively impacted by higher Betting Net Win Margin. For a description of the variables and other factors that can impact QNY, see “Non-IFRS Measures, Key Metrics and Other Data—Key Metrics and Other Data” above.
United Kingdom Segment Stakes and Betting Net Win Margin
The segment’s Stakes for the quarter ended December 31, 2018 were $1.29 billion, with a Betting Net Win Margin of 10.1%. The segment’s Stakes for the year ended December 31, 2018 were $2.51 billion, with a Betting Net Win Margin of 8.6%. Stakes remained strong primarily as a result of trends in customer engagement. Betting Net Win
22
Margin for the quarter was above long-term averages of around 9% primarily due to the mix of stakes across different sporting events and bet types throughout the quarter as such sporting events and bet types can have different average Betting Net Win Margins. For the year, the Betting Net Win Margin was slightly below the long-term average of around 9% primarily as a result of the operator-unfavorable sporting results in the third quarter. For a description of the variables and other factors that can impact Stakes and Betting Net Win Margin, see “Non-IFRS Measures, Key Metrics and Other Data—Key Metrics and Other Data” above.
Australia
As at December 31, 2018, the Australia reporting segment consisted of the BetEasy business.
|
| Quarter Ended December 31, |
| Year Ended December 31, | ||||||||
In thousands of U.S. Dollars (except otherwise noted) |
| 2018 |
| 2017 |
| % Change |
| 2018 |
| 2017 |
| % Change |
Stakes |
| 877,338 |
| — |
| — |
| 2,570,502 |
| — |
| — |
Betting Net Win Margin (%) |
| 8.2% |
| — |
| — |
| 7.6% |
| — |
| — |
|
|
|
|
|
|
|
|
|
|
|
|
|
Revenue |
|
|
|
|
|
|
|
|
|
|
|
|
Betting |
| 71,542 |
| — |
| — |
| 196,101 |
| — |
| — |
Other |
| 829 |
|
|
|
|
| 829 |
|
|
|
|
Total revenue |
| 72,371 |
| — |
| — |
| 196,930 |
| — |
| — |
|
|
|
|
|
|
|
|
|
|
|
|
|
Gross profit (excluding depreciation and amortization) |
| 47,768 |
| — |
| — |
| 137,357 |
| — |
| — |
Gross profit margin (%) |
| 66.0% |
| — |
| — |
| 69.7% |
| — |
| — |
|
|
|
|
|
|
|
|
|
|
|
|
|
General and administrative |
| 32,934 |
| — |
| — |
| 117,522 |
| — |
| — |
Sales and marketing |
| 15,862 |
| — |
| — |
| 53,385 |
| — |
| — |
Research and development |
| 432 |
| — |
| — |
| 1,530 |
| — |
| — |
Operating loss |
| (1,460) |
| — |
| — |
| (35,080) |
| — |
| — |
|
|
|
|
|
|
|
|
|
|
|
|
|
Adjusted EBITDA ¹ |
| 13,211 |
| — |
| — |
| 21,072 |
| — |
| — |
Adjusted EBITDA Margin (%) ¹ |
| 18.3% |
| — |
| — |
| 10.7% |
| — |
| — |
¹ Non-IFRS measure. A reconciliation to its nearest IFRS measure is provided under “Reconciliations” below.
As previously disclosed, in February and April 2018 the Corporation collectively acquired a majority interest in BetEasy, and in April 2018 BetEasy acquired TSGA. BetEasy operates an online sportsbook in Australia. As at December 31, 2018, the Corporation held an 80% equity interest in BetEasy.
Revenue for the quarter and year ended December 31, 2018 were $72.4 million and $196.9 million, respectively. Gross profit for the same periods was $47.8 million and $137.4 million, respectively, resulting in a gross profit margin of 66.0% and 69.7%, respectively. Revenue and gross profit for both periods were impacted by the Betting Net Win Margin for the quarter and year which was below the long-term averages of 8.5% primarily due to a combination of customer-favorable sporting results and increased promotional spend, including special bonuses to help mitigate the potential loss of customers during the migration of TSGA customers onto the BetEasy technology platform and the rebranding of both entities into BetEasy.
For a description of seasonal trends and other factors impacting this segment’s results, see “Summary of Quarterly Results” below.
23
Australia Segment QAUs and QNY
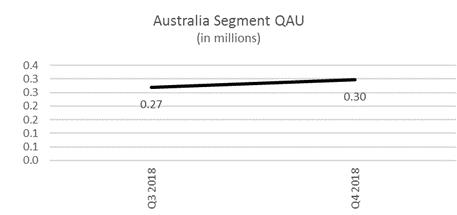
The segment’s QAUs for the quarter ended December 31, 2018 was 0.3 million. The Corporation believes that this was primarily the result of increased activity following the successful migration of TSGA customers onto the BetEasy platform and associated promotional spend to drive activity and assist the migration. For a description of the variables and other factors that can impact QAUs, see “Non-IFRS Measures, Key Metrics and Other Data—Key Metrics and Other Data” above.
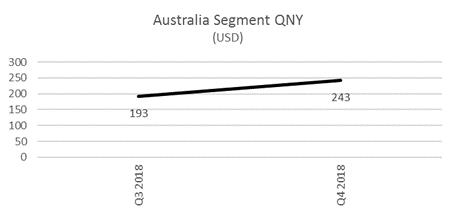
The segment’s QNY for the quarter ended December 31, 2018 was $243, which the Corporation believes was negatively impacted by lower than the long-term average Betting Net Win Margin. For a description of the variables and other factors that can impact QNY, see “Non-IFRS Measures, Key Metrics and Other Data—Key Metrics and Other Data” above.
Australia Segment Stakes and Betting Net Win Margin
The segment’s Stakes for the quarter ended December 31, 2018 were $877.3 million, with a Betting Net Win Margin of 8.2%. The segment’s Stakes for the year ended December 31, 2018 were $2.57 billion, with a Betting Net Win Margin of 7.6%. Stakes were strong primarily as a result of positive trends in QAUs driven in part by the customer migration noted above. Betting Net Win Margin for the quarter and year was below long-term averages of around 8.5% primarily due to a combination of customer-favorable sporting results as well as increased promotional spend, including special bonuses to help mitigate the potential loss of customers during the migration of TSGA customers onto the BetEasy technology platform and the rebranding of both entities into BetEasy as described above. For a description of the variables and other factors that can impact Stakes and Betting Net Win Margin, see “Non-IFRS Measures, Key Metrics and Other Data—Key Metrics and Other Data” above.
24
The Corporate cost center includes certain general and administrative expenses, including corporate head office expenses, acquisition-related costs and various corporate governance and regulatory costs, as well as the cost to manage the centralized corporate tax and the debt servicing functions. These Corporate cost center expenses are not allocated to the reporting segments as they do not directly relate to the operations of those segments.
|
| Quarter Ended December 31, |
|
| Year Ended December 31, |
| ||||||||||||||||||
In thousands of U.S. Dollars (except otherwise noted) |
| 2018 |
|
| 2017 |
|
| % Change |
|
| 2018 |
|
| 2017 |
|
| % Change |
| ||||||
Operating expenses |
|
| (3,254 | ) |
|
| (22,887 | ) |
|
| (85.8 | %) |
|
| (166,822 | ) |
|
| (68,994 | ) |
|
| 141.8 | % |
Operating loss |
|
| (3,254 | ) |
|
| (22,887 | ) |
|
| (85.8 | %) |
|
| (166,822 | ) |
|
| (68,994 | ) |
|
| 141.8 | % |
Net financing charges |
|
| (90,813 | ) |
|
| (38,739 | ) |
|
| 134.4 | % |
|
| (363,884 | ) |
|
| (158,332 | ) |
|
| 129.8 | % |
Income tax recovery (expense) |
|
| (14,450 | ) |
|
| (26,352 | ) |
|
| (45.2 | %) |
|
| 988 |
|
|
| (27,208 | ) |
|
| (103.6 | %) |
Net loss |
|
| (108,517 | ) |
|
| (87,978 | ) |
|
| 23.3 | % |
|
| (529,718 | ) |
|
| (254,534 | ) |
|
| 108.1 | % |
|
|
|
|
|
|
|
|
|
|
|
|
|
|
|
|
|
|
|
|
|
|
|
|
|
Adjusted EBITDA ¹ |
|
| (13,686 | ) |
|
| (11,138 | ) |
|
| (22.9 | %) |
|
| (40,970 | ) |
|
| (36,098 | ) |
|
| (13.5 | %) |
¹ Non-IFRS measure. A reconciliation to its nearest IFRS measure is provided under “Reconciliations” below.
Operating Expenses
Operating expenses for the quarter ended December 31, 2018 decreased $19.6 million, or 85.8%, compared to the prior year period. This was primarily the result of foreign exchange gains recognized in respect of intercompany loans within the applicable reporting segments, which are offset by losses recognized in the applicable segment’s results. Operating expenses for the year ended December 31, 2018 increased $97.8 million, or 141.8%, compared to the prior year period. This was primarily the result of (i) acquisition-related costs of $54.2 million incurred in connection with the Acquisitions, and (ii) realized losses on deal contingent forward contracts of $61.4 million in relation to the Acquisitions.
Net Financing Charges and Income Taxes
Net financing charges and income taxes are only recorded in the Corporate cost center and as a result the variances and trends are as discussed above under “Consolidated Results of Operations and Cash Flows”.
LIQUIDITY AND CAPITAL RESOURCES
Sources of Liquidity
The Corporation’s principal sources of liquidity are its cash generated from operations, Revolving Facility and certain other currently available funds. Currently available funds consist primarily of cash on deposit with banks and investments, which are comprised primarily of certain highly liquid, short-term investments, including money market funds. The Corporation’s working capital requirements are generally minimal during the year as its current gaming business requires customers to deposit funds prior to playing or participating in its real-money product offerings. The Corporation believes that such deposits are typically converted to revenue efficiently and on a timely basis such that operating expenditures are sufficiently covered. Management also believes that investing is a key element necessary for the continued growth of the Corporation’s customer base and the future development of new and innovative product offerings. Based on the Corporation’s currently available funds, funds available from the Revolving Facility and its ability to access the debt and equity capital markets, if necessary, management believes that the Corporation will have the cash resources necessary to satisfy current obligations and working capital needs, and fund currently planned development and integration activities and other capital expenditures, as well as currently planned acquisitions, for at least the next 12 months. Notwithstanding, the state of capital markets and the Corporation’s ability to access them on favorable terms, if at all; micro and macro-economic downturns; and fluctuations of the Corporation’s operations, among other things, may influence its ability to secure the capital resources required to satisfy current or future obligations and fund future projects, strategic initiatives and support growth. For a description of the factors and risks that could affect the Corporation’s ability to generate sufficient amounts of cash and access the capital markets in the short- and long-terms in order to maintain the Corporation’s capacity to meet its obligations and expected growth or fund development activities, see “Risk Factors and Uncertainties” above and in the 2018 Annual Information Form, including, in particular, under the headings “Risk Factors and Uncertainties—The Stars
25
Group’s substantial indebtedness requires and will continue to require that it use a significant portion of its cash flow to make debt service payments, and it may not generate sufficient cash flows to meet its debt service obligations, which could have significant adverse consequences on it and its business” and “Credit Ratings”.
The Corporation believes that its financial condition improved during the period up to the SBG Acquisition on July 10, 2018 by, among other things, decreasing its leverage ratios and producing strong net cash inflows from operating activities. Following the SBG Acquisition and SBG Financing, the Corporation has improved, and intends to continue to improve, its financial condition, including by reducing its long-term debt and decreasing its leverage ratios, through its strong cash flow generation and liquidity, including as a result of continuing to introduce new and innovative product offerings, gaining market share and pursuing expansion into new jurisdictions. For additional information regarding the Corporation’s repayment of debt, see below under “Long-Term Debt”.
For additional information regarding the Corporation’s liquidity and capital resources, see the descriptions of the Corporation’s debt as set forth below under “Revolving Facility” and “Long-Term Debt” and the notes to the 2018 Annual Financial Statements, as well as the 2018 Annual Information Form. See also “Risk Factors and Uncertainties” above and in the 2018 Annual Information Form, particularly under the heading “Risk Factors and Uncertainties—Risks Related to the Business”.
Market Risk
The Corporation is exposed to market risks, including changes to foreign currency exchange rates and interest rates. For additional information regarding these and other risks, including risks related to Brexit, and its impact on the below, and other risk categories, see note 29 in the 2018 Annual Financial Statements and the 2018 Annual Information Form, including under the heading “Risk Factors and Uncertainties”.
Foreign Currency Exchange Risk
The Corporation is exposed to foreign currency risk, which includes risks related to its revenue and operating expenses denominated in currencies other than the U.S. dollar. In general, the Corporation is a net receiver of currencies other than the U.S. dollar, primarily the Euro, GBP and AUD, which are the primary depositing currencies of the Corporation’s customers. Accordingly, changes in exchange rates, and in particular a strengthening of the U.S. dollar, which is the primary currency of game play on certain of the Corporation’s product offerings within the International segment, have in the past reduced, and may in the future reduce, the purchasing power of the Corporation’s customers, thereby potentially negatively affecting the Corporation’s revenue and other operating results.
The Corporation has also experienced and will continue to experience fluctuations in its net earnings as a result of translation gains or losses related to revaluing certain current asset and current liability balances that are denominated in currencies other than the functional currency of the entities in which they are recorded. Management monitors movements in foreign exchange rates and uses derivative financial instruments for risk management purposes and anticipates that such instruments will mitigate some of its foreign currency risk. As such, any change in cash flows associated with derivative instruments is expected to be offset by changes in cash flows related to the hedged position. However, it is difficult to predict the effect hedging activities could have on the Corporation’s results of operations and there can be no assurance that any foreign currency exchange risks will be so mitigated or that such instruments will not result in a loss. The Corporation recorded foreign currency losses of $9.5 million and foreign currency losses of $0.5 million in the quarters ended December 31, 2018 and 2017, respectively, and foreign currency losses of $68.4 million and foreign currency losses of $2.8 million in the years ended December 31, 2018 and 2017, respectively. For additional information on derivatives, see also notes 2 and 19 in the 2018 Annual Financial Statements. The Corporation may in the future enter into additional derivatives or other financial instruments in an attempt to further hedge its foreign currency exchange risk.
Interest Rate Risk
The Corporation’s exposure to changes in interest rates relates primarily to interest paid on its long-term indebtedness, as well as the interest earned on and market value of its cash, money market funds and debt instruments held at fair value through other comprehensive income. The Corporation is also exposed to fair value interest rate risk on its fixed rate Senior Notes. The Corporation attempts to mitigate cashflow interest rate risk on the First Lien Term Loans through the Swap Agreements but remains exposed to cash flow interest rate risk on the unhedged elements of the First Lien Term Loans, which have variable interest rates.
26
As at December 31, 2018, the USD First Lien Term Loan and EUR First Lien Term Loan (as defined below) have LIBOR and EURIBOR floors, respectively, of 0% and as such, the interest rate cannot decrease below 3.50% or 3.75%, respectively. Management monitors movements in the interest rates by frequently reviewing the EURIBOR and LIBOR.
The Corporation’s cash consists primarily of cash on deposit with banks and its investments consist primarily of certain highly liquid, short-term instruments. The Stars Group’s investment policy and strategy is focused on preservation of capital and supporting its liquidity requirements, not on generating trading profits. Changes in interest rates affect the interest earned on the Corporation’s cash and investments and the market value of those investments. However, any realized gains or losses resulting from such interest rate changes would occur only if it sold the investments prior to maturity.
In July 2017, the Financial Conduct Authority (the authority that regulates LIBOR) announced it intends to stop compelling banks to submit rates for the calculation of LIBOR after 2021. The Alternative Reference Rates Committee (“ARRC”) has proposed that the Secured Overnight Financing Rate (“SOFR”) is the rate that represents best practice as the alternative to USD-LIBOR for use in derivatives and other financial contracts that are currently indexed to USD-LIBOR. ARRC has proposed a paced market transition plan to SOFR from USD-LIBOR and organizations are currently working on industry wide and company specific transition plans as it relates to derivatives and cash markets exposed to USD-LIBOR. The Corporation has material contracts that are indexed to USD-LIBOR and is monitoring this activity and evaluating the related risks.
Liquidity Risk
The Corporation is also exposed to liquidity risk with respect to its contractual obligations and financial liabilities. The Corporation manages liquidity risk by continuously monitoring its forecasted and actual cash flows, and matching maturity profiles of financial assets and liabilities. The Corporation’s objective is to maintain a balance between continuity of funding and flexibility through borrowing facilities available through the Corporation’s lenders. The Corporation’s policy is to seek to ensure adequate funding is available from operations, established lending facilities and other sources, including the debt and equity capital markets, as required. Notwithstanding, the Corporation’s ability to secure the capital resources required to satisfy its current or future obligations could be impacted by, among other things, the state of capital markets, micro and macro-economic downturns, and fluctuations of the Corporation’s operations.
Contractual Obligations
The following is a summary of the Corporation’s contractual obligations as at December 31, 2018:
|
| Payments due by period |
| |||||||||||||
In thousands of U.S. Dollars |
| Total |
|
| Less than 1 year |
|
| 2 to 5 years |
|
| After 5 years |
| ||||
Provisions |
|
| 43,191 |
|
|
| 39,189 |
|
|
| 3,844 |
|
|
| 158 |
|
Long-term debt * |
|
| 7,529,366 |
|
|
| 349,328 |
|
|
| 1,363,382 |
|
|
| 5,816,656 |
|
Derivatives |
|
| 22,561 |
|
|
| 16,493 |
|
|
| 6,068 |
|
|
| — |
|
Lease obligations |
|
| 241,811 |
|
|
| 61,423 |
|
|
| 154,374 |
|
|
| 26,013 |
|
Purchase obligations |
|
| 104,626 |
|
|
| 40,011 |
|
|
| 54,054 |
|
|
| 10,561 |
|
Deferred contingent payment |
|
| 77,628 |
|
|
| — |
|
|
| 77,628 |
|
|
| — |
|
Total contractual obligations |
|
| 8,019,183 |
|
|
| 506,444 |
|
|
| 1,659,350 |
|
|
| 5,853,388 |
|
* Includes principal and interest
27
The following is a summary of long-term debt outstanding as at December 31, 2018 and December 31, 2017 (all capitalized terms used in the table below relating to such long-term debt are defined below):
In thousands of U.S. Dollars |
| Interest rate |
| December 31, 2018, Principal outstanding balance in local denominated currency |
| December 31, 2018 Carrying amount in USD |
| December 31, 2017, Principal outstanding balance in local denominated currency |
| December 31, 2017 Carrying amount in USD |
Revolving Facility |
| 5.64% |
| — |
| — |
| — |
| — |
USD First Lien Term Loan |
| 5.89% |
| 3,557,125 |
| 3,479,823 |
| — |
| — |
EUR First Lien Term Loan |
| 3.75% |
| 850,000 |
| 951,980 |
| — |
| — |
Senior Notes |
| 7.00% |
| 1,000,000 |
| 980,008 |
| — |
| — |
Loan payable to non-controlling interests |
| 0.00% |
| 35,147 |
| 35,147 |
| — |
| — |
Previous USD first lien term loan |
| 5.32% |
| — |
| — |
| 1,895,654 |
| 1,848,397 |
Previous EUR first lien term loan |
| 3.25% |
| — |
| — |
| 382,222 |
| 453,540 |
USD second lien term loan |
| 8.69% |
| — |
| — |
| 95,000 |
| 56,632 |
Total long-term debt |
|
|
|
|
| 5,446,958 |
|
|
| 2,358,569 |
Current portion |
|
|
|
|
| 35,750 |
|
|
| 4,990 |
Non-current portion |
|
|
|
|
| 5,411,208 |
|
|
| 2,353,579 |
The increase in outstanding long-term debt from December 31, 2017 to December 31, 2018 was primarily the result of the proceeds from the incurrence of the First Lien Term Loans and issuance of the Senior Notes, partially offset by scheduled quarterly debt principal repayments and the repayment of the entire balance of the Corporation’s prior first and second lien term loans. In connection with the SBG Acquisition on July 10, 2018, the Corporation raised $4.567 billion in First Lien Term Loans, $1.00 billion in Senior Notes and obtained a new Revolving Facility of $700.0 million of which it had drawn $100.0 million as of completion of the acquisition (but had fully repaid on October 24, 2018), each of which are described below. Additionally, the Corporation completed the underwritten public offering of Common Shares at a price of $38.00 per Common Share, which closed on June 26, 2018, for a total net proceeds (before expenses and excluding the overallotment) of $621.8 million (the “Equity Offering” and collectively with the foregoing, the “SBG Financing”). See note 24 in the 2018 Annual Financial Statements for additional information relating to the Equity Offering. For additional information regarding the Corporation’s outstanding long-term debt, see the 2018 Annual Financial Statements.
The contractual principal repayments over the next five years of the Corporation’s long-term debt outstanding as at December 31, 2018, amount to the following:
In thousands of U.S. Dollars |
| <1 Year |
| 1-2 Years |
| 2-3 Years |
| 3-4 Years |
| 4-5 Years |
| >5 Years |
Revolving Facility |
| — |
| — |
| — |
| — |
| — |
| — |
USD First Lien Term Loan |
| 35,750 |
| 35,750 |
| 35,750 |
| 35,750 |
| 35,750 |
| 3,378,375 |
EUR First Lien Term Loan |
| — |
| — |
| — |
| — |
| — |
| 973,803 |
Senior Notes |
| — |
| — |
| — |
| — |
| — |
| 1,000,000 |
Loan payable to non-controlling interests |
| — |
| 35,147 |
| — |
| — |
| — |
| — |
Total |
| 35,750 |
| 70,897 |
| 35,750 |
| 35,750 |
| 35,750 |
| 5,352,178 |
First Lien Credit Facility
On July 10, 2018, the Corporation completed the debt portion of the SBG Financing, which replaced its previous first lien credit facility with: (i) a first lien revolving facility (the “Revolving Facility”); (ii) a USD first lien term loan (the “USD First Lien Term Loan”); and (iii) a new EUR first lien term loan (the “EUR First Lien Term Loan” and, together with the USD First Lien Term Loan, the “First Lien Term Loans”). Also on July 10, 2018, in connection with the SBG Financing, the Corporation, lenders and Deutsche Bank AG New York Branch, as agent, and certain other parties entered into a new credit agreement (the “Credit Agreement”) for the Revolving Facility and First Lien Term Loans to, among other things, reflect the new first lien credit facility and continue to add certain operational and financial flexibility, particularly as it relates to the Corporation on a combined basis following the SBG Acquisition.
28
The Credit Agreement contains customary restrictive covenants and also provides for customary mandatory prepayments, including a customary excess cash flow sweep. See note 17 in the 2018 Annual Financial Statements for further information in respect of the restrictive covenants. As at December 31, 2018, the Corporation was in compliance with all covenants related to the First Lien Term Loans.
Revolving Facility
Maturing on July 10, 2023, the Revolving Facility is for $700 million and has a margin of 3.25% above the applicable LIBOR rate. The margin for the Revolving Facility is subject to leverage-based step-downs. The commitment fee on the Revolving Facility varies based on first lien leverage and ranges from 0.250% to 0.375%. Borrowings under the Revolving Facility are subject to the satisfaction of customary conditions, including the absence of a default and compliance with certain representations and warranties. To the extent the Corporation’s aggregate drawings on and certain letters of credit against the Revolving Facility exceed 35% of the Revolving Facility, the Corporation must comply on a quarterly basis with a maximum net first lien senior secured leverage ratio of 6.75 to 1.00.
The Revolving Facility can be used for working capital needs and for general corporate purposes. As at December 31, 2018, the Corporation has no funds drawn under the Revolving Facility, but had $74.2 million of letters of credit issued but undrawn thereunder relating to, among other things, the Kentucky bond collateral (as described in the 2018 Annual Financial Statements). Availability under the Revolving Facility as at the date hereof is $625.8 million. As at December 31, 2018, the Corporation was in compliance with all covenants related to the Revolving Facility.
First Lien Term Loans
The First Lien Term Loans consist of a $3.575 billion USD First Lien Term Loan priced at LIBOR plus 3.50% and a €850 million EUR First Lien Term Loan priced at EURIBOR plus 3.75%, each with a maturity date of July 10, 2025 and a floor of 0%. Starting on the last business day of the first fiscal quarter ending after July 10, 2018, the USD First Lien Term Loan requires scheduled quarterly payments in amounts equal to 0.25% of the aggregate principal amount of the USD First Lien Term Loan, with the balance due at maturity. There is no amortization on the EUR First Lien Term Loan.
7.00% Senior Notes
On July 10, 2018, two of the Corporation’s subsidiaries, Stars Group Holdings B.V. and Stars Group (US) Co-Borrower, LLC (the “Issuers”), issued the 7.00% Senior Notes due 2026 (the “Senior Notes”) at par in an aggregate principle amount of $1.00 billion. The Senior Notes mature on July 15, 2026. Interest on the Senior Notes is payable semi-annually on January 15 and July 15 of each year, commencing on January 15, 2019. The Senior Notes are guaranteed by each of the Issuers’ restricted subsidiaries that guarantees the Revolving Facility. The Senior Notes are the Issuers’ senior unsecured obligations and rank equally in right of payment with all of the Issuers’ existing and future senior indebtedness.
The indenture governing the Senior Notes (the “Indenture”) provides the holders of the Senior Notes with customary rights, including the right to require Stars Group Holdings B.V. to offer to repurchase the Senior Notes in certain limited circumstances and it also provides the Issuers with the right to redeem some or all of the Senior Notes at defined redemption prices based on when the redemption occurs. The Senior Notes include, among other terms and conditions, certain customary limitations on the Issuers’ ability to take certain actions or engage in certain activities. See note 17 in the 2018 Annual Financial Statements for further information in respect of the terms and conditions of the Indenture and Senior Notes. As at the date hereof, the aggregate principal amount of outstanding Senior Notes is $1.00 billion.
Hedging Activities
Subsequent to the SBG Financing, and as part of managing the Corporation’s exposure to foreign exchange risk and interest rate risk, the Corporation entered into cross-currency interest rate swap agreements and interest rate swap agreements (collectively, the “Swap Agreements”), each as discussed below. Prior to entering into the Swap Agreements, the Corporation unwound and settled all of its and SBG’s prior swap agreements.
During the year ended December 31, 2018, a subsidiary of the Corporation entered into USD-EUR cross-currency interest rate swap agreements with a notional amount of €1.99 billion ($2.33 billion), which fix the USD to EUR exchange rate at 1.167 and fix the Euro interest payments at an average interest rate of 3.6%, as well as EUR-GBP
29
cross-currency interest rate swap agreements with a notional amount of £1.00 billion (€1.12 billion), which fix the EUR to GBP exchange rate at 0.889 and fix the GBP interest payments at an average interest rate of 5.4%. The cross-currency interest rate swaps have a profile that amortizes in line with the USD First Lien Term Loan and each are set to mature in July 2023. The Corporation also entered into an amortizing USD interest rate swap agreement with a notional amount of $700 million, which is set to mature in July 2023, and swaps USD three-month LIBOR to a fixed interest rate of 2.82%.
The USD-EUR cross-currency interest rate swap agreements and the USD interest rate swap are designated as cash flow hedges. The effective portion of the Corporation’s cash flow hedges is recognized in the consolidated statements of comprehensive (loss) income until reclassified into the consolidated statements of (loss) earnings in the same period the hedged transaction affects earnings.
The EUR-GBP cross-currency interest rate swap agreements are designated as a net investment hedge of the Corporation’s GBP functional currency subsidiaries. Accordingly, the portion of the translation impact arising from the translation of the GBP-denominated liabilities that was determined to be an effective hedge during the period was recognized in the consolidated statements of comprehensive (loss) income, counterbalancing a portion of the translation impact arising from translation of the Corporation’s net investment in its GBP foreign operations.
Upon completion of the SBG Financing, the Corporation also designated a portion of the carrying amount of the USD First Lien Term Loan and the carrying amount of the Senior Notes as a net investment hedge in the Corporation’s USD functional currency subsidiaries. Accordingly, the portion of the translation impact arising from the translation of the USD-denominated liabilities that was determined to be an effective hedge during the period was recognized in the consolidated statements of comprehensive (loss) income, counterbalancing a portion of the translation impact arising from translation of the Corporation’s net investment in its USD foreign operations.
The Corporation evaluates the effectiveness of its cash flow hedges and net investment hedges for each reporting period. In the years ended December 31, 2018 and 2017, the Corporation recorded $(14.9) million and $nil of ineffectiveness, respectively, in respect of its cash flow hedges, and no ineffectiveness was recorded in respect of its net investment hedges.
See note 19 in the 2018 Annual Financial Statements for further information in respect of the Corporation’s hedging activities.
To supplement its 2018 Annual Financial Statements presented in accordance with IFRS, the Corporation considers certain financial measures that are not prepared in accordance with IFRS, including those set forth below. See “Non-IFRS Measures, Key Metrics and Other Data” above. The tables below present reconciliations of Adjusted EBITDA, Adjusted Net Earnings, Adjusted Net Earnings per Diluted Share, and Free Cash Flow, each as presented in this MD&A. The Corporation does not provide a reconciliation for the numerator of QNY as the revenue components thereof (i.e., Poker, Gaming and Betting, as applicable) and Other revenue are set forth in “Segment Results of Operations” above.
30
|
| Quarter Ended December 31, 2018 |
| |||||||||||||||||
In thousands of U.S. Dollars (except per share amounts) |
| International |
|
| United Kingdom |
|
| Australia |
|
| Corporate |
|
| Consolidated |
| |||||
Net earnings (loss) |
|
| 94,323 |
|
|
| (22,519 | ) |
|
| (1,460 | ) |
|
| (108,517 | ) |
|
| (38,173 | ) |
|
|
|
|
|
|
|
|
|
|
|
|
|
|
|
|
|
|
|
|
|
Income tax recovery |
|
| — |
|
|
| — |
|
|
| — |
|
|
| (14,450 | ) |
|
| (14,450 | ) |
Net financing charges |
|
| — |
|
|
| — |
|
|
| — |
|
|
| (90,813 | ) |
|
| (90,813 | ) |
|
|
|
|
|
|
|
|
|
|
|
|
|
|
|
|
|
|
|
|
|
Operating income (loss) |
|
| 94,323 |
|
|
| (22,519 | ) |
|
| (1,460 | ) |
|
| (3,254 | ) |
|
| 67,090 |
|
|
|
|
|
|
|
|
|
|
|
|
|
|
|
|
|
|
|
|
|
|
Depreciation and amortization |
|
| 35,950 |
|
|
| 55,237 |
|
|
| 8,753 |
|
|
| 85 |
|
|
| 100,025 |
|
Add (deduct) the impact of the following: |
|
|
|
|
|
|
|
|
|
|
|
|
|
|
|
|
|
|
|
|
Acquisition-related costs |
|
| — |
|
|
| — |
|
|
| — |
|
|
| 3,084 |
|
|
| 3,084 |
|
Stock-based compensation1 |
|
| — |
|
|
| — |
|
|
| — |
|
|
| 4,004 |
|
|
| 4,004 |
|
Loss from investments |
|
| 1,297 |
|
|
| — |
|
|
| — |
|
|
| — |
|
|
| 1,297 |
|
Impairment of intangibles assets |
|
| 678 |
|
|
| 602 |
|
|
| — |
|
|
| — |
|
|
| 1,280 |
|
Other costs (income) |
|
| 35,614 |
|
|
| 38,697 |
|
|
| 5,918 |
|
|
| (17,605 | ) |
|
| 62,624 |
|
Total adjusting items |
|
| 37,589 |
|
|
| 39,299 |
|
|
| 5,918 |
|
|
| (10,517 | ) |
|
| 72,289 |
|
|
|
|
|
|
|
|
|
|
|
|
|
|
|
|
|
|
|
|
|
|
Adjusted EBITDA |
|
| 167,862 |
|
|
| 72,017 |
|
|
| 13,211 |
|
|
| (13,686 | ) |
|
| 239,404 |
|
|
| Year Ended December 31, 2018 |
| |||||||||||||||||
In thousands of U.S. Dollars (except per share amounts) |
| International |
|
| United Kingdom |
|
| Australia |
|
| Corporate |
|
| Consolidated |
| |||||
Net earnings (loss) |
|
| 507,046 |
|
|
| (51,154 | ) |
|
| (35,080 | ) |
|
| (529,718 | ) |
|
| (108,906 | ) |
|
|
|
|
|
|
|
|
|
|
|
|
|
|
|
|
|
|
|
|
|
Income tax recovery |
|
| — |
|
|
| — |
|
|
| — |
|
|
| 988 |
|
|
| 988 |
|
Net financing charges |
|
| — |
|
|
| — |
|
|
| — |
|
|
| (363,884 | ) |
|
| (363,884 | ) |
Net earnings from associates |
|
| 1,068 |
|
|
| — |
|
|
| — |
|
|
| — |
|
|
| 1,068 |
|
|
|
|
|
|
|
|
|
|
|
|
|
|
|
|
|
|
|
|
|
|
Operating income (loss) |
|
| 505,978 |
|
|
| (51,154 | ) |
|
| (35,080 | ) |
|
| (166,822 | ) |
|
| 252,922 |
|
|
|
|
|
|
|
|
|
|
|
|
|
|
|
|
|
|
|
|
|
|
Depreciation and amortization |
|
| 144,304 |
|
|
| 108,879 |
|
|
| 29,476 |
|
|
| 147 |
|
|
| 282,806 |
|
Add (deduct) the impact of the following: |
|
|
|
|
|
|
|
|
|
|
|
|
|
|
|
|
|
|
|
|
Acquisition-related costs and deal contingent forwards |
|
| — |
|
|
| — |
|
|
| — |
|
|
| 115,569 |
|
|
| 115,569 |
|
Stock-based compensation1 |
|
| — |
|
|
| — |
|
|
| — |
|
|
| 12,806 |
|
|
| 12,806 |
|
Loss from investments and associates |
|
| 1,667 |
|
|
| — |
|
|
| — |
|
|
| — |
|
|
| 1,667 |
|
Impairment of intangibles assets and assets held for sale |
|
| 5,621 |
|
|
| 602 |
|
|
| — |
|
|
| — |
|
|
| 6,223 |
|
Other costs (income) |
|
| 43,317 |
|
|
| 41,633 |
|
|
| 26,676 |
|
|
| (2,670 | ) |
|
| 108,956 |
|
Total adjusting items |
|
| 50,605 |
|
|
| 42,235 |
|
|
| 26,676 |
|
|
| 125,705 |
|
|
| 245,221 |
|
|
|
|
|
|
|
|
|
|
|
|
|
|
|
|
|
|
|
|
|
|
Adjusted EBITDA |
|
| 700,887 |
|
|
| 99,960 |
|
|
| 21,072 |
|
|
| (40,970 | ) |
|
| 780,949 |
|
31
|
| Quarter Ended December 31, 2017 | ||||||||
In thousands of U.S. Dollars (except per share amounts) |
| International |
| United Kingdom |
| Australia |
| Corporate |
| Consolidated |
Net earnings (loss) |
| 135,153 |
| — |
| — |
| (87,978) |
| 47,175 |
|
|
|
|
|
|
|
|
|
|
|
Income tax recovery |
| — |
| — |
| — |
| (26,352) |
| (26,352) |
Net financing charges |
| — |
| — |
| — |
| (38,739) |
| (38,739) |
|
|
|
|
|
|
|
|
|
|
|
Operating income (loss) |
| 135,153 |
| — |
| — |
| (22,887) |
| 112,266 |
|
|
|
|
|
|
|
|
|
|
|
Depreciation and amortization |
| 38,213 |
| — |
| — |
| 8 |
| 38,221 |
Add (deduct) the impact of the following: |
|
|
|
|
|
|
|
|
|
|
Stock-based compensation1 |
| — |
| — |
| — |
| 2,708 |
| 2,708 |
Gain from investments |
| (20,032) |
| — |
| — |
| — |
| (20,032) |
Impairment of intangibles assets and assets held for sale |
| 1,630 |
| — |
| — |
| — |
| 1,630 |
Other costs |
| 3,176 |
| — |
| — |
| 9,033 |
| 12,209 |
Total adjusting items |
| (15,226) |
| — |
| — |
| 11,741 |
| (3,485) |
|
|
|
|
|
|
|
|
|
|
|
Adjusted EBITDA |
| 158,140 |
| — |
| — |
| (11,138) |
| 147,002 |
|
| Year Ended December 31, 2017 | ||||||||
| International |
| United Kingdom |
| Australia |
| Corporate |
| Consolidated | |
Net earnings (loss) |
| 513,819 |
| — |
| — |
| (254,534) |
| 259,285 |
|
|
|
|
|
|
|
|
|
|
|
Income tax recovery |
| — |
| — |
| — |
| (27,208) |
| (27,208) |
Net financing charges |
| — |
| — |
| — |
| (158,332) |
| (158,332) |
Net loss from associates |
| (2,569) |
| — |
| — |
| — |
| (2,569) |
|
|
|
|
|
|
|
|
|
|
|
Operating income (loss) |
| 516,388 |
| — |
| — |
| (68,994) |
| 447,394 |
|
|
|
|
|
|
|
|
|
|
|
Depreciation and amortization |
| 147,027 |
| — |
| — |
| 159 |
| 147,186 |
Add (deduct) the impact of the following: |
|
|
|
|
|
|
|
|
|
|
Stock-based compensation1 |
| — |
| — |
| — |
| 10,622 |
| 10,622 |
Gain from investments |
| (29,169) |
| — |
| — |
| (4,429) |
| (33,598) |
Impairment of intangibles assets and assets held for sale |
| (4,532) |
| — |
| — |
| (2,267) |
| (6,799) |
Other costs |
| 6,690 |
| — |
| — |
| 28,811 |
| 35,501 |
Total adjusting items |
| (27,011) |
| — |
| — |
| 32,737 |
| 5,726 |
|
|
|
|
|
|
|
|
|
|
|
Adjusted EBITDA |
| 636,404 |
| — |
| — |
| (36,098) |
| 600,306 |
32
Adjusted Net Earnings and Adjusted Diluted Net Earnings per Share
|
| Quarter Ended December 31, |
| Year Ended December 31, | ||||
In thousands of U.S. Dollars (except per share amounts) |
| 2018 |
| 2017 |
| 2018 |
| 2017 |
Net (loss) earnings |
| (38,173) |
| 47,175 |
| (108,906) |
| 259,285 |
Income tax expense (recovery) |
| 14,450 |
| 26,352 |
| (988) |
| 27,208 |
Net (earnings) loss before tax |
| (23,723) |
| 73,527 |
| (109,894) |
| 286,493 |
Add (deduct) the impact of the following: |
|
|
|
|
|
|
|
|
Interest accretion2 |
| 12,367 |
| 12,057 |
| 42,431 |
| 47,764 |
Loss on debt extinguishment |
| 3,453 |
| — |
| 146,950 |
| — |
Re-measurement of contingent consideration2 |
| (9,095) |
| — |
| (342) |
| — |
Re-measurement of embedded derivative2 |
| 17,400 |
| — |
| 6,100 |
| — |
Ineffectiveness on cash flow hedges2 |
| (2,960) |
| — |
| (14,909) |
| — |
Acquisition-related costs and deal contingent forwards |
| 3,084 |
| — |
| 115,569 |
| — |
Amortization of acquisition intangibles2 |
| 86,686 |
| 31,075 |
| 241,651 |
| 124,301 |
Stock-based compensation1 |
| 4,004 |
| 2,708 |
| 12,806 |
| 10,622 |
Loss (gain) from investments and associates |
| 1,297 |
| (20,032) |
| 599 |
| (31,029) |
Impairment (reversal of impairment) of intangibles assets and assets held for sale |
| 1,280 |
| 1,630 |
| 6,223 |
| (6,799) |
Other costs |
| 62,624 |
| 12,209 |
| 108,956 |
| 35,502 |
Adjust for income tax expense |
| (11,754) |
| (1,223) |
| (22,192) |
| (7,914) |
Adjusted Net Earnings |
| 144,663 |
| 111,951 |
| 533,948 |
| 458,940 |
Adjusted Net Earnings attributable to |
|
|
|
|
|
|
|
|
Shareholders of The Stars Group Inc. |
| 141,738 |
| 111,951 |
| 531,168 |
| 458,940 |
Non-controlling interest |
| 2,925 |
| — |
| 2,780 |
| — |
|
|
|
|
|
|
|
|
|
Adjusted Net Earnings |
| 144,663 |
| 111,951 |
| 533,948 |
| 458,940 |
|
|
|
|
|
|
|
|
|
Diluted Shares |
| 273,294,532 |
| 206,807,485 |
| 242,768,766 |
| 203,707,589 |
Adjusted Diluted Net Earnings per Share |
| 0.52 |
| 0.54 |
| 2.19 |
| 2.25 |
The table below presents certain items comprising “Other costs (income)” in the Adjusted EBITDA, Adjusted Net Earnings and Adjusted Diluted Net Earnings per Share reconciliation tables above:
|
| Quarter Ended December 31, |
| Year Ended December 31, | ||||
| 2018 |
| 2017 |
| 2018 |
| 2017 | |
In thousands of U.S. Dollars |
| $000's |
| $000's |
| $000's |
| $000's |
Integration costs |
| 17,042 |
| — |
| 45,597 |
| — |
Financial expenses |
| 10,547 |
| 719 |
| 7,648 |
| 3,781 |
Restructuring expenses3 |
| 2,283 |
| 1,676 |
| 8,827 |
| 5,842 |
AMF and other investigation professional fees4 |
| 2,902 |
| 2,544 |
| 6,673 |
| 6,432 |
Lobbying (US and Non-US) and other legal expenses5 |
| 6,276 |
| 4,862 |
| 16,194 |
| 17,095 |
Professional fees in connection with non-core activities6 |
| 2,602 |
| 912 |
| 4,578 |
| 3,080 |
Retention bonuses |
| — |
| 117 |
| 259 |
| 1,388 |
Loss on disposal of assets |
| — |
| — |
| 41 |
| 599 |
Refund of Austria gaming duty |
| — |
| — |
| (3,679) |
| (5,000) |
Termination of affiliate agreements |
| — |
| — |
| — |
| 407 |
Acquisition of option rights for market access7 |
| 20,661 |
| — |
| 20,661 |
| — |
Other |
| 311 |
| 1,379 |
| 2,157 |
| 1,877 |
Other costs |
| 62,624 |
| 12,209 |
| 108,956 |
| 35,501 |
33
| Quarter Ended December 31, |
| Year Ended December 31, | ||||
In thousands of U.S. Dollars | 2018 |
| 2017 |
| 2018 |
| 2017 |
Net cash inflows from operating activities | 190,537 |
| 123,757 |
| 559,844 |
| 494,600 |
Customer deposit liability movement | 4,712 |
| 8,526 |
| (7,637) |
| 30,924 |
| 195,249 |
| 132,283 |
| 552,207 |
| 525,524 |
Capital Expenditure: |
|
|
|
|
|
|
|
Additions to deferred development costs | (18,888) |
| (6,511) |
| (51,574) |
| (23,212) |
Additions to property and equipment | (15,161) |
| (5,490) |
| (33,952) |
| (10,997) |
Additions to intangible assets | (11,934) |
| (409) |
| (28,202) |
| (1,893) |
Interest paid | (57,771) |
| (29,007) |
| (186,162) |
| (124,627) |
Debt servicing cash flows (excluding voluntary prepayments) | (8,937) |
| (6,012) |
| (29,367) |
| (24,913) |
Free Cash Flow | 82,558 |
| 84,854 |
| 222,950 |
| 339,882 |
United Kingdom Segment QNY
The table below presents proforma revenue for the United Kingdom segment for the quarter ended September 30, 2018, which includes revenue earned by SBG prior to the SBG Acquisition from July 1, 2018 through July 9, 2018, for use in the calculation of the numerator of QNY for the United Kingdom segment for the applicable period:
In thousands of U.S. Dollars |
| $ |
| |
Revenue as reported for the quarter ended September 30, 2018 |
|
|
|
|
Poker |
|
| 2,884 |
|
Gaming |
|
| 73,318 |
|
Betting |
|
| 85,189 |
|
Total |
|
| 161,391 |
|
Add: pre-acquisition revenue |
|
| 28,018 |
|
Revenue as adjusted for QNY |
|
| 189,409 |
|
1 Stock-based compensation expense is excluded from Adjusted EBITDA primarily due to its discretionary nature.
2 Interest accretion, re-measurement of contingent consideration and the Embedded Derivative, ineffectiveness on cash flow hedges, and amortization of intangible assets resulting from purchase price allocations following acquisitions are excluded from Adjusted Net Earnings as these are accounting adjustments that are not representative of underlying cash operating activities or expenses of the Corporation.
3 Restructuring expenses relate to certain restructuring programs implemented following prior acquisitions, and certain of the Corporation’s strategic cost savings initiatives (i.e., referred to by the Corporation as “operational excellence” or “operational efficiency” programs), all of which management does not consider to be part of core, ongoing operating activities or expenses. “Termination of employment agreements” presented in prior periods is now included in restructuring expenses.
4 AMF and other investigation professional fees relate to those matters described in the 2018 Annual Information Form under the heading “Legal Proceedings and Regulatory Actions”.
5 The Corporation excludes certain lobbying and legal expenses in jurisdictions where it is actively seeking licensure or similar approval because management believes that the Corporation’s incremental cost of these lobbying and legal expenses in such jurisdictions is generally higher than its peers given liabilities and related issues primarily stemming from periods prior to the acquisition of the Stars Interactive Group or from matters not directly involving the Corporation or its current business.
6 Professional fees in connection with non-core activities are excluded from Adjusted EBITDA as these expenses are not representative of the underlying operations including professional fees related to litigation matters, and incremental accounting and audit fees incurred in connection with the integration of the Acquisitions, including as it relates to internal controls.
7 The Corporation also excludes direct costs incurred in respect of market access agreements that are not eligible to be capitalized. See above and note 24 in the 2018 Annual Financial Statements for additional information regarding the market access arrangement with Eldorado.
34
The following financial data for each of the eight most recently completed quarters has been prepared in accordance with IFRS. The presentation currency for each period presented below was and remains the U.S. dollar.
| For the quarter ended |
| ||||||||||||||||||||||
| Mar. 31, |
| Jun. 30, |
| Sept. 30, |
| Dec. 31, |
| Mar. 31, |
| Jun. 30, |
| Sept. 30, |
| Dec. 31, |
| ||||||||
In thousands of U.S. Dollars (except per share amounts) | 2017 |
| 2017 |
| 2017 |
| 2017 |
| 2018 |
| 2018 |
| 2018 |
| 2018 |
| ||||||||
Revenue |
| 317,317 |
|
| 305,305 |
|
| 329,443 |
|
| 360,250 |
|
| 392,891 |
|
| 411,512 |
|
| 571,983 |
|
| 652,852 |
|
Gross Profit |
| 254,857 |
|
| 252,637 |
|
| 266,966 |
|
| 290,358 |
|
| 312,627 |
|
| 327,875 |
|
| 442,757 |
|
| 486,815 |
|
Operating Income |
| 110,886 |
|
| 105,517 |
|
| 118,725 |
|
| 112,266 |
|
| 113,866 |
|
| 1,064 |
|
| 70,901 |
|
| 67,091 |
|
Net Earnings (Loss) |
| 65,753 |
|
| 70,483 |
|
| 75,874 |
|
| 47,175 |
|
| 74,361 |
|
| (154,824 | ) |
| 9,730 |
|
| (38,173 | ) |
Basic Net Earnings (Loss) per Common Share | $ 0.45 |
| $ 0.48 |
| $ 0.52 |
| $ 0.32 |
| $ 0.51 |
| $(1.01) |
| $ 0.06 |
| $ | (0.14 | ) | |||||||
Diluted Net Earnings (Loss) per Common Share | $ 0.33 |
| $ 0.35 |
| $ 0.37 |
| $ 0.23 |
| $ 0.36 |
| $(1.01) |
| $ 0.06 |
| $ | (0.14 | ) | |||||||
The year-over-year consolidated revenue increases in each quarter of 2018 as compared to the applicable prior year periods were primarily attributable to Gaming and Betting revenue in what is now the International segment resulting from the continued rollout of casino and sports betting product offerings and the expansion of the geographical reach of such product offerings into eligible markets, in addition to the positive impact on poker revenue from the introduction of the Stars Rewards program. Quarterly consolidated revenue in 2018 was also positively impacted by the Acquisitions.
For a discussion of results, trends and variances, including the impact of foreign currency fluctuations, over the quarter and year ended December 31, 2018 and 2017, see “Consolidated Results of Operations and Cash Flows”, “Segment Results of Operations” and “Liquidity and Capital Resources” contained in this MD&A.
The Corporation’s consolidated and segmental results of operations can fluctuate due to seasonal trends and other factors. The Corporation believes that the climate and weather in geographies where its customers reside tend to impact, among other things, revenue from operations, key metrics and customer activity, and as such, historically those have been generally higher in the first and fourth quarters than in the second and third quarters. The Betting operations (and thus the financial performance) of the Corporation are also subject to the seasonal variations dictated by various sports calendars. A significant portion of the Corporation’s Betting revenue is and will continue to be generated from bets placed on European football, which has an off-season in the summer that can cause a corresponding temporary decrease in its Betting revenue, and betting on horse racing, the Australian Football League and the National Rugby League comprises a large portion of Betting revenue in the Australia segment. The Corporation’s revenue may also be affected by the scheduling of major sporting events that do not occur annually, such as the World Cup and the UEFA European Championships. In addition, certain individuals or teams advancing or failing to advance and their scores and other results within specific tournaments, games or events may have adverse consequences on the Corporation’s financial performance. Also, the cancellation of sporting events and races could negatively impact Stakes and revenue.
With respect to online Betting, revenue generally fluctuates in line with Betting Net Win Margin. However, the impact on revenue may be mitigated by the impact of Betting Net Win Margin on Stakes, which can fluctuate inversely with such margins. As a result, prolonged periods of high Betting Net Win Margin can negatively impact customer experience, enjoyment and engagement levels, thus resulting in lower customer betting and/or gaming activity levels. Conversely, while periods of low Betting Net Win Margin tend to negatively impact revenue, this may be partially mitigated by increased customer wagering volume (generally referred to as recycling of winnings) due to the positive impact of customer-favorable results on customer experience, enjoyment and engagement. Further, changes to the Corporation’s use of various offsets to revenue including free bets, bonuses and promotions, and/or loyalty program rewards impact reported revenue, which could also cause fluctuations. As such, results for any quarter are not necessarily indicative of the results that may be achieved in another quarter or for the full fiscal year. There can be no assurance that the seasonal trends and other factors that have impacted the Corporation’s historical results will repeat in future periods as the Corporation cannot influence or forecast many of these factors. For other factors that may cause its results to fluctuate, including market risks, such as foreign exchange risks, see “Overview and Outlook” above, “Risk Factors and Uncertainties” above, and the 2018 Annual Information Form, including under the headings
35
“Risk Factors and Uncertainties” and “Business of the Corporation—Seasonality and Other Factors Impacting the Business” therein.
SUMMARY OF SIGNIFICANT ACCOUNTING POLICIES
For a description of the Corporation’s significant accounting policies, critical accounting estimates and judgments, and related information, see notes 2 and 3 to the 2018 Annual Financial Statements. Other than as set forth below, there have been no changes to the Corporation’s significant accounting policies or critical accounting estimates or judgments during the quarter and year ended December 31, 2018.
Key Sources of Estimation Uncertainty
Determining the carrying amounts of some assets and liabilities requires estimation of the effects of uncertain future events on those assets and liabilities at the end of the reporting period. The following discussion sets forth key sources of estimation uncertainty at the end of the reporting period, that management believes have a significant risk of resulting in a material adjustment to the carrying amounts of assets and liabilities within the next financial year.
Goodwill impairment
At least annually, the Corporation tests whether goodwill is subject to any impairment in accordance with the applicable accounting policy set forth in note 2 to the 2018 Annual Financial Statements.
The Corporation applied judgment in the allocation of goodwill to the identified cash-generating units (“CGUs”). Prior to the SBG Acquisition, the Corporation identified potential synergy benefits that management estimated would be realized in both the International and United Kingdom CGUs and accordingly attributed a portion of the goodwill recognized from the SBG Acquisition to the International CGU for impairment testing purposes. The annual recurring synergy benefit applicable to each CGU was calculated and the net present value of this recurring benefit to each CGU was used to allocate the appropriate proportion of goodwill accordingly.
The recoverable amount for any CGU or group of CGUs is determined based on the higher of fair value less costs to sell and value in use. Both valuation approaches require management to use judgments and estimates. Goodwill impairment exists when the carrying value of a CGU or group of CGUs exceeds its recoverable amount. Estimates used in determining the recoverable amount include but are not limited to expected cash flows, growth rates, capital expenditures and discount rates. A change in future earnings or any other assumptions may have a material impact on the fair value of the CGU or group of CGUs, and could result in an impairment loss. See note 11 to the 2018 Annual Financial Statements.
Valuation of deferred contingent payment on acquisition of non-controlling interest
As part of the incremental acquisition of an 18% equity interest in BetEasy, BetEasy’s management team will be entitled to an additional payment of up to AUD 239 million in 2020, subject to certain performance conditions primarily related to its EBITDA, and payable in cash and/or additional Common Shares at The Stars Group’s discretion. The Corporation considered this additional payment to be a contingent consideration and accounted for it as part of the purchase price related to the acquisition of the 18% equity interest in BetEasy. The deferred contingent payment is subsequently recorded at fair value at each balance sheet date, with re-measurements recorded within net financing charges in the consolidated statements of (loss) earnings. In valuing the deferred contingent payment as at December 31, 2018, the Corporation used a discount rate of 10.5%, considering the term of the deferred contingent payment period and credit risk. The Corporation applied a volatility of historical EBITDA for comparable companies of 25%, which was based on historical performance and market indicators. See notes 5 and 26 of the 2018 Annual Financial Statements.
Uncertain tax positions
Determining the Corporation’s income tax and its provisions for income taxes involves a significant degree of estimation and judgment, particularly in respect of open tax returns relating to prior years where the liabilities remain to be agreed with the local tax authorities. The Corporation is also subject to tax authority audits and has a number of open tax enquiries. As a result, it has recognized a number of provisions against uncertain tax positions that are recognized based on management’s best estimate of the outcome after taking into consideration all available evidence, and where appropriate, after taking external advice. The tax provisions recorded in the Corporation’s consolidated financial statements in respect of prior years relate to intercompany trading and financing arrangements entered into in the normal course of business and tax audits that are currently in progress with fiscal authorities. Due to the uncertainty associated with such tax items it is possible that at a future date, on resolution of the open tax matters, the
36
final outcome may vary significantly and there is the potential for a material adjustment to the carrying amounts of the liability recorded as a result of this estimation uncertainty.
Critical Accounting Estimates and Judgments
The preparation of the Corporation’s 2018 Annual Financial Statements requires management to make estimates and assumptions concerning the future. It also requires management to exercise its judgment in applying the Corporation’s accounting policies. Estimates and judgments are continually evaluated and are based on historical experience, general economic conditions and trends and other factors, including expectations of future events that are believed to be reasonable under the circumstances.
Estimates and their underlying assumptions are reviewed on a regular basis and the effects of any changes are recognized immediately. Changes in the status of certain facts or circumstances could result in material changes to the estimates used in the preparation of the consolidated financial statements and actual results could differ from the Corporation’s estimates.
The following discussion sets forth management’s most significant estimates and assumptions in determining the value of assets and liabilities and the most significant judgments in applying accounting policies.
Determination of purchase price allocations and deferred contingent payments
Management makes certain judgments and estimates in the recognition and measurement of assets and liabilities, including separately identifiable intangibles acquired as part of a business combination. Further, management also makes judgments and estimates in determining the value of deferred contingent payments that should be recorded as part of the consideration on the date of acquisition and changes in deferred contingent payments payable in subsequent reporting periods. The deferred contingent payment relating to the incremental acquisition of an 18% equity interest in BetEasy is discussed in notes 2 and 26 to the 2018 Annual Financial Statements.
Business combinations may result in the recognition of certain intangible assets, recognized at fair value, including but not limited to, software technology, customer relationships, below market significant contracts, and brands. Judgment is applied in the identification of “identifiable” intangible assets which requires that an asset must be separable or must arise from contractual or other legal rights to distinguish it from goodwill. Specifically, customer relationships recognized in respect of the SBG Acquisition and the Australian Acquisitions are primarily in respect of non-contractual relationships from which the acquired companies have a practice and history of establishing contracts (i.e., customers that have previously engaged in online gaming transactions and are expected to engage in future online gaming transactions).
Key estimates made by management in connection with the measurement of acquired intangible assets relating to the SBG Acquisition and the Australian Acquisitions, included:
| (i) | Discount rates – The Corporation used discount rates ranging from 7% to 10%. |
| (ii) | Attrition rates – The Corporation valued certain intangibles using estimated attrition rates ranging from 3% to 10%. |
| (iii) | Technology migration – The Corporation valued technology intangibles using estimated useful lives of 5 to 7 years based on the planned migration towards newer developed technology. |
| (iv) | Technology royalty rate – The Corporation valued certain technology intangibles using royalty rates ranging from 5% to 10%. |
| (v) | Brand royalty rate – The Corporation valued brands using royalty rates ranging from 2.5% to 5%. |
| (vi) | Estimating future cash flows – The Corporation considered historical performance and industry assessments among other sources in the estimation of the cash flows. Significant estimation uncertainty exists with respect to forecasting and growth assumptions used in the valuation of intangibles. |
Acquisition of BetEasy – control assessment
The Corporation acquired a 62% equity interest in BetEasy on February 27, 2018, and a further 18% equity interest on April 24, 2018. As is typical, the shareholders agreement entered into with the minority shareholders of BetEasy in connection with these transactions includes a number of rights and protections for the minority shareholders in certain circumstances that are directly harmful to the minority, including as it relates to significant changes to business scope, material acquisitions or financing. In the Corporation’s judgment, such minority shareholder rights are protective rights and the Corporation has control in accordance with IFRS 3, Business Combinations.
Useful lives of long-lived assets
Estimates are used for each component of an asset’s useful life and is based on an analysis of all pertinent factors including, but not limited to, the expected use of the asset and, in the case of intangible assets, where applicable, contractual provisions that enable the renewal or extension of the asset’s legal or contractual life without substantial
37
cost, as well as renewal history or the expected period of future benefit of the intangible asset. Incorrect estimates of useful lives could result in an increase or decrease in the annual amortization expense and future impairment charges.
As noted above, the Corporation acquired significant intangible assets in connection with the SBG Acquisition and the Australian Acquisition. Management used estimates in determining the useful lives for these acquired intangible assets using information regarding, among other things, details of the contractual terms, historical customer activity and attrition, forecasted cash flow information, and market conditions and trends.
Debt extinguishment
The Corporation applied judgment in determining whether transactions related to its long-term debt during the period should be classified as an extinguishment or modification of such debt. The Corporation considers long-term debt that is pre-payable with no significant termination costs as being extinguished when contractual amendments are made. As discussed in note 17, on April 6, 2018, the Corporation amended its long-term debt in connection with the Australian Acquisitions and recorded the amendment as an extinguishment for accounting purposes as the debt was repayable at par, and no termination costs were incurred. On July 10, 2018, the Corporation’s previous first lien term loans were repaid in full and the transaction was recorded as an extinguishment for accounting purposes. No termination costs were incurred upon repayment.
Recognition and valuation of embedded derivatives
The Senior Notes include certain embedded features allowing the Corporation to redeem the Senior Notes or allowing the holders to require a redemption of the Senior Notes. Management applied its judgment in determining whether the features represent embedded derivatives required to be bifurcated from the carrying value of the Senior Notes, including in relation to the assessment of whether the features are closely related to the host contract (i.e., the Indenture governing the Senior Notes). Certain features were bifurcated from the carrying value of the Senior Notes. Management used estimates, including an implied credit spread of 3.8% as at December 31, 2018, in determining the fair value of the embedded derivatives. See notes 17, 19 and 26 to the 2018 Annual Financial Statements.
Functional currency
The Corporation’s worldwide operations expose the Corporation to transactions denominated in a number of different currencies, which are required to be translated into one currency for consolidated financial statement reporting purposes. The Corporation’s foreign currency translation policy is designed to reflect the economic exposure of the Corporation’s operations to various currencies. The functional currencies of the Corporation’s subsidiaries are assessed on a regular basis as the operations of the Corporation evolve or as result of business combinations or expansions. The functional currency of an operation or subsidiary is the currency of the primary economic environment to which it is exposed.
Following the SBG Acquisition and the Australian Acquisitions, management applied judgment in determining the functional currencies of the acquired subsidiaries and considered the impact of the acquisitions on the primary economic environment of the acquiring subsidiaries. To determine the functional currencies, management considered the currency that influences sales prices of the goods and services provided by the operations and the currency that influences the costs incurred by the operations. Where as a result of these primary factors, the functional currency was not obvious, management examined secondary factors such as the currency in which funds from financing are obtained, the currency in which cash receipts are retained and the levels of interactions with the parent company.
Contingent liabilities
The Corporation reviews outstanding legal cases following developments in legal proceedings at each balance sheet date, considering, among other things: the nature of the litigation, claim or assessment; the legal processes and potential level of damages in the jurisdiction in which the litigation, claim or assessment has been brought; the progress of the case (including progress after the date of the consolidated financial statements but before those statements are issued); the opinions or views of legal counsel and other advisors; experience of similar cases; and any decision of the Corporation’s management as to how it will respond to the litigation, claim or assessment. The Corporation assesses the probability of an outflow of resources to settle the obligation as well as if the outflow can be reliably measured. If these conditions are not met, no provision will be recorded and the relevant facts will be disclosed as a contingent liability. To the extent that the Corporation’s assessments at any time do not reflect subsequent developments or the eventual outcome of any claim, its future consolidated financial statements may be materially affected, with a favourable or adverse impact on the Corporation’s business, financial condition or results of operations. See note 28 to the 2018 Annual Financial Statements.
38
RECENT ACCOUNTING PRONOUNCEMENTS
New Significant Accounting Policies Adopted
Revenue Recognition
The Corporation applied IFRS 15, Revenue from Contracts with Customers (“IFRS 15”) from January 1, 2018. As permitted, the Corporation applied IFRS 15 using the modified retrospective approach, whereby the cumulative impact of adoption is recognized in opening retained earnings. Comparative information for 2017 has not been restated. See note 4 in the 2018 Annual Financial Statements. The adoption of IFRS 15 did not have a material impact on the timing and amount of revenue recognized by the Corporation and the Corporation did not apply the available optional practical expedients.
Revenue from contracts with customers is recognized when control of the Corporation’s services is transferred to the customer at an amount that reflects the consideration to which the Corporation expects to be entitled in exchange for those services. The Corporation has concluded that it is the principal in its revenue arrangements because it controls the services before transferring them to the customer.
The Corporation evaluates all contractual arrangements it enters into and evaluates the nature of the promised goods or services, and rights and obligations under the arrangement, in determining the nature of its performance obligations. Where such performance obligations are capable of being distinct and are distinct in the context of the contract, the consideration the Corporation expects to be entitled under the arrangement is allocated to each performance obligation based on its relative estimated stand-alone selling prices. Performance obligations that the Corporation concludes are not distinct are combined together into a single combined performance obligation. Revenue is recognized at an amount equal to the transaction price allocated to the specific performance obligation when it is satisfied, either at a point in time or over time as applicable based on the pattern of transfer of control.
The Corporation’s principal arrangements include the following sources of revenue:
Revenue from customers within the scope of IFRS 15
Poker revenue
Poker revenue represents primarily the commission charged at the conclusion of each poker hand in cash games (i.e., rake) and entry fees for participation in poker tournaments, and is net of certain promotional expenses, which are treated as a reduction to the transaction price. In poker tournaments, entry fee revenue is recognized when the tournament has concluded.
Gaming revenue
Gaming revenue primarily represents the difference between the amounts of bets placed by customers less amounts won (i.e., net house win) and is presented net of certain promotional expenses which are treated as a reduction to the transaction price. Gaming transactions are instantaneously settled and revenue is recognized at a point in time.
Poker and Gaming each consist of a single revenue performance obligation, notwithstanding the impact of customer loyalty programs as noted below. Revenue is recognized at a point in time upon completion of the performance obligation as noted above. Poker and Gaming are each presented as revenue gross of applicable gaming duties, which are presented within cost of revenue.
Conversion margins
Revenue from conversion margins is the revenue earned on the processing of real-money deposits and cash outs in specified currencies. Revenue from customer cross currency deposits and withdrawals is recognized when the transaction is complete at a point in time. Revenue is recognized with reference to the underlying arrangement and agreement with the players and represents a single performance obligation and is recorded within the applicable line of operations.
Other revenue from customers
Play-money gaming revenue
Customers can participate in online poker tournaments and social casino games using play-money, or virtual currency. Customers can purchase additional play-money chips online to participate in the poker tournaments and social casino games. The revenue is recognized at a point in time when the customer has purchased such chips as control has been
39
transferred to the customer and no further performance obligations exist. Once a customer has purchased such chips they are non-refundable and non-cancellable.
Other
The Corporation sponsors certain live poker tours and events, uses its industry expertise to provide consultancy and support services to the casinos that operate the events, and has marketing arrangements for branded poker rooms at various locations around the world. The Corporation also provides customers with access to odds comparisons, tips and other information to assist with betting, and provides other media and advertising services, and limited content development services with revenue generated by way of affiliate commissions, revenue share arrangements and advertising income as applicable. Revenue is recognized upon satisfying the applicable performance obligations, generally at a point in time.
Revenue from customers out of the scope of IFRS 15
Betting revenue
The Corporation’s income generated from Betting product offerings does not fall within the scope of IFRS 15. Income generated from these online transactions is disclosed as revenue although these transactions are accounted as derivative instruments in accordance with IFRS 9 (as defined below) where the income meets the definition of gains or losses, as applicable.
Betting revenue primarily represents the difference between the amounts of bets placed by customers less amounts won (i.e., net house win). Open betting positions are carried at fair value, and gains and losses arising on these positions are recognized in revenue.
Betting is presented as revenue gross of applicable gaming duties, which are presented within cost of revenue.
Customer loyalty programs
The Corporation operates loyalty programs for its customers within each of its reporting segments that reward customers based on a number of factors, including volume of play, player impact on the overall ecosystem, whether the player is a net withdrawing or net depositing player, and product and game selection. For customer loyalty programs operated by the Corporation, applicable revenue received for which loyalty rights earned by its customers are recorded as a contract liability based on the rewards’ allocated amount and are subsequently recognized as revenue in a future period when the rewards are redeemed. Customer loyalty rewards are included in accounts payable and other liabilities on the consolidated statements of financial position.
The estimated selling price of loyalty rewards is determined using an equivalent cash cost approach, which uses historical data of award redemption patterns considering the alternative goods or services for which the rewards can be redeemed. The estimated selling price of rewards is adjusted for an estimate of rewards that will not be redeemed based on historical redemption patterns. Historically, non-redeemed loyalty rewards have not been significant.
Other sources of revenue
Income from player funds
A portion of customer deposits is held as current investments. Income generated from current investments and dormant accounts does not fall within the scope of IFRS 15. Income generated from investments is disclosed as revenue despite being accounted for in accordance with IFRS 9 where it meets the definition of gains or losses, as applicable.
Income (loss) from dormant accounts
When a customer deposit account becomes dormant in accordance with the Corporation’s terms and conditions, the deposit is removed from customer liabilities and recorded within accounts payable and other liabilities. Income is generated from dormant accounts that are not expected to be re-activated based on historical information and re-activation rates. Losses are recorded on dormant accounts that are re-activated. Income (loss) generated from dormant accounts is disclosed as revenue despite being accounted for in accordance with IFRS 9 where it meets the definition of gains or losses, as applicable.
Financial Instruments
The Corporation applied IFRS 9, Financial Instruments (“IFRS 9”) retrospectively from January 1, 2018. In accordance with the practical expedients permitted under the standard, comparative information for 2017 has not been restated. As permitted by IFRS 9, the Corporation elected to continue to apply the hedge accounting requirements of
40
IAS 39, Financial Instruments rather than the new requirements of IFRS 9 and will comply with the revised annual hedge accounting disclosures as required by the related amendments to IFRS 7, Financial Instruments: Disclosures.
For further information regarding the impact of the adoption of IFRS 9, see note 4 in the 2018 Annual Financial Statements.
Financial Assets
Recognition and measurement
At initial recognition, the Corporation measures a financial asset at its fair value plus, in the case of a financial asset not measured at FVTPL (as defined below), transaction costs that are directly attributable to the acquisition of the financial asset. From January 1, 2018, the Corporation classifies financial assets into one of the following measurement categories:
Those to be measured subsequently at fair value through profit or loss (“FVTPL”);
Those to be measured subsequently through other comprehensive income (“FVOCI”); or
Those to be measured at amortized cost.
The classification depends on the Corporation’s business model for managing the financial assets and the contractual terms of the cash flows. Except in very limited circumstances, the classification may not be changed subsequent to initial recognition. The Corporation only reclassifies debt instruments when its business model for managing those assets changes.
Debt instruments
Subsequent measurement of debt instruments depends on the Corporation’s business model for managing the asset and the cash flow characteristics of that asset. There are three measurement categories into which the Corporation classifies its debt instruments:
Amortized cost: debt instruments are measured at amortized cost if they are held within a business model with the objective of collecting the contractual cash flows and those cash flows solely represent payments of principal and interest. A gain or loss on a debt instrument that is subsequently measured at amortized cost and is not part of a hedging relationship is recognized in profit or loss when the debt instrument is derecognized or impaired. Interest income from these debt instruments is recognized using the effective interest rate method. Cash, restricted cash and accounts receivable are classified as amortized cost.
FVOCI: debt instruments are measured at FVOCI if they are held within a business model with the objective of either collecting the contractual cash flows or of selling the debt instrument, and those cash flows solely represent payments of principal and interest. Movements in the carrying amount are recorded in other comprehensive income, with impairment gains or losses, interest income and foreign exchange gains or losses recognized in profit or loss. When the debt instrument is derecognized, the cumulative gain or loss previously recognized in other comprehensive income is reclassified to profit or loss. Bonds recorded within current investments are classified as FVOCI.
FVTPL: debt instruments that are not solely payments of principal and interest are classified and measured at FVTPL, irrespective of the business model. Notwithstanding the criteria for debt instruments to be classified at amortized cost or at FVOCI, as described above, debt instruments may be designated at FVTPL on initial recognition if doing so eliminates, or significantly reduces, an accounting mismatch. A gain or loss on a debt instrument that is subsequently measured at FVTPL and is not part of a hedging relationship is recognized in profit or loss and presented in the consolidated statements of (loss) earnings. Funds recorded within current investments are classified as FVTPL.
Equity instruments
The Corporation subsequently measures all equity instruments at fair value, except for equity instruments for which equity method accounting is applied. The classification of equity instruments depends on whether the Corporation has made an irrevocable election at the time of initial recognition to account for the equity instruments at FVOCI. There are two measurement categories into which the Corporation classifies its equity instruments:
FVOCI: equity instruments are classified as FVOCI on an instrument-by-instrument basis when the conditions are met based on the nature of the instrument. Where the Corporation’s management makes an irrevocable election to present fair value gains and losses on equity instruments in other comprehensive income, there is no subsequent reclassification of fair value gains and losses to profit or loss upon the derecognition of those instruments. Dividends
41
from such instruments continue to be recognized in profit or loss when the Corporation’s right to receive payment is established. The Corporation does not currently hold any equity instruments classified as FVOCI.
FVTPL: equity instruments are classified as FVTPL if they are held for trading (they are acquired for the purpose of selling or repurchasing in the near term) or equity investments which the Corporation had not irrevocably elected to classify at FVOCI. Changes in the fair value of financial assets at FVTPL are recognized in the consolidated statement of earnings. Equity in unquoted companies is classified as FVTPL.
Impairment of financial assets
At the end of each reporting period, the Corporation assesses on a forward-looking basis the expected credit losses associated with its debt instruments carried at amortized cost and FVOCI. The impairment methodology applied depends on whether there has been a significant increase in credit risk. The impairment provision recorded in respect of debt instruments carried at amortized cost and FVOCI is determined at 12-months expected credit losses on the basis that the Corporation considers these instruments as low risk.
The Corporation applies the simplified approach permitted by IFRS 9 for trade receivables and other financial assets held at amortized cost, which requires expected lifetime losses to be recognized from initial recognition of the receivables.
The forward-looking element in determining impairment for financial assets is derived from comparison of current and projected macroeconomic indicators covering primary markets in which the Corporation operates.
Financial Liabilities
Recognition and measurement
Financial liabilities are classified, at initial recognition, as either financial liabilities at FVTPL or other financial liabilities.
FVTPL: Financial liabilities are classified as FVTPL if they are held for trading or are designated as FVTPL upon initial recognition if such designation eliminates or significantly reduces a measurement or recognition inconsistency that would otherwise arise or the financial liability is managed and its performance is evaluated on a fair value basis. Any gains or losses arising on re-measurement are recognized in the consolidated statements of (loss) earnings. Derivative instruments as well as the deferred contingent payment and certain other level 3 liabilities (see note 26) are classified as FVTPL.
Other financial liabilities: Financial liabilities, including borrowings, are initially measured at fair value, net of transaction costs. Other financial liabilities are subsequently measured at amortized cost using the effective interest method. The effective interest method calculates the amortized cost of a financial liability and allocates interest expense over the relevant period. The effective interest rate is the rate that exactly discounts estimated future cash payments through the expected life of the financial liability (or a shorter period where appropriate) to the net carrying amount on initial recognition. Long-term debt is classified within other financial liabilities and is measured at amortized cost.
Debt modifications
The Corporation may pursue amendments to its credit agreements based on, among other things, prevailing market conditions. Such amendments, when completed, are considered by the Corporation to be debt modifications. For debt repayable at par with nominal break costs, the Corporation elected to account for such debt modifications as equivalent to repayment at no cost of the original financial instrument and an origination of a new debt at market conditions. Resetting the debt to market conditions with the same lender has the same economic substance as extinguishing the original financial instrument and originating new debt with a third-party lender at market conditions. The transaction is accounted for as an extinguishment of the original debt instrument, which is derecognized and replaced by the amended debt instrument, with any unamortized costs or fees incurred on the original debt instrument recognized as part of the gain or loss on extinguishment.
For all other debt, the accounting treatment of debt modifications depends upon whether the modified terms are substantially different than the previous terms. The terms of an amended debt agreement are considered substantially different when either: (i) the discounted present value of the cash flows under the new terms, discounted using the original effective interest rate, are at least ten percent different from the discounted present value of the remaining cash flows of the original debt or (ii) management determines that other changes to the terms of the amended agreement, such as a change in the environment in which a floating interest rate is determined, are substantially different. If the modification is considered to be substantially different, the transaction is accounted for as an extinguishment of the original debt instrument, which is derecognized and replaced by the amended debt instrument, with any unamortized costs or fees incurred on the original debt instrument recognized as part of the gain or loss on
42
extinguishment. If the modification is not considered to be substantially different, an adjustment to the carrying amount of the original debt instrument is recorded, which is calculated as the difference between the original contractual cash flows and the modified cash flows discounted at the original effective interest rate with the difference recognized in net financing changes on the consolidated statements of (loss) earnings.
Transaction costs
Transaction costs that are directly attributable to the acquisition or issuance of financial assets and financial liabilities (other than financial assets and financial liabilities that are classified as FVTPL) are added to or deducted from, as applicable, the fair value of the financial instrument on initial recognition. These costs are expensed to financial expenses on the consolidated statements of (loss) earnings over the term of the related interest bearing financial asset or financial liability using the effective interest method. When a debt facility is retired by the Corporation, any remaining balance of related debt transaction costs is expensed to financial expenses in the period that the debt facility is retired. Transaction costs related to financial instruments at FVTPL are expensed when incurred.
Derivatives
The Corporation uses derivative instruments for risk management purposes and does not use derivative instruments for speculative trading purposes (except for derivatives with respect to the Corporation’s Betting line of operations, which are transactions within the scope of IFRS 9 but reported as revenue as discussed above). All derivatives are recorded at fair value in the statements of financial position. The accounting for subsequent changes in fair value depends on whether the derivative is designated as a hedging instrument, and if so, the nature of the item being hedged. For derivatives not designated as hedging instruments, the re-measurement of those derivatives each period is recognized in the consolidated statements of (loss) earnings.
Derivatives may be embedded in other financial liabilities and non-financial instruments (i.e., the host instrument). Embedded derivatives are treated as separate derivatives when their economic characteristics and risks are not closely related to those of the host instrument, the terms of the embedded derivative are the same as those of a stand-alone derivative and the combined instrument (i.e., the embedded derivative plus the host instrument) is not held-for-trading or designated at fair value. These embedded derivatives are measured at fair value with subsequent changes recognized in the consolidated statements of (loss) earnings.
A derivative embedded within a hybrid contract containing a financial asset host is not accounted for separately under IFRS 9. The financial asset host together with the embedded derivative is required to be classified in its entirety as a financial asset at FVTPL.
IFRS 16, Leases
In 2016, the IASB issued IFRS 16, Leases (“IFRS 16”) replacing IAS 17, Leases (“IAS 17”) and related interpretations. The standard introduces a single lease accounting model for lessees that requires on-balance sheet recognition and measurement. Lessees are required to recognize right-of-use assets representing the right to use the underlying assets and a lease liability representing the obligation to make lease payments. At the commencement date of a lease, a lessee will measure the present value of in substance fixed future lease payments as right-of-use assets and lease liabilities. Lessees will be required to recognize the interest expense related to recognizing the lease liability and the depreciation expense on the right-of-use asset. IFRS 16 substantially carries forward the lessor accounting requirements from IAS 17.
IFRS 16 became effective for the Corporation on January 1, 2019 for reporting periods after that date. The Corporation intends to adopt the standard by applying the requirements of the standard retrospectively with the cumulative effects of initial application recorded in opening retained earnings as at January 1, 2019 using a modified retrospective approach with no restatement of the comparative period.
The Corporation will make use of the practical expedient available on transition to IFRS 16, that does not require it to reassess whether a past contract is or contains a lease. Accordingly, the definition of a lease in accordance with IAS 17 and related interpretations will continue to apply to the Corporation’s leases entered into or modified before January 1, 2019. The Corporation will also elect to use the exemptions provided by the standard on lease contracts with durations of 12 months or less as of the date of initial application and for leases of underlying assets with low value. Under IFRS 16, right-of-use assets will be tested for impairment in accordance with IAS 36, Impairment of Assets. This will replace the previous requirement to recognize a provision for onerous lease contracts. However, as a transition practical expedient, the Corporation has elected to rely on the assessment of whether leases are onerous by applying IAS 37, Provisions, Contingent Liabilities and Contingent Assets immediately before the date of initial application as an alternative to performing an impairment review.
43
In preparation for the first-time adoption of IFRS 16, the Corporation has also carried out an implementation project which has led management to conclude that that the new definition in IFRS 16 will not change significantly the scope of contracts that meet the definition of a lease for the Corporation.
On initial application of IFRS 16, for all leases for which the Corporation is a lessee, the Corporation expects to recognize a right-of-use asset in the range of $54.0 million to $58.0 million and a corresponding lease liability in the range of $57.0 million to $61.0 million in the consolidated statements of financial position, initially measured at the present value of the future lease payments.
Subsequent to initial application of IFRS 16, there will be a decrease in rent expense and an increase in depreciation and net finance charges. For short-term leases and leases of low-value assets, the Corporation will opt to recognize a lease expense on a straight-line basis as permitted by IFRS 16. For the year ending December 31, 2019, the Corporation currently expects an decrease to net (loss) earnings in the form of a reduction to operating rental expenses of between $14.0 million and $16.0 million and an increase in depreciation expenses of between $12.5 million to $14.5 million, each as reported in general and administrative expenses on the consolidated statements of (loss) earnings as well as an increase to interest accretion expense of between $1.5 million to $2.5 million reported in net financing charges on the consolidated statements of (loss) earnings.
At the date of finalizing the 2018 Annual Financial Statements, management are completing their reviews across certain non-material contracts. Some of these contracts may be identified as leases under IFRS 16 and if so, the right of use asset and lease liability may increase accordingly. As the Corporation has no finance leases, there will be no impact as a result of the adoption of IFRS 16 with respect to the same.
International Financial Reporting Interpretations Committee 23, Uncertainty over Income Tax Treatments (“IFRIC 23”)
In June 2017, the IASB published IFRIC 23, effective for annual periods beginning on or after January 1, 2019. The interpretation requires an entity to assess whether it is probable that a tax authority will accept an uncertain tax treatment used, or proposed to be used, by an entity in its income tax filings and to exercise judgment in determining whether each tax treatment should be considered independently or whether some tax treatments should be considered together. The decision should be based on which approach provides better predictions of the resolution of the uncertainty. An entity also has to consider whether it is probable that the relevant authority will accept each tax treatment, or group of tax treatments, assuming that the taxation authority with the right to examine any amounts reported to it will examine those amounts and will have full knowledge of all relevant information when doing so.
The Corporation intends to adopt the interpretation by applying the requirements retrospectively with the cumulative effects of initial application recorded in opening retained earnings as at January 1, 2019 using a modified retrospective approach with no restatement of the comparative period. The Corporation believes that the adoption of the interpretation will not have a material impact to the consolidated financial statements of the Corporation.
OFF BALANCE SHEET ARRANGEMENTS AND RELATED PARTY TRANSACTIONS
Off Balance Sheet Arrangements
As at December 31, 2018, the Corporation had no off-balance sheet arrangements that have or are reasonably likely to have a current or future effect on the Corporation’s financial condition, changes in financial condition, revenue or expenses, results of operations, liquidity, capital expenditures or capital resources that are material to investors.
Related Party Transactions
The Corporation’s key management have authority and responsibility for overseeing, planning, directing and controlling its activities and consist of the members of the Board, the Chief Executive Officer, Chief Financial Officer, Chief Operating Officer, Chief Corporate Development Officer, Executive Vice-President and Chief Legal Officer, Chief Technology Officer, and certain other senior members of management. Total compensation expense for such key management was $17.9 million in 2018, as compared to $9.0 million in 2017. The increase in compensation expense for such key management was primarily the result of the addition of members of key management and other senior members of management during the second half of 2017, as well as increased stock-based compensation following the implementation of a long-term incentive plan. For additional information, see note 30 of the 2018 Annual Financial Statements and The Corporation’s most recent management information circular for its annual meeting of shareholders.
44
|
| As at March 5, 2019 |
| 273,190,669 | |
Common Shares issuable upon exercise of options |
| 4,609,105 |
Common Shares issuable upon settlement of other equity-based awards |
| 1,379,587 |
Total Common Shares on a fully-diluted basis |
| 279,179,361 |
45
LEGAL PROCEEDINGS AND REGULATORY ACTIONS
For information regarding the Corporation’s material legal proceedings and regulatory actions, and material changes or updates thereto, see the 2018 Annual Information Form, particularly under the heading “Legal Proceedings and Regulatory Actions” and note 28 to the 2018 Annual Financial Statements.
DISCLOSURE CONTROLS AND PROCEDURES AND
INTERNAL CONTROL OVER FINANCIAL REPORTING
The applicable rules of the U.S. Securities and Exchange Commission and the Canadian Securities Administrators require The Stars Group’s certifying officers, the Chief Executive Officer (“CEO”) and the Chief Financial Officer (“CFO”), to establish and maintain disclosure controls and procedures (“DC&P”) and internal control over financial reporting (“ICFR”), as those terms are defined in such rules. In compliance with these rules, the Corporation has filed applicable certifications signed by the CEO and the CFO that, among other things, report on the design of each of DC&P and ICFR.
Disclosure Controls and Procedures
The CEO and CFO have designed DC&P, or have caused them to be designed under their supervision, to provide reasonable assurance that:
| • | material information relating to the Corporation is made known to them by others, particularly during the period in which the annual and interim filings are being prepared; and |
| • | information required to be disclosed in the annual filings, interim filings or other reports filed or submitted under securities legislation is recorded, processed, summarized and reported within the time periods specified in applicable securities legislation. |
The CEO and CFO have evaluated, or caused to be evaluated under their supervision, the effectiveness of the Corporation’s DC&P at the financial year end December 31, 2018. Based on that evaluation, the CEO and CFO concluded that, because of material weaknesses in the Corporation’s ICFR discussed below, the Corporation’s DC&P were not effective as of December 31, 2018. Notwithstanding these material weaknesses, the Corporation’s management, including the CEO and CFO, have concluded that the 2018 Annual Financial Statements present fairly, in all material respects, the Corporation’s financial position, results of operations and cash flows for the periods presented in conformity with IFRS.
Management’s Annual Report on Internal Control Over Financial Reporting
The CEO and CFO have designed ICFR, or have caused it to be designed under their supervision, to provide reasonable assurance regarding the reliability of financial reporting and the preparation of financial statements for external purposes in accordance with the Corporation’s accounting and reporting standards.
For the quarter and year ended December 31, 2018, the Corporation excluded from its assessment the internal control over financial reporting at BetEasy (including TSGA) and SBG, which were acquired on February 27, 2018 and July 10, 2018, respectively. In respect of BetEasy (including TSGA), its financial statements constitute (1.0)% and 4.5% of net and total assets, respectively, 11.1% and 9.7% of revenue, respectively and (45.8)% and 18.1% of net loss respectively, of the consolidated financial statement amounts as of and for the quarter and year ended December 31, 2018. In respect of SBG, its financial statements constitute 113.5% and 48.2% of net and total assets, respectively, 34.6% and 19.4% of revenue, respectively and 272.4% and 111.9% of net loss respectively, of the consolidated financial statement amounts as of and for the quarter and year ended December 31, 2018.
The CEO and CFO have evaluated, or caused to be evaluated under their supervision, the effectiveness of the Corporation’s ICFR at the financial year end December 31, 2018, based on the criteria set forth in Internal Control – Integrated Framework issued by the Committee of Sponsoring Organizations of the Treadway Commission (2013 framework). Based on that evaluation, the CEO and CFO concluded that the Corporation’s ICFR was not effective as of December 31, 2018, due to the fact that there were material weaknesses in the same. A material weakness is a deficiency, or a combination of deficiencies, in ICFR, such that there is a reasonable possibility that a material misstatement of the Corporation’s annual or interim financial statements or report will not be prevented or detected
46
on a timely basis. Management identified the following internal control deficiencies that constitute material weaknesses in the Corporation’s ICFR as of December 31, 2018:
Translation of Intercompany Loans
During the fourth quarter of 2018, management identified a deficiency related to the foreign currency translation of intercompany loans, which were not being translated each reporting period, which resulted in foreign exchange losses not being properly reflected in the Corporation’s financial statements. Management has concluded that as of December 31, 2018, there was a material weakness in the controls over the foreign currency translation of intercompany loans.
Certain remedial measures were undertaken in the fourth quarter of 2018 that resulted in an effective control design over the Corporation’s translation of intercompany loans, however management was unable to conclude that these controls were operationally effective in the assessment for the year ended December 31, 2018 due to the continued testing of such controls that is currently underway. Management made an adjustment during the fourth quarter of $5.8 million to foreign exchange loss through the consolidated statements of (loss) earnings and a corresponding adjustment to unrealized foreign currency translation in respect of the translation of intercompany loans. There were no restatements or other adjusting entries required in the 2018 Annual Financial Statements or otherwise as a result of this material weakness.
Embedded Derivatives
During the fourth quarter of 2018, management identified a deficiency related to the timely assessment of inputs and assumptions used in the valuation of embedded derivatives as at September 30, 2018, where a full assessment was not prepared in support of such valuation until after such date. This could have resulted in an incorrect valuation with a corresponding impact to (loss) earnings. Management has concluded that as of December 31, 2018, there was a material weakness in the controls over the valuation of embedded derivatives.
Certain remedial measures were undertaken in the fourth quarter of 2018 that resulted in an effective control design over the Corporation’s timely assessment of inputs and assumptions used in valuation of embedded derivatives, however management was unable to conclude that these controls were operationally effective in the assessment for the year ended December 31, 2018 due to the continued testing of such controls that is currently underway. There were no restatements or other adjusting entries required in the 2018 Annual Financial Statements or otherwise as a result of this material weakness.
The effectiveness of the Corporation’s ICFR has been audited by its independent external auditor, Deloitte, LLP, London, United Kingdom (“Deloitte”), the registered public accounting firm that also audited the 2018 Annual Financial Statements. Deloitte’s attestation report on the Corporation’s ICFR as of December 31, 2018 is included in the 2018 Annual Financial Statements.
Changes to Internal Control Over Financial Reporting
As discussed above and below, in the fourth quarter of 2018, the Corporation took steps to remediate material weaknesses relating to foreign currency translation of intercompany loans and the valuation of embedded derivatives.
In addition, in the Corporation’s management’s discussion and analysis for each of the second and third quarters of 2018, the Corporation disclosed a material weakness that management identified as of the quarter ended June 30, 2018. This weakness related to the design of controls over the Corporation’s accounting for debt and related disclosures, and was primarily a result of deficiencies in control design over a complex model that was previously developed to support the underlying accounting for debt. To remediate this material weakness, the Corporation redesigned its complex model used for validating, updating, maintaining and monitoring its accounting for debt and related balances. The Corporation also enhanced the control design regarding management’s review of the model to improve the effectiveness of the review. Furthermore, during the quarter ended September 30, 2018, the Corporation hired staff with significant experience in the financial reporting of debt and related balances. During the fourth quarter of 2018, the Corporation successfully completed the testing necessary for management to conclude that this material weakness has been remediated.
Other than as described above, there has been no change in the Corporation’s ICFR that occurred during the quarter ended December 31, 2018 that has materially affected, or is reasonably likely to materially affect, the Corporation’s ICFR.
47
Remediation Efforts to Address Identified Material Weakness
The following steps are among the measures that have been implemented or that the Corporation intends to implement after the date of this management’s discussion and analysis to address its material weaknesses as of December 31, 2018:
Translation of Intercompany Loans
The Corporation implemented and strengthened controls over the revaluation of intercompany loans, including conducting a monthly revaluation, a monthly review of such revaluations and adding a control to detect whether the revaluation is performed correctly. Management currently expects that the successful implementation of these measures will allow it to conclude that the Corporation’s ICFR relating to the translation of intercompany loans are effective when assessing their effectiveness as at the end of the first quarter of 2019.
Embedded Derivatives
The Corporation strengthened existing control processes over the assessment of inputs and assumptions used in valuation of embedded derivatives. Management currently expects that the successful implementation of these measures will allow it to conclude that the Corporation’s ICFR relating to the valuation of embedded derivatives are effective when assessing their effectiveness as at the end of the first quarter of 2019.
Management believes the foregoing efforts will effectively remediate the material weaknesses.
Limitations on Effectiveness of DC&P and ICFR
In designing and evaluating DC&P and ICFR, management recognizes that any controls and procedures, no matter how well designed and operated, can provide only reasonable assurance of achieving the desired control objectives. In addition, the design of DC&P and ICFR must reflect the fact that there are resource constraints and that management is required to apply judgment in evaluating the benefits of possible controls and procedures relative to their costs. See also “Risk Factors and Uncertainties—Risks Related to the Business—If The Stars Group’s internal controls are ineffective, its operating results and market confidence in its reported financial information could be adversely affected” in the 2018 Annual Information Form.
48
Additional information relating to The Stars Group and its business, including the 2018 Annual Reports and other filings that The Stars Group has made and may make in the future with applicable securities authorities, may be found on or through SEDAR at www.sedar.com, EDGAR at www.sec.gov or The Stars Group’s website at www.starsgroup.com. Additional information, including directors’ and officers’ remuneration and indebtedness, principal holders of The Stars Group securities and securities authorized for issuance under equity compensation plans, is also contained in the Corporation’s most recent management information circular for the most recent annual meeting of shareholders of the Corporation.
In addition to press releases, securities filings and public conference calls and webcasts, The Stars Group intends to use its investor relations page on its website as a means of disclosing material information to its investors and others and for complying with its disclosure obligations under applicable securities laws. Accordingly, investors and others should monitor the website in addition to following The Stars Group’s press releases, securities filings, and public conference calls and webcasts. This list may be updated from time to time.
Toronto, Ontario
March 6, 2019
(Signed) “Brian Kyle”
_____________________
Brian Kyle
Chief Financial Officer
49
