Revenues
For the year ended December 31, 2019, we had revenues of $233.9 million, an increase of $45.1 million or 23.9% over the prior year. Of this increase, $23.2 million was provided by companies acquired in 2019. The remaining increase of $21.9 million was driven by growth in all three of our reporting segments. See “Segment Results of Operations” below.
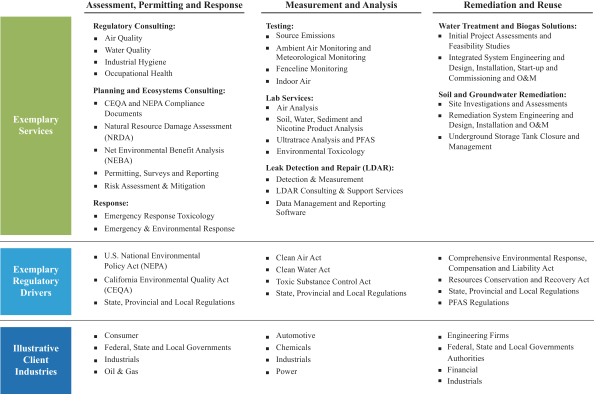
For the year ended December 31, 2019, our Assessment, Permitting and Response segment generated $21.1 million, or 9.0% of total revenues, our Measurement and Analysis segment generated $135.5 million, or 58.0% of total revenues, and our Remediation and Reuse segment generated $77.3 million, or 33.0% of total revenues. For the year ended December 31, 2018, we had revenues of $188.8 million, of which our Assessment, Permitting and Response segment generated $3.7 million, or 1.9% of total revenues, our Measurement and Analysis segment generated $117.4 million, or 62.2% of total revenues, and our Remediation and Reuse segment generated $67.8 million, or 35.9% of total revenues. Revenue from Discontinued Service Lines contributed $10.9 million and $12.3 million to revenues in the years ended December 31, 2019 and December 31, 2018, respectively, which was all in our Remediation and Reuse segment.
Cost of Revenues
For the year ended December 31, 2019, cost of revenues was $164.0 million or 70.1% of revenues, and was comprised of direct labor of $94.2 million, outside services (including construction, laboratory, shipping and freight and other outside services) of $34.8 million, field supplies, testing supplies and equipment rental of $20.5 million, project-related travel expenses of $8.7 million and other direct costs of $5.8 million. For the year ended December 31, 2019, cost of revenues as a percentage of revenue fell 1.3% from the prior year, as a result of lower labor and field supplies as a percentage of revenue, partially offset by higher outside services costs. These drivers were primarily as a result of changes in segment mix.
For the year ended December 31, 2018, cost of revenues was $134.7 million or 71.4% of revenues, and was comprised of direct labor of $79.4 million, outside services (including construction, laboratory, shipping and freight and other outside services) of $26.1 million, field supplies, testing supplies and equipment rental of $17.6 million, project-related travel expenses of $7.0 million and other direct costs of $4.6 million.
Selling, General and Administrative Expenses
Selling, general and administrative expenses consist of general corporate overhead, including executive, legal, finance, safety, risk management, human resource, marketing and information technology related costs, as well as indirect operational costs of labor, rent, insurance and stock-based compensation.
For the year ended December 31, 2019, selling, general and administrative expenses were $50.7 million, an increase of $12.1 million or 31.2% versus the prior year, of which $3.5 million was from selling, general and administrative expenses pertaining to companies we acquired in 2019. The remaining $8.6 million increase was primarily due to an increase in bad debt of $1.2 million, an increase in expense related to the fair value adjustment of contingent consideration of $1.4 million, an increase in costs incurred related to acquisitions of $1.9 million, costs related to preparing for our IPO of $0.6 million and investment in corporate infrastructure (primarily finance, sales and marketing, safety, IT and human resources).
For the year ended December 31, 2019, selling, general and administrative expenses were comprised of indirect labor of $18.4 million, facilities costs of $10.7 million, stock-based compensation of $2.9 million, acquisition-related costs of $3.5 million, fair value changes in business acquisitions contingent consideration of $1.4 million, bad debt expense of $1.2 million, costs related to preparing for our IPO of $0.6 million and other costs (including software, travel, insurance, legal, consulting and audit services) of $12.0 million.
67

