UNITED STATES
SECURITIES AND EXCHANGE COMMISSION
Washington, D.C. 20549
FORM 10-K
| ☑ | ANNUAL REPORT PURSUANT TO SECTION 13 OR 15(d) OF THE SECURITIES EXCHANGE ACT OF 1934 |
For the fiscal year ended December 31, 2017
or
| ☐ | TRANSITION REPORT PURSUANT TO SECTION 13 OR 15(d) OF THE SECURITIES EXCHANGE ACT OF 1934 |
For the transition period from ___________ to ___________
Commission file number 001-37550
QUORUM HEALTH CORPORATION
(Exact name of registrant as specified in its charter)
| | |
Delaware | | 47-4725208 |
State or other jurisdiction of incorporation or organization | | I.R.S. Employer Identification No. |
| | |
1573 Mallory Lane Brentwood, Tennessee | | 37027 |
Address of principal executive offices | | Zip code |
Registrant’s telephone number, including area code(615) 221-1400
Securities registered pursuant to Section 12(b) of the Act:
| | |
Title of each class | | Name of each exchange on which registered |
Common Stock, $0.0001 par value per share | | New York Stock Exchange |
Securities registered pursuant to Section 12(g) of the Act: None
Indicate by check mark if the registrant is a well-known seasoned issuer, as defined in Rule 405 of the Securities Act. Yes ☐ No ☑
Indicate by check mark if the registrant is not required to file reports pursuant to Section 13 or 15(d) of the Act. Yes ☐ No ☑
Indicate by check mark whether the registrant (1) has filed all reports required to be filed by Section 13 or 15(d) of the Securities Exchange Act of 1934 during the preceding 12 months (or for such shorter period that the registrant was required to file such reports), and (2) has been subject to such filing requirements for the past 90 days. Yes ☑ No ☐
Indicate by check mark whether the registrant has submitted electronically and posted on its corporate website, if any, every Interactive Data File required to be submitted and posted pursuant to Rule 405 of Regulation S-T (§ 232.405 of this chapter) during the preceding 12 months (or for such shorter period that the registrant was required to submit and post such files). Yes ☑ No ☐
Indicate by check mark if disclosure of delinquent filers pursuant to Item 405 of Regulation S-K (§ 229.405 of this chapter) is not contained herein, and will not be contained, to the best of the registrant’s knowledge, in definitive proxy or information statements incorporated by reference in Part III of the Form 10-K or any amendment to the Form 10-K. ☑
Indicate by check mark whether the registrant is a large accelerated filer, an accelerated filer, a non-accelerated filer, a smaller reporting company, or an emerging growth company. See the definitions of “large accelerated filer,” “accelerated filer,” “smaller reporting company” and “emerging growth company” in Rule 12b-2 of the Exchange Act.
| |
Large accelerated filer ☐ | Accelerated filer ☑ |
Non-accelerated filer ☐ (Do not check is a smaller reporting company) | Smaller reporting company ☐ |
Emerging growth company ☐ | |
If an emerging growth company, indicate by check mark if the registrant has elected not to use the extended transition period for complying with any new or revised financial accounting standards provided pursuant to Section 7(a)(2)(B) of the Securities Act. ☐
Indicate by check mark whether the registrant is a shell company (as defined in Rule 12b-2 of the Act). Yes ☐ No ☑
The aggregate market value of the common stock (“Common Stock”) held on June 30, 2017 by non-affiliates of the Registrant was approximately $118.3 million (based on the June 30, 2017 closing price of common stock of $4.15 per share as reported on the New York Stock Exchange). For purposes of this calculation only, shares held by non-affiliates excludes only those shares beneficially owned by the registrant’s executive officers, directors and stockholders owning 10% or more of the Company’s outstanding common stock. The registrant has no non-voting common stock outstanding. As of March 12, 2018, there were 30,201,415 shares outstanding of the registrant’s Common Stock.
Documents incorporated by reference
Portions of the registrant’s definitive proxy statement for its 2018 Annual Meeting of Stockholders are incorporated by reference into Part III hereof.
QUORUM HEALTH CORPORATION
Annual Report on Form 10-K
Table of Contents
PART 1
Item 1.Business
Overview
The principal business of Quorum Health Corporation and its subsidiaries is to provide hospital and outpatient healthcare services in our markets across the United States. As of December 31, 2017, we owned or leased a diversified portfolio of 31 hospitals in rural and mid-sized markets, which are located in 15 states and have a total of 2,979 licensed beds. In addition, through Quorum Health Resources LLC (“QHR”), our wholly-owned subsidiary, we provide a wide range of hospital management advisory and healthcare consulting services. Over 95% of our net operating revenues for the year ended December 31, 2017 were attributable to our hospital operations business and the remainder related to our hospital management advisory and healthcare consulting services business. Our company became an independent, publicly-traded company on April 29, 2016 upon the spin-off (“Spin-off”) of 38 hospitals, their affiliated facilities and QHR from Community Health Systems, Inc. (“CHS” or “Parent” when referring to the carve-out period prior to April 29, 2016). The terms of the spin-off and related financing transactions, including the transition services agreements between us and CHS, are described below in the section entitled “The Spin-off.”
As used in this report, the terms (“QHC,” “Company,” “we,” “our,” and “us”) refer to Quorum Health Corporation and its subsidiaries. Quorum Health Corporation is a Delaware corporation that was incorporated in 2015 to facilitate our Spin-off from Community Health Systems, Inc., as described below. All references within this Annual Report on Form 10-K to our financial statements, financial data and operating data refer to such data on a consolidated and combined basis unless otherwise noted. For a definition of consolidated and combined basis, see “Item 7. Management’s Discussion and Analysis of Financial Condition and Results of Operations — Results of Operations.”
For the year ended December 31, 2017, we generated total net operating revenues of $2.1 billion, loss from operations of $12.1 million, loss before income taxes of $134.2 million, net loss of $112.4 million, net cash provided by operating activities of $67.0 million, Adjusted EBITDA of $141.8 million, Adjusted EBITDA, Adjusted for Divestitures of $162.5 million and Adjusted EBITDA, Adjusted for Potential Divestitures of $170.8 million. For information regarding why the Company believes Adjusted EBITDA, Adjusted EBITDA, Adjusted for Divestitures and Adjusted EBITDA, Adjusted for Potential Divestitures present useful information to investors and for a reconciliation of Adjusted EBITDA, Adjusted EBITDA, Adjusted for Divestitures and Adjusted EBITDA, Adjusted for Potential Divestitures to net income (loss) attributable to Quorum Health Corporation, the most directly comparable financial measure under United States generally accepted accounting principles (“U.S. GAAP” or “GAAP”), see “Item 6 — Selected Financial Data.” Our loss before income taxes was impacted by: (1) $47.3 million of impairment related to our hospital operations business, consisting of $45.4 million of impairment to long-lived assets and $1.9 million of impairment to goodwill; (2) $65.3 million of net operating losses from the hospitals that we divested (the “divestitures group”) or have targeted for divestiture (the “potential divestitures group”), which collectively includes two hospitals divested in December 2016, five hospitals divested in 2017 and an additional seven hospitals that we intend to divest or close in the next twelve to twenty-four months; and (3) $122.1 of interest expense and $125.8 million of cash interest payments made on our indebtedness.
We generate patient revenues from the healthcare services we provide at our hospitals and affiliated outpatient facilities. Our hospital services include general and acute care, emergency room, general and specialty surgery, critical care, internal medicine, obstetrics, diagnostic services, psychiatric and rehabilitation services. We also generate revenues from the outpatient healthcare services we provide at both our hospitals and affiliated outpatient service facilities, including physician practices, urgent care centers, imaging centers and surgery centers, which are located in the same and immediately surrounding communities as our hospitals. We prioritize building and maintaining a strong presence in the communities where we operate hospitals in collaboration with the local residents, business leaders and governmental agencies. We continuously seek to improve our market share in each community by building patient loyalty to both our hospitals and physicians and by maintaining a strong reputation for quality of patient care. We are the sole provider of general and acute hospital healthcare services in 20 of our markets, which we generally define as the county where our hospital resides, which means we typically have less direct competition from other hospital companies for our hospital services. Some of our hospitals are located in markets that are adjacent to highly populated areas where the population, available workforce and demand for healthcare services are likely to continue to grow. Such factors could increase the demand for healthcare services from our facilities due to the close proximity of our hospitals and outpatient services facilities to these neighboring markets.
We generate non-patient revenues from our hospital management advisory and healthcare consulting services business. QHR is a leading provider of hospital management advisory and healthcare consulting services in the United States. The clients of QHR are hospitals that are not affiliated with our hospital operations business that enter into contracts with us to receive these non-patient services. As of December 31, 2017, QHR had contracts to provide management advisory services to 85 hospital clients located in 31 states with a total of approximately 5,200 licensed beds. During the year ended December 31, 2017, QHR also provided consulting and other support services to approximately 98 hospital clients located in 36 states with a total of approximately 5,000 licensed beds. By managing and consulting with non-affiliated hospitals that are often located in similar markets as our owned and leased hospitals, we hope to benefit from the opportunity to build relationships and partnerships in these communities and to enhance our knowledge of overall U.S. market conditions beyond the markets in which we currently operate hospitals. In addition to our non-patient revenues from our QHR business, we generate other non-patient revenues, primarily from rental income and hospital cafeteria sales.
2
The Spin-off
On April 29, 2016, CHS completed the Spin-off of 38 hospitals, including their affiliated outpatient facilities, and QHR to form Quorum Health Corporation through the distribution of 100% of QHC common stock to CHS stockholders of record on April 22, 2016 (the “Record Date”). Each CHS stockholder received a distribution of one share of QHC common stock for every four shares of CHS common stock held as of the Record Date, plus cash in lieu of fractional shares. QHC common stock began trading on the New York Stock Exchange (“NYSE”) under the ticker symbol “QHC” on May 2, 2016.
In connection with the Spin-off, we issued $400 million in aggregate principal amount of 11.625% Senior Notes due 2023 (the “Senior Notes”) on April 22, 2016 and entered into a credit agreement on April 29, 2016, consisting of an $880 million senior secured term loan facility (the “Term Loan Facility”) and a $100 million senior secured revolving credit facility (the “Revolving Credit Facility”), or on a combined basis referred to as the “Senior Credit Facility.” In addition, we entered into a $125 million senior secured asset-based revolving credit facility (“the ABL Credit Facility”). The net offering proceeds of the Senior Notes, together with the net borrowings under the Term Loan Facility, were used to make a $1.2 billion payment from QHC to CHS and to pay our transaction and financing fees and expenses.
In connection with the Spin-off, certain agreements were established by CHS that govern and continue to govern matters related to the Spin-off. These agreements include, among others, a Separation and Distribution Agreement, a Tax Matters Agreement and an Employee Matters Agreement. Various transition services agreements were established by CHS that define services to be provided by CHS to QHC. The transition services agreements generally have five-year terms and include, among others, the provision for services related to information technology, payroll processing, certain human resources functions, patient eligibility screening, billing, collections and other revenue management services.
Pursuant to the terms of the Separation and Distribution Agreement, CHS made a non-cash capital contribution of $530.6 million and transferred $13.5 million of cash to us on the Spin-off date. The cash transfer consisted of an agreed upon $20.0 million for the initial funding of our working capital, reduced by $6.5 million for the difference in estimated and actual financing fees and expenses incurred at the closing of the Spin-off.
The following table contains a summary of the major transactions to effect the Spin-off of QHC as a newly formed, independent company (dollars in thousands):
| | | | | | | | | | | | | | | | | | | Additional | | | | | |
| | Long-Term | | | Due to | | | | Common Stock | | | Paid-in | | | Parent's | |
| | Debt | | | Parent, Net | | | | Shares | | | Amount | | | Capital | | | Equity | |
| | | | | | | | | | | | | | | | | | | | | | | | | |
Balance at April 29, 2016 (prior to the Spin-off) | | $ | 24,179 | | | $ | 1,813,836 | | | | | — | | | $ | — | | | $ | — | | | $ | 3,137 | |
Borrowings of long-term debt, net of debt issuance discounts | | | 1,255,464 | | | | — | | | | | — | | | | — | | | | — | | | | — | |
Payments of debt issuance costs | | | (29,146 | ) | | | — | | | | | — | | | | — | | | | — | | | | — | |
Cash proceeds paid to Parent | | | — | | | | (1,217,336 | ) | | | | — | | | | — | | | | — | | | | — | |
Transfer of liabilities from Parent | | | — | | | | (22,292 | ) | | | | — | | | | — | | | | — | | | | — | |
Net deferred income tax liability resulting from the Spin-off | | | — | | | | (46,783 | ) | | | | — | | | | — | | | | — | | | | — | |
Non-cash capital contribution from Parent | | | — | | | | (527,425 | ) | | | | — | | | | — | | | | 530,562 | | | | (3,137 | ) |
Distribution of common stock | | | — | | | | — | | | | | 27,719,645 | | | | 3 | | | | (3 | ) | | | — | |
Distribution of restricted stock awards | | | — | | | | — | | | | | 692,409 | | | | — | | | | — | | | | — | |
Balance at April 29, 2016 (after the Spin-off) | | $ | 1,250,497 | | | $ | — | | | | | 28,412,054 | | | $ | 3 | | | $ | 530,559 | | | $ | — | |
3
The following table contains a summary of the sources and uses of cash directly related to our separation from CHS (in thousands):
Sources of cash: | | | | |
Term Loan Facility, maturing 2022 | | $ | 880,000 | |
Senior Notes, maturing 2023 | | | 400,000 | |
Cash transfer from CHS for initial funding of working capital, less adjustments | | | 13,454 | |
Total sources of cash | | | 1,293,454 | |
Uses of cash: | | | | |
Payment to CHS for the businesses | | | (1,217,336 | ) |
Payments of debt issuance costs | | | (29,146 | ) |
Reduction in debt proceeds for debt issuance discounts | | | (24,536 | ) |
Transaction costs related to the Spin-off, as recorded in the statements of income | | | (21,825 | ) |
Total uses of cash | | | (1,292,843 | ) |
Net cash inflow | | $ | 611 | |
Our Hospital Operations Business
Our hospitals and their affiliated outpatient service facilities generate revenues by providing a broad range of general and acute inpatient and outpatient healthcare services to patients living in or traveling to the communities in which we are located. Each of our hospitals has a corporate board of directors, a board of trustees, or both (in all cases, the “hospital board”), which include members from the local community and the hospital’s medical staff. The hospital board oversees the operations of the hospital and is responsible for matters such as establishing and monitoring policies related to medical, professional and ethical practices at the hospital and also ensuring these practices conform to U.S. healthcare industry standards and regulatory requirements. Each of our hospitals has an active quality assurance program to monitor patient safety and quality of care standards at the hospital and its affiliated outpatient service facilities and to meet accreditation and other federal and state regulatory requirements. Our hospitals conduct patient satisfaction surveys and engage in other quality of care assessment activities that are reviewed and monitored by our senior and hospital management teams on a continuing basis as part of our initiatives to maintain a high-quality reputation in each of the communities we serve.
The U.S. healthcare industry has been trending in recent years toward treatment of an increasing number of medical conditions in outpatient settings. We provide outpatient healthcare services at both our hospitals and their affiliated facilities, including physician practices, urgent care centers, imaging centers and surgery centers which we own or lease that are located in the same and immediately surrounding communities as our hospitals. For the years ended December 31, 2017, 2016 and 2015, outpatient healthcare services represented 55.0%, 55.4% and 56.8%, respectively, of our net patient revenues, before the provision for bad debts.
Our Hospital Management Advisory and Healthcare Consulting Services Business
In addition to the healthcare services provided through our hospitals and their affiliated outpatient service facilities, we also operate QHR, a leader in hospital management advisory and healthcare consulting services.
As of December 31, 2017, QHR had contracts to provide management advisory services to 85 hospital clients located in 31 states with a total of approximately 5,200 licensed beds. In some cases, we are engaged under these contracts to provide experienced hospital management professionals that are employees of our company to serve as the chief executive officer and chief financial officer for the hospital client on an interim or permanent basis. As part of the services we provide, our hospital clients receive operations support from QHR corporate and regional management teams. This service benefits our hospital clients as a result of the broader experience of our QHR corporate and regional management teams in providing services to hospitals of all sizes in diverse markets throughout the United States.
Our hospital management advisory contracts generally have terms of three to five years. QHR generates revenues from its management advisory contracts by charging a management advisory fee for its services, which is typically a fixed fee charge agreed upon by QHR and the hospital client’s board of directors and is typically not a calculation based on the hospital client’s revenues or other operating measures. As specified in the terms of each management advisory contract, QHR is not responsible for hospital licensure, physician credentialing, professional and general liability insurance coverage, capital investments or other functions of the hospital client. These functions are normally the responsibility of a hospital’s board of directors or board of trustees. QHR is also not responsible for funding any hospital operating expenses for its hospital clients. In its capacity as a provider of management advisory services to hospitals, QHR is not considered a healthcare provider for hospital licensure and certificate of need purposes.
QHR has a nationally recognized consulting services division and promotes healthcare consulting services to hospital clients that do not receive services from its management advisory services business. QHR generates revenues from its consulting contracts by charging a consulting fee for its services based on the nature, scope and timeline of the services defined for each specific contract. During the year ended December 31, 2017, QHR had contracts during some or all of the year to provide healthcare consulting and
4
other support services to approximately 98 hospitals in 36 states with a total of approximately 5,000 licensed beds. QHR provides consulting services to support a variety of the operational needs hospitals may face including, among others, assistance with revenue and accounts receivable management, electronic health records (“EHR”) management, patient flow management and regulatory compliance management. QHR also provides consulting services to large, sophisticated medical institutions that contract with us to provide hospital-related advice on specific topics.
QHR’s primary services include:
| • | Hospital Management Advisory and Operations Support. QHR provides hospital and other healthcare organization clients with operational, financial and strategic guidance, as well as interim senior level management when needed. |
| • | Hospital Group Purchasing. QHR offers group purchasing services to hospitals and other healthcare organizations through its Quorum Purchasing Advantage Program. Through this program, hospital and other healthcare organization clients can enter into a contract with QHR to buy discounted medical supplies, medical equipment, pharmaceuticals and other products and services from the same group purchasing organization used by us for our hospital operations business. QHR also assists with managing its clients’ supply chain for such purchases when needed. |
| • | Online Solutions for Hospitals. QHR offers a suite of web-based applications and software tools through its Vantage App Suite that are designed to support hospital and other healthcare organization clients in their efforts to improve operating and financial performance. These web-based tools are available through online subscriptions and include, among others, applications for measuring productivity, managing medical and drug supply costs, reviewing operating results against benchmark targets for performance and maintaining compliance contracts. |
| • | Education Programs. The Quorum Learning Institute educates healthcare leaders, professionals and other medical staff each year, from trustees and senior level management executives to department managers and other staff. It offers programs through national conferences, classroom courses, webinars and online resources. The Quorum Learning Institute programs address current issues in healthcare and provide technical training courses for new and advancing healthcare professionals and medical staff. |
Business Strategy
Our business strategy includes divesting underperforming hospitals, reducing our debt, refining our portfolio to a more sustainable group of hospitals with higher operating margins and increasing our market share in the each of the communities we serve. We intend to grow our revenues and operating margins by expanding specialty care and outpatient service lines at each of our hospitals, primarily by recruiting talented physicians and medical staff. We continuously aim to manage our operating costs, primarily through the efficient management of staffing, medical specialist costs and medical supply inventory levels, with a continued focus on enhancing patient safety and quality of care. In addition, our business strategy includes investing capital in renovations, expansion, medical-related technology and equipment at our existing healthcare facilities and also in acquiring new healthcare facilities.
As part of our efforts to accomplish these goals, we operate our healthcare facilities in accordance with the following strategic objectives:
| • | improve our financial results by pursuing the sale or closure of underperforming hospitals; |
| • | refine our portfolio to include high-quality, profitable hospitals and outpatient service facilities; |
| • | expand the breadth and capacity of the specialty care service lines and outpatient services we offer; |
| • | enhance patient safety, quality of care and satisfaction at our healthcare facilities; |
| • | improve the operating and financial performance of our hospital and clinical operations business; and |
| • | grow our revenues through selective acquisitions. |
Improve our Financial Results by Pursuing the Sale or Closure of Underperforming Hospitals
We perform an ongoing strategic review of our hospitals based upon an analysis of financial performance, current competitive conditions, market demographic and economic trends and capital allocation requirements to assess our overall portfolio of hospitals. As part of this strategy, we engage in initiatives to divest or close underperforming hospitals and outpatient service facilities which, in turn, we believe will allow us to reduce our corporate indebtedness and refine our hospital portfolio to become a sustainable group of hospitals and outpatient service facilities with higher operating margins. We will continue to pursue divestiture or closure opportunities that align with this strategy. Our strategic review process is ongoing and we have targeted additional hospitals for divestiture with the intent of utilizing all net proceeds to pay down our secured debt. We intend to divest or close these hospitals in the next twelve to twenty-four months. For a discussion of our recent divestitures and closure activities, see “Item 7. Management’s Discussion and Analysis of Financial Condition and Results of Operations — Overview – Recent Divestiture Activity.”
5
Refine our Portfolio to Include High-Quality, Profitable Hospitals and Outpatient Service Facilities
We are refining our portfolio of hospitals and outpatient service facilities, primarily by divesting underperforming businesses, with the goal of improving market share in each of the communities we serve. We are the sole provider of general and acute hospital healthcare services for 20 of our markets, which we generally define as the county where our hospital resides. We monitor the unique aspects of the individual communities we serve and utilize hospital-specific operating and marketing strategies to achieve our goals and benefit these communities. By focusing on building strong community, physician and employee relationships and by establishing strong local market leadership teams at our hospitals and outpatient service facilities, we believe we can enhance our delivery of high-quality healthcare services and improve operating performance at our hospitals and outpatient service facilities. We have local management leadership teams at each of our hospitals and additionally have local physician and clinical leadership groups in each of our markets. We aim to achieve a high level of presence and involvement in the communities we serve and to further our development of good relationships with local residents, business leaders and governmental agencies. We empower our individual hospital management teams to develop comprehensive strategic plans that position their respective hospitals to meet the unique healthcare needs of their local community and to look for opportunities to grow market share through selective acquisitions or the opening of new outpatient service facilities, including physician practices. We believe we have developed a reputation for partnering with the local communities of our hospitals to grow both the specialty care service lines and medical technology available to patients.
Expand the Breadth and Capacity of the Specialty Care Service Lines and Outpatient Services We Offer
Each of our markets has unique healthcare needs and gaps in available specialty care service lines and we assess these needs on an ongoing basis to prioritize our recruitment efforts. We are focused on the execution of effective primary care and specialty care physician retention and recruitment programs, and additionally non-physician recruitment and retention programs, at each of our hospitals for the purpose of building and maintaining the confidence of community residents in the stability and breadth of medical treatment available to them locally through our healthcare facilities. We invest capital in new and existing specialty care service lines and medical technology at our hospitals to continuously improve and enhance the quality of care experienced by our patients and with the intent of reducing the potential migration of our patients and local community residents to competing in-market and out-of-market providers. We also invest capital to expand our outpatient service line offerings. We believe this widens the catchment area for our hospitals and is consistent with prevailing market drivers in the U.S. healthcare industry, including patient preference for a convenient medical treatment facility, physician preference toward the increased efficiency of utilizing non-hospital settings when available, and both patient and third-party payor preferences toward the typically lower cost of care in outpatient settings. In particular, we are targeting four specialties, which are orthopedics, general surgery, gastroenterology and non-invasive cardiology. We anticipate the addition of these services will bolster utilization and increase acuity of our services, as measured by case mix index and net revenues per adjusted admission.
Enhance Patient Safety, Quality of Care and Satisfaction at our Healthcare Facilities
Clinical quality is a high priority for us. We have various programs that support our hospitals and outpatient service facilities to continuously improve the safety, quality of care and satisfaction of patients receiving services from us. As an example, we maintain active safety and quality training programs for our senior hospital management, chief nursing officers, quality control directors, physicians and other medical staff at our healthcare facilities. We also have programs that focus on sharing information among our hospital management teams to align best practices in medical treatment, operations and regulatory compliance. We seek to provide our hospitals with the infrastructure and technological capability to deliver high-quality care to patients. We believe measurements of patient, physician, medical staff and employee satisfaction provide important insight for our hospital leadership teams into the quality of care being administered to patients. Each of our hospitals conducts patient, physician, medical staff and employee satisfaction surveys to identify methods and opportunities for improving patient safety, quality of care and satisfaction. In addition, we have standardized many of our processes for documenting compliance with accreditation requirements and clinical best practices that have positive track records in leading to improved patient experiences at our healthcare facilities. For example, we established a baseline at each of our hospitals in April 2013 for monitoring the Serious Safety Event Rate. As of September 30, 2017, we have reported 92% fewer serious safety events in comparison to our baseline in 2013.
Improve the Operating and Financial Performance of our Hospital and Clinical Operations Business
We intend to improve the operating and financial performance at each of our hospitals and outpatient service facilities through frequent and ongoing evaluation of our operations, focusing on hospital-specific strategic initiatives, growing revenues by expanding specialty care and outpatient service line offerings, controlling operating costs and aligning incentive compensation with operating and financial performance to reward our hospital management teams. In general, we believe our opportunities for improving operating and financial performance are hospital-specific and we intend to provide our hospital management teams with the autonomy to develop an operating and marketing strategy tailored to the individual community they serve. Our strategic initiatives and operating cost control efforts include tasks such as continuously focusing on revenue cycle management and collections, adhering to established protocols related to medical supplies utilization, monitoring medical staffing levels and reducing contract labor usage. We believe these efforts, in combination with other initiatives aimed at improving our operating and financial performance, should lead to improved cash flow generation for us in the future.
6
Grow our Revenues through Selective Acquisitions
As part of our business strategy, once we have completed our divestiture program and paid down a sufficient amount of debt to reduce our leverage, we will seek attractive hospital acquisition opportunities meeting the following criteria:
| • | located in cities and counties with stable, growing populations and positive economic trends; |
| • | currently operate as tax-exempt (not-for-profit) hospitals; |
| • | present opportunities for capacity and service line expansion; and |
| • | align with our goals for improving overall operating and financial performance. |
We also seek to acquire selective outpatient service facilities, primarily physician practices, located in the same and immediately surrounding communities as our existing hospitals and will invest capital into building new outpatient service facilities when needed. We believe these strategic in-market initiatives will further strengthen our community relationships and benefit our patients and the community residents through increased availability of local specialty care and outpatient service lines.
Competition
The U.S. healthcare industry is highly competitive. We face competition from other healthcare providers for patients. We utilize both employee and non-employee physicians at our hospitals and outpatient service facilities. Our non-employee physicians, in most cases, also provide services at healthcare facilities not owned by us. We seek to attract patients to our facilities by maintaining a reputation for high quality of care and patient satisfaction, providing convenient inpatient and outpatient settings for the delivery of healthcare services, and ensuring that we invest in technologically advanced medical equipment. Our ability to effectively compete for patients is impacted by commercial and managed care payor programs that influence patient choice by offering health insurance plans that restrict patient choice of provider. For example, plans with narrow network structures restrict the number of participating in-network provider plans and plans with tiered network structures impose higher cost-sharing obligations on patients who obtain services from providers in a disfavored tier.
We are the sole provider of general and acute hospital healthcare services in 20 of our markets, which we generally define as the county where our hospital resides, which means we typically have less direct competition for our hospital services. Our hospitals face competition from out-of-market hospitals, including hospitals in urban areas that may have more comprehensive specialty care service lines, more advanced medical equipment and technology, more extensive medical research capabilities and resources or greater access to medical education programs. Patients in the markets where we operate hospitals may travel to out-of-market hospitals to seek medical treatment for a variety of reasons including, but not limited to, the need for services we do not offer or as a result of a physician referral. Patients who seek medical treatment from an out-of-market hospital may subsequently shift their preferences to that hospital for future healthcare services. We also face competition from other specialty care providers, including outpatient surgery, orthopedic, oncology and diagnostic centers that are not affiliated with us. Our hospitals and many of the hospitals with whom we compete engage in physician alignment strategies, which may include employing physicians, acquiring physician practice groups, and participating in Accountable Care Organizations (“ACOs”) and, to the extent permitted by law, physician ownership of healthcare facilities. Consolidation within the payor industry, vertical integration efforts among payors and healthcare providers, and cost-reduction strategies implemented by large employer groups and their affiliates may also affect our competitive position.
In our markets where we are not the sole provider of general and acute hospital healthcare services, our primary competitor is generally a not-for-profit hospital. Not-for-profit hospitals are typically owned by tax-supported governmental agencies or not-for-profit entities that are financially supported by endowments and charitable contributions. Not-for-profit hospitals do not pay income or property taxes and are able to make capital investments without paying sales tax. These financial advantages may better position such hospitals to maintain more modern and technologically upgraded healthcare facilities and equipment and to offer more specialized healthcare services than those available at our hospitals. Recent consolidations of not-for-profit hospital entities may intensify competitive pressures.
The trend toward increasing clinical transparency and value-based purchasing within the U.S. healthcare industry may have an adverse impact on our competitive position and patient admissions volumes in ways that we are unable to predict. For example, the Patient Protection and Affordable Care Act, as amended by the Health Care and Education Reconciliation Act of 2010 (collectively, the “Affordable Care Act”), requires hospitals to publish or make available to the public their standard charges for healthcare services. In addition, Centers for Medicare & Medicaid Services (“CMS”) publicizes on its Hospital Compare website certain data submitted by hospitals in connection with Medicare reimbursement claims, which includes individual hospital performance data related to quality of care measures and patient satisfaction surveys.
Our Competitive Strengths
In the rural and mid-sized markets where we operate, we believe we have strengths in our hospital operations that differentiate us from our competitors, including our commitment and ability to respond to the demand for better access to high-quality patient care,
7
improved patient experience through the entire treatment and billing process and continuous improvement in clinical quality. We believe our competitive strengths are summarized as follows:
| • | strong presence in the communities we serve; |
| • | geographically diversified hospital portfolio; |
| • | track record of continuous improvement in clinical quality, safety and patient experience; and |
| • | dedicated and experienced management teams. |
Strong Presence in the Communities We Serve
Our hospitals are the sole providers of general and acute hospital healthcare services in most of the markets we serve throughout the United States. These communities rely on our hospitals for access to quality healthcare services, as well as to make a positive societal and economic impact in their regions. Our hospitals are dedicated to providing local employment opportunities, engaging in local sponsorships and offering community health education through lecture programs, health fairs and screening events.
Geographically Diversified Hospital Portfolio
We have a geographically diversified portfolio, which as of December 31, 2017 included 31 hospitals located across 15 states. Many of our hospitals operate in markets experiencing population growth. We believe our existing hospital portfolio is geographically well-positioned to adapt to ongoing changes in the U.S. healthcare industry and to respond to individual community needs related to healthcare services. Additionally, as part of our business strategy and to enhance our long-term growth, we are actively engaged in refining our hospital portfolio and reducing our leverage, primarily by divesting underperforming hospitals.
Track Record of Continuous Improvement in Clinical Quality, Safety and Patient Experience
We are committed to providing a high-quality and cost-effective healthcare experience for patients in collaboration with our physicians, medical staff and third-party payors. We have continued to see a reduction in our Serious Safety Events, as last reported through September 30, 2017, with a 92% reduction from our 2013 baseline. Our hospitals continually strive to achieve clinical excellence designations, such as Chest Pain Center accreditation by the Society of Cardiovascular Patient Care and Primary Stroke Center accreditation by The Joint Commission.
Dedicated and Experienced Management Teams
Our dedicated senior management team has significant public company and hospital operations experience, including a proven track record of acquiring and integrating hospitals. We believe the breadth of healthcare industry expertise and experience from both our senior management team and the management teams at each of our hospitals will drive our long-term growth.
U.S. Healthcare Industry
Overview
According to CMS, total U.S. healthcare expenditures in 2016 grew by 4.3% to approximately $3.3 trillion and are projected to have grown 4.6% in 2017 to approximately $3.5 trillion. The CMS projections, published in February of 2018, indicate that total U.S. healthcare spending will grow at an average annual rate of 5.6% for 2018 through 2026, exceeding $5.7 trillion by 2026 and accounting for approximately 19.7% of the total U.S. gross domestic product. CMS expects healthcare spending to be largely influenced by changes in economic conditions and demographics as well as increasing prices for medical goods and services. The CMS projections are typically published once per year and are not updated to reflect interim changes. For example, the projections do not take into account the possibility of further modifications to, or repeal of, the Affordable Care Act.
Hospital care, the category within the U.S. healthcare industry in which we classify our hospital operations business, is the largest category of U.S. healthcare expenditures. The hospital care category is broadly defined to include services provided at acute care, rehabilitation and psychiatric healthcare facilities that are owned by the government or investors or that operate as not-for-profit facilities. CMS defines the hospital care category to include all services provided by hospitals to patients. Services include room and board, ancillary charges, services of employed physicians, inpatient pharmacy, hospital-based nursing home, home health care and any other service billed by hospitals in the United States for patient care. In 2017, hospital care expenditures are projected to have grown 4.6%, amounting to over $1.1 trillion. CMS estimates that the hospital services category will amount to nearly $1.2 trillion in 2018 and projects growth in this category at an average of 5.6% annually from 2018 through 2026. According to the American Hospital Association, as of January 2018, there are approximately 4,840 community hospitals in the United States and approximately 1,825 of these hospitals are located in rural communities, which are the primary markets in which we operate hospitals.
Demographic Trends
According to the U.S. Census Bureau, in 2015, the U.S. population included approximately 47.8 million people living in the United States age 65 or older, comprising 14.9% of the total U.S. population. By 2030, the U.S. Census Bureau predicts the number of people age 65 or older living in the United States will increase to approximately 74.1 million, or 20.6% of the total U.S. population.
8
Due to increasing life expectancy, people living in the United States age 85 or older is also expected to increase from approximately 6.3 million in 2015 to 9.1 million by 2030. The increase in life expectancy is expected to increase the demand for healthcare services and, as importantly, the demand for more innovative means of delivering healthcare services.
Based on U.S. Census Bureau data compiled by us for the specific markets in which we operate hospitals, the number of people living in our service areas grew 0.4% from 2010 to 2017 and is expected to grow 1.4% from 2017 to 2022. The national average population growth is 5.3% and 3.8% for these respective periods. The number of people age 65 or older living in our service areas grew 18.8% from 2010 to 2017 and is expected to grow 35.8% from 2017 to 2022. The national average population growth for people age 65 or older is 24.9% and 17.5% for these respective periods. The number of people age 65 or older living in our service areas comprised 15.8% of the total population in our service areas in 2017 and is expected to comprise 18.1% of the total population in these same service areas by 2022. The number of people age 65 or older living in the United States is 16.3% and 19.1% for these respective periods. On a similar basis, the number of people age 85 or older in our service areas grew 15.2% from 2010 to 2017 and is expected to grow 14.6% from 2017 to 2022. The national average population growth for people age 85 or older is 15.2% and 5.7% for these respective periods. The number of people age 85 or older living in our service areas comprised 1.9% of the total population in our service areas in 2017 and is expected to comprise 2.0% of the total population in these same service areas by 2022. The number of people age 85 or older living in the United States is 2.0% and 2.2% for these respective periods.
Hospital Consolidation Trends
Various sectors of the U.S. healthcare industry are experiencing consolidation activity. We believe that consolidation activity in the hospital care category will continue to be a trend of the U.S. healthcare industry in the future. Reasons for this consolidation activity generally include the following:
| • | desire to enhance the quality of care and breadth of local healthcare service lines available in communities; |
| • | need for additional recruitment of specialty care and primary care physicians or other medical staff; |
| • | general economies of scale, such as those that can be achieved through contracting for medical and drug supply purchase agreements and professional and general liability insurance coverage as a combined hospital system; |
| • | increasing market share in the communities they serve |
| • | mitigating risks associated with ongoing changes in reimbursement rates available from both governmental and non-governmental third-party payors; |
| • | changes to healthcare reimbursement payment models that more closely tie reimbursement rates to the cost-effective delivery of patient services and the quality of care administered to patients; and |
| • | other ongoing regulatory changes within the U.S. healthcare industry. |
Hospital companies are acquiring an increasing number of physician practices and other outpatient service facilities as part of their physician alignment strategies to position themselves for readmissions, payment bundling and other payment restructuring models. Similarly, commercial and non-governmental managed care third-party payors have been consolidating and, in some cases, acquiring complementary service providers in an effort to offer more competitive programs.
Payment Trends
In recent years, the Affordable Care Act and the consolidation activity within the U.S. healthcare industry, among other factors, have resulted in higher deductible and co-payment requirements due from patients, which in turn have increased financial risk for hospitals. The amount of uncollectible patient account balances is expected to increase in response to rising medical prices and to greater financial burden on insured patients. These increases have been partially offset by the reduction in costs associated with previously uninsured patients benefiting from Medicaid expansion due to the Affordable Care Act. However, it is unclear whether these effects will continue due to uncertainty regarding the future of the Affordable Care Act and other health reform initiatives.
Outpatient Services Trends
In recent years, hospitals have experienced an increase in the percentage of total revenues associated with outpatient healthcare services. This shift in revenues is primarily attributable to advances in medical technology, which have permitted more procedures to be performed in an outpatient setting. In addition, increased pressure from the Medicare and Medicaid programs, commercial health insurance companies and managed care plans to reduce the number of days a patient stays in the hospital has also contributed to the increase in outpatient healthcare services. Patients and third-party payors have been seeking lower cost service settings through outpatient service facilities on an increasing basis as the number of outpatient service facilities and the types of services available through outpatient service facilities increase. Certain third-party payors are imposing limitations and adjusting coverage of inpatient services for types of services currently available in outpatient settings. Further, recent changes to Medicare policy affecting the reimbursement methodology for certain items and services provided by off-campus provider-based hospital departments have generally resulted in reduced payment rates for hospital outpatient settings. For the years ended December 31, 2017, 2016 and 2015, outpatient healthcare services represented 55.0%, 55.4% and 56.8%, respectively, of our net patient revenues, before the provision for
9
bad debts. We expect the percentage of total revenues attributable to outpatient healthcare services will increase in the future and will, in turn, inhibit the growth of inpatient admissions at our hospitals.
Health Insurance Coverage Trends
The Affordable Care Act, as currently structured, mandates that substantially all U.S. citizens maintain health insurance coverage, while expanding access to coverage through a combination of private sector health insurance reforms and public program expansion. In recent years, most of the states that have experienced the greatest reductions in rates of uninsured individuals have been those that expanded Medicaid coverage and established healthcare insurance exchanges at the state level. However, CMS has indicated that it intends to increase state flexibility in the administration of Medicaid programs, including allowing states to condition Medicaid enrollment on work or other community engagement. Further, there is considerable uncertainty regarding the future of the Affordable Care Act, making it difficult to predict future trends in health insurance coverage. The presidential administration and certain members of Congress have stated their intent to repeal or make significant changes to the Affordable Care Act, its implementation or its interpretation. In 2017, Congress eliminated the financial penalties associated with the individual mandate, effective January 1, 2019, which may impact the number of individuals who elect to purchase health insurance. In addition, the president signed an executive order directing agencies to relax limits on certain health plans, potentially allowing for fewer plans that adhere to specific Affordable Care Act coverage mandates. Several private health insurers have limited their participation in or withdrawn from the healthcare insurance exchanges, and the presidential administration has taken steps, including ending cost-sharing subsidies that were previously available to insurers, which may threaten the long-term viability of those marketplaces. Government efforts to change, alter the implementation of, or repeal the Affordable Care Act, or otherwise influence financial and delivery systems within the healthcare industry, may have an adverse effect on our business, results of operations, cash flow, capital resources and liquidity.
Revenues
We generate revenues by providing healthcare services at our hospitals and affiliated outpatient service facilities to patients seeking medical treatment. Hospital revenues depend on, among other factors, inpatient occupancy and acuity levels, the volume of outpatient procedures and the charges and negotiated reimbursement rates for the healthcare services provided. Our primary sources of payment for patient healthcare services are third-party payors, including the Medicare and Medicaid programs, Medicare and Medicaid managed care programs, commercial insurance companies, other managed care programs, workers’ compensation carriers and employers. Self-pay revenues are the portion of our revenues generated from providing healthcare services to patients who do not have health insurance coverage as well as the patient responsibility portion of charges that are not covered for an individual by a health insurance program or plan. We generate revenues related to our QHR business when hospital management advisory and healthcare consulting services are provided. We report these revenues at their net realizable value. We generate other non-patient revenue primarily from rental income and hospital cafeteria sales.
Amounts we collect for medical treatment of patients covered by Medicare, Medicaid and non-governmental third-party payors are generally less than our standard billing rates. Our standard charges and reimbursement rates for routine inpatient services vary significantly depending on the type of medical procedure performed and the geographical location of the hospital. Differences in our standard billing rates and the amounts we expect to collect from third-party payors are classified as contractual allowances. The reimbursements we ultimately receive as payments for services are determined for each patient instance of care, based on the contractual terms we negotiate with third-party payors or based on federal and state regulations related to governmental healthcare programs. Our contractual allowances are impacted by the timing and ability of CHS to monitor the classification and collection of our patient accounts receivable. Billings and collections are outsourced to CHS under the transition services agreements that were put in place by CHS in connection with the Spin-off. See Note 16 — Related Party Transactions in the accompanying financial statements for additional information on these agreements. Except for emergency department services, our policy is to determine the payment methodology with patients prior to when the services are performed. Self-pay and other payor discounts are incentives offered to uninsured or underinsured patients or other payors to reduce their costs of healthcare services.
10
The following table provides a summary of our net operating revenues, before the provision for bad debts, for the years ended December 31, 2017, 2016 and 2015, by payor source (dollars in thousands):
| | Year Ended December 31, | |
| | 2017 | | | 2016 | | | 2015 | |
| | $ Amount | | | % of Total | | | $ Amount | | | % of Total | | | $ Amount | | | % of Total | |
| | | | | | | | | | | | | | | | | | | | | | | | |
Medicare | | $ | 656,843 | | | | 28.2 | % | | $ | 673,074 | | | | 27.8 | % | | $ | 656,799 | | | | 26.9 | % |
Medicaid | | | 425,943 | | | | 18.3 | % | | | 446,273 | | | | 18.4 | % | | | 443,479 | | | | 18.1 | % |
Managed care and commercial | | | 921,503 | | | | 39.6 | % | | | 952,535 | | | | 39.4 | % | | | 984,480 | | | | 40.3 | % |
Self-pay | | | 226,043 | | | | 9.7 | % | | | 242,095 | | | | 10.1 | % | | | 247,234 | | | | 10.0 | % |
Non-patient | | | 97,323 | | | | 4.2 | % | | | 105,076 | | | | 4.3 | % | | | 113,866 | | | | 4.7 | % |
Total net operating revenues, before the provision for bad debts | | $ | 2,327,655 | | | | 100.0 | % | | $ | 2,419,053 | | | | 100.0 | % | | $ | 2,445,858 | | | | 100.0 | % |
The table above includes an $11.4 million change in estimate we recorded as of December 31, 2016 to reduce the net realizable value of patient accounts receivable due to increasing delays associated with collections on accounts receivable under the Illinois Medicaid program. This change in estimate impacted contractual allowances associated with Medicaid revenues. In addition, net operating revenues, before the provision for bad debts, declined $135.8 million in 2017 compared to the same period in 2016 due to the seven hospitals that have been divested by the Company.
For the years ending December 31, 2017, 2016 and 2015, Medicare revenues related to Medicare Advantage Plans were $186.7 million, $170.4 million and $146.9 million, respectively, or 28.4%, 25.3% and 22.4% as a percentage of total Medicare revenues, respectively.
Charity Care
In the ordinary course of business, we provide services to patients who are financially unable to pay for care. The related charges for those patients who are financially unable to pay that otherwise do not qualify for reimbursement from a governmental program are classified as charity care. We determine amounts that qualify for charity care primarily based on the patient’s household income relative to the poverty level guidelines established by the federal government. Our policy is not to pursue collections for such amounts; therefore, the related charges are recorded in operating revenues at the standard billing rates and fully offset in contractual allowances in the same period.
Provision for Bad Debts
To provide for accounts receivable that could become uncollectible in the future, we establish an allowance for doubtful accounts to reduce the carrying value of our receivables to their estimated net realizable value. The primary uncertainty in collectability of our revenues relates to uninsured patients and the patient financial responsibility portion of payments due from insured patients. Collections are impacted by the economic ability of patients to pay, the effectiveness of CHS’ collection efforts pursuant to the transition services agreements, and our own collection efforts. Significant changes in payor mix, CHS’ business office operations, economic conditions, or trends in federal and state governmental healthcare coverage, among other things, could affect our collection levels and are considered in our estimate of the allowance for doubtful accounts. See “Item 1. Business — Agreements with CHS Related to the Spin-off” for additional information on the transition services agreements.
We have an established process to determine the adequacy of our allowance for doubtful accounts that relies on a number of analytical tools and benchmarks. No single statistic or measurement determines the adequacy of the allowance for doubtful accounts. Some of the analytical tools we utilize include, but are not limited to, monitoring historical cash collections experience, revenue trends by payor classification and days revenue outstanding.
During the fourth quarter of 2017, we analyzed our self-pay patient accounts receivable at a more comprehensive and disaggregated level and refined our estimate of the collectability of the portion of self-pay accounts receivable related to insured patients, primarily co-pays and deductibles. Our analysis also included an evaluation of patient accounts receivable retained in the divestitures of six of our seven divested hospitals. As a result of these efforts, we recorded a change in estimate of $21.0 million to reduce the net realizable value of patient accounts receivable, which negatively impacted the provision for bad debts in our statement of income for the year ended December 31, 2017.
As of December 31, 2016, we recorded a change in estimate of $11.4 million to reduce the net realizable value of our patient accounts receivable, which negatively impacted the provision for bad debts in our statement of income for the year ended December 31, 2016. This change in estimate related to our assessment of the collectability of our managed care and commercial accounts receivable aged greater than one year based on a review of historical cash collections for these accounts.
11
Reimbursement under Governmental Healthcare Programs
We receive payments for a substantial portion of our revenues from the Medicare and Medicaid programs, including Medicare managed care plans, known as Medicare Advantage Plans, and the Medicaid managed care plans. Medicare is a federal program that provides health insurance benefits to individuals age 65 and older, some disabled individuals and individuals with end-stage renal disease. Medicaid is a federal and state funded program, administered at the state level, which provides health insurance benefits and subsidies to individuals who are unable to afford to pay for healthcare services or health insurance on their own. All of our hospitals are certified as providers under the Medicare and Medicaid programs.
The payments we receive under the Medicare and Medicaid programs are generally significantly less than the standard charges at our hospitals for the healthcare services provided. Furthermore, reimbursement payments under federally-funded healthcare programs are subject to across-the-board spending cuts to the federal budget imposed by the Budget Control Act of 2011. These sequestration cuts, as they are known, require reductions in reimbursement rates through federal fiscal year 2027. The Affordable Care Act, as currently structured, also imposes significant reductions on Medicare and Medicaid reimbursement rates. The federal government updates reimbursement rates annually. Legislation or regulation may result in payment reductions in the Medicare or Medicaid programs that could negatively impact our business. Our ability to operate our hospitals and affiliated healthcare facilities successfully in the future may depend, in large part, on our ability to adapt to the ongoing regulatory changes in the Medicare and Medicaid programs. See “Item 1. Business — U.S. Healthcare Industry” for statistical information on U.S. population trends.
Medicare Reimbursement
Under the Medicare program, we are paid for inpatient and outpatient healthcare services provided to qualifying Medicare beneficiaries at our hospitals and other healthcare facilities. Medicare is funded by the federal government under a series of individual programs. For example, the Part A program covers hospital, skilled nursing facility, home health and hospice care services and the Part B program covers physician services, preventive care, durable medical equipment, hospital outpatient services, laboratory tests, x-rays, mental health care and some home health and ambulance services. Medicare Advantage Plans, which is the customary term for the Part C program, are administered by private third-party payors that contract with the Medicare program to provide Medicare Part A and Part B benefits to participants. They include plans organized as health management organizations (“HMOs”), preferred provider organizations (“PPOs”), private fee-for-service plans, special needs plans and Medicare medical savings account plans. We are paid directly by the third-party payor that administers a Medicare Advantage Plan for the healthcare services we provide to patients enrolled in one of these plans. The regulations governing reimbursement under the Medicare program also generally apply to Medicare Advantage Plans.
Inpatient Medicare Reimbursement. Reimbursement rates for inpatient acute care services provided to Medicare beneficiaries are generally determined based on a prospective payment system. Under the inpatient prospective payment system (“IPPS”), our hospitals are paid a predetermined amount based on the patient’s diagnosis. Specifically, each discharge is assigned to a medical severity diagnosis-related group (“MS-DRG”) based upon the patient’s course of medical treatment during the relevant inpatient stay. The base MS-DRG payment rate does not consider the actual costs incurred by an individual hospital in providing a particular inpatient service. Each MS-DRG is assigned a relative weight that reflects the average amount of resources, as determined on a national basis, that are needed to treat a patient with that particular diagnosis compared to the amount of hospital resources that are needed to treat the average Medicare inpatient stay. The IPPS payment for each discharge is based on two national standardized base payment rates, one that covers hospital operating expenses and the other that covers hospital capital costs. The base MS-DRG payment rate for operating expenses is adjusted by a wage index to reflect geographical differences in labor costs. While a hospital generally does not receive additional reimbursement beyond the MS-DRG payment, hospitals may qualify for an “outlier” payment when a patient’s medical treatment costs are extraordinarily high and exceed a specified regulatory threshold.
CMS adjusts the MS-DRG payment rates annually, using the “market basket index” to account for changes to the costs of goods and services purchased by hospitals. For federal fiscal year 2018, which began on October 1, 2017, CMS increased the reimbursement rate by approximately 1.2% for hospitals that successfully report the quality measures of the Hospital Inpatient Quality Reporting (“IQR”) Program and are meaningful EHR users. This rate increase accounts for a projected market basket update of 2.7%, positively adjusted by 0.46% in accordance with the 21st Century Cures Act and negatively adjusted by the following percentage points: 0.6 for the multi-factor productivity measure, a 0.75 as required by the Affordable Care Act, and 0.6 to remove the effects of prior adjustments related to the two midnight rule. Hospitals that do not successfully report quality data under the IQR Program are subject to a 25% reduction of the market basket update. Hospitals that are not meaningful EHR users are subject to an additional 75% reduction of the market basket update. Based on our current portfolio, we estimate that these rate changes will increase inpatient Medicare reimbursement by $2.2 million in 2018.
The DRG payment rates are also adjusted pursuant to provisions of the Affordable Care Act that promote value-based purchasing, linking payments to quality and efficiency. For example, hospitals that meet or exceed defined quality performance standards receive greater reimbursement, while hospitals that do not satisfy the quality performance standards may receive reduced Medicare inpatient hospital payments. The amount collected from the reductions is pooled and used to fund the payments that reward hospitals based on a set of quality measures that have been linked to improved clinical processes of care and patient satisfaction. CMS scores each hospital on its achievement relative to other hospitals and improvement relative to that hospital’s own past performance. Similarly, hospitals
12
that experience “excess readmissions” for conditions designated by CMS within 30 days of the patient’s date of discharge receive inpatient payments reduced by an amount determined by comparing that hospital’s readmission performance to a risk-adjusted national average. In addition, CMS incentivizes hospitals to improve Hospital Acquired Condition (“HAC”) rates by reducing total inpatient Medicare payments by 1% for hospitals that rank among the lowest-performing 25% with respect to HACs.
Outpatient Medicare Reimbursement. CMS reimburses hospital outpatient services (and certain Medicare Part B services furnished to hospital inpatients without Part A coverage) under the hospital outpatient prospective payment system (“OPPS”). Other items and services, such as physical, occupational and speech therapies, durable medical equipment, and clinical diagnostic laboratory services, are reimbursed pursuant to fee schedules.
Hospital outpatient services paid under the OPPS are grouped into ambulatory payment classifications (“APCs”). Services for each APC are similar clinically and in terms of the resources they require. CMS has established a payment rate for each APC, and it updates these rates annually on a calendar year basis. For calendar year 2018, CMS issued a final rule that it estimates will result in a 1.4% payment increase for hospitals paid under the OPPS. This reflects a market basket increase of 2.7%, with a positive 0.6 percentage point multi-factor productivity adjustment and the 0.75 percentage point reduction required by the Affordable Care Act, along with other policy changes. For calendar year 2018, these policy changes include an adjustment applicable to all providers that is intended to offset the projected payment reductions under the 340B Drug Pricing Program so that the 340B Program changes are implemented in a budget neutral manner. There are legal challenges to the 340B Program payment reductions and CMS has indicated that it may revisit these policy changes in the future. In addition to these broad OPPS-wide adjustments, hospitals that fail to meet quality data reporting requirements are subject to a 2.0 percentage point reduction to the market basket update. Based on our current portfolio, we estimate that the cumulative changes to OPPS payments will increase our outpatient Medicare reimbursement by $3.1 million in 2018.
CMS has implemented a site-neutral Medicare reimbursement policy that limits reimbursement under the OPPS for items and services that are provided at certain off-campus outpatient provider-based departments (“off-campus OPBDs”) of hospitals. Items and services that are subject to the policy are reimbursed under the Medicare Physician Fee Schedule (“MPFS”). However, the site-neutral payment policy does not apply to items and services rendered in a dedicated emergency department or at off-campus OPBDs that are located within 250 yards of a remote location of a hospital, or to grandfathered off-campus OPBDs, which include those that were billing Medicare for outpatient hospital services prior to November 2, 2015.
Medicare Bundled Payments. The Center for Medicare & Medicaid Innovation, which is part of CMS, works to identify, develop, test and encourage the adoption of new methods of delivering and paying for healthcare services that create savings under the Medicare and Medicaid programs, while maintaining or improving quality of care. Some of the current and proposed initiatives involve bundled payments, which link payments to participating providers for services provided during an episode of care. Generally, providers participating in a bundled payment arrangement agree to receive one payment for services provided to patients for certain medical conditions or during each episode of care. In contrast to the traditional fee-for-service model, bundled payments are intended to align incentives for providers, encouraging more effective and efficient care.
Participation in bundled payment programs is generally voluntary, but CMS requires hospitals located in certain geographic areas to participate in the Comprehensive Care for Joint Replacement (“CJR”) model, a mandatory bundled payment initiative focused on knee and hip replacements. We operate one hospital within the geographical areas currently being tested. CMS has indicated that it is developing more bundled payment models. Our experience to date with the CJR model has not materially impacted our overall financial statements.
Medicare-Dependent Hospital Program. The Medicare program also makes reimbursement rate adjustments under a Medicare-Dependent Hospital program that applies to low admission volume hospitals, referred to as rural extenders, to ensure hospital access for rural Medicare beneficiaries. The budget bill signed into law in February 2018 extended the Medicare-Dependent Hospital program through federal fiscal year 2019. If future legislation is not passed to further extend the Medicare-Dependent Hospital program, we could experience a reduction in our net operating revenues at certain of our hospitals that currently qualify for participation in this program.
Medicare Physician Services Payments. Physician services provided to Medicare patients are reimbursed based on the MPFS, which is adjusted annually. Under MACRA, the MPFS reimbursement rate will increase 0.5% each calendar year through 2019. MACRA also established the Quality Payment Program (“QPP”), a payment methodology intended to reward high-quality patient care. Beginning in 2017, physicians and certain other healthcare clinicians are required to participate in the QPP through one of two tracks. Under both tracks, performance data collected in 2017 will affect Medicare payments in 2019 and performance data collected in 2018 will affect payments in 2020. CMS expects to transition increasing financial risk to providers as the QPP evolves. The Advanced Alternative Payment Model (“APM”) track makes incentive payments available for participation in specific innovative payment models approved by CMS, such as certain ACO models or a Medicare Shared Savings Program. Providers may earn a 5% Medicare incentive payment between 2019 and 2024 and will be exempt from reporting requirements and payment adjustments imposed under the Merit-Based Incentive Payment System (“MIPS”) if the provider has sufficient participation (based on percentage of payments or patients) in an Advanced APM. Alternatively, providers may participate in the MIPS track. Providers who choose the MIPS track initially will be subject to a performance-based reimbursement rate increase or decrease of up to 4% of the provider’s
13
Medicare payments based on their performance with respect to clinical quality, resource use, clinical improvement activities and meaningful use of EHR. The adjustment percentage will increase incrementally, up to 9%, by 2022. MIPS will consolidate components of three previously established incentive programs: the Physician Quality Reporting System, the Physician Value-Based Payment Modifier, and the Medicare EHR Incentive Program.
Medicare Disproportionate Share Hospital Payments. In addition to making payments related to specific patient services, Medicare provides financial support to hospitals that treat a disproportionately large number of low-income patients. These Disproportionate Share Hospital (“DSH”) payments are determined annually based on statistical information required by the Department of Health and Human Services (“HHS”) and are paid as a percentage addition to MS-DRG payments. The Affordable Care Act reduced Medicare DSH payments to 25% of the amount they otherwise would have been absent the law. The remaining 75% of the amount that would have been paid is earmarked for an uncompensated care payment pool that is adjusted each year by a formula that reflects reductions in the U.S. uninsured population that is under 65 years of age. Thus, the greater the rate of coverage for the previously uninsured population, the more the Medicare uncompensated care pool will be reduced. Each eligible hospital is then paid, out of the uncompensated care pool, an amount based upon its estimated cost of providing uncompensated care. The IPPS final rules for federal fiscal years 2018 and 2017 established the uncompensated care amounts to be distributed to qualifying hospitals in these years as nearly $6.8 billion and $6.0 billion, respectively. Medicare DSH payments received in the aggregate by our hospitals for 2017, 2016 and 2015 were approximately $8.9 million, $9.0 million and $9.4 million, respectively. We estimate the amount to be received for 2018 to be approximately $10.3 million.
Medicare Administrative Contractors. CMS competitively bids the Medicare fiscal intermediary and Medicare carrier functions to Medicare Administrative Contractors (“MACs”) in 12 defined jurisdictions. Each MAC is geographically assigned and serves both Medicare Part A and Part B providers within its given jurisdiction. In connection with past consolidation efforts, CMS gave chain providers the option of having all hospitals use one home office MAC. Although we elected to use one MAC, CMS has not yet transitioned all of our hospitals to one MAC and has not provided a clear timeline for doing so. MAC transitions impact Medicare claims processing, which could delay reimbursement payments and adversely affect our cash flow. MAC transitions may also be prompted by the periodic re-soliciting by CMS of MAC bids in a jurisdiction.
Medicaid Reimbursement
Medicaid programs are funded jointly by the federal and state governments and administered by the states to provide healthcare benefits to certain low-income individuals. Most state Medicaid payments are made under a prospective payment system or under programs that negotiate payment levels with individual hospitals. Amounts received under the Medicaid programs are often significantly less than the hospital’s standard charges for the services provided. State Medicaid agencies may also fund Medicaid Managed Care Plans, which are administered by managed care organizations (“MCOs”). The MCOs receive a set per member per month payment for their administrative services from the applicable state Medicaid agency. We are paid directly by the MCO for the healthcare services we provide to patients enrolled in one of these plans. The regulations that govern the reimbursement rates of the Medicaid programs also generally apply to Medicaid managed care plans.
The Affordable Care Act requires states to expand Medicaid coverage by adjusting eligibility requirements such as income thresholds. A number of states have opted out of the Medicaid expansion provisions, which they may do without losing federal funding. Eight of the 15 states in which we operate hospitals have expanded coverage under their state Medicaid programs. For the year ended December 31, 2017, our hospitals and affiliated outpatient service facilities located in these eight states generated 75.2% of our total net patient revenues, before the provision for bad debts, excluding our divested hospitals and affiliated outpatient services facilities. However, there is uncertainty regarding the future of the Affordable Care Act, including its Medicaid expansion provisions. In addition, budget pressures have prompted many states to consider reducing Medicaid funding, as Medicaid is often the state’s largest program. Some states have adopted or are considering legislation intended to reduce coverage, increase enrollment in managed care programs or otherwise finance the system. Several states use, or have applied to use, waivers granted by CMS to implement expansion, impose different eligibility or enrollment restrictions, or otherwise implement programs that vary from federal standards. CMS has indicated that it intends to increase state flexibility in the administration of Medicaid programs, including approving waivers that allow states to condition enrollment on work or other community engagement. However, the Affordable Care Act, as enacted, requires that states maintain certain eligibility standards for children until October 1, 2019. The Affordable Care Act also prohibits the use of federal funds under the Medicaid program to reimburse providers for medical services provided to patients to treat HACs. We can provide no assurance that reductions to Medicaid funding will not have a material adverse effect on our results of operations or cash flows.
Medicaid Disproportionate Share Hospital and Supplemental Payments. Currently, most states, including 14 of the 15 states we operating in, utilize supplemental payment programs, including disproportionate share hospital (“DSH”) programs, for the purpose of providing additional payments for services to providers, such as our hospitals, to offset a portion of the cost of providing care to Medicaid and indigent patients. These programs are designed with input from CMS and funded with a combination of federal and state resources, including, in certain states, taxes, fees or other program costs (collectively, “provider taxes”) levied on the providers participating in the programs. Hospitals that provide care to a disproportionately high number of low-income patients may receive Medicaid DSH payments. The federal government distributes federal Medicaid DSH funds to each state based on a statutory formula. States then distribute the DSH funding among qualifying hospitals, as determined in each state. States have broad discretion to define
14
which hospitals qualify for Medicaid DSH payments and the amount of such payments. Under the budget bill signed into law in February 2018, Medicaid DSH funding will be reduced by $4 billion in federal fiscal year 2020 and by $8 billion per year in federal fiscal years 2021 through 2025. In addition to DSH payments, some states operate programs that provide for supplemental payments to bridge the gap between hospital operating costs and Medicare reimbursement. Various federal policy changes are focused on limiting the use of other types of supplemental payments. For example, CMS began limiting “pass-through payments” to Medicaid managed care plans in 2016 and will ultimately prohibit such payments by 2027.
We recognize the reimbursement payments due to us from state supplemental payment programs in the periods amounts are estimable and revenue collection is reasonably assured. These amounts are recorded in operating revenues as favorable contractual allowances and the costs we incur under these programs are recorded as other operating expenses.
The following table shows the portion of our Medicaid reimbursements attributable to state supplemental payment programs (in thousands):
| | Year Ended December 31, | |
| | 2017 | | | 2016 | | | 2015 | |
| | | | | | | | | | | | |
Medicaid revenues | | $ | 211,448 | | | $ | 220,389 | | | $ | 211,696 | |
Provider taxes and other expenses | | | 75,388 | | | | 76,616 | | | | 75,929 | |
Reimbursements attributable to state supplemental payment programs, net of expenses | | $ | 136,060 | | | $ | 143,773 | | | $ | 135,767 | |
Reimbursements attributable to state supplemental payment programs related to hospitals that have been divested decreased $1.3 million for the year ended December 31, 2017 compared to the year ended December 31, 2016.
The following table provides a summary of the amounts due from and to attributable to state supplemental payment programs (in thousands):
| | December 31, | |
| | 2017 | | | 2016 | |
| | | | | | | | |
Due from state supplemental payment programs | | $ | 79,819 | | | $ | 92,359 | |
| | | | | | | | |
Due to state supplemental payment programs | | $ | 14,542 | | | $ | 9,171 | |
Several states in which we operate face budgetary challenges that have resulted, and likely will continue to result, in reduced Medicaid funding levels to hospitals and other providers. Continuing pressure on state budgets and other factors could result in future reductions to Medicaid payments, payment delays or additional provider taxes being assessed on hospitals participating in these programs.
The following table shows the portion of our Medicaid reimbursements by state attributable to state supplemental payment programs (in thousands):
| | Year Ended December 31, | |
| | 2017 | | | 2016 | | | 2015 | |
| | | | | | | | | | | | |
Illinois | | $ | 82,152 | | | $ | 80,243 | | | $ | 75,533 | |
California | | | 25,121 | | | | 36,604 | | | | 33,515 | |
Arkansas | | | 6,789 | | | | 6,602 | | | | 7,208 | |
New Mexico | | | 6,403 | | | | 6,926 | | | | 5,691 | |
Texas | | | 4,148 | | | | 2,458 | | | | 1,222 | |
All Other | | | 11,447 | | | | 10,940 | | | | 12,598 | |
Net reimbursements attributable to state supplemental payment programs, net of expenses | | $ | 136,060 | | | $ | 143,773 | | | $ | 135,767 | |
The California Department of Health Care Services implemented the Hospital Quality Assurance Fee (“HQAF”) program, imposing a fee on certain general and acute care California hospitals. Revenues generated from these fees provide funding for the non-federal supplemental payments to California hospitals that serve California’s Medicaid (“Medi-Cal”) and uninsured patients. Under this program we recognized $22.0 million, $34.4 million and $31.5 million of operating revenues, net of provider taxes, for the years ended December 31, 2017, 2016 and 2015, respectively.
Electronic Health Records Incentive Payments
Pursuant to the Health Information Technology for Economic and Clinical Health Act (“HITECH”), MACRA and other laws, HHS has established Medicare and Medicaid incentive programs to encourage hospitals and healthcare professionals to adopt EHR
15
technology. Eligible hospitals can receive Medicaid incentive payments for their adoption and meaningful use of certified EHR technology. These payments are available for a maximum period of five or six years, depending on the program. Eligible hospitals that fail to demonstrate meaningful use of certified EHR technology, and have not applied for a hardship, are subject to payment reductions. Under the OPP, eligible healthcare professionals are also subject to positive or negative payment adjustments based, in part, on their use of EHR technology. EHR incentive payments paid to our hospitals are subject to audit and potential recoupment if it is determined that the applicable meaningful use standards were not met and are also subject to retrospective adjustment because the cost report data upon which the incentive payments are based are further subject to audit.
Although we believe that our hospitals are currently in compliance with the meaningful use standards, there can be no assurance that all of our hospitals will remain in compliance and therefore not be subject to the HITECH penalty provisions. We incur both capital expenditures and operating expenses in connection with the implementation of EHR technology initiatives. The amount and timing of these expenditures does not directly correlate with the timing of the receipt of EHR payments or the recognition of EHR incentives as earned. We record EHR incentives in our statements of income as a reduction to our operating costs and expenses. As we move toward the full implementation of certified EHR technology in accordance with all three phases of the program, our EHR incentives are declining and will ultimately end. For the years ended December 31, 2017, 2016 and 2015, our EHR incentives earned were $4.7 million, $11.5 million and $25.8 million, respectively. Excluding payment adjustments under the OPP, we anticipate that we will earn approximately $1.5 million of EHR incentives in 2018.
TRICARE
TRICARE is the U.S. Department of Defense’s healthcare program for members of the armed forces. Under the TRICARE program, hospitals and other healthcare providers are reimbursed for healthcare services provided to qualifying patients using an inpatient DRG-based payment system and an outpatient prospective payment system similar to those used to make reimbursement payments under the Medicare program.
Reimbursement under Non-Governmental Plans and Programs
Managed Care and Commercial Plans
In addition to governmental healthcare reimbursement programs, we are paid for a portion of the healthcare services we provide to patients by private third-party payors, including commercial health insurance companies, HMOs, PPOs, other managed care companies, workers’ compensation carriers and employers. Patients are generally not responsible for any difference between the standard charges for our services and the contracted payment amounts that we receive from non-government third-party payors, but are responsible for the portions of the payment for services that are not covered by programs or plans under contract. These amounts generally consist of the deductibles and co-payment obligations of their coverage. The deductible and co-payment obligations due from patients, which we include in the self-pay payor category, have increased in recent years in response to the increasing numbers of individuals and employers who purchase insurance plans with high deductibles and high co-payments.
Commercial health insurance companies, HMOs, PPOs and other managed care companies generally attempt to manage their costs by seeking discounted fee structures or fixed fee charge arrangements with providers to reduce their payouts below the provider’s standard charges or the charges initially billed to them. They also utilize other strategies, such as narrowing the provider options in their networks, to restrict the pool of providers that insured patients may utilize under their coverage. Consolidation within the payor industry, including vertical integration efforts involving payors and healthcare providers, and cost-reduction strategies imposed by large employer groups and their affiliates may increase these challenges. To remain competitive, we actively engage in the negotiation of discounts or fixed fee charge arrangements with commercial health insurance and other private managed care companies. The negotiated discounts and fixed fee charge arrangements are typically less than the reductions in reimbursement rates imposed on us by governmental payors. If an increasing number of private third-party payors succeed in negotiating discounted or fixed fee structures with us or if we are unable to negotiate acceptable contractual terms with these payors and therefore do not participate in some or all of the commercial health insurance and managed care networks in our markets, our results of operations or cash flows may be adversely impacted. There can be no assurance that we will retain our existing reimbursement payment arrangements with private third-party payors with whom we currently do business or that these third-party payors will not attempt to further reduce the reimbursement payments they ultimately pay to us for our services in the future.
Under current law, commercial health insurance companies that participate on the Exchanges, which were established pursuant to the Affordable Care Act, are required to offer a set of minimum coverage benefits and a minimum number of levels of plans that vary depending on the percentage of total premium costs to be paid by the insured individual. Our hospitals participate in the provider networks of various insurers offering plan options on the Exchanges. However, in 2017, the president signed an executive order directing agencies to relax limits on certain health plans, potentially permitting the sale of short-term health insurance plans and coverage that does not meet the Affordable Care Act’s minimum requirements. In addition, several insurers have withdrawn from or limited their participation in the Exchanges, which may threaten the long-term viability of those marketplaces.
16
Accountable Care Organizations
With the aim of reducing healthcare costs by improving quality and operational efficiency, ACOs are gaining traction in both the public and private sectors of the U.S. healthcare industry. An ACO is a network of providers, including hospitals, physicians and other designated healthcare-related professionals, which work together to invest in infrastructure and redesign delivery processes to achieve high quality and efficiency in the delivery of healthcare services. ACOs are intended to produce savings as a result of improved quality and operational efficiency initiatives. Pursuant to the Affordable Care Act, HHS established a Medicare Shared Savings Program that seeks to promote accountability through the creation of ACOs. Medicare-approved ACOs that achieve quality performance standards established by HHS are eligible to share in a portion of the amounts saved by the Medicare program. HHS has significant discretion in determining key elements of ACO programs. Certain waivers are available from fraud and abuse laws for ACOs.
Healthcare Reform
Over the last decade, the U.S. Congress and certain state legislatures have passed a large number of laws and regulations intended to result in major changes to the U.S. healthcare system. The most prominent of these reform efforts, the Affordable Care Act, affects how healthcare services are covered, delivered, and reimbursed.
As currently structured, the Affordable Care Act mandates that substantially all U.S. citizens maintain health insurance coverage and expands access to health insurance coverage through a combination of public program expansion and private sector health insurance reforms. However, the future of the Affordable Care Act is uncertain, as the presidential administration and certain members of Congress have stated their intent to repeal or make significant changes to the Affordable Care Act, its implementation or its interpretation. In 2017, Congress eliminated the penalty associated with the individual mandate, effective January 2019, which may impact the number of individuals who elect to purchase health insurance. In addition, a presidential executive order directs agencies to minimize “economic and regulatory burdens” of the Affordable Care Act.
Some provisions of the Affordable Care Act have benefited our business, while others have increased our operating costs and reduced the reimbursement we receive under the Medicare and Medicaid programs. These changes include the requirement that large employers offer health insurance coverage to full-time employees, reductions to the Medicare annual market basket update for federal fiscal years 2010 through 2019, a productivity offset to the Medicare market basket update, and reductions to disproportionate share hospital payments.
It is difficult to predict the full impact of the Affordable Care Act due to a number of factors, including clarifications and modifications resulting from executive orders, the rule-making process, the outcome of court challenges, the development of agency guidance, unknowns related to state Medicaid program expansion and changes within the health insurance industry, the number of individuals who elect to purchase health insurance coverage, and budgetary issues at federal and state levels. The impact on the healthcare industry and timing of any potential repeal of or further changes to the Affordable Care Act and any alternative provisions is unknown. It is difficult to predict the nature and success of future financial or delivery system reforms.
California 2017-2019 Hospital Quality Assurance Fee Program
The HQAF program provides funding for supplemental payments to hospitals that serve Medi-Cal and uninsured patients. Revenues generated from fees assessed on certain general and acute care California hospitals fund the non-federal supplemental payments to California’s safety-net hospitals while drawing down federal matching funds that are issued as supplemental payments to hospitals for care of Medi-Cal patients. In November 2016, California voters approved a state constitutional amendment measure that extends indefinitely the statute that imposes fees on California hospitals seeking federal matching funds.
The fourth phase of the HQAF program expired on December 31, 2016. The California Department of Health Care Services (“DHCS”) submitted the Phase V HQAF program package to CMS on March 30, 2017 for approval of the overall program structure and the fees or provider tax rates for the program period January 1, 2017 through June 30, 2019, and the fee-for-service inpatient and outpatient upper payments limits (“UPL”) for each of the state fiscal years in the period January 1, 2017 through June 30, 2019. CMS issued formal approval of Phase V HQAF on December 15, 2017. The approvals include the inpatient and outpatient fee-for-service supplemental payments and the overall tax structure. The California Hospital Association will work with the DHCS to develop an implementation schedule and update the draft model to reflect the CMS-approved amounts. However, CMS has not yet issued a decision on the managed care components of the Phase V HQAF program and, therefore, the payment amounts in the draft model are preliminary. Furthermore, the supplemental Medi-Cal managed care payments made through the new directed payment mechanism have been estimated using inpatient utilization data publicly reported to the California Office of Statewide Health Planning and Development for the fiscal year ending in 2015. However, in actuality, the directed payments will be made for inpatient and outpatient services provided to in-network patients during the current state fiscal year.
17
According to the California Hospital Association, the rate packages will be submitted to CMS for approval on a state fiscal year basis, with tentative submission dates as follows:
| • | Under the traditional “pass-through” methodology, which represents the historical utilization: |
| - | For the short state fiscal year period January 1, 2017 through June 30, 2017, the package should be submitted by May 15, 2018. |
| - | For the state fiscal year July 1, 2017 through June 30, 2018, the package should be submitted by May 31, 2018. |
| - | For the final state fiscal year in the program period of July 1, 2018 through June 30, 2019, the package should be submitted by October 31, 2018. |
| • | Under the new “directed” payment methodology, which is subject to current utilization; |
| - | For the state fiscal year July 1, 2017 through June 30, 2018, the package should be submitted by May 31, 2018. |
| - | For the final state fiscal year in the program period of July 1, 2018 through June 30, 2019, the package should be submitted by October 31, 2018. |
CMS has indicated that going forward it will only approve one fiscal year at a time for the UPL amounts using data that is no older than two years. Of the total supplemental payments received by all hospitals, our portion represents 0.50%. We are estimating that our net impact over the 30 month period will be $56.8 million. While uncertainties regarding the timing and amount of payment under the HQAF program exist, our estimates of cash collections at this time, including previous programs, will be $38.5 million in 2018, $20.0 million in 2019 and $13.3 million in 2020. On October 16, 2017, we received $30.9 million in cash for the 2015-2016 fiscal year program period.
Illinois 2018 Hospital Assessment Program Redesign
The Illinois Hospital Assessment program provides funding for supplemental payments to hospitals that serve Medicaid and uninsured patients. Revenues generated from fees assessed on certain general and acute care Illinois hospitals draw down federal matching funds that are issued as supplemental payments to hospitals for care of Medicaid patients. The existing program is set to expire on June 30, 2018. State legislation is currently being proposed to authorize a similar but modified program with an effective date of July 1, 2018. The “new” program must be approved by CMS. The “new” program is being redesigned to meet certain CMS requirements which have been expressed in the past and are believed to be critical for CMS approval going forward. CMS has communicated that future program approvals must include updated base year data and require more funds to be paid through claims rather than supplemental monthly or quarterly lump sum payments.
| • | Updated Base year data - The current program uses base rate data from 2005. The “new” program will use base rate data from 2015. |
| • | More funds to be paid through claims – The “new” program would require a greater percentage of funds to hospitals to be delivered at the paid claims level rather than through lump sum payments. |
According to the hospital association, the total funding available to all hospitals in the new program will approximate the old program. There will, however, be “winners” and “losers” based on updated base year data and changes designed to allocate funding toward hospitals with safety net status or higher levels of Medicaid utilization. The most recent models provided by the hospital association show our hospital payments being reduced by $7.7 million annually.
Other Government Laws and Regulations
Licensure, Certifications and Accreditations
Hospitals and other healthcare providers are subject to laws and regulations regarding licensing, certification or accreditation, and may be subject to periodic inspection by federal, state and local governmental agencies evaluating compliance and performance with such requirements. In addition, healthcare providers participating in the Medicare and Medicaid programs are subject to extensive regulatory requirements in order to continue to qualify for participation in these programs.
Regulations imposed on healthcare facilities for licensure, certification and accreditation address compliance areas such as the following:
| • | the adequacy of medical care, equipment and staff; |
| • | operating policies and procedures; |
| • | billing and coding for services, including classifying the acuity level of care provided; |
| • | proper handling of reimbursement overpayments; |
| • | preparing and filing of Medicare and Medicaid annual cost reports; |
18
| • | relationships between referral sources and recipients; |
| • | maintaining adequate compliance records; |
| • | utilization reviews of services provided at our facilities; |
| • | standard charges for patient services; |
| • | compliance with building codes; |
| • | environmental protection; and |
| • | patient privacy and security. |
Failure to comply with applicable licensure, certification, and accreditation standards may result in criminal penalties, civil sanctions, loss of operating licenses, or restrictions on our ability to participate in certain government programs. All of our hospitals and other healthcare facilities are currently licensed under appropriate state laws and are qualified to participate in both federal and state Medicare and Medicaid programs.
Fraud and Abuse Provisions
Federal and state governments have enacted various laws intended to prevent and reduce healthcare fraud and abuse, which continue to be a top enforcement priority. Violations of these laws may result in criminal or civil penalties, including exclusion from the Medicare and Medicaid programs. Civil monetary penalties are updated annually based on changes to the consumer price index and were recently increased under the Bipartisan Budget Act of 2018.
Federal False Claims Act
The federal False Claims Act (“FCA”) prohibits knowingly making false claims or statements to the U.S. government, including submitting false claims for reimbursement under government programs. The FCA broadly defines the term “knowingly.” Although simple negligence does not give rise to liability under the FCA, submitting a claim with reckless disregard to its truth or falsity may constitute “knowingly” submitting a false claim and result in liability. The FCA can be used to prosecute fraud involving issues such as coding errors, billing for services not provided, and submitting false cost reports. Its reach extends to payments involving federal funds in connection with the Exchanges created under the Affordable Care Act. Violations of other statutes, such as the Stark Law, can serve as a basis for liability under the FCA.
Among the potential bases for liability under the FCA are knowingly and improperly avoiding repayment of an overpayment received from the government and knowingly failing to report and return an overpayment within 60 days of identifying the overpayment or by the date a corresponding annual cost report is due, whichever is later. Overpayments are deemed to have been “identified” when a provider has, or should have, through reasonable diligence determined that a reimbursement overpayment was received and quantified such overpayment.
A provider that is determined to be liable under the FCA is required to pay three times the actual damages sustained by the federal government, plus a substantial mandatory civil penalty for each separate false claim. These penalties will be updated annually based on changes to the consumer price index. Settlements entered into prior to litigation usually involve a less severe calculation of damages. The FCA also contains “qui tam” or whistleblower provisions, which allow private individuals to file a complaint or otherwise report actions alleging the defrauding of the federal government by a provider. If the federal government intervenes, the individual that filed the initial complaint may share in any settlement or judgment. If the federal government does not intervene in the action, the whistleblower plaintiff may pursue its allegation independently and may receive a larger share of any settlement or judgment. When a private individual brings a qui tam action under the FCA, the defendant generally is not made aware of the lawsuit until the federal government commences its own investigation or determines whether it will intervene.
Any provider that receives at least $5 million annually in Medicaid reimbursement payments is required to distribute and make available to all employees, contractors and any other agents detailed information about its policies related to false claims, false statements and whistleblower protection under certain federal laws, including the FCA, and similar state laws.
Federal Anti-Kickback Statute
The Federal Anti-Kickback Statute (“Anti-Kickback Statute”), a subsection of the Social Security Act, makes it a felony to knowingly and willfully offer, pay, solicit, or receive remuneration, directly or indirectly, in order to induce patient referrals or business that is reimbursable under any federal healthcare program. Violations under the Anti-Kickback Statute may result in exclusion from federal healthcare programs and the imposing of criminal and civil fines, including the payment of damages up to three times the total dollar amount involved. The civil monetary penalties are updated annually based on changes to the consumer price index. Further, submission of a claim for services or items generated in violation of the Anti-Kickback Statute constitutes a false claim under the FCA.
The HHS Office of Inspector General (“OIG”) is responsible for identifying and investigating fraud and abuse activities in federal healthcare programs. As part of its duties, the OIG provides guidance to healthcare providers by identifying types of activities that could violate the Anti-Kickback Statute. The OIG has published regulations that set forth “safe harbors” protecting certain payment
19
and business practices, outlining activities and business relationships that are deemed not to violate the Anti-Kickback Statute. The failure of a particular activity to comply with the safe harbor regulations does not necessarily mean that the activity violates the Anti-Kickback Statute; however, such failure may lead to increased scrutiny by the OIG or other governmental enforcement agencies.
The OIG has identified the following incentive arrangements as potential violations of the Anti-Kickback Statute:
| • | payment of any incentive by a hospital to a physician when the physician makes a patient referral to the hospital or to a healthcare facility that benefits the hospital; |
| • | provision of free or significantly discounted office space or equipment to physicians to entice them to locate in close proximity to the hospital; |
| • | provision of free or significantly discounted billing, nursing or other medical and administrative staffing services; |
| • | provision of free training for a physician or a physician’s medical and office staff, including management and laboratory training, but excluding compliance training; |
| • | provision of guarantees that provide that if a physician’s income falls below a predetermined level, the hospital will pay the remainder to them; |
| • | provision of low-interest or interest-free loans, or loans that may be forgiven if a physician refers patients to the hospital; |
| • | payment of the costs of a physician’s travel and expenses for conferences; |
| • | payment for services to a physician, in which such services require few, if any, substantive duties to be performed by the physician or that are in excess of the fair market value of the services rendered; |
| • | coverage of a physician on the hospital’s group health insurance plan at an inappropriately low cost to the physician; |
| • | purchases from a physician made by a hospital for goods and services at prices in excess of their fair market value; |
| • | rental of space in physician offices at prices below fair market value; or |
| • | engaging in relationships with physician-owned entities, often referred to as physician-owned distributorships (“PODs”), which derive revenues from the sale or arrangement for sale of implantable medical devices whereby the physician orders such medical devices and then uses them for their own patients in surgeries or procedures performed at the hospital or other outpatient service facility. |
We have a variety of financial arrangements with physicians who refer patients to our hospitals. Physicians own interests in some of our facilities. Physicians may also own our stock. We have contracts with physicians providing for a variety of financial arrangements, including employment contracts, leases, management agreements and professional service agreements. We provide financial incentives to recruit physicians to relocate to communities served by our hospitals. These incentives include relocation packages, reimbursement for certain direct expenses, income guarantees and, in some cases, loans. Although we strive to comply with the Anti-Kickback Statute, taking into account available guidance from the OIG including the “safe harbor” regulations, we cannot make assurances that the OIG or other regulatory agencies may not determine that our actions are in violation. If that happens, we could be subject to criminal and civil penalties or may become excluded from eligibility to participate in Medicare, Medicaid, or other government healthcare programs.
The Stark Law
The Social Security Act also includes a provision commonly known as the “Stark Law.” This law prohibits physicians from referring Medicare and Medicaid patients to healthcare entities in which they or any of their immediate family members have ownership interests or other financial arrangements if the entity provides certain “designated health services.” These types of referrals are commonly known as “self-referrals.” The Stark Law also prohibits entities that provide designated health services reimbursable by Medicare or Medicaid from billing these programs for any items or services that result from a prohibited referral and requires the entities to refund amounts received for items or services provided pursuant to the prohibited referral. “Designated health services” include inpatient and outpatient hospital services.
Sanctions for violating the Stark Law include denial of reimbursement payments under federal healthcare programs, substantial civil monetary penalties and exclusion from participation in federal healthcare programs. In addition, the Stark Law provides for a penalty of up to $161,692 for engaging in activities intended to circumvent the Stark Law prohibitions. These civil monetary penalties are updated annually based on changes to the consumer price index.
There are ownership and compensation arrangement exceptions to the self-referral prohibitions under the Stark Law. For example, one exception allows a physician to refer patients to a healthcare entity in which the physician has an ownership interest if such entity is located in a rural area, as defined under the Stark Law. There are also exceptions for many of the customary financial arrangements between physicians and healthcare entities, including employment contracts, leases and recruitment agreements. From time to time, the federal government has issued regulations that interpret the provisions included in the Stark Law.
20
Another Stark Law exception, known as the “whole hospital” exception, allows a physician to make a referral to a hospital if the physician owns an interest in the entire hospital, as opposed to an ownership interest in a department of the hospital. A hospital is considered to be physician-owned if any physician, or an immediate family member of a physician, holds stock, debt or other types of investment arrangements in the hospital or in any owner of the hospital, excluding physician ownership through publicly traded securities that meet certain conditions. CMS regulations impose various restrictions and disclosure requirements on physician-owned hospitals. Physician-owned hospitals must disclose their physician ownership in writing to patients and must make a list of their physician owners available upon request to the public. Each physician owner who is a member of a physician-owned hospital’s medical staff must agree, as a condition of their inclusion on the medical staff and their admitting privileges at the hospital, to disclose in writing to all patients whom they refer to the hospital their ownership interest, or an immediate family members’ ownership interest, in the hospital. Failure to comply with the physician-ownership regulations may result in the hospital’s loss of eligibility to participate in the Medicare program.
The Affordable Care Act narrowed the “whole hospital” exception to the Stark Law. Although existing physician investments in a whole hospital may continue under a “grandfather” clause if the arrangement satisfies certain requirements and restrictions, physicians are prohibited, from the time the Affordable Care Act became effective, from increasing the aggregate percentage of their ownership in the hospital. In addition, the Affordable Care Act restricts the ability of existing physician-owned hospitals to expand the capacity of their aggregate licensed beds, operating rooms and procedure rooms.
Other Fraud and Abuse Laws
Under various federal laws and regulations, any individual or entity that knowingly and willfully defrauds or attempts to defraud a healthcare benefit program, including both governmental and private healthcare programs and plans, may be subject to fines, imprisonment or both. The Civil Monetary Penalties Law (“CMP Law”) imposes substantial civil penalties on providers that, for example, knowingly present or cause to be presented a claim for services not provided as claimed, offer remuneration to influence a Medicare or Medicaid beneficiary’s selection of a healthcare provider, or bill Medicare amounts that are substantially in excess of a provider’s usual charges. Notably, the CMP Law requires a lower burden of proof than some other fraud and abuse laws. Criminal and civil penalties may be imposed for a number of other prohibited activities, including engaging in certain gainsharing arrangements or contracting with an individual or entity known to be excluded from a federal healthcare program.
Federal enforcement officials have the ability to exclude from federal healthcare programs any investors, officers, and managing employees associated with business entities that have committed healthcare fraud, even if those individuals had no knowledge of the fraud.
State Laws
A number of states, including states in which we operate hospitals, have adopted their own false claims provisions as well as their own whistleblower provisions whereby a private individual or entity may file a civil lawsuit in a state court. Federal laws provide an incentive to states to enact false claims laws at the state level that are comparable to the FCA.
In addition, many states in which we operate have adopted laws similar to the Anti-Kickback Statute that prohibit payments to physicians in exchange for referrals. Many states have also passed self-referral legislation similar to the Stark Law, prohibiting the referral of patients to entities with which the physician has a financial relationship. Often these state laws are broad in scope and may apply regardless of the source of payor for the healthcare services provided. These statutes at the state level typically include criminal and civil penalties, as well as loss of licensure, for violations. There is little precedent for the interpretation or enforcement of these state laws.
Program Integrity
CMS contracts with third parties to promote the integrity of the Medicare program through review of quality concerns and detection efforts to identify improper reimbursement payments. Most non-governmental managed care programs require similar utilization reviews. Quality Improvement Organizations (“QIOs”), for example, are groups of physicians and other healthcare quality experts that work on behalf of CMS to ensure that Medicare pays only for the delivery of healthcare goods and services to Medicare beneficiaries that are considered reasonable and necessary courses of treatment and that are provided in the most appropriate setting. Among other responsibilities, QIOs are tasked with conducting short stay inpatient hospital reviews to evaluate compliance with the two midnight rule. Providers that exhibit persistent noncompliance with Medicare payment policies may be referred by a QIO to a Recovery Audit Contractor.
Under the Recovery Audit Contractor (“RAC”) program, CMS contracts with third parties nationwide to conduct post-payment reviews to detect and correct improper payments in the Medicare program, as required by statute. RACs review claims submitted to Medicare for billing compliance, including correct coding and medical necessity. Compensation for RACs is on a contingency basis, based upon the amount of overpayments and underpayments identified, if any. CMS recently reduced the number of claims that RACs may audit by limiting the number of records that RACs may request from hospitals based on each provider’s claim denial rate for the previous year.
21
The RAC program’s scope also includes Medicaid claims. States may coordinate with Medicaid RACs regarding recoupment of overpayments and refer suspected fraud and abuse to appropriate law enforcement agencies. Under the Medicaid Integrity Program, CMS employs private contractors, referred to as Medicaid Integrity Contractors (“MICs”) to perform reviews and post-payment audits of Medicaid claims to identify potential overpayments. MICs are assigned to five geographic jurisdictions within the United States. Besides MICs, other approved contractors and state Medicaid agencies have increased their review activities of Medicaid payments.
We maintain policies and procedures to respond to RAC requests and payment denials. Payment recoveries resulting from RAC reviews and denials are appealable, and we pursue reversal of adverse determinations at appropriate appeal levels. Depending upon the growth of RAC programs and our success in appealing claims, our results of operations and cash flows could be negatively impacted. Currently, there are significant delays in the assignment of new Medicare appeals to Administrative Law Judges. According to the Office of Medicare Hearings and Appeals, the average processing time in fiscal year 2017 was approximately three years. To ease the backlog of appeals, CMS has announced two new settlement initiatives.
Annual Cost Reports
Hospitals participating in the Medicare, Medicaid and TRICARE programs are required to meet specified financial reporting requirements. Federal and, where applicable, state regulations require submission of annual cost reports identifying medical costs and expenses associated with the services provided by each hospital to Medicare beneficiaries and Medicaid recipients.
Annual cost reports required under the Medicare and some Medicaid programs are subject to routine governmental audits. These audits may result in adjustments to the amounts ultimately determined to be due to us under these reimbursement programs. Finalization of these audits often takes several years. Providers can appeal any final determination made in connection with an audit. MS-DRG outlier payments have been and continue to be a subject of CMS audit and adjustment. The OIG is also actively engaged in audits and investigations into alleged abuses of the MS-DRG outlier payment system. For the years ended December 31, 2017, 2016 and 2015, we recorded net favorable (unfavorable) contractual allowance adjustments in net operating revenues of $2.0 million, $(5.8) million and $(15.1) million, respectively, related to previous program reimbursement estimates and final cost report settlements. The 2015 amounts were impacted by an $11.1 million Illinois cost report settlement which was recorded as a favorable adjustment in 2014 and an unfavorable adjustment in 2015 upon its reversal in the second quarter due to contract negotiations that were finalized in that quarter.
HIPAA Administrative Simplification and Privacy and Security Requirements
The Health Insurance Portability and Accountability Act of 1996 (“HIPAA”) Administrative Simplification provisions and their implementing regulations require the use of uniform electronic data transmission standards and code sets for certain healthcare claims and transactions submitted or received electronically. These provisions are intended to encourage electronic commerce in the U.S. healthcare industry. HHS is in the process of adopting standards for additional electronic transactions and establishing operating rules to promote uniformity in the implementation of each standardized electronic transaction.
HIPAA, as amended by the HITECH Act, and implementing regulations extensively regulate the use, disclosure, confidentiality, availability and integrity of individually identifiable health information, known as “protected health information,” and provide for a number of individual rights with respect to such information. These requirements apply to health plans and most health care providers, which are known as “covered entities.” Vendors, known as “business associates,” that handle protected health information, on behalf of covered entities must also comply with most HIPAA requirements. A covered entity may be subject to penalties as a result of a business associate violating HIPAA, if the business associate is found to be an agent of the covered entity. In order to comply with HIPAA, covered entities must, among other things, maintain privacy and security policies, train workforce members, maintain physical, administrative, and technical safeguards, enter into confidentiality agreements with business associates, and permit individuals to access and amend their protected health information. In addition, covered entities must report breaches of unsecured (unencrypted) protected health information to affected individuals without unreasonable delay, but not to exceed 60 calendar days from the discovery date of the breach. Notification must also be made to HHS and, in certain cases involving large breaches, to the media. HHS is required to report on its website a list of all covered entities that report a breach involving more than 500 individuals. All non-permitted uses or disclosures are presumed to be breaches unless the covered entity or business associate can demonstrate that there is a low probability that the information has been compromised.
HIPAA violations may result in criminal penalties and substantial civil penalties per violation. These civil penalties are subject to annual updates to reflect changes to the consumer price index. State attorneys general are authorized to bring civil actions seeking either injunction or damages up to $25,000 for violations of the same requirement in a calendar year in response to HIPAA violations that affect their state residents. HHS has the discretion in many cases to resolve HIPAA violations through informal means without the imposition of penalties. However, HHS is required to impose penalties for violations resulting from willful neglect and can and has imposed significant penalties. HHS also conducts compliance audits, which could lead to further compliance reviews or to enforcement actions.
Our healthcare facilities continue to remain subject to other applicable federal or state laws that are more restrictive than the HIPAA privacy and security regulations, which could result in additional penalties. For example, the Federal Trade Commission uses its consumer protection authority to initiate enforcement actions against entities whose inadequate data security programs may expose
22
consumers to fraud, identity theft and privacy intrusions, including the security programs of entities subject to HIPAA regulation. Various state laws and regulations require entities that maintain individually identifiable information (even if not health-related) to report data breaches to affected individuals and, in some cases, state regulators. In connection with our corporate compliance program, we have implemented a comprehensive set of privacy and security policies and procedures. We expect compliance with HIPAA and other privacy and security standards to continue to impose significant costs on our hospitals and operations.
State Certificate of Need Laws
In some states where we operate hospitals and outpatient service facilities, the construction or expansion of healthcare facilities, the acquisition of healthcare facilities, the transfer or change of ownership related to healthcare facilities and the addition of new licensed beds or healthcare service lines at healthcare facilities may be subject to review, prior approval or notification with a state regulatory agency under a certificate of need (“CON”) program. Such laws are generally in place for the reviewing state regulatory agency to determine the public need for additional or expanded healthcare facilities and services in a specific market. As of December 31, 2017, we operated 23 hospitals in 10 states that have adopted CON programs. See “Item 2. Properties” for a table that denotes the states where we operate hospitals in which CON programs are present. The failure to provide required notification and obtain necessary approval in states having a CON program can result in the inability to expand, acquire or change ownership related to healthcare facilities in a particular market. Violations of these state laws may result in the imposition of civil sanctions or the revocation of a hospital’s licenses.
Not-for-Profit Hospital Conversion Legislation
Many states, including some where we have hospitals and others where we may in the future acquire hospitals, have adopted legislation regarding the sale or other disposition of hospitals operated by not-for-profit entities. In other states that do not have specific legislation, the attorneys general have demonstrated an interest in these transactions under their general obligations to protect charitable assets from waste. These legislative and administrative efforts primarily focus on the appropriate valuation of the assets divested and the use of the proceeds from the sale by the not-for-profit seller. These reviews and, in some instances, approval processes can add additional time to the closing of a hospital acquisition. There can be no assurance that future actions at a state level will not seriously delay or even prevent our ability to acquire not-for-profit hospitals. If these activities are widespread, they could limit our ability to acquire hospitals in general.
Corporate Practice of Medicine and Fee-Splitting
Some states have adopted laws that prohibit unlicensed individuals or business entities from employing physicians. Some states also have adopted laws that prohibit unlicensed individuals or business entities from making direct or indirect payments to physicians or that prohibit these parties from engaging in fee-splitting arrangements. Physicians that violate these laws are subject to sanctions, including loss of licensure, civil and criminal penalties and rescission of business arrangements. Laws, such as these, vary from state to state, are often vague and have seldom been interpreted by the courts or state regulatory agencies. We structure our arrangements with employed physicians to comply with the state laws where we operate. We can give no assurance that governmental agencies responsible for enforcing these laws will not assert that we are in violation of these laws. These laws could also be interpreted by the courts in a manner inconsistent with our interpretations. See “—Employees and Medical Staff — Physicians” below for additional information on our employed physicians.
Emergency Medical Treatment and Active Labor Act
All of our hospitals are subject to the Emergency Medical Treatment and Active Labor Act (“EMTALA”). This federal law requires any hospital that participates in the Medicare program to conduct an appropriate medical screening examination of every individual that enters the hospital’s emergency department seeking treatment and, if the patient is suffering from an emergency medical condition, including active labor, requires the hospital to either stabilize the patient’s condition or make an appropriate transfer of the patient to another healthcare facility that can handle the condition. The obligation of the hospital to examine and stabilize emergency medical conditions or otherwise make an appropriate transfer of the patient to another suitable healthcare facility exists regardless of a patient’s ability to pay for treatment. Outpatient service facilities that lack emergency departments or otherwise do not treat emergency medical conditions are not generally subject to EMTALA; however, they are required to have policies and procedures that address the handling of situations in which an individual presents at their facility seeking emergency medical treatment, such as transferring the patient to the closest hospital with an emergency department. There are severe penalties under EMTALA if a hospital fails to screen or appropriately stabilize or transfer a patient or if the hospital delays appropriate treatment in order to first inquire about the patient’s ability to pay, including exclusion from participation in the Medicare program and civil monetary penalties. These penalties are updated annually based on changes to the consumer price index. In addition to these penalties, a harmed patient, the patient’s family or a medical facility that suffers a financial loss as a direct result of another participating hospital’s violation of the law can bring a civil lawsuit against that other hospital.
Medical Malpractice Tort Law Reform
Laws related to medical malpractice liability have historically been maintained at the state level. All states have laws governing medical malpractice liability lawsuits. Almost all states have eliminated joint and several liability in medical malpractice lawsuits and many states have established caps on the damage awards or attorney fees permissible in such lawsuits. Recently, many states have
23
introduced legislation to address medical malpractice tort reform. Proposed solutions include enacting limits on non-economic damages, malpractice insurance reform and gathering lawsuit claims data from malpractice insurance companies and the courts for the purpose of assessing the connection between malpractice settlements and premium rates. Medical malpractice reform legislation has also been proposed, but not adopted, at the federal level that could preempt additional state legislation in this area.
Environmental Regulation
Our hospitals and outpatient service facilities are subject to various federal, state and local laws and regulations governing the use, discharge and disposal of hazardous materials, including medical and pharmaceutical waste products. Our compliance costs related to environmental laws are not significant and we do not anticipate that these costs will become material to us in the future.
Supply Contracts
We purchase medical supplies, equipment, pharmaceuticals and certain other items under an agreement with a group purchasing organization (“GPO”) that covers all of our hospitals and their affiliated outpatient service facilities. By participating in a group purchasing organization, we believe that we can procure items at more competitively priced rates than we would pay for similar items without such agreement. In addition, we provide a service opportunity to our QHR hospital clients to contract with us for purchases that we make on their behalf under the terms of our agreement with this group purchasing organization.
Agreements with CHS Related to the Spin-off
In connection with the Spin-off and effective as of the Spin-off date, we entered into certain agreements with CHS that at the time of Spin-off governed the allocation to us of various assets, employees, liabilities and obligations (including investments, property, employee benefits and tax-related assets and liabilities) that were previously part of CHS. In addition, these agreements govern certain relationships and activities between us and CHS for a definitive period of time after the Spin-off date, as specified by each individual agreement.
A summary of these agreements follows:
| • | Separation and Distribution Agreement. This agreement governed the principal actions of both QHC and CHS that needed to be taken to effect the Spin-off. It sets forth other agreements that govern certain aspects of our relationship with CHS following the Spin-off. |
| • | Tax Matters Agreement. This agreement governs respective rights, responsibilities and obligations of QHC and CHS after the Spin-off with respect to deferred tax liabilities and benefits, tax attributes, tax contests and other tax sharing regarding U.S. federal, state and local income taxes, other tax matters and related tax returns. |
| • | Employee Matters Agreement. This agreement governs certain compensation and employee benefit obligations with respect to the employees and non-employee directors of QHC and CHS. It also allocated liabilities and responsibilities relating to employment matters, employee compensation, employee benefit plans and other related matters as of the Spin-off date. |
In addition to the agreements referenced above, we entered into certain transition services agreements and other ancillary agreements with CHS defining agreed upon services, as specified by each agreement, to be provided by CHS to us commencing on the Spin-off date. The agreements generally have terms of five years.
A summary of the major transition services agreements follows:
| • | Shared Services Centers Transition Services Agreement. This agreement defines services to be provided by CHS related to billing and collections utilizing CHS shared services centers. Services include, but are not limited to, billing and receivables management, statement processing, denials management, cash posting, patient customer service, and credit balance and other account research. In addition, it provides for patient pre-arrival services, including pre-registration, insurance verification, scheduling and charge estimates. Fees are based on a percentage of cash collections each month. |
| • | Computer and Data Processing Transition Services Agreement. This agreement defines services to be provided by CHS for information technology infrastructure, support and maintenance. Services include, but are not limited to, operational support for various applications, oversight, maintenance and information technology support services, such as helpdesk, product support, network monitoring, data center operations, service ticket management and vendor relations. Fees are based on both a fixed charge for labor costs, as well as direct charges for all third-party vendor contracts entered into by CHS on QHC’s behalf. |
| • | Receivables Collection Agreement (“PASI”). This agreement defines services to be provided by CHS’ wholly-owned subsidiary, PASI, which currently serves as a third-party collection agency to us related to accounts receivable collections of both active and bad debt accounts of QHC hospitals, including both receivables that existed as of the Spin-off date and those that have occurred during the operating period since the Spin-off date. Services include, but are not limited to, self-pay collections, insurance follow-up, collection letters and calls, payment arrangements, payment posting, |
24
| | dispute resolution and credit balance research. Fees are based on the type of service and are calculated based on a percentage of recoveries. |
| • | Billing and Collection Agreement (“PPSI”). This agreement defines services to be provided by CHS related to collections of certain accounts receivable generated from our outpatient healthcare services, predominately physician clinics. Services include, but are not limited to, self-pay collections, insurance follow-up, collection letters and calls, payment arrangements, payment posting, dispute resolution and credit balance research. Fees are based on the type of service and are calculated based on a percentage of recoveries. |
| • | Employee Service Center Agreement. This agreement defines services to be provided by CHS related to payroll processing and human resources information systems (“HRIS”) support. Fees are based on a fixed charge per employee headcount per month. |
| • | Eligibility Screening Services Agreement. This agreement defines services to be provided by CHS for financial and program criteria screening related to Medicaid or other program eligibility for pure self-pay patients. Fees are based on a fixed charge for each hospital receiving services. |
We recorded total expenses under transition services agreements with CHS following the Spin-off combined with the allocations from CHS for these same services prior to the Spin-off of $63.5 million, $66.4 million and $60.2 million for the years ended December 31, 2017, 2016, and 2015, respectively. We are disputing in arbitration, among other issues and actions, certain charges and lack of performance of various obligations under the transition services agreements with CHS. For additional information, see “Item 3. Legal Proceedings.”
Compliance Program
We recognize that our compliance with laws and regulations impacting our business depends on individual employee actions as well as company-wide operations. We adopted a compliance program following the Spin-off for our entire business (the “Compliance Program”). Our Compliance Program focuses on aligning compliance responsibilities with operational functions and is intended to reinforce our company-wide commitment to operate strictly in accordance with the laws and regulations that govern our business. Our hospital and corporate office management teams manage and oversee compliance among the employees within our hospitals and outpatient services facilities, QHR and all other departments within our company.
Our Compliance Program contains the following requirements, among others:
| • | oversight of management at all levels; |
| • | a written code of conduct (the “Code of Conduct”); |
| • | policies and procedures that address specific risk areas; |
| • | employee education and training programs; |
| • | an internal system available to employees and affiliates to report concerns; |
| • | auditing and monitoring programs; and |
| • | policies related to the enforcement of the Compliance Program. |
In addition to the above, our Compliance Program includes policies and procedures related to the interpretation and implementation of the HIPAA standards for privacy and security. It also includes procedures specific to claims preparation and submission, including procedures for coding, billing and annual cost reports. It addresses policies related to financial arrangements with physicians and other referral sources, compliance with the FCA, the Anti-Kickback Statute and the Stark Law. The program includes policies specific to our compliance with EMTALA related to the treatment of hospital emergency room patients regardless of their ability to pay. We plan to continuously review our Compliance Program and to make necessary updates or changes to be compliant with new laws and regulations or industry standards impacting our business.
Our written Code of Conduct applies to all persons and businesses associated with our company, including directors, officers, employees and consultants. We have a confidential disclosure program to enhance the statement of ethical responsibility expected of our employees and all business associates with whom we work, including our accounting, financial reporting and asset management departments. Our Code of Conduct is posted on our website at www.quorumhealth.com.
Corporate Integrity Agreement
On August 4, 2014, CHS became subject to the terms of a five-year Corporate Integrity Agreement (“CIA”) with the OIG arising from a civil settlement with the U.S. Department of Justice, other federal agencies and identified relators that concluded previously announced investigations and litigation related to short stay admissions through emergency departments at certain of their affiliated hospitals. The OIG has required us to be bound by the terms of the CHS CIA commencing on the Spin-off date and applying to us for the remainder of the five-year compliance term required of CHS, which terminates on August 4, 2019.
25
The compliance measures and the reporting and auditing requirements contained in the CIA include:
| • | continuing the duties and activities of the Corporate Compliance Officer, Corporate Compliance Work Group, and Facility Compliance Officers and committees; |
| • | maintaining a written Code of Conduct, which sets forth our commitment to full compliance with all statutes, regulations, and guidelines applicable to federal healthcare programs; |
| • | maintaining written policies and procedures addressing matters included in our Compliance Program, including adherence to medical necessity and admissions standards for inpatient hospital stays; |
| • | continuing general compliance training; |
| • | providing specific training for employees and affiliates handling our billing, case management and clinical documentation; |
| • | engaging an independent third party to perform an annual review of our compliance with the CIA; |
| • | continuing the Confidential Disclosure Program and hotline to enable employees or others to disclose issues or questions regarding possible inappropriate policies or behavior; |
| • | continuing the screening program to ensure that we do not hire or engage employees or contractors who are ineligible persons for federal healthcare programs; |
| • | reporting any material deficiency which resulted in an overpayment to us by a federal healthcare program; and |
| • | submitting annual reports to the OIG which describe in detail the operations of the corporate Compliance Program. |
A material, uncorrected violation of the CIA could lead to our suspension or disbarment from participation in Medicare, Medicaid and other federal and state healthcare programs. In addition, we are subject to possible civil penalties if we fail to substantially comply with the terms of the CIA, including stipulated penalties ranging from $1,000 to $2,500 per day. We are also subject to a stipulated penalty of $50,000 for each false certification by us or any individual or entity on behalf of us in connection with reports required under the CIA. The CIA increases the amount of information we are required to provide to the federal government regarding our healthcare practices and our compliance with federal regulations. We believe that we are currently operating our business in compliance with the CIA and are unaware of any historical actions on our part that could represent a violation under the terms of the CIA.
Insurance Reserves
Workers’ Compensation and Professional and General Liability Insurance Reserve
As part of the business of owning and operating hospitals, we are subject to legal actions alleging liability on our part. To mitigate a portion of this risk, we maintain insurance exceeding a self-insured retention level for these types of claims. Our self-insurance reserves reflect the current estimate of all outstanding losses, including incurred but not reported losses, based on actuarial calculations as of period end. The loss estimates included in the actuarial calculations may change in the future due to updated facts and circumstances. Insurance expense in the statements of income includes the actuarially determined estimates for losses in the current year, including claims incurred but not reported, the changes in estimates for losses in prior years based on actual claims development experience as compared to prior actuarial projections, the insurance premiums for losses related to policies obtained to cover amounts in excess of our self-insured retention levels, the administrative costs of the insurance programs, and interest expense related to the discounted portions of these liabilities. Our reserves for workers’ compensation and professional and general liability claims are based on semi-annual actuarial calculations, which are discounted to present value and consider historical claims data, demographic factors, severity factors and other actuarial assumptions. The liabilities for self-insured claims are discounted based on our risk-free interest rate that corresponds to the period when the self-insured claims are incurred and projected to be paid.
A portion of our reserves for workers’ compensation and professional and general liability claims included on our balance sheets relates to incurred but not reported claims prior to the Spin-off. These claims were fully indemnified by CHS under the terms of the Separation and Distribution Agreement. As a result, we have a corresponding receivable from CHS related to these claims on our balance sheets. For the years ended December 31, 2017 and 2016, we had total liabilities of $126.1 million and $116.0 million related to insurance for professional and general liabilities and workers’ compensation liability, respectively, of which $83.4 million and $98.1 million, respectively, were the indemnified portions for which we have offsetting receivables from CHS.
Under our current insurance arrangements, our self-insured retention level for professional and general liability claims is $5 million per claim. Additionally, we maintain a $0.5 million per claim, high deductible program for workers’ compensation. We maintain a separate insurance arrangement for professional and general liability related to QHR, due to the differing nature of this business. The self-insured retention level for QHR is $6 million for professional and general liability insurance.
26
Employee Health Benefits
We are self-insured for substantially all of the medical benefits of our employees. We maintain a liability for our current estimate of incurred but not reported employee health claims based on historical claims data provided by third-party administrators. The undiscounted reserve for self-insured employee health benefits was $8.8 million and $11.0 million as of December 31, 2017 and 2016, respectively. Expense each period is based on the actual claims received during the period plus any adjustment to the liability for incurred but not reported employee health claims.
There can be no assurance that our future cash flows will be adequate to cover the self-insured portion of professional and general liability, workers’ compensation and medical claims in the future. If we are required to make payments for claims that exceed the estimated losses we have reserved, our results of operations, financial condition and cash flows could be adversely impacted in the future.
Employees and Medical Staff
Employees
As of December 31, 2017, we had approximately 13,000 employees, including approximately 3,500 part-time employees. We are subject to various federal and state laws that regulate wages, hours, benefits and other terms and conditions relating to employment. We maintain a number of different employee benefit plans.
Physicians
Our hospitals are staffed by licensed physicians, including both employed physicians and physicians who are not employees of our hospitals. Our ability to generate revenues from our hospital operations business is impacted by the number, quality and specialty area of practice of physicians providing healthcare services at our facilities, and additionally the scheduling and admitting of patients by these physicians. As of December 31, 2017, we had approximately 329 employed physicians at our hospitals and affiliated outpatient service facilities. Some physicians provide services in our healthcare facilities pursuant to a contract with us. These contracts generally describe the types of healthcare services that the physician is contracted to perform, establish the duties and obligations of the physician, require certain performance criteria be met by the physician and fix the compensation arrangements for the services performed by the physician. Any licensed physician may apply to be accepted to the medical staff of any of our hospitals, but the hospital’s medical staff and the board of directors of the hospital, in accordance with established credentialing criteria, must approve the physician’s acceptance to the medical staff. Members of the medical staffs of our hospitals often also serve on the medical staffs of other hospitals that we do not own and may terminate their affiliation with one of our hospitals at any time. It is essential to our hospital operations business that we attract an appropriate number of quality physicians in the specialty care service areas required to support our hospital operations business and that we maintain good relationships with our physicians. In some of our markets, physician recruitment and retention are affected by a shortage of physicians in certain desired specialty care service areas and are affected by the difficulty that physicians can experience in obtaining affordable malpractice insurance.
Unions and Labor Relations
As of December 31, 2017, we had approximately 2,400 employees, including approximately 980 part-time employees, at our eight hospitals represented by labor unions. We consider our employee relations to be good and have not experienced any work stoppages that had a material adverse impact on our business or results of operations.
Availability of Information
We file certain reports with the SEC, including annual reports on Form 10-K, quarterly reports on Form 10-Q and current reports on Form 8-K. The public may read and copy any materials we file with the SEC at the SEC’s Public Reference Room at 100 F Street, N.E., Washington, DC 20549. The public may obtain information on the operation of the Public Reference Room by calling the SEC at 1-800-SEC-0330. We are an electronic filer, and the SEC maintains an Internet site at www.sec.gov that contains our reports, proxy and information statements and other information we file electronically. Our website is www.quorumhealth.com. We make available free of charge on this website under “Investor Relations — SEC Filings” our annual reports on Form 10-K, quarterly reports on Form 10-Q, and current reports on Form 8-K and any amendments to such reports filed or furnished as soon as reasonably practicable after we electronically file or furnish such reports to the SEC. Our website and the information contained therein or linked thereto are not intended to be incorporated into this Annual Report on Form 10-K.
27
Item 1A.Risk Factors
Our company faces a variety of risks. Many of these risks are beyond our control and could cause our actual operating results and financial performance to be materially different from our expectations. Some of these risks are described below, including risks related to our business, the Spin-off, the U.S. healthcare industry, laws and regulations governing our industry, the securities markets and ownership of our common stock. Others risk factors, such as those related to our markets, operations, liquidity and interest rates, are described elsewhere in this Annual Report on Form 10-K, such as in “Item 7. Management’s Discussion and Analysis of Financial Condition and Results of Operations.” If any of the events or circumstances described in any of the following risk factors or those contained elsewhere in this Annual Report on Form 10-K occur, our business, results of operations, financial condition or cash flows could be materially and adversely affected, the trading price of our common stock could decline, and our shareholders could lose all or part of their investment. Furthermore, our actual operating and financial results may differ materially from those predicted in any forward-looking statements we make in any public disclosures, including those summarized in “Item 7. Management’s Discussion and Analysis of Financial Condition and Results of Operations.”
Risks Related to Our Business and Industry
We have substantial indebtedness, which could adversely affect our ability to refinance our existing indebtedness, raise additional capital, finance operations and capital expenditures, pursue desirable business opportunities or successfully operate our business in the future.
As of December 31, 2017, our total debt, excluding unamortized debt issuance costs and discounts, was $1.3 billion.
Our overall leverage, terms of our financing arrangements and debt service obligations could have important consequences to us, including the following:
| • | limits our ability to obtain additional financing for working capital and capital expenditures, to fund growth or to fund general corporate purposes, even when necessary for us to maintain adequate liquidity, particularly if any ratings assigned to our debt securities by rating agencies were revised downward; |
| • | subjects us to higher levels of indebtedness than our competitors, which may cause a competitive disadvantage and may reduce our flexibility in responding to increased competition; |
| • | requires us to dedicate a substantial portion of our operating cash flow to make interest payments on our debt, thereby limiting the availability of our operating cash flow to fund future investments, capital expenditures, working capital, business activities, financial obligations and other general corporate expenditures; |
| • | limits our ability to refinance our indebtedness on terms acceptable to us or at all; |
| • | limits our flexibility to plan for and adjust to changing business and market conditions in the industry in which we operate, and increase our vulnerability to adverse economic and industry conditions and governmental regulations; and |
| • | result in the market value of our stock being more volatile, potentially resulting in larger investment gains or losses for our shareholders, than the market value of the common stock of other companies that have a relatively smaller amount of indebtedness. |
Our ability to meet expenses and debt service obligations will depend on our future performance, which will be affected by financial, business, economic and other factors, including potential changes in patient preferences, the success of responding to changing payment models, the success in negotiating the termination of certain agreements with CHS and regulatory issues and pressure from competitors. If we do not generate enough cash to pay our debt service obligations, we may be required to refinance all or part of our existing debt, sell our assets, borrow more money or raise equity. We may be limited in our ability to pursue any of these options, if at all, in an instance of need, and any proceeds we receive may not be adequate to meet our debt service obligations as due.
Our senior credit facilities bear interest at variable rates. If market interest rates increase, this variable rate debt will create higher debt service requirements from us, which could adversely affect our available cash flow.
The agreements governing our debt, including our credit facilities and the indenture governing our Senior Notes, contain various covenants that impose restrictions on us that may affect our ability to operate our business.
The agreements and indenture governing our credit facilities and Senior Notes contain covenants that, among other things, limit our ability to:
| • | borrow money or guarantee debt; |
| • | create liens on our assets; |
| • | pay dividends or make distributions on, or redeem or repurchase our common stock; |
| • | make specified types of investments and acquisitions; |
| • | enter into agreements restricting our subsidiaries’ ability to pay dividends; |
28
| • | enter into new lines of business; |
| • | engage in transactions with affiliates; and |
| • | sell assets or merge with other companies. |
In addition, our credit facility contains restrictive covenants and requires us to maintain specified financial ratios and satisfy other financial condition tests. Our ability to meet these restrictive covenants and financial ratios and tests may be affected by events beyond our control, and we cannot assure you that we will meet those tests.
These restrictions on our ability to operate our business could harm our business by, among other things, limiting our ability to take advantage of financing, merger and acquisition and other corporate opportunities.
Various risks, uncertainties and events beyond our control could affect our ability to comply with these covenants. Failure to comply with any of the covenants in our existing or future financing agreements could result in a default under those agreements and under other agreements containing cross-default provisions.
A default would permit lenders to accelerate the maturity of the debt under these agreements and to foreclose upon any collateral securing the debt. Under these circumstances, we might not have sufficient funds or other resources to satisfy all of our obligations, including our obligations under the Senior Notes. In addition, the limitations imposed by financing agreements on our ability to incur additional debt and to take other actions might significantly impair our ability to obtain other financing.
Our financial statements have been prepared under the assumption that we will continue as a going concern.
On December 31, 2016, the Company adopted FASB’s ASU No. 2014-15, Presentation of Financial Statements — Going Concern, which requires management to evaluate if there are conditions or events that raise substantial doubt about an entity’s ability to continue as a going concern. On April 11, 2017, we amended our Senior Credit Facility (the “CS Amendment”) to, among other things, raise the maximum Secured Net Leverage Ratio (as defined in our credit agreement (“CS Agreement”), among us, the lenders party thereto and Credit Suisse AG, Cayman Islands Branch (“Credit Suisse”), as administrative agent and collateral agent) to 4.75x from 4.25x for the period July 1, 2017 to December 31, 2018 (which was previously 4.25x for the period July 1, 2017 to June 30, 2018), at which point it was to drop to 4.00x for the remainder of the agreement. On March 14, 2018, we amended our Senior Credit Facility (the “CS Second Amendment”) to, among other things, raise the maximum Secured Net Leverage Ratio to 4.75x for the period July 1, 2017 to July 30, 2018 and 5.00x for the period July 1, 2018 through December 31, 2019, at which point it will drop to 4.50x for the remainder of the agreement. Management has concluded that the CS Amendment and the CS Second Amendment alleviate any substantial doubt about our ability to continue as a going concern for the one year period following the issuance of the financial statements for the year ended December 31, 2017. However, we cannot predict, with certainty, the outcome of our actions. Our ability to fund capital requirements, service our existing debt and comply with our debt covenants will depend on our future operating performance and will be impacted by financial, business, economic, regulatory and other factors. If we do not generate enough cash to pay our debt service obligations or our operating performance does not comply with our amended debt covenants, we may be required to refinance all or part of our existing indebtedness, sell assets, borrow additional money or raise equity. Breach of covenants included in our debt agreements, which could result in the lenders demanding payment of the unpaid principal and interest balances, would have an adverse effect upon our business and would likely require us to do any or all of the following: seek to renegotiate these debt arrangements with the lenders, seek waivers from the lenders, or seek to raise additional capital and increase revenues. If such negotiations and capital raising attempts proved unsuccessful, we may be required to seek protection from creditors through bankruptcy proceedings.
If we are unable to complete divestitures or closures that are currently contemplated, our results of operations and financial condition could be adversely affected.
As noted above, we have been implementing a portfolio refinement strategy by divesting underperforming hospitals and outpatient service facilities. In addition, on January 5, 2018 the Company announced the planned closure of Affinity Medical Center in Massillon, Ohio. Generally, we believe these divestitures and closures will allow us to reduce our corporate indebtedness and refine our hospital portfolio to a sustainable group of hospitals and outpatient service facilities with higher operating margins. However, there is no assurance that these contemplated divestitures or closures will be completed, will be completed within our contemplated timeframe, or will be completed on terms favorable to us or on terms sufficient to allow us to achieve our strategy. Additionally, the results of operations for these hospitals we plan to divest and the potential gains or losses on the sales of these businesses may adversely affect our profitability. Moreover, we may incur asset impairment charges related to divestitures or closures that reduce our profitability.
In addition, after entering into a definitive agreement, we may be subject to the satisfaction of pre-closing conditions as well as necessary regulatory and governmental approvals, which, if not satisfied or obtained, may prevent us from completing the sale. Divestitures or closures may also involve continued financial exposure related to the divested business, such as through indemnities or retained obligations, that present risk to us.
29
Our planned divestiture and closure activities may present financial, managerial, and operational risks. Those risks include diversion of management attention from improving existing operations; additional restructuring charges and the related impact from separating personnel, renegotiating contracts, and restructuring financial and other systems; adverse effects on existing business relationships with patients and third-party payors; and the potential that the collectability of any patient accounts receivable retained from any divested hospital may be adversely impacted. Any of these factors could adversely affect our financial condition and results of operations.
If reimbursement rates paid by federal or state healthcare programs or commercial insurance and other managed care payors are reduced, if we are unable to maintain favorable contract terms with payors or comply with our payor contract obligations, if insured individuals move to insurance programs or plans with greater coverage exclusions or narrower networks, or if insurance coverage is otherwise restricted, our net operating revenues may decline.
Our net patient revenues, before the provision for bad debts, from the Medicare and Medicaid programs, including Medicare and Medicaid managed care plans, were 46.5%, 46.3% and 45.0% for the years ended December 31, 2017, 2016 and 2015, respectively, and were 39.6%, 39.4% and 40.3% from managed care and commercial payors for these respective periods. Healthcare expenditures continue to increase and state governments continue to face budgetary shortfalls. Driven by these financial factors and ongoing health reform efforts, federal and state governments have made, and continue to make, significant changes in the Medicare and Medicaid programs, including reductions in reimbursement payment levels and reductions to payments made to providers under state supplemental payment programs. Some of these changes have already decreased, and could further decrease in the future, the amount of payments we receive for our services.
In addition, governmental and commercial payors, as well as other third parties from whom we receive payment for our services, attempt to control healthcare costs by, for example, requiring hospitals to discount payments for their services in exchange for exclusive or preferred participation in their benefit plan networks, restricting coverage through utilization reviews, reducing coverage of inpatient services and shifting coverage of care to outpatient settings when possible, requiring prior authorizations for non-emergency services and implementing alternative payment models. The ability of commercial payors to control healthcare costs using these measures may be enhanced by the increasing consolidation of private health insurance companies and managed care companies and vertical integration of health insurers with healthcare providers. Cost-reduction strategies by large employer groups and their affiliates may also limit our ability to negotiate favorable terms in our contracts and otherwise intensify competitive pressure. Furthermore, our contracts with payors require us to comply with a number of terms related to the provision of services and billing for services. If we are unable to negotiate increased reimbursement rates, maintain existing reimbursement rates or other favorable contract terms, effectively respond to payor cost controls or comply with the terms of our payor contracts, the payments we receive for our services may be reduced or we may be involved in disputes with payors and experience payment denials, both prospectively and retroactively.
In recent years, the percentage of the population with health insurance has increased, driven primarily by various provisions of the Affordable Care Act, including the requirement that individuals purchase health insurance or pay a penalty. However, in 2017, Congress eliminated the financial penalty associated with the individual mandate, effective January 1, 2019. This change may result in fewer individuals electing to purchase health insurance. In addition, the president signed an executive order directing agencies to relax limits on certain health plans, potentially allowing for fewer plans that adhere to specific Affordable Care Act coverage mandates. Further, individuals are increasingly enrolling in high-deductible health plans, which tend to have lower reimbursement rates for providers along with higher co-payments and deductibles due from the patient in comparison to traditional plans. These plans, sometimes referred to as consumer directed plans, may even exclude our hospitals and employed physicians from coverage.
Changes to Medicaid supplemental payment programs may adversely affect our revenues, results of operations and cash flows.
Medicaid state supplemental payments to providers are separate from and in addition to those made under a state’s standard Medicaid program. For example, federal law requires state Medicaid programs to make DSH payments to hospitals that serve significant numbers of Medicaid and uninsured patients. The Affordable Care Act and subsequent legislation provide for reductions in Medicaid DSH payments. Under the budget bill signed into law in February 2018, Medicaid DSH payments will be reduced by $4 billion in 2020 and by $8 billion per year from 2021 through 2025. Reductions in Medicaid DSH payments and the funding of similar programs could have an adverse effect on our revenues and results of operations.
Supplemental payment programs are being reviewed by certain state agencies, and some states have made or may make waiver requests to CMS to replace existing supplemental payment programs. These reviews and waiver requests may result in restructuring of such programs and could cause reductions in or elimination of the payments. In December 2017, CMS announced that it will phase out funding for Designated State Health Programs under Medicaid waivers granted pursuant to section 1115 of the Social Security Act. The Texas Healthcare Transformation and Quality Improvement Program is an example of such a waiver. The program offsets some costs of providing uncompensated care and incentivizes delivery system reform under a waiver granted by CMS. In December 2017, CMS has approved an extension of the Texas Medicaid waiver through September 30, 2022, but indicated that it will phase out the federal funding related to delivery system reform, eliminating those federal payments beginning October 1, 2021. In addition, Texas will not receive any federal financial participation for uncompensated care pool payments until CMS approves revised uncompensated care protocol policies for the state.
30
In December 2017, CMS approved Phase V of California’s HQAF program, with a program period of January 1, 2017, through June 30, 2019. The HQAF program provides funding for supplemental payments to hospitals that serve Medi-Cal and uninsured patients. The supplemental payments are funded in part by the federal government. The CMS approval process can be lengthy and, in some cases, the state must seek approval each fiscal year. In addition, changes to the Medi-Cal program may affect the availability of funding for supplemental payments.
As a result of the increase in reviews of claims filed for Medicare and Medicaid reimbursements, we may experience delayed payments or incur additional costs and may be required to repay amounts already paid to us under these programs.
We are subject to routine post-payment inquiries, investigations and audits of the claims we submit to Medicare and Medicaid for reimbursement for our healthcare services provided to covered patients. The number and parameters of claims subject to these post-payment reviews may increase as a result of federal and state governmental healthcare cost-containment initiatives, including enhanced medical necessity reviews for Medicare patients admitted as inpatients to hospitals for certain procedures. Furthermore, CMS contracts with RACs to perform post-payment targeted review process that employs data analysis techniques in order to identify Medicare and Medicaid claims most likely to contain overpayments, such as incorrectly coded services, short stay admissions, incorrect payment amounts, non-covered services and duplicate payments. The claims review strategies used by RACs generally include a review of high dollar claims, including inpatient hospital claims. As a result, a large majority of the total payment adjustments determined by RACs relate to hospital claims. In addition, CMS employs MICs to perform post-payment audits of Medicaid claims to identify potential overpayments. State Medicaid agencies and other private third-party contractors have also increased their review activities. Third-party audits or investigations of Medicare or Medicaid claims could result in increases or decreases in our revenues to be recognized in periods subsequent to when the related healthcare services were performed, which could have an adverse effect on our results of operations.
Payment recoveries resulting from post-payment reviews and denials are appealable. However, there are significant delays in the assignment of new Medicare appeals to Administrative Law Judges. According to the Office of Medicare Hearings and Appeals, the average processing time in fiscal year 2017 was over three years. Depending upon the growth of RAC programs and our success in appealing claims, our results of operations and cash flows could be negatively impacted.
A material portion of our revenues are concentrated in a single state which makes us particularly sensitive to regulatory and economic changes in that state.
Our revenues are particularly sensitive to regulatory and economic changes in the state of Illinois where we generate a significant portion of our patient revenues. We currently operate nine hospitals in Illinois, which collectively accounted for 37.2%, 35.1% and 35.3% of our net patient revenues, before the provision for bad debts, for the years ended December 31, 2017, 2016 and 2015, respectively. Our accounts receivable due from Illinois continue to be delayed due to state budgetary and funding pressures. Accordingly, any change in the current demographic, economic, competitive or regulatory conditions in this state could have an adverse effect on our business, results of operations, financial condition and cash flows. Recently, Illinois announced the 2018 launch of HealthChoice Illinois, an expansion of its Medicaid managed care program to all counties in the state. Changes to the state Medicaid and other governmental payor programs in Illinois, including reductions in reimbursement rates or delays in timing of reimbursement payments, could also have an adverse effect on our business, results of operations, financial condition and cash flows.
We are unable to predict the ultimate impact of healthcare reform initiatives, including the Affordable Care Act, and our business may be adversely affected if the Affordable Care Act is repealed entirely or if provisions benefitting our operations are significantly modified.
In recent years, the U.S. Congress and certain state legislatures have introduced and passed a large number of proposals and legislation designed to make major changes in the healthcare system, including changes that increased access to health insurance. The most prominent of these efforts, the Affordable Care Act, affects how healthcare services are covered, delivered, and reimbursed. As currently structured, the Affordable Care Act, expands health insurance coverage through a combination of public program expansion and private sector health insurance reforms, reduces Medicare reimbursement to hospitals, and promotes value-based purchasing. There are currently several public and private initiatives that aim to transition payment models from passive volume-based reimbursement to models that are tied to the quality and value of services. We are limited in our ability to reduce the direct costs of providing care to patients. We are unable to predict the nature and success of future financial or delivery system reforms, whether such reforms are implemented by government or other industry participants, such as private payors and large employer groups, or the potential impact of such changes to our operations.
The Trump administration and certain members of Congress have stated their intent to repeal or make significant changes to the Affordable Care Act, its implementation and/or its interpretation. For example, in 2017, Congress eliminated the financial penalty associated with the individual mandate, effective January 1, 2019, which may result in fewer individuals electing to purchase health insurance. In addition, a presidential executive order has been signed that directs agencies to minimize “economic and regulatory burdens” of the Affordable Care Act. CMS administrators have indicated that they intend to grant states additional flexibility in the administration of state Medicaid programs, including by expanding the scope of waivers under which states may impose different eligibility or enrollment restrictions or otherwise implement programs that vary from federal standards. There is uncertainty regarding whether, when, and how the Affordable Care Act will be further changed, what alternative provisions, if any, will be enacted, the
31
timing of enactment and implementation of alternative provisions, and the impact of alternative provisions on providers as well as other healthcare industry participants. Further, Congress could eliminate or alter provisions beneficial to us while leaving in place provisions reducing our reimbursement. Efforts to repeal or change the Affordable Care Act or implement other initiatives intended to reform healthcare delivery and financial systems may have an adverse effect on our business, results of operations, cash flow, capital resources and liquidity.
If we experience growth in self-pay revenues, or if we experience deterioration in the collectability of patient responsibility accounts, our results of operations, financial condition and cash flows could be adversely affected.
The primary uncertainty in collectability of our revenues relates to uninsured patients and the patient financial responsibility portion of payments due from insured patients. Collections on account balances are impacted by the economic ability of patients to pay, the effectiveness of CHS’ collection efforts pursuant to our transition services agreements with them, and our own collection efforts. Significant changes in payor mix, centralized business office operations, in-market or overall U.S. economic conditions, or new and changing laws and regulations related to federal and state governmental healthcare coverage, among other things, could adversely impact our estimates of accounts receivable collectability. See “Item 1. Business — Agreements with CHS Related to the Spin-off” for additional information on the transition services agreements.
In recent years, our self-pay revenues have decreased, primarily due to the insurance expansion provisions of the Affordable Care Act. In particular, we have experienced increasing numbers of individuals covered by Medicaid or commercial insurance plans. However, efforts to repeal or revise the Affordable Care Act have caused uncertainty with regard to the future of this statute and its effects on the size of the uninsured population of U.S. citizens. In 2017, Congress eliminated the financial penalty associated with the individual mandate, effective January 1, 2019. This may result in fewer individuals electing to purchase health insurance. There is also uncertainty regarding the number and identity of states that will ultimately expand their Medicaid programs, and on what terms. These factors, among others, make it difficult to predict changes to the percentage of our revenues comprised of self-pay revenues.
Moreover, we may be adversely affected by growth in the patient financial responsibility portion of payments for services or other conditions or restrictions associated with governmental and non-governmental healthcare plans and programs. Individuals are increasingly using healthcare savings accounts and participating in more narrow or tiered network programs. Our ability to improve collections of our patient accounts (as well as the ability of those collecting patient accounts of our behalf) may be limited by statutory, regulatory and investigatory initiatives, including private lawsuits directed at hospital charges and collection practices for uninsured and underinsured patients. In addition, a deterioration of economic conditions in the United States could lead to higher levels of uninsured patients, result in higher levels of patients covered by lower-paying governmental programs, result in fiscal uncertainties related to both governmental and non-governmental payors and could limit the economic ability of patients to make payments for which they are responsible. If we experience growth in self-pay revenues volume or deterioration in collectability of patient accounts, our results of operations, financial condition and cash flows could be adversely affected.
If we are unable to effectively compete for patients, local residents in the markets where we operate hospitals may choose to use other hospitals and healthcare providers for medical treatment.
The U.S. healthcare industry is highly competitive among hospitals and other healthcare providers for patients and physician affiliations. We are the sole provider of general and acute hospital healthcare services in 20 of our markets, which we generally define as the county where our hospital is located, which means we typically have less direct competition for our hospital services. Our hospitals face competition for patients from out-of-market hospitals, including hospitals in urban areas that may have more comprehensive specialty care service lines, more advanced medical equipment and technology, more extensive medical research capabilities and greater access to medical education programs. Patients who receive medical treatment from an out-of-market hospital may subsequently shift their preferences to that hospital for future healthcare services. We also face competition from other specialty care providers, including outpatient surgery, orthopedic, oncology and diagnostic centers that are not affiliated with us. Our hospitals and many of the hospitals with which we compete engage in physician alignment strategies, which may include employing physicians, acquiring physician practice groups, participating in ACOs and, to the extent permitted by law, physician ownership of healthcare facilities.
We face competition from municipal and not-for-profit hospitals. In our markets where we are not the sole provider of general and acute hospital healthcare services, our primary competitor is generally a not-for-profit hospital. Not-for-profit hospitals are typically owned by tax-supported governmental agencies or not-for-profit entities which are financially supported by endowments and charitable contributions. Not-for-profit hospitals do not pay income or property taxes and can make capital investments without paying sales tax. These financial advantages may better position such hospitals to maintain more modern and technologically upgraded facilities and equipment and to offer more specialized services than those available at our hospitals. If our competitors are better able to attract patients with these offerings, we may experience an overall decline in our patient volumes and operating revenues. Recent consolidations of not-for-profit hospital entities may intensify this competitive pressure.
Our ability to effectively compete for patients is impacted by commercial and managed care payor programs that influence patient choice related to both physicians and hospitals by offering health insurance plans that restrict patient choice of provider. For example, plans with narrow network structures restrict the number of participating in-network provider plans with tiered network structures impose higher cost-sharing obligations on patients that obtain services from providers in a disfavored tier. If we are unable to
32
participate in plan networks or favorable tiers or are otherwise unable retain or maintain favorable contracts with health plans, our patient volumes may decrease and our revenues may be reduced. In addition, healthcare industry participants are increasingly pursuing alignment initiatives, such as the proposed acquisition of Aetna by CVS Health. Integration among insurers and providers and cost-reduction strategies by large employer groups and their affiliates may shift costs, accelerate further change, and impact our ability to compete in ways that are difficult to predict.
Trends toward increasing clinical transparency and value-based purchasing may have an adverse impact on our competitive position and patient volumes. The CMS Hospital Compare website makes available to the public certain data that hospitals submit in connection with Medicare reimbursement claims, including performance data related to quality measures and patient satisfaction surveys. In addition, hospitals are required to publish their standard charges for healthcare items and services or their policy for allowing the public to review a list of their standard charges for healthcare services. If any of our hospitals achieve poor results on quality of care measures or patient satisfaction surveys, if our results are lower than the results of our competitors, or if our standard charges are higher than our competitors, we may attract fewer patients.
We expect these competitive trends to continue. If we are unable to compete effectively with other healthcare providers, local residents may seek healthcare services from providers other than our hospitals and affiliated outpatient service facilities.
A significant decline in operating results or other indicators of impairment at one or more of our facilities, including outpatient ancillary affiliated entities, could result in a material, non-cash charge to earnings to impair the value of long-lived assets.
Our operations are capital intensive and require significant investment in long-lived assets, including property, equipment, software and other long-lived intangible assets. If one of our hospitals or other healthcare facilities experiences declining operating results or is adversely impacted by one or more of the risk factors related to our business, we may not be able to recover the carrying value of those assets through our future operating cash flows. On an ongoing basis, we evaluate whether changes in future undiscounted cash flows reflect any potential impairment in the fair value of our long-lived assets. For the years ended December 31, 2017, 2016 and 2015, we recorded impairment of $47.3 million, $166.9 million and $13.0 million because of declining operating results and projections of future cash flows at certain of our hospitals. See Note 3 — Impairment of Long-Lived Assets and Goodwill in the accompanying financial statements.
If the fair value of one or both of our reporting units declines, it could result in a material, non-cash charge to earnings from impairment of our goodwill.
The testing of goodwill for impairment requires us to make significant estimates about our future performance and cash flows, as well as other assumptions related to our cost of capital and other factors impacting our fair value models. Future estimates of fair value could be adversely affected if the actual outcome of one or more of these assumptions changes materially in the future, including lower than expected hospital patient volumes, reduced reimbursement or increased operating costs. On an ongoing basis, we evaluate whether the carrying value of our goodwill is impaired when events or changes in circumstances indicate that such carrying value may not be recoverable.
For the year ended December 31, 2017, we recorded $1.9 million of impairment to goodwill related to certain hospitals we classified as held for sale or sold during 2017. For the year ended December 31, 2016, we recorded a total of $125.0 million of impairment to the goodwill associated with our hospital operations reporting unit. The fiscal year 2016 impairment charge consisted of two components, a $5.0 million write-down of goodwill related to certain hospitals that we reclassified as held for sale in the second quarter of 2016 and $120.0 million of goodwill impairment resulting from a step two goodwill impairment evaluation as a result of certain indicators of impairment. The primary indicators were our declining market capitalization, as compared to the carrying value of equity, and a decrease in estimated future earnings.
If competition decreases our ability to acquire additional hospitals on favorable terms, we may be unable to execute our acquisition strategy.
An important part of our long-term business strategy is to acquire additional hospitals. However, not-for-profit hospital systems and other for-profit hospital companies generally attempt to acquire the same type of hospitals as we do. Some of our competitors for acquisitions have greater financial resources than we have. Furthermore, some hospitals are sold through an auction process, which may result in higher purchase prices than we believe are reasonable. Therefore, we may not be able to acquire additional hospitals on terms favorable to us.
If we fail to improve the financial and operating performance of acquired and existing hospitals, we may be unable to achieve our growth strategy.
Some of our existing hospitals are experiencing lower operating margins than other hospitals in our portfolio. While we do not intend to acquire hospitals that are not accretive to our net operating revenues, it is possible that one or more hospitals we acquire may have lower operating margins than we do or have incurred operating losses prior to the time we acquire them. We may occasionally experience delays in improving the operating margins or effectively integrating the operations of acquired hospitals. In the future, if we are unable to improve the operating margins of these existing hospitals or any acquired hospitals, operate them profitably or
33
effectively integrate their operations, as applicable, we may be unable to achieve our growth strategy. To the extent that our operating margins were to decline as a result of financial and operating performance at our hospitals, we could be unable to comply with the covenants contained in our credit agreements or be limited or precluded from obtaining future borrowings by the terms of our credit agreements and the indenture governing our Senior Notes.
The failure or downsizing of large employers, or the closure of manufacturing or other major facilities in our markets, could have a disproportionate impact on our hospitals.
The economies in the markets in which most of our hospitals operate are often dependent on a small number of large employers, especially manufacturing or other major facilities. These employers often provide income and health insurance for a disproportionately large number of community residents who may depend on our hospitals and outpatient service facilities for their medical care. The failure of one or more large employers, or the closure or substantial reduction in the number of individuals employed at manufacturing or other facilities located in or near the markets in which we operate hospitals, could cause affected residents to move elsewhere for employment or lose insurance coverage that was otherwise available to them. The occurrence of these events may cause a reduction in our revenues and adversely impact our results of operations.
We are subject to a variety of operational, legal and financial risks associated with outsourcing functions to third parties.
We have outsourced to CHS, through various transition services agreements, certain services including, among others, services related to patient eligibility screening, billing, accounts receivable collections and other revenue management services and support, as well as information technology, payroll processing and other human resources functions. We take steps to monitor and regulate the performance of any parties in which we delegate services; however, the transition services agreements with CHS were executed in connection with the Spin-off, based upon certain business and financial assumptions. To the extent that any of the transition services agreements are determined not to benefit us in their current form, our ability to renegotiate, rescind or reform any or all of the agreements may be limited or non-existent, and our business could be adversely affected.
Arrangements with third-party service providers may make our operations vulnerable if these vendors fail to satisfy their obligations to us as a result of their performance, changes in their own operations, financial condition or other matters outside of our control. We may also face legal, financial or reputational harm for the actions or omissions of such providers, and we may not have effective recourse against the providers. Effective management, development and implementation of our outsourcing strategies are important to our business strategy. If there are delays or difficulties in enhancing business processes or our third-party service providers do not perform, we may not be able to fully realize on a timely basis the economic and other benefits of the outsourcing services or other relationships we enter into with key vendors, which could result in substantial costs, divert management’s attention from other strategic activities, negatively affect employee morale or create other operational or financial problems for us. Terminating or transitioning arrangements with key vendors, including the transition services agreements with CHS, could result in additional costs and a risk of operational problems, delays in collections from payors, potential errors and possible control issues during the termination and transition processes, any of which could adversely affect our business, results of operations, financial condition and cash flows.
The failure to obtain our medical supplies and drugs at favorable prices could cause our operating results to be adversely affected.
In connection with the Spin-off, we renegotiated and entered into a separate participation agreement with the group purchasing organization (“GPO”) that we used prior to the Spin-off date. GPOs attempt to obtain favorable pricing on medical supplies and drugs with manufacturers and vendors, sometimes by negotiating exclusive supply arrangements in exchange for discounts. To the extent these exclusive supply arrangements are challenged or deemed unenforceable, we could incur higher costs than anticipated for our medical supplies obtained through the GPO. Also, there can be no assurance that our arrangement with the GPO will provide the expected discounts on a long-term basis. Furthermore, costs of medical supplies and drugs may continue to increase due to market pressure from pharmaceutical companies and new product drug releases. Higher costs could cause our operating results to be adversely affected.
A pandemic, epidemic or outbreak of an infectious disease in the markets in which we operate hospitals, or which otherwise impacts our healthcare facilities, could adversely impact our business.
If a pandemic, epidemic, outbreak of an infectious disease or other public health crisis were to affect any or all of the markets in which we operate hospitals, our business and results of operations could be adversely affected. Such a crisis could diminish the public’s trust in healthcare facilities, especially hospitals that fail to accurately or timely diagnose or that are treating or have treated patients affected by contagious diseases. If any of our healthcare facilities were involved in treating patients for such a contagious disease, other patients might cancel elective procedures or fail to seek needed care from our healthcare facilities. Further, a pandemic might adversely impact our business by causing a temporary shutdown or diversion of patients, by disrupting or delaying production and delivery of materials and products in the supply chain or by causing staffing shortages in our healthcare facilities. Although we have disaster plans in place and operate pursuant to infectious disease protocols, the potential impact of a pandemic, epidemic or outbreak of an infectious disease, with respect to our markets or our healthcare facilities is difficult to predict and could adversely impact our business.
34
Our performance depends on our ability to recruit and retain quality physicians.
Although we employ some physicians, physicians are often not employees of the healthcare facilities at which they practice. The success of our healthcare facilities depends in part on the number and quality of the physicians on the medical staffs of our hospitals and other healthcare facilities, our ability to employ or contract with quality physicians, the admitting and utilization practices of employed and non-employee physicians, maintaining good relations with physicians and controlling costs related to the employment of physicians. In many of the markets we serve, many physicians have admitting privileges at other healthcare facilities in addition to our healthcare facilities. Such physicians may terminate their affiliation or employment with our healthcare facilities at any time. If we are unable to provide adequate supporting medical staff or technologically advanced medical equipment and facilities that meet the needs or expectations of those physicians and their patients, they may be discouraged from referring patients to our facilities, admissions may decrease and our operating performance may decline.
Our labor costs could be adversely affected by competition for medical staff, a shortage of experienced nurses and labor union activity.
In addition to our physicians, the operations of our healthcare facilities are dependent on the efforts, abilities and experience of our hospital management teams and other medical staff, such as nurses, pharmacists and lab technicians. We compete with other healthcare providers in recruiting and retaining qualified management and medical staff responsible for the daily operations of our healthcare facilities. In some markets across the United States, the availability of nurses and other medical support personnel has been a significant operating issue for healthcare providers. We may be required to enhance wages and benefits to recruit and retain nurses and other medical support personnel or to hire more expensive temporary or contract medical staff. In addition, some states have, and others could adopt, mandatory nurse-staffing ratios or could reduce mandatory nurse-staffing ratios already in place. State-mandated nurse-staffing ratios could significantly affect labor costs and have an adverse impact on revenues at hospitals where admissions must be limited in order to meet the required ratios.
As of December 31, 2017, we had approximately 2,400 employees, including approximately 980 part-time employees, at our eight hospitals represented by labor unions. Increased or ongoing labor union activity is another factor that could adversely affect our labor costs or otherwise adversely impact us. To the extent a significant portion of our employee base unionizes, our labor costs could increase significantly. In addition, when negotiating collective bargaining agreements with unions, whether such agreements are renewals or first contracts, there is the possibility that strikes could occur during the negotiation process, and our continued operations during any strike periods could increase our labor costs and otherwise adversely impact our business and results of operations.
If our labor costs increase, we may not be able to raise the standard charges for our healthcare services to offset these increased costs. Additionally, a significant portion of our revenues are subject to fixed reimbursement rates, which constrains our ability to pass along the impact of these increased costs to the patient or other third-party payors. In the event we are not effective at recruiting and retaining qualified hospital management, nurses and other medical staff, or we are unable to control our labor costs in relation to certain events and circumstances, the increase in our labor costs could have an adverse effect on our results of operations.
Our hospitals and other healthcare facilities may be negatively impacted by severe weather, earthquakes and other factors beyond our control, which could restrict patient access to care or cause one or more of our facilities to close temporarily.
The results of operations of our hospitals and outpatient service facilities may be adversely impacted by severe weather conditions, including earthquakes, hurricanes and widespread winter storms, or other factors beyond our control that could cause disruption to patient scheduling or displacement of our patients, employees, physicians and clinical staff, and may force certain of our facilities to close temporarily. In certain geographic areas, we have a concentration of hospitals and outpatient service facilities that may be simultaneously affected by adverse weather conditions or events. These types of disruptions due to severe weather could have an adverse effect on our business, results of operations, financial condition and cash flows.
35
If our adoption and utilization of electronic health record systems fails to satisfy CMS standards, our results of operations could be adversely affected.
Under the HITECH Act, MACRA and other laws, HHS has established Medicare and Medicaid incentive programs to encourage hospitals and healthcare professionals to adopt EHR technology. Eligible hospitals can receive Medicaid incentive payments for their adoption and meaningful use of certified EHR technology; Medicare incentive payments are no longer available. Eligible hospitals that fail to demonstrate meaningful use are subject to Medicare payment reductions. Under the OPP, eligible healthcare professionals are also subject to positive or negative payment adjustments based, in part, on their use of EHR technology. If our hospitals and healthcare professionals are unable to properly adopt, maintain, and utilize certified EHR technology, we will not be eligible to receive incentive payments and we could be subject to penalties that may have an adverse effect on our results of operations. Excluding payment adjustments under the OPP, we expect our EHR incentive payments earned will be approximately $1.5 million for 2018.
If there are delays in regulatory updates by governmental agencies to federal and state healthcare programs, we may experience increased volatility in our operating results as such delays may result in a timing difference between when such program revenues are earned and when they become known or estimable for purposes of accounting recognition.
Our net patient revenues, before the provision for bad debts, from the Medicare and Medicaid programs, including Medicare and Medicaid managed care plans, were 46.5%, 46.3% and 45.0% for the years ended December 31, 2017, 2016 and 2015, respectively. The reimbursement payments related to these programs are subject to ongoing legislative and regulatory changes that can have a significant impact on our operating results. When delays occur in the passage of legislation, funding authorizations or the implementation of regulations, we could experience material increases or decreases in our revenues to be recognized in periods subsequent to when the related healthcare services were performed. For the years ended December 31, 2017, 2016 and 2015, we recorded net favorable (unfavorable) contractual allowance adjustments in net operating revenues of $2.0 million, $(5.8) million and $(15.1) million, respectively, related to previous program reimbursement estimates and final cost report settlements. The volatility in the timing of recognition as revenues of adjustments to reimbursement payments under these programs could have an adverse effect on our results of operations, financial position and cash flows.
Controls designed by third-party payors to reduce utilization of inpatient services may reduce our revenues.
Over the last several years, third-party payors, including both governmental and non-governmental payors, have instituted policies and procedures to substantially reduce or limit coverage of inpatient healthcare services. Payors have implemented controls and procedures designed to monitor and reduce patient admissions and lengths of stay, commonly referred to as “utilization review,” which have impacted and are expected to continue to impact inpatient admission volumes at our hospitals. Federal laws contain numerous provisions designed to ensure that services rendered by hospitals to Medicare and Medicaid patients meet professionally recognized standards and are medically necessary and that claims for reimbursement are properly filed. Inpatient utilization, average lengths of stay and hospital occupancy rates continue to be negatively affected by payor-required pre-admission authorization requirements, payor-required post-admission utilization reviews and payor pressure to maximize outpatient and alternative delivery options for healthcare services for less acutely ill patients. Significant limits on the scope of services reimbursed and on reimbursement rates by governmental and non-governmental third-party payors could have an adverse effect on our revenues and results of operations.
If we fail to comply with the extensive laws and governmental regulations that apply to the U.S. healthcare industry, including anti-fraud and abuse laws, we could suffer penalties or be required to make significant changes to our operations.
The U.S. healthcare industry is governed by extensive laws and regulations at the federal, state and local government levels. These laws and regulations include standards that address, among other issues, the following:
| • | the adequacy of medical care, equipment, personnel, and operating policies and procedures; |
| • | billing and coding for services; |
| • | proper handling of overpayments; |
| • | classification of levels of care provided; |
| • | preparing and filing of cost reports; |
| • | relationships with referral sources and referral recipients; |
| • | maintenance of adequate records; |
| • | compliance with building codes; |
| • | environmental protection; |
| • | privacy and security; and |
| • | debt collection and communications with patients and consumers. |
36
Examples of these laws include, but are not limited to, HIPAA, the Stark Law, the Anti-Kickback Statute, the False Claims Act, EMTALA and similar state laws. If we fail to comply with applicable laws and regulations, we could suffer civil sanctions and criminal penalties, including the loss of our operating licenses and our ability to participate in the Medicare, Medicaid and other federal and state healthcare programs. There are heightened coordinated civil and criminal enforcement efforts by both federal and state governmental agencies relating to the U.S. healthcare industry. Recent enforcement actions have focused on financial arrangements between hospitals and physicians, billing for services without adequately documenting medical necessity and billing for services outside the coverage guidelines for such services. Specific to our hospitals, we have received inquiries and subpoenas from various governmental agencies regarding these and other matters, and we are also subject to various claims and lawsuits relating to such matters. See “Item 3. Legal Proceedings” for a further discussion of these matters.
In the future, evolving interpretations or enforcement of the laws and regulations applicable to the U.S. healthcare industry could subject our current practices to allegations of impropriety or illegality or could require us to make changes to our healthcare facilities, equipment, personnel, healthcare service offerings, capital expenditure programs and operating expenses.
We could be subject to increased monetary penalties and other sanctions, including exclusion from federal healthcare programs, if we fail to comply with the terms of the Corporate Integrity Agreement.
On August 4, 2014, CHS became subject to the terms of a five-year CIA with the OIG arising from a civil settlement with the DOJ, other federal agencies and identified relators that concluded previously announced investigations and litigation related to short stay admissions through emergency departments at certain of their hospitals. The OIG has required us to be bound by the terms of the CHS CIA commencing on the Spin-off date and applying to us for the remainder of the five-year compliance term required of CHS, which terminates on August 4, 2019. See “Item 3. Legal Proceedings” for additional information on the terms of the CIA.
Material, uncorrected violations of the CIA could lead to our suspension or exclusion from participation in Medicare, Medicaid and other federal and state healthcare programs and subject us to repayment obligations. In addition, we are subject to possible civil penalties for failure to substantially comply with the terms of the CIA, including stipulated penalties ranging between $1,000 and $2,500 per day. We are also subject to a stipulated penalty of $50,000 for each false certification made by us or on our behalf, pursuant to the reporting provisions of the CIA. The CIA increases the amount of information we must provide to the federal government regarding our practices at our healthcare facilities and our compliance with federal regulations. The reports we provide in connection with the CIA could result in greater scrutiny by other regulatory agencies.
We may be adversely affected by consolidation among health insurers and other industry participants.
In recent years, a number of private health insurers have merged or increased efforts to consolidate with other non-governmental payors. Insurers are also increasingly pursuing alignment initiatives with healthcare providers, such as the proposed acquisition of Aetna by CVS. Consolidation within the health insurance industry may result in insurers having increased negotiating leverage and competitive advantages, such as greater access to performance and pricing data. In addition, the trend within the U.S. healthcare industry toward value-based purchasing programs could be accelerated if the large private health insurance companies, including those engaging in consolidation activity, find these programs to be financially beneficial. Other industry participants, such as large employer groups and their affiliates, may intensify competitive pressure and affect the industry in ways that are difficult to predict.
These trends result, in part, from health care reform efforts, including the medical loss ratio (“MLR”) requirements. The MLR represents the percentage of premiums used to pay patient medical claims and used for programs or activities that improve the quality of patient care. Under the Affordable Care Act, health insurance payors that do not meet minimum MLR requirements must pay premium rebates on group and individual health insurance plan products and, for certain Medicare program products, may be subject to additional penalties. Our ability to negotiate prices and favorable terms with health insurance providers could be negatively impacted by their efforts to satisfy the MLR requirements. We cannot predict whether we will be able to negotiate favorable terms and otherwise respond effectively to the impact of increased consolidation within the payor industry or vertical integration efforts.
We may from time to time become the subject of legal, regulatory and governmental proceedings that, if resolved unfavorably, could have an adverse effect on us, and we may be subject to other loss contingencies, both known and unknown.
We may from time to time become a party to various legal, regulatory and governmental proceedings and other related matters. Those proceedings include, among other things, governmental investigations. In addition, we may become subject to other loss contingencies, both known and unknown, which may relate to past, present and future facts, events, circumstances and occurrences. Addressing any investigations, lawsuits or other claims may distract management and divert resources, even if we ultimately prevail. Should an unfavorable outcome occur in some or all of any such current or future legal, regulatory or governmental proceedings or other such loss contingencies, or if successful claims and other actions are brought against us in the future, there could be an adverse impact on our results of operations, financial position and cash flows.
For example, on October 25, 2017, a shareholder (R2 Investments LDC) filed an action in the Circuit Court of Williamson County, Tennessee against us and certain of our officers and directors and CHS and certain its officers and directors. The complaint alleges that the defendants violated the Tennessee Securities Act and common law by, among other things, making alleged false and/or misleading statements and failing to disclose certain information regarding aspects of our business, operations and financial condition. Plaintiff is seeking recessionary, compensatory, and punitive damages. Defending ourselves against these allegations or
37
other shareholder activities, activism or lawsuits and any related publicity could potentially entail significant costs and could require significant attention from our management. We are unable to predict the outcome of this matter. However, it is reasonably possible that we may incur a loss in connection with this matter. We are unable to reasonably estimate the amount or range of such reasonably possible loss. Under some circumstances, any losses incurred in connection with adverse outcomes in this matter could be material.
Governmental investigations, as well as qui tam lawsuits, may lead to significant fines, penalties, settlements or other sanctions, including exclusion from federal and state healthcare programs. Settlements of lawsuits involving Medicare and Medicaid issues routinely require both monetary payments and corporate integrity agreements, each of which could have an adverse effect on our business, results of operations, financial position and cash flows. While CHS has agreed to indemnify us for certain liabilities relating to outcomes or events occurring prior to the closing of the Spin-off, we cannot guarantee that any such legal proceedings or loss contingencies will be covered by such indemnities or that CHS will fully indemnify us thereunder. See “Item 3. Legal Proceedings” for additional information on legal proceedings to which we are subject.
We could be subject to substantial uninsured liabilities or increased insurance costs as a result of significant legal actions.
Physicians, hospitals and other healthcare providers have become subject to an increasing number of legal actions alleging malpractice and other liability claims or legal theories. Even in states that have imposed caps on damage awards, plaintiffs are seeking recoveries under new theories of liability that might not be subject to the caps on damages. Many of these actions involve large claims and significant costs for legal defense. To protect us from the vulnerability to the potentially significant costs arising from these claims, we maintain claims-made professional and general liability insurance coverage in excess of those amounts for which we are self-insured. We believe the insurance coverage we maintain is sufficient to cover potential losses of our operations. Our insurance coverage, however, may not continue to be available in the future at a reasonable cost for us to maintain adequate levels of insurance. Additionally, our insurance coverage does not cover all claims against us, such as fines, penalties, or other damage and legal expense payments resulting from qui tam lawsuits. We cannot predict the outcome of current or future legal actions against us or the effect that judgments or settlements in such matters may have on us or on our insurance costs. Additionally, all professional and general liability insurance we purchase is subject to policy limitations. If the aggregate limit of any of our professional and general liability policies is exhausted, in whole or in part, it could deplete or reduce the limits available to pay any other material claims applicable to that policy period. Furthermore, one or more of our insurance carriers could become insolvent and unable to fulfill its or their obligations to defend, pay or reimburse us when those obligations become due. In that case, or if payments of claims exceed our estimates or are not covered by our insurance, it could have an adverse effect on our business, financial condition or results of operations. Although CHS has agreed to indemnify us for certain legal proceedings and our loss contingencies relating to outcomes or events occurring prior to the closing of the Spin-off, we cannot guarantee that any such legal proceedings or loss contingencies will be covered by such indemnities or that CHS will fully indemnify us thereunder.
Our operations could be impaired by a failure of our information systems.
The operation of our information systems is critical to our business operations. We entered into various transition services agreements with CHS that define agreed upon services to be provided by CHS to us. The transition services agreements generally have terms of five years and include, among others, services related to information technology, payroll processing, certain human resources functions, patient eligibility screening, billing, collections and other revenue management services. The majority of our information systems are managed by CHS under the terms of these agreements. In general, information systems may be vulnerable to damage from a variety of sources, including telecommunications or network failures, human acts and natural disasters. We believe that CHS takes precautionary measures to prevent problems that could affect our business operations as a result of failure or disruption to their information systems. It is possible that we may be impacted by information system failures. The occurrence of any information system failures could result in interruptions, delays, loss or corruption of data and cessations or interruptions in the availability of these systems. All of these events or circumstances, among others, could have an adverse effect on our business, results of operations, financial position and cash flows, and they could harm our business reputation.
A cyber-attack or security breach could result in the compromise of our facilities, confidential patient data or critical systems and give rise to potential harm to patients, remediation and other expenses, expose us to liability under HIPAA, consumer protection laws, common law or other legal theories, subject us to litigation and federal and state governmental inquiries, damage our reputation, and otherwise be disruptive to our business.
We rely extensively on our computer systems to manage clinical and financial data, to communicate with our patients, payors, vendors and other third parties, and to summarize and analyze our operating results. We have made significant investments in technology to protect our systems and information from cyber-security risks. During the second quarter of 2014, the computer network of CHS was the target of an external, criminal cyber-attack in which the attacker successfully copied and transferred certain data outside CHS. This data included certain non-medical patient identification data (such as patient names, addresses, birthdates, telephone numbers and social security numbers) considered protected under HIPAA, but did not include patient credit card, medical or clinical information. The remediation efforts in response to the attack included continued development and enhancement of our controls, processes and practices designed to protect our systems, computers, software, data and networks from attack, damage or unauthorized access.
38
We have implemented security measures to protect the confidentiality, integrity and availability of this data and the systems and devices that store and transmit such data. We utilize current security technologies, and our defenses are monitored and routinely tested internally and by external parties. Despite these efforts, threats from malicious persons and groups, new vulnerabilities and advanced new attacks against information systems create risk of cyber-security incidents. There can be no assurance that we, or our third-party vendors, will not be subject to cyber-attacks or security breaches in the future. Such attacks or breaches could impact the integrity, availability or privacy of protected patient medical data or other information subject to privacy laws or disrupt our information technology systems, medical devices or business, including our ability to provide various healthcare services. Additionally, growing cyber-security threats related to the use of ransomware and other malicious software threaten the access and utilization of critical information technology and data. As a result, cyber-security and the continued development and enhancement of our controls, process and practices designed to protect our information systems and data from attack, damage or unauthorized access remain a priority for us. Our ability to recover from a ransomware or other cyber-attack is dependent on these practices, including successful backup systems and other recovery procedures. As cyber-threats continue to evolve, we may be required to invest in significant additional resources to continue to modify or enhance our protective measures or to investigate and remediate any information security vulnerabilities. If we are subject to cyber-attacks or security breaches in the future, this could result in harm to patients; business interruptions and delays; the loss, misappropriation, corruption or unauthorized access of data; litigation and potential liability under privacy, security and consumer protection laws or other applicable laws; reputational damage and federal and state governmental inquiries, any of which could have an adverse effect on our business, results of operations, financial position and cash flows.
The industry trend toward value-based purchasing may negatively impact our revenues.
The trend toward value-based purchasing of healthcare services is gaining momentum across the U.S. healthcare industry among both governmental and commercial payors. Generally, value-based purchasing initiatives tie reimbursement payments to the quality and efficiency of patient care. For example, hospitals that fall into the lowest-performing 25% of national risk-adjusted HAC rates for all hospitals in the previous year are subject to a 1% reduction in their total Medicare reimbursement payments. Further, hospitals do not receive Medicare reimbursement payments for care related to HACs. In addition, HHS reduces Medicare inpatient hospital reimbursement payments for all discharges by a required percentage, set at 2% for federal fiscal year 2017 and for subsequent years, and pools the amount collected from these reductions to fund payments to reward hospitals that meet or exceed certain quality performance standards. Hospitals are also required to report certain quality data to receive full reimbursement updates under both the Medicare and Medicaid programs.
HHS has indicated that it is particularly focused on tying Medicare payments to quality or value through alternative payment models, which generally aim to make providers attentive to the quality and cost of care they deliver to patients. Examples of alternative payment models include ACOs and bundled payment arrangements. While participation in bundled payment programs is voluntary, CMS has indicated that it is developing more bundled payment models, although it is unclear whether they will successfully lead to increased coordination of care and cost containment. It is possible that the adoption of alternative payment models will decrease the aggregate reimbursements under federal and state healthcare programs.
Several of the largest commercial insurance payors in the United States have also expressed the intent to increase reliance on value-based purchasing. Furthermore, many large commercial insurance payors require hospitals to report quality data, and several commercial payors do not reimburse hospitals for certain preventable adverse events.
We expect value-based purchasing programs, including programs that condition reimbursement rates on patient outcome measures, to become more common and to involve a higher percentage of reimbursement payment amounts under both governmental and non-governmental programs and plans. We are unable at this time to predict how this trend will affect our results of operations, but it could negatively impact our revenues, operating costs, or both.
Certificate of need laws and regulations regarding licenses, ownership and operation may impair our future expansion or divestiture opportunities in some states. In states without certificate of need laws, our providers may face lower barriers to entry, but could also face increased competition from other providers.
Some states require prior approval for the purchase, construction and expansion of healthcare facilities based on the state’s determination of need for additional or expanded healthcare facilities or services. In addition, certain states in which we operate hospitals require a CON for, among other things, capital expenditures exceeding a prescribed amount and changes in bed capacity or healthcare service lines. We may not be able to obtain CONs required for expansion activities that we want to pursue in the future. In addition, we are required to maintain one or more licenses in all of the states in which we operate hospitals. If we fail to obtain a required CON or license, our ability to operate or expand our operations in those states could be negatively impacted. Furthermore, if a CON or other prior approval upon which we relied to invest in construction of a replacement or expanded healthcare facility were to be revoked or lost through an appeal process, we may not be able to recover the value of our investment.
Some states in which we operate do not require CONs for the purchase, construction and expansion of healthcare facilities or services. Additionally, from time to time, states with existing requirements may repeal or limit the scope of their CON programs for future entry. In these cases, our competing healthcare providers could face lower barriers to entry and expansion into certain states where we operate hospitals. We could face decreased market share and revenues if competing healthcare providers are able to
39
purchase, construct or expand healthcare facilities, without being subject to regulatory approval, into markets that are in close proximity to those in which we operate hospitals.
If we acquire hospitals with unknown or contingent liabilities, we could become liable for material obligations.
Hospitals that we acquire may have unknown or contingent liabilities, including liabilities for failure to comply with healthcare laws and regulations. Although we plan to generally seek indemnification from sellers covering these matters, we may nevertheless have material liabilities for past activities of acquired hospitals.
State efforts to regulate the sale of hospitals operated by municipal or not-for-profit entities could prevent us from acquiring these types of hospitals and executing on our business strategy.
Many states have adopted legislation regarding the sale or other disposition of hospitals operated by municipalities or not-for-profit entities. In some states that do not have specific legislation, the attorneys general have demonstrated an interest in these transactions under their general obligation to protect the use of charitable assets. These legislative and administrative efforts focus primarily on the appropriate valuation of the assets divested and the use of the proceeds of the sale by the non-profit seller. The review and, in some instances, approval processes can add additional time to the closing of a hospital acquisition. In addition, future state actions could delay or even prevent our ability to acquire these types of hospitals.
Quorum Health Resources, while subject to various risk factors affecting its hospital industry clients, is subject to additional risks related to its unique business model.
The various risk factors stated herein that could result in adverse impacts on the results of operations of our hospitals could similarly affect the hospital and other healthcare clients of our QHR business. Any negative impact on our QHR clients could result in defaults under or terminations of one or more of our contracts, or could result in our inability to attract new management advisory and consulting business. Furthermore, QHR could be subject to allegations of mismanagement, as well as assertions of participation in incidents of alleged malpractice in its position as a management advisor to certain hospital clients. It is possible that resolutions of these actions could require settlements from us that exceed the revenues received from the related hospital client, and this could have a negative impact on our results of operations, financial position and cash flows.
Changes in tax laws or their interpretations, or becoming subject to additional federal, state or local taxes, could negatively affect our business, financial condition and results of operations.
We are subject to extensive tax liabilities, including federal and state taxes such as excise, sales/use, payroll, franchise, withholding, and ad valorem taxes. Changes in tax laws or their interpretations could decrease the amount of revenues we receive, the value of any tax loss carryforwards and tax credits recorded on our balance sheet and the amount of our cash flow, and have a material adverse impact on our business, financial condition and results of operations. Some of our tax liabilities are subject to periodic audits by the respective taxing authority which could increase our tax liabilities. If we are required to pay additional taxes, our costs would increase and our net income would be reduced, which could have a material adverse effect on our business, financial condition and results of operations.
On December 22, 2017, President Trump signed into law H.R.1, originally known as the “Tax Cuts and Jobs Act,” which includes significant changes to the taxation of business entities. These changes include, among others, a reduction in the corporate income tax rate. We continue to examine the impact this tax reform legislation may have on our business. Notwithstanding the reduction in the corporate income tax rate, the overall impact of this tax reform is uncertain, and our business and financial condition could be adversely affected.
We have identified a material weakness in our internal control over financial reporting which, if not remediated, could adversely affect our ability to report our financial condition, results of operations or cash flows accurately and on a timely basis. Any future material weakness or deficiencies in our internal control over financial reporting could harm stockholder and business confidence in our financial reporting and, as a result, adversely affect our reputation, business or stock price.
We identified a deficiency related to the controls intended to properly document and review on a timely basis our analysis of self-pay patient accounts receivable at a more comprehensive and disaggregated level which included uninsured and insured, primarily co-pays and deductibles, self-pay accounts receivable related to our adoption of Financial Accounting Standards Board’s Accounting Standards Update (“ASU”) 2014-09 “Revenue from Contracts with Customers.” As described under “Item 9A - Controls and Procedures,” we have concluded that the deficiency constitutes a material weakness in our internal control over financial reporting and, as a result, internal control over financial reporting was not effective as of December 31, 2017.
A material weakness is a deficiency, or combination of deficiencies, in internal control over financial reporting such that there is a reasonable possibility that a material misstatement of our annual or interim consolidated financial statements will not be prevented or detected on a timely basis. Although we have developed and are implementing a plan to remediate this material weakness as described under “Item 9A - Controls and Procedures” and believe, based on our evaluation to date, that this material weakness will be remediated during 2018, we cannot assure you that this will occur within the contemplated timeframe. Moreover, we cannot assure you that we will not identify additional material weaknesses in our internal control over financial reporting in the future. If we are unable to remediate the material weakness, our ability to record, process and report financial information accurately, and to prepare
40
financial statements within the time periods specified by the rules and forms of the Securities and Exchange Commission, could be adversely affected. The occurrence of or failure to remediate the material weakness may adversely affect our reputation and business and the market price of our common stock and any other securities we may issue.
We cannot be certain that, in the future, additional material weaknesses or deficiencies will not exist or otherwise be discovered. If our efforts to address the remaining material weakness identified above are not successful, or if an additional material weakness or deficiency occurs, such weakness or deficiency could result in misstatements in our results of operations, restatements of our financial statements, a decline in the price of our common stock and stockholder confidence or other material effects on our business, reputation, results of operations, financial condition or liquidity.
Risks Related to the Spin-Off and Our Operations as an Independent Publicly Traded Company
The utilization of our federal income tax loss carryforwards may be subject to certain limitations.
As of December 31, 2017, we had a federal net operating loss (“NOL”) carryforward of approximately $125 million on a pre-tax basis available to offset future taxable income and have recorded a full valuation allowance on these federal NOL carryforwards. Any NOL arising in a taxable year ending before January 1, 2018 may only be carried forward for 20 taxable years following the taxable year of such loss. Any NOL arising in a taxable year ending on or after January 1, 2018 can be carried forward indefinitely. In addition, any NOL deduction with respect to an NOL arising in a taxable year beginning after December 31, 2017 is limited to 80% of our taxable income in the year in which deduction is taken.
Section 382 of the Internal Revenue Code (“Code”) also imposes an annual limitation on the amount of a company’s taxable income that may be offset by the NOL carryforwards if it experiences an “ownership change” as defined in Section 382 of the Code. An ownership change occurs when a company’s “5-percent shareholders,” as defined in Section 382 of the Code, collectively increase their ownership in a company by more than 50 percentage points, by value, over a rolling three-year period. This is different from a change in beneficial ownership under applicable securities laws. These ownership changes include purchases of common stock under share repurchase programs, a company’s offering of its stock, the purchase or sale of company stock by 5-percent shareholders, or the issuance or exercise of rights to acquire company stock. If an ownership change occurs, our ability to use the NOL carryforwards to offset future taxable income will be subject to an annual limitation and will depend on the amount of taxable income we generate in future periods. There is no assurance that we will be able to fully utilize the NOL carryforwards. We have recorded a full valuation allowance related to the amount of the NOL carryforwards that may not be realized.
The utilization of our state income tax loss carryforwards could be limited if we do not realize profits from our hospital operations to adequately offset these losses in the applicable states where they exist.
As of December 31, 2017, we had state income tax loss carryforwards of approximately $668 million. We expect to be able to realize a small amount of our NOL carryforwards in certain states prior to their expiration. In other states where we hope to improve our financial performance through selective profitable acquisitions of hospitals or, when needed, the divestiture of underperforming hospitals, we cannot make assurances that we will be able to fully realize the tax benefit associated with these state NOL carryforwards. As a result, we have recorded a valuation allowance to offset all or a portion of the deferred tax asset created by the NOL carryforwards in those states. We could be required to record additional valuation allowance related to our state NOL carryforwards based upon our operating results in the future, which could adversely impact our results of operations.
The Spin-off may expose us to potential liabilities arising out of state and federal fraudulent conveyance laws and legal distribution requirements.
The Spin-off could be challenged under various state and federal fraudulent conveyance laws. An unpaid creditor or an entity vested with the power of such creditor (such as a trustee or debtor-in-possession in a bankruptcy) could claim that the Spin-off left CHS insolvent or with unreasonably small capital or that CHS intended or believed it would incur debts beyond its ability to pay such debts as they mature and that CHS did not receive fair consideration or reasonably equivalent value in the Spin-off. If a court were to agree with such a plaintiff, then such court could void the Spin-off as a fraudulent transfer and could impose a number of different remedies, including without limitation, returning our assets or your shares in our company to CHS, voiding our liens and claims against CHS, or providing CHS with a claim for money damages against us in an amount equal to the difference between the consideration received by CHS and the fair market value of our company at the time of the Spin-off.
The measure of insolvency for purposes of the fraudulent conveyance laws varies depending on which jurisdiction’s law is applied. Generally, however, an entity would be considered insolvent if either the fair saleable value of its assets is less than the amount of its liabilities (including the probable amount of contingent liabilities), or it is unlikely to be able to pay its liabilities as they become due. No assurance can be given as to what standard a court would apply to determine insolvency or that a court would determine that CHS was solvent at the time of or after giving effect to the Spin-off, including the distribution of our common stock.
Under the Separation and Distribution Agreement with CHS, from and after the Spin-off, we are responsible for the debts, liabilities and other obligations related to our business. Although we do not expect to be liable for any of these or other obligations not expressly assumed by us pursuant to the Separation and Distribution Agreement, it is possible that we could be required to assume responsibility for certain obligations retained by CHS should CHS fail to pay or perform its retained obligations.
41
Risks Related to Our Common Stock
Anti-takeover provisions in our organizational documents could delay or prevent a change in control.
Certain provisions of our amended and restated certificate of incorporation and our amended and restated bylaws may delay or prevent a merger or acquisition that a stockholder may consider favorable. For example, our amended and restated certificate of incorporation and our amended and restated bylaws, among other things, authorize our Board of Directors (the “Board”) to issue one or more series of preferred stock, prohibit our shareholders from calling a special meeting of shareholders and provide that Delaware is the sole and exclusive forum for certain types of legal proceedings initiated by our shareholders. These provisions may also discourage acquisition proposals or delay or prevent a change in control, which could harm our stock price. In addition, we are subject to Section 203 of the Delaware General Corporation Law which may have an anti-takeover effect with respect to transactions not approved in advance by our Board, including discouraging takeover attempts that could have resulted in a premium over the market price for shares of our common stock.
Under the Tax Matters Agreement, we are required not to enter into any transaction involving an acquisition of our common stock, issuance of our common stock or any other transaction or, to the extent we have the right to prohibit it, to permit any such transaction, that could cause the distribution of our common stock to CHS shareholders to be taxable. We also agreed to indemnify CHS for any tax resulting from any such transactions. Generally, CHS will recognize taxable gain on the distribution of our common stock if there are one or more acquisitions or issuances of our common stock, directly or indirectly, representing 50% or more, measured by vote or value, of our then-outstanding common stock, and the acquisition or issuance is deemed to be part of a plan or series of related transactions that include the distribution of common stock to CHS shareholders. Any such shares of our common stock acquired, directly or indirectly, within two years before or after the Spin-off date, with exceptions, including public trading by less-than-5% shareholders and certain compensatory stock issuances, will generally be presumed to be part of such a plan unless that presumption is rebutted. As a result, our obligations may discourage, delay or prevent a change of control of our company.
We do not plan to pay dividends on our common stock, and our indebtedness could limit our ability to pay dividends in the future.
We do not currently plan to pay a regular dividend on our common stock. The declaration of any future cash dividends and, if declared, the amount of any such dividends will be subject to our financial condition, earnings, capital requirements, financial covenants and other contractual restrictions and to the discretion of our Board. Our Board may take into account such matters as general business conditions, industry practice, our financial condition and performance, our future prospects, our cash needs and capital investment plans, income tax consequences, applicable law and such other factors as our Board may deem relevant. There can be no assurance that we will pay a dividend in the future or continue to pay any dividend if we do commence the payment of dividends.
The percentage ownership in our common stock of each shareholder may become diluted in the future.
As with any public company, the percentage ownership of our company held by an individual shareholder may become diluted because of equity issuances for acquisitions, capital market transactions or equity awards, which we may grant to officers, directors and certain of our employees. From time to time, we will issue additional options or other stock-based awards to our employees under our employee benefits plans. Such awards will have a dilutive effect on our earnings per share, which could adversely affect the market price of our common stock.
In addition, our amended and restated certificate of incorporation authorizes us to issue, without the approval of our shareholders, one or more classes or series of preferred stock having such designation, powers, preferences and relative, participating, optional and other special rights, including preferences over our common stock respecting dividends and distributions, as our Board generally may determine. The terms of one or more classes or series of preferred stock could dilute the voting power or reduce the value of our common stock. For example, we could grant the holders of preferred stock the right to elect some number of our directors in all events or on the happening of specified events or the right to veto specified transactions. Similarly, the repurchase or redemption rights or liquidation preferences we could assign to holders of preferred stock could affect the residual value of the common stock.
Item 1B.Unresolved Staff Comments
None.
42
Item 2.Properties
Corporate Office
Our corporate office is located in Brentwood, Tennessee, which is a suburb of Nashville, and our address is 1573 Mallory Lane, Brentwood, TN 37027. We occupy one building that consists of approximately 87,000 square feet of leased office space. QHR, our hospital management advisory and healthcare consulting services business, is also located in the same building. We account for the corporate office lease as a capital lease obligation. The term of the lease, including all term extensions, expires in 2038.
Hospitals
A summary of information about our hospitals as of December 31, 2017 follows:
State / Hospital | | City | | Licensed Beds (1) | | | Ownership Type |
| | | | | | | | |
Alabama (12) | | | | | | | | |
DeKalb Regional Medical Center (13) (14) | | Fort Payne | | 134 | | | Owned | |
Arkansas (12) | | | | | | | | |
Forrest City Medical Center (13) (14) | | Forrest City | | 118 | | | Leased | (2) |
Helena Regional Medical Center (13) (14) | | Helena | | 155 | | | Leased | (3) |
California | | | | | | | | |
Barstow Community Hospital (13) (14) | | Barstow | | 30 | | | Owned | |
Watsonville Community Hospital | | Watsonville | | 106 | | | Owned | |
Georgia (12) | | | | | | | | |
Fannin Regional Hospital (13) | | Blue Ridge | | 50 | | | Joint Venture | (4) |
Clearview Regional Medical Center (13) | | Monroe | | 77 | | | Owned | |
Illinois (12) | | | | | | | | |
Union County Hospital (5) (13) | | Anna | | 25 | | | Leased | (6) |
MetroSouth Medical Center | | Blue Island | | 314 | | | Owned | |
Galesburg Cottage Hospital | | Galesburg | | 173 | | | Owned | |
Gateway Regional Medical Center | | Granite City | | 338 | | | Owned | |
Heartland Regional Medical Center | | Marion | | 98 | | | Owned | |
Crossroads Community Hospital | | Mt. Vernon | | 47 | | | Owned | |
Red Bud Regional Hospital (5) (13) | | Red Bud | | 25 | | | Owned | |
Vista Medical Center East | | Waukegan | | 229 | | | Owned | |
Vista Medical Center West (7) | | Waukegan | | 70 | | | Owned | |
Kentucky (12) | | | | | | | | |
Kentucky River Medical Center (13) (14) | | Jackson | | 55 | | | Leased | (8) |
Three Rivers Medical Center (13) (14) | | Louisa | | 90 | | | Owned | |
Paul B. Hall Regional Medical Center (13) | | Paintsville | | 72 | | | Joint Venture | (9) |
Nevada (12) | | | | | | | | |
Mesa View Regional Hospital (5) (13) | | Mesquite | | 25 | | | Owned | |
New Mexico | | | | | | | | |
Mimbres Memorial Hospital (5) (13) | | Deming | | 25 | | | Owned | |
Alta Vista Regional Hospital (13) (14) | | Las Vegas | | 54 | | | Owned | |
North Carolina (12) | | | | | | | | |
Martin General Hospital (13) | | Williamston | | 49 | | | Leased | (10) |
Ohio (12) | | | | | | | | |
Affinity Medical Center | | Massillon | | 156 | | | Owned | |
Oregon (12) | | | | | | | | |
McKenzie - Willamette Medical Center | | Springfield | | 113 | | | Joint Venture | (11) |
43
State / Hospital | | City | | Licensed Beds (1) | | | | Ownership Type |
| | | | | | | | | | |
Tennessee (12) | | | | | | | | | | |
Henderson County Community Hospital (13) | | Lexington | | 45 | | | | Owned | |
McKenzie Regional Hospital | | McKenzie | | 45 | | | | Owned | |
Texas | | | | | | | | | | |
Big Bend Regional Medical Center (5) (13) | | Alpine | | 25 | | | | Owned | |
Scenic Mountain Medical Center (13) (14) | | Big Spring | | 150 | | | | Owned | |
Utah | | | | | | | | | | |
Mountain West Medical Center (13) | | Tooele | | 44 | | | | Owned | |
Wyoming | | | | | | | | | | |
Evanston Regional Hospital (13) (14) | | Evanston | | | 42 | | | | Owned | |
Total number of licensed beds at December 31, 2017 | | | | | 2,979 | | | | | |
Total number of hospitals at December 31, 2017 | | | | | 31 | | | | | |
| (1) | Licensed beds are defined as the number of beds for which the appropriate state agency licenses a hospital, regardless of whether the beds are actually available for patient use. |
| (2) | Prepaid lease expiring on February 28, 2046. |
| (3) | Prepaid lease expiring on January 1, 2025. |
| (4) | We hold a 98.21% majority ownership, as determined on December 31, 2017. |
| (5) | Designated by CMS as a critical access hospital. |
| (6) | Prepaid lease expiring on October 31, 2036. |
| (7) | Includes psychiatric and rehabilitation licensed beds. |
| (8) | Operating lease obligation expiring on June 30, 2022. |
| (9) | We hold a 97.08% majority ownership, as determined on December 31, 2017. |
| (10) | Prepaid lease expiring on October 31, 2028. |
| (11) | We hold a 92.24% majority ownership, as determined on December 31, 2017. |
| (12) | Represents a state with CON laws. |
| (13) | Represents sole community provider hospital, which is defined as the sole community provider within the county our hospital resides. |
| (14) | Represents a hospital considered a sole community hospital, as defined by Medicare regulations. |
44
Item 3.Legal Proceedings
We are subject to lawsuits and other legal matters arising in the ordinary course of our business, including claims of damages for personal injuries, medical malpractice, breach of hospital management contracts, breach of other contracts, wrongful restriction of or interference with physicians’ staffing privileges and other employment-related claims. In certain of these claims, plaintiffs request payment for damages, including punitive damages that may not be covered by our insurance policies.
Healthcare facilities are also subject to the regulation and oversight of various federal and state governmental agencies. The healthcare industry has seen numerous ongoing investigations related to compliance and billing practices and hospitals, in particular, continue to be the subject of governmental fraud and abuse programs and a primary enforcement target for the OIG and DOJ. From time to time, we detect issues of non-compliance with federal healthcare laws pertaining to claims submission and reimbursement payment practices or financial relationships with physicians. We avail ourselves of various mechanisms to address potential overpayments arising out of these issues, including repayment of claims, rebilling of claims, and participation in voluntary disclosure protocols offered by CMS and the OIG. Participating in voluntary repayment of claims and voluntary disclosure protocols can have the potential for significant settlement obligations or even enforcement action. Additionally, under the federal False Claims Act, private parties have the right to bring qui tam, or “whistleblower,” suits against healthcare facilities that submit false claims for payments to, or improperly retain overpayments from, governmental payors. Some states have adopted similar state whistleblower and false claims provisions. Qui tam or “whistleblower” actions initiated under the civil False Claims Act may be pending but placed under seal by the court to comply with the False Claims Act’s requirements for filing such suits. As a result, they could lead to proceedings without our knowledge. Certain of our healthcare facilities have received, and from time to time other healthcare facilities may receive, inquiries or subpoenas from fiscal intermediaries or federal and state agencies. Any proceedings against us may involve potentially substantial settlement amounts, as well as the possibility of civil, criminal, or administrative fines, penalties or other sanctions which could be material. Settlements of suits involving Medicare and Medicaid issues routinely require both monetary payments as well as corporate integrity agreements from the offending healthcare company. Depending on how the underlying conduct is interpreted by the inquiring or investigating federal or state agency, the resolution could have a material adverse effect on our results of operations, financial position and cash flows.
In connection with the Spin-off, CHS agreed to indemnify us for certain liabilities relating to outcomes or events occurring prior to the closing of the Spin-off, including (i) certain claims and proceedings known to be outstanding on or prior to the Spin-off and (ii) certain claims, proceedings and investigations by governmental authorities or private plaintiffs related to activities occurring at or related to our healthcare facilities prior to the closing date of the Spin-off , but only to the extent, in the case of clause (ii), that such claims are covered by insurance policies maintained by CHS, including professional and general liability and workers’ compensation liability. In this regard, CHS will continue to be responsible for certain Health Management Associates, Inc. legal matters covered by its contingent value rights agreement that relate to the portion of CHS’s business now held by us. Notwithstanding the foregoing, CHS is not indemnifying us in respect of any claims or proceedings arising out of, or related to, the business operations of QHR at any time or our compliance with the CIA with the OIG. Subsequent to the Spin-off, the OIG entered into an “Assumption of CIA Liability Letter” with us reiterating the applicability of the CIA to certain of our hospitals, although the OIG declined to enter into a separate agreement with us.
We do not control and cannot predict with certainty the progress or final outcome of discussions with government agencies, investigations and legal proceedings against us. Therefore, the final amounts paid to resolve such matters, claims and obligations could be material and could materially differ from amounts currently recorded, if any. Any such changes in our estimates or any adverse judgments could materially adversely impact our future results of operations, financial position and cash flows.
We have included a discussion of specific legal proceedings below, some of which may not be required to be disclosed in this Part I, Item 3 under SEC rules due to the nature of our business; however, we believe that the discussion of these open legal matters may provide useful information to security holders or the other readers of this Annual Report on Form 10-K. The proceedings discussed below do not include claims and lawsuits covered by professional and general liability or employment practices insurance and risk retention programs. The legal matters referenced below are also discussed in Note 19 — Commitments and Contingencies in the accompanying financial statements.
With respect to all legal, regulatory and governmental proceedings, we consider the likelihood of a negative outcome. If we determine the likelihood of a negative outcome with respect to any such matter is probable and the amount of the loss can be reasonably estimated, we record an accrual for the estimated amount of loss for the expected outcome of the matter. If the likelihood of a negative outcome with respect to material matters is reasonably possible and we are able to determine an estimate of the amount of possible loss or a range of loss, whether in excess of a related accrued liability or where there is no accrued liability, we disclose the estimate of the amount of possible loss or range of loss. However, we are unable to estimate an amount of possible loss or range of loss in some instances based on the significant uncertainties involved in, or the preliminary nature of, certain legal, regulatory and governmental matters.
Government Investigations
| • | Tooele, Utah — Physician Compensation. On May 5, 2016, our hospital in Tooele, Utah received a Civil Investigative Demand (“CID”) from the Office of the United States Attorney in Salt Lake City, Utah concerning allegations that the |
45
| | hospital and clinic corporation submitted or caused to be submitted false claims to the government for services referred by physicians with whom the hospital and clinic had inappropriate financial relationships, which allegedly violated federal law. The CID requested records and documentation concerning physician compensation. Because this matter remains at a preliminary stage, there are not sufficient facts available to assess what the outcome may be or to determine any estimate of the amount of loss or range of loss. We are fully cooperating with this investigation. |
| • | Blue Island, Illinois — Patient Status. On October 9, 2015, our hospital in Blue Island, Illinois received a CID from the Office of the United States Attorney in Chicago, Illinois concerning allegations of upcoding observation and other outpatient services and improperly falsifying inpatient admission orders. To date, the hospital has produced a significant amount of documents in response to requests for emails, medical records, and documentation concerning status change from observation to inpatient, and the government has taken CID testimony from former hospital employees. We are unable to predict the outcome of this investigation. However, it is reasonably possible that we may incur a loss in connection with this investigation. We are unable to reasonably estimate the amount or range of such reasonably possible loss given that the investigation is still ongoing. Under some circumstances, losses incurred in connection with an adverse resolution in this investigation could be material. We are fully cooperating with this investigation. |
Commercial Litigation and Other Lawsuits
| • | Arbitration with Community Health Systems, Inc. On August 4, 2017, we received a demand for arbitration from CHS seeking payment of certain amounts withheld by us pursuant to two transition services agreements. We contend that the amounts are not payable to CHS and were not properly billed by CHS under the agreements. The matter is pending before the American Arbitration Association. CHS seeks payment of approximately $9.0 million relating to two of the transition services agreements. We intend to vigorously contest the charges as not payable to CHS under the transition services agreements and have made a counterclaim for substantial damages we believe we have suffered as a result of the transition services agreements and other actions taken by CHS in connection with the Spin-off. The matter is at a preliminary stage and we cannot assess the likelihood of a material adverse outcome at this time. The arbitration has been scheduled for June 18-29, 2018. A decision is expected by early August 2018. |
| • | Zwick Partners LP and Aparna Rao, Individually and On Behalf of All Others Similarly Situated v. Quorum Health Corporation, Community Health Systems, Inc., Wayne T. Smith, W. Larry Cash, Thomas D. Miller and Michael J. Culotta. On September 9, 2016, a shareholder filed a purported class action in the United States District Court for the Middle District of Tennessee against QHC and certain of our officers. The Amended Complaint, filed on September 13, 2017, purports to be brought on behalf of a class consisting of all persons (other than defendants) who purchased or otherwise acquired securities of QHC between May 2, 2016 and August 10, 2016 and alleges that we and certain of our officers violated federal securities laws, including Sections 10(b) and/or 20(a) of the Securities Exchange Act of 1934 and Rule 10b-5 promulgated thereunder, by making alleged false and/or misleading statements and failing to disclose certain information regarding aspects of our business, operations and compliance policies. On April 17, 2017, Plaintiff filed a Second Amended Complaint adding additional defendants, Community Health Systems, Inc., Wayne T. Smith and W. Larry Cash. On June 23, 2017, we filed a motion to dismiss, which Plaintiffs opposed on August 22, 2017. We are vigorously defending ourselves in this matter. We are unable to predict the outcome of this matter. However, it is reasonably possible that we may incur a loss in connection with this matter. We are unable to reasonably estimate the amount or range of such reasonably possible loss because the motion to dismiss is still pending and discovery is stayed pending resolution of the motion to dismiss. Under some circumstances, losses incurred in connection with adverse outcomes in this matter could be material. |
| • | United Tort Claimants v. Quorum Health Resources, LLC (U.S. Bankruptcy Court for the District of New Mexico); Douthitt - Dugger, et al. v. Quorum Health Resources, LLC (Bernalillo County, New Mexico District Court). Plaintiffs in these cases underwent surgical procedures at Gerald Champion Regional Medical Center in New Mexico that they contend were experimental and performed by an unqualified doctor. Their lawsuits, originally filed starting on June 11, 2010, against the doctors, QHR and the hospital are pending in state court and in federal bankruptcy court in New Mexico. In 2012, QHR resolved plaintiffs’ claims for QHR’s liability exceeding insurance limits, and for liability not covered by insurance, for $5.1 million through a partial settlement agreement. Pursuant to this settlement agreement, the bankruptcy court has held that QHR is entitled to have language in any judgment entered in favor of the plaintiffs limiting enforcement to available insurance and not from QHR’s assets. Litigation of plaintiffs’ claims against QHR has continued, and the trial of the claims of most of the plaintiffs is proceeding in phases in a bankruptcy court bench trial. On December 23, 2016, during the liability phase, the bankruptcy court ruled that QHR was 16.5% at fault for plaintiffs’ injuries. The plaintiffs have made attempts to assert new allegations against QHR in an effort to increase the percentage of liability attributed to QHR, but the bankruptcy court has ruled against the plaintiffs as to each attempt. On January 24, 2018, the New Mexico state court ruled that collateral estoppel applies as to all rulings issued by the bankruptcy court in these matters, which includes the percentage of liability. As a result of the rulings in both courts, all that remains to be determined is the amount of damages sustained, if any, by the individual plaintiffs. The bankruptcy court has heard evidence regarding damages as to four of the plaintiffs and issued an opinion setting forth its findings January 30, 2018. |
46
| | Additional trials will be set in the bankruptcy court to hear evidence as to the remaining plaintiffs in that action. A jury will hear evidence as to the damages asserted by the plaintiffs in state court beginning November 26, 2018. QHR’s insurer, Lexington Insurance Company, is providing a defense in these cases, subject to a reservation of rights. Lexington has sued QHR in Williamson County, Tennessee seeking a declaration that plaintiffs’ claims and at least some portion of the cost of defending QHR are not covered by Lexington. (Lexington Insurance Company v. Quorum Health Resources, LLC, et al. (Williamson County, Tennessee Chancery Court)). No trial date has been set for Lexington’s claim against QHR with respect to insurance coverage, which QHR also is vigorously defending. The Tennessee court has ruled that Lexington is not entitled to reimbursement of defense costs. Lexington is seeking appellate review of this ruling. We are unable to predict the outcome of this matter. However, it is reasonably possible that we may incur a loss in connection with this matter. We are unable to reasonably estimate the amount or range of such reasonably possible loss because the proceedings with respect to the merits of the New Mexico state court action, the availability and extent of insurance coverage and damages are not sufficiently advanced. Under some circumstances, losses incurred in connection with adverse outcomes in this matter could be material. |
| • | R2 Investments, LDC v. Quorum Health Corporation, Community Health Systems, Inc., Wayne T. Smith, W. Larry Cash, Thomas D. Miller, Michael J. Culotta, John A. Clerico, James S. Ely, III, John A. Fry, William Norris Jennings, Julia B. North, H. Mitchell Watson, Jr. and H. James Williams. On October 25, 2017, a shareholder filed an action in the Circuit Court of Williamson County, Tennessee against us and certain of our officers and directors and CHS and certain its officers and directors. The complaint alleges that the defendants violated the Tennessee Securities Act and common law by, among other things, making alleged false and/or misleading statements and failing to disclose certain information regarding aspects of our business, operations and financial condition. Plaintiff is seeking rescissionary, compensatory, and punitive damages. We filed a motion to dismiss the action on January 16, 2018. We are vigorously defending ourselves in this matter. Given the early stage of this matter, there are not sufficient facts available to reasonably assess the potential outcome of this matter or reasonably assess any estimate of the amount or range of any potential outcome. |
Corporate Integrity Agreement
On August 4, 2014, CHS became subject to the terms of a five-year CIA with the OIG arising from a civil settlement with the U.S. Department of Justice, other federal agencies and identified relators that concluded previously announced investigations and litigation related to short stay admissions through emergency departments at certain of their affiliated hospitals. The OIG has required us to be bound by the terms of the CHS CIA commencing on the Spin-off date and applying to us for the remainder of the five-year compliance term required of CHS, which terminates on August 4, 2019.
The compliance measures and the reporting and auditing requirements contained in the CIA include:
| • | continuing the duties and activities of the Corporate Compliance Officer, Corporate Compliance Work Group, and Facility Compliance Officers and committees; |
| • | maintaining a written Code of Conduct, which sets forth our commitment to full compliance with all statutes, regulations, and guidelines applicable to federal healthcare programs; |
| • | maintaining written policies and procedures addressing matters included in our Compliance Program, including adherence to medical necessity and admissions standards for inpatient hospital stays; |
| • | continuing general compliance training; |
| • | providing specific training for employees and affiliates handling our billing, case management and clinical documentation; |
| • | engaging an independent third party to perform an annual review of our compliance with the CIA; |
| • | continuing the Confidential Disclosure Program and hotline to enable employees or others to disclose issues or questions regarding possible inappropriate policies or behavior; |
| • | continuing the screening program to ensure that we do not hire or engage employees or contractors who are ineligible persons for federal healthcare programs; |
| • | reporting any material deficiency which resulted in an overpayment to us by a federal healthcare program; and |
| • | submitting annual reports to the OIG which describe in detail the operations of the corporate Compliance Program. |
A material, uncorrected violation of the CIA could lead to our suspension or disbarment from participation in Medicare, Medicaid and other federal and state healthcare programs. In addition, we are subject to possible civil penalties if we fail to substantially comply with the terms of the CIA, including stipulated penalties ranging from $1,000 to $2,500 per day. We are also subject to a stipulated penalty of $50,000 for each false certification by us or any individual or entity on behalf of us in connection with reports required under the CIA. The CIA increases the amount of information we are required to provide to the federal government regarding our healthcare practices and our compliance with federal regulations. We believe that we are currently operating our business in
47
compliance with the CIA and are unaware of any historical actions on our part that could represent a violation under the terms of the CIA.
Item 4.Mine Safety Disclosures
Not applicable.
48
PART II
Item 5. | Market for Registrant’s Common Equity, Related Stockholder Matters and Issuer Purchases of Equity Securities |
Market Information for Common Stock
Our common stock is listed on the NYSE under the symbol “QHC”. Since May 2, 2016, our common stock has been trading on the NYSE. The following table sets forth, in the periods indicated, the high and low sales prices per share of our common stock as reported by the NYSE:
| | | | | | High | | | Low | |
| | | | | | | | | | | | |
Year Ended December 31, 2017 | | | | | | | | | | | | |
First quarter | | | | | | $ | 9.45 | | | $ | 5.12 | |
Second quarter | | | | | | | 5.57 | | | | 2.54 | |
Third quarter | | | | | | | 5.18 | | | | 2.91 | |
Fourth quarter | | | | | | | 7.24 | | | | 3.85 | |
| | | | | | | | | | | | |
Year Ended December 31, 2016 | | | | | | | | | | | | |
May 2, 2016 through June 30, 2016 | | | | | | $ | 13.52 | | | $ | 8.82 | |
Third quarter | | | | | | | 11.59 | | | | 4.12 | |
Fourth quarter | | | | | | | 8.24 | | | | 3.75 | |
On March 12, 2018, the last reported sales price for our common stock on the NYSE was $6.23 per share.
Stockholders
As of March 12, 2018, there were 149 holders of record of shares of our common stock.
Dividends
We have never declared or paid cash dividends on our common stock. We intend to retain future earnings to finance the growth and development of our business and, accordingly, do not currently intend to declare or pay any cash dividends on our common stock. Our Board will evaluate our future results of operations, financial condition and capital requirements in determining whether to declare or pay cash dividends. Delaware law prohibits us from paying any dividends unless we have capital surplus or net profits available for this purpose. In addition, we are restricted by the terms of our existing indebtedness, including our Credit Agreements (as defined herein) and Senior Notes, on our ability to pay dividends.
Stock Performance
The graph below compares the quarterly percentage change of cumulative total stockholder return on our common stock with (1) the cumulative total return of a broad equity market index, the Russell 2000 Index (the “Broad Index”) and (2) the cumulative total return of a published industry index, the S&P Health Care Facilities Index (the “Industry Index”). The graph begins on May 2, 2016, the first day of trading of our common stock. The comparison assumes the investment of $100 on such date in each of our common stock, the Broad Index and the Industry Index and assumes the re-investment of all dividends, if any.
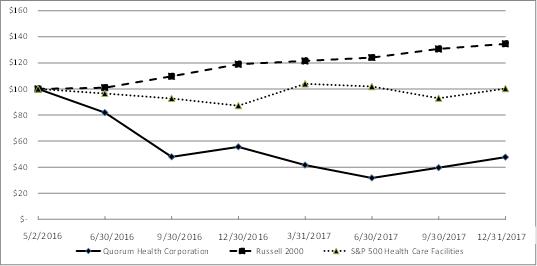
49
The following table presents the corresponding data for the periods shown in the graph:
| | May 2, | | | June 30, | | | September 30, | | | December 31, | |
| | 2016 | | | 2016 | | | 2016 | | | 2016 | |
| | | | | | | | | | | | | | | | |
Quorum Health Corporation | | $ | 100.00 | | | $ | 81.88 | | | $ | 47.94 | | | $ | 55.58 | |
Russell 2000 | | | 100.00 | | | | 100.96 | | | | 109.71 | | | | 118.95 | |
S&P 500 Healthcare Facilities | | | 100.00 | | | | 96.51 | | | | 92.70 | | | | 87.17 | |
| | | | | | | | | | | | | | | | |
| | March 31, | | | June 30, | | | September 30, | | | December 31, | |
| | 2017 | | | 2017 | | | 2017 | | | 2017 | |
| | | | | | | | | | | | | | | | |
Quorum Health Corporation | | $ | 41.59 | | | $ | 31.73 | | | $ | 39.60 | | | $ | 47.71 | |
Russell 2000 | | | 121.47 | | | | 124.05 | | | | 130.67 | | | | 134.59 | |
S&P 500 Healthcare Facilities | | | 103.93 | | | | 101.88 | | | | 92.87 | | | | 100.22 | |
Recent Purchases of Equity Securities by the Issuer and Affiliated Purchasers
The following table sets forth certain information with respect to purchases made by us of our own common stock during the three months ended December 31, 2017:
| | | | | | | | | | Total Number of | | | Maximum Number | |
| | | | | | | | | | Shares Purchased | | | of Shares that May | |
| | Total Number | | | Weighted- | | | as Part of Publicly | | | Yet be Purchased | |
| | of Shares | | | Average Price | | | Announced Plans | | | Under the Plans | |
Period | | Purchased (1) | | | Paid per Share | | | or Programs | | | or Programs | |
| | | | | | | | | | | | | | | | |
October 1, 2017 - October 31, 2017 | | | 1,058 | | | $ | 5.38 | | | | — | | | | — | |
November 1, 2017 - November 30, 2017 | | | — | | | | — | | | | — | | | | — | |
December 1, 2017 - December 31, 2017 | | | — | | | | — | | | | — | | | | — | |
Total | | | 1,058 | | | | 5.38 | | | | — | | | | — | |
| (1) | Includes shares acquired by us of our own common stock in connection with the satisfaction of tax withholding obligations on vested restricted stock. |
50
Item 6.Selected Financial Data
We have set forth in the tables below selected financial data that has been derived from our audited consolidated and combined financial statements as of and for the years ended December 31, 2017, 2016, 2015, 2014 and 2013. These financial statements may not necessarily be indicative of our results of operations, financial position and cash flows that would have occurred if we operated on a stand-alone basis during the entirety of the periods presented herein.
Consolidated and combined is used to define our financial statements for the reported periods presented herein. Our financial statements include amounts and disclosures related to the stand-alone financial statements and accounting records of QHC after the Spin-off (“consolidated”) in combination with amounts and disclosures that have been derived from the consolidated financial statements and accounting records of CHS for the periods prior to the completion of the Spin-off on April 29, 2016 (“combined”).
You should read the information below in conjunction with “Item 7. Management’s Discussion and Analysis of Financial Condition and Results of Operations” and “Item 8. Financial Statements and Supplementary Data” that are included in this Annual Report on Form 10-K. Certain prior period amounts have been reclassified to conform to the current presentation. Certain information in the table entitled “Other Financial and Operating Data” is derived from our consolidated and combined operations and is unaudited (dollars in thousands, except earnings per share):
| | Year Ended December 31, | |
| | 2017 | | | 2016 | | | 2015 | | | 2014 | | | 2013 | |
| | | | | | | | | | | | | | | | | | | | |
Statements of income data: | | | | | | | | | | | | | | | | | | | | |
Operating revenues, net of contractual allowances and discounts | | $ | 2,327,655 | | | $ | 2,419,053 | | | $ | 2,445,858 | | | $ | 2,410,002 | | | $ | 2,235,437 | |
Provision for bad debts | | | 255,485 | | | | 280,586 | | | | 258,520 | | | | 264,502 | | | | 287,822 | |
Net operating revenues | | | 2,072,170 | | | | 2,138,467 | | | | 2,187,338 | | | | 2,145,500 | | | | 1,947,615 | |
Operating costs and expenses: | | | | | | | | | | | | | | | | | | | | |
Salaries and benefits | | | 1,034,797 | | | | 1,057,119 | | | | 1,016,696 | | | | 1,012,618 | | | | 957,086 | |
Supplies | | | 250,523 | | | | 258,639 | | | | 249,792 | | | | 244,590 | | | | 226,561 | |
Other operating expenses | | | 623,063 | | | | 645,802 | | | | 634,233 | | | | 619,808 | | | | 557,783 | |
Depreciation and amortization | | | 82,155 | | | | 117,288 | | | | 128,001 | | | | 127,593 | | | | 106,557 | |
Rent | | | 50,230 | | | | 49,883 | | | | 48,729 | | | | 48,319 | | | | 43,092 | |
Electronic health records incentives earned | | | (4,745 | ) | | | (11,482 | ) | | | (25,779 | ) | | | (44,660 | ) | | | (34,026 | ) |
Legal, professional and settlement costs | | | 6,001 | | | | 7,342 | | | | — | | | | 30,374 | | | | 20,544 | |
Impairment of long-lived assets and goodwill | | | 47,281 | | | | 291,870 | | | | 13,000 | | | | 1,000 | | | | 8,000 | |
Loss (gain) on sale of hospitals, net | | | (5,243 | ) | | | 2,150 | | | | — | | | | — | | | | — | |
Transaction costs related to the Spin-off | | | 253 | | | | 5,488 | | | | 16,337 | | | | — | | | | — | |
Total operating costs and expenses | | | 2,084,315 | | | | 2,424,099 | | | | 2,081,009 | | | | 2,039,642 | | | | 1,885,597 | |
Income (loss) from operations | | | (12,145 | ) | | | (285,632 | ) | | | 106,329 | | | | 105,858 | | | | 62,018 | |
Interest expense, net | | | 122,077 | | | | 113,440 | | | | 98,290 | | | | 92,926 | | | | 99,465 | |
Income (loss) before income taxes | | | (134,222 | ) | | | (399,072 | ) | | | 8,039 | | | | 12,932 | | | | (37,447 | ) |
Provision for (benefit from) income taxes | | | (21,865 | ) | | | (53,875 | ) | | | 3,304 | | | | 5,579 | | | | (12,102 | ) |
Net income (loss) | | | (112,357 | ) | | | (345,197 | ) | | | 4,735 | | | | 7,353 | | | | (25,345 | ) |
Less: Net income (loss) attributable to noncontrolling interests | | | 1,833 | | | | 2,491 | | | | 3,398 | | | | (448 | ) | | | (1,323 | ) |
Net income (loss) attributable to Quorum Health Corporation | | $ | (114,190 | ) | | $ | (347,688 | ) | | $ | 1,337 | | | $ | 7,801 | | | $ | (24,022 | ) |
| | | | | | | | | | | | | | | | | | | | |
Earnings (loss) per share attributable to Quorum Health Corporation stockholders: | | | | | | | | | | | | | | | | | | | | |
Basic and diluted | | $ | (4.06 | ) | | $ | (12.24 | ) | | $ | 0.05 | | | $ | 0.27 | | | $ | (0.85 | ) |
Weighted-average shares outstanding: | | | | | | | | | | | | | | | | | | | | |
Basic and diluted | | | 28,113,566 | | | | 28,413,247 | | | | 28,412,054 | | | | 28,412,054 | | | | 28,412,054 | |
51
| | December 31, | |
| | 2017 | | | 2016 | | | 2015 | | | 2014 | | | 2013 | |
| | | | | | | | | | | | | | | | | | | | |
Balance sheets data: | | | | | | | | | | | | | | | | | | | | |
Cash and cash equivalents | | $ | 5,617 | | | $ | 25,455 | | | $ | 1,106 | | | $ | 2,559 | | | $ | 873 | |
Patient accounts receivable, net | | | 343,145 | | | | 380,685 | | | | 390,890 | | | | 374,252 | | | | 314,016 | |
Property and equipment, net | | | 675,279 | | | | 733,900 | | | | 880,249 | | | | 913,312 | | | | 871,637 | |
Total assets | | | 1,828,841 | | | | 1,994,370 | | | | 2,294,856 | | | | 2,368,439 | | | | 2,062,525 | |
Long-term debt, including current maturities and Due to Parent, net | | | 1,213,890 | | | | 1,246,825 | | | | 1,824,323 | | | | 1,781,360 | | | | 1,535,677 | |
Other long-term liabilities, including deferred income taxes | | | 145,728 | | | | 140,470 | | | | 149,171 | | | | 214,581 | | | | 194,236 | |
Total liabilities | | | 1,713,106 | | | | 1,771,994 | | | | 2,269,955 | | | | 2,358,159 | | | | 2,052,214 | |
Redeemable noncontrolling interests | | | 2,325 | | | | 6,807 | | | | 8,958 | | | | 2,362 | | | | 3,131 | |
Total equity | | | 113,410 | | | | 215,569 | | | | 15,943 | | | | 7,918 | | | | 7,180 | |
| | Year Ended December 31, | |
| | 2017 | | | 2016 | | | 2015 | | | 2014 | | | 2013 | |
| | | | | | | | | | | | | | | | | | | | |
Statements of cash flow data: | | | | | | | | | | | | | | | | | | | | |
Cash flows from operating activities | | $ | 66,970 | | | $ | 81,086 | | | $ | 42,889 | | | $ | 43,044 | | | $ | 90,114 | |
Cash flows from investing activities | | | (38,267 | ) | | | (73,146 | ) | | | (78,592 | ) | | | (272,098 | ) | | | (129,473 | ) |
Cash flows from financing activities | | | (48,541 | ) | | | 16,409 | | | | 34,250 | | | | 230,740 | | | | 38,875 | |
Net change in cash and cash equivalents | | $ | (19,838 | ) | | $ | 24,349 | | | $ | (1,453 | ) | | $ | 1,686 | | | $ | (484 | ) |
| | | | | | | | | | | | | | | | | | | | |
Other financial and operating data (unaudited): | | | | | | | | | | | | | | | | | | | | |
Net inpatient revenues, before the provision for bad debts | | $ | 1,003,104 | | | $ | 1,033,065 | | | $ | 1,008,139 | | | $ | 1,058,572 | | | $ | 982,669 | |
Net outpatient revenues, before the provision for bad debts | | $ | 1,227,228 | | | $ | 1,280,912 | | | $ | 1,323,853 | | | $ | 1,237,625 | | | $ | 1,132,448 | |
Adjusted EBITDA (1) | | $ | 141,845 | | | $ | 162,922 | | | $ | 263,667 | | | $ | 264,825 | | | $ | 197,119 | |
Adjusted EBITDA, Adjusted for Divestitures (1) | | $ | 162,482 | | | $ | 196,028 | | | $ | 270,074 | | | $ | 266,229 | | | $ | 196,701 | |
Number of licensed beds at end of period (2) | | | 2,979 | | | | 3,459 | | | | 3,582 | | | | 3,635 | | | | 3,390 | |
Admissions (3) | | | 88,504 | | | | 95,313 | | | | 98,378 | | | | 101,217 | | | | 97,686 | |
Adjusted admissions (4) | | | 217,583 | | | | 235,263 | | | | 240,841 | | | | 236,228 | | | | 212,557 | |
Emergency room visits (5) | | | 660,246 | | | | 726,155 | | | | 730,021 | | | | 685,530 | | | | 575,850 | |
Medicare case mix index (6) | | | 1.43 | | | | 1.38 | | | | 1.34 | | | | 1.33 | | | | 1.34 | |
| (1) | EBITDA is a non-GAAP financial measure that consists of net income (loss) before interest, income taxes, depreciation and amortization. Adjusted EBITDA, also a non-GAAP financial measure, is EBITDA adjusted to add back the effect of certain legal, professional and settlement costs, impairment of long-lived assets and goodwill, net loss (gain) on sale of hospitals, transaction costs related to the Spin-off, post-spin headcount reductions and change in estimate related to collectability of patient accounts receivable. We use Adjusted EBITDA as a measure of financial performance. Adjusted EBITDA is a key measure used by our management to assess the operating performance of our hospital operations business and to make decisions on the allocation of resources. Additionally, management utilizes Adjusted EBITDA in assessing our consolidated results of operations and in comparing our results of operations between periods. Adjusted EBITDA, Adjusted for Divestitures, also a non-GAAP financial measure, is further retrospectively adjusted to exclude the effect of EBITDA of hospitals divested. We present Adjusted EBITDA and Adjusted EBITDA, Adjusted for Divestitures because management believes these measures provide investors and other users of our financial statements with additional information about how management assesses the results of operations. |
Adjusted EBITDA and Adjusted EBITDA, Adjusted for Divestitures are not measurements of financial performance under U.S. GAAP. These calculations should not be considered in isolation or as a substitute for net income, operating income or any other measure calculated in accordance with U.S. GAAP. The items excluded from Adjusted EBITDA and Adjusted EBITDA, Adjusted for Divestitures are significant components in understanding and evaluating the Company’s financial performance. Management believes such adjustments are appropriate, as the magnitude and frequency of such items can vary significantly and are not related to the assessment of normal operating performance. Additionally, our calculation of Adjusted EBITDA and Adjusted EBITDA, Adjusted for Divestitures may not be comparable to similarly titled measures reported by other companies.
Our Credit Agreements use Adjusted EBITDA Adjusted for Divestitures, subject to further permitted adjustments, for certain financial covenants. Management believes that it is useful to present Adjusted EBITDA and Adjusted EBITDA, Adjusted for Divestitures because these measures, as defined, provide investors with additional information about our ability to incur and service debt and make capital expenditures.
52
The following table reconciles Adjusted EBITDA and Adjusted EBITDA, Adjusted for Divestitures, each as defined above, to net income (loss), the most directly comparable U.S. GAAP financial measure, as derived directly from our consolidated and combined financial statements for the respective periods (in thousands):
| | Year Ended December 31, | |
| | 2017 | | | 2016 | | | 2015 | | | 2014 | | | 2013 | |
| | | | | | | | | | | | | | | | | | | | |
Adjusted EBITDA components (unaudited): | | | | | | | | | | | | | | | | | | | | |
Net income (loss) | | $ | (112,357 | ) | | $ | (345,197 | ) | | $ | 4,735 | | | $ | 7,353 | | | $ | (25,345 | ) |
Interest expense, net | | | 122,077 | | | | 113,440 | | | | 98,290 | | | | 92,926 | | | | 99,465 | |
Provision for (benefit from) income taxes | | | (21,865 | ) | | | (53,875 | ) | | | 3,304 | | | | 5,579 | | | | (12,102 | ) |
Depreciation and amortization | | | 82,155 | | | | 117,288 | | | | 128,001 | | | | 127,593 | | | | 106,557 | |
EBITDA | | | 70,010 | | | | (168,344 | ) | | | 234,330 | | | | 233,451 | | | | 168,575 | |
Legal, professional and settlement costs | | | 6,001 | | | | 7,342 | | | | — | | | | 30,374 | | | | 20,544 | |
Impairment of long-lived assets and goodwill | | | 47,281 | | | | 291,870 | | | | 13,000 | | | | 1,000 | | | | 8,000 | |
Loss (gain) on sale of hospitals, net | | | (5,243 | ) | | | 2,150 | | | | — | | | | — | | | | — | |
Transaction costs related to the Spin-off | | | 253 | | | | 5,488 | | | | 16,337 | | | | — | | | | — | |
Post-spin headcount reductions | | | 2,543 | | | | 1,617 | | | | — | | | | — | | | | — | |
Change in estimate related to collectability of patient accounts receivable | | | 21,000 | | | | 22,799 | | | | — | | | | — | | | | — | |
Adjusted EBITDA | | | 141,845 | | | | 162,922 | | | | 263,667 | | | | 264,825 | | | | 197,119 | |
Negative (Positive) EBITDA of divested hospitals | | | 20,637 | | | | 33,106 | | | | 6,407 | | | | 1,404 | | | | (418 | ) |
Adjusted EBITDA, Adjusted for Divestitures | | $ | 162,482 | | | $ | 196,028 | | | $ | 270,074 | | | $ | 266,229 | | | $ | 196,701 | |
| (2) | Licensed beds are the number of beds for which the appropriate state agency licenses a hospital regardless of whether the beds are actually available for patient use. |
| (3) | Admissions represent the number of patients admitted for inpatient services. |
| (4) | Adjusted admissions are computed by multiplying admissions by gross patient revenues and then dividing that number by gross inpatient revenues. |
| (5) | Emergency room visits represent the number of patients registered and treated in our emergency rooms. |
| (6) | Medicare case mix index is a relative value assigned to a diagnosis-related group of patients that is used in determining the allocation of resources necessary to treat the patients in that group. Medicare case mix index is calculated as the average case mix index for all Medicare admissions during the period. |
53
Item 7. | Management’s Discussion and Analysis of Financial Condition and Results of Operations |
You should read the following discussion of our results of operations, financial condition and cash flows, together with the audited consolidated and combined financial statements and the accompanying notes included in this Annual Report on Form 10-K. The financial information discussed may not necessarily reflect what our results of operations, financial position and cash flows would have been if we were a stand-alone company for the entirety of the periods presented herein or what our results of operations, financial condition and cash flows may be in the future.
All references to our financial statements, results of operations, financial condition, financial position, cash flows, liquidity, indebtedness and our business refer to the results of QHC derived from the audited consolidated and combined financial statements and the accompanying notes included in “Item 8. Financial Statements and Supplementary Data.” All references to our financial outlook refer to the anticipated unaudited consolidated results of QHC derived from management’s best estimate as of the date of filing of this Annual Report on Form 10-K.
Forward Looking Statements
Some of the matters discussed in this Annual Report on Form 10-K include forward-looking statements. Statements that are predictive in nature, that depend upon or refer to future events or conditions or that include words such as “expects,” “anticipates,” “intends,” “plans,” “believes,” “estimates,” “thinks,” and similar expressions are forward-looking statements. These statements involve known and unknown risks, uncertainties and other factors that may cause our actual results and performance to be materially different from any future results or performance expressed or implied by these forward-looking statements.
These factors include, but are not limited to, the following:
| • | general economic and business conditions, both nationally and in the regions in which we operate; |
| • | risks associated with our substantial indebtedness, leverage and debt service obligations, including our ability to comply with our debt covenants, including our senior credit facility, as amended; |
| • | our ability to successfully make acquisitions or complete divestitures and the timing thereof, our ability to complete any such acquisitions or divestitures on desired terms or at all, and our ability to realize the intended benefits from any such acquisitions or divestitures; |
| • | changes in reimbursement methodologies and rates paid by federal or state healthcare programs, including Medicare and Medicaid, or commercial payors, and the timeliness of reimbursement payments, including delays in certain states in which we operate; |
| • | the extent to which regulatory and economic changes occur in Illinois, where a material portion of our revenues are concentrated; |
| • | the impact of changes made to the Affordable Care Act, the potential for repeal or additional changes to the Affordable Care Act, its implementation or its interpretation, as well as changes in other federal, state or local laws or regulations affecting the healthcare industry; |
| • | increases in the amount and risk of collectability of patient accounts receivable, including lower collectability levels which may result from, among other things, self-pay growth and difficulties in collecting payments for which patients are responsible, including co-pays and deductibles; |
| • | changes in medical or other technology; |
| • | any potential impairments in the carrying values of long-lived assets and goodwill or the shortening of the useful lives of long-lived assets; |
| • | the impact of certain outsourcing functions, and the ability of CHS, as provider of our billing and collection services pursuant to the transition services agreements, to timely and appropriately bill and collect; |
| • | our ability to manage effectively our arrangements with third-party vendors for key non-clinical business functions and services; |
| • | the ability to achieve operating and financial targets and to control the costs of providing services if patient volumes are lower than expected; |
| • | the effects related to outbreaks of infectious diseases; |
| • | our ability to attract and retain, at reasonable employment costs, qualified personnel, key management, physicians, nurses and other healthcare workers; |
54
| • | increases in wages as a result of inflation or competition for highly technical positions and rising medical supply and drug costs due to market pressure from pharmaceutical companies and new product releases; |
| • | the impact of seasonal or severe weather conditions or earthquakes; |
| • | our ongoing ability to demonstrate meaningful use of certified EHR technology and recognize income for the related Medicare or Medicaid incentive payments, to the extent such payments have not expired; |
| • | the efforts of healthcare insurers, providers, large employer groups and others to contain healthcare costs, including the trend toward treatment of patients in less acute or specialty healthcare settings and the increased emphasis on value-based purchasing; |
| • | the failure to comply with governmental regulations; |
| • | our ability, where appropriate, to enter into, maintain and comply with provider arrangements with payors and the terms of these arrangements, which may be impacted by the increasing consolidation of health insurers and managed care companies and vertical integration efforts involving payors and healthcare providers; |
| • | the potential adverse impact of known and unknown government investigations, internal investigations, audits, and federal and state false claims act litigation and other legal proceedings, including the shareholder and creditor litigations against our company and certain of our officers and threats of litigation, as well as the significant costs and attention from management required to address such matters; |
| • | liabilities and other claims asserted against us, including self-insured malpractice claims; |
| • | the impact of cyber-attacks or security breaches; |
| • | our ability to utilize our income tax loss carryforwards and risks associated with the Tax Cuts and Jobs Act of 2017; |
| • | our ability to maintain certain accreditations at our existing facilities and any future facilities we may acquire; |
| • | the success and long-term viability of healthcare insurance exchanges and potential changes to the beneficiary enrollment process; |
| • | the extent to which states support or implement changes to Medicaid programs, utilize healthcare insurance exchanges or alter the provision of healthcare to state residents through regulation or otherwise; |
| • | the timing and amount of cash flows related to the California HQAF Program, as well as the potential for retroactive adjustments for prior year payments; |
| • | the effects related to the continued implementation of the sequestration spending reductions and the potential for future deficit reduction legislation; |
| • | changes in U.S. generally accepted accounting principles, including the impacts of adopting newly issued accounting standards; |
| • | the availability and terms of capital to fund acquisitions, replacement facilities or other capital expenditures; |
| • | our ability to obtain adequate levels of professional and general liability and workers’ compensation liability insurance; and |
| • | the risk factors included in “Item 1A. Risk Factors.” |
Although we believe that these forward-looking statements are based upon reasonable assumptions, these assumptions are inherently subject to significant regulatory, economic and competitive uncertainties and contingencies, which are difficult or impossible to predict accurately and may be beyond our control. Accordingly, we cannot give any assurance that our expectations will in fact occur and caution that actual results may differ materially from those in the forward-looking statements. Given these uncertainties, prospective investors are cautioned not to place undue reliance on these forward-looking statements. These forward-looking statements are made as of the date of this filing. We undertake no obligation to revise or update any forward-looking statements, or to make any other forward-looking statements, whether as a result of new information, future events or otherwise.
Overview
As of December 31, 2017, we owned or leased a diversified portfolio of 31 hospitals in rural and mid-sized markets, which are located in 15 states and have a total of 2,979 licensed beds. Our hospitals provide a broad range of hospital and outpatient healthcare services, including general and acute care, emergency room, general and specialty surgery, critical care, internal medicine, obstetrics, diagnostic services, psychiatric and rehabilitation services. For our hospital operations business, we are paid for our services by governmental agencies, private insurers and directly by the patients we serve. We also operate QHR, a leading hospital management advisory and healthcare consulting services business. For our hospital management advisory and healthcare consulting services business, we are paid by the non-affiliated hospitals utilizing our services. Over 95% of our net operating revenues are attributable to our hospital operations business.
55
We perform an ongoing strategic review of our hospitals based on an analysis of financial performance, current competitive conditions, expected demographic trends, joint venture opportunities and capital allocation requirements. We are actively engaging in initiatives to divest underperforming hospitals, reduce our debt and refine our portfolio to a more sustainable group of hospitals with higher operating margins, among others. In 2016, we sold two hospitals and their affiliated entities for combined proceeds of $13.8 million. In 2017, we sold five hospitals and their affiliated entities for combined proceeds of $32.1 million. We have targeted an additional seven hospitals that we intend to divest or close within twelve to twenty-four months. We continually evaluate other hospitals for potential divestiture which could result in changes to the hospitals included in this group in future periods. The seven targeted potential divestiture hospitals had net operating income (losses) of $(40.7) million, $(17.7) million and $(20.7) million for the years ended December 31, 2017, 2016 and 2015, respectively.
We refer to the seven hospitals that we have divested through December 31, 2017 as the Divestitures Group, the seven remaining hospitals targeted for divestiture as the Potential Divestitures Group and the remaining twenty-four hospitals that we operate as the Continuing Hospitals Group. We believe that a discussion of our operating results that distinguishes between those hospitals that management does not foresee as being part of our ongoing hospital operations business and those hospitals that will become our core hospital operations business, and available to service our debt obligations into the future, is meaningful to our stockholders, investors and other users of our financial statements. See “— Overview — Recent Divestiture Activity” below for additional information on our divestitures activities. These hospital groups are also further defined in “— Results of Operations” below.
On March 1, 2018, we sold 70-bed Vista Medical Center West and its affiliated facilities, located in Waukegan, Illinois, for proceeds of $1.2 million.
We have a definitive agreement to sell another hospital in the Potential Divestitures Group, 77-bed Clearview Regional Medical Center and its affiliated facilities, located in Monroe, Georgia. We currently anticipate completing the sale of this hospital in the first quarter of 2018.
On January 5, 2018, we announced plans to close Affinity Medical Center (“Affinity”) in Massillon, Ohio. Subsequent to January 5, 2018, our affiliates entered into an agreement with the City of Massillon related to the closure whereby all of the owned real property and a substantial majority of the related tangible assets located at the hospital will be transferred to the City of Massillon in exchange for nominal consideration and the assumption of certain ongoing real property lease obligations and equipment lease obligations. Operations ceased on February 11, 2018 and we currently anticipate the asset transfer to the City of Massillon will be completed by the end of the first quarter of 2018. We recorded $16.1 million and $20.2 million of impairment to property, equipment and capitalized software costs of Affinity during the years ended December 31, 2017 and 2016 respectively.
Our strategic review process is ongoing and we may be unable to divest or realize proceeds from the sale or closure of any or all hospitals we consider for divestiture. We may also be subject to impairment charges in the future as a result of our ongoing strategic review process.
2017 Financial Overview
Our net operating revenues for the year ended December 31, 2017 decreased $66.3 million to $2,072.2 million compared to $2,138.5 million for the year ended December 31, 2016, a 3.1% decrease. Net operating revenues decreased $108.8 million related to the Divestitures Group. Excluding the Divestitures Group, net operating revenues increased $42.5 million for the year ended December 31, 2017 compared to the same period in 2016, primarily due to favorable volume and payor rate variances. Net loss attributable to Quorum Health Corporation for the years ended December 31, 2017 were $(114.2) million compared to $(347.7) million for the same period in 2016. The 2017 period included long-lived asset and goodwill impairment of $47.3 million related to hospitals held for sale or identified for divestiture, $21.0 million reduction in net operating revenues as a result of a change in estimate related to the collectability of patient accounts receivable, $0.3 million in transaction costs related to the Spin-off and a net gain of $5.2 million on the sale of hospitals. The 2016 period included $291.9 million of impairment related to our hospital operations business, consisting of $166.9 million of impairment to long-lived assets, $125.0 million of impairment to goodwill, $5.4 million of transaction costs related to the Spin-off, a net loss of $2.2 million on the sale of hospitals and a $22.8 million reduction in net operating revenues as a result of a change in estimate related to the collectability of patient accounts receivable. On a same-facility basis, our operating results for the year ended December 31, 2017 reflect a 0.5% decrease in admissions and a 0.4% increase in adjusted admissions compared to the same period in 2016. Excluding the Divestitures Group and Potential Divestitures Group, admissions and adjustment admissions increased 0.9% and 2.2% respectively, for these same periods.
56
2017 Impairment
The following table provides a summary of the impairment recorded during the year ended December 31, 2017 (in thousands):
| | | | | | | | | | | | | | | | | | | | | | Total | |
| | | | | | | | | | | | | | | | | | | | | | Goodwill | |
| | | | | | | | | | | | | | Total | | | | | | | and | |
| | Property | | | Capitalized | | | | | | | Long- | | | | | | | Long- | |
| | and | | | Software | | | Medicare | | | Lived | | | | | | | Lived | |
| | Equipment | | | Costs | | | Licenses | | | Assets | | | Goodwill | | | Assets | |
| | | | | | | | | | | | | | | | | | | | | | | | |
First quarter of 2017 impairment: | | | | | | | | | | | | | | | | | | | | | | | | |
Held for sale assets | | $ | 1,102 | | | $ | 830 | | | $ | — | | | $ | 1,932 | | | $ | 1,368 | | | $ | 3,300 | |
Held for use assets | | | — | | | | — | | | | — | | | | — | | | | — | | | | — | |
Total impairment recorded in first quarter of 2017 | | | 1,102 | | | | 830 | | | | — | | | | 1,932 | | | | 1,368 | | | | 3,300 | |
Second quarter of 2017 impairment: | | | | | | | | | | | | | | | | | | | | | | | | |
Held for sale assets | | | 12,852 | | | | 48 | | | | — | | | | 12,900 | | | | — | | | | 12,900 | |
Held for use assets | | | — | | | | — | | | | — | | | | — | | | | — | | | | — | |
Total impairment recorded in second quarter of 2017 | | | 12,852 | | | | 48 | | | | — | | | | 12,900 | | | | — | | | | 12,900 | |
Third quarter of 2017 impairment: | | | | | | | | | | | | | | | | | | | | | | | | |
Held for sale assets | | | 284 | | | | 16 | | | | — | | | | 300 | | | | 561 | | | | 861 | |
Held for use assets | | | 3,399 | | | | 461 | | | | 540 | | | | 4,400 | | | | — | | | | 4,400 | |
Total impairment recorded in third quarter of 2017 | | | 3,683 | | | | 477 | | | | 540 | | | | 4,700 | | | | 561 | | | | 5,261 | |
Fourth quarter of 2017 impairment: | | | | | | | | | | | | | | | | | | | | | | | | |
Held for sale assets | | | 390 | | | | — | | | | — | | | | 390 | | | | — | | | | 390 | |
Held for use assets | | | 23,346 | | | | 2,084 | | | | — | | | | 25,430 | | | | — | | | | 25,430 | |
Total impairment recorded in fourth quarter of 2017 | | | 23,736 | | | | 2,084 | | | | — | | | | 25,820 | | | | — | | | | 25,820 | |
Total impairment recorded for the year ended December 31, 2017 | | $ | 41,373 | | | $ | 3,439 | | | $ | 540 | | | $ | 45,352 | | | $ | 1,929 | | | $ | 47,281 | |
During the three months ended December 31, 2017, we evaluated the fair value of hospitals classified as held for sale and evaluated other hospitals intended for potential divestiture. In connection with this evaluation, we recognized long-lived asset impairment of $25.8 million during the three months ended December 31, 2017, which consisted of $23.7 million of property and equipment and $2.1 million of intangible assets impairment. During the three months ended September 30, 2017, we evaluated the fair value of hospitals classified as held for sale and evaluated other hospitals intended for potential divestiture. In connection with this evaluation, we recognized long-lived asset and goodwill impairment of $5.3 million during the three months ended September 30, 2017, which consisted of $3.7 million of property and equipment, $1.0 million of intangible assets and $0.6 million of goodwill impairment. During the three months ended June 30, 2017, we recognized $12.9 million of impairment to property and equipment of certain hospitals in our Potential Divestitures Group for which we have received letters of intent. During the three months ended March 31, 2017, management made a decision to classify certain additional hospitals as held for sale. In connection with this decision, we evaluated the estimated relative fair value of the hospitals classified as held for sale in relation to the overall fair value of the hospital operations reporting unit utilizing a September 30, 2016 measurement date, which was the measurement date of our most recent annual goodwill impairment analysis, and recognized $3.3 million of impairment to long-lived assets and goodwill during the three months ended March 31, 2017, which consisted of $1.1 million of property and equipment, $0.8 million of intangible assets and $1.4 million of goodwill impairment.
57
2016 Impairment
The following table provides a summary of the impairment recorded during the year ended December 31, 2016 subsequent to the Spin-off (in thousands):
| | | | | | | | | | | | | | | | | | | | | | Total | |
| | | | | | | | | | | | | | | | | | | | | | Goodwill | |
| | | | | | | | | | | | | | Total | | | | | | | and | |
| | Property | | | Capitalized | | | | | | | Long- | | | | | | | Long- | |
| | and | | | Software | | | Medicare | | | Lived | | | | | | | Lived | |
| | Equipment | | | Costs | | | Licenses | | | Assets | | | Goodwill | | | Assets | |
| | | | | | | | | | | | | | | | | | | | | | | | |
Second quarter of 2016 impairment: | | | | | | | | | | | | | | | | | | | | | | | | |
Held for sale assets | | $ | 9,789 | | | $ | 4,411 | | | $ | — | | | $ | 14,200 | | | $ | 5,000 | | | $ | 19,200 | |
Held for use assets | | | 31,200 | | | | — | | | | — | | | | 31,200 | | | | — | | | | 31,200 | |
Preliminary step two goodwill impairment estimate | | | — | | | | — | | | | — | | | | — | | | | 200,000 | | | | 200,000 | |
Total impairment recorded in second quarter of 2016 | | | 40,989 | | | | 4,411 | | | | — | | | | 45,400 | | | | 205,000 | | | | 250,400 | |
Fourth quarter of 2016 impairment: | | | | | | | | | | | | | | | | | | | | | | | | |
Final step two goodwill impairment and long-lived asset analysis using September 30, 2016 measurement date: | | | | | | | | | | | | | | | | | | | | | | | | |
Held for sale assets | | | 1,386 | | | | 14 | | | | — | | | | 1,400 | | | | — | | | | 1,400 | |
Held for use assets | | | 70,470 | | | | 10,830 | | | | — | | | | 81,300 | | | | (80,000 | ) | | | 1,300 | |
Further decline in held for use assets using December 31, 2016 measurement date | | | 32,723 | | | | 3,677 | | | | 2,370 | | | | 38,770 | | | | — | | | | 38,770 | |
Total impairment recorded in fourth quarter of 2016 | | | 104,579 | | | | 14,521 | | | | 2,370 | | | | 121,470 | | | | (80,000 | ) | | | 41,470 | |
Total impairment recorded for the year ended December 31, 2016 | | $ | 145,568 | | | $ | 18,932 | | | $ | 2,370 | | | $ | 166,870 | | | $ | 125,000 | | | $ | 291,870 | |
During the second quarter of 2016 and subsequent to the Spin-off, management made a decision to classify certain hospitals as held for sale and evaluate other hospitals for potential divestiture. As a result, we analyzed the long-lived assets of all of our hospitals to test for impairment and recorded $45.4 million of long-lived asset impairment in this quarter. In addition, we evaluated the estimated relative fair value of the hospitals we classified as held for sale in relation to the overall fair value of our hospital operations reporting unit utilizing a September 30, 2015 measurement date, which was the measurement date of our most recent annual goodwill impairment analysis, and recognized $5.0 million of goodwill impairment in this quarter. In this same quarter, we identified certain indicators of goodwill impairment related to our hospital operations reporting unit and concluded that such indicators necessitated an interim goodwill impairment evaluation. The primary indicators were our declining market capitalization, as compared to the carrying value of equity, and a decrease in estimated future earnings of our hospital operations reporting unit. We performed a calculation of the overall fair value of this reporting unit in step one of the impairment test and concluded that the carrying value of the hospital operations reporting unit as of June 30, 2016 exceeded its estimated fair value. We performed a preliminary step two calculation of goodwill impairment to determine the implied fair value of goodwill of the hospital operations reporting unit in a hypothetical purchase price allocation. Based on this preliminary analysis, we estimated and recorded additional goodwill impairment of $200 million in the second quarter of 2016.
For step two goodwill impairment testing, we engaged a professional valuation firm to perform a hypothetical purchase price valuation of each of our hospitals utilizing a September 30, 2016 measurement date. The results of the third-party valuation, which was completed in the fourth quarter of 2016, indicated that the carrying values of certain of our individual hospitals exceeded their fair values. Considering these results to be an indicator of potential impairment and to assess whether any additional impairment of long-lived assets existed, we utilized a September 30, 2016 measurement date and the same professional valuation firm to perform an analysis of undiscounted cash flows for each hospital in which an indicator of impairment was identified. Based on the results of these analyses, we recorded impairment of $82.7 million related to long-lived assets at certain of our hospitals and a downward adjustment to our previously recorded goodwill impairment estimate of $80.0 million in the fourth quarter of 2016. Our final assessment of goodwill impairment took into consideration the impairment adjustments to the carrying values of the hospital long-lived assets. The net impact to our financial statements was $2.7 million of additional impairment in the fourth quarter of 2016 beyond the initial estimate of $200 million recorded as the preliminary step-two calculation in the second quarter of 2016.
In addition to the above, we experienced a decline in operating results at several of our hospitals in the fourth quarter of 2016. This led management to perform additional testing for impairment using a December 31, 2016 measurement date. As a result of this analysis, we recorded additional impairment of $38.8 million related to held for use assets in the fourth quarter of 2016. The carrying values of long-lived assets, including those classified as held for sale, are reported in our balance sheet net of impairment as of December 31, 2016.
58
The Spin-off
On April 29, 2016, CHS completed the Spin-off of 38 hospitals, including their affiliated outpatient facilities, and QHR to form Quorum Health Corporation through the distribution of 100% of QHC common stock to CHS stockholders of record on April 22, 2016 (the “Record Date”). Each CHS stockholder received a distribution of one share of QHC common stock for every four shares of CHS common stock held as of the Record Date, plus cash in lieu of fractional shares. Our common stock began trading on the New York Stock Exchange (“NYSE”) under the ticker symbol “QHC” on May 2, 2016.
In connection with the Spin-off, we issued $400 million in aggregate principal amount of 11.625% Senior Notes due 2023 (the “Senior Notes”) on April 22, 2016 and entered into a credit agreement on April 29, 2016, consisting of an $880 million senior secured term loan facility (the “Term Loan Facility”) and a $100 million senior secured revolving credit facility (the “Revolving Credit Facility”), or on a combined basis referred to as the “Senior Credit Facility.” In addition, we entered into a $125 million senior secured asset-based revolving credit facility. The net offering proceeds of the Senior Notes, together with the net borrowings under the Term Loan Facility, were used to make a $1.2 billion payment from QHC to CHS and to pay our transaction and financing fees and expenses.
In connection with the Spin-off, certain agreements were established by CHS that govern and continue to govern matters related to the Spin-off. These agreements include, among others, a Separation and Distribution Agreement, a Tax Matters Agreement and an Employee Matters Agreement. Various transition services agreements were established by CHS that define agreed upon services to be provided by CHS to QHC. The transition services agreements generally have five-year terms and include, among others, the provision for services related to information technology, payroll processing, certain human resources functions, patient eligibility screening, billing, collections and other revenue management services.
Pursuant to the terms of the Separation and Distribution Agreement, CHS made a non-cash capital contribution of $530.6 million and transferred $13.5 million of cash to us on the Spin-off date. The cash transfer consisted of an agreed upon $20.0 million for the initial funding of our working capital, reduced by $6.5 million for the difference in estimated and actual financing fees and expenses incurred at the closing of the Spin-off.
The following table contains a summary of the major transactions to effect the Spin-off of QHC as a newly formed, independent company (dollars in thousands):
| | | | | | | | | | | | | | | | | | | Additional | | | | | |
| | Long-Term | | | Due to | | | | Common Stock | | | Paid-in | | | Parent's | |
| | Debt | | | Parent, Net | | | | Shares | | | Amount | | | Capital | | | Equity | |
| | | | | | | | | | | | | | | | | | | | | | | | | |
Balance at April 29, 2016 (prior to the Spin-off) | | $ | 24,179 | | | $ | 1,813,836 | | | | | — | | | $ | — | | | $ | — | | | $ | 3,137 | |
Borrowings of long-term debt, net of debt issuance discounts | | | 1,255,464 | | | | — | | | | | — | | | | — | | | | — | | | | — | |
Payments of debt issuance costs | | | (29,146 | ) | | | — | | | | | — | | | | — | | | | — | | | | — | |
Cash proceeds paid to Parent | | | — | | | | (1,217,336 | ) | | | | — | | | | — | | | | — | | | | — | |
Transfer of liabilities from Parent | | | — | | | | (22,292 | ) | | | | — | | | | — | | | | — | | | | — | |
Net deferred income tax liability resulting from the Spin-off | | | — | | | | (46,783 | ) | | | | — | | | | — | | | | — | | | | — | |
Non-cash capital contribution from Parent | | | — | | | | (527,425 | ) | | | | — | | | | — | | | | 530,562 | | | | (3,137 | ) |
Distribution of common stock | | | — | | | | — | | | | | 27,719,645 | | | | 3 | | | | (3 | ) | | | — | |
Distribution of restricted stock awards | | | — | | | | — | | | | | 692,409 | | | | — | | | | — | | | | — | |
Balance at April 29, 2016 (after the Spin-off) | | $ | 1,250,497 | | | $ | — | | | | | 28,412,054 | | | $ | 3 | | | $ | 530,559 | | | $ | — | |
59
The following table provides a summary of the sources and uses of cash directly related to our separation from CHS (in thousands):
Sources of cash: | | | | |
Term Loan Facility, maturing 2022 | | $ | 880,000 | |
Senior Notes, maturing 2023 | | | 400,000 | |
Cash transfer from CHS for initial funding of working capital, less adjustments | | | 13,454 | |
Total sources of cash | | | 1,293,454 | |
Uses of cash: | | | | |
Payment to CHS for the businesses | | | (1,217,336 | ) |
Payments of debt issuance costs | | | (29,146 | ) |
Reduction in debt proceeds for debt issuance discounts | | | (24,536 | ) |
Transaction costs related to the Spin-off, as recorded in the statements of income | | | (21,825 | ) |
Total uses of cash | | | (1,292,843 | ) |
Net cash inflow | | $ | 611 | |
Agreements with CHS Related to the Spin-off
In connection with the Spin-off and effective as of the Spin-off date, we entered into certain agreements with CHS that at the time of Spin-off governed the allocation to us of various assets, employees, liabilities and obligations (including investments, property, employee benefits and tax-related assets and liabilities) that were previously part of CHS. In addition, these agreements govern certain relationships and activities between QHC and CHS for a definitive period of time after the Spin-off date, as specified by each individual agreement.
A summary of these agreements follows:
| • | Separation and Distribution Agreement. This agreement governed the principal actions of both QHC and CHS that needed to be taken to effect the Spin-off. It sets forth other agreements that govern certain aspects of our relationship with CHS following the Spin-off. |
| • | Tax Matters Agreement. This agreement governs respective rights, responsibilities and obligations of QHC and CHS after the Spin-off with respect to deferred tax liabilities and benefits, tax attributes, tax contests and other tax sharing regarding U.S. federal, state and local income taxes, other tax matters and related tax returns. |
| • | Employee Matters Agreement. This agreement governs certain compensation and employee benefit obligations with respect to the employees and non-employee directors of QHC and CHS. It also allocated liabilities and responsibilities relating to employment matters, employee compensation, employee benefit plans and other related matters as of the Spin-off date. |
In addition to the agreements referenced above, we entered into certain transition services agreements and other ancillary agreements with CHS defining agreed upon services, as specified by each agreement, to be provided by CHS to us commencing on the Spin-off date. The agreements generally have terms of five years.
A summary of the major transition services agreements follows:
| • | Shared Services Centers Transition Services Agreement. This agreement defines services to be provided by CHS related to billing and collections utilizing CHS shared services centers. Services include, but are not limited to, billing and receivables management, statement processing, denials management, cash posting, patient customer service, and credit balance and other account research. In addition, it provides for patient pre-arrival services, including pre-registration, insurance verification, scheduling and charge estimates. Fees are based on a percentage of cash collections each month. |
| • | Computer and Data Processing Transition Services Agreement. This agreement defines services to be provided by CHS for information technology infrastructure, support and maintenance. Services include, but are not limited to, operational support for various applications, oversight, maintenance and information technology support services, such as helpdesk, product support, network monitoring, data center operations, service ticket management and vendor relations. Fees are based on both a fixed charge for labor costs, as well as direct charges for all third-party vendor contracts entered into by CHS on QHC’s behalf. |
| • | Receivables Collection Agreement (“PASI”). This agreement defines services to be provided by CHS’ wholly-owned subsidiary, PASI, which currently serves as a third-party collection agency to us related to accounts receivable collections of both active and bad debt accounts of QHC hospitals, including both receivables that existed as of the Spin-off date and those that have occurred during the operating period since the Spin-off date. Services include, but are not limited to, self-pay collections, insurance follow-up, collection letters and calls, payment arrangements, payment posting, dispute resolution and credit balance research. Fees are based on the type of service and are calculated based on a percentage of recoveries. |
60
| • | Billing and Collection Agreement (“PPSI”). This agreement defines services to be provided by CHS related to collections of certain accounts receivable generated from our outpatient healthcare services, predominately physician clinics. Services include, but are not limited to, self-pay collections, insurance follow-up, collection letters and calls, payment arrangements, payment posting, dispute resolution and credit balance research. Fees are based on the type of service and are calculated based on a percentage of recoveries. |
| • | Employee Service Center Agreement. This agreement defines services to be provided by CHS related to payroll processing and human resources information systems (“HRIS”) support. Fees are based on a fixed charge per employee headcount per month. |
| • | Eligibility Screening Services Agreement. This agreement defines services to be provided by CHS for financial and program criteria screening related to Medicaid or other program eligibility for pure self-pay patients. Fees are based on a fixed charge for each hospital receiving services. |
We recorded total expenses under transition services agreements with CHS following the Spin-off combined with the allocations from CHS for these same services prior to the Spin-off of $63.5 million, $66.4 million, and $60.2 million for the years ended December 31, 2017, 2016 and 2015, respectively.
We are currently engaged in preliminary discussions with CHS related to the transition of certain of our transition services agreements related to billing and collections and eligibility screening services. We are seeking to bring these services in-house; however, we are unable to provide any assurances as to the timing of such an agreement or whether such agreement will be reached.
Recent Divestiture Activity
On March 1, 2018, we sold 70-bed Vista Medical Center West and its affiliated facilities (“Vista West”), located in Waukegan, Illinois, for proceeds of $1.2 million. For the years ended December 31, 2017, 2016 and 2015, our operating results included pre-tax gains (losses) of $(2.3) million, $4.9 million, and $5.7 million respectively, related to Vista West. In addition to the above, we recorded $11.1 million and $4.1 million to property, equipment and capitalized software costs of Vista West during the years ended December 31, 2017 and 2016, respectively. We do not expect the loss on sale of this hospital will be material, after consideration of the impairment recorded.
On February 1, 2018, we announced that we had entered into a definitive agreement to sell 77-bed Clearview Regional Medical Center and its affiliated facilities (“Clearview’), located in Monroe, Georgia. We currently anticipate completing the sale of this hospital by the end of the first quarter of 2018. We recorded $1.2 million of impairment to Medicare licenses of Clearview during the year ended December 31, 2016.
On January 5, 2018, we announced plans to close Affinity Medical Center (“Affinity”), located in Massillon, Ohio. Subsequent to January 5, 2018, our affiliates entered into an agreement with the City of Massillon related to the closure whereby all of the owned real property and a substantial majority of the related tangible assets located at the hospital will be transferred to the City of Massillon in exchange for nominal consideration and the assumption of certain ongoing real property lease obligations and equipment lease obligations. Operations ceased on February 11, 2018 and we currently anticipate that the asset transfer to the City of Massillon will be completed by the end of the first quarter of 2018. We recorded $16.1 million and $20.2 million of impairment to property, equipment and capitalized software costs of Affinity during the years ended December 31, 2017 and 2016 respectively.
On October 31, 2017, we sold 72-bed L.V. Stabler Memorial Hospital and its affiliated facilities (“L.V. Stabler”), located in Greenville, Alabama, for proceeds of $2.8 million. For the years ended December 31, 2017, 2016 and 2015, our operating results included pre-tax losses of $4.8 million, $5.8 million and $5.0 million, respectively, related to L.V. Stabler. In addition to the above, we recorded less than $0.1 million loss on the sale for the year ended December 31, 2017. We also recorded impairment to property, equipment and capitalized software costs of $2.5 million and $2.9 million of related to L.V. Stabler in the years ended December 31, 2017 and 2016, respectively. We recorded a total of $5.4 million of impairment to property, equipment and capitalized software costs of L.V. Stabler in the years ended 2016 and 2017.
On September 30, 2017, we sold 70-bed Sunbury Community Hospital and its affiliated facilities (“Sunbury”), located in Sunbury, Pennsylvania, and 47-bed Lock Haven Hospital and its affiliated facilities (“Lock Haven”) located in Lock Haven, Pennsylvania, for combined proceeds of $9.1 million. For the years ended December 31, 2017, 2016 and 2015, our operating results included pre-tax losses of $8.4 million, $12.9 million and $18.7 million, respectively, related to Sunbury and Lock Haven on a combined basis. In addition to the above, we recorded a $0.1 million loss on the sale for the year ended December 31, 2017. We also recorded impairment to property, equipment and capitalized software costs of $1.9 million, $12.7 million and $3.0 million related to Sunbury and Lock Haven during the years ended December 31, 2017, 2016 and 2015, respectively. We recorded a total of $26.6 million of impairment to property, equipment and capitalized software costs of Sunbury and Lock Haven from January 1, 2012 to December 31, 2017.
On June 30, 2017, we sold 231-bed Trinity Hospital of Augusta and its affiliated facilities (“Trinity”), located in Augusta, Georgia, for $15.9 million. For the years ended December 31, 2017, 2016 and 2015, our operating results included pre-tax losses of $9.7 million, $9.5 million and $2.9 million, respectively, related to Trinity. In addition to the above, we recorded a $5.2 million gain
61
on the sale for the year ended December 31, 2017 and remitted $1.2 million of proceeds to the joint venture partners. We also recorded impairment to property, equipment and capitalized software costs of $33.9 million related to Trinity during the year ended December 31, 2016.
On March 31, 2017, we sold 60-bed Cherokee Medical Center and its affiliated facilities (“Cherokee”), located in Centre, Alabama, for $4.3 million. For the years ended December 31, 2017, 2016 and 2015, our operating results included pre-tax losses of $1.0 million, $5.0 million and $5.3 million, respectively, related to Cherokee. In addition to the above, we recorded a $0.2 million gain on the sale in the year ended December 31, 2017. We also recorded impairment to property, equipment and capitalized software costs of $3.9 million and $2.0 million related to Cherokee during the years ended December 31, 2016 and 2015, respectively. We have recorded a total of $6.9 million of impairment to property, equipment and capitalized software costs of Cherokee from January 1, 2012 to December 31, 2017.
On December 31, 2016, we sold 56-bed Barrow Regional Medical Center and its affiliated facilities (“Barrow”), located in Winder, Georgia, for $6.6 million. For the years ended December 31, 2017, 2016 and 2015, our operating results included pre-tax losses of $1.4 million, $14.5 million and $6.2 million, respectively, related to Barrow. In addition to the above, we recorded a $1.2 million net loss on the sale in the year ended December 31, 2016. We also recorded impairment to property, equipment and capitalized software costs of $4.0 million related to Barrow during the year ended December 31, 2016.
On December 1, 2016, we sold 64-bed Sandhills Regional Medical Center and its affiliated facilities (“Sandhills”), located in Hamlet, North Carolina, for $7.2 million. For the years ended December 31, 2017, 2016 and 2015, our operating results included a pre-tax losses of $0.2 million, $6.9 million and $2.0 million, respectively, related to Sandhills. In addition to the above, we recorded a $1.0 million net loss on the sale in the year ended December 31, 2016. The Company also recorded impairment to property, equipment and capitalized software costs of $4.8 million related to Sandhills during the year ended December 31, 2016.
Healthcare Reform
The Affordable Care Act, as currently structured, mandates that substantially all U.S. citizens maintain health insurance coverage, while expanding access to coverage through a combination of private sector health insurance reforms and public program expansion. However, there is considerable uncertainty with regard to the future of the Affordable Care Act, as the presidential administration and certain members of Congress have expressed their intent to repeal or make significant changes to the law, its implementation and its interpretation. For example, in 2017, Congress eliminated the financial penalties associated with the individual mandate, effective January 1, 2019, which may result in fewer individuals electing to purchase health insurance. In addition, several private health insurers have withdrawn from or limited their participation in the healthcare insurance exchanges, and the presidential administration has taken steps, including ending cost-sharing subsidies that were previously available to insurers, which may threaten the long-term viability of those marketplaces. Healthcare reform initiatives, including efforts to change, alter the implementation of, or repeal the Affordable Care Act, may have an adverse effect on our business, results of operations, financial position, cash flow, capital resources and liquidity.
Other Government Regulations
Our hospital operations business is highly regulated. We are required to comply with extensive, complicated and overlapping governmental laws and regulations at the federal, state and local levels. These laws and regulations govern every aspect of how our hospitals conduct their operations, including the service lines that must be offered for licensure as an acute care hospital, restrictions related to employing physicians, and requirements applicable to eligibility and payment structures under the Medicare and Medicaid programs. The failure to comply with these laws and regulations can result in severe penalties including criminal penalties, civil sanctions, and the loss of our ability to qualify for participation in the Medicare and Medicaid programs.
Rules, regulations and laws imposed on the U.S. healthcare industry are subject to ongoing and frequent changes with little or no notice and are often interpreted and applied differently by various regulatory agencies with authority to enforce such requirements. Each change or conflicting interpretation may require us to make changes at our hospitals and other healthcare facilities related to aspects such as space usage, equipment, technology, staffing and service lines. We may also be required to revise or implement operating policies and procedures that were previously believed to be compliant. The cost of compliance with governmental laws and regulations is a significant component of our overall operating costs. Furthermore, these costs have been rising in recent years due to new regulatory requirements and increasing enforcement provisions. Management anticipates that compliance costs will continue to grow in the foreseeable future. The U.S. healthcare industry has seen a number of ongoing investigations related to patient referrals, physician recruiting and employment practices, cost reporting and billing practices, medical necessity of inpatient admissions, physician office leasing, laboratory and home healthcare services, physician ownership of hospitals and other healthcare providers, and joint ventures involving hospitals and physicians. Hospitals continue to be one of the primary focus areas of the OIG, DOJ and other governmental fraud and abuse regulatory authorities and programs.
62
Basis of Presentation
Prior to our separation from CHS, QHC did not operate as a separate company and stand-alone financial statements were not historically prepared; however, QHC was comprised of certain stand-alone legal entities for which discrete financial information was available under CHS’ ownership. Our accompanying financial statements include amounts and disclosures for QHC that have been derived from the consolidated financial statements and accounting records of CHS for the periods prior to the Spin-off in combination with the amounts and disclosures related to the stand-alone financial statements and accounting records of QHC after the Spin-off. See Note 18 — Related Party Transactions in the accompanying financial statements for additional information on the carve-out of financial information from CHS.
The statements of income for the years ended December 31, 2016 and 2015, as presented herein, include expense allocations for certain corporate functions provided by CHS to QHC for the periods prior to the Spin-off, including, but not limited to, executive and divisional management, employee benefits administration, treasury, accounting, risk management, audit, legal, procurement, human resources, information technology support and other administrative support services. These expenses were allocated to QHC based on direct usage or benefit where identifiable, with the remainder allocated to QHC using ratios based on revenues, expenses or licensed beds. Following the Spin-off, we began performing corporate functions using internal resources or purchased services, certain of which are being provided by CHS pursuant to the transition services agreements and other ancillary agreements.
For the periods prior to the Spin-off, CHS used a centralized approach to cash management and to finance its operations, which included the operations of QHC. For these periods, cash and cash equivalents were swept to the CHS corporate accounts and transactions between QHC and CHS were accounted for through Due to Parent, net. This liability to CHS was settled in full on the transaction date, in part by a cash payment to CHS of $1.2 billion funded with net proceeds from the debt issuances that occurred in connection with the Spin-off. The remainder of the liability was extinguished and reclassified as a capital contribution to QHC. See Note 11 — Equity in the accompanying financial statements for additional information on the equity established in connection with the Spin-off. Following the Spin-off, we established our own depository and disbursement cash accounts with various banks and use a centralized approach to cash management.
Revenues
We generate revenues by providing healthcare services at our hospitals and affiliated outpatient service facilities to patients seeking medical treatment. Hospital revenues depend on, among other factors, inpatient occupancy and acuity levels, the volume of outpatient procedures and the charges and negotiated reimbursement rates for the healthcare services provided. Our primary sources of payment for patient healthcare services are third-party payors, including the Medicare and Medicaid programs, Medicare and Medicaid managed care programs, commercial insurance companies, other managed care programs, workers’ compensation carriers and employers. Self-pay revenues are the portion of our revenues generated from providing healthcare services to patients who do not have health insurance coverage as well as the patient responsibility portion of charges that are not covered for an individual by a health insurance program or plan. We generate revenues related to our QHR business when hospital management advisory and healthcare consulting services are provided. We report these revenues at their net realizable value. We generate other non-patient revenues primarily from rental income and hospital cafeteria sales.
Amounts we collect for medical treatment of patients covered by Medicare, Medicaid and non-governmental third-party payors are generally less than our standard billing rates. Our standard charges and reimbursement rates for routine inpatient services vary significantly depending on the type of medical procedure performed and the geographical location of the hospital. Differences in our standard billing rates and the amounts we expect to collect from third-party payors are classified as contractual allowances. The reimbursements we ultimately receive as payments for services are determined for each patient instance of care, based on the contractual terms we negotiate with third-party payors or based on federal and state regulations related to governmental healthcare programs. Our contractual allowances are impacted by the timing and ability of CHS to monitor the classification and collection of our patient accounts receivable. Billings and collections are outsourced to CHS under the transition services agreements that were put in place by CHS in connection with the Spin-off. See Note 18 — Related Party Transactions in the accompanying financial statements for additional information on these agreements. Except for emergency department services, our policy is to determine the payment methodology with patients prior to when the services are performed. Self-pay and other payor discounts are incentives offered to uninsured or underinsured patients or other payors to reduce their costs of healthcare services.
63
A summary of our net operating revenues, before the provision for bad debts, by payor source follows (dollars in thousands):
| | Year Ended December 31, | |
| | 2017 | | | 2016 | | | 2015 | |
| | $ Amount | | | % of Total | | | $ Amount | | | % of Total | | | $ Amount | | | % of Total | |
| | | | | | | | | | | | | | | | | | | | | | | | |
Medicare | | $ | 656,843 | | | | 28.2 | % | | $ | 673,074 | | | | 27.8 | % | | $ | 656,799 | | | | 26.9 | % |
Medicaid | | | 425,943 | | | | 18.3 | % | | | 446,273 | | | | 18.4 | % | | | 443,479 | | | | 18.1 | % |
Managed care and commercial | | | 921,503 | | | | 39.6 | % | | | 952,535 | | | | 39.4 | % | | | 984,480 | | | | 40.3 | % |
Self-pay | | | 226,043 | | | | 9.7 | % | | | 242,095 | | | | 10.1 | % | | | 247,234 | | | | 10.0 | % |
Non-patient | | | 97,323 | | | | 4.2 | % | | | 105,076 | | | | 4.3 | % | | | 113,866 | | | | 4.7 | % |
Total net operating revenues, before the provision for bad debts | | $ | 2,327,655 | | | | 100.0 | % | | $ | 2,419,053 | | | | 100.0 | % | | $ | 2,445,858 | | | | 100.0 | % |
The table above includes an $11.4 million change in estimate we recorded as of December 31, 2016 to reduce the net realizable value of patient accounts receivable due to increasing delays associated with collections on accounts receivable under the Illinois Medicaid program. This change in estimate negatively impacted contractual allowances associated with Medicaid revenues. In addition, net operating revenues, before the provision for bad debts, declined $135.8 million in the year ended December 31, 2017 compared to the same period in 2016 due to the seven hospitals we have divested.
For the years ended December 31, 2017, 2016 and 2015, Medicare revenues related to Medicare Advantage Plans were $186.7 million, $170.4 million and $146.9 million, respectively, or 28.4%, 25.3% and 22.4% as a percentage of total Medicare revenues, respectively.
Charity Care
In the ordinary course of business, we provide services to patients who are financially unable to pay for hospital care. The related charges for those patients who are financially unable to pay that otherwise do not qualify for reimbursement from a governmental program are classified as charity care. We determine amounts that qualify for charity care primarily based on the patient’s household income relative to the poverty level guidelines established by the federal government. Our policy is not to pursue collections for such amounts; therefore, the related charges are recorded in operating revenues at the standard billing rates and fully offset in contractual allowances in the same period.
Electronic Health Record Incentive Payments
Pursuant to the HITECH Act, MACRA and other laws, HHS has established Medicare and Medicaid incentive programs to encourage hospitals and healthcare professionals to adopt certified EHR technology. Eligible hospitals that demonstrate meaningful use of certified EHR technology can receive incentive payments, while hospitals that fail to do so are subject to payment reductions. We incur both capital expenditures and operating expenses in connection with the implementation of EHR technology initiatives. The amount and timing of these expenditures does not directly correlate with the timing of the receipt of EHR payments or the recognition of EHR incentives as earned. We record EHR incentives in our statements of income as a reduction to our operating costs and expenses. As we move toward our full implementation of certified EHR technology, our EHR incentives are declining and will ultimately end. For the years ended December 31, 2017, 2016 and 2015, our EHR incentives earned were $4.7 million, $11.5 million and $25.8 million, respectively. We anticipate that we will earn approximately $1.5 million of EHR incentives in 2018.
Critical Accounting Policies
The preparation of financial statements in accordance with U.S. GAAP requires us to make estimates and judgments that affect the reported amounts and related disclosures. Actual results may differ from these estimates under different assumptions or conditions. Critical accounting policies are defined as those that are reflective of significant judgments and uncertainties, and potentially result in materially different results under different assumptions and conditions. The critical accounting estimates and judgments presented below are not intended to be a comprehensive list of all our accounting policies that require estimates, but are limited to those that involve a higher degree of judgment and complexity. We believe the current assumptions and other considerations used to estimate amounts in our financial statements are appropriate. If actual results differ from these assumptions and considerations, the resulting impact could have a material adverse effect on our results of operations and financial condition.
Third-Party Reimbursements and State Supplemental Payment Programs
Our estimate of the net realizable amount of our patient revenues due from third-party payors is subject to complexities, including interpretations of governmental regulations and payor-specific contractual agreements that are frequently changing. The Medicare and Medicaid programs, which are the payor sources for a major portion of our patient revenues, are highly complex programs and subject to interpretation of federal and state-specific reimbursement rates, new or changing legislation and final cost report settlements.
64
Contractual allowances are recorded in the period services are performed and the patient’s method of payment is verified. Estimates for contractual allowances are subject to change, in large part, due to ongoing contract negotiations and regulatory changes, which is typical in the U.S. healthcare industry. Revisions to estimates for contractual allowances are recorded in the periods in which they become known and may be subject to further revisions. All hospital contractual allowance calculations are reviewed on a monthly basis by management to ensure reasonableness and accuracy.
We use a third-party automated contractual allowance system to calculate our contractual allowances each month. Contractual allowances are calculated utilizing historical paid claims data by payor source, which is uploaded into the system each month. The key assumptions used by the system to calculate the current period estimated contractual allowances are derived on a payor-specific basis from the estimated contractual reimbursement percentage and historical paid claims data. The automated contractual allowance system does not include patient account level information, as it estimates an average contractual allowance for each payor source. Due to the complexities involved in the contractual allowance estimates, actual reimbursement payments we receive from third-party payors could be different from the amounts we estimated and recorded. If the actual contractual reimbursement percentages by payor source differed by 1% from our estimated contractual reimbursement percentages, our net loss for the year ended December 31, 2017 would have changed by $14.9 million. If we applied a 1% differential to our patient accounts receivable due from governmental, managed care and commercial third-party payors as of December 31, 2017, patient accounts receivable, net would have changed by $18.2 million.
Cost report settlements under reimbursement programs with Medicare, Medicaid and other managed care plans are estimated and recorded in the period patient services are performed and any revisions to estimates of previous program reimbursements are recorded in subsequent periods until the final cost report settlements are determined. We account for cost report settlements in contractual allowances in our statements of income and record these amounts as due from and due to third-party payors on our balance sheets. During the years ended December 31, 2017, 2016 and 2015, contractual allowance adjustments related to previous program reimbursements and final cost report settlements favorably (unfavorably) impacted our net operating revenues by $2.0 million, $(5.8) million and $(15.1) million, respectively. The 2015 amount included the unfavorable impact of an $11.1 million Illinois cost report settlement in 2014 that was reversed in the second quarter of 2015 due to contract negotiations that were finalized in that quarter. Exclusive of this adjustment, our net operating revenues were favorably (unfavorably) impacted by $(4.0) million in 2015 for all other contractual allowance adjustments related to previous program reimbursements and final cost report settlements.
Several states utilize supplemental payment programs, including disproportionate share programs, for the purpose of providing reimbursement to providers to offset a portion of the cost of providing care to Medicaid and indigent patients. The amounts due to us under such programs are included in due from third-party payors on our balance sheets. Some of these programs have participation costs, referred to as fees or provider taxes. We record these costs in due to third-party payors on our balance sheets. After a state supplemental program is approved and fully authorized, we recognize the reimbursement payments due to us from state supplemental payment programs in the periods amounts are estimable and revenue collection is reasonably assured. These amounts are recorded in operating revenues as favorable contractual allowances and the costs we incur under these programs are recorded as other operating expenses. We record the revenues as favorable contractual allowance adjustments in our net operating revenues and the related provider taxes as other operating expenses in our statements of income.
The following table shows the portion of our Medicaid reimbursements attributable to state supplemental payment programs (in thousands):
| | Year Ended December 31, | |
| | 2017 | | | 2016 | | | 2015 | |
| | | | | | | | | | | | |
Medicaid revenues | | $ | 211,448 | | | $ | 220,389 | | | $ | 211,696 | |
Provider taxes and other expenses | | | 75,388 | | | | 76,616 | | | | 75,929 | |
Reimbursements attributable to state supplemental payment programs, net of expenses | | $ | 136,060 | | | $ | 143,773 | | | $ | 135,767 | |
The California Department of Health Care Services implemented the HQAF Program, imposing a fee on certain general and acute care California hospitals. Revenues generated from these fees provide funding for the non-federal supplemental payments to California hospitals that serve California’s Medi-Cal and uninsured patients. Under Phase IV of the program, covering the period from January 2014 through December 2016, and Phase V of the program, covering the period from January 2017 through June 2019, we recognized $22.0 million, $34.4 million and $31.5 million of operating revenues, net of provider taxes, for the years ended December 31, 2017, 2016 and 2015, respectively. Reimbursements attributable to state supplemental payment programs related to hospitals that have been divested decreased $1.3 million for the year ended December 31, 2017 compared to the year ended December 31, 2016.
65
The following table provides a summary of the components of due from and due to third-party payors (in thousands):
| | December 31, | |
| | 2017 | | | 2016 | |
| | | | | | | | |
Amounts due from third-party payors: | | | | | | | | |
Previous program reimbursements and final cost report settlements | | $ | 17,383 | | | $ | 23,876 | |
State supplemental payment programs | | | 79,819 | | | | 92,359 | |
Total amounts due from third-party payors | | $ | 97,202 | | | $ | 116,235 | |
| | | | | | | | |
Amounts due to third-party payors: | | | | | | | | |
Previous program reimbursements and final cost report settlements | | $ | 33,163 | | | $ | 33,366 | |
State supplemental payment programs | | | 14,542 | | | | 9,171 | |
Total amounts due to third-party payors | | $ | 47,705 | | | $ | 42,537 | |
Provision for Bad Debts and the Allowance for Doubtful Accounts
The following table provides a summary of patient accounts receivable, before contractual allowances, discounts and the allowance for doubtful accounts, by payor source (dollars in thousands):
| | December 31, | |
| | 2017 | | | 2016 | |
| | Amount | | | % of Total | | | Amount | | | % of Total | |
| | | | | | | | | | | | | | | | |
Third-parties | | $ | 1,796,852 | | | | 75.1 | % | | $ | 1,930,103 | | | | 74.6 | % |
Self-pay | | | 596,863 | | | | 24.9 | % | | | 656,373 | | | | 25.4 | % |
Total patient accounts receivable, gross | | $ | 2,393,715 | | | | 100.0 | % | | $ | 2,586,476 | | | | 100.0 | % |
Substantially all of our accounts receivable are related to providing healthcare services to patients at our hospitals and outpatient service facilities. Collection of these accounts receivable is our primary source of cash and is critical to our operating performance. Our primary collection risks relate to uninsured patients and the patient financial responsibility portion of payments due from insured patients, generally deductibles and co-payments. Our policy is to verify the health insurance coverage of a patient prior to the procedure date for all medical treatment scheduled in advance. We do not verify insurance coverage in advance of treatment for walk-in and emergency room patients.
We estimate our allowance for doubtful accounts by reserving a percentage of all self-pay patient receivables without regard to aging category, based on collection history. The allowance percentage is based on a model that considers historical write-off activity and is adjusted for expected recoveries and any anticipated changes in trends. Our ability to estimate the allowance for doubtful accounts is not significantly impacted by the aging of accounts receivable as management believes that substantially all of the risk exists at the point in time such accounts are identified as self-pay. For our insured receivables, which are non-self-pay receivables, we estimate the allowance for doubtful accounts based on historical collection rates for the uncontractualized portion of all accounts aging over 365 days from the date of patient discharge, reduced by an estimate for expected recoveries. Generally, these non-self-pay accounts receivable aged over 365 days represent an immaterial percentage of our total patient accounts receivable on our balance sheets. We believe that we collect substantially all of our third-party insured receivables, which include receivables from governmental agencies.
During the fourth quarter of 2017, we analyzed our self-pay patient accounts receivable at a more comprehensive and disaggregated level and refined our estimate of the collectability of the portion of self-pay accounts receivable related to insured patients, primarily co-pays and deductibles. Our analysis also included an evaluation of patient accounts receivable retained in the divestitures of six of our seven divested hospitals. As a result of these efforts, we recorded a change in estimate of $21.0 million to reduce the net realizable value of patient accounts receivable, which negatively impacted the provision for bad debts in our statement of income for the year ended December 31, 2017.
As of December 31, 2016, we recorded a change in estimate of $11.4 million to reduce the net realizable value of our patient accounts receivable, which negatively impacted the provision for bad debts in our statement of income for the year ended December 31, 2016. This change in estimate related to our assessment of the collectability of our managed care and commercial accounts receivable aged greater than one year based on a review of historical cash collections for these accounts.
Collections are impacted by the economic ability of patients to pay and the effectiveness of CHS’ billing and collection efforts, including their current policies on billings, accounts receivable payor classifications, collections, and our own efforts to further attempt collection. As previously stated, billings and collections are outsourced to CHS under the transition services agreements that were put in place with the Spin-off. See Note 18 — Related Party Transactions in the accompanying financial statements for additional information on these agreements. Significant changes in payor mix, centralized business office operations, including CHS’
66
efforts in collecting the Company’s accounts receivables, economic conditions or trends in federal and state governmental healthcare coverage, among other things, could affect our collection levels and are considered in our estimate of the allowance for doubtful accounts each period. We also continually review our overall allowance adequacy by monitoring historical cash collections experience, revenue trends by payor classification and days revenue outstanding, the composition of self-pay receivables between pure self-pay patients and the patient responsibility portion of third-party insured receivables, and the impact of recent acquisitions and dispositions.
Our policy is to write off gross accounts receivable if the balance is under $10.00 or when such amounts are placed with outside collection agencies. We believe this policy accurately reflects our ongoing collection efforts and is consistent with practices within the U.S. healthcare industry. We had $474.3 million and $420.3 million of past due patient account balances at December 31, 2017 and 2016, respectively, being pursued by secondary collection agencies, excluding accounts being pursued by PASI under the transition services agreement. We expect to collect less than 3%, net of estimated collection fees, of the amounts being pursued by these secondary collection agencies. As these amounts have been written-off, they are not included in our gross accounts receivable or our allowance for doubtful accounts. Collections of any account balances previously written off are recognized as a reduction to bad debt expense when received. However, we take into consideration estimated collections of these future amounts written-off in evaluating the reasonableness of our allowance for doubtful accounts.
For self-pay receivables, the total amount of contractual allowances, discounts and the allowance for doubtful accounts that reduces these receivables to their net carrying value was $545.8 million and $571.7 million as of December 31, 2017 and 2016, respectively. If our self-pay receivables being pursued by outside collection agencies were included in both gross self-pay receivables and the allowance for doubtful accounts above, the allowance for doubtful accounts related to self-pay receivables as a percentage of gross self-pay receivables would have been 94.5% and 92.1% at December 31, 2017 and 2016, respectively. If our actual collection percentage differed by 1% from our estimated collection percentage as a result of a change in recoveries, our net loss for the year ended December 31, 2017 would have changed $5.1 million. If we applied a 1% differential to our estimate of the allowance for doubtful accounts related to self-pay receivables as of December 31, 2017, our patient accounts receivable, net would have changed by $6.1 million.
Days revenue outstanding related to patient accounts receivable, excluding amounts recorded as due from and due to third-party payors on our balance sheets, was 63 days and 68 days as of December 31, 2017 and 2016, respectively. In the fourth quarter of 2017, we received $31 million of approximately $50 million of 2015 and 2016 outstanding amounts from the California HQAF program. In this same quarter, we also received a total of $51 million of the approximate $65 million in arrears from Illinois Medicaid and state employee patients. The portion of our allowance for doubtful accounts representing an adjustment for expected recoveries of self-pay receivables aged over 365 days that have been placed with outside collection agencies was 4 days as of December 31, 2017.
Impairment of Long-Lived Assets and Goodwill
Whenever an event occurs or changes in circumstances indicate that the carrying values of certain long-lived assets may be impaired, we project the undiscounted cash flows expected to be generated by those assets. If the projections indicate that the carrying values are not expected to be recovered, the assets are reduced to their estimated fair value based on a quoted market price, if available, or an estimated value based on valuation techniques available in the circumstances.
Our hospital operations and hospital management advisory and healthcare consulting services operations meet the criteria to be classified as reporting units for goodwill. Goodwill is evaluated for impairment at the same time every year and when an event occurs or circumstances change that, more likely than not, reduce the fair value of a reporting unit below its carrying value. There is a two-step method for determining goodwill impairment. Step one is to compare the fair value of the reporting unit with the unit’s carrying amount, including goodwill. If this test indicates the fair value is less than the carrying value, then step two is required. Step two is to compare the implied fair value of the reporting unit’s goodwill with the carrying value of the reporting unit’s goodwill. When an indicator of potential impairment is identified in interim periods, we evaluate goodwill for impairment at such date.
We perform our annual goodwill impairment evaluation in the fourth quarter of each year. For our annual evaluation, we estimate the fair value of each of our reporting units utilizing two modeling approaches, a discounted cash flow model and an earnings multiple model. The discounted cash flow model applies a discount rate to our cash flow forecasts that is based on our best estimate of our weighted-average cost of capital. The earnings multiple model applies a market supported multiple to EBITDA. Both models are based on our best estimate of future revenues and operating costs and expenses as of the testing date. Additionally, the results of both models are reconciled to our consolidated market capitalization, which considers the amount a potential buyer would be required to pay, in the form of a control premium, to gain sufficient ownership to set policies, direct operations and control management decisions of our company.
During the years ended December 31, 2017, 2016 and 2015, we recorded impairment of $47.3 million, $291.9 million and $13.0 million, respectively. See “— Overview — 2017 Impairment and — 2016 Impairment” for a table and additional information on the impairment recorded in these years.
67
Workers’ Compensation and Professional and General Liability Insurance Reserve
As part of the business of owning and operating hospitals, we are subject to legal actions alleging liability on our part. To mitigate a portion of this risk, we maintain insurance exceeding a self-insured retention level for these types of claims. Our self-insurance reserves reflect the current estimate of all outstanding losses, including incurred but not reported losses, based on actuarial calculations as of period end. The loss estimates included in the actuarial calculations may change in the future due to updated facts and circumstances. Insurance expense in the statements of income includes the actuarially determined estimates for losses in the current year, including claims incurred but not reported, the changes in estimates for losses in prior years based on actual claims development experience as compared to prior actuarial projections, the insurance premiums for losses related to policies obtained to cover amounts in excess of our self-insured retention levels, the administrative costs of the insurance programs, and interest expense related to the discounted portions of these liabilities. Our reserves for workers’ compensation and professional and general liability claims are based on semi-annual actuarial calculations, which are discounted to present value and consider historical claims data, demographic factors, severity factors and other actuarial assumptions. The liabilities for self-insured claims are discounted based on our risk-free interest rate that corresponds to the period when the self-insured claims are incurred and projected to be paid.
A portion of our reserves for workers’ compensation and professional and general liability claims included on our balance sheets relates to incurred but not reported claims prior to the Spin-off. These claims were fully indemnified by CHS under the terms of the Separation and Distribution Agreement. As a result, we have a corresponding receivable from CHS related to these claims on our balance sheets. See Note 19 — Commitments and Contingencies — Insurance Reserves in the accompanying financial statements for a table that summarizes the liabilities and receivables associated with our workers’ compensation and professional and general liability claims as of December 31, 2017 and 2016.
Income Taxes
The breadth of our operations and the complexity of tax regulations require assessments of uncertainties and judgments in estimating the amount of income taxes that we will ultimately pay. The amount of income taxes ultimately paid by us is dependent upon many factors, including negotiations with taxing authorities in various jurisdictions, outcomes of tax litigation and resolution of disputes arising from federal and state tax audits in the normal course of business.
We calculate our provision for income taxes and account for income taxes using the asset and liability method. Under this method, deferred income taxes are recorded to represent the future tax consequences expected to occur when the reported amounts of assets and liabilities are recovered or paid. The provision for income taxes represents income taxes paid or payable for the current year plus the change in deferred income taxes during the year. Deferred income taxes result from differences between the financial and tax basis of our assets and liabilities and are adjusted for changes in tax rates and the enactment of new or amended tax laws.
Under the asset and liability method, valuation allowances are recorded to reduce deferred income tax assets when it is more likely than not that a tax benefit will not be realized. We assess the realization of our deferred tax assets to determine whether an income tax valuation allowance is required. Based on all available evidence, both positive and negative, and the weight of that evidence to the extent such evidence can be objectively verified, we determine whether it is more likely than not that all or a portion of the deferred tax assets will be realized.
The main factors that we consider include:
| • | cumulative earnings or losses in recent years, adjusted for certain nonrecurring items; |
| • | expected earnings or losses in future years; |
| • | unsettled circumstances that, if unfavorably resolved, would adversely affect future operations and earnings levels; |
| • | the availability, or lack thereof, of taxable income in prior carryback periods that would limit realization of tax benefits; and |
| • | the carryforward period associated with the deferred tax assets and liabilities. |
In the ordinary course of business, there is inherent uncertainty in quantifying our income tax positions. We assess our income tax positions and record deferred income tax benefits for all tax years subject to examination based upon management’s evaluation of the facts, circumstances and information available at the reporting date about the ability to realize the benefit of the deferred tax assets or tax positions. For those tax positions where it is more likely than not that a future tax benefit will be sustained, our policy is to record the largest amount of income tax benefit with a greater than 50% likelihood of being realized upon ultimate settlement with a taxing authority that has full knowledge of all relevant information. For those income tax positions where it is not more likely than not that an income tax benefit will not be sustained in the future, we do not recognize a deferred tax benefit in our financial statements. We record interest and penalties, net of any applicable tax benefit, related to income taxes, if any, as a component of the provision for income taxes when applicable.
See Note 12 — Income Taxes in the accompanying financial statements for additional information on the use of the separate return method of accounting for income taxes that we used during the carve-out period and for information on the projected impact of the new tax laws.
68
New Accounting Pronouncements
In January 2017, the FASB issued ASU No. 2017-04, Intangibles — Goodwill and Other: Simplifying the Accounting for Goodwill Impairment, which simplifies the accounting for goodwill impairment by eliminating step two from the goodwill impairment test. This ASU instead permits an entity to recognize goodwill impairment as the excess of a reporting unit's carrying value over the estimated fair value of the reporting unit, to the extent this amount does not exceed the carrying amount of goodwill. The new guidance continues to allow an entity to perform a qualitative assessment of goodwill impairment indicators in lieu of a quantitative assessment in certain situations. The ASU is effective for our annual and interim reporting periods beginning after December 15, 2019, with early adoption permitted. We are currently evaluating the impact this guidance may have on our results of operations, financial position and cash flows.
In March 2016, the FASB issued ASU No. 2016-09, Compensation — Stock Compensation, which was issued to simplify some of the accounting guidance for share-based compensation. Among the areas impacted by the amendments in this ASU are the accounting for income taxes related to share-based payments, accounting for forfeitures, classification of awards as equity or liabilities and classification on the statement of cash flows. This ASU is effective for fiscal years beginning after December 15, 2016, with early adoption permitted. We adopted this ASU on January 1, 2017. The adoption of this ASU had no material impact on our results of operations, financial position and cash flows.
In February 2016, the FASB issued ASU No. 2016-02, Leases, which amends the accounting for leases and requires the rights and obligations arising from lease contracts, including existing and new arrangements, to be recognized as assets and labilities on the balance sheet. Recognition of these assets and liabilities will have a material impact to our consolidated balance sheets upon adoption. This ASU is effective for fiscal years beginning after December 15, 2018, with early adoption permitted. Under ASU 2016-02, lessees and lessors are required to recognize and measure leases at the beginning of the earliest period presented using a modified retrospective approach, which includes a number of optional practical expedients. We expect to adopt this ASU on January 1, 2019. We are still evaluating the impact that the adoption of this standard will have on our policies, procedures, financial disclosures and control framework. We are additionally evaluating any modifications to our leasing strategy in response to the requirements of this standard.
In May 2014, the FASB issued ASU No. 2014-09, Revenue from Contracts with Customers, which provides for a single comprehensive principles-based model for the recognition of revenue across all industries using a five-step model to recognize revenue from customer contracts. The new standard significantly expands disclosures about the nature, amount, timing, and uncertainty of revenues and cash flows, as well as certain additional quantitative and qualitative disclosures. The standard is effective for fiscal years beginning after December 15, 2017, with early adoption permitted for annual periods beginning after December 15, 2016, and permits the use of either a full or modified retrospective approach upon adoption. We adopted this ASU on January 1, 2018 using the modified retrospective approach and during the fourth quarter of 2017 completed our evaluation of the resulting impact on our consolidated results of operations, financial position and cash flows. A significant portion of the adoption of this ASU was the process of evaluating the characteristics of patient accounts receivable portfolios to ensure that when evaluated under the new standard it would result in a materially consistent revenue amount for such portfolios as if each patient account was evaluated on a contract-by-contract basis. A component of this evaluation was the estimation of what portion of an insured patient’s account will ultimately be due from the patient as a co-payment or deductible and of that amount what will ultimately be collectible. We updated our processes to accommodate this estimate and recorded a change in estimate to increase our allowance for doubtful accounts at December 31, 2017, which is further discussed above in our critical accounting policies on accounts receivable and allowance for doubtful accounts. We completed our evaluation of the impact on our results of operations as of the fourth quarter 2017 and we do not expect the adoption of this ASU to have a material impact on our consolidated results of operations on a prospective basis, other than the impact of the presentation of the income statement, as the provision for bad debts will be recorded as a direct reduction to revenues and will not be presented as a separate line item.
Results of Operations
We have summarized our results of operations, including certain financial and operating data, for the years ended December 31, 2017, 2016 and 2015, for the three months ended December 31, 2017 and 2016 and for the sequential quarters ended December 31, 2017 and September 30, 2017 on a comparative basis below. The definitions of certain terms used throughout the remainder of “Item 7. Management’s Discussion and Analysis of Financial Condition and Results of Operations” follows:
Consolidated and Combined. Our financial statements include amounts and disclosures related to the stand-alone financial statements and accounting records of QHC after the Spin-off (“consolidated”) in combination with amounts and disclosures that have been derived for the businesses comprising QHC from the consolidated financial statements and accounting records of CHS for the periods prior to the completion of the Spin-off (“combined”). Any references to our financial statements, financial data and operating data refer to our consolidated and combined financial statements unless otherwise noted.
Same-facility. Same-facility financial and operating data, as presented in the comparative discussions herein, excludes hospitals that were sold prior to and as of the end of the current reporting period. Our same-facility operating results for the three months and years ended December 31, 2017 and 2016 and the three months ended September 30, 2017, which are reported herein, have been
69
adjusted to exclude the operating results of Sandhills, Barrow, Cherokee, Trinity, Lock Haven, Sunbury and L.V. Stabler, which we sold on December 1, 2016, December 31, 2016, March 31, 2017, June 30, 2017, September 30, 2017, September 30, 2017 and October 31, 2017, respectively.
Continuing Hospitals Group. The Continuing Hospitals Group consists of twenty-four hospitals which we currently intend to continue to operate as part of our core business.
Divestitures Group. The Divestitures Group, as of December 31, 2017, includes all hospitals that had been divested by us since the Spin-off through December 31, 2017. The Divestitures Group includes Barrow, Sandhills, Cherokee, Trinity, Lock Haven, Sunbury and L.V. Stabler. This group of hospitals has certain ongoing operations during the wind-down period related to the assets and liabilities which were not part of the hospital sale, which typically include accounts receivable and third-party receivables and payables.
Potential Divestitures Group. The Potential Divestitures Group, as of December 31, 2017, includes seven hospitals that management has identified for potential divestiture over the next twelve to twenty-four month period. We continually evaluate other hospitals for potential divestiture which could result in changes to the hospitals included in this group in future periods.
Licensed Beds. Licensed beds are the number of beds for which the appropriate state agency licenses a hospital, regardless of whether the beds are actually available for patient use.
Admissions. Admissions represent the number of patients admitted for inpatient services.
Adjusted Admissions. Adjusted admissions is computed by multiplying admissions by gross patient revenues and then dividing that number by gross inpatient revenues.
Emergency room visits. Emergency room visits represent the number of patients registered and treated in our emergency rooms.
Medicare case mix index. Medicare case mix index is a relative value assigned to a diagnosis-related group of patients that is used in determining the allocation of resources necessary to treat the patients in that group. Medicare case mix index is calculated as the average case mix index for all Medicare admissions during the period.
Hospital operations man-hours per adjusted admission. Hospital operations man-hours per adjusted admission is calculated as total paid employed and contract labor hours at both our hospitals and affiliated outpatient facilities divided by adjusted admissions. It is used by management as a measurement of productivity.
Days revenue outstanding. Days revenue outstanding approximates the average collection period for patient accounts receivable. It is calculated by dividing net patient accounts receivable at the end of the period by average net operating revenues per day for the most recent three months. Net patient accounts receivable excludes the amounts reported as due from and to third-party payors related to final cost report settlements and state supplemental payment programs.
EBITDA. EBITDA is a non-GAAP financial measure that consists of net income (loss) before interest, income taxes, depreciation and amortization.
Adjusted EBITDA. Adjusted EBITDA, also a non-GAAP financial measure, is EBITDA adjusted to add back the effect of certain legal, professional and settlement costs, impairment of long-lived assets and goodwill, net gain (loss) on sale of hospitals, transaction costs related to the Spin-off, post-spin headcount reductions and change in estimate related to collectability of patient accounts receivable. We use Adjusted EBITDA as a measure of financial performance. Adjusted EBITDA is a key measure used by our management to assess the operating performance of our hospital operations business and to make decisions on the allocation of resources. Additionally, management utilizes Adjusted EBITDA in assessing our consolidated results of operations and in comparing our results of operations between periods.
Adjusted EBITDA, Adjusted for Divestitures. Adjusted EBITDA, Adjusted for Divestitures, also a non-GAAP financial measure, is further retrospectively adjusted to exclude the effect of positive or negative EBITDA of the Divestitures Group. We present Adjusted EBITDA, Adjusted for Divestitures because management believes this measure provides investors and other users of our financial statements with additional information about how management assesses the results of operations.
Adjusted EBITDA, Adjusted for Potential Divestitures. Adjusted EBITDA, Adjusted for Potential Divestitures, also a non-GAAP financial measure, is Adjusted EBITDA, Adjusted for Divestitures, and further retrospectively adjusted to exclude the effect of positive or negative EBITDA of the Potential Divestitures Group. We present Adjusted EBITDA, Adjusted for Potential Divestitures because management believes this measure provides investors and other users of our financial statements with additional information about how management assesses the results of operations.
70
Year Ended December 31, 2017 Compared to Year Ended December 31, 2016
A summary of our results of operations, both in dollars and as a percentage of net operating revenues, follows (dollars in thousands):
| | Year Ended December 31, | |
| | 2017 | | | 2016 | | | 2017 vs 2016 | |
| | | | | | % of | | | | | | | % of | | | $ | | | Change | |
| | Amount | | | Revenues | | | Amount | | | Revenues | | | Variance | | | in % | |
| | | | | | | | | | | | | | | | | | | | | | | | |
Operating revenues, net of contractual allowances and discounts | | $ | 2,327,655 | | | | | | | $ | 2,419,053 | | | | | | | $ | (91,398 | ) | | | | |
Provision for bad debts | | | 255,485 | | | | | | | | 280,586 | | | | | | | | (25,101 | ) | | | | |
Net operating revenues | | | 2,072,170 | | | | 100.0 | % | | | 2,138,467 | | | | 100.0 | % | | | (66,297 | ) | | | | |
Operating costs and expenses: | | | | | | | | | | | | | | | | | | | | | | | | |
Salaries and benefits | | | 1,034,797 | | | | 49.9 | % | | | 1,057,119 | | | | 49.4 | % | | | (22,322 | ) | | | 0.5 | % |
Supplies | | | 250,523 | | | | 12.1 | % | | | 258,639 | | | | 12.1 | % | | | (8,116 | ) | | | — | % |
Other operating expenses | | | 623,063 | | | | 30.1 | % | | | 645,802 | | | | 30.3 | % | | | (22,739 | ) | | | (0.2 | )% |
Depreciation and amortization | | | 82,155 | | | | 4.0 | % | | | 117,288 | | | | 5.5 | % | | | (35,133 | ) | | | (1.5 | )% |
Rent | | | 50,230 | | | | 2.4 | % | | | 49,883 | | | | 2.3 | % | | | 347 | | | | 0.1 | % |
Electronic health records incentives earned | | | (4,745 | ) | | | (0.2 | )% | | | (11,482 | ) | | | (0.5 | )% | | | 6,737 | | | | 0.3 | % |
Legal, professional and settlement costs | | | 6,001 | | | | 0.3 | % | | | 7,342 | | | | 0.3 | % | | | (1,341 | ) | | | — | % |
Impairment of long-lived assets and goodwill | | | 47,281 | | | | 2.3 | % | | | 291,870 | | | | 13.6 | % | | | (244,589 | ) | | | (11.3 | )% |
Loss (gain) on sale of hospitals, net | | | (5,243 | ) | | | (0.3 | )% | | | 2,150 | | | | 0.1 | % | | | (7,393 | ) | | | (0.4 | )% |
Transaction costs related to the Spin-off | | | 253 | | | | — | % | | | 5,488 | | | | 0.3 | % | | | (5,235 | ) | | | (0.3 | )% |
Total operating costs and expenses | | | 2,084,315 | | | | 100.6 | % | | | 2,424,099 | | | | 113.4 | % | | | (339,784 | ) | | | (12.8 | )% |
Income (loss) from operations | | | (12,145 | ) | | | (0.6 | )% | | | (285,632 | ) | | | (13.4 | )% | | | 273,487 | | | | 12.8 | % |
Interest expense, net | | | 122,077 | | | | 5.9 | % | | | 113,440 | | | | 5.3 | % | | | 8,637 | | | | 0.6 | % |
Income (loss) before income taxes | | | (134,222 | ) | | | (6.5 | )% | | | (399,072 | ) | | | (18.7 | )% | | | 264,850 | | | | 12.2 | % |
Provision for (benefit from) income taxes | | | (21,865 | ) | | | (1.1 | )% | | | (53,875 | ) | | | (2.6 | )% | | | 32,010 | | | | 1.5 | % |
Net income (loss) | | | (112,357 | ) | | | (5.4 | )% | | | (345,197 | ) | | | (16.1 | )% | | | 232,840 | | | | 10.7 | % |
Less: Net income (loss) attributable to noncontrolling interests | | | 1,833 | | | | 0.1 | % | | | 2,491 | | | | 0.2 | % | | | (658 | ) | | | (0.1 | )% |
Net income (loss) attributable to Quorum Health Corporation | | $ | (114,190 | ) | | | (5.5 | )% | | $ | (347,688 | ) | | | (16.3 | )% | | $ | 233,498 | | | | 10.8 | % |
The following table reconciles Adjusted EBITDA, Adjusted EBITDA, Adjusted for Divestitures and Adjusted EBITDA, Adjusted for Potential Divestitures to net income (loss), the most directly comparable U.S. GAAP financial measure (in thousands):
| | Year Ended December 31, | |
| | 2017 | | | 2016 | |
| | | | | | | | |
Net income (loss) | | $ | (112,357 | ) | | $ | (345,197 | ) |
Interest expense, net | | | 122,077 | | | | 113,440 | |
Provision for (benefit from) income taxes | | | (21,865 | ) | | | (53,875 | ) |
Depreciation and amortization | | | 82,155 | | | | 117,288 | |
EBITDA | | | 70,010 | | | | (168,344 | ) |
Legal, professional and settlement costs | | | 6,001 | | | | 7,342 | |
Impairment of long-lived assets and goodwill | | | 47,281 | | | | 291,870 | |
Loss (gain) on sale of hospitals, net | | | (5,243 | ) | | | 2,150 | |
Transaction costs related to the Spin-off | | | 253 | | | | 5,488 | |
Post-spin headcount reductions | | | 2,543 | | | | 1,617 | |
Change in estimate related to collectability of patient accounts receivable | | | 21,000 | | | | 22,799 | |
Adjusted EBITDA | | | 141,845 | | | | 162,922 | |
Negative EBITDA of divested hospitals | | | 20,637 | | | | 33,107 | |
Adjusted EBITDA, Adjusted for Divestitures | | | 162,482 | | | | 196,029 | |
Negative (Positive) EBITDA of potential divestitures | | | 8,337 | | | | (8,232 | ) |
Adjusted EBITDA, Adjusted for Potential Divestitures | | $ | 170,819 | | | $ | 187,797 | |
71
Revenues
The following table provides information related to our net operating revenues (dollars in thousands, except per adjusted admission amounts):
| | Year Ended December 31, | |
| | 2017 | | | 2016 | | | $ Variance | | | % Variance | |
| | | | | | | | | | | | | | | | |
Consolidated and combined: | | | | | | | | | | | | | | | | |
Net patient revenues, before the provision for bad debts | | $ | 2,230,332 | | | $ | 2,313,977 | | | $ | (83,645 | ) | | | (3.6 | )% |
Provision for bad debts | | | 255,485 | | | | 280,586 | | | | (25,101 | ) | | | (8.9 | )% |
Total net patient revenues | | | 1,974,847 | | | | 2,033,391 | | | | (58,544 | ) | | | (2.9 | )% |
Non-patient revenues | | | 97,323 | | | | 105,076 | | | | (7,753 | ) | | | (7.4 | )% |
Total net operating revenues | | $ | 2,072,170 | | | $ | 2,138,467 | | | $ | (66,297 | ) | | | (3.1 | )% |
Net patient revenues per adjusted admission | | $ | 9,076 | | | $ | 8,643 | | | $ | 433 | | | | 5.0 | % |
Net operating revenues per adjusted admission | | $ | 9,524 | | | $ | 9,090 | | | $ | 434 | | | | 4.8 | % |
| | | | | | | | | | | | | | | | |
Same-facility: | | | | | | | | | | | | | | | | |
Net patient revenues, before the provision for bad debts | | $ | 2,133,099 | | | $ | 2,080,948 | | | $ | 52,151 | | | | 2.5 | % |
Provision for bad debts | | | 231,392 | | | | 227,511 | | | | 3,881 | | | | 1.7 | % |
Total net patient revenues | | | 1,901,707 | | | | 1,853,437 | | | | 48,270 | | | | 2.6 | % |
Non-patient revenues | | | 96,015 | | | | 102,073 | | | | (6,058 | ) | | | (5.9 | )% |
Total net operating revenues | | $ | 1,997,722 | | | $ | 1,955,510 | | | $ | 42,212 | | | | 2.2 | % |
Net patient revenues per adjusted admission | | $ | 9,236 | | | $ | 9,036 | | | $ | 200 | | | | 2.2 | % |
Net operating revenues per adjusted admission | | $ | 9,702 | | | $ | 9,534 | | | $ | 168 | | | | 1.8 | % |
The following table provides information related to our net operating revenues, before the provision for bad debts, by payor source (dollars in thousands):
| | Year Ended December 31, | |
| | 2017 | | | 2016 | | | 2017 vs 2016 | |
| | Amount | | | % of Total | | | Amount | | | % of Total | | | $ Variance | | | Change in % | |
| | | | | | | | | | | | | | | | | | | | | | | | |
Consolidated and combined: | | | | | | | | | | | | | | | | | | | | | | | | |
Medicare | | $ | 656,843 | | | | 28.2 | % | | $ | 673,074 | | | | 27.8 | % | | $ | (16,231 | ) | | | 0.4 | % |
Medicaid | | | 425,943 | | | | 18.3 | % | | | 446,273 | | | | 18.4 | % | | | (20,330 | ) | | | (0.1 | )% |
Managed care and commercial | | | 921,503 | | | | 39.6 | % | | | 952,535 | | | | 39.4 | % | | | (31,032 | ) | | | 0.2 | % |
Self-pay | | | 226,043 | | | | 9.7 | % | | | 242,095 | | | | 10.1 | % | | | (16,052 | ) | | | (0.4 | )% |
Non-patient | | | 97,323 | | | | 4.2 | % | | | 105,076 | | | | 4.3 | % | | | (7,753 | ) | | | (0.1 | )% |
Total net operating revenues, before the provision for bad debts | | $ | 2,327,655 | | | | 100.0 | % | | $ | 2,419,053 | | | | 100.0 | % | | $ | (91,398 | ) | | | | |
| | | | | | | | | | | | | | | | | | | | | | | | |
Same-facility: | | | | | | | | | | | | | | | | | | | | | | | | |
Medicare | | $ | 624,269 | | | | 28.0 | % | | $ | 600,590 | | | | 27.5 | % | | $ | 23,679 | | | | 0.5 | % |
Medicaid | | | 411,176 | | | | 18.4 | % | | | 416,904 | | | | 19.1 | % | | | (5,728 | ) | | | (0.7 | )% |
Managed care and commercial | | | 884,042 | | | | 39.7 | % | | | 868,219 | | | | 39.8 | % | | | 15,823 | | | | (0.1 | )% |
Self-pay | | | 213,612 | | | | 9.6 | % | | | 195,235 | | | | 8.9 | % | | | 18,377 | | | | 0.7 | % |
Non-patient | | | 96,015 | | | | 4.3 | % | | | 102,073 | | | | 4.7 | % | | | (6,058 | ) | | | (0.4 | )% |
Total net operating revenues, before the provision for bad debts | | $ | 2,229,114 | | | | 100.0 | % | | $ | 2,183,021 | | | | 100.0 | % | | $ | 46,093 | | | | | |
72
The following table provides information on certain drivers of our net operating revenues:
| | Year Ended December 31, | |
| | 2017 | | | 2016 | | | $ Variance | | | % Variance | |
| | | | | | | | | | | | | | | | |
Consolidated and combined: | | | | | | | | | | | | | | | | |
Number of licensed beds at end of period | | | 2,979 | | | | 3,459 | | | | (480 | ) | | | (13.9 | )% |
Admissions | | | 88,504 | | | | 95,313 | | | | (6,809 | ) | | | (7.1 | )% |
Adjusted admissions | | | 217,583 | | | | 235,263 | | | | (17,680 | ) | | | (7.5 | )% |
Emergency room visits | | | 660,246 | | | | 726,155 | | | | (65,909 | ) | | | (9.1 | )% |
Medicare case mix index | | | 1.43 | | | | 1.38 | | | | 0.05 | | | | 3.6 | % |
| | | | | | | | | | | | | | | | |
Same-facility: | | | | | | | | | | | | | | | | |
Number of licensed beds at end of period | | | 2,979 | | | | 2,979 | | | | — | | | | — | % |
Admissions | | | 84,459 | | | | 84,905 | | | | (446 | ) | | | (0.5 | )% |
Adjusted admissions | | | 205,905 | | | | 205,110 | | | | 795 | | | | 0.4 | % |
Emergency room visits | | | 622,049 | | | | 631,346 | | | | (9,297 | ) | | | (1.5 | )% |
Medicare case mix index | | | 1.43 | | | | 1.39 | | | | 0.04 | | | | 2.9 | % |
Net operating revenues for the year ended December 31, 2017 decreased $66.3 million compared to the year ended December 31, 2016, consisting of a $58.5 million decrease in net patient revenues and a $7.8 million decrease in non-patient revenues. Our 2016 net patient revenues, before the provision for bad debts, included an $11.4 million negative impact to contractual allowances resulting from the change in estimate described below. Excluding this impact, net patient revenues, before the provision for bad debts decreased $72.2 million, or 3.5%, consisting of a $135.8 million decline from the Divestitures Group, a $16.0 million decline in the Potential Divestitures Group and a $56.8 million increase in the Continuing Hospitals Group. The Continuing Hospitals Group included a $36.3 million increase from volumes, and a $20.5 million increase from payor rates, partially offset by a $15.4 million decrease in net operating revenues related to the California HQAF program. On a consolidated basis, admissions and adjusted admissions declined 7.1% and 7.5%, respectively, when comparing 2017 to 2016. For the Continuing Hospitals Group, admissions and adjusted admissions increased 0.9% and 2.2%, respectively, when comparing 2017 to 2016. Non-patient revenues decreased $7.8 million when comparing 2017 to 2016, primarily related to our hospital management advisory and healthcare consulting services business.
As of December 31, 2016, we recorded a change in estimate of $11.4 million to reduce the net realizable value of our patient accounts receivable, which negatively impacted contractual allowances in our statement of income for the year ended December 31, 2016. This change in estimate related to increasing delays associated with collections on accounts receivable under the Illinois Medicaid program.
Provision for Bad Debts
The provision for bad debts decreased $25.1 million for the year ended December 31, 2017 compared to the year ended December 31, 2016, primarily due to a $28.7 million decrease related to the Divestitures Group.
During the fourth quarter of 2017, we analyzed our self-pay patient accounts receivable at a more comprehensive and disaggregated level and refined our estimate of the collectability of the portion of self-pay accounts receivable related to insured patients, primarily co-pays and deductibles. Our analysis also included an evaluation of patient accounts receivable retained in the divestitures of six of our seven divested hospitals. As a result of these efforts, we recorded a change in estimate of $21.0 million to reduce the net realizable value of patient accounts receivable, which negatively impacted the provision for bad debts in our statement of income for the year ended December 31, 2017.
As of December 31, 2016, we recorded a change in estimate of $11.4 million to reduce the net realizable value of our patient accounts receivable, which negatively impacted the provision for bad debts in our statement of income for the year ended December 31, 2016. This change in estimate related to our assessment of the collectability of our managed care and commercial accounts receivable aged greater than one year based on a review of historical cash collections for these accounts.
73
Salaries and Benefits
The following table provides information related to our salaries and benefits expenses (dollars in thousands, except per adjusted admission amounts):
| | Year Ended December 31, | |
| | 2017 | | | 2016 | | | $ Variance | | | % Variance | |
| | | | | | | | | | | | | | | | |
Salaries and benefits | | $ | 1,034,797 | | | $ | 1,057,119 | | | $ | (22,322 | ) | | | (2.1 | )% |
Hospital operations salaries and benefits | | $ | 942,237 | | | $ | 968,868 | | | $ | (26,631 | ) | | | (2.7 | )% |
Hospital operations salaries and benefits per adjusted admission | | $ | 4,330 | | | $ | 4,118 | | | $ | 212 | | | | 5.2 | % |
Hospital operations man-hours per adjusted admission | | | 106.0 | | | | 104.7 | | | | 1.3 | | | | 1.3 | % |
Salaries and benefits decreased $22.3 million for the year ended December 31, 2017 compared to the year ended December 31, 2016. Salaries and benefits declined $60.4 million related to the Divestitures Group and $1.7 million related to the Potential Divestitures Group. These declines were offset by an increase of $35.8 million in salaries and benefits of the Continuing Hospitals Group primarily resulting from increased salaries at our clinics due to physician recruitment efforts and an increase in corporate salaries of $13.1 million as we had a full year of corporate salaries in 2017 compared to eight months in 2016. For the four months in 2016 prior to the Spin-off, management fees were allocated to QHC for corporate functions of CHS and were included in other operating expenses. The increase in corporate salaries and benefits as a result of the Spin-off was partially offset by a reduction in corporate and QHR salaries and benefits in 2017 due to headcount reductions in November 2016 and May 2017. Included in salaries and benefits expenses related to corporate functions were $10.0 million and $7.4 million of stock-based compensation for the years ended December 31, 2017 and 2016, respectively.
Supplies
The following table provides information related to our supplies expense (dollars in thousands, except per adjusted admission amounts):
| | Year Ended December 31, | |
| | 2017 | | | 2016 | | | $ Variance | | | % Variance | |
| | | | | | | | | | | | | | | | |
Supplies | | $ | 250,523 | | | $ | 258,639 | | | $ | (8,116 | ) | | | (3.1 | )% |
Supplies per adjusted admission | | $ | 1,151 | | | $ | 1,099 | | | $ | 52 | | | | 4.7 | % |
Supplies expense decreased $8.1 million for the year ended December 31, 2017 compared to the year ended December 31, 2016. Supplies expense declined $14.7 million related to the Divestitures Group and $3.1 million related to the Potential Divestitures Group. Supplies expense of the Continuing Hospitals Group increased $9.9 million, primarily due to an increase in adjusted admissions of 2.2% for 2017 compared to 2016 which resulted from increased implant costs.
Other Operating Expenses
The following table provides information related to our other operating expenses (dollars in thousands):
| | Year Ended December 31, | |
| | 2017 | | | 2016 | | | 2017 vs 2016 | |
| | | | | | % of | | | | | | | % of | | | $ | | | Change | |
| | Amount | | | Total | | | Amount | | | Total | | | Variance | | | in % | |
| | | | | | | | | | | | | | | | | | | | | | | | |
Purchased services | | $ | 168,711 | | | | 27.1 | % | | $ | 180,672 | | | | 28.0 | % | | $ | (11,961 | ) | | | (0.9 | )% |
Taxes and insurance | | | 131,734 | | | | 21.1 | % | | | 129,775 | | | | 20.1 | % | | | 1,959 | | | | 1.0 | % |
Medical specialist fees | | | 111,840 | | | | 18.0 | % | | | 106,803 | | | | 16.5 | % | | | 5,037 | | | | 1.5 | % |
Transition services agreements and allocations from Parent | | | 63,470 | | | | 10.2 | % | | | 66,441 | | | | 10.3 | % | | | (2,971 | ) | | | (0.1 | )% |
Repairs and maintenance | | | 41,048 | | | | 6.6 | % | | | 42,986 | | | | 6.7 | % | | | (1,938 | ) | | | (0.1 | )% |
Utilities | | | 27,324 | | | | 4.4 | % | | | 29,833 | | | | 4.6 | % | | | (2,509 | ) | | | (0.2 | )% |
Management fees from Parent | | | — | | | | — | % | | | 11,792 | | | | 1.8 | % | | | (11,792 | ) | | | (1.8 | )% |
Other miscellaneous operating expenses | | | 78,936 | | | | 12.6 | % | | | 77,500 | | | | 12.0 | % | | | 1,436 | | | | 0.6 | % |
Total other operating expenses | | $ | 623,063 | | | | 100.0 | % | | $ | 645,802 | | | | 100.0 | % | | $ | (22,739 | ) | | | | |
Other operating expenses decreased $22.7 million for the year ended December 31, 2017 compared to the year ended December 31, 2016. As a percentage of net operating revenues, other operating expenses were 29.9% and 30.3% in these respective years. Other operating expenses declined $11.8 million related to management fees from Parent that existed in 2016 with no comparable other operating expenses in 2017. The comparable costs are primarily included in salaries and benefits following the Spin-off. Other
74
operating expenses also declined $41.7 million related to the Divestitures Group, and increased $3.8 million related to the Potential Divestitures Group and $20.5 million related to the Continuing Hospitals Group. The increase in the Potential Divestitures Group and the Continuing Hospitals Group was primarily due to a $9.7 million increase in medical specialist fees resulting from contracts related to emergency room services and subsidies to various third parties, including hospitalists and a $8.2 million increase in taxes and insurance primarily related to $3.2 million of New Mexico gross receipts tax refunds received in 2016 with no comparable tax refund in 2017. We are disputing in arbitration, among other issues and actions, certain charges and lack of performance of various obligations under the transition services agreements with our former Parent.
Depreciation and Amortization
Depreciation and amortization expense decreased $35.1 million to $82.2 million for the year ended December 31, 2017 compared to $117.3 million for the year ended December 31, 2016. Depreciation and amortization decreased $9.3 million related to the Divestitures Group. In addition, depreciation and amortization is lower in 2017 when compared to 2016 due to impairment recorded in 2017 and 2016 reducing the asset bases of our long-lived assets and due to the discontinuation of depreciation and amortization related to long-lived assets classified as held for sale.
Rent
Rent expense increased $0.3 million to $50.2 million for the year ended December 31, 2017 compared to $49.9 million for the year ended December 31, 2016. As a percentage of net operating revenues, rent expense was 2.4% and 2.3% in these respective years.
Electronic Health Records Incentives Earned
Electronic health records incentives earned decreased $6.8 million to $4.7 million for the year ended December 31, 2017 compared to $11.5 million for the year ended December 31, 2016 primarily due to the decrease in activity as we move closer toward full implementation of EHR. See Note 2 — Basis of Presentation and Significant Accounting Policies — Revenues in the accompanying financial statements for additional information on EHR.
Legal, Professional and Settlement Costs
Legal, professional and settlement costs decreased $1.3 million to $6.0 million for the year ended December 31, 2017 compared to $7.3 million for the year ended December 31, 2016. Our costs in 2017 primarily related to investigation costs incurred by our Board related to litigation related to the Spin-off and the costs in 2016 primarily related to a QHR legal claim. See Note 19 — Commitments and Contingencies in the accompanying financial statements for additional information on legal matters.
Impairment of Long-Lived Assets and Goodwill
For the year ended December 31, 2017, we recognized $47.3 million of impairment to long-lived assets and goodwill. In the first quarter of 2017, we classified certain additional hospitals as held for sale. As part of this process, we evaluated the estimated relative fair value of all our hospitals classified as held for sale in relation to the overall fair value of our hospital operations reporting unit utilizing a September 30, 2016 measurement date, which was the measurement date of our most recent annual goodwill impairment analysis. In the first quarter of 2017, we recorded impairment totaling $3.3 million, consisting of $1.1 million related to property and equipment, $0.8 million related to capitalized software costs and $1.4 million related to goodwill. In the second quarter of 2017, we recognized $12.9 million of impairment to long-lived assets of certain hospitals which we have identified as potential divestiture candidates and for which we have received letters of intent. In the third quarter of 2017, we recognized $5.3 million of impairment to long-lived assets and goodwill of certain hospitals which we have identified as potential divestiture candidates and for which we have received letters of intent, consisting of $3.7 million related to property and equipment and $0.6 million related to goodwill. In the fourth quarter of 2017, we recognized $25.8 million of impairment to long-lived assets and goodwill of potential divestiture candidates, consisting of $23.7 million related to property and equipment and $2.1 million related to capitalized software costs. See “— Overview — 2017 Impairment” for a table and additional information on the impairment recorded in 2017.
For the year ended December 31, 2016, we recognized $291.9 million of impairment to long-lived assets and goodwill, consisting of $145.6 million to property and equipment, $18.9 million to capitalized software costs, $2.4 million to medical license assets and $125.0 million to goodwill. As a result of management’s decision in the second quarter following the Spin-off to divest certain hospitals and evaluate additional hospitals for potential divestiture, we analyzed the long-lived assets of all of our hospitals to test for impairment and additionally identified certain indicators of goodwill impairment related to our hospital operations reporting unit in this quarter. We concluded that such indicators necessitated an interim goodwill impairment evaluation. As a result of all of the above, we recorded impairment in the second quarter of 2016 of $41.0 million related to property and equipment, $4.4 million related to capitalized software costs and $205.0 million related to goodwill, which included a preliminary step two goodwill impairment estimate. In the fourth quarter of 2016, we revised our goodwill impairment estimate by recording a downward adjustment of $80 million, but recorded additional impairment of $71.9 million related to property and equipment and $10.8 million related to capitalized software costs in connection with finalizing our step two goodwill impairment evaluation. Additionally, due to additional indicators of impairment resulting from continued operating losses at certain of our hospitals in the second half of 2016, we recorded further impairment of $32.7 million related to property and equipment, $3.7 million related to capitalized software costs and $2.4 million
75
related to medical licenses associated with our hospital operations business in the fourth quarter of 2017. See “— Overview — 2016 Impairment” for a table and additional information on the impairment recorded in 2016.
Loss (Gain) on Sale of Hospitals, Net
For the year ended December 31, 2017, we recognized a $5.2 million net gain on the sale of hospitals primarily related to the $5.3 million gain on the sale of Trinity in the second quarter of 2017. For the year ended December 31, 2016, we recorded a $2.2 million net loss on the sale of two hospitals, consisting of $1.2 million related to Barrow and $1.0 million related to Sandhills. We are committed to our business strategy, which includes actively engaging in initiatives, among others, to divest underperforming hospitals, reduce our debt and refine our portfolio to a more sustainable group of hospitals with higher operating margins. We have divested a total of seven hospitals in 2017 and 2016. See Note 4 — Divestitures in the accompanying financial statements for additional information on divestitures.
Interest Expense, Net
The following table provides information related to interest expense, net (in thousands):
| | Year Ended December 31, | |
| | 2017 | | | 2016 | | | $ Variance | | | % Variance | |
| | | | | | | | | | | | | | | | |
Senior Credit Facility: | | | | | | | | | | | | | | | | |
Revolving Credit Facility | | $ | 528 | | | $ | 330 | | | $ | 198 | | | | 60.0 | % |
Term Loan Facility | | | 66,111 | | | | 40,719 | | | | 25,392 | | | | 62.4 | % |
ABL Credit Facility | | | 1,854 | | | | 342 | | | | 1,512 | | | | 442.1 | % |
Senior Notes | | | 46,516 | | | | 32,166 | | | | 14,350 | | | | 44.6 | % |
Amortization of debt issuance costs and discounts | | | 8,949 | | | | 4,918 | | | | 4,031 | | | | 82.0 | % |
All other interest expense (income), net | | | (1,881 | ) | | | (849 | ) | | | (1,032 | ) | | | 121.6 | % |
Total interest expense, net, from long-term debt | | | 122,077 | | | | 77,626 | | | | 44,451 | | | | 57.3 | % |
Due to Parent, net | | | — | | | | 35,814 | | | | (35,814 | ) | | | (100.0 | )% |
Total interest expense, net | | $ | 122,077 | | | $ | 113,440 | | | $ | 8,637 | | | | 7.6 | % |
Interest expense, net increased $8.6 million for the year ended December 31, 2017 compared to the year ended December 31, 2016. Following the Spin-off, interest expense is calculated based on the terms of our Credit Agreements and Senior Notes. The effective interest rates for our Term Loan Facility and Senior Notes were approximately 8.8% and 12.9%, respectively, at December 31, 2017 and 7.7% and 12.5%, respectively, at December 31, 2016. Our Senior Credit Facility was amended on April 11, 2017, which increased the interest rate terms on our Term Loan Facility. Additionally, for the four month period in 2016 prior to the Spin-off, we were charged interest on the amounts due to CHS at various rates ranging from 4% to 7%. Interest computations on this indebtedness were based on the outstanding balance of Due to Parent, net at the end of each month. This debt with CHS was extinguished on April 29, 2016. See “Liquidity and Capital Resources” below and Note 7 — Long-Term Debt in the accompanying financial statements for additional information on our indebtedness.
Provision for (Benefit from) Income Taxes
The following table reconciles the differences between the statutory federal income tax rate and our effective tax rate (dollars in thousands):
| | Year Ended December 31, | |
| | 2017 | | | 2016 | | | 2017 vs 2016 | |
| | Amount | | | % of Total | | | Amount | | | % of Total | | | $ Variance | | | Change in % | |
| | | | | | | | | | | | | | | | | | | | | | | | |
Provision for (benefit from) income taxes at statutory federal tax rate | | $ | (46,978 | ) | | | 35.0 | % | | $ | (139,685 | ) | | | 35.0 | % | | $ | 92,707 | | | | — | % |
State income taxes, net of federal income tax benefit | | | (6,137 | ) | | | 4.6 | % | | | (47,749 | ) | | | 12.0 | % | | | 41,612 | | | | (7.4 | )% |
Net (income) loss attributable to noncontrolling interests | | | (641 | ) | | | 0.5 | % | | | (872 | ) | | | 0.2 | % | | | 231 | | | | 0.3 | % |
Non-deductible goodwill and Spin-off costs | | | 535 | | | | (0.4 | )% | | | 36,009 | | | | (9.0 | )% | | | (35,474 | ) | | | 8.6 | % |
Change in valuation allowance (pre Tax Act) | | | 53,470 | | | | (39.8 | )% | | | — | | | | — | % | | | 53,470 | | | | (39.8 | )% |
Change in rate due to Tax Act | | | (10,934 | ) | | | 8.1 | % | | | 94,745 | | | | (23.7 | )% | | | (105,679 | ) | | | 31.8 | % |
Change in valuation allowance due to Tax Act | | | (13,121 | ) | | | 9.8 | % | | | — | | | | — | % | | | (13,121 | ) | | | 9.8 | % |
All other items | | | 1,941 | | | | (1.5 | )% | | | 3,677 | | | | (1.0 | )% | | | (1,736 | ) | | | (0.5 | )% |
Total provision for (benefit from) income taxes and effective tax rate | | $ | (21,865 | ) | | | 16.3 | % | | $ | (53,875 | ) | | | 13.5 | % | | $ | 32,010 | | | | 2.8 | % |
76
On December 22, 2017, the Tax Cuts and Jobs Act (the “Tax Act”) was signed into law. The Tax Act includes a number of changes to existing U.S. tax laws that impact us, most notably a reduction of the U.S. corporate tax rate from 35% to 21% for tax years after December 31, 2017. As a direct result of changes in tax law due to the passage of the Tax Act, we recorded a total tax benefit of $24.0 million during 2017 which is composed of two amounts: a tax benefit of $10.9 million in deferred income tax expense for the net change in our deferred tax liabilities at the new 21% tax rate, and a $13.1 million tax benefit in deferred income tax expense for the reduction in valuation allowance attributable to the change in net realizability of deferred tax assets. The Tax Act also provides for acceleration of depreciation for certain assets placed into service after September 27, 2017, as well as prospective changes beginning in 2018. These prospective changes include an increased limitation on the deductibility of executive compensation, a limitation on the deductibility of interest expense, new rules surrounding meals and entertainment expense and fines and penalties. Also, while net operating losses generated in the future may by carried forward indefinitely under the new law, there is a limitation on the amount that may be used in any given year. The Tax Act may also have an impact on projected future taxable income that could further affect valuation allowance considerations. In addition to the federal law, we await guidance from the states in which we file on how components of the Tax Act may be treated in these jurisdictions. Those adjustments may materially impact our provision for (benefit from) income taxes in the period in which the adjustments are made.
The benefit from income taxes was $21.9 million and $53.9 million for the years ended December 31, 2017 and 2016, respectively. Our effective tax rates were 16.3% and 13.5% for these respective periods. The increase in our effective tax rate in 2017 when compared to 2016 was primarily due to the Tax Act which provided for the recognition of a deferred tax benefit on both the release of valuation allowance related to certain deferred tax assets not previously expected to be realized in addition to statutory rate reduction from 35% to 21%.
Net Income (Loss) Attributable to Noncontrolling Interests
Net income (loss) attributable to noncontrolling interests was $1.8 million and $2.5 million for the years ended December 31, 2017 and 2016, respectively. As a percentage of net operating revenues, net income (loss) attributable to noncontrolling interests was 0.1% and 0.2% in these respective years. Our noncontrolling interest partnership associated with Trinity was dissolved in connection with the sale of this hospital in the second quarter of 2017.
77
Year Ended December 31, 2016 Compared to Year Ended December 31, 2015
A summary of our results of operations, both in dollars and as a percentage of net operating revenues, follows (dollars in thousands):
| | Year Ended December 31, | |
| | 2016 | | | 2015 | | | 2016 vs 2015 | |
| | | | | | % of | | | | | | | % of | | | $ | | | Change | |
| | Amount | | | Revenues | | | Amount | | | Revenues | | | Variance | | | in % | |
| | | | | | | | | | | | | | | | | | | | | | | | |
Operating revenues, net of contractual allowances and discounts | | $ | 2,419,053 | | | | | | | $ | 2,445,858 | | | | | | | $ | (26,805 | ) | | | | |
Provision for bad debts | | | 280,586 | | | | | | | | 258,520 | | | | | | | | 22,066 | | | | | |
Net operating revenues | | | 2,138,467 | | | | 100.0 | % | | | 2,187,338 | | | | 100.0 | % | | | (48,871 | ) | | | | |
Operating costs and expenses: | | | | | | | | | | | | | | | | | | | | | | | | |
Salaries and benefits | | | 1,057,119 | | | | 49.4 | % | | | 1,016,696 | | | | 46.5 | % | | | 40,423 | | | | 2.9 | % |
Supplies | | | 258,639 | | | | 12.1 | % | | | 249,792 | | | | 11.4 | % | | | 8,847 | | | | 0.7 | % |
Other operating expenses | | | 645,802 | | | | 30.3 | % | | | 634,233 | | | | 29.0 | % | | | 11,569 | | | | 1.3 | % |
Depreciation and amortization | | | 117,288 | | | | 5.5 | % | | | 128,001 | | | | 5.9 | % | | | (10,713 | ) | | | (0.4 | )% |
Rent | | | 49,883 | | | | 2.3 | % | | | 48,729 | | | | 2.2 | % | | | 1,154 | | | | 0.1 | % |
Electronic health records incentives earned | | | (11,482 | ) | | | (0.5 | )% | | | (25,779 | ) | | | (1.2 | )% | | | 14,297 | | | | 0.7 | % |
Legal, professional and settlement costs | | | 7,342 | | | | 0.3 | % | | | — | | | | — | % | | | 7,342 | | | | 0.3 | % |
Impairment of long-lived assets and goodwill | | | 291,870 | | | | 13.6 | % | | | 13,000 | | | | 0.6 | % | | | 278,870 | | | | 13.0 | % |
Loss (gain) on sale of hospitals, net | | | 2,150 | | | | 0.1 | % | | | — | | | | — | % | | | 2,150 | | | | 0.1 | % |
Transaction costs related to the Spin-off | | | 5,488 | | | | 0.3 | % | | | 16,337 | | | | 0.7 | % | | | (10,849 | ) | | | (0.4 | )% |
Total operating costs and expenses | | | 2,424,099 | | | | 113.4 | % | | | 2,081,009 | | | | 95.1 | % | | | 343,090 | | | | 18.3 | % |
Income (loss) from operations | | | (285,632 | ) | | | (13.4 | )% | | | 106,329 | | | | 4.9 | % | | | (391,961 | ) | | | (18.3 | )% |
Interest expense, net | | | 113,440 | | | | 5.3 | % | | | 98,290 | | | | 4.5 | % | | | 15,150 | | | | 0.8 | % |
Income (loss) before income taxes | | | (399,072 | ) | | | (18.7 | )% | | | 8,039 | | | | 0.4 | % | | | (407,111 | ) | | | (19.1 | )% |
Provision for (benefit from) income taxes | | | (53,875 | ) | | | (2.6 | )% | | | 3,304 | | | | 0.2 | % | | | (57,179 | ) | | | (2.8 | )% |
Net income (loss) | | | (345,197 | ) | | | (16.1 | )% | | | 4,735 | | | | 0.2 | % | | | (349,932 | ) | | | (16.3 | )% |
Less: Net income (loss) attributable to noncontrolling interests | | | 2,491 | | | | 0.2 | % | | | 3,398 | | | | 0.1 | % | | | (907 | ) | | | 0.1 | % |
Net income (loss) attributable to Quorum Health Corporation | | $ | (347,688 | ) | | | (16.3 | )% | | $ | 1,337 | | | | 0.1 | % | | $ | (349,025 | ) | | | (16.4 | )% |
The following table reconciles Adjusted EBITDA, Adjusted EBITDA, Adjusted for Divestitures and Adjusted EBITDA, Adjusted for Potential Divestitures, to net income (loss), the most directly comparable U.S. GAAP financial measure (in thousands):
| | Year Ended December 31, | |
| | 2016 | | | 2015 | |
| | | | | | | | |
Net income (loss) | | $ | (345,197 | ) | | $ | 4,735 | |
Interest expense, net | | | 113,440 | | | | 98,290 | |
Provision for (benefit from) income taxes | | | (53,875 | ) | | | 3,304 | |
Depreciation and amortization | | | 117,288 | | | | 128,001 | |
EBITDA | | | (168,344 | ) | | | 234,330 | |
Legal, professional and settlement costs | | | 7,342 | | | | — | |
Impairment of long-lived assets and goodwill | | | 291,870 | | | | 13,000 | |
Loss (gain) on sale of hospitals, net | | | 2,150 | | | | — | |
Transaction costs related to the Spin-off | | | 5,488 | | | | 16,337 | |
Post-spin headcount reductions | | | 1,617 | | | | — | |
Change in estimate related to collectability of patient accounts receivable | | | 22,799 | | | | — | |
Adjusted EBITDA | | | 162,922 | | | | 263,667 | |
Negative EBITDA of divested hospitals | | | 33,107 | | | | 6,407 | |
Adjusted EBITDA, Adjusted for Divestitures | | | 196,029 | | | | 270,074 | |
Negative (Positive) EBITDA of potential divestitures | | | (8,232 | ) | | | (5,637 | ) |
Adjusted EBITDA, Adjusted for Potential Divestitures | | $ | 187,797 | | | $ | 264,437 | |
78
Revenues
The following table provides information on our net operating revenues (dollars in thousands, except per adjusted admission amounts):
| | Year Ended December 31, | |
| | 2016 | | | 2015 | | | $ Variance | | | % Variance | |
| | | | | | | | | | | | | | | | |
Consolidated and combined: | | | | | | | | | | | | | | | | |
Net patient revenues, before the provision for bad debts | | $ | 2,313,977 | | | $ | 2,331,992 | | | $ | (18,015 | ) | | | (0.8 | )% |
Provision for bad debts | | | 280,586 | | | | 258,520 | | | | 22,066 | | | | 8.5 | % |
Total net patient revenues | | | 2,033,391 | | | | 2,073,472 | | | | (40,081 | ) | | | (1.9 | )% |
Non-patient revenues | | | 105,076 | | | | 113,866 | | | | (8,790 | ) | | | (7.7 | )% |
Total net operating revenues | | $ | 2,138,467 | | | $ | 2,187,338 | | | $ | (48,871 | ) | | | (2.2 | )% |
Net patient revenues per adjusted admission | | $ | 8,643 | | | $ | 8,609 | | | $ | 34 | | | | 0.4 | % |
Net operating revenues per adjusted admission | | $ | 9,090 | | | $ | 9,082 | | | $ | 8 | | | | 0.1 | % |
| | | | | | | | | | | | | | | | |
Same-facility: | | | | | | | | | | | | | | | | |
Net patient revenues, before the provision for bad debts | | $ | 2,080,948 | | | $ | 2,077,447 | | | $ | 3,501 | | | | 0.2 | % |
Provision for bad debts | | | 227,511 | | | | 205,379 | | | | 22,132 | | | | 10.8 | % |
Total net patient revenues | | | 1,853,437 | | | | 1,872,068 | | | | (18,631 | ) | | | (1.0 | )% |
Non-patient revenues | | | 102,073 | | | | 110,898 | | | | (8,825 | ) | | | (8.0 | )% |
Total net operating revenues | | $ | 1,955,510 | | | $ | 1,982,966 | | | $ | (27,456 | ) | | | (1.4 | )% |
Net patient revenues per adjusted admission | | $ | 9,036 | | | $ | 9,004 | | | $ | 32 | | | | 0.4 | % |
Net operating revenues per adjusted admission | | $ | 9,534 | | | $ | 9,537 | | | $ | (3 | ) | | | — | % |
The following table provides information related to our net operating revenues, before the provision for bad debts, by payor source (dollars in thousands):
| | Year Ended December 31, | |
| | 2016 | | | 2015 | | | 2016 vs 2015 | |
| | Amount | | | % of Total | | | Amount | | | % of Total | | | $ Variance | | | Change in % | |
| | | | | | | | | | | | | | | | | | | | | | | | |
Consolidated and combined: | | | | | | | | | | | | | | | | | | | | | | | | |
Medicare | | $ | 673,074 | | | | 27.8 | % | | $ | 656,799 | | | | 26.9 | % | | $ | 16,275 | | | | 0.9 | % |
Medicaid | | | 446,273 | | | | 18.4 | % | | | 443,479 | | | | 18.1 | % | | | 2,794 | | | | 0.3 | % |
Managed care and commercial | | | 952,535 | | | | 39.4 | % | | | 984,480 | | | | 40.3 | % | | | (31,945 | ) | | | (0.9 | )% |
Self-pay | | | 242,095 | | | | 10.1 | % | | | 247,234 | | | | 10.0 | % | | | (5,139 | ) | | | 0.1 | % |
Non-patient | | | 105,076 | | | | 4.3 | % | | | 113,866 | | | | 4.7 | % | | | (8,790 | ) | | | (0.4 | )% |
Total net operating revenues, before the provision for bad debts | | $ | 2,419,053 | | | | 100.0 | % | | $ | 2,445,858 | | | | 100.0 | % | | $ | (26,805 | ) | | | | |
| | | | | | | | | | | | | | | | | | | | | | | | |
Same-facility: | | | | | | | | | | | | | | | | | | | | | | | | |
Medicare | | $ | 600,590 | | | | 27.5 | % | | $ | 579,351 | | | | 26.5 | % | | $ | 21,239 | | | | 1.0 | % |
Medicaid | | | 416,904 | | | | 19.1 | % | | | 412,211 | | | | 18.8 | % | | | 4,693 | | | | 0.3 | % |
Managed care and commercial | | | 868,219 | | | | 39.8 | % | | | 886,602 | | | | 40.5 | % | | | (18,383 | ) | | | (0.7 | )% |
Self-pay | | | 195,235 | | | | 8.9 | % | | | 199,283 | | | | 9.1 | % | | | (4,048 | ) | | | (0.2 | )% |
Non-patient | | | 102,073 | | | | 4.7 | % | | | 110,898 | | | | 5.1 | % | | | (8,825 | ) | | | (0.4 | )% |
Total net operating revenues, before the provision for bad debts | | $ | 2,183,021 | | | | 100.0 | % | | $ | 2,188,345 | | | | 100.0 | % | | $ | (5,324 | ) | | | | |
79
The following table provides information on certain drivers of our net operating revenues:
| | Year Ended December 31, | |
| | 2016 | | | 2015 | | | $ Variance | | | % Variance | |
| | | | | | | | | | | | | | | | |
Consolidated and combined: | | | | | | | | | | | | | | | | |
Number of licensed beds at end of period | | | 3,459 | | | | 3,582 | | | | (123 | ) | | | (3.4 | )% |
Admissions | | | 95,313 | | | | 98,378 | | | | (3,065 | ) | | | (3.1 | )% |
Adjusted admissions | | | 235,263 | | | | 240,841 | | | | (5,578 | ) | | | (2.3 | )% |
Emergency room visits | | | 726,155 | | | | 730,021 | | | | (3,866 | ) | | | (0.5 | )% |
Medicare case mix index | | | 1.38 | | | | 1.34 | | | | 0.04 | | | | 3.0 | % |
| | | | | | | | | | | | | | | | |
Same-facility: | | | | | | | | | | | | | | | | |
Number of licensed beds at end of period | | | 2,979 | | | | 2,984 | | | | (5 | ) | | | (0.2 | )% |
Admissions | | | 84,905 | | | | 86,810 | | | | (1,905 | ) | | | (2.2 | )% |
Adjusted admissions | | | 205,110 | | | | 207,918 | | | | (2,808 | ) | | | (1.4 | )% |
Emergency room visits | | | 631,346 | | | | 630,259 | | | | 1,087 | | | | 0.2 | % |
Medicare case mix index | | | 1.39 | | | | 1.36 | | | | 0.03 | | | | 2.5 | % |
Net operating revenues for the year ended December 31, 2016 decreased $48.9 million compared to the year ended December 31, 2015, consisting of a $40.1 million decrease in net patient revenues and an $8.8 million decrease in non-patient revenues. Our 2016 net patient revenues, before the provision for bad debts, included an $11.4 million negative impact to contractual allowances resulting from the change in estimate described below. In addition, our net patient revenues in 2015 were unfavorably impacted by an $11.1 million Illinois cost report settlement reversal that was initially recorded as a favorable adjustment to contractual allowances in 2014 and then reversed in 2015 due to contract negotiations finalized in the second quarter of 2015. Excluding both of these impacts, net patient revenues, before the provision for bad debts, decreased $17.7 million, or 0.8%, in 2016 when compared to 2015 consisting of a $21.5 million decline from the Divestitures Group and a $3.8 million increase in the Potential Divestitures Group. Net patient revenues, before the provision for bad debts, of the Continuing Hospitals Group decreased $0.1 million, consisting of an $18.3 million decrease from volumes, offset by an $18.2 million increase from payor rates. On a consolidated basis, admissions and adjusted admissions declined 3.1% and 2.3%, respectively, for the year ended December 31, 2016 compared to the year ended December 31, 2015. For the Continuing Hospitals Group, admissions and adjusted admissions decreased 2.6% and 1.3%, respectively, in 2016 when compared to 2015.
As of December 31, 2016, we recorded a change in estimate of $11.4 million to reduce the net realizable value of our patient accounts receivable, which negatively impacted contractual allowances in our statement of income for the year ended December 31, 2016. This change in estimate related to increasing delays associated with collections on accounts receivable under the Illinois Medicaid program.
Non-patient revenues decreased $8.8 million in 2016 compared to 2015, consisting of $5.0 million related to our hospital management advisory and healthcare consulting services business due to fewer management advisory and consulting services contracts in 2016 when compared to 2015 and $3.8 million of other income. We had other income of $2.2 million related to the receivables facility with CHS in 2015 with no comparable income in 2016. Our hospitals were removed from the CHS receivables facility in November 2015.
Provision for Bad Debts
The provision for bad debts increased $22.1 million for the year ended December 31, 2016 compared to the year ended December 31, 2015, primarily due to the $11.4 million change in estimate recorded as of December 31, 2016, which negatively impacted the provision for bad debts in our statement of income for the year ended December 31, 2016. This change in estimate related to our assessment of the collectability of our managed care and commercial accounts receivable aged greater than one year based on a review of historical cash collections for these accounts. The provision for bad debts decreased $0.1 million related to the Divestitures Group. The remaining increase was due to a decline in the collectability of self-pay accounts receivable indicated by the most recent hindsight model.
80
Salaries and Benefits
The following table provides information related to our salaries and benefits expenses (dollars in thousands, except per adjusted admission amounts):
| | Year Ended December 31, | |
| | 2016 | | | 2015 | | | $ Variance | | | % Variance | |
| | | | | | | | | | | | | | | | |
Salaries and benefits | | $ | 1,057,119 | | | $ | 1,016,696 | | | $ | 40,423 | | | | 4.0 | % |
Hospital operations salaries and benefits | | $ | 968,868 | | | $ | 959,495 | | | $ | 9,373 | | | | 1.0 | % |
Hospital operations salaries and benefits per adjusted admission | | $ | 4,118 | | | $ | 3,984 | | | $ | 134 | | | | 3.4 | % |
Hospital operations man-hours per adjusted admission | | | 104.7 | | | | 103.2 | | | | 1.5 | | | | 1.5 | % |
Salaries and benefits increased $40.4 million for the year ended December 31, 2016 compared to the year ended December 31, 2015, primarily due to $29.2 million of corporate salaries and benefits in the eight month period following the Spin-off, which included $7.4 million of stock-based compensation. Prior to the Spin-off, management fees were allocated to QHC for corporate functions of CHS and were included in other operating expenses. Salaries and benefits declined $0.9 million related to the Divestitures Group, declined $2.2 million related to the Potential Divestitures Group and increased $9.6 million related to the Continuing Hospitals Group. The increase in the Continuing Hospitals Group primarily related to increased costs related to our self-insurance health claims and costs related to our clinic operations as a result of our physician recruiting efforts.
Supplies
The following table provides information related to our supplies expense (dollars in thousands, except per adjusted admission amounts):
| | Year Ended December 31, | |
| | 2016 | | | 2015 | | | $ Variance | | | % Variance | |
| | | | | | | | | | | | | | | | |
Supplies | | $ | 258,639 | | | $ | 249,792 | | | $ | 8,847 | | | | 3.5 | % |
Supplies per adjusted admission | | $ | 1,099 | | | $ | 1,037 | | | $ | 62 | | | | 6.0 | % |
Supplies expense increased $8.8 million for the year ended December 31, 2016 compared to the year ended December 31, 2015. Supplies expense increased $0.7 million related to the Divestitures Group, declined $0.8 million related to the Potential Divestitures Group and increased $8.8 million related to the Continuing Hospitals Group. The increase in the Continuing Hospitals Group was primarily due to the renegotiated contract with our group purchasing organization following the Spin-off, which resulted in a reduction in rebates and administrative fee reimbursements of $5.3 million in 2016 when compared to 2015.
Other Operating Expenses
The following table provides information related to our other operating expenses (dollars in thousands):
| | Year Ended December 31, | |
| | 2016 | | | 2015 | | | 2016 vs 2015 | |
| | | | | | % of | | | | | | | % of | | | $ | | | Change | |
| | Amount | | | Total | | | Amount | | | Total | | | Variance | | | in % | |
| | | | | | | | | | | | | | | | | | | | | | | | |
Purchased services | | $ | 180,672 | | | | 28.0 | % | | $ | 176,758 | | | | 27.9 | % | | $ | 3,914 | | | | 0.1 | % |
Taxes and insurance | | | 129,775 | | | | 20.1 | % | | | 124,635 | | | | 19.7 | % | | | 5,140 | | | | 0.4 | % |
Medical specialist fees | | | 106,803 | | | | 16.5 | % | | | 85,042 | | | | 13.4 | % | | | 21,761 | | | | 3.1 | % |
Transition services agreements and allocations from Parent | | | 66,441 | | | | 10.3 | % | | | 60,166 | | | | 9.5 | % | | | 6,275 | | | | 0.8 | % |
Repairs and maintenance | | | 42,986 | | | | 6.7 | % | | | 45,945 | | | | 7.2 | % | | | (2,959 | ) | | | (0.5 | )% |
Utilities | | | 29,833 | | | | 4.6 | % | | | 29,856 | | | | 4.7 | % | | | (23 | ) | | | (0.1 | )% |
Management fees from Parent | | | 11,792 | | | | 1.8 | % | | | 36,466 | | | | 5.7 | % | | | (24,674 | ) | | | (3.9 | )% |
Other miscellaneous operating expenses | | | 77,500 | | | | 12.0 | % | | | 75,365 | | | | 11.9 | % | | | 2,135 | | | | 0.1 | % |
Total other operating expenses | | $ | 645,802 | | | | 100.0 | % | | $ | 634,233 | | | | 100.0 | % | | $ | 11,569 | | | | | |
Other operating expenses increased $11.6 million for the year ended December 31, 2016 compared to the year ended December 31, 2015. As a percentage of net operating revenues, other operating expenses were 30.2% and 29.0% in these respective years. Other operating expenses increased $3.2 million related to the Divestitures Group, increased $3.5 million related to the Potential Divestitures Group and increased $11.3 million related to the Continuing Hospitals Group. Medical specialist fees increased in 2016 when compared to 2015 as a result of the renegotiated contracts related to emergency room services and subsidies to various third parties, including hospitalists. Taxes and insurance increased primarily due to a reduction in property tax credits in 2016 when compared to 2015. In 2016, we had $8.0 million of Illinois income tax credits and $3.2 million of New Mexico gross receipts tax refunds, which
81
compared to $13.1 million of Illinois income tax credits in 2015. In 2016, we incurred $0.9 million of expenses associated with New Mexico gross receipts tax refunds that were included in purchased services with no comparable fees in 2015. Management fees from Parent, which primarily consisted of costs for corporate salaries and benefits allocated from CHS, decreased in 2016 as it only includes the four months prior to the Spin-off. We entered into transition services agreements with CHS that were initiated on the Spin-off date and are comparable shared services to those received by us from CHS prior to the Spin-off. When comparing 2016 to 2015, our costs associated with the transition services agreements were $6.3 million higher than the comparable allocated costs from CHS.
Depreciation and Amortization
Depreciation and amortization expense decreased $10.7 million to $117.3 million for the year ended December 31, 2016 compared to $128.0 million for the year ended December 31, 2015. The decrease in depreciation and amortization was primarily due to $45.4 million of impairment to long-lived assets and the reclassification of certain property, equipment and capitalized software costs to held for sale as of June 30, 2016, which reduced depreciation and amortization in the second half of 2016. See “— Overview — 2016 Impairment” for a table and additional information on the impairment recorded in 2016.
Rent
Rent expense increased $1.2 million to $49.9 million for the year ended December 31, 2016 compared to $48.7 million for the year ended December 31, 2015. As a percentage of net operating revenues, rent expense was 2.3% and 2.2% in these respective years.
Electronic Health Records Incentives Earned
Electronic health records incentives earned decreased $14.3 million to $11.5 million for the year ended December 31, 2016 compared to $25.8 million for the year ended December 31, 2015 primarily due to the decrease in activity as we move closer toward full implementation of EHR. See Note 2 — Basis of Presentation and Significant Accounting Policies — Revenues in the accompanying financial statements for additional information on EHR.
Legal, Professional and Settlement Costs
Legal, professional and settlement costs of $7.3 million for the year ended December 31, 2016 primarily related to $4.6 million of costs associated with a QHR legal matter and $1.9 million of costs primarily associated with litigation related to the Spin-off. We did not have any comparable costs in 2015. See Note 19 — Commitments and Contingencies — Commercial Litigations and Other Lawsuits in the accompanying financial statements for additional information on our legal matters.
Impairment of Long-Lived Assets and Goodwill
During the year ended December 31, 2016, we recognized $291.9 million of impairment to long-lived assets and goodwill, consisting of $145.6 million to property and equipment, $18.9 million to capitalized software costs, $2.4 million to medical license assets and $125.0 million to goodwill.
During the second quarter following the Spin-off, we made the decision to classify certain hospitals as held for sale and evaluate other hospitals for potential divestiture. Due to the increase in net operating losses associated with these hospitals, we analyzed the long-lived assets of all of our hospitals to test for impairment and recorded $45.4 million of long-lived asset impairment in this quarter. In addition, we evaluated the estimated relative fair value of the hospitals classified as held for sale in relation to the overall fair value of the hospital operations reporting unit utilizing a September 30, 2015 measurement date, which was the measurement date of our most recent annual goodwill impairment analysis, and recognized $5.0 million of goodwill impairment in this quarter. In this same quarter, we identified certain indicators of goodwill impairment related to the hospital operations reporting unit and concluded that such indicators necessitated an interim goodwill impairment evaluation. The primary indicators were declining market capitalization, as compared to the carrying value of equity, and a decrease in estimated future earnings of the hospital operations reporting unit. We performed a calculation of the overall fair value of this reporting unit in step one of the impairment test and concluded that the carrying value of our hospital operations reporting unit as of June 30, 2016 exceeded the estimated fair value. We performed a preliminary step two calculation of goodwill impairment to determine the implied fair value of goodwill of the hospital operations reporting unit in a hypothetical purchase price allocation. Based on this preliminary analysis, we estimated and recorded additional goodwill impairment of $200 million in the second quarter of 2016.
For step two goodwill impairment testing, we engaged a professional valuation firm to perform a hypothetical purchase price valuation of each of our hospitals utilizing a September 30, 2016 measurement date. The results of the third-party valuation, which were completed in the fourth quarter of 2016, indicated that the carrying values of certain of our individual hospitals exceeded their fair values. Considering these results to be an indicator of potential impairment and to assess whether any additional impairment of long-lived assets existed, we utilized a September 30, 2016 measurement date to perform an analysis of undiscounted cash flows for each hospital in which an indicator of impairment was identified. Based on the results of these analyses, we recorded impairment of $82.7 million related to long-lived assets at certain hospitals and a downward adjustment to our previously recorded goodwill impairment estimate of $80 million in the fourth quarter of 2016. The net impact to our financial statements was $2.7 million of additional impairment in the fourth quarter of 2016 beyond the initial estimate of $200 million estimate recorded as the preliminary step-two calculation in the second quarter of 2016.
82
In addition to the above, we experienced a decline in operating results at several hospitals in the fourth quarter of 2016. This led management to perform additional testing for impairment using a December 31, 2016 measurement date. As a result of this analysis, we recorded additional impairment of $38.8 million related to long-lived assets in the fourth quarter of 2016. See “— Overview — 2016 Impairment” for a table and additional information on the impairment recorded in 2016.
During the year ended December 31, 2015, we recognized impairment of $13.0 million to reduce the carrying values of certain long-lived assets at seven of our hospitals to their estimated fair values. The impairment for 2015 was identified because of declining operating results and projections of future cash flows at these hospitals, which were caused by competitive and operational challenges specific to the markets in which these hospitals operate.
Loss (Gain) on Sale of Hospitals, Net
During the year ended December 31, 2016, we recorded a $2.2 million net loss on the sale of two hospitals, consisting of $1.2 million related to Barrow and $1.0 million related to Sandhills. We had no comparable hospital sales in 2015. We are committed to our business strategy, which includes actively engaging in initiatives, among others, to divest underperforming hospitals, reduce our debt and refine our portfolio to a more sustainable group of hospitals with higher operating margins. See Note 4 — Divestitures in the accompanying financial statements for additional information on the sales of these hospitals, which both occurred in the month of December 2016.
Interest Expense, Net
The following table provides information related to interest expense, net (in thousands):
| | Year Ended December 31, | |
| | 2016 | | | 2015 | | | $ Variance | | | % Variance | |
| | | | | | | | | | | | | | | | |
Senior Credit Facility: | | | | | | | | | | | | | | | | |
Revolving Credit Facility | | $ | 330 | | | $ | — | | | $ | 330 | | | | 100.0 | % |
Term Loan Facility | | | 40,719 | | | | — | | | | 40,719 | | | | 100.0 | % |
ABL Credit Facility | | | 342 | | | | — | | | | 342 | | | | 100.0 | % |
Senior Notes | | | 32,166 | | | | — | | | | 32,166 | | | | 100.0 | % |
Amortization of debt issuance costs and discounts | | | 4,918 | | | | — | | | | 4,918 | | | | 100.0 | % |
All other interest expense (income), net | | | (849 | ) | | | 283 | | | | (1,132 | ) | | | (400.0 | )% |
Total interest expense, net, from long-term debt | | | 77,626 | | | | 283 | | | | 77,343 | | | | 27,329.7 | % |
Due to Parent, net | | | 35,814 | | | | 98,007 | | | | (62,193 | ) | | | (63.5 | )% |
Total interest expense, net | | $ | 113,440 | | | $ | 98,290 | | | $ | 15,150 | | | | 15.4 | % |
Interest expense, net increased $15.2 million for the year ended December 31, 2016 compared to the year ended December 31, 2015 primarily due to the new debt structure put in place in connection with the Spin-off. Interest expense for the period following the Spin-off is calculated based on the terms of the Credit Agreements and Senior Notes. The effective interest rates for our Term Loan Facility and Senior Notes were approximately 7.7% and 12.5%, respectively, at December 31, 2016. Prior to the Spin-off, we were charged interest on our indebtedness with CHS at various rates ranging from 4% to 7%. Interest computations on this indebtedness were based on the outstanding balance of Due to Parent, net at the end of each month. This debt with CHS was extinguished on April 29, 2016, the Spin-off date. See Note 7 — Long-Term Debt in the accompanying financial statements for additional information on our indebtedness.
83
Provision for (Benefit from) Income Taxes
The following table reconciles the differences between the statutory federal income tax rate and our effective tax rate (dollars in thousands):
| | Year Ended December 31, | |
| | 2016 | | | 2015 | | | 2016 vs 2015 | |
| | Amount | | | % of Total | | | Amount | | | % of Total | | | $ Variance | | | Change in % | |
| | | | | | | | | | | | | | | | | | | | | | | | |
Provision for (benefit from) income taxes at statutory federal tax rate | | $ | (139,685 | ) | | | 35.0 | % | | $ | 2,814 | | | | 35.0 | % | | $ | (142,499 | ) | | | — | % |
State income taxes, net of federal income tax benefit | | | (47,749 | ) | | | 12.0 | % | | | (171 | ) | | | (2.1 | )% | | | (47,578 | ) | | | 14.1 | % |
Net (income) loss attributable to noncontrolling interests | | | (872 | ) | | | 0.2 | % | | | (1,189 | ) | | | (14.8 | )% | | | 317 | | | | 15.0 | % |
Non-deductible goodwill and Spin-off costs | | | 36,009 | | | | (9.0 | )% | | | — | | | | — | % | | | 36,009 | | | | (9.0 | )% |
Change in valuation allowance | | | 94,745 | | | | (23.7 | )% | | | 1,459 | | | | 18.2 | % | | | 93,286 | | | | (41.9 | )% |
All other | | | 3,677 | | | | (1.0 | )% | | | 391 | | | | 4.8 | % | | | 3,286 | | | | (5.8 | )% |
Total provision for (benefit from) income taxes and effective tax rate | | $ | (53,875 | ) | | | 13.5 | % | | $ | 3,304 | | | | 41.1 | % | | $ | (57,179 | ) | | | (27.6 | )% |
Our income tax benefit was $53.9 million for the year ended December 31, 2016 and our income tax expense was $3.3 million for the year ended December 31, 2015. Our effective tax rates were 13.5% and 41.1% for these respective years. The decrease in our effective tax rate in 2016 when compared to 2015 was primarily due to our 2016 pre-tax loss, recording a valuation allowance against deferred tax assets that are not more likely than not to be recognized, which we initiated in the fourth quarter of 2016, and the additional impact in 2016 of a greater proportion of non-deductible expenses relative to our pre-tax loss. These non-deductible expenses were primarily the non-deductible portions of our goodwill impairment and Spin-off costs. See Note 12 — Income Taxes in the accompanying financial statements.
Net Income (Loss) Attributable to Noncontrolling Interests
Net income (loss) attributable to noncontrolling interests decreased $0.9 million to $2.5 million for the year ended December 31, 2016 compared to $3.4 million for the year ended December 31, 2015. As a percentage of net operating revenues, net income (loss) attributable to noncontrolling interests was 0.2% and 0.1% in these respective years.
84
Three Months Ended December 31, 2017 Compared to Three Months Ended December 31, 2016 (Unaudited)
A summary of our operating results, both in dollars and as a percentage of net operating revenues, follows (dollars in thousands):
| | Three Months Ended December 31, | |
| | 2017 | | | 2016 | | | 2017 vs 2016 | |
| | | | | | % of | | | | | | | % of | | | $ | | | Change | |
| | Amount | | | Revenues | | | Amount | | | Revenues | | | Variance | | | in % | |
| | | | | | | | | | | | | | | | | | | | | | | | |
Operating revenues, net of contractual allowances and discounts | | $ | 596,648 | | | | | | | $ | 593,855 | | | | | | | $ | 2,793 | | | | | |
Provision for bad debts | | | 81,566 | | | | | | | | 78,615 | | | | | | | | 2,951 | | | | | |
Net operating revenues | | | 515,082 | | | | 100.0 | % | | | 515,240 | | | | 100.0 | % | | | (158 | ) | | | | |
Operating costs and expenses: | | | | | | | | | | | | | | | | | | | | | | | | |
Salaries and benefits | | | 253,106 | | | | 49.1 | % | | | 268,559 | | | | 52.1 | % | | | (15,453 | ) | | | (3.0 | )% |
Supplies | | | 63,932 | | | | 12.4 | % | | | 66,829 | | | | 13.0 | % | | | (2,897 | ) | | | (0.6 | )% |
Other operating expenses | | | 156,669 | | | | 30.5 | % | | | 163,276 | | | | 31.8 | % | | | (6,607 | ) | | | (1.3 | )% |
Depreciation and amortization | | | 18,714 | | | | 3.6 | % | | | 26,434 | | | | 5.1 | % | | | (7,720 | ) | | | (1.5 | )% |
Rent | | | 13,599 | | | | 2.6 | % | | | 11,966 | | | | 2.3 | % | | | 1,633 | | | | 0.3 | % |
Electronic health records incentives earned | | | (229 | ) | | | — | % | | | (1,691 | ) | | | (0.3 | )% | | | 1,462 | | | | 0.3 | % |
Legal, professional and settlement costs | | | (518 | ) | | | (0.1 | )% | | | 1,166 | | | | 0.2 | % | | | (1,684 | ) | | | (0.3 | )% |
Impairment of long-lived assets and goodwill | | | 25,820 | | | | 5.0 | % | | | 41,470 | | | | 8.0 | % | | | (15,650 | ) | | | (3.0 | )% |
Loss (gain) on sale of hospitals, net | | | (131 | ) | | | — | % | | | 2,150 | | | | 0.4 | % | | | (2,281 | ) | | | (0.4 | )% |
Transaction costs related to the Spin-off | | | 49 | | | | — | % | | | 44 | | | | — | % | | | 5 | | | | — | % |
Total operating costs and expenses | | | 531,011 | | | | 103.1 | % | | | 580,203 | | | | 112.6 | % | | | (49,192 | ) | | | (9.5 | )% |
Income (loss) from operations | | | (15,929 | ) | | | (3.1 | )% | | | (64,963 | ) | | | (12.6 | )% | | | 49,034 | | | | 9.5 | % |
Interest expense, net | | | 31,873 | | | | 6.2 | % | | | 28,684 | | | | 5.6 | % | | | 3,189 | | | | 0.6 | % |
Income (loss) before income taxes | | | (47,802 | ) | | | (9.3 | )% | | | (93,647 | ) | | | (18.2 | )% | | | 45,845 | | | | 8.9 | % |
Provision for (benefit from) income taxes | | | (21,779 | ) | | | (4.2 | )% | | | (3,555 | ) | | | (0.7 | )% | | | (18,224 | ) | | | (3.5 | )% |
Net income (loss) | | | (26,023 | ) | | | (5.1 | )% | | | (90,092 | ) | | | (17.5 | )% | | | 64,069 | | | | 12.4 | % |
Less: Net income (loss) attributable to noncontrolling interests | | | 785 | | | | 0.1 | % | | | 574 | | | | 0.1 | % | | | 211 | | | | — | % |
Net income (loss) attributable to Quorum Health Corporation | | $ | (26,808 | ) | | | (5.2 | )% | | $ | (90,666 | ) | | | (17.6 | )% | | $ | 63,858 | | | | 12.4 | % |
The following table reconciles Adjusted EBITDA, Adjusted EBITDA, Adjusted for Divestitures and Adjusted EBITDA, Adjusted for Potential Divestitures to net income (loss), the most directly comparable U.S. GAAP financial measure (in thousands):
| | Three Months Ended December 31, | |
| | 2017 | | | 2016 | |
| | | | | | | | |
Net income (loss) | | $ | (26,023 | ) | | $ | (90,092 | ) |
Interest expense, net | | | 31,873 | | | | 28,684 | |
Provision for (benefit from) income taxes | | | (21,779 | ) | | | (3,555 | ) |
Depreciation and amortization | | | 18,714 | | | | 26,434 | |
EBITDA | | | 2,785 | | | | (38,529 | ) |
Legal, professional and settlement costs | | | (518 | ) | | | 1,166 | |
Impairment of long-lived assets and goodwill | | | 25,820 | | | | 41,470 | |
Loss (gain) on sale of hospitals, net | | | (131 | ) | | | 2,150 | |
Transaction costs related to the Spin-off | | | 49 | | | | 44 | |
Post-spin headcount reductions | | | — | | | | 1,617 | |
Change in estimate related to collectability of patient accounts receivable | | | 21,000 | | | | 22,799 | |
Adjusted EBITDA | | | 49,005 | | | | 30,717 | |
Negative EBITDA of divested hospitals | | | 5,144 | | | | 13,140 | |
Adjusted EBITDA, Adjusted for Divestitures | | | 54,149 | | | | 43,857 | |
Negative EBITDA of potential divestitures | | | 3,114 | | | | 2,102 | |
Adjusted EBITDA, Adjusted for Potential Divestitures | | $ | 57,263 | | | $ | 45,959 | |
85
Revenues
The following table provides information on our net operating revenues (dollars in thousands, except per adjusted admission amounts):
| | Three Months Ended December 31, | |
| | 2017 | | | 2016 | | | $ Variance | | | % Variance | |
| | | | | | | | | | | | | | | | |
Consolidated and combined: | | | | | | | | | | | | | | | | |
Net patient revenues, before the provision for bad debts | | $ | 572,038 | | | $ | 567,767 | | | $ | 4,271 | | | | 0.8 | % |
Provision for bad debts | | | 81,566 | | | | 78,615 | | | | 2,951 | | | | 3.8 | % |
Total net patient revenues | | | 490,472 | | | | 489,152 | | | | 1,320 | | | | 0.3 | % |
Non-patient revenues | | | 24,610 | | | | 26,088 | | | | (1,478 | ) | | | (5.7 | )% |
Total net operating revenues | | $ | 515,082 | | | $ | 515,240 | | | $ | (158 | ) | | | — | % |
Net patient revenues per adjusted admission | | $ | 9,657 | | | $ | 8,551 | | | $ | 1,106 | | | | 12.9 | % |
Net operating revenues per adjusted admission | | $ | 10,142 | | | $ | 9,007 | | | $ | 1,135 | | | | 12.6 | % |
| | | | | | | | | | | | | | | | |
Same-facility: | | | | | | | | | | | | | | | | |
Net patient revenues, before the provision for bad debts | | $ | 570,947 | | | $ | 514,383 | | | $ | 56,564 | | | | 11.0 | % |
Provision for bad debts | | | 75,204 | | | | 63,638 | | | | 11,566 | | | | 18.2 | % |
Total net patient revenues | | | 495,743 | | | | 450,745 | | | | 44,998 | | | | 10.0 | % |
Non-patient revenues | | | 24,484 | | | | 25,138 | | | | (654 | ) | | | (2.6 | )% |
Total net operating revenues | | $ | 520,227 | | | $ | 475,883 | | | $ | 44,344 | | | | 9.3 | % |
Net patient revenues per adjusted admission | | $ | 9,801 | | | $ | 8,963 | | | $ | 838 | | | | 9.3 | % |
Net operating revenues per adjusted admission | | $ | 10,285 | | | $ | 9,463 | | | $ | 822 | | | | 8.7 | % |
The following table provides information related to our net operating revenues, before the provision for bad debts, by payor source (dollars in thousands):
| | Three Months Ended December 31, | |
| | 2017 | | | 2016 | | | 2017 vs 2016 | |
| | Amount | | | % of Total | | | Amount | | | % of Total | | | $ Variance | | | Change in % | |
| | | | | | | | | | | | | | | | | | | | | | | | |
Consolidated and combined: | | | | | | | | | | | | | | | | | | | | | | | | |
Medicare | | $ | 154,096 | | | | 25.8 | % | | $ | 167,238 | | | | 28.2 | % | | $ | (13,142 | ) | | | (2.4 | )% |
Medicaid | | | 127,363 | | | | 21.3 | % | | | 104,243 | | | | 17.6 | % | | | 23,120 | | | | 3.7 | % |
Managed care and commercial | | | 237,861 | | | | 39.9 | % | | | 238,195 | | | | 40.1 | % | | | (334 | ) | | | (0.2 | )% |
Self-pay | | | 52,718 | | | | 8.9 | % | | | 58,091 | | | | 9.7 | % | | | (5,373 | ) | | | (0.8 | )% |
Non-patient | | | 24,610 | | | | 4.1 | % | | | 26,088 | | | | 4.4 | % | | | (1,478 | ) | | | (0.3 | )% |
Total net operating revenues, before the provision for bad debts | | $ | 596,648 | | | | 100.0 | % | | $ | 593,855 | | | | 100.0 | % | | $ | 2,793 | | | | | |
| | | | | | | | | | | | | | | | | | | | | | | | |
Same-facility: | | | | | | | | | | | | | | | | | | | | | | | | |
Medicare | | $ | 153,736 | | | | 25.8 | % | | $ | 150,695 | | | | 27.9 | % | | $ | 3,041 | | | | (2.1 | )% |
Medicaid | | | 127,941 | | | | 21.5 | % | | | 98,865 | | | | 18.3 | % | | | 29,076 | | | | 3.2 | % |
Managed care and commercial | | | 236,769 | | | | 39.8 | % | | | 217,858 | | | | 40.4 | % | | | 18,911 | | | | (0.6 | )% |
Self-pay | | | 52,501 | | | | 8.8 | % | | | 46,965 | | | | 8.7 | % | | | 5,536 | | | | 0.1 | % |
Non-patient | | | 24,484 | | | | 4.1 | % | | | 25,138 | | | | 4.7 | % | | | (654 | ) | | | (0.6 | )% |
Total net operating revenues, before the provision for bad debts | | $ | 595,431 | | | | 100.0 | % | | $ | 539,521 | | | | 100.0 | % | | $ | 55,910 | | | | | |
The table above includes $29.9 million of revenues from the California HQAF program in the 2017 period, of which $22.5 million related to the first three quarters of 2017, and an $11.4 million change in estimate in the 2016 period which impacted contractual allowances. Both of these items impacted Medicaid revenues.
86
The following table provides information on certain drivers of our net operating revenues:
| | Three Months Ended December 31, | |
| | 2017 | | | 2016 | | | $ Variance | | | % Variance | |
| | | | | | | | | | | | | | | | |
Consolidated and combined: | | | | | | | | | | | | | | | | |
Number of licensed beds at end of period | | | 2,979 | | | | 3,459 | | | | (480 | ) | | | (13.9 | )% |
Admissions | | | 20,932 | | | | 23,200 | | | | (2,268 | ) | | | (9.8 | )% |
Adjusted admissions | | | 50,788 | | | | 57,202 | | | | (6,414 | ) | | | (11.2 | )% |
Emergency room visits | | | 155,746 | | | | 174,754 | | | | (19,008 | ) | | | (10.9 | )% |
Medicare case mix index | | | 1.45 | | | | 1.41 | | | | 0.04 | | | | 2.8 | % |
| | | | | | | | | | | | | | | | |
Same-facility: | | | | | | | | | | | | | | | | |
Number of licensed beds at end of period | | | 2,979 | | | | 2,979 | | | | — | | | | — | % |
Admissions | | | 20,864 | | | | 20,788 | | | | 76 | | | | 0.4 | % |
Adjusted admissions | | | 50,583 | | | | 50,290 | | | | 293 | | | | 0.6 | % |
Emergency room visits | | | 154,874 | | | | 152,620 | | | | 2,254 | | | | 1.5 | % |
Medicare case mix index | | | 1.45 | | | | 1.39 | | | | 0.06 | | | | 4.3 | % |
Net operating revenues for the three months ended December 31, 2017 decreased $0.2 million compared to the three months ended December 31, 2016, consisting of a $1.3 million increase in net patient revenues, partially offset by a $1.5 million decrease in non-patient revenues. Our net patient revenues, before the provision for bad debts, increased $4.3 million, or 0.8%, consisting of a $52.3 million decline in the Divestitures Group, an $8.0 million decline in the Potential Divestitures Group and a $64.6 million increase in the Continuing Hospitals Group. Our net patient revenues, before the provision for bad debts, of the Continuing Hospitals Group include $29.9 million of revenues from the California HQAF program in 2017 as the program approval process by CMS for the 2017-2019 period was completed in the fourth quarter of 2017, of which $22.5 million related to the first three quarters of 2017. Excluding both the California HQAF revenues of $22.5 million in the 2017 period related to the first three quarters of 2017 and the change in estimate of $11.4 million in the 2016 period, which impacted contractual allowances as described below, net patient revenues of the Continuing Hospitals Group increased $30.7 million, consisting of a $15.5 million increase from volumes and a $15.2 million increase from payor rates. Excluding these same items, net patient revenues per adjusted admission for the Continuing Hospitals Group would have increased 3.8%. On a consolidated basis, admissions and adjusted admissions declined 9.8% and 11.2%, respectively, when comparing the fourth quarter of 2017 to the same period in 2016. For the Continuing Hospitals Group, admissions and adjusted admissions increased 3.4% and 3.7%, respectively, when comparing the fourth quarter of 2017 to the same period in 2016.
As of December 31, 2016, we recorded a change in estimate of $11.4 million to reduce the net realizable value of our patient accounts receivable, which negatively impacted contractual allowances in our statement of income for the year ended December 31, 2016. This change in estimate related to increasing delays associated with collections on accounts receivable under the Illinois Medicaid program.
Non-patient revenues decreased $1.5 million for the three months ended December 31, 2017 compared to the 2016 period, primarily related to our hospital management advisory and healthcare consulting services business.
Provision for Bad Debts
The provision for bad debts increased $3.0 million for the three months ended December 31, 2017 compared to the three months ended December 31, 2016. The provision for bad debts decreased $8.3 million related to the Divestitures Group, offset by an increase of $6.2 million related to the Potential Divestitures Group and an increase of $5.1 million related to the Continuing Hospitals Group.
During the fourth quarter of 2017, we analyzed our self-pay patient accounts receivable at a more comprehensive and disaggregated level and refined our estimate of the collectability of the portion of self-pay accounts receivable related to insured patients, primarily co-pays and deductibles. Our analysis also included an evaluation of patient accounts receivable retained in the divestitures of six of our seven divested hospitals. As a result of these efforts, we recorded a change in estimate of $21.0 million to reduce the net realizable value of patient accounts receivable, which negatively impacted the provision for bad debts in our statement of income for the three months ended December 31, 2017.
As of December 31, 2016, we recorded a change in estimate of $11.4 million to reduce the net realizable value of our patient accounts receivable, which negatively impacted the provision for bad debts in our statement of income for the three months ended December 31, 2016. This change in estimate related to our assessment of the collectability of our managed care and commercial accounts receivable aged greater than one year based on a review of historical cash collections for these accounts.
87
Salaries and Benefits
The following table provides information related to our salaries and benefits expenses (dollars in thousands, except per adjusted admission amounts):
| | Three Months Ended December 31, | |
| | 2017 | | | 2016 | | | $ Variance | | | % Variance | |
| | | | | | | | | | | | | | | | |
Salaries and benefits | | $ | 253,106 | | | $ | 268,559 | | | $ | (15,453 | ) | | | (5.8 | )% |
Hospital operations salaries and benefits | | $ | 230,987 | | | $ | 242,745 | | | $ | (11,758 | ) | | | (4.8 | )% |
Hospital operations salaries and benefits per adjusted admission | | $ | 4,548 | | | $ | 4,244 | | | $ | 304 | | | | 7.2 | % |
Hospital operations man-hours per adjusted admission | | | 108.6 | | | | 108.2 | | | | 0.4 | | | | 0.4 | % |
Salaries and benefits decreased $15.5 million for the three months ended December 31, 2017 compared to the three months ended December 31, 2016. Salaries and benefits declined $25.3 million related to the Divestitures Group, $1.5 million related to the Potential Divestitures Group and $4.2 million related to corporate and QHR salaries and benefits, which the latter was due to headcount reductions in November 2016 and May 2017. Included in salaries and benefits expenses related to corporate functions were $2.3 million and $2.8 million of stock-based compensation for the three months ended December 31, 2017 and 2016, respectively. These declines were offset by an increase of $15.6 million in salaries and benefits of the Continuing Hospitals Group primarily resulting from increased salaries at our clinics due to physician recruitment efforts.
Supplies
The following table provides information related to our supplies expense (dollars in thousands, except per adjusted admission amounts):
| | Three Months Ended December 31, | |
| | 2017 | | | 2016 | | | $ Variance | | | % Variance | |
| | | | | | | | | | | | | | | | |
Supplies | | $ | 63,932 | | | $ | 66,829 | | | $ | (2,897 | ) | | | (4.3 | )% |
Supplies per adjusted admission | | $ | 1,259 | | | $ | 1,168 | | | $ | 91 | | | | 7.8 | % |
Supplies expense decreased $2.9 million for the three months ended December 31, 2017 compared to the three months ended December 31, 2016. Supplies expense declined $6.9 million related to the Divestitures Group and $1.3 million related to the Potential Divestitures Group. Supplies expense of the Continuing Hospitals Group increased $5.4 million, primarily due to an increase in adjusted admissions of 3.7% for the three months ended December 31, 2017 compared to the same period in 2016, which resulted in an increase in implant costs as a result of increased orthopedic surgeries.
Other Operating Expenses
The following table provides information related to our other operating expenses (dollars in thousands):
| | Three Months Ended December 31, | |
| | 2017 | | | 2016 | | | 2017 vs 2016 | |
| | | | | | % of | | | | | | | % of | | | $ | | | Change | |
| | Amount | | | Total | | | Amount | | | Total | | | Variance | | | in % | |
| | | | | | | | | | | | | | | | | | | | | | | | |
Purchased services | | $ | 38,556 | | | | 24.6 | % | | $ | 47,356 | | | | 29.0 | % | | $ | (8,800 | ) | | | (4.4 | )% |
Taxes and insurance | | | 38,952 | | | | 24.9 | % | | | 35,518 | | | | 21.8 | % | | | 3,434 | | | | 3.1 | % |
Medical specialist fees | | | 27,235 | | | | 17.4 | % | | | 29,460 | | | | 18.0 | % | | | (2,225 | ) | | | (0.6 | )% |
Transition services agreements | | | 15,734 | | | | 10.0 | % | | | 14,249 | | | | 8.7 | % | | | 1,485 | | | | 1.3 | % |
Repairs and maintenance | | | 9,680 | | | | 6.2 | % | | | 11,410 | | | | 7.0 | % | | | (1,730 | ) | | | (0.8 | )% |
Utilities | | | 6,079 | | | | 3.9 | % | | | 7,307 | | | | 4.5 | % | | | (1,228 | ) | | | (0.6 | )% |
Other miscellaneous operating expenses | | | 20,433 | | | | 13.0 | % | | | 17,976 | | | | 11.0 | % | | | 2,457 | | | | 2.0 | % |
Total other operating expenses | | $ | 156,669 | | | | 100.0 | % | | $ | 163,276 | | | | 100.0 | % | | $ | (6,607 | ) | | | | |
Other operating expenses decreased $6.6 million for the three months ended December 31, 2017 compared to the three months ended December 31, 2016. As a percentage of net operating revenues, other operating expenses were 29.3% and 31.8% in these respective periods. Other operating expenses declined $17.3 million related to the Divestitures Group and $0.7 million related to the Potential Divestitures Group, partially offset by a $10.8 million increase related to the Continuing Hospitals Group. The increase in the Continuing Hospitals Group was primarily due to a $7.9 million increase in provider taxes associated with the California HQAF program, which was approved in the fourth quarter of 2017 for the 2017-2019 program period resulting in a full year of provider taxes being recognized in the fourth quarter of 2017 compared to one quarter in the 2016 period. We are disputing in arbitration, among
88
other issues and actions, certain charges and lack of performance of various obligations under the transition services agreements with our former Parent.
Depreciation and Amortization
Depreciation and amortization expense decreased $7.7 million to $18.7 million for the three months ended December 31, 2017 compared to $26.4 million for the three months ended December 31, 2016. This decrease was primarily due to the overall reduction in our long-lived assets due to divestitures, impairment charges reducing the asset bases of our long-lived assets and the discontinuation of depreciation and amortization related to long-lived assets upon being reclassified as held for sale.
Rent
Rent expense increased $1.6 million to $13.6 million for the three months ended December 31, 2017 compared to $12.0 million for the three months ended December 31, 2016. The increase was primarily due to the recognition of a $0.9 million charge related to leased space we are no longer able to sub-lease and therefore have recognized the remaining portion of the lease obligation as rent expense in the 2017 period. As a percentage of net operating revenues, rent expense was 2.6% and 2.3% for these respective periods.
Electronic Health Records Incentives Earned
Electronic health records incentives earned decreased $1.5 million to $0.2 million for the three months ended December 31, 2017 compared to $1.7 million for the three months ended December 31, 2016 primarily due to the decrease in activity as we move closer toward full implementation of EHR. See Note 2 — Basis of Presentation and Significant Accounting Policies — Electronic Health Records Incentives Earned in the accompanying financial statements for additional information on EHR.
Legal, Professional and Settlement Costs
Legal, professional and settlement costs for the three months ended December 31, 2017 included an adjustment to our prior quarter’s expenses for various costs that were determined to be covered under our existing insurance policies. The net result of this adjustment was a credit of $(0.5) million of legal, professional and settlement costs for the three months ended December 31, 2017. For the three months ended December 31, 2016, legal, professional and settlement costs were $1.2 million and primarily related to the shareholder class action lawsuit and costs associated with our dispute in arbitration, among other issues and actions, of certain charges and lack of performance of various obligations under the transition services agreements with our former Parent.
Impairment of Long-Lived Assets and Goodwill
During the three months ended December 31, 2017, we recognized $25.8 million of impairment to long-lived assets including $23.7 million of property and equipment and $2.1 million of capitalized software costs related to certain hospitals which we have identified as potential divestiture candidates and for which we have received letters of intent.
During the three months ended December 31, 2016, we recognized $41.5 million of impairment to long-lived assets and goodwill. This included a revision to our goodwill impairment estimate initially recorded in the second quarter of 2016, which was a downward adjustment of $80 million. This amount was offset by impairment of $71.9 million related to property and equipment and $10.8 million related to capitalized software costs in connection with finalizing our step two goodwill impairment evaluation. Additionally, due to additional indicators of impairment resulting from continued operating losses at certain of our hospitals in the second half of 2016, we recorded further impairment of $32.7 million related to property and equipment, $3.7 million related to capitalized software costs and $2.4 million related to medical licenses associated with our hospital operations business in the fourth quarter of 2016.
See “Overview — 2017 Impairment and — 2016 Impairment” for a table and additional information on the impairment recorded in 2017 and 2016.
Loss (Gain) on Sale of Hospitals, Net
During the three months ended December 31, 2017, we recognized a $0.1 million gain on the sale of hospitals, net primarily related to the sale of L.V. Stabler. During the three months ended December 31, 2016, we recognized a $2.2 million loss on the sale of hospitals, net consisting of a $1.2 million loss related to the sale of Barrow and a $1.0 million loss related to the sale of Sandhills. See Note 4 — Divestitures in the accompanying financial statements for additional information on divestitures.
89
Interest Expense, Net
The following table provides information related to interest expense, net (in thousands):
| | Three Months Ended December 31, | |
| | 2017 | | | 2016 | | | $ Variance | | | % Variance | |
| | | | | | | | | | | | | | | | |
Senior Credit Facility: | | | | | | | | | | | | | | | | |
Revolving Credit Facility | | $ | 99 | | | $ | 121 | | | $ | (22 | ) | | | (18.2 | )% |
Term Loan Facility | | | 17,316 | | | | 15,108 | | | | 2,208 | | | | 14.6 | % |
ABL Credit Facility | | | 347 | | | | 140 | | | | 207 | | | | 147.9 | % |
Senior Notes | | | 11,630 | | | | 11,626 | | | | 4 | | | | 0.0 | % |
Amortization of debt issuance costs and discounts | | | 2,678 | | | | 2,035 | | | | 643 | | | | 31.6 | % |
All other interest expense (income), net | | | (197 | ) | | | (346 | ) | | | 149 | | | | (43.1 | )% |
Total interest expense, net | | $ | 31,873 | | | $ | 28,684 | | | $ | 3,189 | | | | 11.1 | % |
Interest expense, net increased $3.2 million to $31.9 million for the three months ended December 31, 2017 compared to $28.7 million for the three months ended December 31, 2016. Following the Spin-off, interest expense is calculated based on the terms of our Credit Agreements and Senior Notes. The effective interest rates for our Term Loan Facility and Senior Notes were approximately 8.8% and 12.5%, respectively, at December 31, 2017 and 7.7% and 12.5%, respectively, at December 31, 2016. Our Senior Credit Facility was amended on April 11, 2017, which increased the interest rate terms on our Term Loan Facility. See Liquidity and Capital Resources below and Note 7 — Long-Term Debt in the accompanying financial statements for additional information on our indebtedness.
Provision for (Benefit from) Income Taxes
On December 22, 2017, the Tax Act was signed into law. The Tax Act includes a number of changes to existing U.S. tax laws that impact us, most notably a reduction of the U.S. corporate tax rate from 35% to 21% for tax years after December 31, 2017. As a direct result of changes in tax law due to the passage of the Tax Act, we recorded a total tax benefit of $24.0 million during 2017 which is composed of two amounts: a tax benefit of $10.9 million in deferred income tax expense for the net change in our deferred tax liabilities at the new 21% tax rate, and a $13.1 million tax benefit in deferred income tax expense for the reduction in valuation allowance attributable to the change in net realizability of deferred tax assets. The Tax Act also provides for acceleration of depreciation for certain assets placed into service after September 27, 2017, as well as prospective changes beginning in 2018. These prospective changes include an increased limitation on the deductibility of executive compensation, a limitation on the deductibility of interest expense, new rules surrounding meals and entertainment expense and fines and penalties. Also, while net operating losses generated in the future may by carried forward indefinitely under the new law, there is a limitation on the amount that may be used in any given year. The Tax Act may also have an impact on projected future taxable income that could further affect valuation allowance considerations. In addition to the federal law, we await guidance from the states in which we file on how components of the Tax Act may be treated in these jurisdictions. Those adjustments may materially impact our provision for (benefit from) income taxes in the period in which the adjustments are made.
The benefit from income taxes was $21.8 million for the three months ended December 31, 2017 and $3.6 million for the three months ended December 31, 2016. Our effective tax rates were 45.6% and 3.8% for these respective periods. The increase in our effective tax rate for the fourth quarter of 2017 when compared to the same 2016 period was primarily due to the Tax Act which provided for the recognition of a deferred tax benefit on both the release of valuation allowance related to certain deferred tax assets not previously expected to be realized in addition to the statutory rate reduction from 35% to 21%.
Net Income (Loss) Attributable to Noncontrolling Interests
Net income (loss) attributable to noncontrolling interests was $0.8 million and $0.6 million in the three months ended December 31, 2017 and 2016, respectively. As a percentage of net operating revenues, it was relatively flat, or 0.1% in both periods.
90
Three Months Ended December 31, 2017 Compared to Three Months Ended September 30, 2017 (Unaudited)
A summary of our operating results, both in dollars and as a percentage of net operating revenues, follows (dollars in thousands):
| | Three Months Ended | |
| | December 31, 2017 | | | September 30, 2017 | | | Fourth Quarter vs Third Quarter | |
| | | | | | % of | | | | | | | % of | | | $ | | | Change | |
| | Amount | | | Revenues | | | Amount | | | Revenues | | | Variance | | | in % | |
| | | | | | | | | | | | | | | | | | | | | | | | |
Operating revenues, net of contractual allowances and discounts | | $ | 596,648 | | | | | | | $ | 557,847 | | | | | | | $ | 38,801 | | | | | |
Provision for bad debts | | | 81,566 | | | | | | | | 58,545 | | | | | | | | 23,021 | | | | | |
Net operating revenues | | | 515,082 | | | | 100.0 | % | | | 499,302 | | | | 100.0 | % | | | 15,780 | | | | | |
Operating costs and expenses: | | | | | | | | | | | | | | | | | | | | | | | | |
Salaries and benefits | | | 253,106 | | | | 49.1 | % | | | 251,780 | | | | 50.4 | % | | | 1,326 | | | | (1.3 | )% |
Supplies | | | 63,932 | | | | 12.4 | % | | | 58,657 | | | | 11.7 | % | | | 5,275 | | | | 0.7 | % |
Other operating expenses | | | 156,669 | | | | 30.5 | % | | | 145,357 | | | | 29.2 | % | | | 11,312 | | | | 1.3 | % |
Depreciation and amortization | | | 18,714 | | | | 3.6 | % | | | 20,735 | | | | 4.2 | % | | | (2,021 | ) | | | (0.6 | )% |
Rent | | | 13,599 | | | | 2.6 | % | | | 12,377 | | | | 2.5 | % | | | 1,222 | | | | 0.1 | % |
Electronic health records incentives earned | | | (229 | ) | | | — | % | | | (287 | ) | | | (0.1 | )% | | | 58 | | | | 0.1 | % |
Legal, professional and settlement costs | | | (518 | ) | | | (0.1 | )% | | | 2,050 | | | | 0.4 | % | | | (2,568 | ) | | | (0.5 | )% |
Impairment of long-lived assets and goodwill | | | 25,820 | | | | 5.0 | % | | | 5,261 | | | | 1.1 | % | | | 20,559 | | | | 3.9 | % |
Loss (gain) on sale of hospitals, net | | | (131 | ) | | | — | % | | | 79 | | | | — | % | | | (210 | ) | | | — | % |
Transaction costs related to the Spin-off | | | 49 | | | | — | % | | | 173 | | | | — | % | | | (124 | ) | | | — | % |
Total operating costs and expenses | | | 531,011 | | | | 103.1 | % | | | 496,182 | | | | 99.4 | % | | | 34,829 | | | | 3.7 | % |
Income (loss) from operations | | | (15,929 | ) | | | (3.1 | )% | | | 3,120 | | | | 0.6 | % | | | (19,049 | ) | | | (3.7 | )% |
Interest expense, net | | | 31,873 | | | | 6.2 | % | | | 32,216 | | | | 6.4 | % | | | (343 | ) | | | (0.2 | )% |
Income (loss) before income taxes | | | (47,802 | ) | | | (9.3 | )% | | | (29,096 | ) | | | (5.8 | )% | | | (18,706 | ) | | | (3.5 | )% |
Provision for (benefit from) income taxes | | | (21,779 | ) | | | (4.2 | )% | | | (542 | ) | | | (0.1 | )% | | | (21,237 | ) | | | (4.1 | )% |
Net income (loss) | | | (26,023 | ) | | | (5.1 | )% | | | (28,554 | ) | | | (5.7 | )% | | | 2,531 | | | | 0.6 | % |
Less: Net income (loss) attributable to noncontrolling interests | | | 785 | | | | 0.1 | % | | | 637 | | | | 0.1 | % | | | 148 | | | | — | % |
Net income (loss) attributable to Quorum Health Corporation | | $ | (26,808 | ) | | | (5.2 | )% | | $ | (29,191 | ) | | | (5.8 | )% | | $ | 2,383 | | | | 0.6 | % |
The following table reconciles Adjusted EBITDA, Adjusted EBITDA, Adjusted for Divestitures and Adjusted EBITDA, Adjusted for Potential Divestitures to net income (loss), the most directly comparable U.S. GAAP financial measure (in thousands):
| | Three Months Ended | |
| | December 31, 2017 | | | September 30, 2017 | |
| | | | | | | | |
Net income (loss) | | $ | (26,023 | ) | | $ | (28,554 | ) |
Interest expense, net | | | 31,873 | | | | 32,216 | |
Provision for (benefit from) income taxes | | | (21,779 | ) | | | (542 | ) |
Depreciation and amortization | | | 18,714 | | | | 20,735 | |
EBITDA | | | 2,785 | | | | 23,855 | |
Legal, professional and settlement costs | | | (518 | ) | | | 2,050 | |
Impairment of long-lived assets and goodwill | | | 25,820 | | | | 5,261 | |
Loss (gain) on sale of hospitals, net | | | (131 | ) | | | 79 | |
Transaction costs related to the Spin-off | | | 49 | | | | 173 | |
Post-spin headcount reductions | | | — | | | | 850 | |
Change in estimate related to collectability of patient accounts receivable | | | 21,000 | | | | — | |
Adjusted EBITDA | | | 49,005 | | | | 32,268 | |
Negative EBITDA of divested hospitals | | | 5,144 | | | | 5,242 | |
Adjusted EBITDA, Adjusted for Divestitures | | | 54,149 | | | | 37,510 | |
Negative (Positive) EBITDA of potential divestitures | | | 3,114 | | | | (420 | ) |
Adjusted EBITDA, Adjusted for Potential Divestitures | | $ | 57,263 | | | $ | 37,090 | |
91
Revenues
The following table provides information on our net operating revenues (dollars in thousands, except per adjusted admission amounts):
| | Three Months Ended | |
| | December 31, 2017 | | | September 30, 2017 | | | $ Variance | | | % Variance | |
| | | | | | | | | | | | | | | | |
Consolidated and combined: | | | | | | | | | | | | | | | | |
Net patient revenues, before the provision for bad debts | | $ | 572,038 | | | $ | 534,430 | | | $ | 37,608 | | | | 7.0 | % |
Provision for bad debts | | | 81,566 | | | | 58,545 | | | | 23,021 | | | | 39.3 | % |
Total net patient revenues | | | 490,472 | | | | 475,885 | | | | 14,587 | | | | 3.1 | % |
Non-patient revenues | | | 24,610 | | | | 23,417 | | | | 1,193 | | | | 5.1 | % |
Total net operating revenues | | $ | 515,082 | | | $ | 499,302 | | | $ | 15,780 | | | | 3.2 | % |
Net patient revenues per adjusted admission | | $ | 9,657 | | | $ | 8,756 | | | $ | 901 | | | | 10.3 | % |
Net operating revenues per adjusted admission | | $ | 10,142 | | | $ | 9,187 | | | $ | 955 | | | | 10.4 | % |
| | | | | | | | | | | | | | | | |
Same-facility: | | | | | | | | | | | | | | | | |
Net patient revenues, before the provision for bad debts | | $ | 570,947 | | | $ | 514,761 | | | $ | 56,186 | | | | 10.9 | % |
Provision for bad debts | | | 75,204 | | | | 53,370 | | | | 21,834 | | | | 40.9 | % |
Total net patient revenues | | | 495,743 | | | | 461,391 | | | | 34,352 | | | | 7.4 | % |
Non-patient revenues | | | 24,484 | | | | 23,201 | | | | 1,283 | | | | 5.5 | % |
Total net operating revenues | | $ | 520,227 | | | $ | 484,592 | | | $ | 35,635 | | | | 7.4 | % |
Net patient revenues per adjusted admission | | $ | 9,801 | | | $ | 8,859 | | | $ | 942 | | | | 10.6 | % |
Net operating revenues per adjusted admission | | $ | 10,285 | | | $ | 9,305 | | | $ | 980 | | | | 10.5 | % |
The following table provides information related to our net operating revenues, before the provision for bad debts, by payor source (dollars in thousands):
| | Three Months Ended | |
| | December 31, 2017 | | | September 30, 2017 | | | Fourth Quarter vs Third Quarter | |
| | Amount | | | % of Total | | | Amount | | | % of Total | | | $ Variance | | | Change in % | |
| | | | | | | | | | | | | | | | | | | | | | | | |
Consolidated and combined: | | | | | | | | | | | | | | | | | | | | | | | | |
Medicare | | $ | 154,096 | | | | 25.8 | % | | $ | 167,287 | | | | 30.0 | % | | $ | (13,191 | ) | | | (4.2 | )% |
Medicaid | | | 127,363 | | | | 21.3 | % | | | 94,571 | | | | 17.0 | % | | | 32,792 | | | | 4.3 | % |
Managed care and commercial | | | 237,861 | | | | 39.9 | % | | | 213,637 | | | | 38.3 | % | | | 24,224 | | | | 1.6 | % |
Self-pay | | | 52,718 | | | | 8.9 | % | | | 58,935 | | | | 10.6 | % | | | (6,217 | ) | | | (1.7 | )% |
Non-patient | | | 24,610 | | | | 4.1 | % | | | 23,417 | | | | 4.1 | % | | | 1,193 | | | | — | % |
Total net operating revenues, before the provision for bad debts | | $ | 596,648 | | | | 100.0 | % | | $ | 557,847 | | | | 100.0 | % | | $ | 38,801 | | | | | |
| | | | | | | | | | | | | | | | | | | | | | | | |
Same-facility: | | | | | | | | | | | | | | | | | | | | | | | | |
Medicare | | $ | 153,736 | | | | 25.8 | % | | $ | 160,734 | | | | 29.9 | % | | $ | (6,998 | ) | | | (4.1 | )% |
Medicaid | | | 127,941 | | | | 21.5 | % | | | 91,006 | | | | 16.9 | % | | | 36,935 | | | | 4.6 | % |
Managed care and commercial | | | 236,769 | | | | 39.8 | % | | | 207,309 | | | | 38.5 | % | | | 29,460 | | | | 1.3 | % |
Self-pay | | | 52,501 | | | | 8.8 | % | | | 55,712 | | | | 10.4 | % | | | (3,211 | ) | | | (1.6 | )% |
Non-patient | | | 24,484 | | | | 4.1 | % | | | 23,201 | | | | 4.3 | % | | | 1,283 | | | | (0.2 | )% |
Total net operating revenues, before the provision for bad debts | | $ | 595,431 | | | | 100.0 | % | | $ | 537,962 | | | | 100.0 | % | | $ | 57,469 | | | | | |
92
The following table provides information on certain drivers of our net operating revenues:
| | Three Months Ended | |
| | December 31, 2017 | | | September 30, 2017 | | | $ Variance | | | % Variance | |
| | | | | | | | | | | | | | | | |
Consolidated and combined: | | | | | | | | | | | | | | | | |
Number of licensed beds at end of period | | | 2,979 | | | | 3,051 | | | | (72 | ) | | | (2.4 | )% |
Admissions | | | 20,932 | | | | 21,646 | | | | (714 | ) | | | (3.3 | )% |
Adjusted admissions | | | 50,788 | | | | 54,350 | | | | (3,562 | ) | | | (6.6 | )% |
Emergency room visits | | | 155,746 | | | | 163,986 | | | | (8,240 | ) | | | (5.0 | )% |
Medicare case mix index | | | 1.45 | | | | 1.43 | | | | 0.02 | | | | 1.4 | % |
| | | | | | | | | | | | | | | | |
Same-facility: | | | | | | | | | | | | | | | | |
Number of licensed beds at end of period | | | 2,979 | | | | 2,979 | | | | — | | | | — | % |
Admissions | | | 20,864 | | | | 20,908 | | | | (44 | ) | | | (0.2 | )% |
Adjusted admissions | | | 50,583 | | | | 52,079 | | | | (1,496 | ) | | | (2.9 | )% |
Emergency room visits | | | 154,874 | | | | 155,798 | | | | (924 | ) | | | (0.6 | )% |
Medicare case mix index | | | 1.45 | | | | 1.44 | | | | 0.01 | | | | 0.7 | % |
Net operating revenues increased $15.8 million for the three months ended December 31, 2017 compared to the three months ended September 30, 2017, consisting of a $14.6 million increase in net patient revenues and a $1.2 million increase in non-patient revenues. Our net patient revenues, before the provision for bad debts, increased $37.6 million, or 7.0%, consisting of an $18.6 million decline in the Divestitures Group, a $1.6 million increase in the Potential Divestitures Group and a $54.6 million increase in the Continuing Hospitals Group. The increase in the Continuing Hospitals Group was impacted by CMS’ approval of the California HQAF 2017-2019 program period which occurred in the fourth quarter of 2017 and resulted in a full year of program revenues being recognized in the fourth quarter of 2017 with no comparable revenues in the third quarter. The total HQAF program revenues recognized in the fourth quarter of 2017 were $29.9 million, which included $22.5 million related to the first three quarters of 2017. Excluding the impact of the California HQAF revenues of $29.9 million, net patient revenues, before the provision for bad debts, related to the Continuing Hospitals Group increased $24.7 million consisting of a $35.8 million increase from payor rates, partially offset by an $11.1 million decrease from volumes. Excluding the impact of the California HQAF program, consolidated net patient revenues per adjusted admission would have increased 8.5%. For the Continuing Hospitals Group, admissions and adjusted admissions increased 0.9% and decreased 2.6%, respectively, for the fourth quarter of 2017 compared to the third quarter of 2017.
Provision for Bad Debts
The provision for bad debts increased $23.0 million for the three months ended December 31, 2017 compared to the three months ended September 30, 2017, primarily due to the change in estimate, which is further described below. The provision for bad debts increased $1.5 million related to the Divestitures Group, increased $9.9 million related to the Potential Divestitures Group and increased $11.6 million related to the Continuing Hospitals Group.
During the fourth quarter of 2017, we analyzed our self-pay patient accounts receivable at a more comprehensive and disaggregated level and refined our estimate of the collectability of the portion of self-pay accounts receivable related to insured patients, primarily co-pays and deductibles. Our analysis also included an evaluation of patient accounts receivable retained in the divestitures of six of our seven divested hospitals. As a result of these efforts, we recorded a change in estimate of $21.0 million to reduce the net realizable value of patient accounts receivable, which negatively impacted the provision for bad debts in our statement of income for the three months ended December 31, 2017.
Salaries and Benefits
The following table provides information related to our salaries and benefits expenses (dollars in thousands, except per adjusted admission amounts):
| | Three Months Ended | |
| | December 31, 2017 | | | September 30, 2017 | | | $ Variance | | | % Variance | |
| | | | | | | | | | | | | | | | |
Salaries and benefits | | $ | 253,106 | | | $ | 251,780 | | | $ | 1,326 | | | | 0.5 | % |
Hospital operations salaries and benefits | | $ | 230,987 | | | $ | 229,410 | | | $ | 1,577 | | | | 0.7 | % |
Hospital operations salaries and benefits per adjusted admission | | $ | 4,548 | | | $ | 4,221 | | | $ | 327 | | | | 7.7 | % |
Hospital operations man-hours per adjusted admission | | | 108.6 | | | | 106.3 | | | | 2.3 | | | | 2.2 | % |
Salaries and benefits were $253.1 million for the three months ended December 31, 2017 compared to $251.8 million for the three months ended September 30, 2017. Salaries and benefits declined $8.7 million related to the Divestitures Group which was offset by
93
an increase of $1.6 million related to the Potential Divestitures Group and an increase of $8.6 million related to the Continuing Hospitals Group. The increase in the Continuing Hospitals Group was primarily the result of an increase in self-insured health claims for the three months ended December 31, 2017 compared to the three months ended September 30, 2017.
Supplies
The following table provides information related to our supplies expense (dollars in thousands, except per adjusted admission amounts):
| | Three Months Ended | |
| | December 31, 2017 | | | September 30, 2017 | | | $ Variance | | | % Variance | |
| | | | | | | | | | | | | | | | |
Supplies | | $ | 63,932 | | | $ | 58,657 | | | $ | 5,275 | | | | 9.0 | % |
Supplies per adjusted admission | | $ | 1,259 | | | $ | 1,079 | | | $ | 180 | | | | 16.7 | % |
Supplies expense increased $5.3 million for the three months ended December 31, 2017 compared to the three months ended September 30, 2017. Supplies expense declined $1.8 million related to the Divestitures Group, offset by increases of $2.2 million related to the Potential Divestitures Group and $4.9 million related to the Continuing Hospitals Group. These increases were primarily due to increases in surgeries of 3.1% and 4.4% related to the Potential Divestitures Group and Continuing Hospitals Group, respectively, which increased implant costs. In addition, we incurred increased costs of $0.8 million in relation to inventory adjustments during the three months ended December 31, 2017 primarily due to adjustments for obsolete inventory.
Other Operating Expenses
The following table provides information related to our other operating expenses (dollars in thousands):
| | Three Months Ended | |
| | December 31, 2017 | | | September 30, 2017 | | | Fourth Quarter vs Third Quarter | |
| | | | | | % of | | | | | | | % of | | | $ | | | Change | |
| | Amount | | | Total | | | Amount | | | Total | | | Variance | | | in % | |
| | | | | | | | | | | | | | | | | | | | | | | | |
Purchased services | | $ | 38,556 | | | | 24.6 | % | | $ | 40,716 | | | | 28.0 | % | | $ | (2,160 | ) | | | (3.4 | )% |
Taxes and insurance | | | 38,952 | | | | 24.9 | % | | | 24,929 | | | | 17.2 | % | | | 14,023 | | | | 7.7 | % |
Medical specialist fees | | | 27,235 | | | | 17.4 | % | | | 27,254 | | | | 18.7 | % | | | (19 | ) | | | (1.3 | )% |
Transition services agreements | | | 15,734 | | | | 10.0 | % | | | 15,468 | | | | 10.6 | % | | | 266 | | | | (0.6 | )% |
Repairs and maintenance | | | 9,680 | | | | 6.2 | % | | | 10,166 | | | | 7.0 | % | | | (486 | ) | | | (0.8 | )% |
Utilities | | | 6,079 | | | | 3.9 | % | | | 7,853 | | | | 5.4 | % | | | (1,774 | ) | | | (1.5 | )% |
Other miscellaneous operating expenses | | | 20,433 | | | | 13.0 | % | | | 18,971 | | | | 13.1 | % | | | 1,462 | | | | (0.1 | )% |
Total other operating expenses | | $ | 156,669 | | | | 100.0 | % | | $ | 145,357 | | | | 100.0 | % | | $ | 11,312 | | | | | |
Other operating expenses increased 11.3 million for the three months ended December 31, 2017 compared to the three months ended September 30, 2017. As a percentage of net operating revenues, other operating expenses were 29.3% and 29.2% in these respective periods. Other operating expenses declined $6.5 million related to the Divestitures Group, increased $1.7 million related to the Potential Divestitures Group and increased $14.7 million related to the Continuing Hospitals Group. This increase in the Continuing Hospitals Group was primarily due to $7.9 million of provider taxes recorded in the fourth quarter of 2017 related to the full year for the California HQAF program that was approved by CMS in the fourth quarter of 2017, of which only $2.0 million related to the fourth quarter. In addition, we recognized $7.8 million of Illinois income tax credits for the three months ended September 30, 2017 with no comparable reduction in expense for the three months ended December 31, 2017. We are disputing in arbitration, among other issues and actions, certain charges and lack of performance of various obligations under the transition services agreements with our former Parent.
Depreciation and Amortization
Depreciation and amortization expense decreased $2.0 million to $18.7 million for the three months ended December 31, 2017 compared to $20.7 million for the three months ended September 30, 2017. We placed in service a portion of the capital expenditures for our new patient tower and expanded surgical capacity at McKenzie-Willamette Medical Center. This increase to depreciation was offset by lower depreciation and amortization resulting from our divestitures, impairment and assets classified as held for sale.
Rent
Rent expense increased $1.2 million to $13.6 million for the three months ended December 31, 2017 compared to $12.4 million for the three months ended September 30, 2017. As a percentage of net operating revenues, rent expense was 2.6% and 2.5% for these respective periods.
94
Electronic Health Records Incentives Earned
Electronic health records incentives earned were $0.2 million and $0.3 million for the three months ended December 31, 2017 and September 30, 2017, respectively. Our activity is decreasing as we move closer toward full implementation of EHR.
Legal, Professional and Settlement Costs
Legal, professional and settlement costs decreased $2.6 million to $(0.5) million for the three months ended December 31, 2017 compared to $2.1 million for the three months ended September 30, 2017. Legal, professional and settlement costs for the three months ended December 31, 2017 included an adjustment to our prior quarter’s expenses for various costs that were determined to be covered under our existing insurance policies. The net result of this adjustment resulted in a credit of $(0.5) million of legal, professional and settlement costs for the three months ended December 31, 2017. These costs in each period primarily related to the shareholder class action lawsuit and costs associated with our dispute in arbitration, among other issues and actions, of certain charges and lack of performance of various obligations under the transition services agreements with our former Parent.
Impairment of Long-Lived Assets and Goodwill
We recognized impairment to long-lived assets and goodwill of $25.8 million and $5.3 million for the three months ended December 31, 2017 and September 30, 2017, respectively, related to hospitals in our Potential Divestitures Group, as previously discussed.
Loss (Gain) on Sale of Hospitals, Net
For the three months ended December 31, 2017, we recognized a $0.1 million gain on the sale of hospitals, net primarily related to the sale of L.V. Stabler. For the three months ended September 30, 2017, we recognized a $0.1 million loss on the sale of hospitals, net primarily related to the combined sale of Lock Haven and Sunbury. See Note 4 — Divestitures in the accompanying financial statements for additional information on divestitures.
Interest Expense, Net
The following table provides information related to interest expense, net (in thousands):
| | Three Months Ended | |
| | December 31, 2017 | | | September 30, 2017 | | | $ Variance | | | % Variance | |
| | | | | | | | | | | | | | | | |
Senior Credit Facility: | | | | | | | | | | | | | | | | |
Revolving Credit Facility | | $ | 99 | | | $ | 98 | | | $ | 1 | | | | 1.0 | % |
Term Loan Facility | | | 17,316 | | | | 17,512 | | | | (196 | ) | | | (1.1 | )% |
ABL Credit Facility | | | 347 | | | | 638 | | | | (291 | ) | | | (45.6 | )% |
Senior Notes | | | 11,630 | | | | 11,631 | | | | (1 | ) | | | — | % |
Amortization of debt issuance costs and discounts | | | 2,678 | | | | 2,067 | | | | 611 | | | | 29.6 | % |
All other interest expense (income), net | | | (197 | ) | | | 270 | | | | (467 | ) | | | (173.0 | )% |
Total interest expense, net | | $ | 31,873 | | | $ | 32,216 | | | $ | (343 | ) | | | (1.1 | )% |
Interest expense, net was $31.9 million and $32.2 million for the three months ended for the three months ended December 31, 2017 and September 30, 2017, respectively. We paid down $22.2 million of our Term Loan Facility in the fourth quarter of 2017 with proceeds from the sales of Lock Haven, Sunbury and L.V. Stabler.
Provision for (Benefit from) Income Taxes
On December 22, 2017, the Tax Act was signed into law. The Tax Act includes a number of changes to existing U.S. tax laws that impact us, most notably a reduction of the U.S. corporate tax rate from 35% to 21% for tax years after December 31, 2017. As a direct result of changes in tax law due to the passage of the Tax Act, we recorded a total tax benefit of $24.0 million during 2017 which is composed of two amounts: a tax benefit of $10.9 million in deferred income tax expense for the net change in our deferred tax liabilities at the new 21% tax rate, and a $13.1 million tax benefit in deferred income tax expense for the reduction in valuation allowance attributable to the change in net realizability of deferred tax assets. The Tax Act also provides for acceleration of depreciation for certain assets placed into service after September 27, 2017, as well as prospective changes beginning in 2018. These prospective changes include an increased limitation on the deductibility of executive compensation, a limitation on the deductibility of interest expense, new rules surrounding meals and entertainment expense and fines and penalties. Also, while net operating losses generated in the future may by carried forward indefinitely under the new law, there is a limitation on the amount that may be used in any given year. The Tax Act may also have an impact on projected future taxable income that could further affect valuation allowance considerations. In addition to the federal law, we await guidance from the states in which we file on how components of the Tax Act may be treated in these jurisdictions. Those adjustments may materially impact our provision for (benefit from) income taxes in the period in which the adjustments are made.
95
The benefit from income taxes was $21.8 million for the three months ended December 31, 2017 and $0.5 million for the three months ended September 30, 2017. Our effective tax rates were 45.6% and 1.9% for these respective periods. The increase in our effective tax rate for the three months ended December 31, 2017 when compared to the three months ended September 30, 2017 was due to the Tax Act which provided for the recognition of a deferred tax benefit on both the release of valuation allowance related to certain deferred tax assets not previously expected to be realized in addition to statutory rate reduction from 35% to 21%.
Net Income (Loss) Attributable to Noncontrolling Interests
Net income (loss) attributable to noncontrolling interests was $0.8 million and $0.6 million for the three months ended December 31, 2017 and September 30, 2017, respectively. As a percentage of net operating revenues, it was relatively flat, or 0.1% in both periods.
96
Quarterly Results of Operations for the Years Ended December 31, 2017 and 2016 (Unaudited)
The following tables summarize our quarterly results of operations and selected financial and operating data (dollars in thousands except earnings (loss) per share and per adjusted admission amounts):
| | 2017 Quarters | | | 2016 Quarters | |
| | 1st | | | 2nd | | | 3rd | | | 4th | | | 1st | | | 2nd | | | 3rd | | | 4th | |
| | | | | | | | | | | | | | | | | | | | | | | | | | | | | | | | |
Statements of income data: | | | | | | | | | | | | | | | | | | | | | | | | | | | | | | | | |
Operating revenues, net of contractual allowances and discounts | | $ | 587,945 | | | $ | 585,215 | | | $ | 557,847 | | | $ | 596,648 | | | $ | 614,484 | | | $ | 598,163 | | | $ | 612,551 | | | $ | 593,855 | |
Provision for bad debts | | | 60,305 | | | | 55,069 | | | | 58,545 | | | | 81,566 | | | | 64,933 | | | | 68,426 | | | | 68,612 | | | | 78,615 | |
Net operating revenues | | | 527,640 | | | | 530,146 | | | | 499,302 | | | | 515,082 | | | | 549,551 | | | | 529,737 | | | | 543,939 | | | | 515,240 | |
Operating costs and expenses: | | | | | | | | | | | | | | | | | | | | | | | | | | | | | | | | |
Salaries and benefits | | | 264,602 | | | | 265,309 | | | | 251,780 | | | | 253,106 | | | | 256,862 | | | | 264,886 | | | | 266,812 | | | | 268,559 | |
Supplies | | | 63,822 | | | | 64,112 | | | | 58,657 | | | | 63,932 | | | | 63,661 | | | | 64,136 | | | | 64,013 | | | | 66,829 | |
Other operating expenses | | | 163,424 | | | | 157,613 | | | | 145,357 | | | | 156,669 | | | | 164,463 | | | | 163,185 | | | | 154,878 | | | | 163,276 | |
Depreciation and amortization | | | 22,120 | | | | 20,586 | | | | 20,735 | | | | 18,714 | | | | 31,157 | | | | 31,463 | | | | 28,234 | | | | 26,434 | |
Rent | | | 12,102 | | | | 12,152 | | | | 12,377 | | | | 13,599 | | | | 12,549 | | | | 12,545 | | | | 12,823 | | | | 11,966 | |
Electronic health records incentives earned | | | (2,452 | ) | | | (1,777 | ) | | | (287 | ) | | | (229 | ) | | | (4,208 | ) | | | (4,247 | ) | | | (1,336 | ) | | | (1,691 | ) |
Legal, professional and settlement costs | | | 535 | | | | 3,934 | | | | 2,050 | | | | (518 | ) | | | 241 | | | | 5,447 | | | | 488 | | | | 1,166 | |
Impairment of long-lived assets and goodwill | | | 3,300 | | | | 12,900 | | | | 5,261 | | | | 25,820 | | | | — | | | | 250,400 | | | | — | | | | 41,470 | |
Loss (gain) on sale of hospitals, net | | | (870 | ) | | | (4,321 | ) | | | 79 | | | | (131 | ) | | | — | | | | — | | | | — | | | | 2,150 | |
Transaction costs related to the Spin-off | | | 31 | | | | — | | | | 173 | | | | 49 | | | | 3,735 | | | | 1,177 | | | | 532 | | | | 44 | |
Total operating costs and expenses | | | 526,614 | | | | 530,508 | | | | 496,182 | | | | 531,011 | | | | 528,460 | | | | 788,992 | | | | 526,444 | | | | 580,203 | |
Income (loss) from operations | | | 1,026 | | | | (362 | ) | | | 3,120 | | | | (15,929 | ) | | | 21,091 | | | | (259,255 | ) | | | 17,495 | | | | (64,963 | ) |
Interest expense, net | | | 27,530 | | | | 30,458 | | | | 32,216 | | | | 31,873 | | | | 27,452 | | | | 29,276 | | | | 28,028 | | | | 28,684 | |
Income (loss) before income taxes | | | (26,504 | ) | | | (30,820 | ) | | | (29,096 | ) | | | (47,802 | ) | | | (6,361 | ) | | | (288,531 | ) | | | (10,533 | ) | | | (93,647 | ) |
Provision for (benefit from) income taxes | | | 701 | | | | (245 | ) | | | (542 | ) | | | (21,779 | ) | | | (1,674 | ) | | | (44,565 | ) | | | (4,081 | ) | | | (3,555 | ) |
Net income (loss) | | | (27,205 | ) | | | (30,575 | ) | | | (28,554 | ) | | | (26,023 | ) | | | (4,687 | ) | | | (243,966 | ) | | | (6,452 | ) | | | (90,092 | ) |
Less: Net income (loss) attributable to noncontrolling interests | | | 356 | | | | 55 | | | | 637 | | | | 785 | | | | 315 | | | | 1,095 | | | | 507 | | | | 574 | |
Net income (loss) attributable to Quorum Health Corporation | | $ | (27,561 | ) | | $ | (30,630 | ) | | $ | (29,191 | ) | | $ | (26,808 | ) | | $ | (5,002 | ) | | $ | (245,061 | ) | | $ | (6,959 | ) | | $ | (90,666 | ) |
| | | | | | | | | | | | | | | | | | | | | | | | | | | | | | | | |
Earnings (loss) per share attributable to Quorum Health Corporation stockholders: | | | | | | | | | | | | | | | | | | | | | | | | | | | | | | | | |
Basic and diluted | | $ | (0.99 | ) | | $ | (1.09 | ) | | $ | (1.03 | ) | | $ | (0.95 | ) | | $ | (0.18 | ) | | $ | (8.63 | ) | | $ | (0.24 | ) | | $ | (3.19 | ) |
Weighted-average shares outstanding: | | | | | | | | | | | | | | | | | | | | | | | | | | | | | | | | |
Basic and diluted | | | 27,800,597 | | | | 28,145,215 | | | | 28,245,833 | | | | 28,248,527 | | | | 28,412,054 | | | | 28,412,720 | | | | 28,413,532 | | | | 28,416,801 | |
97
| | 2017 Quarters | | | 2016 Quarters | |
| | 1st | | | 2nd | | | 3rd | | | 4th | | | 1st | | | 2nd | | | 3rd | | | 4th | |
| | | | | | | | | | | | | | | | | | | | | | | | | | | | | | | | |
Other financial and operating data: | | | | | | | | | | | | | | | | | | | | | | | | | | | | | | | | |
Net patient revenues per adjusted admission | | $ | 8,834 | | | $ | 9,099 | | | $ | 8,756 | | | $ | 9,657 | | | $ | 8,741 | | | $ | 8,520 | | | $ | 8,753 | | | $ | 8,551 | |
Net operating revenues per adjusted admission | | $ | 9,280 | | | $ | 9,529 | | | $ | 9,187 | | | $ | 10,142 | | | $ | 9,190 | | | $ | 8,987 | | | $ | 9,168 | | | $ | 9,007 | |
Adjusted EBITDA | | $ | 26,142 | | | $ | 34,430 | | | $ | 32,268 | | | $ | 49,005 | | | $ | 56,224 | | | $ | 29,232 | | | $ | 46,749 | | | $ | 30,717 | |
Adjusted EBITDA, Adjusted for Divestitures | | $ | 28,891 | | | $ | 41,932 | | | $ | 37,510 | | | $ | 54,149 | | | $ | 59,824 | | | $ | 37,483 | | | $ | 54,864 | | | $ | 43,857 | |
Adjusted EBITDA, Adjusted for Potential Divestitures | | $ | 32,772 | | | $ | 43,694 | | | $ | 37,090 | | | $ | 57,263 | | | $ | 56,329 | | | $ | 39,330 | | | $ | 46,178 | | | $ | 45,959 | |
Number of licensed beds at end of period | | | 3,399 | | | | 3,168 | | | | 3,051 | | | | 2,979 | | | | 3,577 | | | | 3,579 | | | | 3,578 | | | | 3,459 | |
Admissions | | | 23,656 | | | | 22,270 | | | | 21,646 | | | | 20,932 | | | | 24,992 | | | | 23,618 | | | | 23,503 | | | | 23,200 | |
Adjusted admissions | | | 56,860 | | | | 55,634 | | | | 54,350 | | | | 50,788 | | | | 59,801 | | | | 58,942 | | | | 59,333 | | | | 57,202 | |
Emergency room visits | | | 172,939 | | | | 167,575 | | | | 163,986 | | | | 155,746 | | | | 184,934 | | | | 182,301 | | | | 184,166 | | | | 174,754 | |
Medicare case mix index | | | 1.39 | | | | 1.43 | | | | 1.43 | | | | 1.45 | | | | 1.37 | | | | 1.38 | | | | 1.37 | | | | 1.41 | |
The following table reconciles Adjusted EBITDA, Adjusted EBITDA, Adjusted for Divestitures and Adjusted EBITDA, Adjusted for Potential Divestitures, as defined in “Item 6. Selected Financial Data”, to net income (loss) attributable to Quorum Health Corporation, the most directly comparable U.S. GAAP financial measure, as derived directly from the our consolidated and combined financial statements for the respective periods (in thousands):
| | 2017 Quarters | | | 2016 Quarters | |
| | 1st | | | 2nd | | | 3rd | | | 4th | | | 1st | | | 2nd | | | 3rd | | | 4th | |
| | | | | | | | | | | | | | | | | | | | | | | | | | | | | | | | |
Adjusted EBITDA components: | | | | | | | | | | | | | | | | | | | | | | | | | | | | | | | | |
Net income (loss) | | $ | (27,205 | ) | | $ | (30,575 | ) | | $ | (28,554 | ) | | $ | (26,023 | ) | | $ | (4,687 | ) | | $ | (243,966 | ) | | $ | (6,452 | ) | | $ | (90,092 | ) |
Interest expense, net | | | 27,530 | | | | 30,458 | | | | 32,216 | | | | 31,873 | | | | 27,452 | | | | 29,276 | | | | 28,028 | | | | 28,684 | |
Provision for (benefit from) income taxes | | | 701 | | | | (245 | ) | | | (542 | ) | | | (21,779 | ) | | | (1,674 | ) | | | (44,565 | ) | | | (4,081 | ) | | | (3,555 | ) |
Depreciation and amortization | | | 22,120 | | | | 20,586 | | | | 20,735 | | | | 18,714 | | | | 31,157 | | | | 31,463 | | | | 28,234 | | | | 26,434 | |
EBITDA | | | 23,146 | | | | 20,224 | | | | 23,855 | | | | 2,785 | | | | 52,248 | | | | (227,792 | ) | | | 45,729 | | | | (38,529 | ) |
Legal, professional and settlement costs | | | 535 | | | | 3,934 | | | | 2,050 | | | | (518 | ) | | | 241 | | | | 5,447 | | | | 488 | | | | 1,166 | |
Impairment of long-lived assets and goodwill | | | 3,300 | | | | 12,900 | | | | 5,261 | | | | 25,820 | | | | — | | | | 250,400 | | | | — | | | | 41,470 | |
Loss (gain) on sale of hospitals, net | | | (870 | ) | | | (4,321 | ) | | | 79 | | | | (131 | ) | | | — | | | | — | | | | — | | | | 2,150 | |
Transaction costs related to the Spin-off | | | 31 | | | | — | | | | 173 | | | | 49 | | | | 3,735 | | | | 1,177 | | | | 532 | | | | 44 | |
Post-spin headcount reductions | | | — | | | | 1,693 | | | | 850 | | | | — | | | | — | | | | — | | | | — | | | | 1,617 | |
Change in estimate related to collectability of patient accounts receivable | | | — | | | | — | | | | — | | | | 21,000 | | | | — | | | | — | | | | — | | | | 22,799 | |
Adjusted EBITDA | | | 26,142 | | | | 34,430 | | | | 32,268 | | | | 49,005 | | | | 56,224 | | | | 29,232 | | | | 46,749 | | | | 30,717 | |
Negative EBITDA of divested hospitals | | | 2,749 | | | | 7,502 | | | | 5,242 | | | | 5,144 | | | | 3,600 | | | | 8,251 | | | | 8,115 | | | | 13,140 | |
Adjusted EBITDA, Adjusted for Divestitures | | | 28,891 | | | | 41,932 | | | | 37,510 | | | | 54,149 | | | | 59,824 | | | | 37,483 | | | | 54,864 | | | | 43,857 | |
Negative (Positive) EBITDA of potential divestitures | | | 3,881 | | | | 1,762 | | | | (420 | ) | | | 3,114 | | | | (3,495 | ) | | | 1,847 | | | | (8,686 | ) | | | 2,102 | |
Adjusted EBITDA, Adjusted for Potential Divestitures | | $ | 32,772 | | | $ | 43,694 | | | $ | 37,090 | | | $ | 57,263 | | | $ | 56,329 | | | $ | 39,330 | | | $ | 46,178 | | | $ | 45,959 | |
Liquidity and Capital Resources
Financial Outlook
Our primary sources of liquidity are cash flows from operations, proceeds from divestitures and available borrowing capacity under our revolving credit facilities. We believe that these amounts will be adequate to service our existing debt and finance internal growth and fund capital expenditures over the next 12 months and into the foreseeable future. Borrowings under our revolving credit facilities are intended to be used for working capital, capital expenditures and general corporate purposes. Our cash flows are negatively impacted by the significant amount of interest expense associated with the high debt leverage put in place to effect the Spin-off. Interest payments were $125.8 million, $90.9 million and $98.3 million in the years ended December 31, 2017, 2016 and 2015, respectively. In addition, two states in which we operate, California and Illinois, are historically slow payors on their Medicaid supplemental payment programs, and in the case of Illinois, the Medicaid managed care organizations and fee for service are also programs in which state reimbursements are typically slow. In the fourth quarter of 2017, we received $31 million of approximately $50 million of 2015 and 2016 outstanding amounts from the California HQAF program. In this same quarter, we also received a total of $51 million of the approximate $65 million in arrears from Illinois Medicaid and state employee patients. As of December 31, 2017, receivables outstanding under the California and Illinois state supplemental programs were $48.4 million and $22.9 million, respectively.
Our business strategy includes an ongoing strategic review of our hospitals based on analysis of financial performance, current competitive conditions, expected demographic trends, joint venture opportunities, capital allocation requirements and specific state
98
reimbursements and payment methodologies. As part of this strategy, we are actively engaging in initiatives, among others, to divest underperforming hospitals, reduce our debt and refine our portfolio to a more sustainable group of hospitals with higher operating margins. As of December 31, 2017, we had combined proceeds of $45.9 million from the sale of five hospitals in 2017 and two hospitals in 2016, which have been used to pay down $44.4 million on our Term Loan Facility. We have targeted an additional seven hospitals that we intend to divest or close in the next twelve to twenty-four months from December 31, 2017. Of the seven targeted hospitals, we have closed one hospital in February 2018 and sold one hospital on March 1, 2018. See “— Overview — Business Strategy Summary” above for additional information on our divestitures activities. For the year ended December 31, 2017, we experienced net operating losses of $65.3 million from the fourteen hospitals in the Divestitures Group and the Potential Divestitures Group.
On April 11, 2017, we executed the CS Amendment to, among other things, raise the maximum Secured Net Leverage Ratio, as defined in the CS Agreement, to 4.75x from 4.25x for the period July 1, 2017 to December 31, 2018 (which was previously 4.25x for the period July 1, 2017 to June 30, 2018), at which point it drops to 4.00x for the remainder of the agreement. On March 14, 2018, we executed the CS Second Amendment with our Senior Credit Facility lenders to amend, among other things, the Secured Net Leverage Ratio to 4.75x beginning July 1, 2017 through June 30, 2018 and 5.00x beginning July 1, 2018 through December 31, 2019, at which point it drops to 4.50x for the remainder of the agreement. The CS Amendment and the CS Second Amendment also provide for additional Consolidated EBITDA add backs under the covenant calculations for certain items. For additional details of the CS Amendment, see “—Long-Term Debt” below. We are actively engaged in initiatives to divest underperforming hospitals and outpatient service facilities, for which proceeds will be used to pay down the Term Loan under our Senior Credit Facility.
Statements of Cash Flows
Prior to the Spin-off, our cash activity was managed through Due to Parent, net under CHS’ cash management program and interest on our indebtedness with CHS was accumulated in Due to Parent, net. Following the Spin-off, we own and manage our own cash depository and disbursement bank accounts and have borrowing capacity, as well as principal and interest obligations, under our new debt structure.
Year Ended December 31, 2017 Compared to Year Ended December 31, 2016
The following table provides a summary of our cash flows (in thousands):
| | Year Ended December 31, | |
| | 2017 | | | 2016 | | | $ Variance | | | % Variance | |
| | | | | | | | | | | | | | | | |
Net cash provided by operating activities | | $ | 66,970 | | | $ | 81,086 | | | $ | (14,116 | ) | | | (17.4 | )% |
Net cash used in investing activities | | | (38,267 | ) | | | (73,146 | ) | | | 34,879 | | | | 47.7 | % |
Net cash provided by (used in) financing activities | | | (48,541 | ) | | | 16,409 | | | | (64,950 | ) | | | (395.8 | )% |
Net change in cash and cash equivalents | | $ | (19,838 | ) | | $ | 24,349 | | | $ | (44,187 | ) | | | | |
Net cash provided by operating activities was $67.0 million for the year ended December 31, 2017 compared to $81.1 million for the year ended December 31, 2016, a $14.1 million decrease. This decrease in cash flows from operating activities was primarily due to interest payments on our indebtedness, which increased $34.9 million. In 2017, we made $125.8 million of interest payments, primarily associated with our Term Loan Facility and Senior Notes, compared to $90.9 million in 2016. This amount was partially offset by favorable cash collections related to patient accounts receivable. In the fourth quarter of 2017, we collected $31 million of approximately $50 million related to 2015 and 2016 outstanding amounts from the California HQAF program and $51 million of approximately $65 million related to past due receivables from Illinois Medicaid and state employee patients. We additionally contracted with third-party companies and collected $13 million in the fourth quarter related to underpayments, denials and accounts with no collection follow-up to supplement CHS collection efforts under the transition service agreements. All other changes in operating assets and liabilities on a comparative basis for the years ended December 31, 2017 and 2016 were considered to be part of our normal business operations.
Net cash used in investing activities was $38.3 million in the year ended December 31, 2017 compared to $73.1 million in the year ended December 31, 2016, a $34.9 million decrease. This decrease in cash used in investing activities was primarily due to an $18.4 million reduction in hospital capital expenditures and an increase of $18.3 million in proceeds from hospital divestitures. This decrease in capital expenditures was due to an overall reduction in capital spending at our hospitals due to budgetary constraints, a $4.4 million reduction in spending on the $105 million Springfield, Oregon hospital project and a $3.1 million reduction related to divested hospitals. In total, we divested five hospitals in 2017 and two hospitals in 2016. These amounts were partially offset by $1.1 million of increased costs for acquisitions of ancillary outpatient businesses in 2017 when compared to 2016.
Net cash used in financing activities was $48.5 million in the year ended December 31, 2017 compared to net cash provided by financing activities of $16.4 million in the year ended December 31, 2016, a $64.9 million decrease. In 2017, we paid down $37.3 million on our Term Loan Facility from proceeds of divestitures. We also paid $3.1 million of debt issuance costs associated with the April 2017 amendment to our Senior Credit Facility and paid $3.9 million in distributions to noncontrolling interest partners. In 2016,
99
we completed the financing transactions related to the Spin-off which resulted in cash inflow from borrowings under the Term Loan Facility and Senior Notes of $1.3 billion, a cash settlement payment of $1.2 billion related to the Due to Parent liability with CHS and cash outflow of $29.1 million for debt issuance costs related to the Spin-off financing transactions. Additionally, we paid $11.6 million on the Term Loan Facility, consisting of $7.2 million from the proceeds of the sale of Sandhills and $4.4 million in scheduled payments, and $2.9 million in distributions to noncontrolling interest partners in 2016. We had a net cash inflow of $25.2 million related to transactions with CHS which were processed through Due to Parent, net prior to the Spin-off with no comparable activity in 2017.
Year Ended December 31, 2016 Compared to Year Ended December 31, 2015
The following table provides a summary of our cash flows (in thousands):
| | Year Ended December 31, | |
| | 2016 | | | 2015 | | | $ Variance | | | % Variance | |
| | | | | | | | | | | | | | | | |
Net cash provided by operating activities | | $ | 81,086 | | | $ | 42,889 | | | $ | 38,197 | | | | 89.1 | % |
Net cash used in investing activities | | | (73,146 | ) | | | (78,592 | ) | | | 5,446 | | | | 6.9 | % |
Net cash provided by (used in) financing activities | | | 16,409 | | | | 34,250 | | | | (17,841 | ) | | | (52.1 | )% |
Net change in cash and cash equivalents | | $ | 24,349 | | | $ | (1,453 | ) | | $ | 25,802 | | | | | |
Net cash provided by operating activities was $81.1 million for the year ended December 31, 2016 compared to $42.9 million for the year ended December 31, 2015, an increase of $38.2 million. Net cash provided by operating activities was impacted by a $97.9 million decrease in net income for 2016 when compared to 2015, exclusive of the non-cash items that we add back in each respective year to calculate our operating cash flows. Net cash provided by operating activities was impacted by the fluctuations in certain corporate allocations and other charges from CHS to us that were included in the computation of net income (loss), but settled as a financing activity in the statement of cash flows for periods prior to April 29, 2016, the Spin-off date. In addition, net cash provided by operating activities was impacted by a $136.1 million increase in the net change in operating assets and liabilities, exclusive of acquisitions and divestitures activity, in 2016 when compared to 2015. The primary drivers of this increase related to the Spin-off, including a $17.6 million increase in accounts payable, primarily due to our independent management of cash since the Spin-off date, $19.9 million of accrued interest in 2016 with no comparable accrual in 2015 due to our new debt structure and $22.8 million of increased allowances related to a change in estimate to reduce the carrying value of patient accounts receivable as of December 31, 2016. In 2015, we made $26.4 million of legal settlement payments. All other changes in operating assets and liabilities on a comparative basis for the years ended December 31, 2016 and 2015 were considered to be part of our normal business operations.
Net cash used in investing activities decreased $5.4 million to $73.1 million for the year ended December 31, 2016 from $78.6 million in the year ended December 31, 2015. Our expenditures for property and equipment increased $20.5 million in 2016 when compared to 2015. We incurred $38.5 million and $10.4 million of costs in 2016 and 2015, respectively, related to the patient tower and expanded surgical capacity construction project at our Springfield, Oregon hospital, which was the primary driver of the increase in capital expenditures in 2016. Cash proceeds from the sale of hospitals in 2016 related to Barrow and Sandhills. Payments for acquisitions in 2015 of $8.0 million related to the purchase of ancillary businesses at our existing hospitals.
Net cash provided by financing activities was $16.4 million for the year ended December 31, 2016 compared to $34.3 million in the year ended December 31, 2015. In connection with the Spin-off on April 29, 2016, we borrowed $880 million under the Term Loan Facility and issued $400 million of Senior Notes, reduced by $24.5 million of issuance discounts related to this debt. We paid $1.2 billion to CHS from the debt proceeds as part of the settlement of our Due to Parent, net liability with CHS. We made payments on the Term Loan Facility of $11.6 million in 2016, which included a $7.2 million pay down utilizing the net proceeds of the Sandhills divestiture. Our other debt payments primarily related to capital lease obligations, including the capital lease associated with our corporate office in 2016. The decrease in Due to Parent, net in 2016 related to activity for the first four months of the year and then the full settlement of this liability with CHS in connection with the Spin-off. The decrease of $224.8 million in the borrowings under the receivables facility with CHS in 2015 was offset in the change in Due to Parent, net with a corresponding receivable. This decrease also reflected the termination of our participation in CHS’ receivable facility program as of November 2015.
Capital Expenditures
Capital expenditures for property, equipment and software were $68.4 million, $87.2 million and $68.3 million for the years ended December 31, 2017, 2016 and 2015, respectively. In addition, we had $6.8 million and $15.7 million of capital expenditures related to property and equipment accrued in accounts payable at December 31, 2017 and 2016, respectively. Capital expenditures in 2017 decreased primarily due to budgetary constraints and partially due to our divestiture activity. Capital expenditures in 2016 increased primarily due to spending on the Springfield, Oregon project.
We are building a new patient tower and expanding the surgical capacity at McKenzie-Willamette Medical Center, our hospital in Springfield, Oregon. We incurred costs of $34.1 million, $38.5 million and $10.4 million in the years ended December 31, 2017, 2016 and 2015, respectively, related to the project. As of December 31, 2017, we have incurred a total of $83.0 million of costs for this
100
project, of which $76.1 million was placed into service in the fourth quarter of 2017. The total estimated cost for this project, including equipment costs, is estimated to be approximately $105 million. The project is expected to be completed in late 2018.
As of December 31, 2017, we have capital commitments related to certain other renovation projects that are expected to begin and be completed in 2018. The total estimated costs for these projects is approximately $3.0 million.
Capital Resources
Net working capital was $220.8 million, $272.6 million and $334.0 million as of December 31, 2017, 2016 and 2015, respectively. The $51.8 million decrease in net working capital in 2017 when compared to 2016 was primarily due to cash collections related to patient accounts receivable, timing of interest payments on the Term Loan Facility and a decrease in discretionary benefits. The $61.4 million decrease in net working capital for 2016 compared to 2015 primarily related to changes in cash management following the Spin-off, which increased our liabilities for accounts payable and accrued interest, partially offset by an increase in cash. In addition, we recorded a change in estimate to reduce the carrying value of patient accounts receivable and incurred liabilities related to the establishment of self-insurance reserves related to employee medical benefits, professional and general liability claims and workers’ compensation claims in 2016 with no comparable amounts in 2015. Prior to the Spin-off, our cash from operations was swept to CHS through Due to Parent, net under their centralized cash management program.
Long-Term Debt
The following table provides a summary of activity related to our long-term debt (in thousands):
| | Year Ended December 31, 2017 | |
| | | | | | | | | | | | | | | | | | | | | | Assets | | | | | |
| | Total | | | | | | | | | | | Debt | | | | | | | Acquired | | | Total | |
| | Debt at | | | Borrowings, | | | | | | | Issuance | | | | | | | Under | | | Debt | |
| | Beginning | | | Excluding | | | | | | | Costs | | | | | | | Capital | | | at End | |
| | of Year | | | Discounts | | | Repayments | | | Payments | | | Amortization | | | Leases | | | of Year | |
| | | | | | | | | | | | | | | | | | | | | | | | | | | | |
Senior Credit Facility: | | | | | | | | | | | | | | | | | | | | | | | | | | | | |
Revolving Credit Facility, maturing 2021 | | $ | — | | | $ | 39,000 | | | $ | (39,000 | ) | | $ | — | | | $ | — | | | $ | — | | | $ | — | |
Term Loan Facility, maturing 2022 | | | 868,419 | | | | — | | | | (37,261 | ) | | | — | | | | — | | | | — | | | | 831,158 | |
ABL Credit Facility, maturing 2021 | | | — | | | | 469,000 | | | | (469,000 | ) | | | — | | | | — | | | | — | | | | — | |
Senior Notes, maturing 2023 | | | 400,000 | | | | — | | | | — | | | | — | | | | — | | | | — | | | | 400,000 | |
Unamortized debt issuance costs and discounts | | | (48,764 | ) | | | — | | | | — | | | | (3,119 | ) | | | 8,949 | | | | — | | | | (42,934 | ) |
Capital lease obligations | | | 25,588 | | | | — | | | | (1,231 | ) | | | — | | | | — | | | | 54 | | | | 24,411 | |
Other debt | | | 1,582 | | | | 376 | | | | (703 | ) | | | — | | | | — | | | | — | | | | 1,255 | |
Total debt | | | 1,246,825 | | | | 508,376 | | | | (547,195 | ) | | | (3,119 | ) | | | 8,949 | | | | 54 | | | | 1,213,890 | |
Less: Current maturities of long-term debt | | | (5,683 | ) | | | | | | | | | | | | | | | | | | | | | | | (1,855 | ) |
Total long-term debt | | $ | 1,241,142 | | | $ | 508,376 | | | $ | (547,195 | ) | | $ | (3,119 | ) | | $ | 8,949 | | | $ | 54 | | | $ | 1,212,035 | |
The following table shows the results of the calculation of our total debt to total capitalization (dollars in thousands):
| | Year Ended | |
| | December 31, | |
| | 2017 | |
| | | | |
Total debt, excluding unamortized debt issuance costs and discounts | | $ | 1,256,824 | |
Total Quorum Health Corporation stockholders' equity | | | 99,441 | |
Total capitalization | | $ | 1,356,265 | |
Total debt to total capitalization | | | 92.7 | % |
The following table provides a summary of our long-term debt, allocated between fixed and variable debt (dollars in thousands):
| | December 31, 2017 | |
| | Amount | | | % of Total | |
| | | | | | | | |
Fixed | | $ | 425,666 | | | | 33.9 | % |
Variable | | | 831,158 | | | | 66.1 | % |
Total debt, excluding unamortized debt issuance costs and discounts | | $ | 1,256,824 | | | | 100.0 | % |
101
Senior Credit Facility
On April 29, 2016, we entered into a credit agreement, among us, the lenders party thereto and Credit Suisse AG, Cayman Islands Branch, as administrative agent and collateral agent. On April 11, 2017, we executed an agreement with our Senior Credit Facility lenders to amend certain provisions of our Senior Credit Facility, as described below.
The CS Agreement initially provided for an $880 million senior secured term loan facility and a $100 million senior secured revolving credit facility. The Term Loan Facility was issued at a discount of $17.6 million, or 98% of par value, and has a maturity date of April 29, 2022, subject to customary acceleration events and repayment, extension or refinancing. The Revolving Credit Facility has a maturity date of April 29, 2021, subject to certain customary acceleration events and repayment, extension or refinancing. The CS Amendment reduced the Revolving Credit Facility’s borrowing capacity from $100 million to $87.5 million until December 31, 2017, at which time the borrowing capacity decreased to $75.0 million through maturity.
The CS Agreement contains customary covenants, including a maximum permitted Secured Net Leverage Ratio, as determined based on 12 month trailing Consolidated EBITDA, as defined in the CS Agreement. On April 11, 2017, we executed the CS Amendment with our Senior Credit Facility lenders to amend the calculation of the Secured Net Leverage Ratio beginning July 1, 2017 through maturity, among other provisions. The CS Second Amendment, which was executed on March 14, 2018, amended the Secured Net Leverage Ratio for the period July 1, 2017 through maturity. As of December 31, 2017 and 2016, we had Secured Net Leverage Ratios of 3.87 to 1.00 and 3.93 to 1.00, respectively, implying additional borrowing capacity of $193.3 million as of December 31, 2017.
After giving effect to the CS Amendment and the CS Second Amendment, the maximum Secured Net Leverage Ratio permitted under the CS Agreement, as determined based on 12 month trailing Consolidated EBITDA and as defined in the CS Agreement, follows:
| | Maximum |
| | Secured Net |
Period | | Leverage Ratio |
| | |
Period from January 1, 2017 to June 30, 2017 | | 4.50 to 1.00 |
Period from July 1, 2017 to June 30, 2018 | | 4.75 to 1.00 |
Period from July 1, 2018 to December 31, 2019 | | 5.00 to 1.00 |
Period from January 1, 2020 and thereafter | | 4.50 to 1.00 |
In addition to amending the calculation of the Secured Net Leverage Ratio and the Maximum Secured Net Leverage Ratio, the CS Amendment and CS Second Amendment also affected other terms of the CS Agreement as follows:
| • | Through April 29, 2022, we are required to use asset sales proceeds to make mandatory redemptions under the Term Loan Facility. |
| • | Through December 31, 2018, we may request to exercise Incremental Term Loan Commitments, as defined in the CS Agreement, only if the Secured Net Leverage Ratio, adjusted for the requested Incremental Term Loan borrowing, is below 3.35 to 1.00. After December 31, 2018, we may request to exercise Incremental Term Loan Commitments for the greater of $100 million or an amount which would produce a Secured Net Leverage Ratio of 3.35 to 1.00. |
| • | Through December 31, 2018, we are allowed to incur Permitted Additional Debt, as defined in the CS Agreement, as long as our Total Leverage Ratio, adjusted for the Permitted Additional Debt, is below 4.50 to 1.00. After December 31, 2018, we may incur Permitted Additional Debt, as long as our Total Leverage Ratio, adjusted for the Permitted Additional Debt, is below 5.50 to 1.00. |
Prior to the CS Amendment, interest under the Term Loan Facility accrued, at our option, at adjusted LIBOR, subject to statutory reserves and a floor of 1% plus 5.75%, or the alternate base rate plus 4.75%. Following the CS Amendment, interest under the Term Loan Facility accrues, at our option, at adjusted LIBOR, subject to statutory reserves and a floor of 1% plus 6.75%, or the alternate base rate plus 5.75%. The effective interest rate on the Term Loan Facility was 8.8% as of December 31, 2017. Interest on outstanding borrowings under the Revolving Credit Facility accrues, at our option, at adjusted LIBOR, subject to statutory reserves and a floor of 0% plus 2.75%, or the alternate base rate plus 1.75%, and remains unchanged under the CS Amendment. The CS Second Amendment did not alter these provisions.
As of December 31, 2017, we had no borrowings outstanding on the Revolving Credit Facility and had $10.2 million of letters of credit outstanding that were primarily related to the self-insured retention levels of professional and general liability and workers’ compensation liability insurance and represent security for the payment of claims. As of December 31, 2017, we had borrowing capacity on our Revolving Credit Facility of $77.3 million.
102
ABL Credit Facility
On April 29, 2016, we entered into an ABL Credit Agreement (the “UBS Agreement,” and together with the CS Agreement, collectively, the “Credit Agreements”), among us, the lenders party thereto and UBS AG, Stamford Branch (“UBS”), as administrative agent and collateral agent. The UBS Agreement provides for a $125 million senior secured asset-based revolving credit facility (the “ABL Credit Facility”). As of December 31, 2017, we had no borrowings outstanding on the ABL Credit Facility and borrowing capacity of $124 million.
On April 11, 2017, we executed an amendment to the UBS Agreement with its lender party thereto, which aligned the provisions of the UBS Agreement with the CS Amendment. There were no changes to the USB Agreement that impact our interest or covenant calculations associated with the ABL Credit Facility.
The ABL Credit Facility has a maturity date of April 29, 2021, subject to customary acceleration events and repayment, extension or refinancing. Interest on outstanding borrowings under the ABL Credit Facility accrues, at our option, at a base rate or LIBOR, subject to statutory reserves and a floor of 0%, except that all swingline borrowings will accrue interest based on the base rate, plus an applicable margin determined by the average excess availability under the ABL Credit Facility for the fiscal quarter immediately preceding the date of determination. The applicable margin ranges from 1.75% to 2.25% for LIBOR advances and from 0.75% to 1.25% for base rate advances.
The ABL Credit Facility has a “Covenant Trigger Event” definition that requires us to maintain excess availability under the ABL Credit Facility equal to or greater than the greater of (i) $12.5 million and (ii) 10% of the aggregate commitments under the ABL Credit Facility. If a Covenant Trigger Event occurs, then we are required to maintain a minimum Consolidated Fixed Charge Ratio of 1.10 to 1.00 until such time that a Covenant Trigger Event is no longer continuing. In addition, if excess availability under the ABL Credit Facility were to fall below the greater of (i) 12.5% of the aggregate commitments under the ABL Credit Facility and (ii) $15.0 million, then a “Cash Dominion Event” would be triggered upon which the lenders could assume control of our cash.
Credit Agreement Covenants
In addition to the specific covenants described above, the Credit Agreements contain customary negative covenants, which limit our ability to, among other things, incur additional indebtedness, create liens, make investments, transfer assets and merge or acquire assets, and make restricted payments, including dividends, distributions, and specified payments on other indebtedness. They include customary events of default, including payment defaults, material breaches of representations and warranties, covenant defaults, default on other material indebtedness, customary Employee Retirement Income Security Act events of default, bankruptcy and insolvency, material judgments, invalidity of liens on collateral, change of control or cessation of business. The Credit Agreements also contain customary affirmative covenants and representations and warranties.
Senior Notes
On April 22, 2016, we issued $400 million aggregate principal amount of 11.625% Senior Notes due 2023, pursuant to the Indenture. The Senior Notes were issued at a discount of $6.9 million, or 1.734%, in a private placement and are senior unsecured obligations guaranteed on a senior basis by certain of our subsidiaries (the “Guarantors”). The Senior Notes mature on April 15, 2023 and bear interest at a rate of 11.625% per annum, payable semi-annually in arrears on April 15 and October 15 of each year, which began on October 15, 2016. Interest on the Senior Notes accrues from the date of original issuance and is calculated on the basis of a 360-day year comprised of twelve 30-day months. The effective interest rate on the Senior Notes was 12.5% as of December 31, 2017.
The Indenture contains covenants that, among other things, limit our ability and certain of our subsidiaries’ ability to incur or guarantee additional indebtedness, pay dividends or make other restricted payments, make certain investments, create or incur certain liens, sell assets and subsidiary stock, transfer all or substantially all of our assets or enter into merger or consolidation transactions.
On May 17, 2017, we exchanged the 11.625% Senior Notes due 2023 (the “Initial Notes”) in the aggregate principal amount of $400 million, which were not registered under the Securities Act of 1933, as amended (the “Securities Act”), for a like principal amount of 11.625% Senior Notes due 2023 (the “Exchange Notes”), which have been registered under the Securities Act. The Initial Notes were substantially identical to the Exchange Notes, except that the Exchange Notes are registered under the Securities Act and are not subject to the transfer restrictions and certain registration rights agreement provisions applicable to the Initial Notes.
On and after April 15, 2019, we are entitled, at our option, to redeem all or a portion of the Senior Notes upon not less than 30 nor more than 60 days’ notice, at the following redemption prices, plus accrued and unpaid interest, if any, to the redemption date. The redemption prices are expressed as a percentage of the principal amount on the redemption date. Holders of record on the relevant record date have the right to receive interest due on the relevant interest payment date. In addition, prior to April 15, 2019, we may redeem some or all of the Senior Notes at a price equal to 100% of the principal amount thereof, plus accrued and unpaid interest, if any, plus a “make whole” premium, as set forth in the Indenture. We are entitled to redeem up to 35% of the aggregate principal amount of the Senior Notes until April 15, 2019 with the net proceeds from certain equity offerings at the redemption price set forth in the Indenture.
103
The following table provides a summary of the redemption periods and prices related to the Senior Notes:
| | Redemption | |
Period | | Prices | |
| | | | |
Period from April 15, 2019 to April 14, 2020 | | | 108.719 | % |
Period from April 15, 2020 to April 14, 2021 | | | 105.813 | % |
Period from April 15, 2021 to April 14, 2022 | | | 102.906 | % |
Period from April 15, 2022 to April 15, 2023 | | | 100.000 | % |
Debt Issuance Costs and Discounts
The following table provides a summary of debt issuance costs and discounts (in thousands):
| | December 31, | |
| | 2017 | | | 2016 | |
| | | | | | | | |
Debt issuance costs | | $ | 32,265 | | | $ | 29,146 | |
Debt discounts | | | 24,536 | | | | 24,536 | |
Total debt issuance costs and discounts | | | 56,801 | | | | 53,682 | |
Less: Amortization of debt issuance costs and discounts | | | (13,867 | ) | | | (4,918 | ) |
Total unamortized debt issuance costs and discounts | | $ | 42,934 | | | $ | 48,764 | |
Capital Lease Obligations and Other Debt
Our debt arising from capital lease obligations primarily relates to our corporate office in Brentwood, Tennessee. As of December 31, 2017, this capital lease obligation was $17.9 million. The remainder of our capital lease obligations primarily relate to property and equipment at our hospitals and corporate office. Other debt consists of physician loans and miscellaneous notes payable to banks.
Contractual Obligations and Other Capital Commitments
The following table provides a summary of our contractual obligations and other commercial commitments as of December 31, 2017 and for the next five years and thereafter (in thousands):
| | Payments Due by Period | |
| | Total | | | 2018 | | | 2019-2020 | | | 2021-2022 | | | Thereafter | |
| | | | | | | | | | | | | | | | | | | | |
Debt obligations: | | | | | | | | | | | | | | | | | | | | |
Term Loan Facility(1) | | $ | 1,124,956 | | | $ | 69,144 | | | $ | 138,288 | | | $ | 917,524 | | | $ | — | |
Senior Notes(1) | | | 648,000 | | | | 46,500 | | | | 93,000 | | | | 93,000 | | | | 415,500 | |
Capital lease obligations, net of imputed interest | | | 24,411 | | | | 1,140 | | | | 2,572 | | | | 2,858 | | | | 17,841 | |
Other debt | | | 4,926 | | | | 1,833 | | | | 2,620 | | | | 473 | | | | — | |
Total debt obligations | | | 1,802,293 | | | | 118,617 | | | | 236,480 | | | | 1,013,855 | | | | 433,341 | |
Operating lease obligations | | | 115,746 | | | | 32,253 | | | | 45,241 | | | | 21,016 | | | | 17,236 | |
Capital commitments (2) | | | 31,211 | | | | 23,214 | | | | 5,075 | | | | 1,948 | | | | 974 | |
Open purchase orders | | | 9,919 | | | | 9,919 | | | | — | | | | — | | | | — | |
Total contractual obligations and other capital commitments | | $ | 1,959,169 | | | $ | 184,003 | | | $ | 286,796 | | | $ | 1,036,819 | | | $ | 451,551 | |
| (1) | Contractual obligations on the Term Loan Facility and Senior Notes include both principal and interest. These amounts exclude our unamortized debt issuance costs, and discounts. Estimates of interest payments assume that interest rates and borrowing spreads at December 31, 2017 remain constant through maturity. |
| (2) | We have future commitments of approximately $25.4 million related to certain hospital expansion and renovation projects, of which approximately $22.4 million is the remaining commitment on the McKenzie-Willamette Medical Center project. In addition, pursuant to the master lease agreement at our hospital in Helena, Arkansas, we have committed to make capital expenditures and improvements at this hospital averaging a specified percentage of the hospital’s annual net operating revenues. We currently estimate that we will make capital expenditures of approximately $1 million for each year of the remaining lease term, which extends through January 1, 2025. Both of these items have been included in the capital commitments line in the table above. |
In connection with the Spin-off, we entered into certain agreements that were established by CHS to govern matters related to the Spin-off. These agreements include, among others, a Separation and Distribution Agreement, a Tax Matters Agreement and an Employee Matters Agreement. We also entered into various transition services agreements that were established by CHS and that define agreed upon services to be provided by CHS to QHC. The transition services agreements generally have five year terms expiring on April 29, 2021, and include, among others, the provision for services related to information technology, payroll
104
processing, certain human resources functions, patient eligibility screening, billing, collections and other revenue management services. Our future cash obligations related to these agreements are based on certain fixed and variable factors, as defined by each agreement, and include factors such as total cash collections, labor costs and employee headcount, which are used to determine the fees charged to us under the agreements each period. See Note 18 — Related Party Transactions in the accompanying financial statements for additional information on our agreements with CHS. The obligations associated with these agreements are not included in the table above.
Off-Balance Sheet Arrangements
As of December 31, 2017, we had $10.2 million of letters of credit outstanding that were primarily related to the self-insured retention level of professional and general liability insurance and workers’ compensation liability insurance as security for the payment of claims.
As of December 31, 2017, we operate one hospital under an operating lease obligation for the land and building. We utilize the same operating strategies to improve operations at this hospital as we do at those hospitals that we own or lease under capital lease arrangements. The term of this hospital operating lease expires in June 2022, not including lease extension options. As of December 31, 2017, the total obligation for the remainder of this lease, not including lease extension options, was $12.8 million.
Redeemable and Non-Redeemable Noncontrolling Interests
Our financial statements include all assets, liabilities, revenues and expenses of less than 100% owned entities that we control. Accordingly, we have recorded noncontrolling interests in the earnings and equity of such entities. Certain of our consolidated subsidiaries have noncontrolling physician ownership interests with redemption features that require us to deliver cash upon the occurrence of certain events outside our control, such as the retirement, death, or disability of a physician-owner. We record the carrying amount of redeemable noncontrolling interests at the greater of: (1) the initial carrying amount increased or decreased for the noncontrolling interests' share of cumulative net income (loss), net of cumulative amounts distributed, if any, or (2) the redemption value. As of December 31, 2017, we had redeemable noncontrolling interests of $2.3 million and non-redeemable noncontrolling interests of $14.0 million that are included in our balance sheet.
Inflation
The healthcare industry is labor intensive. Salaries, benefits and other labor-related costs increase during periods of inflation and periods of labor shortages for nurses and other medical staff, which may differ depending on the geographic area in which a hospital is located. In addition, the Affordable Care Act is subject to ongoing revisions and possible repeal and replacement, which may lead to substantially higher costs to us related to providing employee medical benefits. We are also exposed to rising costs for medical supplies and drugs due to inflationary pressures on our suppliers, including our group purchasing organization. We have implemented cost control measures to monitor and manage the impact of rising operating costs and expenses on our operating margins, including, among others, the reduction of costs in non-labor intensive categories. We cannot make assurances that we will be able to adequately offset the impact that any future increases in labor costs, employee medical benefit costs or other operating costs and expenses may have on our business which could adversely impact our operating margins in the future.
Item 7A. Quantitative and Qualitative Disclosures about Market Risk
We are exposed to market risk associated with changes in interest rates on our variable rate long-term debt. In connection with the Spin-off, on April 29, 2016, we entered into two credit agreements, the Senior Credit Facility and the ABL Credit Facility, that subject us to variable interest rates. As of December 31, 2017, we had outstanding principal amount of debt, excluding unamortized debt issuance costs and discounts, of $831.2 million which was subject to variable rates of interest. We had no borrowings outstanding on the revolving credit facilities as of December 31, 2017. If the interest rate on our variable rate long-term debt outstanding as of December 31, 2017, after taking into consideration the 1% floor on our Term Loan Facility, was 100 basis points higher for the year ended December 31, 2017, the additional interest expense impacting net income (loss) would have been $(7.1) million, or $(0.25) per basic and diluted share. We do not currently have any derivative or hedging arrangements, or other known exposures, to changes in interest rates.
Item 8. | Financial and Supplementary Data |
This information is included in this Annual Report on Form 10-K beginning at page F-1, which follows the signature page.
105
Item 9. | Changes in and Disagreements with Accountants on Accounting and Financial Disclosure |
None.
Item 9A. | Controls and Procedures |
Evaluation of disclosure controls and procedures
Based on the evaluation of our disclosure controls and procedures (as defined in the Rules 13a-15(e) and 15d-15(e) under the Securities Exchange Act of 1934, or the Exchange Act) required by Exchange Act Rules 13a-15(b) or 15d-15(b), our principal executive officer and our principal financial officer have concluded that as of the end of the period covered by this report, our disclosure controls and procedures were not effective as a result of the material weakness in our internal control over financial reporting discussed below.
Notwithstanding the identified material weakness, management, including our CEO (principal executive officer) and CFO (principal financial officer), believes that the consolidated financial statements included in this Annual Report on Form 10-K fairly present in all material respects our financial condition, results of operations and cash flows as of and for the periods presented in accordance with U.S. GAAP.
Changes in Internal Control over Financial Reporting
There were no changes in our internal control over financial reporting as defined in Exchange Act Rules 13a-15(f) and 15d-15(f) that occurred during our most recently completed fiscal quarter that have materially affected, or are reasonably likely to materially affect, our internal control over financial reporting.
Material Weakness
We identified a deficiency in our internal control over financial reporting that is described in Management’s Annual Report on Internal Control Over Financial Reporting. We have concluded that this deficiency constitutes a material weakness in our internal control over financial reporting. Nonetheless, we have concluded that this material weakness does not require a change in the fourth quarter or full year 2017 consolidated financial statements, nor does it require a restatement of or change in our consolidated financial statements for any prior annual or interim period. We have developed a remediation plan for this material weakness, which is described below.
Management’s Annual Report on Internal Control Over Financial Reporting
Our management, including our principal executive officer and principal financial officer, is responsible for establishing and maintaining adequate internal control over financial reporting. Our management conducted an evaluation of the effectiveness of our internal control over financial reporting based on the framework and criteria established in Internal Control - Integrated Framework (2013) issued by the Committee of Sponsoring Organizations of the Treadway Commission. Based on its evaluation, our management has concluded that our internal control over financial reporting was not effective as of December 31, 2017, due to the material weakness in our internal control over financial reporting discussed below. A material weakness is a deficiency, or combination of deficiencies, in internal control over financial reporting such that there is a reasonable possibility that a material misstatement of our annual or interim financial statements will not be prevented or detected on a timely basis.
We identified a deficiency as it related to the controls intended to properly document and review on a timely basis our analysis of self-pay patient accounts receivable at a more comprehensive and disaggregated level related to our adoption of ASU 2014-09 Revenue from Contracts with Customers. We have concluded that the deficiency constitutes a material weakness in our internal control over financial reporting. There were no material errors in the financial results or balances identified as a result of the control deficiency, and there was no restatement of prior period financial statements and no change in previously released financial results were required as a result of this control deficiency.
The effectiveness of our internal control over financial reporting as of December 31, 2017 has been audited by Deloitte & Touche LLP, an independent registered public accounting firm, as stated in their report which appears in Item 15(a) of this Annual Report on Form 10-K.
Remediation Plan
We have begun implementing a remediation plan to address the control deficiency that led to the material weakness. The remediation plan includes the following:
| • | Strengthening our documentation for our self-pay and self-pay after insurance revenue as it relates to the adoption of ASC 2014-09, including obtaining additional resources as necessary to complete this documentation; and |
106
| • | Implementing specific procedures related to the disaggregated analysis of the estimated transaction price, as determined by reducing our standard charges by any contractual allowances, discounts and implicit price concessions, related to our self-pay and self-pay after insurance revenue that conforms to the requirements under ASC 2014-09; and |
| • | Implementing specific review procedures designed to enhance our controls over the preparation of the disaggregated estimated transaction price, as determined by reducing our standard charges by any contractual allowances, discounts and implicit price concessions, related to our self-pay and self-pay after insurance revenue. |
We currently plan to have our enhanced review procedures and documentation standards in place and operating as of the first quarter of 2018. Our goal is to remediate this material weakness by the end of 2018, subject to adequate opportunities to conclude, through testing, that the enhanced control is operating effectively.
Item 9B. | Other Information |
On March 14, 2018, we executed the CS Second Amendment. For a description of the terms and conditions of the CS Second Amendment, see “Item 7. Management’s Discussion and Analysis of Financial Condition and Results of Operations — Liquidity and Capital Resources.”
107
PART III
Item 10. Directors, Executive Officers and Corporate Governance
Information to be provided in Items 10, 11, 12, 13 and 14 of the Form 10-K and not otherwise included herein is incorporated by reference to the definitive proxy statement for our 2018 Annual Meeting of Stockholders to be held on June 8, 2018, which will be filed with the SEC within 120 days of the end of the Company’s fiscal year ended December 31, 2017.
Code of Conduct
Our Board expects its members, as well as our officers and employees, to act ethically at all times and to acknowledge in writing their adherence to the policies comprising our Code of Conduct. A copy of the Code of Conduct is posted on the “About Us — Corporate Governance” section of our internet website at www.quorumhealth.com/about-us/corporate-governance and is also available in print, free of charge, by visiting or mailing a request to our corporate office located at 1573 Mallory Lane, Brentwood, TN 37027. We intend to disclose any amendments to our Code of Conduct and any waivers from a provision of our Code of Conduct, as required by the SEC, on our website, in each case to the extent such amendment or waiver would otherwise require us to file a Current Report on Form 8-K pursuant to Item 5.05 thereof.
Item 11. Executive Compensation
See Item 10.
Item 12. Security Ownership of Certain Beneficial Owners and Management and Related Stockholder Matters
See Item 10.
Item 13. Certain Relationships and Related Transactions, and Director Independence
See Item 10.
Item 14. Principal Accountant Fees and Services
See Item 10.
108
PART IV
Item 15. | Exhibits, Financial Statement Schedules |
| (a) | Index to Consolidated and Combined Financial Statements, Financial Statement Schedules and Exhibits |
| (1) | Consolidated and Combined Financial Statements |
The consolidated financial statements required to be included in “Item 8. Financial Statements and Supplementary Data” begin on page F-1 and are submitted as a separate section of this report.
| (2) | Consolidated and Combined Financial Statement Schedules |
All schedules are omitted because they are not applicable or not required, or because the required information is included in the consolidated financial statements section of this report, which begins on page F-1.
No. | | Description |
| | |
2.1 | Separation and Distribution Agreement, dated as of April 29, 2016, by and between Community Health Systems, Inc. and Quorum Health Corporation (incorporated by reference to Exhibit 2.1 to the Company’s Current Report on Form 8-K filed with the SEC on May 2, 2016) (File No. 001-37550). |
| |
2.2 | Tax Matters Agreement, dated as of April 29, 2016, by and between Community Health Systems, Inc. and Quorum Health Corporation (incorporated by reference to Exhibit 2.2 to the Company’s Current Report on Form 8-K filed with the SEC on May 2, 2016) (File No. 001-37550). |
| |
2.3 | Employee Matters Agreement, dated as of April 29, 2016, by and between Community Health Systems, Inc. and Quorum Health Corporation (incorporated by reference to Exhibit 2.3 to the Company’s Current Report on Form 8-K filed with the SEC on May 2, 2016) (File No. 001-37550). |
| |
2.4 | Amendment to the Employee Matters Agreement, effective as of April 29, 2016, by and between Community Health Systems, Inc. and Quorum Health Corporation (incorporated by reference to Exhibit 2.1 to the Company’s Report on Form 10-Q filed with the SEC on November 14, 2016) (File No. 001-37550). |
| |
2.5 | Computer and Data Processing Transition Services Agreement, dated as of April 29, 2016, by and between CHSPSC, LLC and QHCCS, LLC (incorporated by reference to Exhibit 2.4 to the Company’s Current Report on Form 8-K filed with the SEC on May 2, 2016) (File No. 001-37550). |
| |
2.6 | Receivables Collection Agreement (PASI), dated as of April 29, 2016, by and between Professional Account Services, Inc. and QHCCS, LLC (incorporated by reference to Exhibit 2.5 to the Company’s Current Report on Form 8-K filed with the SEC on May 2, 2016) (File No. 001-37550). |
| |
2.7 | Billing and Collection Agreement (PPSI), dated as of April 29, 2016, by and between Physician Practice Support, LLC and QHCCS, LLC (incorporated by reference to Exhibit 2.6 to the Company’s Current Report on Form 8-K filed with the SEC on May 2, 2016) (File No. 001-37550). |
| |
2.8 | Eligibility Screening Services Agreement, dated as of April 29, 2016, by and between Eligibility Screening Services, LLC and QHCCS, LLC (incorporated by reference to Exhibit 2.7 to the Company’s Current Report on Form 8-K filed with the SEC on May 2, 2016) (File No. 001-37550). |
| |
2.9 | Employee Service Center/HRIS Transition Services Agreement, dated as of April 29, 2016, by and between CHSPSC, LLC and QHCCS, LLC (incorporated by reference to Exhibit 2.8 to the Company’s Current Report on Form 8-K filed with the SEC on May 2, 2016) (File No. 001-37550). |
| |
2.10 | Shared Services Center Transition Services Agreement, dated as of April 29, 2016, by and between Revenue Cycle Service Center, LLC and QHCCS, LLC (incorporated by reference to Exhibit 2.9 to the Company’s Current Report on Form 8-K filed with the SEC on May 2, 2016) (File No. 001-37550). |
| |
2.11 | Supplemental Medicaid Program Services Agreement, dated as of April 29, 2016, by and between CHSPSC, LLC and QHCCS, LLC (incorporated by reference to Exhibit 2.10 to the Company’s Current Report on Form 8-K filed with the SEC on May 2, 2016) (File No. 001-37550). |
| |
109
No. | | Description |
2.12 | Short-Term Transition Services Agreement, dated as of April 29, 2016, by and between CHSPSC, LLC and QHCCS, LLC (incorporated by reference to Exhibit 2.11 to the Company’s Current Report on Form 8-K filed with the SEC on May 2, 2016) (File No. 001-37550). |
| |
3.1 | Amended and Restated Certificate of Incorporation of Quorum Health Corporation (incorporated by reference to Exhibit 4.2 to the Company’s Registration Statement on Form S-8 filed with the SEC on April 29, 2016) (File No. 333-210993). |
| |
3.2 | Amended and Restated Bylaws of Quorum Health Corporation (incorporated by reference to Exhibit 4.3 to the Company’s Registration Statement on Form S-8 filed with the SEC on April 29, 2016) (File No. 333-210993). |
| |
4.1 | Indenture, dated as of April 22, 2016, by and between Quorum Health Corporation and Regions Bank, as trustee (incorporated by reference to Exhibit 4.1 to the Company’s Current Report on Form 8-K filed with the SEC on April 22, 2016) (File No. 001-37550). |
| |
4.2 | Supplemental Indenture, dated as of April 29, 2016, by and among Quorum Health Corporation, the guarantors party thereto and Regions Bank, as trustee (incorporated by reference to Exhibit 4.1 to the Company’s Current Report on Form 8-K filed with the SEC on May 2, 2016) (File No. 001-37550). |
| |
4.3 | Supplemental Indenture, dated as of December 28, 2016, by and among Quorum Health Corporation, the guarantor party thereto and Regions Bank, as trustee (incorporated by reference to Exhibit 4.3 to the Company’s Annual Report on Form 10-K filed with the SEC on April 12, 2017) (File No. 001-37550). |
| |
4.4 | Registration Rights Agreement, dated as of April 22, 2016, by and between Quorum Health Corporation and Credit Suisse Securities (USA) LLC, as representative of the initial purchasers (incorporated by reference to Exhibit 4.2 to the Company’s Current Report on Form 8-K filed with the SEC on April 22, 2016) (File No. 001-37550). |
| |
4.5 | Registration Rights Agreement Joinder, dated as of April 29, 2016, by and between the guarantors party thereto and Credit Suisse Securities (USA) LLC, as representative of the initial purchasers (incorporated by reference to Exhibit 4.2 to the Company’s Current Report on Form 8-K filed with the SEC on May 2, 2016) (File No. 001-37550). |
| |
4.6 | Registration Rights Agreement Joinder, dated as of December 28, 2016, by and between the guarantor party thereto and Credit Suisse Securities (USA) LLC, as representative of the initial purchasers (incorporated by reference to Exhibit 4.6 to the Company’s Annual Report on Form 10-K filed with the SEC on April 12, 2017) (File No. 001-37550). |
| |
4.7 | Form of 11.625% Senior Notes due 2023 (incorporated by reference to Exhibit A to Exhibit 4.1 to the Company’s Current Report on Form 8-K filed with the SEC on April 22, 2016) (File No. 001-37550). |
| |
10.1 | Credit Agreement, dated as of April 29, 2016, by and among Quorum Health Corporation, the lenders party thereto and Credit Suisse AG, as Administrative Agent and Collateral Agent (incorporated by reference to Exhibit 10.1 to the Company’s Current Report on Form 8-K filed with the SEC on May 2, 2016) (File No. 001-37550). |
| |
10.2 | Amendment No. 1, dated as of April 11, 2017, to the Credit Agreement, dated as of April 29, 2016, among Quorum Health Corporation, the lenders party thereto and Credit Suisse AG, as Administrative Agent and Collateral Agent (incorporated by reference to Exhibit 10.2 to the Company’s Annual Report on Form 10-K filed with the SEC on April 12, 2017) (File No. 001-37550). |
| |
10.3* | Amendment No. 2, dated as of March 14, 2018, to the Credit Agreement, dated as of April 29, 2106, as amended by Amendment No. 1 to the Credit Agreement, dated as of April 11, 2017, among Quorum Health Corporation, the lenders party thereto and Credit Suisse AG, as Administrative Agent and Collateral Agent |
| |
110
No. | | Description |
10.4 | ABL Credit Agreement, dated as of April 29, 2016, by and among Quorum Health Corporation, the lenders party thereto and UBS AG, Stamford Branch, as Administrative Agent, Collateral Agent and Swingline Lender (incorporated by reference to Exhibit 10.2 to the Company’s Current Report on Form 8-K filed with the SEC on May 2, 2016) (File No. 001-37550). |
| |
10.5 | Amendment No. 1, dated as of April 11, 2017, to the ABL Credit Agreement, dated as of April 29, 2016, by and among Quorum Health Corporation, the lenders party thereto and UBS AG, Stamford Branch, as Administrative Agent, Collateral Agent and Swingline Lender (incorporated by reference to Exhibit 10.4 to the Company’s Annual Report on Form 10-K filed with the SEC on April 12, 2017) (File No. 001-37550). |
| |
10.6† | Quorum Health Corporation 2016 Stock Award Plan (incorporated by reference to Exhibit 10.3 to the Company’s Current Report on Form 8-K filed with the SEC on May 2, 2016) (File No. 001-37550). |
| |
10.7† | Quorum Health Corporation Director’s Fees Deferral Plan, effective as of September 16, 2016 (incorporated by reference to Exhibit 4.1 to the Company’s Registration Statement on Form S-8 filed with the SEC on September 20, 2016) (File No. 333-213717). |
| |
10.8† | Form of Restricted Stock Award Agreement (incorporated by reference to Exhibit 10.4 to the Company’s Quarterly Report on Form 10-Q filed with the SEC on May 11, 2016) (File No. 001-37550). |
| |
10.9† | Form of Director Restricted Stock Award Agreement (incorporated by reference to Exhibit 10.2 to the Company’s Current Report on Form 8-K filed with the SEC on May 6, 2016) (File No. 001-37550). |
| |
10.10† | Form of Performance-Based Restricted Stock Award Agreement (incorporated by reference to Exhibit 10.1 to the Company’s Current Report on Form 8-K filed with the SEC on May 6, 2016) (File No. 001-37550). |
| |
10.11†
| Quorum Health Corporation 2016 Employee Performance Incentive Plan (incorporated by reference to Exhibit 10.5 to the Company’s Current Report on Form 8-K filed with the SEC on May 2, 2016) (File No. 001-37550). |
| |
10.12† | Quorum Health Corporation Supplemental Executive Retirement Plan (incorporated by reference to Exhibit 10.6 to the Company’s Current Report on Form 8-K filed with the SEC on May 2, 2016) (File No. 001-37550). |
| |
10.13† | Change in Control Severance Agreement, dated December 31, 2008, by and among Community Health Systems, Inc., CHSPSC, LLC (formerly Community Health Systems Professional Services Corporation) and Thomas D. Miller (incorporated by reference to Exhibit 10.4 to Amendment No. 2 to the Company’s Registration Statement on Form 10 filed with the SEC on November 20, 2015) (File No. 001-37550). |
| |
10.14† | Change in Control Severance Agreement, dated December 31, 2008, by and among Community Health Systems, Inc., CHSPSC, LLC (formerly Community Health Systems Professional Services Corporation) and Martin D. Smith (incorporated by reference to Exhibit 10.5 to Amendment No. 2 to the Company’s Registration Statement on Form 10 filed with the SEC on November 20, 2015) (File No. 001-37550). |
| |
10.15† | Form of Indemnification Agreement for Directors and Executive Officers (incorporated by reference to Exhibit 10.9 to the Company’s Current Report on Form 8-K filed with the SEC on May 2, 2016) (File No. 001-37550). |
| |
10.16† | Quorum Health Corporation Amended and Restated Supplemental Executive Retirement Plan (incorporated by reference to Exhibit 10.12 to the Company’s Report on Form 10-Q filed with the SEC on August 10, 2016) (File No. 001-37550). |
| |
10.17† | QHCCS, LLC Nonqualified Deferred Compensation Plan, effective as of September 1, 2016 (incorporated by reference to Exhibit 10.1 to the Company’s Current Report on Form 8-K filed with the SEC on August 18, 2016) (File No. 001-37550). |
| |
111
No. | | Description |
10.18† | QHCCS, LLC Nonqualified Deferred Compensation Plan Adoption Agreement, executed as of August 18, 2016 (incorporated by reference to Exhibit 10.2 to the Company’s Current Report on Form 8-K filed with the SEC on August 18, 2016) (File No. 001-37550). |
| |
10.19† | Form of Change in Control Severance Agreement by and between Quorum Health Corporation and each of Michael Culotta, Shaheed Koury, R. Harold McCard, Jr. and Matthew Hayes (incorporated by reference to Exhibit 10.1 to the Company’s Current Report on Form 8-K filed with the SEC on September 29, 2017) (File No. 001-37550). |
| |
12.1* | Ratio of Earnings to Fixed Charges. |
| |
21.1* | List of Subsidiaries of Quorum Health Corporation. |
| |
23.1* | Consent of Deloitte & Touche LLP. |
| |
31.1* | Certification of Chief Executive Officer pursuant to Section 302 of the Sarbanes-Oxley Act of 2002. |
| |
31.2* | Certification of Chief Financial Officer pursuant to Section 302 of the Sarbanes-Oxley Act of 2002. |
| |
32.1** | Certification of Chief Executive Officer pursuant to 18 U.S.C. Section 1350, adopted pursuant to Section 906 of the Sarbanes-Oxley Act of 2002. |
| |
32.2** | Certification of Chief Financial Officer pursuant to 18 U.S.C. Section 1350, adopted pursuant to Section 906 of the Sarbanes-Oxley Act of 2002. |
| |
101.INS* | XBRL Instance Document. |
| |
101.SCH* | XBRL Taxonomy Extension Schema. |
| |
101.CAL* | XBRL Taxonomy Extension Calculation Linkbase. |
| |
101.DEF* | XBRL Taxonomy Extension Definition Linkbase. |
| |
101.LAB* | XBRL Taxonomy Extension Label Linkbase. |
| |
101.PRE* | XBRL Taxonomy Extension Presentation Linkbase. |
| † | Indicates a management contract or compensation plan or arrangement. |
Item 16.Form 10-K Summary
None.
112
SIGNATURES
Pursuant to the requirements of Sections 13 or 15(d) of the Securities Exchange Act of 1934, the registrant has duly caused this Report to be signed on its behalf by the undersigned thereunto duly authorized.
QUORUM HEALTH CORPORATION (Registrant) |
|
By: | | /s/ Thomas D. Miller |
| | Thomas D. Miller |
| | President, Chief Executive Officer |
| | and Director |
| | (principal executive officer) |
| | |
By: | | /s/ Michael J. Culotta |
| | Michael J. Culotta |
| | Executive Vice President |
| | and Chief Financial Officer |
| | (principal financial officer and principal accounting officer) |
|
By: | | /s/ Stanley E. Hunt |
| | Stanley E. Hunt |
| | Senior Vice President and Corporate Controller |
Date: March 15, 2018
Pursuant to the requirements of the Securities Exchange Act of 1934, this Report has been signed below by the following persons on behalf of the registrant in the capacities and on the date indicated.
Name | Title | Date |
| | |
/s/ William M. Gracey William M. Gracey | Director | March 15, 2018 |
/s/ Thomas D. Milller Thomas D. Miller | President, Chief Executive Officer and Director (principal executive officer) | March 15, 2018 |
/s/ Michael J. Culotta Michael J. Culotta | Executive Vice-President and Chief Financial Officer (principal financial officer and principal accounting officer) | March 15, 2018 |
/s/ James T. Breedlove James T. Breedlove | Director | March 15, 2018 |
/s/ Terry A. Rappuhn Terry A. Rappuhn | Director | March 15, 2018 |
/s/ Joseph A. Hastings, D.M.D Joseph A. Hastings, D.M.D. | Director | March 15, 2018 |
/s/ William S. Hussey William S. Hussey | Director | March 15, 2018 |
/s/ Barbara R. Paul, M.D. Barbara R. Paul, M.D. | Director | March 15, 2018 |
/s/ R. Lawrence Van Horn, Ph.D. R. Lawrence Van Horn, Ph.D. | Director | March 15, 2018 |
113
QUORUM HEALTH CORPORATION
Index to the Consolidated and Combined Financial Statements
F-1
REPORT OF INDEPENDENT REGISTERED PUBLIC ACCOUNTING FIRM
To the Stockholders and the Board of Directors of
Quorum Health Corporation
1573 Mallory Lane
Brentwood, Tennessee 37027
Opinion on Internal Control over Financial Reporting
We have audited the internal control over financial reporting of Quorum Health Corporation and subsidiaries (the "Company") as of December 31, 2017, based on criteria established in Internal Control — Integrated Framework (2013) issued by the Committee of Sponsoring Organizations of the Treadway Commission (COSO). In our opinion, because of the effect of the material weakness identified below on the achievement of the objectives of the control criteria, the Company has not maintained effective internal control over financial reporting as of December 31, 2017, based on criteria established in Internal Control — Integrated Framework (2013) issued by COSO.
We have also audited, in accordance with the standards of the Public Company Accounting Oversight Board (United States) (PCAOB), the consolidated balance sheets and the related statements of income (loss), comprehensive income (loss), equity, and cash flows, as of and for the period ended December 31, 2017 of the Company and our report dated March 15, 2018, expressed an unqualified opinion on those financial statements.
Basis for Opinion
The Company’s management is responsible for maintaining effective internal control over financial reporting and for its assessment of the effectiveness of internal control over financial reporting, included in the accompanying Management’s Annual Report on Internal Control Over Financial Reporting. Our responsibility is to express an opinion on the Company’s internal control over financial reporting based on our audit. We are a public accounting firm registered with the PCAOB and are required to be independent with respect to the Company in accordance with the U.S. federal securities laws and the applicable rules and regulations of the Securities and Exchange Commission and the PCAOB.
We conducted our audit in accordance with the standards of the PCAOB. Those standards require that we plan and perform the audit to obtain reasonable assurance about whether effective internal control over financial reporting was maintained in all material respects. Our audit included obtaining an understanding of internal control over financial reporting, assessing the risk that a material weakness exists, testing and evaluating the design and operating effectiveness of internal control based on the assessed risk, and performing such other procedures as we considered necessary in the circumstances. We believe that our audit provides a reasonable basis for our opinion.
Definition and Limitations of Internal Control over Financial Reporting
A company’s internal control over financial reporting is a process designed to provide reasonable assurance regarding the reliability of financial reporting and the preparation of financial statements for external purposes in accordance with generally accepted accounting principles. A company’s internal control over financial reporting includes those policies and procedures that (1) pertain to the maintenance of records that, in reasonable detail, accurately and fairly reflect the transactions and dispositions of the assets of the company; (2) provide reasonable assurance that transactions are recorded as necessary to permit preparation of financial statements in accordance with generally accepted accounting principles, and that receipts and expenditures of the company are being made only in accordance with authorizations of management and directors of the company; and (3) provide reasonable assurance regarding prevention or timely detection of unauthorized acquisition, use, or disposition of the company’s assets that could have a material effect on the financial statements.
Because of its inherent limitations, internal control over financial reporting may not prevent or detect misstatements. Also, projections of any evaluation of effectiveness to future periods are subject to the risk that controls may become inadequate because of changes in conditions, or that the degree of compliance with the policies or procedures may deteriorate.
Material Weakness
A material weakness is a deficiency, or a combination of deficiencies, in internal control over financial reporting, such that there is a reasonable possibility that a material misstatement of the company’s annual or interim financial statements will not be prevented or detected on a timely basis. The following material weakness has been identified and included in management's assessment:
A material weakness has been identified related to the controls intended to properly document and review on a timely basis the Company’s analysis of self-pay patient accounts receivable at a more comprehensive and disaggregated level related to the Company’s adoption of ASU 2014-09 Revenue from Contracts with Customers.
This material weakness was considered in determining the nature, timing, and extent of audit tests applied in our audit of the consolidated balance sheets and the related statements of income (loss), comprehensive income (loss), equity, and cash flows, as of and for the period ended December 31, 2017, of the Company, and this report does not affect our report on such financial statements.
/s/ Deloitte & Touche LLP
Nashville, Tennessee
March 15, 2018
F-2
REPORT OF INDEPENDENT REGISTERED PUBLIC ACCOUNTING FIRM
To the Stockholders and the Board of Directors of
Quorum Health Corporation
1573 Mallory Lane
Brentwood, Tennessee 37027
Opinion on the Financial Statements
We have audited the accompanying consolidated balance sheets of Quorum Health Corporation and subsidiaries (the "Company") as of December 31, 2017 and 2016, the related consolidated statements of income (loss), comprehensive income (loss), equity, and cash flows, for each of the three years in the period ended December 31, 2017, and the related notes (collectively referred to as the "financial statements"). In our opinion, the financial statements present fairly, in all material respects, the financial position of the Company as of December 31, 2017 and 2016, and the results of its operations and its cash flows for each of the three years in the period ended December 31, 2017, in conformity with accounting principles generally accepted in the United States of America. We have also audited, in accordance with the standards of the Public Company Accounting Oversight Board (United States) (PCAOB), the Company's internal control over financial reporting as of December 31, 2017, based on criteria established in Internal Control — Integrated Framework (2013) issued by the Committee of Sponsoring Organizations of the Treadway Commission and our report dated March 15, 2018, expressed an adverse opinion on the Company's internal control over financial reporting because of a material weakness.
Basis for Opinion
These financial statements are the responsibility of the Company's management. Our responsibility is to express an opinion on the Company's financial statements based on our audits. We are a public accounting firm registered with the PCAOB and are required to be independent with respect to the Company in accordance with the U.S. federal securities laws and the applicable rules and regulations of the Securities and Exchange Commission and the PCAOB.
We conducted our audits in accordance with the standards of the PCAOB. Those standards require that we plan and perform the audit to obtain reasonable assurance about whether the financial statements are free of material misstatement, whether due to error or fraud. Our audits included performing procedures to assess the risks of material misstatement of the financial statements, whether due to error or fraud, and performing procedures that respond to those risks. Such procedures included examining, on a test basis, evidence regarding the amounts and disclosures in the financial statements. Our audits also included evaluating the accounting principles used and significant estimates made by management, as well as evaluating the overall presentation of the financial statements. We believe that our audits provide a reasonable basis for our opinion.
/s/ Deloitte & Touche LLP
Nashville, Tennessee
March 15, 2018
We have served as the Company’s auditor since 2015.
F-3
QUORUM HEALTH CORPORATION
CONSOLIDATED AND COMBINED STATEMENTS OF INCOME (LOSS)
(In Thousands, Except Earnings per Share and Shares)
| | Year Ended December 31, | |
| | 2017 | | | 2016 | | | 2015 | |
| | | | | | | | | | | | |
Operating revenues, net of contractual allowances and discounts | | $ | 2,327,655 | | | $ | 2,419,053 | | | $ | 2,445,858 | |
Provision for bad debts | | | 255,485 | | | | 280,586 | | | | 258,520 | |
Net operating revenues | | | 2,072,170 | | | | 2,138,467 | | | | 2,187,338 | |
Operating costs and expenses: | | | | | | | | | | | | |
Salaries and benefits | | | 1,034,797 | | | | 1,057,119 | | | | 1,016,696 | |
Supplies | | | 250,523 | | | | 258,639 | | | | 249,792 | |
Other operating expenses | | | 623,063 | | | | 645,802 | | | | 634,233 | |
Depreciation and amortization | | | 82,155 | | | | 117,288 | | | | 128,001 | |
Rent | | | 50,230 | | | | 49,883 | | | | 48,729 | |
Electronic health records incentives earned | | | (4,745 | ) | | | (11,482 | ) | | | (25,779 | ) |
Legal, professional and settlement costs | | | 6,001 | | | | 7,342 | | | | — | |
Impairment of long-lived assets and goodwill | | | 47,281 | | | | 291,870 | | | | 13,000 | |
Loss (gain) on sale of hospitals, net | | | (5,243 | ) | | | 2,150 | | | | — | |
Transaction costs related to the Spin-off | | | 253 | | | | 5,488 | | | | 16,337 | |
Total operating costs and expenses | | | 2,084,315 | | | | 2,424,099 | | | | 2,081,009 | |
Income (loss) from operations | | | (12,145 | ) | | | (285,632 | ) | | | 106,329 | |
Interest expense, net | | | 122,077 | | | | 113,440 | | | | 98,290 | |
Income (loss) before income taxes | | | (134,222 | ) | | | (399,072 | ) | | | 8,039 | |
Provision for (benefit from) income taxes | | | (21,865 | ) | | | (53,875 | ) | | | 3,304 | |
Net income (loss) | | | (112,357 | ) | | | (345,197 | ) | | | 4,735 | |
Less: Net income (loss) attributable to noncontrolling interests | | | 1,833 | | | | 2,491 | | | | 3,398 | |
Net income (loss) attributable to Quorum Health Corporation | | $ | (114,190 | ) | | $ | (347,688 | ) | | $ | 1,337 | |
| | | | | | | | | | | | |
Earnings (loss) per share attributable to Quorum Health Corporation stockholders: | | | | | | | | | | | | |
Basic and diluted | | $ | (4.06 | ) | | $ | (12.24 | ) | | $ | 0.05 | |
Weighted-average shares outstanding: | | | | | | | | | | | | |
Basic and diluted | | | 28,113,566 | | | | 28,413,247 | | | | 28,412,054 | |
See accompanying notes
F-4
QUORUM HEALTH CORPORATION
CONSOLIDATED AND COMBINED STATEMENTS OF COMPREHENSIVE INCOME (LOSS)
(In Thousands)
| | Year Ended December 31, | |
| | 2017 | | | 2016 | | | 2015 | |
| | | | | | | | | | | | |
Net income (loss) | | $ | (112,357 | ) | | $ | (345,197 | ) | | $ | 4,735 | |
Amortization and recognition of unrecognized pension cost (credit) components, net of income taxes | | | 804 | | | | (2,760 | ) | | | — | |
Comprehensive income (loss) | | | (111,553 | ) | | | (347,957 | ) | | | 4,735 | |
Less: Comprehensive income (loss) attributable to noncontrolling interests | | | 1,833 | | | | 2,491 | | | | 3,398 | |
Comprehensive income (loss) attributable to Quorum Health Corporation | | $ | (113,386 | ) | | $ | (350,448 | ) | | $ | 1,337 | |
See accompanying notes
F-5
QUORUM HEALTH CORPORATION
CONSOLIDATED BALANCE SHEETS
(In Thousands, Except Par Value per Share and Shares)
| | December 31, | |
| | 2017 | | | 2016 | |
| | | | | | | | |
ASSETS | | | | | | | | |
Current assets: | | | | | | | | |
Cash and cash equivalents | | $ | 5,617 | | | $ | 25,455 | |
Patient accounts receivable, net of allowance for doubtful accounts of $352,509 and $360,796 at December 31, 2017 and 2016, respectively | | | 343,145 | | | | 380,685 | |
Inventories | | | 53,459 | | | | 58,124 | |
Prepaid expenses | | | 21,167 | | | | 23,028 | |
Due from third-party payors | | | 97,202 | | | | 116,235 | |
Current assets of hospitals held for sale | | | 8,112 | | | | 1,502 | |
Other current assets | | | 47,440 | | | | 57,942 | |
Total current assets | | | 576,142 | | | | 662,971 | |
Property and equipment, at cost | | | 1,405,184 | | | | 1,519,975 | |
Less: Accumulated depreciation and amortization | | | (729,905 | ) | | | (786,075 | ) |
Total property and equipment, net | | | 675,279 | | | | 733,900 | |
Goodwill | | | 409,229 | | | | 416,833 | |
Intangible assets, net | | | 64,850 | | | | 84,982 | |
Long-term assets of hospitals held for sale | | | 7,734 | | | | 6,851 | |
Other long-term assets | | | 95,607 | | | | 88,833 | |
Total assets | | $ | 1,828,841 | | | $ | 1,994,370 | |
| | | | | | | | |
LIABILITIES AND EQUITY | | | | | | | | |
Current liabilities: | | | | | | | | |
Current maturities of long-term debt | | $ | 1,855 | | | $ | 5,683 | |
Accounts payable | | | 171,250 | | | | 169,684 | |
Accrued liabilities: | | | | | | | | |
Accrued salaries and benefits | | | 77,803 | | | | 98,803 | |
Accrued interest | | | 10,466 | | | | 19,915 | |
Due to third-party payors | | | 47,705 | | | | 42,537 | |
Current liabilities of hospitals held for sale | | | 2,577 | | | | 492 | |
Other current liabilities | | | 43,687 | | | | 53,268 | |
Total current liabilities | | | 355,343 | | | | 390,382 | |
Long-term debt | | | 1,212,035 | | | | 1,241,142 | |
Deferred income tax liabilities, net | | | 7,774 | | | | 31,474 | |
Other long-term liabilities | | | 137,954 | | | | 108,996 | |
Total liabilities | | | 1,713,106 | | | | 1,771,994 | |
Redeemable noncontrolling interests | | | 2,325 | | | | 6,807 | |
Commitments and Contingencies (Note 19) | | | | | | | | |
Equity: | | | | | | | | |
Quorum Health Corporation stockholders' equity: | | | | | | | | |
Preferred stock, $0.0001 par value per share; 100,000,000 shares authorized; none issued | | | — | | | | — | |
Common stock, $0.0001 par value per share; 300,000,000 shares authorized; 30,294,895 shares issued and outstanding at December 31, 2017 and 29,482,050 shares issued and outstanding at December 31, 2016 | | | 3 | | | | 3 | |
Additional paid-in capital | | | 549,610 | | | | 537,911 | |
Accumulated other comprehensive income (loss) | | | (1,956 | ) | | | (2,760 | ) |
Accumulated deficit | | | (448,216 | ) | | | (334,026 | ) |
Total Quorum Health Corporation stockholders' equity | | | 99,441 | | | | 201,128 | |
Nonredeemable noncontrolling interests | | | 13,969 | | | | 14,441 | |
Total equity | | | 113,410 | | | | 215,569 | |
Total liabilities and equity | | $ | 1,828,841 | | | $ | 1,994,370 | |
See accompanying notes
F-6
QUORUM HEALTH CORPORATION
CONSOLIDATED AND COMBINED STATEMENTS OF EQUITY
(In Thousands, Except Shares)
| | | | | | | Quorum Health Corporation Stockholders' Equity | | | | | | | | | | | | | |
| | | | | | | | | | | | | | | | | | | Accumulated | | | | | | | | | | | | | | | | | |
| | Redeemable | | | | | | | | | | | | Additional | | | Other | | | | | | | | | | | Nonredeemable | | | | | |
| | Noncontrolling | | | | Common Stock | | | Paid-in | | | Comprehensive | | | Accumulated | | | Parent's | | | Noncontrolling | | | Total | |
| | Interests | | | | Shares | | | Amount | | | Capital | | | Loss | | | Deficit | | | Equity | | | Interests | | | Equity | |
| | | | | | | | | | | | | | | | | | | | | | | | | | | | | | | | | | | | | |
Balances at December 31, 2014 | | $ | 2,362 | | | | | — | | | $ | — | | | $ | — | | | $ | — | | | $ | — | | | $ | 3,109 | | | $ | 4,809 | | | $ | 7,918 | |
Comprehensive income (loss) | | | (170 | ) | | | | — | | | | — | | | | — | | | | — | | | | — | | | | 1,337 | | | | 3,568 | | | | 4,905 | |
Transfers to Parent (prior to the Spin-off) | | | — | | | | | — | | | | — | | | | — | | | | — | | | | — | | | | (1,337 | ) | | | — | | | | (1,337 | ) |
Cash distributions to noncontrolling investors | | | (499 | ) | | | | — | | | | — | | | | — | | | | — | | | | — | | | | — | | | | (1,124 | ) | | | (1,124 | ) |
Purchases of shares from noncontrolling investors | | | (543 | ) | | | | — | | | | — | | | | — | | | | — | | | | — | | | | 217 | | | | (85 | ) | | | 132 | |
Redemption of shares from noncontrolling interests | | | 5,955 | | | | | — | | | | — | | | | — | | | | — | | | | — | | | | — | | | | 5,586 | | | | 5,586 | |
Reclassifications of noncontrolling interests | | | (5 | ) | | | | — | | | | — | | | | — | | | | — | | | | — | | | | — | | | | 5 | | | | 5 | |
Adjustments to redemption values of redeemable noncontrolling interests | | | 142 | | | | | — | | | | — | | | | — | | | | — | | | | — | | | | (142 | ) | | | — | | | | (142 | ) |
Noncontrolling interest in acquired entity | | | 1,716 | | | | | — | | | | — | | | | — | | | | — | | | | — | | | | — | | | | — | | | | — | |
Balances at December 31, 2015 | | | 8,958 | | | | | — | | | | — | | | | — | | | | — | | | | — | | | | 3,184 | | | | 12,759 | | | | 15,943 | |
Comprehensive income (loss) | | | (1,064 | ) | | | | — | | | | — | | | | — | | | | (2,760 | ) | | | (334,026 | ) | | | (13,662 | ) | | | 3,555 | | | | (346,893 | ) |
Transfers to Parent (prior to the Spin-off) | | | — | | | | | — | | | | — | | | | — | | | | — | | | | — | | | | 13,662 | | | | — | | | | 13,662 | |
Changes in equity related to the Spin-off | | | — | | | | | 28,412,054 | | | | 3 | | | | 530,559 | | | | — | | | | — | | | | (3,137 | ) | | | — | | | | 527,425 | |
Stock-based compensation expense | | | — | | | | | 1,072,987 | | | | — | | | | 7,441 | | | | — | | | | — | | | | — | | | | — | | | | 7,441 | |
Cancellation of restricted stock awards for payroll tax withholdings on vested shares | | | — | | | | | (2,991 | ) | | | — | | | | (13 | ) | | | — | | | | — | | | | — | | | | — | | | | (13 | ) |
Cash distributions to noncontrolling investors | | | (386 | ) | | | | — | | | | — | | | | — | | | | — | | | | — | | | | — | | | | (2,464 | ) | | | (2,464 | ) |
Purchases of shares from noncontrolling investors | | | (102 | ) | | | | — | | | | — | | | | — | | | | — | | | | — | | | | 19 | | | | (18 | ) | | | 1 | |
Reclassifications of noncontrolling interests | | | (609 | ) | | | | — | | | | — | | | | — | | | | — | | | | — | | | | — | | | | 609 | | | | 609 | |
Adjustments to redemption values of redeemable noncontrolling interests | | | 142 | | | | | — | | | | — | | | | (76 | ) | | | — | | | | — | | | | (66 | ) | | | — | | | | (142 | ) |
Noncontrolling interest in acquired entity | | | (132 | ) | | | | — | | | | — | | | | — | | | | — | | | | — | | | | — | | | | — | | | | — | |
Balances at December 31, 2016 | | | 6,807 | | | | | 29,482,050 | | | | 3 | | | | 537,911 | | | | (2,760 | ) | | | (334,026 | ) | | | — | | | | 14,441 | | | | 215,569 | |
Comprehensive income (loss) | | | (1,218 | ) | | | | — | | | | — | | | | — | | | | 804 | | | | (114,190 | ) | | | — | | | | 3,051 | | | | (110,335 | ) |
Changes in equity related to the Spin-off | | | — | | | | | — | | | | — | | | | 1,563 | | | | — | | | | — | | | | — | | | | — | | | | 1,563 | |
Stock-based compensation expense | | | — | | | | | 1,031,753 | | | | — | | | | 9,952 | | | | — | | | | — | | | | — | | | | — | | | | 9,952 | |
Cancellation of restricted stock awards for payroll tax withholdings on vested shares | | | — | | | | | (218,908 | ) | | | — | | | | (1,508 | ) | | | — | | | | — | | | | — | | | | — | | | | (1,508 | ) |
Cash distributions to noncontrolling investors | | | (42 | ) | | | | — | | | | — | | | | — | | | | — | | | | — | | | | — | | | | (3,809 | ) | | | (3,809 | ) |
Reclassifications of noncontrolling interests | | | (363 | ) | | | | — | | | | — | | | | — | | | | — | | | | — | | | | — | | | | 363 | | | | 363 | |
Redemption of shares from noncontrolling interests | | | (3,402 | ) | | | | — | | | | — | | | | 2,235 | | | | — | | | | — | | | | — | | | | (77 | ) | | | 2,158 | |
Adjustments to redemption values of redeemable noncontrolling interests | | | 543 | | | | | — | | | | — | | | | (543 | ) | | | — | | | | — | | | | — | | | | — | | | | (543 | ) |
Balances at December 31, 2017 | | $ | 2,325 | | | | | 30,294,895 | | | $ | 3 | | | $ | 549,610 | | | $ | (1,956 | ) | | $ | (448,216 | ) | | $ | — | | | $ | 13,969 | | | $ | 113,410 | |
See accompanying notes
F-7
QUORUM HEALTH CORPORATION
CONSOLIDATED AND COMBINED STATEMENTS OF CASH FLOWS
(In Thousands)
| | Year Ended December 31, | |
| | 2017 | | | 2016 | | | 2015 | |
| | | | | | | | | | | | |
Cash flows from operating activities: | | | | | | | | | | | | |
Net income (loss) | | $ | (112,357 | ) | | $ | (345,197 | ) | | $ | 4,735 | |
Adjustments to reconcile net income (loss) to net cash provided by (used in) operating activities: | | | | | | | | | | | | |
Depreciation and amortization | | | 82,155 | | | | 117,288 | | | | 128,001 | |
Non-cash interest expense | | | 5,770 | | | | 2,496 | | | | — | |
Provision for (benefit from) deferred income taxes | | | (22,137 | ) | | | (56,339 | ) | | | 2,542 | |
Stock-based compensation expense | | | 9,952 | | | | 7,441 | | | | — | |
Impairment of long-lived assets and goodwill | | | 47,281 | | | | 291,870 | | | | 13,000 | |
Loss (gain) on sale of hospitals, net | | | (5,243 | ) | | | 2,150 | | | | — | |
Changes in reserves for self-insurance claims, net of payments | | | 22,519 | | | | 27,994 | | | | — | |
Changes in reserves for legal, professional and settlement costs, net of payments | | | (3,651 | ) | | | 3,651 | | | | — | |
Other non-cash expense (income), net | | | 190 | | | | (575 | ) | | | 380 | |
Changes in operating assets and liabilities, net of acquisitions and divestitures: | | | | | | | | | | | | |
Patient accounts receivable, net | | | 29,091 | | | | 10,205 | | | | (16,639 | ) |
Due from and due to third-party payors, net | | | 24,201 | | | | 7,005 | | | | (18,198 | ) |
Inventories, prepaid expenses and other current assets | | | 673 | | | | 1,457 | | | | 8,000 | |
Accounts payable and accrued liabilities | | | (14,743 | ) | | | 20,760 | | | | (78,944 | ) |
Long-term assets and liabilities, net | | | 3,269 | | | | (9,120 | ) | | | 12 | |
Net cash provided by (used in) operating activities | | | 66,970 | | | | 81,086 | | | | 42,889 | |
| | | | | | | | | | | | |
Cash flows from investing activities: | | | | | | | | | | | | |
Capital expenditures for property and equipment | | | (61,530 | ) | | | (79,920 | ) | | | (59,455 | ) |
Capital expenditures for software | | | (6,898 | ) | | | (7,269 | ) | | | (8,845 | ) |
Acquisitions, net of cash acquired | | | (1,920 | ) | | | (785 | ) | | | (8,019 | ) |
Proceeds from the sale of hospitals | | | 32,081 | | | | 13,746 | | | | — | |
Proceeds from asset sales | | | — | | | | 1,082 | | | | 3,114 | |
Other investing activities | | | — | | | | — | | | | (5,387 | ) |
Net cash provided by (used in) investing activities | | | (38,267 | ) | | | (73,146 | ) | | | (78,592 | ) |
| | | | | | | | | | | | |
Cash flows from financing activities: | | | | | | | | | | | | |
Borrowings under revolving credit facilities | | | 508,000 | | | | 50,000 | | | | — | |
Repayments under revolving credit facilities | | | (508,000 | ) | | | (50,000 | ) | | | — | |
Borrowings of long-term debt | | | 376 | | | | 1,256,281 | | | | 372 | |
Repayments of long-term debt | | | (39,195 | ) | | | (15,222 | ) | | | (1,563 | ) |
Increase in Due to Parent, net | | | — | | | | 24,796 | | | | 262,775 | |
Increase (decrease) in receivables facility, net | | | — | | | | — | | | | (224,774 | ) |
Payments of debt issuance costs | | | (3,119 | ) | | | (29,146 | ) | | | — | |
Cash paid to Parent related to the Spin-off | | | — | | | | (1,217,336 | ) | | | — | |
Cancellation of restricted stock awards for payroll tax withholdings on vested shares | | | (1,508 | ) | | | (13 | ) | | | — | |
Cash distributions to noncontrolling investors | | | (3,851 | ) | | | (2,850 | ) | | | (1,623 | ) |
Purchases of shares from noncontrolling investors | | | (1,244 | ) | | | (101 | ) | | | (937 | ) |
Net cash provided by (used in) financing activities | | | (48,541 | ) | | | 16,409 | | | | 34,250 | |
| | | | | | | | | | | | |
Net change in cash and cash equivalents | | | (19,838 | ) | | | 24,349 | | | | (1,453 | ) |
Cash and cash equivalents at beginning of period | | | 25,455 | | | | 1,106 | | | | 2,559 | |
Cash and cash equivalents at end of period | | $ | 5,617 | | | $ | 25,455 | | | $ | 1,106 | |
| | | | | | | | | | | | |
Supplemental cash flow information: | | | | | | | | | | | | |
Interest payments, net | | $ | 125,775 | | | $ | 90,909 | | | $ | 98,290 | |
Income tax payments, net (after the Spin-off) | | | 196 | | | | — | | | | — | |
Non-cash purchases of property and equipment under capital lease obligations | | | 54 | | | | 6,579 | | | | 15,448 | |
See accompanying notes
F-8
QUORUM HEALTH CORPORATION
NOTES TO CONSOLIDATED AND COMBINED FINANCIAL STATEMENTS
NOTE 1 — DESCRIPTION OF THE BUSINESS AND THE SPIN-OFF
Description of the Business
The principal business of Quorum Health Corporation, a Delaware corporation, and its subsidiaries (collectively, “QHC” or the “Company”) is to provide hospital and outpatient healthcare services in its markets across the United States. As of December 31, 2017, the Company owned or leased a diversified portfolio of 31 hospitals in rural and mid-sized markets, which are located in 15 states and have a total of 2,979 licensed beds. The Company provides outpatient healthcare services through its hospitals and their affiliated facilities, including urgent care centers, diagnostic and imaging centers, physician clinics and surgery centers. The Company’s wholly-owned subsidiary, Quorum Health Resources, LLC (“QHR”), provides hospital management advisory and healthcare consulting services to non-affiliated hospitals located throughout the United States. Over 95% of the Company’s net operating revenues for each of the years ended December 31, 2017, 2016 and 2015 are attributable to its hospital operations business.
Description of the Spin-off
On April 29, 2016, Community Health Systems, Inc. (“CHS”, or “Parent” when referring to the carve-out period prior to April 29, 2016) completed the spin-off of 38 hospitals, including their affiliated facilities, and QHR to form Quorum Health Corporation through the distribution of 100% of the common stock of QHC, issued at a par value of $0.0001 per share, to CHS stockholders of record as of the close of business on April 22, 2016 (the “Record Date”) and cash proceeds to CHS of $1.2 billion (the “Spin-off”). Each CHS stockholder received a distribution of one share of QHC common stock for every four shares of CHS common stock held as of the Record Date plus cash in lieu of fractional shares. Quorum Health Corporation began trading on the New York Stock Exchange (“NYSE”) under the ticker symbol “QHC” on May 2, 2016.
In connection with the Spin-off, QHC issued $400 million in aggregate principal amount of 11.625% Senior Notes due 2023 (the “Senior Notes”) on April 22, 2016, pursuant to an indenture (the “Indenture”) by and between the Company and Regions Bank, as Trustee. The Senior Notes were issued at a discount of $6.9 million, or 1.734%. The gross offering proceeds of the Senior Notes were deposited into a segregated escrow account at the closing of the offering on April 22, 2016. On April 29, 2016, the Company entered into a credit agreement (the “Senior Credit Facility”) consisting of an $880 million senior secured term loan facility (the “Term Loan Facility”), which was issued at 98% of par value, or a discount of $17.6 million, and a $100 million senior secured revolving credit facility (the “Revolving Credit Facility”). In addition, the Company entered into a $125 million senior secured asset-based revolving credit facility (the “ABL Credit Facility”) on April 29, 2016. The net offering proceeds of the Senior Notes were released to QHC from the escrow account on April 29, 2016. The net offering proceeds of the Senior Notes, together with the net borrowings under the Term Loan Facility, were used to pay $1.2 billion of the cash proceeds to CHS, as mentioned above, and to pay the Company’s fees and expenses related to the Spin-off. The cash proceeds paid to CHS were characterized as a one-time, tax-free cash distribution.
In connection with the Spin-off, QHC and CHS entered into a Separation and Distribution Agreement, a Tax Matters Agreement and an Employee Matters Agreement on April 29, 2016, which, collectively, governed or continue to govern the allocation of employees, assets and liabilities that were transferred to QHC from CHS, including but not limited to investments, working capital, property and equipment, employee benefits and deferred tax assets and liabilities. In addition, QHC and CHS entered into various transition services agreements and other ancillary agreements that govern certain relationships and activities of QHC and CHS for five years following the Spin-off. See Note 18 — Related Party Transactions for additional information on the agreements that exist between QHC and CHS after the Spin-off.
In connection with the Spin-off, CHS contributed $530.6 million of additional paid-in capital to QHC and made a $13.5 million cash contribution to QHC, pursuant to the Separation and Distribution Agreement. This contribution consisted of $20.0 million of cash contributed to fund a portion of QHC’s initial working capital, reduced by $6.5 million for the difference in estimated and actual financing transaction fees related to the Spin-off.
F-9
QUORUM HEALTH CORPORATION
NOTES TO CONSOLIDATED AND COMBINED FINANCIAL STATEMENTS (CONTINUED)
The following table provides a summary of the major transactions to effect the Spin-off of QHC as a newly formed, independent company (dollars in thousands):
| | | | | | | | | | | | | | | | | | | Additional | | | | | |
| | Long-Term | | | Due to | | | | Common Stock | | | Paid-in | | | Parent's | |
| | Debt | | | Parent, Net | | | | Shares | | | Amount | | | Capital | | | Equity | |
| | | | | | | | | | | | | | | | | | | | | | | | | |
Balances at April 29, 2016 (prior to the Spin-off) | | $ | 24,179 | | | $ | 1,813,836 | | | | | — | | | $ | — | | | $ | — | | | $ | 3,137 | |
Borrowings of long-term debt, net of debt issuance discounts | | | 1,255,464 | | | | — | | | | | — | | | | — | | | | — | | | | — | |
Payments of debt issuance costs | | | (29,146 | ) | | | — | | | | | — | | | | — | | | | — | | | | — | |
Cash proceeds paid to Parent | | | — | | | | (1,217,336 | ) | | | | — | | | | — | | | | — | | | | — | |
Transfer of liabilities from Parent | | | — | | | | (22,292 | ) | | | | — | | | | — | | | | — | | | | — | |
Net deferred income tax liability resulting from the Spin-off | | | — | | | | (46,783 | ) | | | | — | | | | — | | | | — | | | | — | |
Non-cash capital contribution from Parent | | | — | | | | (527,425 | ) | | | | — | | | | — | | | | 530,562 | | | | (3,137 | ) |
Distribution of common stock | | | — | | | | — | | | | | 27,719,645 | | | | 3 | | | | (3 | ) | | | — | |
Distribution of restricted stock awards | | | — | | | | — | | | | | 692,409 | | | | — | | | | — | | | | — | |
Balances at April 29, 2016 (after the Spin-off) | | $ | 1,250,497 | | | $ | — | | | | | 28,412,054 | | | $ | 3 | | | $ | 530,559 | | | $ | — | |
NOTE 2 — BASIS OF PRESENTATION AND SIGNIFICANT ACCOUNTING POLICIES
Basis of Presentation
The consolidated and combined financial statements and accompanying notes of the Company presented herein have been prepared in accordance with accounting principles generally accepted in the United States of America (“U.S. GAAP” or “GAAP”). In the opinion of the Company’s management, the consolidated and combined financial information presented herein includes all adjustments necessary to present fairly the results of operations, financial position and cash flows of the Company for the periods presented.
Prior to its separation from CHS on April 29, 2016, QHC did not operate as a separate company and stand-alone financial statements were not historically prepared; however, QHC was comprised of certain stand-alone legal entities for which discrete financial information was available under CHS’ ownership. The accompanying consolidated and combined financial statements include amounts and disclosures for QHC that have been derived from the consolidated financial statements and accounting records of CHS for the periods prior to the Spin-off in combination with the amounts and disclosures related to the stand-alone financial statements and accounting records of QHC after the Spin-off. The accompanying consolidated and combined financial statements may not necessarily be indicative of the results of operations, financial position and cash flows of QHC in the future or those that would have occurred had the Company operated on a stand-alone basis during the entirety of the periods presented herein. See Note 18 — Related Party Transactions for additional information on the carve-out of financial information from CHS.
Principles of Consolidation and Combination
The consolidated and combined financial statements include the accounts of the Company and its subsidiaries in which it holds either a direct or indirect ownership of a majority voting interest. Investments in less-than-wholly-owned consolidated subsidiaries of QHC are presented separately in the equity component of the Company’s consolidated balance sheets to distinguish between the interests of QHC and the interests of the noncontrolling investors. Revenues and expenses from these subsidiaries are included in the respective individual line items of the Company’s consolidated and combined statements of income, and net income is presented both in total and separately to distinguish the amounts attributable to the Company and the amounts attributable to the interests of the noncontrolling investors. Noncontrolling interests that are redeemable, or may become redeemable at a fixed or determinable price at the option of the holder or upon the occurrence of an event outside of the control of the Company, are presented in mezzanine equity in the consolidated balance sheets.
Intercompany transactions and accounts of the Company are eliminated in consolidation. Additionally, all significant transactions with CHS that occurred prior to the Spin-off have been included in the consolidated balance sheets within Due to Parent, net. This liability to CHS was settled in the Spin-off.
F-10
QUORUM HEALTH CORPORATION
NOTES TO CONSOLIDATED AND COMBINED FINANCIAL STATEMENTS (CONTINUED)
Use of Estimates
The preparation of financial statements in conformity with U.S. GAAP requires management to make estimates and assumptions that affect the amounts reported in the consolidated and combined financial statements and accompanying notes. Actual results could differ from those estimates under different assumptions or conditions.
Reclassifications and Immaterial Restatements
Certain revisions have been made to the prior period balances as follows:
Beginning in 2017, the Company has reclassified and separately presented on the consolidated and combined statements of cash flows the borrowings and repayments of the revolving credit facilities. Both items are included in cash flows from financing activities. This restatement of the consolidated and combined statement of cash flows as of December 31, 2016 was considered immaterial and had no effect on the Company’s results of operations or financial position as of December 31, 2016.
Beginning in 2017, the Company reclassified and separately presented in the notes to the consolidated and combined financial statements the components of deferred income tax assets and liabilities based on their type of asset and liability. Previously, deferred tax assets and liabilities were classified as either other current or other long-term assets or liabilities. The Company believes the current presentation helps distinguish the types of deferred tax assets and liabilities.
Revenues and Accounts Receivable
Revenue Recognition
The Company recognizes revenues from patient services at its hospitals and affiliated facilities in the period services are performed and reports these revenues at the net realizable amount expected to be collected from patients and third-party payors. Billings and collections are outsourced to CHS under the transition services agreements that were entered into by CHS in connection with the Spin-off. See Note 18 — Related Party Transactions for additional information on these agreements.
The amounts that are collected for patient services are generally less than established billing rates, or standard billing charges, due to contractual agreements with third-party payors, governmental programs that require reduced billing rates, discounts offered as incentives for payment, and a portion related to bad debts. The Company recognizes revenues related to its QHR business when management advisory and consulting services are provided and reports these revenues at the net realizable amount expected to be collected from the non-affiliated hospital clients of the Company’s QHR business.
The following table provides a summary of the components of net operating revenues, before the provision for bad debts (in thousands):
| | Year Ended December 31, | |
| | 2017 | | | 2016 | | | 2015 | |
| | | | | | | | | | | | |
Operating revenues | | $ | 11,930,145 | | | $ | 12,104,580 | | | $ | 11,613,826 | |
Less: Contractual allowances | | | (9,173,711 | ) | | | (9,247,789 | ) | | | (8,795,674 | ) |
Less: Discounts | | | (428,779 | ) | | | (437,738 | ) | | | (372,294 | ) |
Total net operating revenues, before the provision for bad debts | | $ | 2,327,655 | | | $ | 2,419,053 | | | $ | 2,445,858 | |
During the fourth quarter of 2017, the Company analyzed self-pay patient accounts receivable at a more comprehensive and disaggregated level and refined its estimate of the collectability of the portion of self-pay accounts receivable related to insured patients, primarily co-pays and deductibles. The Company’s analysis also included an evaluation of patient accounts receivable retained in the divestitures of six of the Company’s seven divested hospitals. As a result of these efforts, the Company recorded a change in estimate of $21.0 million to reduce the net realizable value of patient accounts receivable, which negatively impacted the provision for bad debts in the consolidated and combined statement of income for the year ended December 31, 2017.
As of December 31, 2016, the Company recorded a change in estimate of $11.4 million to reduce the net realizable value of patient accounts receivable, which negatively impacted the provision for bad debts in the statement of income for the year ended December 31, 2016. This change in estimate related to an assessment of the collectability of managed care and commercial accounts receivable aged greater than one year based on the Company’s review of historical cash collections for these accounts.
Payor Sources
The primary sources of payment for patient healthcare services are third-party payors, including federal and state agencies administering the Medicare and Medicaid programs, other governmental agencies, managed care health plans, commercial insurance companies, workers’ compensation carriers and employers. Self-pay revenues are the portion of patient service revenues derived from
F-11
QUORUM HEALTH CORPORATION
NOTES TO CONSOLIDATED AND COMBINED FINANCIAL STATEMENTS (CONTINUED)
patients who do not have health insurance coverage and the patient responsibility portion of services that are not covered by health insurance plans. Non-patient revenues primarily include revenues from QHR’s hospital management advisory and consulting services business, rental income and hospital cafeteria sales.
The following table provides a summary of net operating revenues, before the provision for bad debts, by payor source (dollars in thousands):
| | Year Ended December 31, | |
| | 2017 | | | 2016 | | | 2015 | |
| | $ Amount | | | % of Total | | | $ Amount | | | % of Total | | | $ Amount | | | % of Total | |
| | | | | | | | | | | | | | | | | | | | | | | | |
Medicare | | $ | 656,843 | | | | 28.2 | % | | $ | 673,074 | | | | 27.8 | % | | $ | 656,799 | | | | 26.9 | % |
Medicaid | | | 425,943 | | | | 18.3 | % | | | 446,273 | | | | 18.4 | % | | | 443,479 | | | | 18.1 | % |
Managed care and commercial plans | | | 921,503 | | | | 39.6 | % | | | 952,535 | | | | 39.4 | % | | | 984,480 | | | | 40.3 | % |
Self-pay | | | 226,043 | | | | 9.7 | % | | | 242,095 | | | | 10.1 | % | | | 247,234 | | | | 10.0 | % |
Non-patient | | | 97,323 | | | | 4.2 | % | | | 105,076 | | | | 4.3 | % | | | 113,866 | | | | 4.7 | % |
Total net operating revenues, before the provision for bad debts | | $ | 2,327,655 | | | | 100.0 | % | | $ | 2,419,053 | | | | 100.0 | % | | $ | 2,445,858 | | | | 100.0 | % |
The table above includes an $11.4 million change in estimate the Company recorded as of December 31, 2016 to reduce the net realizable value of patient accounts receivable due to increasing delays associated with collections on accounts receivable under the Illinois Medicaid program. This change in estimate impacted contractual allowances associated with Medicaid revenues.
For the years ended December 31, 2017, 2016 and 2015, Medicare revenues related to Medicare Advantage Programs were $186.7 million, $170.4 million and $146.9 million, respectively.
Contractual Allowances and Discounts
The net realizable amount of patient service revenues due from third-party payors is subject to complexities and interpretations of payor-specific contractual agreements and governmental regulations that are frequently changing. The Medicare and Medicaid programs, which represent a large portion of the Company’s operating revenues, are highly complex programs to administer and are subject to interpretation of federal and state-specific reimbursement rates, new legislation and final cost report settlements. Contractual allowances, or differences in standard billing rates and the payments derived from contractual terms with governmental and non-governmental third-party payors, are recorded based on management’s best estimates in the period in which services are performed and a payment methodology is established with the patient. Recorded estimates for past contractual allowances are subject to change, in large part, due to ongoing contract negotiations and regulation changes, which are typical in the U.S. healthcare industry. Revisions to estimates are recorded as contractual allowance adjustments in the periods in which they become known and may be subject to further revisions. Billing and collections are outsourced to CHS under the transition services agreements that were put in place by CHS in connection with the Spin-off. The Company’s contractual allowances are impacted by the timing and ability of CHS to monitor the classification and collection of our patient accounts receivable. Self-pay and other payor discounts are incentives offered to uninsured or underinsured payors to reduce their costs of healthcare services.
Third-Party Program Reimbursements
Cost report settlements under reimbursement programs with Medicare, Medicaid and other managed care plans are estimated and recorded in the period the related services are performed and are adjusted in future periods, as needed, until the final cost report settlements are determined. Previous program reimbursements and final cost report settlements are included in due from and due to third-party payors in the consolidated balance sheets. During the years ended December 31, 2017, 2016 and 2015, contractual allowance adjustments related to previous program reimbursements and final cost report settlements favorably (unfavorably) impacted net operating revenues by $2.0 million, $(5.8) million and $(15.1) million, respectively. The 2015 amount included the unfavorable impact of an $11.1 million Illinois cost report settlement in 2014 that was reversed in the second quarter of 2015 due to contract negotiations that were finalized in that quarter. Exclusive of this adjustment, net operating revenues were unfavorably impacted by $4.0 million in the year ended December 31, 2015 for all other contractual allowance adjustments related to previous program reimbursements and final cost report settlements.
Currently, several states utilize supplemental payment programs, including disproportionate share programs, for the purpose of providing reimbursement to providers to offset a portion of the cost of providing care to Medicaid and indigent patients. These programs are designed with input from CMS and are funded with a combination of federal and state resources, including, in certain instances, taxes, fees or other program expenses (collectively, “provider taxes”) levied on the providers. The receivables and payables associated with these programs are included in due from and due to third-party payors in the consolidated balance sheets.
F-12
QUORUM HEALTH CORPORATION
NOTES TO CONSOLIDATED AND COMBINED FINANCIAL STATEMENTS (CONTINUED)
The following table provides a summary of the components of amounts due from and due to third-party payors, as presented in the consolidated balance sheets (in thousands):
| | December 31, | |
| | 2017 | | | 2016 | |
| | | | | | | | |
Amounts due from third-party payors: | | | | | | | | |
Previous program reimbursements and final cost report settlements | | $ | 17,383 | | | $ | 23,876 | |
State supplemental payment programs | | | 79,819 | | | | 92,359 | |
Total amounts due from third-party payors | | $ | 97,202 | | | $ | 116,235 | |
| | | | | | | | |
Amounts due to third-party payors: | | | | | | | | |
Previous program reimbursements and final cost report settlements | | $ | 33,163 | | | $ | 33,366 | |
State supplemental payment programs | | | 14,542 | | | | 9,171 | |
Total amounts due to third-party payors | | $ | 47,705 | | | $ | 42,537 | |
After a state supplemental payment program is approved and fully authorized by the appropriate state legislative or governmental agency, the Company recognizes the revenues and related expenses based on the terms of each program in the period in which amounts are estimable and revenue collection is reasonably assured. The revenues earned by the Company under these programs are included in net operating revenues and the expenses associated with these programs are included in other operating expenses in the consolidated and combined statements of income.
The following table provides a summary of the portion of Medicaid reimbursements included in the consolidated and combined statements of income that are attributable to state supplemental payment programs (in thousands):
| | Year Ended December 31, | |
| | 2017 | | | 2016 | | | 2015 | |
| | | | | | | | | | | | |
Medicaid revenues | | $ | 211,448 | | | $ | 220,389 | | | $ | 211,696 | |
Provider taxes and other expenses | | | 75,388 | | | | 76,616 | | | | 75,929 | |
Reimbursements attributable to state supplemental payment programs, net of expenses | | $ | 136,060 | | | $ | 143,773 | | | $ | 135,767 | |
The California Department of Health Care Services implemented the HQAF Program, imposing a fee on certain general and acute care California hospitals. Revenues generated from these fees provide funding for the non-federal supplemental payments to California hospitals that serve California’s Medi-Cal and uninsured patients. Under Phase IV of the program, covering the period from January 2014 through December 2016, and Phase V of the program, covering the period from January 2017 through June 2019, the Company recognized $22.0 million, $34.4 million and $31.5 million of operating revenues, net of provider taxes, for the years ended December 31, 2017, 2016 and 2015, respectively.
Charity Care
In the ordinary course of business, the Company provides services to patients who are financially unable to pay for hospital care. The related charges for those patients who are financially unable to pay that otherwise do not qualify for reimbursement from a governmental program are classified as charity care. The Company determines amounts that qualify for charity care primarily based on the patient’s household income relative to the poverty level guidelines established by the federal government. The Company’s policy is to not pursue collections for such amounts; therefore, the related charges are recorded in operating revenues at the standard billing rates and fully offset in contractual allowances. The Company’s gross amounts of charity care revenues were $34.0 million, $34.6 million and $30.4 million for the years ended December 31, 2017, 2016 and 2015, respectively.
The Company estimates the cost of providing charity care services utilizing a ratio of cost to gross charges and applying this ratio to the gross charges associated with providing care to charity patients for the period. The estimated costs of providing charity care services was $5.6 million, $5.7 million and $5.0 million for the years ended December 31, 2017, 2106 and 2015, respectively. To the extent the Company receives reimbursement from any of the various governmental assistance programs to subsidize its care of indigent patients, the Company excludes the charges for such patients from the cost of care provided under its charity care program.
Accounts Receivable and Allowance for Doubtful Accounts
Substantially all of the Company’s receivables are related to providing healthcare services to patients at its hospitals and affiliated outpatient facilities.
F-13
QUORUM HEALTH CORPORATION
NOTES TO CONSOLIDATED AND COMBINED FINANCIAL STATEMENTS (CONTINUED)
The following table provides a summary of the components of patient accounts receivable before contractual allowances, discounts and allowance for doubtful accounts (dollars in thousands):
| | December 31, | |
| | 2017 | | | 2016 | |
| | $ Amount | | | % of Total | | | $ Amount | | | % of Total | |
| | | | | | | | | | | | | | | | |
Third-parties | | $ | 1,796,852 | | | | 75.1 | % | | $ | 1,930,103 | | | | 74.6 | % |
Self-pay | | | 596,863 | | | | 24.9 | % | | | 656,373 | | | | 25.4 | % |
Total patient accounts receivable, gross | | $ | 2,393,715 | | | | 100.0 | % | | $ | 2,586,476 | | | | 100.0 | % |
Accounts receivable are reduced by an allowance for amounts that could become uncollectible in the future. Receivables from third-parties include the non-self-pay receivables due to the Company from providers of governmental and non-governmental programs and plans. For insured receivables, the Company estimates the allowance for doubtful accounts based on a model that considers the uncontractualized portion of all accounts aging over 365 days from the date of patient discharge, reduced by an estimate of recoveries. For self-pay receivables, the Company estimates the allowance for doubtful accounts by reserving a percentage of all self-pay accounts receivable without regard to aging category. The allowance percentage is based on a model that considers historical write-off activity and is adjusted for expected recoveries and any anticipated changes in trends. The Company’s ability to estimate the allowance for doubtful accounts is not significantly impacted by the aging of accounts receivable, as management believes that substantially all of the risk exists at the point in time such accounts are identified as self-pay.
Collections are impacted by the economic ability of patients to pay, the effectiveness of CHS’ billing and collection efforts, including their current policies on collections, and the ability of the Company to further attempt collection efforts. Billings and collections are outsourced to CHS under the transition services agreements that were established with the Spin-off. See Note 18 — Related Party Transactions for additional information on these agreements. Significant changes in payor mix, CHS’s business office operations, including the CHS shared services centers’ efforts in collecting the Company’s accounts receivables, economic conditions, or trends in federal and state governmental healthcare coverage, among others, could affect the Company’s estimates of accounts receivable collectability. The Company also continually reviews its overall allowance adequacy by monitoring historical cash collections as a percentage of trailing net operating revenues after the provision for bad debts, as well as by analyzing current period net operating revenues and admissions by payor classification, aged accounts receivable by payor, days revenue outstanding, the composition of self-pay receivables between pure self-pay patients and the patient responsibility portion of third-party insured receivables, and the impact of recent divestitures.
The following table provides a summary of the changes in the allowance for doubtful accounts (in thousands):
| | December 31, | |
| | 2017 | | | 2016 | | | 2015 | |
| | | | | | | | | | | | |
Balance at beginning of period | | $ | 360,796 | | | $ | 346,507 | | | $ | 341,527 | |
Provision for bad debts | | | 255,485 | | | | 280,586 | | | | 258,520 | |
Amounts written off, net of recoveries | | | (263,772 | ) | | | (266,297 | ) | | | (253,540 | ) |
Balance at end of period | | $ | 352,509 | | | $ | 360,796 | | | $ | 346,507 | |
During the fourth quarter of 2017, the Company analyzed self-pay patient accounts receivable at a more comprehensive and disaggregated level and refined its estimate of the collectability of the portion of self-pay accounts receivable related to insured patients, primarily co-payments and deductibles. The Company’s analysis also included an evaluation of patient accounts receivable retained in the divestitures of six of the Company’s seven divested hospitals. As a result of these efforts, the Company recorded a change in estimate of $21.0 million to reduce the net realizable value of patient accounts receivable, which negatively impacted the provision for bad debts in the consolidated and combined statement of income for the year ended December 31, 2017.
As of December 31, 2016, the Company recorded a change in estimate of $11.4 million to reduce the net realizable value of patient accounts receivable, which negatively impacted the provision for bad debts in the consolidated and combined statement of income for the year ended December 31, 2016. This change in estimate related to the Company’s assessment of the collectability of managed care and commercial accounts receivable aged greater than one year based on the Company’s review of historical cash collections for these accounts.
Concentration of Credit Risk
The Company grants unsecured credit to its patients, most of whom reside in the service area of the Company’s hospitals and affiliated facilities and are insured under third-party payor agreements. Because of the economic diversity of the Company’s markets
F-14
QUORUM HEALTH CORPORATION
NOTES TO CONSOLIDATED AND COMBINED FINANCIAL STATEMENTS (CONTINUED)
and non-governmental third-party payors, Medicare receivables are a significant concentration of credit risk. Accounts receivable, net of contractual allowances, from Medicare were $70.4 million and $72.6 million, or 10.0% and 9.8% of total patient accounts receivable, net as of December 31, 2017 and 2016, respectively. Additionally, the Company believes Illinois Medicaid represents a concentration of credit risk to the Company due to the fiscal problems in the state of Illinois that affect the timing and extent of payments due to providers which are administered by the state of Illinois under the Medicaid program. The Company’s accounts receivable, net of contractual allowances, from Illinois Medicaid were $29.6 million and $34.8 million, or 4.2% and 4.7% of total patient accounts receivable, net as of December 31, 2017 and 2016, respectively. The Company’s state supplemental program receivables from Illinois Medicaid were $22.9 million and $16.6 million, or 23.5% and 14.3% of total due from third-party payors, as of December 31, 2017 and 2016, respectively. The Company’s state supplemental program receivables from California Medicaid were $48.4 million and $66.2 million, or 49.8% and 57.0% of total due from third-party payors, as of December 31, 2017 and 2016, respectively.
The Company’s revenues are particularly sensitive to regulatory and economic changes in certain states where the Company generates significant revenues. Accordingly, any changes in the current demographic, economic, competitive or regulatory conditions in certain states in which revenues are significant could have an adverse effect on the Company’s results of operations, financial condition or cash flows. Changes to the Medicaid and other government-managed payor programs in these states, including reductions in reimbursement rates or delays in reimbursement payments under state supplemental payment or other programs, could also have a similar adverse effect.
The following table provides a summary of the states in which the Company generates more than 5% of total net patient revenues, before the provision for bad debts, as determined in each year (dollars in thousands):
| | Number of | | Year Ended December 31, | |
| | Hospitals at | | 2017 | | | 2016 | | | 2015 | |
| | December 31, 2017 | | $ Amount | | | % of Total | | | $ Amount | | | % of Total | | | $ Amount | | | % of Total | |
| | | | | | | | | | | | | | | | | | | | | | | | | | |
Illinois | | 9 | | $ | 829,473 | | | | 37.2 | % | | $ | 811,565 | | | | 35.1 | % | | $ | 822,501 | | | | 35.3 | % |
Oregon | | 1 | | | 218,653 | | | | 9.8 | % | | | 210,818 | | | | 9.1 | % | | | 201,610 | | | | 8.6 | % |
California | | 2 | | | 195,725 | | | | 8.8 | % | | | 199,743 | | | | 8.6 | % | | | 209,500 | | | | 9.0 | % |
Georgia | | 2 | | | 148,353 | | | | 6.7 | % | | | 216,745 | | | | 9.4 | % | | | 224,330 | | | | 9.6 | % |
Kentucky | | 3 | | | 124,317 | | | | 5.6 | % | | | 121,988 | | | | 5.3 | % | | | 131,077 | | | | 5.6 | % |
Other Operating Expenses
The following table provides a summary of the major components of other operating expenses (in thousands):
| | Year Ended December 31, | |
| | 2017 | | | 2016 | | | 2015 | |
| | | | | | | | | | | | |
Purchased services | | $ | 168,711 | | | $ | 180,672 | | | $ | 176,758 | |
Taxes and insurance | | | 131,734 | | | | 129,775 | | | | 124,635 | |
Medical specialist fees | | | 111,840 | | | | 106,803 | | | | 85,042 | |
Transition services agreements and allocations from Parent | | | 63,470 | | | | 66,441 | | | | 60,166 | |
Repairs and maintenance | | | 41,048 | | | | 42,986 | | | | 45,945 | |
Utilities | | | 27,324 | | | | 29,833 | | | | 29,856 | |
Management fees from Parent | | | — | | | | 11,792 | | | | 36,466 | |
Other miscellaneous operating expenses | | | 78,936 | | | | 77,500 | | | | 75,365 | |
Total other operating expenses | | $ | 623,063 | | | $ | 645,802 | | | $ | 634,233 | |
Following the Spin-off, the Company began recording costs associated with the transition services agreements and other ancillary agreements with CHS in accordance with the terms of these agreements. These costs, which primarily include the costs of providing information technology, patient billing and collections and payroll services, are included in “Transition services agreements and allocations from Parent” in the table above. Amounts allocated to the Company by CHS for periods prior to the Spin-off are also included in “Transition services agreements and allocations from Parent” in the table above.
F-15
QUORUM HEALTH CORPORATION
NOTES TO CONSOLIDATED AND COMBINED FINANCIAL STATEMENTS (CONTINUED)
Prior to the Spin-off, QHC recorded a monthly corporate management fee from CHS that represented a portion of CHS’ corporate office costs, and this fee was included in other operating expenses. Following the Spin-off, the costs for corporate office functions are primarily included in salaries and benefits expenses in the consolidated and combined statements of income.
See Note 18 — Related Party Transactions for additional information on the allocated costs from CHS.
General and Administrative Costs
Substantially all of the Company’s operating costs and expenses are “cost of revenues” items. Operating expenses that could be classified as general and administrative by the Company are costs related to corporate office functions, including, but not limited to tax, treasury, audit, risk management, legal, investor relations and human resources. These costs are primarily salaries and benefits expenses associated with these corporate office functions. General and administrative costs of the Company were $52.7 million, $55.2 million and $43.5 million during the years ended December 31, 2017, 2016 and 2015, respectively. Prior to the Spin-off, the majority of these costs were allocations from CHS. See Note 18 — Related Party Transactions for additional information on the allocated costs from CHS.
Electronic Health Records Incentives Earned
Pursuant to the Health Information Technology for Economic and Clinical Health Act (“HITECH”) and other laws, HHS has established Medicare and Medicaid incentive programs to encourage adoption of Electronic Health Records (“EHR”) technology. The Company is eligible to receive incentive payments under these programs for its eligible hospitals and physician clinics that demonstrate meaningful use of certified EHR technology. EHR incentive payments paid to the Company are subject to audit and potential recoupment if it is determined that the applicable meaningful use standards were not met. EHR incentive payments are also subject to retrospective adjustment because the cost report data upon which the incentive payments are based are further subject to audit.
The Company utilizes a gain contingency model to recognize EHR incentive payments. When the recognition criteria have been fully met, the Company recognizes the income from EHR incentives payments as a part of operating costs and expenses in the consolidated and combined statements of income. Medicaid EHR incentive payments are calculated based on prior period Medicare cost report information available at the time when eligible hospitals demonstrate meaningful use of certified EHR technology. Medicare EHR incentive payments are calculated when eligible hospitals demonstrate meaningful use of certified EHR technology and the information for the applicable full Medicare cost report year used to determine the final incentive payment is available. In some instances, the Company may receive estimated Medicare EHR incentive payments prior to when the Medicare cost report information used to determine the final incentive payment is available. In these instances, recognition of the income from EHR incentive payments is deferred until all recognition criteria are met. The Company recognizes receivables for EHR incentive payments that have been earned, but are uncollected at period end, as other current assets in the consolidated balance sheets. The receivables are adjusted for any known audit or retrospective adjustments related to prior periods. Deferred revenue from EHR incentive payments is recorded in other current liabilities in the consolidated balance sheets.
The Company incurs both capital expenditures and operating expenses in connection with the implementation of EHR technology initiatives. The amounts and timing of these expenditures does not directly correlate with the timing of the Company’s receipt or recognition of EHR incentive payments as earned. As the Company completes its full implementation of certified EHR technology in accordance with all three phases of the program, its EHR incentive payments will decline and ultimately end.
F-16
QUORUM HEALTH CORPORATION
NOTES TO CONSOLIDATED AND COMBINED FINANCIAL STATEMENTS (CONTINUED)
The following table provides a summary of activity related to EHR incentives (in thousands):
| | Year Ended December 31, | |
| | 2017 | | | 2016 | | | 2015 | |
| | | | | | | | | | | | |
Electronic health records incentives receivable at beginning of period | | $ | 4,189 | | | $ | 11,227 | | | $ | 12,204 | |
Electronic health records incentives earned | | | 4,489 | | | | 7,843 | | | | 11,428 | |
Cash incentive payments received | | | (5,796 | ) | | | (13,808 | ) | | | (10,084 | ) |
Adjustments to receivable based on final cost report settlement or audit | | | (1,103 | ) | | | (1,073 | ) | | | (2,321 | ) |
Electronic health records incentives receivable at end of period | | $ | 1,779 | | | $ | 4,189 | | | $ | 11,227 | |
| | | | | | | | | | | | |
Deferred revenue related to electronic health records incentives at beginning of period | | $ | — | | | $ | — | | | $ | (14,351 | ) |
Cash received and deferred during period | | | (256 | ) | | | (3,639 | ) | | | — | |
Recognition of deferred incentives as earned | | | 256 | | | | 3,639 | | | | 14,351 | |
Deferred revenue related to electronic health records incentives at end of period | | $ | — | | | $ | — | | | $ | — | |
| | | | | | | | | | | | |
Total electronic health records incentives earned during period | | $ | 4,745 | | | $ | 11,482 | | | $ | 25,779 | |
Total cash incentive payments received during period | | | 6,052 | | | | 17,447 | | | | 10,084 | |
Legal, Professional and Settlement Costs
Legal, professional and settlement costs in the consolidated and combined statements of income primarily include legal costs and related settlements, if any, associated with regulatory claims, government investigations into reimbursement payments, claims associated with QHR’s hospital management contracts and professional costs of projects approved by the Company’s Board of Directors (the “Board”).
Loss (Gain) on Sale of Hospitals, Net
Loss (gain) on sale of hospitals, net is the loss (gain) incurred by the Company’s divestiture of hospitals and their related outpatient facilities. It is calculated as the difference between the cash proceeds from the sale and the carrying values of the associated net assets sold at the date of sale, less certain incremental direct selling costs.
Transaction Costs Related to the Spin-off
Transaction costs related to the Spin-off consists of QHC’s portion of the costs to effect the Spin-off and the costs associated with forming a new company. These costs include audit, management advisory and consulting costs, investment advisory costs, legal expenses and other miscellaneous costs.
Income Taxes
The Company accounts for income taxes using the asset and liability method. Under this method, deferred tax assets and liabilities are recognized for the future tax consequences attributable to differences between the financial statement carrying values of existing assets and liabilities and their respective tax bases. Deferred tax assets and liabilities are measured using enacted tax rates expected to apply to taxable income in the years in which those temporary differences are expected to be recovered or settled. The effect on deferred tax assets and liabilities of a change in tax rates is recognized in the provision for (benefit from) income taxes in the consolidated and combined statements of income in the period that includes the enactment date. The Company assesses the likelihood that deferred tax assets will be recovered from future taxable income. To the extent the Company believes that recovery is not likely, a valuation allowance is established. To the extent the Company establishes a valuation allowance or increases this allowance, the related expense is included in the provision for (benefit from) income taxes in the consolidated and combined statements of income. The Company classifies interest and penalties, if any, related to its tax positions as a component of provision for (benefit from) income taxes. See Note 12 — Income Taxes for information on the separate return method of accounting for income taxes that was used by the Company during the carve-out period.
Comprehensive Income (Loss)
The Company’s other comprehensive income (loss) consists of pension costs related to the Company’s defined benefit pension plan at one of its hospitals and the Company’s supplemental employee retirement plan.
F-17
QUORUM HEALTH CORPORATION
NOTES TO CONSOLIDATED AND COMBINED FINANCIAL STATEMENTS (CONTINUED)
Cash and Cash Equivalents
Cash includes cash on hand and cash with banks. Cash equivalents are short-term, highly liquid investments with a maturity of three months or less from the date acquired that are subject to an insignificant risk of change in value.
Inventories
Inventories, primarily consisting of medical supplies and drugs, are stated at the lower of cost or market on a first-in, first-out basis.
Other Current Assets
Other current assets consists of the current portion of the receivables from CHS related to professional and general liability and workers’ compensation liability insurance reserves that were indemnified by CHS in connection with the Spin-off, non-patient accounts receivable primarily related to QHR, receivables related to electronic health records incentives and other miscellaneous current assets.
Property and Equipment
Purchases of property and equipment are recorded at cost. Property and equipment acquired in a business combination are recorded at estimated fair value. Routine maintenance and repairs are expensed as incurred. Expenditures that increase capacities or extend useful lives are capitalized. The Company capitalizes interest related to financing of major capital additions with the respective asset. Depreciation is recognized using the straight-line method over the estimated useful life of an asset. The Company depreciates land improvements over 3 to 20 years, buildings and improvements over 5 to 40 years, and equipment and fixtures over 3 to 18 years. The Company also leases certain facilities and equipment under capital lease obligations. These assets are amortized on a straight-line basis over the lesser of the lease term or the remaining useful life of the asset. Property and equipment assets that are held for sale are not depreciated.
Goodwill
The Company’s hospital operations and QHR’s management advisory and healthcare consulting services operations meet the criteria for classification as separate reporting units for goodwill. Goodwill was initially determined for QHC’s hospital operations reporting unit based on a relative fair value approach as of September 30, 2013 (CHS’ goodwill impairment testing date). Additional goodwill was allocated on a similar basis for four hospitals acquired by CHS in 2014 that were included in the group of hospitals spun-off to QHC. For the QHR reporting unit, goodwill was allocated based on the amount recorded by CHS at the time of its acquisition in 2007. All subsequent goodwill generated from hospital, physician practice or other ancillary business acquisitions is recorded at fair value at the time of acquisition.
Intangible Assets
The Company’s intangible assets primarily consist of purchase and development costs of software for internal use and contract-based intangible assets, including physician guarantee contracts, medical licenses, hospital management contracts, non-compete agreements and certificates of need. There are no expected residual values related to the Company’s intangible assets. Capitalized software costs are generally amortized over three years, except for software costs for significant system conversions, which are amortized over 8 to 10 years. Costs incurred to renew certain contract-based intangibles, such as hospital management contracts and certificates of need, are recognized as intangible assets and amortized over the respective renewal contract periods. Capitalized software costs that are in the development stage are not amortized until the related projects are complete. Assets related to physician guarantee contracts, hospital management contracts, non-compete agreements and certificates of need are amortized over the life of the individual contracts. Intangible assets held for sale are not amortized.
Impairment of Long-Lived Assets and Goodwill
Whenever an event occurs or changes in circumstances indicate that the carrying values of certain long-lived assets may be impaired, the Company projects the undiscounted cash flows expected to be generated by these assets. If the projections indicate that the carrying values are not expected to be recovered, such amounts are reduced to their estimated fair value based on a quoted market price, if available, or an estimated fair value based on valuation techniques available in the circumstances.
Goodwill arising from business combinations is not amortized. Goodwill is evaluated for impairment at the same time every year and when an event occurs or circumstances change that, more likely than not, reduce the fair value of the reporting unit below its carrying value. There is a two-step method for determining goodwill impairment. Step one is to compare the fair value of the reporting unit with the unit’s carrying value, including goodwill. If this test indicates the fair value is less than the carrying value, then step two
F-18
QUORUM HEALTH CORPORATION
NOTES TO CONSOLIDATED AND COMBINED FINANCIAL STATEMENTS (CONTINUED)
is required to compare the implied fair value of the reporting unit’s goodwill with the carrying value of the reporting unit’s goodwill. The Company performs its annual testing for impairment of goodwill in the fourth quarter of each year. The fair value of the Company’s reporting units is estimated using both a discounted cash flow model as well as a multiple model based on earnings before interest, taxes, depreciation and amortization. The cash flow forecasts are adjusted by an appropriate discount rate based on the Company’s best estimate of a market participant’s weighted-average cost of capital. Both models are based on the Company’s best estimate of future revenues and operating costs and are reconciled to the Company’s consolidated market capitalization, with consideration of the amount a potential acquirer would be required to pay, in the form of a control premium, in order to gain sufficient ownership to set policies, direct operations and control management decisions of the Company.
See Note 3 — Impairment of Long-Lived Assets and Goodwill for additional information related to impairment recorded in the consolidated and combined statements of income for the years ended December 31, 2017, 2016 and 2015.
Other Long-Term Assets
Other long-term assets consists of the long-term portion of the receivables from CHS related to professional and general liability and workers’ compensation liability insurance reserves that were indemnified by CHS in connection with the Spin-off, as well as deferred compensation plan assets, deposits, investments in unconsolidated subsidiaries and other miscellaneous long-term assets.
Other Current Liabilities
Other current liabilities consists of the current portion of professional and general liability insurance reserves, including the portion indemnified by CHS in connection with the Spin-off, as well as property tax accruals, legal accruals, deferred revenue related to electronic health records incentives, physician guarantees and other miscellaneous current liabilities.
Professional and General Liability and Workers’ Compensation Liability Insurance Reserves
As part of the business of owning and operating hospitals, the Company is subject to legal actions alleging liability on its part. To mitigate a portion of these risks, the Company maintains insurance exceeding a self-insured retention level for these types of claims. The Company’s self-insurance reserves reflect the current estimate of all outstanding losses, including incurred but not reported losses, based on actuarial calculations as of period end. The loss estimates included in the actuarial calculations may change in the future based on updated facts and circumstances. The Company’s insurance expense includes the actuarially determined estimates of losses for the current year, including claims incurred but not reported, the change in the estimates of losses for prior years based upon actual claims development experience as compared to prior actuarial projections, the insurance premiums for losses in excess of the Company’s self-insured retention levels, the administrative costs of the insurance programs, and interest expense related to the discounted portion of the liability. The Company’s reserves for professional and general liability and workers’ compensation liability claims are based on semi-annual actuarial calculations, which are discounted to present value and consider historical claims data, demographic factors, severity factors and other actuarial assumptions. The reserves for self-insured claims are discounted based on the Company’s risk-free interest rate that corresponds to the period when the self-insured claims are incurred and projected to be paid.
See Note 19 — Commitments and Contingencies for information related to the portion of the Company’s insurance reserves for professional and general liability and workers’ compensation liability and that are indemnified by CHS and the related accounting treatment and presentation in the consolidated and combined financial statements.
Self-Insured Employee Health Benefits
The Company is self-insured for substantially all of the medical benefits of its employees. The Company maintains a liability for its current estimate of incurred but not reported employee health claims based on historical claims data provided by third-party administrators. The undiscounted reserve for self-insured employee health benefits was $8.8 million and $11.0 million as of December 31, 2017 and 2016, respectively, and is included in accrued salaries and benefits in the consolidated balance sheets. Expense each period is based on the actual claims received during the period plus the impact of any adjustment to the liability for incurred but not reported employee health claims.
Prior to the Spin-off, QHC was allocated employee health benefit expense as part of the monthly corporate overhead charges allocated from CHS. The allocation was determined by CHS based on claims made by QHC employees during the period plus an estimate for the change in liability related to QHC employee health claims incurred but not reported. The liability was included in Due to Parent, net in the consolidated balance sheets, as the related employee health insurance policy was owned by CHS. Employee health benefit expense is included in salaries and benefits expenses in the consolidated and combined statements of income for all periods. See Note 18 — Related Party Transactions for additional information on corporate overhead costs allocated from CHS prior to the Spin-off.
F-19
QUORUM HEALTH CORPORATION
NOTES TO CONSOLIDATED AND COMBINED FINANCIAL STATEMENTS (CONTINUED)
Debt Issuance Costs and Discounts
The Company recognizes debt issuance costs as a reduction to the related debt liability on the consolidated balance sheet, consistent with the accounting treatment for debt discounts. Amortization of debt issuance costs and debt discounts are each recorded as non-cash interest expense over the life of the respective debt instrument.
Due to Parent, Net
Prior to the Spin-off, Due to Parent, net in the consolidated balance sheets represented the Company’s liability to CHS for the accumulation of (1) CHS’ historical investment in QHC, (2) liabilities related to the cost allocations from CHS to QHC, (3) interest charged by CHS on the monthly outstanding Due to Parent, net balance, (4) the net effect of transactions between CHS and QHC, and (5) the net effect of cash transfers from QHC to CHS under CHS’ centralized cash management program. In connection with the Spin-off, certain liabilities were transferred through Due to Parent, net to the Company, pursuant to the Separation and Distribution Agreement, and the remaining balance was settled with cash and in the form of a non-cash capital contribution to the Company. See Note 1 — Description of the Business and Spin-off and Note 18 — Related Party Transactions for additional information on the Spin-off and related party transactions with CHS.
Redeemable and Non-Redeemable Noncontrolling Interests
The Company’s consolidated and combined financial statements include all assets, liabilities, revenues and expenses of less than 100% owned entities that it controls. Certain of the Company’s consolidated subsidiaries have noncontrolling physician ownership interests with redemption features that require the Company to deliver cash upon the occurrence of certain events outside its control, such as the retirement, death, or disability of a physician-owner. The carrying amount of redeemable noncontrolling interests is recognized in the Company’s consolidated balance sheets at the greater of: (1) the initial carrying amount of these investments, increased or decreased for the noncontrolling interests' share of cumulative net income (loss), net of cumulative amounts distributed to the noncontrolling interest partners, if any, or (2) the redemption value of the investments held by the noncontrolling interest partners.
Assets and Liabilities of Hospitals Held for Sale
The Company reports separately from other assets in the consolidated balance sheets those assets that meet the criteria for classification as held for sale. Generally, assets that meet the criteria include those for which the carrying amount will be settled principally through a sale transaction rather than through continuing use. The asset must be available for immediate sale in its present condition, subject to usual or customary terms, and the sale must be probable to occur in the next 12 months. Similarly, the liabilities of a disposal group are classified as held for sale upon meeting these criteria. Immediately following classification as held for sale, the Company remeasures these assets and liabilities and adjusts the value to the lesser of the carrying amount or fair value less costs to sell. The assets and liabilities classified as held for sale are no longer depreciated or amortized into expense. The carrying values of assets classified as held for sale are reported net of impairment in the consolidated balance sheets. See Note 3 — Impairment of Long-Lived Assets and Goodwill for additional information on impairment recorded during the years ended December 31, 2017, 2016 and 2015.
Stock-Based Compensation
In connection with the Spin-off, the Company issued QHC restricted stock awards to all CHS restricted stock award holders as of the Record Date. Each holder of CHS restricted stock awards received one QHC restricted stock award for every four CHS restricted stock awards held. In addition, QHC employees that held CHS restricted stock awards were allowed to continue to hold the CHS awards under the same terms and conditions that existed prior to the Spin-off, excluding certain shares granted on March 1, 2016 that were canceled in connection with the Spin-off. The unrecognized compensation expense related to the vesting of the CHS restricted stock awards held by QHC employees was transferred to QHC with the Spin-off. As a result, the Company is responsible for recording stock-based compensation expense attributable to the unvested portion of CHS restricted stock awards held by QHC employees and the unvested portion of all QHC restricted stock awards held by its employees, consisting of both QHC awards issued on the Record Date and additional awards granted under the Quorum Health Corporation 2016 Stock Award Plan (the “2016 Stock Award Plan”) following the Spin-off. See Note 16 — Stock-Based Compensation for additional information related to stock-based compensation.
Benefit Plans
The Company maintains various benefit plans, including defined contribution plans, a defined benefit plan and a deferred compensation plan, for which certain of the Company’s subsidiaries are the plan sponsors. The rights and obligations of these plans were transferred from CHS to the Company, pursuant to the Separation and Distribution Agreement. Prior to the Spin-off, QHC was allocated a portion of CHS’ benefit costs under its defined contribution plans. The allocation was based on specific identification for
F-20
QUORUM HEALTH CORPORATION
NOTES TO CONSOLIDATED AND COMBINED FINANCIAL STATEMENTS (CONTINUED)
plans associated exclusively with QHC hospitals and on QHC’s proportional share of employees covered under all other applicable plans. Benefits costs are recorded as salaries and benefits in the consolidated and combined statements of income for prior to and subsequent to the Spin-off. The cumulative liability for these benefit costs, which were transferred to the Company in connection with the Spin-off, is recorded in other long-term liabilities on the consolidated balance sheets. Prior to the Spin-off the cumulative liability was recorded in Due to Parent, net in the consolidated balance sheets.
QHC recognizes the unfunded liability of its defined benefit plan in other long-term liabilities in the consolidated balance sheets. Unrecognized gains (losses) and prior service credits (costs) are recorded as changes in other comprehensive income (loss). The measurement date of the plan’s assets and liabilities coincides with the Company’s year end. The Company’s pension benefit obligation is measured using actuarial calculations that incorporate discount rates, rate of compensation increases and expected long-term returns on plan assets. The calculations additionally consider expectations related to the retirement age and mortality of plan participants. The Company records pension benefit costs related to all of its plans as salaries and benefits expenses in the consolidated and combined statements of income.
See Note 17 — Benefit Plans for additional information on the Company’s individual plans.
Fair Value of Financial Instruments
The Company utilizes the U.S. GAAP fair value hierarchy to measure the fair value of its financial instruments. The fair value hierarchy distinguishes between market participant assumptions based on market data obtained from sources independent of the reporting entity (observable inputs that are classified within Levels 1 and 2 of the hierarchy) and the reporting entity’s own assumption about market participant assumptions (unobservable inputs classified within Level 3 of the hierarchy).
The inputs used to measure fair value are classified into the following fair value hierarchy:
| • | Level 1 - Quoted market prices in active markets for identical assets and liabilities. |
| • | Level 2 - Observable market-based inputs or unobservable inputs that are corroborated by market data. |
| • | Level 3 - Unobservable inputs that are supported by little or no market activity and are significant to the fair value of the assets or liabilities. Level 3 includes values determined using pricing models, discounted cash flow methodologies or similar techniques reflecting the Company’s own assumptions. |
Segment Reporting
The principal business of the Company is to provide healthcare services at its hospitals and outpatient service facilities. The Company’s only other line of business is the hospital management advisory and consulting services it provides through QHR. The Company has determined that its hospital operations business and for QHR’s business meets the criteria for separate segment reporting. The Company’s corporate functions have been reported in the all other reportable segment. See Note 15 — Segments.
New Accounting Pronouncements
In January 2017, the FASB issued ASU No. 2017-04, Intangibles — Goodwill and Other: Simplifying the Accounting for Goodwill Impairment, which simplifies the accounting for goodwill impairment by eliminating step two from the goodwill impairment test. This ASU instead permits an entity to recognize goodwill impairment as the excess of a reporting unit’s carrying value over the estimated fair value of the reporting unit, to the extent this amount does not exceed the carrying amount of goodwill. The new guidance continues to allow an entity to perform a qualitative assessment over goodwill impairment indicators in lieu of a quantitative assessment in certain situations. The ASU is effective for the Company’s annual and interim reporting periods beginning after December 15, 2019, with early adoption permitted. The Company is currently evaluating the impact this guidance may have on its consolidated and combined results of operations, financial position and cash flows.
In March 2016, the FASB issued ASU No. 2016-09, Compensation — Stock Compensation, which was issued to simplify some of the accounting guidance for share-based compensation. Among the areas impacted by the amendments in this ASU are the accounting for income taxes related to share-based payments, accounting for forfeitures, classification of awards as equity or liabilities and classification on the statement of cash flows. This ASU is effective for fiscal years beginning after December 15, 2016, with early adoption permitted. The Company adopted this ASU on January 1, 2017. The adoption of this ASU had no material impact on the Company’s consolidated and combined results of operations, financial position and cash flows.
In February 2016, the FASB issued ASU No. 2016-02, Leases, which amends the accounting for leases and requires the rights and obligations arising from lease contracts, including existing and new arrangements, to be recognized as assets and labilities on the balance sheet. Recognition of these assets and liabilities will have a material impact to the Company’s consolidated balance sheets upon adoption. This ASU is effective for fiscal years beginning after December 15, 2018, with early adoption permitted. Under ASU
F-21
QUORUM HEALTH CORPORATION
NOTES TO CONSOLIDATED AND COMBINED FINANCIAL STATEMENTS (CONTINUED)
2016-02, lessees and lessors are required to recognize and measure leases at the beginning of the earliest period presented using a modified retrospective approach, which includes a number of optional practical expedients. The Company expects to adopt this ASU on January 1, 2019. The Company is still evaluating the impact that the adoption of this standard will have on its policies, procedures, financial disclosures, and control framework. The Company is additionally evaluating any modifications to its leasing strategy in response to the requirements of this standard.
In May 2014, the FASB issued ASU No. 2014-09, Revenue from Contracts with Customers, which provides for a single comprehensive principles-based model for the recognition of revenue across all industries using a five-step model to recognize revenue from customer contracts. The new standard significantly expands disclosures about the nature, amount, timing, and uncertainty of revenues and cash flows, as well as certain additional quantitative and qualitative disclosures. The standard is effective for fiscal years beginning after December 15, 2017, with early adoption permitted for annual periods beginning after December 15, 2016, and permits the use of either a full or modified retrospective approach upon adoption. The Company adopted this ASU on January 1, 2018 using the modified retrospective approach and during the fourth quarter of 2017 completed its evaluation of the resulting impact on its consolidated results of operations, financial position and cash flows. A significant portion of the adoption of this ASU was the process of evaluating the characteristics of patient accounts receivable portfolios to ensure that when evaluated under the new standard it would result in a materially consistent revenue amount for such portfolios as if each patient account was evaluated on a contract-by-contract basis. A component of this evaluation was the estimation of what portion of an insured patient’s account will ultimately be due from the patient as a co-payment or deductible and of that amount what will ultimately be collectible. The Company updated its processes to accommodate this estimate and has recorded a change in estimate to increase the Company’s allowance for doubtful accounts at December 31, 2017, which is further discussed above with respect to the Company’s accounting policies on accounts receivable and allowance for doubtful accounts. The Company completed its evaluation of the impact on its results of operations as of the fourth quarter 2017 and the Company does not expect the adoption of this ASU to have a material impact on its consolidated results of operations on a prospective basis, other than the impact of the presentation of the income statement, as the provision for bad debts will be recorded as a direct reduction to revenues and will not be presented as a separate line item.
NOTE 3 — IMPAIRMENT OF LONG-LIVED ASSETS AND GOODWILL
2017 Impairment
During the three months ended December 31, 2017, the Company evaluated the fair value of hospitals classified as held for sale and evaluated other hospitals intended for potential divestiture. In connection with this evaluation, the Company recognized long-lived asset impairment of $25.8 million during the three months ended December 31, 2017, which consisted of $23.7 million of property and equipment and $2.1 million of intangible assets impairment
During the three months ended September 30, 2017, the Company evaluated the fair value of hospitals classified as held for sale and evaluated other hospitals intended for potential divestiture. In connection with this evaluation, the Company recognized long-lived asset and goodwill impairment of $5.3 million during the three months ended September 30, 2017, which consisted of $3.7 million of property and equipment, $1.0 million of intangible assets and $0.6 million of goodwill impairment.
During the three months ended June 30, 2017, the Company evaluated the fair value of hospitals classified as held for sale and evaluated other hospitals intended for potential divestiture. In connection with this evaluation, the Company recognized $12.9 million of impairment to property and equipment during the three months ended June 30, 2017.
During the three months ended March 31, 2017, management made a decision to classify certain additional hospitals as held for sale. In connection with this decision, the Company evaluated the estimated relative fair value of the hospitals classified as held for sale in relation to the overall fair value of the hospital operations reporting unit utilizing a September 30, 2016 measurement date, which was the measurement date of the Company’s most recent annual goodwill impairment analysis. As a result, the Company recognized long-lived asset and goodwill impairment of $3.3 million during the three months ended March 31, 2017, which consisted of $1.1 million of property and equipment, $0.8 million of intangible assets and $1.4 million of goodwill impairment.
F-22
QUORUM HEALTH CORPORATION
NOTES TO CONSOLIDATED AND COMBINED FINANCIAL STATEMENTS (CONTINUED)
2016 Impairment
During the second quarter of 2016, management made a decision to classify certain hospitals as held for sale and evaluate other hospitals for potential divestiture. Due to the increase in net operating losses associated with these hospitals, the Company analyzed the long-lived assets of all of its hospitals to test for impairment and recorded $45.4 million of long-lived asset impairment in this quarter. In addition, the Company evaluated the estimated relative fair value of the hospitals classified as held for sale in relation to the overall fair value of the hospital operations reporting unit utilizing a September 30, 2015 measurement date, which was the measurement date of the Company’s most recent annual goodwill impairment analysis, and recognized $5.0 million of goodwill impairment in this quarter. In this same quarter, management identified certain indicators of goodwill impairment related to the hospital operations reporting unit and concluded that such indicators necessitated an interim goodwill impairment evaluation. The primary indicators were declining market capitalization, as compared to the carrying value of equity, and a decrease in estimated future earnings of the hospital operations reporting unit. The Company performed a calculation of the overall fair value of this reporting unit in step one of the impairment test and concluded that the carrying value of its hospital operations reporting unit as of June 30, 2016 exceeded the estimated fair value. The Company performed a preliminary step two calculation of goodwill impairment to determine the implied fair value of goodwill of the hospital operations reporting unit in a hypothetical purchase price allocation. Based on this preliminary analysis, the Company estimated and recorded additional goodwill impairment of $200 million in the second quarter of 2016.
For step two goodwill impairment testing, the Company engaged a professional valuation firm to perform a hypothetical purchase price valuation of each of its hospitals utilizing a September 30, 2016 measurement date. The results of the third-party valuation, which was completed in the fourth quarter of 2016, indicated that the carrying values of certain of the Company’s individual hospitals exceeded their fair values. Considering these results to be an indicator of potential impairment and to assess whether any additional impairment of long-lived assets existed, the Company utilized a September 30, 2016 measurement date to perform an analysis of undiscounted cash flows for each hospital in which an indicator of impairment was identified. Based on the results of these analyses, the Company recorded impairment of $82.7 million related to long-lived assets at certain hospitals and a downward adjustment to its previously recorded goodwill impairment estimate of $80 million in the fourth quarter of 2016. The net impact to the Company’s consolidated and combined financial statements was $2.7 million of additional impairment in the fourth quarter of 2016 beyond the initial estimate of $200 million estimate recorded as the preliminary step-two calculation in the second quarter of 2016.
In addition to the above, the Company experienced a decline in operating results at several hospitals in the fourth quarter of 2016. This led management to perform additional testing for impairment using a December 31, 2016 measurement date. As a result of this analysis, the Company recorded additional impairment of $38.8 million related to long-lived assets in the fourth quarter of 2016. The carrying values of long-lived assets, including those classified as held for sale, are reported net of impairment in the consolidated balance sheet as of December 31, 2016.
2015 Impairment
During the year ended December 31, 2015, the Company recorded impairment of $13.0 million to reduce the carrying values of certain long-lived assets at seven of its hospitals to their estimated fair values. The impairment for 2015 was identified because of declining operating results and projections of future cash flows at these hospitals, which were caused by competitive and operational challenges specific to the markets in which these hospitals operate.
F-23
QUORUM HEALTH CORPORATION
NOTES TO CONSOLIDATED AND COMBINED FINANCIAL STATEMENTS (CONTINUED)
NOTE 4 —ACQUISITIONS AND DIVESTITURES
Acquisitions
During the years ended December 31, 2017, 2016 and 2015, the Company acquired operating assets and the related businesses of certain physician practices, clinics and other ancillary businesses that operate within communities served by the Company’s hospitals. Prior to the Spin-off, the Company was allocated the consideration paid for these facilities through Due to Parent, net.
The following table provides a summary of the combined purchase price allocation by year for the Company’s acquisitions (in thousands):
| | Year Ended December 31, | |
| | 2017 | | | 2016 | | | 2015 | |
| | | | | | | | | | | | |
Current assets | | $ | 142 | | | $ | (343 | ) | | $ | 422 | |
Property and equipment | | | 695 | | | | 851 | | | | 3,190 | |
Goodwill | | | 1,211 | | | | 129 | | | | 6,788 | |
Other long-term assets | | | — | | | | — | | | | 564 | |
Liabilities | | | (128 | ) | | | 16 | | | | (1,229 | ) |
Noncontrolling interests | | | — | | | | 132 | | | | (1,716 | ) |
Total consideration paid or allocated from CHS | | $ | 1,920 | | | $ | 785 | | | $ | 8,019 | |
The table above includes adjustments to estimated amounts recognized, if any, that were recorded by the Company within the measurement period from the date of the respective acquisition. In some cases, the adjustments may be negative.
Divestitures
Vista Medical Center West
On March 1, 2018, the Company sold 70-bed Vista Medical Center West and its affiliated facilities (“Vista West”), located Waukegan, Illinois, for proceeds of $1.2 million. For the years ended December 31, 2017, 2016 and 2015, the Company’s operating results included pre-tax gains (losses) of $(2.3) million, $4.9 million, and $5.7 million, respectively, related to Vista West. In addition, the Company recorded impairment to property, equipment and capitalized software costs of $11.1 million and $4.1 million related to Vista West during the years ended December 31, 2017 and 2016, respectively.
L.V. Stabler Memorial Hospital
On October 31, 2017, the Company sold 72-bed L.V. Stabler Memorial Hospital and its affiliated facilities (“L.V. Stabler”) located in Greenville, Alabama for $2.8 million. For the years ended December 31, 2017, 2016 and 2015, the Company’s operating results included pre-tax losses of $5.3 million, $4.0 million, and $0.7 million, respectively, related to L.V. Stabler. In addition to the above, the Company recorded a loss on sale of less than $0.1 million in the year ended December 31, 2017. The Company also recorded impairment to property, equipment and capitalized software costs of $2.5 million and $2.9 million related to L.V. Stabler in the years ended December 31, 2017 and 2016, respectively.
Sunbury Community Hospital and Lock Haven Hospital
On September 30, 2017, the Company sold 70-bed Sunbury Community Hospital and its affiliated facilities (“Sunbury”), located in Sunbury, Pennsylvania, and 47-bed Lock Haven Hospital and its affiliated facilities (“Lock Haven”), located in Lock Haven, Pennsylvania, for combined proceeds of $9.1 million. For the years ended December 31, 2017, 2016 and 2015, the Company’s operating results included pre-tax losses of $8.8 million, $9.4 million, and $8.7 million, respectively, related to Sunbury and Lock Haven on a combined basis. In addition to the above, the Company recorded a $0.1 million loss on the sale in the year ended December 31, 2017. The Company also recorded impairment to property, equipment and capitalized software costs of $1.9 million, $12.7 million and $3.0 million of impairment to property, equipment and capitalized software costs related to Sunbury and Lock Haven during the years ended December 31, 2017, 2016 and 2015, respectively. The Company also recorded impairment to property and equipment of $3.0 million and $6.0 million for the years ended December 31, 2013 and 2012, respectively.
Trinity Hospital of Augusta
On June 30, 2017, the Company sold 231-bed Trinity Hospital of Augusta and its affiliated facilities (“Trinity”), located in Augusta, Georgia, for $15.9 million. For the years ended December 31, 2017, 2016 and 2015, the Company’s operating results included pre-tax losses of $9.7 million, $9.5 million and $2.8 million, respectively, related to Trinity. In addition to the above, the Company recorded a $5.3 million gain on the sale in the year ended December 31, 2017. The Company also recorded impairment to property, equipment and capitalized software costs of $33.9 million related to Trinity during the year ended December 31, 2016.
F-24
QUORUM HEALTH CORPORATION
NOTES TO CONSOLIDATED AND COMBINED FINANCIAL STATEMENTS (CONTINUED)
As part of the sale of Trinity, the Company redeemed shares valued at $3.5 million from minority interest partners, which included cash distributions of $1.2 million related to the dissolution of the partnership.
Cherokee Medical Center
On March 31, 2017, the Company sold 60-bed Cherokee Medical Center and its affiliated facilities (“Cherokee”), located in Centre, Alabama, for $4.3 million. For the years ended December 31, 2017, 2016 and 2015, the Company’s operating results included pre-tax losses of $1.0 million, $3.7 million and $1.6 million, respectively, related to Cherokee. In addition to the above, the Company recorded a $0.2 million gain on the sale in the year ended December 31, 2017. The Company also recorded impairment to property, equipment and capitalized software costs of $3.9 million and $2.0 million of Cherokee during the years ended December 31, 2016 and 2015, respectively. The Company also recorded impairment to property and equipment of $1.0 million for the year ended December 31, 2012.
Barrow Regional Medical Center
On December 31, 2016, the Company sold 56-bed Barrow Regional Medical Center and its affiliated facilities (“Barrow”), located in Winder, Georgia, for $6.6 million. For the years ended December 31, 2017, 2016 and 2015, the Company’s operating results included pre-tax losses of $2.4 million, $14.5 million and $6.2 million, respectively, related to Barrow. In addition to the above, the Company recorded a $1.2 million net loss on the sale in the year ended December 31, 2016. The Company also recorded impairment to property, equipment and capitalized software costs of $4.0 million related to Barrow during the year ended December 31, 2016.
Sandhills Regional Medical Center
On December 1, 2016, the Company sold 64-bed Sandhills Regional Medical Center and its affiliated facilities (“Sandhills”), located in Hamlet, North Carolina, for $7.2 million. For the years ended December 31, 2017, 2016 and 2015, the Company’s operating results included pre-tax losses of $0.2 million, $6.9 million and $2.0 million, respectively, related to Sandhills. In addition to the above, the Company recorded a $1.0 million net loss on the sale in the year ended December 31, 2016. The Company also recorded impairment to property, equipment and capitalized software costs of $4.8 million related to Sandhills during the year ended December 31, 2016.
NOTE 5 — PROPERTY AND EQUIPMENT
The following table provides a summary of the components of property and equipment (in thousands):
| | December 31, | |
| | 2017 | | | 2016 | |
| | | | | | | | |
Property and equipment, at cost: | | | | | | | | |
Land and improvements | | $ | 70,731 | | | $ | 84,474 | |
Building and improvements | | | 790,619 | | | | 782,892 | |
Equipment and fixtures | | | 529,150 | | | | 592,463 | |
Construction in progress | | | 14,684 | | | | 60,146 | |
Total property and equipment, at cost | | | 1,405,184 | | | | 1,519,975 | |
Less: Accumulated depreciation and amortization | | | (729,905 | ) | | | (786,075 | ) |
Total property and equipment, net | | $ | 675,279 | | | $ | 733,900 | |
Depreciation expense was $58.6 million, $83.0 million and $90.9 million for the years ended December 31, 2017, 2016 and 2015, respectively. See Note 6 — Goodwill and Intangible Assets for information on amortization expense recorded for property and equipment held under capital lease obligations. The total amount of assets held under capital lease obligations, at cost, was $29.2 million and $30.2 million at December 31, 2017 and 2016, respectively, and $25.6 million and $27.5 million, net of accumulated amortization, at December 31, 2017 and 2016, respectively.
Purchases of property and equipment accrued in accounts payable were $6.8 million and $15.7 million as of December 31, 2017 and 2016, respectively.
See Note 3 — Impairment of Long-Lived Assets and Goodwill for information on impairment related to property and equipment recorded in the consolidated and combined statements of income for the years ended December 31, 2017, 2016 and 2015.
F-25
QUORUM HEALTH CORPORATION
NOTES TO CONSOLIDATED AND COMBINED FINANCIAL STATEMENTS (CONTINUED)
NOTE 6— GOODWILL AND INTANGIBLE ASSETS
Goodwill
The following table provides a summary of the changes in goodwill (in thousands):
| | December 31, | |
| | 2017 | | | 2016 | |
| | | | | | | | |
Balance at beginning of period | | $ | 416,833 | | | $ | 541,704 | |
Acquisitions | | | 1,211 | | | | 129 | |
Divestitures | | | (5,293 | ) | | | — | |
Reclass to held for sale | | | (1,593 | ) | | | — | |
Impairment | | | (1,929 | ) | | | (125,000 | ) |
Balance at end of period | | $ | 409,229 | | | $ | 416,833 | |
Goodwill related to the hospital operations reporting unit was $375.9 million and $383.5 million as of December 31, 2017 and December 31, 2016, respectively. Goodwill related to the management advisory and consulting services reporting unit was $33.3 million at both December 31, 2017 and December 31, 2016. Goodwill related to divestitures was associated with the sale of Trinity and Sunbury. See Note 4 — Divestitures for additional information on the divestitures of Trinity and Sunbury.
See Note 3 — Impairment of Long-Lived Assets and Goodwill for additional information on impairment to goodwill recorded by the Company in 2017, 2016 and 2015.
Intangible Assets
The following table provides a summary of the components of intangible assets (in thousands):
| | December 31, | |
| | 2017 | | | 2016 | |
| | | | | | | | |
Finite-lived intangible assets: | | | | | | | | |
Capitalized software costs: | | | | | | | | |
Cost | | $ | 159,449 | | | $ | 180,855 | |
Accumulated amortization | | | (111,661 | ) | | | (118,391 | ) |
Capitalized software costs, net | | | 47,788 | | | | 62,464 | |
Physician guarantee contracts: | | | | | | | | |
Cost | | | 7,489 | | | | 11,355 | |
Accumulated amortization | | | (4,290 | ) | | | (6,329 | ) |
Physician guarantee contracts, net | | | 3,199 | | | | 5,026 | |
Other finite-lived intangible assets: | | | | | | | | |
Cost | | | 43,376 | | | | 44,342 | |
Accumulated amortization | | | (34,668 | ) | | | (33,059 | ) |
Other finite-lived intangible assets, net | | | 8,708 | | | | 11,283 | |
Total finite-lived intangible assets | | | | | | | | |
Cost | | | 210,314 | | | | 236,552 | |
Accumulated amortization | | | (150,618 | ) | | | (157,779 | ) |
Total finite-lived intangible assets, net | | $ | 59,696 | | | $ | 78,773 | |
| | | | | | | | |
Indefinite-lived intangible assets: | | | | | | | | |
Tradenames | | $ | 4,000 | | | $ | 4,000 | |
Medical licenses and other indefinite-lived intangible assets | | | 1,154 | | | | 2,209 | |
Total indefinite-lived intangible assets | | $ | 5,154 | | | $ | 6,209 | |
| | | | | | | | |
Total intangible assets: | | | | | | | | |
Cost | | $ | 215,468 | | | $ | 242,761 | |
Accumulated amortization | | | (150,618 | ) | | | (157,779 | ) |
Total intangible assets, net | | $ | 64,850 | | | $ | 84,982 | |
F-26
QUORUM HEALTH CORPORATION
NOTES TO CONSOLIDATED AND COMBINED FINANCIAL STATEMENTS (CONTINUED)
During the years ended December 31, 2017 and 2016, the Company recorded $3.4 million and $18.9 million, respectively, of impairment related to capitalized software costs. See Note 3 — Impairment of Long-Lived Assets and Goodwill for additional information on these impairment charges.
As of December 31, 2017, the Company had $0.7 million of capitalized software costs that are currently in the development stage. Amortization of these costs will begin once the software projects are complete and ready for their intended use.
Amortization Expense
The following table provides a summary of the components of amortization expense (in thousands):
| | Year Ended December 31, | |
| | 2017 | | | 2016 | | | 2015 | |
| | | | | | | | | | | | |
Amortization of finite-lived intangible assets: | | | | | | | | | | | | |
Capitalized software costs | | $ | 15,879 | | | $ | 25,193 | | | $ | 27,317 | |
Physician guarantee contracts | | | 2,032 | | | | 3,108 | | | | 3,951 | |
Other finite-lived intangible assets | | | 2,594 | | | | 2,866 | | | | 3,334 | |
Total amortization expense related to finite-lived intangible assets | | | 20,505 | | | | 31,167 | | | | 34,602 | |
Amortization of leasehold improvements and property and equipment assets held under capital lease obligations | | | 3,038 | | | | 3,111 | | | | 2,496 | |
Total amortization expense | | $ | 23,543 | | | $ | 34,278 | | | $ | 37,098 | |
As of December 31, 2017, the weighted-average remaining amortization period of the Company’s intangible assets subject to amortization, except for capitalized software costs and physician guarantee contracts, was approximately 4.6 years.
The following table provides a summary of estimated future amortization expense for the next five years and thereafter related to intangible assets (in thousands):
2018 | | $ | 18,898 | |
2019 | | | 14,475 | |
2020 | | | 11,791 | |
2021 | | | 9,378 | |
2022 | | | 3,900 | |
Thereafter | | | 1,254 | |
Total estimated future amortization expense | | $ | 59,696 | |
NOTE 7 — LONG-TERM DEBT
The following table provides a summary of the components of long-term debt (in thousands):
| | December 31, | |
| | 2017 | | | 2016 | |
| | | | | | | | |
Senior Credit Facility: | | | | | | | | |
Revolving Credit Facility, maturing 2021 | | $ | — | | | $ | — | |
Term Loan Facility, maturing 2022 | | | 831,158 | | | | 868,419 | |
ABL Credit Facility, maturing 2021 | | | — | | | | — | |
Senior Notes, maturing 2023 | | | 400,000 | | | | 400,000 | |
Unamortized debt issuance costs and discounts | | | (42,934 | ) | | | (48,764 | ) |
Capital lease obligations | | | 24,411 | | | | 25,588 | |
Other miscellaneous debt | | | 1,255 | | | | 1,582 | |
Total debt | | | 1,213,890 | | | | 1,246,825 | |
Less: Current maturities of long-term debt | | | (1,855 | ) | | | (5,683 | ) |
Total long-term debt | | $ | 1,212,035 | | | $ | 1,241,142 | |
In connection with the Spin-off, the Company entered into two credit agreements and issued senior notes. In addition, the previous indebtedness with CHS, which was classified in the consolidated balance sheets as Due to Parent, net was fully settled in the
F-27
QUORUM HEALTH CORPORATION
NOTES TO CONSOLIDATED AND COMBINED FINANCIAL STATEMENTS (CONTINUED)
Spin-off. See Note 1 — Description of the Business and Spin-off and Note 18 — Related Party Transactions for additional information on the use of proceeds from the new debt instruments and the settlement of Due to Parent, net.
Senior Credit Facility
On April 29, 2016, the Company entered into a credit agreement (the “CS Agreement”), among the Company, the lenders party thereto and Credit Suisse AG, Cayman Islands Branch (“Credit Suisse”), as administrative agent and collateral agent. On April 11, 2017, the Company executed an agreement with its Senior Credit Facility lenders to amend certain provisions of its Senior Credit Facility (the “CS Amendment”), as described below. On March 14, 2018, the Company executed a second agreement with its Senior Credit Facility lenders to amend certain provisions of its Senior Credit Facility (the “CS Second Amendment”), as described below.
The CS Agreement provides for an $880 million senior secured term loan facility (the “Term Loan Facility”) and a $100 million senior secured revolving credit facility (the “Revolving Credit Facility” and, together with the Term Loan Facility, the “Senior Credit Facility”). The Term Loan Facility was issued at a discount of $17.6 million, or 98% of par value, and has a maturity date of April 29, 2022, subject to customary acceleration events and repayment, extension or refinancing. The Revolving Credit Facility has a maturity date of April 29, 2021, subject to certain customary acceleration events and repayment, extension or refinancing. The CS Amendment reduced the Revolving Credit Facility’s capacity from $100 million to $87.5 million until December 31, 2017, at which time the capacity decreased to $75.0 million through maturity. The CS Second Amendment reduced the Revolving Credit Facility’s capacity to $62.5 million through maturity, effective with the amendment executed on March 14, 2018.
The CS Agreement contains customary covenants, including a maximum permitted Secured Net Leverage Ratio, as determined based on 12 month trailing Consolidated EBITDA, as defined in the CS Agreement. On April 11, 2017, the Company executed the CS Amendment with its Senior Credit Facility lenders to amend the calculation of the Secured Net Leverage Ratio beginning July 1, 2017 through maturity, among other provisions. In addition, the CS Amendment raised the minimum Secured Net Leverage Ratio required for the Company to remain in compliance for certain periods, and also changed the calculation of compliance for specified periods. The CS Second Amendment, which was executed on March 14, 2018, amended the Secured Net Leverage Ratio for the period July 1, 2017 through maturity. As of December 31, 2017 and 2016, the Company had a Secured Net Leverage Ratio of 3.87 to 1.00 and 3.93 to 1.00, respectively, implying additional borrowing capacity of $193.3 million as of December 31, 2017.
After giving effect to the CS Amendment and the CS Second Amendment, the maximum Secured Net Leverage Ratio permitted under the CS Agreement, as determined based on 12 month trailing Consolidated EBITDA, which is defined in the CS Agreement, follows:
| | Maximum |
| | Secured Net |
Period | | Leverage Ratio |
| | |
Period from January 1, 2017 to June 30, 2017 | | 4.50 to 1.00 |
Period from July 1, 2017 to June 30, 2018 | | 4.75 to 1.00 |
Period from July 1, 2018 to December 31, 2019 | | 5.00 to 1.00 |
Period from January 1, 2020 and thereafter | | 4.50 to 1.00 |
In addition to amending the calculation of the Secured Net Leverage Ratio and the Maximum Secured Net Leverage Ratio, the CS Amendment and the CS Second Amendment also affected other terms of the CS Agreement as follows:
| • | Through April 29, 2022, the Company is required to use asset sales proceeds to make mandatory redemptions under the Term Loan Facility. |
| • | Through December 31, 2018, the Company may request to exercise Incremental Term Loan Commitments, as defined in the CS Agreement, only if the Secured Net Leverage Ratio, adjusted for the requested Incremental Term Loan borrowing, is below 3.35 to 1.00. After December 31, 2018, the Company may request to exercise Incremental Term Loan Commitments for the greater of $100 million or an amount which would produce a Secured Net Leverage Ratio of 3.35 to 1.00. |
| • | Through December 31, 2018, the Company is allowed to incur Permitted Additional Debt, as defined in the CS Agreement, only if the Total Leverage Ratio, adjusted for the Permitted Additional Debt, is below 4.50 to 1.00. After December 31, 2018, the Company may incur Permitted Additional Debt so long as the Total Leverage Ratio, adjusted for the Permitted Additional Debt, is below 5.50 to 1.00. |
Prior to the CS Amendment, interest under the Term Loan Facility accrued, at the option of the Company, at adjusted LIBOR, subject to statutory reserves and a floor of 1% plus 5.75%, or the alternate base rate plus 4.75%. Following the CS Amendment,
F-28
QUORUM HEALTH CORPORATION
NOTES TO CONSOLIDATED AND COMBINED FINANCIAL STATEMENTS (CONTINUED)
interest under the Term Loan Facility accrues, at the option of the Company, at adjusted LIBOR, subject to statutory reserves and a floor of 1% plus 6.75%, or the alternate base rate plus 5.75%. The effective interest rate on the Term Loan Facility was 8.77% as of December 31, 2017. Interest on outstanding borrowings under the Revolving Credit Facility accrues, at the option of the Company, at adjusted LIBOR, subject to statutory reserves and a floor of 0% plus 2.75%, or the alternate base rate plus 1.75%, and remains unchanged under the CS Amendment. The CS Second Amendment did not alter these provisions.
Borrowings from the Revolving Credit Facility are used for working capital and general corporate purposes. As of December 31, 2017, the Company had no borrowings outstanding on the Revolving Credit Facility and had $10.2 million of letters of credit outstanding that were primarily related to the self-insured retention levels of professional and general liability and workers’ compensation liability insurance as security for the payment of claims. As of December 31, 2017, the Company had borrowing capacity under its Revolving Credit Facility of $77.3 million.
ABL Credit Facility
On April 29, 2016, the Company entered into an ABL Credit Agreement (the “UBS Agreement,” and together with the CS Agreement, collectively, the “Credit Agreements”), among the Company, the lenders party thereto and UBS AG, Stamford Branch (“UBS”), as administrative agent and collateral agent. The UBS Agreement provides for a $125 million senior secured asset-based revolving credit facility (the “ABL Credit Facility”). The available borrowings from the ABL Credit Facility, which are based on eligible patient accounts receivable, are used for working capital and general corporate purposes. As of December 31, 2017, the Company had no borrowings outstanding on the ABL Credit Facility and borrowing capacity of $124 million.
On April 11, 2017, the Company executed an amendment to the UBS Agreement with its lender party thereto, which aligned the provisions of the UBS Agreement with the CS Agreement. There were no changes to the UBS Agreement that impact the Company’s current interest or covenant calculations associated with the ABL Credit Facility.
The ABL Credit Facility has a maturity date of April 29, 2021, subject to customary acceleration events and repayment, extension or refinancing. Interest on outstanding borrowings under the ABL Credit Facility accrues, at the option of the Company, at a base rate or LIBOR, subject to statutory reserves and a floor of 0%, except that all swingline borrowings will accrue interest based on the base rate, plus an applicable margin determined by the average excess availability under the ABL Credit Facility for the fiscal quarter immediately preceding the date of determination. The applicable margin ranges from 1.75% to 2.25% for LIBOR advances and from 0.75% to 1.25% for base rate advances.
The ABL Credit Facility has a “Covenant Trigger Event” definition that requires the Company to maintain excess availability under the ABL Credit Facility equal to or greater than the greater of (i) $12.5 million and (ii) 10% of the aggregate commitments under the ABL Credit Facility. If a Covenant Trigger Event occurs, then the Company is required to maintain a minimum Consolidated Fixed Charge Ratio of 1.10 to 1.00 until such time that a Covenant Trigger Event is no longer continuing. In addition, if excess availability under the ABL Credit Facility were to fall below the greater of (i) 12.5% of the aggregate commitments under the ABL Credit Facility and (ii) $15.0 million, then a “Cash Dominion Event” would be triggered upon which the lenders could assume control of the Company’s cash.
Credit Agreement Covenants
In addition to the specific covenants described above, the Credit Agreements contain customary negative covenants which limit the Company’s ability to, among other things, incur additional indebtedness, create liens, make investments, transfer assets, merge or acquire assets, and make restricted payments, including dividends, distributions and specified payments on other indebtedness. They include customary events of default, including payment defaults, material breaches of representations and warranties, covenant defaults, default on other material indebtedness, customary Employee Retirement Income Security Act (“ERISA”) events of default, bankruptcy and insolvency, material judgments, invalidity of liens on collateral, change of control or cessation of business. The Credit Agreements also contain customary affirmative covenants and representations and warranties.
Senior Notes
On April 22, 2016, QHC issued $400 million aggregate principal amount of 11.625% Senior Notes due 2023, pursuant to the Indenture. The Senior Notes were issued at a discount of $6.9 million, or 1.734%, in a private placement and are senior unsecured obligations of the Company guaranteed on a senior basis by certain of the Company’s subsidiaries (the “Guarantors”). The Senior Notes mature on April 15, 2023 and bear interest at a rate of 11.625% per annum, payable semi-annually in arrears on April 15 and October 15 of each year, beginning on October 15, 2016. Interest on the Senior Notes accrues from the date of original issuance and is calculated on the basis of a 360-day year comprised of twelve 30-day months. The effective interest rate on the Senior Notes was 12.49% as of December 31, 2017.
F-29
QUORUM HEALTH CORPORATION
NOTES TO CONSOLIDATED AND COMBINED FINANCIAL STATEMENTS (CONTINUED)
The Indenture contains covenants that, among other things, limit the ability of the Company and certain of its subsidiaries to incur or guarantee additional indebtedness, pay dividends or make other restricted payments, make certain investments, create or incur certain liens, sell assets and subsidiary stock, transfer all or substantially all of its assets or enter into merger or consolidation transactions.
On May 17, 2017, the Company exchanged the 11.625% Senior Notes due 2023 (the “Initial Notes”) in the aggregate principal amount of $400 million, which were not registered under the Securities Act of 1933, as amended (the “Securities Act”), for a like principal amount of 11.625% Senior Notes due 2023 (the “Exchange Notes”), which have been registered under the Securities Act. The Initial Notes were substantially identical to the Exchange Notes, except that the Exchange Notes are registered under the Securities Act and are not subject to the transfer restrictions and certain registration rights agreement provisions applicable to the Initial Notes.
On and after April 15, 2019, the Company is entitled, at its option, to redeem all or a portion of the Senior Notes upon not less than 30 nor more than 60 days’ notice, at the following redemption prices specified in the table below, plus accrued and unpaid interest, if any, to the redemption date. The redemption prices are expressed as a percentage of the principal amount on the redemption date. Holders of record on the relevant record date have the right to receive interest due on the relevant interest payment date. In addition, prior to April 15, 2019, the Company may redeem some or all of the Senior Notes at a price equal to 100% of the principal amount thereof, plus accrued and unpaid interest, if any, plus a “make whole” premium, as set forth in the Indenture. The Company is entitled to redeem up to 35% of the aggregate principal amount of the Senior Notes until April 15, 2019 with the net proceeds from certain equity offerings at the redemption price set forth in the Indenture.
The following table provides a summary of the redemption periods and prices related to the Senior Notes:
| | Redemption | |
Period | | Prices | |
| | | | |
Period from April 15, 2019 to April 14, 2020 | | | 108.719 | % |
Period from April 15, 2020 to April 14, 2021 | | | 105.813 | % |
Period from April 15, 2021 to April 14, 2022 | | | 102.906 | % |
Period from April 15, 2022 to April 14, 2023 | | | 100.000 | % |
Debt Issuance Costs and Discounts
The following table provides a summary of unamortized debt issuance costs and discounts (in thousands):
| | December 31, | |
| | 2017 | | | 2016 | |
| | | | | | | | |
Debt issuance costs | | $ | 32,265 | | | $ | 29,146 | |
Debt discounts | | | 24,536 | | | | 24,536 | |
Total debt issuance costs and discounts at origination | | | 56,801 | | | | 53,682 | |
Less: Amortization of debt issuance costs and discounts | | | (13,867 | ) | | | (4,918 | ) |
Total unamortized debt issuance costs and discounts | | $ | 42,934 | | | $ | 48,764 | |
Capital Lease Obligations and Other Debt
The Company’s debt arising from capital lease obligations primarily relates to its corporate office in Brentwood, Tennessee. As of December 31, 2017 and 2016, this capital lease obligation was $17.9 million and $18.7 million, respectively. The remainder of the Company’s capital lease obligations relate to property and equipment at its hospitals and corporate office. Other debt consists of physician loans and miscellaneous notes payable to banks.
F-30
QUORUM HEALTH CORPORATION
NOTES TO CONSOLIDATED AND COMBINED FINANCIAL STATEMENTS (CONTINUED)
Debt Maturities
The following table provides a summary of debt maturities for each of the next five years and thereafter (in thousands):
2018 | | $ | 1,855 | |
2019 | | | 1,486 | |
2020 | | | 1,517 | |
2021 | | | 3,329 | |
2022 | | | 830,796 | |
Thereafter | | | 417,841 | |
Total debt, excluding unamortized debt issuance costs and discounts | | $ | 1,256,824 | |
Interest Expense, Net
The following table provides a summary of the components of interest expense, net (in thousands):
| | Year Ended December 31, | |
| | 2017 | | | 2016 | | | 2015 | |
| | | | | | | | | | | | |
Senior Credit Facility: | | | | | | | | | | | | |
Revolving Credit Facility | | $ | 528 | | | $ | 330 | | | $ | — | |
Term Loan Facility | | | 66,111 | | | | 40,719 | | | | — | |
ABL Credit Facility | | | 1,854 | | | | 342 | | | | — | |
Senior Notes | | | 46,516 | | | | 32,166 | | | | — | |
Amortization of debt issuance costs and discounts | | | 8,949 | | | | 4,918 | | | | — | |
All other interest expense (income), net | | | (1,881 | ) | | | (849 | ) | | | 283 | |
Total interest expense, net, from long-term debt | | | 122,077 | | | | 77,626 | | | | 283 | |
Due to Parent, net | | | — | | | | 35,814 | | | | 98,007 | |
Total interest expense, net | | $ | 122,077 | | | $ | 113,440 | | | $ | 98,290 | |
NOTE 8 — OTHER LONG-TERM ASSETS AND OTHER LONG-TERM LIABILITIES
The following table provides a summary of the major components of other long-term assets (in thousands):
| | December 31, | |
| | 2017 | | | 2016 | |
| | | | | | | | |
Receivable for professional and general liability insurance reserves indemnified by CHS | | $ | 44,377 | | | $ | 59,652 | |
Receivable for workers' compensation liability insurance reserves indemnified by CHS | | | 14,545 | | | | 15,958 | |
Assets of Nonqualified Deferred Compensation Plan | | | 23,052 | | | | 69 | |
Other miscellaneous long-term assets | | | 13,633 | | | | 13,154 | |
Total other long-term assets | | $ | 95,607 | | | $ | 88,833 | |
The following table provides a summary of the components of other long-term liabilities (in thousands):
| | December 31, | |
| | 2017 | | | 2016 | |
| | | | | | | | |
Professional and general liability insurance reserves | | $ | 76,993 | | | $ | 74,194 | |
Workers' compensation liability insurance reserves | | | 18,558 | | | | 17,416 | |
Benefit plan liabilities | | | 36,103 | | | | 10,722 | |
Deferred rent | | | 4,268 | | | | 4,001 | |
Other miscellaneous long-term liabilities | | | 2,032 | | | | 2,663 | |
Total other long-term liabilities | | $ | 137,954 | | | $ | 108,996 | |
See Note 19 — Commitments and Contingencies for additional information about the Company’s insurance reserves and Note 17 — Benefit Plans for additional information about the Company’s benefit plan liabilities.
F-31
QUORUM HEALTH CORPORATION
NOTES TO CONSOLIDATED AND COMBINED FINANCIAL STATEMENTS (CONTINUED)
NOTE 9 — FAIR VALUE OF FINANCIAL INSTRUMENTS
The carrying values of the Company’s cash and cash equivalents, patient accounts receivable, amounts due from and due to third-party payors, and accounts payable approximate their fair values due to the short-term maturity of these financial instruments.
The Company recorded impairment related to long-lived assets and goodwill during the years ended December 31, 2017 2016 and 2015. See Note 3 — Impairment of Long-Lived Assets and Goodwill for additional information on these impairments. The assessment of fair value was based on Level 3 inputs, as the valuation methodologies used to determine impairment were based on internal projections and unobservable inputs. The portion of the impairment related to hospital assets held for sale was determined based on Level 2 inputs, as the valuation methodologies used to determine impairment considered letters of intent received on these hospitals.
The following table provides a summary of the carrying values and estimated fair values of the Company’s long-term debt (in thousands):
| | December 31, | |
| | 2017 | | | 2016 | |
| | Carrying | | | Estimated | | | Carrying | | | Estimated | |
| | Amount | | | Fair Value | | | Amount | | | Fair Value | |
| | | | | | | | | | | | | | | | |
Revolving Credit Facility | | $ | — | | | $ | — | | | $ | — | | | $ | — | |
Term Loan Facility | | | 831,158 | | | | 838,954 | | | | 868,419 | | | | 849,427 | |
ABL Credit Facility | | | — | | | | — | | | | — | | | | — | |
Senior Notes | | | 400,000 | | | | 393,396 | | | | 400,000 | | | | 334,720 | |
Other debt | | | 25,666 | | | | 25,666 | | | | 27,170 | | | | 27,170 | |
Total long-term debt, excluding debt issuance costs and discounts | | $ | 1,256,824 | | | $ | 1,258,016 | | | $ | 1,295,589 | | | $ | 1,211,317 | |
The Company considers its long-term debt instruments to be measured based on Level 2 inputs. Information about the valuation methodologies used in the determination of the estimated fair values for the Company’s long-term debt instruments follows:
| • | Term Loan Facility. The estimated fair value is based on publicly available trading activity and supported with information from the Company’s lending institutions regarding relevant pricing for trading activity. |
| • | Senior Notes. The estimated fair value is based on the closing market price for these notes. |
| • | All other debt. The carrying values of the Company’s other debt instruments, including the Revolving Credit Facility, ABL Credit Facility, capital lease obligations, physician loans and miscellaneous notes payable to banks, approximate their estimated fair values due to the nature of these obligations. |
NOTE 10 — LEASES
The Company leases certain property and equipment under capital and operating lease agreements. The Company’s lease commitments typically require the Company, as lessee, to pay maintenance, repairs, property taxes and insurance costs.
F-32
QUORUM HEALTH CORPORATION
NOTES TO CONSOLIDATED AND COMBINED FINANCIAL STATEMENTS (CONTINUED)
The following table provides a summary of the Company’s commitments relating to non-cancellable operating and capital leases for each of the next five years and thereafter (in thousands):
Year Ending December 31, | | Operating (1) | | | Capital | |
| | | | | | | | |
2018 | | $ | 32,253 | | | $ | 2,531 | |
2019 | | | 25,568 | | | | 2,552 | |
2020 | | | 19,673 | | | | 2,590 | |
2021 | | | 12,722 | | | | 2,628 | |
2022 | | | 8,294 | | | | 2,332 | |
Thereafter | | | 17,236 | | | | 20,707 | |
Total minimum future payments obligations | | $ | 115,746 | | | | 33,340 | |
Less: Imputed interest | | | | | | | (8,929 | ) |
Total capital lease obligations | | | | | | | 24,411 | |
Less: Current portion of capital lease obligations | | | | | | | (1,140 | ) |
Total long-term capital lease obligations | | | | | | $ | 23,271 | |
| (1) | Minimum lease payments obligations have not been reduced by minimum sublease rentals due in the future of $5.2 million. |
NOTE 11 — EQUITY
Preferred Stock
In connection with the Spin-off, the Company authorized 100,000,000 shares of preferred stock, par value of $0.0001 per share. No shares have been issued as of December 31, 2017. The Board has the discretion, subject to limitations prescribed by Delaware law and by its amended and restated certificate of incorporation, to determine the rights, preferences, privileges and restrictions, including voting rights, dividend rights, conversion rights, redemption privileges and liquidation preferences, of each series of preferred stock, when and if issued.
Common Stock
In connection with the Spin-off, the Company authorized 300,000,000 shares of common stock, par value of $0.0001 per share, and issued 28,412,054 shares of common stock on April 29, 2016 to CHS stockholders of record as of the Record Date, or April 22, 2016. The Company’s common stock began trading on the NYSE on May 2, 2016 under the ticker symbol “QHC.” As of December 31, 2017 and 2016, the Company had 30,294,895 shares and 29,482,050 shares, respectively, of common stock issued and outstanding.
Holders of the Company’s common stock are entitled to one vote for each share held of record on all matters for which stockholders may vote. Holders of the Company’s common stock do not have cumulative voting rights in the election of directors. There are no preemptive rights, conversion, redemption or sinking fund provisions applicable to the common stock. In the event of liquidation, dissolution or winding up, holders of common stock are entitled to share ratably in the assets available for distribution. Delaware law prohibits the Company from paying any dividends unless it has capital surplus or net profits available for this purpose. In addition, the Company’s Credit Agreements impose restrictions on its ability to pay dividends.
Additional Paid-in Capital
In connection with the Spin-off, the Company issued common stock, as described above, to CHS stockholders. In addition, pursuant to the Separation and Distribution Agreement, CHS contributed capital of $530.6 million, in lieu of a cash settlement payment, related to the remaining intercompany indebtedness with CHS and the Parent’s equity attributable to CHS. See Note 1 — Description of the Business and Spin-off for additional information on the major transactions that occurred on April 29, 2016 to effect the Spin-off.
Accumulated Deficit
Accumulated deficit of the Company, as shown in the consolidated balance sheets as of December 31, 2017 and 2016, represents the Company’s cumulative net losses since the Spin-off. The cumulative earnings and losses of the Company prior to the Spin-off were included in Due to Parent, net in the consolidated balance sheets prior to April 29, 2016.
F-33
QUORUM HEALTH CORPORATION
NOTES TO CONSOLIDATED AND COMBINED FINANCIAL STATEMENTS (CONTINUED)
Parent’s Equity
Prior to the Spin-off, the purchase of shares from noncontrolling interest partners and the changes in valuation of redeemable shares of noncontrolling interests investments were accounted for as Parent’s equity in the consolidated balance sheets. Parent’s equity was reclassified as additional paid-in capital in connection with the Spin-off.
NOTE 12 — INCOME TAXES
The Company and its subsidiaries are subject to U.S. federal income tax and income taxes of multiple state and local jurisdictions. The Company provides for income taxes based on enacted tax laws and tax rates in jurisdictions in which it conducts its operations. Prior to the Spin-off, the Company was included in the consolidated federal, state and local income tax returns filed by CHS and calculated income taxes for the purpose of carve-out financial statements using the “separate return method.” The Company deemed the amounts that it would have paid to or received from the U.S. Internal Revenue Service and other jurisdictions, had QHC not been a member of CHS’ consolidated tax group, to be immediately settled with CHS through Due to Parent, net in the consolidated balance sheets. Since the Spin-off, the Company has been filing its own consolidated federal, state and local income tax returns.
The following table provides a summary of the components of the provision for (benefit from) income taxes (in thousands):
| | Year Ended December 31, | |
| | 2017 | | | 2016 | | | 2015 | |
| | | | | | | | | | | | |
Current: | | | | | | | | | | | | |
Federal | | $ | — | | | $ | — | | | $ | — | |
State | | | 271 | | | | 530 | | | | 762 | |
Total provision for (benefit from) current income taxes | | | 271 | | | | 530 | | | | 762 | |
Deferred: | | | | | | | | | | | | |
Federal | | | (22,540 | ) | | | (51,177 | ) | | | 1,749 | |
State | | | 404 | | | | (3,228 | ) | | | 793 | |
Total provision for (benefit from) deferred income taxes | | | (22,136 | ) | | | (54,405 | ) | | | 2,542 | |
Total provision for (benefit from) income taxes | | $ | (21,865 | ) | | $ | (53,875 | ) | | $ | 3,304 | |
On December 22, 2017, the Tax Cuts and Jobs Act (the “Tax Act”) was signed into law. The Tax Act includes a number of changes to existing U.S. tax laws that impact the Company, most notably a reduction of the U.S. corporate tax rate from 35% to 21% for tax years after December 31, 2017. As a direct result of changes in tax law due to the passage of the Tax Act, the Company recorded a total tax benefit of $24.0 million during 2017 which is composed of two amounts: a tax benefit of $10.9 million in deferred income tax expense for the net change in its deferred tax liabilities at the new 21% tax rate, and a $13.1 million tax benefit in deferred income tax expense for the reduction in valuation allowance attributable to the change in net realizability of deferred tax assets. The Tax Act also provides for acceleration of depreciation for certain assets placed into service after September 27, 2017, as well as prospective changes beginning in 2018. These prospective changes include an increased limitation on the deductibility of executive compensation, a limitation on the deductibility of interest expense, new rules surrounding meals and entertainment expense and fines and penalties. Also, while net operating losses generated in the future may by carried forward indefinitely under the new law, there is a limitation on the amount that may be used in any given year. The Tax Act may also have an impact on projected future taxable income that could further affect valuation allowance considerations. In addition to the federal law, the Company awaits guidance from the states in which it files on how components of the Tax Act may be treated in these jurisdictions.
The $24.0 million tax benefit represents what the Company believes is the impact of the Tax Act, the key components being the re-measurement of deferred tax balances to the new corporate rate and reduction in valuation allowance as a result of anticipated realizability of deferred tax assets due to the change in tax law. As the benefit is based on currently available information and interpretations, which are continuing to evolve, the benefit should be considered provisional. The Company will continue to analyze additional information and guidance related to the Tax Act as supplemental legislation, regulatory federal or state guidance, or evolving technical interpretations become available. The final impacts may differ from the recorded amounts as of December 31, 2017, and the Company will continue to refine such amounts within the measurement period provided by Staff Accounting Bulletin No. 118. The Company expects to complete the analysis by the end of 2018.
The following table reconciles the provision for (benefit from) income taxes utilizing the statutory federal income tax rate to the Company’s effective income tax rate (dollars in thousands):
F-34
QUORUM HEALTH CORPORATION
NOTES TO CONSOLIDATED AND COMBINED FINANCIAL STATEMENTS (CONTINUED)
| | Year Ended December 31, | |
| | 2017 | | | 2016 | | | 2015 | |
| | Amount | | | % | | | Amount | | | % | | | Amount | | | % | |
| | | | | | | | | | | | | | | | | | | | | | | | |
Provision for (benefit from) income taxes at statutory federal tax rate | | $ | (46,978 | ) | | | 35.0 | % | | $ | (139,685 | ) | | | 35.0 | % | | $ | 2,814 | | | | 35.0 | % |
State income taxes, net of federal income tax benefit | | | (6,137 | ) | | | 4.6 | % | | | (47,749 | ) | | | 12.0 | % | | | (171 | ) | | | (2.1 | )% |
Net (income) loss attributable to noncontrolling interests | | | (641 | ) | | | 0.5 | % | | | (872 | ) | | | 0.2 | % | | | (1,189 | ) | | | (14.8 | )% |
Non-deductible goodwill and Spin-off costs | | | 535 | | | | (0.4 | )% | | | 36,009 | | | | (9.0 | )% | | | — | | | | — | % |
Change in valuation allowance (pre Tax Act) | | | 53,470 | | | | (39.8 | )% | | | 94,745 | | | | (23.7 | )% | | | 1,459 | | | | 18.2 | % |
Change in rate due to Tax Act | | | (10,934 | ) | | | 8.1 | % | | | — | | | | — | % | | | — | | | | — | % |
Change in valuation allowance due to Tax Act | | | (13,121 | ) | | | 9.8 | % | | | — | | | | — | % | | | — | | | | — | % |
All other items | | | 1,941 | | | | (1.5 | )% | | | 3,677 | | | | (1.0 | )% | | | 391 | | | | 4.8 | % |
Total provision for (benefit from) income taxes and effective tax rate | | $ | (21,865 | ) | | | 16.3 | % | | $ | (53,875 | ) | | | 13.5 | % | | $ | 3,304 | | | | 41.1 | % |
Deferred income taxes are determined based on the estimated future tax effects of differences between the financial statement carrying values and tax bases of the Company’s assets and liabilities under the provisions of the enacted tax laws.
The following table provides a summary of the components of deferred income tax assets and liabilities (in thousands):
| | December 31, | |
| | 2017 | | | 2016 | |
| | Assets | | | Liabilities | | | Assets | | | Liabilities | |
| | | | | | | | | | | | | | | | |
Net operating loss and credit carryforwards | | $ | 83,879 | | | $ | — | | | $ | 72,195 | | | $ | — | |
Property and equipment | | | 2,039 | | | | 1,416 | | | | — | | | | 10,447 | |
Prepaid expenses | | | — | | | | 2,836 | | | | — | | | | 6,874 | |
Goodwill and intangible assets | | | — | | | | 18,544 | | | | — | | | | 27,193 | |
Investments in unconsolidated affiliates | | | 140 | | | | — | | | | 298 | | | | — | |
Accounts receivable | | | 4,928 | | | | — | | | | 1,532 | | | | 10,290 | |
Accrued compensation and recruiting accruals | | | 8,743 | | | | 828 | | | | 14,968 | | | | 965 | |
Other accruals | | | 175 | | | | — | | | | 251 | | | | — | |
Deferred compensation | | | 9,160 | | | | — | | | | 10,208 | | | | — | |
Debt issuance costs | | | — | | | | 7,756 | | | | — | | | | 53 | |
Insurance and settlement reserves | | | 31,322 | | | | — | | | | 39,112 | | | | — | |
Total deferred income tax assets and liabilities, before valuation allowance | | | 140,386 | | | | 31,380 | | | | 138,564 | | | | 55,822 | |
Valuation allowance | | | (116,780 | ) | | | — | | | | (114,216 | ) | | | — | |
Total deferred income tax assets and liabilities | | $ | 23,606 | | | $ | 31,380 | | | $ | 24,348 | | | $ | 55,822 | |
Total deferred income tax liabilities, net | | | | | | $ | 7,774 | | | | | | | $ | 31,474 | |
As of December 31, 2017, the Company had federal net operating loss carryforwards of approximately $125 million, which will begin expiring in 2035. The Company also had state net operating loss carryforwards of approximately $668 million, which expire from 2018 to 2037. In addition, the Company has $0.5 million of refundable alternative minimum tax credit carryforwards and $0.4 million of Texas credit carryforwards which expire in 2027. The Company has concluded that it is not more likely than not that it will realize the benefit of its deferred tax assets, and as a result, has recognized a valuation allowance of $116.8 million. With respect to the deferred tax liabilities pertaining to goodwill and intangible assets, as included in the table above, goodwill purchased in connection with certain business acquisitions is amortizable for income tax reporting purposes. However, for financial reporting purposes, there is no corresponding amortization allowed with respect to such purchased goodwill. As the Company does not expect to realize its state deferred tax assets, it has not recognized the corresponding federal tax benefit, and as such, the amounts presented above for the years ended December 31, 2017 and 2016 do not include the federal tax benefit.
The Company’s valuation allowance increased $2.6 million during the year ended December 31, 2017 from $114.2 million to $116.8 million. This net increase was comprised of several factors. Prior to any consideration for any changes resulting from the effects of the Tax Act, the Company recorded an increase in its valuation allowance of $53.4 million through deferred tax expense to
F-35
QUORUM HEALTH CORPORATION
NOTES TO CONSOLIDATED AND COMBINED FINANCIAL STATEMENTS (CONTINUED)
offset additional deferred tax assets generated during the year resulting from the Company’s 2017 net operating loss. The Company recorded this valuation allowance because it has concluded that it is not more likely than not that it will realize the benefits of its deferred tax assets. In addition, the Company recorded a deferred tax benefit for a decrease of $37.7 million in its valuation allowance to offset a decrease in its deferred tax assets for the same amount to account for the Tax Act’s reduction in the federal tax rate from 35% to 21%. The Company also recorded an income tax benefit through a reduction in its valuation allowance of $13.1 million to account for the change in net realizability of deferred tax assets since the Tax Act has made the net operating loss carryforward period indefinite and has limited the amount of net operating loss usage to 80% of taxable income starting in 2018.
In the ordinary course of business, there is inherent uncertainty in quantifying the Company’s income tax positions. The Company assesses its income tax positions and records tax benefits for all tax years subject to examination based on management’s evaluation of the facts, circumstances, and information available at the reporting date. The Company is not aware of any unrecognized tax benefits; and therefore has not recorded any such amounts for the years ended December 31, 2017, 2016 and 2015. The Company classified interest and penalties, if any, related to its tax positions as a component of the provision for (benefit from) income taxes in the consolidated and combined statements of income.
NOTE 13 — EARNINGS PER SHARE
The following table provides a summary of the computation of basic and diluted earnings (loss) per share (in thousands, except earnings per share and shares):
| | Year Ended December 31, | |
| | 2017 | | | 2016 | | | 2015 | |
| | | | | | | | | | | | |
Numerator: | | | | | | | | | | | | |
Net income (loss) | | $ | (112,357 | ) | | $ | (345,197 | ) | | $ | 4,735 | |
Less: Net income (loss) attributable to noncontrolling interests | | | 1,833 | | | | 2,491 | | | | 3,398 | |
Net income (loss) attributable to Quorum Health Corporation | | $ | (114,190 | ) | | $ | (347,688 | ) | | $ | 1,337 | |
Denominator: | | | | | | | | | | | | |
Weighted-average shares outstanding - basic and diluted | | | 28,113,566 | | | | 28,413,247 | | | | 28,412,054 | |
| | | | | | | | | | | | |
Earnings (loss) per share attributable to Quorum Health Corporation stockholders - basic and diluted | | $ | (4.06 | ) | | $ | (12.24 | ) | | $ | 0.05 | |
For comparative purposes, the Company used 28,412,054 shares as the number of basic and diluted shares outstanding for all periods prior to the Spin-off in calculating basic and diluted earnings (loss) per share. This number of shares represents the number of shares issued on the Spin-off date. Due to the net loss attributable to Quorum Health Corporation for the years ended December 31, 2017 and 2016, no incremental shares were included in diluted earnings (loss) per share for these periods because the net effect of the shares would be anti-dilutive. No incremental shares were considered for any periods prior to the Spin-off.
NOTE 14 — ADDITIONAL CASH FLOW INFORMATION
During the years ended December 31, 2017 and 2016, the Company reclassified certain assets and liabilities as held for sale, which are included as separate line items in the consolidated balance sheets as of December 31, 2017 and 2016. In addition, the Company recorded certain opening balance sheet adjustments in the second and fourth quarters of the year ended December 31, 2016, which included non-cash components that were primarily transfers of assets and liabilities from CHS to effect the Spin-off. See Note 1 — Description of the Business and Spin-off for additional information on the Spin-off.
NOTE 15 — SEGMENTS
The Company’s operations consist of two distinct operating segments, its hospital operations business and its hospital management advisory and healthcare consulting services business. The hospital operations segment includes the operations of the Company’s owned and leased hospitals and their affiliated outpatient facilities that provide inpatient and outpatient healthcare services. The hospital management advisory and healthcare consulting services segment includes the operations of QHR. Both segments meet the criteria to be classified as a separate reportable segment. The financial information for the Company’s corporate functions has been reported in the tables below as part of the all other reportable segment.
F-36
QUORUM HEALTH CORPORATION
NOTES TO CONSOLIDATED AND COMBINED FINANCIAL STATEMENTS (CONTINUED)
Prior to the Spin-off, the Company included management fees allocated from Parent in the operating expenses of the hospital operations segment. Following the Spin-off, the Company began presenting general and administrative costs for corporate functions in the operating expenses of the all other reportable segment.
The following tables provide a summary of financial information related to the Company’s reportable segments (in thousands):
| | Year Ended December 31, | |
| | 2017 | | | 2016 | | | 2015 | |
| | | | | | | | | | | | |
Net operating revenues: | | | | | | | | | | | | |
Hospital operations | | $ | 1,987,973 | | | $ | 2,052,751 | | | $ | 2,096,831 | |
QHR operations | | | 80,863 | | | | 85,533 | | | | 90,507 | |
All other | | | 3,334 | | | | 183 | | | | — | |
Total net operating revenues | | $ | 2,072,170 | | | $ | 2,138,467 | | | $ | 2,187,338 | |
| | | | | | | | | | | | |
Adjusted EBITDA: | | | | | | | | | | | | |
Hospital operations | | $ | 175,597 | | | $ | 184,000 | | | $ | 249,375 | |
QHR operations | | | 20,599 | | | | 16,980 | | | | 14,246 | |
All other | | | (54,351 | ) | | | (38,058 | ) | | | 46 | |
Total Adjusted EBITDA | | $ | 141,845 | | | $ | 162,922 | | | $ | 263,667 | |
| | December 31, | |
| | 2017 | | | 2016 | |
| | | | | | | | |
Assets: | | | | | | | | |
Hospital operations | | $ | 1,687,576 | | | $ | 1,802,121 | |
QHR operations | | | 61,752 | | | | 75,113 | |
All other | | | 79,513 | | | | 117,136 | |
Total assets | | $ | 1,828,841 | | | $ | 1,994,370 | |
The following table provides a reconciliation of Adjusted EBITDA to net income (loss), its most directly comparable U.S. GAAP financial measure (in thousands):
| | Year Ended December 31, | |
| | 2017 | | | 2016 | | | 2015 | |
| | | | | | | | | | | | |
Adjusted EBITDA | | $ | 141,845 | | | $ | 162,922 | | | $ | 263,667 | |
Interest expense, net | | | (122,077 | ) | | | (113,440 | ) | | | (98,290 | ) |
(Provision for) benefit from income taxes | | | 21,865 | | | | 53,875 | | | | (3,304 | ) |
Depreciation and amortization | | | (82,155 | ) | | | (117,288 | ) | | | (128,001 | ) |
Legal, professional and settlement costs | | | (6,001 | ) | | | (7,342 | ) | | | — | |
Impairment of long-lived assets and goodwill | | | (47,281 | ) | | | (291,870 | ) | | | (13,000 | ) |
Loss (gain) on sale of hospitals, net | | | 5,243 | | | | (2,150 | ) | | | — | |
Transaction costs related to the Spin-off | | | (253 | ) | | | (5,488 | ) | | | (16,337 | ) |
Post-spin headcount reductions | | | (2,543 | ) | | | (1,617 | ) | | | — | |
Change in estimate related to collectability of patient accounts receivable | | | (21,000 | ) | | | (22,799 | ) | | | — | |
Net income (loss) | | $ | (112,357 | ) | | $ | (345,197 | ) | | $ | 4,735 | |
NOTE 16 — STOCK-BASED COMPENSATION
On April 1, 2016, the Company adopted the Quorum Health Corporation 2016 Stock Award Plan (the “2016 Stock Award Plan”). The Company filed a Registration Statement on Form S-8 on April 29, 2016 to register 4,700,000 shares of QHC common stock that may be issued under the plan.
As defined in the Separation and Distribution Agreement, QHC and CHS employees who held CHS restricted stock awards on the Record Date received QHC restricted stock awards for the number of whole shares, rounded down, of QHC common stock that
F-37
QUORUM HEALTH CORPORATION
NOTES TO CONSOLIDATED AND COMBINED FINANCIAL STATEMENTS (CONTINUED)
they would have received as a shareholder of CHS as if the underlying CHS stock were unrestricted on the Record Date, except, that with respect to a portion of CHS restricted stock awards granted to any QHC employees on March 1, 2016 that were cancelled and forfeited on the Spin-off date. The QHC restricted stock awards received by QHC and CHS employees in connection with the Spin-off vest on the same terms as the CHS restricted stock awards to which they relate, through the continued service by such employees with their respective employer. CHS restricted stock awards were adjusted by increasing the number of shares of CHS stock subject to restricted stock awards by an amount of whole shares, rounded down, necessary to preserve the intrinsic value of such awards at the Spin-off date. QHC did not issue any stock options as part of the distribution of shares to holders of CHS stock options in connection with the Spin-off.
The following table provides a summary of the activity related to unvested QHC restricted stock awards held by QHC and CHS employees from the Spin-off date through December 31, 2017 (in shares):
| | QHC Awards Distributed in Spin-off | |
| | QHC Employees | | | CHS Employees | | | Total | |
| | | | | | | | | | | | |
Unvested restricted stock awards at Spin-off date | | | 54,321 | | | | 638,088 | | | | 692,409 | |
Vested | | | (1,317 | ) | | | (6,098 | ) | | | (7,415 | ) |
Forfeited | | | (542 | ) | | | (10,465 | ) | | | (11,007 | ) |
Unvested restricted stock awards at December 31, 2016 | | | 52,462 | | | | 621,525 | | | | 673,987 | |
Vested | | | (34,131 | ) | | | (204,858 | ) | | | (238,989 | ) |
Forfeited | | | (14,174 | ) | | | (153,944 | ) | | | (168,118 | ) |
Unvested restricted stock awards at December 31, 2017 | | | 4,157 | | | | 262,723 | | | | 266,880 | |
The following table provides a summary of the activity related to unvested restricted stock awards granted subsequent to the Spin-off:
| | QHC Awards Granted | |
| | Subsequent to Spin-off | |
| | | | | | Weighted- | |
| | | | | | Average | |
| | | | | | Grant Date | |
| | | | | | Fair Value | |
| | Shares | | | Per Share | |
| | | | | | | | |
Unvested restricted stock awards at Spin-off date | | | — | | | $ | — | |
Granted | | | 1,081,005 | | | | 12.77 | |
Vested | | | — | | | | — | |
Forfeited | | | — | | | | — | |
Unvested restricted stock awards at December 31, 2016 | | | 1,081,005 | | | | 12.77 | |
Granted | | | 1,142,571 | | | | 7.54 | |
Vested | | | (282,582 | ) | | | 12.77 | |
Forfeited | | | (161,506 | ) | | | 10.90 | |
Unvested restricted stock awards at December 31, 2017 | | | 1,779,488 | | | $ | 9.58 | |
During the year ended December 31, 2017, the Company granted 230,000 performance-based restricted stock awards to certain of its executive officers. If the performance-based objectives are attained in accordance with the targets set forth in the performance-based restricted stock award agreement, the restrictions on the restricted stock awards will lapse on the second anniversary of the grant date. In addition, the Company granted 720,000 time-based restricted stock awards which will lapse in equal installments on each of the first three anniversaries of the grant date. In addition, the Company granted 192,571 time-based restricted stock awards to its non-employee directors which will lapse on February 22, 2018.
During the year ended December 31, 2016, the Company granted 460,000 performance-based restricted stock awards to certain of its executive officers. The performance-based objectives set forth in the performance-based restricted stock award agreement were achieved; therefore, the restrictions on the restricted stock awards will lapse in equal installments on each of the first three anniversaries of the grant date. In addition, the Company granted 551,005 time-based restricted stock awards of which 445,000 will lapse in equal installments on each of the first three anniversaries of the grant date and 106,005 will lapse in equal installments on the second and third anniversaries of the grant date. In addition, the Company granted 70,000 time-based restricted stock to its non-employee directors which will lapse on the first anniversary of the grant date.
F-38
QUORUM HEALTH CORPORATION
NOTES TO CONSOLIDATED AND COMBINED FINANCIAL STATEMENTS (CONTINUED)
Following the Spin-off, the Company began recording stock-based compensation expense related to the vesting of QHC restricted stock awards issued to QHC employees on the Spin-off date, CHS restricted stock awards held by QHC employees on the Spin-off date, and all restricted stock awards granted by QHC after the Spin-off. Stock-based compensation expense is recognized as a component of salaries and benefits expense in the consolidated and combined statements of income. Prior to the Spin-off, an estimated portion of CHS’ stock-based compensation expense was allocated to QHC through the monthly corporate management fee from CHS, which was recorded in other operating expenses in the consolidated and combined statements of income, and therefore is not included in stock-based compensation expense in the table below. The estimated costs allocated to QHC from CHS for stock-based compensation related to QHC’s employees were $2.3 million and $7.0 million for the years ended December 31, 2016 and 2015, respectively.
The following table provides a summary of stock-based compensation expense for the periods subsequent to the Spin-off (in thousands):
| | Year Ended December 31, | |
| | 2017 | | | 2016 | | | 2015 | |
| | | | | | | | | | | | |
Stock-based compensation resulting from the Spin-off | | $ | 2,225 | | | $ | 3,089 | | | $ | — | |
Stock-based compensation related to grants following the Spin-off | | | 7,727 | | | | 4,352 | | | | — | |
Total stock-based compensation expense | | $ | 9,952 | | | $ | 7,441 | | | $ | — | |
As of December 31, 2017, the Company had unrecognized stock-based compensation expense of $0.4 million related to the outstanding unvested QHC and CHS restricted stock awards held by QHC employees as of the Spin-off date and $9.8 million of unrecognized stock-based compensation expense related to QHC restricted stock awards that were granted subsequent to the Spin-off.
NOTE 17 — BENEFIT PLANS
The Company maintains various benefit plans, including defined contribution plans, a defined benefit plan and deferred compensation plans, of which certain of the Company’s subsidiaries are the plan sponsors. The rights and obligations of certain of these plans were transferred from CHS in connection with the Spin-off, pursuant to the Separation and Distribution Agreement.
Defined Contribution Plans
The Quorum Health Retirement Savings Plan (the “Retirement Savings Plan”) is a defined contribution plan, which was established on January 1, 2016 by CHS in anticipation of the Spin-off. Prior to the Spin-off, the cumulative liability for these benefit costs was recorded in Due to Parent, net. The assets and liabilities under this plan were transferred to QHC in connection with the Spin-off. The Retirement Savings Plan covers the majority of the employees at the Company’s subsidiaries. The Company has other minor defined contribution plans at certain of its hospitals that cover employees under the terms of these individual plans. Total expenses to the Company under all defined contribution plans was $1.2 million, $13.6 million and $13.0 million for the years ended December 31, 2017, 2016 and 2015, respectively. The benefit costs associated with the Retirement Savings Plan are recorded as salaries and benefits expense in the consolidated and combined statements of income.
Deferred Compensation Plans
Prior to the Spin-off, certain of the Company’s employees participated in CHS’ unfunded deferred compensation plans. Under these CHS plans, participants were allowed to defer receipt of a portion of their compensation. The election period for those employees continued under the CHS plan through December 31, 2016. In January 2017, CHS transferred the assets and liabilities attributable to QHC employees under these plans to QHC and they were rolled into a new plan established by QHC, as described below. The assets and liabilities transferred in January 2017 were of $22.9 million and $23.9 million, respectively.
On August 18, 2016, the Compensation Committee of the Board of Directors adopted the Executive Nonqualified Excess Plan Adoption Agreement (the “Adoption Agreement”) and the Executive Nonqualified Excess Plan Document (the “Plan Document”), that together, the Adoption Agreement names as the QHCCS, LLC Nonqualified Deferred Compensation Plan (the “NQDCP”). The NQDCP is an unfunded, nonqualified deferred compensation plan that provides deferred compensation benefits for a select group of management, highly compensated employees and independent contractors of the Company’s wholly-owned subsidiary, QHCCS, LLC, a Delaware limited liability company (“QHCCS”), including the Company’s named executive officers. The NQDCP permits participants to defer a portion of their annual base salary, service bonus and performance-based compensation, as well as up to 100% of their incentive compensation in any calendar year. In addition to participant deferrals, QHCCS, and/or its affiliates may make discretionary credits to participants’ accounts for any year. As of December 31, 2017, the assets and liabilities under this plan were $23.1 million and $24.3 million, respectively, and are included in other long-term assets and other long-term liabilities in the consolidated balance sheet.
F-39
QUORUM HEALTH CORPORATION
NOTES TO CONSOLIDATED AND COMBINED FINANCIAL STATEMENTS (CONTINUED)
Supplemental Executive Retirement Plans
On April 1, 2016, the Board adopted the Quorum Health Corporation Supplemental Executive Retirement Plan (the “Original SERP Plan”). Pursuant to the Employee Matters Agreement between the Company and CHS, the Company assumed the liabilities for all obligations under the Original SERP Plan as of April 29, 2016, the Spin-off date, which related to QHC employees, as defined in the Employee Matters Agreement. In addition, as defined by the Employee Matters Agreement, no additional benefits were to accrue under the Original SERP Plan following the Spin-off and no assets were transferred to the Company related to the Original SERP Plan. The accrued benefit liability transferred to the Company for the Original SERP Plan was $6.0 million.
On May 24, 2016, the Board, upon recommendation of the Compensation Committee, approved the Company’s Amended and Restated Supplemental Executive Retirement Plan (the “Amended and Restated SERP”), in order to accrue additional benefits with respect to QHC employees who otherwise qualify as “Participants” under the Amended and Restated SERP. The Amended and Restated SERP is a noncontributory non-qualified deferred compensation plan under Section 409A of the Internal Revenue Code. The Company uses a December 31 measurement date for the benefit obligations and a January 1 measurement date for the net periodic benefit costs of the Amended and Restated SERP. The benefit obligations under this plan were unfunded as of December 31, 2017.
The following table provides a summary of the components of net periodic benefit costs (in thousands):
| | Year Ended December 31, | |
| | 2017 | | | 2016 | | | 2015 | |
| | | | | | | | | | | | |
Service cost | | $ | 1,347 | | | $ | 1,270 | | | $ | — | |
Interest cost | | | 299 | | | | 237 | | | | — | |
Amortizations: | | | | | | | | | | | | |
Prior service cost (credit) | | | 396 | | | | 268 | | | | — | |
Net (gain) loss | | | 3 | | | | 12 | | | | — | |
Total net periodic benefit cost | | $ | 2,045 | | | $ | 1,787 | | | $ | — | |
The following table provides a summary of the weighted-average assumptions used by the Company to determine its net periodic benefit costs:
| | Year Ended December 31, | |
| | 2017 | | | 2016 | | | 2015 | |
| | | | | | | | | | | | |
Discount rate | | | 3.6 | % | | | 3.2 | % | | | — | % |
Rate of compensation increase | | | 2.0 | % | | | 3.0 | % | | | — | % |
The following table provides a summary of the changes recognized in other comprehensive income (loss) (in thousands):
| | December 31, | |
| | 2017 | | | 2016 | | | 2015 | |
| | | | | | | | | | | | |
Prior service cost (credit) | | $ | — | | | $ | 2,949 | | | $ | — | |
Net loss (gain) arising during period | | | (146 | ) | | | 14 | | | | — | |
Amounts recognized as a component of net periodic benefit cost: | | | | | | | | | | | | |
Amortization or curtailment recognition of prior service (cost) credit | | | (396 | ) | | | (264 | ) | | | — | |
Amortization or settlement recognition of net gain (loss) | | | (3 | ) | | | (3 | ) | | | — | |
Total recognized in other comprehensive loss (income) | | $ | (545 | ) | | $ | 2,696 | | | $ | — | |
The estimated prior service cost that will be amortized from accumulated other comprehensive income (loss) into net periodic benefit cost for the year ended December 31, 2018 is $0.3 million. The estimated actuarial loss that will be amortized or recognized from accumulated other comprehensive income into net periodic benefit cost is minimal.
F-40
QUORUM HEALTH CORPORATION
NOTES TO CONSOLIDATED AND COMBINED FINANCIAL STATEMENTS (CONTINUED)
The following table provides a summary of the changes in the benefit obligation (in thousands):
| | December 31, | |
| | 2017 | | | 2016 | |
| | | | | | | | |
Benefit obligation at beginning of period | | $ | 9,434 | | | $ | — | |
Benefit obligation transferred from the Spin-off | | | — | | | | 5,964 | |
Service cost | | | 1,347 | | | | 1,270 | |
Interest cost | | | 299 | | | | 190 | |
Plan amendments | | | — | | | | 2,921 | |
Benefits paid | | | (2,275 | ) | | | — | |
Actuarial (gain) loss | | | (146 | ) | | | (911 | ) |
Benefit obligation at end of period | | $ | 8,659 | | | $ | 9,434 | |
As of December 31, 2017, the long-term portion of the Company’s benefit obligation liability was $8.7 million and there was no current portion of the benefit obligation liability. As of December 31, 2016, the current and long-term portions of the Company’s benefit obligation liability were $2.3 million and $7.1 million, respectively. The current portion is recognized as a component of accrued salaries and benefits and the long-term portion is recognized as a component of other long-term liabilities in the consolidated balance sheets. The accumulated benefit obligation at December 31, 2017 was $5.2 million.
The following table provides a summary of the weighted-average assumptions used by the Company to determine its benefit obligation:
| | December 31, | |
| | 2017 | | | 2016 | |
| | | | | | | | |
Discount rate | | | 3.3 | % | | | 3.6 | % |
Rate of compensation increase | | | 2.0 | % | | | 2.0 | % |
The following table provides a summary of the expected future benefit payments for each of the next five years and the five years thereafter (in thousands):
2018 | | $ | — | |
2019 | | | — | |
2020 | | | — | |
2021 | | | 948 | |
2022 | | | — | |
Five years thereafter | | | 10,448 | |
Total expected future benefit payments | | $ | 11,396 | |
Director’s Fees Deferral Plan
On September 16, 2016, the Board adopted the Quorum Health Corporation Director’s Fees Deferral Plan (the “Director’s Plan”). Pursuant to the Director’s Plan, members of the Board may elect to defer and accumulate fees, including retainer fees and fees for attendance at Board meetings and Board committees. Under this plan, a director may elect that all or any specified portion of the director’s fees to be earned during a calendar year be credited to a director’s cash account and/or a director’s stock unit account maintained on the individual director’s behalf in lieu of payment. Payment of amounts credited to a director’s cash account and stock unit account will be made upon a payment commencement event, as defined in the Director’s Plan, in accordance with the payment method elected by each director, either in lump sum or in a number of annual installments, not to exceed 15 installments. The Director’s Plan covers directors of the Board not employed by the Company or any of its subsidiaries. Pursuant to the Director’s Plan, the Company registered and made available for issuance under the Director’s Plan a maximum of 150,000 shares of QHC common stock.
Defined Benefit Pension Plan
The Company provides benefits to employees at one of its hospitals through a defined benefit plan (the “Pension Plan”). The Pension Plan provides benefits to covered individuals satisfying certain age and service requirements. Employer contributions to the Pension Plan are made by the Company in accordance with the minimum funding requirements of ERISA. The Company expects to make contributions to the Pension Plan for the full year 2018 of $0.4 million. The Company uses a December 31 measurement date for the benefit obligations and a January 1 measurement date for the net periodic benefit costs of the Pension Plan. Variances from
F-41
QUORUM HEALTH CORPORATION
NOTES TO CONSOLIDATED AND COMBINED FINANCIAL STATEMENTS (CONTINUED)
actuarially assumed rates result in increases or decreases in the benefit obligation, net periodic benefit cost and funding requirements in future periods. The weighted-average assumptions used for determining the net periodic benefit costs for the year ended December 31, 2017 were a discount rate of 3.6%, an annual salary increase of 3.5% and an expected long-term rate of return on assets of 6.25%. The weighted-average assumptions used for determining the net periodic benefit costs for the year ended December 31, 2016 were a discount rate of 3.75%, an annual salary increase of 3.0% and an expected long-term rate of return on assets of 7.0%. Net periodic benefits costs related to the Pension Plan were $0.1 million, $0.3 million and $0.3 million for the years ended December 31, 2017, 2016 and 2015, respectively. QHC recognizes the unfunded liability of the Pension Plan in other long-term liabilities in the consolidated balance sheets. Unrecognized gains (losses) and prior service credits (costs) are recorded as other comprehensive income (loss). The accrued benefit obligation liability for the Pension Plan was $0.8 million and $1.1 million at December 31, 2017 and 2016, respectively.
NOTE 18 — RELATED PARTY TRANSACTIONS
CHS was a related party to QHC prior to the Spin-off. The significant transactions and balances with CHS prior to the Spin-off and the agreements between QHC and CHS as of and subsequent to the Spin-off are described below.
Carve-Out from Parent
Prior to the Spin-off, QHC did not operate as a separate company and stand-alone financial statements were not prepared. Historically, QHC was managed and operated in the normal course of business with all other hospitals and affiliates of CHS. Accordingly, for the purposes of the carve-out financial statements related to the Spin-off, a combined opening balance sheet for the QHC hospitals and QHR was established. The combined opening balance sheet included the assets and liabilities of QHC hospitals and QHR, as reported by CHS, and a net liability to CHS, referred to as Due to Parent, net, for the net investment held by CHS related to its contribution of these net assets. The operating results of the QHC hospitals and QHR prior to the Spin-off were derived from the CHS operating results for these entities. In addition, certain corporate overhead costs were allocated to QHC from CHS during the carve-out period for the purpose of estimating QHC’s share of these expenses.
Allocated Costs from CHS during the Carve-Out Period
CHS allocated costs to QHC during the carve-out period for a portion of its corporate overhead costs and any other costs related to QHC hospitals and QHR that were paid by CHS or covered by an agreement, policy or contract owned by CHS.
The following table provides a summary of the allocated costs to QHC from CHS for the periods prior to the Spin-off (in thousands):
| | Year Ended December 31, | |
| | 2016 | | | 2015 | |
| | | | | | | | |
Insurance costs | | $ | 44,246 | | | $ | 134,290 | |
Management fees from Parent | | | 11,792 | | | | 36,466 | |
All other allocated costs | | | 25,021 | | | | 72,262 | |
Total related party operating costs and expenses | | $ | 81,059 | | | $ | 243,018 | |
The allocation of insurance costs from CHS primarily included costs for self-insurance estimates and third-party policies related to employee health benefits, professional and general liability and workers’ compensation liability coverage. Insurance costs were primarily allocated to QHC based on claims history of the QHC hospitals, as determined on an individual hospital level. Corporate management fees were allocated to QHC for certain corporate functions of CHS, including services such as, among others, executive and divisional management, treasury, accounting, risk management, legal, procurement, human resources, information technology support and other administrative support services. These corporate overhead costs were allocated to QHC using a ratio based on the number of licensed beds at each QHC hospital in proportion to CHS’ total licensed beds. This methodology used was comparable to how CHS allocated corporate overhead costs to all of its hospitals through a management fee charge that eliminates in consolidation. All other allocated costs in the table above include any other costs allocated to QHC hospitals or QHR that were not part of management fees. These costs were allocated to QHC using ratios based on revenues, expenses or licensed beds. If possible, allocations were made on a specific identification basis.
Following the Spin-off, the Company began performing corporate functions using internal resources or purchased services, certain of which are being provided by CHS pursuant to the transition services agreements and other ancillary agreements. See the section “Agreements with CHS Related to the Spin-off” below.
F-42
QUORUM HEALTH CORPORATION
NOTES TO CONSOLIDATED AND COMBINED FINANCIAL STATEMENTS (CONTINUED)
Due to Parent, Net
Prior to the Spin-off, Due to Parent, net in the consolidated balance sheets represented the Company’s cumulative liability to CHS for the net assets of QHC hospitals and QHR, as well as an allocation of costs for corporate functions. See Note 1 — Description of the Business and Spin-off and Note 2 — Basis of Presentation and Significant Accounting Policies — Due to Parent, net for additional information on the types of transactions settled through Due to Parent, net during the carve-out period and the transactions that occurred to settle this liability in connection with the Spin-off.
During the carve-out period, QHC was charged interest on a monthly basis by CHS on the amount of Due to Parent, net outstanding at the end of each month. Interest rates were variable and ranged from 4% to 7% during the carve-out period. Interest expense incurred on Due to Parent, net was recorded as an increase in the Due to Parent, net liability and was deemed settled each month. The total amount of related party interest expense arising from the liability with CHS was $35.8 million and $98.0 million for the years ended December 31, 2016 and 2015, respectively.
Agreements with CHS Related to the Spin-off
In connection with the Spin-off and effective as of April 29, 2016, the Company entered into certain agreements with CHS that allocated between the Company and CHS the various assets, employees, liabilities and obligations (including investments, property, employee benefits and tax-related assets and liabilities) that were previously part of CHS. In addition, these agreements govern certain relationships between, and activities of, the Company and CHS for a definitive period of time after the Spin-off, as specified by each individual agreement.
The agreements were as follows:
| • | Separation and Distribution Agreement. This agreement governed the principal actions of both the Company and CHS that needed to be taken in connection with the Spin-off. It also sets forth other agreements that govern certain aspects of the Company’s relationship with CHS following the Spin-off. |
| • | Tax Matters Agreement. This agreement governs respective rights, responsibilities and obligations of the Company and CHS after the Spin-off with respect to deferred tax liabilities and benefits, tax attributes, tax contests and other tax sharing regarding U.S. federal, state and local income taxes, other tax matters and related tax returns. |
| • | Employee Matters Agreement. This agreement governs certain compensation and employee benefit obligations with respect to the current and former employees and non-employee directors of both the Company and CHS. It also allocated liabilities and responsibilities relating to employment matters, employee compensation, employee benefit plans and programs as of the Spin-off date. |
In addition to the agreements referenced above, the Company entered into certain transition services agreements and other ancillary agreements with CHS defining agreed upon services to be provided by CHS to certain or all QHC hospitals, as determined by each agreement, commencing on the Spin-off date. The agreements generally have terms of five years.
A summary of the major provisions of the transition services agreements follows:
| • | Shared Services Centers Transition Services Agreement. This agreement defines services to be provided by CHS related to billing and collections utilizing CHS shared services centers. Services include, but are not limited to, billing and receivables management, statement processing, denials management, cash posting, patient customer service, and credit balance and other account research. In addition, it provides for patient pre-arrival services, including pre-registration, insurance verification, scheduling and charge estimates. Fees are based on a percentage of cash collections each month. |
| • | Computer and Data Processing Transition Services Agreement. This agreement defines services to be provided by CHS for information technology infrastructure, support and maintenance. Services include, but are not limited to, operational support for various applications, oversight, maintenance and information technology support services, such as helpdesk, product support, network monitoring, data center operations, service ticket management and vendor relations. Fees are based on both a fixed charge for labor costs, as well as direct charges for all third-party vendor contracts entered into by CHS on QHC’s behalf. |
| • | Receivables Collection Agreement (“PASI”). This agreement defines services to be provided by CHS’ wholly-owned subsidiary, PASI, which currently serves as a third-party collection agency to QHC related to accounts receivable collections of both active and bad debt accounts of QHC hospitals, including both receivables that existed as of the Spin-off date and those that have occurred since the Spin-off date. Services include, but are not limited to, self-pay collections, insurance follow-up, collection letters and calls, payment arrangements, payment posting, dispute resolution and credit balance research. Fees are based on the type of service and are calculated based on a percentage of recoveries. |
F-43
QUORUM HEALTH CORPORATION
NOTES TO CONSOLIDATED AND COMBINED FINANCIAL STATEMENTS (CONTINUED)
| • | Billing and Collection Agreement (“PPSI”). This agreement defines services to be provided by CHS related to collections of accounts receivable generated by the Company’s affiliated outpatient healthcare facilities. Services include, but are not limited to, self-pay collections, insurance follow-up, collection letters and calls, payment arrangements, payment posting, dispute resolution and credit balance research. Fees are based on the type of service and are calculated based on a percentage of recoveries. |
| • | Employee Service Center Agreement. This agreement defines services to be provided by CHS related to payroll processing and human resources information systems support. Fees are based on a fixed charge per employee headcount per month. |
| • | Eligibility Screening Services Agreement. This agreement defines services to be provided by CHS for financial and program criteria screening related to Medicaid or other program eligibility for pure self-pay patients. Fees are based on a fixed charge for each hospital receiving services. |
The total expenses recorded by the Company under transition services agreements with CHS following the Spin-off were $63.5 million and $44.7 million for the years ended December 31, 2017 and 2016, respectively. The total expenses recorded by the Company under transition services agreements with CHS following the Spin-off combined with the allocations from CHS for these same services prior to the Spin-off were $63.5 million and $66.4 million for the year ended December 31, 2017 and 2016, respectively. Allocations from CHS for these services were $60.2 million for the year ended December 31, 2015. The Company is disputing in arbitration, among other issues and actions, certain charges and lack of performance of various obligations under the transition services agreements with CHS.
NOTE 19 — COMMITMENTS AND CONTINGENCIES
Legal Matters
The Company is a party to various legal, regulatory and governmental proceedings incidental to its business. Based on current knowledge, management does not believe that loss contingencies arising from pending legal, regulatory and governmental proceedings, including the matters described herein, will have a material adverse effect on the operating results, financial position or liquidity of the Company. However, in light of the inherent uncertainties involved in these matters, some of which are beyond the Company’s control, and the very large or indeterminate damages sought in some of these matters, an adverse outcome in one or more of these matters could be material to the Company’s results of operations or cash flows for any particular reporting period.
In connection with the Spin-off, CHS agreed to indemnify QHC for certain liabilities relating to outcomes or events occurring prior to the closing of the Spin-off, including (i) certain claims and proceedings known to be outstanding on or prior to the closing date of the Spin-off and (ii) certain claims, proceedings and investigations by governmental authorities or private plaintiffs related to activities occurring at or related to the Company’s healthcare facilities prior to the closing date of the Spin-off, but only to the extent, in the case of clause (ii), that such claims are covered by insurance policies maintained by CHS, including professional and general liability and workers’ compensation liability. In this regard, CHS will continue to be responsible for certain Health Management Associates, Inc. legal matters covered by its contingent value rights agreement that relate to the portion of CHS’ business now held by QHC. Notwithstanding the foregoing, CHS is not indemnifying QHC in respect of any claims or proceedings arising out of, or related to, the business operations of QHR at any time or its compliance with the Corporate Integrity Agreement (“CIA”) with the United States Department of Health and Human Services Office of the Inspector General (“OIG”). Subsequent to the Spin-off, the OIG entered into an “Assumption of CIA Liability Letter” with the Company reiterating the applicability of the CIA to certain of the Company’s hospitals, although the OIG declined to enter into a separate agreement with the Company.
With respect to all legal, regulatory and governmental proceedings, the Company considers the likelihood of a negative outcome. If the Company determines the likelihood of a negative outcome with respect to any such matter is probable and the amount of the loss can be reasonably estimated, the Company records an accrual for the estimated amount of loss for the expected outcome of the matter. If the likelihood of a negative outcome with respect to material matters is reasonably possible and the Company is able to determine an estimate of the amount of possible loss or a range of loss, whether in excess of a related accrued liability or where there is no accrued liability, the Company discloses the estimate of the amount of possible loss or range of loss. However, the Company is unable to estimate an amount of possible loss or range of loss in some instances based on the significant uncertainties involved in, or the preliminary nature of, certain legal, regulatory and governmental matters.
Government Investigations
| • | Tooele, Utah — Physician Compensation. On May 5, 2016, the Company’s hospital in Tooele, Utah received a Civil Investigative Demand (“CID”) from the Office of the United States Attorney in Salt Lake City, Utah concerning allegations that the hospital and clinic corporation submitted or caused to be submitted false claims to the government for services referred by physicians with whom the hospital and clinic had inappropriate financial relationships, which |
F-44
QUORUM HEALTH CORPORATION
NOTES TO CONSOLIDATED AND COMBINED FINANCIAL STATEMENTS (CONTINUED)
| | allegedly violated federal law. The CID requested records and documentation concerning physician compensation. Because this matter remains at a preliminary stage, there are not sufficient facts available for the Company to assess what the outcome may be or to determine any estimate of the amount of loss or range of loss. The Company is fully cooperating with this investigation. |
| • | Blue Island, Illinois — Patient Status. On October 9, 2015, the Company’s hospital in Blue Island, Illinois received a CID from the Office of the United States Attorney in Chicago, Illinois concerning allegations of upcoding observation and other outpatient services and improperly falsifying inpatient admission orders. To date, the hospital has produced a significant amount of documents in response to requests for emails, medical records and documentation concerning status change from observation to inpatient, and the government has taken CID testimony from former hospital employees. The Company is unable to predict the outcome of this investigation. However, it is reasonably possible that the Company may incur a loss in connection with this investigation. The Company is unable to reasonably estimate the amount or range of such reasonably possible loss given that the investigation is still ongoing. Under some circumstances, losses incurred in connection with an adverse resolution in this investigation could be material. The Company is fully cooperating with this investigation. |
Commercial Litigation and Other Lawsuits
| • | Arbitration with Community Health Systems, Inc. On August 4, 2017, the Company received a demand for arbitration from CHS seeking payment of certain amounts the Company has withheld pursuant to two transition services agreements. The Company contends that the amounts are not payable to CHS and were not properly billed by CHS under the agreements. The matter is pending before the American Arbitration Association. CHS seeks payment of approximately $9.0 million relating to two of the transition service agreements. The Company intends to vigorously contest the charges as not payable to CHS under the transition service agreements and has made a counterclaim for substantial damages the Company believes it has suffered as a result of the transition service agreements and other actions taken by CHS in connection with the Spin-off. The matter is at a preliminary stage and the Company cannot assess the likelihood of a material adverse outcome at this time. The arbitration has been scheduled for June 18-29, 2018. A decision is expected by early August 2018. |
| • | Zwick Partners LP and Aparna Rao, Individually and On Behalf of All Others Similarly Situated v. Quorum Health Corporation, Community Health Systems, Inc., Wayne T. Smith, W. Larry Cash, Thomas D. Miller and Michael J. Culotta. On September 9, 2016, a shareholder filed a purported class action in the United States District Court for the Middle District of Tennessee against the Company and certain of its officers. The Amended Complaint, filed on September 13, 2017, purports to be brought on behalf of a class consisting of all persons (other than defendants) who purchased or otherwise acquired securities of the Company between May 2, 2016 and August 10, 2016 and alleges that the Company and certain of its officers violated federal securities laws, including Sections 10(b) and/or 20(a) of the Securities Exchange Act of 1934 and Rule 10b-5 promulgated thereunder, by making alleged false and/or misleading statements and failing to disclose certain information regarding aspects of the Company’s business, operations and compliance policies. On April 17, 2017, Plaintiff filed a Second Amended Complaint adding additional defendants, Community Health Systems, Inc., Wayne T. Smith and W. Larry Cash. On June 23, 2017, the Company filed a motion to dismiss, which Plaintiffs opposed on August 22, 2017. The Company is vigorously defending itself in this matter. The Company is unable to predict the outcome of this matter. However, it is reasonably possible that the Company may incur a loss in connection with this matter. The Company is unable to reasonably estimate the amount or range of such reasonably possible loss because the motion to dismiss is still pending and discovery is stayed pending resolution of the motion to dismiss. Under some circumstances, losses incurred in connection with adverse outcomes in this matter could be material. |
| • | United Tort Claimants v. Quorum Health Resources, LLC (U.S. Bankruptcy Court for the District of New Mexico); Douthitt - Dugger, et al. v. Quorum Health Resources, LLC (Bernalillo County, New Mexico District Court). Plaintiffs in these cases underwent surgical procedures at Gerald Champion Regional Medical Center in New Mexico that they contend were experimental and performed by an unqualified doctor. Their lawsuits, originally filed starting on June 11, 2010 against the doctors, QHR and the hospital are pending in state court and in federal bankruptcy court in New Mexico. In 2012, QHR resolved plaintiffs’ claims for QHR’s liability exceeding insurance limits, and for liability not covered by insurance, for $5.1 million through a partial settlement agreement. Pursuant to this settlement agreement, the bankruptcy court has held that QHR is entitled to have language in any judgment entered in favor of the plaintiffs limiting enforcement to available insurance and not from QHR’s assets. Litigation of plaintiffs’ claims against QHR has continued, and the trial of the claims of most of the plaintiffs is proceeding in phases in a bankruptcy court bench trial. On December 23, 2016, during the liability phase, the bankruptcy court ruled that QHR was 16.5% at fault for plaintiffs’ injuries. The plaintiffs have made attempts to assert new allegations against QHR in an effort to increase the percentage |
F-45
QUORUM HEALTH CORPORATION
NOTES TO CONSOLIDATED AND COMBINED FINANCIAL STATEMENTS (CONTINUED)
| | of liability attributed to QHR, but the bankruptcy court has ruled against the plaintiffs as to each attempt. On January 24, 2018, the New Mexico state court ruled that collateral estoppel applies as to all rulings issued by the bankruptcy court in these matters, which includes the percentage of liability. As a result of the rulings in both courts, all that remains to be determined is the amount of damages sustained, if any, by the individual plaintiffs. The bankruptcy court has heard evidence regarding damages as to four of the plaintiffs and issued an opinion setting forth its findings January 30, 2018. Additional trials will be set in the bankruptcy court to hear evidence as to the remaining plaintiffs in that action. A jury will hear evidence as to the damages asserted by the plaintiffs in state court beginning November 26, 2018. QHR’s insurer, Lexington Insurance Company, is providing a defense in these cases, subject to a reservation of rights. Lexington has sued QHR in Williamson County, Tennessee seeking a declaration that plaintiffs’ claims and at least some portion of the cost of defending QHR are not covered by Lexington. (Lexington Insurance Company v. Quorum Health Resources, LLC, et al. (Williamson County, Tennessee Chancery Court)). No trial date has been set for Lexington’s claim against QHR with respect to insurance coverage, which QHR also is vigorously defending. The Tennessee court has ruled that Lexington is not entitled to reimbursement of defense costs. Lexington is seeking appellate review of this ruling. The Company is unable to predict the outcome of this matter. However, it is reasonably possible that the Company may incur a loss in connection with this matter. The Company is unable to reasonably estimate the amount or range of such reasonably possible loss because the proceedings with respect to the merits of the New Mexico state court action, the availability and extent of insurance coverage and damages are not sufficiently advanced. Under some circumstances, losses incurred in connection with adverse outcomes in this matter could be material. |
| • | R2 Investments, LDC v. Quorum Health Corporation, Community Health Systems, Inc., Wayne T. Smith, W. Larry Cash, Thomas D. Miller, Michael J. Culotta, John A. Clerico, James S. Ely, III, John A. Fry, William Norris Jennings, Julia B. North, H. Mitchell Watson, Jr. and H. James Williams. On October 25, 2017, a shareholder filed an action in the Circuit Court of Williamson County, Tennessee against the Company and certain of its officers and directors and CHS and certain of its officers and directors. The complaint alleges that the defendants violated the Tennessee Securities Act and common law by, among other things, making alleged false and/or misleading statements and failing to disclose certain information regarding aspects of the Company’s business, operations and financial condition. Plaintiff is seeking rescissionary, compensatory and punitive damages. The Company filed a motion to dismiss the action on January 16, 2018. The Company is vigorously defending itself in this matter. Given the early stage of this matter, there are not sufficient facts available to reasonably assess the potential outcome of this matter or reasonably assess any estimate of the amount or range of any potential outcome. |
Insurance Reserves
As part of the business of owning and operating hospitals, the Company is subject to potential professional and general liability and workers’ compensation liability claims or other legal actions alleging liability on its part. The Company is also subject to similar liabilities related to its QHR business.
Prior to the Spin-off, CHS provided professional and general liability insurance and workers’ compensation liability insurance to QHC and indemnified QHC from losses under these insurance arrangements related to the hospital operations business assumed by QHC in the Spin-off. The liabilities for claims prior to the Spin-off and related to QHC’s hospital operations business are determined based on an actuarial study of QHC’s operations and historical claims experience at its hospitals, including during the period of ownership by CHS. Corresponding receivables from CHS are established to reflect the indemnification by CHS for each of these liabilities for claims that related to events and circumstances that occurred prior to the Spin-off date.
After the Spin-off, QHC entered into its own professional and general liability insurance and workers’ compensation liability insurance arrangements to mitigate the risk for claims exceeding its self-insured retention levels. The Company maintains a self-insured retention level for professional and general liability claims of $5 million per claim and maintains a $0.5 million per claim, high deductible program for workers’ compensation liability claims. Due to the differing nature of its business, the Company maintains separate insurance arrangements for professional and general liability claims related to its subsidiary, QHR. The self-insured retention level for QHR is $6 million for professional and general liability claims.
F-46
QUORUM HEALTH CORPORATION
NOTES TO CONSOLIDATED AND COMBINED FINANCIAL STATEMENTS (CONTINUED)
The following table provides a summary of the Company’s insurance reserves related to professional and general liability and workers’ compensation liability, distinguished between those indemnified by CHS and those related to the Company’s own risks (in thousands):
| | December 31, 2017 | |
| | Current | | | Long-Term | | | Current | | | Long-Term | |
| | Receivable | | | Receivable | | | Liability | | | Liability | |
| | | | | | | | | | | | | | | | |
Professional and general liability: | | | | | | | | | | | | | | | | |
Insurance reserves indemnified by CHS, Inc. | | $ | 21,465 | | | $ | 44,377 | | | $ | 21,465 | | | $ | 44,377 | |
All other self-insurance reserves | | | — | | | | — | | | | 2,883 | | | | 32,616 | |
Total insurance reserves for professional and general liability | | | 21,465 | | | | 44,377 | | | | 24,348 | | | | 76,993 | |
Workers' compensation liability: | | | | | | | | | | | | | | | | |
Insurance reserves indemnified by CHS, Inc. | | | 3,032 | | | | 14,545 | | | | 3,032 | | | | 14,545 | |
All other self-insurance reserves | | | — | | | | — | | | | 3,120 | | | | 4,013 | |
Total insurance reserves for workers' compensation liability | | | 3,032 | | | | 14,545 | | | | 6,152 | | | | 18,558 | |
Total self-insurance reserves | | $ | 24,497 | | | $ | 58,922 | | | $ | 30,500 | | | $ | 95,551 | |
| | | | | | | | | | | | | | | | |
| | December 31, 2016 | |
| | Current | | | Long-Term | | | Current | | | Long-Term | |
| | Receivable | | | Receivable | | | Liability | | | Liability | |
| | | | | | | | | | | | | | | | |
Professional and general liability: | | | | | | | | | | | | | | | | |
Insurance reserves indemnified by CHS, Inc. | | $ | 17,580 | | | $ | 59,652 | | | $ | 17,580 | | | $ | 59,652 | |
All other self-insurance reserves | | | — | | | | — | | | | 230 | | | | 14,542 | |
Total insurance reserves for professional and general liability | | | 17,580 | | | | 59,652 | | | | 17,810 | | | | 74,194 | |
Workers' compensation liability: | | | | | | | | | | | | | | | | |
Insurance reserves indemnified by CHS, Inc. | | | 4,863 | | | | 15,958 | | | | 4,863 | | | | 15,958 | |
All other self-insurance reserves | | | — | | | | — | | | | 1,736 | | | | 1,458 | |
Total insurance reserves for workers' compensation liability | | | 4,863 | | | | 15,958 | | | | 6,599 | | | | 17,416 | |
Total self-insurance reserves | | $ | 22,443 | | | $ | 75,610 | | | $ | 24,409 | | | $ | 91,610 | |
For the years ended December 31, 2017 and 2016, the net present value of the projected payments for professional and general liability claims related to the Company’s self-insurance risks was discounted using a weighted-average risk-free rate of 2.0% in both years. The Company’s estimated liability for these claims was $35.5 million and $14.7 million as of December 31, 2017 and 2016, respectively. The estimated undiscounted claims liability was $39.2 million and $16.4 million as of December 31, 2017 and 2016, respectively. For the years ended December 31, 2017 and 2016, the net present value of the projected payments for professional and general liability claims indemnified by CHS was discounted using a weighted-average risk-free rate of 1.9% and 1.5%, respectively. The estimated undiscounted liability for these claims was $71.7 million and $86.6 million as of December 31, 2017 and 2016, respectively.
For the years ended December 31, 2017 and 2016, the net present value of the projected payments for workers’ compensation liability claims related to the Company’s self-insurance risks was discounted using a weighted-average risk-free rate of 2.0%. The Company’s estimated liability for these claims was $7.1 million and $3.2 million as of December 31, 2017 and 2016, respectively. The estimated undiscounted liability for these claims was $7.4 million and $3.5 million as of December 31, 2017 and 2016, respectively.
Physician Recruiting Commitments
As part of its physician recruitment strategy, the Company provides income guarantee agreements to certain physicians who agree to relocate to its communities and commit to remain in practice there for a period of time. Under such agreements, the Company is required to make payments to a physician in excess of the amount earned as income by the physician in his or her practice, up to the amount of the income guarantee. The income guarantee period over which the Company agrees to subsidize a physician’s income is typically one year and the commitment period over which the physician agrees to practice in the designated community is typically three years. Under the terms of the agreements, such payments are recoverable by the Company from physicians who do not fulfill their commitment periods. As of December 31, 2017 and 2016, the Company had physician guarantee contract liabilities of $0.2 million and $1.6 million, respectively, which were included in other current liabilities in the consolidated balance sheets. At December
F-47
QUORUM HEALTH CORPORATION
NOTES TO CONSOLIDATED AND COMBINED FINANCIAL STATEMENTS (CONTINUED)
31, 2017, the maximum potential amount of future payments under these guarantees in excess of the liabilities recorded was $0.4 million.
Construction and Capital Commitments
McKenzie - Willamette Medical Center Project. The Company is building a new patient tower and expanding surgical capacity at McKenzie – Willamette Medical Center, its hospital in Springfield, Oregon. During the years ended December 31, 2017, 2016 and 2015, the Company incurred costs of $34.1 million, $38.5 million and $10.4 million, respectively, related to this project. As of December 31, 2017, the Company had incurred a total of $83.0 million of costs for this project, of which $76.1 million has been placed into service as of December 31, 2017. The total estimated cost of this project, including equipment costs, is estimated to be approximately $105 million. The project is expected to be completed in late 2018.
Helena Regional Medical Center Master Lease. Pursuant to the lease agreement at the Company’s hospital in Helena, Arkansas, the Company has committed to make capital expenditures and improvements at this hospital averaging a specified percentage of the hospital’s annual net operating revenues. The Company estimates that it will make capital expenditures of approximately $1 million for each year of the remaining lease term, which extends through January 1, 2025.
Other Renovation Projects. The Company has committed to certain other renovation projects at one of its hospitals that are expected to begin and be completed in 2018. The total estimated costs for these projects is approximately $4.7 million.
Commitments Related to the Spin-off
On April 29, 2016, the Company entered into certain agreements with CHS that allocated between QHC and CHS the various assets, employees, liabilities and obligations (including investments, property, employee benefits and tax-related assets and liabilities) that comprise the separate companies and governed or continue to govern certain relationships between, and activities of, QHC and CHS for a period of time after the Spin-off. In addition to these agreements, QHC entered into certain transition services agreements and other ancillary agreements with CHS defining agreed upon services to be provided by CHS to certain or all QHC hospitals, as determined by each agreement. The agreements generally have terms of five years. See Note 18 — Related Party Transactions for additional information on the Company’s agreements with CHS.
NOTE 20 — SUBSEQUENT EVENTS
On March 14, 2018, the Company executed an agreement with its lenders pursuant to its Senior Credit Facility to amend the calculation of the Secured Net Leverage Ratio beginning July 1, 2017 through maturity, among other provisions. See Note 7 — Long-term Debt for additional information on the Company’s Senior Credit Facility and the terms of the amendment
On March 1, 2018, the Company sold 70-bed Vista Medical Center West and its affiliated facilities (“Vista West”), located in Waukegan, Illinois, for proceeds of $1.2 million. For the years ended December 31, 2017, 2016 and 2015, the Company’s operating results included pre-tax gains (losses) of $(2.3) million, $4.9 million, and $5.7 million respectively, related to Vista West. In addition to the above, the Company recorded $11.1 million and $4.1 million of impairment to property, equipment and capitalized software costs of Vista West during the years ended December 31, 2017 and 2016, respectively. The Company does not expect the loss on sale of this hospital will be material, after consideration of the impairment recorded.
On February 1, 2018, the Company announced that it had entered into a definitive agreement to sell 77-bed Clearview Regional Medical Center and its affiliated facilities (“Clearview”), located in Monroe, Georgia. The definitive agreement covers the hospital and its affiliated outpatient facilities. The Company currently anticipates completing the sale of this hospital by the end of the first quarter of 2018. The Company recorded $1.2 million of impairment to Medicare licenses of Clearview during the year ended December 31, 2016.
On January 5, 2018, the Company announced plans to close Affinity Medical Center (“Affinity”) in Massillon, Ohio. Subsequent to January 5, 2018, the Company’s affiliates entered into an agreement with the City of Massillon related to the closure whereby all of the owned real property and a substantial majority of the related tangible assets located at the hospital will be transferred to the City of Massillon in exchange for nominal consideration and the assumption of certain ongoing real property lease obligations and equipment lease obligations. Operations ceased on February 11, 2018 and the Company currently anticipates the asset transfer to the City of Massillon will be completed by the end of the first quarter of 2018. The Company recorded $16.1 million and $20.2 million of impairment related to property, equipment and capitalized software costs of Affinity during the years ended December 31, 2017 and 2016 respectively. The Company expects to complete its assessment of the closure of Affinity by the end of the first quarter, including any potential impacts on the Company’s results of operations, financial position and cash flows.
F-48
QUORUM HEALTH CORPORATION
NOTES TO CONSOLIDATED AND COMBINED FINANCIAL STATEMENTS (CONTINUED)
NOTE 21 — QUARTERLY FINANCIAL DATA (UNAUDITED)
The following table provides a summary of the Company’s quarterly operating results for the years ended December 31, 2017 and 2016 (in thousands, except earnings per share and shares):
| | 2017 Quarters | | |
| | 1st | | | 2nd | | | 3rd | | | 4th | | |
| | | | | | | | | | | | | | | | | |
Net operating revenues | | $ | 527,640 | | | $ | 530,146 | | | $ | 499,302 | | | $ | 515,082 | | |
| | | | | | | | | | | | | | | | | |
Net income (loss) | | $ | (27,205 | ) | | | (30,575 | ) | | | (28,554 | ) | | | (26,023 | ) | |
Less: Net income (loss) attributable to noncontrolling interests | | | 356 | | | | 55 | | | | 637 | | | | 785 | | |
Net income (loss) attributable to Quorum Health Corporation | | $ | (27,561 | ) | | $ | (30,630 | ) | | $ | (29,191 | ) | | $ | (26,808 | ) | |
| | | | | | | | | | | | | | | | | |
Earnings (loss) per share attributable to Quorum Health Corporation stockholders: | | | | | | | | | | | | | | | | | |
Basic and diluted | | $ | (0.99 | ) | | $ | (1.09 | ) | | $ | (1.03 | ) | | $ | (0.95 | ) | |
Weighted-average common shares outstanding: | | | | | | | | | | | | | | | | | |
Basic and diluted | | | 27,800,597 | | | | 28,145,215 | | | | 28,245,833 | | | | 28,248,527 | | |
| | | | | | | | | | | | | | | | | |
| | | | | | | | | | | | | | | | | |
| | 2016 Quarters | | |
| | 1st | | | 2nd | | | 3rd | | | 4th | | |
| | | | | | | | | | | | | | | | | |
Net operating revenues | | $ | 549,551 | | | $ | 529,737 | | | $ | 543,939 | | | $ | 515,240 | | |
| | | | | | | | | | | | | | | | | |
Net income (loss) | | | (4,687 | ) | | | (243,966 | ) | | | (6,452 | ) | | | (90,092 | ) | |
Less: Net income (loss) attributable to noncontrolling interests | | | 315 | | | | 1,095 | | | | 507 | | | | 574 | | |
Net income (loss) attributable to Quorum Health Corporation | | $ | (5,002 | ) | | $ | (245,061 | ) | | $ | (6,959 | ) | | $ | (90,666 | ) | |
| | | | | | | | | | | | | | | | | |
Earnings (loss) per share attributable to Quorum Health Corporation stockholders: | | | | | | | | | | | | | | | | | |
Basic and diluted | | $ | (0.18 | ) | | $ | (8.63 | ) | | $ | (0.24 | ) | | $ | (3.19 | ) | |
Weighted-average common shares outstanding: | | | | | | | | | | | | | | | | | |
Basic and diluted | | | 28,412,054 | | | | 28,412,720 | | | | 28,413,532 | | | | 28,416,801 | | |
Net income (loss) for each quarter in the year ended December 31, 2017 included the impact of impairment recorded for long-lived assets and goodwill. See Note 3 — Impairment of Long-lived Assets and Goodwill.
Net income (loss) for the fourth quarter of 2017 additionally includes the impact of California HQAF of $22.0 million of operating revenues, net of provider taxes. The amount recognized in the fourth quarter included the impact for the entire year as the Company was unable to recognize the impact of the California HQAF program until the fourth quarter, after the program received regulatory approval. See Note 2 — Basis of Presentation and Significant Accounting Policies — Revenues and Accounts Receivable.
Net income (loss) for the second and fourth quarters in the year ended December 31, 2016 included the impact of impairment recorded for long-lived assets and goodwill. See Note 3 — Impairment of Long-lived Assets and Goodwill.
Net income (loss) for the fourth quarters of 2017 and 2016 additionally included the impact of the change in estimate related to collectability of patient accounts receivable. See Note 2 — Basis of Presentation and Significant Accounting Policies — Revenues and Accounts Receivable.
F-49
QUORUM HEALTH CORPORATION
NOTES TO CONSOLIDATED AND COMBINED FINANCIAL STATEMENTS (CONTINUED)
NOTE 22 — GUARANTOR AND NON-GUARANTOR SUPPLEMENTAL INFORMATION
The Senior Notes are senior unsecured obligations of the Company guaranteed on a senior basis by certain of its existing and subsequently acquired or organized 100% owned domestic subsidiaries (the “Guarantors”). The Senior Notes are fully and unconditionally guaranteed on a joint and several basis, with exceptions considered customary for such guarantees, limited to the release of the guarantee when a subsidiary guarantor’s capital stock is sold, or when a sale of all of the subsidiary guarantor’s assets used in operations occurs.
The condensed consolidating and combining financial statements have been prepared and presented in accordance with SEC Regulation S-X Rule 3-10 “Financial Statements of Guarantors and Issuers of Guaranteed Securities Registered or Being Registered.”
The accounting policies used in the preparation of this financial information are consistent with those elsewhere in these consolidated and combined financial statements of the Company, except as noted below:
| • | Intercompany receivables and payables are presented gross in the supplemental condensed consolidating balance sheets. |
| • | Due to Parent and Due from Parent are presented gross in the supplemental condensed consolidating balance sheets. |
| • | Investments in consolidated subsidiaries, as well as guarantor subsidiaries’ investments in non-guarantor subsidiaries, are presented under the equity method of accounting with the related investments presented within the line items net investment in subsidiaries and other long-term liabilities in the supplemental condensed consolidating balance sheets. |
| • | The provision for (benefit from) income taxes is allocated from the parent issuer to the income producing operations (other guarantors and non-guarantors) through stockholders’ equity. As this approach represents an allocation, the provision for (benefit from) income tax allocation is considered non-cash for statement of cash flow purposes. |
Following the Spin-off, the Company’s intercompany activity consists primarily of daily cash transfers, the allocation of certain expenses and expenditures paid by the parent issuer on behalf of its subsidiaries, and the push down of investment in its subsidiaries. The parent issuer’s investment in its subsidiaries reflects the activity of the period beginning April 29, 2016 through December 31, 2017. Likewise, the parent issuer’s equity in earnings of unconsolidated affiliates represents the Company’s earnings for the same post-spin period.
F-50
QUORUM HEALTH CORPORATION
NOTES TO CONSOLIDATED AND COMBINED FINANCIAL STATEMENTS (CONTINUED)
Condensed Consolidating and Combining Statement of Income (Loss)
Year Ended December 31, 2017
(In Thousands)
| | Parent Issuer | | | Other Guarantors | | | Non- Guarantors | | | Eliminations | | | Consolidated | |
| | | | | | | | | | | | | | | | | | | | |
Operating revenues, net of contractual allowances and discounts | | $ | — | | | $ | 1,815,355 | | | $ | 512,300 | | | $ | — | | | $ | 2,327,655 | |
Provision for bad debts | | | — | | | | 215,021 | | | | 40,464 | | | | — | | | | 255,485 | |
Net operating revenues | | | — | | | | 1,600,334 | | | | 471,836 | | | | — | | | | 2,072,170 | |
Operating costs and expenses: | | | | | | | | | | | | | | | | | | | | |
Salaries and benefits | | | — | | | | 715,713 | | | | 319,084 | | | | — | | | | 1,034,797 | |
Supplies | | | — | | | | 182,172 | | | | 68,351 | | | | — | | | | 250,523 | |
Other operating expenses | | | 3,002 | | | | 504,809 | | | | 115,252 | | | | — | | | | 623,063 | |
Depreciation and amortization | | | — | | | | 68,770 | | | | 13,385 | | | | — | | | | 82,155 | |
Rent | | | — | | | | 29,923 | | | | 20,307 | | | | — | | | | 50,230 | |
Electronic health records incentives earned | | | — | | | | (3,681 | ) | | | (1,064 | ) | | | — | | | | (4,745 | ) |
Legal, professional and settlement costs | | | — | | | | 6,001 | | | | — | | | | — | | | | 6,001 | |
Impairment of long-lived assets and goodwill | | | — | | | | 47,281 | | | | — | | | | — | | | | 47,281 | |
Loss (gain) on sale of hospitals, net | | | — | | | | — | | | | (5,243 | ) | | | — | | | | (5,243 | ) |
Transaction costs related to the Spin-off | | | — | | | | 195 | | | | 58 | | | | — | | | | 253 | |
Total operating costs and expenses | | | 3,002 | | | | 1,551,183 | | | | 530,130 | | | | — | | | | 2,084,315 | |
Income (loss) from operations | | | (3,002 | ) | | | 49,151 | | | | (58,294 | ) | | | — | | | | (12,145 | ) |
Interest expense, net | | | 124,060 | | | | (2,054 | ) | | | 71 | | | | — | | | | 122,077 | |
Equity in earnings of affiliates | | | 15,291 | | | | 29,673 | | | | — | | | | (44,964 | ) | | | — | |
Income (loss) before income taxes | | | (142,353 | ) | | | 21,532 | | | | (58,365 | ) | | | 44,964 | | | | (134,222 | ) |
Provision for (benefit from) income taxes | | | (28,163 | ) | | | (3,508 | ) | | | 9,806 | | | | — | | | | (21,865 | ) |
Net income (loss) | | | (114,190 | ) | | | 25,040 | | | | (68,171 | ) | | | 44,964 | | | | (112,357 | ) |
Less: Net income (loss) attributable to noncontrolling interests | | | — | | | | — | | | | 1,833 | | | | — | | | | 1,833 | |
Net income (loss) attributable to Quorum Health Corporation | | $ | (114,190 | ) | | $ | 25,040 | | | $ | (70,004 | ) | | $ | 44,964 | | | $ | (114,190 | ) |
F-51
QUORUM HEALTH CORPORATION
NOTES TO CONSOLIDATED AND COMBINED FINANCIAL STATEMENTS (CONTINUED)
Condensed Consolidating and Combining Statement of Income (Loss)
Year Ended December 31, 2016
(In Thousands)
| | Parent Issuer | | | Other Guarantors | | | Non- Guarantors | | | Eliminations | | | Consolidated | |
| | | | | | | | | | | | | | | | | | | | |
Operating revenues, net of contractual allowances and discounts | | $ | — | | | $ | 1,811,586 | | | $ | 607,467 | | | $ | — | | | $ | 2,419,053 | |
Provision for bad debts | | | — | | | | 211,921 | | | | 68,665 | | | | — | | | | 280,586 | |
Net operating revenues | | | — | | | | 1,599,665 | | | | 538,802 | | | | — | | | | 2,138,467 | |
Operating costs and expenses: | | | | | | | | | | | | | | | | | | | | |
Salaries and benefits | | | — | | | | 715,925 | | | | 341,194 | | | | — | | | | 1,057,119 | |
Supplies | | | — | | | | 180,098 | | | | 78,541 | | | | — | | | | 258,639 | |
Other operating expenses | | | — | | | | 505,778 | | | | 140,024 | | | | — | | | | 645,802 | |
Depreciation and amortization | | | — | | | | 97,318 | | | | 19,970 | | | | — | | | | 117,288 | |
Rent | | | — | | | | 27,741 | | | | 22,142 | | | | — | | | | 49,883 | |
Electronic health records incentives earned | | | — | | | | (8,948 | ) | | | (2,534 | ) | | | — | | | | (11,482 | ) |
Legal, professional and settlement costs | | | — | | | | 7,342 | | | | — | | | | — | | | | 7,342 | |
Impairment of long-lived assets and goodwill | | | — | | | | 242,685 | | | | 49,185 | | | | — | | | | 291,870 | |
Loss (gain) on sale of hospitals, net | | | — | | | | — | | | | 2,150 | | | | — | | | | 2,150 | |
Transaction costs related to the Spin-off | | | — | | | | 4,105 | | | | 1,383 | | | | — | | | | 5,488 | |
Total operating costs and expenses | | | — | | | | 1,772,044 | | | | 652,055 | | | | — | | | | 2,424,099 | |
Income (loss) from operations | | | — | | | | (172,379 | ) | | | (113,253 | ) | | | — | | | | (285,632 | ) |
Interest expense, net | | | 78,266 | | | | 32,541 | | | | 2,633 | | | | — | | | | 113,440 | |
Equity in earnings of affiliates | | | 258,078 | | | | 58,605 | | | | — | | | | (316,683 | ) | | | — | |
Income (loss) before income taxes | | | (336,344 | ) | | | (263,525 | ) | | | (115,886 | ) | | | 316,683 | | | | (399,072 | ) |
Provision for (benefit from) income taxes | | | (2,318 | ) | | | (35,576 | ) | | | (15,981 | ) | | | — | | | | (53,875 | ) |
Net income (loss) | | | (334,026 | ) | | | (227,949 | ) | | | (99,905 | ) | | | 316,683 | | | | (345,197 | ) |
Less: Net income (loss) attributable to noncontrolling interests | | | — | | | | — | | | | 2,491 | | | | — | | | | 2,491 | |
Net income (loss) attributable to Quorum Health Corporation | | $ | (334,026 | ) | | $ | (227,949 | ) | | $ | (102,396 | ) | | $ | 316,683 | | | $ | (347,688 | ) |
F-52
QUORUM HEALTH CORPORATION
NOTES TO CONSOLIDATED AND COMBINED FINANCIAL STATEMENTS (CONTINUED)
Condensed Consolidating and Combining Statement of Income (Loss)
Year Ended December 31, 2015
(In Thousands)
| | Parent Issuer | | | Other Guarantors | | | Non- Guarantors | | | Eliminations | | | Consolidated | |
| | | | | | | | | | | | | | | | | | | | |
Operating revenues, net of contractual allowances and discounts | | $ | — | | | $ | 1,833,226 | | | $ | 612,632 | | | $ | — | | | $ | 2,445,858 | |
Provision for bad debts | | | — | | | | 204,968 | | | | 53,552 | | | | — | | | | 258,520 | |
Net operating revenues | | | — | | | | 1,628,258 | | | | 559,080 | | | | — | | | | 2,187,338 | |
Operating costs and expenses: | | | | | | | | | | | | | | | | | | | | |
Salaries and benefits | | | — | | | | 687,596 | | | | 329,100 | | | | — | | | | 1,016,696 | |
Supplies | | | — | | | | 177,421 | | | | 72,371 | | | | — | | | | 249,792 | |
Other operating expenses | | | — | | | | 507,514 | | | | 126,719 | | | | — | | | | 634,233 | |
Depreciation and amortization | | | — | | | | 105,320 | | | | 22,681 | | | | — | | | | 128,001 | |
Rent | | | — | | | | 27,871 | | | | 20,858 | | | | — | | | | 48,729 | |
Electronic health records incentives earned | | | — | | | | (21,001 | ) | | | (4,778 | ) | | | — | | | | (25,779 | ) |
Impairment of long-lived assets | | | — | | | | 13,000 | | | | — | | | | — | | | | 13,000 | |
Transaction costs related to the Spin-off | | | — | | | | 12,161 | | | | 4,176 | | | | — | | | | 16,337 | |
Total operating costs and expenses | | | — | | | | 1,509,882 | | | | 571,127 | | | | — | | | | 2,081,009 | |
Income (loss) from operations | | | — | | | | 118,376 | | | | (12,047 | ) | | | — | | | | 106,329 | |
Interest expense, net | | | — | | | | 86,363 | | | | 11,927 | | | | — | | | | 98,290 | |
Equity in earnings of affiliates | | | — | | | | (16,857 | ) | | | — | | | | 16,857 | | | | — | |
Income (loss) before income taxes | | | — | | | | 48,870 | | | | (23,974 | ) | | | (16,857 | ) | | | 8,039 | |
Provision for (benefit from) income taxes | | | — | | | | 16,904 | | | | (13,600 | ) | | | — | | | | 3,304 | |
Net income (loss) | | | — | | | | 31,966 | | | | (10,374 | ) | | | (16,857 | ) | | | 4,735 | |
Less: Net income (loss) attributable to noncontrolling interests | | | — | | | | (621 | ) | | | 4,019 | | | | — | | | | 3,398 | |
Net income (loss) attributable to Quorum Health Corporation | | $ | — | | | $ | 32,587 | | | $ | (14,393 | ) | | $ | (16,857 | ) | | $ | 1,337 | |
F-53
QUORUM HEALTH CORPORATION
NOTES TO CONSOLIDATED AND COMBINED FINANCIAL STATEMENTS (CONTINUED)
Condensed Consolidating and Combining Statement of Comprehensive Income (Loss)
Year Ended December 31, 2017
(In Thousands)
| | Parent Issuer | | | Other Guarantors | | | Non- Guarantors | | | Eliminations | | | Consolidated | |
| | | | | | | | | | | | | | | | | | | | |
Net income (loss) | | $ | (114,190 | ) | | $ | 25,040 | | | $ | (68,171 | ) | | $ | 44,964 | | | $ | (112,357 | ) |
Amortization and recognition of unrecognized pension cost components, net of income taxes | | | 804 | | | | 804 | | | | — | | | | (804 | ) | | | 804 | |
Comprehensive income (loss) | | | (113,386 | ) | | | 25,844 | | | | (68,171 | ) | | | 44,160 | | | | (111,553 | ) |
Less: Comprehensive income (loss) attributable to noncontrolling interests | | | — | | | | — | | | | 1,833 | | | | — | | | | 1,833 | |
Comprehensive income (loss) attributable to Quorum Health Corporation | | $ | (113,386 | ) | | $ | 25,844 | | | $ | (70,004 | ) | | $ | 44,160 | | | $ | (113,386 | ) |
F-54
QUORUM HEALTH CORPORATION
NOTES TO CONSOLIDATED AND COMBINED FINANCIAL STATEMENTS (CONTINUED)
Condensed Consolidating and Combining Statement of Comprehensive Income (Loss)
Year Ended December 31, 2016
(In Thousands)
| | Parent Issuer | | | Other Guarantors | | | Non- Guarantors | | | Eliminations | | | Consolidated | |
| | | | | | | | | | | | | | | | | | | | |
Net income (loss) | | $ | (334,026 | ) | | $ | (227,949 | ) | | $ | (99,905 | ) | | $ | 316,683 | | | $ | (345,197 | ) |
Amortization and recognition of unrecognized pension cost components, net of income taxes | | | (2,760 | ) | | | (2,760 | ) | | | — | | | | 2,760 | | | | (2,760 | ) |
Comprehensive income (loss) | | | (336,786 | ) | | | (230,709 | ) | | | (99,905 | ) | | | 319,443 | | | | (347,957 | ) |
Less: Comprehensive income (loss) attributable to noncontrolling interests | | | — | | | | — | | | | 2,491 | | | | — | | | | 2,491 | |
Comprehensive income (loss) attributable to Quorum Health Corporation | | $ | (336,786 | ) | | $ | (230,709 | ) | | $ | (102,396 | ) | | $ | 319,443 | | | $ | (350,448 | ) |
F-55
QUORUM HEALTH CORPORATION
NOTES TO CONSOLIDATED AND COMBINED FINANCIAL STATEMENTS (CONTINUED)
Condensed Consolidating and Combining Statement of Comprehensive Income (Loss)
Year Ended December 31, 2015
(In Thousands)
| | Parent Issuer | | | Other Guarantors | | | Non- Guarantors | | | Eliminations | | | Consolidated | |
| | | | | | | | | | | | | | | | | | | | |
Net income (loss) | | $ | — | | | $ | 31,966 | | | $ | (10,374 | ) | | $ | (16,857 | ) | | $ | 4,735 | |
Amortization and recognition of unrecognized pension cost components, net of income taxes | | | — | | | | — | | | | — | | | | — | | | | — | |
Comprehensive income (loss) | | | — | | | | 31,966 | | | | (10,374 | ) | | | (16,857 | ) | | | 4,735 | |
Less: Comprehensive income (loss) attributable to noncontrolling interests | | | — | | | | (621 | ) | | | 4,019 | | | | — | | | | 3,398 | |
Comprehensive income (loss) attributable to Quorum Health Corporation | | $ | — | | | $ | 32,587 | | | $ | (14,393 | ) | | $ | (16,857 | ) | | $ | 1,337 | |
F-56
QUORUM HEALTH CORPORATION
NOTES TO CONSOLIDATED AND COMBINED FINANCIAL STATEMENTS (CONTINUED)
Condensed Consolidating Balance Sheet
December 31, 2017
(In Thousands)
| Parent Issuer | | | Other Guarantors | | | Non- Guarantors | | | Eliminations | | | Consolidated | |
| | | | | | | | | | | | | | | | | | | |
ASSETS | | | | | | | | | | | | | | | | | | | |
Current assets: | | | | | | | | | | | | | | | | | | | |
Cash and cash equivalents | $ | 1,051 | | | $ | 4,222 | | | $ | 344 | | | $ | — | | | $ | 5,617 | |
Patient accounts receivable, net of allowance for doubtful accounts | | — | | | | 262,690 | | | | 80,455 | | | | — | | | | 343,145 | |
Inventories | | — | | | | 43,276 | | | | 10,183 | | | | — | | | | 53,459 | |
Prepaid expenses | | 33 | | | | 16,980 | | | | 4,154 | | | | — | | | | 21,167 | |
Due from third-party payors | | — | | | | 93,323 | | | | 3,879 | | | | — | | | | 97,202 | |
Current assets of hospitals held for sale | | — | | | | 8,112 | | | | — | | | | — | | | | 8,112 | |
Other current assets | | — | | | | 32,867 | | | | 14,573 | | | | — | | | | 47,440 | |
Total current assets | | 1,084 | | | | 461,470 | | | | 113,588 | | | | — | | | | 576,142 | |
Intercompany receivable | | 3 | | | | 402,817 | | | | 172,098 | | | | (574,918 | ) | | | — | |
Property and equipment, net | | — | | | | 543,073 | | | | 132,206 | | | | — | | | | 675,279 | |
Goodwill | | — | | | | 243,618 | | | | 165,611 | | | | — | | | | 409,229 | |
Intangible assets, net | | — | | | | 58,240 | | | | 6,610 | | | | — | | | | 64,850 | |
Long-term assets of hospitals held for sale | | — | | | | 7,730 | | | | 4 | | | | — | | | | 7,734 | |
Other long-term assets | | — | | | | 74,918 | | | | 20,689 | | | | — | | | | 95,607 | |
Net investment in subsidiaries | | 1,488,021 | | | | — | | | | — | | | | (1,488,021 | ) | | | — | |
Total assets | $ | 1,489,108 | | | $ | 1,791,866 | | | $ | 610,806 | | | $ | (2,062,939 | ) | | $ | 1,828,841 | |
LIABILITIES AND EQUITY | | | | | | | | | | | | | | | | | | | |
Current liabilities: | | | | | | | | | | | | | | | | | | | |
Current maturities of long-term debt | $ | — | | | $ | 1,434 | | | $ | 421 | | | $ | — | | | $ | 1,855 | |
Accounts payable | | 132 | | | | 146,193 | | | | 24,925 | | | | — | | | | 171,250 | |
Accrued liabilities: | | | | | | | | | | | | | | | | | | | |
Accrued salaries and benefits | | — | | | | 56,522 | | | | 21,281 | | | | — | | | | 77,803 | |
Accrued interest | | 10,466 | | | | — | | | | — | | | | — | | | | 10,466 | |
Due to third-party payors | | — | | | | 46,381 | | | | 1,324 | | | | — | | | | 47,705 | |
Current liabilities of hospitals held for sale | | — | | | | 2,577 | | | | — | | | | — | | | | 2,577 | |
Other current liabilities | | 516 | | | | 30,664 | | | | 12,507 | | | | — | | | | 43,687 | |
Total current liabilities | | 11,114 | | | | 283,771 | | | | 60,458 | | | | — | | | | 355,343 | |
Long-term debt | | 1,188,224 | | | | 23,809 | | | | 2 | | | | — | | | | 1,212,035 | |
Intercompany payable | | 182,555 | | | | 173,341 | | | | 219,022 | | | | (574,918 | ) | | | — | |
Deferred income tax liabilities, net | | 7,774 | | | | — | | | | — | | | | — | | | | 7,774 | |
Other long-term liabilities | | — | | | | 195,132 | | | | 31,100 | | | | (88,278 | ) | | | 137,954 | |
Total liabilities | | 1,389,667 | | | | 676,053 | | | | 310,582 | | | | (663,196 | ) | | | 1,713,106 | |
Redeemable noncontrolling interests | | — | | | | — | | | | 2,325 | | | | — | | | | 2,325 | |
Equity: | | | | | | | | | | | | | | | | | | | |
Quorum Health Corporation stockholders' equity: | | | | | | | | | | | | | | | | | | | |
Preferred stock | | — | | | | — | | | | — | | | | — | | | | — | |
Common stock | | 3 | | | | — | | | | — | | | | — | | | | 3 | |
Additional paid-in capital | | 549,610 | | | | 1,291,581 | | | | 471,767 | | | | (1,763,348 | ) | | | 549,610 | |
Accumulated other comprehensive income (loss) | | (1,956 | ) | | | (1,956 | ) | | | — | | | | 1,956 | | | | (1,956 | ) |
Accumulated deficit | | (448,216 | ) | | | (173,812 | ) | | | (187,837 | ) | | | 361,649 | | | | (448,216 | ) |
Total Quorum Health Corporation stockholders' equity | | 99,441 | | | | 1,115,813 | | | | 283,930 | | | | (1,399,743 | ) | | | 99,441 | |
Nonredeemable noncontrolling interests | | — | | | | — | | | | 13,969 | | | | — | | | | 13,969 | |
Total equity | | 99,441 | | | | 1,115,813 | | | | 297,899 | | | | (1,399,743 | ) | | | 113,410 | |
Total liabilities and equity | $ | 1,489,108 | | | $ | 1,791,866 | | | $ | 610,806 | | | $ | (2,062,939 | ) | | $ | 1,828,841 | |
F-57
QUORUM HEALTH CORPORATION
NOTES TO CONSOLIDATED AND COMBINED FINANCIAL STATEMENTS (CONTINUED)
Condensed Consolidating Balance Sheet
December 31, 2016
(In Thousands)
| Parent Issuer | | | Other Guarantors | | | Non- Guarantors | | | Eliminations | | | Consolidated | |
| | | | | | | | | | | | | | | | | | | |
ASSETS | | | | | | | | | | | | | | | | | | | |
Current assets: | | | | | | | | | | | | | | | | | | | |
Cash and cash equivalents | $ | 21,609 | | | $ | 3,498 | | | $ | 348 | | | $ | — | | | $ | 25,455 | |
Patient accounts receivable, net of allowance for doubtful accounts | | — | | | | 277,155 | | | | 103,530 | | | | — | | | | 380,685 | |
Inventories | | — | | | | 46,318 | | | | 11,806 | | | | — | | | | 58,124 | |
Prepaid expenses | | — | | | | 17,874 | | | | 5,154 | | | | — | | | | 23,028 | |
Due from third-party payors | | — | | | | 109,793 | | | | 6,442 | | | | — | | | | 116,235 | |
Current assets of hospitals held for sale | | — | | | | 1,502 | | | | — | | | | — | | | | 1,502 | |
Other current assets | | — | | | | 41,673 | | | | 16,269 | | | | — | | | | 57,942 | |
Total current assets | | 21,609 | | | | 497,813 | | | | 143,549 | | | | — | | | | 662,971 | |
Intercompany receivable | | 3 | | | | 126,035 | | | | 84,827 | | | | (210,865 | ) | | | — | |
Property and equipment, net | | — | | | | 624,457 | | | | 109,443 | | | | — | | | | 733,900 | |
Goodwill | | — | | | | 252,433 | | | | 164,400 | | | | — | | | | 416,833 | |
Intangible assets, net | | — | | | | 73,404 | | | | 11,578 | | | | — | | | | 84,982 | |
Long-term assets of hospitals held for sale | | — | | | | 6,851 | | | | — | | | | — | | | | 6,851 | |
Other long-term assets | | — | | | | 72,967 | | | | 15,866 | | | | — | | | | 88,833 | |
Net investment in subsidiaries | | 1,485,213 | | | | — | | | | — | | | | (1,485,213 | ) | | | — | |
Total assets | $ | 1,506,825 | | | $ | 1,653,960 | | | $ | 529,663 | | | $ | (1,696,078 | ) | | $ | 1,994,370 | |
LIABILITIES AND EQUITY | | | | | | | | | | | | | | | | | | | |
Current liabilities: | | | | | | | | | | | | | | | | | | | |
Current maturities of long-term debt | $ | 3,819 | | | $ | 1,560 | | | $ | 304 | | | $ | — | | | $ | 5,683 | |
Accounts payable | | 158 | | | | 147,521 | | | | 22,005 | | | | — | | | | 169,684 | |
Accrued liabilities: | | | | | | | | | | | | | | | | | | | |
Accrued salaries and benefits | | — | | | | 69,896 | | | | 28,907 | | | | — | | | | 98,803 | |
Accrued interest | | 19,915 | | | | — | | | | — | | | | — | | | | 19,915 | |
Due to third-party payors | | — | | | | 40,595 | | | | 1,942 | | | | — | | | | 42,537 | |
Current liabilities of hospitals held for sale | | — | | | | 492 | | | | — | | | | — | | | | 492 | |
Other current liabilities | | — | | | | 46,002 | | | | 7,266 | | | | — | | | | 53,268 | |
Total current liabilities | | 23,892 | | | | 306,066 | | | | 60,424 | | | | — | | | | 390,382 | |
Long-term debt | | 1,215,836 | | | | 24,899 | | | | 407 | | | | — | | | | 1,241,142 | |
Intercompany payable | | 34,495 | | | | 86,084 | | | | 90,286 | | | | (210,865 | ) | | | — | |
Deferred income tax liabilities, net | | 31,474 | | | | — | | | | — | | | | — | | | | 31,474 | |
Other long-term liabilities | | — | | | | 144,950 | | | | 22,651 | | | | (58,605 | ) | | | 108,996 | |
Total liabilities | | 1,305,697 | | | | 561,999 | | | | 173,768 | | | | (269,470 | ) | | | 1,771,994 | |
Redeemable noncontrolling interests | | — | | | | — | | | | 6,807 | | | | — | | | | 6,807 | |
Equity: | | | | | | | | | | | | | | | | | | | |
Quorum Health Corporation stockholders' equity: | | | | | | | | | | | | | | | | | | | |
Preferred stock | | — | | | | — | | | | — | | | | — | | | | — | |
Common stock | | 3 | | | | — | | | | — | | | | — | | | | 3 | |
Additional paid-in capital | | 537,911 | | | | 1,333,347 | | | | 412,705 | | | | (1,746,052 | ) | | | 537,911 | |
Accumulated other comprehensive income (loss) | | (2,760 | ) | | | (2,760 | ) | | | — | | | | 2,760 | | | | (2,760 | ) |
Accumulated deficit | | (334,026 | ) | | | (238,626 | ) | | | (78,058 | ) | | | 316,684 | | | | (334,026 | ) |
Total Quorum Health Corporation stockholders' equity | | 201,128 | | | | 1,091,961 | | | | 334,647 | | | | (1,426,608 | ) | | | 201,128 | |
Nonredeemable noncontrolling interests | | — | | | | — | | | | 14,441 | | | | — | | | | 14,441 | |
Total equity | | 201,128 | | | | 1,091,961 | | | | 349,088 | | | | (1,426,608 | ) | | | 215,569 | |
Total liabilities and equity | $ | 1,506,825 | | | $ | 1,653,960 | | | $ | 529,663 | | | $ | (1,696,078 | ) | | $ | 1,994,370 | |
F-58
QUORUM HEALTH CORPORATION
NOTES TO CONSOLIDATED AND COMBINED FINANCIAL STATEMENTS (CONTINUED)
Condensed Consolidating and Combining Statement of Cash Flows
Year Ended December 31, 2017
(In Thousands)
| | Parent Issuer | | | Other Guarantors | | | Non- Guarantors | | | Eliminations | | | Consolidated | |
| | | | | | | | | | | | | | | | | | | | |
Net cash provided by (used in) operating activities | | $ | (121,079 | ) | | $ | 206,248 | | | $ | (18,199 | ) | | $ | — | | | $ | 66,970 | |
| | | | | | | | | | | | | | | | | | | | |
Cash flows from investing activities: | | | | | | | | | | | | | | | | | | | | |
Capital expenditures for property and equipment | | | — | | | | (24,777 | ) | | | (36,753 | ) | | | — | | | | (61,530 | ) |
Capital expenditures for software | | | — | | | | (6,090 | ) | | | (808 | ) | | | — | | | | (6,898 | ) |
Acquisitions, net of cash acquired | | | — | | | | (29 | ) | | | (1,891 | ) | | | — | | | | (1,920 | ) |
Proceeds from the sale of hospitals | | | — | | | | 11,925 | | | | 20,156 | | | | — | | | | 32,081 | |
Changes in intercompany balances with affiliates, net | | | — | | | | (183,829 | ) | | | — | | | | 183,829 | | | | — | |
Net cash provided by (used in) investing activities | | | — | | | | (202,800 | ) | | | (19,296 | ) | | | 183,829 | | | | (38,267 | ) |
| | | | | | | | | | | | | | | | | | | | |
Cash flows from financing activities: | | | | | | | | | | | | | | | | | | | | |
Borrowings under revolving credit facilities | | | 508,000 | | | | — | | | | — | | | | — | | | | 508,000 | |
Repayments under revolving credit facilities | | | (508,000 | ) | | | — | | | | — | | | | — | | | | (508,000 | ) |
Borrowings of long-term debt | | | — | | | | 376 | | | | — | | | | — | | | | 376 | |
Repayments of long-term debt | | | (37,261 | ) | | | (1,592 | ) | | | (342 | ) | | | — | | | | (39,195 | ) |
Payments of debt issuance costs | | | (3,119 | ) | | | — | | | | — | | | | — | | | | (3,119 | ) |
Cancellation of restricted stock awards for payroll tax withholdings on vested shares | | | — | | | | (1,508 | ) | | | — | | | | — | | | | (1,508 | ) |
Cash distributions to noncontrolling investors | | | — | | | | — | | | | (3,851 | ) | | | — | | | | (3,851 | ) |
Purchases of shares from noncontrolling investors | | | — | | | | — | | | | (1,244 | ) | | | — | | | | (1,244 | ) |
Changes in intercompany balances with affiliates, net | | | 140,901 | | | | — | | | | 42,928 | | | | (183,829 | ) | | | — | |
Net cash provided by (used in) financing activities | | | 100,521 | | | | (2,724 | ) | | | 37,491 | | | | (183,829 | ) | | | (48,541 | ) |
| | | | | | | | | | | | | | | | | | | | |
Net change in cash and cash equivalents | | | (20,558 | ) | | | 724 | | | | (4 | ) | | | — | | | | (19,838 | ) |
Cash and cash equivalents at beginning of period | | | 21,609 | | | | 3,498 | | | | 348 | | | | — | | | | 25,455 | |
Cash and cash equivalents at end of period | | $ | 1,051 | | | $ | 4,222 | | | $ | 344 | | | $ | — | | | $ | 5,617 | |
F-59
QUORUM HEALTH CORPORATION
NOTES TO CONSOLIDATED AND COMBINED FINANCIAL STATEMENTS (CONTINUED)
Condensed Consolidating and Combining Statement of Cash Flows
Year Ended December 31, 2016
(In Thousands)
| | Parent Issuer | | | Other Guarantors | | | Non- Guarantors | | | Eliminations | | | Consolidated | |
| | | | | | | | | | | | | | | | | | | | |
Net cash provided by (used in) operating activities | | $ | (66,266 | ) | | $ | 173,382 | | | $ | (26,030 | ) | | $ | — | | | $ | 81,086 | |
| | | | | | | | | | | | | | | | | | | | |
Cash flows from investing activities: | | | | | | | | | | | | | | | | | | | | |
Capital expenditures for property and equipment | | | — | | | | (73,327 | ) | | | (6,593 | ) | | | — | | | | (79,920 | ) |
Capital expenditures for software | | | — | | | | (3,854 | ) | | | (3,415 | ) | | | — | | | | (7,269 | ) |
Acquisitions, net of cash acquired | | | — | | | | (549 | ) | | | (236 | ) | | | — | | | | (785 | ) |
Proceeds from the sale of hospitals | | | — | | | | — | | | | 13,746 | | | | — | | | | 13,746 | |
Proceeds from asset sales | | | — | | | | 1,498 | | | | (416 | ) | | | — | | | | 1,082 | |
Changes in intercompany balances with affiliates, net | | | — | | | | (116,674 | ) | | | — | | | | 116,674 | | | | — | |
Net cash provided by (used in) investing activities | | | — | | | | (192,906 | ) | | | 3,086 | | | | 116,674 | | | | (73,146 | ) |
| | | | | | | | | | | | | | | | | | | | |
Cash flows from financing activities: | | | | | | | | | | | | | | | | | | | | |
Borrowings under revolving credit facilities | | | 50,000 | | | | — | | | | — | | | | — | | | | 50,000 | |
Repayments under revolving credit facilities | | | (50,000 | ) | | | — | | | | — | | | | — | | | | (50,000 | ) |
Borrowings of long-term debt | | | 1,255,464 | | | | 740 | | | | 77 | | | | — | | | | 1,256,281 | |
Repayments of long-term debt | | | (11,581 | ) | | | (3,025 | ) | | | (616 | ) | | | — | | | | (15,222 | ) |
Increase (decrease) in Due to Parent, net | | | — | | | | 24,796 | | | | — | | | | — | | | | 24,796 | |
Payments of debt issuance costs | | | (29,146 | ) | | | — | | | | — | | | | — | | | | (29,146 | ) |
Cash paid to Parent related to the Spin-off | | | (1,217,336 | ) | | | — | | | | — | | | | — | | | | (1,217,336 | ) |
Cancellation of restricted stock awards for payroll tax withholdings on vested shares | | | — | | | | (13 | ) | | | — | | | | — | | | | (13 | ) |
Cash distributions to noncontrolling investors | | | — | | | | — | | | | (2,850 | ) | | | — | | | | (2,850 | ) |
Purchases of shares from noncontrolling investors | | | — | | | | — | | | | (101 | ) | | | — | | | | (101 | ) |
Changes in intercompany balances with affiliates, net | | | 90,474 | | | | — | | | | 26,200 | | | | (116,674 | ) | | | — | |
Net cash provided by (used in) financing activities | | | 87,875 | | | | 22,498 | | | | 22,710 | | | | (116,674 | ) | | | 16,409 | |
| | | | | | | | | | | | | | | | | | | | |
Net change in cash and cash equivalents | | | 21,609 | | | | 2,974 | | | | (234 | ) | | | — | | | | 24,349 | |
Cash and cash equivalents at beginning of period | | | — | | | | 524 | | | | 582 | | | | — | | | | 1,106 | |
Cash and cash equivalents at end of period | | $ | 21,609 | | | $ | 3,498 | | | $ | 348 | | | $ | — | | | $ | 25,455 | |
F-60
QUORUM HEALTH CORPORATION
NOTES TO CONSOLIDATED AND COMBINED FINANCIAL STATEMENTS (CONTINUED)
Condensed Consolidating and Combining Statement of Cash Flows
Year Ended December 31, 2015
(In Thousands)
| | Parent Issuer | | | Other Guarantors | | | Non- Guarantors | | | Eliminations | | | Consolidated | |
| | | | | | | | | | | | | | | | | | | | |
Net cash provided by (used in) operating activities | | $ | — | | | $ | 87,313 | | | $ | (44,424 | ) | | $ | — | | | $ | 42,889 | |
| | | | | | | | | | | | | | | | | | | | |
Cash flows from investing activities: | | | | | | | | | | | | | | | | | | | | |
Capital expenditures for property and equipment | | | — | | | | (37,321 | ) | | | (22,134 | ) | | | — | | | | (59,455 | ) |
Capital expenditures for software | | | — | | | | (6,935 | ) | | | (1,910 | ) | | | — | | | | (8,845 | ) |
Acquisitions, net of cash acquired | | | — | | | | (3,467 | ) | | | (4,552 | ) | | | — | | | | (8,019 | ) |
Proceeds from asset sales | | | — | | | | 3,114 | | | | — | | | | — | | | | 3,114 | |
Other investing activities | | | — | | | | (1,416 | ) | | | (3,971 | ) | | | — | | | | (5,387 | ) |
Net cash provided by (used in) investing activities | | | — | | | | (46,025 | ) | | | (32,567 | ) | | | — | | | | (78,592 | ) |
| | | | | | | | | | | | | | | | | | | | |
Cash flows from financing activities: | | | | | | | | | | | | | | | | | | | | |
Borrowings of long-term debt | | | — | | | | 217 | | | | 155 | | | | — | | | | 372 | |
Repayments of long-term debt | | | — | | | | (1,043 | ) | | | (520 | ) | | | — | | | | (1,563 | ) |
Increase (decrease) in Due to Parent, net | | | — | | | | 152,971 | | | | 109,804 | | | | — | | | | 262,775 | |
Increase (decrease) in receivables facility, net | | | — | | | | (194,835 | ) | | | (29,939 | ) | | | — | | | | (224,774 | ) |
Cash distributions to noncontrolling investors | | | — | | | | — | | | | (1,623 | ) | | | — | | | | (1,623 | ) |
Purchases of shares from noncontrolling investors | | | — | | | | (526 | ) | | | (411 | ) | | | — | | | | (937 | ) |
Net cash provided by (used in) financing activities | | | — | | | | (43,216 | ) | | | 77,466 | | | | — | | | | 34,250 | |
| | | | | | | | | | | | | | | | | | | | |
Net change in cash and cash equivalents | | | — | | | | (1,928 | ) | | | 475 | | | | — | | | | (1,453 | ) |
Cash and cash equivalents at beginning of period | | | — | | | | 2,452 | | | | 107 | | | | — | | | | 2,559 | |
Cash and cash equivalents at end of period | | $ | — | | | $ | 524 | | | $ | 582 | | | $ | — | | | $ | 1,106 | |
F-61