UNITED STATES
SECURITIES AND EXCHANGE COMMISSION
Washington, D.C. 20549
_______________________________________________________________________
FORM 10-K
______________________________________________________________________________________________________
| | | | | |
| ☒ | ANNUAL REPORT PURSUANT TO SECTION 13 OR 15(d) OF THE SECURITIES EXCHANGE ACT OF 1934 |
For the fiscal year ended December 31, 2024
OR
| | | | | |
| ☐ | TRANSITION REPORT PURSUANT TO SECTION 13 OR 15(d) OF THE SECURITIES EXCHANGE ACT OF 1934 |
Commission File Number 001-37586
__________________________________________________________________________
INGEVITY CORPORATION
(Exact name of registrant as specified in its charter)
_________________________________________________________________________
| | | | | | | | | | | |
| Delaware | 47-4027764 |
| (State or other jurisdiction of incorporation or organization) | (I.R.S. Employer Identification No.) |
| | | |
| 4920 O'Hear Avenue Suite 400 | North Charleston | South Carolina | 29405 |
| (Address of principal executive offices) | (Zip code) |
843-740-2300
(Registrant’s telephone number)
Securities registered pursuant to Section 12(b) of the Act: | | | | | | | | |
| Title of Each Class: | Trading Symbol(s) | Name of Each Exchange on Which Registered: |
| Common Stock ($0.01 par value) | NGVT | New York Stock Exchange |
Securities registered pursuant to Section 12(g) of the Act: None
Indicate by check mark if the registrant is a well-known seasoned issuer, as defined in Rule 405 of the Securities Act.
Yes x No o
Indicate by check mark if the registrant is not required to file reports pursuant to Section 13 or Section 15(d) of the Act.
Yes o No x
Indicate by check mark whether the registrant: (1) has filed all reports required to be filed by Section 13 or 15(d) of the Securities Exchange Act of 1934 during the preceding 12 months (or for such shorter period that the registrant was required to file such reports); and (2) has been subject to such filing requirements for the past 90 days.
Yes x No o
Indicate by check mark whether the registrant has submitted electronically and posted on its corporate web site, if any, every Interactive Data File required to be submitted and posted pursuant to Rule 405 of Regulation S-T (§232.405 of this chapter) during the preceding 12 months (or for such shorter period that the registrant was required to submit and post such files).
Yes x No o
Indicate by check mark whether the registrant is a large accelerated filer, an accelerated filer, a non-accelerated filer, or a smaller reporting company. See the definitions of “large accelerated filer,” “accelerated filer” and “smaller reporting company” in Rule 12b-2 of the Exchange Act. (Check one):
| | | | | | | | | | | |
| Large accelerated filer | x | Accelerated filer | o |
| Non-accelerated filer | o | Smaller reporting company | o |
| | Emerging growth company | o |
If an emerging growth company, indicate by check mark if the registrant has elected not to use the extended transition period for complying with any new or revised financial accounting standards provided pursuant to Section 13(a) of the Exchange Act. o
Indicate by check mark whether the registrant has filed a report on and attestation to its management's assessment of the effectiveness of its internal control over financial reporting under Section 404(b) of the Sarbanes-Oxley Act (15 U.S.C. 7262(b)) by the registered public accounting firm that prepared or issued its audit report. ☒
If securities are registered pursuant to Section 12(b) of the Act, indicate by check mark whether the financial statements of the registrant included in the filing reflect the correction of an error to previously issued financial statements. o
Indicate by check mark whether any of those error corrections are restatements that required a recovery analysis of incentive-based compensation received by any of the registrant’s executive officers during the relevant recovery period pursuant to §240.10D-1(b). o
Indicate by check mark whether the Registrant is a shell company (as defined by Rule 12b-2 of the Exchange Act). Yes ☐ No x
At June 30, 2024, the aggregate market value of common stock held by non-affiliates of the Registrant was $1,582,951,662. The market value held by non-affiliates excludes the value of those shares held by executive officers and directors of the Registrant.
The Registrant had 36,351,236 shares of common stock, $0.01 par value, outstanding at February 14, 2025.
| | | | | | | | | | | |
| Documents Incorporated by Reference |
| Portions of the Company's definitive 2025 Annual Meeting Proxy Statement are incorporated by reference into Part III of this report. |
Ingevity Corporation
Form 10-K
CAUTIONARY STATEMENT REGARDING FORWARD-LOOKING STATEMENTS
This Annual Report on Form 10-K contains forward-looking statements within the meaning of the Securities Exchange Act of 1934, as amended, and the Private Securities Litigation Reform Act of 1995 that reflect our current expectations, beliefs, plans, or forecasts with respect to, among other things, future events and financial performance. Forward-looking statements are often characterized by words or phrases such as “may,” “will,” “could,” “should,” “would,” “anticipate,” “estimate,” “expect,” “project,” “intend,” “plan,” “believe,” “target,” “prospects,” “potential,” “outlook,” “guidance,” and “forecast,” and other words, terms and phrases of similar meaning.
These statements, by their nature, involve certain estimates, expectations, projections, forecasts and assumptions, and are subject to various risks and uncertainties that are difficult to predict and often beyond our control. These risks and uncertainties may, and often do, cause actual results to differ materially from those contained in a forward-looking statement. Accordingly, readers are cautioned not to place undue reliance on any forward-looking statement. Any forward-looking statement is based on information currently available to us and speaks only as of the date that it is made. We have no duty, and undertake no obligation, to update any forward-looking statement to reflect developments occurring after the statement is made.
The risks and uncertainties that may cause actual results to differ materially from those indicated in any forward-looking may be included with the forward-looking statement itself. Other such risks and uncertainties include, but are not limited to, those discussed in Item 1A. Risk Factors in this report, as well as the following:
•the anticipated timing, charges, costs and results of any current or future repositioning of our Performance Chemicals segment, including the oleo-based product refining transition and the closure of our plants in DeRidder, Louisiana and Crossett, Arkansas may differ materially from our estimates due to events that may occur as a result of, or in connection with, such repositioning efforts;
•our announced review of strategic alternatives for the industrial specialties product line and North Charleston, South Carolina crude tall oil (“CTO”) refinery may not result in a transaction and any transaction entered into may not yield the expected results or benefits;
•we may be adversely affected by general global economic, geopolitical, and financial conditions beyond our control, including inflation, the Russia-Ukraine war, and the conflict in the Middle East;
•leadership transitions within our organization;
•we are exposed to risks related to our international sales and operations, including potential changes in tariffs;
•adverse conditions in the automotive market have and may continue to negatively impact demand for our automotive carbon products;
•if more stringent air quality standards worldwide are not adopted, our growth could be impacted;
•we face competition from substitute products, new technologies, and new or emerging competitors;
•we may be adversely affected by a decrease in government infrastructure spending;
•adverse conditions in cyclical end markets may continue to adversely affect demand for our products;
•lack of access to raw materials upon which we depend would impact our ability to produce our products;
•the inability to make or effectively integrate future acquisitions and other investments may negatively affect our results;
•we are dependent upon third parties for the provision of certain critical operating services at several of our facilities;
•we may be adversely affected by disruptions in our supply chain;
•the occurrence of natural disasters and extreme weather or other unanticipated problem such as labor difficulties (including work stoppages), equipment failure, or unscheduled maintenance and repair, which could result in operational disruptions of varied duration;
•we are dependent upon attracting and retaining key personnel;
•we are dependent on certain large customers;
•from time to time, we are and may be engaged in legal actions associated with our intellectual property rights;
•if we are unable to protect our intellectual property and other proprietary information, we may lose significant competitive advantage;
•information technology security breaches and other disruptions;
•government policies and regulations, including, but not limited to, those affecting the environment, climate change, tax policies, tariffs, the chemicals industry and subsidies or incentives that may impact key raw materials or products may adversely affect financial results; and
•losses due to lawsuits arising out of environmental damage or personal injuries associated with chemical or other manufacturing processes.
PART I
ITEM 1. BUSINESS
General
Ingevity Corporation provides products and technologies that purify, protect, and enhance the world around us. Through a diverse team of talented and experienced people, we develop, manufacture, and bring to market solutions that are largely renewably sourced and help customers solve complex problems while making the world more sustainable. Our products are used in a variety of demanding applications, including adhesives, agrochemicals, asphalt paving, bioplastics, coatings, elastomers, lubricants, paint for road markings, oil drilling, and automotive components. We operate in three reportable segments: Performance Materials, Performance Chemicals and Advanced Polymer Technologies.
Throughout this Annual Report on Form 10-K, except where otherwise stated or indicated by the context, "Ingevity," the "Company," "we," "us," or "our" means Ingevity Corporation and its consolidated subsidiaries and their predecessors.
Our business originated as part of the operations of our former parent company, Westvaco Corporation, in 1964, and we operated as a division of Westvaco Corporation and its corporate successors, including MeadWestvaco Corporation and WestRock Company (“WestRock”) until our separation from WestRock in May 2016. Our common stock began "regular-way" trading on the New York Stock Exchange in May 2016 under the symbol "NGVT."
Our principal executive offices are located at 4920 O'Hear Avenue, Suite 400, North Charleston, South Carolina 29405. Ingevity maintains a website at www.ingevity.com. We make available, free of charge through our website, our filings with the Securities and Exchange Commission (the “SEC”), including our annual reports on Form 10-K, quarterly reports on Form 10-Q, current reports on Form 8-K and any amendments to those reports, as soon as reasonably practicable after such items are filed with, or furnished to, the SEC. We also use our website to publish additional information that may be important to investors, such as presentations to analysts. Information contained in or connected to our website is not incorporated by reference into this Annual Report on Form 10-K. Reports we file with the SEC may also be viewed at www.sec.gov.
The table below illustrates our product lines and the primary end-use markets for our products by segment, as well as our net sales by segment for the fiscal year 2024. For more information on our U.S. and foreign operations, see Notes 4 and 19, to the Consolidated Financial Statements included within Part II. Item 8 of this Form 10-K.
| | | | | | | | | | | | | | |
| Performance Materials | Performance Chemicals | Advanced Polymer Technologies |
| Product Lines | | Road Technologies | Industrial Specialties | |
| End-Use Markets | Automotive
Purification: Food, Chemicals, and Water | Pavement Construction
Pavement Preservation
Pavement Reconstruction and Recycling
Pavement Markings
| Agricultural Chemicals
Lubricants
Rubber
Industrial Intermediates
Adhesives
Oilfield | Automotive & Transportation
Industrial Equipment
Footwear & Apparel
Bioplastics
Consumer Packaging
Medical & Health |
| 2024 Revenue | $609.6 million | $608.2 million | $188.6 million |
|
|
Seasonality
There are a variety of seasonal dynamics, including global climate and weather conditions, that impact our businesses, though none have currently materially affected our financial results, except in the case of the road technologies product line, where roughly 70 to 75 percent of revenue is generated between April and September. From a supply perspective, this seasonality is effectively managed through pre-season inventory build and active inventory management throughout the year.
Energy
Our manufacturing processes require a significant amount of energy. We are dependent on natural gas to fuel the processes in our chemical refineries and activated carbon plants. Although we believe that we currently have a stable natural
gas supply and infrastructure for our operations, we are subject to volatility in the market price of natural gas. We enter into certain derivative financial instruments to mitigate expected fluctuations in market prices and the resulting volatility of earnings and cash flow. All of our manufacturing processes also consume a significant amount of electricity and are located in regulated service areas that have stable electricity rate structures with reliable supply.
Leveraging Sustainability
Throughout our Performance Materials, Performance Chemicals, and Advanced Polymer Technologies reportable segments, we are a leader in adding value to products made from renewable materials and in derivatizing technologies that impart desirable environmental benefits in their use. To create a majority of our chemistries, we take CTO from pine trees, hardwood sawdust (both co-products of the lumber, paper, and furniture-making industries), and plant based oils and convert them into products that benefit customers, the environment, and society. For the caprolactone-based products in our Advanced Polymer Technologies segment – although derived from non-oleo feedstocks – these products provide solutions that enable performance attributes in end-use markets that directly help customers and consumers meet sustainability goals.
Put simply: Ingevity’s products help customers reduce their ecological impact. Our asphalt emulsifiers enable pavement recycling that reuses up to 100 percent of existing materials to create longer-lasting roads. Our automotive activated carbon products improve the air we breathe by recovering 8 million gallons of gasoline daily. Our agriculture adjuvants provide enhanced performance in crop protection. Our alternative-fuel vehicle technology enables the use of renewable natural gas as fuel for pickup trucks and buses. The superior durability of caprolactone-based polyurethane technologies extends product life and the biodegradable performance of our thermoplastic polycaprolactones offer compostable end of-life solutions.
Our business is built on our ability to maximize the value and utility of materials over their lifecycle, and we will continue to enhance this value proposition through future acquisitions and new product development.
Strategic Portfolio Review
On October 29, 2024, we announced our intention to comprehensively review Ingevity’s asset and product portfolios. On January 16, 2025, we announced the exploration of strategic alternatives for our Performance Chemicals industrial specialties product line, including a potential divestiture of portions of the North Charleston site. This process includes all industrial specialties pine chemicals based chemistries that serve the paper chemical, rubber, adhesive, oilfield, lubricants and industrial intermediate end-use markets, and the North Charleston, South Carolina, CTO refinery. This process will not include the Performance Chemicals road technologies product line, nor certain lignin-based products that are currently reported in the Performance Chemicals industrial specialties product line.
We will continue to evaluate the rest of our portfolio and remain committed to taking appropriate actions to ensure our cost structure is aligned with our objective of being a specialty chemicals leader. We cannot assure this strategic review will result in a transaction and will update investors when appropriate.
Human Capital Management
Core Values
Developed collaboratively by Ingevity employees, the IngeviWay is the cultural framework that shapes Ingevity’s future and enables our success. It describes who we are, what we want to be, and what’s important to us as we work together to fulfill our purpose to purify, protect and enhance the world around us.
Reinforcing our IngeviWay foundation we launched “The IngeviWay in Action,” an initiative that raises the bar on expectations to build, inspire and lead, and better aligns how we work as a team to create the Ingevity of the future. By focusing on making a positive impact through everyday actions, “The IngeviWay in Action” bolsters the way we live our core values of safety and sustainability, maximize value for our people and our customers, commitment to excellence, integrity and ethical behavior, and drive to create innovative solutions.
Talent
Our employees are critical to our success, and we strive to provide a safe, rewarding, and respectful workplace where our people have opportunities to pursue career paths based on skills, performance, and potential. Our success depends, in part, on our ability to attract, retain and motivate critical resources across production, technical, engineering, sales, and various functional disciplines.
Labor Relations and Collective Bargaining
We currently employ approximately 1,600 employees, of whom approximately 73 percent are employed in the U.S. Approximately 51 percent of our production employees are represented by labor unions under various collective bargaining agreements ("CBA"). We engage in negotiations with labor unions for new CBAs from time to time based on expiration dates of agreements and statutory requirements. We consider our relationships with all salaried, union-hourly, and non-hourly employees to be positive and collaborative.
In 2024, the International Association of Machinists and Aerospace Workers, on behalf of its affiliated Local Union 1362 at our Crossett, Arkansas manufacturing plant ratified a one year extension agreement which expires March 1, 2025. The parties will begin contract renewal negotiations during the first quarter of 2025. The Advanced Polymer Technologies manufacturing plant in Warrington, United Kingdom negotiates pay and conditions annually with the GMB Trade Union. In addition, the CBA at our Covington, Virginia Performance Materials plant with the International Brotherhood of Electrical Workers on behalf of its affiliated Local Union 464 expired January 15, 2025. The parties began negotiations in the fourth quarter of 2024 and will continue to operate under the same terms and conditions while negotiations are pending. Also, the CBA at our Covington, Virginia Plant with the Covington Paperworkers Union Local 675, affiliated with the Association of Western Pulp and Paper Workers expires December 1, 2025. It is anticipated that the parties will begin contract renewal negotiations in the fourth quarter of 2025.
Diversity, Equity, Inclusion and Belonging
We are committed to fostering Diversity, Equity, Inclusion and Belonging. Our success is fueled by a vibrant, team-oriented culture where people understand that our individual differences make a greater collective impact in every interaction, from peer-to-peer collaboration across regions to customer engagements. At the heart of our efforts, we aim to strengthen empathetic and inclusive leadership, cultivate a sense of safety and belonging, and structure our systems, policies and processes to enable employee success. Working as one team, we are building a diverse, equitable and inclusive workplace where everyone has the opportunity to thrive.
We believe that the diversity of our leadership continues to positively impact our growth and success. Today, our board of directors is 33 percent women and 22 percent racially and ethnically diverse, and our executive team is 14 percent women-led and 29 percent racially and ethnically diverse.
Performance Management
We assess employee performance comprehensively, taking into account behaviors and direct input from the employee, feedback, the individual's progress toward goals, and their level of business impact. Achievements that bolster the team, our business, and our clients—internal and external—and our fundamental values are all included in the performance evaluation process. Our method involves keeping a codified record of employee performance at mid-year and end-of-year. It also includes a requirement for all Ingevity employees to ask for feedback from those who are aware of their performance and contributions. We encourage managers and their employees to have regular discussions to boost productivity, provide positive business outcomes, and raise employee engagement. With our all-encompassing strategy, Ingevity is able to gain a comprehensive understanding of each worker's strengths and identify opportunities for growth and development.
Health & Safety
Ingevity has a world-class safety program and a strong safety culture. Personal, process, and public safety are core values at Ingevity. We work hard to protect employees, contractors, and the communities where we operate from injuries, illnesses and incidents through the design and delivery of safe operations, continuous improvement of personal and process safety performance, management systems, and programs, a strong culture of compliance, and a commitment to strive for zero harm to people and the environment.
In 2024, we continued our efforts to increase reporting of and response to near miss incidents to prevent more serious injuries before they occur. This included efforts to increase the number of near misses reported and an increase in reporting by a broader number of employees. We also continued to improve safety training, further expanded the use of leading indicators to ensure effective initiatives are proactively implemented, and improved incident investigation quality to ensure contributing factors are appropriately identified and addressed. Employees were trained on the importance of our Life-Saving Rules, put in place to prevent fatalities and serious injuries through leadership videos, monthly interactive training packages, and upgraded procedures, checklists, work permits, and audits. Additionally, in North America where the majority of our bulk shipments are
executed, we abide by the American Chemistry Council’s Responsible Care practices for transporting our chemicals safely. We strategically utilize logistics providers that have committed to these higher standards of safety, security, stewardship, and sustainability.
Governmental Regulations
Our manufacturing operations are subject to regulation by governmental and other regulatory authorities with jurisdiction over our operations. These regulations include the discharge of materials into the environment, the handling, storage, transportation, disposal, and clean-up of chemicals and waste materials, and otherwise relating to the protection of the environment, as well as other operational regulations, such as the Occupational Safety and Health Act ("OSHA") and the Toxic Substances Control Act ("TSCA") in the U.S., and the Registration, Evaluation and Authorization of Chemicals ("REACH") directives in the European Union, the United Kingdom, and other countries. It is not possible to quantify with certainty the material effects that compliance with these regulations may have upon the capital expenditures, earnings, or competitive position of Ingevity, but we currently anticipate that such compliance will not have a material adverse effect on any of the foregoing. Environmental and other regulations and related legal proceedings have the potential to involve significant costs and liability for Ingevity.
Intellectual Property
Protection of intellectual property, including patents, closely guarded trade secrets, and highly proprietary manufacturing know-how, as well as other proprietary rights, is critical to maintaining our technology leadership and competitive edge. Our business strategy includes filing patent and trademark applications where appropriate for proprietary developments, as well as protecting our trade secrets. We actively create, protect, and enforce our intellectual property rights. We are filing for and being granted patents for product and process developments for our Performance Materials business that we believe are both novel and consistent with trends in the technological development of engines. Our Evotherm® Warm Mix Asphalt technology is supported by numerous global patents and trademarks. Additionally, our caprolactone and related technologies are supported by numerous global patents and trademarks, as well as proprietary manufacturing and technical know-how. The protection afforded by our patents and trademarks varies based on country, scope, and coverage, as well as the availability of legal remedies. Although our intellectual property taken as a whole is material to the business, there is no individual patent or trademark the loss of which could have a material adverse effect on the business.
On July 19, 2018, we filed suit against BASF Corporation (“BASF”) in the U.S. District Court for the District of Delaware (the “Delaware Proceeding”) alleging BASF infringed Ingevity’s patent covering canister systems used in the control of automotive gasoline vapor emissions (U.S. Patent No. RE38,844) (the “844 Patent”). On February 14, 2019, BASF asserted counterclaims against us in the Delaware Proceeding, alleging two claims for violations of U.S. antitrust law (one for exclusive dealing and the other for tying) as well as a claim for tortious interference with an alleged prospective business relationship between BASF and a BASF customer (the “BASF Counterclaims”). The BASF Counterclaims relate to our enforcement of the 844 Patent and our entry into several supply agreements with customers of our fuel vapor canister honeycombs. The U.S. District Court dismissed our patent infringement claims on November 18, 2020, and the case proceeded to trial on the BASF Counterclaims in September 2021.
On September 15, 2021, a jury in the Delaware Proceeding issued a verdict in favor of BASF on the BASF Counterclaims and awarded BASF damages of approximately $28.3 million, which will be trebled under U.S. antitrust law to approximately $85.0 million. On May 18, 2023, the court in the Delaware Proceeding entered judgment on the jury’s verdict, which commenced the post-trial briefing stage. On February 13, 2024, the court in the Delaware Proceeding denied BASF’s motion for pre-judgment interest on its tortious interference claim as well as our motion seeking judgment as a matter of law, or a new trial in the alternative. In addition, BASF has indicated it will seek attorneys’ fees and costs in amounts that they will allege and have to demonstrate at a future date. Unless the judgment is set aside, BASF will be entitled to post-judgment interest pursuant to the rate provided under federal law.
We disagree with the verdict, including the court’s application of the law and entry of judgment. Therefore, on March 13, 2024, we appealed the verdict as well as the U.S. District Court’s November 2020 dismissal of our patent infringement claims against BASF. Ingevity believes in the strength of its intellectual property and the merits of its position and intends to pursue all legal relief available to challenge these outcomes in the Delaware Proceeding. Final resolution of these matters could take up to 15 months from the date of this Annual Report on Form 10-K.
Segments
Performance Materials
We engineer, manufacture, and sell hardwood-based, chemically activated carbon products which are produced through a highly technical and specialized process primarily for use in gasoline vapor emission control systems in internal combustion engines and hybrid electric vehicles including cars, trucks, motorcycles, and boats. To maximize the productivity of our manufacturing assets, we also produce several other activated carbon products for food, water, beverage, and chemical purification applications.
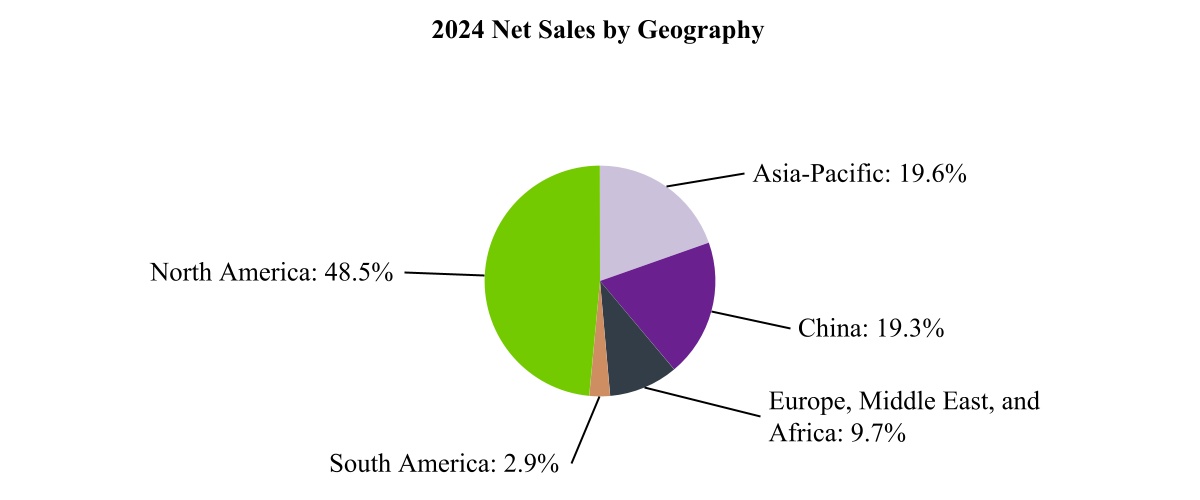
Our automotive activated carbon products primarily take the form of granules, pellets, and honeycomb "scrubbers," which are primarily utilized in vehicle-based gasoline vapor emission control systems to capture gasoline vapors that would otherwise be released into the atmosphere as volatile organic compounds. The captured gasoline vapors are largely purged from the activated carbon and re-directed to the engine where they are used as supplemental power for the vehicle. In this way, our automotive activated carbon products are part of a system that improves the environment and fuel efficiency. Performance Materials' net sales for 2024, 2023, and 2022 were $609.6 million, $586.0 million, and $548.5 million, respectively. The chart below reflects our 2024 Performance Materials' net sales by geography. Sales are assigned to geographic areas based on the location of the party to which the product was shipped.
Raw Materials and Production
Our Performance Materials segment serves customers globally from three manufacturing locations in the U.S. and two in China. The primary raw material (by volume) used in the manufacture of our activated carbon is hardwood sawdust. Sawdust is readily available and is sourced through multiple suppliers to protect against supply disruptions and to maintain competitive pricing.
We also utilize phosphoric acid to chemically activate the hardwood sawdust. This phosphoric acid is sourced through multiple suppliers to protect against supply disruptions and to maintain competitive pricing. The market price of phosphoric acid is affected by the global agriculture market as the majority of global phosphate rock production is used for fertilizer production and only a portion of that production is used to manufacture purified phosphoric acid.
Customers
We sell our automotive technologies products to approximately 60 customers around the globe. In 2024, our ten largest customers accounted for approximately 85 percent of sales. We are the trusted source of these products for many of the world’s largest automotive parts manufacturers, including PHINIA Inc. (previously BorgWarner Inc.), A. Kayser Automotive System GmbH, Korea Fuel-Tech Corporation, MAHLE GmbH, and many other large and small component manufacturers throughout the global automotive supply chain. Our food, water, beverage, and chemical purification products are sold to approximately 70 customers globally. We sell our products primarily through our own direct sales force in North America,
Europe, South America, Asia, and a smaller, focused network of third-party distributors that have established a strong direct sales and marketing presence in North America and China.
Competition
Our competitors include Norit, Kuraray Co., Ltd., and several domestic U.S. manufacturers and distributors of imported products and Chinese manufacturers. Ingevity has a decades-long track record of providing activated carbon that achieves life-of-vehicle emission standards. Given the imperative for automotive manufacturers to produce vehicles for the U.S., Canada, and China markets capable of meeting life-of-vehicle emission standards, or potentially face expensive recalls and unfavorable publicity, our automotive activated carbon products provide our customers the low-risk choice for this high-performance application. Additionally, we are well-positioned to meet increasing emissions standards around the world.
Performance Chemicals
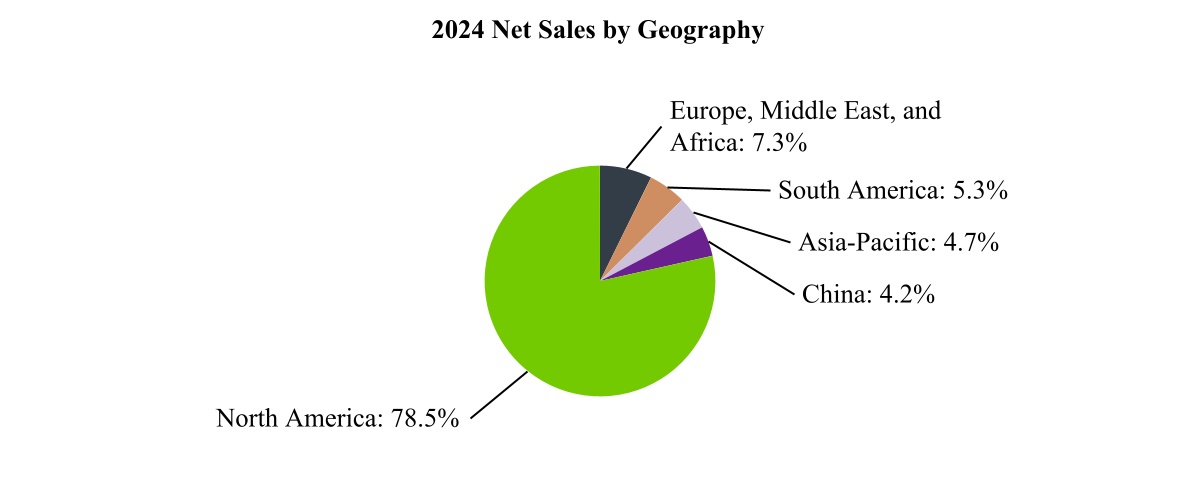
Our Performance Chemicals segment is comprised of two product lines: road technologies and industrial specialties. Our products are utilized in road construction, preservation, reconstruction and recycling, road markings, agrochemical dispersants, lubricants, certain adhesives, rubber, and other diverse industrial uses. Our application expertise is often called upon by our customers to provide unique solutions that maximize resource efficiency. We have a broad and diverse customer base in this segment. In 2024, our top ten customers accounted for approximately 26 percent of our segment revenue, with the next 100 customers making up approximately 47 percent of our segment revenue. Performance Chemicals' net sales for 2024, 2023, and 2022 were $608.2 million, $902.1 million, and $875.1 million, respectively. The chart below reflects our 2024 Performance Chemicals' net sales by geography. Sales are assigned to geographic areas based on the location of the party to which the product was shipped.
In 2023, Ingevity began a transformation of the Performance Chemicals’ industrial specialties product line. During the fourth quarter of 2023, Ingevity announced the planned closure of the DeRidder, Louisiana (the “DeRidder Plant”) CTO refinery and derivatives operations. All production at the DeRidder Plant ceased in the first quarter of 2024. Additionally, in July 2024, we announced plans to transition the refining of oleo-based products from our Crossett, Arkansas manufacturing plant (the “Crossett Facility”) to our North Charleston, South Carolina manufacturing plant. We ceased production at the Crossett Facility in the third quarter of 2024 and materially completed the transition in the fourth quarter of 2024. With the majority of this transformation complete, Ingevity’s participation in the rosin-based adhesive and publication printing ink markets along with emulsifiers for drilling into the oilfield markets has been significantly reduced.
On January 16, 2025, we announced the exploration of strategic alternatives for our Performance Chemicals industrial specialties product line, including a potential divestiture of portions of the North Charleston site. This process includes all industrial specialties' pine chemicals based chemistries that serve the paper chemical, rubber, adhesive, oilfield, lubricants and industrial intermediate end-use markets, and the North Charleston, South Carolina, crude tall oil refinery. This process will not include the Performance Chemicals road technologies product line, nor certain lignin-based products that are currently reported in Ingevity’s industrial specialties product line.
Raw Materials and Production
Our Performance Chemicals segment serves customers globally from five manufacturing locations in the U.S. Most of our industrial specialties products and some of our road technologies products are derived from CTO, a co-product produced by softwood kraft pulp processors. We also produce products derived from kraft lignin, which is extracted from black liquor, another co-product of softwood kraft pulp processing.
Historically, we have sourced the majority of our CTO needs through long-term supply contracts. However, CTO pricing volatility in recent years has made it difficult to manage long-term pricing mechanisms, and as a result, during 2024 we exited all material long-term contracts. We now procure our supply of CTO through shorter-duration contracts. Shorter-term contracts of 12 to 15 months enable more flexibility and transparency on pricing. On July 1, 2024, we terminated our last material long-term CTO supply contract. As consideration for the termination, we made cash payments totaling $100.0 million during 2024.
The supply of CTO is generally inelastic and governed by the volume of softwood kraft pulp processing around the world. Also, there are regulatory pressures that may incentivize suppliers of CTO to sell CTO into alternative fuel markets (e.g., biofuels) rather than to historical end users such as Ingevity. CTO-based biofuel has been deemed to meet the EU’s Renewable Energy Directive, second phase (“RED II”) biofuel sustainability criteria. As a result of RED II and related government incentives, there has been a significant increase in demand for CTO and its derivatives over the past several years. The increased demand, combined with the rationalization of softwood kraft pulp processing, has created pressure on CTO pricing and driven the cost of CTO to unprecedented levels, higher by as much as 300 percent in some cases.
During 2024, we sourced approximately 81 percent of our CTO from two primary parties: Smurfit WestRock and Georgia-Pacific. CTO accounted for approximately 14 percent of our consolidated cost of sales and 38 percent of our consolidated raw materials purchases in 2024.
In addition to these developments in the EU, various pieces of legislation regarding the use of alternative fuels have been introduced in the U.S. at both the federal and state level. Currently, none of the U.S. legislation mandates or provides incentives for the use of CTO or its derivatives as a biofuel. Future legislation in the U.S. and elsewhere may promote the use of CTO or its derivatives as a feedstock for the production of biofuels, further constraining supply.
The other key raw materials used in the Performance Chemicals business are maleic anhydride, ethoxylates, amines, and acrylic emulsions. These are sourced where possible through multiple suppliers to protect against supply disruptions and to maintain competitive pricing.
Markets Served
Road Technologies
Our road technologies product line produces a broad line of innovative additives and technologies utilized globally in road construction and pavement preservation, including pavement reconstruction and recycling. With the 2022 acquisition of Ozark Materials, LLC (“Ozark Materials”), we added road markings technologies to the portfolio.
Road Construction. Evotherm®, our premier road construction additive, is a warm mix asphalt technology that acts as both a liquid antistrip and a warm mix asphalt. Once Evotherm® is mixed into the binder utilized for road layer construction, production temperatures can be significantly lowered compared to conventional hot mix asphalt. Lower production temperatures reduces our customers' emissions and fuel use during road construction as well as making roads last up to 20 percent longer.
Pavement Preservation. We provide an array of pavement preservation products that eliminate many traditional asphalt heating, mixing, and transportation demands – saving our customers time, energy, and money. Our technical team matches the right emulsifier and design to our customers’ materials and conditions to create high-performing emulsions. We offer a full range of specialized cationic, anionic, and amphoteric emulsifiers with additional, custom-formulated specialty additives.
Pavement Reconstruction and Recycling. We provide an array of pavement reconstruction and recycling additives that reduce the life cycle cost of pavement by enabling the milling and reuse of existing roadways. Our cold in-place recycling additives allow our customers to reopen existing roadways faster, while also lowering overall costs and jobsite emissions.
Pavement Markings. We provide thermoplastic and waterborne paint road markings technologies which provide long service life, excellent adhesion, superior color, and higher retro-reflectivity. Based on the customer and/or governmental agency requirements, the markings can be designed for varying levels of initial and retained performance properties.
Customers
We supply our road technologies products to approximately 750 customers in 60 countries through our own direct sales force, primarily in the Americas and Europe, as well as a network of third-party distributors. In 2024, our ten largest customers accounted for approximately 37 percent of the product line's sales. Our largest customers include Ergon, Inc., TRP Group, Frontline, The Heritage Group, and Idaho Asphalt Supply Inc.
Competition
Our primary competitors in road technologies are Nouryon Chemicals B.V., Arkema S.A., Kao Specialties Americas LLC, Sherwin-Williams Company, and PPG Industries Traffic Solutions. We compete based on deep knowledge of our customers’ businesses and extensive insights into road-building technologies and trends globally. We use these strengths to develop consultative relationships with government departments of transportation, facilitating new technology introduction into key markets around the world. Our combined expertise in the disciplines of chemistry and civil engineering provides us with a comprehensive understanding of the relationship between the molecular structure of our products and their impact on the performance of pavement systems. This allows us to develop products customized to local markets and to consistently deliver cost-effective solutions for our customers.
Industrial Specialties
Our industrial specialties product line produces and sells chemicals utilized in several industrial applications, including adhesive tackifiers, agrochemical dispersants, lubricant additives, rubber resins, industrial intermediates, and oilfield.
Agricultural Chemicals. We produce dispersants for crop protection products as well as other naturally derived products for agrochemicals. Crop protection formulations are highly engineered, specifically formulated, and cover a range of different formulation types, from liquids to solids. We deliver a wide range of dispersants that are high performing and consistent. In addition, our crop protection products are approved for use as inert ingredients in agrochemicals by regulatory agencies throughout the world.
Rubber. We are a global supplier of tall oil-based products and we offer a broad range of resins, rosin soaps, mixed acids and fatty acids from renewable resources. We currently supply specialty products to latex manufacturers, compounders and tire producers where our resins help improved fuel efficiency, wear and traction.
Industrial Intermediates. Our functional chemistries are sold across a diverse range of industrial markets including, textile dyes, rubber, cleaners, mining, oilfield and nutraceuticals.
Adhesives, and Lubricants. We are a North American supplier of tackifier resins which provide superior adhesion to difficult-to-bond materials to the adhesives industry. Adhesive applications for our products include construction, product assembly, packaging, pressure-sensitive labels and tapes, hygiene products, and road markings. We supply lubricant additives and corrosion inhibitors for the metalworking and fuel additives markets. Our lubricant products are multi-functional additives that contribute to lubricity, wetting, corrosion inhibition, emulsification, and general performance efficiency.
Customers
We sell our industrial specialties products to approximately 400 customers around the globe in over 40 countries through our own direct sales representatives and third-party sales representatives and distributors. In 2024, our ten largest customers accounted for approximately 39 percent of the product line's sales. Our largest customers include Solenis, Arboris, ChampionX, and Syngenta.
Competition
Our competitors, which differ depending on the product, application, and region, include Kraton Corp., Forchem, Eastman Chemical Co., Borregaard ASA, Repsol S.A., Lamberti S.p.A., Cargill, Vantage, and PMC, as well as several others. Specific to our industrial specialty products, our customers select the product that provides the best balance of performance, consistency, and price. Reputation and loyalty are also valued by our customers and allow us to win business when other factors are equal. In agrochemicals, the selection of a dispersant is made early in the product development cycle and the formulator has a choice among our sulfonated lignin products, lower-quality lignosulfonates and other surfactants such as naphthalene sulfonates. In adhesives, our products compete against other tackifiers, including other tall oil resin ("TOR") based tackifiers as well as tackifiers produced from gum rosin and hydrocarbon based materials. In lubricants, we compete against other producers of distilled tall oil and additives. In our industrial intermediates business, our tall oil fatty acid ("TOFA") competes against widely available fats and oils derived from tallow, soy, rapeseed, palm, and cotton sources.
Advanced Polymer Technologies
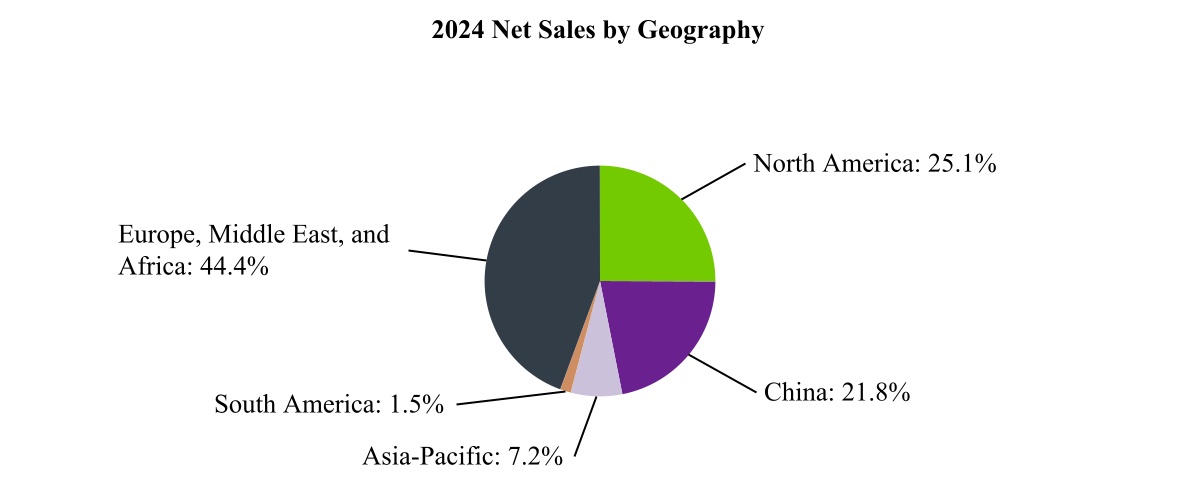
Our Advanced Polymer Technologies segment produces caprolactone and caprolactone-based specialty polymers for use in coatings, resins, elastomers, adhesives, bioplastics, and medical devices. Advanced Polymer Technologies' net sales for 2024, 2023, and 2022 were $188.6 million, $204.0 million, and $244.7 million, respectively. The chart below reflects our 2024 Advanced Polymer Technologies' net sales by geography. Sales are assigned to geographic areas based on the location of the party to which the product was shipped.
Raw Materials and Production
Our Advanced Polymer Technologies segment serves customers globally from one manufacturing location in the U.K. Our Advanced Polymer Technologies' products are caprolactone-based, which is derived from cyclohexanone, a benzene derivative, and hydrogen peroxide, both of which are readily available in the market. We maintain multiple suppliers of cyclohexanone to protect against supply disruptions and to maintain competitive pricing. Our hydrogen peroxide is currently supplied by Solvay Interox Limited under a long-term supply agreement.
Customers
We sell our Advanced Polymer Technologies products to approximately 250 customers around the globe through our own direct sales representatives and third-party sales representatives and distributors. In 2024, our ten largest customers accounted for approximately 46 percent of the segment's sales. Our largest customers are active in polyurethane, elastomers, adhesives, coatings, and bioplastics manufacturers.
Competition
Our primary caprolactone competitors are Daicel Corporation, Hunan Juren Chemical Hitechnology, and BASF SE, but we also face competition from other competing materials. Our value proposition is focused on sustainability elements, either through the high durability performance our Capa polyols impart to polyurethane articles or via the biodegradability characteristics of our Capa thermoplastics which now hold certification in multiple environments. We also add value through customer intimacy, a high focus on environmental, health, safety and quality performance and our supply chain capabilities.
ITEM 1A. RISK FACTORS
Based on the information currently known to us, we believe that the following information identifies the most significant risk factors affecting the Company. However, the risks and uncertainties we face are not limited to those set forth in the risk factors described below. Additional risks and uncertainties not presently known to us or that we currently believe to be immaterial may also adversely affect our business. In addition, past financial performance may not be a reliable indicator of future performance, and historical trends should not be used to anticipate results or trends in future periods.
If any of the following risks and uncertainties develop into actual events, these events could have a material adverse effect on our business, financial condition. or results of operations. In such case, the trading price of our Common Stock could decline.
Operational Risks
The repositioning of our Performance Chemicals business has reduced our net sales and may otherwise adversely affect our financial condition and results of operations during this transition period.
On November 1, 2023 and July 31, 2024, we announced a number of strategic actions designed to further reposition our Performance Chemicals reportable segment to improve the profitability and reduce the cyclicality of the Company as a whole. These initiatives, including the closure of our plants in DeRidder, Louisiana and Crossett, Arkansas (the “Plant Closures”), focus on reducing exposure to lower margin end-use markets of our industrial specialties product line. The anticipated timing, charges, costs and results of the closure of the Plant Closures and other current or future repositioning activities are subject to a number of assumptions and risks and the actual results could materially differ from our estimates if such actions result in adverse legal or regulatory actions, if personnel required to effect the shutdown become unavailable, or we are affected by other factors not currently contemplated. These actions have, and may continue to, adversely affect the Company’s financial condition and results of operations.
Our review of strategic alternatives for the industrial specialties product line and North Charleston, South Carolina crude tall oil (“CTO”) refinery may not result in a transaction and any transaction entered into may not yield the expected results or benefits.
On January 16, 2025, we announced plans to explore strategic alternatives for our industrial specialties product line and North Charleston, South Carolina CTO refinery, including a potential divestiture of portions of the North Charleston site. While it is our intent to identify and pursue a transaction that will strengthen the Performance Chemicals segment and improve the Company’s financial performance, and benefit our stockholders by enabling us to focus on higher growth and higher margin opportunities, there can be no guarantee that this strategic review will result in such a transaction or achieve such expected results or benefits.
We are dependent upon third parties for the provision of certain critical operating services at several of our facilities.
We are dependent upon third parties for the provision of certain critical operating services, primarily utilities and related services (depending on the site, e.g., steam, compressed air, energy, water, wastewater treatment, hydrogen peroxide), at our Covington, Virginia Performance Materials facility and at our Warrington, United Kingdom Advanced Polymer Technologies facility.
The services provided by third parties would be at risk if any of the counterparties were to idle or permanently shut down the associated mill or plant, or if operations at the associated mill or plant were disrupted due to natural or other disaster, or by reason of strikes or other labor disruptions, or if there were a significant contractual dispute between the parties. The third party provider of critical and non-critical services at our location in Warrington, United Kingdom has announced plans to discontinue operations at its Warrington, United Kingdom plant, but continues to provide services to us. In the event that the applicable counterparty were to fail to provide the contracted services, we would be required to obtain these services from other third parties, most likely at an increased cost, or to expend capital to provide these services ourselves. The expenses associated with obtaining or providing these services, as well as any interruption in our operations as a result of the failure of the counterparty to provide these services, may be significant and may adversely affect our financial condition and results of operations.
Furthermore, in the event that Smurfit WestRock’s Covington, VA paper mill’s wastewater treatment operations do not comply with permits or applicable law and Smurfit WestRock is unable to determine the cause of such non-compliance,
then we will be responsible for between 10 percent and 50 percent of the costs and expenses of such noncompliance (increasing in 10 percent increments per violation during each twelve-month period) despite representing less than 3 percent of the total wastewater volume. These costs and expenses may be significant and may adversely impact our financial condition and results of operations.
Additionally, several of our manufacturing facilities are leased. In the event we were to have a dispute with the landlord regarding the terms of the relevant lease agreements, or we were otherwise unable to fully access or utilize the leased property, the associated business disruption may be significant and may adversely affect our financial condition and results of operations.
Disruptions at any of our facilities could negatively impact our production, financial condition and results of operations.
Disruptions to any of our manufacturing operations or other facilities due to natural disasters and extreme weather, such as a hurricane, tropical storm, earthquake, tornado, severe weather, flood or fire, or other unanticipated problems such as labor difficulties, pandemics, equipment failure, cyberattacks or other cybersecurity incidents, capacity expansion difficulties or unscheduled maintenance, could cause operational disruptions of varied duration. Also, many of our production employees are governed by collective bargaining agreements (“CBAs”). The CBA at our Warrington, United Kingdom Advanced Polymer Technologies manufacturing facility with GMB Union is negotiated annually and the parties operate under the prior CBA until new terms are agreed. The CBA at our Covington, Virginia Performance Materials plant with the International Brotherhood of Electrical Workers on behalf of its affiliated Local Union 464 expired on January 15, 2025. The parties began negotiations in the fourth quarter of 2024 and will continue to operate under the same terms and conditions while negotiations are pending. The CBA at our Crossett, Arkansas Performance Chemicals manufacturing facility with the International Association of Machinists and Aerospace Workers Union ("IAM") expires on March 1, 2025. The parties will begin contract renewal negotiations during the first quarter of 2025. Further, the CBA at our Covington, Virginia Plant with the Covington Paperworkers Union Local 675, affiliated with the Association of Western Pulp and Paper Workers will expire on December 1, 2025. It is anticipated that the parties will begin contract renewal negotiations during the fourth quarter of 2025.
While the Company has generally positive relations with its labor unions, there is no guarantee the Company will be able to successfully negotiate new union contracts without work stoppages, labor difficulties or unfavorable terms. In addition, existing CBAs may not prevent a strike or work stoppage at the applicable plant.
These types of disruptions could materially adversely affect our financial condition and results of operations to varying degrees depending upon the facility, the duration of the disruption, and our ability to shift business to another facility or find alternative sources of manufacturing capacity. Any losses due to these events may not be covered by our existing insurance policies or may be subject to certain deductibles. In certain cases, we have products, such as our extruded honeycomb, caprolactone, pavement preservation products, road construction products, pavement reconstruction and recycling products, and industrial specialties products, that are only made at a single site, such as our Covington, Virginia Performance Materials plant. While we have some redundancies within the facilities that are the sole manufacturer of certain products, we have limited ability to make these products at other facilities.
Supply Chain Risks
We purchase a variety of raw materials, which are subject to pricing pressures and limited availability; inability to procure these raw materials or to pass on price increases could negatively impact our operations or financial results.
The Company purchases a variety of raw materials from third parties for its manufacturing operations, including, but not limited to, CTO, hardwood sawdust, phosphoric acid, ethylene amines, black liquor, maleic/fumaric acid, hydrogen peroxide, cyclohexanone, and ethoxylates. Each raw material is subject to its own supply and demand dynamics which may, at times, limit availability and/or cause price volatility. The Company may be unable to procure the quantities of raw materials it needs which could negatively impact our operations or we may be unable to pass through price increases to our customers which could negatively impact our financial results. For example, our Performance Chemicals segment produces many products derived from CTO and lignin, which are co-products of the kraft pulping process. While we have taken aggressive action to limit the Company’s exposure to the volatility of the CTO market, its limited availability and competing demands for its use could again impact our financial results and results of operations if we are unable to source a sufficient supply at a reasonable cost. Lignin is also in limited supply and if we are unable to secure a sufficient amount of lignin on a cost-effective basis we could suffer disruption to our road technologies product line, which could negatively impact our financial results and our results of operations.
Disruptions within our supply chain could negatively impact, our production, financial condition and results of operations.
We could be adversely affected by disruptions within our supply chain and transportation network. Our products are transported by truck, rail, barge or ship primarily by third-party providers. The costs of transporting our products could be negatively affected by factors outside of our control, including rail service interruptions or rate increases, extreme weather events, local hostilities, tariffs, rising fuel costs, and capacity constraints. For example, port strikes within the U.S. have adversely impacted, and could continue to adversely impact, the reliability and cost of our export shipments to customers. Significant delays or increased costs relating to transportation could materially affect our financial condition and results of operations. Disruptions at our suppliers could lead to volatility or increases in raw material or energy costs and/or reduced availability of materials or energy, potentially affecting our financial condition and results of operations.
Market Risks
Adverse conditions in the automotive market may negatively impact demand for our automotive carbon products.
Sales of our automotive activated carbon products are tied to global internal-combustion-engine (“ICE”) and hybrid electric vehicle automobile (“HEV”) production levels. ICE and HEV automotive production in the markets we serve can be affected by macro-economic factors such as interest rates, fuel prices, shifts in vehicle mix (including shifts toward alternative energy vehicles), consumer confidence, employment trends, regulatory and legislative oversight requirements, and trade agreements.
The Company’s road technologies product line is heavily dependent on government infrastructure spending.
A significant portion of our customers’ revenues in our road technologies business is derived from contracts with various foreign and U.S. governmental agencies, and therefore, when government spending is reduced, our customers’ demand for our products is similarly reduced. While we do not do business directly with governmental agencies, our customers provide paving services to the governments of various jurisdictions within North America, South America, Europe, China, Brazil and India, and revenue either directly or indirectly attributable to such government spending continues to remain a significant portion of our revenues. Government business is, in general, subject to special risks and challenges, including: delays in funding and uncertainty regarding the allocation of funds to federal, state and local agencies; delays in spending or reductions in other state and local funding dedicated for transportation projects; other government budgetary constraints, cutbacks, delays or reallocation of government funding; long purchase cycles or approval processes; our customers’ competitive bidding and qualification requirements; changes in government policies and political agendas; and international conflicts or other military operations that could cause the temporary or permanent diversion of government funding from transportation or other infrastructure projects.
Certain of the Company’s products are sold into cyclical end-markets, such as the automotive market and the apparel market, which are impacted by changes in consumer and industrial demand.
Certain of our products are sold into end-markets that are cyclical and subject to frequent and rapid technology changes, changes in consumer preferences, evolving standards, and changes in product supply and demand. For example, demand for our Advanced Polymer Technologies products in the automotive market, where our products are formulated into automotive resins and coatings and various components, may be affected by technological advances, changing automotive original equipment manufacturer ("OEM") specifications, and global automobile production levels. Demand for our Advanced Polymer Technologies products which are sold into automotive applications, footwear adhesives and structural support, may be affected by consumer discretionary spending and changes in consumer preferences. Additionally, sales of our industrial specialties and Advanced Polymer Technologies products have, and may continue to be, negatively impacted due to reduced global industrial demand. The impact of these changes may lead to increased competition from competing and substitute products and downward pricing pressures on our customers, and therefore, on our Advanced Polymer Technologies and industrial specialties product offerings.
We face competition from new technologies and new or emerging competitors.
Our industries and the end-use markets into which we sell our products experience periodic technological change and product innovation. Our future growth depends on our ability to gauge the direction of commercial and technological progress in key end-use markets, to swiftly identify and respond to disruptive technologies, and to fund and successfully develop, manufacture, and market products in such changing end-use markets. If we fail to keep pace with the evolving or disruptive
technological innovations in our end-use markets on a competitive basis, our financial condition and results of operations could be adversely affected.
In the Performance Materials segment, there is competition from other activated carbon manufacturers. These competitors are trying to develop more advanced and alternative activated carbon products that could more effectively compete with our products in automotive applications. There is also competition in automotive applications from non-activated carbon competitors and product offerings. For example, multiple OEMs are using sealed tanks in certain subsets of their vehicles to comply with the strict emission regulations (i.e., Tier 3/LEV III) in the U.S. While sealed tank fuel systems generally require an increased sized pelleted activated carbon canister to deal with refueling emissions, in most cases, they do not use an extruded honeycomb to meet current U.S. and California regulations. There is also emerging competition in the "honeycomb" space, which may impact sales of the Company's products. If a competitor were to succeed in developing products that are better suited than ours for automotive evaporative emissions capture applications and/or a competitive technology, such as, but not limited to, sealed gas tanks, our financial results could be negatively impacted.
In addition, the adoption of electric and hydrogen fuel cell vehicles is increasing in the U.S. and other parts of the world. Consumer demand for these alternative-fueled vehicles is expected to continue to increase significantly in future years as certain states and international governments implement limits on the sale of vehicles with ICE with various time lines to phase out sales of ICE vehicles. A reduction in the sales of vehicles with internal combustion engines would reduce demand for our activated carbon automotive products. Our long-term strategy is to grow our sales of products for applications in all-electric and hydrogen fuel cell vehicles to off-set the expected decline in activated carbon sales for ICE. If we are unable to develop products for all-electric and hydrogen fuel cell vehicles or grow sales fast enough, our business and results of operations could be adversely impacted. The process of designing and developing new technology and related products is complex, costly, and uncertain and may require us to retain and recruit talent in areas of expertise outside of our current core competencies. There can be no assurance that such advances in technology will be feasible or successful, or will occur in a timely and efficient manner.
In the Advanced Polymer Technologies segment, there is competition from other caprolactone manufacturers, including new market entrants. If we are unable to successfully compete in our end-use markets, our financial condition and results of operations could be adversely affected.
Certain of our products face competition from substitute products where the costs of different raw material inputs can impact the price competitiveness of our products and negatively impact our sales and/or profits as we respond to substitute product competition.
The price of gum rosin has a significant impact on the market price for TOR and rosin derivatives and is driven by labor rates for harvesting, land leasing costs, and various other factors that are not within our control. Hydrocarbon resins, for example, C5 resins, are co-products from the manufacture of isoprene (synthetic rubber). Availability and pricing are determined by the supply/demand dynamics for synthetic rubber as well as the price of crude oil as the feedstock for isoprene and various other factors that are not within our control. Animal and plant based fatty acids compete with TOFA products in industrial specialties. The market price for our TOFA and oleochemical products are impacted by the prices of other fats and oils, and the prices for other fats and oils are driven by actual and expected harvest rates, petroleum oil prices, and the biofuel market. Other monomers, thermoplastics, and polyols compete with our caprolactone-based products. The price for our products is impacted by the prices of competitive substitutes which are influenced by oil prices as well as other supply and demand factors. We may not be able to pass through raw material cost increases, or we may lose market share if we do not effectively manage our pricing, which in either case could negatively impact our financial results.
Additionally, the price of energy may directly or indirectly impact demand, pricing or profitability for certain of our products. As petroleum oil prices can change rapidly, Performance Chemical segment products may be disadvantaged due to the fact that CTO is a thinly traded commodity with pricing commonly established for periods ranging from one quarter to one-year periods of time. Due to this, alternative technologies which compete with product offerings provided by Ingevity may be advantaged from time to time in the marketplace. Protracted periods of high volatility or sustained oversupply of petroleum oil may also translate into increased competition from petroleum-based alternatives. In addition, pricing for competing oleochemicals such as palm or soybean is likely to put further pressure on pricing of the Company’s products during periods of depressed petroleum prices.
We are dependent on certain large customers.
We have certain large customers in particular businesses, the loss of which could have a material adverse effect on the applicable segment’s sales and, depending on the significance of the loss, our results of operations, financial condition or cash flows. Sales to the Company’s ten largest customers (across all three segments) accounted for 38 percent of total sales for 2024. No customer accounted for more than 10 percent of total sales for 2024. With some exceptions, our business with those large customers is based primarily upon individual purchase orders. As such, our customers could cease buying our products from us at any time, for any reason, with little or no recourse. If a major customer or multiple smaller customers elected not to purchase products from us, our financial condition and results of operations could be materially adversely affected.
We are dependent on attracting and retaining key personnel.
We are dependent upon our production workers, as well as upon engineering, technical, sales, and application specialists, together with experienced industry professionals and senior management. Our success depends, in part, on our ability to attract, retain and motivate key talent. Our failure to attract and retain individuals making significant contributions to our business could adversely affect our financial condition and results of operations.
The inability to make or effectively integrate future acquisitions may negatively affect our results.
As part of our growth strategy, we may pursue acquisitions of businesses and product lines or invest in joint ventures. The ability to grow through acquisitions or other investments depends upon our ability to identify, negotiate, finance, complete, and integrate suitable acquisitions or joint venture arrangements. There can be no assurances that we will be able to integrate these acquisitions in an efficient and cost-effective manner or that these acquisitions or joint ventures will generate the expected value.
Acquisitions and other investments may expose us to liability from the target company and/or joint venture partner. Acquisition and investment target companies may be or may become involved in disputes regarding intellectual property and other aspects of their businesses or may be subject to liabilities that are unknown at the time of the transaction, including liabilities under environmental or tax laws. Depending on the nature of our investment and/or structure of an acquisition, we may take on or be exposed to such liability, which could materially impact our business, financial condition, or results of operations.
As we rely on information technologies to conduct our business, cyber-attacks, data and privacy breaches, or a failure of information technology systems could disrupt our operations and expose us to liability, which could cause our business and reputation to suffer.
We rely on our information technology systems, some of which are managed by third parties, to support, manage and maintain the day-to-day operations and activities of our business, including our manufacturing facilities, customer and vendor transactions, and financial, accounting, and business records. In addition, we collect and store certain data, including proprietary business information, and may have access to confidential or personal information that is subject to privacy and security laws and regulations.
The secure processing, storage, and transmission of sensitive, confidential, and personal data is critical to our operations and business strategy. We have instituted a system of security policies, procedures, capabilities, internal controls and audits aligned with our ISO 27001 certification, designed to protect this information. Additionally, we engage third-party threat detection, penetration testing, and monitoring services which includes a global cybersecurity incident response team. Despite our security architecture and controls, and those of our third-party providers, we may be vulnerable to cyber-attacks, computer viruses, security breaches, ransomware attacks, inadvertent or intentional employee actions, system failures, and other risks that could potentially lead to the compromising of sensitive, confidential or personal data, improper use of our, or our third-party provider systems, solutions or networks, unauthorized access, use, disclosure, modification or destruction of information, and operational disruptions. We also maintain an information security risk insurance policy to help mitigate the financial consequences of these risks, however, there is no guarantee that such a policy will be sufficient to address such costs. In addition, the global regulatory environment pertaining to information security and privacy is increasingly complex, with new and changing requirements, such as the European Union’s General Data Protection Regulation (“GDPR”), California Consumer Privacy Act (“CCPA”), and the China Cybersecurity Law and Personal Information Protection Law. GDPR, which applies to the collection, use, retention, security, processing, and transfer of personally identifiable information of residents of EU countries, mandates new compliance obligations and imposes significant fines and sanctions for violations. CCPA requires
companies to provide new data disclosure, access, deletion, and opt-out rights to consumers in California. Implementing and complying with these laws and regulations may be more costly or take longer than we anticipate, or could otherwise affect our business operations. Information security breaches, cyber incidents, and disruptions, or failure to comply with laws and regulations related to information security or privacy, could result in legal claims or proceedings against us by governmental entities or individuals, significant fines, penalties or judgements, disruption of our operations, remediation requirements, changes to our business practices, and damage to our reputation, which could adversely affect our business, financial condition or results of operations.
International Operations Risks
We are exposed to the risks inherent in international sales and operations.
In 2024, sales to customers outside of the U.S. made up approximately 42 percent of our total sales, and we sell our products to customers in approximately 70 countries. We have exposure to risks of operating outside the U.S., including: fluctuations in foreign currency exchange rates, including the euro, pound sterling, Japanese yen, Brazilian Real, and Chinese renminbi; restrictions on, or difficulties and costs associated with, the repatriation of cash from foreign countries to the U.S.; difficulties and costs associated with complying with a wide variety of complex laws, treaties and regulations, which may carry significant penalties for non-compliance; unexpected changes in political or regulatory environments; earnings and cash flows that may be subject to tax withholding requirements or the imposition of tariffs, exchange controls or other restrictions; geopolitical and economic instability, including the wars in Ukraine and the Middle East; general country strikes or work stoppages; unforeseen public health crises, such as pandemic and epidemic diseases; import and export restrictions; difficulties in maintaining overseas subsidiaries and international operations; difficulties in obtaining approval for significant transactions; government limitations on foreign ownership; government takeover or nationalization of business; and government mandated price controls.
Tariffs and other trade barriers or retaliatory actions could also negatively impact our business. For example, the new U.S. administration has increased the tariff on Chinese products to 10 percent and has imposed, or is considering imposing, tariffs on products from other countries. Whether and to what extent these tariffs will be imposed is presently unknown, however such tariffs (and any retaliatory action taken as a result) could lead to increased costs, which could cause decreased customer demand for our products as well as our customers’ products that incorporate our products due to increased pricing, and adversely affect our financial condition and results of operations.
Any one or more of the above factors could adversely affect our international operations and could significantly affect our financial condition and results of operations. For example, Chinese government agencies have in the past required companies to reduce or suspend manufacturing operations from time to time, with little or no notice, for reasons such as energy restrictions and air quality concerns. The timing and length of these suspensions, which are expected to continue occurring, are difficult to predict. These unpredictable events could negatively impact our results of operations and cash flows. Further, any of these factors may impact our customers’ non-U.S. operations, which could reduce demand for our products. As our international operations and activities expand, we inevitably have greater exposure to the risks associated with operating in many foreign countries.
Legal and Regulatory Risks
From time to time, we may be engaged in legal actions associated with our intellectual property rights; if we are unsuccessful, these could potentially result in an adverse effect on our financial condition and results of operations.
Intellectual property rights, including patents, trade secrets, confidential information, trademarks, trade names, and trade dress, are important to our business. See “Intellectual Property” included within Part I. Item 1 of this Form 10-K for more information on the 844 Patent. We endeavor to protect our intellectual property rights in key jurisdictions in which our products are produced or used, in jurisdictions into which our products are imported, and in jurisdictions where our competitors have significant manufacturing capabilities. Our success will depend to a significant degree upon our ability to protect and preserve our intellectual property rights. However, we may be unable to obtain or maintain protection for our intellectual property in key jurisdictions and the Company’s patents and other intellectual property may not prevent competitors from independently developing or selling similar or duplicative products and services. Although we own and have applied for numerous patents and trademarks throughout the world, we may have to rely on judicial enforcement of our patents and other proprietary rights. Our patents and other intellectual property rights may be challenged, invalidated, circumvented, and rendered unenforceable or otherwise compromised. We are currently involved in several legal actions related to the intellectual property associated with
the 844 Patent. On September 15, 2021, a jury in the lawsuit filed by the Company against BASF Corporation for patent infringement in the U.S. District Court for the District of Delaware (the “Delaware Proceeding”) issued a verdict in favor of BASF on certain counterclaims filed by BASF in the Delaware Proceeding. The jury awarded BASF damages of approximately $28.3 million, which will be trebled under U.S. antitrust law to approximately $85.0 million when the court enters judgment. On May 18, 2023, the court in the Delaware Proceeding entered judgment on the jury’s verdict, which commenced the post-trial briefing stage. On February 13, 2024, the court in the Delaware Proceeding denied BASF’s motion for pre-judgment interest on its tortious interference claim as well as our motion seeking judgment as a matter of law, or a new trial in the alternative. In addition, BASF may seek post-judgment interest and attorneys’ fees and costs in amounts that they will have to prove at a future date. Earlier in the Delaware Proceeding, the U.S. District Court dismissed the Company’s patent infringement claims against BASF alleging BASF infringed the 844 Patent and invalidated some, but not all, of the claims in our 844 patent, which expired in March 2022.
The Company disagrees with the verdict, including the court’s application of the law and entry of judgment. Therefore, on March 13, 2024, we appealed the verdict as well as the U.S. District Court’s November 2020 dismissal of our patent infringement claims against BASF. As of December 31, 2024, the final resolution of these matters could take up to 15 months and there can be no assurance that the Company will prevail in its attempts to challenge the verdict. Because the outcome of the Company’s post-trial motions and possible appeal is difficult to predict, as of December 31, 2024, the Company has accrued a total of $85.0 million, the full amount of the jury’s verdict (including treble damages). The amount accrued for this matter is included within Other liabilities on the consolidated balance sheet as of December 31, 2024, and the charge is included within Other (income) expense, net on the consolidated statement of operations for the twelve months ended December 31, 2021. In addition, as a result of the judgment being officially entered on May 18, 2023, we have started accruing for post-judgment interest at the legally mandated interest rate. As of December 31, 2024 and 2023, the total amount accrued, inclusive of post-judgement interest, was $91.4 million and $87.4 million, respectively. The amount of any liability the Company may ultimately incur related to the Delaware Proceeding could be more or less than the amount accrued. The Company has and may continue to incur additional fees, costs and expenses for as long as the post-trial motions and possible appeal are ongoing. If the Company is required to pay the entire jury verdict (together with any associated fees, costs, and expenses), or the Company must make certain changes to its business when the matters associated with the Delaware Proceeding are eventually resolved, such outcomes could have an adverse effect on the Company’s business, financial condition, and operating results.
The Delaware Proceeding and other legal actions to protect, defend or enforce our intellectual property rights could result in significant costs and diversion of our resources and our management’s attention, and we may not prevail in any such suits or proceedings, which could have an adverse effect on our financial condition and results of operations. Similarly, third parties may assert claims against us and our customers and distributors alleging our products infringe upon third-party intellectual property rights. If the Company is found to infringe any third-party rights, it could be required to pay substantial damages, or it could be enjoined from offering some of its products and services.
We also rely heavily upon unpatented proprietary technology, know-how, and other trade secrets to maintain our competitive position. While we maintain policies to enter into confidentiality agreements with our employees and third parties to protect our proprietary expertise and other trade secrets, these agreements may not be enforceable or, even if legally enforceable, we may not have adequate remedies for breaches of such agreements. We also may not be able to readily detect breaches of such agreements. For instance, we manufacture some of our products in China where we may be at a greater risk of a third party misappropriating our intellectual property despite the foregoing policies, procedures and agreements. The failure of our patents or confidentiality agreements to protect our proprietary technology, know-how or trade secrets could result in significantly lower revenues, reduced profit margins, or loss of market share.
Environmental and Sustainability Risks
Certain elements of our strategic growth are dependent on the adoption of more stringent air quality standards around the world.
Environmental standards drive the implementation of gasoline vapor emission control systems by automotive manufacturers. Given increasing societal concern over global warming and health hazards associated with poor air quality, there is growing pressure on regulators across the globe to take meaningful action. For those countries that have not significantly regulated gasoline vapor emissions, enacting more stringent regulations governing gasoline vapor emissions represents a significant upside to our Performance Materials’ automotive carbon business. However, regulators may react to a variety of considerations, including economic and political, that may result in any such more stringent regulations being delayed or
shelved entirely, in one or more countries or regions. As the adoption of more stringent regulations governing gasoline vapor emissions is expected to drive significant growth in our automotive carbon applications, the failure to enact such regulations would have a negative impact on the growth prospects for these products.
Our business involves hazards associated with chemical manufacturing, storage, transportation and disposal; the legal and regulatory environment related to such chemicals could require expenditures or changes to our product formulations and operations.
There are hazards associated with the chemicals we manufacture and the related storage and transportation of our raw materials, including common solvents, such as toluene and methanol, and reactive chemicals, such as acrylic acid, all of which fall under the OSHA Process Safety Management Code. These hazards could lead to an interruption or suspension of operations and have an adverse effect on the productivity and profitability of a particular manufacturing facility or on us as a whole. While we endeavor to provide adequate protection for the safe handling of these materials, issues could be created by various events, including natural disasters, severe weather events, acts of sabotage and performance by third parties, and as a result we could face potential hazards, including the following: piping and storage tank leaks and ruptures; mechanical failure; employee exposure to hazardous substances; and chemical spills and other discharges or releases of toxic or hazardous substances or gases. These hazards may cause personal injury and loss of life, damage to property, and contamination of the environment, which could lead to government fines, work stoppage injunctions, lawsuits by injured persons, damage to our public reputation and brand, and diminished product acceptance. While we have insurance coverage intended to assist with any financial impacts the financial resources of the Company could be impacted. If such actions are determined adversely to us, or there is an associated economic impact on our business, we may have inadequate insurance or cash flow to offset any associated costs.
Our operations are subject to a wide range of general and industry-specific environmental laws and regulations; changes to this legal and regulatory landscape could limit our business activities and increase our operating costs.
Our operations are subject to a wide range of general and industry-specific environmental laws and regulations. Certain regulations applicable to our operations, including the OSHA and the TSCA in the U.S. and the REACH directive in Europe, the United Kingdom and other countries, prescribe limits restricting exposure to several chemicals used in our operations, including certain forms of formaldehyde, a raw material used in the manufacture of some lignin-based dispersants. Future studies on the health effects of chemicals used in our operations may result in additional regulation or new requirements, which might further restrict or prohibit the use of, and exposure to, these chemicals. Additional regulation of or requirements for such chemicals could require us to change our operations, and these changes could affect the quality or types of products we manufacture and/or materially increase our costs.
Increased focus by governmental entities on environmental issues and sustainability have resulted in a complex landscape of new or increased regulations. Changes in environmental laws and regulations, or their application, could subject Ingevity to significant additional capital expenditures and operating expenses. Additionally, changes in the regulation of greenhouse gases, as well as future climate change laws and regulations, depending on their nature and scope, could subject our operations to significant additional costs or limits on operations. Our manufacturing facilities use energy, including electricity and natural gas and some of our plants emit amounts of greenhouse gasses that may in the future be affected by legislative and regulatory efforts to limit greenhouse gas emissions. Potential consequences could include increased energy, transportation, and raw material costs and may require us to make additional investments in facilities and equipment or limit our ability to grow. Any such changes are uncertain and, therefore, it is not possible for Ingevity to predict with certainty the amount of additional capital expenditures or operating expenses that could be necessary for compliance with respect to any such changes.
Independent of any such regulation, increased public awareness and adverse publicity about potential impacts on climate change or environmental harm from us or our industry could harm our reputation or otherwise impact Ingevity adversely. In recent years, some investors have also begun to show increased interest about sustainability and climate change as it relates to their investment decisions. We have set targets for greenhouse gas emissions and related sustainability goals. There can be no assurance that we will meet these targets and goals. If we fail to achieve our sustainability goals or reduce our impact on the environment or if we are unable to respond or are perceived to be inadequately responding to sustainability concerns, we may receive adverse publicity, and certain investors may divert from, or avoid investing in, our securities, which could have a negative impact on our business and reputation.
Adverse weather conditions and other environmental impacts (such as climate change and extreme weather) may impact our operations and the demand for some of our products, which could negatively affect our financial condition and results of operations.
Our road technologies product line is seasonal in nature, with roughly 70 to 75 percent of revenue generated between April and September each year. Adverse weather conditions, which directly affect the ability to engage in paving and/or road marking activity, have had, and going forward may have, an adverse effect on sales in the road technologies product line if such conditions result in lower customer demand due to a shortened season.
Increasing weather-related impacts on our operations and plant sites may impact the cost or availability of insurance. Furthermore, the potential impact of climate change and related regulations on our suppliers and customers is highly uncertain and there can be no assurance that it will not have an adverse effect on the availability over time of our suppliers’ and customers’ businesses, and on our financial condition and results of operations.
Financial and Economic Risks
We may be adversely affected by general global economic and financial conditions beyond our control.
Our businesses may be affected by a number of factors that are beyond our control such as general economic and business conditions, changes in tax laws, or tax rates and conditions in the financial services markets including counterparty risk, insurance carrier risk, rising interest rates, inflation, deflation, fluctuations in currencies, which factors may negatively impact our ability to compete. Macroeconomic challenges, including conditions in financial and capital markets and levels of unemployment, and the ability of the U.S. and other countries to deal with their rising debt levels, may continue to put pressure on the economy or lead to changes in tax laws or tax rates. There can be no assurance that changes in tax laws or tax rates will not have a material impact on our future cash taxes, effective tax rate, or deferred tax assets and liabilities. Adverse developments in global or regional economies could drive an increase or decrease in the demand for our products that could increase or decrease our revenues, increase or decrease our manufacturing costs, and ultimately increase or decrease our results of operations, financial condition and cash flows. As a result of negative changes in the economy, customers, vendors, or counterparties may experience significant cash flow problems or cause consumers of our products to postpone or refrain from spending in response to adverse economic events or conditions. If customers are not successful in generating sufficient revenue or cash flows or are precluded from securing financing, they may not be able to pay or may delay payment of accounts receivable that are owed to us or we may experience lower sales volumes. Our financial condition and results of operations could be materially and adversely affected by any of the foregoing.
Inflation could result in an adverse impact on our results of operations.
We are affected by general global economic and financial conditions that are beyond our control, including inflation and significant spikes in energy costs. We attempt to reduce our inflation risk and mitigate the effects of other adverse economic and financial conditions by passing on price increases where appropriate to our customers. A significant portion of our business with our customers is purchase order based, which allows us to increase prices in response to inflation and other market conditions. However, to the extent our customers are under fixed-price contracts with limited or no price adjustment mechanisms, we are unable to mitigate the impact of inflation by passing on price increases through to our customers, and we could experience an adverse impact on our results of operations as a result.
Challenges in the commercial and credit environment may materially adversely affect Ingevity’s future access to capital.
We have, at times, relied on various forms of credit to satisfy working capital needs. Our ability to issue debt or enter into other financing arrangements on acceptable terms could be materially adversely affected if there is a material decline in the demand for our products or in the solvency of our customers or suppliers or if other significantly unfavorable changes in economic conditions occur. Volatility in the world financial markets could increase borrowing costs or affect our ability to gain access to the capital markets, which could have a material adverse effect on our competitive position, business, financial condition, results of operations, and cash flows.
ITEM 1B. UNRESOLVED STAFF COMMENTS
None.
ITEM 1C. CYBERSECURITY
At Ingevity, we recognize the paramount importance of cybersecurity in safeguarding sensitive information. We align with industry standards, including the ISO 27001 information security framework, for which we became certified in 2024. Our comprehensive cybersecurity program is led by a team of diverse, highly skilled professionals, and we invest in modern technologies, including artificial intelligence and machine learning, to fortify our defenses. We actively collaborate with local, state and federal agencies, as well as peers in the chemical manufacturing industry to identify the latest threats and implement effective defenses that safeguard our employees and customers.
Key Components of Our Cybersecurity Program:
Leadership and Governance. We have a team of skilled internal and external cybersecurity professionals, led by our Vice President of Information Technology, Chief Information Officer and Chief Information Security Officer ("CIO"), who has over three decades of experience in information security and information technology infrastructure. Our team has experience in information security and information technology infrastructure and holds several advanced and expert licenses and certifications, including International Society of Automation 62443, Cybersecurity Expert and International Information System Security Certification Consortium (ISC2), Certified Information Security Manager (CISM), and Certified Information Systems Security Professional (CISSP). Beginning in 2025, the Sustainability & Safety Committee of our Board of Directors (“the Board”) has oversight of our cybersecurity and risk management programs. Prior to that, the full Board exercised oversight of cybersecurity risk management. The Board moved oversight of cybersecurity risk management into the Sustainability & Safety Committee to allow for more in-depth reviews. The Sustainability & Safety Committee receives at least quarterly updates from the CIO on cybersecurity matters and our related risk management program, and periodic updates from external cybersecurity experts on the overall risk landscape. Our full Board of Directors also receives an update at least once a year on these matters in addition to regular reporting from the Sustainability & Safety Committee on matters reviewed. We have implemented processes for continual monitoring of our information systems, including the deployment of advanced security measures and system audits to identify potential vulnerabilities. If a cybersecurity incident were to occur, we have developed and documented an incident response plan that includes immediate actions to mitigate the impact and long-term strategies for remediation and prevention of future incidents. Additionally, our CIO regularly meets with our executive management leadership team to provide updates on our cybersecurity risks and incidents ensuring management is keenly aware of any potential threat.
Protection of Sensitive Information. We enforce collection, storage, and access controls of personal, proprietary, and confidential information, focusing on protecting trade secrets, intellectual property, clinical trial data, third-party information, and employee data.
Industry-Standard Frameworks and Policies. We incorporate industry-standard frameworks, policies, and practices such as ISO 27001 which are designed to protect the confidentiality and privacy of information.
Protection Mechanisms. We currently adhere to the ISO 27001 information security framework and are advancing our program having achieved ISO 27001 certification in 2024. We continuously monitor our enterprise network and have deployed detective and preventative controls. In-depth third-party security assessments are conducted annually.
Incident Response and Testing. We maintain a robust cybersecurity incident response plan that incorporates regular simulations, drills, vulnerability scans, penetration testing and third-party assessments to evaluate and enhance our cybersecurity controls and resilience.
Third-Party Monitoring. We partner with a managed security services provider for 24/7 monitoring of our enterprise network. We require third-party service providers with access to personal, confidential or proprietary information to implement and maintain comprehensive cybersecurity measures aligned with applicable legal standards and industry best practices.
Our proactive approach to cybersecurity involves the integration of leading technologies and collaboration with third-party experts to ensure alignment with industry standards. We believe these measures contribute to the protection of both our organization's and our clients' sensitive information.
During the past three years, there have been no material impacts from cybersecurity threats or cybersecurity incidents that have materially affected or are reasonably likely to materially affect the Company’s business strategy, results of operations,
or financial condition. Despite our security architecture and controls, and those of our third-party providers, we may be vulnerable to cyber-attacks, computer viruses, security breaches, ransomware attacks, inadvertent or intentional employee actions, system failures, and other risks that could materially impact our financial results and our results of operations.
ITEM 2. PROPERTIES
We are headquartered in North Charleston, South Carolina and operate manufacturing facilities in the U.S., United Kingdom, and the People's Republic of China and have business offices and warehouse and distribution facilities globally. The following locations represent the principal properties of Ingevity. We believe these facilities are adequate and suitable for our current operations, and that the production capacity of our facilities is sufficient to meet current demand. In the case of the properties identified as “Leased,” we nevertheless own the manufacturing facilities and equipment.
| | | | | | | | | | | | | | |
| Location | | Own / Lease | | Functional Use |
| North Charleston, South Carolina | | Own / Lease (1) | | Corporate Headquarters; Application Labs; Performance Chemicals: Manufacturing |
| Covington, Virginia | | Lease | | Performance Materials: Manufacturing |
| Crossett, Arkansas | | Lease (2) | | Performance Chemicals: Manufacturing |
| DeRidder, Louisiana | | Own (2) | | Performance Chemicals: Manufacturing |
| Waynesboro, Georgia | | Own (3) | | Performance Materials: Manufacturing |
| Shanghai, People's Republic of China | | Lease | | Regional Headquarters; Application Lab |
| Wickliffe, Kentucky | | Own (4) | | Performance Materials: Manufacturing |
| Changshu, People’s Republic of China | | Lease | | Performance Materials: Manufacturing |
| Warrington, United Kingdom | | Lease | | Advanced Polymer Technologies: Manufacturing, Application Lab |
| Zhuhai, People’s Republic of China | | Lease | | Performance Materials: Manufacturing, Application Lab |
| Greenville, Alabama | | Lease | | Performance Chemicals: Manufacturing |
| Dayton, Nevada | | Own | | Performance Chemicals: Manufacturing |
| Childress, Texas | | Own (5) | | Performance Chemicals: Manufacturing |
| Marion, Indiana | | Own | | Performance Chemicals: Manufacturing |
________________________
(1) Portions of the manufacturing operations are on leased land and our corporate headquarters building is leased.
(2) All production at our DeRidder and Crossett Plants ceased during 2024. We continue to lease the Crossett, Arkansas site and own the DeRidder, Louisiana site.
(3) Certain manufacturing assets are subject to a finance lease with the Development Authority of Burke County (the county in which Waynesboro, Georgia is located).
(4) Certain manufacturing assets are subject to a finance lease.
(5) Portions of the manufacturing operations are on leased land.
ITEM 3. LEGAL PROCEEDINGS
Information regarding certain of these matters is set forth in Note 18 – Commitments and Contingencies to the Consolidated Financial Statements included within Part II. Item 8 of this Form 10-K.
ITEM 4. MINE SAFETY DISCLOSURES
Not applicable.
INFORMATION ABOUT OUR EXECUTIVE OFFICERS
The executive officers of Ingevity Corporation, the offices they currently hold, their business experience over the past five years and their ages are as follows:
| | | | | | | | | | | | | | |
| Name | | Age (1) | | Present Position and Business Experience |
| Luis Fernandez-Moreno | | 62 | | Interim President and Chief Executive Officer (2024-present); Senior Vice President of Ashland Inc. (2012-2017); President, Ashland Inc. Chemicals Group (2015-2017); President, Ashland Inc. Specialty Ingredients (2013-2015); and President, Ashland Water Technologies (2012-2013). Prior to that role, he held various senior-level positions of increasing responsibility with Rohm & Haas Company for 27 years. |
| Mary Dean Hall | | 67 | | Executive Vice President and Chief Financial Officer (2021-present); Senior Vice President, Chief Financial Officer and Treasurer at Quaker Houghton (2015-2021); Vice President and Treasurer at Eastman Chemical Company (2009-2015); Prior to that role, she held various senior-level financial positions of increasing responsibility with Eastman from 1995 through 2009, including Treasurer, Vice President and Controller, and Vice President, Finance. |
| S. Edward Woodcock | | 59 | | Executive Vice President & President of Performance Materials (2015-present); Vice President of MeadWestvaco's Carbon Technologies business (2010-2015) |
| Rich White | | 62 | | Senior Vice President & President of Performance Chemicals (2022-present); Vice President, Industrial Specialties (2019-2022); Vice President, Global Sales at DuPont Nutrition & Biosciences (2017-2019); Prior to that role, he held various senior-level positions of increasing responsibility with FMC from 1998 through 2017. |
| Steve Hulme | | 56 | | Senior Vice President & President of Advanced Polymer Technologies (2022-present); Vice President, Engineered Polymers (2020-2022); General Manager at Maysta International Ltd (2018-2020); Prior to that role, he held various senior-level positions of increasing responsibility with Evonik and Air Products and Chemicals from 2010 through 2018. |
| Ryan Fisher | | 49 | | Senior Vice President, General Counsel & Secretary (2024-present); Vice President, Deputy General Counsel, Chief Compliance Officer and Assistance Secretary (2021-2024); Deputy General Counsel, Chief Legal Officer - Performance Chemicals and Assistant Secretary (2016-2020); Senior Counsel, WestRock Company (2015-2015); Associate General Counsel, WestRock Company (2014-2015); Assistant General Counsel, WestRock Company (2006-2013). |
| Terry Dyer | | 58 | | Senior Vice President & Chief Human Resources Officer (2024-present); Senior Vice President Human Resources and Communications, Billerud (2020-2024); Chief Human Resource Officer, Worthington Industries (2012-2016); Prior to that role, he held various senior-level positions of increasing responsibility with Armstrong World Industries and Burlington Industries from 1998 through 2012. |
_______________
(1) As of December 31, 2024.
All officers are elected to hold office for one year or until their successors are elected and qualified. No family relationships exist among any of our executive officers or directors, and there are no arrangements or understandings between any of the above-listed officers and any other person pursuant to which they serve as an officer.
PART II
ITEM 5. MARKET FOR REGISTRANT'S COMMON EQUITY, RELATED STOCKHOLDERS MATTER AND ISSUER PURCHASES OF EQUITY SECURITIES
Market for Registrant's Common Equity and Related Stockholder Matters
Ingevity's common stock ($0.01 par value) is listed on the New York Stock Exchange, Inc. ("NYSE") under the symbol "NGVT." There were approximately 4,200 record holders of our common stock as of February 14, 2025.
Unregistered Sales of Equity Securities
Not Applicable.
Issuer Purchases of Equity Securities
The following table summarizes information with respect to the repurchase of our common stock during the three months ended December 31, 2024.
| | | | | | | | | | | | | | | | | | | | | | | | | |
| | | | | |
| Period | Total Number of Shares Purchased | | Average Price Paid Per Share | | Total Number of Shares Purchased as Part of Publicly Announced Plans or Programs | | | | Approximate Dollar Value of Shares that May Yet be Purchased Under the Plans or Programs (1) |
| October 1-31, 2024 | — | | | $ | — | | | — | | | | | $ | 353,384,633 | |
| November 1-30, 2024 | — | | | $ | — | | | — | | | | | $ | 353,384,633 | |
| December 1-31, 2024 | — | | | $ | — | | | — | | | | | $ | 353,384,633 | |
| Total | — | | | | | — | | | | | |
_______________
(1) On July 25, 2022, our Board of Directors authorized the repurchase of up to $500.0 million of our common stock (the "2022 Authorization"), and rescinded the prior outstanding repurchase authorization with respect to the shares that remained unused under the prior authorization. Shares under the 2022 Authorization may be purchased through open market or privately negotiated transactions at the discretion of management based on its evaluation of market prevailing conditions and other factors, including through the use of trading plans intended to qualify under Rule 10b5-1 under the Securities Exchange Act.
Stock Performance Graph
The following table and graph present the cumulative total stockholder return for Ingevity's common stock compared with the Standard & Poor's (S&P) SmallCap 600 Index, S&P MidCap 400 Index, the S&P Chemicals 600 Index, and the Dow Jones (DJ) U.S. Specialty Chemicals Index for the five-year period ended December 31, 2024.
The graph assumes the investment of $100 in each of Ingevity's common stock, the S&P SmallCap 600 Index, S&P MidCap 400 Index, the S&P Chemicals 600 Index, and the DJ U.S. Specialty Chemicals Index, respectively, as of market close on December 31, 2019, and that all dividends, if any, were reinvested. Previously, Ingevity was included in the S&P MidCap 400 Index and was moved to the S&P SmallCap 600 Index on June 16, 2023. We updated our comparative broad market index accordingly for the fiscal year ended December 31, 2024. In light of our market capitalization, the S&P SmallCap 600 Index is a more comparable broad market index with which to compare Ingevity's common stock.
| | | | | | | | | | | | | | | | | | | | | | | | | | | | | | | | | | | |
| December 31, |
| 2019 | | 2020 | | 2021 | | 2022 | | 2023 | | 2024 |
| Ingevity Corporation | $ | 100.00 | | | $ | 86.67 | | | $ | 82.06 | | | $ | 80.61 | | | $ | 54.04 | | | $ | 46.64 | |
| S&P Small Cap 600 Index | $ | 100.00 | | | $ | 111.24 | | | $ | 140.98 | | | $ | 118.22 | | | $ | 137.07 | | | $ | 148.91 | |
| S&P MidCap 400 Index | $ | 100.00 | | | $ | 113.65 | | | $ | 141.76 | | | $ | 123.19 | | | $ | 143.38 | | | $ | 163.30 | |
| S&P Chemicals 600 Index | $ | 100.00 | | | $ | 118.60 | | | $ | 148.68 | | | $ | 127.25 | | | $ | 135.24 | | | $ | 128.11 | |
| Dow Jones U.S. Specialty Chemicals Index | $ | 100.00 | | | $ | 115.21 | | | $ | 142.61 | | | $ | 123.18 | | | $ | 124.91 | | | $ | 118.83 | |
The graph and related information set forth above are not deemed to be "filed" with the SEC for purposes of Section 18 of the Exchange Act or incorporated by reference into any future filing made by us with the SEC, except to the extent that we specifically incorporate it by reference into any such filing. The stock price performance included in the graph above is not necessarily indicative of future stock performance.
ITEM 6. [RESERVED]
ITEM 7. MANAGEMENT’S DISCUSSION AND ANALYSIS OF FINANCIAL CONDITION AND RESULTS OF OPERATIONS
Introduction
Management’s discussion and analysis of Ingevity’s financial condition and results of operations (“MD&A”) should be read in conjunction with Item 8. Financial Statements and Supplementary Data. Investors are cautioned that the forward-looking statements contained in this section and other parts of this Annual Report on Form 10-K involve both risk and
uncertainty. Several important factors could cause actual results to differ materially from those anticipated by these statements. Many of these statements are macroeconomic in nature and are, therefore, beyond the control of management. See "Cautionary Statements about Forward-Looking Statements" at the beginning of this Annual Report on Form 10-K for further discussion.
All references to notes (herein referred to as "Note") in this section refer to the notes accompanying the Consolidated Financial Statements included in Part II. Item 8 within this Form 10-K.
Overview
Ingevity Corporation ("Ingevity," "the Company," "we," "us," or "our") provides products and technologies that purify, protect, and enhance the world around us. Through a diverse team of talented and experienced people, we develop, manufacture, and bring to market solutions that are largely renewably sourced and help customers solve complex problems while making the world more sustainable. Our products are used in a variety of demanding applications, including adhesives, agrochemicals, asphalt paving, bioplastics, coatings, elastomers, lubricants, paint for road markings, oil drilling, and automotive components. We operate in three reportable segments: Performance Materials, Performance Chemicals, and Advanced Polymer Technologies.
Recent Developments
Interest Rate Risk Management
During the third quarter of 2024, we entered into a floating-to-fixed interest rate swap with a notional amount of $200.0 million to manage the variability of cash flows in the interest rate payments associated with our existing Secured Overnight Financing Rate ("SOFR") based interest payments, effectively converting $200.0 million of our floating rate debt to a fixed rate. In accordance with the terms of this instrument, we receive floating rate interest payments based upon one-month U.S. dollar SOFR and in return are obligated to pay interest at a fixed rate of 3.84 percent until August 2026. The fair value of outstanding interest rate instruments at December 31, 2024 and 2023 was an asset of $0.6 million and zero, respectively.
Measurement Alternative Investments
For the year ended December 31, 2024, the Company identified triggering events indicating that investments being accounted for under the measurement alternative may be impaired and recognized impairment charges of $11.5 million, recorded in Other (income) expense, net on the consolidated statement of operations.
Impairment Assessment(s) and Goodwill Impairment Charge
Impairment Assessment
Our fiscal year 2024 annual goodwill impairment assessment was performed as of October 1, 2024. We determined that the fair value of our reporting units were in excess of their carrying value and therefore concluded that no goodwill impairment existed.
The results of our October 1st annual review calculated that our APT reporting unit headroom, defined as the percentage difference between the fair value of a reporting unit and its carrying value, is 12 percent. Since the fair value of our APT reporting unit is higher than the carrying value, we have concluded that no impairment to goodwill is necessary. Our analysis includes significant assumptions such as revenue growth rate, Earnings before Interest, Taxes, Depreciation and Amortization ("EBITDA") margin, and discount rate, which are judgmental, and variations in any assumptions could result in materially different calculations of fair value.
There were no events or circumstances indicating that goodwill might be impaired as of December 31, 2024.
Goodwill Impairment Charge
Beginning in fiscal year 2023, we began to see depressed volumes in our industrial end markets, constraining our ability to offset the continued crude tall oil (“CTO”) price inflation we were experiencing, and negatively impacting earnings and cash flow within our Performance Chemicals reporting unit, particularly in our industrial specialties product line. As a result, we concluded that a triggering event occurred in the third quarter of 2023. Our third quarter 2023 impairment analysis included significant assumptions, such as the execution of several measures in 2023 to pursue greater cost efficiency, including a reorganization to streamline certain functions and reduce ongoing costs, and expectations of decreased CTO costs beginning in the second half of 2024. We concluded that no impairment was necessary as a result of that third quarter 2023 interim analysis or at our annual impairment assessment, dated October 1, 2023.
During the second quarter of 2024, our contracted long-term supplier of CTO provided new information regarding the cost of CTO for the second half of 2024, which significantly exceeded our forecasted costs, resulting in a triggering event for our Performance Chemicals reporting unit. We performed an analysis of the reporting unit’s goodwill, intangibles, and long-lived assets. Our analysis included significant assumptions such as: revenue growth rate, EBITDA margin, and discount rate, which are judgmental, and variations in any assumptions could result in materially different calculations of fair value.
Our analysis reassessed the expected cash flows in light of current performance and expected lack of near term recovery in our industrial specialties product line, resulting in lower volume and profitability expectations. As a result, we concluded that the carrying amount of the Performance Chemicals reporting unit exceeded its fair value, resulting in a non-cash goodwill impairment charge of $349.1 million, which represented all of the goodwill within the Performance Chemicals' reportable segment. The charge was is included within Goodwill impairment charge on the consolidated statements of operations for the year ended December 31, 2024. Specific to our long-lived assets, we determined that the undiscounted cash flows were in excess of the carrying values and therefore concluded that no impairment existed.
Performance Chemicals' Repositioning
On November 1, 2023, we announced a number of strategic actions designed to reposition our Performance Chemicals reportable segment to improve profitability and reduce the cyclicality of the Company as a whole. These actions increased our focus on growing our most profitable Performance Chemicals product lines, such as road technologies, and diversifying our raw material stream to non-CTO based fatty acids. The repositioning focused on reducing exposure to lower margin end-use markets of our industrial specialties product line, such as adhesives, publication inks, and oilfield, representing approximately 45 percent of our industrial specialties product line's historical annualized net sales. The repositioning included the permanent closure of our Performance Chemicals CTO refinery and our manufacturing plant located in DeRidder, Louisiana (the “DeRidder Plant”), including the polyol production assets associated with the APT reportable segment. All production at the DeRidder Plant ceased in the first quarter of 2024. The Performance Chemicals’ repositioning initiative included additional corporate and business cost reduction actions executed in November 2023.
Additionally, in July 2024, we announced plans to transition the refining of oleo-based products manufactured for our Performance Chemicals reportable segment from our Crossett, Arkansas manufacturing plant (the “Crossett Facility”) to our North Charleston, South Carolina manufacturing plant. This action included the closure of the Crossett Facility, as well as additional corporate and business cost reduction actions. We ceased production at the Crossett Facility in the third quarter of 2024.
The actions referenced above, when combined with other targeted workforce reduction initiatives, during 2024 and 2023 resulted in the reduction of Ingevity's global workforce by 23 percent. Specific to Performance Chemicals, the reduction represented approximately 40 percent of the reportable segment's workforce.
Expected Charges
We expect to incur total charges of approximately $350.0 million, excluding CTO resale activity as described below, associated with the Performance Chemicals repositioning, consisting of approximately $250.0 million in asset-related charges, approximately $25.0 million in severance and other employee-related costs, and approximately $75.0 million in other restructuring costs including decommissioning, dismantling and removal charges, and contract termination costs. We expect approximately $250.0 million of the total charges to be non-cash and $100.0 million to be settled in cash. Through December 31, 2024, we have incurred $311.8 million associated with these actions, including $244.8 million of non-cash asset-
related charges, excluding $7.4 million related to an asset retirement obligation ("ARO"), and $67.0 million of charges to be settled in cash, which includes the aforementioned ARO. As of December 31, 2024, $54.5 million of the charges to be settled in cash have been paid and all non-cash charges have been incurred. In total, we expect approximately $100 million of cash charges, including approximately $20-$25 million during 2025.
Inventory Charges
The Company believes the collective actions of workforce, operational, and regional business exits will hinder our ability to dispose of the associated inventory on hand. As a result, in the years ended December 31, 2024 and 2023, we recorded $6.3 million and $19.7 million, respectively, of non-cash, lower of cost or market, inventory charges to adjust the carrying value of the impacted inventory to what we will realize upon disposal, less disposal costs. These inventory charges are recorded to Cost of sales on the consolidated statement of operations. Since these inventory charges are directly attributable to the Performance Chemicals’ repositioning, that is, they do not represent normal, recurring expenses necessary to operate our business, we have excluded such impact from the financial results of our Performance Chemicals reportable segment. Refer to Note 19 for more information.
CTO Resale Activity
The DeRidder Plant closure, and the corresponding reduced CTO refining capacity, significantly reduced our CTO volume requirements. However, we were obligated under an existing CTO supply contract to purchase CTO volumes through 2025 at amounts in excess of the CTO volumes needed to support our business operations. To manage this excess inventory, we sold CTO volumes (herein referred to as "CTO resales") in the open market. During the years ended December 31, 2024 and 2023, we incurred $52.7 million and $22.0 million of CTO resale losses, which are recorded as Other (income) expense, net on the consolidated statements of operations. Refer to Note 2, under the section: Non-operating income and expense, for more information.
As of July 1, 2024, we terminated the CTO supply contract that resulted in these excess CTO volumes. As consideration for the early termination of the CTO supply contract, we made cash payments totaling $100.0 million. The total charge was recorded within Other (income) expense, net on the consolidated statements of operations for the year ended December 31, 2024. As a result of the termination, the purchases under the CTO supply contract ended effective June 30, 2024. The CTO resale activity described above ended in 2024 and no excess CTO volumes were on hand at December 31, 2024.
Expected Savings and Impact
The Performance Chemicals' repositioning, which began in November 2023, was focused on reducing exposure to lower margin end-use markets of our industrial specialties product line, such as adhesives, publication inks, and oilfield. Sales into these end-use markets represented approximately 45 percent of our industrial specialties product line historical annualized net sales. As a result of this initiative, we expect to realize savings of approximately $95 million to $110 million. These cash savings are derived from headcount reductions, plant operating efficiencies, and reduced supply chain costs. During the year ended December 31, 2024, we realized cash savings of approximately $84.0 million, including $68.0 million in Cost of sales, $12.0 million in Selling, general, and administrative expenses, and $4.0 million in Research and technical expenses, respectively. Collectively, these savings are realized in the following financial statement captions: 70-80 percent in Cost of sales, 15-25 percent in Selling, general, and administrative expenses, and ~5 percent in Research and technical expenses, all presented on our consolidated statements of operations. We expect to realize the remaining savings in 2025.
In addition to the cash savings, we expect to realize approximately $15 million to $17 million in depreciation and intangible amortization expenses, respectively. During the year ended December 31, 2024, we realized savings of approximately $10 million. We expect to realize the remaining savings in 2025.
The charges we currently expect to incur and the savings we expect to obtain in connection with these actions are subject to a number of assumptions and risks, and actual results may differ materially. We may also incur other material charges not currently contemplated due to events that may occur as a result of, or in connection with, these actions.
Results of Operations | | | | | | | | | | | | | | | | | |
| Years Ended December 31, |
| In millions | 2024 | | 2023 | | 2022 |
| Net sales | $ | 1,406.4 | | | $ | 1,692.1 | | | $ | 1,668.3 | |
| Cost of sales | 951.7 | | | 1,220.2 | | | 1,098.2 | |
| Gross profit | 454.7 | | | 471.9 | | | 570.1 | |
| Selling, general, and administrative expenses | 166.7 | | | 183.7 | | | 198.8 | |
| Research and technical expenses | 28.1 | | | 31.8 | | | 30.3 | |
| | | | | |
| Restructuring and other (income) charges, net | 186.2 | | | 170.2 | | | 13.8 | |
| Goodwill impairment charge | 349.1 | | | — | | | — | |
| Acquisition-related costs | 0.3 | | | 3.6 | | | 5.0 | |
| Other (income) expense, net | 169.8 | | | 5.7 | | | (1.7) | |
| Interest expense | 97.8 | | | 93.3 | | | 61.8 | |
| Interest income | (7.7) | | | (6.3) | | | (7.5) | |
| Income (loss) before income taxes | (535.6) | | | (10.1) | | | 269.6 | |
| Provision (benefit) for income taxes | (105.3) | | | (4.7) | | | 58.0 | |
| Net income (loss) | $ | (430.3) | | | $ | (5.4) | | | $ | 211.6 | |
| | | | | |
| | | | | |
Net sales
The table below shows 2024 and 2023 Net sales and variances from 2023 and 2022, respectively.
| | | | | | | | | | | | | | | | | | | | | | | | | | | | | |
| | | Change vs. prior year | | |
| In millions | Prior year Net sales | | Volume | | Price/Mix | | Currency effect | | Current year Net sales |
| Year Ended December 31, 2024 vs. 2023 | $ | 1,692.1 | | | (274.9) | | | (1.0) | | | (9.8) | | | $ | 1,406.4 | |
| Year Ended December 31, 2023 vs. 2022 | $ | 1,668.3 | | | (106.3) | | | 142.3 | | | (12.2) | | | $ | 1,692.1 | |
2024 Performance Summary
The Net sales decrease was driven primarily by the Performance Chemicals industrial specialties product line due to repositioning actions that have resulted in the reduction of sales to lower margin end-use markets, therefore reducing Net sales during the year by approximately $210 million. Also contributing to the lower sales was unfavorable weather in key North American regions impacting the Performance Chemicals road technologies product line contributing to the decline in Net sales of $27.5 million, continued weakness in certain industrial end markets that negatively impacted sales in the Performance Chemicals industrial specialties product line that contributed to the reduction in Net sales of $56.4 million, and lower sales in our Advanced Polymer Technologies reportable segment of $15.4 million, partially offset by an increase in our Performance Materials reportable segment of $23.6 million.
Year Ended December 31, 2024 vs. 2023
The Net sales decrease in 2024 was driven by volume decline of $274.9 million (16 percent), unfavorable foreign exchange impacts of $9.8 million (one percent), and unfavorable pricing and sales mix of $1.0 million (zero percent).
Year Ended December 31, 2023 vs. 2022
The Net sales increase in 2023 was driven by favorable pricing and sales mix of $142.3 million (nine percent), primarily attributed to an increase in Performance Chemicals of $93.1 million, partially offset by volume decline of $106.3 million (six percent), and unfavorable foreign exchange impacts of $12.2 million (one percent).
Gross profit
Year Ended December 31, 2024 vs. 2023
Gross profit decrease of $17.2 million was driven by unfavorable sales volume of $35.8 million, unfavorable pricing and sales mix of $6.4 million, and unfavorable foreign exchange impacts of $2.9 million, partially offset by decreased manufacturing costs of $27.9 million. Gross profit includes the realized savings of $68.0 million from the Performance Chemicals repositioning action initiated in 2023. Refer to the Segment Operating Results section included within this MD&A for more information on the drivers of the changes in gross profit period over period for all segments.
Year Ended December 31, 2023 vs. 2022
Gross profit decrease of $98.2 million was driven by increased manufacturing costs of $158.6 million primarily due to significant CTO raw material cost pressure within our industrial specialties product line in our Performance Chemicals reportable segment, unfavorable sales volume of $46.9 million, inventory charges of $19.7 million, and unfavorable foreign currency exchange impacts of $0.9 million, partially offset by favorable pricing and sales mix of $127.9 million. Refer to the Segment Operating Results section included within this MD&A for more information on the drivers to the changes in gross profit period over period for all segments.
Selling, general, and administrative expenses
Year Ended December 31, 2024 vs. 2023
Selling, general, and administrative ("SG&A") expenses were $166.7 million (12 percent of Net sales) and $183.7 million (11 percent of Net sales) for the years ended December 31, 2024 and 2023, respectively. Overall, SG&A decreased by approximately $17.0 million or nine percent. Our Performance Chemicals' repositioning actions resulted in a non-cash reduction of intangible amortization expense of $11.4 million and $12.0 million in cash savings. These combined savings were partially offset by increased spending on commercial activities of $1.0 million and increased variable incentive compensation of $5.4 million, driven by adjustments recognized in the year ended December 31, 2023, that did not repeat in 2024.
Year Ended December 31, 2023 vs. 2022
SG&A expenses were $183.7 million (11 percent of Net sales) and $198.8 million (12 percent of Net sales) for the years ended December 31, 2023 and 2022, respectively. The decrease in SG&A expenses is primarily due to lower employee-related costs of $18.4 million, and decreased travel and other miscellaneous costs of $6.9 million, partially offset by increased amortization expense of $10.2 million due to the Ozark Materials acquisition.
Research and technical expenses
Years Ended December 31, 2024, 2023, and 2022
Research and technical expenses as a percentage of Net sales remained relatively consistent period over period, totaling 2.0 percent of sales in the year ended December 31, 2024, compared to 1.9 percent in the year ended December 31, 2023, and 1.8 percent in the year ended December 31, 2022. Research and technical expenses as a percentage of Net sales increased due to lower sales. Overall, Research and technical expense decreased by $3.7 million in 2024, compared to 2023, which included approximately $4.0 million realized from the Performance Chemicals repositioning actions initiated in 2023.
Restructuring and other (income) charges, net
Years Ended December 31, 2024, 2023, and 2022
| | | | | | | | | | | | | | | | | |
| | Years Ended December 31, |
| In millions | 2024 | | 2023 | | 2022 |
| Work force reductions and other | $ | 2.3 | | | $ | 12.5 | | | $ | — | |
| Performance Chemicals' repositioning | 172.7 | | | 113.1 | | | — | |
| Restructuring charges | $ | 175.0 | | | $ | 125.6 | | | $ | — | |
| Alternative feedstock transition | — | | | 22.1 | | | — | |
| North Charleston plant transition | 11.2 | | | 14.8 | | | — | |
| Business transformation costs | — | | | 7.7 | | | 13.8 | |
| | | | | |
| Other (income) charges, net | $ | 11.2 | | | $ | 44.6 | | | $ | 13.8 | |
Restructuring and other (income) charges, net (1) | $ | 186.2 | | | $ | 170.2 | | | $ | 13.8 | |
_______________
(1) See Note 15 for more information.
Goodwill impairment charge
Years Ended December 31, 2024, 2023, and 2022
Goodwill impairment charge of $349.1 million for the year ended December 31, 2024 within our Performance Chemicals reporting unit. See Note 8 for more information.
Acquisition-related costs
Years Ended December 31, 2024, 2023, and 2022
Acquisition costs were $0.3 million, $3.6 million, and $5.0 million for the years ended December 31, 2024, 2023, and 2022, respectively. For the twelve months ended December 31, 2024, 2023, and 2022, all charges related to the integration of Ozark Materials into our Performance Chemicals segment. See Note 16 for more information.
Other (income) expense, net
Years Ended December 31, 2024, 2023, and 2022
| | | | | | | | | | | | | | | | | |
| | Years Ended December 31, |
| In millions | 2024 | | 2023 | | 2022 |
(Gain) loss on strategic investments (1) | $ | 11.4 | | | $ | (19.3) | | | $ | — | |
| Foreign currency transaction (gain) loss | 4.2 | | | 3.7 | | | 2.3 | |
| CEO severance charges | 4.8 | | | — | | | — | |
Loss on CTO resales (2) | 52.7 | | | 22.0 | | | — | |
CTO supply contract termination charges (2) | 100.0 | | | — | | | — | |
| Other (income) expense, net | (3.3) | | | (0.7) | | | (4.0) | |
| Total Other (income) expense, net | $ | 169.8 | | | $ | 5.7 | | | $ | (1.7) | |
_______________
(1) See Note 5 for more information.
(2) See Note 15 for more information.
Interest expense
Years Ended December 31, 2024, 2023, and 2022
| | | | | | | | | | | | | | | | | |
| Years Ended December 31, |
| In millions | 2024 | | 2023 | | 2022 |
Finance lease obligations (1) | $ | 7.3 | | | $ | 7.3 | | | $ | 7.5 | |
Revolving credit facility and term loan (2) (3) | 57.2 | | | 59.1 | | | 21.2 | |
Senior Notes (3) | 22.4 | | | 22.4 | | | 33.1 | |
Accounts receivable securitization (3) | 5.7 | | | 1.5 | | | — | |
Litigation related interest expense (4) | 5.2 | | | 3.0 | | | — | |
| Total interest expense | $ | 97.8 | | | $ | 93.3 | | | $ | 61.8 | |
_______________
(1) See Note 13 for more information.
(2) The increase in interest expense was driven by higher average debt levels during 2024 and 2023 due to the October 2022, $325.0 million acquisition of Ozark Materials, as well as higher average interest rates compared to prior years.
(3) See Note 10 for more information.
(4) See Note 18 for more information.q
Interest income
Years Ended December 31 2024, 2023, and 2022
| | | | | | | | | | | | | | | | | |
| Years Ended December 31, |
| In millions | 2024 | | 2023 | | 2022 |
Restricted investment (1) | $ | 2.6 | | | $ | 2.4 | | | $ | 2.1 | |
Fixed-to-fixed cross-currency interest rate swap (2) | — | | | — | | | 1.1 | |
Floating-to-fixed interest rate swaps (2) | 0.8 | | | — | | | 1.7 | |
Other (3) | 4.3 | | | 3.9 | | | 2.6 | |
| Total interest income | $ | 7.7 | | | $ | 6.3 | | | $ | 7.5 | |
_______________(1) See Note 5 for more information.
(2) See Note 9 for more information.
(3) Primarily consists of bank interest.
Provision (benefit) for income taxes
Years Ended December 31, 2024, 2023, and 2022
For the years ended December 31, 2024, 2023, and 2022, our effective tax rate was 19.7 percent, 46.5 percent, and 21.5 percent respectively. An explanation of the change in the effective tax rate is presented in Note 17.
Segment Operating Results
In addition to the information discussed above, the following sections discuss the results of operations for each of Ingevity's segments. Our segments are (i) Performance Materials, (ii) Performance Chemicals, and (iii) Advanced Polymer Technologies. Segment Earnings before Interest, Taxes, Depreciation and Amortization ("EBITDA") is the primary measure used by the Company's chief operating decision maker to evaluate the performance of and allocate resources among our operating segments. Segment EBITDA is defined as segment net sales less segment operating expenses (segment operating expenses consist of costs of sales, selling, general and administrative expenses, research and technical expenses, other (income) expense, net, excluding depreciation and amortization). We have excluded the following items from segment EBITDA: interest expense associated with corporate debt facilities, interest income, income taxes, depreciation, amortization, restructuring and other income (charges), net, including inventory lower of cost or market charges associated with restructuring actions, goodwill impairment charge, acquisition and other-related income (costs), litigation verdict charges, gain (loss) on strategic investments, loss on CTO resales, CTO supply contract termination charges, and pension and postretirement settlement and curtailment income (charges), net. In general, the accounting policies of the segments are the same as those described in the Summary of Significant Accounting Policies in Note 2.
Performance Materials
2024 Performance Summary
Performance Materials delivered record Net sales, Segment EBITDA, and Segment EBITDA margins. Sales growth of four percent was driven by higher volume and improved price and mix. There are two components to mix that are key to understanding this reportable segment. The segment benefits from larger vehicles, such as trucks and sport utility vehicles, as well as more hybrids and internal combustion engine vehicles versus all electric vehicles, as these vehicles contain more of our activated carbon content. Regional mix is also important as North America, which is nearly 50 percent of Performance Material sales, is our most profitable region due to the typically larger size of vehicles requiring more content, and this region also has the highest emissions control standards in the world requiring more advanced forms of our activated carbon product. Asia Pacific is also an important region, representing about 40 percent of total Performance Materials net sales. Within Asia Pacific, about half of our net sales are in China and the remaining are made up primarily of South Korea and Japan. All of these countries have strict emissions control standards or strong export markets where our activated carbon plays an important role in meeting regulations. Europe is our least impactful region due to the regulatory environment favoring electric vehicles, and also because European emissions standards lag behind North America and Asia Pacific. Segment EBITDA for Performance Materials increased 11 percent to $319.1 million, with Segment EBITDA margins for the year of 52.3 percent. This record result was primarily driven by operational improvements that enabled our production operations to run more efficiently which reduced our input costs by using less natural gas and also improved yields.
| | | | | | | | | | | | | | | | | |
| In millions | Years Ended December 31, |
| 2024 | | 2023 | | 2022 |
| Total Performance Materials - Net sales | $ | 609.6 | | | $ | 586.0 | | | $ | 548.5 | |
| Segment EBITDA | $ | 319.1 | | | $ | 286.6 | | | $ | 252.2 | |
Net Sales Comparison of Years Ended December 31, 2024, 2023, and 2022
| | | | | | | | | | | | | | | | | | | | | | | | | | | | | |
| | | Change vs. prior year | | |
| In millions | Prior year Net sales | | Volume | | Price/Mix | | Currency effect | | Current year Net sales |
| Year Ended December 31, 2024 vs 2023 | $ | 586.0 | | | 11.2 | | | 17.3 | | | (4.9) | | | $ | 609.6 | |
| Year Ended December 31, 2023 vs 2022 | $ | 548.5 | | | 17.3 | | | 32.2 | | | (12.0) | | | $ | 586.0 | |
Year Ended December 31, 2024 vs. 2023
Segment net sales. The increase of $23.6 million in 2024 was driven by favorable pricing and sales mix of $17.3 million (three percent), and a volume increase of $11.2 million (two percent), partially offset by unfavorable foreign currency exchange impacts of $4.9 million (one percent).
Segment EBITDA. The increase of $32.5 million in 2024 was driven by decreased manufacturing costs of $26.0 million, pricing and sales mix of $11.9 million, and favorable volume of $6.3 million. The increase was partially offset by higher SG&A expenses and research and technical costs of $10.9 million, and unfavorable foreign currency exchange and other charges of $0.8 million.
Year Ended December 31, 2023 vs. 2022
Segment net sales. The increase in 2023 was driven by favorable pricing and sales mix of $32.2 million (six percent), and a volume increase of $17.3 million (three percent), partially offset by unfavorable foreign currency exchange impacts of $12.0 million (two percent).
Segment EBITDA. Segment EBITDA increased by $34.4 million due to pricing and sales mix of $21.1 million, decreased SG&A expenses and research and technical costs of $11.6 million, and favorable volume of $10.9 million. The increase was partially offset by higher manufacturing costs of $8.8 million, and unfavorable foreign currency exchange impacts of $0.4 million.
Performance Chemicals
2024 Performance Summary
Performance Chemicals net sales of $608.2 million declined almost $300 million, a 33 percent decline, versus the prior year primarily as a result of our repositioning actions. Approximately $210 million of the decline in net sales reflects the exit of lower-margin end markets in our industrial specialties product line as we continue to focus on maximizing profitability. The remaining net sales decline was due primarily to lost sales as customers sought alternative suppliers in light of our repositioning actions and lower road technologies product line sales attributed to adverse weather in the key states within the U.S. The segment generated Segment EBITDA of $14.7 million for the year. The year over year decline in Segment EBITDA was driven by higher CTO costs and lower volumes, particularly in the road technologies product line, partially offset by cost savings realized due to the Performance Chemicals repositioning.
| | | | | | | | | | | | | | | | | |
| Years Ended December 31, |
| In millions | 2024 | | 2023 | | 2022 |
| Total Performance Chemicals - Net sales | $ | 608.2 | | | $ | 902.1 | | | $ | 875.1 | |
| | | | | |
| Road Technologies product line | 342.3 | | | 369.8 | | | 241.3 | |
| Industrial Specialties product line | 265.9 | | | 532.3 | | | 633.8 | |
| | | | | |
| Segment EBITDA | $ | 14.7 | | | $ | 65.7 | | | $ | 160.4 | |
Net Sales Comparison of Years Ended December 31, 2024, 2023, and 2022
| | | | | | | | | | | | | | | | | | | | | | | | | | | | | |
| | | Change vs. prior year | | |
| In millions | Prior year Net sales | | Volume | | Price/Mix | | Currency effect | | Current year Net sales |
| Year Ended December 31, 2024 vs 2023 | $ | 902.1 | | | (293.2) | | | 0.5 | | | (1.2) | | | $ | 608.2 | |
| Road Technologies product line | 369.8 | | | (30.8) | | | 3.7 | | | (0.4) | | | 342.3 | |
| Industrial Specialties product line | 532.3 | | | (262.4) | | | (3.2) | | | (0.8) | | | 265.9 | |
| Year Ended December 31, 2023 vs 2022 | $ | 875.1 | | | (65.3) | | | 93.1 | | | (0.8) | | | $ | 902.1 | |
| Road Technologies product line | 241.3 | | | 98.4 | | | 30.4 | | | (0.3) | | | 369.8 | |
| Industrial Specialties product line | 633.8 | | | (163.7) | | | 62.7 | | | (0.5) | | | 532.3 | |
Year Ended December 31, 2024 vs. 2023
Segment net sales. The decrease of $293.9 million in 2024 was driven by a volume decrease of $293.2 million (33 percent), as a result of a decrease in industrial specialties ($262.4 million) and road technologies ($30.8 million), and unfavorable foreign currency exchange of $1.2 million (zero percent). The decrease was partially offset by favorable pricing
and sales mix of $0.5 million (zero percent), comprised of road technologies ($3.7 million), offset by industrial specialties ($3.2 million).
Segment EBITDA. The decrease of $51.0 million in 2024 was driven by a volume decrease of $45.0 million, higher manufacturing costs of $21.4 million, primarily due to higher cost CTO, and unfavorable foreign currency exchange and other charges of $5.1 million. The decrease was partially offset by favorable pricing and sales mix of $0.5 million and lower SG&A expenses of $20.0 million, which benefited from the Performance Chemicals' repositioning and cost savings initiatives implemented in 2023.
Year Ended December 31, 2023 vs. 2022
Segment net sales. The sales increase was driven by favorable pricing and sales mix of $93.1 million (11 percent), comprised of industrial specialties ($62.7 million) and road technologies product lines ($30.4 million), respectively. The increase was partially offset by a volume decline of $65.3 million (seven percent), driven by a decline in industrial specialties ($163.7 million), partially offset by growth in road technologies ($98.4 million). Unfavorable foreign currency exchange also impacted Net sales by $0.8 million (zero percent).
Segment EBITDA. Segment EBITDA decreased $94.7 million, mainly due to higher manufacturing costs of $157.8 million primarily due to increased CTO cost, a volume decline of $34.1 million, and unfavorable foreign currency exchange impacts of $0.1 million, These increases were partially offset by favorable pricing and sales mix of $89.7 million, and decreased SG&A expenses of $7.6 million.
Advanced Polymer Technologies
2024 Performance Summary
Advanced Polymer Technologies generated higher volumes year over year as the segment made progress in end markets such as elastomers, adhesives, and coatings; however, unfavorable overall product mix and selective price concessions contributed to a revenue decline of eight percent. The segment benefited from lower energy costs and an improvement in utilization rates as a result of higher volumes but these cost savings were more than offset by the revenue decline, resulting in segment EBITDA of $35.2 million and a segment EBITDA margin of 18.7 percent.
| | | | | | | | | | | | | | | | | |
| In millions | Years Ended December 31, |
| 2024 | | 2023 | | 2022 |
| Advanced Polymer Technologies - Net sales | $ | 188.6 | | | $ | 204.0 | | | $ | 244.7 | |
| Segment EBITDA | $ | 35.2 | | | $ | 44.5 | | | $ | 40.0 | |
Net Sales Comparison of Years Ended December 31, 2024, 2023, and 2022
| | | | | | | | | | | | | | | | | | | | | | | | | | | | | |
| | | Change vs. prior year | | |
| In millions | Prior year Net sales | | Volume | | Price/Mix | | Currency effect | | Current year Net sales |
| Year Ended December 31, 2024 vs 2023 | $ | 204.0 | | | 7.1 | | | (18.8) | | | (3.7) | | | $ | 188.6 | |
| Year Ended December 31, 2023 vs 2022 | $ | 244.7 | | | (58.3) | | | 17.0 | | | 0.6 | | | $ | 204.0 | |
Year Ended December 31, 2024 vs. 2023
Segment net sales. The decrease of $15.4 million in 2024 was driven by unfavorable pricing and sales mix of $18.8 million (nine percent), and unfavorable foreign currency exchange of $3.7 million (two percent), partially offset by volume growth of $7.1 million (three percent).
Segment EBITDA. The decrease of $9.3 million in 2024 was driven by unfavorable pricing and sales mix of $18.8 million, and unfavorable foreign currency exchange impacts and other charges of $2.8 million. The decrease was partially offset by lower manufacturing costs of $8.8 million, volume growth of $2.9 million, and lower SG&A expenses of $0.6 million.
Year Ended December 31, 2023 vs. 2022
Segment net sales. The sales decrease was driven by a volume decline of $58.3 million (24 percent), partially offset by favorable pricing and sales mix of $17.0 million (seven percent), and favorable foreign currency exchange of $0.6 million (zero percent).
Segment EBITDA. Segment EBITDA increased $4.5 million, mainly due to favorable pricing and sales mix of $17.1 million, decreased manufacturing costs of $9.9 million, and decreased SG&A expenses of $5.9 million. These increases were partially offset by volume declines of $23.7 million, and unfavorable foreign currency exchange impacts and other miscellaneous charges of $4.7 million.
Use of Non-GAAP Financial Measures
Ingevity has presented the financial measure, Adjusted EBITDA, defined below, which has not been prepared in accordance with U.S. generally accepted accounting principles (“GAAP”) and has provided a reconciliation to net income, the most directly comparable financial measure calculated in accordance with GAAP. Adjusted EBITDA is not meant to be considered in isolation nor as a substitute for the most directly comparable financial measure calculated in accordance with GAAP. Adjusted EBITDA is utilized by management as a measure of profitability.
We believe this non-GAAP financial measure provides management as well as investors, potential investors, securities analysts, and others with useful information to evaluate the performance of the business, because such measure, when viewed together with our financial results computed in accordance with GAAP, provides a more complete understanding of the factors and trends affecting our historical financial performance and projected future results. We believe Adjusted EBITDA is a useful measure because it excludes the effects of financing and investment activities as well as non-operating activities.
Adjusted EBITDA is defined as net income (loss) plus interest expense, net, provision (benefit) for income taxes, depreciation, amortization, restructuring and other (income) charges, net, acquisition and other-related (income) costs, goodwill impairment charge, litigation verdict charges, (loss) gain on strategic investments, loss on CTO resales, CTO supply contract termination charges, and pension and postretirement settlement and curtailment (income) charges, net.
This non-GAAP measure is not intended to replace the presentation of financial results in accordance with GAAP and investors should consider the limitations associated with these non-GAAP measures, including the potential lack of comparability of these measures from one company to another. A reconciliation of Adjusted EBITDA to net income is set forth within this section.
| | | | | | | | | | | | | | | | | |
| Reconciliation of Net Income (Loss) to Adjusted EBITDA |
| Years Ended December 31, |
| In millions | 2024 | | 2023 | | 2022 |
Net income (loss) (GAAP) | $ | (430.3) | | | $ | (5.4) | | | $ | 211.6 | |
| Interest expense | 97.8 | | | 93.3 | | | 61.8 | |
| Interest income | (7.7) | | | (6.3) | | | (7.5) | |
| Provision (benefit) for income taxes | (105.3) | | | (4.7) | | | 58.0 | |
Depreciation and amortization (1) | 108.3 | | | 122.8 | | | 108.8 | |
| | | | | |
Restructuring and other (income) charges, net (2) | 186.2 | | | 170.2 | | | 13.8 | |
Goodwill impairment charge (3) | 349.1 | | | — | | | — | |
Acquisition and other-related costs (4) | 0.3 | | | 4.5 | | | 5.9 | |
Loss on CTO resales (5) | 52.7 | | | 22.0 | | | — | |
CTO supply contract termination charges (6) | 100.0 | | | — | | | — | |
(Gain) loss on strategic investments (7) | 11.4 | | | (19.3) | | | — | |
| | | | | |
Pension and postretirement settlement and curtailment charges (income), net (8) | 0.2 | | | — | | | 0.2 | |
Adjusted EBITDA (Non-GAAP) | $ | 362.7 | | | $ | 377.1 | | | $ | 452.6 | |
_______________
(1) Refer to Note 19 for more information.
(2) We regularly perform strategic reviews and assess the return on our operations, which sometimes results in a plan to restructure the business. These costs are excluded from our reportable segment results and for the purposes of calculating our non-GAAP financial performance measures. Refer to Note 15 for more information on the charges.
(3) Refer to Note 8 for more information.
(4) Charges represent costs incurred to complete and integrate acquisitions and other strategic investments and include the expensing of the inventory fair value step-up resulting from the application of purchase accounting for acquisitions and certain legal and professional fees associated with the completion of acquisitions and strategic investments. Refer to Note 16 for more information.
(5) Due to the DeRidder Plant closure, and the corresponding reduced CTO refining capacity, we were obligated, under an existing CTO supply contract, to purchase CTO at amounts in excess of required CTO volumes. As of July 1, 2024, we terminated the CTO supply contract that resulted in these excess CTO volumes. As a result of the termination of this contract the purchases under the CTO supply contract ended, effective June 30, 2024, and we ended our CTO resale activity as of December 31, 2024. Since these CTO resale activities
are directly attributable to the Performance Chemicals’ repositioning, that is, they do not represent normal, recurring expenses necessary to operate our business, we have excluded the CTO resale (income) charges for the purposes of calculating our non-GAAP financial performance measures. For the years ended December 31, 2024 and 2023, the loss on CTO resales relates to the Performance Chemicals segment. Refer to Note 2 and Note 15 for more information.
(6) As consideration for the termination of the CTO supply contract, we made cash payments totaling $100.0 million during 2024. Since this contract termination is directly attributable to the Performance Chemicals’ repositioning, that is, it does not represent normal, recurring expenses necessary to operate our business, we have excluded the CTO supply contract termination charges for the purposes of calculating our non-GAAP financial performance measures. Refer to Note 2 and Note 15 for more information.
(7) We exclude gains and losses from strategic investments from our segment results, as well as our non-GAAP financial measures, because we do not consider such gains or losses to be directly associated with the operational performance of the segment. We believe that the inclusion of such gains or losses, would impair the factors and trends affecting the historical financial performance of our reportable segments. We continue to include undistributed earnings or loss, distributions, amortization or accretion of basis differences, and other-than-temporary impairments for equity method investments that we believe are directly attributable to the operational performance of such investments, in our reportable segment results. Refer to Note 5 for more information.
(8) Our pension and postretirement settlement and curtailment charges (income) are related to the acceleration of prior service costs, as a result of a reduction in the number of participants within the Union Hourly defined benefit pension plan. These are excluded from our segment results because we consider these costs to be outside our operational performance. We continue to include the service cost, amortization of prior service cost, interest costs, expected return on plan assets, and amortized actual gains and losses in our segment EBITDA. Refer to Note 14 for more information.
Revision to Previously Reported Adjusted EBITDA (Non-GAAP)
We revised our December 31, 2023 non-GAAP Adjusted EBITDA calculation to remove previous adjustments of $19.7 million related to inventory lower of cost or market charges associated with the Company's Performance Chemicals repositioning. This change was made to address a request from the Securities and Exchange Commission to revise future filings to no longer exclude these adjustments from non-GAAP performance measures. The following table presents the twelve months ended December 31, 2023 as previously reported and as revised.
| | | | | | | | | | | |
| Reconciliation of Net Income (Loss) to Adjusted EBITDA |
| Twelve Months Ended December 31, 2023 |
| In millions | As previously reported | | As revised |
Net income (loss) (GAAP) | $ | (5.4) | | | $ | (5.4) | |
| Interest expense | 93.3 | | | 93.3 | |
| Interest income | (6.3) | | | (6.3) | |
| Provision (benefit) for income taxes | (4.7) | | | (4.7) | |
| Depreciation and amortization | 122.8 | | | 122.8 | |
| | | |
| Restructuring and other (income) charges, net | 189.9 | | | 170.2 | |
| | | |
| Acquisition and other-related costs | 4.5 | | | 4.5 | |
| Loss on CTO resales | 22.0 | | | 22.0 | |
| | | |
| Gain on sale of strategic investment | (19.3) | | | (19.3) | |
| | | |
| | | |
Adjusted EBITDA (Non-GAAP) | $ | 396.8 | | | $ | 377.1 | |
Adjusted EBITDA
Year Ended December 31, 2024, 2023 and 2022
The factors that impacted Adjusted EBITDA period to period are the same factors that affected earnings discussed in the sections entitled "Results of Operations" and "Segment Operating Results" within MD&A.
Current Full Year Company Outlook vs. Prior Year
Net sales are expected to be between $1.3 billion and $1.4 billion for 2025. We expect growth in our Performance Materials reportable segment due to increased pricing on select products while global automotive production remains flat compared to the prior year. For our Performance Chemicals reportable segment, we expect the industrial specialties product line to deliver Net sales between $160 and $200 million, which reflects the impact of our repositioning actions to improve profitability by focusing on higher margin end markets, as well as continued weak industrial demand. Additionally, we expect our road technologies product line Net sales to improve compared to 2024 as adverse weather conditions experienced in key states within the U.S. negatively impacted 2024. Our Advanced Polymer Technologies reportable segment anticipates modest growth as industrial demand recovery will be tempered by continued competitive dynamics, particularly in Asia.
Adjusted EBITDA is expected to be between $400 million and $415 million for 2025. We expect modest improvement in our Performance Materials reportable segment EBITDA, while maintaining segment EBITDA margins around 50 percent, as improved pricing and continued operational efficiencies will be muted by expected higher input costs, particularly energy, and higher spend on innovation activities. In our Performance Chemicals reportable segment, we expect improved segment EBITDA, with segment EBITDA margins in the mid-to-high single digits. The segment will benefit from revenue growth in our road technologies product line and further savings from our repositioning actions. While we expect to benefit from lower CTO costs in the latter part of the year, we expect these benefits to be offset by price concessions to align with market pricing. We anticipate that our Advanced Polymer Technologies segment EBITDA will improve versus prior year as our enacted pricing and mix strategies will produce segment EBITDA margins of around 20 percent.
A reconciliation of net income to adjusted EBITDA as projected for 2025 is not provided. Ingevity does not forecast net income as it cannot, without unreasonable effort, estimate or predict with certainty various components of net income. These components, net of tax, include further restructuring and other income (charges), net; additional acquisition and other-related income (costs); additional pension and postretirement settlement and curtailment (income) charges; and revisions due to legislative tax rate changes. Additionally, discrete tax items could drive variability in our projected effective tax rate. All of these components could significantly impact such financial measures. Further, in the future, other items with similar characteristics to those currently included in adjusted EBITDA, that have a similar impact on comparability of periods, and which are not known at this time, may exist and impact adjusted EBITDA.
Liquidity and Capital Resources
The primary source of liquidity for our business is the cash flow provided by operating activities. We expect our cash flow provided by operations combined with cash on hand and available capacity under our revolving credit facility to be sufficient to fund our planned operations and meet our interest and other contractual obligations for at least the next twelve months. As of December 31, 2024, our undrawn capacity under our revolving credit facility was $302.4 million. Over the next twelve months, we expect to fund the following: debt principal repayments, interest payments, capital expenditures, income tax payments, additional spending associated with our Performance Materials' intellectual property litigation, and restructuring activities such as the repositioning of our Performance Chemicals reportable segment as further described within Note 15. In addition, we may also evaluate and consider purchases pursuant to our stock repurchase program (and related excise tax payments), strategic acquisitions, joint ventures, or other transactions to create stockholder value and enhance financial performance. In connection with such transactions, or to fund other anticipated uses of cash, we may modify our existing revolving credit facility, redeem all or part of our outstanding senior notes, seek additional debt financing, issue equity securities, or some combination thereof.
Cash and cash equivalents totaled $68.0 million at December 31, 2024. We continuously monitor deposit concentrations and the credit quality of the financial institutions that hold our cash and cash equivalents, as well as the credit quality of our insurance providers, customers, and key suppliers.
Due to the global nature of our operations, a portion of our cash is held outside the U.S. The cash and cash equivalents balance at December 31, 2024, included $63.9 million held by our foreign subsidiaries. Cash and earnings of our foreign subsidiaries are generally used to finance our foreign operations and their capital expenditures. We believe that our foreign holdings of cash will not have a material adverse impact on our U.S. liquidity. If these earnings were distributed, such amounts would be subject to U.S. federal income tax at the statutory rate less the available foreign tax credits, if any, and would potentially be subject to withholding taxes in the various jurisdictions. The potential tax implications of the repatriation of unremitted earnings are driven by facts at the time of distribution, therefore, it is not practicable to estimate the income tax liabilities that might be incurred if such cash and earnings were repatriated to the U.S. Management does not currently expect to repatriate cash earnings from our foreign operations in order to fund U.S. operations.
Debt and Finance Lease Obligations
Refer to Note 10 for a summary of our outstanding debt obligations and revolving credit facility, and Note 13 for details of our lease obligations.
Other Potential Liquidity Needs
Share Repurchases
On July 25, 2022, our Board of Directors authorized the repurchase of up to $500.0 million of our common stock (the "2022 Authorization"), and rescinded the prior outstanding repurchase authorization with respect to the shares that remained unused under the prior authorization. Shares under the 2022 Authorization may be purchased through open market or privately negotiated transactions at the discretion of management based on its evaluation of market prevailing conditions and other factors, including through the use of trading plans intended to qualify under Rule 10b5-1 under the Securities Exchange Act of 1934, as amended.
During the year ended December 31, 2024, we repurchased no common stock. At December 31, 2024, $353.4 million remained available for purchase under our Board-authorized repurchase program.
Capital Expenditures
Projected 2025 capital expenditures are expected to be $50 million to $70 million, the majority of which will be spent on maintenance and safety, health and environment projects. We have no material commitments associated with these projected capital expenditures as of December 31, 2024.
Cash flow comparison of Years Ended December 31, 2024, 2023, and 2022
| | | | | | | | | | | | | | | | | |
| Years Ended December 31, |
| In millions | 2024 | | 2023 | | 2022 |
| Net cash provided by (used in) operating activities | $ | 128.6 | | | $ | 205.1 | | | $ | 313.4 | |
| Net cash provided by (used in) investing activities | (79.5) | | | (77.3) | | | (551.9) | |
| Net cash provided by (used in) financing activities | (70.2) | | | (99.9) | | | 48.1 | |
Cash flows provided by (used in) operating activities
Cash provided by operating activities, which consists of net income (loss) adjusted for non-cash items including the cash impact from changes in operating assets and liabilities (i.e., working capital), totaled $128.6 million for the year ended December 31, 2024.
Cash provided by operating activities for 2024, when compared to 2023, decreased by $76.5 million. This decrease was driven by a payment to terminate a Performance Chemicals CTO contract of $100.0 million, reduced cash earnings of $75.8 million, CTO resale cash outflows of $35.5 million, increased spending on restructuring initiatives of $15.3 million, and an increase in cash interest paid of $2.7 million due primarily to rising interest rates when compared to 2023. Partially offsetting these cash outflows was a net reduction in trade working capital (accounts receivable, inventory, and accounts payable) of $108.5 million, reduced employee variable compensation of $41.5 million, and a reduction in tax payments of $2.8 million.
Cash provided by operating activities for 2023, when compared to 2022, decreased by $108.3 million. This decrease was driven by lower cash earnings of $41.4 million, increased employee compensation payments of $38.9 million, increased spending on restructuring initiatives of $30.2 million, an increase in cash interest paid of $27.9 million due to higher average debt levels resulting from the October 2022 acquisition of Ozark Materials and rising interest rates during 2023, and CTO resale cash outflows of $10.6 million. This was partially offset by a reduction in tax payments of $25.1 million, and a decrease in trade working capital (accounts receivable, inventory, and accounts payable) of $15.6 million.
Cash flows provided by (used in) investing activities
Cash used in investing activities for 2024 was primarily driven by capital spending. Capital spending included the base maintenance capital supporting ongoing operations and cost improvement and growth spending.
Cash used in investing activities for 2023 was driven by capital spending, offset partially by the proceeds from the sale of a strategic investment (refer to Note 5 for more information). Capital spending included the base maintenance capital supporting ongoing operations and cost improvement and growth spending in our Advanced Polymer Technologies segment.
| | | | | | | | | | | | | | | | | |
| Capital expenditure categories | Years Ended December 31, |
| In millions | 2024 | | 2023 | | 2022 |
| Maintenance | $ | 50.8 | | | $ | 65.5 | | | $ | 57.4 | |
| Safety, health and environment | 4.1 | | | 11.3 | | | 19.7 | |
| Growth and cost improvement | 22.7 | | | 33.0 | | | 65.4 | |
| Total capital expenditures | $ | 77.6 | | | $ | 109.8 | | | $ | 142.5 | |
Cash flows provided by (used in) financing activities
Cash used in financing activities for the year ended December 31, 2024, was $70.2 million and was primarily driven by net payments on the revolving credit facility and other borrowings of $66.1 million.
Cash used in financing activities for the year ended December 31, 2023, was $99.9 million and was driven by share repurchases of $92.1 million, and net payments on the revolving credit facility and other borrowings of $87.9 million, offset by proceeds from our accounts receivable securitization facility of $81.3 million.
New Accounting Guidance
Refer to Note 3 for a full description of recent accounting pronouncements including the respective expected dates of adoption and expected effects on our Consolidated Financial Statements.
Critical Accounting Policies and Estimates
Our principal accounting policies are described in Note 2. Our Consolidated Financial Statements are prepared in conformity with GAAP. The preparation of our financial statements requires management to make estimates and judgments that affect the reported amounts of assets, liabilities, revenues, and expenses. We have reviewed these accounting policies, identifying those that we believe to be critical to the preparation and understanding of our financial statements. Critical accounting policies are central to our presentation of results of operations and financial condition and require management to make estimates and judgments on certain matters. We base our estimates and judgments on historical experience, current conditions, and other reasonable factors.
The following is a list of those accounting policies that we have deemed most critical to the presentation and understanding of our results of operations and financial condition:
Revenue recognition
Our revenue is derived from contracts with customers, and substantially all our revenue is recognized when products are either shipped from our manufacturing and warehousing facilities or delivered to the customer. Revenue, net of returns and customer incentives, is based on the sale of manufactured products. Revenues are recognized when performance obligations under the terms of a contract with our customer are satisfied; generally, this occurs with the transfer of control of our products. For certain limited contracts, where we are producing goods with no alternative use and for which we have an enforceable right to payment for performance completed to date, we are recognizing revenue as goods are manufactured, rather than when they are shipped. Revenues are presented as Net sales on the consolidated statements of operations.
Since Net sales are derived from product sales only, we have disaggregated our Net sales by our product lines within each reportable segment. Net sales are measured as the amount of consideration we expect to receive in exchange for transferring goods. Sales, value add, and other taxes we collect concurrent with revenue-producing activities are excluded from revenue. Sales returns and allowances are not a normal practice in the industry and are not significant. Certain customers may receive cash-based incentives, including discounts and volume rebates, which are accounted for as variable consideration and included within Net sales. Shipping and handling fees billed to customers are included in Net sales. If we pay for the freight and shipping, we recognize the cost when control of the product has transferred to the customer as an expense within Cost of sales on the consolidated statements of operations. Payment terms with our customers are typically in the range of zero to sixty days. Because the period between when we transfer a promised good to a customer and when the customer pays for that good will be one year or less, we elect not to adjust the promised amount of consideration for the effects of any financing component, as it is not significant.
Valuation of tangible and intangible long-lived assets and goodwill
Our long-lived assets primarily include property, plant, and equipment, and other intangible assets. We periodically evaluate whether current events or circumstances indicate that the carrying value of long-lived assets to be held and used may not be recoverable. If such circumstances are determined to exist, an estimate of undiscounted future cash flows produced by the long-lived asset, or the appropriate grouping of assets, is compared to carrying value to determine whether an impairment exists.
If an asset is determined to be impaired, the loss is measured based on quoted market prices in active markets, if available. If quoted market prices are not available, the estimate of fair value is based on various valuation techniques, including a discounted value of estimated future cash flows. We report an asset to be disposed of at the lower of its carrying value or its estimated net realizable value.
Goodwill represents the excess of cost of an acquired business over the fair value of the identifiable tangible and intangible assets acquired and liabilities assumed in a business combination. We conduct a required annual review of goodwill for potential impairment at October 1, or sooner if events or changes in circumstances indicate that the fair value of a reporting unit is below its carrying value. Our reporting units are our operating segments, i.e., Performance Materials, Performance Chemicals and Advanced Polymer Technologies. If the carrying value of a reporting unit that includes goodwill exceeds its fair
value, which is determined using both the income approach and market approach, goodwill is considered impaired. The income approach determines fair value based on discounted cash flow model derived from a reporting unit’s long-term forecasted cash flows. The market approach determines fair value based on the application of earnings multiples of comparable companies to the projected earnings of the reporting unit. The amount of impairment loss is measured as the difference between the carrying value and the fair value of a reporting unit but is limited to the total amount of goodwill allocated to the reporting unit. In performing the fair value analysis, management makes various judgments, estimates, and assumptions, the most significant of which are the assumptions related to revenue growth rates, Earnings before Interest, Taxes, Depreciation and Amortization ("EBITDA") margin, and discount rate.
The factors we considered in developing our estimates and projections for cash flows include, but are not limited to, the following: (i) macroeconomic conditions; (ii) industry and market considerations; (iii) costs, such as increases in raw materials, labor, or other costs; (iv) our overall financial performance; and (v) other relevant entity-specific events that impact our reporting units.
The determination of whether goodwill is impaired involves a significant level of judgment in the assumptions underlying the approach used to determine the estimated fair values of our reporting units. We believe that the estimates and assumptions used in our impairment assessment are reasonable; however, these assumptions are judgmental and variations in any assumptions could result in materially different calculations of fair value. We will continue to evaluate goodwill on an annual basis as of October 1, and whenever events or changes in circumstances, such as significant adverse changes in operating results, market conditions, or changes in management’s business strategy indicate that there may be a probable indicator of impairment. It is possible that the assumptions used by management related to the evaluation may change or that actual results may vary significantly from management’s estimates.
The results of our October 1st annual review calculated that our APT reporting unit headroom, defined as the percentage difference between the fair value of a reporting unit and its carrying value, is 12 percent. Since the fair value of our APT reporting unit is higher than the carrying value, we have concluded that no impairment to goodwill is necessary. Our analysis includes significant assumptions such as revenue growth rate, Earnings before Interest, Taxes, Depreciation and Amortization ("EBITDA") margin, and discount rate, which are judgmental, and variations in any assumptions could result in materially different calculations of fair value.
The below table shows how changes in certain significant assumptions utilized in our annual goodwill testing, specific to our APT reporting unit, impacts the calculated headroom.
| | | | | | | | | | | | |
| Advanced Polymer Technologies Reporting Unit - Headroom Sensitivity Analysis |
| | Revenue growth rate declines by 100 Bps | EBITDA margin declines by 100 Bps | Discount rate
increases by 100 Bps |
| Headroom | | 2% | 3% | (6)% |
Business Combinations
Accounting for business combinations, which requires, among other things, the acquiring entity in a business combination to recognize the fair value of the assets acquired and liabilities assumed; the recognition of acquisition-related costs within the consolidated results of operations; the recognition of restructuring costs within the consolidated results of operations for which the acquirer becomes obligated after the acquisition date; and contingent purchase consideration to be recognized at fair value on the acquisition date with subsequent adjustments recognized on the consolidated statements of operations. We generally use qualified third-party consultants to assist management in determining the fair value of assets acquired and liabilities assumed. This includes, when necessary, assistance with the determination of lives and valuation of tangible property, plant, and equipment and identifiable intangibles, assisting management in determining the fair value of obligations associated with employee-related liabilities and assisting management in assessing obligations associated with legal and environmental claims.
The fair value assigned to identifiable intangible assets acquired is determined primarily by using an income approach, which is based on assumptions and estimates made by management. Significant assumptions utilized in the income approach are the attrition rate, revenue growth rates, EBITDA margins, royalty rates, and the discount rate. These assumptions are based on company-specific information and projections, which are not observable in the market and are therefore considered Level 2 and Level 3 measurements. The excess of the purchase price over the fair value of the identified assets and liabilities is recorded
as goodwill. Based on the acquired business’ end markets and products, as well as how the chief operating decision maker will review the business results, determines the most appropriate operating segment for which to integrate the acquired business. Goodwill acquired, if any, is allocated to the reporting unit within or at the operating segment for which the acquired business will be integrated. Selection of the appropriate reporting unit is based on the level at which discrete financial information is available and reviewed by business management post-integration. Operating results of the acquired entity are reflected within the Consolidated Financial Statements from the date of acquisition.
Income taxes
We are subject to income taxes in the U.S. and numerous foreign jurisdictions, including China and the United Kingdom. The provision for income taxes includes income taxes paid, currently payable or receivable, and deferred taxes. We follow the liability method of accounting for income taxes in accordance with current accounting standards regarding the accounting for income taxes. Under this method, deferred income taxes are recorded based on the differences between the financial reporting and tax bases of assets and liabilities and are measured using the enacted tax rates and laws in effect at the time the underlying assets or liabilities are recovered or settled. The ability to realize deferred tax assets is evaluated through the forecasting of taxable income, historical and projected future operating results, the reversal of existing temporary differences, and the availability of tax planning strategies. Valuation allowances are recognized to reduce deferred tax assets when it is more likely than not that a tax benefit will not be realized. We do not provide income taxes on undistributed earnings of consolidated foreign subsidiaries as it is our intention that such earnings will remain invested in those companies.
We recognize income tax positions that are more likely than not to be realized and accrue interest related to unrecognized income tax positions, which is included as a component of the income tax provision, on the consolidated statements of operations.
ITEM 7A. QUANTITATIVE AND QUALITATIVE DISCLOSURES ABOUT MARKET RISK
Foreign currency exchange rate risk
Net sales originating from our foreign-based operations, primarily Europe, South America, and Asia, accounted for approximately 25 percent of our net sales in 2024. We have designated the local currency as the functional currency of our significant operations outside of the U.S. The primary currencies for which we have exchange rate exposure are the U.S. dollar versus the euro, the Japanese yen, the pound sterling, the Brazilian real, and the Chinese renminbi. In addition, certain of our domestic operations have sales to foreign customers. In the conduct of our foreign operations, we also make inter-company sales. All of this exposes us to the effect of changes in foreign currency exchange rates. Our earnings are therefore subject to change due to fluctuations in foreign currency exchange rates when the earnings in foreign currencies are translated into U.S. dollars. In some cases, to minimize the effects of such fluctuations, we use foreign exchange forward contracts to hedge firm and highly anticipated foreign currency cash flows. Our largest exposures are to the Brazilian real, the Chinese renminbi, and the euro. A hypothetical 10 percent adverse change, excluding the impact of any hedging instruments, in the average Brazilian real, Chinese renminbi, and euro to U.S. dollar exchange rates during the year ended December 31, 2024, would have decreased our net sales and income before income taxes for the year ended December 31, 2024, by approximately $18 million or one percent and $6 million or one percent, respectively. Comparatively, a hypothetical 10 percent adverse change in the average Brazilian real, Chinese renminbi, and euro to U.S. dollar exchange rates during the year ended December 31, 2023 would have decreased our net sales and income before income taxes for the year ended December 31, 2023, by approximately $20 million or one percent and $5 million or two percent, respectively.
Concentration of credit risk
The financial instruments that potentially subject Ingevity to concentrations of credit risk are accounts receivable. We limit our credit risk by performing ongoing credit evaluations and, when necessary, requiring letters of credit, guarantees, or collateral. Our largest customer as of December 31, 2024, had accounts receivable of $8.3 million and $7.5 million as of December 31, 2024 and 2023, respectively. Sales to our largest customer, which is in our Performance Materials segment, were approximately six percent of total net sales for the year ended December 31, 2024, and four percent for each of the years ended December 31, 2023, and 2022, respectively. Sales to the automotive industry, which represents our largest industry concentration, were approximately 40 percent of our consolidated Net sales. No customer individually accounted for greater than 10 percent of Ingevity's consolidated Net sales.
Commodity price risk
A portion of our manufacturing costs includes purchased raw materials, which are commodities whose prices fluctuate as market supply and demand fundamentals change. Accordingly, product margins and the level of our profitability tend to fluctuate with the changes in these commodity prices. The cost of energy is a manufacturing cost that is exposed to commodity pricing. Our sources of energy costs are diversified among electricity, steam and natural gas, with natural gas comprising our largest energy input.
Crude tall oil price risk
Our results of operations are directly affected by the cost of our raw materials, particularly CTO, which, excluding CTO resales, represents approximately 14 percent of consolidated cost of sales and 38 percent of our full company raw materials purchases for the year ended December 31, 2024. Pricing for CTO is driven by the limited supply of the product and competing demands for its use, both of which drive pressure on its price. Our gross profit and margins could be adversely affected by increases in the cost of CTO if we are unable to pass the increases on to our customers. Based on average pricing during the year ended December 31, 2024, a hypothetical unhedged, unfavorable 10 percent increase in the market price for CTO would have increased our cost of sales for the year ended December 31, 2024, by approximately $13.0 million or one percent, which we may not have been able to pass on to our customers. Comparatively, based on average pricing during the year ended December 31, 2023, a hypothetical unhedged, unfavorable 10 percent increase in the market price for CTO would have increased our cost of sales for the year ended December 31, 2023 by approximately $29.3 million or two percent. The repositioning of the Performance Chemicals reportable segment and the termination of the long-term CTO supply contract have significantly reduced the Company's volume requirements and exposure to CTO beginning in 2025.
Natural gas price risk
Natural gas, both direct and indirect, is our largest form of energy costs constituting approximately four percent of our cost of goods sold for the year ended December 31, 2024. Increases in natural gas costs, unless passed on to our customers, would adversely affect our results of operations. If natural gas prices increase significantly, our business or results of operations may be adversely affected. We enter into certain derivative financial instruments to mitigate expected fluctuations in market prices and the volatility to earnings and cash flow resulting from changes to the pricing of natural gas purchases. Refer to Note 9 for more information on our natural gas price risk hedging program. For the year ended December 31, 2024, a hypothetical, unhedged 10 percent increase in natural gas pricing would have resulted in an increase to cost of sales of approximately $3.6 million or 37 basis points. Comparatively, for the year ended December 31, 2023, a hypothetical, unhedged 10 percent increase in natural gas pricing would have resulted in an increase to cost of sales of approximately $4.7 million or 39 basis points. As of December 31, 2024, we had 1.8 million mmBTUS (millions of British Thermal Units) in open natural gas derivative contracts, designated as cash flow hedges. As of December 31, 2024, open natural gas derivative contracts hedge a portion of forecasted transactions until December 2025. The fair value of the open natural gas derivative contracts as of December 31, 2024 and 2023 was a net asset (liability) of $0.3 million and $(0.9) million, respectively.
Interest rate risk
During the third quarter of 2024, we entered into a floating-to-fixed interest rate swap with a notional amount of $200.0 million to manage the variability of cash flows in the interest rate payments associated with our existing Secured Overnight Financing Rate ("SOFR") based interest payments, effectively converting $200.0 million of our floating rate debt to a fixed rate. In accordance with the terms of this instrument, we receive floating rate interest payments based upon one-month U.S. dollar SOFR and in return are obligated to pay interest at a fixed rate of 3.84 percent until August 2026. The fair value of outstanding interest rate instruments at December 31, 2024 and 2023 was an asset of $0.6 million and zero, respectively.
As of December 31, 2024, approximately $555 million of our borrowings, adjusted for our $200 million floating-to-fixed interest rate swap, include a variable interest rate component. As a result, we are subject to interest rate risk with respect to such floating-rate debt. The weighted average interest rate associated with our variable interest rate borrowings, was 6.52 percent for the period ended December 31, 2024. For the year ended December 31, 2024, a hypothetical 100 basis point increase in the variable interest rate component of our borrowings would increase our annual interest expense by approximately $6 million or eight percent. Comparatively, for the year ended December 31, 2023, a hypothetical 100 basis point increase in the variable interest rate component of our borrowings would have increased our annual interest expense by approximately $8 million or 10 percent.
ITEM 8. FINANCIAL STATEMENTS AND SUPPLEMENTARY DATA
INDEX TO THE FINANCIAL STATEMENTS
Ingevity Corporation
Management's Report on Internal Control over Financial Reporting
Management is responsible for establishing and maintaining adequate internal control over financial reporting as defined in Rules 13a-15(f) and 15d-15(f) under the Securities Exchange Act of 1934. The Company's internal control over financial reporting is a process designed to provide reasonable assurance regarding the reliability of financial reporting and the preparation of financial statements for external purposes in accordance with GAAP. The Company's internal control over financial reporting includes those policies and procedures that:
i.pertain to the maintenance of records that, in reasonable detail, accurately and fairly reflect the transactions and dispositions of the assets of the Company;
ii.provide reasonable assurance that transactions are recorded as necessary to permit preparation of financial statements in accordance with GAAP and that receipts and expenditures of the Company are being made only in accordance with authorization of management and directors of the Company; and
iii.provide reasonable assurance regarding prevention or timely detection of unauthorized acquisitions, use or disposition of the Company's assets that could have a material effect on the financial statements.
Because of its inherent limitations, internal control over financial reporting may not prevent or detect misstatements. Also, projections of any evaluation of effectiveness to future periods are subject to the risk that controls may become inadequate because of changes in conditions, or that the degree of compliance with the policies or procedures may deteriorate.
Management assessed the effectiveness of the Company's internal control over financial reporting as of December 31, 2024, based on criteria set forth by the Committee of Sponsoring Organizations of the Treadway Commission (COSO) in Internal Control-Integrated Framework (2013). Based on its assessment and those criteria, management concluded that the Company maintained effective internal control over financial reporting as of December 31, 2024.
PricewaterhouseCoopers LLP, an independent registered public accounting firm, has audited the effectiveness of the Company's internal control over financial reporting as of December 31, 2024, as stated in their report, which is presented on the following page.
| | | | | | | | | | | |
| Date: | February 19, 2025 | | |
| | | |
| | | |
| By: | /S/ LUIS FERNANDEZ-MORENO | | /S/ MARY DEAN HALL |
| Luis Fernandez-Moreno | | Mary Dean Hall |
| Interim President and Chief Executive Officer | | Executive Vice President and Chief Financial Officer |
Report of Independent Registered Public Accounting Firm
To the Board of Directors and Stockholders of Ingevity Corporation
Opinions on the Financial Statements and Internal Control over Financial Reporting
We have audited the accompanying consolidated balance sheets of Ingevity Corporation and its subsidiaries (the "Company") as of December 31, 2024 and 2023, and the related consolidated statements of operations, of comprehensive income (loss), of stockholders’ equity and of cash flows for each of the three years in the period ended December 31, 2024, including the related notes and financial statement schedule listed in the index appearing under Item 15(a)(2) (collectively referred to as the "consolidated financial statements"). We also have audited the Company's internal control over financial reporting as of December 31, 2024, based on criteria established in Internal Control - Integrated Framework (2013) issued by the Committee of Sponsoring Organizations of the Treadway Commission (COSO).
In our opinion, the consolidated financial statements referred to above present fairly, in all material respects, the financial position of the Company as of December 31, 2024 and 2023, and the results of its operations and its cash flows for each of the three years in the period ended December 31, 2024 in conformity with accounting principles generally accepted in the United States of America. Also in our opinion, the Company maintained, in all material respects, effective internal control over financial reporting as of December 31, 2024, based on criteria established in Internal Control - Integrated Framework (2013) issued by the COSO.
Basis for Opinions
The Company's management is responsible for these consolidated financial statements, for maintaining effective internal control over financial reporting, and for its assessment of the effectiveness of internal control over financial reporting, included in the accompanying Management’s Report on Internal Control over Financial Reporting. Our responsibility is to express opinions on the Company’s consolidated financial statements and on the Company's internal control over financial reporting based on our audits. We are a public accounting firm registered with the Public Company Accounting Oversight Board (United States) (PCAOB) and are required to be independent with respect to the Company in accordance with the U.S. federal securities laws and the applicable rules and regulations of the Securities and Exchange Commission and the PCAOB.
We conducted our audits in accordance with the standards of the PCAOB. Those standards require that we plan and perform the audits to obtain reasonable assurance about whether the consolidated financial statements are free of material misstatement, whether due to error or fraud, and whether effective internal control over financial reporting was maintained in all material respects.
Our audits of the consolidated financial statements included performing procedures to assess the risks of material misstatement of the consolidated financial statements, whether due to error or fraud, and performing procedures that respond to those risks. Such procedures included examining, on a test basis, evidence regarding the amounts and disclosures in the consolidated financial statements. Our audits also included evaluating the accounting principles used and significant estimates made by management, as well as evaluating the overall presentation of the consolidated financial statements. Our audit of internal control over financial reporting included obtaining an understanding of internal control over financial reporting, assessing the risk that a material weakness exists, and testing and evaluating the design and operating effectiveness of internal control based on the assessed risk. Our audits also included performing such other procedures as we considered necessary in the circumstances. We believe that our audits provide a reasonable basis for our opinions.
Definition and Limitations of Internal Control over Financial Reporting
A company’s internal control over financial reporting is a process designed to provide reasonable assurance regarding the reliability of financial reporting and the preparation of financial statements for external purposes in accordance with generally accepted accounting principles. A company’s internal control over financial reporting includes those policies and procedures that (i) pertain to the maintenance of records that, in reasonable detail, accurately and fairly reflect the transactions and dispositions of the assets of the Company; (ii) provide reasonable assurance that transactions are recorded as necessary to permit preparation of financial statements in accordance with generally accepted accounting principles, and that receipts and expenditures of the Company are being made only in accordance with authorizations of management and directors of the Company; and (iii) provide reasonable assurance regarding prevention or timely detection of unauthorized acquisition, use, or disposition of the Company’s assets that could have a material effect on the financial statements.
Because of its inherent limitations, internal control over financial reporting may not prevent or detect misstatements. Also, projections of any evaluation of effectiveness to future periods are subject to the risk that controls may become inadequate because of changes in conditions, or that the degree of compliance with the policies or procedures may deteriorate.
Critical Audit Matters
The critical audit matter communicated below is a matter arising from the current period audit of the consolidated financial statements that was communicated or required to be communicated to the audit committee and that (i) relates to accounts or disclosures that are material to the consolidated financial statements and (ii) involved our especially challenging, subjective, or complex judgments. The communication of critical audit matters does not alter in any way our opinion on the consolidated financial statements, taken as a whole, and we are not, by communicating the critical audit matter below, providing a separate opinion on the critical audit matter or on the accounts or disclosures to which it relates.
Annual Goodwill Impairment Assessment – Advanced Polymer Technologies Reporting Unit
As described in Notes 2 and 8 to the consolidated financial statements, the Company’s consolidated goodwill balance was $175.2 million as of December 31, 2024, of which $170.9 million relates to the Advanced Polymer Technologies reporting unit. Management conducts an annual review of goodwill for potential impairment at October 1, or sooner if events or changes in circumstances indicate that the fair value of a reporting unit is below its carrying value. The fair value of the reporting unit was determined by management using both the income approach and market approach. The income approach determines fair value based on a discounted cash flow model derived from a reporting unit’s long-term forecasted cash flows, and the market approach determines fair value based on the application of earnings multiples of comparable companies to projected earnings of the reporting unit. The amount of impairment loss is measured as the difference between the carrying value and the fair value of a reporting unit but is limited to the total amount of goodwill allocated to a reporting unit. The calculated estimated fair value of the reporting unit reflects a number of significant management assumptions and estimates including forecasted revenue growth rates, forecasted Earnings before Interest, Taxes, Depreciation and Amortization (“EBITDA”) margins, and discount rate. Management concluded that there was no impairment for the year ended December 31, 2024.
The principal considerations for our determination that performing procedures relating to the annual goodwill impairment assessment of the Advanced Polymer Technologies reporting unit is a critical audit matter are (i) the significant judgment by management when developing the fair value estimate of the reporting unit; (ii) a high degree of auditor judgment, subjectivity, and effort in performing procedures and evaluating management’s significant assumptions related to forecasted revenue growth rates, forecasted EBITDA margins, and discount rate used in the discounted cash flow model; and (iii) the audit effort involved the use of professionals with specialized skill and knowledge.
Addressing the matter involved performing procedures and evaluating audit evidence in connection with forming our overall opinion on the consolidated financial statements. These procedures included testing the effectiveness of controls relating to management’s annual goodwill impairment assessment, including controls over the valuation of the Advanced Polymer Technologies reporting unit. These procedures also included, among others (i) testing management’s process for developing the fair value estimate of the reporting unit; (ii) evaluating the appropriateness of the income and market approaches; (iii) testing the completeness and accuracy of underlying data used in the discounted cash flow model; and (iv) evaluating the reasonableness of the significant assumptions used by management related to the forecasted revenue growth rates, forecasted EBITDA margins, and discount rate. Evaluating management’s significant assumptions related to the forecast of forecasted revenue growth rates and forecasted EBITDA margins involved evaluating whether the significant assumptions used by management were reasonable considering (i) the current and past performance of the Advanced Polymer Technologies reporting unit; (ii) the consistency with external market data; and (iii) whether these significant assumptions were consistent with evidence obtained in other areas of the audit. Professionals with specialized skill and knowledge were used to assist in evaluating (i) the appropriateness of the Company’s discounted cash flow model and (ii) the reasonableness of the discount rate.
/s/ PricewaterhouseCoopers LLP
Charlotte, North Carolina
February 19, 2025
We have served as the Company’s auditor since 2015.
INGEVITY CORPORATION
Consolidated Statements of Operations | | | | | | | | | | | | | | | | | |
| Years Ended December 31, |
| In millions, except per share data | 2024 | | 2023 | | 2022 |
| Net sales | $ | 1,406.4 | | | $ | 1,692.1 | | | $ | 1,668.3 | |
| Cost of sales | 951.7 | | | 1,220.2 | | | 1,098.2 | |
| Gross profit | 454.7 | | | 471.9 | | | 570.1 | |
| Selling, general, and administrative expenses | 166.7 | | | 183.7 | | | 198.8 | |
| Research and technical expenses | 28.1 | | | 31.8 | | | 30.3 | |
| | | | | |
| Restructuring and other (income) charges, net | 186.2 | | | 170.2 | | | 13.8 | |
| Goodwill impairment charge | 349.1 | | | — | | | — | |
| Acquisition-related costs | 0.3 | | | 3.6 | | | 5.0 | |
| Other (income) expense, net | 169.8 | | | 5.7 | | | (1.7) | |
| Interest expense | 97.8 | | | 93.3 | | | 61.8 | |
| Interest income | (7.7) | | | (6.3) | | | (7.5) | |
| Income (loss) before income taxes | (535.6) | | | (10.1) | | | 269.6 | |
| Provision (benefit) for income taxes | (105.3) | | | (4.7) | | | 58.0 | |
| Net income (loss) | $ | (430.3) | | | $ | (5.4) | | | $ | 211.6 | |
| | | | | |
| Per share data | | | | | |
| Basic earnings (loss) per share | $ | (11.85) | | | $ | (0.15) | | | $ | 5.54 | |
| Diluted earnings (loss) per share | (11.85) | | | (0.15) | | | 5.50 | |
The accompanying notes are an integral part of these financial statements.
INGEVITY CORPORATION
Consolidated Statements of Comprehensive Income (Loss) | | | | | | | | | | | | | | | | | |
| Years Ended December 31, |
| In millions | 2024 | | 2023 | | 2022 |
| Net income (loss) | $ | (430.3) | | | $ | (5.4) | | | $ | 211.6 | |
| Other comprehensive income (loss), net of tax: | | | | | |
| Foreign currency adjustments: | | | | | |
| Foreign currency translation adjustment | (18.6) | | | 20.2 | | | (74.9) | |
| Reclassification of foreign currency translation losses | (0.2) | | | — | | | — | |
| Unrealized gain (loss) on net investment hedges, net of tax provision (benefit) of zero, zero, and $3.2 | — | | | — | | | 10.7 | |
| Total foreign currency adjustments, net of tax provision (benefit) of zero, zero, and $3.2 | (18.8) | | | 20.2 | | | (64.2) | |
| Derivative instruments: | | | | | |
| Unrealized gain (loss), net of tax provision (benefit) of $0.1, $(1.0), and $2.6 | 0.3 | | | (3.2) | | | 8.5 | |
| Reclassifications of deferred derivative instruments (gain) loss, included within net income (loss), net of tax (provision) benefit of $0.6, $0.9, and $(2.4) | 1.8 | | | 3.0 | | | (7.8) | |
| Total derivative instruments, net of tax provision (benefit) of $0.7, $(0.1), and $0.2 | 2.1 | | | (0.2) | | | 0.7 | |
| Pension & other postretirement benefits: | | | | | |
| Unrealized actuarial gains (losses) and prior service (costs) credits, net of tax provision (benefit) of $0.5, zero, and $1.0 | 1.8 | | | 0.1 | | | 3.4 | |
| Reclassifications of net actuarial and other (gain) loss, amortization of prior service cost, and settlement and curtailment (income) charges, included within net income, net of tax (provision) benefit of $0.1, $0.1, and $0.1 | 0.2 | | | — | | | 0.2 | |
| Total pension and other postretirement benefits, net of tax provision (benefit) of $0.6, $0.1, and $1.1 | 2.0 | | | 0.1 | | | 3.6 | |
| Other comprehensive income (loss), net of tax provision (benefit) of $1.3, zero, and $4.5 | (14.7) | | | 20.1 | | | (59.9) | |
| Comprehensive income (loss) | $ | (445.0) | | | $ | 14.7 | | | $ | 151.7 | |
The accompanying notes are an integral part of these financial statements.
INGEVITY CORPORATION
Consolidated Balance Sheets | | | | | | | | | | | |
| December 31, |
| In millions, except share and par value data | 2024 | | 2023 |
| Assets | | | |
| Cash and cash equivalents | $ | 68.0 | | | $ | 95.9 | |
Accounts receivable, net of allowance of $0.6 million - 2024 and $1.1 million - 2023 | 141.0 | | | 182.0 | |
| Inventories, net | 226.8 | | | 308.8 | |
| Prepaid and other current assets | 57.4 | | | 71.9 | |
| Current assets | 493.2 | | | 658.6 | |
| Property, plant, and equipment, net | 658.9 | | | 762.2 | |
| Operating lease assets, net | 50.4 | | | 67.1 | |
| Goodwill | 175.2 | | | 527.5 | |
| Other intangibles, net | 278.8 | | | 336.1 | |
| Deferred income taxes | 117.9 | | | 11.6 | |
Restricted investment, net of allowance of $0.2 million - 2024 and $0.2 million - 2023 | 81.6 | | | 79.1 | |
| Strategic investments | 87.3 | | | 99.2 | |
| Other assets | 79.3 | | | 81.9 | |
| Total Assets | $ | 2,022.6 | | | $ | 2,623.3 | |
| Liabilities | | | |
| Accounts payable | $ | 94.5 | | | $ | 158.4 | |
| Accrued expenses | 58.1 | | | 72.3 | |
| Accrued payroll and employee benefits | 27.7 | | | 19.9 | |
| Current operating lease liabilities | 16.9 | | | 18.7 | |
| Notes payable and current maturities of long-term debt | 61.3 | | | 84.4 | |
| Income taxes payable | 5.6 | | | 9.2 | |
| Current liabilities | 264.1 | | | 362.9 | |
| Long-term debt including finance lease obligations | 1,339.7 | | | 1,382.8 | |
| Noncurrent operating lease liabilities | 36.8 | | | 48.6 | |
| Deferred income taxes | 56.2 | | | 70.9 | |
| Other liabilities | 130.6 | | | 126.7 | |
| Total Liabilities | 1,827.4 | | | 1,991.9 | |
Commitments and contingencies (Note 18) | | | |
| Equity | | | |
Preferred stock (par value $0.01 per share; 50,000,000 shares authorized; zero issued and outstanding at 2024 and 2023) | — | | | — | |
Common stock (par value $0.01 per share; 300,000,000 shares authorized; 43,630,211 and 43,446,513 issued and 36,350,425 and 36,233,092 outstanding at 2024 and 2023, respectively) | 0.4 | | | 0.4 | |
| Additional paid-in capital | 176.8 | | | 164.9 | |
| Retained earnings | 572.0 | | | 1,002.3 | |
| Accumulated other comprehensive income (loss) | (41.4) | | | (26.7) | |
Treasury stock, common stock, at cost (7,279,786 shares - 2024 and 7,213,421 shares - 2023) | (512.6) | | | (509.5) | |
| | | |
| | | |
| Total Equity | 195.2 | | | 631.4 | |
| Total Liabilities and Equity | $ | 2,022.6 | | | $ | 2,623.3 | |
The accompanying notes are an integral part of these financial statements.
INGEVITY CORPORATION
Consolidated Statements of Stockholders' Equity
| | | | | | | | | | | | | | | | | | | | | | | | | | | | | | | | | | | | | | | | | | | |
| Ingevity Stockholders' | | |
| Common Stock | | | | | | | | | | | | |
| In millions, shares in thousands | Shares | | Amount | | | | Additional paid-in capital | | Retained earnings | | Accumulated other comprehensive income (loss) | | Treasury stock | | Total Equity |
| | | | | | | | | | | | | | | |
| Balance at December 31, 2021 | 43,102.0 | | | $ | 0.4 | | | | | $ | 136.3 | | | $ | 796.1 | | | $ | 13.1 | | | $ | (272.1) | | | $ | 673.8 | |
| Net income (loss) | — | | | — | | | | | — | | | 211.6 | | | — | | | — | | | 211.6 | |
| Other comprehensive income (loss) | — | | | — | | | | | — | | | — | | | (59.9) | | | — | | | (59.9) | |
| Common stock issued | 82.9 | | | — | | | | | — | | | — | | | — | | | — | | | — | |
| Exercise of stock options, net | 43.2 | | | — | | | | | 1.6 | | | — | | | — | | | — | | | 1.6 | |
| Tax payments related to vested restricted stock units | — | | | — | | | | | — | | | — | | | — | | | (2.2) | | | (2.2) | |
| Share repurchase program | — | | | — | | | | | — | | | — | | | — | | | (145.2) | | | (145.2) | |
| | | | | | | | | | | | | | | |
| Share-based compensation plans | — | | | — | | | | | 15.1 | | | — | | | — | | | 3.5 | | | 18.6 | |
| | | | | | | | | | | | | | | |
| | | | | | | | | | | | | | | |
| Balance at December 31, 2022 | 43,228.1 | | | $ | 0.4 | | | | | $ | 153.0 | | | $ | 1,007.7 | | | $ | (46.8) | | | $ | (416.0) | | | $ | 698.3 | |
| Net income (loss) | — | | | — | | | | | — | | | (5.4) | | | — | | | — | | | (5.4) | |
| Other comprehensive income (loss) | — | | | — | | | | | — | | | — | | | 20.1 | | | — | | | 20.1 | |
| Common stock issued | 177.2 | | | — | | | | | — | | | — | | | — | | | — | | | — | |
| Exercise of stock options, net | 41.2 | | | — | | | | | 2.2 | | | — | | | — | | | — | | | 2.2 | |
| Tax payments related to vested restricted stock units | — | | | — | | | | | — | | | — | | | — | | | (4.9) | | | (4.9) | |
| Share repurchase program | — | | | — | | | | | — | | | — | | | — | | | (92.1) | | | (92.1) | |
| Share-based compensation plans | — | | | — | | | | | 9.7 | | | — | | | — | | | 3.5 | | | 13.2 | |
| Balance at December 31, 2023 | 43,446.5 | | | $ | 0.4 | | | | | $ | 164.9 | | | $ | 1,002.3 | | | $ | (26.7) | | | $ | (509.5) | | | $ | 631.4 | |
| Net income (loss) | — | | | — | | | | | — | | | (430.3) | | | — | | | — | | | (430.3) | |
| Other comprehensive income (loss) | — | | | — | | | | | — | | | — | | | (14.7) | | | — | | | (14.7) | |
| Common stock issued | 183.7 | | | — | | | | | — | | | — | | | — | | | — | | | — | |
| | | | | | | | | | | | | | | |
| Tax payments related to vested restricted stock units | — | | | — | | | | | — | | | — | | | — | | | (3.1) | | | (3.1) | |
| | | | | | | | | | | | | | | |
| | | | | | | | | | | | | | | |
| Share-based compensation plans | — | | | — | | | | | 11.9 | | | — | | | — | | | — | | | 11.9 | |
| | | | | | | | | | | | | | | |
| | | | | | | | | | | | | | | |
| Balance at December 31, 2024 | 43,630.2 | | | $ | 0.4 | | | | | $ | 176.8 | | | $ | 572.0 | | | $ | (41.4) | | | $ | (512.6) | | | $ | 195.2 | |
The accompanying notes are an integral part of these financial statements.
INGEVITY CORPORATION
Consolidated Statements of Cash Flows | | | | | | | | | | | | | | | | | |
| Years Ended December 31, |
| In millions | 2024 | | 2023 | | 2022 |
| Cash provided by (used in) operating activities: | | | | | |
| Net income (loss) | $ | (430.3) | | | $ | (5.4) | | | $ | 211.6 | |
| Adjustments to reconcile net income (loss) to cash provided by operating activities: | | | | | |
| Depreciation and amortization | 108.3 | | | 122.8 | | | 108.8 | |
| Non cash operating lease costs | 19.1 | | | 18.6 | | | 16.1 | |
| Deferred income taxes | (121.4) | | | (44.7) | | | (5.0) | |
| Disposal/impairment of assets | 1.3 | | | 4.3 | | | 2.5 | |
| Restructuring and other (income) charges, net | 186.2 | | | 170.2 | | | 13.8 | |
| CTO resales | 52.7 | | | 22.0 | | | — | |
| LIFO reserve | (18.7) | | | 72.9 | | | 10.0 | |
| Share-based compensation | 11.9 | | | 10.6 | | | 16.1 | |
| (Gain) loss on strategic investment | 11.4 | | | (19.3) | | | — | |
| Pension and other postretirement benefit costs | 1.5 | | | 1.6 | | | 1.4 | |
| Goodwill impairment charge | 349.1 | | | — | | | — | |
| Other non-cash items | 17.0 | | | 36.2 | | | 18.4 | |
| Changes in operating assets and liabilities, net of effect of acquisitions: | | | | | |
| Accounts receivable, net | 38.2 | | | 42.7 | | | (42.1) | |
| Inventories, net | 86.2 | | | (75.6) | | | (63.7) | |
| Prepaid and other current assets | 7.7 | | | (28.6) | | | (0.8) | |
| Planned major maintenance outage | (6.5) | | | (12.8) | | | (9.1) | |
| Accounts payable | (63.4) | | | (14.6) | | | 42.7 | |
| Accrued expenses | (1.0) | | | (7.7) | | | 0.8 | |
| Accrued payroll and employee benefits | 8.0 | | | (33.5) | | | 5.4 | |
| Income taxes | (13.8) | | | 6.4 | | | 4.9 | |
| | | | | |
| Operating leases | (21.7) | | | (22.5) | | | (18.8) | |
| | | | | |
| Restructuring and other spending | (59.3) | | | (44.0) | | | (13.8) | |
| CTO resales | (46.1) | | | (10.6) | | | — | |
| Changes in all other operating assets and liabilities, net | 12.2 | | | 16.1 | | | 14.2 | |
| Net cash provided by (used in) operating activities | $ | 128.6 | | | $ | 205.1 | | | $ | 313.4 | |
| Cash provided by (used in) investing activities: | | | | | |
| Capital expenditures | (77.6) | | | (109.8) | | | (142.5) | |
| Payments for acquired businesses, net of cash acquired | — | | | — | | | (344.5) | |
| | | | | |
| | | | | |
| | | | | |
| Proceeds from sale of strategic investment | — | | | 31.5 | | | — | |
| Net investment hedge settlement | — | | | — | | | 14.7 | |
| Purchase of strategic investments | (0.3) | | | (2.4) | | | (77.4) | |
| | | | | |
| | | | | |
| Other investing activities, net | (1.6) | | | 3.4 | | | (2.2) | |
| Net cash provided by (used in) investing activities | $ | (79.5) | | | $ | (77.3) | | | $ | (551.9) | |
The accompanying notes are an integral part of these financial statements.
INGEVITY CORPORATION
Consolidated Statements of Cash Flows (continued) | | | | | | | | | | | | | | | | | |
| Years Ended December 31, |
| In millions | 2024 | | 2023 | | 2022 |
| Cash provided by (used in) financing activities: | | | | | |
| Proceeds from revolving credit facility and other borrowings | 404.5 | | | 376.3 | | | 1,164.7 | |
| | | | | |
| Payments on revolving credit facility and other borrowings | (470.6) | | | (382.9) | | | (336.7) | |
| Payments on long-term borrowings | — | | | — | | | (628.1) | |
| Debt issuance costs | — | | | (0.4) | | | (3.0) | |
| Debt repayment costs | — | | | — | | | (3.8) | |
| Financing lease obligations, net | (1.0) | | | (0.7) | | | (0.9) | |
| | | | | |
| Tax payments related to withholdings on vested equity awards | (3.1) | | | (4.8) | | | (2.2) | |
| Proceeds and withholdings from share-based compensation plans, net | — | | | 4.7 | | | 4.1 | |
| Repurchases of common stock under publicly announced plan | — | | | (92.1) | | | (145.2) | |
| | | | | |
| | | | | |
| Other financing activities, net | — | | | — | | | (0.8) | |
| Net cash provided by (used in) financing activities | $ | (70.2) | | | $ | (99.9) | | | $ | 48.1 | |
| Increase (decrease) in cash, cash equivalents, and restricted cash | (21.1) | | | 27.9 | | | (190.4) | |
| Effect of exchange rate changes on cash | (4.2) | | | (0.3) | | | (6.0) | |
| Change in cash, cash equivalents, and restricted cash | (25.3) | | | 27.6 | | | (196.4) | |
| Cash, cash equivalents, and restricted cash at beginning of period | 111.9 | | | 84.3 | | | 280.7 | |
Cash, cash equivalents, and restricted cash at end of period (1) | $ | 86.6 | | | $ | 111.9 | | | $ | 84.3 | |
| _______________ |
| (1) Includes restricted cash of $18.6 million, $16.0 million, and $7.6 million and cash and cash equivalents of $68.0 million, $95.9 million, and $76.7 million for the years ended December 31, 2024, 2023, and 2022, respectively. Restricted cash is included within "Prepaid and other current assets" and "Restricted investment" within the consolidated balance sheets. |
| | | | | |
| Supplemental cash flow information: | | | | | |
| Cash paid for interest, net of capitalized interest | $ | 85.4 | | | $ | 82.7 | | | $ | 54.8 | |
| Cash paid for income taxes, net of refunds | 26.9 | | | 29.7 | | | 54.8 | |
| Purchases of property, plant, and equipment in accounts payable | 2.4 | | | 2.8 | | | 4.9 | |
| Leased assets obtained in exchange for new finance lease liabilities | — | | | 0.2 | | | — | |
| Leased assets obtained in exchange for new operating lease liabilities | 6.0 | | | 29.1 | | | 23.7 | |
The accompanying notes are an integral part of these financial statements.
Ingevity Corporation
Notes to the Consolidated Financial Statements
December 31, 2024
| | | | | | | | | | | |
| INDEX |
| Note | | Page No. |
| 1 | | |
| 2 | | |
| 3 | | |
| 4 | | |
| 5 | | |
| 6 | | |
| 7 | | |
| 8 | | |
| 9 | | |
| 10 | | |
| 11 | | |
| 12 | | |
| 13 | | |
| 14 | | |
| 15 | | |
| 16 | | |
| 17 | | |
| 18 | | |
| 19 | | |
| 20 | | |
| 21 | | |
| | |
Ingevity Corporation
Notes to the Consolidated Financial Statements
December 31, 2024
Note 1: Background
Description of Business
Ingevity Corporation ("Ingevity," "the Company," "we," "us," or "our") provides products and technologies that purify, protect, and enhance the world around us. Through a diverse team of talented and experienced people, we develop, manufacture, and bring to market solutions that are largely renewably sourced and help customers solve complex problems while making the world more sustainable. Our products are used in a variety of demanding applications, including adhesives, agrochemicals, asphalt paving, bioplastics, coatings, elastomers, lubricants, paint for road markings, oil drilling, and automotive components. We operate in three reportable segments: Performance Materials, Performance Chemicals and Advanced Polymer Technologies.
Our Performance Materials segment manufactures products in the form of powder, granular, extruded pellets, extruded honeycombs, and activated carbon sheets. Performance Materials engineers, manufactures, and sells hardwood-based, chemically activated carbon products which are produced through a highly technical and specialized process primarily for use in gasoline vapor emission control systems in internal combustion engines and hybrid electric vehicles including cars, trucks, motorcycles, and boats. To maximize the productivity of our manufacturing assets, we also produce several other activated carbon products for food, water, beverage, and chemical purification applications.
Our Performance Chemicals segment consists of our road technologies and industrial specialties product lines. Performance Chemicals products serve as critical inputs used in a variety of high-performance applications, including pavement construction, pavement preservation, pavement reconstruction and recycling, and paint for road markings (road technologies product line), as well as agrochemical dispersants, lubricants, certain adhesives, rubber, and other diverse industrial uses (industrial specialties product line).
Our Advanced Polymer Technologies segment produces caprolactone and caprolactone-based specialty polymers for use in coatings, resins, elastomers, adhesives, bioplastics, and medical devices.
Basis of Consolidation and Presentation
The accompanying Consolidated Financial Statements of Ingevity were prepared in accordance with accounting principles generally accepted in the United States of America (“U.S. GAAP”). The significant accounting policies described in Note 2, together with the other notes that follow, are an integral part of the Consolidated Financial Statements. The Consolidated Financial Statements include the accounts of Ingevity and subsidiaries in which a controlling interest is maintained.
Note 2: Summary of Significant Accounting Policies
Estimates and assumptions: We are required to make estimates and assumptions that affect the reported amounts of assets and liabilities and disclosures of contingent assets and liabilities at the date of the financial statements and the reported amounts of revenue and expenses during the reporting period. Our estimates are based on historical experiences, facts, and circumstances available at the time and various other assumptions that we believe are reasonable. Actual results may differ from those estimates.
Cash equivalents: Highly liquid securities with an original maturity of three months or less are considered cash equivalents.
Accounts receivable, net of allowance: Accounts receivable, net on the consolidated balance sheets are comprised of trade receivables less allowances for doubtful accounts and credit losses (herein referred to as "credit losses"). Trade receivables consist of amounts owed to Ingevity from customer sales and are recorded at the invoiced amounts when revenue is recognized and generally do not bear interest. The allowance for credit losses is our best estimate of the amount of probable loss in the existing accounts receivable. We determine the allowance based on our expected future credit losses, which is partly based on historical write-off experience, current collection trends, and external business factors such as economic factors, including regional bankruptcy rates and political factors. Past-due balances over a specified amount are reviewed individually for collectability. Account balances are charged off against the allowance when it is probable that the receivable will not be recovered. Allowance for credit losses at December 31, 2024 and 2023, were $0.6 million and $1.1 million, respectively.
Concentration of credit risk: The financial instruments that potentially subject Ingevity to concentrations of credit risk are accounts receivable. We limit our credit risk by performing ongoing credit evaluations and, when necessary, requiring
Ingevity Corporation
Notes to the Consolidated Financial Statements
December 31, 2024
letters of credit, guarantees, or collateral. Our largest customer as of December 31, 2024 had accounts receivable of $8.3 million and $7.5 million as of December 31, 2024 and 2023, respectively. Sales to our largest customer were approximately six percent of total Net sales for the year ended December 31, 2024, and four percent of total Net sales for the years ended December 31, 2023, and 2022, respectively. Sales to the automotive industry, which represents our largest industry concentration, were approximately 40 percent of our consolidated Net sales. No customers individually accounted for greater than 10 percent of Ingevity's consolidated Net sales.
Inventories, net: We value our U.S. inventories at the lower of cost or market, with cost for the majority of our U.S. inventories determined using the last-in first-out (“LIFO”) basis. We value all other inventories at the lower of cost and net realizable value, with cost determined using methods that approximate cost computed on a first-in first-out inventory valuation (“FIFO”) basis. Elements of cost in inventories include raw materials, direct labor, and manufacturing overhead. We routinely assess inventory for both potential obsolescence and potential declines in anticipated selling prices to derive a market value for the inventory on hand. This review also includes an analysis of potentially obsolete, unmarketable, slow-moving, or overvalued inventory. If necessary, we will impair any inventories by an amount equal to the difference between the value of the held inventory (i.e., cost) and its estimated net realizable value for FIFO and average cost inventories and market value for LIFO inventories.
Property, plant, and equipment: Owned assets are recorded at cost. Also included in the cost of these assets is interest on funds borrowed during the construction period. When assets are sold, retired or disposed of, their cost and related accumulated depreciation are removed from the consolidated balance sheet, and any resulting gain or loss is reflected within the consolidated statement of operations. Repair and maintenance costs that materially add to the value of the asset or prolong its useful life are capitalized and depreciated based on the extension of the useful life.
Repair and maintenance costs: We expense routine repair and maintenance costs as we incur them. We defer expenses incurred during planned major maintenance activities and record these amounts to Prepaid and other current assets on our consolidated balance sheets. Deferred amounts are recognized as expense ratably over the shorter of the estimated interval until the next major maintenance activity or the life of the deferred item. The cash outflows related to these costs are included in operating activities within the consolidated statement of cash flows. The timing of this maintenance can vary by manufacturing plant and has a significant impact on our results of operations in the period performed primarily due to lost production during the maintenance period.
Depreciation: The cost of property, plant, and equipment is depreciated, utilizing the straight-line method, over the estimated useful lives of the assets, the majority of which range from 20 to 40 years for buildings and leasehold improvements and 5 to 30 years for machinery and equipment. The following table provides details on the useful lives and proportion of our machinery and equipment (“M&E”) in each useful life category.
| | | | | | | | | | | | | | |
Percent of
M&E Cost | | Depreciable Life in Years | | Types of Assets |
| 27 | | 5 to 10 | | Production control system equipment and hardware, laboratory testing equipment |
| 13 | | 15 | | Control systems, instrumentation, metering equipment |
| 37 | | 20 | | Production vessels and kilns, storage tanks, piping |
| 6 | | 25 to 30 | | Blending equipment, storage tanks, piping, shipping equipment and platforms, safety equipment |
| 2 | | 40 | | Machinery & equipment support structures and foundations |
| 15 | | Various | | Various |
Leases: We lease various assets for use in our operations that are classified as both operating and financing leases. At contract inception, we determine that a lease exists if the contract conveys the right to control an identified asset for a period of time in exchange for consideration. Control is considered to exist when the lessee has the right to obtain substantially all of the economic benefits from the use of an identified asset as well as the right to direct the use of that asset. If a contract is considered to be a lease, we recognize a lease liability based on the present value of the future lease payments, with an offsetting entry to recognize a right-of-use asset. As a majority of our leases do not provide an explicit rate within the lease, an incremental borrowing rate is used, which is based on information available at the commencement date. The determination of the incremental borrowing rate for each individual lease was impacted by the following assumptions: lease term, currency, and the economic environment for the physical location of the leased asset.
Ingevity Corporation
Notes to the Consolidated Financial Statements
December 31, 2024
Our operating leases principally relate to the following leased asset classes:
| | | | | | | | |
| Leased Asset Class | | Remaining Lease Term |
| Administrative offices | | 2 to 15 years |
| Manufacturing buildings | | 4 to 50 years |
| Manufacturing and office equipment | | 1 to 11 years |
| Warehousing and storage facilities | | 3 to 10 years |
| | |
| Rail cars | | 0 to 10 years |
Leases with an initial term of 12 months or less are not recorded on the consolidated balance sheets. Lease expense is recognized on a straight-line basis over the expected lease term. Some of our leases include options to extend the lease term at our sole discretion. We account for lease and non-lease components together as a single component for all lease asset classes. The depreciable life of assets and leasehold improvements is limited by the expected lease term unless there is a transfer of title or purchase option reasonably certain of exercise. Certain leases provide for escalation of the lease payments, as well as maintenance costs and taxes increase.
Asset retirement obligations: We record asset retirement obligations (“AROs”) at fair value at the time the liability is incurred if we can reasonably estimate the settlement date. The associated AROs are capitalized as part of the carrying amount of related long-lived assets. In future periods, the liability is accreted to its present value and the capitalized cost is depreciated over the useful life of the related asset. We also adjust the liability for changes resulting from the passage of time and/or revisions to the timing or the amount of the original estimate. Upon the retirement of the long-lived asset, we either settle the obligation for its recorded amount or incur a gain or loss. The carrying amounts for the AROs for the years ended December 31, 2024 and 2023 are $16.3 million and $12.9 million, respectively, and are included in Accrued expenses and Other liabilities on the consolidated balance sheets.
Impairment of long-lived assets: We periodically evaluate whether current events or circumstances indicate that the carrying value of our long-lived assets, including intangible assets, to be held and used may not be recoverable. If such circumstances are determined to exist, an estimate of undiscounted future cash flows produced by the long-lived asset, or the appropriate grouping of assets, is compared to carrying value to determine whether impairment exists.
If an asset is determined to be impaired, the loss is measured based on quoted market prices in active markets, if available. If quoted market prices are not available, the estimate of fair value is based on various valuation techniques, including a discounted value of estimated future cash flows. We report an asset to be disposed of at the lower of its carrying value or its estimated net realizable value.
Goodwill and other intangible assets: Goodwill represents the excess of cost of an acquired business over the fair value of the identifiable tangible and intangible assets acquired and liabilities assumed in a business combination. We conduct a required annual review of goodwill for potential impairment at October 1, or sooner if events or changes in circumstances indicate that the fair value of a reporting unit is below its carrying value. Our reporting units are our operating segments, i.e., Performance Materials, Performance Chemicals, and Advanced Polymer Technologies. If the carrying value of a reporting unit that includes goodwill exceeds its fair value, which is determined using both the income approach and market approach, goodwill is considered impaired. The income approach determines fair value based on discounted cash flow model derived from a reporting unit’s long-term forecasted cash flows. The market approach determines fair value based on the application of earnings multiples of comparable companies to projected earnings of the reporting unit. The amount of impairment loss is measured as the difference between the carrying value and the fair value of a reporting unit but is limited to the total amount of goodwill allocated to the reporting unit. In performing the fair value analysis, management makes various judgments, estimates and assumptions, the most significant of which are the assumptions related to revenue growth rates, Earnings before Interest, Taxes, Depreciation and Amortization ("EBITDA") margin, and discount rate.
The factors we considered in developing our estimates and projections for cash flows include, but are not limited to, the following: (i) macroeconomic conditions; (ii) industry and market considerations; (iii) costs, such as increases in raw materials, labor, or other costs; (iv) our overall financial performance; and (v) other relevant entity-specific events that impact our reporting units.
Ingevity Corporation
Notes to the Consolidated Financial Statements
December 31, 2024
The determination of whether goodwill is impaired involves a significant level of judgment in the assumptions underlying the approach used to determine the estimated fair values of our reporting units. We believe that the estimates and assumptions used in our impairment assessment are reasonable; however, these assumptions are judgmental and variations in any assumptions could result in materially different calculations of fair value. We will continue to evaluate goodwill on an annual basis as of October 1, and whenever events or changes in circumstances, such as significant adverse changes in operating results, market conditions, or changes in management’s business strategy indicate that there may be a probable indicator of impairment. It is possible that the assumptions used by management related to the evaluation may change or that actual results may vary significantly from management’s estimates.
Other intangible assets are comprised of finite-lived intangible assets consisting primarily of brands (representing trademarks, trade names and know-how), customer contracts and relationships, and developed technology. Other intangible assets are amortized over their estimated useful lives which range from 3 to 20 years. Any potential impairment for definite-lived intangible assets will be calculated in the same manner as disclosed under impairment of property, plant, and equipment. Customer relationships are amortized in a manner that reflects the pattern in which the economic benefits of the intangible asset are consumed.
Capitalized software: Capitalized software for internal use is included within Other assets on the consolidated balance sheets. Amounts capitalized are presented in Capital expenditures on our consolidated statements of cash flow. Capitalized software is amortized using the straight-line over the estimated useful lives ranging from 3 to 15 years. Amortization is recorded to Costs of sales on our consolidated statements of operations for software directly used in the production of inventory and Selling, general, and administrative expenses on our consolidated statements of operations for software used for non-production related activities.
Strategic investments: We have a variety of strategic investments that are classified as long-term assets on the consolidated balance sheets. Our strategic investments are accounted for under either the equity method of accounting or the measurement alternative, where fair value is not readily determinable. We use the equity method of accounting for investments that we do not control, but for which we have the ability to exercise significant influence.
For strategic investments that are accounted for under the equity method of accounting, our initial investment is recorded at cost. Subsequently, the carrying value for these investments will be impacted by our proportionate share of undistributed earnings or loss, distributions, amortization or accretion of basis differences, and other-than-temporary impairments. Subsequent adjustments to our initial investment are recorded within Other (income) expense, net on the consolidated statement of operations.
Strategic investments accounted for under the measurement alternative, where fair value is not readily determinable, are accounted for at cost. Adjustments for observable changes in prices or impairments are recognized in Other (income) expense, net in our consolidated statements of operations.
At each reporting period, we evaluate each investment to determine whether events or changes in business circumstances indicate that the carrying value of the investment may not be fully recoverable.
Legal liabilities: We recognize a liability for legal contingencies when a loss is probable and reasonably estimable. Third-party fees for legal services are expensed as incurred. If only a range of estimated losses can be determined, we accrue an amount that reflects the most likely outcome; if none of the estimates within that range is a better estimate than any other amount, we accrue the low end of the range. If an unfavorable outcome is reasonably possible but not probable, we will disclose an estimate of the reasonably possible loss or range of loss. If we cannot estimate the loss or range of losses arising from a legal proceeding, we will disclose that an estimate cannot be made. In assessing the materiality of a legal proceeding, we evaluate, among other factors, the amount of monetary damages claimed, as well as the potential impact of non-monetary remedies sought by plaintiffs that may require us to change our business practices in a manner that could have a material adverse impact on our business.
Revenue recognition: Our revenue is derived from contracts with customers, and substantially all our revenue is recognized when products are either shipped from our manufacturing and warehousing facilities or delivered to the customer. Revenue, net of returns and customer incentives, is based on the sale of manufactured products. Revenues are recognized when performance obligations under the terms of a contract with our customer are satisfied; generally, this occurs with the transfer of control of our products. For certain limited contracts, where we are producing goods with no alternative use and for which we have an enforceable right to payment for performance completed to date, we are recognizing revenue as goods are
Ingevity Corporation
Notes to the Consolidated Financial Statements
December 31, 2024
manufactured, rather than when they are shipped. Revenues are presented as Net sales on the consolidated statements of operations.
Since Net sales are derived from product sales only, we have disaggregated our Net sales by our product lines within each reportable segment. Net sales are measured as the amount of consideration we expect to receive in exchange for transferring goods. Sales, value add, and other taxes we collect concurrent with revenue-producing activities are excluded from revenue. Sales returns and allowances are not a normal practice in the industry and are not significant. Certain customers may receive cash-based incentives, including discounts and volume rebates, which are accounted for as variable consideration and included within Net sales. Shipping and handling fees billed to customers are included within Net sales. If we pay for the freight and shipping, we recognize the cost when control of the product has transferred to the customer as an expense within Cost of sales on the consolidated statements of operations. Payment terms with our customers are typically in the range of zero to sixty days. Because the period between when we transfer a promised good to a customer and when the customer pays for that good will be one year or less, we elect not to adjust the promised amount of consideration for the effects of any financing component, as it is not significant.
Cost of sales: Costs primarily consist of the cost of inventory sold and other production related costs. These costs include raw materials, direct labor, manufacturing overhead, packaging costs, and maintenance costs. Shipping and handling costs are recorded within Cost of sales on the consolidated statements of operations.
Royalty expense: We have licensing agreements with third parties requiring us to pay royalties for certain technologies we use in the manufacturing of our products. Royalty expense is recognized as incurred and recorded within Cost of sales on the consolidated statements of operations.
Selling, general, and administrative expenses: Costs are expensed as incurred and primarily include employee compensation costs related to sales and office personnel, office expenses, and other expenses not directly related to our manufacturing operations. Costs also include advertising and promotional costs.
Research and technical expenses: Costs are expensed as incurred and primarily include employee compensation, technical equipment costs, material testing, and innovation-related expenses.
Restructuring and other (income) charges, net: We regularly perform strategic reviews and assess the return on our operations, which sometimes results in a plan to restructure the business. The cost and benefit of these strategic restructuring initiatives are recorded within Restructuring and other (income) charges, net on the consolidated statement of operations. These costs are excluded from our operating segment results.
We record an accrual for severance and other costs under the provisions of the relevant accounting guidance. Additionally, in some restructuring plans, write-downs of long-lived assets may occur. Two types of assets are impacted: assets to be disposed of by sale and assets to be abandoned. Assets to be disposed of by sale are measured at the lower of carrying amount or estimated net proceeds from the sale. Assets to be abandoned with no remaining future service potential are written down to amounts expected to be recovered. The useful lives of assets to be abandoned that have a remaining future service potential are adjusted and depreciation is recorded over the adjusted useful life.
Non-operating income and expense: Non-operating income and expenses are included within Other (income) expense, net on the consolidated statement of operations. Included within Other (income) expense, net, among other items, are gains and losses associated with crude tall oil ("CTO") resales and CTO supply contract termination charges. As further described in Note 15, due to the actions taken and the corresponding reduced CTO refining capacity, we were obligated, under an existing CTO supply contract, to purchase CTO volumes through 2025 at amounts in excess of required CTO volumes. To manage this excess inventory, we sold CTO volumes (herein referred to as "CTO resales") in the open market.
Our Performance Chemicals reportable segment is in the business of producing, primarily from CTO-based feedstocks, derivative specialty chemicals for sale to third-party customers. As a result of the Performance Chemicals repositioning, we sold excess CTO volumes, which is outside of the ordinary course of business, that is, not a normal ongoing part of our operations and not core to our business. The excess CTO volumes, calculated as the volume directly attributable to reduced CTO refining capacity as defined under the contractual terms of the CTO supply contract, on hand at period end will be valued at the lower of cost or expected selling price, less costs to sell. Volumes on hand at period end and any pending CTO resale receivables will be recorded to Other current assets on the consolidated balance sheets. Any payables associated with the purchases of the excess CTO volumes will be recorded to Accrued expenses on the consolidated balance sheets. We will
Ingevity Corporation
Notes to the Consolidated Financial Statements
December 31, 2024
recognize the net gains or losses associated with the CTO resale activities within Other (income) expenses, net on the consolidated statement of operations.
On July 1, 2024, we terminated our last long-term CTO supply contract. As a result of the termination, the purchases under the CTO supply contract ended effective June 30, 2024. The CTO resale activity described above ended in 2024 and no excess CTO volumes were on hand at December 31, 2024.
Income taxes: We are subject to income taxes in the U.S. and numerous foreign jurisdictions, including China and the United Kingdom ("UK"). The provision for income taxes includes income taxes paid, currently payable or receivable, and deferred taxes. We follow the asset and liability method of accounting for income taxes in accordance with current accounting standards regarding the accounting for income taxes. Under this method, deferred income taxes are recognized based on the temporary differences between the financial reporting and tax bases of assets and liabilities, and are measured using the enacted tax rates and laws in effect at the time the underlying assets or liabilities are recovered or settled. The ability to realize deferred tax assets is evaluated through the forecasting of taxable income, historical and projected future operating results, the reversal of existing temporary differences, and the availability of tax planning strategies. Valuation allowances are recognized to reduce deferred tax assets when it is more-likely-than-not that a tax benefit will not be realized. We do not provide income taxes on undistributed earnings of consolidated foreign subsidiaries, as it is our intention that such earnings will remain invested in those companies.
We recognize income tax positions that are more-likely-than-not to be realized and accrue interest related to unrecognized income tax positions, which is included as a component of the income tax provision, on the consolidated statements of operations.
Earnings per Share: Basic earnings (loss) per share is computed by dividing net income (loss) for the period by the weighted average number of common shares outstanding during the period. Diluted earnings (loss) per share reflects the dilution that could occur if the outstanding stock-based compensation awards, including any unvested awards, were vested and exercised, resulting in the issuance of common stock as determined under the treasury stock method. Diluted earnings (loss) per share is computed by dividing net income (loss) for the period by the weighted average number of shares of common stock and potentially dilutive common stock outstanding for the period. The calculation of diluted net income per share excludes all anti-dilutive common shares. In periods where we incur a net loss, stock-based compensation awards are excluded from the calculation of earnings per share as their inclusion would have an anti-dilutive effect.
Pension and postretirement benefits: We provide both qualified and non-qualified pension and postretirement benefit plans to our employees. The expense related to the current employees, as well as the expense related to retirees, are included within the Consolidated Financial Statements. The costs (or benefits) and obligations related to these benefits reflect key assumptions related to general economic conditions, including interest (discount) rates, healthcare cost trend rates, and expected return on plan assets. The costs (or benefits) and obligations for these benefit programs are also affected by other assumptions, such as average retirement age, mortality rates, employee turnover, and plan participation. To the extent our plans' actual experience, as influenced by changing economic and financial market conditions or by changes to our own plans' demographics, differs from these assumptions, the costs and obligations for providing these benefits, as well as the plans' funding requirements, could increase or decrease. When actual results differ from our assumptions, the difference is typically recognized over future periods. In addition, the unrealized gains and losses related to our pension and postretirement benefit obligations may also affect periodic benefit costs (or benefits) in future periods.
Share-based compensation: We recognize compensation expense within our Consolidated Financial Statements for all share-based compensation arrangements. Share-based compensation cost is measured at the date of grant, based on the fair value of the award, and expense is recognized over the grantee's requisite service period; forfeitures are recognized as they occur. We calculate the fair value of our stock options using the Black-Scholes option pricing model. The fair value of restricted stock units ("RSUs"), non-employee director deferred stock units ("DSUs"), and performance-based restricted stock units ("PSUs") is determined using our closing stock price on the date of the grant. Beginning in 2023, certain granted PSUs include a market condition, relative total shareholder return ("rTSR"), which requires that the fair value of the award be calculated using a Monte Carlo simulation. Substantially all compensation expense related to share-based awards is recorded as a component of Selling, general and administrative expenses within the consolidated statements of operations.
Operating segments: Our operating segments are Performance Materials, Performance Chemicals, and Advanced Polymer Technologies. Our operating segments were determined based upon the nature of the products produced, the nature of
Ingevity Corporation
Notes to the Consolidated Financial Statements
December 31, 2024
the production process, the type of customer for the products, the similarity of economic characteristics, and the manner in which management reviews results. Our chief operating decision maker evaluates the business at the segment level when making decisions about allocating resources and assessing the performance of Ingevity as a whole.
Fair value measurements: We have categorized our assets and liabilities that are recorded at fair value, based on the priority of the inputs to the valuation technique, into a three-level fair value hierarchy. The fair value hierarchy gives the highest priority to quoted prices in active markets for identical assets or liabilities (Level 1) and the lowest priority to unobservable inputs (Level 3). If the inputs used to measure the assets and liabilities fall within different levels of the hierarchy, the categorization is based on the lowest level input that is significant to the fair value measurement of the instrument. The carrying value of our financial instruments: cash and cash equivalents, other receivables, other payables, and accrued liabilities, approximate their fair values due to the short-term nature of these financial instruments.
Derivative financial instruments: We are exposed to market risks, such as the impact of changes in interest rates on our floating rate debt, foreign currency exchange rates due to transactions denominated in a variety of foreign currencies, and commodity prices due to purchases of certain raw materials and inputs. Changes in these rates and prices may have an impact on our future cash flow and earnings. We formally document all relationships between the derivative financial instrument and the hedged item, as well as the risk management objective and strategy for undertaking various hedge transactions. We do not hold or issue derivative financial instruments for speculative or trading purposes. We enter into derivative financial instruments which are governed by policies, procedures, and internal processes set forth by our Board of Directors.
Our risk management program also addresses counterparty credit risk by selecting only major financial institutions with investment grade ratings. Once the derivative financial instrument is entered into, we continuously monitor the financial institutions’ credit ratings and our credit risk exposure held by the financial institution. When appropriate, we reallocate exposures across multiple financial institutions to limit credit risk. If a counterparty fails to fulfill its performance obligations under the derivative financial instrument, then Ingevity is exposed to credit risk equal to the fair value of the financial instrument. Derivative assets and liabilities are recorded on our consolidated balance sheets at fair value and are presented on a gross basis. Due to our proactive mitigation of these potential credit risks, we anticipate performance by our counterparties to these contracts, and therefore, no material loss is expected. In order to mitigate the impact of market risks, we have and may enter into both net investment hedges and cash flow hedges.
Cash flow hedges: Cash flow hedges are derivative financial instruments designated as and used to hedge the exposure to variability in expected future cash flows that are attributable to a particular risk. The derivative financial instruments that are designated and qualify as a cash flow hedge are recorded on the consolidated balance sheetsat fair value, and the changes in fair value of these hedging instruments are offset in part or in whole by corresponding changes in the anticipated cash flows of the underlying exposures being hedged. The gains and losses arising from qualifying hedging instruments are reported as a component of Accumulated other comprehensive income (loss) (“AOCI”) located within the consolidated balance sheets and reclassified into earnings in the same period or periods during which the hedged transaction affects earnings. The reclassification gains or losses of the hedge from AOCI are recorded in the same financial statement caption on the consolidated statements of operations as the hedged item. For example, designated cash flow hedges entered to minimize foreign currency exchange risk of forecasted revenue transactions are recorded to Net sales on the consolidated statements of operations when the forecasted transaction occurs. Designated commodity cash flow hedges gains or losses recorded in AOCI are recognized within Cost of sales on the consolidated statements of operations when the inventory is sold. Designated interest rate cash flow hedge gains or losses are recorded in Accumulated other comprehensive income (loss) AOCI and are recognized in Interest expense on the consolidated statements of operations on a straight-line basis over the remaining maturity of the underlying debt.
Net investment hedges: Net investment hedges are defined as derivative or non-derivative instruments, which are designated as and used to hedge the foreign currency exposure of the net investment in certain foreign operations. The net of the change in the hedge instrument and the item being hedged against for qualifying net investment hedges is reported as a component of the foreign currency adjustments ("CTA") within AOCI on the consolidated balance sheets. The gains (losses) on net investment hedges are reclassified to earnings only when the related CTA are required to be reclassified, usually upon the sale or liquidation of the investment.
Ingevity Corporation
Notes to the Consolidated Financial Statements
December 31, 2024
Treasury stock: We record shares of common stock repurchased at cost as treasury stock, resulting in a reduction of stockholders’ equity on the consolidated balance sheets. When the treasury shares are contributed under our employee benefit plans or issued for option exercises, we use a first-in, first-out (“FIFO”) method for determining cost. The difference between the cost of the shares and the market price at the time of contribution to an employee benefit plan is added to or deducted from Additional paid-in capital on the consolidated balance sheets.
Translation of foreign currencies: The local currency is the functional currency for all of our significant operations outside the U.S., consisting primarily of the euro, the Japanese yen, the pound sterling, and the Chinese renminbi. The assets and liabilities of our foreign subsidiaries are translated into U.S. dollars using period-end exchange rates, and adjustments resulting from these financial statement translations are reported as a component of CTA within AOCI on the consolidated balance sheets. Revenues and expenses are translated at average rates prevailing during each period.
Business combinations: Accounting for business combinations which requires, among other things, the acquiring entity in a business combination to recognize the fair value of the assets acquired and liabilities assumed; the recognition of acquisition-related costs within the consolidated results of operations; the recognition of restructuring costs within the consolidated results of operations for which the acquirer becomes obligated after the acquisition date; and contingent purchase consideration to be recognized at fair value on the acquisition date with subsequent adjustments recognized on the consolidated statement of operations. We generally use qualified third-party consultants to assist management in determining the fair value of assets acquired and liabilities assumed. This includes, when necessary, assistance with the determination of lives and valuation of tangible property, plant, and equipment and identifiable intangibles, assisting management in determining the fair value of obligations associated with employee-related liabilities, and assisting management in assessing obligations associated with legal and environmental claims. The purchase price allocation process allows us to refine these estimates over a measurement period not to exceed one year to reflect new information obtained surrounding facts and circumstances existing at the acquisition date.
The fair value assigned to identifiable intangible assets acquired is determined primarily by using an income approach, which is based on assumptions and estimates made by management. Significant assumptions utilized in the income approach are the attrition rate, revenue growth rates, EBITDA margins, royalty rates, and the discount rate. These assumptions are based on company-specific information and projections, which are not observable in the market and are therefore considered Level 2 and Level 3 measurements. The excess of the purchase price over the fair value of the identified assets and liabilities is recorded as goodwill. Based on the acquired business’ end markets and products, as well as how the chief operating decision maker will review the business results, determines the most appropriate operating segment for which to integrate the acquired business. Goodwill acquired, if any, is allocated to the reporting unit within or at the operating segment for which the acquired business will be integrated. Selection of the appropriate reporting unit is based on the level at which discrete financial information is available and reviewed by business management post-integration. Operating results of the acquired entity are reflected within the Consolidated Financial Statements from the date of acquisition.
Reclassifications: Certain prior year amounts have been reclassified to conform with the current year's presentation.
Note 3: New Accounting Guidance
The Financial Accounting Standards Board ("FASB") Accounting Standards Codification ("ASC" or "Codification") is the sole source of authoritative GAAP other than the U.S. Securities and Exchange Commission ("SEC") issued rules and regulations that apply only to SEC registrants. The FASB issues an Accounting Standards Update ("ASU") to communicate changes to the Codification. We consider the applicability and impact of all ASUs. ASUs not listed below were assessed and determined to be either not applicable or are not expected to have a material impact on the Consolidated Financial Statements.
Recently Issued Accounting Pronouncements
In November 2023, the FASB issued ASU 2023-07, “Segment Reporting: Improvements to Reportable Segment Disclosures,” which is intended to improve reportable segment disclosure requirements, primarily through enhanced disclosures about significant segment expenses. The purpose of the amendment is to provide readers of the financial statements with information to better understand an entity’s overall performance and assess potential future cash flows. We adopted this standard which is effective beginning with our 2024 fiscal year Form 10-K, and it has been applied to all prior periods presented in the Consolidated Financial Statements.
Ingevity Corporation
Notes to the Consolidated Financial Statements
December 31, 2024
In December 2023, the FASB issued ASU 2023-09, “Improvements to Income Tax Disclosures,” which is intended to enhance income tax disclosures around the rate reconciliation and income taxes paid. The purpose of the amendment is to provide readers of the financial statements with information to better assess the differences between the effective tax rate and the statutory tax rate across multiple jurisdictions, enabling them to understand tax implications around operational opportunities and potential future cash flows. The guidance is effective beginning with our 2025 fiscal year Consolidated Financial Statements. We are currently evaluating the potential impact of adopting this new guidance on our Consolidated Financial Statements and related disclosures.
In November 2024, the FASB issued ASU 2024-03, “Disaggregation of Income Statement Expenses,” which is intended to enhance disclosures regarding significant expenses. The purpose of the amendment is to provide readers of the financial statements with information to better understand an entity’s overall performance, assess potential future cash flows, and compare an entity's performance over time and with that of other entities. The guidance is effective beginning with our 2027 fiscal year Consolidated Financial Statements. We are currently evaluating the potential impact of adopting this new guidance on our Consolidated Financial Statements and related disclosures.
Note 4: Net Sales
Disaggregation of Net sales
The following table presents our Net sales disaggregated by reportable segment and product line.
| | | | | | | | | | | | | | | | | |
| Years Ended December 31, |
| In millions | 2024 | | 2023 | | 2022 |
| | | | | |
| | | | | |
| Performance Materials segment | $ | 609.6 | | | $ | 586.0 | | | $ | 548.5 | |
| | | | | |
| Road Technologies product line | 342.3 | | | 369.8 | | | 241.3 | |
Industrial Specialties product line (1) | 265.9 | | | 532.3 | | | 633.8 | |
| | | | | |
| Performance Chemicals segment | $ | 608.2 | | | $ | 902.1 | | | $ | 875.1 | |
| Advanced Polymer Technologies segment | $ | 188.6 | | | $ | 204.0 | | | $ | 244.7 | |
| Net sales | $ | 1,406.4 | | | $ | 1,692.1 | | | $ | 1,668.3 | |
|
|
_______________(1) The reduction in the industrial specialties product line from 2023 to 2024 was due to the repositioning action taken to improve the Performance Chemicals reportable segment, refer to Note 15 for more information.
The following table presents our Net sales disaggregated by geography, based on the delivery address of our customer. | | | | | | | | | | | | | | | | | |
| Years Ended December 31, |
| In millions | 2024 | | 2023 | | 2022 |
North America (1) | $ | 820.9 | | | $ | 1,069.5 | | | $ | 983.2 | |
Asia Pacific (1) | 346.0 | | | 364.0 | | | 398.7 | |
| Europe, Middle East, and Africa | 187.0 | | | 215.5 | | | 242.2 | |
| South America | 52.5 | | | 43.1 | | | 44.2 | |
| Net sales | $ | 1,406.4 | | | $ | 1,692.1 | | | $ | 1,668.3 | |
_______________
(1) Countries with Net sales in excess of 10 percent of consolidated Net sales for the years ended December 31, 2024, 2023, and 2022 are the U.S., which totaled $736.0 million, $972.1 million, and $897.1 million, respectively, and China, which totaled $184.3 million, $202.7 million, and $220.6 million, respectively.
Contract Balances
The contract assets primarily relate to our rights to consideration for products produced but not billed at the reporting date from contracts with certain customers. The contract assets are recognized as accounts receivables when we have an enforceable right to payment for performance completed to date and the customer has been billed. Contract liabilities represent obligations to transfer goods to a customer for which we have received consideration from our customer. For all periods presented, we had no contract liabilities.
Ingevity Corporation
Notes to the Consolidated Financial Statements
December 31, 2024
The following table provides information about contract assets from contracts with certain customers.
| | | | | | | | | | | | | |
| Year Ended December 31, | | |
| In millions | 2024 | | 2023 | | |
| Contract asset at beginning of period | $ | 11.2 | | | $ | 6.4 | | | |
| Additions | 15.3 | | | 18.1 | | | |
| Reclassification to accounts receivable, billed to customers | (20.0) | | | (13.3) | | | |
Contract asset at end of period (1) | $ | 6.5 | | | $ | 11.2 | | | |
| _______________ | | | | |
| (1) Included within "Prepaid and other current assets" on the consolidated balance sheets. | | |
Note 5: Fair Value Measurements
Recurring Fair Value Measurements
The following information is presented for assets and liabilities that are recorded on the consolidated balance sheets at fair value measured on a recurring basis. There were no transfers of assets and liabilities that are recorded at fair value between the three-level fair value hierarchy during the periods reported.
| | | | | | | | | | | | | | | | | | | | | | | |
| In millions | Level 1 (1) | | Level 2 (2) | | Level 3 (3) | | Total |
| December 31, 2024 | | | | | | | |
| Assets: | | | | | | | |
Deferred compensation plan investments (4) | $ | 3.7 | | | $ | — | | | $ | — | | | $ | 3.7 | |
| Total assets | $ | 3.7 | | | $ | — | | | $ | — | | | $ | 3.7 | |
| Liabilities: | | | | | | | |
Deferred compensation arrangement (4) | $ | 15.9 | | | $ | — | | | $ | — | | | $ | 15.9 | |
| | | | | | | |
| | | | | | | |
| Total liabilities | $ | 15.9 | | | $ | — | | | $ | — | | | $ | 15.9 | |
| | | | | | | | | | | | | | | | | | | | | | | |
| In millions | Level 1 (1) | | Level 2 (2) | | Level 3 (3) | | Total |
| December 31, 2023 | | | | | | | |
| Assets: | | | | | | | |
| | | | | | | |
Deferred compensation plan investments (4) | $ | 3.0 | | | $ | — | | | $ | — | | | $ | 3.0 | |
| Total assets | $ | 3.0 | | | $ | — | | | $ | — | | | $ | 3.0 | |
| Liabilities: | | | | | | | |
Deferred compensation arrangement (4) | $ | 15.5 | | | $ | — | | | $ | — | | | $ | 15.5 | |
| | | | | | | |
| Total liabilities | $ | 15.5 | | | $ | — | | | $ | — | | | $ | 15.5 | |
_______________
(1) Quoted prices in active markets for identical assets.
(2) Quoted prices for similar assets and liabilities in active markets.
(3) Significant unobservable inputs.
(4) Consists of a deferred compensation arrangement through which we hold various investment securities recognized on our consolidated balance sheets. Both the asset and liability related to investment securities are recorded at fair value and are included within "Other assets" and "Other liabilities" on the consolidated balance sheets, respectively. In addition to the investment securities, we also had company-owned life insurance related to the deferred compensation arrangement recorded at cash surrender value in "Other assets" of $16.5 million and $14.9 million at December 31, 2024 and 2023, respectively.
Ingevity Corporation
Notes to the Consolidated Financial Statements
December 31, 2024
Nonrecurring Fair Value Measurements
There were no nonrecurring fair value measurements on the consolidated balance sheetsduring the years ended December 31, 2024 and 2023.
Strategic Investments
Equity Method Investments
The aggregate carrying value of all strategic equity method investments was $15.4 million and $16.0 million at December 31, 2024 and 2023, respectively. As of December 31, 2024 and 2023, respectively, we had approximately $5.3 million and $5.6 million of unfunded commitments, associated with a venture capital fund investment accounted for under the equity method of accounting, which we anticipate will be paid over a period of 10 years.
During the first quarter of 2023, we sold a strategic equity method investment for $31.5 million, resulting in a $19.3 million gain, recorded within "Other (income) expense, net" on the consolidated statement of operations. We recognized an additional $0.1 million gain associated with the equity method investment sale during the period ended December 31, 2024. There were no adjustments to the carrying value of equity method investments for impairment for the periods ended, December 31, 2024 and 2023.
Measurement Alternative Investments
The aggregate carrying value of all measurement alternative investments where fair value is not readily determinable totaled $71.9 million and $83.2 million at December 31, 2024 and 2023, respectively. For the year ended December 31, 2024, the Company identified triggering events indicating that investments being accounted for under the measurement alternative may be impaired, and recognized impairment charges of $11.5 million, recorded in Other (income) expense, net on the consolidated statement of operations. There were no adjustments to the carrying value of the measurement alternative method investments for impairment or observable price changes for the periods ended December 31, 2023.
Restricted Investment
Our restricted investment is a trust managed in order to secure repayment of the finance lease obligation associated with Performance Materials' Wickliffe, Kentucky, manufacturing plant at maturity. The trust, presented as Restricted investment on our consolidated balance sheets, originally purchased long-term bonds that mature through 2026. The principal received at maturity of the bonds, along with interest income that is reinvested in the trust, are expected to be equal to or more than the $80.0 million finance lease obligation that is due in 2027. Because the provisions of the trust provide us the ability, and it is our intent, to hold the investments to maturity, the investments held by the trust are accounted for as held to maturity ("HTM"); therefore, they are held at their amortized cost. The investments held by the trust earn interest at the stated coupon rate of the invested bonds. Interest earned on the investments held by the trust is recognized and presented as Interest income on our consolidated statement of operations. As interest from the bonds is received and as bonds mature, any proceeds not reinvested are held in highly liquid securities and treated as restricted cash.
At December 31, 2024 and 2023, the carrying value of our restricted investment was $81.6 million and $79.1 million, net of an allowance for credit losses of $0.2 million and $0.2 million, and included restricted cash of $18.2 million and $15.4 million, respectively. The fair value at December 31, 2024 and 2023 was $80.3 million and $76.7 million, respectively, based on Level 1 inputs.
The following table shows the total amortized cost of our HTM debt securities by credit rating, excluding the allowance for credit losses and cash. The primary factor in our expected credit loss calculation is the composite bond rating. As the rating decreases, the risk present in holding the bond is inherently increased, leading to an increase in expected credit losses.
| | | | | | | | | | | | | | | | | | | | | | | | | | | | | | | | | | | | | |
| HTM Debt Securities |
| In millions | AA+ | | | | AA- | | A | | A- | | BBB+ | | Total |
| December 31, 2024 | $ | 13.2 | | | | | 10.3 | | | 23.3 | | 6.8 | | 10.0 | | $ | 63.6 | |
| December 31, 2023 | $ | 13.3 | | | | | 10.4 | | | 13.2 | | 17.0 | | 10.0 | | $ | 63.9 | |
Ingevity Corporation
Notes to the Consolidated Financial Statements
December 31, 2024
Debt and Finance Lease Obligations
At December 31, 2024 and 2023, the carrying value of finance lease obligations was $100.0 million and $101.1 million, respectively, and the fair value was $102.2 million and $105.7 million, respectively. The fair value of our finance lease obligation associated with our Performance Materials' Wickliffe, Kentucky manufacturing plant, is based on the period-end quoted market prices for the obligations, using Level 2 inputs. The fair value of all other finance lease obligations approximates their carrying values.
The carrying value of our variable rate debt, excluding debt issuance fees and adjusted for our $200.0 million floating-to-fixed interest rate swap, was $555.2 million, and $821.4 million as of December 31, 2024 and 2023, respectively. The carrying value of our variable rate debt is a reasonable estimate of the fair value.
At December 31, 2024 and 2023, the carrying value of our fixed rate debt was $550.0 million and $550.0 million, respectively, and the fair value was $503.2 million and $494.6 million, respectively, based on Level 2 inputs.
Note 6: Inventories, net | | | | | | | | | | | |
| December 31, |
| In millions | 2024 | | 2023 |
| Raw materials | $ | 97.6 | | | $ | 128.3 | |
| Production materials, stores and supplies | 25.0 | | | 26.0 | |
| Finished and in-process goods | 186.2 | | | 255.2 | |
| Subtotal | $ | 308.8 | | | $ | 409.5 | |
| Less: LIFO reserve | (82.0) | | | (100.7) | |
| Inventories, net | $ | 226.8 | | | $ | 308.8 | |
As of December 31, 2024, approximately 41 percent, 11 percent, and 48 percent of our Inventories, net, were accounted for under the FIFO, average cost, and LIFO methods, respectively. As of December 31, 2023, approximately 27 percent, 8 percent, and 65 percent of our Inventories, net, were accounted for under the FIFO, average cost, and LIFO methods, respectively. The repositioning actions taken to improve our Performance Chemicals reportable segment has reduced overall LIFO inventory (refer to Note 15 for more detail).
During the year ended December 31, 2024, inventory quantities carried on a LIFO basis, primarily in our Performance Chemicals reportable segment domestic inventory, were reduced which led to liquidations of LIFO inventory quantities. These reductions resulted in a pre-tax decrease of $6.9 million, recorded in Cost of sales on our consolidated statement of operations. No such reductions occurred during the year ended December 31, 2023.
Note 7: Property, Plant, and Equipment, net
| | | | | | | | | | | |
| December 31, |
| In millions | 2024 | | 2023 |
| Machinery and equipment | $ | 1,296.4 | | | $ | 1,244.6 | |
| Buildings and leasehold improvements | 224.3 | | | 217.4 | |
| Land and land improvements | 26.2 | | | 26.3 | |
| Construction in progress | 68.9 | | | 92.8 | |
| Total cost | $ | 1,615.8 | | | $ | 1,581.1 | |
Less: accumulated depreciation (1) | (956.9) | | | (818.9) | |
Property, plant, and equipment, net (2) | $ | 658.9 | | | $ | 762.2 | |
_______________
(1) As a result of the Performance Chemicals repositioning, as further described in Note 15, we accelerated the depreciation of certain property, plant, and equipment assets in 2024 and 2023. This resulted in $92.6 million and $46.3 million of additional expense for the years ended December 31, 2024 and 2023, respectively, which is included in Restructuring and other (income) charges, net within the consolidated statement of operations.
Ingevity Corporation
Notes to the Consolidated Financial Statements
December 31, 2024
(2) Includes finance leases related to machinery and equipment of $93.7 million and $94.2 million, and net carrying value of $20.3 million and $22.7 million; buildings and leasehold improvements of $39.2 million and $39.2 million, and net carrying value of $29.9 million and $32.3 million, respectively. Amortization expense associated with these finance leases is included within depreciation expense. The payments remaining under these finance lease obligations are included within Note 13.
Depreciation expense, excluding accelerated depreciation included in Restructuring and other (income) charges, net, was $71.6 million, $81.5 million, and $70.9 million for the years ended December 31, 2024, 2023, and 2022, respectively.
Note 8: Goodwill and Other Intangible Assets, net
Goodwill
| | | | | | | | | | | | | | | | | | | | | | | |
| Reporting Units | | |
| In millions | Performance Materials | | Performance Chemicals | | Advanced Polymer Technologies | | Total |
| | | | | | | |
| | | | | | | |
| Balance as of December 31, 2022 | $ | 4.3 | | | $ | 514.2 | | | $ | — | | | $ | 518.5 | |
| Segment change reallocation | — | | | (165.0) | | | 165.0 | | | — | |
| Foreign currency translation | — | | | 0.2 | | | 8.8 | | | 9.0 | |
| | | | | | | |
| | | | | | | |
| | | | | | | |
| | | | | | | |
| Balance as of December 31, 2023 | $ | 4.3 | | | $ | 349.4 | | | $ | 173.8 | | | $ | 527.5 | |
| Goodwill impairment charge | — | | | (349.1) | | | — | | | (349.1) | |
| Foreign currency translation | — | | | (0.3) | | | (2.9) | | | (3.2) | |
| | | | | | | |
| Balance as of December 31, 2024 | | | | | | | |
| Goodwill | 4.3 | | | 349.1 | | | 170.9 | | | 524.3 | |
| Accumulated impairment losses | — | | | (349.1) | | | — | | | (349.1) | |
| $ | 4.3 | | | $ | — | | | $ | 170.9 | | | $ | 175.2 | |
Impairment Assessment(s) and Goodwill Impairment Charge
Impairment Assessment
Our fiscal year 2024 annual goodwill impairment assessment was performed as of October 1, 2024. We determined that the fair value of our reporting units were in excess of their carrying value and therefore concluded that no goodwill impairment existed.
The results of our October 1st annual review calculated that our APT reporting unit headroom, defined as the percentage difference between the fair value of a reporting unit and its carrying value, is 12 percent. Since the fair value of our APT reporting unit is higher than the carrying value, we have concluded that no impairment to goodwill is necessary. Our analysis includes significant assumptions such as revenue growth rate, Earnings before Interest, Taxes, Depreciation and Amortization ("EBITDA") margin, and discount rate, which are judgmental, and variations in any assumptions could result in materially different calculations of fair value.
There were no events or circumstances indicating that goodwill might be impaired as of December 31, 2024.
Goodwill Impairment Charge
Beginning in fiscal year 2023, we began to see depressed volumes in our industrial end markets, constraining our ability to offset the continued crude tall oil (“CTO”) price inflation we were experiencing, and negatively impacting earnings and cash flow within our Performance Chemicals reporting unit, particularly in our industrial specialties product line. As a result, we concluded that a triggering event occurred in the third quarter of 2023. Our third quarter 2023 impairment analysis included significant assumptions, such as the execution of several measures in 2023 to pursue greater cost efficiency, including a reorganization to streamline certain functions and reduce ongoing costs, and expectations of decreased CTO costs beginning in the second half of 2024. We concluded that no impairment was necessary as a result of that third quarter 2023 interim analysis or at our annual impairment assessment, dated October 1, 2023.
Ingevity Corporation
Notes to the Consolidated Financial Statements
December 31, 2024
During the second quarter of 2024, our contracted long-term supplier of CTO provided new information regarding the cost of CTO for the second half of 2024, which significantly exceeded our forecasted costs, resulting in a triggering event for our Performance Chemicals reporting unit. We performed an analysis of the reporting unit’s goodwill, intangibles, and long-lived assets. Our analysis included significant assumptions such as: revenue growth rate, EBITDA margin, and discount rate, which are judgmental, and variations in any assumptions could result in materially different calculations of fair value.
Our analysis reassessed the expected cash flows in light of current performance and expected lack of near term recovery in our industrial specialties product line, resulting in lower volume and profitability expectations. As a result, we concluded that the carrying amount of the Performance Chemicals reporting unit exceeded its fair value, resulting in a non-cash goodwill impairment charge of $349.1 million, which represented all of the goodwill within the Performance Chemicals' reportable segment. The charge was is included within Goodwill impairment charge on the consolidated statements of operations for the year ended December 31, 2024. Specific to our long-lived assets, we determined that the undiscounted cash flows were in excess of the carrying values and therefore concluded that no impairment existed.
Other Intangible Assets
| | | | | | | | | | | | | | | | | | | | | | | | | |
| In millions | Customer contracts and relationships | | Brands (1) | | Developed Technology | | | | Total |
| Gross Asset Value | | | | | | | | | |
| December 31, 2022 | $ | 388.5 | | | $ | 89.2 | | | $ | 88.5 | | | | | $ | 566.2 | |
| | | | | | | | | |
| | | | | | | | | |
| Foreign currency translation | 8.0 | | | 3.4 | | | 3.2 | | | | | 14.6 | |
| December 31, 2023 | 396.5 | | | 92.6 | | | 91.7 | | | | | 580.8 | |
| | | | | | | | | |
Retirements (2) | (129.0) | | | — | | | (1.9) | | | | | (130.9) | |
| Foreign currency translation | (2.6) | | | (1.2) | | | (1.1) | | | | | (4.9) | |
| December 31, 2024 | $ | 264.9 | | | $ | 91.4 | | | $ | 88.7 | | | | | $ | 445.0 | |
| Accumulated Amortization | | | | | | | | | |
| December 31, 2022 | $ | (113.8) | | | $ | (23.9) | | | $ | (23.7) | | | | | $ | (161.4) | |
Amortization (4) | (63.5) | | | (5.7) | | | (10.1) | | | | | (79.3) | |
| | | | | | | | | |
| Foreign currency translation | (2.1) | | | (0.7) | | | (1.2) | | | | | (4.0) | |
| December 31, 2023 | (179.4) | | | (30.3) | | | (35.0) | | | | | (244.7) | |
Amortization (4) | (38.9) | | | (5.5) | | | (9.9) | | | | | (54.3) | |
Retirements (2) | 129.0 | | | — | | | 1.9 | | | | | 130.9 | |
| Foreign currency translation | 0.9 | | | 0.4 | | | 0.6 | | | | | 1.9 | |
| December 31, 2024 | $ | (88.4) | | | $ | (35.4) | | | $ | (42.4) | | | | | $ | (166.2) | |
Other intangibles, net (3) | $ | 176.5 | | | $ | 56.0 | | | $ | 46.3 | | | | | $ | 278.8 | |
_______________
(1) Represents trademarks, trade names, and know-how.
(2) As a result of the Performance Chemicals repositioning, as further described in Note 15, we retired certain customer contract and relationships, and developed technology finite-lived intangible assets.
(3) The weighted average amortization period remaining for all intangibles is 10.7 years, while the weighted average amortization period remaining for customer contracts and relationships, brands, and developed technology is 11.8 years, 10.4 years, and 7.0 years, respectively.
(4) As a result of the Performance Chemicals repositioning, as further described in Note 15, we accelerated the amortization of certain customer contract and relationship finite-lived intangible assets. This resulted in $22.1 million and $37.4 million of additional expense for the years ended December 31, 2024 and 2023, which is included in Restructuring and other (income) charges, net within the consolidated statements of operations.
Ingevity Corporation
Notes to the Consolidated Financial Statements
December 31, 2024
Intangible assets subject to amortization were allocated among our business segments as follows:
| | | | | | | | | | | |
| December 31, |
| In millions | 2024 | | 2023 |
| Performance Materials | $ | 1.2 | | | $ | 1.5 | |
Performance Chemicals (1) | 102.5 | | | 137.5 | |
| Advanced Polymer Technologies | 175.1 | | | 197.1 | |
| Other intangibles, net | $ | 278.8 | | | $ | 336.1 | |
_______________
(1) Refer to footnote 4 in the preceding Other Intangible Assets table for more information on the change in amortization in 2024.
The amortization expense related to our intangible assets in the table above is shown in the table below.
| | | | | | | | | | | | | | | | | |
| Years Ended December 31, |
| In millions | 2024 | | 2023 | | 2022 |
| | | | | |
| Selling, general, and administrative expenses | $ | 32.2 | | | $ | 41.9 | | | $ | 33.6 | |
Restructuring and other (income) charges, net (1) | 22.1 | | | 37.4 | | | — | |
| Total amortization expense | $ | 54.3 | | | $ | 79.3 | | | $ | 33.6 | |
_______________
(1) Amounts recorded to Restructuring and other (income) charges, net are not included within segment depreciation and amortization.
Based on the current carrying values of intangible assets, estimated pre-tax amortization expense for the next five years is as follows: 2025 - $30.0 million, 2026 - $29.3 million, 2027 - $29.3 million, 2028 - $29.3 million and 2029 - $29.3 million. The estimated pre-tax amortization expense may fluctuate due to changes in foreign currency exchange rates.
Note 9: Financial Instruments and Risk Management
Net Investment Hedges
During 2022, we terminated our fixed-to-fixed cross-currency interest rate swaps, accounted for as net investment hedges, and received net proceeds of $14.7 million. The proceeds are presented within cash provided by investing activities within the consolidated statement of cash flows. The $14.7 million gain is reported as a component of the CTA within AOCI on the consolidated balance sheet. Gains from net investment hedges are reclassified to earnings only when the related CTA are required to be reclassified, usually upon the sale or liquidation of the investment (i.e., the legal entity).
The fair value of our net investment hedge was a net asset (liability) of zero at December 31, 2024 and 2023. During the years ended December 31, 2024, 2023, and 2022, we recognized net interest income associated with this financial instrument of zero, zero, and $1.1 million, respectively.
Cash Flow Hedges
Foreign Currency Exchange Risk Management
We manufacture and sell our products in several countries throughout the world and thus, we are exposed to changes in foreign currency exchange rates. To manage the volatility relating to these exposures, we net the exposures on a consolidated basis to take advantage of natural offsets. To manage the remaining exposure, from time to time, we utilize forward currency exchange contracts and zero cost collar option contracts to minimize the volatility to earnings and cash flows resulting from the effect of fluctuating foreign currency exchange rates on export sales denominated in foreign currencies (principally the euro). These contracts are generally designated as cash flow hedges. As of December 31, 2024, open foreign currency exchange contracts hedge a portion of forecasted transactions until January 2026. Designated cash flow hedges entered to minimize foreign currency exchange risk of forecasted revenue transactions are recorded to Net sales on the consolidated statement of operations when the forecasted transaction occurs. As of December 31, 2024, there were $6.5 million in open foreign currency derivative contracts. The fair value of the designated foreign currency hedge contracts was an asset (liability) of $0.1 million and zero as of December 31, 2024 and 2023, respectively.
Ingevity Corporation
Notes to the Consolidated Financial Statements
December 31, 2024
Commodity Price Risk Management
Certain energy sources used in our manufacturing operations are subject to price volatility caused by weather, supply and demand conditions, economic variables, and other unpredictable factors. This volatility is primarily related to the market pricing of natural gas. To mitigate expected fluctuations in market prices and the volatility to earnings and cash flow resulting from changes to the pricing of natural gas purchases, from time to time, we will enter into swap contracts and zero cost collar option contracts and designate these contracts as cash flow hedges. As of December 31, 2024, we had 1.8 million mmBTUS (millions of British Thermal Units) in open natural gas derivative contracts, designated as cash flow hedges. As of December 31, 2024, open natural gas derivative contracts hedge a portion of forecasted transactions until December 2025. The fair value of the open natural gas derivative contracts was a net asset (liability) of $0.3 million and $(0.9) million as of December 31, 2024 and 2023, respectively.
Interest Rate Risk Management
During the third quarter of 2024, we entered into a floating-to-fixed interest rate swap with a notional amount of $200.0 million to manage the variability of cash flows in the interest rate payments associated with our existing Secured Overnight Financing Rate ("SOFR") based interest payments, effectively converting $200.0 million of our floating rate debt to a fixed rate. In accordance with the terms of this instrument, we receive floating rate interest payments based upon one-month U.S. dollar SOFR and in return are obligated to pay interest at a fixed rate of 3.84 percent until August 2026. The fair value of outstanding interest rate instruments at December 31, 2024 and 2023 was an asset of $0.6 million and zero, respectively.
During 2022, we had floating-to-fixed interest rate swaps with a combined notional amount of $166.2 million to manage the variability of cash flows in the interest rate payments associated with our existing LIBOR-based interest payments, effectively converting $166.2 million of our floating rate debt to a fixed rate. Per the terms of these instruments, we received floating rate interest payments based upon a three-month U.S. dollar LIBOR and in return, were obligated to pay interest at a fixed rate of 3.79 percent until July 2023. Due to the repayment of our term loan (refer to Note 10 for more information), during the second quarter of 2022, we terminated these interest rate swap instruments. Upon termination of the interest rate swap instruments, we reclassified a $1.7 million gain from AOCI into Interest income on the consolidated statement of operations.
Effect of Cash Flow and Net Investment Hedge Accounting on AOCI
| | | | | | | | | | | | | | | | | | | | | | | | | | | | | | | | | | | | | | | | | |
| In millions | Amount of Gain (Loss) Recognized in AOCI | | Amount of Gain (Loss) Reclassified from AOCI into Net income | | Location of Gain (Loss) Reclassified from AOCI into Net income |
| Years Ended December 31, | | |
| 2024 | | 2023 | | 2022 | | 2024 | | 2023 | | 2022 | | |
| Cash flow hedging derivatives | | | | | | | | | | | | | |
| Currency exchange contracts | $ | 0.2 | | | $ | (0.1) | | | $ | 0.9 | | | $ | 0.1 | | | $ | (0.7) | | | $ | 2.0 | | | Net sales |
| Natural gas contracts | (0.4) | | | (4.1) | | | 4.4 | | | (2.5) | | | (3.2) | | | 6.5 | | | Cost of sales |
| Interest rate swap contracts | 0.6 | | | — | | | 5.8 | | | — | | | — | | | 1.7 | | | Interest income |
| Total | $ | 0.4 | | | $ | (4.2) | | | $ | 11.1 | | | $ | (2.4) | | | $ | (3.9) | | | $ | 10.2 | | | |
| | | | | | | | | | | | | |
| Amount of Gain (Loss) Recognized in AOCI | | Amount of Gain (Loss) Recognized in Income on Derivative
(Amount Excluded from Effectiveness Testing) | | Location of Gain or (Loss) Recognized in Income on Derivative
(Amount Excluded from Effectiveness Testing) |
| Years Ended December 31, | | |
| 2024 | | 2023 | | 2022 | | 2024 | | 2023 | | 2022 | | |
| Net investment hedging derivative | | | | | | | | | | | | | |
Currency exchange contracts (1) | $ | — | | | $ | — | | | $ | 13.9 | | | $ | — | | | $ | — | | | $ | 1.1 | | | Interest income |
| Total | $ | — | | | $ | — | | | $ | 13.9 | | | $ | — | | | $ | — | | | $ | 1.1 | | | |
_______________
(1) Reclassifications from AOCI to Net Income were zero for all periods presented. Gains and losses would be reclassified from AOCI to Other (income) expense, net.
Ingevity Corporation
Notes to the Consolidated Financial Statements
December 31, 2024
Within the next twelve months, we expect to reclassify $0.2 million of losses from AOCI to earnings before taxes.
Fair-Value Measurements
The following information is presented for derivative assets and liabilities that are recorded on the consolidated balance sheets at fair value measured on a recurring basis. There were no transfers of assets and liabilities that were recorded at fair value between Level 1 and Level 2 during the periods reported. There were no non-recurring fair value measurements related to derivative assets and liabilities on our consolidated balance sheetsduring the fiscal years ending December 31, 2024, 2023, or 2022, respectively.
| | | | | | | | | | | | | | | | | | | | | | | |
| December 31, 2024 |
| In millions | Level 1 (1) | | Level 2 (2) | | Level 3 (3) | | Total |
| Assets: | | | | | | | |
Natural gas contracts (4) | $ | — | | | $ | 0.4 | | | $ | — | | | $ | 0.4 | |
Currency exchange contracts (4) | — | | | 0.2 | | | — | | | 0.2 | |
Interest rate swap contracts (5) | — | | | 0.6 | | | — | | | 0.6 | |
| Total assets | $ | — | | | $ | 1.2 | | | $ | — | | | $ | 1.2 | |
| Liabilities: | | | | | | | |
Natural gas contracts (6) | $ | — | | | $ | 0.1 | | | $ | — | | | $ | 0.1 | |
Currency exchange contracts (6) | — | | | 0.1 | | | — | | | 0.1 | |
| | | | | | | |
| | | | | | | |
| Total liabilities | $ | — | | | $ | 0.2 | | | $ | — | | | $ | 0.2 | |
| | | | | | | | | | | | | | | | | | | | | | | |
| December 31, 2023 |
| In millions | Level 1 (1) | | Level 2 (2) | | Level 3 (3) | | Total |
| Assets: | | | | | | | |
Currency exchange contracts (4) | $ | — | | | $ | 0.5 | | | $ | — | | | $ | 0.5 | |
| | | | | | | |
| | | | | | | |
| Total assets | $ | — | | | $ | 0.5 | | | $ | — | | | $ | 0.5 | |
| Liabilities: | | | | | | | |
Natural gas contracts (6) | $ | — | | | $ | 0.9 | | | $ | — | | | $ | 0.9 | |
Currency exchange contracts (6) | — | | | 0.5 | | | — | | | 0.5 | |
| | | | | | | |
| | | | | | | |
| Total liabilities | $ | — | | | $ | 1.4 | | | $ | — | | | $ | 1.4 | |
_______________
(1) Quoted prices in active markets for identical assets.
(2) Quoted prices for similar assets and liabilities in active markets.
(3) Significant unobservable inputs.
(4) Included within "Prepaid and other current assets" on the consolidated balance sheets.
(5) Included within "Other assets" on the consolidated balance sheets.
(6) Included within "Accrued expenses" on the consolidated balance sheets.
Ingevity Corporation
Notes to the Consolidated Financial Statements
December 31, 2024
Note 10: Debt, including Finance Lease Obligations
Current and long-term debt including finance lease obligations consisted of the following:
| | | | | | | | | | | | | | |
| | December 31, |
| In millions, except percentages | | | | 2024 | | 2023 |
| | | | | | |
Revolving Credit Facility (1) | | | | $ | 695.0 | | | $ | 738.0 | |
| | | | | | |
| | | | | | |
| | | | | | |
| | | | | | |
| 3.88% Senior Notes due 2028 | | | | 550.0 | | | 550.0 | |
| | | | | | |
Finance lease obligations (2) | | | | 100.0 | | | 101.1 | |
| Accounts receivable securitization | | | | 58.3 | | | 81.3 | |
| Other notes payable | | | | 1.9 | | | 2.1 | |
| Total debt including finance lease obligations | | | | $ | 1,405.2 | | | $ | 1,472.5 | |
| Less: debt issuance costs | | | | 4.2 | | | 5.3 | |
| Total debt including finance lease obligations, net of debt issuance costs | | | | $ | 1,401.0 | | | $ | 1,467.2 | |
Less: debt maturing within one year (3) | | | | 61.3 | | 84.4 |
| Long-term debt including finance lease obligations | | | | $ | 1,339.7 | | | $ | 1,382.8 | |
_______________
(1) Letters of credit outstanding under the revolving credit facility were $2.6 million and $2.5 million and available funds under the facility were $302.4 million and $259.5 million at December 31, 2024 and 2023, respectively.
(2) Refer to Note 13 for more information on finance lease obligations. At December 31, 2024 and 2023, $80.0 million of the finance lease obligation upon maturity will be settled utilizing liquid assets that have been placed into a trust established strictly for this purpose. The trust is presented as Restricted investments on the consolidated balance sheets in the amount of $81.6 million and $79.1 million as of December 31, 2024 and 2023, respectively.
(3) Debt maturing within one year is included within "Notes payable and current maturities of long-term debt" on the consolidated balance sheets.
Revolving Credit Facility
On June 23, 2022, we entered into an Amendment and Restatement Agreement (the “Amendment”) together with the other parties named therein, which amends and restates our existing credit agreement, dated as of March 7, 2016, as amended, supplemented or otherwise modified.
Among other things, the Amendment (a) extends the maturity date from October 28, 2025 to June 23, 2027 and increases the aggregate principal amount of revolving commitments thereunder from $500 million to $1 billion, (b) adds Ingevity UK as a borrower under the revolving credit facility, and (c) modifies certain leverage ratio tests and thresholds.
Borrowings under the revolving credit facility bear interest at a rate per annum equal to either (a) the Secured Overnight Financing Rate ("SOFR"), subject to a zero floor, or (b) a base rate, in each case, plus an applicable margin of 1 percent to 1.75 percent for term benchmark loans and 0.00 percent to 0.75 percent for base rate loans. The weighted average interest rate associated with our revolving credit facility, exclusive of any floating-to-fixed interest rate instrument, was 6.69 percent and 6.36 percent for the periods ended December 31, 2024, and 2023, respectively.
Fees of zero, zero, and $3.0 million were incurred in 2024, 2023, and 2022, respectively, to secure the various amendments associated with our revolving credit facility. These fees have been deferred and will be amortized over the term of the facility.
Term Loan Repayment
During 2022, we repaid our outstanding term loan in an aggregate principal amount of $323.0 million. Upon repayment, we recognized $1.3 million in outstanding interest and $0.4 million in repayment fees and accelerated the remaining deferred finance fees of $0.4 million. The interest, fees, and accelerated deferred finance fees were recorded to Interest expense on the consolidated statements of operations. Legal expenses associated with this repayment have been recorded as incurred.
Ingevity Corporation
Notes to the Consolidated Financial Statements
December 31, 2024
Senior Notes
Senior Note due 2026
On April 27, 2022, we redeemed the $300 million outstanding aggregate principal balance of our 4.50% Senior Notes due in 2026 prior to maturity. The redemption was primarily funded utilizing the outstanding capacity under our revolving credit facility. At redemption, we recognized a $3.4 million redemption premium and accelerated the remaining deferred finance fees of $2.7 million. Both the redemption premium and accelerated deferred finance fees were recorded to Interest expense on the consolidated statements of operations. Legal expenses associated with this redemption have been recorded as incurred.
Senior Note due 2028
On October 28, 2020, we issued $550 million aggregate principal amount of 3.88% senior unsecured notes due 2028 (the “2028 Notes”). The 2028 Notes were issued pursuant to an indenture dated as of October 28, 2020, by and among Ingevity, the subsidiary guarantors party thereto and U.S. Bank National Association, as trustee. The net proceeds from the sale of the 2028 Notes, after deducting deferred financing fees of $8.8 million, were used to repay the existing term loan and the outstanding balances under our revolving credit facility. Interest payments on the 2028 Notes are due semiannually in arrears on November 1st and May 1st of each year, at a rate of 3.88 percent per year. The 2028 Notes mature on November 1, 2028.
Accounts Receivable Securitization
On October 2, 2023, we entered into a revolving accounts receivable securitization facility (“Facility”). The Facility enables us to borrow, on a revolving basis, up to a maximum of $100.0 million based upon eligible trade receivables. The program's effective borrowing cost is based upon an asset-backed commercial paper conduit rate plus a negotiated margin. In addition, a fee is assessed for any undrawn portion of the facility. The Facility required the establishment of a bankruptcy-remote special purpose entity (“SPE”), wholly owned and fully consolidated by Ingevity Corporation. Trade receivables will be sold to this SPE and held as secured collateral for the borrowings under the Facility. Ingevity maintains continuing involvement as it acts as the servicer for the eligible trade receivables and guarantees payment to the bank. Such receivables, recorded on the consolidated balance sheet, totaled $58.3 million and $81.3 million as of December 31, 2024 and 2023, respectively. The borrowings are presented on the consolidated balance sheets as short-term debt, and cash flows will be presented as financing on our cash flow statement. Fees of $0.4 million were incurred in 2023 to secure the Facility. These fees have been deferred and will be amortized over the term of the Facility. The weighted average interest rate associated with our Facility was 5.35 percent and 5.61 percent for the periods ended December 31, 2024 and 2023, respectively.
Debt Covenants
Our indenture contains certain customary covenants (including covenants limiting Ingevity's and its restricted subsidiaries’ ability to grant or permit liens on certain property securing debt, declare or pay dividends, make distributions on or repurchase or redeem capital stock, make investments in unrestricted subsidiaries, engage in sale and lease-back transactions, and engage in a consolidation or merger, or sell, transfer or otherwise dispose of all or substantially all of the assets of Ingevity and our restricted subsidiaries, taken as a whole) and events of default (subject in certain cases to customary exceptions, as well as grace and cure periods). The occurrence of an event of default under the 2028 Senior Notes could result in the acceleration of the notes of such series and could cause a cross-default resulting in the acceleration of other indebtedness of Ingevity and its subsidiaries. We were in compliance with all covenants under the indenture as of December 31, 2024.
The credit agreement governing our revolving credit facility contains customary default provisions, including defaults for non-payment, breach of representations and warranties, insolvency, non-compliance with covenants and cross-defaults to other material indebtedness. The occurrence of an uncured event of default under the credit agreement could result in all loans and other obligations becoming immediately due and payable and our revolving credit facility being terminated. The credit agreement also contains certain customary covenants, including financial covenants. The revolving credit facility financial covenants require Ingevity to maintain on a consolidated basis a maximum total net leverage ratio of 4.0 to 1.0 (which may be increased to 4.5 to 1.0 under certain circumstances) and a minimum interest coverage ratio of 3.0 to 1.0. As calculated per the credit agreement, our net leverage for the four consecutive quarters ended December 31, 2024 was 3.1 and our actual interest coverage for the four consecutive quarters ended December 31, 2024 was 4.7. We were in compliance with all covenants at December 31, 2024.
Ingevity Corporation
Notes to the Consolidated Financial Statements
December 31, 2024
Note 11: Share-based Compensation
Equity Incentive Plan
The Ingevity Corporation 2016 Omnibus Incentive Plan, adopted on May 15, 2016, grants certain corporate officers, key employees, and non-employee directors of Ingevity and subsidiaries different forms of benefits, including stock options, Restricted Stock Units ("RSUs"), Director Stock Units ("DSUs"), and Performance-based restricted Stock Units ("PSUs"). The Ingevity Corporation 2016 Omnibus Incentive Plan has a maximum shares reserve of 4,000,000 for the grant of equity awards. As of December 31, 2024, 1,817,417 shares under the Ingevity Corporation 2016 Omnibus Incentive Plan are still available to be granted, assuming that Ingevity performs at the target performance level in each year of the three-year performance period for PSU awards. The Talent and Compensation Committee of Ingevity's Board of Directors ("Compensation Committee") determines the long-term incentive mix, including stock options, RSUs, and PSUs, and may authorize new grants annually. We typically issue new common shares for the vesting of awards under our equity incentive plan.
Employee Stock Purchase Plan
On December 9, 2016, our Compensation Committee and Board of Directors approved the 2017 Ingevity Corporation Employee Stock Purchase Plan ("ESPP"), which was approved by Ingevity’s stockholders on April 27, 2017. The ESPP allows eligible employee participants to purchase no more than 5,000 shares of our common stock at a discount through payroll deductions up to 15 percent of their compensation deducted during the purchase period. However, no participant shall be permitted to purchase common stock with a value greater than $25,000 in any calendar year. The ESPP is a tax-qualified plan under Section 423 of the Internal Revenue Code. The ESPP consists of a one-month enrollment period preceding the three-month purchase period. Employees purchase shares in each purchase period at 85 percent of the market value of our common stock at either the beginning of the offering period or the end of the purchase period, whichever price is lower.
On April 27, 2023, the ESPP was amended to add an additional 300,000 shares of Ingevity's common stock, increasing the total amount of shares under the ESPP to 550,000 shares, those additional shares were registered with the SEC on May 4, 2023. The shares are reserved and authorized for issuance to participating U.S. employees, as defined by the ESPP, excluding certain officers of Ingevity. We typically issue treasury shares for issuances under the ESPP. As of December 31, 2024, 319,611 shares under the ESPP are still available for issuance. During fiscal year 2024, there were zero shares issued under the ESPP as all purchases under the ESPP were suspended during the third quarter of 2023.
Our share-based compensation and ESPP expense is included in the table below.
| | | | | | | | | | | | | | | | | |
| Years Ended December 31, |
| In millions | 2024 | | 2023 | | 2022 |
| Stock option expense | $ | 0.1 | | | $ | 0.6 | | | $ | 1.5 | |
| ESPP expense | — | | | 0.5 | | | 0.7 | |
| RSU, DSU and PSU expense | 11.8 | | | 9.5 | | | 13.9 | |
Total share-based compensation expense (1) | $ | 11.9 | | | $ | 10.6 | | | $ | 16.1 | |
| Income tax benefit | (2.6) | | | (2.3) | | | (3.1) | |
| Total share-based compensation expense, net of tax | $ | 9.3 | | | $ | 8.3 | | | $ | 13.0 | |
_______________
(1) Substantially all compensation expense related to share-based awards is recorded as a component of Selling, general and administrative expenses within the consolidated statements of operations.
Ingevity Corporation
Notes to the Consolidated Financial Statements
December 31, 2024
Stock Options
All stock options vest in accordance with vesting conditions set by the Compensation Committee. The Compensation Committee, with the addition of rTSR to the PSUs, did not grant stock options in 2024 or 2023. Stock options granted to date have vesting periods of one to three years from the date of grant. Incentive and non-qualified options granted under the Plan expire no later than 10 years from the grant date. Expense related to stock options granted is based on the assumptions shown in the table below:
| | | | | | | | | | | | | | | | | |
| Years Ended December 31, |
| Weighted-average assumptions used to calculate expense for stock options | 2024 | | 2023 | | 2022 |
| Risk-free interest rate | — | % | | — | % | | 1.8 | % |
| Average life of options (years) | 0.0 | | 0.0 | | 6.0 |
| Volatility | — | % | | — | % | | 40.0 | % |
| Dividend yield | — | | | — | | | — | |
| Fair value per stock option | $ | — | | | $ | — | | | $ | 28.80 | |
The following table summarizes Ingevity's stock option activity.
| | | | | | | | | | | | | | | | | | | | | | | |
| Number of Options (in thousands) | | Weighted-average exercise price (per share) | | Weighted-average remaining contractual term (years) | | Aggregate intrinsic value (in thousands) |
| Outstanding, December 31, 2023 | 278 | | | $ | 63.86 | | | 5.1 | | $ | 863 | |
| Granted | — | | | | | | | |
| Exercised | (1) | | | 37.19 | | | | | |
| Forfeited | (20) | | | 75.02 | | | | | |
| Cancelled | — | | | | | | | |
| Outstanding, December 31, 2024 | 257 | | | $ | 63.12 | | | 3.0 | | $ | 510 | |
| Exercisable, December 31, 2024 | 248 | | | $ | 62.94 | | | 2.8 | | $ | 510 | |
The aggregate intrinsic values in the table above represent the total pre-tax intrinsic value (the difference between Ingevity's closing stock price on the last trading day of the period and the exercise price, multiplied by the number of in-the-money options) that would have been received by the option holders had all option holders exercised their in-the-money options at each year end. The amount changes based on the fair market value of Ingevity's stock.
As of December 31, 2024, there is no remaining unrecognized compensation expense related to stock options.
Restricted Stock Units, Deferred Stock Units, and Performance-based Restricted Stock Units
All RSUs, DSUs, and PSUs vest in accordance with vesting conditions set by the Compensation Committee. RSUs and DSUs granted to date have vesting periods ranging from less than one year to three years from the date of grant. PSUs granted to date have vesting periods of three years from the date of grant, including grants that have a cumulative three-year performance period, subject to the satisfaction of the applicable performance goals established for the respective grant. We periodically assess the probability of achievement of the performance criteria and adjust the amount of compensation expense accordingly. Beginning in 2023, certain granted PSUs include a rTSR modifier that, when combined with the performance criteria could modify the final PSU payout by +/- 15 to 30 percent depending on the Company's rTSR performance over a three year performance period. The rTSR component of the 2024 PSU awards is a market condition requiring the use of a Monte Carlo simulation on the grant date to estimate the fair value. The assumptions utilized to calculate the fair value of the 2024 PSUs are shown in the table below. Compensation expense is recognized over the vesting period and adjusted for the probability of achievement of the performance criteria.
Ingevity Corporation
Notes to the Consolidated Financial Statements
December 31, 2024
| | | | | |
| Weighted-average assumptions used to calculate expense for PSUs | Year Ended December 31, 2024 |
| Risk-free interest rate | 4.4 | % |
| Average life of options (years) | 3.0 |
| Volatility | 38.0 | % |
| Dividend yield | — | |
| Fair value per PSU | $ | 48.37 | |
The following table summarizes Ingevity's RSUs, DSUs, and PSUs activity.
| | | | | | | | | | | | | | | | | | | | | | | |
| RSUs and DSUs | | PSUs |
| Number of Units (in thousands) (1) | | Weighted average grant date fair value (per share) | | Number of Units (in thousands) (1) | | Weighted average grant date fair value (per share) |
| Nonvested, December 31, 2023 | 350 | | | $ | 72.06 | | | 263 | | | $ | 72.02 | |
| Granted | 179 | | | 42.48 | | | 127 | | | 45.22 | |
| Vested | (145) | | | 74.55 | | | (35) | | | 69.65 | |
| Forfeited | (76) | | | 60.38 | | | (142) | | | 58.58 | |
Nonvested, December 31, 2024 (2) | 308 | | | $ | 56.52 | | | 213 | | | $ | 65.44 | |
_______________
(1) The number granted represents the number of shares issuable upon vesting of RSUs and DSUs. For PSUs, the number granted represents the number of shares issuable upon vesting, assuming that Ingevity performs at the target performance level in each year of the three-year performance period.
(2) Excludes 19,068 non-employee director shares that were vested but unissued at December 31, 2024.
As of December 31, 2024, $11.6 million of unrecognized share-based compensation expense related to RSUs, DSUs and PSUs is expected to be recognized over a weighted-average period of 1 year.
Ingevity Corporation
Notes to the Consolidated Financial Statements
December 31, 2024
Note 12: Equity
Accumulated other comprehensive income (loss)
Summarized below is the roll forward of AOCI, net of tax.
| | | | | | | | | | | | | | | | | |
| Years Ended December 31, |
| In millions | 2024 | | 2023 | | 2022 |
| Foreign currency translation | | | | | |
| Beginning balance | $ | (25.6) | | | $ | (45.8) | | | $ | 18.4 | |
| | | | | |
| | | | | |
| Net gains (losses) on foreign currency translation | (18.6) | | | 20.2 | | | (74.9) | |
| Reclassification of foreign currency translation losses | (0.2) | | | — | | | — | |
| Gains (losses) on net investment hedges | — | | | — | | | 13.9 | |
| Less: tax provision (benefit) | — | | | — | | | 3.2 | |
| Net gains (losses) on net investment hedges | — | | | — | | | 10.7 | |
| Other comprehensive income (loss), net of tax | (18.8) | | | 20.2 | | | (64.2) | |
| Ending balance | $ | (44.4) | | | $ | (25.6) | | | $ | (45.8) | |
| | | | | |
| Derivative instruments | | | | | |
| Beginning balance | $ | (1.6) | | | $ | (1.4) | | | $ | (2.1) | |
| Gains (losses) on derivative instruments | 0.4 | | | (4.2) | | | 11.1 | |
| Less: tax provision (benefit) | 0.1 | | | (1.0) | | | 2.6 | |
| Net gains (losses) on derivative instruments | 0.3 | | | (3.2) | | | 8.5 | |
| (Gains) losses reclassified to net income | 2.4 | | | 3.9 | | | (10.2) | |
| Less: tax (provision) benefit | 0.6 | | | 0.9 | | | (2.4) | |
| Net (gains) losses reclassified to net income | 1.8 | | | 3.0 | | | (7.8) | |
| Other comprehensive income (loss), net of tax | 2.1 | | | (0.2) | | | 0.7 | |
| Ending balance | $ | 0.5 | | | $ | (1.6) | | | $ | (1.4) | |
| | | | | |
| Pension and other postretirement benefits | | | | | |
| Beginning balance | $ | 0.5 | | | $ | 0.4 | | | $ | (3.2) | |
| Unrealized actuarial gains (losses) and prior service (costs) credits | 2.3 | | | 0.1 | | | 4.4 | |
| Less: tax provision (benefit) | 0.5 | | | — | | | 1.0 | |
| Net actuarial gains (losses) and prior service (costs) credits | 1.8 | | | 0.1 | | | 3.4 | |
| Amortization of actuarial and other (gains) losses, prior service cost (credits), and settlement and curtailment (income) charge reclassified to net income | 0.3 | | | 0.1 | | | 0.3 | |
| Less: tax (provision) benefit | 0.1 | | | 0.1 | | | 0.1 | |
| Net actuarial and other (gains) losses, amortization of prior service cost (credits), and settlement and curtailment (income) charge reclassified to net income | 0.2 | | | — | | | 0.2 | |
| | | | | |
| Other comprehensive income (loss), net of tax | 2.0 | | | 0.1 | | | 3.6 | |
| Ending balance | $ | 2.5 | | | $ | 0.5 | | | $ | 0.4 | |
| | | | | |
| Total AOCI ending balance at December 31 | $ | (41.4) | | | $ | (26.7) | | | $ | (46.8) | |
Ingevity Corporation
Notes to the Consolidated Financial Statements
December 31, 2024
Reclassifications of accumulated other comprehensive income (loss)
The table below provides details about the reclassifications from AOCI and the affected line items on the consolidated statement of operations for each of the periods presented.
| | | | | | | | | | | | | | | | | |
| Years Ended December 31, |
| In millions | 2024 | | 2023 | | 2022 |
| | | | | |
| Foreign currency | | | | | |
Foreign currency translation adjustment (1) | $ | 0.2 | | | $ | — | | | $ | — | |
| Total before tax | 0.2 | | | — | | | — | |
| (Provision) benefit for income taxes | — | | | — | | | — | |
| Amount included within net income (loss) | $ | 0.2 | | | $ | — | | | $ | — | |
| | | | | |
| Derivative Instruments | | | | | |
Currency exchange contracts (2) | $ | 0.1 | | | $ | (0.7) | | | $ | 2.0 | |
Natural gas contracts (3) | (2.5) | | | (3.2) | | | 6.5 | |
Interest rate swaps (5) | — | | | — | | | 1.7 | |
| Total before tax | (2.4) | | | (3.9) | | | 10.2 | |
| (Provision) benefit for income taxes | 0.6 | | | 0.9 | | | (2.4) | |
| Amount included within net income (loss) | $ | (1.8) | | | $ | (3.0) | | | $ | 7.8 | |
| | | | | |
| Pension and other postretirement benefits | | | | | |
Amortization of prior service credit (costs) (3) | $ | (0.1) | | | $ | (0.1) | | | $ | (0.1) | |
Amortization of unrecognized net actuarial and other gains (losses) (4) | — | | | — | | | — | |
Recognized gain (loss) due to curtailment and settlement (3) | (0.2) | | | — | | | (0.2) | |
| Total before tax | (0.3) | | | (0.1) | | | (0.3) | |
| (Provision) benefit for income taxes | 0.1 | | | 0.1 | | | 0.1 | |
| Amount included within net income (loss) | $ | (0.2) | | | $ | — | | | $ | (0.2) | |
_______________
(1) Included within "Restructuring and other (income) charges, net" on the consolidated statements of operations.
(2) Included within "Net sales" on the consolidated statements of operations.
(3) Included within "Cost of sales" on the consolidated statements of operations.
(4) Included within "Other (income) expense, net" on the consolidated statements of operations.
(5) Included within "Interest income" on the consolidated statements of operations.
Share Repurchases
On July 25, 2022, our Board of Directors authorized the repurchase of up to $500.0 million of our common stock (the "2022 Authorization"), and rescinded the prior outstanding repurchase authorization with respect to the shares that remained unused under the prior authorization. Shares under the 2022 Authorization may be purchased through open market or privately negotiated transactions at the discretion of management based on its evaluation of market prevailing conditions and other factors, including through the use of trading plans intended to qualify under Rule 10b5-1 under the Securities Exchange Act of 1934, as amended.
During the year ended December 31, 2024, we repurchased zero common stock. At December 31, 2024, $353.4 million remained unused under our Board-authorized repurchase program. During the years ended December 31, 2023 and 2022, we repurchased $92.1 million (inclusive of $0.8 million in excise tax) and $145.2 million in common stock, representing 1,269,373 and 2,112,463 shares of our common stock at a weighted average cost per share of $71.93 and $68.73, respectively.
Ingevity Corporation
Notes to the Consolidated Financial Statements
December 31, 2024
Note 13: Leases
We have both operating and finance leases, with the majority being operating lease agreements related to rail cars, tanks, equipment, and real estate. Supplemental consolidated balance sheet information related to our leases is as follows:
| | | | | | | | | | | | | | | | | |
| | | December 31, |
| In millions | Financial Statement Caption | | 2024 | | 2023 |
| Assets | | | | | |
Operating lease assets, net (1) | Operating lease assets, net | | $ | 50.4 | | | $ | 67.1 | |
Finance lease assets, net (2) | Property, plant, and equipment, net | | 50.2 | | | 55.0 | |
Finance lease assets, net (2) | Other assets, net | | — | | | 0.1 | |
| Total lease assets | | | $ | 100.6 | | | $ | 122.2 | |
| Liabilities | | | | | |
| Current | | | | | |
Operating lease liabilities (3) | Current operating lease liabilities | | $ | 16.9 | | | $ | 18.7 | |
| Finance lease liabilities | Notes payable and current maturities of long-term debt | | 1.1 | | | 1.1 | |
| Noncurrent | | | | | |
| Operating lease liabilities | Noncurrent operating lease liabilities | | 36.8 | | | 48.6 | |
| Finance lease liabilities | Long-term debt including finance lease obligations | | 98.9 | | | 100.0 | |
| Total lease liabilities | | | $ | 153.7 | | | $ | 168.4 | |
_______________
(1) Operating lease assets, net are recorded net of accumulated amortization of $49.9 million and $40.7 million as of December 31, 2024, and 2023, respectively.
(2) Finance lease assets, net are recorded net of accumulated amortization in Property, plant, and equipment, net and Other assets, net of $81.4 million and $1.4 million, as of December 31, 2024, and $78.4 million and $1.5 million, as of December 31, 2023.
(3) Operating lease liabilities include $0.2 million and $0.5 million of accrued interest, as of December 31, 2024 and 2023, respectively.
Finance Leases
Our finance lease obligations of $100.0 million and $101.1 million at December 31, 2024 and 2023, respectively, primarily consist of two leases. The first obligation of $80.0 million, at December 31, 2024, is owed to the city of Wickliffe, Kentucky, associated with Performance Materials' Wickliffe, Kentucky, manufacturing plant, which is due at maturity in 2027. This obligation will be settled upon maturity utilizing liquid assets that have been placed into a trust established strictly for this purpose. The trust is presented as Restricted investment on the consolidated balance sheet in the amount of $81.6 million as of December 31, 2024, see Note 5 for more information. The remaining obligation of $20.0 million, at December 31, 2024, is primarily owed to the lessor of our corporate headquarters in North Charleston, South Carolina. The lease commenced in July 2020, with a term of 15 years, and is structured as a traditional rental with payments due on a monthly basis.
We also have a finance lease obligation due in 2031 for certain assets located at our Performance Materials' Waynesboro, Georgia, manufacturing plant. The lease is with the Development Authority of Burke County (“Authority”). The Authority established the sale-leaseback of these assets by issuing an industrial development revenue bond. The bond was purchased by Ingevity and the obligations under the finance lease remain with Ingevity. Accordingly, we offset the finance lease obligation and bond on our consolidated balance sheets.
Ingevity Corporation
Notes to the Consolidated Financial Statements
December 31, 2024
Components of lease cost are as follows:
| | | | | | | | | | | | | | | | | | | | | | | |
| | | Years Ended December 31, |
| In millions | Financial Statement Caption | | 2024 | | 2023 | | 2022 |
Operating lease cost (1) | | | | | | | |
| Cost of sales | | $ | 20.3 | | | $ | 21.0 | | | $ | 19.9 | |
| Selling, general, and administrative expenses | | 1.3 | | | 1.2 | | | 1.4 | |
| Finance lease cost | | | | | | | |
| Amortization of leased assets | Cost of sales | | $ | 3.2 | | | $ | 3.2 | | | $ | 3.0 | |
| Selling, general, and administrative expenses | | 1.6 | | | 1.6 | | | 1.6 | |
| Interest on lease liabilities | Interest expense, net | | 7.3 | | | 7.3 | | | 7.5 | |
Net lease cost (2) | | | $ | 33.7 | | | $ | 34.3 | | | $ | 33.4 | |
_______________
(1) Includes short-term leases and variable lease costs, which are immaterial.
(2) Only on the rare occasion do we sublease our leased assets; as a result, this amount excludes sublease income which is immaterial.
Maturity of Lease Liabilities
| | | | | | | | | | | | | | | | | |
| December 31, 2024 |
| In millions | Operating leases | | Finance leases | | Total |
| 2025 | $ | 19.9 | | | $ | 8.3 | | | $ | 28.2 | |
| 2026 | 15.2 | | | 8.4 | | | 23.6 | |
| 2027 | 11.6 | | | 85.4 | | | 97.0 | |
| 2028 | 6.7 | | | 2.4 | | | 9.1 | |
| 2029 | 4.0 | | | 2.4 | | | 6.4 | |
| 2030 and thereafter | 3.5 | | | 15.2 | | | 18.7 | |
| Total lease payments | $ | 60.9 | | | $ | 122.1 | | | $ | 183.0 | |
| Less: Interest | 7.2 | | | 22.1 | | | 29.3 | |
Present value of lease liabilities (1) | $ | 53.7 | | | $ | 100.0 | | | $ | 153.7 | |
_______________
(1) As of December 31, 2024, we have zero operating lease commitments that have not yet commenced related to manufacturing and office equipment leases.
Lease Term and Discount Rate
| | | | | | | | | | | |
| December 31, |
| In millions, except percentages and years | 2024 | | 2023 |
| Weighted-average remaining lease term (years) | | | |
| Operating leases | 4.0 | | 4.5 |
| Finance leases | 10.9 | | 11.9 |
| Weighted-average discount rate | | | |
| Operating leases | 5.95 | % | | 5.66 | % |
| Finance leases | 5.44 | % | | 7.21 | % |
Ingevity Corporation
Notes to the Consolidated Financial Statements
December 31, 2024
Other Information | | | | | | | | | | | | | | | | | |
| Years Ended December 31, |
| In millions | 2024 | | 2023 | | 2022 |
| Cash paid for amounts included in the measurement of lease liabilities: | | | | | |
| Operating cash flows from operating leases | $ | 21.7 | | | $ | 22.5 | | | $ | 18.8 | |
| Operating cash flows from finance leases | 7.3 | | | 7.3 | | | 7.5 | |
| Financing cash flows from finance leases | 1.0 | | | 0.7 | | | 0.9 | |
Note 14: Retirement Plans
Defined Contribution Plans
Eligible employees may participate in our retirement savings plan ("Plan"), a qualified salary-reduction plan under Section 401(k) of the U.S. Internal Revenue Code by contributing a portion of their compensation. For non-union eligible employees participating in the Plan, Ingevity makes matching contributions up to six percent of the employee deferral. In addition to the matching contributions, Ingevity also makes a non-elective contribution of three percent of eligible compensation per payroll for non-union employees. For eligible union employees participating in the Plan, Ingevity makes matching contributions up to 100 percent of the first three percent of the employee deferrals and 50 percent on the next two percent of deferrals. Employee contributions, as well as Ingevity’s match contributions, are made to funds designated by the participant, none of which are based on Ingevity’s common stock.
Charges associated with employer contributions to the Plan were $9.6 million, $11.4 million, and $11.2 million for the years ended December 31, 2024, 2023, and 2022, respectively.
Defined Benefit Pension and Postretirement Plans
Ingevity has both established qualified and non-qualified benefit plans to provide pension and post-retirement benefits to certain employees and retirees. Our retirement obligations consist of accrued defined benefit obligations earned by Ingevity domestic hourly union employees; accrued obligations from a frozen non-qualified defined benefit pension plan for certain salaried and former salaried employees of Ingevity; and other post-retirement medical and life insurance benefits.
We are required to recognize on our consolidated balance sheets the overfunded and underfunded status of our defined benefit postretirement plans. The overfunded and underfunded status is defined as the difference between the fair value of plan assets and the projected benefit obligation. We are also required to recognize, as a component of other comprehensive income, the actuarial gains and losses and the prior service costs and credits that arise during the period.
Ingevity Corporation
Notes to the Consolidated Financial Statements
December 31, 2024
The following tables summarize the weighted average assumptions used and components of our defined benefit postretirement plans at December 31, 2024 and 2023.
| | | | | | | | | | | | | | | | | | | | | | | |
| Pensions | | Other Benefits |
| December 31, |
| In millions, except percentages | 2024 | | 2023 | | 2024 | | 2023 |
| Following are the weighted average assumptions used to determine the benefit obligations at December 31: | | | | | | | |
| Discount rate - qualified benefit plans | 5.50 | % | | 4.80 | % | | — | % | | — | % |
| Discount rate - non-qualified benefit plans | 5.45 | % | | 4.80 | % | | 5.35 | % | | 4.70 | % |
| Rate of compensation increase | N/A | | N/A | | N/A | | N/A |
| Change in projected benefit obligation | | | | | | | |
| Projected benefit obligation at January 1 | $ | 35.5 | | | $ | 32.8 | | | $ | 0.7 | | | $ | 0.7 | |
| Service cost | 1.2 | | | 1.1 | | | — | | | — | |
| Interest cost | 1.7 | | | 1.6 | | | — | | | — | |
| Actuarial loss (gain) | (3.4) | | | 1.0 | | | — | | | 0.1 | |
| Plan amendments | — | | | 0.3 | | | — | | | — | |
| Benefit payments | (1.5) | | | (1.3) | | | — | | | (0.1) | |
Projected benefit obligation at December 31 (1) | 33.5 | | | 35.5 | | | 0.7 | | | 0.7 | |
| Change in plan assets | | | | | | | |
| Fair value of plan asset at January 1 | 26.6 | | | 23.1 | | | — | | | — | |
| Actual return on plan assets | 0.6 | | | 2.6 | | | — | | | — | |
| Company contributions | 0.3 | | | 2.2 | | | — | | | — | |
| Benefit payments | (1.5) | | | (1.3) | | | — | | | — | |
| Fair value of plan assets at December 31 | 26.0 | | | 26.6 | | | — | | | — | |
| Funded Status | | | | | | | |
| Net Funded Status of the Plan (Liability) | $ | (7.5) | | | $ | (8.9) | | | $ | (0.7) | | | $ | (0.7) | |
| | | | | | | |
| Pensions | | Other Benefits |
| December 31, |
| In millions | 2024 | | 2023 | | 2024 | | 2023 |
| Amount recognized on the consolidated balance sheets: | | | | | | | |
Pension and other postretirement benefit asset (2) | $ | — | | | $ | — | | | $ | — | | | $ | — | |
Pension and other postretirement benefit (liability) (2) | (7.5) | | | (8.9) | | | (0.7) | | | (0.7) | |
| Total Net Funded Status of the Plan (Liability) | $ | (7.5) | | | $ | (8.9) | | | $ | (0.7) | | | $ | (0.7) | |
_______________
(1) The accumulated benefit obligation for all years presented equals the projected benefit obligation for each plan, respectively.
(2) Asset balance is included within "Other assets" and liability balances are included within "Other liabilities" on the consolidated balance sheets.
Ingevity Corporation
Notes to the Consolidated Financial Statements
December 31, 2024
Amounts Recognized in Other Comprehensive Income (Loss)
Changes in plan assets and benefit obligations recognized in other comprehensive income (loss) are as follows:
| | | | | | | | | | | | | | | | | | | | | | | | | | | | | | | | | | | | | | | | | | | | | | | | | | | | | |
| Pensions | | Other Benefits | | Total |
| Years Ended December 31, |
| In millions | 2024 | | 2023 | | 2022 | | 2024 | | 2023 | | 2022 | | 2024 | | 2023 | | 2022 |
| Current year net actuarial loss (gain) | $ | (2.3) | | | $ | (0.4) | | | $ | (4.7) | | | $ | — | | | $ | — | | | $ | (0.1) | | | $ | (2.3) | | | $ | (0.4) | | | $ | (4.8) | |
| Current year prior service cost (credit) | — | | | 0.3 | | | 0.5 | | | — | | | — | | | (0.1) | | | — | | | 0.3 | | | 0.4 | |
| Amortization of net actuarial (loss) gain and prior service (cost) credit | (0.1) | | | (0.1) | | | (0.1) | | | — | | | — | | | — | | | (0.1) | | | (0.1) | | | (0.1) | |
| Settlement and curtailment (charges) income, net | (0.2) | | | — | | | (0.2) | | | — | | | — | | | — | | | (0.2) | | | — | | | (0.2) | |
| Total recognized in other comprehensive (income) loss, before taxes | (2.6) | | | (0.2) | | | (4.5) | | | — | | | — | | | (0.2) | | | (2.6) | | | (0.2) | | | (4.7) | |
| Total recognized in other comprehensive (income) loss, after taxes | $ | (2.0) | | | $ | (0.1) | | | $ | (3.4) | | | $ | — | | | $ | — | | | $ | (0.2) | | | $ | (2.0) | | | $ | (0.1) | | | $ | (3.6) | |
Amounts Recognized in Accumulated Other Comprehensive Income (Loss)
The amounts in accumulated other comprehensive income (loss) that have not yet been recognized as components of net periodic benefit cost are as follows: | | | | | | | | | | | | | | | | | | | | | | | | | | | | | | | | | | | |
| Pensions | | Other Benefits | | Total |
| December 31, |
| In millions | 2024 | | 2023 | | 2024 | | 2023 | | 2024 | | 2023 |
| Net actuarial (gain) loss | $ | (4.2) | | | $ | (2.0) | | | $ | — | | | $ | — | | | $ | (4.2) | | | $ | (2.0) | |
| Prior service cost (credit) | 1.0 | | | 1.4 | | | (0.1) | | | (0.1) | | | 0.9 | | | 1.3 | |
| Accumulated other comprehensive (income) loss, before taxes | (3.2) | | | (0.6) | | | (0.1) | | | (0.1) | | | (3.3) | | | (0.7) | |
| Accumulated other comprehensive (income) loss, after taxes | $ | (2.4) | | | $ | (0.4) | | | $ | (0.1) | | | $ | (0.1) | | | $ | (2.5) | | | $ | (0.5) | |
Ingevity Corporation
Notes to the Consolidated Financial Statements
December 31, 2024
Net Annual Benefit Costs Assumptions
The following table summarizes the weighted-average assumptions used for the components of net annual benefit cost:
| | | | | | | | | | | | | | | | | | | | | | | | | | | | | | | | | | | |
| Pensions | | Other Benefits |
| Years Ended December 31, |
| In millions, except percentages | 2024 | | 2023 | | 2022 | | 2024 | | 2023 | | 2022 |
Discount rate - qualified benefit plans (1) | 4.80 | % | | 5.00 | % | | 2.75 | % | | — | % | | — | % | | — | % |
Discount rate - non-qualified benefit plans (1) | 4.80 | % | | 5.00 | % | | 2.65 | % | | 4.70 | % | | 4.90 | % | | 2.60 | % |
| Expected return on plan assets | 6.50 | % | | 5.50 | % | | 5.50 | % | | N/A | | N/A | | N/A |
| Components of net annual benefit cost: | | | | | | | | | | | |
Service cost (2) | $ | 1.2 | | | $ | 1.1 | | | $ | 1.5 | | | $ | — | | | $ | — | | | $ | — | |
Interest cost (3) | 1.7 | | | 1.6 | | | 1.2 | | | — | | | — | | | — | |
Expected return on plan assets (3) | (1.7) | | | (1.3) | | | (1.7) | | | — | | | — | | | — | |
Amortization of prior service cost (2) | 0.2 | | | 0.2 | | | 0.2 | | | — | | | — | | | — | |
Amortization of net actuarial and other (gain) loss (3) | (0.1) | | | — | | | — | | | — | | | — | | | — | |
Recognized (gain) loss due to curtailments (2)(4) | 0.2 | | | — | | | 0.2 | | | — | | | — | | | — | |
| Net annual benefit cost | $ | 1.5 | | | $ | 1.6 | | | $ | 1.4 | | | $ | — | | | $ | — | | | $ | — | |
_______________
(1) The discount rate used to calculate pension and other post-retirement obligations was based on a review of available yields on high-quality corporate bonds. In selecting a discount rate, we placed particular emphasis on a discount rate yield-curve provided by our third-party actuary, which takes into consideration the projected cash flows that represent the expected timing and amount of our plans' benefit payments.
(2) Amounts are recorded to "Cost of sales" on our consolidated statements of operations consistent with the employee compensation costs that participate in the plan.
(3) Amounts are recorded to "Other (income) expense, net" on our consolidated statements of operations.
(4) Our pension and postretirement settlement and curtailment (income) charges are related to the acceleration of prior service costs as a result of a reduction in the number of participants within the Union Hourly defined benefit pension plan during 2024 and 2022.
Contributions
We made zero and $2.0 million voluntary cash contributions to our domestic hourly union defined benefit pension plan during the years ended December 31, 2024 and 2023, respectively. There were no voluntary cash contributions to our domestic hourly union defined benefit pension plan in the year ended December 31, 2022. The minimum required contribution to our domestic hourly union defined benefit plan for fiscal year 2025 is $1.4 million.
Fair Value Hierarchy
Following is a description of the valuation methodologies used for the investment measure at fair value. See Note 5 for the definition of fair value and the descriptions of Level 1, 2, and 3 in the fair value hierarchy.
•Cash and short-term funds — Cash and quoted short-term instruments are valued at the closing price or the amount held on deposit by the custodian bank.
•Mutual Funds — Mutual funds are valued at the closing price reported on the major market on which the individual securities are traded. Substantially all mutual funds are classified within Level 1 of the valuation hierarchy.
•Pooled Funds — These investment vehicles are valued using the Net Asset Value (NAV) provided by the fund administrator. The NAV is based on the value of the underlying assets owned by the fund, minus its liabilities, and then divided by the number of shares outstanding.
•Other — Other assets are represented by investments in a series limited partnership. These assets are not actively traded and are classified as Level 2.
Ingevity Corporation
Notes to the Consolidated Financial Statements
December 31, 2024
The following table presents our fair value hierarchy for our major categories of pension plan assets by asset class.
| | | | | | | | | | | | | | | | | | | | | | | | | | | | | |
| In millions | December 31, 2024 | | Level 1 | | Level 2 | | Level 3 | | Investments Measured at Net Asset Value |
| Cash and short-term investments | $ | 0.1 | | | $ | 0.1 | | | $ | — | | | $ | — | | | $ | — | |
| Mutual funds | 0.8 | | | 0.8 | | | — | | | — | | | — | |
| Pooled funds | 23.1 | | | — | | | — | | | — | | | 23.1 | |
| Other | 2.0 | | | — | | | 2.0 | | | — | | | — | |
| Total assets | $ | 26.0 | | | $ | 0.9 | | | $ | 2.0 | | | $ | — | | | $ | 23.1 | |
| | | | | | | | | |
| In millions | December 31, 2023 | | Level 1 | | Level 2 | | Level 3 | | Investments Measured at Net Asset Value |
| Cash and short-term investments | $ | 0.2 | | | $ | 0.2 | | | $ | — | | | $ | — | | | $ | — | |
| Mutual funds | 7.9 | | | 7.9 | | | — | | | — | | | — | |
| Pooled funds | 16.6 | | | — | | | — | | | — | | | 16.6 | |
| Other | 1.9 | | | — | | | 1.9 | | | — | | | — | |
| Total assets | $ | 26.6 | | | $ | 8.1 | | | $ | 1.9 | | | $ | — | | | $ | 16.6 | |
Estimated Future Benefit Payments
The following table reflects the estimated future benefit payments for our pension and other postretirement benefit plans. These estimates take into consideration expected future service, as appropriate.
| | | | | | | | | | | |
| In millions | Pensions | | Other Benefits |
| 2025 | $ | 1.3 | | | $ | 0.1 | |
| 2026 | 1.4 | | | 0.1 | |
| 2027 | 1.6 | | | 0.1 | |
| 2028 | 1.8 | | | 0.1 | |
| 2029 | 1.9 | | | 0.1 | |
| 2030-2034 | 11.6 | | | 0.3 | |
Sensitivity Analysis
A one-half percent increase in the assumed discount rate would have decreased our qualified pension benefit obligations by $1.9 million at December 31, 2024 and decreased our qualified pension benefit costs by $0.1 million for 2024. A one-half percent decrease in the assumed discount rate would have increased our qualified pension obligations by $2.1 million at December 31, 2024 and increased our qualified pension benefit cost by $0.1 million for 2024.
A one-half percent increase in the assumed expected long-term rate of return on plan assets would have decreased our qualified pension costs by $0.1 million for 2024. A one-half percent decrease in the assumed expected long-term rate of return on plan assets would have increased our qualified pension costs by $0.1 million for 2024.
Ingevity Corporation
Notes to the Consolidated Financial Statements
December 31, 2024
Note 15: Restructuring and Other (Income) Charges, net
Detail on the restructuring charges and other (income) charges, net is provided below.
| | | | | | | | | | | | | | | | | |
| Years Ended December 31, |
| In millions | 2024 | | 2023 | | 2022 |
| | | | | |
| | | | | |
| | | | | |
| | | | | |
| | | | | |
| | | | | |
| Restructuring charges | $ | 175.0 | | | $ | 125.6 | | | $ | — | |
| | | | | |
| | | | | |
| | | | | |
| | | | | |
| | | | | |
| Other (income) charges, net | 11.2 | | | 44.6 | | | 13.8 | |
| | | | | |
| Total Restructuring and other (income) charges, net | $ | 186.2 | | | $ | 170.2 | | | $ | 13.8 | |
Restructuring Charges
| | | | | | | | | | | | | | | | | | | | | | | |
| In millions | Severance and other employee-related costs | | Other charges (income) (1) | | Asset disposal charges (2) | | Total |
| Performance Chemicals' repositioning | $ | 9.8 | | | $ | 39.7 | | | $ | 123.2 | | | $ | 172.7 | |
Other (3) | 0.3 | | | 0.4 | | | 1.6 | | | 2.3 | |
| Year ended December 31, 2024 | $ | 10.1 | | | $ | 40.1 | | | $ | 124.8 | | | $ | 175.0 | |
| Performance Chemicals' repositioning | 8.6 | | 1.5 | | 103.0 | | 113.1 |
Other (3) | 9.8 | | 0.1 | | 2.6 | | 12.5 |
| Year ended December 31, 2023 | $ | 18.4 | | | $ | 1.6 | | | $ | 105.6 | | | $ | 125.6 | |
| | | | | | | |
| Other | — | | | — | | | — | | | — | |
| Year ended December 31, 2022 | $ | — | | | $ | — | | | $ | — | | | $ | — | |
_______________
(1) Primarily represents costs associated with contract terminations, plant and equipment decommissioning charges and other miscellaneous exit costs.
(2) Primarily represents property, plant, and equipment and finite-lived intangible asset write-downs, accelerated depreciation and amortization, and impairment charges on certain assets, which were or are to be disposed of or abandoned. Also included, to the extent incurred, the acceleration effect of re-estimating settlement dates and revised cost estimates associated with asset retirement obligations related to asset disposal charges that are included within restructuring charges.
(3) During 2023, we incurred severance and asset charges associated with targeted workforce reduction initiatives. During 2024, we took further steps to streamline our Performance Chemicals cost structure and improve the profitability of the segment, resulting in additional restructuring charges of $2.3 million, including $1.6 million in asset disposal charges, $0.2 million in foreign currency translation adjustments, and $0.2 million in other charges.
Performance Chemicals Repositioning
On November 1, 2023, we announced a number of strategic actions designed to reposition our Performance Chemicals reportable segment to improve profitability and reduce the cyclicality of the Company as a whole. These actions increased our focus on growing our most profitable Performance Chemicals product lines, such as road technologies, and diversifying our raw material stream to non-CTO based fatty acids. The repositioning focused on reducing exposure to lower margin end-use markets of our industrial specialties product line, such as adhesives, publication inks, and oilfield, representing approximately 45 percent of our industrial specialties product line's historical annualized net sales. The repositioning included the permanent closure of our Performance Chemicals CTO refinery and our manufacturing plant located in DeRidder, Louisiana (the “DeRidder Plant”), including the polyol production assets associated with the APT reportable segment. All production at the DeRidder Plant ceased in the first quarter of 2024. The Performance Chemicals’ repositioning initiative included additional corporate and business cost reduction actions executed in November 2023.
Additionally, in July 2024, we announced plans to transition the refining of oleo-based products manufactured for our Performance Chemicals reportable segment from our Crossett, Arkansas manufacturing plant (the “Crossett Facility”) to our North Charleston, South Carolina manufacturing plant. This action included the closure of the Crossett Facility, as well as additional corporate and business cost reduction actions. We ceased production at the Crossett Facility in the third quarter of 2024.
Ingevity Corporation
Notes to the Consolidated Financial Statements
December 31, 2024
The actions referenced above, when combined with other targeted workforce reduction initiatives, during 2024 and 2023 resulted in the reduction of Ingevity's global workforce by 23 percent. Specific to Performance Chemicals, the reduction represented approximately 40 percent of the reportable segment's workforce.
Expected Charges
We expect to incur total charges of approximately $350.0 million, excluding CTO resale activity as described below, associated with the Performance Chemicals repositioning, consisting of approximately $250.0 million in asset-related charges, approximately $25.0 million in severance and other employee-related costs, and approximately $75.0 million in other restructuring costs including decommissioning, dismantling and removal charges, and contract termination costs. We expect approximately $250.0 million of the total charges to be non-cash and $100.0 million to be settled in cash. Through December 31, 2024, we have incurred $311.8 million associated with these actions, including $244.8 million of non-cash asset-related charges, excluding $7.4 million related to an asset retirement obligation ("ARO"), and $67.0 million of charges to be settled in cash, which includes the aforementioned ARO. As of December 31, 2024, $54.5 million of the charges to be settled in cash have been paid and all non-cash charges have been incurred. In total, we expect approximately $100 million of cash charges, including approximately $20-$25 million during 2025.
Inventory Charges
The Company believes the collective actions of workforce, operational, and regional business exits will hinder our ability to dispose of the associated inventory on hand. As a result, in the years ended December 31, 2024 and 2023, we recorded $6.3 million and $19.7 million, respectively, of non-cash, lower of cost or market, inventory charges to adjust the carrying value of the impacted inventory to what we will realize upon disposal, less disposal costs. These inventory charges are recorded to Cost of sales on the consolidated statement of operations. Since these inventory charges are directly attributable to the Performance Chemicals’ repositioning, that is, they do not represent normal, recurring expenses necessary to operate our business, we have excluded such impact from the financial results of our Performance Chemicals reportable segment. Refer to Note 19 for more information.
CTO Resale Activity
The DeRidder Plant closure, and the corresponding reduced CTO refining capacity, significantly reduced our CTO volume requirements. However, we were obligated under an existing CTO supply contract to purchase CTO volumes through 2025 at amounts in excess of the CTO volumes needed to support our business operations. To manage this excess inventory, we sold CTO volumes (herein referred to as "CTO resales") in the open market. During the years ended December 31, 2024 and 2023, we incurred $52.7 million and $22.0 million of CTO resale losses, which are recorded as Other (income) expense, net on the consolidated statements of operations. Refer to Note 2, under the section: Non-operating income and expense, for more information.
On July 1, 2024, we terminated the CTO supply contract that resulted in these excess CTO volumes. As consideration for the early termination of the CTO supply contract, we made cash payments totaling $100.0 million during 2024. The charge was recorded within Other (income) expense, net on the consolidated statements of operations for the year ended December 31, 2024. As a result of the termination, the purchases under the CTO supply contract ended effective June 30, 2024. The CTO resale activity described above ended in 2024 and no excess CTO volumes were on hand at December 31, 2024.
The charges we currently expect to incur in connection with these actions are subject to a number of assumptions and risks, and actual results may differ materially. We may also incur other material charges not currently contemplated due to events that may occur as a result of, or in connection with, these actions.
Other (income) charges, net
Alternative feedstock transition
In April 2023, we implemented the feedstock transition of our Crossett, Arkansas manufacturing plant (“Crossett”). This transition converted Crossett from a CTO-based feedstock production facility to produce fatty acids from alternative plant-based feedstocks. During the years ended December 31, 2024 and 2023, we incurred zero and $22.1 million in costs, including zero and $8.8 million in asset disposal costs, respectively.
Ingevity Corporation
Notes to the Consolidated Financial Statements
December 31, 2024
North Charleston plant transition
Our North Charleston, South Carolina Performance Chemicals manufacturing plant has historically been co-located with a Smurfit WestRock Company (“WestRock”) paper mill. In May 2023, WestRock announced that it would permanently cease operating its North Charleston paper mill by August 31, 2023 and notified us that it was terminating the shared services in accordance with our operating agreement. WestRock ceased production at their North Charleston paper mill in June 2023. During 2023, we executed a transition plan to separate certain critical operating services WestRock had historically provided to us such as steam, water and wastewater treatment. During the years ended December 31, 2024 and 2023, we incurred charges of $11.2 million and $14.8 million, including $4.8 million and $4.3 million in asset disposal costs, respectively.
Business transformation costs
Our enterprise resource planning tool implementation and associated business transformation initiative concluded in the fourth quarter of 2023. Costs incurred, during the years ended December 31, 2024, 2023, and 2022, of zero, $7.7 million, and $13.8 million, respectively, represent costs directly associated with the business transformation initiative that, in accordance with GAAP, could not be capitalized.
Restructuring and Other (Income) Charges, net Reserves
The following table shows a roll forward of restructuring reserves that will result in cash spending, the majority of which relate to the Performance Chemicals' repositioning.
| | | | | | | | | | | | | | | | | | | | | | | | | | | | | |
| Balance at | | Change in | | Cash | | | | Balance at |
| In millions | 12/31/2023 (1) | | Reserve (2) | | Payments | | Other (3) | | 12/31/2024 (1) |
| | | | | | | | | |
| Severance and other employee-related costs | $ | 7.3 | | | 10.1 | | | (13.0) | | | (0.2) | | | $ | 4.2 | |
| Other charges (income) | 0.9 | | | 40.1 | | | (39.9) | | | (0.2) | | | 0.9 | |
| | | | | | | | | |
| | | | | | | | | |
| | | | | | | | | |
| Restructuring | 8.2 | | | 50.2 | | | (52.9) | | | (0.4) | | | 5.1 | |
| Other (income) charges, net | — | | | 6.4 | | | (6.4) | | | — | | | — | |
| Restructuring and Other (income) charges, net reserves | $ | 8.2 | | | 56.6 | | | (59.3) | | | (0.4) | | | $ | 5.1 | |
| | | | | | | | | |
| Balance at | | Change in | | Cash | | | | Balance at |
| In millions | 12/31/2022 (1) | | Reserve (2) | | Payments | | Other (3) | | 12/31/2023 (1) |
| | | | | | | | | |
| Severance and other employee-related costs | $ | — | | | 8.6 | | | (1.5) | | | 0.2 | | | $ | 7.3 | |
| Other charges (income) | 0.5 | | | 11.4 | | | (11.0) | | | — | | | 0.9 | |
| Restructuring | 0.5 | | | 20.0 | | | (12.5) | | | 0.2 | | | 8.2 | |
| Other (income) charges, net | — | | | 31.5 | | | (31.5) | | | — | | | — | |
| Restructuring and Other (income) charges, net reserves | $ | 0.5 | | | 51.5 | | | (44.0) | | | 0.2 | | | $ | 8.2 | |
_______________
(1) Included in "Accrued expenses" on the consolidated balance sheets.
(2) Includes severance and other employee-related costs, exited leases, CTO supply contract terminations and other miscellaneous exit costs. Any asset write-downs including accelerated depreciation and impairment charges are not included in the above table.
(3) Primarily foreign currency translation adjustments.
Ingevity Corporation
Notes to the Consolidated Financial Statements
December 31, 2024
Note 16: Acquisitions
Ozark Materials
On October 3, 2022, pursuant to that certain Equity Purchase Agreement (the “Purchase Agreement”), by and among Ingevity, Ozark Materials, LLC (“OM”), Ozark Logistics, LLC (“OL” and, together with OM, “Ozark Materials”) and Ozark Holdings, Inc. (“Seller”), we completed the acquisition of all of the issued and outstanding limited liability company membership interests of Ozark Materials for an aggregate purchase price of $344.5 million (the "Acquisition"). The purchase price allocation was finalized in the third quarter of 2023, with no material adjustments recorded. The Acquisition has been integrated into our Performance Chemicals reportable segment and is included within our road technologies product line. We funded the Acquisition through a combination of borrowings under our existing credit facilities and cash on hand.
The Acquisition is not considered significant to our Consolidated Financial Statements for all periods presented; therefore, proforma results of operations have not been presented.
Acquisition and other-related (income) costs
Costs incurred to complete and integrate acquisitions and other strategic investments are expensed as incurred on our consolidated statement of operations. The following table summarizes the costs incurred associated with these combined activities.
| | | | | | | | | | | | | | | | | |
| Years Ended December 31, |
| In millions | 2024 | | 2023 | | 2022 |
| Legal and professional service fees | $ | 0.3 | | | $ | 3.6 | | | $ | 5.0 | |
| | | | | |
| Acquisition-related costs | 0.3 | | | 3.6 | | | 5.0 | |
Inventory fair value step-up amortization (1) | — | | | 0.9 | | | 0.9 | |
| Acquisition and other-related (income) costs, net | $ | 0.3 | | | $ | 4.5 | | | $ | 5.9 | |
_______________
(1) Fair value of finished goods inventories acquired included a step-up in the value of $1.8 million, of which $0.9 million was expensed
during each of the years ended December 31, 2023 and 2022, respectively. The expense is included within "Cost of sales" on the consolidated
statement of operations. Inventories are accounted for on a FIFO basis of accounting.
Ingevity Corporation
Notes to the Consolidated Financial Statements
December 31, 2024
Note 17: Income Taxes
Domestic and foreign components of Income (loss) before income taxes are shown below:
| | | | | | | | | | | | | | | | | |
| Years Ended December 31, |
| In millions | 2024 | | 2023 | | 2022 |
| Domestic | $ | (473.6) | | | $ | (55.4) | | | $ | 200.0 | |
| Foreign | (62.0) | | | 45.3 | | | 69.6 | |
| Income (loss) before income taxes | $ | (535.6) | | | $ | (10.1) | | | $ | 269.6 | |
The provision (benefit) for income taxes consisted of:
| | | | | | | | | | | | | | | | | |
| Years Ended December 31, |
| In millions | 2024 | | 2023 | | 2022 |
| Current | | | | | |
| Federal | $ | 0.9 | | | $ | 25.8 | | | $ | 41.7 | |
| State and local | 0.9 | | | 2.9 | | | 6.3 | |
| Foreign | 14.3 | | | 11.3 | | | 15.0 | |
| Total current | $ | 16.1 | | | $ | 40.0 | | | $ | 63.0 | |
| Deferred | | | | | |
| Federal | $ | (101.0) | | | $ | (39.7) | | | $ | (4.6) | |
| State and local | (16.8) | | | (4.6) | | | (1.7) | |
| Foreign | (3.6) | | | (0.4) | | | 1.3 | |
| Total deferred | $ | (121.4) | | | $ | (44.7) | | | $ | (5.0) | |
| | | | | |
| Provision (benefit) for income taxes | $ | (105.3) | | | $ | (4.7) | | | $ | 58.0 | |
We recorded $1.3 million, zero, and $4.5 million of deferred tax provision (benefit) expense within components of other comprehensive income during the years ended December 31, 2024, 2023, and 2022, respectively.
Ingevity Corporation
Notes to the Consolidated Financial Statements
December 31, 2024
The following table summarizes the major differences between taxes computed at the U.S. federal statutory rate and the actual income tax provision attributable to operations:
| | | | | | | | | | | | | | | | | |
| Years Ended December 31, |
| In millions, except percentage data | 2024 | | 2023 | | 2022 |
| Federal statutory tax rate | $ | (112.5) | | | $ | (2.1) | | | $ | 56.6 | |
| State and local income taxes, net of federal benefit | (10.3) | | | (1.0) | | | 5.6 | |
| Foreign income tax rate differential | (2.4) | | | 1.7 | | | 2.2 | |
| Changes in valuation allowance | 1.4 | | | 1.3 | | | 0.1 | |
| Foreign derived intangible income | (1.4) | | | (2.4) | | | (5.9) | |
| | | | | |
| | | | | |
| Officers compensation | 0.4 | | | 0.9 | | | 0.6 | |
| Goodwill impairment | 26.8 | | | — | | | — | |
| Excess share-based compensation | 1.0 | | | (1.1) | | | (0.1) | |
| Federal and state tax credits | (11.3) | | | (4.2) | | | (4.8) | |
| | | | | |
| Legislative tax rate change | (0.1) | | | 0.5 | | | 0.8 | |
| Sustainably sourced feedstock benefit | (0.8) | | | (0.7) | | | (1.3) | |
| Uncertain tax positions | 1.0 | | | 0.5 | | | 0.5 | |
| | | | | |
Tax on Dividends, Deemed Dividends, and GILTI (1) | 1.3 | | | 0.5 | | | 2.6 | |
| Other | 1.6 | | | 1.4 | | | 1.1 | |
| Provision (benefit) for income taxes | $ | (105.3) | | | $ | (4.7) | | | $ | 58.0 | |
| Effective tax rate | 19.7 | % | | 46.5 | % | | 21.5 | % |
_______________
(1) GILTI is defined as Global Intangible Low Tax Income
The decrease in our effective tax rate from 2023 to 2024 was mainly driven by the mix of earnings, with extensive U.S. losses, primarily due to the Performance Chemicals goodwill impairment (see Note 8) and restructuring activities (see Note 15), driving an overall global loss and tax benefit for the year. Approximately 31% of the goodwill impaired had an impact to the tax rate, offsetting the overall tax benefit. Significant increases in federal and state tax credits further increased the overall tax benefit as compared to prior years.
The increase in our effective tax rate from 2022 to 2023 was mainly driven by the mix of earnings, with U.S. losses, primarily due to the restructuring activities during the year (see Note 15), driving an overall global loss and tax benefit for the year. Furthermore, significant decline in U.S. taxable earnings drove a decrease in the foreign derived intangible income benefit as compared to prior years skewing the effective tax rate.
Ingevity Corporation
Notes to the Consolidated Financial Statements
December 31, 2024
The significant components of deferred tax assets and liabilities are as follows:
| | | | | | | | | | | |
| December 31, |
| In millions | 2024 | | 2023 |
| Deferred tax assets: | | | |
| | | |
| Employee benefits | $ | 15.4 | | | $ | 13.3 | |
| Intangibles (including goodwill) | 30.5 | | | — | |
| | | |
| Net operating losses | 18.6 | | | 10.6 | |
| | | |
| Inventory | 11.2 | | | 16.9 | |
| Leases | 15.8 | | | 18.7 | |
| Litigation verdict accrual | 21.4 | | | 20.5 | |
| Research and experimental expenses | 29.9 | | | 15.3 | |
| Interest limitation | 24.5 | | | 7.6 | |
| Other | 21.8 | | | 16.3 | |
| Total deferred tax assets | $ | 189.1 | | | $ | 119.2 | |
| Valuation allowance | (11.0) | | | (11.1) | |
| Total deferred tax assets, net of valuation allowance | $ | 178.1 | | | $ | 108.1 | |
| Deferred tax liabilities: | | | |
| Fixed assets | $ | 96.9 | | | $ | 115.9 | |
| Intangibles (including goodwill) | — | | | 29.3 | |
| | | |
| Leases | 14.6 | | | 18.4 | |
| Other | 4.9 | | | 3.8 | |
| Total deferred tax liabilities | $ | 116.4 | | | $ | 167.4 | |
Net deferred tax asset (liability) (1) | $ | 61.7 | | | $ | (59.3) | |
_______________
(1) Presentation in the table above is on a gross basis, however, due to jurisdictional netting, our net deferred tax asset and liability recorded on the consolidated balance sheets were $117.9 million and $56.2 million, respectively, as of December 31, 2024, and $11.6 million and $70.9 million, respectively, as of December 31, 2023.
Our net deferred tax liability changed to an overall net deferred tax asset in 2024 compared to 2023, with a total change of $121.0 million. The pre-tax Performance Chemicals reporting unit goodwill impairment charge of $349.1 million (refer to Note 8 for more detail) and additional Performance Chemicals repositioning restructuring spending (refer to Note 15 for more detail) during 2024 resulted in a change from a deferred liability to an asset.
Due to taxable losses in the U.S. in 2024, additional net operating losses were generated, further increasing the deferred tax asset for the year. As part of Tax Cuts and Jobs Act ("TCJA") enacted in December 2017 under Internal Revenue Code ("IRC") Section 174, we were required to capitalize and amortize research and experimental expenditures. This requirement continued to increase the deferred tax asset for 2024. Also, as modified by TCJA, IRC Section 163(j) limits U.S. business interest expense deductions as a function of adjusted taxable income. In 2024 due to overall taxable losses, Ingevity's interest expense deduction was fully limited, increasing the deferred tax asset for 2024.
We have deferred tax assets, including net operating loss and state tax credit carryforwards, which are available to offset future taxable income. A valuation allowance has been provided where management has determined that it is more likely than not that the deferred tax assets will not be realized. In 2024, we recognized tax expense of $1.4 million due to our expected inability to recognize the benefit associated with state tax credits prior to their expiration.
At December 31, 2024, net operating loss carryforwards totaled $64.4 million of which we have recorded deferred tax assets of $18.6 million. Of this total, $0.1 million will expire in 10 years, $0.3 million will expire in 15 years, $0.9 million will expire in 20 years, and $17.3 million will never expire.
Ingevity Corporation
Notes to the Consolidated Financial Statements
December 31, 2024
Due to the global nature of our operations, a portion of our cash is held outside the U.S. The cash and cash equivalent balance at December 31, 2024 included $63.9 million held by our foreign subsidiaries. At December 31, 2024, 2023, and 2022, no deferred income taxes have been provided for our share of undistributed net earnings of foreign operations due to management’s intent to reinvest such amounts indefinitely. The determination of the amount of taxes that may be due if earnings are remitted is not practicable because such liability, if any, is dependent on circumstances that exist if and when remittance occurs. The circumstances that would affect the calculations include the source location and amount of the distribution, the underlying tax rate already paid on the earnings, foreign withholding taxes, the opportunity to use foreign tax credits, and the potential impact of future tax reform. Positive undistributed earnings considered to be indefinitely reinvested totaled $40.0 million at December 31, 2024.
A reconciliation of the beginning and ending amounts of unrecognized tax benefits is as follows:
| | | | | | | | | | | | | | | | | |
| Years ended December 31, |
| In millions | 2024 | | 2023 | | 2022 |
| Balance at beginning of year | $ | 1.2 | | | $ | 0.8 | | | $ | 0.3 | |
| | | | | |
| Additions for tax positions related to prior years | 1.2 | | | 0.4 | | | 0.5 | |
| | | | | |
| | | | | |
| | | | | |
| Reduction for lapse of statute of limitation | (0.3) | | | — | | | — | |
Balance at end of year (1) | $ | 2.1 | | | $ | 1.2 | | | $ | 0.8 | |
_______________(1) Included in "Other liabilities" on the consolidated balance sheets.
As of December 31, 2024, 2023, and 2022, $2.4 million, $1.4 million, and $0.9 million, respectively, of unrecognized tax benefit, including penalties and interest, would, if recognized, impact our effective tax rate. We recognize interest accrued related to unrecognized tax benefits and penalties as income tax expense.
Pillar Two, released by the Organisation for Economic Cooperation and Development (OECD), went into effect on January 1, 2024. Pillar Two’s intent is to create a 15% global minimum tax for all jurisdictions in which multinational enterprises operate. To date, thirteen of our reporting jurisdictions have enacted final legislation adopting Pillar Two. While we do not anticipate that this legislation will have a material impact on our tax provision or effective tax rate, we continue to monitor evolving tax legislation in the jurisdictions in which we operate. No tax impacts of Pillar Two were recorded for the year ended December 31, 2024.
Ingevity Corporation
Notes to the Consolidated Financial Statements
December 31, 2024
Note 18: Commitments and Contingencies
Legal Proceedings
On July 19, 2018, we filed suit against BASF Corporation (“BASF”) in the United States District Court for the District of Delaware (the “Delaware Proceeding”) alleging BASF infringed Ingevity’s patent covering canister systems used in the control of automotive gasoline vapor emissions (U.S. Patent No. RE38,844) (the “844 Patent”). On February 14, 2019, BASF asserted counterclaims against us in the Delaware Proceeding, alleging two claims for violations of U.S. antitrust law (one for exclusive dealing and the other for tying) as well as a claim for tortious interference with an alleged prospective business relationship between BASF and a BASF customer (the “BASF Counterclaims”). The BASF Counterclaims relate to our enforcement of the 844 Patent and our entry into several supply agreements with customers of its fuel vapor canister honeycombs. The U.S. District Court dismissed our patent infringement claims on November 18, 2020, and the case proceeded to trial on the BASF Counterclaims in September 2021.
On September 15, 2021, a jury in the Delaware Proceeding issued a verdict in favor of BASF on the BASF Counterclaims and awarded BASF damages of approximately $28.3 million, which will be trebled under U.S. antitrust law to approximately $85.0 million. On May 18, 2023, the court in the Delaware Proceeding entered judgment on the jury’s verdict, which commenced the post-trial briefing stage. On February 13, 2024, the court in the Delaware Proceeding denied BASF’s motion for pre-judgment interest on its tortious interference claim as well as our motion seeking judgment as a matter of law, or a new trial in the alternative. In addition, BASF has indicated it will seek attorneys’ fees and costs in amounts that they will allege and have to demonstrate at a future date. Unless the judgment is set aside, BASF will be entitled to post-judgment interest pursuant to the rate provided under federal law.
We disagree with the verdict, including the court’s application of the law and entry of judgment. Therefore, on March 13, 2024, we appealed the verdict as well as the U.S. District Court’s November 2020 dismissal of our patent infringement claims against BASF. Ingevity believes in the strength of its intellectual property and the merits of its position and intends to pursue all legal relief available to challenge these outcomes in the Delaware Proceeding. Final resolution of these matters could take up to 15 months from the date of this Annual Report on Form 10-K.
As of December 31, 2024, nothing has occurred in the post-trial proceedings to warrant any change to our conclusions as disclosed within our 2023 Annual Report. The full amount of the trebled jury verdict, $85.0 million, is accrued within Other liabilities on the consolidated balance sheets as of December 31, 2024 and the charge was included within Other (income) expense, net on the consolidated statement of operations for the year ended December 31, 2021. In addition, as a result of the judgment being officially entered on May 18, 2023, we have started accruing for post-judgment interest at the legally mandated interest rate. As of December 31, 2024 and 2023, the total amount accrued, inclusive of post-judgement interest, was $91.4 million and $87.4 million, respectively. The amount of any liability we may ultimately incur could be more or less than the amount accrued.
Ingevity Corporation
Notes to the Consolidated Financial Statements
December 31, 2024
Note 19: Segment Information
Ingevity’s operating segments are (i) Performance Materials, (ii) Performance Chemicals, and (iii) Advanced Polymer Technologies. A description of our operating segments is included in Note 1. Our operating segments were determined based upon the nature of the products produced, the nature of the production process, the type of customer for the products, the similarity of economic characteristics, and the manner in which management reviews results. Segment EBITDA is the primary measure used by the chief operating decision maker ("CODM"), the Interim CEO and President of Ingevity, to evaluate the performance of and allocate resources among our operating segments. The CODM utilizes Segment EBITDA for each operating segment in the annual budgeting and forecasting process. Segment EBITDA enables the CODM to compare each business and make informed and consistent resource allocation decisions.
| | | | | | | | | | | | | | | | | |
| Years Ended December 31, |
| In millions | 2024 | | 2023 | | 2022 |
| | | | | |
| | | | | |
| | | | | |
| | | | | |
| | | | | |
Segment EBITDA (1)(2) | | | | | |
| Performance Materials | $ | 319.1 | | | $ | 286.6 | | | $ | 252.2 | |
| Performance Chemicals | 14.7 | | | 65.7 | | | 160.4 | |
| Advanced Polymer Technologies | 35.2 | | | 44.5 | | | 40.0 | |
Total Segment EBITDA (1)(2) | $ | 369.0 | | | $ | 396.8 | | | $ | 452.6 | |
| Interest expense | (97.8) | | | (93.3) | | | (61.8) | |
| Interest income | 7.7 | | | 6.3 | | | 7.5 | |
| (Provision) benefit for income taxes | 105.3 | | | 4.7 | | | (58.0) | |
| Depreciation and amortization | (108.3) | | | (122.8) | | | (108.8) | |
Restructuring and other income (charges), net (3) | (186.2) | | | (170.2) | | | (13.8) | |
Goodwill impairment charge (4) | (349.1) | | | — | | | — | |
Acquisition and other-related income (costs), net (5) | (0.3) | | | (4.5) | | | (5.9) | |
Inventory charges (6) | (6.3) | | | (19.7) | | | — | |
Loss on CTO resales (7) | (52.7) | | | (22.0) | | | — | |
CTO supply contract termination charges (7) | (100.0) | | | — | | | — | |
Gain (loss) on sale of strategic investment (8) | (11.4) | | | 19.3 | | | — | |
| | | | | |
Pension and postretirement settlement and curtailment income (charges), net (9) | (0.2) | | | — | | | (0.2) | |
| Net income (loss) | $ | (430.3) | | | $ | (5.4) | | | $ | 211.6 | |
_______________
(1) Segment EBITDA is defined as segment net sales less segment operating expenses (segment operating expenses consist of costs of sales, selling, general and administrative expenses, research and technical expenses, other (income) expense, net, excluding depreciation and amortization). We have excluded the following items from segment EBITDA: interest expense associated with corporate debt facilities, interest income, income taxes, depreciation, amortization, restructuring and other income (charges), net, inventory lower of cost or market charges associated with restructuring actions, acquisition and other-related income (costs), gain (loss) on sale of strategic investments, loss on CTO resales, CTO supply contract termination charges, and pension and postretirement settlement and curtailment income (charges), net.
Ingevity Corporation
Notes to the Consolidated Financial Statements
December 31, 2024
(2) Segment expenses included within the primary measure used by our CODM are included within the below table.
| | | | | | | | | | | | | | | | | | | | | | | | | | | | | | | | | | | | | | | | | | | | | | | | | | | | | |
| Years Ended December 31, |
| 2024 | | 2023 | | 2022 |
| In millions, except per share data | PM | | PC | | APT | | PM | | PC | | APT | | PM | | PC | | APT |
Net sales (1) | $ | 609.6 | | | $ | 608.2 | | | $ | 188.6 | | | $ | 586.0 | | | $ | 902.1 | | | $ | 204.0 | | | $ | 548.5 | | | $ | 875.1 | | | $ | 244.7 | |
| Less: | | | | | | | | | | | | | | | | | |
Cost of sales (2) (3) | 233.9 | | | 515.5 | | | 129.9 | | | 254.2 | | | 743.2 | | | 135.2 | | | 237.6 | | | 614.2 | | | 180.0 | |
| | | | | | | | | | | | | | | | | |
Selling, general, and administrative expenses (2) (4) | 56.8 | | | 73.3 | | | 22.3 | | | 46.1 | | | 92.8 | | | 22.1 | | | 58.8 | | | 99.6 | | | 28.5 | |
Other income (expense), net (2) (5) | 0.2 | | | (4.7) | | | (1.2) | | | 0.9 | | | (0.4) | | | (2.2) | | | 0.1 | | | (0.9) | | | 3.8 | |
| Segment EBITDA | $ | 319.1 | | | $ | 14.7 | | | $ | 35.2 | | | $ | 286.6 | | | $ | 65.7 | | | $ | 44.5 | | | $ | 252.2 | | | $ | 160.4 | | | $ | 40.0 | |
| _______________ |
| (1) Relates to external customers only. Refer to Note 4 for a reconciliation to consolidated Net sales. |
| (2) Excludes Depreciation and amortization. |
| (3) Inventory charges representing lower of cost or market charges associated with the Performance Chemicals repositioning and restructuring actions were not allocated in the measurement of Performance Chemicals reportable segment profitability used by our CODM. Amounts are included in Cost of sales on the consolidated statements of operations. |
| (4) Includes Research and technical expenses. |
| (5) We have excluded the following items from Other income (expense), net: gain (loss) on sale of strategic investments, loss on CTO resales, CTO supply contract termination charges, depreciation, and amortization. |
(3) We regularly perform strategic reviews and assess the return on on our operations, which sometimes results in a plan to restructure the business. These costs are excluded from our reportable segment results. The table below provides an allocation of Restructuring and other income (charges), net between our three reportable segments to provide investors, potential investors, securities analysts and others with the information, should they choose, to apply such (income) charges to each respective reportable segment for which the charges relate.
| | | | | | | | | | | | | | | | | |
| Years Ended December 31, |
| In millions | 2024 | | 2023 | | 2022 |
| Performance Materials | $ | 0.9 | | | $ | 9.0 | | | $ | 4.8 | |
| Performance Chemicals | 185.1 | | 144.5 | | | 7.0 | |
Advanced Polymer Technologies (1) | 0.2 | | | 16.7 | | | 2.0 | |
Restructuring and other (income) charges, net (2) | $ | 186.2 | | | $ | 170.2 | | | $ | 13.8 | |
| _________________ |
| (1) Included in the charges for the year ended December 31, 2023 was $13.3 million of asset disposal charges associated with Advanced Polymer Technologies polyol production assets located at the DeRidder Plant. |
| (2) Refer to Note 15 for more information. |
(4) For the year ended December 31, 2024, charges relate to the Performance Chemicals reportable segment. Refer to Note 8 for more information.
(5) The table below provides an allocation of Acquisition and other-related income (costs), net between our three reportable segments to provide investors, potential investors, securities analysts and others with the information, should they choose, to apply such (income) charges to each respective reportable segment for which the charges relate. For more detail on these charges see Note 16.
| | | | | | | | | | | | | | | | | |
| Years Ended December 31, |
| In millions | 2024 | | 2023 | | 2022 |
| Performance Materials | $ | — | | | $ | — | | | $ | 0.3 | |
| Performance Chemicals | 0.3 | | 4.5 | | | 5.6 | |
| Advanced Polymer Technologies | — | | | — | | | — | |
| Acquisition and other-related (income) costs, net | $ | 0.3 | | | $ | 4.5 | | | $ | 5.9 | |
(6) For the year ended December 31, 2024 and 2023, inventory charges represent lower of cost or market charges associated with the Performance Chemicals’ repositioning and restructuring actions. These charges were not allocated in the measurement of Performance Chemicals reportable segment profitability used by our CODM. Amounts are included in Cost of sales on the consolidated statements of operations.
(7) For the year ended December 31, 2024, CTO supply contract termination charges relate to the Performance Chemicals reportable segment. Refer to Note 2, under the section: Non-operating income and expense, for more information.
Ingevity Corporation
Notes to the Consolidated Financial Statements
December 31, 2024
(8) We exclude gains and losses from sales of strategic investments from our segment results because we do not consider such gains or losses to be directly associated with the operational performance of the segment. We believe that the inclusion of such gains or losses, would impair the factors and trends affecting the historical financial performance of our reportable segments. We continue to include undistributed earnings or loss, distributions, amortization or accretion of basis differences, and other-than-temporary impairments for equity method investments that we believe are directly attributable to the operational performance of such investments, in our reportable segment results. Refer to Note 5, under the section: Strategic Investments, for more information.
| | | | | | | | | | | | | | | | | |
| Years Ended December 31, |
| In millions | 2024 | | 2023 | | 2022 |
| Performance Materials | $ | (0.1) | | | $ | (19.3) | | | $ | — | |
| Performance Chemicals | 9.3 | | — | | | — | |
| Advanced Polymer Technologies | 2.2 | | | — | | | — | |
| (Gain) loss on sale of strategic investment | $ | 11.4 | | | $ | (19.3) | | | $ | — | |
(9) Our pension and postretirement settlement and curtailment charges (income) are related to the acceleration of prior service costs, as a result of a reduction in the number of participants within the Union Hourly defined benefit pension plan. These are excluded from our segment results because we consider these costs to be outside our operational performance. We continue to include the service cost, amortization of prior service cost, interest costs, expected return on plan assets, and amortized actual gains and losses in our segment EBITDA.
| | | | | | | | | | | | | | | | | |
| Years Ended December 31, |
| In millions | 2024 | | 2023 | | 2022 |
| Performance Materials | $ | — | | | $ | — | | | $ | 0.2 | |
| Performance Chemicals | 0.2 | | — | | | — | |
| Advanced Polymer Technologies | — | | | — | | | — | |
| Pension and postretirement settlement and curtailment (income) charges, net | $ | 0.2 | | | $ | — | | | $ | 0.2 | |
| | | | | | | | | | | | | | | | | |
| Depreciation and amortization | Years Ended December 31, |
| In millions | 2024 | | 2023 | | 2022 |
| Performance Materials | $ | 38.7 | | | $ | 38.3 | | | $ | 36.1 | |
| Performance Chemicals | 38.8 | | | 53.2 | | | 43.1 | |
| Advanced Polymer Technologies | 30.8 | | | 31.3 | | | 29.6 | |
| Total depreciation and amortization | $ | 108.3 | | | $ | 122.8 | | | $ | 108.8 | |
| | | | | | | | | | | | | | | | | |
| Capital expenditures | Years Ended December 31, |
| In millions | 2024 | | 2023 | | 2022 |
| Performance Materials | $ | 38.5 | | | $ | 36.4 | | | $ | 59.8 | |
| Performance Chemicals | 22.9 | | | 49.6 | | | 62.4 | |
| Advanced Polymer Technologies | 16.2 | | | 23.8 | | | 20.3 | |
| Total capital expenditures | $ | 77.6 | | | $ | 109.8 | | | $ | 142.5 | |
Ingevity Corporation
Notes to the Consolidated Financial Statements
December 31, 2024
| | | | | | | | | | | |
| Property, plant, and equipment, net | December 31, |
| In millions | 2024 | | 2023 |
North America (1) | $ | 482.3 | | | $ | 581.0 | |
Asia Pacific (1) | 63.3 | | | 71.4 | |
Europe, Middle East, and Africa (1) | 113.2 | | | 109.7 | |
| South America | 0.1 | | | 0.1 | |
| Property, plant, and equipment, net | $ | 658.9 | | | $ | 762.2 | |
_______________
(1) The countries with Property, plant, and equipment, net in excess of 10 percent of consolidated Property, plant, and equipment, net at December 31, 2024 and 2023 are the U.S., which totaled $482.3 million and $581.0 million, the U.K., which totaled $112.5 million and $108.8 million, and China, which totaled $63.2 million and $71.3 million, respectively.
| | | | | | | | | | | |
| Total assets | December 31, |
| In millions | 2024 | | 2023 |
| Performance Materials | $ | 781.6 | | | $ | 738.0 | |
Performance Chemicals (1) | 613.0 | | | 1,218.1 | |
| Advanced Polymer Technologies | 565.0 | | | 598.0 | |
Total segment assets (2) | $ | 1,959.6 | | | $ | 2,554.1 | |
| Corporate and other | 63.0 | | | 69.2 | |
| Total assets | $ | 2,022.6 | | | $ | 2,623.3 | |
_______________
(1) The decline in the Performance Chemicals segment in 2024, as compared to 2023, was driven by our Performance Chemicals repositioning actions and Goodwill impairment charge. Refer to Notes 8 and 15 for more information.
(2) Segment assets exclude assets not specifically managed as part of one specific segment herein referred to as "Corporate and other."
Ingevity Corporation
Notes to the Consolidated Financial Statements
December 31, 2024
Note 20: Earnings (Loss) per Share
| | | | | | | | | | | | | | | | | |
| Years Ended December 31, |
| In millions (except share (in thousands) and per share data) | 2024 | | 2023 | | 2022 |
| Net income (loss) | $ | (430.3) | | | $ | (5.4) | | | $ | 211.6 | |
| | | | | |
Basic and Diluted earnings (loss) per share (1) | | | | | |
| Basic earnings (loss) per share | $ | (11.85) | | | $ | (0.15) | | | $ | 5.54 | |
| Diluted earnings (loss) per share | $ | (11.85) | | | $ | (0.15) | | | $ | 5.50 | |
| | | | | |
| Shares | | | | | |
| Weighted average number of shares of common stock outstanding - Basic | 36,323 | | | 36,496 | | | 38,179 | |
Weighted average additional shares assuming conversion of potential common shares (2) | — | | | — | | | 292 | |
| Shares - diluted basis | 36,323 | | | 36,496 | | | 38,471 | |
_______________(1) Diluted earnings (loss) per share is calculated using net income (loss) available to common stockholders divided by diluted weighted average shares of common shares outstanding during each period, which includes the dilutive effect of outstanding equity awards.
(2) For the years ended December 31, 2024 and 2023, all potentially dilutive common shares were excluded from the calculation of diluted earnings (loss) per share as we had a net loss for the period.
The following average number of potential common shares were antidilutive and, therefore, were not included in the diluted earnings per share calculation:
| | | | | | | | | | | | | | | | | |
| Years Ended December 31, |
| In thousands | 2024 | | 2023 | | 2022 |
| Average number of potential common shares - antidilutive | 444 | | | 571 | | | 204 | |
Ingevity Corporation
Notes to the Consolidated Financial Statements
December 31, 2024
Note 21: Supplemental Information
The following tables include details of prepaid and other current assets, other assets, accrued expenses and other liabilities as presented on the consolidated balance sheets, as well as other (income) expense, net on the consolidated statement of operations:
| | | | | | | | | | | |
| Prepaid and other current assets: | December 31, |
| In millions | 2024 | | 2023 |
| Income and value added tax receivables | $ | 22.1 | | | $ | 12.0 | |
| Prepaid freight and supply agreements | 2.1 | | | 2.5 | |
| Prepaid insurance | 1.2 | | | 1.9 | |
| Non-trade receivables | 2.4 | | | 5.8 | |
| Advances to suppliers | 2.3 | | | 1.0 | |
| Prepaid software as a service | 2.2 | | | 4.1 | |
| Contract asset (Note 4) | 6.5 | | | 11.2 | |
| Restricted cash | 0.4 | | | 0.6 | |
| CTO resales (Note 2) | 6.2 | | | 24.2 | |
| Planned major maintenance activities | 2.3 | | | 2.5 | |
| Currency exchange and natural gas contracts (Note 9) | 0.6 | | | 0.5 | |
| Assets held for sale | 3.7 | | | — | |
| Other | 5.4 | | | 5.6 | |
| $ | 57.4 | | | $ | 71.9 | |
| | | | | | | | | | | |
| Other assets: | December 31, |
| In millions | 2024 | | 2023 |
| Deferred financing charges | $ | 2.8 | | | $ | 3.9 | |
| Capitalized software, net | 40.9 | | | 44.8 | |
| Land-use rights | 4.2 | | | 4.4 | |
| | | |
| Deferred software as a service | 2.2 | | | 2.8 | |
| Deferred compensation plan assets (Note 5) | 20.2 | | | 17.9 | |
| Interest rate swap contracts (Note 9) | 0.6 | | | — | |
| Finance lease assets, net (Note 13) | — | | | 0.1 | |
| | | |
| | | |
| Other | 8.4 | | | 8.0 | |
| $ | 79.3 | | | $ | 81.9 | |
Ingevity Corporation
Notes to the Consolidated Financial Statements
December 31, 2024
| | | | | | | | | | | |
| Accrued expenses: | December 31, |
| In millions | 2024 | | 2023 |
| Accrued interest | $ | 9.8 | | | $ | 10.0 | |
| Accrued taxes | 4.9 | | | 7.5 | |
| Accrued freight | 1.2 | | | 1.8 | |
| Accrued rebates | 13.7 | | | 10.4 | |
| Restructuring reserves (Note 15) | 5.2 | | | 8.2 | |
| | | |
| Accrued royalties and commissions | 1.2 | | | 2.0 | |
| Currency exchange and natural gas contracts (Note 9) | 0.2 | | | 1.4 | |
| Accrued energy | 1.8 | | | 2.3 | |
| CTO resales (Note 2) | — | | | 13.6 | |
| Asset retirement obligations (Note 2) | 8.9 | | | 5.5 | |
| Other | 11.2 | | | 9.6 | |
| $ | 58.1 | | | $ | 72.3 | |
| | | | | | | | | | | |
| Other liabilities: | December 31, |
| In millions | 2024 | | 2023 |
| | | |
| Deferred compensation arrangements (Note 5) | $ | 15.9 | | | $ | 15.5 | |
| Pension & OPEB liabilities (Note 14) | 8.2 | | | 9.6 | |
| Unrecognized tax benefits (Note 17) | 2.4 | | | 1.4 | |
| | | |
| | | |
| | | |
| | | |
| Litigation verdict accrual (Note 18) | 91.4 | | | 87.4 | |
| | | |
| Asset retirement obligations (Note 2) | 7.4 | | | 7.4 | |
| Other | 5.3 | | | 5.4 | |
| $ | 130.6 | | | $ | 126.7 | |
| | | | | | | | | | | | | | | | | |
| Other (income) expense, net: | Years Ended December 31, |
| In millions | 2024 | | 2023 | | 2022 |
| (Gain)/loss on sale of strategic investment (Note 5) | $ | 11.4 | | | $ | (19.3) | | | $ | — | |
| Foreign currency transaction (gain)/loss | 4.2 | | | 3.7 | | | 2.3 | |
| CEO severance charges | 4.8 | | | — | | | — | |
| Loss on CTO resales (Note 2) | 52.7 | | | 22.0 | | | — | |
| CTO supply contract termination charges (Note 2) | 100.0 | | | — | | | — | |
| Other (income)/expense, net | (3.3) | | | (0.7) | | | (4.0) | |
| $ | 169.8 | | | $ | 5.7 | | | $ | (1.7) | |
INGEVITY CORPORATION
SCHEDULE II - VALUATION AND QUALIFYING ACCOUNTS AND RESERVES
FOR YEARS ENDED DECEMBER 31, 2024, 2023, and 2022 | | | | | | | | | | | | | | | | | | | | | | | | | | | | | | | | | | | |
| | | Provision/ (Benefit) | | | | |
| In millions | Balance, Beginning of Year | | Charged to Costs and Expenses | | Charged to Other Comprehensive Income | | Charged to Retained Earnings | | Write-offs (1) | | Balance, End of Year |
| December 31, 2024 | | | | | | | | | | | |
Accounts receivable credit loss allowance (2) | $ | 1.1 | | | (0.2) | | | — | | | — | | | (0.3) | | | $ | 0.6 | |
Held-to-maturity debt securities credit loss allowance (3) | $ | 0.2 | | | — | | | — | | | — | | | — | | | $ | 0.2 | |
| Deferred tax valuation allowance | $ | 11.1 | | | 1.4 | | | (1.5) | | | — | | | — | | | $ | 11.0 | |
| December 31, 2023 | | | | | | | | | | | |
Accounts receivable credit loss allowance (2) | $ | 0.5 | | | 0.6 | | | — | | | — | | | — | | | $ | 1.1 | |
Held-to-maturity debt securities credit loss allowance (3) | $ | 0.6 | | | (0.4) | | | — | | | — | | | — | | | $ | 0.2 | |
| Deferred tax valuation allowance | $ | 9.2 | | | 1.3 | | | 0.6 | | | — | | | — | | | $ | 11.1 | |
| December 31, 2022 | | | | | | | | | | | |
Accounts receivable credit loss allowance (2) | $ | 2.0 | | | 0.3 | | | — | | | — | | | (1.8) | | | $ | 0.5 | |
Held-to-maturity debt securities credit loss allowance (3) | $ | 0.5 | | | 0.1 | | | — | | | — | | | — | | | $ | 0.6 | |
| Deferred tax valuation allowance | $ | 8.8 | | | 0.1 | | | 0.3 | | | — | | | — | | | $ | 9.2 | |
_______________
(1) Write-offs are net of recoveries.
(2) Allowance for credit losses on accounts receivable is included within Accounts receivable, net on the consolidated balance sheets.
(3) Allowance for credit losses on held-to-maturity debt securities is included within Restricted investment on the consolidated balance sheets.
ITEM 9. CHANGES IN AND DISAGREEMENTS WITH ACCOUNTANTS ON ACCOUNTING AND FINANCIAL DISCLOSURE
None.
ITEM 9A. CONTROLS AND PROCEDURES
The Company maintains a system of disclosure controls and procedures designed to provide reasonable assurance that information required to be disclosed in the Company's reports filed or submitted under the Securities Exchange Act of 1934, as amended ("Exchange Act") is recorded, processed, summarized and reported within the time periods specified in the rules and forms of the SEC. These controls and procedures also provide reasonable assurance that information required to be disclosed in such reports is accumulated and communicated to management as appropriate to allow timely decisions regarding required disclosures.
As of December 31, 2024, the Company's Interim Chief Executive Officer ("CEO") and Chief Financial Officer ("CFO"), together with management, conducted an evaluation of the effectiveness of the Company's disclosure controls and procedures pursuant to Rules 13a-15(e) and 15d-15(e) of the Exchange Act. Based on that evaluation, the CEO and CFO concluded that these disclosure controls and procedures are effective at the reasonable assurance level.
Changes in Internal Control over Financial Reporting
There have been no changes in the Company's internal control over financial reporting (as defined in Rule 13a-15(e) and 15d-15(e) of the Exchange Act) during the year ended December 31, 2024 that have materially affected, or are reasonably likely to materially affect, the Company's internal control over financial reporting.
Management's Report on Internal Control over Financial Reporting
Refer to Management’s Report on Internal Control over Financial Reporting, which is included within Part II. Item 8 of this Form 10-K and is incorporated by reference to this Item 9A.
Report of Independent Registered Public Accounting Firm
Refer to the Report of Independent Registered Public Accounting Firm, which is included within Part II. Item 8 of this Form 10-K and is incorporated by reference to this Item 9A.
ITEM 9B. OTHER INFORMATION
None of our directors or executive officers adopted or terminated a Rule 10b5-1 trading arrangement or adopted or terminated a non-Rule 10b5-1 trading arrangement (as defined in Item 408(c) of Regulation S-K) during the quarter ended December 31, 2024.
ITEM 9C. DISCLOSURE REGARDING FOREIGN JURISDICTIONS THAT PREVENT INSPECTIONS
Not applicable.
PART III
ITEM 10. DIRECTORS, EXECUTIVE OFFICERS AND CORPORATE GOVERNANCE
Information concerning directors, appearing under the caption “Proposal 1 - Election of Directors” in our Proxy Statement to be filed with the SEC within 120 days of the fiscal year ended December 31, 2024 in connection with the Annual Meeting of Stockholders scheduled to be held on April 30, 2025 (the “Proxy Statement”), information concerning executive officers, appearing under the caption “Information about our Executive Officers” in Part I of this Form 10-K, information concerning the Audit Committee, appearing under the caption “Board and Corporate Governance Matters - Committees of our Board of Directors - Audit Committee” in the Proxy Statement, information concerning delinquent Section 16(a) reports, appearing under the caption "Delinquent Section 16(a) Reports" in the Proxy Statement, information concerning our Code of Conduct appearing under the caption “Board and Corporate Governance Matters - Code of Conduct” in the Proxy Statement, and information concerning our insider trading policy appearing under the caption “Compensation Discussion and Analysis - Other Compensation Policies and Practices - Insider Trading Policy," is incorporated herein by reference in response to this Item 10. A copy of our Insider Trading Policy is filed as Exhibit 19.1 to this Form 10-K.
ITEM 11. EXECUTIVE COMPENSATION
The information contained in the Proxy Statement in the section titled “Compensation Discussion and Analysis,” in the section titled “Director Compensation” and in the section titled “Policies and practices related to the timing of grants of certain equity awards” is incorporated herein by reference in response to this Item 11.
ITEM 12. SECURITY OWNERSHIP OF CERTAIN BENEFICIAL OWNERS AND MANAGEMENT AND RELATED STOCKHOLDER MATTERS
The information contained in the section titled “Ownership of Equity Securities” in the Proxy Statement, with respect to security ownership of certain beneficial owners and management, is incorporated herein by reference in response to this Item 12.
Equity Compensation Plan Information
The table below sets forth information with respect to compensation plans under which equity securities of Ingevity are authorized for issuance as of December 31, 2024. All of the equity compensation plans pursuant to which we are currently granting equity awards have been approved by stockholders.
| | | | | | | | | | | | | | | | | |
| Plan Category | Number of Securities to be issued upon exercise of outstanding options and restricted stock awards (A) (1) | | Weighted-
average
exercise price of
outstanding
options and
restricted stock
awards
(B) | | Number of Securities remaining available for future issuance under equity compensation plans (excluding securities reflected in column (A)) (C) (2) |
| Equity Compensation Plans approved by stockholders | 988,903 | | | $ | 58.21 | | | 2,137,028 | |
_______________
(1) Includes 256,954 stock options, 499,764 restricted stock units (RSUs) and 213,117 performance-based restricted stock units (PSUs) granted to employees and 19,068 director stock units (DSUs) to be issued to directors. In accordance with SEC rules, the number of shares to be issued for performance based stock unit awards has been calculated based on the assumption that the awards granted in 2024, 2023 and 2022 will pay out at the target (1.0x).
(2) Includes 319,611 shares available for future issuance under the 2017 Ingevity Corporation Employee Stock Purchase Plan.
ITEM 13. CERTAIN RELATIONSHIPS AND RELATED TRANSACTIONS, AND DIRECTOR INDEPENDENCE
The information contained in the Proxy Statement concerning our independent directors under the caption “Board and Corporate Governance Matters - Director Nominees and Selection - Director Independence” and the information contained in the Proxy Statement concerning related party transactions and our review, approval or ratification thereof appearing under the caption “Board and Corporate Governance Matters - Related Party Transactions” is incorporated herein by reference in response to this Item 13.
ITEM 14. PRINCIPAL ACCOUNTING FEES AND SERVICES
The information contained in the Proxy Statement in the section titled “Proposal 3 - Ratification of the Appointment of Independent Registered Public Accounting Firm” is incorporated herein by reference in response to this Item 14.
PART IV
ITEM 15. EXHIBIT AND FINANCIAL STATEMENT SCHEDULES
(a)Documents filed with this Report
i.Consolidated Financial Statements of Ingevity Corporation and its subsidiaries are incorporated under Item 8 of this Form 10-K.
ii.The following supplementary financial information is filed in this Form 10-K: | | | | | |
| Page |
| Financial Statements Schedule II – Valuation and qualifying accounts and reserves for the years ended December 31, 2024, 2023, and 2022 | |
All schedules have been omitted because they are not required, not applicable or the information is otherwise included.
iii.Exhibits: See attached Index of Exhibits
(b)Exhibits
| | | | | |
| Exhibit No. | Exhibit Description |
| Separation and Distribution Agreement between Ingevity Corporation and WestRock Company (incorporated by reference to Exhibit 2.1 to the Company's Current Report on Form 8-K, as filed with the U.S. Securities and Exchange Commission on May 16, 2016). |
| |
| Asset Purchase Agreement, by and among Georgia-Pacific Chemicals, LLC, Georgia-Pacific LLC, Ingevity Arkansas, LLC, and Ingevity Corporation, dated as of August 22, 2017 (incorporated by reference to Exhibit 2.1 to Form 8-K (File No. 001-37586) filed August 22, 2017). |
| |
| First Amendment to Asset Purchase Agreement among Ingevity Corporation, Ingevity Arkansas, LLC, Georgia-Pacific Chemicals LLC and Georgia-Pacific LLC, dated as of March 8, 2018 (incorporated by reference to Exhibit 2.2 to the Company's Current Report on Form 8-K, as filed with the U.S. Securities and Exchange Commission on March 8, 2018). |
| |
| Agreement for the Sale and Purchase of Perstorp UK Ltd., dated as of December 10, 2018, by and amount Perstorp AB and Ingevity Corporation (incorporated by reference to Exhibit 2.1 to the Company's Current Report on Form 8-K, as filed with the U.S. Securities and Exchange Commission on December 10, 2018). |
| |
| Equity Purchase Agreement, dated July 31, 2022, by and among Ingevity Corporation, Ozark Holdings, Inc., Ozark Materials, LLC and Ozark Logistics, LLC (incorporated by reference to Exhibit 2.1 to Ingevity Corporation’s Current Report on Form 8-K, as filed with the U.S. Securities and Exchange Commission on August 2, 2022). |
| |
| Ingevity Corporation Third Amended and Restated Certificate of Incorporation (incorporated by reference to Exhibit 3.1 to the Company's Quarterly Report on Form 10-Q, as filed with the U.S. Securities and Exchange Commission on May 2, 2024). |
| |
| Ingevity Corporation Third Amended and Restated Bylaws, effective July 25, 2022 (incorporated by reference to Exhibit 3.2 to the Company's Current Report on Form 8-K, as filed with the U.S. Securities and Exchange Commission on July 27, 2022). |
| |
| Ingevity Corporation Fourth Amended and Restated Bylaws, effective October 22, 2024 (incorporated by reference to Exhibit 3.2 to the Company's Current Report on Form 8-K, as filed with the U.S. Securities and Exchange Commission on October 25, 2024). |
| |
| Indenture, dated as of October 28, 2020, among Ingevity Corporation, the guarantors party thereto and U.S. Bank National Association, as trustee, with respect to the 3.875% Senior Notes Due 2028 (incorporated by reference to Exhibit 4.1 to Form 8-K filed October 28, 2020). |
| |
| | | | | |
| Exhibit No. | Exhibit Description |
| Description of Registrant's Securities (incorporated by reference to Exhibit 4.3 to Form 10-K filed February 28, 2023). |
| |
| |
| |
| Employee Matters Agreement between Ingevity Corporation and WestRock Company (incorporated by reference to Exhibit 10.3 to the Company's Current Report on Form 8-K, as filed with the U.S. Securities and Exchange Commission on May 16, 2016). |
| |
| Covington Plant Services Agreement between Ingevity Virginia Corporation and WestRock Virginia, LLC (incorporated by reference to Exhibit 10.2 to the Company's Current Report on Form 8-K, as filed with the U.S. Securities and Exchange Commission on May 11, 2016). |
| |
| Covington Plant Ground Lease Agreement between Ingevity Virginia Corporation and WestRock Virginia, LLC (incorporated by reference to Exhibit 10.3 to the Company's Current Report on Form 8-K, as filed with the U.S. Securities and Exchange Commission on May 11, 2016). |
| |
| Crude Tall Oil and Black Liquor Soap Skimmings Agreement by and between Ingevity Corporation, WestRock Shared Services, LLC and WestRock MWV, LLC (incorporated by reference to Exhibit 10.4 to the Company's Current Report on Form 8-K, as filed with the U.S. Securities and Exchange Commission on May 16, 2016). |
| |
| Amendment No. 1 dated March 1, 2017, to Crude Tall Oil and Black Liquor Soap Skimming Agreement by and between WestRock Shared Services, LLC, WestRock MWV, LLC, on behalf of the affiliates of WestRock Company, and Ingevity Corporation. (incorporated by reference to Exhibit 10.7 to the Company’s Quarterly Report on Form 10-Q, as filed with the U.S. Securities and Exchange Commission on May 4, 2017). |
| |
| Amended and Restated Crude Tall Oil and Black Liquor Soap Skimmings Agreement, dated as of March 20, 2023, by and among Ingevity Corporation, WestRock Shared Services, LLC, and WestRock MWV, LLC, on behalf of the affiliates of WestRock Company (incorporated by reference to Exhibit 10.1 to Ingevity Corporation’s Current Report on Form 8-K, as filed with the U.S. Securities and Exchange Commission on March 24, 2023). |
| |
| Amendment No. 1 to that certain Amended and Restated Crude Tall Oil and Black Liquor Soap Skimmings Agreement dated as of March 20, 2023, dated as of November 1, 2023 by and among Ingevity Corporation, WestRock Shared Services, LLC, and WestRock MWV, LLC, on behalf of the affiliates of WestRock Company (incorporated by reference to Exhibit 10.1 to Ingevity Corporation’s Current Report on Form 8-K, as filed with the U.S. Securities and Exchange Commission on November 1, 2023). |
| |
| Credit Agreement, dated as of March 7, 2016, among Ingevity Corporation, as U.S. borrower, the lenders from time to time party thereto and Wells Fargo Bank, N.A., as administrative agent (incorporated by reference to Exhibit 10.8 to the Company's Amendment No. 2 to Form 10, as filed with the U.S. Securities and Exchange Commission on March 7, 2016). |
| |
| Incremental Facility Agreement and Amendment No. 1, by and among Ingevity Corporation, Ingevity Holdings SPRL, the other loan parties party thereto, the lenders party thereto and Wells Fargo Bank, N.A., as administrative agent, dated as of August 21, 2017 (incorporated by reference to Exhibit 10.1 to Form 8-K (File No. 001-37586) filed August 22, 2017). |
| |
| Incremental Facility Agreement and Amendment No. 2, by and among Ingevity Corporation, Ingevity Holdings SPRL, the other loan parties party thereto, the lenders party thereto and Wells Fargo Bank, N.A., as administrative agent, dated as of August 7, 2018 (incorporated by reference to Exhibit 10.1 to the Company's Current Report on Form 8-K, as filed with the U.S. Securities and Exchange Commission on August 9, 2018). |
| |
| Amendment No. 3, by and among Ingevity Corporation, Ingevity Holdings SPRL, the other loan parties party thereto, the lenders party thereto and Wells Fargo Bank, N.A., as administrative agent (incorporated by reference to Exhibit 10.1 to Form 8-K (File No. 001-37586) filed March 7, 2019). |
| |
| | | | | |
| Exhibit No. | Exhibit Description |
| Incremental Facility Agreement and Amendment No. 4, by and among Ingevity Corporation, Ingevity Holdings SPRL, the other loan parties party thereto, the lenders party thereto and Wells Fargo Bank, N.A., as administrative agent (incorporated by reference to Exhibit 10.2 to Form 8-K (File No. 001-37586) filed March 7, 2019). |
| |
| Incremental Facility Agreement and Amendment No. 5, by and among Ingevity Corporation, Ingevity Holdings SPRL, the other loan parties party thereto, the lenders party thereto and JPMorgan Chase Bank, N.A., as successor administrative agent and Wells Fargo Bank, N.A., as resigning administrative agent (incorporated by reference to Exhibit 10.1 to Form 8-K filed October 28, 2020). |
| |
| Amendment and Restatement Agreement, dated as of June 23, 2022, among Ingevity Corporation, Ingevity Holdings SRL, Ingevity UK Ltd, the other loan parties party thereto, JPMorgan Chase Bank, N.A., as the administrative agent, and the lenders party thereto (incorporated by reference to Exhibit 10.1 to the Company’s Current Report on Form 8-K, as filed with the U.S. Securities and Exchange Commission on June 24, 2022). |
| |
| Intellectual Property Agreement by and between WestRock Company and Ingevity Corporation (incorporated by reference to Exhibit 10.5 to the Company's Current Report on Form 8-K, as filed with the U.S. Securities and Exchange Commission on May 16, 2016). |
| |
| |
| |
| Ingevity Corporation 2016 Omnibus Incentive Plan (incorporated by reference to Exhibit 10.6 to the Company's Current Report on Form 8-K, as filed with the U.S. Securities and Exchange Commission on May 16, 2016). |
| |
| Ingevity Corporation Amended and Restated 2016 Omnibus Incentive Plan, restated as of July 31, 2019 (incorporated by reference to Exhibit 10.1 to the Company's Current Report on Form 10-Q, as filed with the U.S. Securities and Exchange Commission on October 30, 2019). |
| |
| Employment Letter, dated October 2, 2015, between WestRock Company, Ingevity Corporation and Katherine P. Burgeson (incorporated by reference to Exhibit 10.11 to the Company's Amendment No. 3 to Form 10, as filed with the U.S. Securities and Exchange Commission on April 4, 2016). |
| |
| Employment Letter, dated July 24, 2015, between WestRock Company, Ingevity Corporation and Michael Wilson (incorporated by reference to Exhibit 10.12 to the Company's Amendment No. 3 to Form 10, as filed with the U.S. Securities and Exchange Commission on April 4, 2016). |
| |
| Trust Agreement, between Ingevity Corporation, The Bank of New York Mellon Trust Company, N.A. and WestRock Company (incorporated by reference to Exhibit 10.1 to the Company's Current Report on Form 8-K, as filed with the U.S. Securities and Exchange Commission on May 11, 2016). |
| |
| Form of Option Award Term under the Ingevity Corporation 2016 Omnibus Incentive Plan (incorporated by reference to Exhibit 10.13a to the Company’s Quarterly Report on Form 10-Q for the quarterly period ended June 30, 2016). |
| |
| Form of Performance-based Restricted Stock Unit Terms under the Ingevity Corporation 2016 Omnibus Incentive Plan (incorporated by reference to Exhibit 10.13b to the Company’s Quarterly Report on Form 10-Q for the quarterly period ended June 30, 2016). |
| |
| Form of Replacement Cash Awards under the Ingevity Corporation 2016 Omnibus Incentive Plan (incorporated by reference to Exhibit 10.13c to the Company’s Quarterly Report on Form 10-Q for the quarterly period ended June 30, 2016). |
| |
| Form of Restricted Stock Unit Terms (three year vesting) under the Ingevity Corporation 2016 Omnibus Incentive Plan (incorporated by reference to Exhibit 10.13d to the Company’s Quarterly Report on Form 10-Q for the quarterly period ended June 30, 2016). |
| |
| Form of Restricted Stock Unit Terms (cliff vesting) under the Ingevity Corporation 2016 Omnibus Incentive Plan (incorporated by reference to Exhibit 10.13e to the Company’s Quarterly Report on Form 10-Q for the quarterly period ended June 30, 2016). |
| |
| | | | | |
| Exhibit No. | Exhibit Description |
| Form of Restricted Stock Unit Terms (D. Michael Wilson) under the Ingevity Corporation 2016 Omnibus Incentive Plan (incorporated by reference to Exhibit 10.13f to the Company’s Quarterly Report on Form 10-Q for the quarterly period ended June 30, 2016). |
| |
| Non-Employee Director Terms and Conditions for Restricted Stock Units under the Ingevity Corporation 2016 Omnibus Incentive Plan (incorporated by reference to Exhibit 10.14g to the Company’s Annual Report on Form 10-K for the year ended December 31, 2016). |
| |
| Non-Employee Director Terms and Conditions for Deferred Stock Units in lieu of Restricted Stock Units under the Ingevity Corporation 2016 Omnibus Incentive Plan (incorporated by reference to Exhibit 10.14h to the Company’s Annual Report on Form 10-K for the year ended December 31, 2016). |
| |
| Non-Employee Director Terms and Conditions for Deferred Stock Units in lieu of Annual Cash Retainer under the Ingevity Corporation 2016 Omnibus Incentive Plan (incorporated by reference to Exhibit 10.14i to the Company’s Annual Report on Form 10-K for the year ended December 31, 2016). |
| |
| Ingevity Corporation Deferred Compensation Plan, effective January 1, 2016. (incorporated by reference to Exhibit 10.15 to the Company’s Annual Report on Form 10-K for the year ended December 31, 2016). |
| |
| Ingevity Corporation Non-Employee Director Deferred Compensation Plan (incorporated by reference to Exhibit 10.16 to the Company’s Annual Report on Form 10-K for the year ended December 31, 2016). |
| |
| Restated Ingevity Corporation Non-Employee Director Compensation Policy, effective April 24, 2019 (incorporated by reference to Exhibit 10.3 to the Company’s Current Report on Form 10-Q, as filed with the U.S. Securities and Exchange Commission on May 2, 2019). |
| |
| Severance and Change of Control Agreement between Ingevity Corporation and John C. Fortson dated August 21, 2020 (incorporated by reference to Exhibit 10.1 to the Company's Current Report on Form 8-K, as filed with the U.S. Securities and Exchange Commission on August 24, 2020). |
| |
| Severance and Change of Control Agreement between Ingevity Corporation and S. Edward Woodcock, Jr. dated March 1, 2017 (incorporated by reference to Exhibit 10.4 to the Company's Current Report on Form 8-K, as filed with the U.S. Securities and Exchange Commission on March 7, 2017). |
| |
| Severance and Change of Control Agreement between Ingevity Corporation and Michael P. Smith dated March 1, 2017 (incorporated by reference to Exhibit 10.28 to the Company’s Annual Report on Form 10-K, as filed with the U.S. Securities and Exchange Commission on February 26, 2020). |
| |
| Severance and Change of Control Agreement between Ingevity Corporation and Stacy Cozad dated January 8, 2021 (incorporated by reference to Exhibit 10.29 to the Company's Annual Report on Form 10-K, as filed with the U.S. Securities and Exchange Commission on February 19, 2021). |
| |
| Crude Tall Oil Supply Agreement between Ingevity Corporation and Georgia-Pacific LLC, dated as of March 8, 2018 (incorporated by reference to Exhibit 10.1 to the Company's Current Report on Form 8-K, as filed with the U.S. Securities and Exchange Commission on March 8, 2018). |
| |
| Amendment to the Crude Tall Oil Supply Agreement, dated as of May 1, 2020, by and between Ingevity Corporation and Georgia-Pacific LLC (incorporated by reference to Exhibit 10.31 to the Company's Annual Report on Form 10-K, as filed with the U.S. Securities and Exchange Commission on February 19, 2021). |
| |
| Second Amendment to Crude Tall Oil Supply Agreement, dated March 21, 2023, by and among Georgia-Pacific LLC, on behalf of itself and its subsidiaries, GP Pine Chemicals LLC and Ingevity Corporation (incorporated by reference to Exhibit 10.2 to Ingevity Corporation’s Current Report on Form 8-K, as filed with the U.S. Securities and Exchange Commission on March 24, 2023). |
| |
| Severance and Change of Control Agreement between Ingevity Corporation and Mary Dean Hall dated March 19, 2021 (incorporated by reference to Exhibit 10.1 to the Company's Current Report on Form 8-K, as filed with the U.S. Securities and Exchange Commission on March 24, 2021). |
| |
| | | | | |
| Exhibit No. | Exhibit Description |
| 2017 Ingevity Corporation Employee Stock Purchase Plan Effective July 1, 2017 (incorporated by reference to Exhibit 4.1 to the Company's Registration Statement on Form S-8, as filed with the U.S. Securities and Exchange Commission on May 23, 2017). |
| |
| Severance and Change of Control Agreement between Ingevity Corporation and Steven P. Hulme dated December 15, 2021 (incorporated by reference to Exhibit 10.33 to the Company's Annual Report on Form 10-K, as filed with the U.S. Securities and Exchange Commission on February 24, 2022). |
| |
| Severance and Change of Control Agreement between Ingevity Corporation and Rich A. White Jr. dated December 14, 2021 (incorporated by reference to Exhibit 10.34 to the Company's Annual Report on Form 10-K, as filed with the U.S. Securities and Exchange Commission on February 24, 2022). |
| |
| Offer Letter between John C. Fortson and Ingevity Corporation dated August 21, 2020 (incorporated by reference to Exhibit 10.35 to the Company's Annual Report on Form 10-K, as filed with the U.S. Securities and Exchange Commission on February 24, 2022). |
| |
| Offer Letter between Mary Dean Hall and Ingevity Corporation dated March 17, 2021 (incorporated by reference to Exhibit 10.36 to the Company's Annual Report on Form 10-K, as filed with the U.S. Securities and Exchange Commission on February 24, 2022). |
| |
| Offer Letter between Stacy L. Cozad and Ingevity Corporation dated January 5, 2021 (incorporated by reference to Exhibit 10.37 to the Company's Annual Report on Form 10-K, as filed with the U.S. Securities and Exchange Commission on February 24, 2022). |
| |
| Offer Letter between Rich A. White Jr. and Ingevity Corporation dated December 2, 2021 (incorporated by reference to Exhibit 10.38 to the Company's Annual Report on Form 10-K, as filed with the U.S. Securities and Exchange Commission on February 24, 2022). |
| |
| Offer Letter between Steven P. Hulme and Ingevity Corporation dated December 2, 2021 (incorporated by reference to Exhibit 10.39 to the Company's Annual Report on Form 10-K, as filed with the U.S. Securities and Exchange Commission on February 24, 2022). |
| |
| Form of Option Award under the Ingevity Corporation 2016 Omnibus Incentive Plan - U.S. Employees (incorporated by reference to Exhibit 10.40 to the Company's Annual Report on Form 10-K, as filed with the U.S. Securities and Exchange Commission on February 24, 2022). |
| |
| Form of Option Award under the Ingevity Corporation 2016 Omnibus Incentive Plan - U.K. Employees (incorporated by reference to Exhibit 10.41 to the Company's Annual Report on Form 10-K, as filed with the U.S. Securities and Exchange Commission on February 24, 2022). |
| |
| Form of Performance-Based Restricted Stock Unit Award under the Ingevity Corporation 2016 Omnibus Incentive Plan – U.S. Employees (incorporated by reference to Exhibit 10.42 to the Company's Annual Report on Form 10-K, as filed with the U.S. Securities and Exchange Commission on February 24, 2022). |
| |
| Form of Performance-Based Restricted Stock Unit Award under the Ingevity Corporation 2016 Omnibus Incentive Plan – U.K. Employees (incorporated by reference to Exhibit 10.43 to the Company's Annual Report on Form 10-K, as filed with the U.S. Securities and Exchange Commission on February 24, 2022). |
| |
| Form of Restricted Stock Unit Award (three-year ratable vesting) under the Ingevity Corporation 2016 Omnibus Incentive Plan – U.S. Employees (incorporated by reference to Exhibit 10.44 to the Company's Annual Report on Form 10-K, as filed with the U.S. Securities and Exchange Commission on February 24, 2022). |
| |
| Form of Restricted Stock Unit Award (three-year ratable vesting) under the Ingevity Corporation 2016 Omnibus Incentive Plan – U.K. Employees (incorporated by reference to Exhibit 10.45 to the Company's Annual Report on Form 10-K, as filed with the U.S. Securities and Exchange Commission on February 24, 2022). |
| |
| | | | | |
| Exhibit No. | Exhibit Description |
| Form of Restricted Stock Unit Award (three-year cliff vesting) under the Ingevity Corporation 2016 Omnibus Incentive Plan – U.S. Employees (incorporated by reference to Exhibit 10.46 to the Company's Annual Report on Form 10-K, as filed with the U.S. Securities and Exchange Commission on February 24, 2022). |
| |
| Form of Restricted Stock Unit Award (three-year cliff vesting) under the Ingevity Corporation 2016 Omnibus Incentive Plan – U.K. Employees (incorporated by reference to Exhibit 10.47 to the Company's Annual Report on Form 10-K, as filed with the U.S. Securities and Exchange Commission on February 24, 2022). |
| |
| Form of Performance-Based Cash Award under the Ingevity Corporation 2016 Omnibus Incentive Plan – International Employees (incorporated by reference to Exhibit 10.48 to the Company's Annual Report on Form 10-K, as filed with the U.S. Securities and Exchange Commission on February 24, 2022). |
| |
| Form of Service-Based Cash Award under the Ingevity Corporation 2016 Omnibus Incentive Plan – International Employees (incorporated by reference to Exhibit 10.49 to the Company's Annual Report on Form 10-K, as filed with the U.S. Securities and Exchange Commission on February 24, 2022). |
| |
| Amended and Restated Severance and Change of Control Agreement between Ingevity Corporation and John C. Fortson dated February 17, 2022 (incorporated by reference to Exhibit 10.50 to the Company's Annual Report on Form 10-K, as filed with the U.S. Securities and Exchange Commission on February 24, 2022). |
| |
| Amended and Restated Severance and Change of Control Agreement between Ingevity Corporation and Mary Dean Hall dated February 14, 2022 (incorporated by reference to Exhibit 10.51 to the Company's Annual Report on Form 10-K, as filed with the U.S. Securities and Exchange Commission on February 24, 2022). |
| |
| Amended and Restated Severance and Change of Control Agreement between Ingevity Corporation and Stacy L. Cozad dated February 17, 2022 (incorporated by reference to Exhibit 10.52 to the Company's Annual Report on Form 10-K, as filed with the U.S. Securities and Exchange Commission on February 24, 2022). |
| |
| Amended and Restated Severance and Change of Control Agreement between Ingevity Corporation and Richard A. White Jr. dated February 14, 2022 (incorporated by reference to Exhibit 10.53 to the Company's Annual Report on Form 10-K, as filed with the U.S. Securities and Exchange Commission on February 24, 2022). |
| |
| Amended and Restated Severance and Change of Control Agreement between Ingevity Corporation and Steven P. Hulme dated February 21, 2022 (incorporated by reference to Exhibit 10.54 to the Company's Annual Report on Form 10-K, as filed with the U.S. Securities and Exchange Commission on February 24, 2022). |
| |
| Consulting Agreement between Ingevity Corporation and Michael P. Smith dated February 23, 2022 (incorporated by reference to Exhibit 10.1 to the Company's Current Report on Form 8-K, as filed with the U.S. Securities Commission on February 23, 2022). |
| |
| Special Cash Award Agreement between Ingevity Corporation and Steven P. Hulme dated July 1, 2021 (incorporated by reference to Exhibit 10.2 to the Company's Quarterly Report on Form 10-Q, as filed with the U.S. Securities Commission on May 5, 2022). |
| |
| Offer Letter between Ingevity Corporation and Christine Stunyo dated April 27, 2022 (incorporated by reference to Exhibit 10.1 to Ingevity Corporation’s Quarterly Report on Form 10-Q, as filed with the U.S. Securities and Exchange Commission on August 3, 2022). |
| |
| Severance and Change of Control Agreement between Ingevity Corporation and Christine Stunyo dated May 1, 2022 (incorporated by reference to Exhibit 10.2 to Ingevity Corporation’s Quarterly Report on Form 10-Q, as filed with the U.S. Securities and Exchange Commission on August 3, 2022). |
| |
| | | | | |
| Exhibit No. | Exhibit Description |
| Severance and Change of Control Agreement between Ingevity Corporation and Erik Ripple dated February 14, 2022 (incorporated by reference to Exhibit 10.3 to Ingevity Corporation’s Quarterly Report on Form 10-Q, as filed with the U.S. Securities and Exchange Commission on August 3, 2022). |
| |
| Transaction Support Agreement, dated July 31, 2022, by and among Ingevity Corporation, William H. Carr, Jerry N. Carr, Leon M. Gross, III, Ozark Holdings, Inc. and each of the other entities that are signatories thereto (incorporated by reference to Exhibit 10.1 to Ingevity Corporation’s Current Report on Form 8-K, as filed with the U.S. Securities and Exchange Commission on August 2, 2022). |
| |
| Separation and Severance Agreement, dated as of February 27, 2023 between Ingevity Corporation and Erik Ripple (incorporated by reference to Exhibit 10.1 to Ingevity Corporation’s Quarterly Report on Form 10-Q, as filed with the U.S. Securities and Exchange Commission on May 4, 2023). |
| |
| Performance Chemicals Transformation Restricted Stock Unit Award dated effective as of May 1, 2023 between Ingevity Corporation and Richard A. White (incorporated by reference to Exhibit 10.1 to Ingevity Corporation’s Quarterly Report on Form 10-Q, as filed with the U.S. Securities and Exchange Commission on August 3, 2023). |
| |
| Confidential Termination Agreement and Release, dated as of July 1, 2024, by and between GP Pine Chemicals, LLC and Ingevity Corporation (incorporated by reference to Exhibit 10.1 to Ingevity Corporation’s Current Report on Form 8-K, as filed with the U.S. Securities and Exchange Commission on July 8, 2024). |
| |
| Transition Agreement dated as of June 26, 2024 between Ingevity Corporation and Stacy L. Cozad (incorporated by reference to Exhibit 10.1 to Ingevity Corporation’s Quarterly Report on Form 10-Q, as filed with the U.S. Securities and Exchange Commission on August 1, 2024). |
| |
| Offer Letter between Ingevity Corporation and Terry Dyer dated July 3, 2024 (incorporated by reference to Exhibit 10.3 to Ingevity Corporation’s Quarterly Report on Form 10-Q, as filed with the U.S. Securities and Exchange Commission on August 1, 2024). |
| |
| Severance and Change of Control Agreement between Ingevity Corporation and Terry Dyer dated July 3, 2024 (incorporated by reference to Exhibit 10.4 to Ingevity Corporation’s Quarterly Report on Form 10-Q, as filed with the U.S. Securities and Exchange Commission on August 1, 2024). |
| |
| Offer Letter between Ingevity Corporation and Ryan C. Fisher dated July 3, 2024 (incorporated by reference to Exhibit 10.5 to Ingevity Corporation’s Quarterly Report on Form 10-Q, as filed with the U.S. Securities and Exchange Commission on August 1, 2024). |
| |
| Severance and Change of Control Agreement between Ingevity Corporation and Ryan C. Fisher dated July 3, 2024 (incorporated by reference to Exhibit 10.6 to Ingevity Corporation’s Quarterly Report on Form 10-Q, as filed with the U.S. Securities and Exchange Commission on August 1, 2024). |
| |
| Form of 2024 Performance-Based Restricted Stock Unit Award under the Ingevity Corporation 2016 Omnibus Incentive Plan – U.S. Employees (incorporated by reference to Exhibit 10.1 to Ingevity Corporation’s Quarterly Report on Form 10-Q, as filed with the U.S. Securities and Exchange Commission on October 30, 2024). |
| |
| Form of 2024 Performance-Based Restricted Stock Unit Award under the Ingevity Corporation 2016 Omnibus Incentive Plan – U.K. Employees (incorporated by reference to Exhibit 10.2 to Ingevity Corporation’s Quarterly Report on Form 10-Q, as filed with the U.S. Securities and Exchange Commission on October 30, 2024). |
| |
| Form of Service-Based Cash Award under the Ingevity Corporation 2016 Omnibus Incentive Plan – 2024 Executive Team.* |
| |
| Notice of Service-Based Cash Award to Mary Dean Hall dated October 1, 2024.* |
| |
| Notice of Service-Based Cash Award to S. Edward Woodcock dated October 1, 2024.* |
| |
| | | | | |
| Exhibit No. | Exhibit Description |
| Notice of Service-Based Cash Award to Ryan C. Fisher dated October 1, 2024.* |
| |
| Notice of Service-Based Cash Award to Terry Dyer dated October 1, 2024.* |
| |
| Notice of Service-Based Cash Award to Richard A. White dated January 1, 2025.* |
| |
| Form of Service-Based Cash Award under the Ingevity Corporation 2016 Omnibus Incentive Plan – 2025 Executive Team* |
| |
| Offer Letter between Ingevity Corporation and Luis Fernandez-Moreno dated October 2, 2024.* |
| |
| Notice of Restricted Stock Unit Award to Luis Fernandez-Moreno dated October 2, 2024.* |
| |
| Service-Based Interim CEO Restricted Stock Unit Award Terms and Conditions.* |
| |
| Securities and Insider Trading Policy* |
| |
| Ingevity Corporation List of Significant Subsidiaries* |
| |
| Consent of PricewaterhouseCoopers LLP.* |
| |
| Rule 13a-14(a)/15d-14(a) Certification of the Company’s Principal Executive Officer.* |
| |
| Rule 13a-14(a)/15d-14(a) Certification of the Company’s Principal Financial Officer.* |
| |
| Section 1350 Certification of the Company's Principal Executive Officer. The information contained in this Exhibit shall not be deemed filed with the Securities and Exchange Commission nor incorporated by reference in any registration statement filed by the registrant under the Securities Act of 1933, as amended.* |
| |
| Section 1350 Certification of the Company’s Principal Financial Officer. The information contained in this Exhibit shall not be deemed filed with the Securities and Exchange Commission nor incorporated by reference in any registration statement filed by the registrant under the Securities Act of 1933, as amended.* |
| |
| Senior Executive Recoupment Policy (incorporated by reference to Exhibit 97.1 to Ingevity Corporation’s Annual Report on Form 10-K, as filed with the U.S. Securities and Exchange Commission on February 22, 2024). |
| |
| 101 | Inline XBRL Instance Document and Related Items - the instance document does not appear in the Interactive Data File because its XBRL tags are embedded within the Inline XBRL document. |
| |
| 104 | The cover page from the Company’s Annual Report on Form 10-K formatted in Inline XBRL (included in Exhibit 101). |
+ Management contract or compensatory plan or arrangement
* Filed or furnished, as applicable, herewith.
† Indicates that certain information has been omitted pursuant to Item 601(b)(2) and/or Item 601(b)(10) of Regulation S-K.
ITEM 16. FORM 10-K SUMMARY
None.
SIGNATURES
Pursuant to the requirements of Section 13 or 15(d) of the Securities Exchange Act of 1934, the Registrant has duly caused this report to be signed on its behalf by the undersigned, thereunto duly authorized.
| | | | | |
| INGEVITY CORPORATION |
| (Registrant) |
| |
| By: | /S/ MARY DEAN HALL |
| Mary Dean Hall |
| Executive Vice President and Chief Financial Officer |
| (Principal Financial Officer and Duly Authorized Officer) |
Date: February 19, 2025
Pursuant to the requirements of the Securities and Exchange Act of 1934, this report has been signed below by the following persons on behalf of the registrant and in the capacities and on the dates indicated. | | | | | | | | |
| Signature | Title | Date |
/s/ Luis Fernandez-Moreno Luis Fernandez-Moreno | Interim President, Chief Executive Officer and Director
(Principal Executive Officer) | February 19, 2025 |
| | |
/s/ Mary Dean Hall Mary Dean Hall | Executive Vice President and
Chief Financial Officer
(Principal Financial Officer) | February 19, 2025 |
| | |
/s/ Phillip J. Platt Phillip J. Platt | Senior Vice President, Finance and
Chief Accounting Officer
(Principal Accounting Officer) | February 19, 2025 |
| | |
/s/ Jean S. Blackwell Jean S. Blackwell | Director | February 19, 2025 |
| | |
| | |
| | |
/s/ Diane H. Gulyas Diane H. Gulyas | Director | February 19, 2025 |
| | |
/s/ Bruce D. Hoechner Bruce D. Hoechner | Director | February 19, 2025 |
| | |
/s/ Frederick J. Lynch Frederick J. Lynch | Director | February 19, 2025 |
| | |
/s/ Karen G. Narwold Karen G. Narwold | Director | February 19, 2025 |
| | |
/s/ Daniel F. Sansone Daniel F. Sansone | Director | February 19, 2025 |
| | |
| | |
| | |
/s/ J. Kevin Willis J. Kevin Willis | Director | February 19, 2025 |
| | |
/s/ Benjamin G. Wright Benjamin G. Wright | Director | February 19, 2025 |
| | |