UNITED STATES
SECURITIES AND EXCHANGE COMMISSION
WASHINGTON, D.C. 20549
Amendment No. 1
to
FORM 20-F
| x | REGISTRATION STATEMENT PURSUANT TO SECTION 12(b) OR 12(g) OF THE SECURITIES EXCHANGE ACT OF 1934 |
OR
| ¨ | ANNUAL REPORT PURSUANT TO SECTION 13 OR 15(d) OF THE SECURITIES EXCHANGE ACT OF 1934 |
For the fiscal year ended
OR
| ¨ | TRANSITION REPORT PURSUANT TO SECTION 13 OR 15(d) OF THE SECURITIES EXCHANGE ACT OF 1934 |
OR
| ¨ | SHELL COMPANY REPORT PURSUANT TO SECTION 13 OR 15(d) OF THE SECURITIES EXCHANGE ACT OF 1934 |
Date of event requiring this shell company report
For the transition period from to
Commission file number: 001-37724
ENDESA AMÉRICAS S.A.
(Exact name of Registrant as specified in its charter)
ENDESA AMÉRICAS S.A.
(Translation of Registrant’s name into English)
CHILE
(Jurisdiction of incorporation or organization)
Santa Rosa 76, Santiago, Chile
(Address of principal executive offices)
Ramiro Alfonsín, phone: (56-2) 2353-4639, Ramiro.Alfonsin@enel.com, Santa Rosa 76, Piso 15, Santiago, Chile
(Name, Telephone, E-mail and/or Facsimile number and Address of Company Contact Person)
Securities registered or to be registered pursuant to Section 12(b) of the Act:
| | |
Title of Each Class | | Name of Each Exchange on Which Registered |
American Depositary Shares Representing Common Stock Common Stock, no par value * | | New York Stock Exchange |
| * | Listed, not for trading, but only in connection with the registration of American Depositary Shares, pursuant to the requirements of the Securities and Exchange Commission. |
Securities registered or to be registered pursuant to Section 12(g) of the Act: None
Securities for which there is a reporting obligation pursuant to Section 15(d) of the Act: None
(Title of Class)
Indicate the number of outstanding shares of each of the issuer’s classes of capital or common stock as of the close of the period covered by the annual report: N/A
Indicate by check mark if the registrant is a well-known seasoned issuer, as defined in Rule 405 of the Securities Act. ¨ Yes x No
If this report is an annual or transition report, indicate by check mark if the registrant is not required to file reports pursuant to Section 13 or 15(d) of the Securities Exchange Act of 1934. ¨ Yes ¨ No
Indicate by check mark whether the registrant (1) has filed all reports required to be filed by Section 13 or 15(d) of the Securities Exchange Act of 1934 during the preceding 12 months (or for such shorter period that the registrant was required to file such reports), and (2) has been subject to such filing requirements for the past 90 days: ¨ Yes ¨ No
Indicate by check mark whether the registrant has submitted electronically and posted on its corporate Web site, if any, every Interactive Data File required to be submitted and posted pursuant to Rule 405 of Regulation S-T (§232.405 of this chapter) during the preceding 12 months (or for such shorter period that the registrant was required to submit and post such files). ¨ Yes ¨ No
Indicate by check mark whether the registrant is a large accelerated filer, an accelerated filer, or a non-accelerated filer. See definition of “accelerated filer and large accelerated filer” in Rule 12b-2 of the Exchange Act.
Large accelerated filer ¨ Accelerated filer ¨ Non-accelerated filer x
Indicate by check mark which basis of accounting the registrant has used to prepare the financial statements included in this filing:
| | | | |
U.S. GAAP ¨ | | International Financial Reporting Standards as issued by the International Accounting Standards Board x | | Other ¨ |
If “Other” has been checked in response to the previous question, indicate by check mark which financial statement item the registrant has elected to follow:
¨ Item 17 ¨ Item 18
If this is an annual report, indicate by check mark whether the registrant is a shell company (as defined in Rule 12b-2 of the Exchange
Act). ¨ Yes ¨ No
SUBJECT TO COMPLETION, DATED MARCH 30, 2016 — FOR INFORMATION ONLY
INFORMATION STATEMENT
ENDESA AMÉRICAS S.A.

Shares of Common Stock
American Depositary Shares
This information statement is being furnished to shareholders of Empresa Nacional de Electricidad S.A., or Endesa Chile, in connection with the “división,” or “demerger,” under Chilean corporate law, of Endesa Chile, which involves (i) the separation of the non-Chilean electricity generation businesses and assets of Endesa Chile, (ii) the creation of Endesa Américas S.A., as part of the demerger, and (iii) the distribution by Endesa Chile to its shareholders of all outstanding shares of common stock of Endesa Américas. The transactions described above are referred to collectively, as the “Spin-Off.” Following the Spin-Off, Endesa Américas will own and operate the non-Chilean electricity generation businesses and assets of Endesa Chile in Argentina, Brazil, Colombia and Peru.
Endesa Chile’s shareholders approved the Spin-Off at an Extraordinary Shareholders Meeting held on December 18, 2015. Endesa Chile’s shareholders will not be required (i) to pay for the shares of Endesa Américas common stock to be received by them in the Spin-Off, (ii) to surrender or exchange shares of Endesa Chile common stock in order to receive Endesa Américas common stock, or (iii) to take any other action in connection with the Spin-Off. There is currently no trading market for Endesa Américas common stock. Endesa Américas will apply to list the common stock on the Santiago Stock Exchange, the Electronic Stock Exchange and the Valparaíso Stock Exchange (collectively, the “Chilean Stock Exchanges”) and American Depositary Shares (“ADSs”), representing shares of Endesa Américas common stock, on the New York Stock Exchange.
Each holder of record of Endesa Chile common stock as of April 14, 2016, will have the right to receive one share of Endesa Américas common stock for each share of Endesa Chile common stock held. Each holder of record of ADSs of Endesa Chile as of April 14, 2016, will have the right to receive one ADS of Endesa Américas for each ADS of Endesa Chile held.
In reviewing this information statement, you should carefully consider the matters described under the caption “Risk Factors” beginning on page 22.
Endesa Américas and shares of Endesa Américas common stock are being registered with the Chilean Superintendence of Securities and Insurance (Superintendencia de Valores y Seguros, or the SVS). The SVS has not approved or disapproved of the securities (including in the form of ADSs) or determined if this information statement or any Spanish language document(s) that will be used in Chile is truthful or complete.
Neither the U.S. Securities and Exchange Commission nor any state securities commission has approved or disapproved these securities or determined if this information statement is truthful or complete. Any representation to the contrary is a criminal offense.
This information statement does not constitute an offer to sell or the solicitation of an offer to buy any securities.
The date of this information statement is , 2016
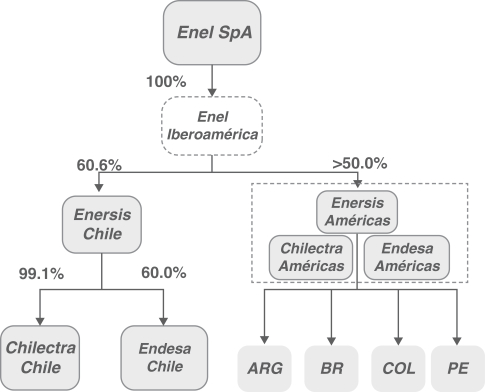
Endesa Américas’ Organizational Structure After Giving Effect to the Spin-Off(1)
As of September 30, 2015
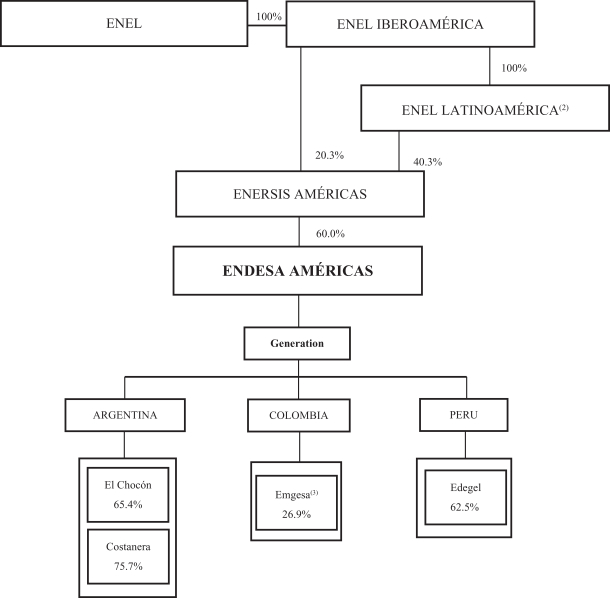
| (1) | Only principal operating combined entities are presented here. The percentage listed for each of our combined entities represents our post-Spin-Off economic interest in such combined entity. |
| (2) | Certain organizational charts contained in this information statement do not show Enel Latinoamérica because it is a wholly-owned subsidiary of Enel and Enel Iberoamérica. |
| (3) | We hold 56.4% of Emgesa’s voting rights as a result of a transfer of voting rights from Enersis and we are allowed to appoint the majority of the Board members pursuant to a shareholders’ agreement. We therefore control Emgesa. For more information on our control and combination of Emgesa, see “Item 1. Discussion of Main Factors Affecting Operating Results and Financial Condition of the Company.” |
TABLE OF CONTENTS
GLOSSARY
| | | | |
| AFP | | Administradora de Fondos de Pensiones | | A legal entity that manages a Chilean pension fund. |
| | |
| Ampla | | Ampla Energia e Serviços S.A. | | A publicly held Brazilian distribution company operating in Rio de Janeiro, owned by Enel Brasil. |
| | |
| Cachoeira Dourada | | Centrais Elétricas Cachoeira Dourada S.A. | | Brazilian generation company owned by Enel Brasil. |
| | |
| CAMMESA | | Compañía Administradora del Mercado Mayorista Eléctrico S.A. | | Argentine autonomous entity in charge of the operation of the Mercado Eléctrico Mayorista (Wholesale Electricity Market), or MEM. CAMMESA’s stockholders are generation, transmission and distribution companies, large users and the Secretariat of Energy. |
| | |
| Chilean Stock Exchanges | | Chilean Stock Exchanges | | The three principal stock exchanges located within Chile: the Santiago Stock Exchange, the Electronic Stock Exchange and the Valparaíso Stock Exchange. |
| | |
| Chilectra | | Chilectra S.A. | | Chilean electricity distribution company operating in the Santiago metropolitan area. |
| | |
| Chilectra Américas | | Chilectra Américas S.A. | | A newly formed electricity company to be spun-off by Chilectra to hold minority interests in electricity distribution companies in Argentina, Brazil, Colombia and Peru. |
| | |
| Chilectra Chile | | Chilectra S.A. | | Chilectra following the spin-off of Chilectra Américas. |
| | |
| CIEN | | Companhia de Interconexão Energética S.A. | | Brazilian transmission company, wholly-owned by Enel Brasil. |
| | |
| Codensa | | Codensa S.A. E.S.P. | | Colombian distribution company that operates mainly in Bogota and is controlled by Enersis before the spin-off of Enersis Chile and Enersis Américas thereafter. |
| | |
| Coelce | | Companhia Energética do Ceará S.A. | | A publicly held Brazilian distribution company operating in the state of Ceará. Coelce is controlled by Enel Brasil. |
| | |
| COES | | Comité de Operación Económica del Sistema | | Peruvian entity in charge of coordinating the efficient operation and dispatch of generation units to satisfy demand. |
1
| | | | |
| | |
| Costanera | | Central Costanera S.A. | | A publicly held Argentine generation company which will become a combined entity of Endesa Américas. Formerly known as Endesa Costanera. |
| | |
| CREG | | Comisión de Regulación de Energía y Gas | | Colombian Commission for the Regulation of Energy and Gas. |
| | |
| CTM | | Compañía de Transmisión del Mercosur S.A. | | Argentine transmission company and a subsidiary of Enel Brasil. |
| | |
| DCV | | Depósito Central de Valores S.A. | | Chilean Central Securities Depositary. |
| | |
| Edegel | | Edegel S.A.A. | | A publicly held Peruvian generation company, which will become a combined entity of Endesa Américas. |
| | |
| Edelnor | | Empresa de Distribución Eléctrica de Lima Norte S.A.A. | | A publicly held Peruvian distribution company, with a concession area in the northern part of Lima, and a subsidiary of Enersis before the spin-off of Enersis Chile and Enersis Américas thereafter. |
| | |
| Edesur | | Empresa Distribuidora Sur S.A. | | Argentine distribution company, with a concession area in the south of the Buenos Aires greater metropolitan area, and a subsidiary of Enersis before the spin-off of Enersis Chile and Enersis Américas thereafter. |
| | |
| El Chocón | | Hidroeléctrica El Chocón S.A. | | Argentine generation company with two hydroelectric plants, El Chocón and Arroyito, both located in the Limay River, which will become a combined entity of Endesa Américas. |
| | |
| Emgesa | | Emgesa S.A. E.S.P. | | Colombian generation company which will become a combined entity of Endesa Américas. |
| | |
| Endesa Américas | | Endesa Américas S.A. | | Our company, a limited liability stock corporation incorporated under the laws of the Republic of Chile, with operations in Argentina, Brazil, Colombia and Peru. The company will be publicly held following the Spin-Off. |
| | |
| Endesa Chile | | Empresa Nacional de Electricidad S.A. | | A publicly held limited liability stock corporation incorporated under the laws of the Republic of Chile, with generation operations in Chile, Argentina, Colombia and Peru, and an equity interest in Brazil prior to the Spin-Off. Following the Spin-Off, Endesa Chile will only hold generation assets in Chile. The company from which our company is being spun-off. |
2
| | | | |
| | |
| Enel | | Enel S.p.A. | | An Italian power company that will hold a 60.6% beneficial interest in Enersis Américas and will be our ultimate parent company following the Spin-Off. |
| | |
| Enel Brasil | | Enel Brasil, S.A. | | Brazilian holding company and a subsidiary of Enersis before the spin-off of Enersis Chile and Enersis Américas thereafter. Enel Brasil was formerly known as Endesa Brasil S.A. |
| | |
| Enel Iberoamérica | | Enel Iberoamérica, S.R.L. | | A wholly-owned subsidiary of Enel and owner of 20.3% of Enersis before the spin-off of Enersis Chile and of Enersis Chile and Enersis Américas thereafter, which it acquired from Endesa Spain in October 2014. Enel Iberoamérica was formerly known as Enel Energy Europe S.R.L. |
| | |
| Enel Latinoamérica | | Enel Latinoamérica, S.A. | | A wholly-owned subsidiary of Enel Iberoamérica and owner of 40.3% of Enersis before the spin-off of Enersis Chile and of Enersis Chile and Enersis Américas thereafter. |
| | |
| Enersis | | Enersis S.A. (before the separation of Enersis Chile) | | A publicly held limited liability stock corporation incorporated under the laws of the Republic of Chile. The parent company of Endesa Chile prior to the Spin-Off. |
| | |
| Enersis Américas | | Enersis Américas S.A. (following the separation of Enersis Chile) | | The successor company of Enersis that will hold the non-Chilean businesses of Enersis following the spin-off of Enersis Chile. The parent company of Endesa Américas following the Spin-Off. |
| | |
| Enersis Chile | | Enersis Chile S.A. | | A newly formed related company to be spun-off by Enersis to hold combined entities engaged primarily in the generation, and distribution of electricity in Chile. |
| | |
| ENRE | | Ente Nacional Regulador de la Electricidad | | Argentine national regulatory authority for the energy sector. |
| | |
| ESM | | Extraordinary Shareholders’ Meeting | | Extraordinary Shareholders’ Meeting. |
| | |
| FONINVEMEM | | Fondo para Inversiones Necesarias que permitan Incrementar la Oferta de Energía Eléctrica en el Mercado Eléctrico Mayorista | | Argentine fund created to increase electricity supply in the MEM. |
| | |
| Fortaleza | | Central Geradora Termelétrica Fortaleza S.A. | | Brazilian generation company that operates a combined cycle plant, located in the state of Ceará. Fortaleza is wholly-owned by Enel Brasil. |
| | |
| Gener | | AES Gener S.A. | | Chilean generation company and our competitor in Argentina and Colombia. |
3
| | | | |
| | |
| IFRS | | International Financial Reporting Standards | | International Financial Reporting Standards as issued by the International Accounting Standard Board (IASB). |
| | |
| LNG | | Liquefied Natural Gas | | Liquefied natural gas. |
| | |
| MEM | | Mercado Eléctrico Mayorista | | Wholesale Electricity Market in Argentina, Colombia and Peru. |
| | |
| MME | | Ministério de Minas e Energia | | Brazilian Ministry of Mines and Energy. |
| | |
| NCRE | | Non-Conventional Renewable Energy | | Energy sources which are continuously replenished by natural processes, such as wind, biomass, mini-hydro, geothermal, wave or tidal energy. |
| | |
| NIS | | Sistema Interconectado Nacional | | National interconnected electric system. There are such systems in Argentina, Brazil and Colombia. |
| ONS | | Operador Nacional do Sistema Eléctrico | | Electric System National Operator. Brazilian non-profit private entity responsible for the planning and coordination of operations in interconnected systems. |
| | |
| Osinergmin | | Organismo Supervisor de la Inversión en Energía y Minería | | Energy and Mining Investment Supervisor Authority, the Peruvian regulatory electricity authority. |
| | |
| OSM | | Ordinary Shareholders’ Meeting | | Ordinary Shareholders’ Meeting. |
| | |
| VAD | | Valor Agregado de Distribución | | Value added from distribution of electricity. |
| | |
| SVS | | Superintendencia de Valores y Seguros | | Chilean Superintendence of Securities and Insurance, the authority in charge of supervising public companies, securities and the insurance business. |
| | |
| UF | | Unidad de Fomento | | Chilean inflation-indexed, Chilean peso-denominated monetary unit. |
| | |
| XM | | Expertos de Mercado S.A. E.S.P. | | A subsidiary of Interconexión Eléctrica S.A. (“ISA”), a Colombian company that provides system management in real time services in electrical, financial and transportation sectors. |
4
INTRODUCTION
Unless the context otherwise requires, all references in this information statement to:
| | • | | “we,” “us,” “our,” “the Company” and “Endesa Américas” refer to the Non-Chilean Business (as defined below) prior to the Spin-Off and to Endesa Américas S.A. following the Spin-Off; |
| | • | | “Endesa Chile” refers to Empresa Nacional de Electricidad S.A.; |
| | • | | “Enersis” refers to Enersis S.A. prior to the separation of Enersis Chile S.A. and to Enersis Américas S.A. (formerly named Enersis S.A.) following the separation of Enersis Chile S.A., which will continue to hold the non-Chilean electricity generation, transmission and distribution businesses and assets formerly held by Enersis S.A.; |
| | • | | “Non-Chilean Business” refers to the non-Chilean electricity generation businesses and assets, comprised exclusively of the ownership interests in shares of companies domiciled outside of Chile, in Argentina, Brazil, Colombia and Peru, held by Empresa Nacional de Electricidad S.A. prior to the Spin-Off and to be held by Endesa Américas after the Spin-Off; and |
| | • | | “Chilean Business” refers to the Chilean electricity generation businesses and assets held by Empresa Nacional de Electricidad S.A. prior to the Spin-Off and continued to be held by Endesa Chile after the Spin-Off. |
This information statement is part of a Registration Statement on Form 20-F (the “Registration Statement”) filed with the U.S. Securities and Exchange Commission (the “SEC”) in connection with the spin-off by Endesa Chile, a Chilean electricity generation company and subsidiary of Enersis S.A., to its shareholders of the shares of Endesa Américas S.A., a Chilean corporation newly formed on March 1, 2016 that holds the non-Chilean electricity generation businesses and assets, comprised exclusively of the ownership interests in shares of companies domiciled outside of Chile, in Argentina, Brazil, Colombia and Peru, formerly held by Endesa Chile.
5
Overview of the Spin-Off and Reorganization
The Spin-Off is part of a reorganization (the “Reorganization”) of certain companies ultimately controlled by Enel S.p.A., an Italian electricity generation company (“Enel”), which beneficially owns 60.6% of Enersis. The Reorganization is intended to separate Endesa Chile’s electricity generation businesses and assets in Chile from those in Argentina, Brazil, Colombia and Peru. The following chart shows the corporate structure both before and after the Reorganization.
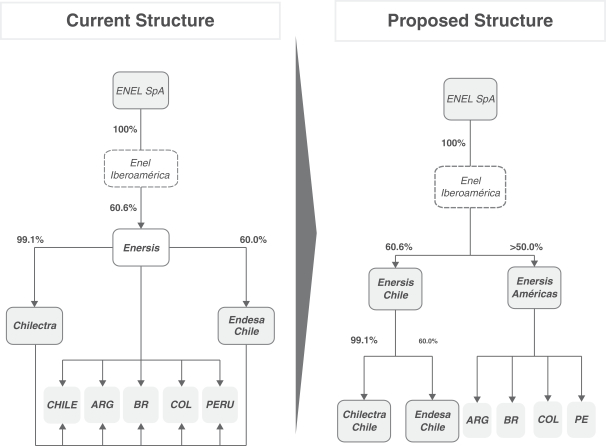
The entities involved in the Reorganization will be listed and traded on the stock exchange markets of both Chile and the U.S. as specified in the table below.
| | |
Listed Company | | Exchange (Shares/ADRs) |
| |
Enersis Chile | | • Chilean Stock Exchanges (shares) • NYSE (ADRs) |
| |
Enersis Américas | | • Chilean Stock Exchanges (shares)* • NYSE (ADRs)* |
| |
Endesa Chile | | • Chilean Stock Exchanges (shares)* • NYSE (ADRs)* |
| |
Endesa Américas (prior to the Merger) | | • Chilean Stock Exchanges (shares) • NYSE (ADRs) |
| |
Chilectra Chile | | • Chilean Stock Exchanges (shares)* |
| |
Chilectra Américas (prior to the Merger) | | • Chilean Stock Exchanges (shares) |
| * | Currently listed and traded. |
6
The Spin-Offs
Endesa Chile conducted a “división” or “demerger” under Chilean corporate law to separate Endesa Chile into two companies. The new company, Endesa Américas S.A. (“Endesa Américas”) was established as a separate company and was assigned the equity interests, assets and associated liabilities of the Company’s businesses outside of Chile (the “Separation”). Upon the completion of the Separation, Endesa Américas will register the shares of Endesa Américas with the Securities Registry of the SVS under Chilean law and the SEC under applicable U.S. federal securities laws, and subject to the receipt of necessary authorizations, the completion of legal formalities and the satisfaction of the conditions precedent, Endesa Chile will distribute to its shareholders shares of Endesa Américas in proportion to their share ownership in Endesa Chile based on a ratio of one share of Endesa Américas for each outstanding share of the Company (the “Distribution,” and together with the Separation, the “Spin-Off”). Following the Separation, Endesa Chile holds the Chilean businesses and assets of Endesa Chile.
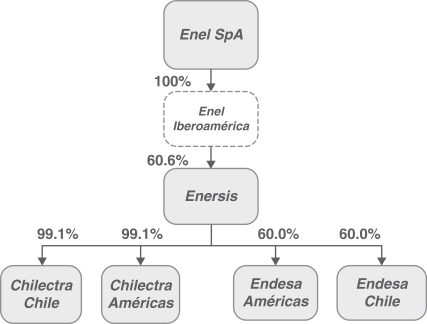
In addition to the Spin-Off, Chilectra S.A., a Chilean electricity distribution company and subsidiary of Enersis (“Chilectra”), also conducted a “demerger” and spin-off to its shareholders pro rata the shares of a new Chilean company, Chilectra Américas S.A. (“Chilectra Américas”), that holds the non-Chilean businesses and assets, comprised exclusively of Chilectra’s ownership interests in shares of companies domiciled outside of Chile (the “Chilectra Spin-Off” and together with the Spin-Off, the “Endesa/Chilectra Spin-Offs”). In connection with the Chilectra Spin-Off, Chilectra Américas will register the shares of Chilectra Américas with the Securities Registry of the SVS and Chilectra will continue to hold the Chilean businesses and assets of Chilectra (“Chilectra Chile”).
Enersis, as the 60.0% owner of Endesa Chile and the 99.1% owner of Chilectra, will own 60.0% of Endesa Américas and 99.1% of Chilectra Américas as a result of the Endesa/Chilectra Spin-Offs and the minority shareholders of Endesa Chile and Chilectra will receive their respective percentage interests in Endesa Américas and Chilectra Américas, respectively. The shares of Endesa Américas and Chilectra Américas will be listed and traded on the Chilean Stock Exchanges and the American Depositary Receipts (“ADRs”) of Endesa Américas will be listed and traded on the New York Stock Exchange (“NYSE”).
7
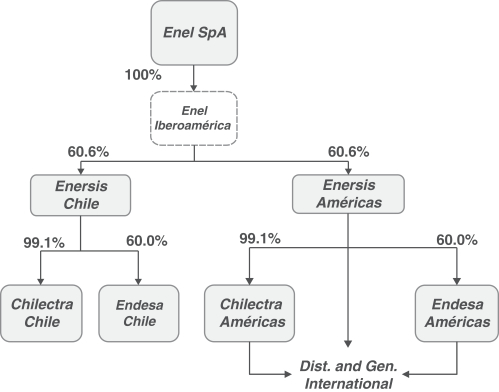
Enersis also conducted a “demerger” to separate Enersis into two companies. The new company, Enersis Chile S.A. was established as a separate company on March 1, 2016 and was assigned the Chilean Business. Enersis Chile will be spun-off to the shareholders of Enersis by distributing the share of Enersis Chile pro rata to the shareholders of Enersis (the “Enersis Spin-Off”). On February 1, 2016, Enersis also changed its name to Enersis Américas S.A. (“Enersis Américas”). Enersis Chile will register the shares of Enersis Chile with the Securities Registry of the SVS under Chilean law and the SEC under applicable U.S. federal securities laws in connection with the Enersis Spin-Off.
Enel will beneficially own 60.6% of Enersis Chile as a result of the Enersis Spin-Off, and the minority shareholders of Enersis will own their respective percentage interest in Enersis Chile. The shares of Enersis Chile will be listed and traded on the Chilean Stock Exchanges and the ADRs of Enersis Chile will be listed and traded on the NYSE.
Each of the Spin-Off and the Chilectra Spin-Off is conditioned on the approval by the Enersis’ shareholders of the Enersis Spin-Off, and the Spin-Off is conditioned on the approval by the shareholders of Chilectra of the Chilectra Spin-Off. For further details, see Item 9. The Offer and Listing — B. Plan of Distribution — Background and Description of the Spin-Off Conditions Precedents.”
The Tender Offer
Following the completion of the Endesa/Chilectra Spin-Offs and the Enersis Spin-Off, and prior to the extraordinary shareholders’ meetings to approve the Merger, Enersis Américas will conduct a public cash tender offer (oferta pública de adquisición de valores) for the shares and ADSs of Endesa Américas under Chilean law and applicable U.S. securities laws (the “Tender Offer”).
The Tender Offer is contingent on (i) the completion of the Endesa/Chilectra Spin-Offs and the Enersis Spin-Off, (ii) the approval of the Merger by the respective shareholders of Enersis Américas, Endesa Américas
8
and Chilectra Américas at separate extraordinary shareholders’ meetings of Enersis Américas, Endesa Américas and Chilectra Américas as described in “— The Merger,” (iii) less than 10% of the outstanding shares of Enersis Américas, 7.72% of the outstanding shares of Endesa Américas and 0.91% of the outstanding shares of Chilectra Américas exercising the right of withdrawal in connection with the Merger, and (iv) the absence of any significant adverse supervening events that would make the Tender Offer not in the best interest of Enersis Américas.
The Tender Offer will be for all shares, including in the form of ADSs represented by ADRs of Endesa Américas (other than those held by Enersis Américas), for a price of Ch$ 285.00 per share (or the equivalent in U.S. dollars at the date of payment in the case of ADSs), and will be subject to other terms and conditions which will be provided at the appropriate time. The Tender Offer is expected to occur by the third quarter of 2016.
This information statement is for informational purposes only and is not an offer to buy or the solicitation of an offer to sell any securities of Enersis, Enersis Américas, Endesa Chile or Endesa Américas. When and if the Tender Offer is commenced, Enersis Américas will make available the tender offer materials to the shareholders of Endesa Américas and file such materials with the SEC in accordance with applicable U.S. federal securities laws and SEC rules. In that event, shareholders and investors are urged to read the tender offer materials because they will contain important information, including the full details of the Tender Offer. Shareholders and investors may obtain free copies of the tender offer materials that Enersis Américas files with the SEC at the SEC’s website at http://www.sec.gov and will receive information at an appropriate time on how to obtain tender offer materials for free from Enersis Américas. These documents are not currently available and their availability is subject to the determination to commence the Tender Offer. The consummation of the Spin-Offs is not conditioned on the Tender Offer.
The Merger
Following the completion of the Endesa/Chilectra Spin-Offs and the Enersis Spin-Off described above, each of Enersis Américas, Endesa Américas and Chilectra Américas (then holding the non-Chilean assets of their respective businesses), and subject to approval by shareholders holding at least two-thirds of the outstanding shares of the relevant companies, intend to merge together (the “Merger”), with Enersis Américas continuing as the surviving company under the name Enersis Américas S.A. (the “Surviving Company”). Following completion of the Merger, the Surviving Company will continue to have its shares publicly traded and listed in Chile on the Chilean Stock Exchanges and its ADRs traded on the NYSE. In the Merger, the shares of Endesa Américas and Chilectra Américas will be converted into shares of the Surviving Company and Endesa Américas and Chilectra Américas shares will cease trading on the Chilean Stock Exchanges and Endesa Américas ADRs will cease to trade on the NYSE. Following the Merger, Enel is expected to continue to be the ultimate controlling shareholder, through its beneficial ownership, of the Surviving Company and the former minority shareholders of Enersis Américas, Endesa Américas and Chilectra Américas will own the minority interest in the Surviving Company.
Based on the valuation reports received by the Board of Directors and the Directors’ Committee of Endesa Chile, a majority of the Board of Directors of Endesa Chile has determined the number of shares of Enersis Américas to be paid by Enersis Américas as consideration for each share of Endesa Américas in connection with the Merger, if approved by the respective shareholders of Enersis Américas, Endesa Américas and Chilectra Américas, will be as follows:
| | | | |
| | | Number of shares of
Enersis Américas for each | |
Endesa Américas share | | | 2.8 | |
9
In connection with the Merger, each of Enersis Américas, Endesa Américas and Chilectra Américas will hold an extraordinary shareholders’ meeting to approve the Merger. Prior to such extraordinary shareholders’ meetings, Enersis Américas will register the shares of the Surviving Company to be issued in the Merger with the SEC under the Securities Act. In connection with their respective extraordinary shareholders’ meetings to approve the Merger, which are expected to be held in mid-2016, Enersis Américas will distribute to the shareholders of each of Enersis Américas and Endesa Américas a proxy statement/prospectus containing information about the Merger and the Surviving Company.
The Spin-Off is not conditioned upon the occurrence of the Merger and there is no assurance as to whether or when the Merger will be consummated. As a result, in the event that the Endesa/Chilectra Spin-Offs and the Enersis Spin-Off become effective but the Merger is not consummated, Enersis Américas, Endesa Américas and Chilectra Américas will remain as separate publicly traded companies.
Estimated Timeline
The following is an estimated timeline of significant dates for implementation of the Reorganization (dates are subject to change):
| | |
| |
April 28, 2015 | | The Board of Directors of Enersis, Endesa Chile and Chilectra authorized the respective companies to analyze the proposed Reorganization. |
| |
May 2015 to October 2015 | | The Board of Directors of Enersis, Endesa Chile and Chilectra announced details regarding the steps to carry out the proposed Reorganization on July 27, 2015, appointed financial advisors and independent experts as required by the SVS in subsequent meetings, and analyzed the proposed Reorganization. |
10
| | |
| |
November 5, 2015 | | The Board of Directors of Enersis and Endesa Chile and Chilectra determined that the proposed Reorganization is in the best interest of the respective companies. |
| |
November 10, 2015 | | The Board of Directors of Enersis and Endesa Chile and Chilectra summoned extraordinary shareholders’ meetings of the respective companies to approve the respective spin-offs and other matters to be voted upon. |
| |
November 24, 2015 | | A majority of the Board of Directors of Enersis and Endesa Chile adopted resolutions regarding the Reorganization, which included among other things, the public announcement of the intention to conduct the Tender Offer. |
| |
December 17, 2015 | | The Board of Directors of Enersis adopted resolutions, which includes among other things, the revision of the proposed Tender Offer price from Ch$ 236 per share of Endesa Américas to Ch$ 285 per share of Endesa Américas. |
| |
December 18, 2015 | | Endesa/Chilectra Spin-Offs and Enersis Spin-Off approved by the respective shareholders of Enersis, Endesa Chile and Chilectra. |
| |
February 1, 2016 | | Enersis S.A. changed its name to Enersis Américas S.A. |
| |
March 1, 2016 | | Separation of Endesa Américas, Chilectra Américas and Enersis Chile effective. |
| |
March 31, 2016 | | Spin-off registration statements of Enersis Chile and Endesa Américas declared effective by the SEC and approval of NYSE listing. |
| |
April 14, 2016 | | Record date for holders of common stock of Endesa Chile and ADSs of Endesa Chile. |
| |
April 2016 | | Registration of shares of Enersis Chile and Endesa Américas with the SVS, the Chilean Stock Exchanges; registration of shares of Chilectra Américas with the SVS and the Chilean Stock Exchanges. |
| |
April 21, 2016 | | Distribution of common stock of Endesa Américas. |
| |
April 26, 2016 | | Distribution of ADSs of Endesa Américas. |
| |
April 2016 | | Endesa/Chilectra Spin-Offs and Enersis Spin-Off effective. |
| |
May 2016 | | Enersis Américas files registration statement on Form F-4 for the Merger with the SEC. |
| |
July 2016 | | The Boards of Directors of Enersis Américas, Endesa Américas and Chilectra Américas summon extraordinary shareholders’ meetings to approve the Merger and other matters to be voted upon. |
| |
July 2016 | | Registration statement on Form F-4 for the Merger declared effective by the SEC. |
| |
August 2016 | | Tender Offer launched in Chile and the United States |
| |
August 2016 | | Enersis Américas, Endesa Américas and Chilectra Américas hold extraordinary shareholders’ meetings of the respective companies to approve the Merger and other matters to be voted upon. |
| |
September 2016 | | Period for exercising right of withdrawal (30 days from the date of approval of the Merger) in connection with the Merger expires. |
| |
September 2016 | | Tender Offer period (up to 45 days from launch of the Tender Offer) expires in the United States and Chile; settlement in the United States and Chile. |
| |
September 2016 | | Merger effective. |
11
SUMMARY OF THE SPIN-OFF
This information statement is being furnished in connection with the Spin-Off. Following is a summary of the material terms of the Spin-Off. See “Item 9. The Offer and Listing — B. Plan of Distribution — Background and Description of the Spin-Off” for a more detailed description of the matters below.
Distributing Company | Empresa Nacional de Electricidad S.A., a publicly held limited liability stock company organized under the laws of the Republic of Chile and a subsidiary of Enersis S.A. After the completion of the Spin-Off, Endesa Chile will not own any capital stock of Endesa Américas and Endesa Américas will not own any capital stock of Endesa Chile. |
Issuer Company | Endesa Américas S.A., a newly formed corporation incorporated as a publicly held limited liability stock corporation under the laws of the Republic of Chile and that holds the non-Chilean electricity generation businesses and assets formerly held by Endesa Chile. |
| Immediately after the effectiveness of the Spin-Off, the share capital of Endesa Américas will be Ch$ 778,936,764,259 and the capital structure of Endesa Américas will be identical to that of Endesa Chile immediately prior to the Spin-Off. Endesa Chile and Endesa Américas will initially have the same shareholders, including controlling shareholders. |
Conditions Precedent | The Spin-Off is contingent upon the satisfaction of specific conditions precedent. See “Item 9. The Offer and Listing — B. Plan of Distribution — Background and Description of the Spin-Off — Conditions Precedent.” |
Share Record Date | April 14, 2016. |
Share Distribution Date | April 21, 2016. |
ADS Record Date | April 14, 2016. |
ADS Distribution Date | April 26, 2016. |
Use of Proceeds | Neither Endesa Chile nor Endesa Américas will receive any proceeds in connection with the Spin-Off. |
Distribution Ratio | Holders of common stock of Endesa Chile (“Endesa Chile Shares”) as of the Share Record Date will have the right to receive one share of common stock of Endesa Américas (“Endesa Américas Shares”) for each Endesa Chile Share on the Share Distribution Date. |
| | Holders of ADSs of Endesa Chile (“Endesa Chile ADSs”) as of the ADS Record Date will have the right to receive one ADS of Endesa Américas (“Endesa Américas ADS”) for each Endesa Chile ADS on the ADS Distribution Date. |
12
Distribution Method | Distribution of Endesa Américas Shares that are not deposited with the Chilean Central Securities Depositary (DCV Registros, S.A., Depósito Central de Valores, or the “DCV”), which is the clearing system for securities traded on the Chilean Stock Exchanges, will be made against the presentation of Endesa Chile’s share certificates. For Endesa Américas Shares deposited with the DCV, distribution will generally be made by book-entry annotation in the shareholder list maintained by the DCV. |
| | Persons holding Endesa Chile ADSs through the facilities of The Depository Trust Company (“DTC”) will receive the distribution of Endesa Américas ADSs by book-entry only, through the facilities of DTC. Persons holding Endesa Chile ADSs directly will receive the distribution of Endesa Américas ADSs in the form of certificated American Depositary Receipts (“ADRs”), representing Endesa Américas ADSs. |
| | Endesa Chile share certificates and certificated ADRs will continue to represent the shares and ADSs of Endesa Chile after the Spin-Off without any need to exchange or surrender those certificates. |
Risk Factors | The Spin-Off and the Non-Chilean Business that will be held by Endesa Américas following the Spin-Off are subject to both general and specific risks. See “Item 3. Key Information — D. Risk Factors.” |
13
PRESENTATION OF THE INFORMATION
Financial Information
In this information statement on Form 20-F, unless otherwise specified, references to “U.S. dollars,” “US$,” are to dollars of the United States of America; references to “pesos” or “Ch$” are to Chilean pesos, the legal currency of Chile; references to “Ar$” or “Argentine pesos” are to the legal currency of Argentina; references to “R$,” or “reais” are to Brazilian reais, the legal currency of Brazil; references to “soles” are to Peruvian Nuevo Sol, the legal currency of Peru; references to “CPs” or “Colombian pesos” are to the legal currency of Colombia; references to “€” or “Euros” are to the legal currency of the European Union; and references to “UF” are to Development Units (Unidades de Fomento).
The Unidad de Fomento is a Chilean inflation-indexed, peso-denominated monetary unit that is adjusted daily to reflect changes in the official Consumer Price Index (“CPI”) of the Chilean National Institute of Statistics (Instituto Nacional de Estadísticas or “INE”). The UF is adjusted in monthly cycles. Each day in the period beginning on the tenth day of the current month through the ninth day of the succeeding month, the nominal peso value of the UF is indexed in order to reflect a proportionate amount of the change in the Chilean CPI during the prior calendar month. As of September 30, 2015, one UF was equivalent to Ch$ 25,346.69. The U.S. dollar equivalent of one UF was US$ 36.28 as of September 30, 2015, using the Observed Exchange Rate reported by the Central Bank of Chile (Banco Central de Chile) as of September 30, 2015 of Ch$ 698.72 per US$ 1.00. The U.S. dollar observed exchange rate (dólar observado) (the “Observed Exchange Rate”), which is reported by the Central Bank of Chile and published daily on its web page, is the weighted average exchange rate of the previous business day’s transactions in the Formal Exchange Market
The Central Bank of Chile may intervene by buying or selling foreign currency on the Formal Exchange Market to maintain the Observed Exchange Rate within a desired range.
As of January 31, 2016, one UF was equivalent to Ch$ 25,629.09. The U.S. dollar equivalent of one UF was US$ 36.08 on January 31, 2016, using the Observed Exchange Rate reported by the Central Bank of Chile as of such date of Ch$ 710.37 per US$ 1.00.
Our combined financial statements and, unless otherwise indicated, other financial information concerning us included in this information statement are presented in Chilean pesos. We have prepared our combined financial statements in accordance with International Financial Reporting Standards (“IFRS”), as issued by the International Accounting Standard Board (“IASB”).
All of our combined entities are combined and all their assets, liabilities, income, expenses and cash flows are included in the combined financial statements after making the adjustments and eliminations related to intra-group transactions. References in this information statement to combined entities refer to entities that are controlled, either directly or indirectly, by Endesa Américas. Control is achieved when Endesa Américas (i) has power over the entity, (ii) is exposed, or has rights, to variable returns from its involvement with the entity and (iii) has the ability to use its power to effect its returns. Endesa Américas has power over its combined entities when it holds the majority of the substantive voting rights or, when it has less than a majority of the voting rights, and those rights are sufficient to give it the practical ability to direct the relevant activities of the entity unilaterally.
Investments in associated companies over which we exercise significant influence are included in our combined financial statements using the equity method. For detailed information regarding combined entities, jointly-controlled entities and associated companies, see Appendices 1, 2 and 3 to the combined financial statements.
For the convenience of the reader, this information statement contains translations of certain Chilean peso amounts into U.S. dollars at specified rates. Unless otherwise indicated, the U.S. dollar equivalent for
14
information in Chilean pesos is based on the Observed Exchange Rate for September 30, 2015, as defined in “Item 3. Key Information — A. Selected Financial Data — Exchange Rates.” The Federal Reserve Bank of New York does not report a noon buying rate for Chilean pesos. No representation is made that the Chilean peso or U.S. dollar amounts shown in this information statement could have been or could be converted into U.S. dollars or Chilean pesos, as the case may be, at such rate or at any other rate. See “Item 3. Key Information — A. Selected Financial Data — Exchange Rates.”
Technical Terms
References to “TW” are to terawatts; references to “GW” and “GWh” are to gigawatts and gigawatt hours, respectively; references to “MW” and “MWh” are to megawatts and megawatt hours, respectively; references to “kW” and “kWh” are to kilowatts and kilowatt-hours, respectively; references to “kV” are to kilovolts, and references to “MVA” are to megavolt amperes. References to “BTU” and “MBTU” are to British thermal unit and million British thermal units, respectively. A “BTU” is an energy unit equal to approximately 1055 joules. References to “Hz” are to hertz; and references to “mtpa” are to metric tons per annum. Unless otherwise indicated, statistics provided in this information statement with respect to the installed capacity of electricity generation facilities are expressed in MW. One TW equals 1,000 GW, one GW equals 1,000 MW and one MW equals 1,000 kW.
Statistics relating to aggregate annual electricity production are expressed in GWh and based on a year of 8,760 hours, except for leap years, which are based on 8,784 hours. Statistics relating to installed capacity and production of the electricity industry do not include electricity of self-generators. Statistics relating to our production do not include electricity consumed by us by our own generation units.
Energy losses experienced by generation companies during transmission are calculated by subtracting the number of GWh of energy sold from the number of GWh of energy generated (excluding their own energy consumption and losses on the part of the power plant), within a given period. Losses are expressed as a percentage of total energy generated.
Calculation of Economic Interest
References are made in this information statement to the “economic interest” of Endesa Américas in its related companies. In circumstances where we do not directly own an interest in a related company, our economic interest in such ultimate related company is calculated by multiplying the percentage of economic interest in a directly held related company by the percentage of economic interest of any entity in the ownership chain of such related company. For example, if we own 60% of a directly held combined entity and that combined entity owns 40% of an associate, our economic interest in such associate would be 60% times 40%, or 24%.
Rounding
Certain amounts included in our combined financial statements have been rounded for ease of presentation. Percentages expressed in this information statement may not have been calculated using rounded amounts, but by using amounts prior to rounding. For this reason, percentages expressed in this information statement may vary from those obtained by performing the same calculations using figures in our combined financial statements. Certain other amounts that appear in the tables in this information statement may not total exactly due to rounding.
15
FORWARD-LOOKING STATEMENTS
This information statement contains statements that are or may constitute forward-looking statements within the meaning of Section 27A of the Securities Act of 1933, as amended, and Section 21E of the Securities Exchange Act of 1934, as amended (the “Exchange Act”). These statements appear throughout this information statement and include statements regarding our intent, belief or current expectations, including, but not limited to, any statements concerning:
| | • | | our capital investment program; |
| | • | | trends affecting our financial condition or results from operations; |
| | • | | the future impact of competition and regulation; |
| | • | | political and economic conditions in the countries in which we or our related companies operate or may operate in the future; |
| | • | | any statements preceded by, followed by or that include the words “believes,” “expects,” “predicts,” “anticipates,” “intends,” “estimates,” “should,” “may” or similar expressions; and |
| | • | | other statements contained or incorporated by reference in this information statement regarding matters that are not historical facts. |
Because such statements are subject to risks and uncertainties, actual results may differ materially from those expressed or implied by such forward-looking statements. Factors that could cause actual results to differ materially include, but are not limited to:
| | • | | changes in the regulatory framework of the electricity industry in one or more of the countries in which we operate; |
| | • | | our ability to implement proposed capital expenditures, including our ability to arrange financing where required; |
| | • | | the nature and extent of future competition in our principal markets; |
| | • | | political, economic and demographic developments in the markets in South America where we conduct our business; and |
| | • | | the factors discussed below under “Risk Factors.” |
You should not place undue reliance on such statements, which speak only as of the date that they were made. Our independent registered public accounting firm has not examined or compiled the forward-looking statements and, accordingly, does not provide any assurance with respect to such statements. You should consider these cautionary statements together with any written or oral forward-looking statements that we may issue in the future. We do not undertake any obligation to release publicly any revisions to forward-looking statements contained in this information statement to reflect later events or circumstances or to reflect the occurrence of unanticipated events.
For all these forward-looking statements, we claim the protection of the safe harbor for forward-looking statements contained in the Private Securities Litigation Reform Act of 1995.
16
PART I
Item 1. Identity of Directors, Senior Management and Advisers
A. Directors and Senior Management
For information regarding our directors and senior management, see “Item 6. Directors, Senior Management and Employees — A. Directors and Senior Management.”
B. Advisors
Not applicable.
C. Auditors
The interim combined financial statements of Endesa Américas as of September 30, 2015 and for nine months ended September 30, 2015, included herein were audited by KPMG Auditores Consultores Ltda. (“KPMG”), independent registered public accounting firm, as stated in their report appearing herein. KPMG’s report states that they did not audit the financial statements of certain combined entities which financial statements reflect total assets constituting 12.04 percent as of September 30, 2015 and total revenues constituting 12.59 percent for the nine-month period ended September 30, 2015, of the related combined totals. In addition, they did not audit the financial statements of Enel Brasil S.A. (a 38.64 percent owner investee company). Our investment in Enel Brasil S.A. as of September 30, 2015 was ThCh$ 426,453,134, and its equity in earnings was ThCh$ 27,869,847 for the nine-month period ended September 30, 2015. Those financial statements, which were prepared in accordance with applicable local statutory accounting standards, were audited by other auditors whose reports have been furnished to KPMG, and their opinion, insofar as it relates to the amounts of those entities whose financial statements have been prepared based on such accounting standards, is based solely on the reports of the other auditors. Accordingly, KPMG have audited the conversion adjustments to the financial statements of these combined entities and non-combined investees to conform them to our accounting policies in accordance with International Accounting Standards 34, Interim Financial Reporting, as issued by the International Accounting Standards Board (“IASB”). KPMG’s report contains an explanatory paragraph that states the interim combined statement of comprehensive income, changes in equity, and cash flows of the Endesa Américas for the nine-month period ended September 30, 2014 were not audited by them and, accordingly, they do not express an opinion on them. KPMG’s report also draws attention to Notes 1 and 2 to the interim combined financial statements, which describes the basis of preparation, including the approach to and the purpose for preparing them.
The combined financial statements of Endesa Américas as of December 31, 2014 and 2013, and January 1, 2013 and for the years ended December 31, 2014 and 2013, included herein were audited by KPMG, independent registered public accounting firm, as stated in their report appearing herein. KPMG’s report states they did not audit the financial statements of certain combined entities which financial statements reflect total assets constituting 12.11 percent, 11.23 percent and 12.99 percent as of December 31, 2014, 2013, and January 1, 2013, respectively, and total revenues constituting 15.58 percent and 12.21 percent for the years ended December 31, 2014 and 2013, respectively, of the related combined totals. In addition, KPMG did not audit the financial statements of Enel Brasil S.A. (a 38.64 percent owner investee company). Our investment in Enel Brasil S.A. as of December 31, 2014, 2013 and January 1, 2013 was ThCh$ 538,876,929, ThCh$ 543,713,349, and ThCh$ 574,168,681, respectively, and its equity in earnings was ThCh$ 62,181,301 and ThCh$ 94,402,624 for the years ended December 31, 2014 and 2013, respectively. Those financial statements, which were prepared in accordance with applicable local statutory accounting standards, were audited by other auditors whose reports have been furnished to KPMG, and their opinion, insofar as it relates to the amounts of those entities whose financial statements have been prepared based on such accounting standards, is based solely on the reports of the other auditors. Accordingly, KPMG have audited the conversion adjustments to the financial statements of these combined entities and non-combined investees to conform them to our accounting policies in accordance with International Financial Reporting Standards as issued by the IASB. KPMG’s report also draws attention to Notes 1 and 2 to the combined financial statements, which describes the basis of preparation, including the approach to and the purpose for preparing them.
17
KPMG’s office is located at Avenida Isidora Goyenechea 3520, Floor 2, Las Condes, Santiago, Chile.
The financial statements of Endesa Argentina S.A. as of September 30, 2015, December 31, 2014, 2013 and 2012 and for the nine months ended September 30, 2015 and the years ended December 31, 2014 and 2013 were audited by Pistrelli, Henry Martin y Asociados S.R.L. (“EY Argentina”), independent registered public accounting firm and a member firm of Ernst & Young Global Limited, as stated in their report appearing herein. EY Argentina’s office is located at 25 de mayo 487, Buenos Aires, C1002ABI, Argentina.
The financial statements of Enel Brasil S.A. as of September 30, 2015, December 31, 2014 and 2013, and January 1, 2013 and for the nine months ended September 30, 2015 and the years ended December 31, 2014 and 2013 were audited by Ernst & Young Auditores Independentes S.S. (“EY Brazil”), independent registered public accounting firm and a member firm of Ernst & Young Global Limited, as stated in their report appearing herein. E&Y’s office is located at Av Pres. Juscelino Kubitschek No. 1,830, Torre I, 5 E 6 Andares, São Paulo, 04543-900, Brazil.
Other Considerations
KPMG, our registered independent public accountants, informed Endesa Chile’s Audit Committee that in their review of the affiliate structure and review of services provided to affiliates in contemplation of the registration of Endesa Américas, they determined that impermissible services were provided by other member firms of KPMG International Cooperative, to companies ultimately controlled by Enel S.p.A.. By virtue of Enel S.p.A. being the common ultimate parent of Endesa Américas it was concluded that these entities are affiliates of Endesa Américas under SEC independence rules. None of the impermissible services were provided to Endesa Américas or entities “downstream” of Endesa Américas, and none of the services were provided by KPMG. The services provided to affiliates included elements of loaned personnel staff in Spain, legal advice specific to the application of regulations to employees in France, management functions related to an ongoing monitoring in Uruguay, and other activities and responsibilities that were concluded to be broker-dealer or investment banking services in Italy. Total fees for services related to these services provided to affiliates, which are not part of the combined group consisting of Endesa Américas and its combined entities and investments in associates and joint ventures, were approximately US$ 249,300.
KPMG considered whether the relationships noted above impacted its objectivity and ability to exercise impartial judgment with regard to its engagement as Endesa Américas’ auditors and have concluded that there has been no impairment of KPMG’s objectivity and ability to exercise impartial judgment. After taking into consideration the facts and circumstances of the above matter and KPMG’s determination, Endesa Chile’s Audit Committee also concluded that KPMG’s objectivity and ability to exercise impartial judgment has not been impaired.
Item 2. Offer Statistics and Expected Timetable
Not applicable.
Item 3. Key Information
| A. | Selected Financial Data. |
The following combined financial data should be read in conjunction with our combined financial statements included in this information statement. The selected combined financial data as of September 30, 2015, December 31, 2014, December 31, 2013 and January 1, 2013 and for the nine months ended September 30, 2015 and 2014 and for the years ended December 31, 2014 and 2013 are derived from our combined financial statements included in this information statement. The audited combined financial statements represent Endesa Américas’ first publication of financial statements prepared in accordance with IFRS, as issued by the IASB.
Amounts are expressed in millions, except for operating data. For the convenience of the reader, all data presented in U.S. dollars, as of and for the nine months ended September 30, 2015 and as of and for the year ended December 31, 2014, has been converted at the U.S. dollar Observed Exchange Rate (dólar observado) for
18
September 30, 2015 of Ch$ 698.72 per US$ 1.00. The Observed Exchange Rate, which is reported and published daily on the Central Bank of Chile’s web page, corresponds to the weighted average exchange rate of the previous business day’s transactions in the Formal Exchange Market.
For more information concerning historical exchange rates, see “— Exchange Rates” below.
The following tables set forth our selected combined financial and other operating data for the periods indicated:
| | | | | | | | | | | | | | | | | | | | | | | | |
| | | Nine months ended September 30, | | | Year ended December 31, | |
| | | 2015(1) | | | 2015 | | | 2014 | | | 2014(1) | | | 2014 | | | 2013 | |
| | | (US$ millions) | | | (Ch$ millions) | | | (US$ millions) | | | (Ch$ millions) | |
COMBINED STATEMENT OF INCOME DATA | | | | | | | | | | | | | | | | | | | | | | | | |
Revenues and other operating income | | | 1,297 | | | | 905,918 | | | | 925,825 | | | | 1,740 | | | | 1,215,559 | | | | 1,057,395 | |
Operating expenses(2) | | | (671 | ) | | | (468,609 | ) | | | (435,058 | ) | | | (848 | ) | | | (592,512 | ) | | | (543,889 | ) |
Operating income | | | 626 | | | | 437,309 | | | | 490,767 | | | | 892 | | | | 623,047 | | | | 513,506 | |
Financial income (expense), net | | | (62 | ) | | | (43,304 | ) | | | (67,979 | ) | | | 12 | | | | 8,564 | | | | (63,135 | ) |
Total gain on sale of non-current assets not held for sale | | | 0.05 | | | | 38 | | | | 738 | | | | 1 | | | | 750 | | | | 843 | |
Other non-operating income | | | 42 | | | | 29,168 | | | | 34,443 | | | | 88 | | | | 61,598 | | | | 95,038 | |
| | | | | | |
Income before income tax | | | 606 | | | | 423,211 | | | | 457,969 | | | | 993 | | | | 693,959 | | | | 546,252 | |
Income tax | | | (240 | ) | | | (167,560 | ) | | | (172,220 | ) | | | (292 | ) | | | (204,051 | ) | | | (167,912 | ) |
Net income | | | 366 | | | | 255,651 | | | | 285,749 | | | | 701 | | | | 489,908 | | | | 378,340 | |
| | | | | | |
Net income attributable to the parent company | | | 134 | | | | 93,789 | | | | 93,081 | | | | 315 | | | | 220,154 | | | | 180,784 | |
Net income attributable to non-controlling interests | | | 232 | | | | 161,862 | | | | 192,668 | | | | 386 | | | | 269,754 | | | | 197,556 | |
| | | | | | | | | | | | | | | | | | | | | | | | |
| | | As of
September 30, | | | As of December 31, | | | As of
January 1, | |
| | | 2015(1) | | | 2015 | | | 2014(1) | | | 2014 | | | 2013 | | | 2013 | |
| | | (US$ millions) | | | (Ch$ millions) | | | (US$ millions) | | | (Ch$ millions) | | | (Ch$ millions) | |
COMBINED STATEMENT OF FINANCIAL POSITION DATA | | | | | | | | | | | | | | | | | | | | | | | | |
Total assets | | | 5,570 | | | | 3,892,030 | | | | 5,729 | | | | 4,002,717 | | | | 3,833,136 | | | | 3,628,749 | |
Non-current liabilities | | | 1,640 | | | | 1,145,584 | | | | 1,804 | | | | 1,260,501 | | | | 1,160,263 | | | | 1,083,616 | |
Equity attributable to the parent company | | | 1,728 | | | | 1,207,215 | | | | 1,753 | | | | 1,224,710 | | | | 1,206,187 | | | | 1,164,386 | |
Equity attributable to non-controlling interests | | | 1,199 | | | | 837,561 | | | | 1,134 | | | | 792,346 | | | | 908,398 | | | | 875,268 | |
Total equity | | | 2,927 | | | | 2,044,776 | | | | 2,887 | | | | 2,017,056 | | | | 2,114,585 | | | | 2,039,654 | |
OTHER COMBINED FINANCIAL DATA | | | | | | | | | | | | | | | | | | | | | | | | |
Capital expenditures (CAPEX)(3) | | | 309 | | | | 216,149 | | | | 381 | | | | 266,281 | | | | 206,848 | | | | 165,532 | |
Depreciation, amortization and impairment losses(4) | | | 113 | | | | 78,734 | | | | 152 | | | | 105,894 | | | | 103,577 | | | | 100,126 | |
| (1) | Solely for the convenience of the reader, Chilean peso amounts have been converted into U.S. dollars at the exchange rate of Ch$ 698.72 per U.S. dollar, as of September 30, 2015. |
| (2) | Operating expenses include selling and administration expense. |
| (3) | CAPEX figures represent effective payments for each year. |
| (4) | For further detail please refer to Notes 7C and 26 of the Notes to our interim combined financial statements. |
| | | | | | | | | | | | | | | | | | | | | | | | | | | | |
| | | As of and for the
nine months ended September 30, | | | As of and for the year ended
December 31, | |
| | | 2015 | | | 2014 | | | 2014 | | | 2013 | | | 2012 | | | 2011 | | | 2010 | |
OPERATING DATA BY COUNTRY | | | | | | | | | | | | | | | | | | | | | | | | | | | | |
Installed capacity in Argentina (MW) | | | 3,632 | | | | 3,632 | | | | 3,632 | | | | 3,632 | | | | 3,632 | | | | 3,632 | | | | 3,632 | |
Installed capacity in Colombia(MW) | | | 3,059 | | | | 3,040 | | | | 3,059 | | | | 2,926 | | | | 2,914 | | | | 2,914 | | | | 2,914 | |
Installed capacity in Peru (MW) | | | 1,680 | | | | 1,527 | | | | 1,652 | | | | 1,540 | | | | 1,657 | | | | 1,668 | | | | 1,668 | |
Generation in Argentina (GWh) | | | 8,680 | | | | 7,332 | | | | 9,604 | | | | 10,840 | | | | 11,207 | | | | 10,713 | | | | 10,940 | |
Generation in Colombia (GWh) | | | 10,750 | | | | 10,467 | | | | 13,559 | | | | 12,748 | | | | 13,251 | | | | 12,051 | | | | 11,283 | |
Generation in Peru (GWh) | | | 6,190 | | | | 6,550 | | | | 8,609 | | | | 8,391 | | | | 8,570 | | | | 8,980 | | | | 8,466 | |
19
Exchange Rates
Fluctuations in the exchange rate between the Chilean peso and the U.S. dollar will affect the U.S. dollar equivalent of the peso price of our shares of common stock on the Santiago Stock Exchange (Bolsa de Comercio de Santiago), the Chilean Electronic Stock Exchange (Bolsa Electrónica de Chile) and the Valparaíso Stock Exchange (Bolsa de Corredores de Valparaíso). These exchange rate fluctuations will likely affect the price of our future ADSs and the conversion of cash dividends relating to the common shares represented by future ADSs from Chilean pesos to U.S. dollars. In addition, to the extent that significant financial liabilities of the Company are denominated in foreign currencies, exchange rate fluctuations may have a significant impact on earnings.
In Chile, there are two currency markets, the Formal Exchange Market (Mercado Cambiario Formal) and the Informal Exchange Market (Mercado Cambiario Informal). The Formal Exchange Market is comprised of banks and other entities authorized by the Central Bank of Chile. The Informal Exchange Market is comprised of entities that are not expressly authorized to operate in the Formal Exchange Market, such as certain foreign exchange houses and travel agencies, among others. The Central Bank of Chile has the authority to require that certain purchases and sales of foreign currencies be carried out on the Formal Exchange Market. Both the Formal and Informal Exchange Markets are driven by free market forces. Current regulations require that the Central Bank of Chile be informed of certain transactions and they must be carried out through the Formal Exchange Market.
The U.S. dollar Observed Exchange Rate, which is reported by the Central Bank of Chile and published daily on its web page, is the weighted average exchange rate of the previous business day’s transactions in the Formal Exchange Market. Nevertheless, the Central Bank of Chile may intervene by buying or selling foreign currency on the Formal Exchange Market to attempt to maintain the Observed Exchange Rate within a desired range.
The Informal Exchange Market reflects transactions carried out at an informal exchange rate (the “Informal Exchange Rate”). There are no limits imposed on the extent to which the rate of exchange in the Informal Exchange Market can fluctuate above or below the Observed Exchange Rate. Foreign currency for payments and distributions with respect to the ADSs may be purchased either in the Formal or the Informal Exchange Market, but such payments and distributions must be remitted through the Formal Exchange Market.
The Federal Reserve Bank of New York does not report a noon buying rate for Chilean pesos. As of January 31, 2016, the U.S. dollar Observed Exchange Rate was Ch$ 710.37 per US$ 1.00.
The following table sets forth the low, high, average and period-end Observed Exchange Rate for U.S. dollars for the periods set forth below, as reported by the Central Bank of Chile:
| | | | | | | | | | | | | | | | |
| | | Daily Observed Exchange Rate (Ch$ per US$)(1) | |
| | | Low(2) | | | High(2) | | | Average(3) | | | Period-end | |
Year ended December 31, | | | | | | | | | | | | | | | | |
2015 | | | 597.10 | | | | 715.66 | | | | 654.66 | | | | 710.16 | |
2014 | | | 527.53 | | | | 621.41 | | | | 573.70 | | | | 606.75 | |
2013 | | | 466.50 | | | | 533.95 | | | | 498.83 | | | | 524.61 | |
2012 | | | 469.65 | | | | 519.69 | | | | 486.31 | | | | 479.96 | |
2011 | | | 455.91 | | | | 533.74 | | | | 483.45 | | | | 519.20 | |
2010 | | | 448.01 | | | | 549.17 | | | | 510.35 | | | | 468.01 | |
Month ended | | | | | | | | | | | | | | | | |
February 2016 | | | 689.18 | | | | 715.41 | | | | n.a. | | | | 694.17 | |
January 2016 | | | 710.37 | | | | 730.31 | | | | n.a. | | | | 710.37 | |
December 2015 | | | 693.72 | | | | 711.52 | | | | n.a. | | | | 710.16 | |
November 2015 | | | 688.94 | | | | 715.66 | | | | n.a. | | | | 711.20 | |
October 2015 | | | 673.91 | | | | 695.53 | | | | n.a. | | | | 690.32 | |
September 2015 | | | 676.74 | | | | 705.92 | | | | n.a. | | | | 698.72 | |
Source: Central Bank of Chile.
| (2) | Exchange rates are the actual low and high, on a day-by-day basis for each period. |
| (3) | The average of the exchange rates on the last day of each month during the period. |
20
Calculation of the appreciation or devaluation of the Chilean peso against the U.S. dollar in any given period is made by determining the percent change between the reciprocals of the Chilean peso equivalent of US$ 1.00 at the end of the preceding period and the end of the period for which the calculation is being made. For example, to calculate the devaluation of the Chilean peso through September 30, 2015, one determines the percent change between the reciprocal of Ch$ 606.75 (the value of one U.S. dollar as of December 31, 2014) and the reciprocal of Ch$ 698.72 (the value of one U.S. dollar as of September 30, 2015). In this example, the percentage change between 0.001648 (the reciprocal of Ch$ 606.75) and 0.001431 (the reciprocal of Ch$ 698.72) is negative 13.2%, which represents the nine month 2015 devaluation of the Chilean peso against the 2014 year-end U.S. dollar. A positive percentage change means that the Chilean peso appreciated against the U.S. dollar, while a negative percentage change means that the Chilean peso devaluated against the U.S. dollar.
The following table sets forth the period-end rates for U.S. dollars for the nine months ended September 30, 2015 and 2014, and the years ended December 31, 2010 through December 31, 2015, based on information published by the Central Bank of Chile.
| | | | | | | | |
| | | Ch$ per US$(1) | |
| | | Period End | | | Appreciation (Devaluation) | |
| | | (in Ch$) | | | (in %) | |
Nine months ended September 30, | | | | | | | | |
2015 | | | 698.72 | | | | (13.2 | ) |
2014 | | | 599.22 | | | | (12.5 | ) |
Year ended December 31, | | | | | | | | |
2015 | | | 710.16 | | | | (14.6 | ) |
2014 | | | 606.75 | | | | (13.5 | ) |
2013 | | | 524.61 | | | | (8.5 | ) |
2012 | | | 479.96 | | | | 8.2 | |
2011 | | | 519.20 | | | | (9.9 | ) |
2010 | | | 468.01 | | | | 8.4 | |
Source: Central Bank of Chile.
| (1) | Calculated based on the variation of period-end exchange rates. |
| B. | Capitalization and Indebtedness. |
The following table sets forth our combined capitalization and indebtedness as of February 29, 2016 on an actual basis, and as adjusted to give effect to the completion of the Spin-Off. This information should be read in conjunction with information included elsewhere in this information statement, including information in “Item 5A. Operating Results” and “Item 5B. Liquidity and Capital Resources.”
21
The information below is not necessarily indicative of Endesa Américas’ future capitalization or indebtedness.
| | | | | | | | |
| | | As of February 29, 2016 | |
| | | Endesa Américas | | | As Adjusted | |
| | | (in millions of Ch$) | |
Short term debt(1) | | | | | | | | |
Bank loans | | | 108,313 | | | | 108,313 | |
Unsecured liabilities | | | 59,918 | | | | 59,918 | |
Finance leases | | | 9,669 | | | | 9,669 | |
Other Obligations | | | 20,808 | | | | 20,808 | |
| | | | | | | | |
Total | | | 198,708 | | | | 198,708 | |
Long term debt(1) | | | | | | | | |
Bank loans | | | 108,723 | | | | 108,723 | |
Unsecured liabilities | | | 751,030 | | | | 751,030 | |
Finance leases | | | 15,298 | | | | 15,298 | |
Other Obligations | | | 33,050 | | | | 33,050 | |
| | | | | | | | |
Total | | | 908,102 | | | | 908,102 | |
| | |
Total Debt | | | 1,106,810 | | | | 1,106,810 | |
| | |
Equity attributable to shareholders of the parent company | | | 1,128,176 | | | | 1,128,176 | |
Non-controlling interest | | | 833,209 | | | | 833,209 | |
| | | | | | | | |
Total Capitalization | | | 3,068,195 | | | | 3,068,195 | |
| (1) | Includes debt payable to third parties before the effect of derivatives. |
| C. | Reasons for the Offer and Use of Proceeds. |
Not applicable.
Risks Related to Our Business
A financial or other crisis in any region worldwide can have a significant impact on the countries in which we have electricity investments, and consequently, may adversely affect our operations as well as our liquidity.
The four countries in which we have electricity investments are vulnerable to external shocks, including financial and political events, which could cause significant economic difficulties and affect their growth. If any of these economies experience lower than expected economic growth or a recession, it is likely that some of our customers may experience difficulties paying their electric bills, possibly increasing our uncollectible accounts. Any of these situations could adversely affect our results of operations and financial condition.
Financial and political crises in other parts of the world could also adversely affect our business. For example, instability in the Middle East or in other oil producing regions could result in higher fuel prices worldwide, which in turn could increase the cost of fuel for our thermal generation plants and adversely affect our results of operations and financial condition.
In addition, an international financial crisis and its disruptive effects on the financial industry could adversely impact our ability to obtain new bank financings on the same historical terms and conditions. A financial crisis could also diminish our ability to access the capital markets in the four countries in which we have assets, as well as the international capital markets for other sources of liquidity, or increase the interest rates available to us. Reduced liquidity could, in turn, adversely affect our capital expenditures, our long-term investments and acquisitions, our growth prospects and our dividend payout policy.
22
South American economic fluctuations may affect our results from operations and financial condition as well as the value of our securities.
All of our operations are located in South American countries. Accordingly, our combined revenues may be affected by the performance of South American economies as a whole. If local, regional or worldwide economic trends adversely affect the economy of any of the countries in which we have investments, our financial condition and results from operations could be adversely affected. Moreover, we have investments in volatile countries such as Argentina. Insufficient cash flows for our combined entities located in the volatile countries have, in some cases, resulted in their inability to meet debt obligations and the need to seek waivers to comply with restrictive debt covenants. We also have a non-controlling participation in Enel Brasil, which consolidates all the operations in Brazil, including distribution, generation and transmission assets. As a result, we are exposed to the recent volatility of the local market in Brazil, which have affected the financial condition of Enel Brasil.
Considering that 58% of our operating revenues for the period ending September 30, 2015 were derived from our operations in Colombia and that the electricity business closely tracks GDP fluctuations, our financial condition and results of operations are particularly dependent on the Colombian economic performance. According to the Latin American Consensus Forecast published by Consensus Economics, Inc. on September 14, 2015, Colombian GDP increased by 4.6% in 2014 compared to a 4.7% increase in 2013, while it is forecasted to grow by only 2.9% in both 2015 and 2016.
Future adverse developments in these economies may impair our ability to execute our strategic plans, which could adversely affect our results of operations and financial condition.
In addition, South American financial and securities markets are, to varying degrees, influenced by economic and market conditions in other countries. Colombian or Peruvian financial and securities markets may be adversely affected by events in other countries, which could adversely affect the value of our securities.
A deterioration of the economic situation in Argentina or a deeper devaluation of the Argentine peso could have an adverse effect on our debt.
The Argentine peso suffered a steep devaluation against the U.S. dollar during 2014, which has continued, but to a lesser extent, during 2015. Due to the decline in value of the Argentine peso relative to foreign currencies, the Argentine government has implemented policies to limit purchases of U.S. dollars. In 2014, the Argentine Central Bank raised the reference interest rate, which increased financing costs for banks and for private sector companies and it has been intervening in the market on a daily basis during 2015 in order to control further devaluation expectations. Although the pace of the devaluation of the Argentine peso against the U.S. dollar has slowed recently, the increase in interest paid on deposits has been insufficient to offset the inflation rate. The new government recently liberalized all currency restrictions imposed by the prior government, which resulted in the immediate devaluation of the Argentinean peso by more than 35% in one day. While the new government is expected to take actions to soften the impact of the one-time effect of devaluation, the devaluation of the Argentine peso may continue in 2016 and future years.
If Argentina’s economy were deemed hyperinflationary, a general price index would be used to present the amounts related to our Argentine combined entities in our combined financial statements under the provisions outlined in IAS 29, “Financial Reporting in Hyperinflationary Economies.” Amounts for the previous reporting periods would be restated by applying the general price index so that the financial statements between the periods presented would be comparative.
In 2014, the Argentine banking industry increased interest rates on loans and shortened maturities. Liquidity in the Argentine derivatives market also deteriorated, which limited access to swaps of Argentine peso-denominated debt into other currencies. As a result our Argentine peso-denominated debt is exposed to further devaluation of the Argentine peso.
23
Argentina’s sovereign creditworthiness seriously deteriorated in 2014, based on market data and reports from credit ratings agencies and such situation has worsened during 2015. The insurance cost of sovereign bonds, as measured by credit default swaps, increased from 29.9% as of December 31, 2014 to 53.9% as of September 30, 2015, which indicates increased probability of a distressed credit event. Argentina’s sovereign debt rating maintained its “selective default” rating by Standard & Poor’s and “restricted default” rating by Fitch, both ratings as a result of a default on Argentina’s sovereign bonds in July 2014. Moody’s maintained the long term foreign currency debt rating at “Caa1,” with negative outlook. Further deterioration of Argentina’s economy could adversely affect our results of operations and financial condition.
For further information on our combined financial statements by geographical areas, please see Note 30 of the Notes to our interim combined financial statements.
Certain South American countries have been historically characterized by frequent and occasionally drastic economic interventionist measures by governmental authorities, including expropriations, which may adversely affect our business and financial results.
Governmental authorities have altered monetary, credit, tariff, tax and other policies to influence the course of the economies of Argentina, Brazil, Colombia and Peru. Even though we will not have assets in Chile after the Spin-Off, we will be a company established under the laws of the Republic of Chile. Therefore, we will pay taxes in Chile and will be subject to changes in the Chilean tax laws. To a lesser extent, the Chilean government has also exercised and continues to exercise a substantial influence over many aspects of the private sector, which may result in changes to economic or other policies. For example, in September 2014, the Chilean government approved the progressive increase of the corporate income tax and a change in the tax system, which may have an additional negative effect upon non-Chilean holders of shares or ADSs. In addition, taxes may be due on accrued dividends prior to their payments depending on the tax mechanism elected. On February 8, 2016, Law 20,899 was enacted, which made adjustments to this tax reform. For further details regarding Chilean tax considerations, please refer to “Item 10. Additional Information — E. Taxation.” Other governmental actions in these South American countries have also involved wage, price and tariff rate controls and other interventionist measures, such as expropriation or nationalization.
For example, Argentina froze bank accounts and imposed capital restrictions in 2001, nationalized the private sector pension funds in 2008, used its Central Bank reserves to pay down indebtedness maturing in 2010, expropriated Repsol’s 51% stake in YPF in 2012 and imposed exchange controls in 2014, which limited Argentine access to foreign currencies. In 2010, Colombia imposed an equity tax to finance reconstruction and repair efforts related to severe flooding, which resulted in an extraordinary tax expense accrual booked in January 2011 for taxes payable in 2011 through 2014.
Changes in the policies of these governmental and monetary authorities regarding tariffs, exchange controls, regulations and taxation could reduce our profitability. Inflation, devaluation, social instability and other political, economic or diplomatic developments, including the response by governments in the region to these circumstances, could also reduce our profitability. Any of these scenarios could adversely affect our results of operations and financial condition.
Our electricity business is subject to risks arising from natural disasters, catastrophic accidents and acts of terrorism, which could adversely affect our operations, earnings and cash flow.
Our primary facilities include power plants and transmission assets, pipelines, liquefied natural gas (“LNG”) terminals and re-gasification plants, storage and chartered LNG tankers. Our facilities may be damaged by earthquakes, flooding, fires, and other catastrophic disasters arising from natural or accidental human causes, as well as acts of terrorism. A catastrophic event could cause disruptions in our business, significant decreases in revenues due to lower demand or significant additional costs to us not covered by our business interruption insurance. There may be lags between a major accident or catastrophic event and the final reimbursement from our insurance policies, which typically carry a deductible and are subject to per event policy maximums.
24
As an example, on May 6, 2013, a blade of Edegel’s Santa Rosa gas turbine unit No. 7 broke and produced catastrophic damage in the unit as a consequence of lubricating oil combustion. The turbine damages were classified as a total loss and its replacement cost exceeded US$ 60 million in property damage and lost profits. Although costs were mostly absorbed by Edegel’s insurance contracts, the unit was out of service for 19 months, with operations delayed until December 5, 2014. Accidents like this can affect our operations, earnings and cash flow.
We are subject to financing risks, such as those associated with funding our new projects and capital expenditures, and risks related to refinancing our maturing debt; we are also subject to debt covenant compliance, all of which could adversely affect our liquidity.
As of September 30, 2015, our combined debt totaled Ch$ 1,143 billion (net of currency hedging instruments).
Our debt had the following maturity profile:
| | • | | Ch$ 256 billion in 2016; |
| | • | | Ch$ 153 billion from 2017 to 2018; |
| | • | | Ch$ 159 billion from 2019 to 2020; and |
| | • | | Ch$ 575 billion thereafter. |
Set forth below is a breakdown by country for debt maturing in 2016:
| | • | | Ch$ 166 billion for Colombia; |
| | • | | Ch$ 53 billion for Peru; and |
| | • | | Ch$ 37 billion for Argentina. |
Some of our debt agreements are subject to (1) financial covenants, (2) affirmative and negative covenants, (3) events of default, (4) mandatory prepayments for contractual breaches and (5) certain change of control clauses for material mergers and divestments, among other provisions. Some of our non-Chilean debt agreements limit or prohibit transactions resulting in a change of control, as defined contractually on a case by case basis, or require the prior consent of a qualified quorum of lenders. Therefore, in some cases, we would need to obtain consents or waivers, as applicable, in order to proceed with the Spin-Off without a change of control breach of contract. A significant portion of our combined entities’ financial indebtedness is subject to cross default provisions, which have varying definitions, criteria, materiality thresholds and applicability with respect to combined entities that could give rise to such a cross default.
In the event that we or our combined entities breach any of these material contractual provisions, our creditors and bondholders may demand immediate repayment, and a significant portion of our indebtedness could become due and payable. For example, for the quarters ended December 31, 2014, March 31, 2015, June 30, 2015, September 30, 2015 and December 31, 2015, our Argentine combined entity El Chocón did not meet an interest coverage ratio test (EBITDA to interest expense) pursuant to a covenant requirement under a loan agreement with Standard Bank, Deutsche Bank and Itaú that matured and was paid in February 2016. El Chocón experienced difficulties complying with this covenant several times in the past and obtained waivers from its lenders. If the lenders had decided to declare an event of default and accelerate the loan, the principal and interest would have become immediately due and payable under this facility. Because of cross-acceleration provisions of El Chocón’s other loans, an additional Ch$ 7 billion would also have been accelerated and El Chocón would have been forced into bankruptcy.
We may be unable to refinance our indebtedness or obtain such refinancing on terms acceptable to us. In the absence of such refinancing, we could be forced to dispose of assets in order to make the payments due on our indebtedness under circumstances that might not be favorable to obtaining the best price for such assets. Furthermore, we may be unable to sell our assets quickly enough, or at sufficiently high prices, to enable us to make such payments.
25
We may also be unable to raise the necessary funds required to finish our projects under development or under construction. Market conditions prevailing at the moment we require these funds or other unforeseen project costs can compromise our ability to finance these projects and expenditures.
As of the date of this information statement, we believe that Argentina continues to be a country in which we operate with a high refinancing risk. As of September 30, 2015, the third-party debt of our Argentine combined entities amounted to Ch$ 82 billion. As long as fundamental issues concerning the local electricity sector remain unresolved, we will roll over our outstanding Argentine debt to the extent we are able to do so. If our creditors will not continue to roll over our debt when it becomes due and we are unable to refinance such obligations, we could default on such indebtedness.
Our inability to finance new projects or capital expenditures or to refinance our existing debt could adversely affect our results of operation and financial condition.
We may be unable to enter into suitable investments, alliances and acquisitions.
On an ongoing basis, we review acquisition prospects that may increase our market coverage or supplement our existing businesses, though there can be no assurance that we will be able to identify and consummate suitable acquisition transactions in the future. The acquisition and integration of independent companies that we do not control is generally a complex, costly and time-consuming process and requires significant efforts and expenditures. If we consummate an acquisition, it could result in the incurrence of substantial debt and assumption of unknown liabilities, the potential loss of key employees, amortization expenses related to tangible assets and the diversion of management’s attention from other business concerns. In addition, any delays or difficulties encountered in connection with acquisitions and the integration of multiple operations could have a material adverse effect on our business, financial condition or results of operations.
Because our generation business depends heavily on hydrological conditions, droughts and climate change may adversely affect our operations and profitability.
Approximately 56.5% of our combined installed generation capacity as of September 30, 2015 was hydroelectric. Accordingly, extreme hydrological conditions and climate change could adversely affect our business, results of operations and financial condition. In the last few years, regional hydrological conditions have been affected by two climate phenomena — El Niño and La Niña — that influence rainfall and resulted in droughts.
For example, the El Niño phenomenon has affected Colombian hydrologic conditions since May 2015, leading to a rainfall deficit and high temperatures, and as a consequence, higher energy prices. According to the National Oceanic and Atmospheric Administration of the United States, this event could last at least until the first quarter of 2016. Each El Niño event is different and, depending on its intensity and duration, the magnitude of the social and economic effects could be more pronounced. Droughts also affect the operation of our thermal plants, including our facilities that use natural gas, fuel oil or coal as fuel, in the following manner:
| | • | | During drought periods, thermal plants are used more frequently. Thermal plant operating costs can be considerably higher than those of hydroelectric plants. Our operating expenses increase during these periods. In addition, depending on our commercial obligations, we may have to buy electricity at spot prices in order to meet our contractual supply obligations and the cost of these electricity purchases may exceed the price at which we sell contracted electricity, thus potentially producing losses from those contracts. |
| | • | | Our thermal plants require water for cooling and droughts not only reduce the availability of water, but also increase the concentration of chemicals, such as sulfates in the water. The high concentration of chemicals in the water we use for cooling increases the risk of damaging the equipment at our thermal plants as well as the risk of violating environmental regulations. As a result, we may have to purchase water from agricultural areas that are also experiencing shortages of water. These water purchases may increase our operating costs and also require us to further negotiate with the local communities. |
26
| | • | | Thermal power plants burning natural gas generate emissions such as sulfur dioxide (SO2) and nitrogen oxide (NO) gases. When operating with diesel they also release particulate matter into the atmosphere. Coal fired plants generate emissions of SO2 and NO. Therefore, greater use of thermal plants during periods of drought increases the risk of producing a higher level of pollutants. |
A prolonged drought will exacerbate the risks described above and have a further negative impact upon our business, results of operations and financial condition.
Governmental regulations may adversely affect our business.
We are subject to extensive regulation on the tariffs we charge to our customers and other aspects of our business and these regulations may adversely affect our profitability. Electricity regulations issued by governmental authorities in the countries in which we operate may affect the ability of our generation companies to collect revenues sufficient to offset their operating costs.
The inability of any company in our combined group to collect revenues sufficient to cover operating costs may affect the ability of that company to operate as a going concern and may otherwise have an adverse effect on our business, financial results and operations.
In addition, changes in the regulatory framework are often submitted to the legislators and administrative authorities in the countries in which we has investments and, and some of these changes could have a material adverse impact on our business, results of operations and financial condition.
Our business and profitability could be adversely affected if water rights are denied or if water concessions are granted with limited duration.
Approximately 56.5% of our installed capacity is hydroelectric. We own water rights for the supply of water from rivers and lakes near our production facilities, granted in Argentina by the Argentine State, in Colombia by the Ministry of Environment, Housing and territorial Development (“MAVDT” in its Spanish acronym), and in Peru by the Water National Authority (“ANA” in its Spanish acronym). In Colombia, water rights or water concessions are granted for 50 years, renewable by equal periods; however, these concessions may be revoked, for example, due to a progressive decrease or depletion of water. In Colombia, human consumption is the first priority before any other use. A similar event may happen in Peru and we could lose our water rights, even when concessions are granted for indefinite periods, due to scarcity or decline in quality.
Any limitations on our current water rights, our need for additional water rights, or our current unlimited duration of water concessions could have a material adverse effect on our hydroelectric development projects and our profitability.
Regulatory authorities may impose fines on our combined entities, which could adversely affect our results of operations and financial condition.
Our electricity businesses may be subject to regulatory fines for any breach of current regulations, including energy supply failures, in the four countries in which we have investments. In Peru, fines may be imposed for a maximum of 1,400 Treasury Tax Units (Unidad Impositiva Tributaria or “UIT”), or Ch $ 1,169 million, using the UIT and foreign exchange rates as of September 30, 2015. In Colombia, fines may be imposed for a maximum of 2,000 Minimum Monthly Salaries (Salarios Mínimos Mensuales), or Ch$ 288 million using the Minimum Monthly Salary and the exchange rates as of September 30, 2015. In Argentina, there is no maximum limit for relevant fines.
Our electricity generation combined entities are supervised by their local regulatory entities and may be subject to these fines in cases where, in the opinion of the regulatory entity, operational failures affecting the regular energy supply to the system are the fault of the company such as when agents are not coordinated with
27
the system operator. In addition, our combined entities may be required to pay fines or compensate customers if those combined entities are unable to deliver electricity, even if such failure is due to forces outside of the combined entities’ control.
For example, in April 2013, Edegel was fined Ch$ 77 million by the Osinergmin, the Peruvian regulatory electricity authority, for the unavailability in several occasions of some of its units in 2008. Edegel paid two of the four fines and appealed the others, which are still under dispute. For further information on fines, please refer to Note 32 of the Notes to our interim combined financial statements.
We depend in part on payments from our combined entities, jointly-controlled entities and associates to meet our payment obligations.
In order to pay our obligations, we rely partly on cash from dividends, loans, interest payments, capital reductions and other distributions from our combined entities and equity affiliates. The ability of our combined entities and equity affiliates to pay dividends, interest payments, loans and other distributions to us is subject to legal constraints such as dividend restrictions, fiduciary duties, contractual limitations and foreign exchange controls that may be imposed in any of the four countries where they operate.
Historically, we have not been able to access at all times the cash flows of our operating combined entities due to government regulations, strategic considerations, economic conditions and credit restrictions.
Our future results from operations may continue to be subject to greater economic and political uncertainties, such as government regulations, economic conditions and credit restrictions, and therefore we may not be able to rely on cash flows from operations in those entities to repay our debt.
Dividend Limits and Other Legal Restrictions. Some of our combined entities are subject to legal reserve requirements and other restrictions on dividend payments. Other legal restrictions, such as foreign currency controls, may limit the ability of our combined entities and equity affiliates to pay dividends and make loan payments or other distributions to us. In addition, the ability of any of our combined entities that are not wholly-owned to distribute cash to us may be limited by the directors’ fiduciary duties of such combined entities to their minority shareholders. Furthermore, some of our combined entities may be forced by local authorities, in accordance with applicable regulation, to diminish or eliminate dividend payments. As a consequence of such restrictions, our combined entities could, under certain circumstances, be impeded from distributing cash to us.
Contractual Constraints. Distribution restrictions included in certain credit agreements of our combined entities Costanera and El Chocón may prevent dividends and other distributions to shareholders if they are not in compliance with certain financial ratios. Generally, our credit agreements prohibit any type of distribution if there is an ongoing default.
Operating Results of Our Combined Entities. The ability of our combined entities and equity affiliates to pay dividends or make loan payments or other distributions to us is limited by their operating results. To the extent that the cash requirements of any of our combined entities exceed their available cash, the combined entity will not be able to make cash available to us.
Any of the situations described above could adversely affect our business, results of operations and financial condition.
Foreign exchange risks may adversely affect our results and the U.S. dollar value of dividends payable to ADS holders.
The currencies of South American countries in which we and our combined entities operate have been subject to large devaluations and appreciations against the U.S. dollar and may be subject to significant fluctuations in the future. Historically, a significant portion of our combined indebtedness has been denominated in U.S. dollars. Although a substantial portion of our operating cash flows is linked to U.S. dollars, we generally
28
have been and will continue to be materially exposed to currency fluctuations of our local currencies against the U.S. dollar because of time lags and other limitations to peg our tariffs to the U.S. dollar.
In countries where operating cash flows are denominated in the local currency, we seek to maintain debt in the same currency, but due to market conditions it may not be possible to do so.
Because of this exposure, the cash generated by our combined entities can decrease substantially when local currencies devalue against the U.S. dollar. Future volatility in the exchange rate of the currencies in which we receive revenues or incur expenditures may adversely affect our business, results of operations and financial condition.
As of September 30, 2015, the amount of our total combined debt was Ch$ 1,143 billion (net of currency hedging instruments). Of this amount, Ch$ 165 billion, or 14%, was denominated in U.S. dollars. As of September 30, 2015, our combined foreign currency-denominated indebtedness (other than U.S. dollars) included the equivalent of:
| | • | | Ch$ 929 billion in Colombian pesos; |
| | • | | Ch$ 38 billion in Argentine pesos; and |
| | • | | Ch$ 11 billion in Peruvian soles. |
These amounts total Ch$ 978 billion in currencies other than U.S. dollars.
For the nine-month period ended September 30, 2015, our operating cash flows were Ch$ 337 billion (before combination adjustments) of which:
| | • | | Ch$ 175 billion, or 52%, came from Colombia; |
| | • | | Ch$ 117 billion, or 35%, came from Peru; |
| | • | | Ch$ 44 billion, or 13%, came from Argentina; and |
| | • | | Ch$ 1 billion, or 0.3%, came from Chile. |
We are involved in litigation proceedings.
We are currently involved in various litigation proceedings, which could result in unfavorable decisions or financial penalties against us. We will continue to be subject to future litigation proceedings, which could cause material adverse consequences to our business.
For example, in 2001, the inhabitants of Sibaté (part of the Cundinamarca Department, Colombia) sued Emgesa and two other unrelated parties because of the possible contamination of El Muña Reservoir, asking the defendants to pay for damages of CP 3 billion (approximately Ch$ 672 billion). The plaintiffs argued that the contamination is a consequence of the pumping of polluted water from the Bogotá River. On the other hand, Emgesa argued that it is not responsible since the company had received the polluted water and requested the inclusion as additional defendants in the judicial proceedings, numerous public and private entities that discharged pollutants into the river or were responsible for the environmental management of the river’s basin. This request was originally accepted by the court, but in June 2015 the court decision was reversed and the new parties were subsequently excluded as defendants. Emgesa appealed such determination and the case remains pending. Our financial condition or results of operations could be adversely affected if we are unsuccessful in defending this litigation or other lawsuits and proceedings against us. For further information on litigation proceedings, please see Note 31.3 of the Notes to our interim combined financial statements.
The values of our generation business’s combined entities’ long-term energy supply contracts are subject to fluctuations in the market prices of certain commodities and other factors.
We have economic exposure to fluctuations in the market prices of certain commodities as a result of the long-term energy sales contracts into which we have entered. We and our combined entities have material obligations as selling parties under long-term fixed-price electricity sales contracts. Prices in these contracts are
29
indexed according to different commodities, the exchange rate, inflation, and the market price of electricity. Adverse changes to these indices would reduce the rates we charge under our long-term fixed-price electricity sales contracts, which could adversely affect our business, results of operations and financial condition.
Our controlling shareholder will exert substantial influence over us and may have a strategic view for our development different from that of our minority shareholders.
After the completion of the Spin-Off, Enel will beneficially own 60.6% of Enersis Américas’ share capital, and Enersis Américas will own 60.0% of our outstanding capital stock. Enel, our ultimate controlling shareholder, will have the power to determine the outcome of substantially all material matters that require shareholders’ votes, such as the election of the majority of our board members and, subject to contractual and legal restrictions, our dividend policy. Enel also exercises decisive influence over our business strategy and operations. Its interests may in some cases differ from those of our minority shareholders. For example, Enel conducts its business operations in the field of renewable energies in South America through Enel Green Power S.p.A. and in the Chilean electricity business through Enersis Chile, in neither of which we will have equity interests. Any present or future conflict of interest affecting Enel may be resolved against our best interests in these matters. As a consequence, our growth may be potentially limited, and our business and results of operations may be adversely affected.
Environmental regulations in the countries in which we operate and other factors may cause delays, impede the development of new projects or increase the costs of operations and capital expenditures.
Our operating combined entities are subject to environmental regulations which, among other things, require us to perform environmental impact studies for future projects and obtain permits from both local and national regulators. The approval of these environmental impact studies may take longer than planned and may be withheld by governmental authorities. Local communities and ethnic and environmental activists, among others, may intervene in the approval process to delay or prevent a project’s development. They may also seek injunctive or other relief, which could negatively impact us if they are successful.
In addition to environmental matters, there are other factors that may adversely affect our ability to build new facilities or to complete projects currently under development on time, including delays in obtaining regulatory approvals, shortages or increases in the price of equipment, materials or labor, strikes, adverse weather conditions, natural disasters, civil unrest, accidents, or other unforeseen events. Any such event could adversely impact our results of operations and financial condition.
Delays or modifications to any proposed project and laws or regulations may change or be interpreted in a manner that could adversely affect our operations or our plans for companies in which we hold investments, which could adversely affect our business, results of operations and financial condition.
Our power plant projects may encounter significant opposition from different groups that may delay their development, increase costs, damage our reputation and potentially result in impairment of our goodwill with stakeholders.
Our reputation is the foundation of our relationship with key stakeholders and other constituencies. If we are unable to effectively manage real or perceived issues that could negatively impact sentiments toward us, our results of operations and financial condition could be adversely affected.
The development of new and existing power plants may face opposition from several stakeholders, such as ethnic groups, environmental groups, land owners, farmers, local communities and political parties, among others, all of which may impact the sponsoring company’s reputation and goodwill. For example, El Quimbo hydroelectric project in Colombia faced constant demands from the public which delayed construction and increased costs. From April 27, 2014 to May 12, 2014, a national agricultural strike involving communities near the project blocked roads and occupied neighboring land. Additional protests during 2014 blocked the entrance to the Balseadero viaduct construction site and the reservoir basin.
30
The operation of our current thermal power plants may also affect our goodwill with stakeholders, due to emissions such as particulate matter, sulfur dioxide and nitrogen oxides, which could adversely affect the environment.
Damage to our reputation may exert considerable pressure on regulators, creditors, and other stakeholders and ultimately lead to projects and operations that may not be optimal, causing our share prices to drop and hindering our ability to attract or retain valuable employees, all of which could result in an impairment of our goodwill with stakeholders.
We may be exposed to asbestos liability and additional expense related to asbestos.
Several of our facilities have asbestos present in them. We have a policy regarding asbestos control and sanitation, which includes a detailed action plan regarding the detecting the presence of asbestos, measuring air quality, ensuring the compliance with safety requirements, as well as a plan to monitor the health of workers. Since 1998, Costanera has been removing identifiable asbestos from its power plant. In total, Costanera has removed approximately 500 tons of asbestos; however, these removals plans need to continue in the future.
We may have to incur additional costs to remediate and implement our asbestos control and sanitation policy, or be subject to legal actions against us, which in turn may have a material adverse effect on our business, results of operation and financial condition.
Our business may experience adverse consequences if we are unable to reach satisfactory collective bargaining agreements with our unionized employees.
A large percentage of our employees are members of unions and have collective bargaining agreements that must be renewed on a regular basis. Our business, financial condition and results of operations could be adversely affected by a failure to reach agreement with any labor union representing such employees or by an agreement with a labor union that contains terms we view as unfavorable. The laws of many of the countries in which we operate provide legal mechanisms for judicial authorities to impose a collective agreement if the parties are unable to come to an agreement, which may increase our costs beyond what we have budgeted.
In addition, we employ many highly-specialized employees, and certain actions such as strikes, walk-outs or work stoppages by these employees, could adversely impact our business, results of operations and financial condition as well as our reputation.
Interruption or failure of our information technology and communications systems or external attacks to or breaches of these systems could have an adverse effect on our operations and results.
We depend on information technology, communication and processing systems (“IT Systems”) to operate our businesses, the failure of which could adversely affect our business, results of operations and financial condition.
IT Systems are all vital to our generation combined entities’ ability to monitor our power plants’ operations, maintain generation and network performance, adequately generate invoices to customers, achieve operating efficiencies and meet our service targets and standards. Temporary or long-lasting operational failures of any of these IT Systems could have a material adverse effect on our results of operations. Additionally, cyber attacks can have an adverse effect on the company’s image and its relationship with the community.
In the last few years, global cyber attacks on security systems, treasury operations and IT Systems have intensified. We are exposed to cyber-terrorist attacks aimed at damaging our assets through computer networks, cyber spying involving strategic information that may be beneficial for third parties and cyber-theft of proprietary and confidential information, including information of our customers. During 2014, we suffered two cyber attacks perpetrated by a cyber-terrorist group, which impacted websites in Argentina, Colombia and Peru. In one case, the attack resulted in a service interruption of 90 minutes. Further cyber attacks may occur and may affect us in the future.
31
We rely on electricity transmission facilities that we do not own or control. If these facilities do not provide us with an adequate transmission service, we may not be able to deliver the power we sell to our final customers.
We depend on transmission facilities owned and operated by other unaffiliated power companies to deliver the electricity we sell. This dependence exposes us to several risks. If transmission is disrupted, or transmission capacity is inadequate, we may be unable to sell and deliver our electricity. If a region’s power transmission infrastructure is inadequate, our recovery of sales costs and profits may be insufficient. If restrictive transmission price regulation is imposed, transmission companies upon whom we rely may not have sufficient incentives to invest in expansion of their transmission infrastructure, which could adversely affect our operations and financial results. Currently, the construction of new transmission lines is taking longer than in the past, mainly because of new social and environmental requirements that are creating uncertainty about the probability of completing the projects. In addition, the increase of new non-conventional renewable energy (“NCRE”) projects in the region is congesting the current transmission systems as these projects can be built relatively quickly, while new transmission projects may take longer to be built.
Any such disruption or failure of transmission facilities could interrupt our business, which could adversely affect our results of operations and financial condition.
Lawsuits against us brought outside of the South American countries in which we operate, or complaints against us based on foreign legal concepts may be unsuccessful.
All of our assets are located outside of the United States. All of our directors and officers are expected to reside outside of the United States and most of their assets are expected to be located outside the United States as well. If any investor were to bring a lawsuit against our directors, officers or experts in the United States, it may be difficult for them to effect service of legal process within the United States upon these persons, or to enforce against them, in United States or Chilean courts, judgments obtained in United States courts based upon the civil liability provisions of the federal securities laws of the United States. In addition, there is doubt as to whether an action could be brought successfully in Chile on the basis of liability based solely upon the civil liability provisions of the United States federal securities laws.
Risks Related to the Spin-Off
There may not be a liquid market for our shares.
There is currently no public market for our shares. It is expected that our shares will be listed on the Chilean Stock Exchanges and our ADSs will be listed on the NYSE after the effectiveness of the Spin-Off. There can be no assurance as to the liquidity of any markets that may develop for our shares or ADSs or the price at which our shares or ADSs may trade. The Chilean securities markets are substantially smaller and less liquid than the major securities markets in the United States. In addition, the Chilean securities markets may be affected materially by developments in other emerging markets. The low liquidity of the Chilean securities markets may impair the ability of our shareholders to sell their shares, or holders of our ADSs to sell shares of our common stock withdrawn from the ADS program, into the Chilean securities markets in the amounts and at the prices and times they wish to do so. Also, the liquidity and the market for our shares or ADSs may be affected by a number of factors including variations in exchange and interest rates, the deterioration and volatility of the markets for similar securities and any changes in our liquidity, financial condition, creditworthiness, results and profitability and uncertainty with respect to the consummation of the Merger. As a result, the initial trading prices of our shares and ADSs may not be indicative of future trading prices. In addition, trading of our shares and ADSs, in the aggregate, may be significantly less liquid than trading of Endesa Chile’s shares and ADSs before the Spin-Off.
Endesa Chile’s historical performance may not be representative of our performance as a separate company.
Our combined financial statements are based on the historical results of operations and historical bases of the assets and liabilities of the former non-Chilean businesses of Endesa Chile. Our historical performance might
32
have been different if we had been a separate, combined entity during the periods presented. The historical carve-out financial information included in this information statement is not necessarily indicative of what our results of operations, financial position and cash flows will be in the future. There may be changes that will occur in our cost structure, funding and operations as a result of our separation from Endesa Chile, including increased costs associated with reduced economies of scale, and increased costs associated with being a stand-alone publicly traded company.
We may face difficulty in financing our operations and capital expenditures following the Spin-Off, which could have an adverse impact on our business and results.
We may need to incur debt or issue additional equity in order to fund working capital and capital expenditures or to make acquisitions and other investments following the Spin-Off. There can be no assurance that debt or equity financing will be available to us on acceptable terms, if at all. As a result of the Spin-Off, it may also become more expensive for us to raise funds through the issuance of debt than it was prior to the consummation of the Spin-Off. If we are not able to obtain sufficient financing on attractive terms, it could have a material adverse effect on our business, results of operations and financial condition.
There is no guarantee that the conditions precedent to the Spin-Off will be satisfied.
The Spin-Off will not become effective unless the conditions precedent are satisfied, including the receipt of certain regulatory approvals and the absence of any order or injunction prohibiting the consummation of the Spin-Off. The conditions precedent include approval by the SVS of a Chilean registration statement relating to the Spin-Off. The Company expects to receive approval from the SVS by mid-April 2016. However, there can be no assurance that the conditions precedent, including approval by SVS, will be satisfied or that there will not be delays. In the event there are any delays or other material developments relating to the Spin-Off, the Company and Endesa Chile will provide updating information in a press release that will also be furnished on a Form 6-K. Any delay or the inability to satisfy the conditions precedent may prevent the effectiveness of the Spin-Off.
The Spin-Off and the Reorganization may be subject to judicial or administrative injunctions.
It is possible that actions may be brought by shareholders, bondholders, regulators or others seeking to enjoin the Spin-Off or the Reorganization. For example, AFP Habitat and AFP Capital, shareholders of Enersis and Endesa Chile, brought action against the SVS in the Santiago Court of Appeals in order to block the Reorganization. On March 22, 2016, the Court reversed the SVS decision and ruled that the Merger is a related-party transaction subject to the requirements for related-party transactions under the Chilean Companies Act but agreed with the SVS decision that the Spin-Offs are not related-party transactions. Any litigation may distract management, divert resources, result in negative publicity or otherwise negatively affect the Spin-Off and the Reorganization.
We will need to rely on intercompany arrangements with Endesa Chile and other affiliates.
Substantially all of Endesa Chile’s personnel will be assigned to Endesa Chile in connection with the Spin-Off. Following the Spin-Off, Endesa Chile will provide us with certain legal, financial, accounting, investor relations and other corporate support and administrative services. Furthermore, we may also need to rely on certain intercompany financial arrangements with Endesa Chile as well as other affiliates such as Enersis Chile, Enersis Américas, Chilectra Chile and Chilectra Américas. Therefore, if the Merger does not occur and we do not develop our own administrative infrastructure or achieve full autonomy for some of these services or develop alternative financial arrangements, there could be a material adverse effect on our business, result of operations and financial condition.
Our business and the shares and ADSs may be adversely impacted if the Merger is not consummated.
The failure to consummate the Merger following the Spin-Off will require us to operate as a standalone company, which may result in significant discounts to the valuation of our shares and ADSs. Our business and the shares and ADSs may be especially vulnerable due to, among other things the fact that we have never operated independently of Endesa Chile.
33
Item 4. Information on the Company
| A. | History and Development of the Company. |
History
In this “History and Development of the Company” section, references to “we,” “us” and “our” are to the Non-Chilean Business of Endesa Chile prior to the Spin-Off, and to Endesa Américas after the Spin-Off.
We expect that we will register our common stock in Chile with the SVS and in the United Sates with the SEC during the first quarter of 2016.
Our contact information in Chile is:
| | |
| Street Address: | | Santa Rosa 76, Santiago, Código Postal 8330099, Chile |
| Telephone: | | (56-2) 2353-4639 |
| Web site: | | www.endesaamericas.cl |
We are primarily engaged in the generation and distribution of electricity in Argentina, Brazil, Colombia and Peru. We trace our origins to the establishment of Empresa Nacional de Electricidad S.A. in 1943.
In May 1992, we began our international expansion program with the following developments:
| | • | | We acquired a stake in Costanera in 1992 and in August 1993, we acquired a controlling equity interest in El Chocón, both in Argentina. As of September 30, 2015, our equity interest in El Chocón was 65.4% and 75.7% in Costanera. |
| | • | | We acquired Edegel in Peru in October 1995. In June 2006, Edegel and Empresa de Generacíon Termoeléctrica Ventanilla S.A. merged, after which our equity interest in Edegel increased to 33.1%. In October 2009, we purchased an additional 29.4% of Edegel from Generalima, an indirect Peruvian subsidiary of Endesa Spain. With this transaction, we increased our economic interest in Edegel to 62.5%. |
| | • | | We acquired Betania and Emgesa, both in Colombia, in December 1996 and in October 1997, respectively. In September 2007, these subsidiaries were merged and adopted the name of Emgesa. Pursuant to a shareholders’ agreement with Empresa de Energía de Bogotá S.A. signed on August 27, 1997, we have had the right to appoint the majority of Emgesa’s Board members and therefore control Emgesa. In addition, following Enersis’ 2013 capital increase, Enersis has transferred its 25.1% voting rights to us. We hold a total of 56.4% of Emgesa’s voting rights as a result of a transfer of voting rights from Enersis and we are allowed to appoint the majority of the Board members pursuant to a shareholders’ agreement. We therefore control Emgesa. For more information on our control and combination of Emgesa, see “Item 5. Operating and Financial Review and Prospects — A. Operating Results. — 1. Discussion of Main Factors Affecting Operating Results and Financial Condition of the Company.” |
| | • | | We acquired Cachoeira Dourada in Brazil in September 1997, and in 1998 we and Endesa Spain invested in CIEN, which operates an international transmission line connecting Brazil and Argentina. Since October 2005, Cachoeira Dourada and CIEN have been subsidiaries of our affiliate, Enel Brasil (formerly Endesa Brasil), which we account for based on the equity method. |
As a result of the Spin-Off, Endesa Américas S.A. will hold the Non-Chilean Business of Endesa Chile and Endesa Chile will primarily engage in the generation of electricity in Chile.
As of September 30, 2015, we had 8,371 MW of installed capacity, with 77 generation units in the three countries (Argentina, Colombia and Peru) in which we operate, combined assets of Ch$ 3,892 billion and operating revenues of Ch$ 905.9 billion.
34
Capital Investments, Capital Expenditures and Divestitures
We coordinate our overall financing strategy, including the terms and conditions of loans and intercompany advances entered into by our combined entities, in order to optimize debt and liquidity management. Generally, our operating combined entities independently plan capital expenditures financed by internally generated funds or direct financings. Although we have considered how these investments will be financed as part of our budget process, we have not committed to any particular financing structure, and investments will depend on the prevailing market conditions at the time the cash flows are needed.
Our investment plan is flexible enough to adapt to changing circumstances by giving different priorities to each project in accordance with profitability and strategic fit. Investment priorities are currently focused on developing additional thermal capacity in Peru to guarantee adequate levels of reliable supply while remaining focused on the environment.
For the 2016-2020 period, we expect to make capital expenditures of Ch$ 759 billion in our combined entities, related to investments currently in progress, maintenance of existing generation plants and in the studies required to develop other potential generation projects. For further detail regarding these projects, please see “Item 4. Information on the Company — D. Property, Plant and Equipment — Projects Under Development.”
The table below sets forth the expected capital expenditures for the 2016-2020 period and the capital expenditures incurred for the nine months ended September 30, 2015 and for the years ended December 31, 2014 and 2013:
| | | | | | | | | | | | | | | | |
| | | Estimated
2016-2020 | | | September
2015 | | | December
2014 | | | December
2013 | |
| | | (in millions of Ch$) | |
Capital expenditures(1) | | | 759,218 | | | | 216,149 | | | | 266,281 | | | | 206,848 | |
| | | | | | | | | | | | | | | | |
| (1) | Capex amounts represent effective payments for each year net of contributions, except for future projections. |
Capital Expenditures for the nine months ended September 30, 2015 and the years ended December 31, 2014 and 2013
Our capital expenditures in the last three years were related principally to the 400 MW El Quimbo project in Colombia and the maintenance of existing installed capacity. El Quimbo project was completed and began commercial operations in November 2015. Additionally, in December 2014, the Salaco plant optimization was completed, adding a total of 145 MW to the Colombian system.
Investments currently in progress
We believe projects in progress will be financed with resources provided by external financing as well as internally generated funds for each of the projects described.
In this “Business Overview” section, references to “we,” “us” and “our” are to the Non-Chilean Business of Endesa Chile prior to the Spin-Off, and to Endesa Américas after the Spin-Off.
We have operations in Argentina, Colombia, and Peru, and an equity interest in a Brazilian company. Our core business is electricity generation. We also participate in other activities which are not part of our core business. Since these non-core activities represent less than 1% of our 2015 revenues, we do not report them as separate business in this information statement or in our combined financial statements.
35
The table below presents our revenues by geographical location:
| | | | | | | | | | | | | | | | | | | | | | | | |
| | | Nine months ended
September 30, | | | Year ended
December 31, | |
Revenues | | 2015 | | | 2014 | | | Change
2015 vs. 2014 | | | 2014 | | | 2013 | | | Change
2014 vs. 2013 | |
| | | (in millions of Ch$) | | | (in %) | | | (in millions of Ch$) | | | (in %) | |
Argentina | | | 102,316 | | | | 76,759 | | | | 33 | % | | | 105,265 | | | | 131,443 | | | | (20 | %) |
Colombia | | | 525,172 | | | | 588,367 | | | | (11 | %) | | | 753,373 | | | | 639,504 | | | | 18 | % |
Peru | | | 276,761 | | | | 257,950 | | | | 7 | % | | | 353,795 | | | | 283,806 | | | | 25 | % |
| | | | | | |
Total revenues | | | 904,249 | | | | 923,076 | | | | (2 | %) | | | 1,212,433 | | | | 1,054,753 | | | | 15 | % |
| | | | | | | | | | | | | | | | | | | | | | | | |
We own and operate 77 generation units in the three countries in which we combine results, with an aggregate installed capacity of 8,371MW, 8 MW higher than 2014.
Our hydroelectric installed capacity represents 56.3% of our total installed capacity. Based on 2014 data, our installed generation capacity in Argentina, Colombia and Peru represents approximately 12%, 20% and 19% of total capacity in each country, respectively.
For additional detail on capacity increase of these units see “Item 4. Information on the Company — D. Property, Plant and Equipment.”
The following table summarizes our combined generation by type of energy:
COMBINED GENERATION BY TYPE OF ENERGY (GWh)
| | | | | | | | | | | | | | | | |
| | | Nine months ended September 30, | |
| | | 2015 | | | 2014 | |
| | | Generation | | | % | | | Generation | | | % | |
Hydroelectric generation | | | 15,935 | | | | 62.2 | | | | 15,171 | | | | 62.3 | |
Thermal generation | | | 9,685 | | | | 37.8 | | | | 9,178 | | | | 37.7 | |
Total generation | | | 25,620 | | | | 100 | | | | 24,349 | | | | 100 | |
| | | | | | | | | | | | | | | | |
| | | Year ended December 31, | |
| | | 2014 | | | 2013 | |
| | | Generation | | | % | | | Generation | | | % | |
Hydroelectric generation | | | 19,698 | | | | 62.0 | | | | 18,576 | | | | 58.1 | |
Thermal generation | | | 12,074 | | | | 38.0 | | | | 13,403 | | | | 41.9 | |
Total generation | | | 31,772 | | | | 100 | | | | 31,979 | | | | 100 | |
Our combined electricity generation reached 25,620 GWh during the nine months ended September 30, 2015, which reflects a 5.3% increase compared to the same period in 2014. This is mainly due to an increased of hydro and thermal generation in Argentina due to additional dispatch by the electric market operator (“CAMMESA” in its Spanish acronym). Our total generation increased by 2.7% in Colombia, decreased by 5.5% in Peru and increased by 18.4% in Argentina. Hydroelectric generation and thermal generation during the nine months ended September 30, 2015 in the three countries (Argentina, Colombia and Peru) where we combine results increased by 5.0% and 5.5%, respectively, compared to the same period in 2014.
Our combined electricity generation reached 31,772 GWh in 2014, 0.6% lower than in 2013, and it is mainly due to a decrease in hydro generation in Colombia and additional dispatch by CAMMESA in Argentina. Our total generation increased by 6.4% in Colombia, by 2.6% in Peru and decreased by 11.4% in Argentina. Hydroelectric generation in 2014 in the three countries (Argentina, Colombia and Peru) where we operate was 6.0% higher than in 2013, and thermal generation in 2014 was 9.9% lower than in 2013.
36
Our combined electricity sales for during the nine months ended September 30, 2015 totaled 28,458 GWh, which reflects a 5.1% increase compared to the same period in 2014. The increase in our combined electricity sales is mainly explained be our increased sales in Colombia and Argentina, 13.9% and 5.8%, respectively, during the nine months ended September 30, 2015 compared to the same period in 2014. Our sales decreased by 6.2% in Peru during the nine months ended September 30, 2015 compared to the same period in 2014.
Our combined electricity sales for 2014 were 35,535 GWh, 4.9% lower than in 2013. We increased our sales in Peru from 8,903 GWh in 2013 to 9,320 GWh in 2014, or 4.5%. The decrease in our combined electricity sales is mainly explained by the results obtained in Argentina and Colombia, with a decrease of 15.5% and 2.0%, respectively, as set forth in the following table:
ELECTRICITY DATA BY COUNTRY
| | | | | | | | | | | | | | | | |
| | | Nine months ended
September 30, | | | Year ended
December 31, | |
| | | 2015 | | | 2014 | | | 2014 | | | 2013 | |
Argentina | | | | | | | | | | | | | | | | |
Number of generating units(1) | | | 20 | | | | 20 | | | | 20 | | | | 20 | |
Installed capacity (MW)(2) | | | 3,632 | | | | 3,632 | | | | 3,632 | | | | 3,632 | |
Electricity generation (GWh) | | | 8,680 | | | | 7,332 | | | | 9,604 | | | | 10,840 | |
Energy sales (GWh) | | | 9,112 | | | | 8,000 | | | | 10,442 | | | | 12,354 | |
Colombia | | | | | | | | | | | | | | | | |
Number of generating units(1)(3) | | | 32 | | | | 31 | | | | 32 | | | | 29 | |
Installed capacity (MW)(2)(3) | | | 3,059 | | | | 3,041 | | | | 3,059 | | | | 2,926 | |
Electricity generation (GWh) | | | 10,750 | | | | 10,467 | | | | 13,559 | | | | 12,748 | |
Energy sales (GWh) | | | 12,845 | | | | 12,140 | | | | 15,773 | | | | 16,090 | |
Peru | | | | | | | | | | | | | | | | |
Number of generating units(1)(3) | | | 25 | | | | 24 | | | | 25 | | | | 24 | |
Installed capacity (MW)(2)(3) | | | 1,680 | | | | 1,528 | | | | 1,652 | | | | 1,540 | |
Electricity generation (GWh) | | | 6,190 | | | | 6,550 | | | | 8,609 | | | | 8,391 | |
Energy sales (GWh) | | | 6,501 | | | | 6,929 | | | | 9,320 | | | | 8,903 | |
Total | | | | | | | | | | | | | | | | |
Number of generating units(1) | | | 79 | | | | 75 | | | | 77 | | | | 73 | |
Installed capacity (MW)(2) | | | 8,371 | | | | 8,200 | | | | 8,343 | | | | 8,098 | |
Electricity generation (GWh) | | | 25,620 | | | | 24,349 | | | | 31,772 | | | | 31,979 | |
Energy sales (GWh) | | | 28,458 | | | | 27,069 | | | | 35,535 | | | | 37,347 | |
| | | | | | | | | | | | | | | | |
| (1) | For details on generation facilities, see “Item 4. Information on the Company — D. Property, Plant and Equipment — Property, Plant and Equipment of Generating Companies.” |
| (2) | Total installed capacity is defined as the maximum capacity (MW), under specific technical conditions and characteristics. In most cases, installed capacity is confirmed by satisfaction guarantee tests performed by equipment suppliers. Figures may differ from installed capacity declared to governmental authorities and customers in each country, according to criteria defined by such authorities and relevant contracts. |
| (3) | The Darío Valencia hydro plant in Colombia has been combined since November 2013 and unit 2 of the Matucana hydro plant in Peru increased its installed capacity in June 2013. In October 2013, La Junca unit and La Tinta 5 unit in Colombia and the Santa Rosa Gas Turbine Unit No.7 in Peru were all decommissioned; however, the Santa Rose Gas Turbine Unit No.7 restarted operations in December 2014. |
We break down our sales to customers by using the two following criteria:
| | • | | The first criterion corresponds to regulated and unregulated customers. Regulated customers are distribution companies that mainly serve residential customers. Unregulated customers, on the other hand, may freely negotiate the electricity price with generators, or may purchase electricity in the pool market at the spot price. The classification of regulated customers differs from one country to another. |
37
| | • | | The second criterion corresponds to contracted and non-contracted sales. This method is useful because it provides us a uniform way to compare the customers of each country. Contracted sales are defined uniformly throughout. |
In the countries in which we operate, the potential for contracting electricity is generally related to electricity demand. Customers identified as small volume regulated customers, including residential customers, are subject to government regulated electricity tariffs, and must purchase electricity directly from a distribution company. These distribution companies, which purchase large amounts of electricity for small volume residential customers, generally enter into contractual agreements with generators at a regulated tariff price. Those identified as large volume industrial customers also enter into contractual agreements with energy suppliers. However, such large volume industrial customers are not subject to the regulated tariff price. Instead, these customers are allowed to negotiate the energy price with generators based on the characteristics of the service required. Finally, the pool market, where energy is normally sold at the spot price, is not carried out through contracted pricing.
The following table contains information regarding our combined sales of electricity by type of customer for each of the periods indicated:
COMBINED ELECTRICITY SALES BY CUSTOMER TYPE (GWh)(1)
| | | | | | | | | | | | | | | | | | | | | | | | | | | | | | | | |
| | | Nine months ended September 30, | | | Year ended December 31, | |
| | | 2015 | | | 2014 | | | 2014 | | | 2013 | |
| | | Sales | | | % of
Sales
Volume | | | Sales | | | % of
Sales
Volume | | | Sales | | | % of
Sales
Volume | | | Sales | | | % of
Sales
Volume | |
Regulated customers | | | 10,066 | | | | 35.4 | | | | 9,501 | | | | 35.1 | | | | 12,801 | | | | 36.0 | | | | 12,989 | | | | 34.8 | |
Unregulated customers | | | 5,527 | | | | 19.4 | | | | 5,795 | | | | 21.4 | | | | 7,744 | | | | 21.8 | | | | 8,207 | | | | 22.0 | |
| | | | | | | | | | | | | | | | | | | | | | | | | | | | | | | | |
Total contracted sales(1) | | | 15,593 | | | | 54.8 | | | | 15,296 | | | | 56.5 | | | | 20,545 | | | | 57.8 | | | | 21,197 | | | | 56.8 | |
| | | | | | | | | | | | | | | | | | | | | | | | | | | | | | | | |
Electricity pool market sales | | | 12,866 | | | | 45.2 | | | | 11,772 | | | | 43.5 | | | | 14,990 | | | | 42.2 | | | | 16,151 | | | | 43.2 | |
| | | | | | | | | | | | | | | | | | | | | | | | | | | | | | | | |
Total electricity sales | | | 28,458 | | | | 100 | | | | 27,068 | | | | 100 | | | | 35,535 | | | | 100 | | | | 37,348 | | | | 100 | |
| | | | | | | | | | | | | | | | | | | | | | | | | | | | | | | | |
| (1) | Includes the sales to distribution companies not backed by contracts in Peru. |
Specific energy consumption limits (measured in GWh) for regulated and unregulated customers are country specific. Moreover, regulatory frameworks often require that regulated distribution companies have contracts to support their commitments to small volume customers and also determine which customers can purchase energy in electricity pool markets.
In terms of expenses, the primary variable costs involved in the electricity generation business, in addition to the direct variable cost of generating hydroelectric or thermal electricity such as fuel costs, are energy purchases and transportation costs. During periods of relatively low rainfall conditions, the amount of our thermal generation increases. This involves an increase of the total fuel cost and the costs of its transportation to the thermal generation power plants. Under drought conditions, electricity that we have contractually agreed to provide may exceed the amount of electricity that we are able to generate, which requires us to purchase electricity in the pool market at spot prices in order to satisfy our contractual commitments. The cost of these purchases at spot prices may, under certain circumstances, exceed the price at which we sell electricity under contracts and, therefore, may result in a loss. We attempt to minimize the effect of poor hydrological conditions on our operations in any year by limiting our contractual sales requirements to a quantity that does not exceed the estimated production in a dry year. To determine an estimated production in a dry year, we take into consideration the available statistical information concerning rainfall, hydrological levels, and the capacity of key reservoirs. In addition to limiting contracted sales, we may adopt other strategies including installing temporary thermal capacity, negotiating lower consumption levels with unregulated customers, negotiating with other water users and including pass-through cost clauses in contracts with customers.
38
The following table contains information regarding our combined electricity generation and purchases:
COMBINED GENERATION AND PURCHASES (GWh)(1)
| | | | | | | | | | | | | | | | | | | | | | | | | | | | | | | | |
| | | Nine months ended
September 30, | | | Year ended
December 31, | |
| | | 2015 | | | 2014 | | | 2014 | | | 2013 | |
| | | (GWh) | | | % of
Volume | | | (GWh) | | | % of
Volume | | | (GWh) | | | % of
Volume | | | (GWh) | | | % of
Volume | |
Electricity generation | | | 25,620 | | | | 89.6 | | | | 24,349 | | | | 89.7 | | | | 31,772 | | | | 89.1 | | | | 31,979 | | | | 85.4 | |
Electricity purchases | | | 2,982 | | | | 10.4 | | | | 2,806 | | | | 10.3 | | | | 3,882 | | | | 10.9 | | | | 5,487 | | | | 14.6 | |
| | | | | | | | | | | | | | | | | | | | | | | | | | | | | | | | |
Total | | | 28,896 | | | | 100 | | | | 27,155 | | | | 100 | | | | 35,655 | | | | 100 | | | | 37,466 | | | | 100 | |
| | | | | | | | | | | | | | | | | | | | | | | | | | | | | | | | |
| (1) | The sum of energy generation and electricity purchases differ from total GWh due to the energy used to power the pumps for the Muña reservoir in Colombia. |
Since September 2005, we have participated in the Brazilian electricity business through our equity investment in Enel Brasil S.A., in which we have a beneficial ownership interest of 37.1%. Enel Brasil consolidates operations of (i) two generation companies, Fortaleza and Cachoeira Dourada, (ii) CIEN, which owns two transmission lines between Argentina and Brazil, (iii) CTM and TESA, subsidiaries of CIEN which own the Argentine side of the lines and (iv) two distribution companies, Ampla Energia e Serviço S.A. (“Ampla”), which is the second largest electricity distribution company in the State of Rio de Janeiro, and Companhia Energética do Ceará S.A. (“Coelce”), which is the sole electricity distributor in the State of Ceará.
Seasonality
While our core business is subject to weather patterns, generally only extreme events such as prolonged droughts, which may adversely affect our generation capacity, rather than seasonal weather variations, may materially affect our operating results and financial condition.
The generation businesses in the countries where we operate are affected by seasonal changes throughout the year. The months with the most precipitation in Argentina are typically May through August, with snow melts typically occurring between October and December. The months with the most precipitation in our operating area in Colombia are typically April and May as well as October and November. The months with the most precipitation in Peru are typically November through March.
When there is more precipitation hydroelectric generating facilities can accumulate additional water to be used for generation. The increased level of our reservoirs allows us to generate more electricity with hydro power plants during months in which marginal electricity costs are lower.
In general, hydrological conditions such as droughts and insufficient rainfall may adversely affect our generation capacity. For example, severe prolonged drought conditions or reduced rainfall levels in the countries in which we operate caused by the El Niño phenomenon reduces the amount of water that can be accumulated in reservoirs, thereby curtailing our hydroelectric generation capacity. In order to mitigate hydrological risk, hydroelectric generation may be substituted with thermal generation (natural gas, LNG, coal or diesel) and energy purchases on the spot market, both of which could result in higher costs, in order to meet our obligations under contracts with both regulated and unregulated customers.
Operations in Argentina
We participate in electricity generation in Argentina through our combined entities (Costanera and El Chocón), with an aggregate of 20 power units. Costanera owns eleven thermal units, with a total installed capacity of 2,304 MW and el Chocón owns nine hydroelectric units, with total installed capacity of 1,328 MW. Our hydro and thermal generation units in Argentina represented 11% of the Argentine National Interconnected system’s (the “Argentine NIS”) installed capacity in 2014 and 11.6% as of September 30, 2015.
39
Our Argentine combined entities have stakes in three additional companies: Termoeléctrica Manuel Belgrano S.A., Termoeléctrica San Martín S.A. and Central Vuelta de Obligado S.A. These companies were formed to undertake the construction of three new generation facilities for a fund called “FONINVEMEM,” whose purpose is to increase electricity capacity and generation within the Argentine wholesale electricity market. The first two plants began their operations in 2008 using gas turbines, with an aggregate capacity of 1,125 MW, and combined-cycles plant as of March 2010, with an additional capacity of 572 MW. The total aggregate capacity of these units is 1,697 MW (848 MW from Manuel Belgrano and 849 MW from San Martín). The third plant began its open cycle operations in December 2014 (with an installed capacity of 540 MW) and it is expected to begin its combined cycle operations in 2016 (with a total installed capacity of 800 MW).
Since 2002, government intervention and energy industry authority actions, including limiting the spot price of electricity by considering the variable cost of generating electricity with natural gas and without considering the hydrological conditions of rivers and reservoirs or the use of more expensive fuels, have led to the lack of investment in the electric power sector. (See “Item 4. Operation of the Company — B. Business Overview — Electricity Industry Regulatory Framework” for further detail). In addition, since 2002, the Argentine government has taken an active role in controlling the fuel supply to the electricity generation sector.
In March 2013, the government intervened with the fuel markets through Resolution No. 95/2013. CAMMESA is now responsible for the supply and the commercial management of fuels for electric generation purposes.
As of both December 31, 2014 and September 30, 2015, Costanera’s installed capacity accounted for 7.4% of the total installed capacity in the Argentine NIS. Costanera’s second combined-cycle plant can operate with either natural gas or diesel. Costanera’s 2,304 MW steam turbine power plant can also operate with either natural gas or fuel oil.
El Chocón accounted for 4.2% of the installed capacity in the Argentine NIS as of December 31, 2014 and September 30, 2015. El Chocón has a 30-year concession, ending in 2023, for two hydroelectric generation facilities with an aggregate installed capacity of 1,328 MW. The larger of the two facilities for which El Chocón has a concession of 1,200 MW of installed capacity is the primary flood control installation on the Limay River. The facility’s large reservoir, Ezequiel Ramos Mejía, enables El Chocón to be one of the Argentine NIS major peak suppliers. Variations in El Chocón’s water discharge are moderated by El Chocón’s Arroyito facility, a downstream dam with 128 MW of installed capacity. A portion of the Arroyito facility’s generation is sold under the “Energy Plus” program, which provides for the offer of new electricity capacity to supply the electricity demand growth, using the 2005 demand level for electricity as a base. (For details on Energy Plus, see “Item 4. Information on the Company — B. Business Overview — Electricity Industry Regulatory Framework — Argentina”).
For information on the installed generation capacity for each of our Argentine combined entities, see “Item 4. Information on the Company — D. Property, Plant and Equipment.”
Our total generation in Argentina amounted to 9,604 GWh in 2014 and 8,680 GWh during the nine months ended September 30, 2015. According to CAMMESA, our generation market share was approximately 12.1% of the total electricity production in Argentina during 2014 and 12.1% for 2015 during the nine months ended September 30, 2015.
Hydroelectric generation in Argentina accounted for nearly 27.4% of our total generation in both 2014 and the nine months ended September 30, 2015. This was due to the fact that hydrological levels of the Limay River were close to average levels.
40
Generation by type and combined entity is shown in the following table:
ELECTRICITY GENERATION IN ARGENTINA (GWh)
| | | | | | | | | | | | | | | | | | | | | | | | | | | | | | | | |
| | | Nine months ended September 30, | | | Year ended December 31, | |
| | | 2015 | | | 2014 | | | 2014 | | | 2013 | |
| | | Generation | | | % | | | Generation | | | % | | | Generation | | | % | | | Generation | | | % | |
Hydroelectric generation (El Chocón) | | | 2,456 | | | | 28.3 | | | | 2,101 | | | | 28.7 | | | | 2,632 | | | | 27.4 | | | | 2,317 | | | | 21.4 | |
Thermal generation (Costanera) | | | 6,224 | | | | 71.7 | | | | 5,231 | | | | 71.3 | | | | 6,972 | | | | 72.6 | | | | 8,523 | | | | 78.6 | |
| | | | | | | | | | | | | | | | | | | | | | | | | | | | | | | | |
Total generation | | | 8,680 | | | | 100 | | | | 7,332 | | | | 100 | | | | 9,604 | | | | 100 | | | | 10,840 | | | | 100 | |
| | | | | | | | | | | | | | | | | | | | | | | | | | | | | | | | |
The following table sets forth our electricity generation and purchases in Argentina:
ELECTRICITY GENERATION AND PURCHASES IN ARGENTINA (GWh)
| | | | | | | | | | | | | | | | | | | | | | | | | | | | | | | | |
| | | Nine months ended
September 30, | | | Year ended December 31, | |
| | | 2015 | | | 2014 | | | 2014 | | | 2013 | |
| | | (GWh) | | | % of
Volume | | | (GWh) | | | % of
Volume | | | (GWh) | | | % of
Volume | | | (GWh) | | | % of
Volume | |
Electricity generation | | | 8,680 | | | | 95.3 | | | | 7,332 | | | | 91.6 | | | | 9,604 | | | | 92.0 | | | | 10,840 | | | | 87.7 | |
Electricity purchases | | | 432 | | | | 4.7 | | | | 668 | | | | 8.3 | | | | 839 | | | | 8.0 | | | | 1,514 | | | | 12.3 | |
| | | | | | | | | | | | | | | | | | | | | | | | | | | | | | | | |
Total | | | 9,405 | | | | 100 | | | | 8,000 | | | | 100 | | | | 10,442 | | | | 100 | | | | 12,354 | | | | 100 | |
| | | | | | | | | | | | | | | | | | | | | | | | | | | | | | | | |
The distribution of our electricity sales in Argentina, by customer segment and per combined entity, is shown in the following tables:
ELECTRICITY SALES PER CUSTOMER SEGMENT IN ARGENTINA (GWh)
| | | | | | | | | | | | | | | | | | | | | | | | | | | | | | | | |
| | | Nine months ended
September 30, | | | Year ended December 31, | |
| | | 2015 | | | 2014 | | | 2014 | | | 2013 | |
| | | Sales | | | % of
Sales
Volume | | | Sales | | | % of
Sales
Volume | | | Sales | | | % of
Sales
Volume | | | Sales | | | % of
Sales
Volume | |
Contracted sales | | | 446 | | | | 4.9 | | | | 683 | | | | 8.5 | | | | 857 | | | | 8.2 | | | | 1,737 | | | | 14.1 | |
Non-contracted sales(1) | | | 8,666 | | | | 95.1 | | | | 7,317 | | | | 91.5 | | | | 9,586 | | | | 91.8 | | | | 10,617 | | | | 85.9 | |
| | | | | | | | | | | | | | | | | | | | | | | | | | | | | | | | |
Total generation | | | 9,112 | | | | 100 | | | | 8,000 | | | | 100 | | | | 10,442 | | | | 100 | | | | 12,354 | | | | 100 | |
| | | | | | | | | | | | | | | | | | | | | | | | | | | | | | | | |
| (1) | Non-contracted electricity were sold at spot prices determined by the Regulator. |
ELECTRICITY SALES PER COMBINED ENTITY IN ARGENTINA (GWh)
| | | | | | | | | | | | | | | | |
| | | Nine months ended
September 30, | | | Year ended December 31, | |
| | | 2015 | | | 2014 | | | 2014 | | | 2013 | |
Costanera | | | 6,225 | | | | 5,301 | | | | 7,051 | | | | 8,962 | |
El Chocón | | | 2,887 | | | | 2,698 | | | | 3,391 | | | | 3,392 | |
| | | | | | | | | | | | | | | | |
Total | | | 9,112 | | | | 8,000 | | | | 10,442 | | | | 12,354 | |
| | | | | | | | | | | | | | | | |
41
In March 2013, the Argentine government intervened in the commercial market for energy, except with respect to the “Energy Plus” program, through the one-time application of Resolution No. 95/2013. CAMMESA is now responsible for the management of contracts with end customers, except for those under the “Energy Plus” program. The resolution defined a transition period in which the electricity generating companies will continue managing the contracts until their expiration dates.
At the end of 2014, Costanera only had one customer contract with an unregulated customer Cerro Negro, and has no contracts with distribution companies. As of September 30, 2015 Costanera did not have any contracts.
Sales to the pool market amounted to 8,666 GWh during the nine months ended September 30, 2015 and 6,972 GWh in 2014.
As of September 30, 2015, El Chocón had eighteen contracts with unregulated customers under the “Energy Plus” program, and no contracts with distribution companies.
As of December 31, 2014, El Chocón had five contracts with unregulated customers under the “Energy Plus” program, and no contracts with distribution companies.
For the nine months ended September 30, 2015, El Chocón’s principal unregulated customers were (ordered alphabetically): Danisco S.A, Petroquímica and Minera Alumbrera.
For the year ended December 31, 2014, El Chocón’s principal unregulated customers were (ordered alphabetically): Acindar, Air Liquide, Chevron, Mínera Alumbrera, Petroquimica and Profertil. Acindar and Profertil do not have contracts directly with El Chocón, but are served through Cemsa, our associate company.
El Chocón does not have the right to terminate its operating agreement with us, unless we fail to comply with our obligations under the agreement. Under the terms of the operating agreement, we are entitled to a fee payable in U.S. dollars based on El Chocón’s annual gross revenues, payable in monthly installments.
According to CAMMESA, electricity demand throughout the Argentine NIS increased by 5.4% during the nine months ended September 30, 2015 compared with the same period of 2014. The total electricity demand was 99,236 GWh during the nine months ended September 30, 2015, 126,397 GWh in 2014 and 125,167 GWh in 2013. Our Argentine combined entities compete with all the major power plants connected to the Argentine NIS. According to the installed capacity reported by CAMMESA, our major competitors in Argentina are: (i) the state controlled company Enarsa (with an installed capacity of 1,060 MW), (ii) the nuclear unit “NASA” (with an installed capacity of 1,010 MW), and (iii) the hydroelectric units Yacyretá and Salto Grande (with an aggregate installed capacity of 3,690 MW). The main private competitors are: AES Group, Sociedad Argentina de Energía S.A. (“Sadesa”), and Pampa Energía. The AES Group has seven power plants connected to the Argentine NIS with a total installed capacity of 2,753 MW (43.7% of which is hydroelectric). Sadesa owns a total of approximately 3,858 MW of installed capacity, the most significant of which are Piedra del Águila (with an installed capacity of 1,400 MW) and Central Puerto (a thermal facility with 1,777 MW of installed capacity). Pampa Energía, with a total installed capacity of 2,217 MW, competes with us with six power plants, of which 653 MW is hydroelectric and 1,564 MW is thermal.
Operations in Colombia
Our generation operations in Colombia are carried out through Emgesa. We hold 56.4% of Emgesa’s voting rights as a result of a transfer of voting rights from Enersis and we are allowed to appoint the majority of the Board members pursuant to a shareholders’ agreement. We therefore control Emgesa. For more information on our control and combination of Emgesa, see “Item 1. Discussion of Main Factors Affecting Operating Results and Financial Condition of the Company.”
42
As of September 30, 2015 and December 31, 2014, Emgesa operated 32 generation units, with a total installed capacity of 3,059 MW, of which 2,615 MW was from hydroelectric plants and 444 MW was from thermoelectric plants. According to Expertos de Mercado S.A. E.S.P. (“XM”), a Colombian company that provides system management in real time services in electrical, financial and transportation sectors, our hydroelectric and thermal generation plants represented 19.4% of the country’s total electricity generation capacity as of September 30, 2015 and 19.7% as of December 31, 2014.
For information on the installed generation capacity for each of our Colombian combined entities, see “Item 4. Information on the Company — D. Property, Plant and Equipment.”
Approximately 85% of our installed capacity in Colombia is hydroelectric, and therefore, our electricity generation depends on reservoir levels and rainfall. According to XM, our generation market share was 21.7% during the nine months ended September 30, 2015, 21.2% in 2014 and 20.6% in 2013. In addition to hydrological conditions, the generation amount depends on our commercial strategy. Companies are free to offer their electricity at prices driven by market conditions and are dispatched by a centralized operating entity to generate according to the prices offered, as opposed to being dispatched according to the operating costs, as in other countries in which we operate.
During the nine months ended September 30, 2015, thermal generation represented 8% of total generation and hydroelectric generation represented the remaining 92%. During the nine months ended September 30, 2015, hydrological conditions were approximately 89% of historical averages in Colombia. In the case of Emgesa, according to XM, the hydrological levels of the Guavio River Basin were 20% higher the average and the hydrological levels of the Magdalena River (Betania) were 1% higher than the average, while the hydrological levels of the Bogotá River (Cadena Nueva) were 16% higher than the average. During the nine months ended September 30, 2015, hydroelectric generation had increased by 1.5% as compared to the same period in 2014.
During 2014, thermal generation represented 6.9% of total generation and hydroelectric generation represented the remaining 93.1%. In 2014, hydrological conditions were below the historical averages in Colombia, with rainfall around 93% of the historical averages. In the case of Emgesa, according to XM, the hydrological levels of the Guavio River Basin were 3% below the average and the hydrological levels of the Magdalena River (Betania) were 3% higher than the average, while the hydrological levels of the Bogotá River (Cadena Nueva) were 17% higher than the average. For the year ended December 31, 2014, hydroelectric generation increased by 7.1% over 2013 levels.
Generation by type in Colombia is shown in the following table:
ELECTRICITY GENERATION IN COLOMBIA (GWh)
| | | | | | | | | | | | | | | | | | | | | | | | | | | | | | | | |
| | | Nine months ended September 30, | | | Year ended December 31, | |
| | | 2015 | | | 2014 | | | 2014 | | | 2013 | |
| | | Generation | | | % | | | Generation | | | % | | | Generation | | | % | | | Generation | | | % | |
Hydroelectric generation | | | 9,886 | | | | 92.0 | | | | 9,741 | | | | 93.1 | | | | 12,627 | | | | 93.1 | | | | 11,784 | | | | 92.4 | |
Thermal generation | | | 865 | | | | 8.0 | | | | 726 | | | | 6.9 | | | | 932 | | | | 6.9 | | | | 964 | | | | 7.6 | |
| | | | | | | | | | | | | | | | | | | | | | | | | | | | | | | | |
Total generation | | | 10,750 | | | | 100 | | | | 10,467 | | | | 100 | | | | 13,559 | | | | 100 | | | | 12,748 | | | | 100 | |
| | | | | | | | | | | | | | | | | | | | | | | | | | | | | | | | |
During the nine months ended September 30, 2015, Emgesa used 360 kilotons of coal for its coal-fired plants, which were obtained from 22 local suppliers. During 2014, Emgesa used 439 kilotons of coal for its coal-fired plants, which were obtained from over 20 local suppliers. The local coal price has remained below the export price as high transport costs make it difficult for domestic coal to compete in the export market. This trend is expected to continue in the Colombian coal market.
43
During 2013, Emgesa also entered into a fuel oil supply agreement with Esapetrol, in addition to the existing oil supply contracts with Petromil and Biomax. We believe that this will ensure that Emgesa will have access to a reliable supply of fuel oil for the Cartagena power plant.
The following table sets forth our electricity generation and purchases in Colombia:
ELECTRICITY GENERATION AND PURCHASES IN COLOMBIA (GWh)
| | | | | | | | | | | | | | | | | | | | | | | | | | | | | | | | |
| | | Nine months ended September 30, | | | Year ended December 31, | |
| | | 2015 | | | 2014 | | | 2014 | | | 2013 | |
| | | (GWh) | | | % | | | (GWh) | | | % | | | (GWh) | | | % | | | (GWh) | | | % | |
Electricity generation | | | 9,227 | | | | 82.8 | | | | 10,467 | | | | 85.6 | | | | 13,559 | | | | 85.3 | | | | 12,748 | | | | 78.6 | |
Electricity purchases | | | 2,239 | | | | 17.2 | | | | 1,760 | | | | 14.4 | | | | 2,333 | | | | 14.7 | | | | 3,461 | | | | 21.4 | |
| | | | | | | | | | | | | | | | | | | | | | | | | | | | | | | | |
Total(1) | | | 12,990 | | | | 100 | | | | 12,140 | | | | 100 | | | | 15,893 | | | | 100 | | | | 16,209 | | | | 100 | |
| | | | | | | | | | | | | | | | | | | | | | | | | | | | | | | | |
| (1) | The sum of energy generation and electricity purchases differ from total sold GWh due to the energy used to power the pumps for the Muña reservoir. |
Colombia has a single interconnected electricity system, the National Interconnected System (“Colombian NIS”). Electricity demand in the Colombian NIS increased 2.8% during the nine months ended September 30, 2015 compared with the same period in 2014. Electricity demand in the Colombian NIS increased 4.4% during 2014. Total accumulated electricity consumption was 65,905 GWh during the nine months ended September 30, 2015, 64,131 GWh during the nine months ended September 30, 2014, 63,570 GWh in 2014 and 60,890 GWh in 2013.
The generation in Colombia’s electricity market has been affected by an agreement with Ecuador to provide an interconnection between the electricity systems of both countries. For the nine months ended September 30, 2015 and the year ended December 31, 2014, Colombian electricity generators sold 445 GWh and 824 GWh, respectively, of electricity to Ecuadorian customers.
In addition, Colombia has interconnection lines with Venezuela that operate under exceptional circumstances as needed by either of the two countries. In April 2011, Colombia and Venezuela signed an agreement to supply energy to Venezuela as part of the normalization of commercial relations. This agreement also includes the import of gasoline and diesel from Venezuela. The total energy exported to Venezuela was 25 GWh in 2014 and 2.4 GWh for during the nine months ended September 30, 2015.
The distribution of our electricity sales in Colombia by customer segment is shown in the following table:
ELECTRICITY SALES PER CUSTOMER SEGMENT IN COLOMBIA (GWh)
| | | | | | | | | | | | | | | | | | | | | | | | | | | | | | | | |
| | | Nine months ended September 30, | | | Year ended December 31, | |
| | | 2015 | | | 2014 | | | 2014 | | | 2013 | |
| | | (GWh) | | | % | | | (GWh) | | | % | | | (GWh) | | | % | | | (GWh) | | | % | |
Contracted sales | | | 9,227 | | | | 71.8 | | | | 8,155 | | | | 67.2 | | | | 10,969 | | | | 69.5 | | | | 11,567 | | | | 71.9 | |
Non-contracted sales | | | 3,618 | | | | 28.2 | | | | 3,985 | | | | 32.8 | | | | 4,804 | | | | 30.5 | | | | 4,523 | | | | 28.1 | |
| | | | | | | | | | | | | | | | | | | | | | | | | | | | | | | | |
Total electricity sales | | | 12,845 | | | | 100 | | | | 12,140 | | | | 100 | | | | 15,773 | | | | 100 | | | | 16,090 | | | | 100 | |
| | | | | | | | | | | | | | | | | | | | | | | | | | | | | | | | |
During the nine months ended September 30, 2015, Emgesa served customers under an average of 921 contracts, serving 420 unregulated customers, of which 17 were for distribution and trading companies. Emgesa’s sales to our distribution company, Codensa, accounted for 15.3% of Emgesa’s total contracted sales during the nine months ended September 30, 2015. Electricity sales to the five largest unregulated customers represented 21% of total contracted sales.
44
During 2014, Emgesa served customers under an average of 860 contracts, serving 401 unregulated customers, of which 16 were for distribution and trading companies. Emgesa’s sales to our distribution company, Codensa, accounted for 24% of Emgesa’s total contracted sales in 2014. Electricity sales to the five largest unregulated customers represented 25% of total contracted sales.
During the nine months ended September 30, 2015, the principal distribution customers were (ordered alphabetically): Centrales Eléctricas del Norte de Santander, Codensa (Enersis’ associate company), Compañía Energética del Tolima (“Enertolima”), Electrificadora de Santander, Electrificadora del Caribe (“Electrocaribe”), Electrificadora del Huila, Electrificadora del Meta (“Meta”), Empresa de Energía del Pacífico (“EPSA”) and Empresas Públicas de Medellín (“EPM”).
For the year ended December 31, 2014, principal distribution customers were (ordered alphabetically): CEO, Codensa, Enertolima, Electrocaribe, Electrificadora del Huila, Meta, Electrificadora de Santander, EPM and PEREIRA.
Our most significant competitors in Colombia include the following state-owned companies: Empresas Públicas de Medellín (with an installed capacity of 3,202 MW) and Isagen (with an installed capacity of 3,001 MW). We also compete with the following private sector companies in Colombia: Chivor (with an installed capacity of 1,000 MW), which is owned by Gener; Colinversiones (with an installed capacity of 1,862 MW), which includes Termoflores and Epsa; and Gecelca (with an installed capacity of 1,361 MW).
Operations in Peru
Through our combined entity, Edegel, we operate a total of 25 generation units in Peru, with a total installed capacity of 1,680 MW. As of September 30, 2015, Edegel owns 18 hydroelectric units, with a total installed capacity of 783 MW, and the remaining 896 MW consists of seven thermal units. On May 6, 2013, Turbine Gas Unit No. 7 of Santa Rosa was decommissioned due to fire damage. The damage in the plant resulted in a total loss and the insurance covered both the assets and the business interruption for a period of up two years. On December 5, 2014, the Turbine Gas Unit No. 7 began its commercial operations again. According to Osinergmin, the Peruvian regulatory electricity authority, our hydroelectric and thermal generation plants in Peru represent 17.7% of the country’s total electricity generation capacity as of September 30, 2015 and 19.0% of the country’s total electricity generation capacity as of December 31, 2014.
For information on the installed generation capacity for each of our power plants in Peru, see “Item 4. Information on the Company — D. Property, Plant and Equipment.”
Generation by type in Peru is shown in the following table:
ELECTRICITY GENERATION IN PERU (GWh)
| | | | | | | | | | | | | | | | | | | | | | | | | | | | | | | | |
| | | Nine months ended September 30, | | | Year ended December 31, | |
| | | 2015 | | | 2014 | | | 2014 | | | 2013 | |
| | | Generation | | | % | | | Generation | | | % | | | Generation | | | % | | | Generation | | | % | |
Hydroelectric generation | | | 3,594 | | | | 58.1 | | | | 3,300 | | | | 50.8 | | | | 4,439 | | | | 51.6 | | | | 4,474 | | | | 53.3 | |
Thermal generation | | | 2,596 | | | | 41.9 | | | | 3,221 | | | | 49.2 | | | | 4,170 | | | | 48.4 | | | | 3,917 | | | | 46.7 | |
| | | | | | | | | | | | | | | | | | | | | | | | | | | | | | | | |
Total generation | | | 6,190 | | | | 100 | | | | 6,550 | | | | 100 | | | | 8,609 | | | | 100 | | | | 8,391 | | | | 100 | |
| | | | | | | | | | | | | | | | | | | | | | | | | | | | | | | | |
According the Committee of Economic Operation of the Peruvian System (“COES” in its Spanish acronym), we generated 21.2% of total electricity production in Peru in 2014 and 19% of total electricity production in Peru during the nine months ended September 30, 2015.
45
Hydroelectric generation represented 51.6% of total production of Edegel in 2014 and 58.1% during the nine months ended September 30, 2015. In the case of Edegel, all hydrological levels were above their historical averages during the nine months ended September 30, 2015. According to COES, hydrological levels of the Rimac River Basin (Huinco, Matucana, Callahuanca, Moyopampa and Huampaní) were 9% higher than the average; hydrological levels of the Tulumayo River (C.H. Chimay) were 15% higher than the average; and hydrological levels of the Tarma River (C.H. Yanango) were 6% higher than the average.
During the nine months ended September 30, 2015, 95.2% of Edegel’s electricity sales were supplied by its generation, requiring Edegel to purchase 4.8% to comply with its contractual obligations to customers.
In 2014, 92.4% of Edegel’s electricity sales were supplied by its generation, requiring Edegel to purchase 7.6% to comply with its contractual obligations to customers.
Edegel has long-term gas supply, transportation and distribution contracts for its Ventanilla and Santa Rosa facilities. It has also signed transport capacity transfer agreements with other generators, which allows it to trade transport capacity in order to operate as instructed by COES, and optimize the use of the natural gas transport system.
The following table sets forth our electricity generation and purchases in Peru:
ELECTRICITY GENERATION AND PURCHASES IN PERU (GWh)
| | | | | | | | | | | | | | | | | | | | | | | | | | | | | | | | |
| | | Nine months ended September 30, | | | Year ended December 31, | |
| | | 2015 | | | 2014 | | | 2014 | | | 2013 | |
| | | (GWh) | | | % | | | (GWh) | | | % | | | (GWh) | | | % | | | (GWh) | | | % | |
Electricity generation | | | 6,190 | | | | 95.2 | | | | 6,550 | | | | 94.5 | | | | 8,609 | | | | 92.4 | | | | 8,391 | | | | 94.2 | |
Electricity purchases | | | 311 | | | | 4.8 | | | | 378 | | | | 5.5 | | | | 711 | | | | 7.6 | | | | 512 | | | | 5.8 | |
| | | | | | | | | | | | | | | | | | | | | | | | | | | | | | | | |
Total | | | 6,501 | | | | 100 | | | | 6,929 | | | | 100 | | | | 9,320 | | | | 100 | | | | 8,903 | | | | 100 | |
| | | | | | | | | | | | | | | | | | | | | | | | | | | | | | | | |
The Peruvian National Interconnected Electric System (“SEIN” in its Spanish acronym) is the only interconnected system in Peru. Electricity sales in the SEIN increased by 5.1% in 2014 compared to 2013, amounting to 37,457 GWh.
The distribution of Edegel’s electricity sales by customer segment in Peru is shown in the following table:
ELECTRICITY SALES PER CUSTOMER SEGMENT IN PERU (GWh)
| | | | | | | | | | | | | | | | | | | | | | | | | | | | | | | | |
| | | Nine months ended September 30, | | | Year ended December 31, | |
| | | 2015 | | | 2014 | | | 2014 | | | 2013 | |
| | | (GWh) | | | % | | | (GWh) | | | % | | | (GWh) | | | % | | | (GWh) | | | % | |
Contracted sales | | | 5,919 | | | | 91.0 | | | | 6,459 | | | | 93.2 | | | | 8,719 | | | | 93.6 | | | | 7,892 | | | | 88.6 | |
Non-contracted sales | | | 582 | | | | 9.0 | | | | 470 | | | | 6.8 | | | | 601 | | | | 6.4 | | | | 1,011 | | | | 11.4 | |
| | | | | | | | | | | | | | | | | | | | | | | | | | | | | | | | |
Total generation | | | 6,501 | | | | 100 | | | | 6,929 | | | | 100 | | | | 9,320 | | | | 100 | | | | 8,903 | | | | 100 | |
| | | | | | | | | | | | | | | | | | | | | | | | | | | | | | | | |
| (1) | Includes sales to distributors without contract. |
Edegel’s electricity sales decreased by 6.2% during the nine months ended September 30, 2015 compared to the same period in 2014, mainly due to decreased demand from regulated and unregulated customers. During the nine months ended September 30, 2015, Edegel had ten regulated customers and fourteen unregulated customers. Sales to unregulated customers represented 38.9% of Edegel’s total contracted sales.
46
Edegel’s electricity sales increased by 4.7% in 2014 compared to 2013, mainly due to the fact it began to supply distribution companies under long-term contracts. During 2014, Edegel had eleven regulated customers and fifteen unregulated customers. Sales to unregulated customers represented 38.5% of Edegel’s total contracted sales.
In 2013 and 2014, there were no long-term tenders in Peru. Edelnor is currently involved in a long-term bidding process for a total requirement of approximately 3300 GWh per year starting in 2022 and for a term of 10 years. The submission of bids were held on December 10, 2015.
During the nine months ended September 30, 2015, Edegel’s principal distribution customers were (ordered alphabetically): Edelnor (Enersis Américas’ combined entity), ElectroSur, Hidrandina, Luz del Sur and Seal, and Edegel’s principal unregulated customers were (ordered alphabetically): Compañia Minera Casapalca, Creditex, Hudbay Perú, Minera Chinalco Perú and Refinería Cajamarquilla.
For the year ended December 31, 2014, Edegel’s principal distribution customers were (ordered alphabetically): Edelnor (Enersis’ combined entity), ElectroSur, Hidrandina, Luz del Sur and Seal, and Edegel’s principal unregulated customers were (ordered alphabetically): Antamina, Creditex, Minera Chinalco Perú, Refinería Cajamarquilla and Siderúrgica del Perú.
Our most significant competitors in Peru are: Enersur (GDF-Suez group, with an installed capacity of 1,247 MW), Electroperú (a state-owned competitor, with an installed capacity of 911 MW), Kallpa (Inkia Energy group, with an installed capacity of 1,060 MW), Egenor (Duke Energy group, with an installed capacity of 622 MW) and Fenix (Fenix Power Peru group, with an installed capacity of 570 MW).
47
ELECTRICITY INDUSTRY REGULATORY FRAMEWORK
The following chart shows a summary of the main characteristics of the electricity regulatory framework by business segment for the four countries in which we have investments or have an economic interest.
| | | | | | | | | | |
| | | | | Argentina | | Brazil | | Peru | | Colombia |
| | | Unregulated Market | | Regulated remuneration scheme (Resolution No. 482/2015) | | Spot markets with costs audited by the regulator | | Spot market with auctioned cost (Price-offered) |
| | | | | | |
| Gx | | Regulated | | Seasonal Price | | Auction Thermal - 20 years / Hydro - 30 years | | Node Price auction 20 years | | Auction 3/5 years |
| | | | | | |
| | | Capacity | | Contribution peak demand | | — | | Income based on contributions during peak demand | | Firm energy contribution (energy auctions for at least 20 years) |
| | | |
| Tx | | Features | | Public - Open Access - Regulated Tariff Monopoly Regime for Transmission System Operators (“TSOs”) |
| | | | | |
| Dx | | Law | | Concession contract | | Administrative Concession (indefinite) | | Authorization Operation Zone |
| | Expansion | | 95 years | | 30 years | | Undefined | | |
| | Tariff review | | 5 years | | 4/5 years | | 4 years | | 5 years |
| | | | | | |
| Cx | | Unregulated Agents | | > 0.03 MW | | > 0.5 MW | | > 0.2 to 2.5 MW | | > 0.1 MW |
| | Liberalized (%) | | ≈ 20% | | ≈ 25% | | ≈ 45% | | ≈ 30% |
| | | | | | |
| Gx: Generation | | Tx: Transmission | | Dx: Distribution | | Cx: Trading |
Argentina
Industry Overview
Industry Structure
In the Argentine Wholesale Electricity Market (“Argentine MEM” in its Spanish acronym) there are four categories of local agents (generators, transmitters, distributors, and large customers) and external agents (traders of generation and traders of demand) who are allowed to buy and sell electricity as well as related products.
48
The following chart shows the relationships among the various participants in the Argentine MEM:
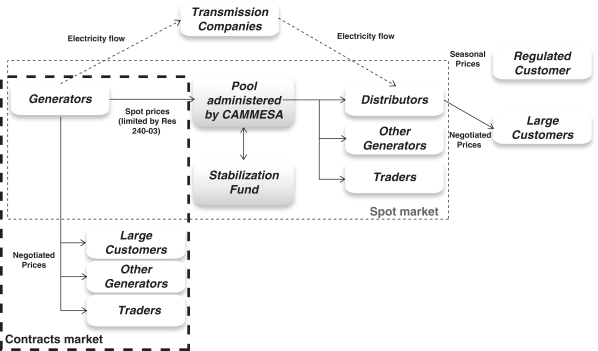
The generation sector was organized on a competitive basis until March 2013, with independent generating companies selling their output in the Argentine MEM spot market, through private contracts to purchasers in the Argentine MEM contract market or to CAMMESA, through special transactions.
On March 26, 2013, the Argentine Secretary of Energy published Resolution No. 95/2013 that set out a regulated remuneration scheme for power generation activity beginning retroactively from February 2013. The main features of the Resolution are as follows:
| | • | | It applies to generators, co-generators and self-generators, except for power plants entered into operation after 2005, nuclear generation and cross-border hydro generation. |
| | • | | CAMMESA, the market operator, became the single buyer/seller for the fuel needed for plant operations. This implies that market agents will not be allowed to trade commodities. |
| | • | | Free bilateral trading is suspended: large customers will have to buy electricity directly from CAMMESA (no change of supply for residential customers, they will still be served by distribution companies). |
| | • | | Generators began to receive a regulated remuneration, which should cover fixed and variable costs plus additional remuneration. |
The transmission sector is regarded as a public service, operating under monopoly conditions and is comprised of several companies to whom the Argentine government grants concessions. One concessionaire operates and maintains the highest voltage facilities and eight concessionaires operate and maintain high and medium voltage facilities, to which generation plants, distribution systems and large customers are connected. The international interconnected transmission systems also require concessions granted by the Argentine Secretary of Energy. Transmission companies are authorized to charge different tolls for their services.
Distribution is regarded as a public service, operating under monopoly conditions, and is comprised of companies that have been granted concessions by the Argentine government. Distribution companies have the
49
obligation to make electricity available to end customers within a specific concession area, regardless of whether the customer has a contract with the distributor or directly with a generator. Accordingly, these companies have regulated tariffs and are subject to quality service specifications. Distribution companies may obtain electricity on the Argentine MEM’s spot market, at a price called “seasonal price”, which is defined by the Argentine Secretary of Energy as the cap for the costs of electricity bought by distributors that can be passed through to regulated customers.
There are two electricity distribution areas subject to federal concessions. The concessionaires are Edesur (one of our combined entities) and Edenor (an unrelated company), both of which are located in the greater Buenos Aires area. The local distribution areas are subject to concessions granted by the provincial or municipal authorities. However, all distribution companies acting on the Argentine MEM must operate under its rules.
Regulated customers are supplied by distributors at regulated tariffs.
“Large Customers” are classified into three categories: major large customers, minor large customers and private large customers. Each of these categories of customers has different requirements with respect to purchases of their energy demand. For example, major large customers are required to purchase 50% of their demand through supply contracts and the remainder in the spot market, while minor large customers and private large customers are required to purchase all of their demand through supply contracts. Large customers participate in CAMMESA by appointing two acting and two alternate directors through the Argentine Association of Electric Power for Large Customers.
There is one interconnected system, the Argentine NIS, and smaller systems that provide electricity to specific areas. According to the Argentine National Institute of Statistics and Census (Federal Planning Ministry provisional data 2013), 99.2% of the energy required by the country is supplied by the Argentine NIS and only 0.8% is supplied by isolated systems.
Principal Regulatory Authorities
The Argentine Ministry of Federal Planning, Public Investment and Services, through the Argentine Secretary of Energy, is primarily responsible for studying and analyzing the behavior of energy markets, preparing the strategic planning with respect to electricity, hydrocarbons and other fuels, promoting policies to increase competition and improve efficiency in the assignment of resources, leading actions for applying the sector policy, orienting new operators to the general interest, respecting the rational exploitation of the resources and the preservation of the environment.
The ENRE carries out the measures necessary for meeting national policy objectives with respect to the generation, transmission and distribution of electricity. Its principal objectives are to: protect the rights of customers; promote competitiveness in production; encourage investments that assure long-term supply; promote free access, non-discrimination and the generalized use of the transmission and distribution services; regulate transmission and distribution services to ensure fair and reasonable tariffs, and encourage private investment in production, transmission, and distribution, ensuring the competitiveness of the markets where possible. ENRE directly controls the management of Edenor and Edesur as distribution companies operating under a national concession. In the case of Edesur, on July 12, 2012, ENRE appointed an overseer, originally for 45 business days, a term that was extended for successive periods of the same duration, in order to monitor and actively control management of Edesur. ENRE resolution No.243/2013 increased the term from 45 to 90 business days and it may be extended further.
The principal functions of the CAMMESA are the coordination of dispatch operations, the establishment of wholesale prices and the administration of economic transactions made through the Argentine NIS. It is also responsible for executing the economic dispatch through economic considerations and rationality in the administration of energy resources, coordinating the centralized operation of the Argentine NIS to guarantee its
50
security and quality, and managing the Argentine MEM, in order to ensure transparency through the participation of all the players involved and with respect to the respective regulations.
The principal functions of the Argentine Federal Electricity Council are the following: (i) managing specific funds for the electricity sector and (ii) advising the national executive authority and the provincial governments with respect to the electricity industry, the priorities in performing studies and works, concessions and authorizations, and prices and tariffs in the electricity sector. It also provides advice regarding modifications resulting from legislation referring to the electricity industry.
The Federal Environmental Council is an institutional branch of the federal government empowered to address environmental problems and solutions in Argentina. It has legal authority to coordinate the development of environmental policy among member states. The member states adopt regulations or rules that are issued by the Argentine Assembly, which are issued as resolutions.
The Ministry of Environment and Sustainable Development, a member of the Federal Environment Council, assists the Chief of Cabinet of Ministers in the implementation of environmental measures and articulates its insertion in the ministries and other areas of the national public administration. It seeks to foster rational exploitation and sovereignty over Argentina’s natural resources with consideration to fairness and social inclusion. The Secretary is involved in environmental planning and preservation, planning and implementation of national environmental management in the implementation of sustainable development, rational use of non-renewable resources and the diagnosis of environmental issues in coordination with different areas of the Argentine government.
The Electricity Law
General
The Argentine electricity industry was originally developed by private companies. As a result of service problems, the Argentine government began to intervene in the sector in the 1950s and initiated a nationalization process. Law 15,336/60 was passed to organize the sector and establish the federal legal framework for the start of major transmission and generation projects. Many state companies were created within this framework in order to carry out various hydroelectric and nuclear projects.
As a result of the electricity shortage in 1989, the following laws were passed starting in 1990: Law 23,696 (“State Reform”), Law 23,697 (“Economic Emergency”) and Law 24,065 (“Electricity Framework”). The objective of the new legislation was essentially to replace the vertically-integrated system based on a centrally-planned state monopoly with a competitive system based on the market and indicative planning.
Regulatory Developments: The Industry After the Public Emergency Law
Law 25,561, the Public Emergency Law, was enacted in 2002 to manage the economic crisis that began that year. It forced the renegotiation of public service contracts (such as electricity transmission and distribution concession contracts) and imposed the conversion of U.S. dollar denominated obligations into Argentine pesos at a pegged rate of Ar$ 1.00 per US$ 1.00. The mandatory conversion of transmission and distribution tariffs from U.S. dollars to Argentine pesos at this pegged rate (compared to the market exchange rate at that time of approximately Ar$ 3.00 per US$ 1.00) and the regulatory measures that cap and reduce the spot and seasonal prices hindered the pass-through of generation variable costs in the tariffs to end customers.
The Public Emergency Law also empowered the Argentine government to implement additional monetary, financial and foreign exchange measures to overcome the economic crisis in the medium term. These measures have been periodically extended. Law 26,729, which was enacted in December 2011, extended the measures until December 31, 2013 and Law 26,896, enacted in October 2013, further extended the measures until December 31, 2015.
51
The Argentine Secretary of Energy introduced several regulatory measures aimed at correcting the effects of the devaluation into the Argentine MEM’s costs and prices and to reduce the price paid by the end customers.
Resolution No. 240/2003 changed the method for calculating spot prices by decoupling such prices from the marginal cost of operation. Prior to this resolution, spot prices in the Argentine MEM were typically fixed by units operating with natural gas during the warm season (from September through April) and units operating with liquid fuel/diesel in the winter (May through August). Due to restrictions on natural gas supply, winter prices were higher and affected by the price of imported fuels priced in U.S. dollars. Resolution No. 240/2003 sought to avoid price indexation pegged to the U.S. dollar and, although generation dispatch is still based on actual fuels used, the calculation of the spot price under the resolution is defined as if all dispatched generation units did not have the existing restrictions on natural gas supply. In addition, water value is not considered if its opportunity cost is higher than the cost of generating with natural gas. The resolution also set a cap on the spot price at Ar$ 120 per MWh, which was valid until the adoption of Resolution No. 95/2013 (March 2013). The real variable costs of thermal units burning liquid fuels were paid by CAMMESA through the Transitory Additional Dispatch Cost (Sobrecosto transitorio de despacho) plus a margin of Ar$ 2.5 per MWh, according to the Resolutions No. 6,866/2009 and No. 6,169/2010, that came into effect in May 2010.
The Argentine government has avoided the increase in electricity tariffs to end customers and seasonal prices have been maintained substantially fixed in Argentine pesos. In contrast, gas producers have received price revisions by the authority and thereby were able to recover part of the value that they lost as a result of the 2002 devaluation.
Under this system, CAMMESA sells energy to distributors who pay seasonal prices and buys energy from generators at spot prices that recognize rising gas prices at a contractual price defined by the instructions of the Argentine Secretary of Energy. To overcome this imbalance, the Argentine Secretary of Energy — through Resolution No. 406/2003 — only allows payments to generators for amounts collected from the purchasers in the spot market. This resolution set a priority of payment for different services, such as capacity payment, fuel cost and energy sales margin, among others. As a result, CAMMESA accumulates debt with generators while the system gives a distorted price incentive to the market that encourages electricity consumption but discourages investments to satisfy the growth in electricity demand, including investments in transmission capacity. Additionally, electricity generators experience a reduction of estimated income from contract prices because of the reduction of the spot price.
The Argentine government had intentions to gradually reverse its decision to freeze distribution tariffs. During 2011, various resolutions authorizing the elimination of electricity and natural gas subsidies were issued. However, the subsidy elimination has been applied to only 5% of customers, and has not expanded to other customers. For further details, see “— Sales to Distribution Companies and Certain Regulated Customers” below.
In order to enhance the energy supply, the Argentine Secretary of Energy created different schemes to sell “more reliable energy.” Resolution No. 1,281/2006 created the Energy Plus Service Program, which was designed to increase generation capacity in order to meet growth in electricity demand over the “Base Demand,” which was the demand for electricity in 2005.
Resolutions No. 220/2007 and No. 724/2008 gave thermal generators the opportunity to reduce some of the adverse effects of Resolution No. 406/2003 by entering into MEM Supply Commitment Contracts (“CCAM” in its Spanish acronym). Under these resolutions, a thermal generator can perform maintenance or repowering investments to improve the availability of its units and add additional capacity to the system. After authorization, the thermal generator can then sign a CCAM at prices that would permit the recovery of such capital expenditures. Additionally, energy sales through a CCAM receive payment priority compared with spot energy sales under Resolution No. 406/2003. Generators with a CCAM can supply energy to CAMMESA for up to 36 months, renewable only for an additional period of six months.
52
During 2009, Resolution No. 762/2009 created the National Hydroelectric Program to promote the construction of new hydro plants. The program enables authorized generators to enter into energy supply contracts with CAMMESA for up to 15 years at prices that would allow for the recoupment of their investment.
The Argentine government has adopted several other measures to encourage new investments, including the following: auctions to expand the capacity of natural gas transportation and electricity transmission; the implementation of certain projects for the construction of power plants; the creation of fiduciary funds to finance these expansions; and the awarding of contracts with renewable energy, called the “GENREN program.” For more details, refer to “— Environmental Regulation” below. In addition, Law 26,095/2006 created specific charges that must be paid by end customers, which are used to finance new electricity and gas infrastructure projects. The Argentine government has also enacted regulations to encourage the rational and efficient use of electricity.
Since the implementation of the Electricity Framework, the generation sector has sold the electricity it generates on the wholesale spot market and the private contract market. However, a series of resolutions have been published in recent years that have permitted the Argentine government and generators to sign contracts for the incorporation of new generation and/or maintenance of existing plants to guarantee the availability of the units, all in accordance with Resolutions No. 146/2002, No. 220/2007, No. 724/2008 and No. 200/2009.
On August 24, 2012, the Argentine government informed electricity sector companies that it would reform the Argentine MEM and end the marginalist system of the 1990s. To implement these changes, a Strategic Planning and Coordination Commission of the National Hydrocarbons Investment Plan was created. The principal change in the generation sector is the evolution of the “liberalized marginalist” model into a “Cost Plus” model in accordance with the following “Declared Principles”: (i) any income shall be applied to each company based on the sum of its equity and debt, less redundant assets, (ii) a “Reasonable Profit” would be recognized, and (iii) efficient operating costs would be recognized.
With this new regulatory model, the Argentine government has more information and control over (i) the profitability of companies, (ii) the quality of service, and (iii) the supply of fuels through CAMMESA, which is the sole supplier of fuels (through imports and a contract with YPF S.A., an Argentine company engaged in the exploration, distribution and sale of petroleum and its derivatives). Therefore, while generation companies will not pay for fuel, reducing their operating costs, they are not compensated for this expense in their prices, also reducing part of their revenues and changing the method employed to record revenues and operating costs.
The Argentine Secretary of Energy published Resolution No. 95/2013, Resolution No. 529/2014 and Resolution No. 482/2015, in 2013, 2014 and 2015, respectively, which established a new remuneration scheme for all generation companies except for biomass/biogas, hydro plants, nuclear plants and blocks of energy commercialized through energy contracts regulated by the Secretariat of Energy. The remuneration scheme is based on average costs for generation companies, in contrast with the previous marginal price system. The new scheme establishes payments for fixed and variable costs depending on the type of technology, whether it be hydro, thermal (gas turbine, steam turbine, combined cycle), internal combustion motor generators, wind, solar photovoltaic, biomass/biogas, as well as the size of the plant (small, medium or large units) separated by their technology and the type of fuel used (natural gas, fuel oil/gas oil, biofuels or coal). The generation companies received payments defined by Resolution 95/2013 from February 2013 until January 2014. From February 2014 until January 2015, generation companies received the payments according to Resolution No. 529/2014. Since February 2015, generators have received payments according to Resolution No. 482/2015, which increased the amounts in order to compensate them for inflation effects. Resolution No. 482/2015 also includes the recognition of non- recurring maintenance costs for hydro generation plants, and incorporates a new payment to finance new electric project investment.
The impact of Resolution No. 482/2015 has been favorable for generators in 2015 due to revenues received higher than those under Resolution No. 529/2014, leading to greater cash flows. However, the future effect of this regulation will depend on the remuneration values constantly being updated by the Argentine Secretary of Energy.
53
The increases in the payments to generators due to Resolution No. 482/2015, as compared to Resolution No. 529/2014 are summarized as follows:
| | • | | 28% increase in the fixed cost recognition for combined cycle gas turbines, CCGTs and hydro plants. |
| | • | | 23.5% and 23% increase in the variable cost recognition for CCGTs and hydro plants. |
| | • | | 25% and 10% increase in the additional remuneration in CCGTs hydro plants, respectively. |
| | • | | 18% increase in the non-recurring maintenance remuneration in hydro plants, which before with Resolution No 529/2014 did not receive this payment. |
| | • | | Create a 2015-2018 FONINVEMEM charge (Cargo Foninvemem 2015-2018), which is intended to finance new investment projects during 2015-2018 and an efficacy and efficiency scheme. |
Part of the additional remuneration set in Resolution No. 95/2013 adjusted by Resolution No. 529/2014 and Resolution No. 482/2015) went into a trust for the execution of works in the electricity sector. The Resolution 95/2013 states that the payment deposited to the trust is not subject to any deduction or discount, and that the Secretary of Energy will define the mechanism under which the receivables collected by CAMMESA due to Resolution No. 406/2003 will be utilized.
Generators, including our combined entities, have the option to invest in new capacity, which could be financed with accruals of the trust. Costanera and El Chocón signed an agreement to install four new 9 MW generators at Costanera. The investment of approximately US$ 43.5 million, which is financed with the accruals of El Chocón’s Additional Remuneration Trust and, if needed, with a loan from Costanera’s trust. The payment, which the new generators will receive, is defined in Resolution No. 482/2015.
FONINVEMEM
Resolution No. 712/2004 created FONINVEMEM, a fund whose purpose is to increase electricity capacity/generation within the Argentine MEM. Pursuant to Resolution No. 406/2003, the Argentine Secretary of Energy decided to pay generators for the spot prices up to the amount available in a stabilization fund, after collecting the funds from the purchasers in the spot market at seasonal prices, which were lower than spot prices for the same period. FONINVEMEM would receive the differences between spot prices and payments to sellers, according to Resolution No. 406/ 2003 from January 1, 2004 to December 31, 2006. CAMMESA was appointed to manage FONINVEMEM.
Pursuant to Resolution No. 1,193/2005, all private generators in the Argentine MEM were called upon to participate in the construction, operation and maintenance of the electricity generation plants to be built with the funds from FONINVEMEM, consisting of two combined-cycle generation plants of approximately 825 MW each.
Due to the insufficient resources to construct the plants, Resolution No. 564/2007 required all of the Argentine MEM’s private sector generators to commit to FONINVEMEM by including the differences between spot prices and payments made pursuant to Resolution No. 406/2003 for an additional period ending December 31, 2007. These plants were completed in 2010 and are powered by natural gas or alternative fuels.
The Energy Plus Program
In September 2006, the Argentine Secretary of Energy issued Resolution No. 1,281/2006 in an effort to respond to the continued increase in energy demand following Argentina’s economic recovery after the crisis. With this resolution, the Argentine government started the Energy Plus Program, which principal objectives are to (i) create incentives to construct electricity generation plants and (ii) ensure that energy available in the market is used primarily to service residential customers and industrial and commercial customers with an energy demand is at or below 300 kW as well as those who do not have access to other viable energy alternatives.
54
The resolution also established the price large customers are required to pay for excess demand that are not covered by a contract under the Energy Plus Program, which is equal to the marginal cost of operations. This marginal cost is equal to the generation cost of the last generation unit dispatched to supply the incremental demand for electricity at any given time.
Agreement to Manage and Operate Projects
On November 25, 2010, the Argentine Secretary of Energy signed an agreement with several generation companies, including our combined entities, in order to: (i) increase thermoelectric unit availability, (ii) increase energy and capacity prices and (iii) develop new generation units through the contribution of outstanding debts of CAMMESA owed to the generation companies.
This agreement seeks to accomplish the following: (i) continue the reform of the Argentine MEM; (ii) enable the incorporation of new generation to meet the increased demand for energy in the Argentine MEM (pursuant to this agreement, our combined entities, together with the SADESA Group and Duke, formed a company to develop the combined-cycle project with a capacity of approximately 800 MW at the Vuelta de Obligado thermal plant (“VOSA”); (iii) determine a mechanism to pay the generators’ sales settlements with maturity dates to be determined (“LVFVD”), which represent generators’ claims for the period from January 1, 2008 to December 31, 2011. These contributions shall be returned with the interests and converted into U.S. dollars at the date of VOSA’s completion, considering the exchange rate existing as of the date on which the agreement was signed; and (iv) determine the method for recognizing the total remuneration due to generators.
On October 24, 2012, the contract for the turnkey supply and construction of the Vuelta de Obligado plant was entered into among General Electric Internacional Inc. and General Electric Internacional Inc., Argentina branch, and the Argentine Secretary of Energy.
The project also includes the expansion of the Río Coronda 500 kV transformer station which connects to the Argentine NIS, the construction of four new fuel tanks, the construction of a gas pipeline to supply natural gas from the national network, and maintenance of the plant during the single and combined-cycle operation periods for a period of ten years.
On December 3, 2014, the Vuelta de Obligado thermal plant started to operate its open cycle, with a capacity of 540 MW. Total installed capacity is expected to reach approximately 800 MW in 2016.
On July 2, 2015, El Chocón, Costanera and Docksud entered into an agreement to manage and operate projects, increase thermal generation availability and adjust the remuneration for energy generated from a new project (an 800 MW CCGT plant) during 2015-2018. In this agreement, it was agreed that the receivables of the 2015-2018 FONINVEMEM charge and the additional trust remuneration accrued or to be accrued from February 2015 to December 2015, which have not be used for other purposes. As of the date of this information statement, the project is being studied and supplementary documentation to finalize the financing scheme is pending.
Limits and Restrictions
To preserve competition in the electricity market, participants in the electricity sector are subject to vertical and horizontal restrictions, depending on the market segment in which they operate.
Vertical Integration Restrictions
The vertical integration restrictions apply to companies that intend to participate simultaneously in different sub-sectors of the electricity market. These vertical integration restrictions were imposed by Law 24,065 (“Electricity Framework”), and apply differently to each sub-sector as described below:
Generators
| | • | | Neither a generation company nor any of its controlled or controlling companies can be an owner, majority shareholder or the controlling entity of a transmission company; and |
55
| | • | | Since a distribution company cannot own generation units, a holder of generation units cannot own distribution concessions. However, the shareholders of the electricity generator may own an entity that holds distribution units, either by themselves or through any other entity created with the purpose of owning or controlling distribution units. |
Transmitters
| | • | | Neither a transmission company nor any of its controlled or controlling companies can be an owner, majority shareholder or the controlling company of a generation company; |
| | • | | Neither a transmission company nor any of its controlled or controlling companies can be an owner, majority shareholder or the controlling company of a distribution company; and |
| | • | | Transmission companies cannot buy or sell electric energy. |
Distributors
| | • | | Neither a distribution company nor any of its controlled or controlling companies can be an owner, majority shareholder or the controlling company of a transmission company; and |
| | • | | A distribution company cannot own generation units. However, the shareholders of an electricity distributor may own generation units either by themselves or through any other entity created with the purpose of owning or controlling generation units. |
Horizontal Integration Restrictions
In addition to the vertical integration restrictions described above, distribution and transmission companies are subject to the following horizontal integration restrictions:
Transmitters
| | • | | Two or more transmission companies can merge or be part of a same economic group only if they obtain an express approval from the ENRE. Such approval is also necessary when a transmission company intends to acquire shares of another transmission company. Pursuant to the concession agreements that govern the services rendered by private companies operating transmission lines between 132 kW and 140 kW, the service is rendered by the concessionaire on an exclusive basis in certain areas indicated in the concession agreement. Pursuant to the concession agreements that govern the services rendered by the private companies operating the high-tension transmission services of at least 220 kW, such companies must render the service on an exclusive basis and are entitled to render the service throughout the entire country, without territorial limitations. |
Distributors
| | • | | Two or more distribution companies can merge or be part of a same economic group only if they obtain an express approval from the ENRE. Such approval is necessary when a distribution company intends to acquire shares of another transmission or distribution company; and |
| | • | | Pursuant to the concession agreements that govern the services rendered by private companies operating distribution networks, the service is rendered by the concessionaire on an exclusive basis in certain areas indicated in the concession agreement. |
Regulation of Generation Companies
Concessions
Hydroelectric generators with a normal generation capacity exceeding 500 kW must obtain a concession to use public water sources. Concessions may be granted for a fixed or an indefinite term.
56
Such concession-holders have the right to: (i) take control of the private properties within the concession area (subject to general laws and local regulations) that are necessary to create reservoirs as well as underground or above ground supply-line and release channels, (ii) flood lands that are necessary to raise water levels, and (iii) request the authorities to make use of the powers conferred in article 10 of Law 15,336 in cases where it is absolutely necessary to appropriate the property of a third-party that was not part of the concession and the concession-holder has failed to reach an agreement with such third-party.
Dispatch and Pricing
CAMMESA controls the coordination of dispatch operations and the administration of the Argentine MEM’s economic transactions. All generators that are Argentine MEM agents must be connected to the Argentine NIS and are obliged to comply with the dispatch order to generate and deliver energy to the Argentine NIS. The emergency regulations enacted after the Argentine crisis in 2001 had a significant impact on energy prices. Among the measures implemented pursuant to the emergency regulations were the specification of prices in the Argentine MEM and the requirement that all spot prices be calculated based on the price of natural gas, even in circumstances where alternative fuel such as diesel is purchased to meet demand due to the lack of supply of natural gas.
The introduction of Resolution No. 95/2013 suppressed the market for energy transactions among generators, large customers and traders. This resolution defines a regulated remuneration scheme for each type of technology used in power generation (see — Argentina — Industry Overview” and “— Regulatory Developments: the Industry After the Public Emergency Law”).
Seasonal Prices
The emergency regulations also made significant changes to the seasonal prices charged to distributors in the Argentine MEM, including the implementation of a cap (which varies depending on the category of customer) on the cost of electricity charged by CAMMESA to distributors at a price significantly below the spot price charged by generators. These prices have not changed since November 2008.
Pursuant to Resolution No. 1,301/2011, which announced the elimination of subsidies, the Argentine MEM’s seasonal reference prices for non-subsidized electricity were published in November 2011. This resolution also provided for the (i) discontinuation of the practice of charging subsidized prices for non-residential customers based on their payment capacity and economic activity; (ii) creation of a Register of Exceptions including a list of customers exempt from the subsidy elimination, provided that they can certify their inability to bear the seasonal reference prices for non-subsidized electricity; and (iii) the identification of the National State Subsidy, requiring CAMMESA to explicitly identify the subsidies that it provides to each level of demand. Under the resolution, distributors are also required to notify residential customers that will be affected by the elimination of subsidies.
Stabilization Fund
The stabilization fund, managed by CAMMESA, was created to absorb the difference between purchases by distributors at seasonal prices and payments to generators for energy sales at the spot price. When the spot price is lower than the seasonal price, the stabilization fund increases and when the spot price is higher than the seasonal price, the stabilization fund decreases. The outstanding balance of this fund at any given time reflects the accumulation of differences between the seasonal price and the hourly energy price in the spot market. The stabilization fund is required to maintain a minimum balance to cover payments to generators if prices in the spot market during the quarter exceed the seasonal price.
The stabilization fund has been adversely affected as a result of the modifications to the spot price and the seasonal price made by the emergency regulations, pursuant to which seasonal prices were set below spot prices
57
resulting in large deficits in the stabilization fund. These deficits have been financed by the Argentine government through loans to CAMMESA and with FONINVEMEM funds, but these continue to be insufficient to cover the differences between the spot price and the seasonal price.
Sales to Distribution Companies and Regulated Customers
In order to stabilize the prices for distribution, the market uses the seasonal price as the energy price to be paid by distributors for their purchases of electricity traded in the spot market. This is a fixed price determined every six months by the Argentine Secretary of Energy based on CAMMESA’s recommended seasonal price level for the next period according to its estimated spot price. CAMMESA estimates this price by evaluating its expected supply, demand and available capacity, as well as other factors. The seasonal price is maintained for at least 90 days. Since 2002, the Argentine Secretary of Energy has been approving seasonal prices lower than those recommended by CAMMESA.
At the end of 2011, the Argentine government issued various resolutions in order to begin a process to reduce subsidies to gas, electricity and water tariffs. These resolutions provide for, among other things, the (i) approval of the seasonal programming of regulated tariffs for the period from November 2011 to April 2012, (ii) establishment of a new non-subsidized seasonal price, which increased from Ar$ 243 per MWh to Ar$ 320 per MWh, (iii) listing of economic activities that are subject to the reduction in subsidies, (iv) creation of a register recording the exceptions to the reduction in subsidies, (v) establishment of the effective date for the new tariffs as of January 1, 2012, and (vi) provisions for voluntarily renouncing gas, electricity and water subsidies through an online system.
Specific Regulatory Charges for Electricity Companies
The authority to impose regulatory charges in Argentina is administratively divided among the federal, provincial and the municipal governments. Therefore, the tax charge varies according to where the customer lives.
Incentives and Penalties
The Energy Plus Service Program, part of the Energy Plus Program, is provided by generators that have (i) installed new generation capacity or (ii) connected previously unconnected existing generation capacity to the Argentine NIS. All “Large Customers” that had a higher demand than their Base Demand as of November 1, 2006, were required to enter into a contract with the Energy Plus Service Program to cover their excess demand. Large Customers that did not enter into such contracts are required to pay additional amounts for any consumption that exceeds the Base Demand. The prices under the contracts with Energy Plus Service Program must be approved by the relevant authorities. Unregulated customers that were unable to secure an Energy Plus Service contract are able to request CAMMESA to conduct an auction in order to satisfy their demand.
Brazil
Industry Overview
Industry Structure
Brazil’s electricity industry is organized into one large interconnected electricity system, the “Brazilian NIS,” which comprises most of the regions of Brazil, and several other small isolated systems.
58
The following chart shows the relationships among the various participants in the Brazilian NIS:
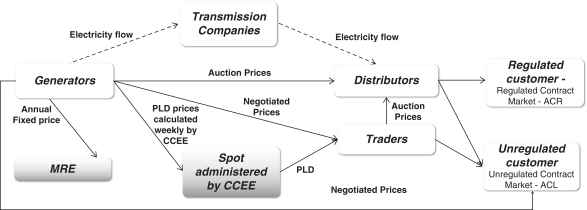
Generation, transmission, distribution and trading are legally separated activities in Brazil.
The generation sector is organized on a competitive basis, with independent generators selling their output through private contracts with distributors, traders or unregulated customers. Differences are sold on the short-term market or spot market at the Settlement Price for the Differences (“PLD” in its Portuguese acronym). There is also a special mechanism between generators that seek to re-allocate hydrological risk by offsetting differences between generators’ assured energy and that which is actually produced, called the Electricity Reallocation Mechanism (“MRE” in its Portuguese acronym).
The Brazilian constitution was amended in 1995 to authorize foreign investment in power generation. Before, all generation concessions were held directly or indirectly by Brazilians or by the Brazilian state.
The transmission sector operates under monopoly conditions. Revenues from the transmission companies are fixed by the Brazilian government. This applies to all electricity companies with transmission operations in Brazil. The transmission revenue fee is fixed and, therefore, transmission revenues do not depend on the amount of electricity transmitted.
Distribution is a public service that operates under monopoly conditions and is comprised of companies who have been granted concessions. Distributors in the Brazilian NIS are not permitted to: (i) develop activities related to the generation or transmission of electricity; (ii) sell electricity to unregulated customers, except for those in their concession area and under the same conditions and tariffs with respect to captive customers in the Regulated Market; (iii) hold, directly or indirectly, any interest in any other company, corporation or partnership; or (iv) develop activities that are unrelated to their respective concessions, except for those permitted by law or in the relevant concession agreement. Similarly, generators are not allowed to hold equity interests in excess of 10.0% in distributors.
The selling of electricity is governed by Law 10,848/2004 and Decrees No. 5,163/2004 and No. 5,177/2004 of the Electricity Trading Chamber or Clearing House (“CCEE” in its Portuguese acronym), and ANEEL Resolution No. 109/2004, which introduced the Electricity Trading Convention. This convention defines the terms, rules and procedures of the trading in the CCEE. Two possible situations were introduced by these regulations for the execution of energy sales agreements: (i) the regulated contracting environment, in which energy generation and distribution agents participate, and (ii) the free market contracting environment, in which energy generation, trading, importing and exporting agents, and unregulated customers, participate.
Commercial relations between the agents participating in the CCEE are governed mainly by energy sales agreements. All the agreements between the agents in the Brazilian NIS should be registered with the CCEE. The
59
register includes the amounts of energy and the terms. The energy prices agreed are not registered with the CCEE, but instead are specified by the parties involved in the agreements.
The CCEE records the differences between energy produced or consumed and the contracted amount. The positive or negative differences are settled in the short-term market and priced at the PLD and are determined weekly for each level of load and for each sub-market, based on the system’s marginal operating cost, within a minimum and maximum price range.
The unregulated market includes the sale of electricity between generation concessionaires, independent producers, self-producers, sellers of electricity, importers of electricity, unregulated, and special customers. It also includes contracts in place between generators and distributors until their expiration, at which point new contracts may be entered into under the terms of the new regulatory framework. According to the specifications set forth in Law 9,427/96, unregulated customers in Brazil are those who currently: (i) represent a demand of at least 3,000 kW, generated using any method and purchase the energy supply directly with generators or traders, but not directly from distributors or (ii) represent a demand in the range of 500 to 3,000 kW with NCRE and purchase their energy supply directly with alternative generators or traders, with the option to purchase energy from distributors as well.
The Brazilian NIS is coordinated by the Brazilian Electricity System Operator (“ONS” in its Portuguese acronym) and is divided into four electric sub-systems: South-East/Center-West, South, North-East, and North. In addition to the Brazilian NIS, there are also the isolated systems that are not part of the Brazilian NIS. These isolated systems are generally located in the Northern and North-Eastern regions of Brazil and rely solely on electricity generated from coal-fired and oil-fueled thermal plants. According to the ONS, over 98% of the energy required by Brazil is supplied by the Brazilian NIS and less than 2% is supplied by isolated systems.
Principal Regulatory Authorities
The Brazilian Ministry of Mines and Energy (“Brazilian MME”) regulates the electricity industry and its primary role is to establish the policies, guidelines and regulations for the sector.
The Brazilian National Energy Policy Council is in charge of developing the national electricity policy. Its principal responsibilities include advising the President in the formulation of energy policies and guidelines, promoting the stable and secure supply of the country’s energy resources, ensuring the energy supply to the most remote parts of the country, establishing directives for specific programs (such as the use of natural gas, alcohol, biomass, coal and thermonuclear energy) and establishing directives for the import and export of energy.
The Energy Research Company is an entity under the Brazilian MME. Its purpose is to conduct research and studies to support energy sector planning.
ANEEL, the Brazilian National Agency for Electric Energy, is the entity that implements the regulatory policies, and its main responsibilities include, among others: (i) supervision of the concessions for electricity sale, generation, transmission and distribution; (ii) enactment of regulations for the electricity sector; (iii) implementation and regulation of the exploitation of electricity resources, including the use of hydroelectricity; (iv) promotion of a bidding process for new concessions; (v) resolution of administrative disputes between electricity sector agents; and (vi) setting the criteria and methodology for determining distribution and transmission tariffs, as well as the approval of all the electricity tariffs, ensuring that customers pay a fair price for energy supplied and, at the same time, preserving the economic-financial balance of the distribution companies, so that they can provide the service to agreed quality and continuity.
The Energy Sector Monitoring Committee (“CMSE” in its Portuguese acronym) is an entity created under the scope of the Brazilian MME and is under the Brazilian MME’s direct coordination. CMSE was established to evaluate the continuity and security of the energy supply across the country. CMSE has the mandate to: (i) follow
60
the development of the energy generation, transmission, distribution, trading, import and export activities; (ii) assess the supply and customer service as well as the security of the system; (iii) identify difficulties and obstacles that affect the supply security and regularity; and (iv) recommend proposals for preventive actions that can help preserve the supply security and service.
CCEE is a non-profit company subject to authorization, inspection and regulation by ANEEL and its main purpose is to carry out the wholesale transactions and trading of electric power within the Brazilian NIS by registering the agreements resulting from market adjustments and whose agents are gathered into four categories: generation, distribution, trading and customers.
The ONS is comprised of generation, transmission and distribution companies, and independent customers, and is responsible for the coordination and control of the generation and transmission operations of the Brazilian NIS, subject to the ANEEL’s regulation and supervision.
The Brazilian Institute of Environment and Renewable Natural Resources (“IBAMA” in its Portuguese acronym) is an executive body of the National Environmental Policy, which acts as a federal independent organization. It is part of the Ministry of Environment, with responsibility for the implementation of the National Environmental Policy and the preservation and conservation of natural heritage, exercising control and supervision over the use of natural resources (water, flora, wildlife, soil, etc.).
IBAMA is also responsible for the environmental impact studies and the granting of environmental licenses for projects nationwide. The environmental license is a procedure by which the competent environmental agency at the federal, state or municipal levels, allows the location installation, expansion, and operation of businesses and activities that require natural resources. It also can consider the effective or potential pollution, in whatever form, and any cause of environmental degradation. This license seeks to ensure that preventive and control measures taken in the draft are compatible with sustainable development.
The Electricity Law
General
Before 1993, power tariffs were the same throughout Brazil. The dealers were entitled to a guaranteed return because the regulatory regime provided for the cost of service. Concession areas that obtained a higher return than the one guaranteed deposited the surplus in a fund from which the distributors with less than the guaranteed return withdrew the difference. In 1993, the Brazilian electric sector was reformed through Law 8,631/1993, which abolished the equalization of electricity tariffs system.
The Concessions Law 8,987 and the Power Sector Law 9,074, both enacted in 1995, intended to promote competition and attract private capital into the electricity sector. Since then, several assets owned by the Brazilian government and/or state governments have been privatized.
The Power Sector Law also introduced the concept of independent power producers, IPPS, in order to open the electricity sector to private sector investment. IPPs are single agents, or agents acting in a consortium, who receive a concession, permit or authorization from the Brazilian government to produce electricity for sale for their own account.
Law 9,648/1998 created the wholesale energy market, composed by the generation and distribution companies. Under this new law, the purchase and sale of electricity are freely negotiated.
The spot price is used to value the purchase and sale of electric power in the short term market. According to the law, the CCEE is responsible for setting electricity prices in the spot market. These prices are calculated on a marginal cost basis, modeling future operation conditions and setting a merit order curve with variable costs for thermal units and opportunity cost for hydroelectric plants, resulting in one price for each subsystem set for the week subsequent to the determination.
61
Pursuant to Law 10,433/2002, the wholesale energy market structure came to be closely regulated and monitored by ANEEL. ANEEL is also responsible for setting wholesale energy market governance rules including measures to stimulate permanent external investment.
During 2003 and 2004, the Brazilian government established the basis for a new model for the Brazilian electricity sector through Laws 10,847 and 10,848 of March 15, 2004, and Decree 5,163 of July 30, 2004. The principal objectives of these laws and decrees were to (i) guarantee the security of the electricity supply, (ii) promote the reasonability of tariffs, and (iii) improve social integration in the Brazilian electricity sector through programs designed to provide universal access to electricity.
The new model contemplates a series of measures to be followed by the agents, such as the obligation to contract all the demand of the distributors and unregulated customers. It also defines a new methodology for calculating the physical energy guarantee for sale of generation, contracting hydroelectric and thermal generating plants in proportions that ensure the best balance between guarantee and supply cost, plus the constant monitoring of the continuity and security of supply, seeking to detect occasional imbalances between supply and demand.
In terms of tariff reasonability, the model contemplates the purchase of electricity by distributors in a regulated environment through tenders carried out at the lowest tariff. As a result, the cost of acquiring electricity to be passed on to captive customers can be reduced. The new model includes electricity benefits for customers who are not yet included in this program, guaranteeing a subsidy for low income customers.
Limits and Restrictions
Regulatory Resolution No. 299/2008 repeals certain sections of ANEEL Resolution No. 278/2000, which established the limits and conditions for the participation of electricity distributors and traders. Specifically, the section of Resolution No. 278/2000 on limits to generation was repealed. Subsequently, Resolution No. 378/2009 establishes new procedures for analyzing mergers and violations of economic regulations in the electric power sector.
Regulation of Generation Companies
Concessions
The Concessions Law provides that, upon receiving a concession, IPPs, self-producers, suppliers and customers will have access to the distribution and transmission systems owned by other concessionaires, provided that they are reimbursed for their costs as determined by ANEEL.
Companies or consortia that intend to build or operate hydroelectric generation facilities with a capacity exceeding 30 MW or transmission networks in Brazil have to resort to a public tender process. Concessions granted to the holder give the right to generate, transmit or distribute electricity, as the case may be, in a given concession area for a certain period of time.
Concessions are limited to 35 years for new generation concessions and to 30 years for new transmission or distribution concessions. Existing concessions may be renewed at the Brazilian government’s discretion for a period equal to their initial term.
In September 2012, ANEEL’s Provisional Resolution No. 579/2012 established the criteria for the renewal of generation, transmission and distribution concessions that expire between 2015 and 2017. It foresees the reduction of energy tariffs and indemnities for non-depreciated investments in hydroelectric plants and
62
transmission installations. In addition, Provisional Resolution No. 577/2012 defines procedures for the temporary provision of the electricity energy service in the case of cancellation of concessions due to management problems. It also reinforces the powers of ANEEL to intervene in the case of economic-financial imbalance in order to avoid affecting the service provided.
On January 23, 2013, the Brazilian Congress approved Law 12,783, which renewed electricity concessions according to Provisional Resolution No. 579/2013. This law requires companies to reduce the average electricity tariff by 20.2% from February 2013, and to extend generation, transmission and distribution concessions for a maximum of 30 years, for both hydroelectric and thermal plants, which expire between 2015 and 2017.
Dispatch and PLD Pricing
The PLD is used to value the purchase and the sale of electric power in the short term settlement market. The price-setting process of the electric power traded in the short-term market is accomplished by using the data employed by the ONS to optimize the operation of the Brazilian NIS.
The mathematical models used to compute the PLD take into account the preponderance of hydro-electric plants within the Brazilian power generation grid. The purpose is to find an optimal equilibrium solution between the current benefit obtained from the use of the water and the future benefit resulting from its storage, measured in terms of the savings from the use of fuels for thermal plants.
The PLD is an amount computed on a weekly basis for each load level based on the Marginal Operational Cost, which in turn is limited by a maximum and minimum price in effect for each period and submarket. The intervals set for the duration of each level are determined by the ONS for each month and reported to the CCEE to be included into the accounting and settlement system.
The model used to compute the PLD seeks to achieve an optimal result for any given period and to define both the hydroelectric and thermal power generation for each submarket first considering the demand for electric power, then the hydrological conditions, the prices of fuel, the cost of the deficit, the entry of new projects into operation and the availability of equipment used for generation and transmission. As result of this process, the Marginal Operational Costs can be obtained for each load level and submarket.
The calculation of the price is based on the “ex-ante” dispatch that is determined based on estimated information existing prior to the actual operation of the system, taking into account the declared availability amounts regarding both the generation and the consumption envisaged for each submarket. The complete process for calculating the PLD involves the use of computational models to calculate the Marginal Operational Cost for each submarket on a monthly and weekly basis.
On November 25, 2014, ANEEL approved new limits for the PLD starting in 2015. The maximum limit decreased from R$ 823 per MWh to R$ 388 per MWh and the minimum increased from R$ 16 per MWh to R$ 30 per MWh. The decision was the result of extensive debate, which began with Public Consultation No. 09/2014 and later in Public Hearing No. 54/2014. The main purpose of the new limits was to reduce the financial impact of the distributor’s exposure risks to the spot market for future contracted energy, principally as a reaction to the high spot prices in 2014. Also, the new maximum price mitigates risks faced by generators, such as unrecoverable economic and financial exposure when production is under contracted values. However, the possibility of selling surplus energy decreases with higher prices. Currently, generators can plan their surplus energy in order to boost their income by producing more power in the months where higher prices are expected.
Electricity Reallocation Mechanism
The MRE provides financial protection against hydrological risks for hydro-generators by ensuring the optimal use of the hydroelectric resources of the interconnected power system.
63
The mechanism guarantees that notwithstanding the centralized dispatch, all generators that participate in the MRE will have a participation in the overall hydro generation dispatched in proportion to their assured energy. The final value of the energy allocated to a generator can be greater or less than its assured energy depending on whether the hydro generation is greater or less than the overall hydro assured energy, respectively. This mechanism permits each generator, before buying energy in the spot market to fulfill its contracts, to purchase cheaper energy at a price that covers the incremental costs of operation, the maintenance of hydroelectric plants and the financial compensation for use of water. The tariff used for trading energy in the MRE, the Optimum Energy Tariff, was set as R$ 11.25 per MWh for 2015.
As the overall generation is more stable than the individual production, the MRE is a very efficient mechanism to reduce the volatility of the individual production and the hydrological risk. Therefore, the energy contracts are only financial instruments in the Brazilian system and generation is totally disassociated from the energy contracts.
Sales between the Agents of the Market
The current model for the electric sector states that the trading of electric power is accomplished in two market environments: the Regulated Contracting Environment (“ACR” in its Portuguese acronym) and the Free-Market Contracting Environment (“ACL” in its Portuguese acronym).
Contracting in the ACR is formalized by means of regulated, bilateral agreements, called Electric Power Trading Agreements within the Regulated Environment entered into between selling agents (sellers, generators, independent producers or self-producers) and purchasing agents (distributors) who participate in electric power purchase and sale auctions.
In the ACL environment, on the other hand, the negotiation among the generating agents, trading agents, free-market customers, importers and exporters of electric power is accomplished freely, whereby the agreements for the purchase and sale of electric power are entered into through bilateral agreements.
Generation agents, regardless of whether they are public generation concessionaires, IPPs, self-producers or trading agents, are allowed to sell electric power within the two environments. This allows the overall market to remain competitive. All agreements that have been entered into in the ACR or the ACL are registered in the CCEE and they serve as a basis for the accounting posting and the settlement of the differences in the short term market.
Sales by Generation Companies to Unregulated Customers
In the unregulated contracting environment, the conditions for purchasing energy are negotiable between suppliers and their customers. As for the regulated environment, where distribution companies operate, the purchase of energy must be conducted pursuant to a bidding process coordinated by ANEEL. In 2012, the Brazilian MME’s Decree 455 mandated the creation of a price index and a requirement to register energy contracts ex-ante. The new price index was published in June 2014 and was tested internally over a six month period before being officially published in the market in December 2014.
Sales by Distribution Companies and Regulated Customers
Pursuant to market regulations, 100% of the energy demand from distributors must be satisfied through long-term contracts. Contracts must be renewed or newly entered into prior to the expiration of current contracts.
Tenders under the current regulatory environment are as follows: (i) A-5 tenders, corresponding to tenders for energy purchases from new generation sources to be supplied five years following the tender; (ii) A-3 tenders, for the acquisition of energy from new generation sources; (iii) A-1 tenders, for the acquisition of energy from
64
existing generation sources; and (iv) A-0 tenders, energy adjustment tenders, for supplementing the energy load necessary for servicing customers in the distribution concession market, with a limit of 1% of such load. Reserve tenders are also carried out for increasing the security of the system.
For 2012, two tenders were planned. An A-3 tender for December 12, 2012, was cancelled due to the low demand of distributors. An A-5 tender for new energy was held on December 14, 2012. Of the 574.3 MW of total installed capacity available for tender, 303.5 MW were allocated. The weighted average price was fixed in R$ 91.25 per MWh. Of the total energy allocated, 294.2 MW were allocated to two hydroelectric plants (at an average price of R$ 93.46 per MWh) and 281.9 MW were allocated to ten wind farms (at an average price of R$ 87.94 per MWh).
In 2013, six tenders took place: (i) an energy adjustments tender, in which no energy was allocated and the maximum price was fixed at R$ 163 per MWh; (ii) an A-0 tender in which no energy was allocated and the maximum price was fixed at R$ 177.22 per MWh; (iii) an A-1 tender in which only 39% of the distributors requirements were allocated at average price of R$ 177.22 per MWh; (iv) an A-3 tender with 332.5 MWh allocated to 39 wind farms at an average price of R$ 124.43 per MWh; (v) an A-5.1 tender in which 690.8 MWh were allocated (46% hydroelectric plants and 54% biomass thermal plants) at an average price of R$ 124.97 per MWh; and (vi) an A-5.2 tender in which 1,599.5 MWh (33% hydroelectric plants, 5% biomass thermal plants and 62% wind farms) were allocated at an average price of R$ 109.93 per MWh.
In 2014, an A-0 tender was held on April 30, which resulted in 2,046 MW at an average price of R$ 268 per MWh. An A-3 tender was held on June 6, 2014, and of the 2,744.6 MW energy bid, 418 MW were assigned to the Santo Antonio hydroelectric plant at an average price of R$ 121per MWh and 551 MW were allocated to 21 wind farms at an average price of R$ 130 per MWh.
During the nine months ended September 30, 2015, four tenders have taken place: (i) three A-3 tenders a) in April with 97 MWh allocated to wind farms (30%) and biomass thermal plants (70%) at an average price of R$ 200 per MWh; b) and two in August, in which 233 MWh were allocated to solar power plant at average price of R$ 301.8 per MWh and 314.3 per MWh were allocated (72% wind farms, 15% hydroelectric plants, 7% gas thermal plants and 6% biomass thermal plants) at an average price of R$ 189 per MWh; and (ii) A-5 tender in which 1,160 MWh (73% gas thermal plants, 20% hydroelectric plants, 7% biomass thermal plants) was allocated at an average price of R$ 259.2 per MWh.
Sales of Capacity to Other Generation Companies
Generators can sell their energy to other generators through direct negotiation at freely-agreed prices and conditions.
Incentives and Penalties
Another change imposed on the electricity sector is the separation of the bidding process for “formerly existing power” and “new power” projects. The Brazilian government believes that a “new power project” needs more favorable contractual conditions such as long term power purchase agreements (15 years for thermal and 30 years for hydro) and certain price levels for each technology in order to promote investment for the required expansion. On the other hand, “formerly existing power plants,” which include depreciated power plants, can sell their energy at lower prices under contracts with shorter terms.
Law 10,438/2002 created certain incentive programs for the use of alternative sources in the generation of electricity, known under the name of Proinfa. It assures the purchase of the electricity generated by Eletrobras for a period of 20 years and financial support from the Brazilian National Development Bank (“BNDES” in its Portuguese acronym), a state-owned development bank. Other programs include a discount of up to 50% on the
65
distribution or transmission tariffs and a special exception for the customers with electricity demand in the range of 500 to 3,000 kW who decide to migrate to an unregulated environment, provided that such customers purchase electricity from generating companies using non-conventional sources of electricity.
Selling agents are responsible for paying the buying agent if they are unable to comply with their delivery obligations. ANEEL regulations set forth the fines applicable to electricity agents based on the nature and the materiality of the violation (including warnings, fines, temporary suspension of the right to participate in bids for new concessions, licenses or authorizations and forfeiture). For each violation, fines may be imposed for up to 2% of the concessionaire’s revenues arising from the sale of electricity and services provided (net of taxes) in the 12-month period immediately preceding any assessment notice. ANEEL may also impose restrictions on the terms and conditions of agreements between related parties and, under extreme circumstances, terminate such agreements.
Decree No. 5,163/2004 establishes that the selling agents must assure 100% physical coverage for their energy and power contracts. This coverage must be made up of physical guarantees from its own power plants or through the purchase of energy or power contracts from third parties.
Among other aspects, ANEEL’s Normative Resolution No. 109/2004 specifies that when these limits are not met, the generation companies and traders are subject to financial penalties. The determination of penalties is predicated on a 12-month period and the revenues obtained from the levying of the penalties are reverted to tariff modality within the ACR.
If the limits on contracting and physical coverage defined in the Trading Rules are not met, the relevant generation companies and traders are notified by the Superintendent of CCEE. Pursuant to the specific Trading Procedure, CCEE’s agents are allowed to file an appeal to be evaluated by CCEE’s Board of Directors who then decides whether to collect or to cancel the financial penalty.
Generation agents may sell power through contracts signed within the ACR or the ACL. Public Service Generators and IPPs must provide a physical coverage from their own power generation for 100% of their sales contracts. Self-producers generate energy for their own exclusive use and they may sell excess power through contracts with ANEEL’s authorization. In both cases, the verification of physical coverage is accomplished on a monthly basis, predicated on generation data and on sales contracts for the last 12 months. Generation agents must pay penalties if they fail to provide physical coverage.
Colombia
Industry Overview
Industry Structure
The Wholesale Electricity Market in Colombia (“Colombian MEM” in its Spanish acronym) is based on a competitive market model and operates under open access principles. The Colombian government participates in this market through an institutional structure that is responsible for setting forth policies and regulations, as well as for exercising supervision and control powers in respect of market participants. The Colombian MEM relies for its effective operation on a central agency, XM, which is in charge of the market central dispatch through the National Dispatch Center (“CND” in its Spanish acronym) and the management of the commercial exchange system through the Commercial Exchange System Authority.
The Colombian NIS includes generation plants, the interconnection grid, regional transmission lines, distribution lines and end-customers.
There are two categories of agents, generators and traders, who are allowed to buy and sell electricity as well as related products in the Colombian MEM. All of the electricity supply offered by generation companies connected to the Colombian NIS and all of the electricity requirements of end-customers, whose demand is represented by trading companies, are traded on the Colombian MEM.
66
The following chart shows the relationships among the various participants in the Colombian MEM:
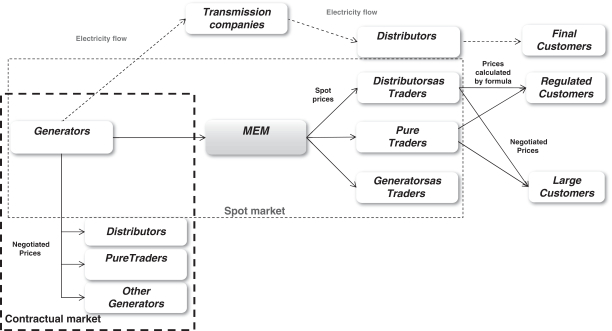
Generation activity consists of the production of electricity through hydroelectric, thermoelectric and all other generation plants connected to the Colombian NIS. The generation sector is organized on a competitive basis, with independent generators selling their output on the spot market or through private contracts with large customers, other generators and traders. Generation companies are required to participate in the Colombian MEM with all of their generation plants or units connected to the Colombian NIS with generation capacities of at least 20 MW. Generation companies declare their energy availability and the price at which they are willing to sell it. This electricity is centrally dispatched by the CND.
Trading consists of intermediation between the market participants that provide electricity generation, transmission and distribution services and the customers of these services, whether or not that activity is carried out together with other electricity-sector activities.
Electricity transactions in the Colombian MEM are carried out under the three following modes:
| | 1. | Energy spot market: short term daily market |
| | 2. | Bilateral contracts: long term market; and |
“Firm Energy” refers to the maximum electric energy that a generation plant is able to deliver on a continual basis during a year, in poor hydrological conditions. The generator who acquires a Firm Energy Commitment (“OEF” in its Spanish acronym) will receive a fixed remuneration during the commitment period, which is explained in the “Incentives and Penalties” section below.
Transmission operates under monopoly conditions with a guaranteed annual fixed income that is determined by the new replacement value of the networks and equipment, and by the resulting value of bidding processes from the awarding of new projects for the expansion of the National Transmission System. This value is allocated among the traders of the National Transmission System in proportion to their energy demand.
67
Distribution is defined as the operation of local networks below 220 kV. Any customer may have access to a distribution network for which the customer pays a connection charge.
There is one interconnected system, the Colombian NIS, and several isolated regional and smaller systems that provide electricity to specific areas. According to the Colombian Mining and Energy Planning Agency, 96.8% of the Colombian population in 2014 received electricity through the public network.
Principal Regulatory Authorities
The Colombian Ministry of Mines and Energy is responsible for the policy-making of the electricity sector, which aims for a better use of the mining and energy resources available in Colombia, and in turn contributes to the country’s social and economic development.
The Colombian Mining and Energy Planning Agency is responsible for planning the expansion of the generation and transmission networks.
The Colombian National Council for Economic and Social Policy (“CONPES” in its Spanish acronym) is the highest national planning authority and works as an advisory entity to the government in all aspects related to Colombia’s economic and social development. It coordinates and directs the entities responsible for economic and social direction, through the study and approval of documents related to policy development.
The Colombian National Planning Department performs the functions of Executive Secretariat of the CONPES and therefore is responsible for coordinating and presenting the documents for discussion at meetings.
The Energy and Gas Regulatory Commission (“CREG” in its Spanish acronym) implements the principles of the industry set out by the Colombian Electricity Act. This commission is constituted by eight experts named by the Colombian President, the Colombian Ministry of Mines and Energy, the Colombian Ministry of Public Credit and the director of the Colombian National Planning Department or their delegates. Such principles are: efficiency (the correct allocation and use of resources and the supply of electricity at minimum cost); quality (compliance with technical requirements); continuity (continuous electricity supply without unjustified interruptions); adaptability (the incorporation of modern technology and administrative systems to promote quality and efficiency); neutrality (impartial treatment of all electricity customers); solidarity (the provision of funds by high-income customers to subsidize the subsistence consumption of low-income customers); and fairness (an adequate and nondiscriminatory supply of electricity to all regions and sectors of the country).
CREG is empowered to issue regulations that govern technical and commercial operations and to set charges for regulated activities. CREG’s main functions are to establish conditions for gradual deregulation of the electricity sector toward an open and competitive market, approve charges for transmission and distribution networks and for regulated customers, establish the methodology for calculating maximum tariffs for supplying the regulated market, regulations for planning and coordination of operations of the Colombian NIS, technical requirements for quality, reliability and security of supply, and protection of customers’ rights.
The National Operations Council is responsible for establishing technical standards to facilitate the efficient integration and operation of the Colombian NIS. It is a consultative entity composed of the CND’s Director and generation, transmission and distribution company representatives.
The Commercialization Advisory Committee is an advisory entity which assists CREG with the commercial aspects of the Colombian MEM.
68
The Colombian Superintendence of Industry and Commerce advises the national government and participates in the formulation of policies to promote competition and protect consumers, and industrial property, among others. It also investigates, corrects and sanctions restrictive commercial competition practices, such as antitrust behavior, and oversees mergers of companies operating in the same industries in order to prevent excessive concentration or monopolies in certain industries.
The Colombian Superintendence of Domestic Public Services is responsible for the oversight of all public utility services companies. The Superintendence monitors the efficiency of all utility companies and the quality of services. The Superintendence can also assume control over utility companies when the availability of utility services or the viability of such companies is at risk. Other duties include (i) enforcing regulations, imposing penalties and generally overseeing the financial and administrative performance of public utility companies, (ii) providing accounting norms and rules for public service companies, and (iii) in general, organizing information networks and databases pertaining to public utilities.
The Colombian Ministry of Environment and Sustainable Development is responsible for the management of the environment and renewable natural resources. It is also responsible for guiding and regulating environmental planning as well as developing policies and regulations. The Colombian Ministry of Environment and Sustainable Development’s goal is to recover, conserve, protect, and promote sustainable use of renewable natural resources, the environment of the nation, and to ensure sustainable development, without prejudice to the functions assigned to other sectors.
The Colombian Ministry of Environment and Sustainable Development, together with the Colombian President, aims to develop national environmental and renewable natural resource policies in order to ensure the right of Colombians to a healthy environment in which natural heritage and national sovereignty are protected.
The Electricity Law
General
In 1994, the Colombian Congress passed significant reforms affecting the public utilities industry. These reforms, contained in Law 142, known as the Public Utility Services Law, and Law 143, were the result of constitutional amendments made in 1991. These laws form the basic legal framework that currently governs the electricity sector in Colombia. The most significant reforms included the opening of the electricity industry to private sector participation, the functional segregation of the electricity sector into four distinct activities (generation, transmission, distribution and trading), the creation of an open and competitive wholesale electricity market, the regulation of transmission and distribution activities as regulated monopolies and the adoption of universal access principles applicable to transmission and distribution networks.
The Colombian Electricity Act regulates electricity generation, trading, transmission, and distribution (collectively, the “Activities”). Under the law, any company existing before 1994, domestic or foreign, may undertake any of the Activities. Companies established subsequent to such date can engage exclusively in only one of such Activities. Trading, however, can be combined with either generation or distribution.
In 2014, the Colombian government published Renewable Energy Law 1715/2014, which promotes the development of renewable energy and energy efficiency projects. The law proposes tax reductions for projects involved with renewable energies. Also, it establishes the development of a national fund that promotes research on related topics and defines the methodology for large and small scale self generation.
Limits and Restrictions
The market share for generators and traders is limited. The limit for generators is 25% of the Colombian system’s Firm Energy. The principal market share metric used by CREG to regulate the generation market is the percentage of Firm Energy that a market participant holds.
69
Additionally, if an electricity generation company’s share of Colombia’s total Firm Energy ranges from 25% to 30% and the market’s Herfindahl Hirschman Index, a measure of market concentration, is at least 1,800, such company becomes subject to monitoring by the Colombian Superintendence of Domestic Public Services. If an electricity generation company’s share of Colombia’s total Firm Energy exceeds 30%, such company may be required to sell its share exceeding the 25% threshold.
Similarly, a trader may not account for more than 25% of the trading activity in the Colombian NIS. Limitations for traders take into account international energy sales. Market share is calculated on a monthly basis according to the trader’s commercial demand and traders have up to six months to reduce their market share when the limit is exceeded.
Such limits are applied to economic groups, including companies that are controlled by, or under common control with, other companies. In addition, generators may not own more than a 25% interest in a distributor, and vice versa. However, this limitation only applies to individual companies and does not preclude cross-ownership by companies within the same corporate group.
A distribution company can hold over 25% of an integrated company’s equity if the market share of the latter company accounts for less than 2% of the national generation business. A company created before the enactment of Law 143 is prohibited from merging with another company created after Law 143 came into effect.
A generator, distributor, trader or an integrated company (i.e., a firm combining generation, transmission and distribution activities) cannot own more than 15% of the equity in a transmission company if the latter represents more than 2% of the national transmission business in terms of revenues.
Regulation of Generation Companies
Concessions
The Colombian electricity sector was structurally reformed by Laws 142 and 143 of 1994. Under this new legal structure, economic activities related to the provision of the electricity service are governed by the constitutional principles of free market economic activity, free market private initiative, freedom to enter and leave, corporate freedom, free market competition and private property, with regulation and inspection, surveillance and control by the state.
According to Law 143, these constitutional principles of freedom are the general rule in the electricity sector business, while the concession is the exception. Different economic, public, private or mixed agents may participate in the sector’s activities, which agents shall enjoy the freedom to develop their functions in a context of free market competition. In order to operate or start up projects, they must obtain from the competent authorities the necessary environmental, sanitation and water-right permits as well as other municipal permits and licenses. All economic agents may construct generation plants and their respective connection lines to the interconnection and transmission networks.
The Colombian government cannot legally participate in the execution and exploitation of generation projects. As a general rule, such projects are to be carried out by the private sector. The Colombian government is only authorized to enter into concession agreements on its own behalf relating to generation when there is no entity prepared to assume these activities on comparable conditions.
Dispatch and Pricing
The purchase and sale of electricity can take place between generators, distributors acting in their capacity as traders, traders (who do not generate or distribute electricity) and unregulated customers. There are no restrictions for new entrants into the market as long as the participants comply with the applicable laws and regulations.
70
The Colombian MEM facilitates the sale of surplus energy that has not been committed under contracts. In the wholesale market, an hourly spot price for all dispatched units is established based on the offer price of the highest priced energy dispatched unit for that period. The CND receives price bids each day from all the generators participating in the Colombian MEM. These bids indicate prices and the hourly available capacity for the following day. Based on this information, the CND, guided by an “optimal dispatch” principle (which assumes an infinite transmission capacity through the network), ranks the dispatch optimized during the 24-hour period, taking into consideration initial operating conditions, and determining which generators will be dispatched the following day in order to satisfy expected demand. The price for all generators is set as the most expensive generator dispatched in each hourly period under the optimal dispatch. This price-ranking system is intended to ensure that national demand, increased by the total amount of energy exported to other countries, will be satisfied at the lowest cost combination of available generating units in the country.
Additionally, the CND plans for the dispatch, which takes into consideration the limitations of the network, as well as other conditions necessary to satisfy the energy demand expected for the following day in a safe, reliable and cost-efficient manner. The cost differences between the “planned dispatch” and the “optimal dispatch” are called “restriction costs”. The net value of such restriction costs is assigned proportionally to all the traders within the Colombian NIS, according to their energy demand, and these costs are passed through to the end customers. Some generators have initiated legal proceedings against the government arguing that recognized prices do not fully cover the costs associated with these restrictions because current regulations do not take into account all the costs of safe, reliable generation. However, CREG believes that Resolution No. 036/2010 modified the remuneration of hydro plants by assigning the opportunity cost to the spot price, which compensated for these costs.
During 2012 and 2013, the “Statute for situations of scarcity in the MEM as part of the operative regulations” was under evaluation. In 2014, CREG published Resolution No. 026/2014 which enacted the Statute, which defines the rules of operation under critical supply conditions.
Sales by Generation Companies to Unregulated Customers
In the unregulated market, generation companies and unregulated customers sign contracts in which terms and prices are freely agreed. Typically, these agreements establish that the customer pays for the energy that it consumes each month without a minimum or maximum. The prices are fixed in Colombian pesos indexed monthly to the Colombian PPI. According to resolution CREG 131 of 1998, to be considered “unregulated”, customers are required to have an average monthly power demand for six months of at least 0.1 MW, or a minimum of 55 MWh in monthly average energy demand over the prior six months.
Sales by Distribution Companies to Regulated Customers
The regulated market is served by traders and by distributors acting as traders, who bill all service costs, according to prices regulated by CREG. The scheme allows distributors to pass through the average purchase price of all the market transactions that affect the regulated market into the customer’s tariff, thereby mitigating spot price volatility and providing an efficiency signal to the market. Additionally, CREG established a formula for the total cost of service, which transfers transmission, distribution, marketing costs, and physical losses costs to the regulated market.
Sales by Generation Companies to Traders for the Regulated Market
Traders in the regulated market are required to buy energy through procedures that ensure free market competition. For evaluating the bids, the buyer takes into account price factors as well as other technical conditions and commercial objectives to be defined before the contracting process. These agreements can be signed with different terms, such as for amounts contracted, demanded with or without a limit, or actually consumed, etc. Prices are denominated in Colombian pesos indexed monthly to the Colombian CPI.
71
Sales to Other Generation Companies
Generators can sell their energy to other generators through freely negotiated prices and conditions.
Regulatory Charges
Contribution by generation per Law 99 of 1993: Generation companies are obliged to pay monthly payments based on their generation to the regional autonomous corporations for environmental protection in areas where the plants are located and to the municipalities where the generation plants are situated. For more information, see “— Environmental Regulation” below.
Generation contribution to the Financial Support Fund for Energy for Unconnected Zones: Law 633 of 2000 (tax reform) states that generators must make a contribution of 1 Colombian peso to the Financial Support Fund for Energy for Unconnected Zones for every kilowatt dispatched on the Wholesale Energy Exchange. Initially, this requirement was effective until December 31, 2007 but first it was extended to 2014 by Law 2,099/2006 and then extended again to 2021 by Law 1,715/2014 in May 2014 and by Decree 142/2015 of January 2015.
Incentives and Penalties
Generators connected to the Colombian NIS can also receive “reliability payments” which are a result of the OEF that they provide to the system. The OEF is a commitment on the part of generation companies backed by its physical resource capable of producing firm energy during scarcity periods. A generator that acquires an OEF will receive fixed compensation during the commitment period, whether or not the fulfillment of its obligation is required. To receive reliability payments, generators have to participate in firm energy bids by declaring and certifying such firm energy. The firm energy supply for reliability purposes required until November 2012, the transition period, was assigned proportionally to the declared firm energy of each generator. Beyond the transition period, only the additional firm energy required by the system is allocated by bids. During 2014, CREG adjusted requirements for thermal plants with the ability to utilize multiple fuels in order to allow them to use natural gas instead of petroleum-based liquid fuels. Projects under construction with delayed start dates are now able to exchange the terms of their OEF, under specific conditions, with geothermal power plants in order to include renewable energy (wind since 2011 and biomass since 2013).
During 2011, CREG published resolutions for the assignment of OEF for the periods from December 2014 to November 2015 and from December 2015 to November 2016. For the first of these periods, the OEF was assigned proportionally to the existing generators while, for the second period, it carried out an auction to supply the additional OEF on December 27, 2011. Since then it has not been necessary to carry out any auction to supply additional future firm energy requirements.
During 2013, Resolution No. 062/2013 created incentives for thermal plants to back up their OEF with imported natural gas to guarantee their OEF for ten years beginning December 2015. The new resolution proposes the foundations of the remuneration for the group of thermal plants in order to develop the first regasification terminal in Colombia.
On March 10, 2014, CREG published Resolution No. 022/ 2014, which defined a transitory regulated revenue in order to motivate the system participants to build a LNG terminal. During 2014, the participants were beginning to contract trading and import agents; however, due to the delay in the construction phase, CREG has allowed thermal generators to comply with their OEF using alternative fuels.
The tender for firm energy for the period from November 2015 to December 2016 was made on December 27, 2011. Seven companies participated with a total of eight projects of which five were assigned at a price of US$ 15.7 per MWh. The new projects are Río Ambeima (hydro, 45 MW), Carlos Lleras Restrepo
72
(hydro, 78 MW), San Miguel (hydro, 42 MW), Gecelca 32 (thermal, 250 MW) and Tasajero 2 (thermal, 160 MW). The new assignments were made for a period of twenty years beginning on December 1, 2015.
In addition, on January 26, 2012, the auction was concluded for projects with long construction periods (“GPPS” in its Spanish acronym) which assigned OEFs for a period of twenty years to three hydroelectric projects and one thermal project. Two of these were assigned to new plants: Termonorte which will have a capacity of 88 MW by 2017 and the Porvenir II hydroelectric power plant which will have a capacity of 352 MW by 2018. The other two involved increases in OEF for plants already under construction and had available firm energy following the auction process conducted in 2008 (Sogamoso and Pescadero-Ituango hydroelectric plants). The process ended with assignment prices below the maximum defined for the auction in December (US$ 15.70 per MWh), and were in connection with Termonorte (US$ 14.90 per MWh); Porvenir II (US$ 11.70 per MWh); Sogamoso and Pescadero-Ituango (US$ 15.70 per MWh).
CREG regulated the reconfiguration auction scheme, under the methodology of reliability charge that allowed agents to change the beginning of the OEF by renouncing the “reliability payments” and paying a premium. XM published the results of the auction sale reconfiguration of OEF and Termocol, Amoya and Gecelca were the participating companies.
During 2012, CREG also issued the statement regarding OEF allocation for the period from December 2016 to November 2017. CREG indicated that (i) a auction for OEF allocation was not necessary due to the conditions of the system and (ii) the assignment schedule will be published once there is greater certainty regarding the execution dates Colombia-Panama interconnection agreement and the processes for importing natural gas. Despite the statement, a tender was finalized in July 2012 for the reconfiguration of the OEF for the period from December 2012 to November 2013. The OEF was allocated to Termocol, which owns the Poliobras project (4.5 GWh per day) and to Amoyá, which owns the Isagen project (0.5 GWh per day). Such tenders are called when previously allocated OEFs exceed the projected demand for a certain period. The tender ended with a price margin of US$ 0.60 per MWh, which is greater than the reliability load price of December 2012 to November 2013. Projects such as Ambeima and Porvenir II have lost their OEF.
In 2014, CREG published the Circular 088/2014, indicating that no auction is needed for the period from December 2016 to November 2020.
In 2015, CREG presented the methodology to calculate firm energy for wind plants. The new resolution allows projects without wind measurements for 10 years, to use proxy data in order to calculate the power-wind curve. The results of the approximation must be certified by the National Operations Council.
Also in 2015, CREG published the new reliability charge methodology for small plants. According to Res. 138/2015, the reliability charge clearing scheme for small plants will be centralized, as it is for large plants, and small plants must present a firm energy commitment for the reliability charge in order to have OEF assignations. CREG is allowing smalls plants to keep participating on the current remuneration mechanism if the differences between real and programmed generation are below +/- 5%. For the first year, the gap will be +/- 10%.
Electricity Exports and Imports
Decision CAN 536 of 2002, CAN 720 of 2009, and CAN 757 of 2011, signed by the countries that participate in the Andean Nations Community, Colombia, Ecuador, Bolivia and Peru, established the general framework for the interconnection of electrical systems that created a coordinated economic dispatch for the countries involved in the interconnections. Under this framework, the interconnection system between Colombia and Ecuador was inaugurated in March 2003. The two countries adopted a transitional regime pursuant to CAN 757, while adopting common standards in order to make such international transactions viable.
In addition to the interconnection with Ecuador, Colombia is also interconnected with Venezuela by three links, the most important being the Cuestecitas-Cuatricentenario line. During 2011 and 2012, there were energy
73
transfers made from Colombia to Venezuela, through this line, under an agreement between the Presidents of both nations. The agreement allows for estimated transactions of 30 GWh per month, with a demand of 70 MW in periods of low and medium load and of 140 MW in periods of high load. The contract was signed on February 1, 2013 for a period of eleven months and was formalized by a contract between Isagen (Colombia) and Corpoelec (Venezuela).
There is also an energy interconnection project with Venezuela being carried out by the Institute of Planning and Promotion of Energy Solutions for Non-Interconnected Zones pursuant to an agreement between Colombia and Venezuela. Under the terms of this agreement, Colombia will sell electricity to Venezuela at a rate that is much cheaper than the costs to produce it. Venezuela will pay for the electricity with fuel rather than cash. This interconnection project is estimated to cost US$ 8 billion and includes the construction of a 35.6 kilometer transmission line with a capacity of 34,500 volts in order to supply electricity to the region of San Fernando de Atabapo, Venezuela.
In the first half of 2012, CREG and the National Public Services Authority of Panama issued resolutions that provided for enhancing the process for tendering of rights to construct the future interconnection line between Colombia and Panama.
The resolutions also supplement pre-existing resolutions by providing for provisions that allow Panamanian distribution companies to participate in future tenders in Colombia. The most important resolutions issued by Colombia are (i) CREG 002/2012, which attempts to resolve the discrepancies between firm capacity in Panama and the OEF in Colombia; (ii) CREG 004/2012, which outlines the exchanges in conditions of rationing; and (iii) CREG 057/2012, which is an operative agreement between the operators of the systems of Colombia and Panama. Panama has also issued parallel resolutions that enable Colombian companies to participate in tenders in Panama as international interconnection agents.
Emgesa, Isagen, Celsia and its combined entity EPSA participated in the tender process to obtain line capacity rights in Panama that took place on August 21, 2012. These companies were able to participate in the tender by forming combined entities in Panama and complying with all requirements under Panamanian law, including the provisions related to guarantees.
In June 2012, Interconexión Eléctrica Colombia-Panamá (“ICP”), which is jointly owned by Interconexión Eléctrica de Colombia and the state-owned Empresa de Transmisión Eléctrica de Panamá , was entrusted with the construction of an interconnection project and was allowed to join the tender for capacity rights. ICP submitted the base amount that is necessary to participate in the tender and proceeded to obtain prequalifications in July and August 2012. However, the tender process was suspended indefinitely on August 19, 2012. This was primarily due to financial reasons as the Panamanian government, citing budget constraints, refused to provide a firm commitment to contribute capital.
ICP is expected to continue to seek financial support in order to ensure the viability of the project and reduce uncertainties for the participants. With the support from the Interamerican Development Bank, ICP has hired a consultant to carry out a study that will explore alternatives plans that would result in more competitive energy prices and greater business opportunities. The Colombian government is also in conversations with its Panamanian counterpart in order to restart the process.
In November 2012, the Declaration of Santiago was signed by Chile, Colombia, Ecuador, Peru and Bolivia. The main purpose of this declaration was to facilitate regional electricity transactions by harmonizing regulatory frameworks of the member countries in order to connect the electricity networks of the signatory countries in the Pacific area.
74
Gas Market
Natural gas is important for the Colombian electricity sector, as natural gas is a key fuel for generation. The Colombian natural gas market operates under near monopolistic conditions and consists of a primary market, secondary market and short-term market. Supply contracts depend on a balance between supply and demand for the next five years, which is calculated by the regulatory authority every year. If demand exceeds supply, auctions take place, if the opposite happens, bilateral negotiations are carried out. Transportation contracts are traded under bilateral negotiation schemes or through auctions.
This regulatory framework is the result of a former proposal that sought to reform the wholesale market for natural gas and ensure that it operates under the principles of transparency and liquidity. This new framework also outlines entities that are eligible to participate in each market, the types of permitted transactions, and the kind of contracts that may be entered into. It even seeks to create standardized force majeure provisions for such contracts in order to clarify the responsibilities of the parties. The new rules took effect in August 2013.
During 2014, CREG defined the rules for choosing the Market Manager, invited participants for the subsequent selection as natural gas Market Manager, and regulated the creation of trust instruments in their care. In 2015, the gas Market Manager was chosen and started operations. Its main responsibilities are the validation and monitoring of participant registration, the primary and secondary market supply and transport contract registration, and the implementation of long term and short term auctions. During the second half of 2014, and in accordance with the new regulatory framework, work continued on the second phase of marketing natural gas, which describes short and long term gas bilateral supply negotiations and aftermarket supply negotiations as well as transportation.
The third trading process of natural gas took place between September 2015 and November 2015 and this third trading process considered bilateral negotiations given that the supply exceed the demand.
As a result of the implementation of the indexes in Annex IV of CREG Resolution No. 089 of 2013, prices of signed, long-term gas contracts were adjusted in November 2013, yielding an increase of around 25% for gas supply contracts in Guajira. CREG requested that agents resume the discussion to achieve a consensus among all participants in the natural gas chain to introduce tariffs for supply contracts and final rate regulated market.
During 2015, CREG presented the final scheme for supply contract indexation. It considers two methodologies, bilateral negotiation and regulated formula application.
Also, advancements were made in defining the methodology to be used for calculating the discount rate, based on the WACC to be applied in natural gas transmission and distribution, fuel gas and LPG transport via pipelines, transmission and distribution of electricity in the national grid, and the generation and distribution of electricity in areas that are not connected to the Colombian NIS.
75
Peru
Industry Overview
Industry Structure
In the Peruvian Wholesale Electricity Market (“Peruvian MEM” in its Spanish acronym) there are four categories of local agents: generators, transmitters, distributors and large customers. The following chart shows the relationships among the various participants in the SEIN.
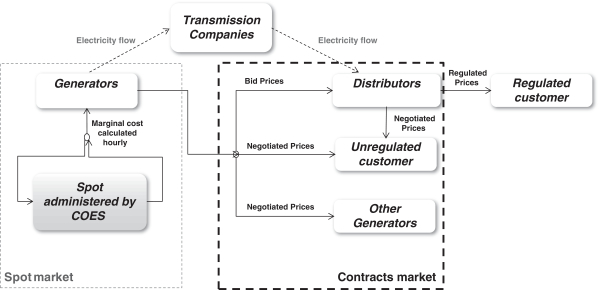
The generation segment is composed of companies that own generation plants. This segment is noted for being a competitive market in which prices tend to reflect the marginal cost of production. Electricity generators, as energy producers, have capacity and energy sale commitments with their contracted customers. Generators may sell their capacity and energy to both distributors and unregulated customers.
The energy received by a generator’s customers does not necessarily coincide with the energy produced by that supplier since the generation plants’ production is allocated by the COES, through a centralized dispatch. The transfer cost is minimized by reviewing the variable production costs of each power plant, regardless of their contractual commitments. The only exception to this rule is the natural gas plants, which declare the natural gas price once a year for dispatch purposes. Therefore, there is a short-term market also managed by the COES, where an economic balance is made between the energy produced and the consumption required by the generators’ customers.
The generation plants’ production and the customers’ energy consumption at the hourly marginal cost are valued, and the deficit generators pay for the energy purchased from surplus generators. The balance made in connection with energy sales is also carried out with respect to capacity, in which case the price of the capacity corresponds to a price regulated by the Osinergmin.
In 2008, due to gas transport and electricity transmission problems, Osinergmin defined a new rule to calculate spot prices. Decree No. 049/2008 established two models, one which represented a theoretical dispatch without considering any restrictions and another that considered real dispatch with restrictions. The spot price is obtained from the theoretical dispatch (known as “ideal marginal cost”), and the additional operating costs resulting from system restrictions are paid through demand from the affected generators through a mechanism established by the authority. The “ideal marginal cost” regime was extended until December 31, 2016.
76
The settlements made by the COES also include payments and/or collections for supplementary services such as frequency and tension regulation. They also consider compensation for operating cost overruns, such as the operation at minimum load, random operational tests, etc.
Regulation DS 027-2011-EM of June 2011 established that as of January 2014, several participants may also act as buyers in the short-term market, in addition to the generators. These other participants include distributors (in order to meet the demand of their unregulated customers), large customers with demand over 10 MW, and a group of unregulated customers whose aggregate demand exceeds 10 MW. This regulation is now suspended until the wholesale market prices return to previous levels (anticipated to occur after 2017).
The transmission system is made up of transmission lines, substations and equipment for the transmission of electricity from the production points (generators) to the consumption centers or distribution points. Transmission in Peru is defined as all lines or substations with a tension higher than 60 kV. Some generation and distribution companies also operate sub-transmission systems at the transmission level.
Electricity distribution is an activity carried out in the concession areas granted to different distribution companies. Customers with a capacity demand lower than 200 kW are considered regulated customers, and their energy supply is considered to be a public service. Customers whose capacity demand is within the range of 200-2,500 kW are free to choose whether to be considered regulated or unregulated customers. Once this type of customer chooses an option, the customer must remain in that category for at least three years. If the customer wants to change its category from regulated to unregulated customer, or vice versa, at least one year advance notice must be provided.
There is only one interconnected system, the SEIN, and several isolated regional and smaller systems that provide electricity to specific areas. According to the National Institute of Statistics of Peru as of December 31, 2014, 92.9% of the population obtained electricity through the public network.
Principal Regulatory Authorities
The Peruvian Ministry of Energy and Mining (“MINEM” in its Spanish acronym) defines energy policies applicable nationwide, regulates environmental matters applicable to the energy sector and oversees the granting, supervision, maturity and termination of licenses, authorizations and concessions for generation, transmission, and distribution activities. On August 10, 2012, Regulation DS 030-2012-EM amended the articles of organization and defined the activities of MINEM and the Natural Gas Management Department.
The Agency for the Promotion of Private Investment is a public entity responsible for attracting private investment in public utilities and infrastructure works. It also advises to investors in making their investment decisions.
Osinergmin, is an autonomous public regulatory entity that controls and enforces compliance with legal and technical regulations related to electrical and hydrocarbon activities, controls and enforces compliance with the obligations stated in the concession contracts, and is responsible for the preservation of the environment in connection with the development of these activities. Osinergmin’s Tariff Regulatory Bureau has the authority to publish the regulated tariffs. It also controls and supervises the bidding processes required by distribution companies to purchase energy from generators.
The COES coordinates the SEIN’s short, medium and long-term operations at minimum cost, maintaining the security of the system and optimizing energy resources. It also plans for the SEIN’s transmission development and manages the short-term market.
The National Institute for Defense of Competition and Intellectual Property is responsible for promoting competition, protecting customer rights and safeguarding all forms of intellectual property.
77
The General Electricity Authority is the regulatory technical entity responsible for evaluating the electricity sector, and proposes the necessary regulations for the development of the electricity generation, transmission and distribution activities.
The Peruvian Ministry of Environment defines environmental policies applicable nationwide and is the head of the national environmental management system, which includes the National Environmental Impact Assessment System, the National Environmental Information System, the Protected Natural Areas System, as well as the management of natural resources in its area of competence, biodiversity and climate change, among others.
The Electricity Law
General
The general legal framework applicable to the Peruvian electricity industry includes: the Law of Electricity Concessions (Decree Law 25,844/1992) and its ancillary regulations, the Law to Secure the Efficient Development of Electricity Generation (Law 28,832/2006), the Technical Regulation on the Quality of the Electricity Supply (Supreme Decree 020/1997), the Electricity Import and Export Regulation (Supreme Decree 049/2005), the Antitrust Law for the Electricity Sector (Law 26,876/1997), the law that regulates the activity of Osinergmin (Law 26,734/1996, together with Law 27,699/2002) ), and Decree Law 1,221/2015 that improves electricity distribution regulation to promote the electricity access in Peru.
Some of the characteristics of the regulatory framework are (i) the separation of the three main activities: generation, transmission and distribution; (ii) freely-determined prices for the supply of energy in competitive market conditions; (iii) a system of regulated prices based on the principle of efficiency together with a bidding regime; and (iv) private operation of the interconnected electricity systems subject to the principles of efficiency and quality of service.
Law 29,852/2012 and Regulation 021-2012-EM created the Hydrocarbons Energy Security System and the Fund of Social Energy Inclusion. These laws also created a system of social compensation and universal service for the most vulnerable sectors of the population which will be financed by surcharges on the electricity billing of unregulated customers (equivalent to the surcharge that exists today for regulated customers on the Electrical Social Compensation Fund), transport surcharges for hydrocarbon-derivate liquids and natural gas multi-pipelines and surcharges on the use of the natural gas pipeline.
Osinergmin and distribution companies manage the Fund of Social Energy Inclusion, which directs funds to (i) the mass usage of natural gas to vulnerable sectors, (ii) develop new energy sources like photovoltaic cells, solar panels, etc., and (iii) supply liquefied petroleum gas to vulnerable sectors.
Law 29,969/2012 provides for the mass usage of natural gas. State electricity distributors are authorized to carry out natural-gas programs, including the distribution of natural gas in their concession area. They are also able to associate with companies specializing in the development of gas distribution projects. Within a maximum period of three years from the start of the gas distribution, MINEM will start the process of promoting private investment by granting gas distribution concessions through the pipeline network.
Law 29,970/2012 guarantees energy security and promotes the development of the petro-chemical complex in the south of the country. Under this law, the following agendas have been declared as a matter of national interest: (i) the guarantee of energy security, (ii) the transport of ethane to southern Peru; and (iii) the construction of regional pipelines in Huancavelica, Junín, and Ayacucho and their connection to existing gas pipelines.
78
Law 1,221/2015 enacted on September 24, 2015, will modify the current legal framework in 2016 once implemented. The main modifications are:
| | • | | In the distribution tariffs, the VAD and the IRR calculations will be defined for each distribution company with over 50 thousands customers. |
| | • | | The MINEM will define a responsibility technical area (“ZRT” in its Spanish acronym) for each distributor, given its operation areas. The investments in the ZRT, which can be carried out either by a distributor or a third party, should be approved by the distributor. Investment and audited costs (with a cap) will be recognized through the VAD. |
| | • | | The VAD will include a technology innovation charge and/or a distribution energy efficiency component. The VAD will also be adjusted to encourage improvements of service quality. |
| | • | | Distributors will be obligated to guarantee their regulated demand for 24 months. |
| | • | | Distributors will be required to execute the urban electrification investments or repay the contribution, if the investment is carried out for a third party, when the rate of occupancy is over 40%. |
| | • | | Generation and transmission concessions originating in bidding processes are restricted to a 30-year term. In the case of hydraulic generation concessions, a favorable report for the watershed, as issued by MINEM, will be required. |
| | • | | Set conditions to the NCRE sources and co-generation that enable them to inject surplus energy to the distribution system without affecting operating security. |
Limits and Restrictions
Since the enactment of the Law of Electricity Concessions, vertical integration is restricted, and activities in the generation, transmission and distribution segments must be developed by different companies. The Antitrust Law for the Electricity Sector regulates the cases in which vertical and horizontal integration is admissible.
An antitrust authorization is compulsory for those electricity companies that hold more than 5% of another business segment, either before or as a result of a merger or integration. An authorization is also required for the horizontal integration of generation, transmission and distribution activities which result in a market share of 15% or higher of any business segment, either before or as a result of any operation.
Such authorizations are granted by the Institute for Defense of the Consumer and Intellectual Property, using the market share information provided by Osinergmin.
Regulation of Generation Companies
Concessions
Generation companies that own or operate a power plant with an installed capacity greater than 500 kW require a concession granted by the MINEM. A concession for electricity generation activity is a unilateral permit granted to the generator by the MINEM. Authorizations are granted by the MINEM for an unlimited period of time, although their termination is subject to the same considerations and requirements as the termination of concessions under the procedures set forth in the Law of Electricity Concessions, and its related regulations.
In order to receive a concession, the applicant must first request for a temporary concession of two years, and must subsequently apply for a definitive concession. In order to receive an authorization, the applicant must file a petition before the MINEM. If the petition is admitted and no opposition is presented, the MINEM grants the authorization to develop generation activities for unlimited time, subject to compliance with applicable regulations.
79
Dispatch and Pricing
The coordination of electricity dispatch operations, the setting of spot prices and the control and management of economic transactions that take place in the SEIN are controlled by COES. Generators can sell energy directly to large customers and buy the deficit or transfer the surplus between contracted energy and actual production in the pool at the spot price. Resolution No. 080-2012-OS/CD (2012) established the criteria and methodology for deciding the real-time operation under exceptional conditions as declared by the MINEM.
Sales by Generation Companies to Unregulated Customers
Sales to unregulated customers are carried out at mutually agreed prices and conditions, which include tolls and compensation for the use of transmission systems and, if necessary, to distribution companies for the use of their network.
Sales to Distribution Companies and Certain Regulated Customers
Sales to distributors can be under bilateral contracts at a price no greater than the regulated price in the case of regulated customers, or at an agreed price in the case of unregulated customers. In addition to the bilateral method allowed under the Law of Electricity Concessions, Law 28,832 has also established the possibility that distributors may meet their unregulated or regulated customers’ demand under contracts signed following a capacity and energy supply tender process.
Sales of Capacity to Other Generation Companies
COES determines a firm capacity for each power plant on an annual basis. Firm capacity is the highest capacity that a generator may supply to the system at certain peak hours, taking into consideration statistical information and accounting for time out of service for maintenance purpose and for extremely dry conditions in the case of hydroelectric plants.
A generation company may be required to purchase or sell capacity in the spot market, depending upon its contractual requirements in relation to the amount of electricity to be dispatched from such company and to its firm capacity.
Regulatory Charges
In addition to taxes applicable to all industries (mainly an income tax and a value added tax), the electricity industry operators are subject to a special regulation contribution that compensates the costs incurred by the state in connection with the regulation, supervision and monitoring of the electricity industry. The applicable rate for this contribution is up to 1% of the annual billing of each company and the funds levied are distributed proportionally to the MINEM and Osinergmin.
Generators that also have hydroelectric plants pay a water royalty as a function of the hydroelectric energy produced and the regulated energy tariff at peak hours.
Tenders Promoted by the State
During 2009, MINEM carried out several studies which concluded that there will be lack of power generation capacity in the system in the near future. MINEM recommended the construction of new power plants that would serve as backup in order to guarantee the flow of electricity to the system and avoid blackouts. As a result, PROINVERSIÓN carried out a public bid in August 2010, seeking to secure investments for three projects located in Talara, Trujillo and Ilo that would add another 800 MW to the system. The bid resulted in two of the projects being awarded: Talara (200 MW, for EEPSA, an Enersis subsidiary) and Ilo (400 MW, for Enersur, an unrelated company). These plants receive regular payments for being permanently available to operate and provide energy to the SEIN whenever the COES calls on them and will also be reimbursed for the fuel costs incurred for generating electricity. The Trujillo generation facility was later replaced by the Eten generation facility and awarded to Planta de Reserva Fría de Generación de Eten S.A. (200 MW) (the “Cold Reserve Project”).
80
An international tender was held in 2012 for the concession for the Cold Reserve Project for the Pucallpa (Ucayali) and Puerto Maldonado (Madre de Dios) plants, which were awarded to Consorcio Energía Perú S.A. The construction period of the plants will be 30 months from the signing of the contracts, and the concession covers a period of 20 years plus the construction period. The Pucallpa thermal plant will require an investment of approximately US$ 31.5 million and will have a capacity between 35 and 40 MW, covering 80% of the energy demand. The Puerto Maldonado thermal plant will require an investment of approximately US$ 18.5 million, and will have a capacity between 15 MW and 18 MW, covering 100% of the energy demand.
On March 21, 2013, PROINVERSIÓN held an international public tender to promote private investments in the Hydroelectric Plants project (CH Molloco — 280 MW), which is located in the hills of the Arequipa region. It was awarded to the Corsan Corviam — Engevix — Enex partnership.
Services provided by generation, transmission, and distribution companies must comply with technical standards stated in the Technical Regulations on the Quality of the Electric Supply. Failure to do so might result in the imposition of fines by Osinergmin.
Generators receive a capacity payment whose main component is the annuity of a peak-load plant. However, to be eligible to receive this payment, plants have to be part of the reserve margin established annually by Osinergmin. The capacity ranking is constructed in base of firm power of every power plant connected to the system and their relative efficiency (ordered by variable costs). Only plants included in the ranking as required to cover the peak demand plus the reserve margin receive the capacity payment. Every year, Osinergmin sets the power price that shall be assigned and paid to each generator pursuant to this concept.
Electricity Exports and Imports
A 220 kV transmission line has been implemented for the interconnection with Ecuador. However, the line has not operated continuously because of regulatory issues. During June and August 2011, Peru imported energy bu 5.7 GWh from Ecuador due to the lack of generation in northern Peru and transmission problems in the SEIN in that zone. In 2012, Peru imported a net of 2.8 GWh of electricity from Ecuador due to the maintenance of the Talara Zorritos line (4.0 GWh in February 2012) and the TGN4 Malacas power plant (1 GWh in March-April 2012). In 2014, electricity exports to Ecuador totaled 12.7 GWh. During the nine months ended September 30, 2015, the electricity exports net amounted to 14.1 GWh.
Internal regulations were also approved for the application of CAN Decision 757, which establishes that when bilateral electricity transactions are carried out with other CAN countries, the Economic Operation Committee of the SEIN should send weekly reports to the MINEM and to Osinergmin demonstrating that priority has been given to supplying the domestic market (Supreme Decree 011-2012-EM).
The governments of Peru and Chile have established a bilateral working group to discuss energy matters. The purpose of the working group is to identify and take advantage of the potential synergies between the two countries. The first few meetings of this group took place in 2011. At the request of the presidents of both nations, the working group is expected to propose a framework for an agreement in connection with both countries’ electricity integration that would establish the general rules for energy exchanges between them. As of the date of this information statement, both countries have conducted negotiations but a final agreement is still pending.
Raw Materials
For information regarding our raw materials, please see “Item 11. Quantitative and Qualitative Disclosures About Market Risk — Commodity Price Risk.”
81
| C. | Organizational Structure. |
In this “Organizational Structure” section, references to (i) “we”, “us” and “our” are to the Non-Chilean Business of Endesa Chile prior to the Spin-Off, and to Endesa Américas after the Spin-Off and (ii) to Enersis are to Enersis S.A. prior to the spin-off of Enersis Chile by Enersis, and to Enersis Américas after such spin-off.
Principal Combined Entities and Affiliates
We are part of an electricity group controlled by the Italian company, Enel, our ultimate parent company. After giving effect to the Spin-Off, Enersis Américas, our controlling shareholder, will own 60.0% of our shares, and Enel will beneficially own 60.6% of Enersis Américas through wholly-owned Spanish combined entities. Enel publicly trades on the Milan Stock Exchange. It is headquartered in Italy and is primarily engaged in the energy sector, with a presence in 30 countries across five continents, mainly in Europe and Latin America, and generating electricity from power plants with over 89 GW of net installed capacity. Enel provides service to more than 61 million customers through its electricity and gas businesses through distribution networks of 1.9 million kilometers.
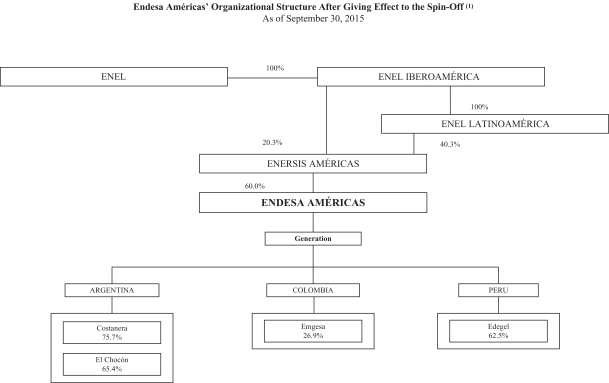
| (1) | Only principal operating combined entities are presented here. The percentage listed for each of our combined entities represents Endesa Américas’ post-Spin-Off economic interest in such combined entity. |
82
The companies listed in the following table were combined by us as of September 30, 2015. Our economic interest is calculated by multiplying our post-Spin-Off percentage of economic interest in a directly held combined entity by the percentage economic interest of any entity in the chain of ownership of such ultimate combined entity.
| | | | | | | | | | | | |
Principal Companies and Country
of Operations | | % Economic
Ownership of Main
Combined entity
by
Endesa Américas | | | Combined Assets
of Each Main
Combined entity on
a
Stand-alone Basis | | | Operating Income of
Each Main
Combined
entity on a
Stand-alone Basis | |
| Electricity Generation | | (in %) | | | (in billions of Ch$) | |
El Chocón (Argentina) | | | 65.4 | | | | 197.5 | | | | 17.7 | |
Costanera (Argentina) | | | 75.7 | | | | 197.5 | | | | 13.9 | |
Emgesa (Colombia)(1) | | | 26.9 | | | | 2,030.2 | | | | 299.4 | |
Edegel (Peru)(2) | | | 62.5 | | | | 848.1 | | | | 87.6 | |
| (1) | We hold 56.4% of Emgesa’s voting rights as a result of a transfer of voting rights from Enersis and we are allowed to appoint the majority of the Board members pursuant to a shareholders’ agreement. We therefore control Emgesa. For more information on our control and combination of Emgesa, see “Item 5. Operating and Financial Review and Prospects — A. Operating Results. — 1. Discussion of Main Factors Affecting Operating Results and Financial Condition of the Company.” |
| (2) | Excludes Chinango S.A.C. |
Costanera (Argentina)
Costanera is a publicly-held Argentine electricity generation company, with 2,324 MW of total installed capacity in Buenos Aires. Costanera consists of six steam turbines with an aggregate capacity of 1,138 MW which burn oil and gas, and two natural gas combined-cycle facilities with a total capacity of 1,186 MW. Costanera was acquired from the Argentine government after the privatization of Servicios Eléctricos del Gran Buenos Aires S.A. We beneficially own 75.7% of Costanera.
El Chocón (Argentina)
El Chocón is an Argentine electricity generation company. It has two hydroelectric power stations with an aggregate installed capacity of 1,328 MW located between Neuquén and Río Negro provinces, in the Comahue Basin in southern Argentina. A 30-year concession, which expires in 2023, was granted by the Argentine government to our combined entity, Hidroinvest S.A., which bought 59.0% of El Chocón’s shares in July 1993 during the privatization process. We operate El Chocón for a fee pursuant to an operating agreement with a term equal to the duration of the concession. We beneficially own 65.4% of El Chocón.
Emgesa (Colombia)
Emgesa has a total installed generating capacity of 3,059 MW, of which 85% is from hydroelectric power plants and 15% is from thermoelectric power plants. Empresa de Energía de Bogotá S.A. directly holds a 51.5% equity interest in Emgesa. We hold 56.4% of Emgesa’s voting rights as a result of a transfer of voting rights from Enersis and we are allowed to appoint the majority of the Board members pursuant to a shareholders’ agreement. We therefore control Emgesa. For more information on our control of Emgesa, see “Item 1. Discussion of Main Factors Affecting Operating Results and Financial Condition of the Company.”
Edegel (Peru)
Edegel, an electricity generation company, was acquired by us in 1995. It consists of seven hydroelectric plants and two thermal plants, with a combined installed capacity of 1,680 MW. In October 2009, we purchased an additional 29.4% stake in Edegel from Generalima, S.A.C., a combined entity of Enersis. As a result of this transaction, we increased our ownership interest in Edegel from 33.1% to 62.5%.
Edegel holds 80% of the shares of Chinango S.A.C. and Peruana de Energía S.A.A. (an unaffiliated entity) owns the remaining 20% of the shares.
83
Selected Related and Jointly-Controlled Companies
Cemsa (Argentina)
Cemsa’s principal activities are the trading of electricity, fuel and oil. Cemsa has signed several agreements with the Argentine electricity power stations in order to support its supply contracts. The power stations that provide Cemsa’s electricity supply contracts are: Costanera, Dock Sud, Centrales Térmicas del Noroeste S.A., and El Chocón. We beneficially own 45% of Cemsa.
Enel Brasil (Brazil)
In 2005, Enel Brasil was formed in order to manage all of our Brazilian generation, transmission and distribution assets. Enel Brasil consolidates two generation companies (Cachoeira Dourada and Fortaleza, both operated by us), CIEN, a transmission company, as well as two distribution companies (Ampla and Coelce). Fortaleza is a 322 MW combined-cycle power plant of fueled by natural gas with a capacity to generate one-third of the electricity requirements of the State of Ceará, with a population of 8.2 million people. Cachoeira Dourada is a run-of–the-river hydroelectric plant using the flows from the Paranaiba River, located in the State of Goias, and consisting of ten generating units totaling 665 MW of installed capacity. CIEN is a transmission and trading Brazilian company wholly-owned by Enel Brasil. It transmits electricity through two transmission lines located between Argentina and Brazil, covering a distance of 500 kilometers, with a total interconnection capacity of 2,100 MW. Ampla is the second largest electricity distribution company in the State of Rio de Janeiro, Brazil, in terms of customers and annual energy sales. Ampla is mainly engaged in the distribution of electricity to 66 municipalities located in the State of Rio de Janeiro, and serves 2.9 million customers in a concession area of 32,615 square kilometers. Coelce is the sole electricity distributor of the State of Ceará, located in northeastern Brazil, and serves over 3.6 million customers within a concession area of 148,825 square kilometers. We beneficially own 37.1% of Enel Brasil and record this unconsolidated investment under the equity method.
For additional information on all of our combined entities and jointly-controlled companies, please refer to Appendix 1 of our combined financial statements.
| D. | Property, Plant and Equipment. |
In this “Property, Plant and Equipment” section, references (i) to “we,” “us” and “our” are to the Non-Chilean Business of Endesa Chile prior to the Spin-Off, and to Endesa Américas after the Spin-Off.
Our property, plant and equipment are concentrated on electricity generation assets in the four countries in which we have investments.
We combine revenues from wholly-owned generation companies in Argentina, Brazil, Colombia and Peru, which in turn own 26 additional generation power plants. A substantial portion of our cash flow and net income is derived from the sale of electricity produced by our electricity generation facilities. Significant damage to one or more of our main electricity generation facilities or interruption in the production of electricity, whether as a result of an earthquake, flood, volcanic activity or any other such cause, could have a material adverse effect on our operations. Our electricity generation facilities are insured against damage due to earthquakes, fires, floods, other acts of god (but not for prolonged droughts, which are not force majeure risks, and are not covered by insurance ) and from damage due to third-party actions, based on the appraised value of the facilities as determined from time to time by an independent appraiser. Based on geological, hydrological and engineering studies, management believes that the risk of an event with a material adverse effect is remote. Claims under our generating combined entities’ insurance policies are subject to customary deductibles and other conditions. We also maintain business interruption insurance providing coverage for the failure of any of our facilities for a period of up to 24 months, including the deductible period.
The insurance coverage taken for our property is approved by each company’s management, taking into account the quality of the insurance companies and the needs, conditions and risk evaluations of each generating facility, and is based on general corporate guidelines.
84
All insurance policies are purchased from reputable international insurers. We continuously monitor and meet with the insurance companies in order to obtain what we believe is the most commercially reasonable insurance coverage.
The following table identifies the power plants that we own and combine, at the end of each period indicated, by country, and their basic characteristics:
| | | | | | | | | | | | | | | | | | | | |
| | | | | | | Installed Capacity | |
| | | | | | | September 30, | | | December 31, | |
Country/Company | | Power Plant Name | | Power Plant Type(1) | | 2015 | | | 2014 | | | 2014 | | | 2013 | |
| | | | | | | (in MW) | |
Argentina | | | | | | | | | | | | | | | | | | | | |
Costanera(2) | | Costanera Steam Turbine | | Steam Turbine/Natural Gas+ Fuel Oil | | | 1,131 | | | | 1,131 | | | | 1,131 | | | | 1,131 | |
| | Costanera Combined Cycle II | | Combined Cycle/Natural Gas+Diesel Oil | | | 851 | | | | 851 | | | | 851 | | | | 851 | |
| | Buenos Aires Combined Cycle I | | Combined Cycle/Natural Gas | | | 322 | | | | 322 | | | | 322 | | | | 322 | |
| | | | | | | | | | | | | | | | | | | | |
Total | | | | | | | 2,304 | | | | 2,304 | | | | 2,304 | | | | 2,304 | |
El Chocón | | Chocón | | Reservoir | | | 1,200 | | | | 1,200 | | | | 1,200 | | | | 1,200 | |
| | Arroyito | | Pass-through | | | 128 | | | | 128 | | | | 128 | | | | 128 | |
| | | | | | | | | | | | | | | | | | | | |
Total | | | | | | | 1,328 | | | | 1,328 | | | | 1,328 | | | | 1,328 | |
| | | | | | | | | | | | | | | | | | | | |
Total capacity in Argentina | | | | | | | 3,632 | | | | 3,632 | | | | 3,632 | | | | 3,632 | |
| | | | | | | | | | | | | | | | | | | | |
Colombia | | | | | | | | | | | | | | | | | | | | |
Emgesa | | Guavio | | Reservoir | | | 1,213 | | | | 1,213 | | | | 1,213 | | | | 1,213 | |
| | Paraíso | | Reservoir | | | 276 | | | | 276 | | | | 276 | | | | 276 | |
| | La Guaca | | Pass-through | | | 325 | | | | 325 | | | | 325 | | | | 325 | |
| | Termozipa | | Steam Turbine/Coal | | | 236 | | | | 236 | | | | 236 | | | | 236 | |
| | Cartagena | | Steam Turbine/ Natural Gas | | | 208 | | | | 208 | | | | 208 | | | | 208 | |
| | Minor plants(3) | | Pass-through | | | 57 | | | | 57 | | | | 57 | | | | 77 | |
| | Betania | | Reservoir | | | 541 | | | | 541 | | | | 541 | | | | 541 | |
| | Dario Valencia(4) | | Pass-through | | | 150 | | | | 150 | | | | 150 | | | | 50 | |
| | Salto II(5) | | Pass-through | | | 35 | | | | 35 | | | | 35 | | | | — | |
| | Laguneta(6) | | Pass-through | | | 18 | | | | — | | | | 18 | | | | — | |
| | | | | | | | | | | | | | | | | | | | |
Total capacity in Colombia | | | | | | | 3,059 | | | | 3,041 | | | | 3,059 | | | | 2,926 | |
| | | | | | | | | | | | | | | | | | | | |
Peru | | | | | | | | | | | | | | | | | | | | |
Edegel | | Huinco(7) | | Pass-through | | | 268 | | | | 247 | | | | 247 | | | | 247 | |
| | Matucana(7) | | Pass-through | | | 137 | | | | 137 | | | | 137 | | | | 133 | |
| | Callahuanca(7) | | Pass-through | | | 84 | | | | 80 | | | | 80 | | | | 80 | |
| | Moyopampa(7) | | Pass-through | | | 69 | | | | 66 | | | | 66 | | | | 66 | |
| | Huampani | | Pass-through | | | 30 | | | | 30 | | | | 30 | | | | 30 | |
| | Santa Rosa(7)(8) | | Gas Turbine/Diesel Oil | | | 413 | | | | 288 | | | | 413 | | | | 305 | |
| | Ventanilla(7) | | Combined Cycle/Natural Gas | | | 484 | | | | 485 | | | | 485 | | | | 485 | |
| | | | | | | | | | | | | | | | | | | | |
Total | | | | | | | 1,485 | | | | 1,333 | | | | 1,458 | | | | 1,346 | |
Chinango | | Yanango | | Pass-through | | | 43 | | | | 43 | | | | 43 | | | | 43 | |
| | Chimay(7) | | Pass-through | | | 152 | | | | 151 | | | | 151 | | | | 151 | |
| | | | | | | | | | | | | | | | | | | | |
Total | | | | | | | 195 | | | | 194 | | | | 194 | | | | 194 | |
| | | | | | | | | | | | | | | | | | | | |
Total capacity in Peru | | | | | | | 1,680 | | | | 1,528 | | | | 1,652 | | | | 1,540 | |
| | | | | | | | | | | | | | | | | | | | |
Combined capacity | | | | | | | 8,371 | | | | 8,200 | | | | 8,343 | | | | 8,098 | |
| | | | | | | | | | | | | | | | | | | | |
| (1) | “Reservoir” and “pass-through” refer to hydroelectric plants that use the force of a dam or a river, respectively, to move the turbines which generate electricity. “Steam” refers to thermal power plants fueled with natural gas, coal, diesel or fuel oil to produce steam that moves the turbines. “Gas Turbine” (“GT”) or “Open Cycle” refer to thermal power that uses either diesel or natural gas to produce gas that moves the turbines. “Combined-Cycle” refers to a thermal power plant fueled with natural gas, diesel oil, or fuel oil to generate gas that first moves a turbine and then recovers the gas from that process to generate steam to move a second turbine. |
| (2) | Values for the years 2012 through 2014 were updated according to CAMMESA’s report (Argentina TSO). |
| (3) | Minor plants have an aggregate capacity of 57 MW. As of September 30, 2015, Emgesa owned and operated two minor plants: Charquito (19 MW), and Tequendama (19.5 MW). In March 2014, the San Antonio (19.5 MW) plant was decommissioned. In October 2013, the La Tinta (19.5 MW) and La Junca (19.5 MW) plants were decommissioned. |
| (4) | In November 2013, the Dario Valencia power plant began commercial operations with 50 MW of installed capacity. During 2014, unit 1 (January) and unit 5 (April) also began commercial operations adding 100 MW of capacity. This power plant is part of the Salaco Hydroelectric project together with the El Limonar, El Salto II and Laguneta power plants. |
| (5) | In June 2014, the El Salto II (35 MW) power plant began commercial operations. |
| (6) | In December 2014, the Laguneta (18 MW) power plant began commercial operations. |
| (7) | Changes in the installed capacity are the result of tests made by COES. |
| (8) | In October 2013, GT unit No. 7 (121 MW) of the Santa Rosa power plant was decommissioned and in December 2014 it began commercial operations again. During 2014, GT No. 5 (January) and GT No. 8 (December) decreased Santa Rosa’s installed capacity by 13 MW. |
85
As of September 30, 2015, we received the ISO 14,001 certification for all our installed capacity in the three countries (Argentina, Colombia and Peru) in which we combine operations, which included all our generation facilities in accordance with this standard.
Project Investments
The total investment for each project described below was translated into Chilean pesos at the exchange rate of Ch$ 698.72 per U.S. dollar, the U.S. dollar Observed Exchange Rate as of September 30, 2015. Budgeted amounts include connecting lines that could eventually be owned by third parties and paid as tolls, unless otherwise indicated.
Investment Projects Completed during 2015
El Quimbo Hydroelectric Project (Colombia)
The El Quimbo hydroelectric project is located in the province of Huila, southeast of Bogotá, on the Magdalena River, upstream of the Betania power plant. The project has two generation units and a total installed capacity of 400 MW. The estimated average generation is 2,216 GWh per year, with a flooded reservoir area of 8,250 hectares.
On October 6, 2015, the Colombian government enacted the Decree No. 1979/2015, which authorizes energy generation for El Quimbo starting from October 7, 2015. On November 11, 2015, we successfully completed the required tests in order for the power plant to begin its commercial operations, reaching a power of 378 MW with the aggregate of Unit 1 and 2. On November 16, 2015, El Quimbo began its commercial operations. On December 15, 2015, the Colombian Constitutional Court declared Decree No. 1979/2015 unconstitutional on the grounds that the precautionary measure issued by the Administrative Tribunal of Huila was still in force and the reasons given to authorize the commissioning of El Quimbo were incorrect. Emgesa therefore suspended operations of El Quimbo as of midnight on December 16, 2015. El Quimbo use all available legal means within its power in order to reverse the precautionary measure and on January 10, 2016 at midnight, El Quimbo began again its commercial operations.
This project was financed primarily with external sources, through local and international bonds. The estimated total investment is Ch$ 674,201 million, of which Ch$ 662,818 million was accrued as of September 30, 2015.
Projects Under Development
We continuously analyze different growth opportunities in the countries in which we operate. During 2015, our project portfolio has been modified to permit flexibility in the investment decision. The focus is to have a portfolio with projects that are sustainable from a technical, environmental, social and economic perspective. Expected dates of commissioning of each of the projects are constantly reviewed and are defined based on commercial opportunities and on our financial capacity to undertake these projects. The most important projects under development are as follows:
Generation Business
Curibamba Hydroelectric Project (Peru)
Curibamba consists of a 188 MW run-of-the-river power plant and a 134 km transmission line that will connect it to SEIN at the Pachachaca substation (220 kV). This power plant will be located 385 km northeast of Lima, which is upstream from the Chimay hydroelectric power plant (province of Junín), and will use the waters of the Comas and Uchubamba Rivers through an 8.1 km penstock.
During 2015, we continued with the bidding process for the project’s main contracts (civil works, equipment supply and electrical interconnection) and we started the studies required for obtaining prior permits to the project construction.
86
Currently, the project has a definite generation concession for the power plant, an approved Environmental Impact Study, and compliance certificates stating the non-existence of archaeological remains, both for the power plant and the transmission line.
In January 2015, the Peruvian Ministry of Energy and Mining approved the 2015—2024 Binding Transmission Plan. The connection of the power plant is being reviewed as the 2015—2024 Binding Transmission Plan allows the project to be connected to a closer substation. During 2015, the Pre-Operation Study for the connection to the Yanango Substation, located at only 40 km from the project, was approved as well as the extension of the validity of the environmental impact study of the power plant.
We anticipate our participation in hydroelectric bids that the Peruvian government expects to hold in the future and are currently pending of tender date. The construction is expected to start in 2016 and last until 2021 as per the timeline in the definitive concession schedule. The construction is expected to last until 2021. This project is being financed primarily with internally generated funds, with an estimated total investment of Ch$ 419,232 million, of which Ch$ 17,258 million has been accrued as of September 30, 2015.
Major Encumbrances
Costanera’s supplier debt with Mitsubishi Corporation (“MC”) corresponds to the remaining payments on equipment purchased from MC in November 1996, which was refinanced in October 2014. The value of the assets pledged to secure this debt was Ch$ 15.2 billion as of September 30, 2015. Additionally, Costanera has granted liens in favor of Credit Suisse in guarantee of a loan, which were valued at Ch$ 4.4 billion as of September 30, 2015.
Climate Change
In recent years, the countries in which we operate have seen an increase of developments related to NCRE and strategies to combat climate change. This has required both the public and private sectors to adopt strategies in order to comply with the new environmental requirements, as evidenced by legal obligations at the local level, commitments assumed by countries at the international level, and the demanding requirements of the international markets.
NCREs provide energy with minimal environmental impact and without CO2 emissions. They are therefore considered technological options that strengthen sustainable energy development as they supplement the production of traditional generators.
The Callahuanca hydroelectric power station (80.2 MW in operation since 1938) is the NCRE facility that we own, and which has contributed clean and renewable energy to its national grid. Regarding the development of CO2 emission reduction mechanisms, the projects in the Clean Development Mechanism (“CDM”) circuit were as follows:
Ventanilla Conversion from Single-Cycle to Combined-Cycle Power Generation Project: On June 20, 2011, the UNFCCC approved the registration of this project in Peru as a CDM for 7 years, which term is subject to renewal, which recognizes that it may verify and trade the greenhouse gas emissions that it will be avoided during it useful life.
On October 31, 2013, the Ventanilla Conversion from Single-Cycle to Combined-Cycle Power Generation Project obtained the registration/verification under the Voluntary Emission Reductions (“VER”) + standard. A total amount of 2,496,494 tons of CO2 were avoided during the period of October 19, 2006 through June 19, 2011. As a result, Edegel received credit for 2,496,494 tons of CO2 emissions in the form of pre-CDM VERs. Additionally, in June 2014, 7,314 tons of CO2of VERs were negotiated at a value of €0.5 per tons of CO2as part of the voluntary neutralization policy of the group.
87
The Rehabilitation of the Callahuanca Hydroelectric Power Station Project: On January 4, 2008, the UNFCCC approved the registration of this project in Peru as a CDM for 7 years, which term is subject to renewal, which recognizes that it may verify and trade the greenhouse gas emissions that it will be avoided during it useful life.
On July 7, 2008 the Rehabilitation of the Callahuanca Hydroelectric Power Station Project obtained the registration/verification under the VER + standard. A total amount of 19,951 tons of CO2 were avoided during 2007. As a result, Edegel received credit for 19,949 tons of CO2 emissions in the form of pre-CDM VERs.
Detail of CDM Projects Processed in the nine months ended September 30, 2015
| | | | | | | | |
CDM project | | Company/country | | Position as of September 30, 2015 | | Emission factor
(tons
CO2e/MWh) | | Approximate
emissions avoided
(tons CO2e/
year)(1) |
Ventanilla Conversion from Single-Cycle to Combined-Cycle Power Generation Project | | Edegel (Peru) | | Registered with the Executive Authority of the UNFCCC since 2011. CDM procedure implemented. | | 0.454 | | 407,296 |
| | | | |
Ventanilla Conversion from Single-Cycle to Combined-Cycle Power Generation Project | | Edegel (Peru) | | Registered with the VER + Standard (Voluntary Standard) since October 2013. | | 0.454 | | 407,296 |
| | | | |
Rehabilitation of the Callahuanca hydroelectric power station | | Edegel (Peru) | | Registered with the Executive Authority of the UNFCCC since 2008. CDM procedure implemented. | | 0.449 | | 18,189 |
| | | | |
Rehabilitation of the Callahuanca hydroelectric power station | | Edegel (Peru) | | Registered with the VER + Standard (Voluntary Standard) since July 2008. | | 0.449 | | 18,189 |
| (1) | Obtained from the PDD (Project Design Document) of each project. |
It is expected that our climate change guidelines will be similar to the current group climate change guidelines as part of our commitment to combat climate change.
In compliance with the group climate change guidelines, Edegel has secured the certification of its carbon footprint for a fourth time. The Spanish Association of Standards and Certification (Asociación Española de Normalización y Certificación or “AENOR”), an independent certification authority, acknowledged the validity of the methodology. Acknowledgement by AENOR includes verification of the group’s carbon footprint reports from 2009 to 2014. A carbon footprint is the sum of all greenhouse gases (“GHGs”) produced by a company in the course of its business activity. The first step involves measuring our carbon footprint.
The tools used to calculate emissions in Edegel include audits at its facilities. This enables to monitor carbon footprint in all different installations associated to the generation of electrical energy. Calculating the carbon footprint also enables Edegel to identify phases of its activities with the greatest potential to reduce emissions.
As part of the process of calculating our carbon footprint, we plan to obtain a GHG inventory, including direct emissions associated with activities controlled by us. We also plan to obtain a GHG inventory of indirect emissions, which are not generated through sources we control but are consequences of our activities.
88
Item 4A. Unresolved Staff Comments
None.
Item 5. Operating and Financial Review and Prospects
General
The following discussion should be read in conjunction with our combined financial statements and the notes thereto, included in this information statement, and “Selected Financial Data,” included in Item 3 herein. Our audited combined financial statements as of September 30, 2015 and for the nine months then ended have been prepared in accordance with IAS 34, Interim Financial Reporting, as issued by the IASB. Our audited combined financial statements as of December 31, 2014 and 2013 and January 1, 2013, and for the years ended December 31, 2014 and 2013, have been prepared in accordance with IFRS, as issued by the IASB.
| 1. | Discussion of Main Factors Affecting Operating Results and Financial Condition |
We own and operate electricity generation companies in Argentina, Colombia and Peru. We also have an equity investment in Enel Brasil, which owns generation companies in Brazil that we operate as well as companies in the transmission and distribution businesses. Our revenues and cash flow primarily come from our electricity generation business as well as from our combined entities and associates, which operate in these four countries.
Factors such as (i) hydrological conditions, (ii) fuel prices, (iii) regulatory developments, (iv) exceptional actions adopted by governmental authorities and (v) changes to the economic conditions in countries in which we operate may materially affect our financial results. In addition, our results from operations and financial condition are affected by variations in the exchange rates between the Chilean peso and the currencies of the four countries in which we have investments. These exchange variations may materially impact the consolidation of the results of our companies. We have certain critical accounting policies that affect our combined operating results.
Our diversification strategy aims to balance the impact of significant changes in one country with opposing changes in other countries, in order to reducing, as much as practicable, the adverse impact of variations in the main factors that affect our combined operating results. The impact of these factors on us, for the periods covered by this information statement, is discussed below.
Prior to the 2013 capital increase conducted by Enersis, Enersis did not have a direct participation in Emgesa, while we directly owned 26.9% of the equity interest and 31.3% of the voting rights of Emgesa (through the ownership of shares with voting rights). Although we owned less than 50% of the equity interest and the voting rights of Emgesa, we were deemed to exercise control over Emgesa as a result of the transfer of 25.1% of the voting rights to Endesa Chile by Enel Latinoamérica, as the holder of a 21.6% interest in Emgesa at the time, and pursuant to a shareholders’ agreement with Empresa de Energía de Bogotá S.A. (which owns 51.5% of the equity interest in Emgesa) signed in August 27, 1997. This agreement will be transferred by Endesa Chile to us. This agreement along with the ownership of shares with voting rights will give us the right to appoint a majority of Emgesa’s Board members and, therefore, we will continue to include Emgesa in our combined financial statements.
After the contribution of Enel Latinoamérica’s 21.6% interest in Emgesa to Enersis in the Enersis’ 2013 capital increase, Enersis transferred its 25.1% voting rights in Emgesa to Endesa Chile and after the completion of the Spin-off, Endesa Chile will transfer this agreement to us; and therefore, Enersis will transfer its 25.1% voting rights in Emgesa to us. As a result of this transfer, we directly own 26.9% of the equity interest and have
89
56.4% of the voting rights of Emgesa as of the date of this information statement and we continue to consolidate Emgesa in our combined financial statements and to appoint a majority of Emgesa’s Board members. While Enersis Américas owns less than 50% of the equity interests and the voting rights of Emgesa as of the date of this information statement, Emgesa is regarded as a subsidiary of Enersis Américas because of our control over Emgesa.
| a. | Hydrological Conditions |
A substantial part of our generation capacity depends on the hydrological conditions prevailing in Argentina, Peru and Colombia. Our installed capacity as of September 30, 2015, September 30, 2014, December 31, 2014, and December 31, 2013 was 8,371 MW, 8,199 MW, 8,343 MW and 8,098 MW, of which 56.5%, 57.1%, 56.3% and 56.3%, respectively, was hydroelectric. See “Item 4. Information on the Company — D. Property, Plant and Equipment.”
Hydroelectric generation was 15,935 GWh and 15,171 GWh in the nine months ended September 30, 2015 and 2014, respectively, and 19,698 GWh and 18,576 GWh in the years 2014 and 2013. Our hydro generation for the nine months ended September 30, 2015 was 5.0% higher than the same period in the previous year mainly due to more favorable hydrological conditions in Argentina.
In the countries in which we operate, hydrological conditions can range from very humid, as a result of several years of abundant rainfall and reservoirs at their peak capacity, to extremely dry, as a consequence of prolonged droughts lasting for several years, and the partial or material depletion of water reservoirs. In between these two extremes, there are a wide range of possible hydrological conditions. For instance, a new year of drought has very different impacts on our business, depending on whether it follows several years of drought or a period of abundant rainfall. On the other hand, a good hydrological year has less marginal impact if it comes after several wet years than after a prolonged drought.
In Argentina, the months that typically have the most precipitation are May through August, and the months when snow and ice melts typically occur are October through December, providing flow to Collon Cura and Limay Rivers which feed El Chocón’s reservoir and hydroelectric plant, located in southwestern Argentina in the Comahue region.
Hydrological conditions in Colombia vary significantly throughout the different regions and depend on geographical conditions and topography. There are two rainfall patterns. One is characterized by two rainy periods separated by a drier season that is observed in the Andean region and in the center of the country, the most populated area and the center of economic activity, where all our hydroelectric plants except Guavio are located. The second pattern is characterized by a rainy season followed by a drier season, which is observed in the Orinoquia (eastern part of the country), where our largest hydroelectric plant, Guavio (1,213 MW), is located and its hydrological conditions are influenced by the Amazon.
Hydrological conditions in Peru also vary significantly depending on the location. The coast, which concentrates most of the population and economic activity, typically has less rainfall. In the Andean mountains, rainfall typically is most abundant from November through March providing flow to the basin of the Rimac River, feeding five of our seven hydroelectric plants. The jungle area also has most of its rainfall in the same period but in larger volumes, feeding the Tarma and Tulumayo River basins, where our other two hydroelectric plants are located.
For purposes of discussing the impact of hydrological conditions on our business, we generally categorize our hydrological conditions into dry, humid or normal, although there are many other possible scenarios well beyond these three. Extreme hydrological conditions may materially affect our operating results and financial conditions. However, it is difficult to calculate the effects of hydrology on our operating income, without concurrently taking into account other factors, because our operating income can only be explained by looking at a combination of factors and not each one on a stand-alone basis.
90
Hydrological conditions affect electricity market prices, generation costs, spot prices, tariffs and the mix of hydroelectric or thermal generation, which is constantly being defined by the market operator to minimize the operating cost of the entire system. Hydroelectric generation is almost always the least expensive method to generate electricity and normally has a marginal cost of close to zero. The exception is in years of prolonged drought, as authorities might assign a cost for the use of water, which may mean that hydroelectric generation does not necessarily have the lowest marginal cost at such time. Generally, hydroelectric plants are dispatched before thermoelectric plants because of their much lower marginal cost. The cost of thermal generation does not depend on hydrology but instead on global commodity prices for LNG, coal and diesel.
Spot prices primarily depend on hydrological conditions and commodity prices. Under most circumstances, abundant hydrological conditions lower spot prices while dry conditions normally increase prices. Spot market prices affect us because we purchase electricity in the spot market if we have deficits between our contracted energy sales and our generation, and we sell electricity in the spot market if we have electricity surpluses.
There are many other factors that may affect operating income, including the level of contracted sales as opposed to sales without contracts, purchases/sales in the spot electricity market, commodity prices, energy demand, technical and unforeseen problems that can affect the availability of our thermal plants, plant locations in relation to urban demand centers, and transmission system conditions, among others.
Hydrological conditions do not have an isolated effect but need to be evaluated in conjunction with other factors to better understand the impact on our operating results.
Argentina is a controlled market, with a defined remuneration scheme and no energy and commodity trading. Market prices are unrelated to hydrological conditions or commodity prices. There is no electricity market since free bilateral trading has been suspended. As a consequence, El Chocón sells most of its energy to the market operator at the regulated price, which is not affected by hydrological conditions and its results depend mainly on the amount of electricity it generates. As of September 30, 2015, El Chocon’s generation increased, resulting in a higher operating income than during the same period in 2014, primarily as a result of better hydrological conditions in the Comahue region. Hydrological conditions were better during 2014 than 2013 for El Chocón but because of the unfavorable currency exchange rate differences from converting Argentine pesos to Chilean pesos, operating income was similar to 2013. Costanera is a thermal plant, so its results only depend on its thermal generation.
In Colombia, hydrological conditions in 2015 and 2014 were influenced by the El Niño phenomenon which resulted in drought conditions for the whole system with very high spot prices. However, the hydrological conditions affecting our Guavio hydroelectric plant were wet, allowing Emgesa higher generation, resulting in surpluses that were sold on the spot market at higher prices, positively affecting Emgesa’s operating income since 2014. Operating income was negatively affected by the exchange rate differences in terms of Chilean pesos in 2015, and the contrary in 2014.
In Peru, during 2015, hydrological conditions were better than the historical average, allowing slightly higher hydroelectric generation, which combined with a drop in commodity prices, the slowing economic growth rate and delays in mining projects, resulted in an electricity oversupply, and even lower spot prices. Hydrological conditions have been wet since 2013 and the oversupply has grown larger. These market conditions negatively impacted Edegel’s 2015 operating income. Edegel is generating more energy than its contracted sale requirements selling the excess at a lower spot price. The better results in terms of Chilean pesos were mainly due to exchange rate differences. Operating income in 2014 was higher than in 2013, mainly due to higher physical sales to regulated customers and being able to purchase energy on the spot market at lower prices.
For additional information on the effects of hydrological conditions on our operating results, see “Item 3. Key Information — D. Risk Factors — Risks Related to Our Business—Because our generation business depends heavily on hydrological conditions, droughts may adversely affect our profitability.”
91
| b. | Selective Regulatory Developments |
The regulatory framework governing our businesses in the four countries in which we have investments has a material effect on our results of operations. In particular, regulators set energy prices in the generation business taking into consideration factors such as fuel costs, reservoir levels, exchange rates, future investments in installed capacity and demand growth, all of which are intended to allow our companies to earn a regulated level of return on their investments and guarantee service quality and reliability. The earnings of our electricity combined entities are determined to a large degree by government regulators, mainly through the tariff setting process.
In Argentina, the Argentine Secretary of Energy published Resolution No. 95/2013, Resolution No. 529/2014 and Resolution No. 482/2015 in 2013, 2014 and 2015, respectively, which set forth a non-recurring regulated remuneration schedule for power generation activity effective retroactively as of February 2013. For additional information relating to the Argentine regulatory frameworks, see “Item 4. Information on the Company — B. Business Overview — Electricity Industry Regulatory Framework — Argentina — Industry Overview — Industry Structure.”
For additional information relating to the regulatory frameworks in the countries where we operate, see “Item 4. Information on the Company — B. Business Overview — Electricity Industry Regulatory Framework.”
Macroeconomic conditions, such as changes in employment levels, and inflation or deflation in the countries in which we operate may have a significant effect on our operating results. Macroeconomic factors, such as the variation of a local currency against the U.S. dollar may impact our operating results, as well as our assets and liabilities, depending on the percentage denominated in U.S. dollars. For example, a devaluation of local currencies against the U.S. dollar increases the cost of capital expenditure plans. For additional information, see “Item 3. Key Information — D. Risk Factors — Risks Related to Our Business — Foreign exchange risks may adversely affect our results and the U.S. dollar value of dividends payable to ADS holders.” and “— Risks Related to Our Business — South American economic fluctuations are likely to affect our results from operations and financial condition as well as the value of our securities.”
In order to determine whether Argentina could be qualified as a hyperinflationary economy, we have considered the behavior of historical and projected inflation, along with other indicators established in IAS 29, Financial Reporting in Hyperinflationary Economies. We have also taken into consideration various analyses and studies issued by international agencies such as the International Practices Task Force of the U.S. SEC Regulations Committee, which have suggested that Argentina is not currently a hyperinflationary economy. In addition, we have checked our peers in Argentina and, in that context, have noted that publicly held Argentine companies which adopted IFRS have not introduced adjustments to reflect inflation since the date of their transition to IFRS.
We have not observed objective verifiable data leading to a conclusion that the Argentine economy should be considered a hyperinflationary economy in accordance with the indicators set forth in IAS 29.
Local Currency Exchange Rate
Variations in the parity of the U.S. dollar and the local currency in each of the countries in which we operate may have an impact on our operating results and overall financial position. The impact will depend on the level at which tariffs are pegged to the U.S. dollar, U.S. dollar-denominated assets and liabilities and also the translation of statements of comprehensive income of our foreign combined entities for combination purposes to the presentation currency, which is the Chilean peso.
92
As of September 30, 2015, we had total combined indebtedness of Ch$ 1,143 billion (net of currency hedging instruments), of which 81.3% was denominated in Colombian pesos, 14.4% in U.S. dollars, 3.3% in Argentine pesos and 1.0% in Peruvian soles.
The following table sets forth the closing and average local currencies per U.S. dollar exchange rates for the periods indicated.
| | | | | | | | | | | | | | | | | | | | | | | | | | | | | | | | |
| | | Local Currency U.S. Dollar Exchange Rates | | | | |
| | | Nine months ended September 30, | | | Year ended December 31, | |
| | | 2015 | | | 2014 | | | 2014 | | | 2013 | |
| | | Average | | | Period End | | | Average | | | Period End | | | Average | | | Year End | | | Average | | | Year End | |
Argentina (Argentine pesos per U.S. dollar) | | | 8.97 | | | | 9.42 | | | | 7.98 | | | | 8.46 | | | | 8.11 | | | | 8.55 | | | | 5.48 | | | | 6.52 | |
Brazil (reais per U.S. dollar) | | | 3.16 | | | | 4.00 | | | | 2.29 | | | | 2.45 | | | | 2.35 | | | | 2.66 | | | | 2.16 | | | | 2.34 | |
Colombia (Colombian pesos per U.S. dollar) | | | 2,643 | | | | 3,100 | | | | 1,943 | | | | 2,024 | | | | 1,997 | | | | 2,392 | | | | 1,870 | | | | 1,927 | |
Peru (soles per U.S. dollar) | | | 3.14 | | | | 3.24 | | | | 2.81 | | | | 2.90 | | | | 2.84 | | | | 2.99 | | | | 2.70 | | | | 2.80 | |
Chile (Chilean pesos per U.S. dollar) | | | 640.39 | | | | 698.72 | | | | 561.10 | | | | 599.22 | | | | 570.40 | | | | 606.75 | | | | 495.18 | | | | 524.61 | |
Sources: Central banks of each country.
For the nine months ended September 30, 2015, our revenues were Ch$ 905.9 billion, of which 58% was generated by operations in Colombia, 30.6% in Peru, 11.3% in Argentina and 0.3% in Chile (mainly from engineering services provided to our combined entities).
Argentina
As a result of the Argentine economic crisis in the early 2000s and the significant governmental intervention in the electricity sector in 2002, we have not received dividends from our Argentine combined entities, Costanera and El Chocón, since 2000 and 2012, respectively. In 2011, we recorded a Ch$ 5.4 billion goodwill impairment charge for Costanera. Additional economic deterioration of Argentina, or of our combined entities that operate in that country, would not be expected to have any material effect on our financial and operating results. Our Argentine operations do not affect our combined liquidity. Our Argentine liquid assets were Ch$ 13.2 billion as of September 30, 2015, which represents 7.9% of our total liquid assets. Of the total Argentine liquid assets, 94.7% is denominated in local currency, and the remaining 5.3% is denominated in U.S. dollars. Our Argentine debt was Ch$ 81.6 billion as of September 30, 2015, representing 7.2% of our total debt. Of the total Argentine debt, 46.9% is denominated in local currency, and the remaining 53.1% is denominated in U.S. dollars. The currency translation effect of converting the statements of comprehensive income from the Argentine peso to the Chilean peso led to a 1.6% increase in the amount of Chilean pesos in the nine months period ended September 2015 compared to same period in 2014.
A default by any of our Argentine combined entities on their indebtedness would not materially affect us, because we, on a stand-alone basis, do not have any debt agreements that includes cross default provisions that could be triggered by any Argentine or any other combined entity’s default. For more information, see “Item 5. Operating and Financial Review and Prospects. — B. Liquidity & Capital Resources.”
The Argentine government has avoided increasing electricity tariffs to end customers, and seasonal prices have remained fixed in Argentine pesos. On the other hand, a generation company’s tariffs are also regulated based on defined fixed and variable remuneration. Due to rate controls, revenues of electric utility companies do not always cover their operating costs. Argentine authorities have created a new mechanism to improve the financial situation of these companies in recognition that their performance is directly related to the regulatory framework. For more detail, see “Item 4. Information on the Company — B. Business Overview — Electricity Industry Regulatory Framework — Argentina.”
93
| d. | Critical Accounting Policies |
Critical accounting policies are defined as those that reflect significant judgments and uncertainties, which would potentially result in materially different results under different assumptions and conditions. We believe that our critical accounting policies are limited to those described below with reference to the preparation of our combined financial statements under IFRS.
For further detail of the accounting policies and the methods used in the preparation of the combined financial statements, see Notes 2 and 3 of the Notes to our interim combined financial statements
Impairment of Long-Lived Assets
During the year, and principally at the end of each reporting period, we evaluate whether there is any indication that an asset has been impaired. Should any such indication exist, we estimate the recoverable amount of that asset to determine, where appropriate, the amount of impairment. In the case of identifiable assets that do not generate cash flows independently, we estimate the recoverability of the cash generating unit to which the asset belongs, which is understood to be the smallest identifiable group of assets that generates independent cash inflows.
Notwithstanding the preceding paragraph, in the case of cash generating units to which goodwill or intangible assets with an indefinite useful life have been allocated, a recoverability analysis is performed routinely at each period end.
The recoverable amount is the greater of (i) the fair value less the cost needed to sell and (ii) the value in use. “Value in use” is defined as the present value of the estimated future cash flows. In order to calculate the recoverable value of property, plant and equipment, goodwill and intangible assets, we use value in use criteria in nearly all cases.
To estimate the value in use, we prepare future pre-tax cash flow projections based on the most recent budgets available. These budgets incorporate management’s best estimates of cash generating units, revenues and costs using sector projections, past experience and future expectations.
In general, these projections cover the next five years, estimating cash flows for subsequent years by applying reasonable growth rates, between 3.4% and 13.1%, which in no case are increasing nor exceed the average long term growth rates for the particular sector and country.
These cash flows are discounted at a given pre-tax rate in order to calculate their present value. This rate reflects the cost of capital of the business and the geographical area in which the business is conducted. The discount rate is calculated taking into account the current time value of money and the risk premiums generally used by market participants for the specific business activity and the country involved.
The pre-tax nominal discount rates applied as of September 30, 2015 and 2014 and December 31, 2014 and 2013 are as follows:
| | | | | | | | | | | | | | | | | | | | | | | | | | | | | | | | | | |
| | | | | Nine months ended September 30, | | | Year ended December 31, | |
| | | | | 2015 | | | 2014 | | | 2014 | | | 2013 | |
Country | | Currency | | Minimum | | | Maximum | | | Minimum | | | Maximum | | | Minimum | | | Maximum | | | Minimum | | | Maximum | |
Argentina | | Argentine peso | | | 33.9 | % | | | 38.0 | % | | | 42.0 | % | | | 44.4 | % | | | 37.2 | % | | | 38.9 | % | | | 42.0 | % | | | 44.4 | % |
Brazil | | Brazilian real | | | 10.9 | % | | | 20.0 | % | | | 9.0 | % | | | 18.8 | % | | | 9.7 | % | | | 22.7 | % | | | 9.0 | % | | | 18.8 | % |
Colombia | | Colombian
peso | | | 14.9% | | | | 14.2% | | | | 13.3% | | | | 14.2% | |
Peru | | Peruvian
Nuevo sol | | | 12.1% | | | | 11.8 | % | | | 12.3 | % | | | 12.6% | | | | 11.8 | % | | | 12.3 | % |
Sources: Central banks of each country.
94
If the recoverable amount is less than the net carrying amount of the asset, the corresponding impairment loss provision is recognized for the difference, and charged to “Reversal of impairment loss (impairment loss) recognized in profit or loss” in the combined statement of comprehensive income.
Impairment losses recognized for an asset in prior periods are reversed when its estimated recoverable amount changes, increasing the asset’s value with a credit to earnings, limited to the asset’s carrying amount if no adjustment had occurred. In the case of goodwill, any adjustments made are not reversible.
Litigation and Contingencies
We are currently involved in certain legal and tax proceedings. As discussed in Note 31.3 of the Notes to our interim combined financial statements as of September 30, 2015, we have estimated the probable outflows of resources for resolving these claims to be Ch$ 4.8 billion. We have reached this estimate after consulting our legal and tax advisors who are carrying out our defense in these matters and an analysis of potential results, assuming a combination of litigation and settlement strategies.
Pension and Post-Employment Benefits Liabilities
We have various defined benefits plans for our employees. These plans pay benefits to employees at retirement and use formulas based on years of service and the compensation of the participants. We also offer certain additional benefits for some retired employees in particular.
The liabilities shown for the pensions and post-employment benefits reflect our best estimate of the future cost of meeting our obligations under these plans. The accounting applied to these defined benefit plans involves actuarial calculations which contain key assumptions that include employee turnover, life expectancy, retirement ages, discount rates, the future level of compensation and benefits, the claims rate under medical plans, and future medical costs. These assumptions change as economic and market conditions vary and any change in any of these assumptions could have a material effect on the reported results from operations.
The effect of an increase of one percentage point in the discount rate used to determine the present value of the post-employment defined benefits would decrease the liability by Ch$ 1.8 billion as of September 30, 2015, and Ch$ 2.2 billion as of December 31, 2014; and the effect of a decrease of one percentage point in the rate used to determine the present value of the post-employment defined benefits would increase the liability by Ch$ 2.3 billion as of September 30, 2015 and Ch$ 2.5 billion as of December 31, 2014.
Recent Accounting Pronouncements
Please see Note 2.2 of the Notes to our interim combined financial statements for additional information regarding recent accounting pronouncements.
95
2. Analysis of Results of Operations for the Nine Months Ended September 30, 2015 and 2014
Revenues
The following table sets forth the revenues by geographical location, as a percentage of total combined revenues for the nine months ended September 30, 2015 and 2014:
| | | | | | | | |
| | | Nine months ended
September 30, | |
| | | 2015 | | | 2014 | |
| | | (as a % of total) | |
Argentina | | | 11.3 | | | | 8.3 | |
Colombia | | | 58.0 | | | | 63.6 | |
Peru | | | 30.6 | | | | 27.9 | |
Chile(1) | | | 0.3 | | | | 0.3 | |
Intercompany transaction adjustments | | | (0.1 | ) | | | (0.03 | ) |
| | | | | | | | |
Total combined net revenues | | | 100 | | | | 100 | |
| | | | | | | | |
| (1) | We consider our revenues from operations that are not related to the electricity business to be immaterial and believe that they do not affect the analysis of our combined financial statements. These revenues come mainly from engineering services provided to our combined entities in Argentina and Peru. |
The tables below set forth the breakdown for our total revenues from operations by geographic location, the volume of energy sales (expressed in GWh) and the volume of energy produced, in each case for the nine months ended September 30, 2015 and 2014:
| | | | | | | | | | | | |
| | | Nine months ended September 30, | |
Revenues | | 2015 | | | 2014 | | | Change | |
| | | (in millions of Ch$) | | | (in %) | |
Argentina | | | 102,316 | | | | 76,759 | | | | 33.3 | |
Colombia | | | 525,172 | | | | 588,368 | | | | (10.7 | ) |
Peru | | | 276,761 | | | | 257,950 | | | | 7.3 | |
Chile | | | 2,848 | | | | 3,012 | | | | (5.5 | ) |
Combined adjustment | | | (1,179 | ) | | | (265 | ) | | | n.a. | |
| | | | | | | | | | | | |
Total net revenues | | | 905,918 | | | | 925,824 | | | | (2.2 | ) |
| | | | | | | | | | | | |
| | | | | | | | | | | | |
| | | Nine months ended September 30, | |
Energy Sales | | 2015 | | | 2014 | | | Change | |
| | | (in GWh) | | | (in %) | |
Argentina | | | 9,112 | | | | 8,000 | | | | 13.9 | |
Colombia | | | 12,845 | | | | 12,140 | | | | 5.8 | |
Peru | | | 6,501 | | | | 6,929 | | | | (6.2 | ) |
| | | | | | | | | | | | |
Total | | | 28,459 | | | | 27,068 | | | | 5.1 | |
| | | | | | | | | | | | |
| | | | | | | | | | | | |
| | | Nine months ended
September 30, | |
Generation | | 2015 | | | 2014 | | | Change | |
| | | (in GWh) | | | (in %) | |
Argentina | | | 8,680 | | | | 7,332 | | | | 18.4 | |
Colombia | | | 10,750 | | | | 10,467 | | | | 2.7 | |
Peru | | | 6,190 | | | | 6,550 | | | | (5.5 | ) |
| | | | | | | | | | | | |
Total | | | 25,620 | | | | 24,349 | | | | 5.2 | |
| | | | | | | | | | | | |
96
Revenues from operations in Argentina grew by 33.3%, or Ch$ 25.6 billion, to Ch$ 102.3 billion for the first nine months of 2015. This increase was explained by greater revenues in Costanera of Ch$ 19.2 billion over the same period of the previous year, as a result of Ch$ 12 billion due to 924 GWh higher energy sales caused by higher thermal dispatch and increased tariffs related to Resolution No. 482/2015 that contributed Ch$ 18 billion. In addition, El Chocón increased its revenues by Ch$ 6.4 billion, mostly due to 189 GWh in higher physical sales due improved hydrological conditions and higher tariffs related to Resolution No. 482/2015 of Ch$ 4 billion.
Total revenues from operations in Colombia declined by 10.7%, or Ch$ 63.2 billion mainly due to the unfavorable currency translation effect of converting Colombian pesos to the Chilean pesos which resulted in a loss of Ch$ 94.8 billion. The effect of translating the combined financial statements from the Colombian pesos to the Chilean pesos in both periods resulted in a 16.1% decline in Chilean pesos for the first nine months of 2015 as compared to the same period in 2014. This was partially offset by Ch$ 20 billion increase due to higher physical sales by 705 GWh to distribution companies.
Revenues from operations in Peru grew by 7.3%, or Ch$ 24.5 billion for the first nine months of 2015, mainly due to the depreciation of the Peruvian Sol against the U.S. dollar and the Chilean peso. The effect of translating the combined financial statements from the Peruvian sol to the Chilean peso in both periods resulted in a 2.1% increase in Chilean pesos for the first nine months of 2015 as compared to the same period in 2014. This was partly offset by Ch$ 2 billion decrease due to lower physical sales by 428 GWh mainly to distribution companies.
Total Operating Costs
Total operating costs consist primarily of electricity purchases from third parties, fuel purchases, tolls paid to transmission companies, depreciation, amortization and impairment losses, maintenance costs, and employee salaries. Total operating costs also include administrative and selling expenses.
The following table shows the breakdown of our combined operating costs, as a percentage of total combined operating costs, for the nine months ended September 30, 2015 and 2014.
| | | | | | | | | | | | | | | | |
| | | Nine months ended
September 30, | |
| | | 2015 | | | 2014 | |
| | | (in millions
of Ch$) | | | (in %) | | | (in millions
of Ch$) | | | (in %) | |
Operating Costs as a Percentage of Total Operating Costs | | | | | | | | | | | | | | | | |
Electricity purchases | | | 75,188 | | | | 16.0 | | | | 81,248 | | | | 18.7 | |
Fuel purchases | | | 90,406 | | | | 19.3 | | | | 73,641 | | | | 16.9 | |
Transmission tolls | | | 77,180 | | | | 16.5 | | | | 75,907 | | | | 17.4 | |
Other variable cost | | | 41,058 | | | | 8.8 | | | | 44,080 | | | | 10.1 | |
Other fixed costs(1) | | | 52,007 | | | | 11.1 | | | | 42,147 | | | | 9.7 | |
Staff benefit costs(1) | | | 54,035 | | | | 11.5 | | | | 41,872 | | | | 9.6 | |
Depreciation, amortization and impairment losses(1) | | | 78,734 | | | | 16.8 | | | | 76,165 | | | | 17.5 | |
| | | | | | | | | | | | | | | | |
Total | | | 468,609 | | | | 100.0 | | | | 435,058 | | | | 100.0 | |
| | | | | | | | | | | | | | | | |
(1) Corresponds to selling and administration expenses | |
97
Generation Operating Costs
The table below sets forth the breakdown for operating costs (excluding selling and administrative expenses) by geographical location for the nine months ended September 30, 2015 and 2014:
| | | | | | | | | | | | |
| | | Nine months ended September 30, | |
| | | 2015 | | | 2014 | | | Change | |
| | | (in millions of Ch$) | | | (in %) | |
Argentina | | | 9,127 | | | | 11,132 | | | | (18.0 | ) |
Colombia | | | 165,121 | | | | 164,121 | | | | 0.6 | |
Peru | | | 109,584 | | | | 99,622 | | | | 10.0 | |
| | | | | | | | | | | | |
Total | | | 283,833 | | | | 274,875 | | | | 3.3 | |
| | | | | | | | | | | | |
In Argentina, due to Resolution No. 95/2013 and subsequent Resolutions No. 529/2014 and No. 482/2015, the marginal remuneration system was terminated in the Argentine electricity generation market. Remuneration is now determined by technology and capacity. The basis for the remuneration is the recognition of fixed (to be determined by availability) and variable costs, plus an additional payment (based on energy generated). As a result, operating expenses (including procurement and service costs) reached Ch$ 9.1 billion for the nine months ended September 30, 2015, an 18.0% decline compared to Ch$ 11.1 billion for the nine months ended September 30, 2014. This decline was mainly due to a 74.0% decrease in electricity purchases in both Costanera of Ch$ 2.3 billion and El Chocón of Ch$ 0.7 billion as a result of increased generation caused by higher thermal dispatch and improved hydrological conditions, respectively.
In Colombia, operating expenses in the generation business remained stable for the nine months ended September 30, 2015 as compared to the same period in 2014 increasing by only 0.6% as compared to same period in 2014 primarily due to greater fuel purchases of Ch$ 9.0 billion from increased thermal generation, partially offset by lower energy purchases of Ch$ 3.9 billion due to reduced average purchase price in the spot market, and lower transportation expenses of Ch$ 3.2 million.
In Peru, operating expenses increased by 10.0%, or Ch$10.0 billion for the nine months ended September 30, 2015 as compared to same period in 2014, mainly due to a greater fuel purchases of Ch$ 6.4 billion related to higher thermal generation, and increased transportation expenses of Ch$ 5.4 billion related to higher toll costs.
Selling and Administrative Expenses
Selling and administrative expenses relate to salaries, compensation, administrative expenses, depreciation, amortization and impairment losses, and office materials and supplies.
The following table shows the breakdown of our combined selling and administrative expenses, as a percentage of total combined selling and administrative expenses, for the nine months ended September 30, 2015 and 2014:
| | | | | | | | |
| | | Nine months ended
September 30, | |
| | | 2015 | | | 2014 | |
| | | (in %) | |
Selling and Administrative Expenses as a Percentage of Total Selling and Administrative Expenses | | | | | | | | |
Other fixed costs | | | 28.1 | | | | 26.3 | |
Staff benefit costs | | | 29.2 | | | | 26.1 | |
Depreciation, amortization and impairment losses | | | 42.6 | | | | 47.5 | |
| | | | | | | | |
Total | | | 100.0 | | | | 100.0 | |
| | | | | | | | |
98
The table below sets forth the breakdown of selling and administrative expenses by geographical location for the nine months ended September 30, 2015 and 2014:
| | | | | | | | | | | | |
| | | Nine months ended September 30, | |
| | | 2015 | | | 2014 | | | Change | |
| | | (in millions of Ch$) | | | (in %) | |
Selling and administrative expenses | | | | | | | | | | | | |
Argentina | | | 61,652 | | | | 43,869 | | | | 40.5 | |
Colombia | | | 60,590 | | | | 58,546 | | | | 3.5 | |
Peru | | | 62,590 | | | | 57,483 | | | | 8.9 | |
Chile | | | 1,124 | | | | 549 | | | | n.a. | |
Combined adjustments | | | (1,179 | ) | | | (265 | ) | | | n.a. | |
| | | | | | | | | | | | |
Total selling and administrative expense | | | 184,777 | | | | 160,184 | | | | 15.4 | |
| | | | | | | | | | | | |
Selling and administrative expenses increased by Ch$ 24.6 billion, or 15.4%, during the nine months ended September 30, 2015 compared to the same period in 2014, as explained below.
In Argentina, selling and administrative expenses increased by 40.5% to Ch$ 61.7 billion, primarily due to higher payroll expenses of Ch$ 12.5 billion following increases in the workforce and in wages and benefits during this period.
In Colombia, selling and administrative expenses increased from Ch$ 58.5 billion for the first nine months of 2014 to Ch$ 60.6 billion for the first nine months of 2015, mainly due to the Ch$ 8.6 billion wealth tax charge related to the tax reform Law No. 1,739 in force since December 2014.
In Peru, selling and administrative expenses increased by 8.9% to Ch$ 62.6 billion, mainly due to higher charges of depreciation and impairment of Ch$ 3.3 billion.
Operating Margin
The following is our operating margin by geographic location for the nine months ended September 30, 2015 and 2014:
| | | | | | | | |
| | | Nine months ended
September 30, | |
| | | 2015 | | | 2014 | |
| | | (in %) | |
Operating margin | | | | | | | | |
Argentina | | | 30.8 | | | | 28.3 | |
Colombia | | | 57.0 | | | | 62.2 | |
Peru | | | 37.8 | | | | 39.1 | |
Chile | | | 60.6 | | | | 81.8 | |
| | | | | | | | |
Total operating margin | | | 48.3 | | | | 53.0 | |
| | | | | | | | |
Our operating margin, or operating income as a percentage of revenues, decreased to 48.3% for the nine months ended September 30, 2015 as compared to 53.0% for the nine months ended September 30, 2014.
This was due to lower operating margins in Colombia, partly offset by higher operating margins in Argentina. The lower operating margin in Colombia was due to a revenue decrease in relation to stable levels of operating costs, mainly related to the unfavorable currency translation effect of converting Colombian pesos to the Chilean pesos, which resulted in the loss of Ch$ 94.8 billion. Operating margin in Argentina improved to
99
30.8% from 28.3% mainly as a consequence of higher tariffs related to Resolution No. 482/2015 and higher hydro and thermal generation. The operating margin in Peru decreased slightly mainly due its operating cost increase by 10.0% because higher fuel and toll costs.
Operating Income
The following table summarizes operating income by geographical location for the nine months ended September 30, 2015 and 2014:
| | | | | | | | | | | | |
| | | Nine months ended
September 30, | |
| | | 2015 | | | 2014 | | | Change | |
| | | (in millions of Ch$) | | | (in %) | |
Operating income | | | | |
Argentina | | | 31,536 | | | | 21,758 | | | | 44.9 | |
Colombia | | | 299,461 | | | | 365,700 | | | | (18.1 | ) |
Peru | | | 104,587 | | | | 100,845 | | | | 3.7 | |
Chile | | | 1,725 | | | | 2,463 | | | | (30.0 | ) |
| | | | | | | | | | | | |
Total operating income | | | 437,309 | | | | 490,766 | | | | (10.9 | ) |
| | | | | | | | | | | | |
Our combined operating income was Ch$ 437.3 billion for the first nine months of 2015 or 10.9% higher than the Ch$ 490.8 billion reported in September 2014. This was mainly explained by lower operating income in Colombia of Ch$ 66.2 billion for the first nine months of 2015, reaching Ch$ 299.5 billion, mostly explained by reduced revenue of Ch$ 63.2 billion and the recognition of the wealth tax decreed by the Colombian government of Ch$ 8.6 billion.
Operating income in Argentina increased by Ch$ 9.8 billion to Ch$ 31.5 billion due to higher physical sales and increased tariffs related to Resolution No. 482/2015. Operating income in Peru grew by 3.7% to Ch$ 104.6 billion for the first nine months of 2015 compared to Ch$ 100.8 billion for the same period in 2014, mainly as a consequence of the depreciation of the Peruvian Sol against the US dollar and the Chilean peso.
Other Results
The following table sets forth certain information regarding our combined other results for the nine months ended September 30, 2015 and 2014:
| | | | | | | | | | | | |
| | | Nine months ended
September 30, | |
| | | 2015 | | | 2014 | | | Change | |
| | | (in millions of Ch$) | | | (in %) | |
Financial results | | | | |
Financial income | | | 14,063 | | | | 9,852 | | | | 42.7 | |
Financial costs | | | (57,693 | ) | | | (53,349 | ) | | | 8.1 | |
Foreign currency exchange differences | | | 326 | | | | (24,482 | ) | | | n.a | |
| | | | | | | | | | | | |
Total | | | (43,304 | ) | | | (67,979 | ) | | | (36.3 | ) |
| | | |
Other | | | | | | | | | | | | |
Share of the profit of investments accounted for using the equity method | | | 29,168 | | | | 34,443 | | | | (15.3 | ) |
Net income from other investments | | | — | | | | 668 | | | | n.a | |
Net income from sales of assets | | | 38 | | | | 70 | | | | (45.5 | ) |
| | | | | | | | | | | | |
Total | | | 29,206 | | | | 35,181 | | | | (17.0 | ) |
| | | | | | | | | | | | |
Total other results | | | (14,098 | ) | | | (32,797 | ) | | | (57.0 | ) |
| | | | | | | | | | | | |
100
Financial Results
Our net financial results amounted to an expense of Ch$ 43.3 billion for the first nine months of 2015, a 36.3% decrease compared to the Ch$ 68.0 billion expense in the same period of 2014. This improvement was mainly a lower charge of Ch$ 24.8 billion in foreign currency exchange differences primarily due to the renegotiation of the terms of Costanera’s US dollar- denominated debt with Mitsubishi Corporation (“MC”) in October 2014.
Share of the profit of investments accounted for using the equity method
Our share of the net profits of investments accounted for using the equity method totaled Ch$ 29.2 billion for the nine months ended September 30, 2015, a 15.3% decrease compared to same period in 2014. This decree was mainly a result of Ch$ 7.3 billion decrease in net income from Enel Brasil primarily by lower profits from the generation business in Brazil related to the drought affecting the country since 2012. For more information see Note 11 of the Notes to our interim combined financial statements.
Corporate Income Tax
Corporate income tax expenses decreased by 2.7% for the first nine month of 2015 or Ch$ 4.6 billion, to Ch$167.6 billion, compared to the same period in 2014. The effective tax rate was 39.6% for the first nine month of 2015 and 37.6% for the same period in 2014.
The decrease in corporate income tax expenses were mainly the result of reduced tax base in Colombia of Ch$ 63.4 billion, a lower tax credit in Chile of Ch$ 14.1 billion related to lower dividends received from Enel Brasil during the first nine months of 2015, and reduced income tax rate in Peru to 28% for the first nine months of 2015, from 30% for the same period in 2014, as result of the Tax Reform No. 30296 in place since January 1, 2015. For more information see Note 29 of the Notes to our interim combined financial statements.
Net Income
The following table sets forth our combined net income before tax, income tax and net income for the nine months ended September 30, 2015 and 2014:
| | | | | | | | | | | | |
| | | Nine months ended September 30, | |
| | | 2015 | | | 2014 | | | Change | |
| | | (in millions of Ch$) | | | (in %) | |
Net income before tax | | | 423,211 | | | | 457,969 | | | | (7.6 | ) |
Income tax | | | (167,560 | ) | | | (172,220 | ) | | | (2.7 | ) |
| | | | | | | | | | | | |
Net income | | | 255,651 | | | | 285,749 | | | | (10.5 | ) |
Net income attributable to the parent company | | | 93,789 | | | | 93,081 | | | | 0.8 | |
Net income attributable to non-controlling interest | | | 161,862 | | | | 192,669 | | | | (16.0 | ) |
For a breakdown of the net income by geographical area, see Note 30 of the Notes to our interim combined financial statements.
101
3. Analysis of Results of Operations for the Years Ended December 31, 2014 and 2013
Revenues
The following table sets forth the revenues by geographical location, as a percentage of total combined revenues for the years ended December 31, 2014 and 2013:
| | | | | | | | |
| | | Year ended December 31, | |
| | | 2014 | | | 2013 | |
| | | (as a % of total) | |
Argentina | | | 8.7 | | | | 12.4 | |
Colombia | | | 62.0 | | | | 60.5 | |
Peru | | | 29.1 | | | | 26.8 | |
Chile | | | 0.4 | | | | 0.3 | |
Combined adjustment | | | (0.2 | ) | | | — | |
| | | | | | | | |
Total combined revenues | | | 100 | | | | 100 | |
| | | | | | | | |
The tables below set forth the breakdown for our total revenues from operations by geographical location, the volume of energy sales (expressed in GWh) and the volume of energy produced, in each case for the years ended December 31, 2014 and 2013:
| | | | | | | | | | | | |
| | | Year ended December 31, | |
Revenues | | 2014 | | | 2013 | | | Change | |
| | | (in millions of Ch$) | | | (in %) | |
Argentina | | | 105,265 | | | | 131,443 | | | | (19.9 | ) |
Colombia | | | 753,373 | | | | 639,504 | | | | 17.8 | |
Peru | | | 353,795 | | | | 283,806 | | | | 24.7 | |
Chile | | | 5,161 | | | | 3,102 | | | | 66.4 | |
Combined adjustment foreign combined entities | | | (2,035 | ) | | | (461 | ) | | | n.a. | |
| | | | | | | | | | | | |
Total revenues | | | 1,215,559 | | | | 1,057,395 | | | | 15.0 | |
| | | | | | | | | | | | |
| | | | | | | | | | | | |
| | | As of December 31, | |
Energy Sales | | 2014 | | | 2013 | | | Change | |
| | | (in GWh) | | | (in %) | |
Argentina | | | 10,442 | | | | 12,354 | | | | (15.5 | ) |
Colombia | | | 15,773 | | | | 16,090 | | | | (2.0 | ) |
Peru | | | 9,320 | | | | 8,904 | | | | 4.7 | |
| | | | | | | | | | | | |
Total | | | 35,535 | | | | 37,348 | | | | (4.8 | ) |
| | | | | | | | | | | | |
| | | | | | | | | | | | |
| | | As of December 31, | |
Generation | | 2014 | | | 2013 | | | Change | |
| | | (in GWh) | | | (in %) | |
Argentina | | | 9,604 | | | | 10,840 | | | | (1.4 | ) |
Colombia | | | 13,559 | | | | 12,748 | | | | 6.4 | |
Peru | | | 8,609 | | | | 8,391 | | | | 2.6 | |
| | | | | | | | | | | | |
Total | | | 31,772 | | | | 31,979 | | | | (0.6 | ) |
| | | | | | | | | | | | |
Revenues from operations in Argentina decreased 19.9%, or Ch$ 26.2 billion, mainly as a result of the currency translation effect of converting the statements of comprehensive income from the Argentine peso to the Chilean peso, which led to a 22.3% reduction, or Ch$ 23 billion, in 2014 when compared to 2013. Excluding the currency translation effect, revenues increased by 3% or Ch$ 3 billion, mainly due to the impact of Resolution
102
No. 529/2014 that updated tariffs and increased El Chocón’s revenues by Ch$ 1.5 billion. Costanera’s revenues also increased by Ch$ 1.5 billion related to its combined-cycle availability contract executed with the Secretary of Energy.
Total revenues from operations in Colombia increased by Ch$ 113.9 billion, or 17.8%, mainly due to a 17.3 % increase in energy sales, as a consequence of Ch$ 65 billion and the effect of translating the statements of comprehensive income from Colombian pesos to Chilean pesos, which in both periods resulted in a 7.6% increase in Chilean pesos, or Ch$ 48 billion in 2014 when compared to 2013.
Revenues from operations in Peru grew by 24.7%, or Ch$ 70.4 billion in 2014, mainly due to a 13.6% increase in electricity sales as a consequence of 417 GWh increase in physical energy sales by Ch$ 43 billion electricity sales. The currency translation effect of converting the statements of comprehensive income from Peruvian soles to the Chilean pesos for both periods resulted in a 9.6% increase, or Ch$ 27 billion increase, in 2014 when compared to 2013.
Total operating Costs
The total operating costs consist primarily of electricity purchases from third parties, fuel purchases, tolls paid to transmission companies, depreciation, amortization and impairment losses, maintenance costs, and employee salaries. Total operating costs also include administrative and selling expenses.
The following table shows the breakdown of our combined operating costs, as a percentage of total combined operating costs, for the years ended December 31, 2014 and 2013.
| | | | | | | | | | | | | | | | |
| | | Year ended December 31, | |
| | | 2014 | | | 2013 | |
| | | (in millions
of Ch$) | | | (in %) | | | (in millions
of Ch$) | | | (in %) | |
Operating Costs as a Percentage of Total Operating Costs | | | | | | | | | | | | | | | | |
Electricity purchases | | | 108,349 | | | | 18.3 | | | | 113,258 | | | | 20.8 | |
Fuel purchases | | | 100,755 | | | | 17.0 | | | | 96,237 | | | | 17.7 | |
Transmission tolls | | | 103,553 | | | | 17.5 | | | | 84,159 | | | | 15.5 | |
Other variable cost | | | 56,584 | | | | 9.5 | | | | 42,324 | | | | 7.8 | |
Other fixed costs(1 | | | 60,036 | | | | 10.1 | | | | 52,541 | | | | 9.7 | |
Staff benefit costs(1) | | | 57,341 | | | | 9.7 | | | | 51,793 | | | | 9.5 | |
Depreciation, amortization and impairment losses(1) | | | 105,894 | | | | 17.9 | | | | 103,577 | | | | 19.0 | |
| | | | | | | | | | | | | | | | |
Total | | | 592,512 | | | | 100.0 | | | | 543,888 | | | | 100.0 | |
| | | | | | | | | | | | | | | | |
(1) Corresponds to selling and administration expenses | |
Generation operating costs
The table below sets forth the breakdown for operating costs (excluding selling and administrative expenses) by geographical location for the years ended December 31, 2014 and 2013:
| | | | | | | | | | | | |
| | | Year ended December 31, | |
| | | 2014 | | | 2013 | | | Change | |
| | | (in millions of Ch$) | | | (in %) | |
Argentina | | | 15,204 | | | | 36,479 | | | | (58.3 | ) |
Colombia | | | 220,303 | | | | 204,419 | | | | 7.8 | |
Peru | | | 133,735 | | | | 95,080 | | | | 40.7 | |
| | | | | | | | | | | | |
Total | | | 369,242 | | | | 335,978 | | | | 9.9 | |
| | | | | | | | | | | | |
103
In Argentina, due to Resolutions No. 95/2013 and No. 529/2014, the marginal remuneration system in the Argentine electricity generation market has ended. Remuneration is now determined by technology and capacity. The basis for the remuneration is the recognition of fixed (to be determined by availability) and variable costs, plus an additional payment (based on energy generated). As a result, operating expenses (or procurement and service costs) in Argentina were Ch$ 15.2 billion in 2014, a 58.3% decrease compared to Ch$ 36.5 billion in 2013. The latter is partially explained by an 18.2% decline in energy generation in Costanera which in turn reduced its procurement and service costs by Ch$ 17.5 billion. Additionally, El Chocón’s physical electricity generation increased 13.6% resulting in a reduction in electricity purchases by Ch$ 3.8 billion which mostly explains the 30.7% decrease in its procurement and service costs. (See “Item 4. Information on the Company — B. Business Overview — Electricity Industry Regulatory Framework — Argentina — Regulatory Developments” for further detail).
In Colombia, operating expenses in the generation business increased by 7.8% in 2014 primarily due to a Ch$ 16.2 billion, or 72.7%, increase in other variable procurement and service costs as a consequence of expenses related to environmental royalties and other technical support services. Additionally, transportation expenses increased by 15.1%, or Ch$ 9 billion, as a result of higher sales to non-regulated market.
In Peru, operating expenses increased by 40.7% due to a Ch$ 14.1 billion higher fuel costs as a consequence of a 6.5% higher thermal generation as a result of the unavailability of some relevant generation units of the Peruvian system during the period; Ch$ 13.4 billion higher energy purchases in the spot market, and Ch$ 12.1 billion higher transportation expenses related to higher toll costs.
Selling and Administrative Expenses
Selling and administrative expenses relate to salaries, compensation, administrative expenses, depreciation, amortization and impairment losses, and office materials and supplies.
The following table shows the breakdown of our combined selling and administrative expenses, as a percentage of total combined selling and administrative expenses, for the years ended December 31, 2014 and 2013:
| | | | | | | | |
| | | Year ended
December 31, | |
| | | 2014 | | | 2013 | |
| | | (in %) | |
Selling and Administrative Expenses as a Percentage of Total Selling and Administrative Expenses | | | | |
Other fixed costs | | | 26.9 | | | | 25.3 | |
Staff benefit costs | | | 25.7 | | | | 24.9 | |
Depreciation, amortization and impairment losses | | | 47.4 | | | | 49.8 | |
| | | | | | | | |
Total | | | 100.0 | | | | 100.0 | |
| | | | | | | | |
The table below sets forth the breakdown of selling and administrative expenses by geographical location for the years ended December 31, 2014 and 2013:
| | | | | | | | | | | | |
| | | Year ended December 31, | |
| | | 2014 | | | 2013 | | | Change | |
| | | (in millions of Ch$) | | | (in %) | |
Selling and administrative expenses | | | | | | | | | | | | |
Argentina | | | 62,106 | | | | 60,036 | | | | 3.4 | |
Colombia | | | 83,538 | | | | 71,091 | | | | 17.5 | |
Peru | | | 78,902 | | | | 76,535 | | | | 3.1 | |
Chile | | | 760 | | | | 709 | | | | 7.1 | |
Combined adjustments | | | (2,035 | ) | | | (461 | ) | | | n.a. | |
| | | | | | | | | | | | |
Total selling and administrative expense | | | 223,271 | | | | 207,911 | | | | 7.4 | |
| | | | | | | | | | | | |
104
Selling and administrative expenses increased by Ch$ 15.4 billion in 2014.
In Colombia, selling and administrative expenses increased from Ch$ 71.1 billion in 2013 to Ch$ 83.5 billion in 2014, mainly as a result of Ch$ 6.2 billion higher charges of depreciation and amortization and of Ch$ 4.3 billion higher other fixed operating expenses due to accounting reclassifications and expenses related to the El Quimbo project coupled with higher payroll expenses related to the same project. In Argentina, selling and administrative expenses rose by 3.4% compared to 2013, primarily due to Ch$ 6.9 billion of higher payroll expenses mostly due to salary increases during the year.
Operating Margin
The following is our operating margin by geographical location for the years ended December 31, 2014 and 2013:
| | | | | | | | |
| | | Year ended
December 31, | |
| | | 2014 | | | 2013 | |
| | | (in %) | |
Operating margin | | | | |
Argentina | | | 26.6 | | | | 26.6 | |
Colombia | | | 59.7 | | | | 56.9 | |
Peru | | | 39.9 | | | | 39.5 | |
Chile | | | 85.3 | | | | 77.1 | |
| | | | | | | | |
Total operating margin | | | 51.3 | | | | 48.6 | |
| | | | | | | | |
Our operating margin, or operating income as a percentage of revenues, a measure of efficiency, increased to 51.3% in 2014 from 48.6% in 2013, mainly due to higher operating margins in Colombia.
The Colombian improvement in efficiency was mainly a result of Ch$ 113.9 billion increase in revenues due to higher average sale prices, coupled with decreased operating costs of Ch$ 15.9 billion due to greater hydro generation.
Operating Income
The following table summarizes operating income by geographical location for the years ended December 31, 2014 and 2013:
| | | | | | | | | | | | |
| | | Year ended December 31, | |
| | | 2014 | | | 2013 | | | Change | |
| | | (in millions of Ch$) | | | (in %) | |
Operating income | | | | |
Argentina | | | 27,955 | | | | 34,928 | | | | (20.0 | ) |
Colombia | | | 449,533 | | | | 363,993 | | | | 23.5 | |
Peru | | | 141,158 | | | | 112,192 | | | | 25.8 | |
Chile | | | 4,401 | | | | 2,393 | | | | 83.9 | |
| | | | | | | | | | | | |
Total operating income | | | 623,047 | | | | 513,506 | | | | 21.3 | |
| | | | | | | | | | | | |
Our combined operating income was Ch$ 623.0 billion in 2014 or 21.3% higher than the Ch$ 513.5 billion reported in 2013. This increase was mostly a consequence of higher average electricity sale prices in both Colombia and Peru. This increase was partially offset by Ch$ 19.4 billion greater transportation costs mainly in Peru and Colombia, coupled with Ch$ 14.3 billion greater other procurement and service costs, mostly in Colombia and Ch$ 4.5 billion greater fuel cost, as a consequence of higher fuel consumption mainly in Peru by Ch$ 14.0 billion.
105
Other Results
The following table sets forth certain information regarding our combined other results for the years ended December 31, 2014 and 2013:
| | | | | | | | | | | | |
| | | Year ended December 31, | |
| | | 2014 | | | 2013 | | | Change | |
| | | (in millions of Ch$) | |
Financial results | | | | |
Financial income | | | 93,967 | | | | 15,137 | | | | n.a. | |
Financial costs | | | (65,211 | ) | | | (66,695 | ) | | | (2.2 | ) |
Foreign currency exchange differences | | | (20,193 | ) | | | (11,577 | ) | | | (74.4 | ) |
| | | | | | | | | | | | |
Total | | | 8,564 | | | | (63,135 | ) | | | 113.6 | |
| | | |
Other | | | | | | | | | | | | |
Share of the profit of investments accounted for using the equity method | | | 61,598 | | | | 95,038 | | | | (35.2 | ) |
Net income from other investments | | | 668 | | | | 726 | | | | (7.9 | ) |
Net income from sales of assets | | | 82 | | | | 118 | | | | (30.4 | ) |
| | | | | | | | | | | | |
Total | | | 62,348 | | | | 95,882 | | | | (35.0 | ) |
| | | | | | | | | | | | |
Total other results | | | 70,912 | | | | 32,747 | | | | 116.6 | |
Financial Results
Our net financial results in 2014 was a gain of Ch$ 8.6 billion compared to an expense of Ch$ 63.1 billion in 2013. This improvement was mainly due to a Ch$ 78.8 billion increase in financial income primarily as a result of renegotiating of the terms of Costanera’s debt with Mitsubishi Corporation (“MC”) in October 2014, which resulted in US$ 107 million in higher financial income, including principal and interest. In accordance with the terms, MC forgave accrued interest of US$ 66 million as of September 30, 2014. For more information see Note 28 of the Notes to our combined financial statements.
Share of the profit of investments accounted for using the equity method
Our share of the net profits of investments accounted for under the equity method totaled Ch$ 61.6 billion as of December 2014, a 35.2% decrease compared to 2013. This decrease was mostly explained by Ch$ 32.2 billion lower net income from Enel Brasil caused by reduced profits from distribution and generation companies mainly due to the drought that has affected Brazil since 2012. For more information see Note 11 of the Notes to our combined financial statements.
Corporate Income Tax
Corporate income tax expenses increased by 21.5%, to Ch$ 204.1 billion, when compared to 2013, as a result of increased tax base in Colombia of Ch$ 11.5 billion and Ch$ 14.3 billion higher deferred taxes in Argentina related to Costanera’s debt renegotiation with MC.
The tax effective rate was 29.4% in 2014 and 30.7% in 2013. For more information see Note 29 of the Notes to our combined financial statements.
106
Net Income
The following table sets forth our combined net income before tax, income tax and net income for the years ended December 31, 2014 and 2013:
| | | | | | | | | | | | |
| | | Year ended December 31, | |
| | | 2014 | | | 2013 | | | Change | |
| | | (in millions of Ch$) | | | (in %) | |
Net income before tax | | | 693,959 | | | | 546,252 | | | | 27.0 | |
Income tax | | | (204,051 | ) | | | (167,912 | ) | | | 21.5 | |
| | | | | | | | | | | | |
Net income | | | 489,908 | | | | 378,340 | | | | 29.5 | |
Net income attributable to the parent company | | | 220,155 | | | | 180,784 | | | | 21.8 | |
Net income attributable to non-controlling interest | | | 269,753 | | | | 197,557 | | | | 36.5 | |
For a breakdown of the net income by geographical area, see Note 30 of the Notes to our combined financial statements.
| B. | Liquidity and Capital Resources. |
The following discussion of cash sources and uses reflects the key drivers of our cash flow.
We, on a stand-alone basis, will receive cash inflows from our foreign combined entities, as well as from related companies outside of Chile. Foreign combined entities and associates’ cash flows may not be available to satisfy our own liquidity needs, mainly because they are not wholly-owned, and because there is a time lag before we have effective access to those funds through dividends or capital reductions. However, we believe that cash flow generated from our business operations, as well as cash balances, borrowings from commercial banks, and ample access to both foreign and Chilean capital markets are sufficient to satisfy all of our needs for working capital, expected debt service, dividends and planned capital expenditures in the foreseeable future.
We have the following economic interests in our combined entities: 62.5% in our Peruvian combined entity, Edegel; 75.7% in our Argentine combined entity, Costanera; 65.4% in our Argentine combined entity, El Chocón; and 26.9% in our Colombian combined entity, Emgesa. We also hold 56.4% of Emgesa’s voting rights as a result of a transfer of voting rights from Enersis and we are allowed to appoint the majority of the Board members pursuant to a shareholders’ agreement. We therefore control Emgesa. For more information on our control and combination of Emgesa, see “— A. Operating Results. — 1. Discussion of Main Factors Affecting Operating Results and Financial Condition of the Company.” above.
Set forth below is a summary of our combined cash flow information for the periods indicated:
| | | | | | | | | | | | | | | | |
| | | Nine months ended
September 30, | | | Year ended
December 31, | |
| | | 2015 | | | 2014 | | | 2014 | | | 2013 | |
| | | (in billions of Ch$) | |
Net cash flows from (used in) operating activities | | | 335 | | | | 399 | | | | 568 | | | | 395 | |
Net cash flows from (used in) investing activities | | | (186 | ) | | | (152 | ) | | | (137 | ) | | | (119 | ) |
Net cash flows from (used in) financing activities | | | (282 | ) | | | (230 | ) | | | (394 | ) | | | (218 | ) |
| | | | | | | | | | | | | | | | |
Net increase (decrease) in cash and cash equivalents before effect of exchange rates changes | | | (133 | ) | | | 17 | | | | 38 | | | | 59 | |
Effects of exchange rate changes on cash and cash equivalents | | | 2 | | | | 14 | | | | (25 | ) | �� | | (4 | ) |
Cash and cash equivalents at beginning of period | | | 298 | | | | 286 | | | | 286 | | | | 231 | |
| | | | | | | | | | | | | | | | |
Cash and cash equivalents at end of period | | | 167 | | | | 317 | | | | 298 | | | | 286 | |
| | | | | | | | | | | | | | | | |
107
For the nine months ended September 30, 2015, net cash flow from operating activities was Ch$ 335 billion, a decrease of Ch$ 63 billion, or 15.9%, compared to Ch$ 399 billion for the same period of 2014, primarily as a consequence of a decrease in collections from the sale of goods and services of Ch$ 78 billion mainly in Colombia, which contributed with Ch$ 89 billion less collections. Emgesa’s decrease is a consequence of an unfavorable translation effect of converting Colombian pesos into Chilean pesos, which resulted in a 16.1% decline in operating cash flows of our Colombian combined entity in Chilean pesos for the first nine months of 2015 as compared to the same period in 2014. Although Emgesa increased its physical sales by 705 GWh compared to the same period in 2014, and Argentina and Peru’s revenues rose by 33.3% and 7.3% respectively, these increases were not enough to offset the effect of the exchange rate that affected the Colombian peso, mainly because Colombian collections represent 56% of Endesa Américas’ collections. Additionally, the decrease of the net cash flow from operating activities was a result of an increase of Ch$ 15 billion in income taxes paid mainly in Colombia as a result of increased sales. This decrease was partially offset by an increase in other collections from operating activities of Ch$ 24 billion mainly in Peru related to the rental of hydraulic facilities to Egehuanza, an unrelated company.
For the year ended December 31, 2014, net cash flow from operating activities was Ch$ 568 billion, an increase of Ch$ 173 billion, or 43.6%, compared to net cash flow from operating activities of Ch$ 395 billion for 2013, primarily as a consequence of an increase in collections from the sale of goods and services of Ch$ 183 billion, comprised of Ch$ 122 billion from Colombia, mainly due to an increase in energy sales, as a consequence of 19.6% higher average sale prices and Ch$ 88 billion from Peru as a consequence of an 8.5% increase in the average electricity sales price expressed in Chilean pesos and a 4.7% increase in energy sales. This increase was partially offset by an increase of Ch$ 18 billion in income taxes paid, comprised of Ch$ 15.7 billion from Peru and Ch$ 5.4 billion from Colombia , in both cases as a consequence of increased energy sales.
For the nine months ended September 30, 2015, net cash used in investment activities was Ch$ 186 billion, compared to net cash used in investment activities of Ch$ 152 billion for the same period of 2014. The increase was mostly explained by the acquisition of property, plant and equipment of Ch$ 216 billion, mainly at Emgesa and Edegel (see “Item 4. Information of the Company — A. History and Development of the Company — Investment, Capital Expenditures and Divestitures”), partially offset by proceeds from investments in time deposits with a maturity greater than 90 days of Ch$ 19 billion, interest received of Ch$ 5 billion and collections from derivatives contracts of Ch$ 5 billion.
For the year ended December 31, 2014, net cash used in investment activities was Ch$ 137 billion, compared to net cash used in investment activities was Ch$ 119 billion for 2013. The increase was mostly due to the acquisition of property, plant and equipment of Ch$ 266 billion, mainly at Emgesa and Edegel (see “Item 4. Information of the Company — A. History and Development of the Company — Investment, Capital Expenditures and Divestitures”) and investments in time deposits with a maturity greater than 90 days of Ch$ 20 billion. This was partially offset by proceeds from dividends classified as investment cash flow of Ch$ 126 billion, interest received of Ch$ 10 billion and collections from futures contracts, forward, options and swaps of Ch$ 8 billion.
For the nine months ended September 30, 2015, cash used for financing activities was Ch$ 282 billion. The main drivers of this change are described below.
The aggregate cash outflows from financing activities were primarily due to:
| | • | | Ch$ 261 billion in dividend payments (including Ch$ 108 billion for Endesa Américas on a stand-alone basis, Ch$ 128 billion for Emgesa, excluding dividends paid to us and Ch$ 25 billion for Edegel, excluding dividends paid to us). |
| | • | | Ch$ 218 billion of payments of loans and bonds (Ch$ 119 billion for Emgesa, Ch$ 87 billion for Edegel and Ch$ 10 billion for El Chocón, among others). |
| | • | | Ch$ 72 billion of interest expense (including Ch$ 62 billion for Emgesa and Ch$ 5 billion for Edegel, among others). |
108
These outflows were offset by cash inflows primarily due to:
| | • | | Ch$ 211 billion in loans incurred by Emgesa. |
| | • | | Ch$ 43 billion in loans incurred by Edegel. |
| | • | | Ch$ 10 billion in loans incurred by El Chocón. |
| | • | | Ch$ 14 billion of net investment of parent companies. |
For the nine months ended September 30, 2014, cash used for financing activities was Ch$ 230 billion. The main drivers of this change are described below.
The aggregate cash outflows from financing activities were primarily due to:
| | • | | Ch$ 225 billion in dividend payments (including Ch$ 90 billion for Endesa Américas on a stand-alone basis, Ch$ 107 billion for Emgesa, excluding dividends paid to us and Ch$ 28 billion for Edegel, excluding dividends paid to us). |
| | • | | Ch$ 73 billion of payments of loans (including Ch$ 40 billion for Emgesa and Ch$ 26 billion for Edegel, among others). |
| | • | | Ch$ 71 billion of interest expense (including Ch$ 58 billion for Emgesa and Ch$ 6 billion for Edegel, among others). |
| | • | | Ch$ 54 billion of net investment of parent companies. |
These outflows were offset by cash inflows primarily due to:
| | • | | Ch$ 165 billion in bond issuances by Emgesa. |
| | • | | Ch$ 33 billion in loans incurred by Edegel on a consolidated basis. |
For the year ended December 31, 2014, cash used for financing activities was Ch$ 394 billion. The main drivers of this change are described below.
The aggregate cash outflows from financing activities were primarily due to:
| | • | | Ch$ 274 billion in dividend payments (including Ch$ 90 billion for Endesa Américas on a stand-alone basis, Ch$ 153 billion for Emgesa, excluding dividends paid to us and Ch$ 31 billion for Edegel, excluding dividends paid to us). |
| | • | | Ch$ 142 billion of net investment of parent companies. |
| | • | | Ch$ 86 billion of payments of loans (including Ch$ 40 billion for Emgesa, Ch$ 25 billion for Edegel and Ch$ 10 billion for Chinango, among others). |
| | • | | Ch$ 83 billion of interest expense (including Ch$ 66 billion for Emgesa, Ch$ 5 billion for El Chocón and Ch$ 7 billion for Edegel, among others). |
These outflows were offset by cash inflows primarily due to:
| | • | | Ch$ 165 billion in bond issuances by Emgesa. |
| | • | | Ch$ 33 billion in loans incurred by Edegel on a consolidated basis. |
For the year ended December 31, 2013, cash used by financing activities was Ch$ 218 billion. The main drivers of this change are described below.
109
The aggregate cash outflows from financing activities were primarily due to:
| | • | | Ch$ 255 billion in dividend payments (including Ch$ 84 for Endesa Américas on a stand-alone basis, Ch$ 146 billion for Emgesa, excluding dividends paid to us and Ch$ 24 billion for Edegel, excluding dividends paid to us). |
| | • | | Ch$ 66 billion of interest expense (including Ch$ 51 billion for Emgesa and Ch$ 8 billion for Edegel, among others). |
| | • | | Ch$ 41 billion of payments of loans for El Chocón and Edegel. |
| | • | | Ch$ 32 billion of net investment of parent companies. |
These outflows were offset by cash inflows primarily due to:
| | • | | Ch$ 149 billion in bond issuances by Emgesa. |
| | • | | Ch$ 11 billion in capital increase by Costanera. |
| | • | | Ch$ 20 billion in loans incurred by El Chocón. |
For a description of liquidity risks resulting from the inability of our combined entities to transfer funds, please see “Item 3. Key Information — D. Risk Factors — Risks Related to Our Business — We depend in part on payments from our combined entities, jointly-controlled entities and associates to meet our payment obligations.”
We coordinate the overall financing strategy of our controlled combined entities. Our operating combined entities independently develop capital expenditure plans and finance their capital expansion programs through internally generated funds or direct financings. Endesa Américas, on a stand-alone basis, has no legal obligations or other commitments to financially support our combined entities. Endesa Américas, on a stand-alone basis, also does not have any debt agreements that includes cross default provisions that could be triggered by any Argentine or any other combined entity’s default and therefore is not affected by a default by any combined entity. For information regarding our commitments for capital expenditures, see “Item 4. Information on the Company — A. History and Development of the Company — Investments, Capital Expenditures and Divestitures” and our contractual obligations table set forth below.
Having stated our corporate policy in connection with the financial autonomy that we expect from our combined entities, we have in the recent past, and to a very limited extent, provided financial support in Argentina in the form of intercompany loans and capital contributions in which debt was capitalized. We have also guaranteed a loan with a third party for an immaterial amount. Most of the loans have been provided by our wholly-owned investment vehicle, Endesa Argentina S.A., using local funds such as dividends from other Argentine combined entities.
Additionally, information about our participation in Costanera’s 2013 capital increase can be found later in this section, and information regarding our structured loans to Costanera can be found in “Item 7— Major Shareholders and Related Party Transactions — B. Related Party Transactions.”
We believe that the level of such financial support is insignificant in the context of our combined financial statements taken as a whole. The fundamental drivers of such limited support are recent regulatory changes implemented by Argentine authorities, such as Resolution 95, 529 and 482, and our expectation that our Argentine long-lived assets will eventually be appropriately recovered by free cash flows arising from new and more favorable electricity sector regulations.
To the extent there may be positive market signals regarding regulatory improvements which allow us to forecast favorable effects on our Argentine combined entities’ operating results, we may continue to evaluate additional, temporary and exceptional financial support (primarily in the form of intercompany loans) on a case by case basis, as described in this context.
110
After completion of the Spin-Off, we will have American Depositary Shares which we intend to list and trade on the NYSE and may in the future continue to access the international equity capital markets (including SEC-registered ADS offerings). We may also issue bonds in the United States (“Yankee Bonds”) depending on our liquidity needs.
The following table lists Emgesa’s bonds issued in the United States and the aggregate principal amount outstanding as of September 30, 2015. The bonds are denominated in Colombian pesos. The annual interest rate is 10.17%.
| | | | | | | | | | | | | | | | | | | | | | | | |
Issuer | | Term | | | Maturity | | | Coupon (inflation
-adjusted rate) | | | Aggregate Principal Amount | |
| | | | | Issued | | | Outstanding | |
| | | | | | | | | (%) | | | (in billions of CP$) | | | (in billions of CP$) | | | (in billions of Ch$)(1) | |
Emgesa | | | 10 years | | | | January 2021 | | | | 10.17 | | | | 737 | | | | 737 | | | | 165 | |
| (1) | Calculated based on the Observed Exchange Rate as of September 30, 2015, which was CP$ 4.4681 per Ch$ 1.00. |
We will have access to the Chilean domestic capital markets, as well the markets of our combined entities in the four countries in which we have investments, where our combined entities have issued debt instruments including commercial paper and medium and long-term bonds that are primarily sold to pension funds, life insurance companies and other institutional investors.
The following table lists local bonds issued by our combined entities that are outstanding as of September 30, 2015. We present aggregate information for each company. The maturity column for each company reflects the issuance with the longest maturity, and the coupon rate corresponds to the weighted average coupon of all issuances for each company.
| | | | | | | | | | | | |
Issuer | | Maturity | | | Coupon(1) | | | Aggregate Principal
Amount Outstanding | |
| | | | | | (%) | | | (in billions of Ch$) | |
Edegel | | | January 2028 | | | | 6.43 | | | | 51 | |
Emgesa | | | May 2030 | | | | 9.49 | | | | 526 | |
| | | | | | | | | | | | |
Total | | | | | | | | | | | 577 | |
| | | | | | | | | | | | |
| (1) | Many of the coupon rates are variable rates based on local indexes, such as inflation. The table reflects the coupon rate taking into account each local index as of September 30, 2015. |
We may also participate in the international commercial bank markets through syndicated senior unsecured loans, including both fixed term and revolving credit facilities.
We may also borrow from banks in the Chilean market under fully committed facilities and from uncommitted local bank facilities with approved lines of credit. Our foreign combined entities also have access to uncommitted local bank facilities, for a total amount of Ch$ 109 billion, none of which we currently draw upon.
We expect to be able to tap the Chilean commercial paper market under programs that need to be registered with the Chilean SVS. Finally, our foreign combined entities also have access to other types of financing, including governmental facilities, supplier credit and leasing, among others.
As of September 30, 2015, Endesa Américas, on a stand-alone basis, had no debt obligations and is therefore not affected by any covenants or events of default. As of September 30, 2015 and as of the date of this information statement, our combined entities are in compliance with the financial covenants contained in our combined debt instruments with the exception of our Argentine combined entity, El Chocón.
111
As of December 31, 2014, March 31, 2015, June 30, 2015 and September 30, 2015, El Chocón did not meet an interest coverage ratio test (EBITDA to interest expense) pursuant to a covenant requirement under a loan agreement with Standard Bank, Deutsche Bank and Itaú that matures in February 2016. Consequently, such debt, has been classified as a current liability. El Chocón has experienced difficulties in meeting this requirement several times in the past and has obtained waivers of compliance from its lenders. As of the date of this information statement, El Chocón has not been able to reach an agreement with the lenders for the granting of a waiver for the default. However, El Chocón has not received acceleration notices for its most recent failure to comply with the ratio. If the lenders decide to declare an event of default and accelerate the loan, US$ 7.5 million of principal and interest would become immediately due and payable under this facility. Because of cross-acceleration provisions of El Chocón’s other loans, an additional Ch$ 7 billion would also be accelerated and El Chocón would be required to enter into bankruptcy. Payment defaults and bankruptcy proceedings of any Argentine or any other combined entity have no material financial effect on us as we, on a stand-alone basis, do not have any debt agreements that includes cross default provisions that could be triggered by any Argentine or other combined entity’s default. However, as of September 30, 2015, El Chocón has cash and cash equivalents in an amount of Ch$ 9.4 billion. El Chocón expects to pay its liabilities with cash generated from its operations and funds borrowed under existing or new loan facilities.
As is customary for certain credit and capital market debt facilities, a significant portion of our combined entities’ financial indebtedness is subject to cross default provisions. Each of the revolving credit facilities described above, have cross default provisions with different definitions, criteria, materiality thresholds, and applicability as to the combined entities that could give rise to a cross default.
With the exception of our Argentine combined entities, our companies have access to existing credit lines sufficient to satisfy all of their present working capital needs. Access to the capital markets on the part of our Argentine combined entities has been very limited due to the difficult financial situation still prevailing in Argentina (particularly in the utilities sector) since 2002, the poor capital markets environment due to the shortage of off-shore financing, the nationalization of the pension fund system and, in general, higher risk associated with lending to Argentine utilities as a consequence of the regulatory framework. Notwithstanding these unusual circumstances, these combined entities were still able to refinance debt maturing in 2015.
Payment of dividends and distributions by our combined entities and affiliates represent an important source of funds for us. The payment of dividends and distributions by certain combined entities and affiliates are subject to legal restrictions, such as legal reserve requirements, and capital and retained earnings criteria, and other contractual restrictions. Legal counsel in the countries where our combined entities and affiliates operate have informed us of the current legal restrictions regarding the payment of dividends or distributions to us in the jurisdictions where such combined entities or affiliates are incorporated. We are currently in compliance with the legal restrictions, and therefore, they currently do not affect the payment of dividends or distributions to us. Certain credit facilities and investment agreements of our combined entities restrict the payment of dividends or distributions in certain special circumstances. For a description of liquidity risks resulting from our company status, see “Item 3. Key Information — D. Risk factors — Risks Related to Our Business — We depend in part on payments from our combined entities, jointly-controlled entities and associates to meet our payment obligations.”
Our estimated capital expenditures for 2016 through 2020 amount to Ch$ 759 billion, of which Ch$ 560 billion are considered as non-discretionary investments. We include maintenance capital expenditures as non-discretionary because it is important for us to maintain the quality and operation standards required for our facilities, but we do have some flexibility regarding the timing for these investments. We also consider the investments in expansion projects as non-discretionary expenditures. We consider the remaining Ch$ 199 billion as discretionary capital expenditures. The latter includes expansion projects that are still under evaluation, in which case we would undertake them only if deemed profitable.
112
Other than in Argentina, we do not currently anticipate liquidity shortfalls affecting our ability to satisfy the material obligations described in this information statement. We expect to be able to refinance our combined indebtedness as it becomes due, fund our purchase obligations outlined previously with internally generated cash and fund capital expenditures with a mixture of internally generated cash and borrowings.
Transactions that most significantly affected our combined entities’ liquidity during the nine months ended September 30, 2015 included:
| | • | | Emgesa: loans for Ch$ 211 billion to finance El Quimbo project and to cover cash needs. |
| | • | | Edegel: loan for Ch$ 43 billion to cover cash needs. |
Transactions that most significantly affected our combined entities’ liquidity for the nine months ended September 30, 2014 included:
| | • | | Emgesa: local bonds issuance for Ch$ 165 billion to finance El Quimbo project and to cover cash needs. |
| | • | | Edegel: loan for Ch$ 33 billion to cover cash needs. |
Transactions that most significantly affected our combined entities’ liquidity for the 2014 fiscal year included:
| | • | | Emgesa: local bond issuance for Ch$ 165 billion as explained above. |
| | • | | Edegel: loan for Ch$ 28 billion to cover cash needs. |
Transactions that most significantly affected our combined entities’ liquidity fir the 2013 fiscal year included:
| | • | | Costanera: capital increase for Ch$ 11 billion, of which 77% was subscribed by Endesa Chile, to support the capital structure of the company. |
| | • | | Emgesa: local bond issuance for Ch$ 149 billion to finance El Quimbo project. |
| | • | | El Chocón: syndicated loan with local banks for Ch$ 14 billion to refinance short term debt. |
| C. | Research and Development, Patents and Licenses, etc. |
None.
Our business is comprised of electricity generation assets, with combined entities and equity method investments engaged primarily in the generation of electricity in Argentina, Brazil, Colombia and Peru. Our businesses are subject to a wide range of conditions that may result in significant variability in our earnings and cash flows from year to year.
Our net income is principally the result of operating income from our generation business, and non-operating income including primarily income arising from related companies accounted for under the equity method and foreign currency exchange rate effects.
Our combined operating income combines the results of operations in the three countries (Argentina, Colombia and Peru) where we operate and is impacted by the combined effect of several factors, including our
113
contracted electricity prices, prevailing hydrological conditions, the price of fuels used to generate thermal electricity, contracted obligations, generation mix, and electricity prices prevailing in the spot market, among others. The combined effect of many, and sometimes all, of these factors impacts our operating income, which can be more or less favorable from year to year.
One of the main drivers of our results of operations is our sale prices and energy costs. Generally, the quantity of electricity sold has been relatively stable over time, with increases reflecting economic and demographic growth. Our profits from contracted sales are driven by the ability to generate or buy electricity at a cost lower than the contracted price. However, the applicable price for sales and purchases for electricity sold and purchased in the spot market is much harder to predict because the spot generation price is influenced by many factors, which can differ in each of the countries where we operate. In general, abundant hydrological conditions lower spot prices while dry conditions increase them. However, our operating income may not be impacted even when we are required to buy at high prices in the spot market if our commercial policy is appropriately managed. Our goal is to have a conservative and well-balanced commercial policy on a country by country basis, which aims at controlling relevant variables, provides stability to profits, and mitigates our exposure to the volatility of the spot market by contracting sales of a significant portion of our expected electricity generation through long-term electricity supply contracts. Our optimal level of electricity supply commitments is one that allows us to protect ourselves against low marginal cost conditions, such as those existing during the rainy season, while still taking advantage of high marginal cost conditions, such as higher spot market prices during dry years. In order to determine the optimal mix of long-term contracts and sales in the spot market: (i) we project our aggregate generation taking into consideration our generation mix, the incorporation of new projects under construction and a dry hydrology scenario, (ii) create demand estimates using standard economic theory, and (iii) forecast the system’s marginal cost using proprietary stochastic models. This commercial policy is not applicable in Argentina, since contracted sales are immaterial and our margin is strongly dependent on the regulatory framework, as explained further below.
International prices for fuel oil, coal and LNG also affect spot prices. Fuel prices affect our results since commodity prices directly impact generation costs of our thermal power plants, mainly in Peru. Commodity prices have materially decreased since the second half of 2014 and it is expected that this trend will continue until the end of 2016, when oil prices are expected to begin increasing. This trend will likely lower our costs, especially in our Peruvian power plants, which are primarily thermal plants. Our costs also depend on other factors such as our contractual surpluses/deficits. Other factors that affect operating income include transmission costs incurred when delivering electricity from its source to end consumers. In Colombia and Peru, transmission costs are mostly passed through to the customers and mainly depend on physical sales. The transmission system charge is set by the regulator, and have tended to remain stable over time. In Argentina, the transmission cost is mainly assumed by the market operator; therefore, it does not significantly affect generators’ operating income.
This general framework applies to most of the countries where we operate, but there are some variations in some of these factors. In Argentina, the electricity market is highly regulated and electricity prices are determined by CAMMESA, which is the sole seller for the fuel needed for thermal generation operations. This implies that market agents will not be allowed to trade commodities and, as a result, fuel and commodity prices do not have a direct impact on our Argentine operations, but may instead affect the electricity prices determined by CAMMESA.
In Colombia, more than 85% of our installed capacity is hydroelectric and electricity prices are therefore significantly affected by hydrological conditions. For our Colombian operations, fuel and commodity prices are not relevant factors because such prices are indexed to the local consumer price index (Indice de Precios al Productor or “IPP”) and contracted obligations are committed for periods of three to four years, which enables us to weather short-term trends and better achieve our projected costs, thereby reducing market risk exposure. Colombian electricity prices are very volatile because of the energy trading activity, which works on forecasts. For example, it could be affected by the expectation of El Niño’s arrival, which will increase prices (dry context). Our electricity supply contracts are not standardized and the terms and conditions of these contracts are
114
individually negotiated. Typically, when these contracts are negotiated, we try to set the price at a premium over future expected spot prices in order to mitigate the risk of future spot price increases. However, the premium can vary substantially depending on a variety of conditions.
In Peru, we also have long-term supply contract, but for longer periods (between 10 to 20 years). The proportion of contracted sales with regulated customers (distributors) has increased in relation to the non-regulated customers. This allows us to have consistent prices for longer periods, which combined with our conservative commercial policy, provides for our profitability.
We expect that during the next three years, regulated tariff rates for the three countries where we operate will remain fairly stable, without material changes.
Finally, operating results in each of the countries where we operate are first expressed in their own functional currencies and then are converted to Chilean pesos, the reporting currency used in our financial statements. As result of exchange rate effects, the operating results in Chilean pesos may differ significantly from those expressed in their own functional currencies. There may be cases in which we have a profit in local terms but a loss in Chilean accounting terms, and vice versa.
Based on the next 12 months’ forward rates available on Bloomberg, we do not anticipate significant impacts on results when converting Peruvian nuevo sols and Colombian pesos to Chilean pesos. However, the conversion of results from Argentine pesos to Chilean pesos may result in a loss in terms of Chilean pesos. We expect that the Argentine peso will devalue at a faster rate than the Chilean peso.
For more detail on how each of these factors impacts the net income of our electricity generation business, see “Item 5. Operating and Financial Review and Prospects—A. Operating Results—1. Discussion of Main Factors Affecting Operating Results and Financial Condition of the Company.”
We expect reasonably good operating performance during the coming years given the favorable macroeconomic perspective for all of the countries in which we have investments. Despite current uncertainties concerning the global economy, there are favorable expectations for growth during the next five years. The expected growth in gross domestic product in 2015 of Argentina, Brazil, Colombia and Peru are, 0.7%, -2.6%, 2.9% and 2.8%, respectively. These percentages are based on Latin American Consensus Forecasts published by Consensus Economic Inc. on September 14, 2015, and stable electricity demand growth is expected.
On the other hand, development of new generation facilities in South America has always lagged behind demand growth. We anticipate that this tendency will continue for the foreseeable future. Also, due to growing environmental restrictions, transmission line saturation, obstacles for fuel transportation, and scarcity of places where to locate plants, these new projects involve higher development costs than in the past. Enel, our ultimate controller both before and after the Spin-Off, has announced that it will no longer build coal power plants because it considers the technology to be obsolete, and the company expects to be carbon neutral by 2050. Eventually, Enel would like to also eliminate natural gas power plants because of the CO2 costs and current carbon capture and storage technology is not economically viable.
We expect that average electricity prices will rise to recognize these higher costs. This could increase the value of our assets, especially in the case of hydroelectric power plants, which have lower production costs, and thus have greater profitability in scenarios of increasing prices to end users. Furthermore, an important part of the new installed capacity under development in the four countries in which we have investments corresponds to thermal power plants, with coal and natural gas as their principal fuels. We expect this situation will also impact long term spot prices positively. Long-term contracts awarded to us in different bids, directly and through our combined entities, have already incorporated these expected price levels. Currently, 16.2% of our expected annual generation is sold under contracts with terms of at least ten years and an additional 29.8% under contracts with terms of at least five years.
115
In order to mitigate the risk of increasing fuel costs, we have entered into supply contracts to cover part of the fuel needed to operate the thermal generation units, which operate with coal, natural gas, diesel, and fuel oil. This is becoming more important as there is an increasing trend to penalize fuel intensive technologies, such as coal and diesel, which have greater environmental impacts.
Although having combined operations in three countries and our equity interests in Brazil allows us to somewhat offset and counterbalance variations with respect to the main factors that can affect our operating results, we cannot claim that our portfolio of assets is fully hedged. Furthermore, there can be no assurance that past performance will be indicative of future performance with respect to our business. Any significant change with respect to hydrological conditions, fuel or electricity prices, among other factors, could affect our operating income in the generation business. More broadly, any significant change with respect to economic or population growth, as well as changes in the regulatory regimes in the countries in which we operate, among other factors, could affect our operating income. Variability in our earnings and cash flows can also arise from non-operating factors as well, such as foreign currency exchange rates. For further information regarding our 2015 results compared with those recorded in previous periods, please see “— A. Operating Results — Results of Operations for the nine months ended September 30, 2015 and 2014” and “— A. Operating Results — Results of Operations for the Years Ended December 31, 2014 and 2013.” Investors should not look at our past performance as indicative of future performance.
We expect that we will continue generating substantial operating cash, which can be used to finance a significant part of our capital expenditure plan. If needed, our shareholders can also decrease the dividend payout ratio, subject to certain minimum legal restrictions, in order to finance our investment plan and future growth.
In order to be more responsive to the concerns of the residents living in the surrounding areas of prospective new sites, we have shifted our focus to building smaller, less invasive power plants. These plants are constructed faster, allow greater flexibility to activate or deactivate according to system needs, and are generally more acceptable to residents. The local population will be involved in the planning stages of any future projects.
| E. | Off-balance Sheet Arrangements. |
We are not a party to any off-balance sheet arrangements.
116
| F. | Tabular Disclosure of Contractual Obligations. |
The table below sets forth our cash payment obligations as of December 31, 2014:
| | | | | | | | | | | | | | | | | | | | |
| | | Payments due by Period | |
Cash payment obligation | | Total | | | 2015 | | | 2016-2017 | | | 2018-2019 | | | After 2019 | |
| | | (in billions of Ch$) | |
Bank debt | | | 191 | | | | 33 | | | | 80 | | | | 37 | | | | 41 | |
Local bonds(1) | | | 708 | | | | 67 | | | | 55 | | | | 163 | | | | 423 | |
Yankee Bonds(1) | | | 187 | | | | — | | | | — | | | | — | | | | 187 | |
Other debt(2) | | | 40 | | | | 4 | | | | 11 | | | | 1 | | | | 24 | |
Interest expense(3) | | | 770 | | | | 65 | | | | 118 | | | | 114 | | | | 474 | |
Pension and post-retirement obligations(4) | | | 283 | | | | 48 | | | | 80 | | | | 71 | | | | 84 | |
Purchase obligations(5) | | | 579 | | | | 105 | | | | 170 | | | | 139 | | | | 165 | |
Financial leases | | | 31 | | | | 9 | | | | 22 | | | | — | | | | — | |
| | | | | | | | | | | | | | | | | | | | |
Total contractual obligations | | | 2,789 | | | | 331 | | | | 536 | | | | 525 | | | | 1,398 | |
| | | | | | | | | | | | | | | | | | | | |
| (1) | Net value, hedging instruments included substantially modify the principal amount of debt. |
| (2) | Other debt includes governmental loan facilities, supplier credits and short-term commercial paper among others. |
| (3) | Interest expenses are the interest payments for all outstanding financial obligations, calculated as principal multiplied by the interest rate, presented according to when the interest payment comes due. |
| (4) | We have funded and unfunded pension and post-retirement benefit plans. Our funded plans have contractual annual commitments for contributions, which do not change based on funding status. Cash flow estimates in the table are based on such annual contractual commitments including certain estimable variable factors such as interest. Cash flow estimates in the table relating to our unfunded plans are based on future discounted payments necessary to meet all of our pension and post-retirement obligations. |
| (5) | Of the total contractual obligations of Ch$ 579 billion, 61% corresponds to miscellaneous services, such as LNG regasification, fuel transport, and coal handling, 34% corresponds to long term fuel supply contracts, and the remaining 5% to energy purchases. |
The information contained in the Items 5.E and 5.F contains statements that may constitute forward-looking statements. See “Forward-Looking Statements” in the “Introduction” of this information statement, for safe harbor provisions.
117
Item 6. Directors, Senior Management and Employees
| A. | Directors and Senior Management. |
Our initial Board of Directors consists of nine members who were elected for an interim term at the Extraordinary Shareholders’ Meeting (“ESM”) of the shareholders of Endesa Chile held on December 18, 2015 to hold office until the first Ordinary Shareholders’ Meeting (“OSM”) of the shareholders of Endesa Américas to be held in April 2016 (the “2016 OSM”). At the 2016 OSM, an entire Board of Directors consisting of nine members will be elected to a three-year term. Following the end of their term, they may be re-elected or replaced. If a vacancy occurs in the interim, the Board of Directors will elect a temporary director to fill the vacancy until the next OSM, at which time the entire Board of Directors will be elected to a new three-year term. Our Executive Officers are appointed and hold office at the discretion of the Board of Directors.
The business address of our current directors is c/o Endesa Américas S.A., Santa Rosa 76, Santiago, Chile.
| | | | | | |
Directors | | Position | | Held Since | |
Enrico Viale | | Chairman | | | 2016 | |
Ignacio Mateo M | | Vice Chairman | | | 2016 | |
Francesco Buresti | | Director | | | 2016 | |
Hernán Cheyre V | | Director | | | 2016 | |
Mauro Di Carlo | | Director | | | 2016 | |
Francesca Gostinelli | | Director | | | 2016 | |
Eduardo Novoa C. | | Director | | | 2016 | |
María Loreto Silva R | | Director | | | 2016 | |
Vittorio Vagliasindi | | Director | | | 2016 | |
At the Board of Directors meeting held on February 29, 2016, our interim Board of Directors agreed to appoint Mr.��Enrico Viale as Chairman of the Board of Directors, and Mr. Ignacio Mateo M. as the Vice Chairman. At the same meeting, it was agreed to appoint Ms. María Loreto Silva R., Mr. Eduardo Novoa C. and Mr. Hernán Cheyre V. as members of the Directors’ Committee. Additionally, Ms. Silva was appointed as Chairman of the Directors’ Committee and Mr. Cheyre as Financial Expert of the Directors’ Committee. At the Board of Directors meeting held on March 23, 2016, our interim Board of Directors ratified all appointments made on February 29, 2016.
Set forth below are brief biographical descriptions of our directors, of whom three reside in Chile and the rest in Europe.
Enrico Viale
Chairman of the Board of Directors
Mr. Viale is currently the Director of Enel’s Global Generation and Chairman of the Board of Directors of Endesa Chile. Mr. Viale joined Enel in 2003 as Country Manager for Southeastern Europe and has occupied diverse positions within Enel subsidiaries, such as Chief Executive Officer (“CEO”) of Enel Maritza East 3. Between 2008 and 2014, he served as Chief Operating Officer, managing Enel’s interest in OGK-5 and Rusenergosbyt, and supporting SeverEnergia’s upstream gas operations, before becoming Country Manager and CEO of Enel Russia. He began his career in 1986 at GIE, an Italian energy company. He was Vice Chairman of ABB, a global provider of power and automation technologies, for the Structure Finance business, a division that provided debt capital and equipment for projects, and asset-backed financing such as leasing. He was also Chief Financial Officer (“CFO”) of Ansaldo Energía, an Italian supplier, installer and service provider for power generation plants, among various finance positions. Mr. Viale holds a civil engineering degree with specialization in hydraulic engineering from the Polytechnic University of Turin (Turin, Italy) and an M.B.A. from University of Santa Clara Business School (California, USA). He has also taken training courses at Politecnico di Milano (Milan, Italy) and at the Massachusetts Institute of Technology (Massachusetts, USA).
118
Ignacio Mateo M.
Vice Chairman of the Board of Directors
Mr. Mateo has been the Director of Planning and Control of the Global Generation Business Division of Enel since 2010 and has served as a director and Vice Chairman of the Board of Directors of Endesa Chile since November 2014. Previously, he was Deputy Strategy Director, Head of Strategic Planning and Strategy Assistant Manager of Endesa Spain, as well as Corporate Development Director for Endesa Telecom, an Endesa Spain subsidiary, and Head of Endesa Spain’s International Cogeneration and Renewable Energy Division. His prior experience was as Head of the Environmental Department and Control Department Engineer of Unión Fenosa Generación (Spain). Mr. Mateo holds a mining engineering degree with specialization in energy and fuel and a Masters in Energy and Environment, both from Universidad Politécnica de Madrid (Madrid, Spain). He also holds an M.B.A. from the IESE Business School (Madrid, Spain).
Francesco Buresti
Director
Mr. Buresti currently serves as the Head of Enel’s Global Procurement. Mr. Buresti was a consultant in the industrial sector for Accenture, a multinational management consulting, technology services, and outsourcing company, and a consultant in the industrial and utilities sectors for McKinsey & Company, a management consulting firm. In 2005, Mr. Buresti joined Enel as Purchasing Director for the Grids and Market divisions. Between 2007 and 2012, Mr. Buresti was Director of Purchasing for Endesa, S.A. (Spain), after which he became Head of Global Procurement. He is also a member of the Board of Directors of several Enel subsidiaries, including Endesa Chile. Mr. Buresti holds a degree in electronics engineering from Università degli Studi di Bologna (Bologna, Italy).
Hernán Cheyre V.
Director, Member and Financial Expert of the Directors’ Committee
Mr. Cheyre served as a director and Vice Chairman of Empresa Nacional del Petróleo, a state-owned Chilean oil company and as Executive Vice Chairman of Production Development Corporation (CORFO), a Chilean governmental organization that supports entrepreneurship and innovation to improve productivity and economic growth, from March 2010 to March 2014. Mr. Cheyre also served as director of several private sector Chilean companies such as Telefónica Chile, Inmobiliaria Manquehue, Factorline, and Hipotecaria La Construcción. He was a founding partner of the consulting firm Econsult in 1985, and was the Chairman of the company until March 2010. Mr. Cheyre also held the position of CEO of the rating agency Duff and Phelps Chile between 1990 and 2000, and its successor Fitch Chile between 2000 and 2004. He held positions as teacher and as consultant for the World Bank and for foreign governments. Mr. Cheyre holds a degree in business administration from the Pontificia Universidad Católica de Chile (Santiago, Chile) and a Masters in economics with specialization in public finance and economic development from the University of Chicago (Illinois, USA).
Mauro Di Carlo
Director
Mr. Di Carlo currently serves as Head of Planning and Control in Enel’s Global Generation Business Line. He started his career at Enel in 2009 as Head of the Brief Terminals and Real Time Control Programming Unit at the Energy Management of the Global Generation Business Line Division and also served as Head of Performance in the Planning and Control Unit of the Global Generation Business Line Division in 2014. Prior to joining Enel, he worked at Interpower S.p.A., an Italian electric machinery company, from May 2001 to February 2003, where his main tasks were: management control and operational reporting, market analysis, development of auction systems as well as defining participation strategies in auctions for each company and the planning of short-, medium- and long-term. Mr. Di Carlo holds a degree in engineering from Università degli Studi di Cassino – Facoltà di Ingegneria (Cassino, Italy). Mr. Di Carlo has taken training courses for leadership in energy management at SDA Bocconi Milano (Milan, Italy) and IESE Business School (Barcelona, Spain).
119
Francesca Gostinelli
Director
Ms. Gostinelli is currently the Business Development Director in the Global Generation Business Line Division of Enel and a director of Endesa Chile. During 2014, she served as Enel’s Director of Business and Improvement of Operations in the International Division, as Business Development Director in the International Division from 2010 to 2014 and as International Regulation Director from September 2007 to December 2010. Ms. Gostinelli started working for Enel and its subsidiaries as an expert in Energy Management at Enel Produzione S.p.A. in July 2000 and during two years, was part of the team that managed the international trading and sale of energy in the open market. Ms. Gostinelli was previously a member of the Board of Directors of multiple Enel subsidiaries, including Enel Green Power, Enel Trade S.p.A., Enel OGK5, Enel France, Marcinelle Energie, Enel Energie and Enel Energie Muntenia and served as Supervisor of the Board of Slovénske Elektrarne. Prior to joining Enel, Ms. Gostinelli worked in Italy as Head of the Technical Department of the Public Agency for Energy and Environment (Perugia, Italy) and as part of the staff of the La Scuola Enrico Mattei (Milan, Italy). Ms. Gostinelli holds a degree in environmental engineering and a Masters in management and energy economy and environment from La Scuola Enrico Mattei (Milan, Italy), a graduate school specialized in international relations and the third world. Ms. Gostinelli has also participated in several training courses and programs in Milan, and in the United States at the German Marshall Fund (Washington D.C., USA) and at Harvard Business School (Massachusetts, USA).
Eduardo Novoa C.
Director and Member of the Directors’ Committee
Mr. Novoa is currently a member of the Board of Directors of several Chilean companies including Empresas Ecomac (a development and construction of real estate projects company), Cementos Bio-Bio S.A.(a construction materials company), Empresa de Servicios Sanitarios de los Lagos S.A (ESSAL, a company that provides drinking water and wastewater collection in southern Chile) and Tech Pack S.A. (a commodity chemicals company, producer of flexible packaging). Mr. Novoa previously was a member of the Board of Directors of Esval, a Chilean company engaged in the production and distribution of drinking water, from 2007 to 2009, Sociedad Química y Minera de Chile S.A. (Soquimich), a Chilean mining company, from 2008 to 2013, and Grupo Drillco, a Chilean company specialized in products and services for mining and drilling, from 2008 to 2014. Mr. Novoa also participated in several startups as a partner and/or investor (from 2007 to 2014). He was also the CEO of Grupo Saesa, a company engaged in the distribution of electricity in southern Chile between 2005 and 2007. From 2001 to 2005, he was Country Manager of PSEG, a generation and energy services company, in Chile, Chairman of Grupo Saesa, Vice Chairman of the Board of Directors of Grupo Chilquinta, director of Luz del Sur and Tecsur (both in Peru), and EdERSA (Argentina), and a member of the Audit Committees of each of these aforementioned electricity companies. Between 1999 and 2001, he was Development Director and a member of the Executive Committee of Grupo Melón in Chile. Previously, he held various positions in Enersis and subsidiaries, first as Director of Transelec, Aguas Cordillera, Distrilec, Coelce and Codensa, and later as Development Director. Mr. Novoa worked at CorpGroup where he held various positions as New Businesses Director of CorpGroup, Director at CorpVida and International Director at AFP Provida Internacional, among others. Mr. Novoa is also a member of the Advisory Council of Endeavor and a founding member of the investor network Chile Global Angels. Mr. Novoa holds a degree in business administration from the Universidad de Chile (Santiago, Chile) and an M.B.A. from the University of Chicago (Illinois, USA).
María Loreto Silva R.
Director and Chairman of the Directors’ Committee
Ms. Silva is currently a partner at the Chilean law firm Bofill Escobar Abogados, where she focuses on regulated markets, public works concessions, construction and conflict resolution related to the development of complex projects and those involving public entities. She has extensive experience in both the Chilean public and private
120
sectors. During the past two decades, she has been involved in the design of public policy and legislation in matters related to public works concessions, construction of infrastructure and water resources. She was appointed Deputy Minister of the Chilean Ministry of Public Works in 2010 and was appointed the Minister of the Chilean Ministry of Public Works in 2012. In the private sector, she was partner at the law firm Morales & Besa, and an attorney at Asociación de Concesionarios de Obras de Infraestructura Pública (COPSA) and the Chilean Chamber of Construction. She is a member of the Council of Infrastructure Policy, the Arbitration and Mediation Center of the Santiago Chamber of Commerce, Comunidad Mujer, an independent and inclusive organization, focusing on gender issues, and the Foundation Avanza Chile, a foundation whose main focus is to contribute to the discussion of ideas and policies to expand opportunities for all Chileans, among others. Ms. Silva also taught the Diplomat in Government Procurement of the Pontificia Universidad Católica de Chile, Local Government and Municipal Management Courses at the School of Economics and Business of the Universidad de Chile and the Master of Law program at the Universidad del Desarrollo. Ms. Silva received her law degree from the Universidad de Chile (Santiago, Chile).
Vitorrio Vagliasindi
Director
Mr. Vagliasindi is currently the Director of Engineering and Construction of Enel’s Global Generation Division and a member of the Board of Directors of Endesa Chile since November 2014. Previously, he worked in affiliated companies of Enel as Deputy Chief Executive of Operations and Engineering (Italy) and Head of Engineering and Construction of Enel Green Power, as well as Head of the Business area of Renewable Energies, Head of Coal and Orimulsion (a type of fuel) Plants and Head of Thermal Electric Generation at Enel Produzione (Sicily, Italy). He was Director of Torrevaldaliga Nord power plant and Sulcis di Portoscuso power plant, both located in Italy. Mr. Vagliasindi holds a degree in nuclear engineering from Università di Roma “La Sapienza” (Rome, Italy).
Executive Officers
Set forth are our Executive Officers appointed at a Board of Directors meeting held on February 29, 2016. Such appointments were ratified at a Board of Directors meeting held on March 23, 2016.
The business address of our Executive Officer is Endesa Américas S.A., Santa Rosa 76, Santiago, Chile.
| | | | |
Executive Officers | | Position | | Current Position
Held Since |
Valter Moro | | Chief Executive Officer | | 2016 |
Ramiro Alfonsín B. | | Chief Financial Officer | | 2016 |
Ignacio Quiñones S. | | General Counsel | | 2016 |
Set forth below are brief biographical descriptions of our Executive Officers, all of whom reside in Chile.
Valter Moro was appointed as Chief Executive Officer (“CEO”) of Endesa Américas in February 2016. Mr. Moro has been the CEO of Endesa Chile since November 2014 and will continue in that position after the Spin-Off. Mr. Moro has 18 years of experience working for Enel and its subsidiaries. He worked for ten years in generation installations and eight years in energy management activities in Italy, Spain and Chile. He was the Maintenance Manager and then the Generation Manager of Enel’s power plant in La Spezia (Italy), and Production Scheduling and Fuel Manager at Enel in Rome. He was later Energy Management Director of Enel Viesgo (Madrid, Spain) and worked in the Generation Energy Management Division as the Project Coordination Unit Manager, providing support to the Iberia and South American Group Divisions. Mr. Moro holds a mechanical engineering degree and a Ph.D. in energy engineering from Università Politécnica delle Marche (Ancona, Italy).
Ramiro Alfonsín B. was appointed as Chief Financial Officer (“CFO”) of Endesa Américas in February 2016. Mr. Alfonsín has been the Deputy Chief Executive Officer and CFO of Endesa Chile since April 2013 and
121
February 2015, respectively, and will continue in those positions after the Spin-Off. He joined Endesa S.A. (“Endesa Spain”) in June 2000. From 2004, he worked at Endesa Italy as Planning and Investment Manager and at Endesa Europe as Deputy Director of Investment and Corporate Relations. From 2007 to March 2013, he held the position of Regional Planning and Control Officer of Enersis. Before joining Endesa Spain, he worked as a Senior Financial Advisor at Banco Urquijo KBL group, a Spanish bank, in the Management of Corporate Development and Institutional Relations area at Alcatel, a telecom company and as an Associate in Corporate Banking at ABN AMRO Bank N.V., a Dutch bank. Currently, Mr. Alfonsín is Director of several subsidiaries of Endesa Chile in Chile, and of some of our combined entities in Argentina, Brazil, and Peru. Mr. Alfonsín holds a degree in business administration from Pontificia Universidad Católica de Argentina (Buenos Aires, Argentina).
Ignacio Quiñones S. was appointed as General Counsel of Endesa Américas in February 2016. Mr. Quiñones has been the General Counsel of Endesa Chile since November 2013 and will continue in that position after the Spin-Off. In 1989, he began his career as lawyer for Chilectra and served in such role until 1994. Between 1994 and 1996, he was a lawyer for Ingeniería y Construcción Sigdo Koppers S.A., a Chilean company related to construction and industrial assembly in a large scale. Between 1996 and 2004, he worked as a lawyer for Placer Dome Latin America, a mining company, and then as Legal Advisor for its affiliated company, Compañía Minera Zaldívar. Between 2004 and 2005, he was Head of the Legal area in Gasoducto del Pacífico S.A., a natural gas transport company. Between 2005 and 2013, he was the General Counsel in Chile for Anglo American Chile Limitada, a mining company. Mr. Quiñones studied law at Universidad Diego Portales (Santiago, Chile) and holds a law degree granted by the Chilean Supreme Court of Justice.
At the ESM held on December 18, 2015, the shareholders of Endesa Chile approved the compensation policy for our Board of Directors. Directors are paid a monthly fee depending on their attendance at Board meetings and their participation as director of any combined entities of Endesa Américas. Director compensation is similar to the current Endesa Chile’s compensation policy, which consists of a monthly fixed compensation of UF 174 and an additional fee of UF 84 per meeting, depending on attendance to Board meetings. The Chairman of the Board is entitled to double the compensation compared to other directors under this policy, while the Vice Chairman receives fixed compensation higher than the directors but lower than the Chairman. The members of the Directors’ Committee of Endesa Américas are paid a monthly fee of UF 58 and a fee of UF 28 depending on attendance to Directors’ Committee meetings with a limit of 12 sessions per year. In the case that a Director serves on one or more Board of Directors of the subsidiaries and/or related companies, nationals or foreigners, or serves as director of another companies or corporations, nationals or foreigners, in which the economic group holds directly or indirectly, an interest, can only receive compensation in one of these Boards of Directors. The Executive Officers of Endesa Américas and/or of our subsidiaries or related companies, nationals or foreigners, will not receive compensation in the case that they serve as Director of any subsidiaries, related companies or are affiliated in any way, nationals or foreigners of Endesa Américas.
Endesa Américas does not disclose, to its shareholders or otherwise, any information about an individual Executive Officer’s compensation. Executive Officers are eligible for variable compensation under a bonus plan for achieving company-wide objectives and for their individual contribution to Endesa Américas’ results and objectives. The annual bonus plan provides for a range of bonus amounts according to seniority level. The bonuses paid to Executive Officers consist of a certain multiple of gross monthly salaries.
Endesa Américas entered into severance indemnity agreements with all of its Executive Officers, pursuant to which it will pay severance indemnity in the event of voluntary resignation, termination by mutual agreement among the parties, or death. The severance indemnity does not apply if the termination is due to willful misconduct, prohibited negotiations, unjustified absences, abandonment of duties, among other causes, as defined in Article 160 of the Chilean Labor Code. All of Endesa Américas employees are entitled to legal severance pay if terminated due to the needs of Endesa Américas, as defined in Article 161 of the Chilean Labor Code.
122
Corporate Governance
Endesa Américas is managed by a Board of Directors in accordance with its by-laws. The Board initially consists of nine directors who were elected by shareholders of Endesa Chile at the ESM held on December 18, 2015 to hold office until the first OSM of the shareholders of Endesa Américas to be held in April 2016. At the 2016 OSM, the entire Board of Directors consisting of nine members will be elected to a three-year term. Following the end of their term, they may be re-elected or replaced. Directors can be re-elected indefinitely. Staggered terms are not permitted under Chilean law. If a vacancy occurs on the board during the three-year term, the Board of Directors may appoint a temporary director to fill the vacancy. Any vacancy triggers an election for every seat on the Board of Directors at the next OSM. Members of the Board of Directors do not have service contracts with Endesa Américas or with any of its combined entities that will provide them benefits upon termination of their service.
Chilean corporate law provides that a company’s Board of Directors is responsible for the management and representation of a company in all matters concerning its corporate purpose, subject to the provisions of the company’s by-laws and the stockholders’ resolutions.
Corporate governance policies of Endesa Américas are included in the following corporate policies or procedures: Manual for the Management of Information of Interest to the Market” (the “Manual”), the Code of Ethics and a Zero Tolerance Anti-Corruption Plan (“ZTAC Plan”), the Penal Risk Prevention Model, the “Guidelines 231: Guidelines applicable to non-Italian subsidiaries in accordance with Legislative Decree 231 of June 8, 2001” and procedures in compliance with General Regulation No. 385 issued by the SVS.
In order to ensure compliance with Securities Market Law No. 18,045 and SVS regulations, the Board of Directors approved the Manual at its meeting held on February 29, 2016 and ratified such decision at its meeting held on March 23, 2016. This document addresses applicable standards regarding the information in connection with transactions of Endesa Américas’ securities and those of its affiliates, entered into by directors, management, principal executives, employees and other related parties, the existence of blackout periods for such transactions undertaken by directors, principal executives and other related parties, the existence of mechanisms for the continuous disclosure of information that is of interest to the market and mechanisms that provide protection for confidential information. The Manual will be posted on Endesa Américas’ website at www.endesaamericas.cl. The provisions of this Manual apply to the members of the Board, as well as executives and employees who have access to confidential information, and especially those who work in areas related to the securities markets.
The Board of Directors approved a ZTAC Plan at its first meeting held on February 29, 2016 in order to supplement the aforementioned corporate governance regulations and ratified such decision at its meeting held on March 23, 2016. The Code of Ethics is based on general principles such as impartiality, honesty, integrity and other ethical standards of similar importance, all of which are expected from employees. The ZTAC Plan reinforces the principles included in the Code of Ethics, but with special emphasis on avoiding corruption in the form of bribes, preferential treatment, and other similar matters.
In order to comply with Law No. 20,393 enacted on December 2, 2009, which imposes criminal responsibility on legal entities for the crimes of asset laundering, financing of terrorism and bribing of public officials, the Board of Directors approved the Penal Risk Prevention Model at its meeting held on February 29, 2016 and ratified such decision at its meeting held on March 23, 2016. The law encourages companies to adopt this model, whose implementation involves compliance with managerial and supervision duties. The adoption of the Penal Risk Prevention Model mitigates, and in some cases relieves, the effects of criminal responsibility even when a crime is committed. One of the elements of this model is the appointment of the Penal Risk Prevention Officer, who was appointed by the Board at the same meeting. Mr. Alain Rosolino, who currently serves as Internal Audit Officer of Enersis Américas and Enersis Chile, was appointed as our Penal Risk Prevention Officer.
123
On February 29, 2016, the Board of Directors also approved the “Guidelines 231: Guidelines applicable to non-Italian subsidiaries in accordance with Legislative Decree 231 of June 8, 2001” and ratified such decision at its meeting held on March 23, 2016. Given that Endesa Américas’ ultimate parent company, Enel, has to comply with Italian Legislative Decree 231, which establishes management responsibility for Italian companies as a consequence of certain crimes committed in Italy or abroad, in the name of or for the benefit of such entities, including those crimes described in Chilean Law No. 20,393, these guidelines set a group of measures, with standards of behavior expected from all employees, advisers, auditors, officials, directors as well as consultants, contractors, commercial partners, agents and suppliers. Legislative Decree 231 includes various activities of a preventive nature that are coherent with and integral to the requirements and compliance with Chilean Law No. 20,393, which deals with the criminal responsibility of legal entities. These guidelines are supplementary to the standards included in the Code of Ethics and the ZTAC Plan.
On November 29, 2012, the SVS issued General Regulation No. 341 which established regulations for the disclosure of information with respect to the standards of corporate governance compliance adopted by publicly held limited liability corporations and sets the procedures, mechanisms and policies that are indicated in the Appendix to the regulation. The objective of this regulation is to provide credible information to investors with respect to good corporate governance policies and practices adopted by publicly held limited liability corporations, which include us, and permit entities like stock exchanges to produce their own analyses to help the various market participants to understand and evaluate the commitment of companies. General Regulation No. 341 was substituted by General Regulation No. 385, issued by the SVS on June 8, 2015. This regulation has similar objectives than the former General Regulation No. 341, but addresses additional issues, by the way of separating each policy in several more detailed policies. Subjects such as non-discrimination, inclusion and sustainability are particularly important in this new regulation. The Appendix of General Regulation No. 385 is divided into the following four sections with respect to which companies must report the corporate practices that have been adopted: (i) the functioning and composition of the board, (ii) relations between the company, shareholders and the general public, (iii) risk management and control and (iv) assessment by a third party. Publicly held limited liability corporations should send the information with respect to corporate governance practices to the SVS, no later than March 31 of each year, using the contents of the Appendix to this regulation as criteria. If none of them is adopted, the company must explain its reasons to the SVS. The information should refer to December 31 of the calendar year prior to its dispatch. At the same time, such information should also be at the public’s disposal on the company’s website and must be sent to the stock exchanges.
Compliance with the New York Stock Exchange Listing Standards on Corporate Governance
The following is a summary of the significant differences between Endesa Américas’ expected corporate governance practices and those applicable to U.S. domestic issuers under the corporate governance rules of the NYSE:
Independence and Functions of the Directors’ Committee (Audit Committee)
Chilean law requires that at least two thirds of the Directors’ Committee be independent directors. According to Chilean law, a member would not be considered independent if, at any time, within the last 18 months he: (i) maintained any relationship of a relevant nature and amount with the company, with other companies of the same group, with its controlling shareholder or with the principal officers of any of them or has been a director, manager, administrator or officer of any of them; (ii) maintained a family relationship with any of the members described in (i) above; (iii) has been a director, manager, administrator or principal officer of a non-profit organization that has received contributions from (i) above; (iv) has been a partner or a shareholder that has controlled, directly or indirectly, 10% or more of the capital stock or has been a director, manager, administrator or principal officer of an entity that has provided consulting or legal services for a relevant consideration or external audit services to the persons listed in (i) above; and (v) has been a partner or a shareholder that has controlled, directly or indirectly, 10% or more of the capital stock or has been a director, manager, administrator or principal officer of the principal competitors, suppliers or customers. In case there are not sufficient independent directors on the Board to serve on the Directors’ Committee, Chilean law determines that the independent director nominates the rest of the members of the Directors’ Committee among the remaining Board members that do not meet the Chilean law independence requirements. Chilean law also
124
requires that all publicly held limited liability stock corporations that have a market capitalization of at least UF 1,500,000 (Ch$ 38 billion as of September 30, 2015) and at least 12.5% of its voting shares are held by shareholders that individually control or own less than 10% of such shares, must have at least one independent director and a Directors’ Committee.
Under the NYSE corporate governance rules, all members of the Audit Committee must be independent, subject to a phase-in period for compliance for spin-off companies. The Audit Committee of a U.S. company must perform the functions detailed in, and otherwise comply with the requirements of NYSE Listed Company Manual Rules 303A.06 and 303A.07. As of July 31, 2005, non-U.S. companies have been required to comply with Rule 303A.06, but not with Rule 303A.07. Endesa Américas currently complies with the independence and the functional requirement of Rule 303A.06.
Pursuant to Endesa Américas’ by-laws, which were approved by the shareholders of Endesa Chile at the ESM held on December 18, 2015, all members of the Directors’ Committee must satisfy the requirements of independence, as stipulated by the NYSE. The Directors’ Committee is composed of three members of the Board and complies with Chilean law, as well as with the criteria and requirements of independence prescribed by the Sarbanes-Oxley Act (“SOX”), the SEC and the NYSE. Therefore, the Directors’ Committee complies with the conditions of the Audit Committee as required by the SOX, the SEC and the NYSE corporate governance rules. As a result, the Company has a single Committee, the Directors’ Committee, which includes among its functions the duties performed by the Audit Committee.
The Endesa Américas Directors’ Committee performs the following functions:
| | • | | review of financial statements and the reports of the external auditors prior to their submission for shareholders’ approval; |
| | • | | formulate proposals to the Board of Directors, which will make its own proposals to shareholders’ meetings, for the selection of external auditors and private rating agencies; |
| | • | | review of information related to transactions of Endesa Américas with related parties and reports the opinion of the Directors’ Committee to the Board of Directors; |
| | • | | the examination of the compensation framework and plans for managers, executive officers and employees; |
| | • | | the preparation of an Annual Management Report, including its main recommendations to shareholders; |
| | • | | provide information to the Board of Directors about the convenience of recruiting external auditors to provide non-auditing services, when such services are not prohibited by law, depending on whether such services might affect the external auditors’ independence; |
| | • | | oversee the work of external auditors; |
| | • | | review and approval of the annual auditing plan by the external auditors; |
| | • | | evaluate the qualifications, independence and quality of the auditing services; |
| | • | | elaborate on policies regarding employment of former members of the external auditing firm; |
| | • | | review and discuss problems or disagreements between management and external auditors regarding the auditing process; |
| | • | | establish procedures for receiving and dealing with complaints regarding accounting, internal control and auditing matters; |
| | • | | any other function mandated to the committee by the by-laws, the Board of Directors or the shareholders. |
125
Corporate Governance Guidelines
The NYSE’s corporate governance rules require U.S.-listed companies to adopt and disclose corporate governance guidelines. Chilean law provides for this practice through the disclosure of the procedures related to the General Resolution No. 385 and the Manual. Endesa Américas also adopted the codes of conduct described above and its by-laws include provisions that govern the creation, composition, attributions, functions and compensation of both Directors’ and Audit Committees described above.
The following table provides the total number of personnel (both permanent and temporary employees) and the number of personnel (both permanent and temporary employees) of each of our combined entities as of the dates indicated:
| | | | | | | | | | | | | | | | |
| | | As of September 30, | | | As of December 31, | |
Company | | 2015 | | | 2014 | | | 2014 | | | 2013 | |
Argentina | | | | | | | | | | | | | | | | |
Costanera | | | 488 | | | | 470 | | | | 485 | | | | 481 | |
El Chocón | | | 45 | | | | 48 | | | | 49 | | | | 48 | |
GasAtacama Argentina(1) | | | 29 | | | | 29 | | | | 29 | | | | — | |
| | | | | | | | | | | | | | | | |
Total personnel in Argentina | | | 562 | | | | 547 | | | | 563 | | | | 529 | |
Chile | | | | | | | | | | | | | | | | |
Endesa Chile | | | 7 | | | | — | | | | — | | | | — | |
| | | | | | | | | | | | | | | | |
Total personnel in Chile | | | 7 | | | | — | | | | — | | | | — | |
| | | | | | | | | | | | | | | | |
Colombia | | | | | | | | | | | | | | | | |
Emgesa | | | 570 | | | | 583 | | | | 589 | | | | 563 | |
| | | | | | | | | | | | | | | | |
Total personnel in Colombia | | | 570 | | | | 583 | | | | 589 | | | | 563 | |
| | | | | | | | | | | | | | | | |
Peru | | | | | | | | | | | | | | | | |
Edegel | | | 263 | | | | 263 | | | | 268 | | | | 260 | |
| | | | | | | | | | | | | | | | |
Total personnel in Peru | | | 263 | | | | 263 | | | | 268 | | | | 260 | |
| | | | | | | | | | | | | | | | |
Total personnel | | | 1,402 | | | | 1,393 | | | | 2,681 | | | | 2,509 | |
| | | | | | | | | | | | | | | | |
| (1) | As a result of our purchase of an additional 50% interest in GasAtacama Holding Ltda. (“GasAtacama Holding”), we began accounting for GasAtacama Holding and its subsidiaries, including GasAtacama Argentina S.A. (“GasAtacama Argentina”) on a combined basis since May 2014. |
126
The following table provides the total number of temporary employees and the number of temporary employees of each of our combined entities as of the dates indicated and the average during the most recent financial year:
| | | | | | | | | | | | | | | | | | | | |
| | | As of September 30, | | | Average | | | As of December 31, | |
Company | | 2015 | | | 2014 | | | 2014 | | | 2014 | | | 2013 | |
Argentina | | | | | | | | | | | | | | | | | | | | |
Costanera | | | 18 | | | | 18 | | | | 18 | | | | 18 | | | | 20 | |
El Chocón | | | 3 | | | | 3 | | | | 3 | | | | 3 | | | | 3 | |
GasAtacama Argentina(1) | | | — | | | | — | | | | — | | | | — | | | | — | |
| | | | | | | | | | | | | | | | | | | | |
Total temporary personnel in Argentina | | | 21 | | | | 21 | | | | 21 | | | | 21 | | | | 23 | |
| | | | | | | | | | | | | | | | | | | | |
Colombia | | | | | | | | | | | | | | | | | | | | |
Emgesa | | | 92 | | | | 92 | | | | 92 | | | | 92 | | | | 87 | |
| | | | | | | | | | | | | | | | | | | | |
Total temporary personnel in Colombia | | | 92 | | | | 92 | | | | 92 | | | | 92 | | | | 87 | |
| | | | | | | | | | | | | | | | | | | | |
Peru | | | | | | | | | | | | | | | | | | | | |
Edegel | | | 26 | | | | 26 | | | | 26 | | | | 26 | | | | 22 | |
| | | | | | | | | | | | | | | | | | | | |
Total temporary personnel in Peru | | | 26 | | | | 26 | | | | 26 | | | | 26 | | | | 22 | |
| | | | | | | | | | | | | | | | | | | | |
Total temporary personnel | | | 259 | | | | 259 | | | | 259 | | | | 259 | | | | 228 | |
| | | | | | | | | | | | | | | | | | | | |
| (1) | As a result of our purchase of an additional 50% interest in GasAtacama Holding we began accounting for GasAtacama Holding and its subsidiaries including GasAtacama Argentina on a combined basis since May 2014. |
Chile
It is expected that no Chilean collective bargaining will be transferred to us in connection with the Spin-Off.
Argentina
El Chocón has two collective bargaining agreements, of which one expires in December 2016, and the other already expired and is in process of renegotiation. Costanera has two collective bargaining agreements, which both expired in 2014. Under Argentine law, collective bargaining agreements are automatically renewed until a new agreement is reached, which is expected to occur in 2015.
Colombia
Emgesa has one collective bargaining agreement which was renegotiated in 2015 and expires in June 2018. Under Colombian labor law, pre-existing collective bargaining agreements are automatically renewed until a new agreement is in force.
Peru
Edegel has one collective bargaining agreement signed in December 2014, which expired in December 2015.
We expect to have a good relationship with all of our labor unions.
At the 2016 OSM, the Board of Directors will be elected. None of the directors or officers of Endesa Américas is expected to will own more than 0.1% of the shares of Endesa Américas or any stock options after the Spin-Off.
127
Item 7. Major Shareholders and Related Party Transactions
Based on the distribution ratio in the Spin-Off of one share of Endesa Américas common stock for every one share of Endesa Chile common stock, immediately after the Spin-Off, Endesa Américas’ shareholders and their holdings of Endesa Américas common stock will be identical to the shareholders of Endesa Chile and their holdings of Endesa Chile common stock immediately prior to the Spin-Off. Following the Spin-Off, Endesa Américas will have only one class of capital stock and Enersis Américas, the controlling stockholder of Endesa Chile prior to the Spin-Off, will also be the ultimate controlling shareholder of Endesa Américas after the Spin-Off and will have no different voting rights than the other shareholders of Endesa Américas.
The following discussion has been prepared based on information available to us concerning ownership of Endesa Chile common stock and ADSs as of September 30, 2015 and describes the expected ownership of Endesa Américas common stock and ADSs immediately following the Spin-Off.
Immediately following the Spin-Off, Endesa Américas is expected to have 8,201,754,580 shares of common stock outstanding, held by 16,206 stockholders of record and three record holders of Endesa Américas ADSs, based on available information as of September 30, 2015. It is not practicable for us to determine the number of Endesa Américas ADSs or Endesa Américas common stock that will be beneficially owned in the United States, as the depositary for Endesa Chile’s ADSs only has knowledge of the record holders, including the Depositary Trust Company and its nominees. As a result, we are not able to ascertain the domicile of the expected final beneficial holders represented by Endesa Américas ADS record holders. Likewise, we cannot readily determine the domicile of any of the expected foreign stockholders who will hold Endesa Américas common stock, either directly or indirectly.
Immediately following the Spin-Off, we expect that: Enersis Américas will beneficially own 60.0% of Endesa Américas; AFPs in the aggregate will own 15.1% of Endesa Américas; Chilean stockbrokers, mutual funds, insurance companies, foreign equity funds, and other Chilean institutional investors collectively will own 18.3% of Endesa Américas; ADS holders will beneficially own 3.9% of Endesa Américas; and the remaining 2.8% of Endesa Américas will be held by more than 13,000 minority shareholders, based on available information as of September 30, 2015.
The following table sets forth certain information concerning the expected ownership of Endesa Américas common stock immediately following the Spin-Off, with respect to each stockholder known by us that is expected to own more than 5% of the outstanding shares of Endesa Américas common stock:
| | | | | | | | |
| | | Number of Shares
Owned | | | Percentage of
Shares
Outstanding | |
Enersis Américas | | | 4,919,488,794 | | | | 59.98 | % |
Enersis Américas, following the Enersis Spin-Off, will be a company primarily engaged, through its combined entities and related companies, in the generation and distribution of electricity in Argentina, Colombia and Peru, and in the generation, transmission and distribution of electricity in Brazil. Enersis Américas will be ultimately controlled by Enel, an Italian company which beneficially owns 60.6% of Enersis Américas’ outstanding capital stock through two Spanish intermediate companies, Enel Iberoamérica and Enel Latinoamérica.
Since June 25, 2009, Enel has been the ultimate parent company of Endesa Chile, by virtue of its beneficial shareholding of 60.6% of Enersis. Enel will continue to be the final controller of Endesa Américas immediately following the Spin-Off and such control will be exercised through Enersis Américas. Enel, an Italian generation and distribution company which is publicly traded on the Milan Stock Exchange, is primarily engaged in the energy sector, with a presence in 30 countries worldwide, and approximately 89 GW of net installed capacity. It provides service to more than 61 million customers through its electricity and gas businesses.
128
| B. | Related Party Transactions. |
Article 146 of Law No. 18,046 (the “Chilean Companies Act”) defines related-party transactions as all transactions involving a company and any entity belonging to the corporate group, its parent companies, controlling companies, subsidiaries or related companies, board members, managers, administrators, senior officers or company liquidators, including their spouses, some of their relatives and all entities controlled by them, in addition to individuals who may appoint at least one member of the company’s board of directors or who control 10% or more of voting capital, or companies in which a board member, manager, administrator, senior officer or company liquidator has been serving in the same position within the last 18 months. The law establishes that in the event that these persons fulfill the requirements established by Article 146, such persons must immediately inform the Board of Directors of their related-party nature, or such other group as the Board may appoint for that purpose. As required by law, “related-party transactions” must comply with corporate interests, as well as prices, terms and conditions prevailing in the market at the time of their approval. They must also meet all legal requirements, including acknowledgement and approval of the transaction by the board (excluding the affected directors), by the ESM (in some cases, with requisite majority approval) and by any applicable regulatory procedures.
The aforementioned law, which also applies to Endesa Américas’ affiliates, also provides for some exceptions, stating that in certain cases, Board approval would suffice for “related-party transactions”, pursuant to certain related-party transaction thresholds and when such transactions are conducted in compliance with the related-party policies defined by the company’s board. Accordingly, during 2016, Endesa Américas’ Board of Directors will adopt a related-party transaction policy (política de habitualidad) which, when approved, will be available on Endesa Américas’ website.
If a transaction is not in compliance with Article 146, this would not affect the transaction’s validity, but Endesa Américas or its shareholders may demand compensation from the individual associated with the infringement as provided under law, and reparation for damages. It is expected that Endesa Américas will comply with the requirements of Article 146 in all transactions with related parties.
In the countries in which Endesa Américas will operate, inter-company transactions are permitted, but they have adverse tax consequences. Accordingly, Endesa Américas will not manage the cash flows of its combined entities.
During the three-year period ended December 31, 2014, Costanera received one loan from Endesa Chile at a spread of 6.0% over LIBOR. This loan matured in November 2013, because it was contributed to Costanera in connection with its capital increase.
As of the date of this information statement, the transactions described above have not experienced material changes. For more information regarding transactions with related parties, refer to Note 8 of the Notes to our combined financial statements.
| C. | Interests of Experts and Counsel. |
Not applicable.
Item 8. Financial Information
| A. | Combined Statements and Other Financial Information. |
See “Item 18. Financial Statements.”
129
Legal Proceedings
We and our combined entities are parties to legal proceedings arising in the ordinary course of business. We believe it is unlikely that any loss associated with pending lawsuits will significantly affect the normal development of our business.
For detailed information as of September 30, 2015 on the status of the material pending lawsuits that have been filed against Endesa Chile and its subsidiaries, please refer to Note 31.3 of the Notes to our interim combined financial statements. Please note that once the Spin-Off is effective, we will be the defendant instead of Endesa Chile for all legal proceeding originating from our businesses outside of Chile.
In relation to the legal proceedings reported in the Notes to our combined financial statements, we use the criteria of disclosing lawsuits above a minimum threshold of US$ 15 million of potential impact to us, and, in some cases, qualitative criteria according to the materiality of the impact in the conduct of our business. The lawsuit status includes a general description, the process status and the estimate of the amount involved in each lawsuit.
Dividend Policy
It is expected that the Board of Directors will establish a definitive dividend payable each year. The dividend policy has not been defined yet.
It is expected that the Board of Directors of Endesa Américas will establish a definitive dividend payable each year, accrued in the prior year, which cannot be less than the legal minimum of 30% of annual net income before negative goodwill amortization. Additionally, the shareholders of Endesa Chile agreed to consider a percentage of Endesa Chile’s 2015 annual consolidated net income as Endesa Américas’ 2015 annual consolidated net income at the ESM held on December 18, 2015. The initial definitive dividend payout will be equal to 50% of the annual consolidated net income of Endesa Chile (before the Spin-Off) for fiscal year 2015. Since an interim dividend of Endesa Chile was already paid in January 2016, the remainder of the definitive dividend will be divided between the continuing company, Endesa Chile and us. Therefore, in May 2016, our shareholders are expected to receive a dividend of Ch$ 9.37144 per share of common stock and shareholders of Endesa Chile are expected to receive a dividend of Ch$ 11.02239 per share of common stock.
It is expected that our dividend policy will be similar to Endesa Chile’s current dividend policy and therefore, the interim dividend will correspond to 15% of liquid net income as of a specific, yet to be determined period, of the combined statements of financial position. Additionally, it is expected that our Board of Directors will propose a definitive dividend payout equal to 50% of the annual net income for fiscal year 2016. Dividend payments will be subject to net profits obtained in each period, as well as to expectations of future profit levels and other conditions that may exist at the time of such dividend declaration. The fulfillment of the aforementioned dividend policy will depend on the net income. The proposed dividend policy will be subject to our Board of Director’s right to change the amount and timing of the dividends under the circumstances at the time of the payment. The payment of dividends for fiscal year 2015 will be based on the net income filed with the SVS. For further details, see “Item 3. Key Information — A. Selected Financial Data.”
The payments of dividends are subject to legal restrictions, such as legal reserve requirements, capital and retained earnings criteria, and other contractual restrictions such as the non-default on credit agreements. However, these legal restrictions will not affect our ability or any of our combined entities to pay dividends. (See “Item 5. Operating and Financial Review and Prospects — B. Liquidity and Capital Resources” for further detail on our debt instruments).
Stockholders set dividend policies at each subsidiary and affiliate. Dividends will be paid to shareholders of record as of midnight of the fifth business day prior to the payment date. Holders of ADS on the applicable record dates will be entitled to participate in dividends.
Dividends
Dividends have not been paid to date.
130
For a discussion of Chilean withholding taxes and access to the formal currency market in Chile in connection with the payment of dividends and sales of ADSs and the underlying common stock, see “Item 10. Additional Information — E. Taxation” and “Item 10. Additional Information — D. Exchange Controls.”
None.
Item 9. The Offer and Listing
| A. | Offer and Listing Details. |
Market Price Information
We expect that the shares of our common stock and our ADS will be traded on Chilean Stock Exchanges and the NYSE, respectively, upon the completion of the Spin-Off.
Background and Description of the Spin-Off
Overview
The Spin-Off will establish us as a new Chilean corporation, independent of Endesa Chile. We will be a holding company that holds the Non-Chilean Business. Neither we nor Endesa Chile will own any capital stock of the other following the Spin-Off. The relationships between the two companies will be limited to:
| | • | | Agreements relating to the implementation of the Spin-Off; and |
| | • | | Intercompany agreements for staff and support services, among others. |
Endesa Chile and Endesa Américas may also have certain intercompany financial arrangements with Enersis Chile, Enersis Américas, Chilectra Chile and Chilectra Américas following the Spin-Off, the Chilectra Spin-Off and the Enersis Spin-Off.
Description of the Spin-Off
The Spin-Off will be implemented using a procedure under Chilean corporate law called división or “demerger.” In a división, an existing company is divided, creating a new company to which specified assets and liabilities are assigned. The shares of the new company are issued to the shareholders of the existing company, pro rata in proportion to their share ownership in the existing company.
The Spin-Off was presented to the shareholders of Endesa Chile for approval at the ESM of Endesa Chile held on December 18, 2015 (the “Endesa Chile Meeting”). Pursuant to the terms of the Spin-Off, holders of Endesa Chile’s common stock (“Endesa Chile Shares”) will have the right to receive one share of common stock of Endesa Américas (“Endesa Américas Shares”) for each Endesa Chile Share. Subject to the receipt of necessary authorizations, the completion of legal formalities and the satisfaction of the conditions precedent, the following actions occurred:
| | • | | Endesa Américas was established as a separate company, with a fully independent legal existence and full capacity to own and dispose of its assets. Its initial interim Board of Directors was elected at the Endesa Chile Meeting to serve until the first annual OSM of Endesa Américas expected to be held in April 2016. |
| | • | | Specified assets and liabilities of Endesa Chile relating to the Non-Chilean Business, including the shares of specified combined entities and jointly controlled entities, were transferred to Endesa |
131
| | Américas. All of the Non-Chilean Business conveyed to Endesa Américas are conducted by separate operating entities, and the continuity of existence of those entities are undisturbed by the Separation. |
| | • | | Certain agreements to accomplish the separation of Endesa Chile’s businesses in the Spin-Off and to provide for ongoing relationships between Endesa Chile and Endesa Américas will take effect. Endesa Chile conveyed to Endesa Américas, and Endesa Américas was formed with, assets amounting to approximately Ch$ 3,892 billion, liabilities amounting to approximately Ch$ 1,847 billion and stockholders’ equity of approximately Ch$ 2,045 billion. |
Endesa Chile shareholders’ resolution from the Endesa Chile Meeting approving the Spin-Off was notarized by public deed dated January 11, 2016, signed before the Santiago Notary Pedro Sadá Azar and registered with the Chilean Commerce Registry (Registro de Comercio del Conservador de Bienes Raíces de Santiago) in Folio 4284, No. 2568 of 2016 and a notice of the Separation was published in the Diario Oficial on January 20, 2016.
The Board of Directors of Endesa Chile granted the necessary powers-of-attorney to execute one or more documents necessary or convenient to certify compliance with the conditions precedent to which the Spin-Off is subject, certify that the assets subject to registration are assigned to Endesa Américas, and granted the Public Deed certifying the satisfaction of the conditions precedent for the Spin-Off (the “Public Deed”) on February 26, 2016. The Separation became fully effective as of March 1, 2016. However, until the registration of the Endesa Américas Shares with the SVS and the SEC is completed, Endesa Américas Shares and ADS will not be delivered or traded separately.
Conditions Precedent
In addition to the receipt of Endesa Chile’s shareholder approval at the Endesa Chile Meeting and the completion of legal formalities, the effectiveness of the Separation is subject to the following conditions precedent:
| | • | | Shareholders of Chilectra must have approved the spin-off of Chilectra Américas at an extraordinary shareholders’ meeting of Chilectra, the minutes of such meeting must have been duly recorded as a public deed and the extracts of such minutes must have been duly registered and published pursuant to Chilean law; and |
| | • | | Shareholders of Enersis must have approved the spin-off of Enersis Chile at an extraordinary shareholders’ meeting of Enersis, the minutes of such meeting must have been duly recorded as a public deed and the extracts of such minutes must have been duly registered and published pursuant to Chilean law. |
As described above, the Public Deed must be executed within 10 calendar days of the satisfaction of all of the conditions precedent. Such conditions precedents have been fully satisfied as of February 26, 2016.
Share Capital and Capital Structure of Endesa Américas
Immediately after the effectiveness of the Spin-Off, the share capital of Endesa Américas will be Ch$ 778,936,764,259. Endesa Américas and Endesa Chile will initially have the same shareholders, and they will continue to be controlled by the same group of shareholders.
Shareholder Approval
On November 5, 2015, the Board of Directors of Endesa Chile determined that the Reorganization, including the Spin-Off and the Merger, was in the best interest of Endesa Chile, subject to the satisfaction of certain conditions established by certain members of its Board of Directors. On November 10, 2015, the Board of Directors of Endesa Chile resolved to summon the Endesa Chile Meeting to approve the Spin-Off.
132
At the Endesa Chile Meeting, the shareholders of Endesa Chile approved the Spin-Off, which includes the Separation establishing Endesa Américas and allocating certain assets and liabilities of Endesa Chile relating to the Non-Chilean Business to Endesa Américas. Holders of approximately 81.15% of the outstanding shares of Enersis voted in favor of the Enersis Spin-Off and holders of approximately 75% of the outstanding shares of Endesa Chile and 100% of the outstanding shares of Chilectra voted in favor of the Endesa/Chilectra Spin-Offs, respectively.
Costs Associated with the Spin-Off
Endesa Chile will assume the notary fees, duties and other costs incurred in connection with the Spin-Off, except for those fees, duties and other costs that by their nature are incurred by any combined entity of Endesa Chile, which shall be assumed by that entity.
Enersis also entered into a tax indemnity agreement with Endesa Chile pursuant to which Enersis will indemnify Endesa Chile for net tax costs paid by Endesa Chile in connection with Endesa Chile’s spin-off of Endesa Américas. This indemnification would be applicable only if the Merger is not approved before December 31, 2017 due to reasons not attributable to Endesa Américas or Endesa Chile or an event of force majeure has occurred.
Third Party Approvals and Consents
With respect to any obligation of Endesa Chile that will be assigned to Endesa Américas, consent of the relevant creditor may be required in order for Endesa Américas to succeed to the rights and obligations of Endesa Chile. In these cases, failure to obtain consent from the creditor may require that Endesa Chile remain liable for such obligation of Endesa Américas. Endesa Américas will agree to indemnify Endesa Chile against liabilities of this kind.
Description of Distribution
Distribution of Endesa Américas Shares
We applied to register Endesa Américas Shares in the Securities Registry of the SVS and to list them for trading on the Chilean Stock Exchanges. Once the SVS has authorized the registration of Endesa Américas Shares, they will be distributed to their legal holders. Distribution of shares that are not deposited with the Chilean Central Securities Depositary (DCV Registros, S.A., Depósito Central de Valores, or the “DCV”), the clearing system for securities traded on the Chilean Stock Exchanges, will be made against the presentation of Endesa Chile Share certificates. For shares deposited with the DCV, distribution will generally be made by book-entry annotation in the shareholder list maintained by the DCV, by which holders of outstanding Endesa Chile Shares will receive one Endesa Américas Share for each Endesa Chile Share.
Holders of Endesa Chile Shares as of April 14, 2016 (the “Share Record Date”) will receive Endesa Américas Shares on April 21, 2016 (the “Share Distribution Date”). The distribution of Endesa Américas Shares will not occur until the registration of Endesa Américas Shares under Chilean and U.S. securities laws is effective.
Following the Separation but prior to the Share Distribution Date, there will be no separate certificates for Endesa Américas Shares, and the right to receive Endesa Américas Shares will trade and be transferred together with Endesa Chile Shares. Investors will not be able to buy or otherwise acquire, or sell or otherwise transfer or deliver, Endesa Chile Shares or Endesa Américas Shares separately.
Distribution of Endesa Américas Shares to shareholders of Endesa Chile will take place on the Share Distribution Date in the following manner:
| | • | | Each holder of Endesa Chile Shares as of the Share Record Date will receive one Endesa Américas Share for each Endesa Chile Share held; and |
133
| | • | | Holders of Endesa Chile Shares will continue to own the same number of Endesa Chile Shares. |
Beginning on the Share Distribution Date, it is expected that:
| | • | | Endesa Américas Shares will commence trading on the Chilean Stock Exchanges; |
| | • | | Endesa Chile Shares will trade on the Chilean Stock Exchanges separately from Endesa Américas Shares; and |
| | • | | Shareholders will be able to trade Endesa Chile Shares and Endesa Américas Shares separately. |
In the event there are any changes to the Share Record Date or the Share Distribution Date, or new material information relating to the distribution of Endesa Américas Shares becomes available, the Company and Endesa Chile will publish any such changes or updates in a press release that will also be furnished on a Form 6-K.
Distribution of Endesa Américas ADSs
Upon the completion of the Spin-Off, each American Depositary Share (“ADS”) of Endesa Chile (“Endesa Chile ADS”) will represent, in addition to 30 Endesa Chile Shares, the right to receive 30 Endesa Américas Shares. Endesa Américas will arrange with a U.S. depositary bank to issue ADSs of Endesa Américas (“Endesa Américas ADSs”), each representing 30 Endesa Américas Shares. Applications will be made to list Endesa Américas’ ADSs on the NYSE.
On April 26, 2016 (the “ADS Distribution Date”), each record holder of Endesa Chile ADSs as of April 14, 2016 (the “ADS Record Date”) will receive one Endesa Américas ADS for each Endesa Chile ADS.
Endesa Américas ADSs will be issued and distributed to each record holder of Endesa Chile ADSs at the close of business (New York time) on the ADS Record Date.
Persons holding Endesa Chile ADSs through the facilities of The Depository Trust Company, or DTC, will receive the distribution of Endesa Américas ADSs by book-entry only, through the facilities of DTC. Persons holding Endesa Chile ADSs directly will receive the distribution of Endesa Américas ADSs in the form of certificated American Depositary Receipts, representing Endesa Américas ADSs. These ADRs will be sent to direct holders of Endesa Chile ADSs on or as soon as practicable after the ADS Distribution Date. Persons holding Endesa Chile ADSs through a broker or other securities intermediary should consult such broker or other securities intermediary concerning distribution of Endesa Américas ADSs.
Beginning on the ADS Distribution Date, it is expected that:
| | • | | Endesa Américas ADSs will commence trading on the NYSE; |
| | • | | Endesa Chile ADSs will trade on the NYSE separately from Endesa Américas’ ADSs; and |
| | • | | ADS holders will be able to trade Endesa Chile ADSs and Endesa Américas ADSs separately. |
In the event there are any changes to the ADS Record Date or the ADS Distribution Date, or new material information relating to the distribution of Endesa Américas ADSs becomes available, the Company and Endesa Chile will publish any such changes or updates in a press release that will also be furnished on a Form 6-K. In addition, Endesa Chile will coordinate with Citibank N.A., its depositary, to give at least 10 days’ notice of any changes to the ADS Record Date to the NYSE in accordance with NYSE’s requirements.
Intercompany Arrangements
Immediately after the Spin-Off, Endesa Chile will not own any Endesa Américas Shares or Endesa Américas ADSs and Endesa Américas will not own any Endesa Chile Shares or Endesa Chile ADSs. Under Chilean law, Endesa Chile will remain jointly and severally liable for the obligations of Endesa Chile assumed by Endesa Américas pursuant to the Spin-Off. Such liability, however, will not extend to any obligation to a person or entity that has given its express consent relieving Endesa Chile of such liability and approving the Spin-Off.
134
Following the Spin-Off, there will be a variety of contractual relationships between Endesa Chile and Endesa Américas, both to accomplish the Spin-Off and to provide for ongoing relationships. They fall into two broad categories:
Arrangements Related to the Approval of the Spin-Off. The separation of the two companies and the transfer of certain assets and liabilities of Endesa Chile to Endesa Américas will be effected by the action of the shareholders of Endesa Chile at the Meeting.
Intercompany Services. Prior to the Spin-Off, Endesa Américas, as part of Endesa Chile, has the benefit of Endesa Chile’s existing intercompany arrangements with Enersis. Following the Spin-Off, these existing intercompany arrangements will be allocated solely to Endesa Chile. As a result, Endesa Américas will enter into new intercompany agreements under which Endesa Chile and Enersis Chile will provide services to Endesa Américas. Endesa Américas is not expected to provide any services to Endesa Chile or Enersis Chile. The services to be received by Endesa Américas will include certain legal, finance, accounting, human resources, communications, security, training and development, relations with contractors, risk management, IT services and other corporate support and administrative services from Enersis Chile and additional corporate functions, such as senior management, tax services, investor relations and financial compliance from Endesa Chile. These services will be provided and charged at market prices if there is a comparable service. If there are no comparable services in the market, they will be provided at cost plus a specified percentage.
Enersis may also enter into a tax indemnity agreement with Endesa Chile pursuant to which Enersis will indemnify Endesa Chile for net tax costs paid by Endesa Chile in connection with Endesa Chile’s spin-off of Endesa Américas. See “— Background of the Distribution — Costs Associated with the Spin-Off” above.
U.S. Federal Income Tax Treatment of the Spin-Off, the Merger and the Tender Offer
This discussion is based on the Internal Revenue Code of 1986, as amended (the “Code”), administrative pronouncements, judicial decisions and final, temporary and proposed Treasury regulations, all as of the date hereof. These authorities are subject to change, possibly with retroactive effect.
The following is a summary of the U.S. federal income tax treatment of U.S. holders (as defined herein) of the Spin-Off, the Merger and the Tender Offer, but it does not purport to be a comprehensive description of all of the tax considerations that may be relevant to a U.S. holder and is based on the assumption that there is no applicable income tax treaty in effect between the United States and Chile. The discussion applies only if the holder holds our shares (or ADSs) as capital assets for U.S. federal income tax purposes and it does not describe all of the tax consequences that may be relevant in light of the holder’s particular circumstances. For instance, it does not describe all the tax consequences that may be relevant to:
| | • | | certain financial institutions; |
| | • | | dealers and traders in securities who use a mark-to-market method of tax accounting; |
| | • | | persons holding shares (or ADSs) as part of a “straddle” integrated transaction or similar transaction; |
| | • | | persons whose functional currency for U.S. federal income tax purposes is not the U.S. dollar; |
| | • | | partnerships or other entities classified as partnerships for U.S. federal income tax purposes; |
| | • | | persons liable for the alternative minimum tax; |
| | • | | tax-exempt organizations; |
| | • | | persons holding shares (or ADSs) that own or are deemed to own ten percent or more of our stock; or |
| | • | | persons holding shares (or ADSs) in connection with a trade or business conducted outside of the United States. |
135
A U.S. holder for purposes of this discussion is a beneficial owner of our shares (or ADSs) that is, for U.S. federal income tax purposes:
| | • | | a citizen or individual resident of the United States; or |
| | • | | a corporation, or other entity taxable as a corporation, created or organized in or under the laws of the United States or any political subdivision thereof; or |
| | • | | an estate, the income of which is subject to U.S. federal income taxation regardless of its source; or |
| | • | | a trust (i) that validly elects to be treated as a U.S. person for U.S. federal income tax purposes or (ii) if (A) a court within the United States is able to exercise primary supervision over the administration of the trust and (B) one or more U.S. persons have the authority to control all substantial decisions of the trust. |
This discussion assumes, and we believe, that we are not, and we will not become, a passive foreign investment company for U.S. federal income tax purposes.
To the extent the following discussion consists of a statement as to matters of U.S. federal income tax law, this discussion is the opinion of Chadbourne & Parke LLP.
U.S. Federal Tax Treatment of the Spin-Off
A U.S. holder receiving Endesa Américas shares (or ADSs) in the Spin-Off will be treated for U.S. federal income tax consequences as receiving a distribution from us. The U.S. tax consequences of the distribution depend on whether the Spin-Off satisfies the conditions for tax-free treatment with respect to the shareholders imposed by section 355 of the Code. While this determination is ultimately based on all the relevant facts and circumstances, we believe, and the discussion below assumes, that the Spin-Off would qualify for such tax-free treatment. However, no rulings have been or will be sought from the Internal Revenue Service concerning whether the Spin-Off qualifies for such tax-free treatment, and there is no assurance that the Internal Revenue Service will not take a contrary view or that a court would not agree with the Internal Revenue Service if the matter were contested.
We note that one of the conditions for tax free treatment under Code Section 355 is that the spin-off transaction is not used principally as a “device” for the distribution of earnings and profits to the shareholders. This is a facts and circumstances determination. The combination of the Tender Offer and the post-Spin-Off Merger transaction may be “evidence” of a device under Treasury regulations promulgated under Section 355 if the Tender Offer results in a more than insubstantial amount of taxable gain recognized by tendering shareholders (viewed as a group). There is no guidance on the amount of gain that is considered insubstantial. Even if the taxable gain recognized by the tendering shareholders (viewed as a group) is more than insubstantial, we believe that the Spin-Off does not constitute a prohibited device based on countervailing facts and circumstances. These countervailing facts and circumstances include the strong corporate business purpose for the Spin-Off, the fact that the Company is widely-held, and the business reasons for the Tender Offer mechanism (which relate in part to the requirement under Chilean law that the Spin-Off and the Merger be separated by at least sixty days). The post-Spin-Off Merger and Tender Offer would not otherwise disqualify the Spin-Off from qualifying for tax-free treatment for the holders of shares (or ADSs) under Section 355.
If, as we believe to be the case, the Spin-Off would qualify for tax-free treatment, a U.S. holder will not recognize gain or loss for U.S. federal income tax purposes as a result of the receipt of the shares (or ADSs) in the Spin-Off. A U.S. holder must allocate its adjusted tax basis in its existing Company shares (or ADSs) over the shares (or ADSs) received in the Spin-Off and its existing Company shares (or ADSs) in proportion to their respective fair market values on the Spin-Off distribution date, and a U.S. holder’s holding period in the shares (or ADSs) received will include such U.S. holder’s holding period in its existing Company shares (or ADSs).
In the event that, contrary to the above, the Spin-Off does not qualify for tax-free treatment, a U.S. holder receiving shares (or ADSs) in the Spin-Off will be treated as receiving a taxable dividend distribution to the
136
extent of such U.S. holder’s share of our current and accumulated earnings and profits (as determined for U.S. federal income tax purposes), in an amount equal to the fair market value of the shares (or ADSs) (in U.S. dollars) received on the distribution date. Based on the assumption that our current and accumulated earnings and profits equal or exceed the fair market value of the shares (or ADSs) received in the Spin-Off, the entire amount of the distribution would be treated as taxable dividend income. Under these circumstances, a U.S. holder’s basis in shares (or ADSs) received in the Spin-Off will be the fair market value of such shares (or ADSs), and a U.S. holder’s holding period for such shares (or ADSs) will begin on the distribution date.
U.S. Tax Reporting of the Spin-Off for “Significant Distributees”
U.S. holders who are “significant distributees” and who receive shares (or ADSs) in the Spin-Off are required to attach to their U.S. federal income tax returns for the year in which the Spin-Off occurs a statement setting forth information with respect to the Spin-Off. A “significant distributee” includes a holder if, immediately before the Spin-off, such holder owned at least 5% (by vote or value) of the total outstanding stock of the distributing corporation if the stock owned by such holder is publicly traded (or at least 1% if such stock is not publicly traded). Publicly traded stock includes stock that is listed on a national securities exchange registered under section 6 of the Securities Exchange Act of 1934, such as the New York Stock Exchange where ADSs of the distributing corporation are traded.
The Merger
Endesa Américas believes, and the discussion below assumes, that the Merger of Endesa Américas with Enersis Américas will be treated as a transaction that qualifies as a tax-free reorganization within the meaning of Section 368(a) of the Code. However, no rulings have been or will be sought from the Internal Revenue Service concerning whether the Merger qualifies for such tax-free treatment, and there is no assurance that the Internal Revenue Service will not take a contrary view or that a court would not agree with the Internal Revenue Service if the matter were contested.
If, as we believe to be the case, the Merger qualifies as a tax-free reorganization, holders of shares (or ADSs) of Endesa Américas who in the Merger receive shares (or ADSs) of Enersis Américas solely for shares (or ADSs) of Endesa Américas will not recognize gain or loss for United States federal income tax purposes, except with respect to cash, if any, they receive in lieu of a fractional share (or ADS) of Enersis Américas. Each holder’s aggregate tax basis in the Enersis Américas share (or ADS) received in the Merger will be the same as his or her aggregate tax basis in the Endesa Américas share (or ADS) surrendered in the transaction, decreased by the amount of any tax basis allocable to any fractional share interest for which cash is received. The holding period of the Enersis Américas shares (or ADSs) received in the Merger by a holder of Endesa Américas shares (or ADSs) will include the holding period of the Endesa Américas shares (or ADSs) that he or she surrendered.
A holder of Endesa Américas shares (or ADSs) who receives cash in lieu of a fractional share (or ADS) of Enersis Américas will generally recognize gain or loss equal to the difference between the amount of cash received and his or her tax basis in the Enersis Américas share (or ADS) that is allocable to the fractional share. That gain or loss generally will constitute capital gain or loss.
U.S. Tax Reporting of the Merger for “Significant Holders”
U.S. holders who are “significant holders” and who receive shares (or ADSs) in the Merger are required to attach to their U.S. federal income tax returns for the year in which the Merger occurs a statement setting forth information with respect to the Merger. A “significant holder” includes a holder if, immediately before the Merger, such holder owned at least 5% (by vote or value) of the total outstanding stock of Endesa Américas if such stock owned by such holder is publicly traded (or at least 1% if such stock is not publicly traded). Publicly traded stock includes stock that is listed on a national securities exchange registered under section 6 of the Securities Exchange Act of 1934, such as the New York Stock Exchange where ADSs of Endesa Américas will be traded.
137
The Tender Offer
For a U.S. holder of shares (or ADSs) of Endesa Américas that does not tender its shares (or ADSs), the Tender Offer will not constitute a taxable event for U.S. federal income tax purposes and will not impact the holder’s Enersis Américas shares (or ADSs) received in the Merger.
For a U.S. holder of shares (or ADSs) of Endesa Américas that tenders all such shares (or ADSs) in the Tender Offer, such U.S. holder will generally recognize gain or loss equal to the difference between the amount of cash received and the tax basis for the shares (or ADSs) of Endesa Américas tendered. That gain or loss generally will constitute capital gain or loss.
For a U.S. holder of shares (or ADSs) of Endesa Américas that tenders some but not all such shares (or ADSs), we believe that cash received in the Tender Offer will be treated for U.S. federal income tax purposes as consideration received in connection with the Merger. Therefore, such U.S. holder should generally be taxed on any gain realized, but not loss, to the extent of cash received in the Tender Offer. Such taxable gain will be based on a determination of gain realized; gain would be realized to the extent the value of shares (or ADSs) of Enersis Américas received in the Merger and cash received in the Tender Offer exceeds the tax basis for the shares (or ADSs) of Endesa Américas exchanged and tendered. However, if the cash received in the Tender Offer were more properly treated for U.S. federal income tax purposes as not connected with the Merger, then a U.S. holder that tenders some but not all its shares (or ADSs) would be taxed on any gain, or loss, equal to the difference between the amount of cash received and the tax basis for the shares (or ADSs) of Endesa Américas tendered. In either scenario, such taxable gain (or, in the latter scenario, loss) generally will constitute capital gain or loss.
U.S. holders are urged to consult their own U.S. tax advisers on the potential U.S. tax consequences of the Spin-Off, the Merger and the Tender Offer including the potential treatment of the transaction under Section 355 of the Code and the determination whether the holder is a significant distributee or a significant holder required to provide a statement concerning the Spin-Off or Merger attached to its U.S. federal income tax return.
In Chile, we will apply for Endesa Américas’ common stock to be traded on three stock exchanges: the Santiago Stock Exchange, the Electronic Stock Exchange and the Valparaíso Stock Exchange. The largest exchange in the country, the Santiago Stock Exchange, was established in 1893 as a private company. Its equity consists of 48 shares as of the date of this information statement. As of December 31, 2014, 230 companies had shares listed on the Santiago Stock Exchange. Equities, closed-end funds, fixed-income securities, short-term and money market securities, gold and U.S. dollars are traded on the Santiago Stock Exchange. The Santiago Stock Exchange also trades U.S. dollar futures and stock index futures. Securities are traded primarily through an open voice auction system; a firm offers system or the daily auction. Trading through the open voice system occurs on each business day from 9:30 a.m. to 4:00 p.m., during local standard time, and from 9:30 a.m. to 5:00 p.m. during daylight savings time (usually from November to March), which differs from New York City time by up to two hours, depending on the season. The Santiago Stock Exchange has an electronic trading system called Telepregón, which operates continuously from 9:30 a.m. to 4:00 p.m. during local standard time, and from 9:00 a.m. to 5:00 p.m. during daylight savings time, on each business day. During local standard time, electronic auctions may be conducted four times a day, at 10:30 a.m., 11:30 a.m., 1:30 p.m., and 3:30 p.m. During daylight savings time there is an additional electronic auction at 4:30 p.m. More than 99% of the auctions and transactions take place electronically.
There are two share price indexes on the Santiago Stock Exchange: the General Shares Price Index, or IGPA, and the Selected Shares Price Index, or IPSA. The IGPA is calculated using the prices of shares that are traded at least 5% of the trading days of a year, with a total annual transactions exceeding UF 10,000 (Ch$ 253 million as of September 30, 2015, equivalent to US$ 0.36 million) and a free float representing at least
138
5% of the capital. The IPSA is calculated using the prices of the 40 shares with highest amounts traded on a quarterly basis, and with a market capitalization above US$ 200 million. The shares included in the IPSA and IGPA are weighted according to the weighted value of the shares traded.
We will apply for Endesa Américas’ common stock to be traded in the United States in the form of ADSs on the NYSE under a yet to be determined ticker symbol. Each ADS will represent 30 shares of common stock, with the ADSs in turn evidenced by American Depositary Receipts (“ADRs”). The ADRs will be issued a Deposit Agreement, with Citibank, N.A. acting as Depositary, and the holders and beneficial owners from time to time of ADRs issued thereunder. Only persons in whose names ADRs are registered on the books of the Depositary will be treated by the Depositary as owners of ADRs.
The NYSE is open for trading Monday through Friday from 9:30 am to 4:00 pm, with the exception of holidays declared by the NYSE in advance. On the trading floor, the NYSE trades in a continuous auction format, where traders can execute stock transactions on behalf of investors. Specialist brokers act as auctioneers in an open outcry auction market to bring buyers and sellers together and to manage the actual auction. Customers can also send orders for immediate electronic execution or route orders to the floor for trade in the auction market. The NYSE works with U.S. regulators like the SEC and the Commodity Futures Trading Commission (“CFTC”) to coordinate risk management measures in the electronic trading environment through the implementation of mechanisms like circuit breakers and liquidity replenishment points.
Not applicable
Not applicable.
Not applicable.
Item 10. Additional Information
Immediately following the effectiveness of the Spin-Off, Endesa Américas’ authorized share capital will be Ch$ 778,936,764,259 divided into 8,201,754,580 common shares with no par value. For more information regarding the share capital of Endesa Américas, see “Item 3. Key Information — B. Capitalization and Indebtedness” and “— B. Memorandum and Articles of Association — Capitalization.”
| B. | Memorandum and Articles of Association. |
Set forth below is certain information concerning our share capital and a brief summary of certain significant provisions of Chilean law and the provisions of our by-laws. which is substantially the same as the current by-laws of Endesa Chile, except:
| | • | | Article Five provides that the authorized capital of Endesa Américas is Ch$ 778,936,764,259 divided into 8,201,754,580 registered ordinary shares, all of the same series and with no par value; |
| | • | | Article Forty-Two bis, which relates to the Right of Chilean Pension Funds as Dissenting Shareholders, is not included given that it has been repealed by law; |
| | • | | New Article Fifty states that Endesa Américas is subject to Resolution No. 667/2002 issued by the Honorable Comisión Resolutiva (the former antitrust authority now known as the Tribunal de Defensa |
139
| | de La Libre Competencia, or “TDLC”) dated October 30, 2002, provided that: (i) the restrictions under such resolution shall not apply to Endesa Américas with respect to Endesa Chile; and (ii) Endesa Américas may merge with Enersis Américas and Chilectra Américas on the basis that neither the parties to the Merger nor the company resulting from the Merger will participate in any way in the relevant markets within the Republic of Chile; |
| | • | | A new Transitory Article Eight was added to confirm that Endesa Américas, from its incorporation, will voluntarily submit in advance to the rules established in Article 50 bis of the Chilean Companies Act relating to the election of independent directors and creation of a Directors’ Committee; and |
| | • | | Other transitory articles that specifically apply to Endesa Américas in connection with the Spin-Off. |
General
Shareholders’ rights in Chilean companies are governed by the company’s by-laws (Estatutos), which have the same purpose as the articles or the certificate of incorporation and the by-laws of a company incorporated in the United States, and by the Chilean Companies Act, Law No. 18,046. In addition, D.L. 3500, or the Pension Funds’ System Law, which permits the investment by Chilean pension funds in stock of qualified companies, indirectly affects corporate governance and prescribes certain rights of shareholders. In accordance with the Chilean Companies Act, legal actions by shareholders to enforce their rights as shareholders of the company must be brought in Chile in arbitration proceedings or, at the option of the plaintiff, before Chilean courts. Members of the Board of Directors, managers, officers and principal executives of the company, or shareholders that individually own shares with a book value or stock value higher that UF 5,000 (Ch$ 127 million as of September 30, 2015) do not have the option to bring the procedure to the courts.
The Chilean securities markets are principally regulated by the SVS under Securities Market Law, Law No. 18,045, and the Chilean Companies Act. These two laws state the disclosure requirements, restrictions on insider trading and price manipulation, and provide protection to minority shareholders. The Securities Market Law sets forth requirements for public offerings, stock exchanges and brokers, and outlines disclosure requirements for companies that issue publicly offered securities. The Chilean Companies Act and the Securities Market Law, both as amended, state rules regarding takeovers, tender offers, transactions with related parties, qualified majorities, share repurchases, directors’ committee, independent directors, stock options and derivative actions.
Public Register
Once the Spin-Off is effective, we will be a publicly held stock corporation incorporated under the laws of Chile. We will be constituted by a public deed issued by a Santiago Notary Public. In connection with the Spin-Off, we will also register in Chile with the SVS and the Commercial Registrar (Registro de Comercio del Conservador de Bienes Raíces y Comercio de Santiago) , as well as with the U.S. SEC.
Reporting Requirements Regarding Acquisition or Sale of Shares
Under Article 12 of the Securities Market Law and General Rule 269 of the SVS, certain information regarding transactions in shares of a publicly held stock corporation or in contracts or securities whose price or results depend on, or are conditioned in whole or in part on the price of such shares, must be reported to the SVS and the Chilean stock exchanges. Since ADSs are deemed to represent the shares of common stock underlying the ADRs, transactions in ADRs will be subject to these reporting requirements and those established in Circular 1375 of the SVS. Shareholders of publicly held stock corporations are required to report to the SVS and the Chilean stock exchanges:
| | • | | any direct or indirect acquisition or sale of shares made by a holder who owns, directly or indirectly, at least 10% of a publicly held stock corporation’s subscribed capital; |
140
| | • | | any direct or indirect acquisition or sale of contracts or securities whose price or results depend on or are conditioned in whole or in part on the price of shares made by a holder who owns, directly or indirectly, at least 10% of a publicly held stock corporation’s subscribed capital; |
| | • | | any direct or indirect acquisition or sale of shares made by a holder who, due to an acquisition of shares of such publicly held stock company, results in the holder acquiring, directly or indirectly, at least 10% of a publicly held stock company’s subscribed capital; and |
| | • | | any direct or indirect acquisition or sale of shares in any amount, made by a director, receiver, principal executive, general manager or manager of a publicly held stock company. |
In addition, majority shareholders of a publicly held stock corporation must inform the SVS and the Chilean stock exchanges if such transactions are entered into with the intention of acquiring control of the company or if they are making a passive financial investment instead.
Under Article 54 of the Securities Market Law and General Rule 104 enacted by the SVS, any person who directly or indirectly intends to take control of a publicly held stock corporation must disclose this intent to the market at least ten business days in advance of the proposed change of control and, in any event, as soon as the negotiations for the change of control have taken place or reserved information of the publicly held stock corporation has been provided.
Corporate Objectives and Purposes
Article 4 of our by-laws provides that our corporate objectives and purposes are, among other things, to exploit the production, transportation, distribution and supply of electric power, as well as to provide engineering consultant services, directly or through other companies abroad and to make loans to related companies, combined entities and affiliates
Board of Directors
Our initial Board of Directors consists of nine members who were elected for an interim term at the ESM of the shareholders of Endesa Chile held on December 18, 2015 to hold office until the first OSM of the shareholders of Endesa Américas to be held in April 2016. At the 2016 OSM, the entire Board of Directors consisting of nine members will be elected to a three-year term. Following the end of their term, each director may be either re-elected or replaced.
The nine directors that will be elected at the OSM will be the nine individual nominees who receive the highest number of votes. Each shareholder may vote his shares in favor of one nominee or may apportion his shares among any number of nominees.
The effect of these voting provisions is to ensure that a shareholder owning more than 10% of our shares is able to secure the election of a member of the Board. A majority of the Board of Directors, five members, can be secured with more than 50% of the shares.
Normally, the compensation of the directors is established annually at the OSM. The compensation of the interim Board of Directors was established at the ESM of the shareholders of Endesa Chile held on December 18, 2015, and is similar to the current Endesa Chile’s director compensations. See “Item 6. Directors, Senior Management and Employees — B. Compensation.”
Future agreements that will be entered into by us with related parties can only be executed when such agreements serve our interest, and their price, terms and conditions are consistent with prevailing market conditions at the time of their approval and comply with all the requirements and procedures indicated in Article 147 of the Chilean Companies Act.
141
Certain Powers of the Board of Directors
Our by-laws provide that every agreement or contract that we enter into with our controlling shareholder, our directors or executives, or with our related parties, must be previously approved by two thirds of the Board of Directors and be included in the Board meetings, and must comply with the provisions of the Chilean Companies Act.
Our by-laws do not contain provisions relating to:
| | • | | the directors’ power, in the absence of an independent quorum, to vote on compensation for themselves or any members of their body; |
| | • | | borrowing powers exercisable by the directors and how such borrowing powers can be varied; |
| | • | | retirement or non-retirement of directors under an age limit requirement; or |
| | • | | number of shares, if any, required for directors’ qualification. |
Certain Provisions Regarding Shareholder Rights
Our capital is comprised of only one class of shares, all of which will be ordinary shares and have the same rights.
Our by-laws do not contain any provisions relating to:
| | • | | liability for capital reductions by us. |
Under Chilean law, the rights of our stockholders may only be modified by an amendment to the by-laws that complies with the requirements explained below under “Item 10. Additional Information — B. Memorandum and Articles of Association — Shareholders’ Meetings and Voting Rights.”
Capitalization
Under Chilean law, only the shareholders of a company acting at an ESM have the power to authorize a capital increase. When an investor subscribes for shares, these are officially issued and registered under his name, and the subscriber is treated as a shareholder for all purposes, except receipt of dividends and for return of capital in the event that the shares have been subscribed but not paid for. The subscriber becomes eligible to receive dividends only for the shares that he has actually paid for or, if the subscriber has paid for only a portion of such shares, the pro rata portion of the dividends declared with respect to such shares unless the company’s by-laws provide otherwise. If a subscriber does not fully pay for shares for which the subscriber has subscribed on or prior to the date agreed upon for payment, notwithstanding the actions intended by the company to collect payment, the company is entitled to auction the shares on the stock exchange where such shares are traded, for the account and risk of the debtor, the number of shares held by the debtor necessary for the company to pay the outstanding balances and disposal expenses. However, until such shares are sold at auction, the subscriber continues to hold all the rights of a shareholder, except the right to receive dividends and return of capital. The Chief Executive Officer or the person replacing him will reduce in the shareholders’ register the number of shares in the name of the debtor shareholder to the number of shares that remain, deducting the shares sold by the company and settling the debt in the amount necessary to cover the result of such disposal after the corresponding expenses. When there are authorized and issued shares for which full payment has not been made within the period fixed by shareholders at the same ESM at which the subscription was authorized (which in no case may exceed three years from the date of such meeting), these shall be reduced in the non-subscribed amount until that date. With respect to the shares subscribed and not paid following the term mentioned above, the Board must proceed to collect payment, unless the shareholders’ meeting authorizes (by two thirds of the voting shares)
142
a reduction of the company’s capital to the amount effectively collected, in which case the capital shall be reduced by force of law to the amount effectively paid. Once collection actions have been exhausted, the Board should propose to the shareholders’ meeting the approval by simple majority of the write-off of the outstanding balance and the reduction of capital to the amount effectively recovered.
Our subscribed and fully paid capital is expected to total Ch$ 779 billion and to consist of 8,201,754,580 shares.
Preemptive Rights and Increases of Share Capital
The Chilean Companies Act requires Chilean companies to grant shareholders preemptive rights to purchase a sufficient number of shares to maintain their existing ownership percentage of such company whenever such company issues new shares.
Under Chilean law, preemptive rights are exercisable or freely transferable by shareholders during a 30-day period. The options to subscribe for shares in capital increases of the company or of any other securities convertible into shares or that confer future rights over these shares, should be offered, at least once, to the shareholders pro rata to the shares held registered in their name at midnight on the fifth business day prior to the date of the start of the preemptive rights period. The preemptive rights offering and the start of the 30-day period for exercising them shall be communicated through the publication of a prominent notice, at least once, in the newspaper that should be used for notifications of shareholders’ meetings. During such 30-day period, and for an additional period of up to 30-days immediately following the initial 30-day period, publicly held stock corporations are not permitted to offer any unsubscribed shares to third parties on terms which are more favorable than those offered to their shareholders. At the end of the second 30-day period, a Chilean publicly held stock corporation is authorized to sell non-subscribed shares to third parties on any terms, provided they are sold on one of the Chilean stock exchanges.
Shareholders’ Meetings and Voting Rights
An OSM must be held within the first four months following the end of our fiscal year. An ESM may be called by the Board of Directors when deemed appropriate, or when requested by shareholders representing at least 10% of the issued shares with voting rights, or by the SVS. To convene an OSM or an ESM, notice must be given three times in a newspaper located in our corporate domicile. The newspaper designated by our shareholders is El Mercurio de Santiago. The first notice must be published not less than 15-days and no more than 20-days in advance of the scheduled meeting. Notice must also be mailed to each shareholder, to the SVS and to the Chilean stock exchanges.
The OSM shall be held on the day stated in the notice and should remain in session until having exhausted all the matters stated in the notice. However, once constituted, upon the proposal of the chairman or shareholders representing at least 10% of the shares with voting rights, the majority of the shareholders present may agree to suspend it and to continue it within the same day and place, with no new constitution of the meeting or qualification of powers being necessary, recorded in one set of minutes. Only those shareholders who were present or represented may attend the recommencement of the meeting with voting rights.
Under Chilean law, a quorum for a shareholders’ meeting is established by the presence, in person or by proxy, of shareholders representing at least a majority of the issued shares with voting rights of a company. If a quorum is not present at the first meeting, a reconvened meeting can take place at which the shareholders present are deemed to constitute a quorum regardless of the percentage of the shares represented. This second meeting must take place within 45-days following the scheduled date for the first meeting. Shareholders’ meetings adopt resolutions by the affirmative vote of a majority of those shares present or represented at the meeting. An ESM must be called to take the following actions:
| | • | | a transformation of the company into a form other than a publicly held stock corporation under the Chilean Companies Act, a merger or split-up of the company; |
143
| | • | | an amendment to the term of duration or early dissolution of the company; |
| | • | | a change in the company’s domicile; |
| | • | | a decrease of corporate capital; |
| | • | | an approval of capital contributions in kind and non-monetary assessments; |
| | • | | a modification of the authority reserved to shareholders or limitations on the Board of Directors; |
| | • | | a reduction in the number of members of the Board of Directors; |
| | • | | a disposition of 50% or more of the assets of the company, whether it includes disposition of liabilities or not, as well as the approval or the amendment of the business plan which contemplates the disposition of assets in an amount greater that such percentage; |
| | • | | the disposition of 50% or more of the assets of a combined entity, as long as such combined entity represents at least 20% of the assets of the corporation, as well as any disposition of its shares that results in the parent company losing its position as controller; |
| | • | | the form of distributing corporate benefits; |
| | • | | issue of guarantees for third-party liabilities which exceed 50% of the assets, except when the third party is a combined entity of the company, in which case approval of the Board of Directors is deemed sufficient; |
| | • | | the purchase of the company’s own shares; |
| | • | | other actions established by the by-laws or the laws; |
| | • | | certain remedies for the nullification of the company’s by-laws; |
| | • | | inclusion in the by-laws of the right to purchase shares from minority shareholders, when the controlling shareholders reaches 95% of the company’s shares by means of a tender offer for all of the company’s shares, where at least 15% of the shares have been acquired from unrelated shareholders; and |
| | • | | approval or ratification of acts or contracts with related parties. |
Regardless of the quorum present, the vote required for any of the actions above is at least two-thirds of the outstanding shares with voting rights.
By-law amendments for the creation of a new class of shares, or an amendment to or an elimination of those classes of shares that already exist, must be approved by at least two-thirds of the outstanding shares of the affected series.
Chilean law does not require a publicly held stock corporation to provide its shareholders the same level and type of information required by the securities laws regarding the solicitation of proxies. However, shareholders are entitled to examine the financial statements of a publicly held stock corporation within the 15-day period before its scheduled OSM. Under Chilean law, a notice of a shareholders meeting listing matters to be addressed at the meeting must be mailed at least 15 days prior to the date of such meeting, and, an indication of the way complete copies of the documents that support the matters submitted for voting can be obtained, which must also be made available to shareholders on our website. In the case of an OSM, our annual report of activities, which will include audited financial statements, must also be made available to shareholders and published on our website at:www.endesaamericas.cl.
The Chilean Companies Act provides that, upon the request by the Directors’ Committee or by shareholders representing at least 10% of the issued shares with voting rights, a Chilean company’s annual report must include, in addition to the materials provided by the Board of Directors to shareholders, such shareholders’
144
comments and proposals in relation to the company’s affairs. In accordance with Article 136 of the Chilean Companies Regulation (“Reglamento de Sociedades Anónimas”), the shareholder(s) holding or representing 10% or more of the shares issued with voting rights, may:
| | • | | make comments and proposals relating to the progress of the corporate businesses in the corresponding year, no shareholder being able to make individually or jointly more than one presentation. These observations should be presented in writing to the company concisely, responsibly and respectfully, and the respective shareholder(s) should state their willingness for these to be included as an appendix to the annual report. The board shall include in an appendix to the annual report of the year a faithful summary of the pertinent comments and proposals the interested parties had made, provided they are presented during the year or within 30-days after its ending; or |
| | • | | make comments and proposals on matters that the board submits for the knowledge or voting of the shareholders. The board shall include a faithful summary of those comments and proposals in all information it sends to shareholders, provided the shareholders’ proposal is received at the offices of the company at least 10-days prior to the date of dispatch of the information by the company. The shareholders should present their comments and proposals to the company, expressing their willingness for these to be included in the appendix to the respective annual report or in information sent to shareholders, as the case may be. The observations referred to in this Article may be made separately by each shareholder holding 10% or more of the shares issued with voting rights or shareholders who together hold that percentage, who should act as one. |
Similarly, the Chilean Companies Act provides that whenever the Board of Directors of a publicly held stock corporation convenes an OSM and solicits proxies for the meeting, or circulates information supporting its decisions or other similar material, it is obligated to include the pertinent comments and proposals that may have been made by the Directors’ Committee or by shareholders owning 10% or more of the shares with voting rights who request that such comments and proposals be so included.
Only shareholders registered as such with us, as of 11:59 p.m. on the fifth business day prior to the date of a meeting, will be entitled to attend and vote their shares. A shareholder may appoint another individual, who does not need to be a shareholder, as his proxy to attend the meeting and vote on his behalf. Proxies for such representation shall be given for all the shares held by the owner. The proxy may contain specific instructions to approve, reject, or abstain with respect to any of the matters submitted for voting at the meeting and which were included in the notice. Every shareholder entitled to attend and vote at a shareholders’ meeting shall have one vote for every share subscribed.
There are no limitations imposed by Chilean law or our by-laws on the right of nonresidents or foreigners to hold or vote shares of common stock. However, the registered holder of the shares of common stock represented by ADSs, and evidenced by outstanding ADSs, is the custodian of the depositary. Accordingly, holders of ADSs will not be entitled to receive notice of meetings of shareholders directly or to vote the underlying shares of common stock represented by ADS directly. A deposit agreement will contain provisions pursuant to which the depositary will agree to solicit instructions from registered holders of ADSs as to the exercise of the voting rights pertaining to the shares of common stock represented by the ADSs. Subject to compliance with the requirements of the deposit agreement and receipt of such instructions, the depositary will agree to endeavor, insofar as practicable and permitted under Chilean law and the provisions of the by-laws, to vote or cause to be voted (or grant a discretionary proxy to the Chairman of the Board of Directors or to a person designated by the Chairman of the Board of Directors to vote) the shares of common stock represented by the ADSs in accordance with any such instruction. The depositary shall not itself exercise any voting discretion over any shares of common stock underlying ADSs. If no voting instructions are received by the depositary from a holder of ADSs with respect to the shares of common stock represented by the ADSs, on or before the date established by the depositary for such purpose, the shares of common stock represented by the ADS, may be voted in the manner directed by the Chairman of the Board, or by a person designated by the Chairman of the Board, subject to limitations set forth in the deposit agreement.
145
Dividends and Liquidation Rights
According to the Chilean Companies Act, unless otherwise decided by unanimous vote of its issued shares eligible to vote, all companies must distribute a cash dividend in an amount equal to at least 30% of their combined net income, before amortization and negative goodwill for each year (calculated according to the local accounting rules that will apply to us when preparing financial statements to be submitted to the SVS), unless and except to the extent we have carried forward losses. The law provides that the Board of Directors must agree to the dividend policy and inform such policy to the shareholders at the OSM.
Any dividend in excess of 30% of net income may be paid, at the election of the shareholder, in cash, or in our shares, or in shares of publicly held corporations owned by us. Shareholders who do not expressly elect to receive a dividend other than in cash are legally presumed to have decided to receive the dividend in cash.
Dividends which are declared but not paid within the appropriate time period set forth in the Chilean Companies Act (as to minimum dividends, 30-days after declaration; as to additional dividends, the date set for payment at the time of declaration) are adjusted to reflect the change in the value of UF, from the date set for payment to the date such dividends are actually paid. Such dividends also accrue interest at the then-prevailing rate for UF-denominated deposits during such period. The right to receive a dividend lapses if it is not claimed within five years from the date such dividend is payable. Payments not collected in such period are transferred to the volunteer fire department.
In the event of our liquidation, the shareholders would participate in the assets available in proportion to the number of paid-in shares held by them, after payment to all creditors.
Approval of Financial Statements
The Board of Directors will be required to submit our combined financial statements to the shareholders annually for their approval. If the shareholders by a vote of a majority of shares present (in person or by proxy) at the shareholders’ meeting reject the financial statements, the Board of Directors must submit new financial statements no later than 60-days from the date of such meeting. If the shareholders reject the new financial statements, the entire Board of Directors is deemed removed from office and a new board is elected at the same meeting. Directors who individually approved such financial statements are disqualified for reelection for the following period.
Change of Control
The Capital Markets Law establishes a comprehensive regulation related to tender offers. The law defines a tender offer as the offer to purchase shares of companies which publicly offer their shares or securities convertibles into shares and which offer is made to shareholders to purchase their shares under conditions which allow the bidder to reach a certain percentage of ownership of the company within a fixed period of time. These provisions apply to both voluntary and hostile tender offers.
Acquisition of Shares
No provision in our by-laws discriminates against any existing or prospective holder of shares as a result of such shareholder owning a substantial number of shares. However, no person may directly or indirectly own more than 65% of the outstanding shares of our stock. The foregoing restriction will not apply to the depositary as record owner of shares represented by ADRs, but it will apply to each beneficial ADS holder. Additionally, our by-laws prohibit any shareholder from exercising voting power with respect to more than 65% of the common stock owned by such shareholder or on behalf of others representing more than 65% of the outstanding issued shares with voting rights.
146
Right of Dissenting Shareholders to Tender Their Shares
The Chilean Companies Act provides that upon the adoption of any of the resolutions enumerated below at a meeting of shareholders, dissenting shareholders acquire the right to withdraw from the company and to compel the company to repurchase their shares, subject to the fulfillment of certain terms and conditions. In order to exercise such withdrawal rights, holders of ADRs must first withdraw the shares represented by their ADRs pursuant to the terms of the deposit agreement.
“Dissenting” shareholders are defined as those who at a shareholders’ meeting vote against a resolution that results in the withdrawal right, or who if absent from such meeting, state in writing their opposition to the respective resolution, within the 30-days following the shareholders’ meeting. Shareholders present or represented at the meeting and who abstain in exercising their voting rights shall not be considered as dissenting. The right to withdraw should be exercised for all the shares that the dissenting shareholder had registered in their name on the date on which the right is determined to participate in the meeting at which the resolution is adopted that motivates the withdrawal and which remains on the date on which their intention to withdraw is communicated to the company.
The price paid to a dissenting shareholder of a publicly held stock corporation whose shares are quoted and actively traded on one of the Chilean stock exchanges, is the weighted average of the sales prices for the shares as reported on the Chilean stock exchanges on which the shares are quoted for the two-month period between the ninetieth and the thirtieth day before the shareholders’ meeting giving rise to the withdrawal right. If, because of the volume, frequency, number and diversity of the buyers and sellers, the SVS determines that the shares are not actively traded on a stock exchange, the price paid to the dissenting shareholder shall be the book value. Book value for this purpose shall equal paid capital plus reserves and profits, less losses, divided by the total number of subscribed shares, whether entirely or partially paid. For the purpose of making this calculation, the last combined statements of financial position is used, as adjusted to reflect inflation up to the date of the shareholders’ meeting which gave rise to the withdrawal right.
Article 126 of the Chilean Companies Act Regulations establishes that in cases where the right to withdraw arises, the company shall be obliged to inform the shareholders of this situation, the value per share that will be paid to shareholders exercising their right to withdraw and the term for exercising it. Such information should be given to shareholders at the same meeting at which the resolutions are adopted giving rise to the right of withdrawal, prior to its voting. A special communication should be given to the shareholders with rights, within two days following the date on which the rights to withdraw are born. In the case of publicly held companies, such information shall be communicated by a prominent notice in a newspaper with a wide national circulation and on its website, plus a written communication addressed to the shareholders with rights at the address they have registered with the company. The notice of the shareholders meeting that should pronounce on a matter that could originate withdrawal rights should mention this circumstance.
The resolutions that result in a shareholder’s right to withdraw include, among others, the following:
| | • | | the transformation of the company into an entity which is not a publicly held stock corporation governed by Chilean Companies Act; |
| | • | | the merger of the company with another company; |
| | • | | disposition of 50% or more of the assets of the company, whether it includes disposition of liabilities or not, as well as the approval or the amendment of the business plan which contemplates the disposition of assets in an amount greater than such percentage; |
| | • | | the disposition of 50% or more of the assets of a combined entity, as long as such combined entity represents at least 20% of the assets of the company, as well as any disposition of its shares that results in the parent company losing its position of controller; |
| | • | | issue of guarantees for third parties’ liabilities which exceed 50% of the assets (if the third party is a combined entity of the company, the approval of the Board of Directors is sufficient); |
147
| | • | | the creation of preferential rights for a class of shares or an amendment to the existing ones. In this case the right to withdraw only accrues to the dissenting shareholders of the class or classes of shares adversely affected; |
| | • | | certain remedies for the nullification of the corporate by-laws; and |
| | • | | such other causes as may be established by the law or by the company’s by-laws. |
Investments by AFPs
The Pension Funds’ System Law permits AFPs to invest their funds in companies that are subject to Title XII and, subject to greater restrictions than other companies. The determination of which stocks may be purchased by AFPs is made by the Risk Classification Committee. The Risk Classification Committee establishes investment guidelines and is empowered to approve or disapprove those companies that are eligible for AFP investments. We expect that after the Spin-Off, we will be a Title XII company and we will be approved by the Risk Classification Committee.
Title XII companies are required to have by-laws that limit the ownership of any shareholder to a specified maximum percentage, require that certain actions be taken only at a meeting of the shareholders, and give the shareholders the right to approve certain investment and financing policies.
Registrations and Transfers
Shares issued by us will be registered with an administrative agent, which we expect to be DCV Registros S.A. This entity will also be responsible for our shareholders registry. In case of jointly-owned shares, an attorney-in-fact must be appointed to represent the joint owners in dealing with us.
None.
The Central Bank of Chile is responsible for, among other things, monetary policies and exchange controls in Chile. Currently applicable foreign exchange regulations are set forth in the Compendium of Foreign Exchange Regulations (the “Compendium”) approved by the Central Bank of Chile in 2002. Appropriate registration of a foreign investment in Chile permits the investor access to the Formal Exchange Market. Foreign investments can be registered with the Foreign Investment Committee under D.L. 600 of 1974 or can be registered with the Central Bank of Chile under the Central Bank Act, Law 18840 of October 1989.
| a) | Foreign Investments Contracts and Chapter XIV |
The following is a summary of certain provisions of Chapter XIV that will be applicable to all shareholders (and ADS holders). This summary does not purport to be complete and is qualified in its entirety by reference to Chapter XIV. Chapter XIV regulates the following type of investments: credits, deposits, investments and equity contributions. A Chapter XIV investor may at any time repatriate an investment made in us upon sale of our shares, and the profits derived therefrom, with no monetary ceiling, subject to the then effective regulations, which must be reported to the Central Bank of Chile.
Except for compliance with tax regulations and some reporting requirements, currently there are no rules in Chile affecting repatriation rights, except that the remittance of foreign currency must be made through a Formal Exchange Market entity. However, the Central Bank of Chile has the authority to change such rules and impose exchange controls.
148
The Compendium and International Bond Issuances
Chilean issuers may offer bonds issued by the Central Bank of Chile internationally under Chapter XIV, as amended, of the Compendium.
Chilean Tax Considerations
The following discussion summarizes material Chilean income and withholding tax consequences to foreign holders arising from the ownership and disposition of shares and ADSs and, to the extent any are issued, rights and ADS rights. The summary that follows does not purport to be a comprehensive description of all of the tax considerations that may be relevant to a decision to purchase, own or dispose of shares or ADSs and rights or ADS rights, if any, and does not purport to deal with the tax consequences applicable to all categories of investors, some of which may be subject to special rules. Holders of shares and ADSs are advised to consult their own tax advisors concerning the Chilean and other tax consequences of the ownership of shares or ADSs.
The summary that follows is based on Chilean law, in effect on the date hereof, and is subject to any changes in these or other laws occurring after such date, possibly with retroactive effect. Under Chilean law, provisions contained in statutes such as tax rates applicable to foreign investors, the computation of taxable income for Chilean purposes and the manner in which Chilean taxes are imposed and collected may be amended only by another law. In addition, the Chilean tax authorities enact rulings and regulations of either general or specific application and interpret the provisions of the Chilean Income Tax Law. Chilean tax may not be assessed retroactively against taxpayers who act in good faith relying on such rulings, regulations and interpretations, but Chilean tax authorities may change their rulings, regulations and interpretations in the future. The discussion that follows is also based, in part, on representations of the depositary, and assumes that each obligation in the Deposit Agreement and any related agreements will be performed in accordance with its terms. As of this date, there is currently no applicable income tax treaty in effect between the United States and Chile. However, in 2010 the United States and Chile signed an income tax treaty that will enter into force once the treaty is ratified by both countries. There can be no assurance that the treaty will be ratified by either country. The following summary assumes that there is no applicable income tax treaty in effect between the United States and Chile.
As used in this information statement, the term “foreign holder” means either:
| | • | | in the case of an individual holder, a person who is not a resident of Chile; for purposes of Chilean taxation, an individual is resident of Chile if he or she has resided in Chile for more than six months in one calendar year, or a total of more than six months in two consecutive fiscal years; or |
| | • | | in the case of a legal entity holder, an entity that is not organized under the laws of Chile, unless the shares or ADSs are assigned to a branch, agent, representative or permanent establishment of such entity in Chile. |
Taxation of Shares and ADSs
Taxation of Cash Dividends and Property Distributions
General Rule: The following taxation of cash dividends and property distributions applies until 2016. Cash dividends paid with respect to the shares or ADSs held by a foreign holder will be subject to Chilean withholding tax, which is withheld and paid by the company. As described in the example below, the amount of the Chilean withholding tax is determined by applying a 35% rate to a “grossed-up” distribution amount (such amount equal to the sum of the actual distribution amount and the correlative Chilean corporate income tax paid by the issuer), and then subtracting as a credit such Chilean corporate income tax paid by the issuer. From 2004 through 2010, the Chilean corporate income tax rate was 17% and from 2011 until 2014, the rate was 20%.
In September 2014, a tax reform was enacted (Law 20,780), which, among other topics, progressively increased the corporate income tax (“CIT”). The CIT rate will be adjusted as follows: in 2014 it increased from
149
20% to 21%; in 2015 it increased to 22.5%; in 2016 it increases to 24%; in 2017, depending on which of the two new alternative systems enacted as part of the 2014 tax reform (discussed below) is chosen, the rate increases to 25% for companies electing the accrued income basis and 25.5% for companies electing the cash basis for shareholders. As of 2018, the CIT rate will remain at 25% for companies that elect the accrued income basis and it will increase to 27% for companies that elect the cash basis for shareholders.
The example below illustrates the effective Chilean withholding tax burden on a cash dividend received by a foreign holder, assuming a Chilean withholding tax base rate of 35%, an effective Chilean corporate income tax rate of 22.5 % (CIT rate for 2015) and a distribution of 50% of the net income of the company distributable after payment of the Chilean corporate income tax:
| | | | |
Line | | Concept and calculation assumptions | | Amount |
1 | | Company taxable income (based on Line 1 = 100) | | 100.0 |
2 | | Chilean corporate income tax : 22.5% x Line 1 | | 22.5 |
3 | | Net distributable income: Line 1 — Line 2 | | 77.5 |
4 | | Dividend distributed (50% of net distributable income): 50% of Line 3 | | 38.75 |
5 | | Withholding tax: (35% of (the sum of Line 4 and 50% of Line 2)) | | (17.5) |
6 | | Credit for 50% of Chilean corporate income tax : 50% of Line 2 | | 11.25 |
7 | | Net withholding tax : Line 5 + Line 6 | | (6.25) |
8 | | Net dividend received: Line 4 - Line 7 | | 32.5 |
9 | | Effective dividend withholding rate : Line 7 / Line 4 | | 16.13% |
In general, the effective Chilean dividend withholding tax rate, after giving effect to the credit for the Chilean corporate income tax paid by the company, can be computed using the following formula:
| | | | | | |
Effective Dividend | | | = | | | (Withholding tax rate) - (Chilean corporate income tax rate) |
Withholding Tax Rate | | | | | | 1 - (Chilean corporate income tax rate) |
Using the rates prevailing until 2015, the Effective Dividend Withholding Rate is
(35%-22.5%) / (100%-22.5%) = 16.13%
Dividends are generally assumed to have been paid out of our oldest retained profits for purposes of determining the level of Chilean corporate income tax that was paid by us. For information as to our retained earnings for tax purposes and the tax credit available on the distribution of such retained earnings, see Note 15 of the Notes to our interim combined financial statements.
Under Chilean Income Tax Law, dividend distributions made in property are subject to the same Chilean tax rules as cash dividends. Stock dividends that represent free shares distributed to foreign shareholders as a consequence of a capitalization made on the same corporation are not subject to Chilean taxation.
Exceptions: Despite the aforementioned general rule, there are special circumstances under which a different tax treatment would apply depending on the source of the income or due to special circumstances existing at the date of the dividend distribution. The most common special cases are briefly described below:
1) Circumstances where there is no CIT credit against the Chilean withholding tax: These cases are when: (i) profits paid as dividends (following the seniority rule indicated above) exceed a company’s taxable income (such dividend distributions in excess of a company’s taxable income determined as of December 31 of the distribution’s year will be subject to the Chilean withholding tax rate of 35%, without the CIT credit; in relation to the provisional withholding rule applicable on the date of the dividend payment, please see number 3 below); or (ii) the income was not subject to CIT due to an exemption of the Chilean corporate income tax, in which case the foreign holder will be also subject to the Chilean withholding tax rate of 35% without the CIT credit.
150
2) Circumstances where dividends have been attributed to income exempted from all the Chilean income taxes: In these cases, dividends distributed by a company to the foreign holder will not be subject to Chilean withholding tax. Income exempted from Chilean income tax is expressly listed in the Chilean Income Tax Law.
3) Circumstances where dividends are subject to a provisional withholding tax: In the event that on the date of the dividend distribution there are no earnings on which income tax has been paid and there are no tax-exempt earnings, a 35% Chilean withholding tax with a provisional 22.5% Chilean CIT credit is applicable. This provisional 22.5% Chilean corporate income tax credit must be confirmed with the information of a company’s taxable income as of December 31 of the year in which the dividend was paid. A company can agree with the foreign holders to withhold a higher amount in order to avoid under withholding of the Chilean withholding tax.
4) Circumstances when it is possible to use certain credits in Chile against income taxes paid abroad, or “foreign tax credit”: This occurs when dividends distributed by the Chilean company have income generated by companies domiciled in third countries as their source. If that income was subject to withholding tax or corporate income tax in those third countries, such income will have a credit or “foreign tax credit” against corresponding Chilean taxes, which can be proportionally transferred to the shareholders of a Chilean company.
New System in effect starting in 2017
The tax reform released in September 2014 created two alternative mechanisms of shareholder-level income taxation beginning on January 1, 2017: a) accrued income basis (known as attributed-income system in Chile) shareholder taxation and b) cash basis (known as partially-integrated system in Chile and most similar to the current system) shareholder taxation. On February 8, 2016, Law 20,899 was enacted, which made adjustments to the tax reform released in September 2014. Among other adjustments, Law 20,899 established that taxpayers who are individual entrepreneurs, individual limited liability companies, communities, stock companies and partnerships, are all required to declare shareholder-level income using the cash basis. Only taxpayers that are individual persons may choose to apply either of the aforementioned systems. The selection should be made before the end of 2016. Once the election is made, it will remain in effect for five years. If no regime is chosen by a taxpayer who is an individual person, the law states that the default system will be the accrued income basis.
In addition, Law 20,899 expanded the 100% CIT credit against the Chilean shareholder tax to taxpayers who are residents in countries with which Chile has an effective or signed tax treaty to avoid international double taxation prior to January 1, 2017, even if not yet in force as of such date. This is currently the status of the treaty signed between Chile and United States. This temporary rule will be in force from January 1, 2017 through December 31, 2019.
Shareholders would be taxed in Chile on income attributed to them as of the end of the tax year in which the income is generated, eliminating the taxable profits fund ledger (“FUT” in its Spanish acronym). These profits would be taxed at the shareholder level whether or not they are distributed. The underlying CIT paid at the entity level may be used by shareholders as a credit to reduce the Chilean shareholder tax. Therefore, the combined total company and shareholder Chilean income tax burden remains at 35%. Future distributions are not subject to taxation.
Taxpayers will be taxed on the income of companies in which they have an interest in the year such income is recognized, regardless of whether actual distributions are made, with the corresponding credit.
151
Taxation in two stages
| | |
• Company: | | 25% of accrued profits (using the maximum CIT applicable as of 2018). |
• Shareholder: | | 35% of accrued profits (whether or not distributions are received, with 100% credit of the CIT paid, resulting in an effective tax rate to the shareholder of 10%). |
Total Tax Burden: 35%
Progressive CIT tax rate increase: 21% in 2014, 22.5% in 2015, 24% in 2016 and 25% as of 2017.
Advantages to accrued income tax basis:
| | • | | CIT Rate of 25% vs. 27% for the cash basis. |
| | • | | Shareholders are granted 100% credit of taxes paid by a company. |
Disadvantages to accrued income tax basis:
| | • | | Shareholders are taxed on undistributed profits. |
| | • | | Shareholders of record must pay tax by December 31st (regardless of having received dividends). |
| | • | | Complex management for companies. |
A company pays CIT on its annual result. Foreign and local individual shareholders will only pay in Chile the relevant tax on effective profit distributions and will be allowed to use the tax paid by the distributing company as credit, with certain limitations. Only 65% of the CIT is creditable against the 35% shareholder-level tax (as opposed to 100% under the current FUT regime and under the accrued income basis). However, if there is an effective or signed tax treaty with Chile before January 1, 2017 (even if not in effect), the CIT is fully creditable against the 35% shareholder tax.
Taxation in two stages
| | |
• Company: | | 27% of accrued profits (using the maximum CIT applicable from 2018 and forward). |
• Shareholder: | | 35% of cash disbursement (65% of CIT tax is creditable against the shareholder level tax, resulting in an effective tax rate to the shareholder of 17.5%. However, if the shareholder is a resident of a country with an effective or signed tax treaty with Chile before January 1, 2017 (even if not in effect), CIT tax is fully creditable, resulting in an effective tax rate to the shareholder of 8%). |
Total Tax Burden: 44.45% (35% for residents of countries with tax treaties)
Advantages to cash basis:
| | • | | Shareholders are only taxed on actual distributions. |
| | • | | Shareholders must pay taxes only if they hold the share on the dividend distribution date. |
Disadvantages to cash basis:
| | • | | CIT Rate of 27% versus 25% for the accrued income basis. |
| | • | | Only shareholders residing in countries with an effective or signed tax treaty with Chile before January 1, 2017 (even if not in effect) are granted full CIT credit (others 65%). |
152
Taxation on sale or exchange of ADSs, outside of Chile
Gains obtained by a foreign holder from the sale or exchange of ADSs outside Chile will not be subject to Chilean taxation.
Taxation on sale or exchange of Shares
The Chilean Income Tax Law includes a tax exemption on capital gains arising from the sale of shares of listed companies traded in the stock markets. Although there are certain restrictions, in general terms, the amendment provides that in order to qualify for the capital gain exemption: (i) the shares must be of a publicly held stock corporation with a certain minimum level of trading on a stock exchange; (ii) the sale must be carried out in a Chilean stock exchange, or in a tender offer subject to Chapter XXV of the Chilean Securities Market Law; (iii) the shares which are being sold must have been acquired on a Chilean stock exchange, or in a tender offer subject to Chapter XXV of the Chilean Securities Market Law, or in an initial public offering (due to the creation of a company or to a capital increase), or due to the exchange of convertible bonds; and (iv) the shares must have been acquired after April 19, 2001.
If the shares do not qualify for the above exemption, capital gains on their sale or exchange of shares (as distinguished from sales or exchanges of ADSs representing such shares of common stock) could be subject to two alternative tax regimes: (a) the general tax regime, with a 22.5% Chilean corporate income tax and a 35% Chilean withholding tax, the former being creditable against the latter; or (b) a 22.5% Chilean corporate income tax as sole tax regime, when all the following circumstances are met: (i) the sale is made between unrelated parties, (ii) the sale of shares is not a recurrent or habitual activity for the seller and (iii) at least one year has elapsed between the acquisition and the sale of the shares.
The date of acquisition of the ADSs is considered to be the date of acquisition of the shares for which the ADSs are exchanged.
Taxation of Rights and ADS Rights
For Chilean tax purposes and to the extent we issue any rights or ADS rights, the receipt of rights or ADS rights by a foreign holder of shares or ADSs pursuant to a rights offering is a nontaxable event. In addition, there are no Chilean income tax consequences to foreign holders upon the exercise or the lapse of the rights or the ADS rights.
Any gain on the sale, exchange or transfer of any ADS rights by a foreign holder is not subject to taxes in Chile.
Any gain on the sale, exchange or transfer of the rights by a foreign holder is subject to a 35% Chilean withholding tax.
Currently, there are no rights that are outstanding.
Other Chilean Taxes
There is no gift, inheritance or succession tax applicable to the ownership, transfer or disposition of ADSs by foreign holders, but such taxes will generally apply to the transfer at death or by gift of the shares by a foreign holder. There is no Chilean stamp, issue, registration or similar taxes or duties payable by holders of shares or ADSs.
Material U.S. Income Tax Considerations
This discussion is based on the Internal Revenue Code of 1986, as amended (the “Code”), administrative pronouncements, judicial decisions and final, temporary and proposed Treasury regulations, all as of the date
153
hereof. These authorities are subject to change, possibly with retroactive effect. This discussion assumes that the depositary’s activities are clearly and appropriately defined so as to ensure that the tax treatment of ADSs will be identical to the tax treatment of the underlying shares.
The following are the material U.S. federal income tax consequences to U.S. Holders (as defined herein) of receiving, owning, and disposing of shares or ADSs, but it does not purport to be a comprehensive description of all of the tax considerations that may be relevant to a particular person’s decision to hold such securities and is based on the assumption stated above under “Chilean Tax Considerations” that there is no applicable income tax treaty in effect between the United States and Chile. The discussion applies only if the beneficial owner holds shares or ADSs as capital assets for U.S. federal income tax purposes and it does not describe all of the tax consequences that may be relevant in light of the beneficial owner’s particular circumstances. For instance, it does not describe all the tax consequences that may be relevant to:
| | • | | certain financial institutions; |
| | • | | dealers and traders in securities who use a mark-to-market method of tax accounting; |
| | • | | persons holding shares or ADSs as part of a “straddle” integrated transaction or similar transaction; |
| | • | | persons whose functional currency for U.S. federal income tax purposes is not the U.S. dollar; |
| | • | | partnerships or other entities classified as partnerships for U.S. federal income tax purposes; |
| | • | | persons liable for the alternative minimum tax; |
| | • | | tax-exempt organizations; |
| | • | | persons holding shares or ADSs that own or are deemed to own ten percent or more of our stock; or |
| | • | | persons holding shares or ADSs in connection with a trade or business conducted outside of the United States. |
If an entity classified as a partnership for U.S. federal income tax purposes holds shares or ADSs, the U.S. federal income tax treatment of a partner will generally depend on the status of the partner and upon the activities of the partnership. Partnerships holding shares or ADSs and partners in such partnerships should consult their tax advisors as to the particular U.S. federal income tax consequences of holding and disposing of the shares or ADSs.
You will be a “U.S. Holder” for purposes of this discussion if you become a beneficial owner of our shares or ADSs and if you are, for U.S. federal income tax purposes:
| | • | | a citizen or individual resident of the United States; or |
| | • | | a corporation, or other entity taxable as a corporation, created or organized in or under the laws of the United States or any political subdivision thereof; or |
| | • | | an estate, the income of which is subject to U.S. federal income taxation regardless of its source; or |
| | • | | a trust (i) that validly elects to be treated as a U.S. person for U.S. federal income tax purposes or (ii) if (A) a court within the United States is able to exercise primary supervision over the administration of the trust and (B) one or more U.S. persons have the authority to control all substantial decisions of the trust. |
In general, if a beneficial owner owns ADSs, such owner will be treated as the owner of the shares represented by those ADSs for U.S. federal income tax purposes. Accordingly, no gain or loss will be recognized if a beneficial owner exchanges ADSs for the underlying shares represented by those ADSs.
The U.S. Treasury has expressed concerns that parties to whom ADSs are released before shares are delivered to the depositary (pre-release) or intermediaries in the chain of ownership between beneficial owners
154
and the issuer of the security underlying the ADSs may be taking actions that are inconsistent with the claiming of foreign tax credits for beneficial owners of depositary shares. Such actions would also be inconsistent with the claiming of the reduced tax rate, described below, applicable to dividends received by certain non-corporate beneficial owners. Accordingly, the analysis of the creditability of Chilean taxes, and the availability of the reduced tax rate for dividends received by certain non-corporate holders, each described below, could be affected by actions taken by such parties or intermediaries.
This discussion assumes that we will not be a passive foreign investment company, as described below.
Beneficial owners should consult their tax advisors with respect to their particular tax consequences of owning or disposing of shares or ADSs, including the applicability and effect of state, local, non-U.S. and other tax laws and the possibility of changes in tax laws.
Taxation of Distributions
The following discussion is based on the current regime for taxation of cash dividends and distributions applicable in Chile until 2016. For 2017 and later, the U.S. federal income tax treatment will depend on which of the two regimes we elect to adopt. See “— Chilean Tax Considerations — Taxation of shares and ADSs — Taxation of Cash Dividends and Property Distributions” above.
Distributions paid on shares or ADSs other than certain pro rata distributions of shares of common stock will be treated as dividends taxable as ordinary income to the extent paid out of our current or accumulated earnings and profits (as determined under U.S. federal income tax principles). Because we do not maintain calculations of our earnings and profits under U.S. federal income tax principles, it is expected that distributions generally will be reported as dividends.
If a beneficial owner is a U.S. Holder, subject to applicable limitations and the discussion above regarding concerns expressed by the U.S. Treasury, dividends paid by qualified foreign corporations to the beneficial owner that is not a corporation are taxable at a maximum rate of 20%. A foreign company is treated as a qualified foreign corporation with respect to dividends paid on stock that is readily tradable on an established securities market in the United States, such as the New York Stock Exchange where our ADSs are traded. Beneficial owners should consult their tax advisors to determine whether the favorable rate will apply to dividends they receive and whether they are subject to any special rules that limit their ability to be taxed at this favorable rate.
The amount of a dividend will include the net amount withheld by us in respect of Chilean withholding taxes on the distribution. The amount of the dividend will be treated as foreign-source dividend income to a beneficial owner and will not be eligible for the dividends-received deduction generally allowed to U.S. corporations under the Code. Dividends will be included in a beneficial owner’s income on the date of the beneficial owner’s, or in the case of ADSs, the Depositary’s receipt of the dividend. The amount of any dividend paid in Chilean pesos will be a U.S. dollar amount calculated by reference to the exchange rate for converting Chilean pesos into U.S. dollars in effect on the date of such receipt regardless of whether the payment is in fact converted into U.S. dollars. If the dividend is converted into U.S. dollars on the date of receipt, a beneficial owner generally should not be required to recognize foreign currency gain or loss in respect of the dividend income. A beneficial owner may have foreign currency gain or loss if the dividend is converted into U.S. dollars on a date after the date of receipt.
Subject to applicable limitations that may vary depending upon a beneficial owner’s circumstances and subject to the discussion above regarding concerns expressed by the U.S. Treasury, the net amount of Chilean withholding tax (after reduction for the credit for Chilean corporate income tax, as discussed above under “— Chilean Tax Considerations — Taxation of Shares and ADSs — Taxation of Cash Dividends and Property Distributions” above) withheld from dividends on shares or ADSs will be creditable against a beneficial owner’s U.S. federal income tax liability. The rules governing foreign tax credits are complex and, therefore, a beneficial
155
owner should consult the beneficial owner’s tax advisor regarding the availability of foreign tax credits in the beneficial owner’s particular circumstances. Instead of claiming a credit, a beneficial owner may, at the beneficial owner’s election, deduct such Chilean taxes in computing the beneficial owner’s taxable income, subject to generally applicable limitations under U.S. law. An election to deduct foreign taxes instead of claiming foreign tax credits applies to all taxes paid or accrued in the taxable year to foreign countries and possessions of the United States.
Sale or Other Disposition of Shares or ADSs
If a beneficial owner is a U.S. Holder, for U.S. federal income tax purposes, the gain or loss a beneficial owner realizes on the sale or other disposition of shares or ADSs will be a capital gain or loss, and will be a long-term capital gain or loss if the beneficial holder has held the shares or ADSs for more than one year. The amount of a beneficial owner’s gain or loss will equal the difference between the beneficial owner’s tax basis in the shares or ADSs disposed of and the amount realized on the disposition, in each case as determined in U.S. dollars. Such gain or loss will generally be U.S.-source gain or loss for foreign tax credit purposes. In addition, certain limitations exist on the deductibility of capital losses by both corporate and individual taxpayers.
In certain circumstances, Chilean taxes may be imposed upon the sale of shares. See “— Chilean Tax Considerations — Taxation of Shares and ADSs.” If a Chilean tax is imposed on the sale or disposition of shares, and a beneficial owner that is a U.S. Holder does not receive significant foreign source income from other sources, such beneficial owner may not be able to credit such Chilean tax against the beneficial owner’s U.S. federal income tax liability.
Passive Foreign Investment Company Rules
We believe that we will not be a “passive foreign investment company” (“PFIC”) for U.S. federal income tax purposes for our 2016 taxable year or for the foreseeable future. However, because PFIC status depends upon the composition of a company’s income and assets and the market value of its assets from time to time, and because it is unclear whether certain types of our income constitute passive income for PFIC purposes, there can be no assurance that we will not be considered a PFIC for any taxable year. If we were to become a PFIC for any taxable year during which a beneficial owner held shares or ADSs, certain adverse consequences could apply to the beneficial owner, including the imposition of higher amounts of tax than would otherwise apply, and additional filing requirements. Beneficial owners should consult their tax advisors regarding the consequences to them if we were a PFIC, as well as the availability and advisability of making any election that might mitigate the adverse consequences of PFIC status.
Information Reporting and Backup Withholding
Payments of dividends and sales proceeds that are made within the United States or through certain U.S.-related financial intermediaries generally are subject to information reporting and to backup withholding unless (i) the beneficial owner is an exempt recipient or (ii) in the case of backup withholding, the beneficial owner provides a correct taxpayer identification number and certifies that the beneficial owner is not subject to backup withholding.
The amount of any backup withholding from a payment to a beneficial owner will be allowed as a credit against the beneficial owner’s U.S. federal income tax liability and may entitle the beneficial owner to a refund, provided that the required information is furnished in a timely fashion to the Internal Revenue Service.
Medicare Contribution Tax
Legislation enacted in 2010 generally imposes a tax of 3.8% on the “net investment income” of certain individuals, trusts and estates. Among other items, net investment income generally includes gross income from
156
dividends and net gain attributable to the disposition of certain property, like the shares or ADSs, less certain deductions. A beneficial owner should consult the beneficial owner’s tax advisor regarding the possible application of this legislation in the beneficial owner’s particular circumstances.
Beneficial owners should consult their tax advisors with respect to the particular consequences to them of receiving, owning or disposing of shares or ADSs.
| F. | Dividends and Paying Agents. |
The paying agent for shareholders is expected to be DCV. The paying agent for holders of our ADRs listed on the NYSE is expected to be Citibank N.A.
Not applicable.
We will be subject to the information requirements of the Exchange Act, except that as a foreign issuer, we are not subject to SEC proxy rules (other than general anti-fraud rules) or the short-swing profit disclosure rules of the Exchange Act. In accordance with these statutory requirements, we will file or furnish reports and other information with the SEC. Reports and other information that we will file or furnish with the SEC may be inspected and copied at the public reference facilities maintained by the SEC at Room 1024, 100 F Street, N.E., Washington, D.C. 20549. Copies of such material may also be inspected at the offices of the New York Stock Exchange, at 11 Wall Street, New York, New York 10005, on which our ADSs are expected to be listed. In addition, the SEC maintains a website that contains electronically filed information, which can be accessed at http://www.sec.gov.
| I. | Combined entity Information. |
Not applicable.
Item 11. Quantitative and Qualitative Disclosures About Market Risk
We are exposed to risks arising from changes in commodity prices, interest rates and foreign exchange rates. These risks are monitored and managed by Endesa Chile in coordination with Enersis, its parent company. Endesa Américas, together with Enersis Américas, will continue to monitor and manage such risks following the Spin-Off. Endesa Chile’s Board of Directors approves risk management policies at all levels and Endesa Américas will also continue to do so, with respect to the Non-Chilean Business, after the Spin-Off.
Commodity Price Risk
In our electricity generation business, we are exposed to market risks arising from the price volatility of electricity, natural gas, diesel oil, and coal. Natural gas is used in some of our power plants in the countries in which we operate. We seek to ensure our fuel supply by securing long-term contracts with our suppliers for periods that are expected to match the lifetime of our generation assets. These contracts generally have provisions that allow us to purchase natural gas with a pricing formula that combines Henry Hub natural gas and Brent diesel oil at market prices prevailing at the time the purchase occurs. As of September 30, 2015 and 2014, and December 31, 2014, 2013 and 2012, we did not hold contracts classified as derivative financial instruments or financial instruments related to natural gas. In the countries where we operate using coal and diesel oil, the dispatch mechanism allows the thermal power plants to cover their operational costs. However, under certain circumstances, fuel price fluctuations might affect marginal costs. As of September 30, 2015 and 2014, and
157
December 31, 2014, 2013 and 2012, we did not hold contracts classified as derivative financial instruments or financial instruments related to coal and diesel oil. Additionally, through adequate commercial risk mitigation policies, and a hydro-thermal power plant mix, we seek to protect our operating income from electricity price volatility. As of September 30, 2015 and December 31, 2014, we did not hold electricity price-sensitive instruments.
We are continually analyzing ways to hedge commodity price risk, like transferring commodity price variations to the customer’s contract prices and permanently adjusting the commodity indexed price formulas for new Power Purchase Agreements (“PPAs”) according to our exposure and/or analyzing ways to mitigate risk through hydrological insurance in dry years. In the future we may use price-sensitive instruments.
Interest Rate and Foreign Currency Risk
The carrying values of our debt as of September 30, 2015, are detailed below, according to maturity. Total values do not include the effect of derivatives.
| | | | | | | | | | | | | | | | | | | | | | | | | | | | | | | | |
| | | Expected maturity date | |
For the year ended December 31, | | 2015 | | | 2016 | | | 2017 | | | 2018 | | | 2019 | | | Thereafter | | | Total | | | Fair
Value(2) | |
| | | (in millions of Ch$)(1) | |
Fixed Rate | | | | | | | | | | | | | | | | | | | | | | | | | | | | | | | | |
US$ | | | 2,390 | | | | 20,035 | | | | 2,901 | | | | 9,714 | | | | 7,646 | | | | 37,458 | | | | 80,146 | | | | 81,548 | |
Weighted average interest rate | | | 0.7 | % | | | 4.5 | % | | | 1.6 | % | | | 5.0 | % | | | 5.9 | % | | | 2.8 | % | | | 3.7 | % | | | — | |
Other currencies(3) | | | 9,958 | | | | 6,100 | | | | 1,488 | | | | 21 | | | | 5,420 | | | | 170,314 | | | | 193,300 | | | | 226,332 | |
Weighted average interest rate | | | 7.3 | % | | | 18.0 | % | | | 28.5 | % | | | 10.9 | % | | | 6.3 | % | | | 10.1 | % | | | 10.2 | % | | | — | |
| | | | | | | | | | | | | | | | | | | | | | | | | | | | | | | | |
Total fixed rate | | | 12,349 | | | | 26,135 | | | | 4,389 | | | | 9,736 | | | | 13,066 | | | | 207,772 | | | | 273,446 | | | | 307,880 | |
Weighted average interest rate | | | 6.0 | % | | | 7.7 | % | | | 10.7 | % | | | 5.0 | % | | | 6.1 | % | | | 8.7 | % | | | 8.3 | % | | | — | |
| | | | | | | | |
Variable Rate | | | | | | | | | | | | | | | | | | | | | | | | | | | | | | | | |
US$ | | | 6,802 | | | | 41,319 | | | | 17,862 | | | | 17,734 | | | | — | | | | — | | | | 83,716 | | | | 83,716 | |
Weighted average interest rate | | | 9.2 | % | | | 2.6 | % | | | 2.1 | % | | | 2.0 | % | | | — | | | | — | | | | 2.9 | % | | | — | |
Other currencies(3) | | | 53,956 | | | | 105,050 | | | | 51,905 | | | | 58,297 | | | | 90,127 | | | | 394,079 | | | | 753,414 | | | | 759,176 | |
Weighted average interest rate | | | 6.8 | % | | | 9.1 | % | | | 10.8 | % | | | 9.8 | % | | | 9.1 | % | | | 8.5 | % | | | 8.8 | % | | | — | |
| | | | | | | | | | | | | | | | | | | | | | | | | | | | | | | | |
Total variable rate | | | 60,758 | | | | 146,369 | | | | 69,767 | | | | 76,030 | | | | 90,127 | | | | 394,079 | | | | 837,129 | | | | 842,892 | |
Weighted average interest rate | | | 7.0 | % | | | 7.3 | % | | | 8.5 | % | | | 8.0 | % | | | 9.1 | % | | | 8.5 | % | | | 8.2 | % | | | — | |
| | | | | | | | | | | | | | | | | | | | | | | | | | | | | | | | |
Total | | | 73,106 | | | | 172,504 | | | | 74,156 | | | | 85,766 | | | | 103,194 | | | | 601,850 | | | | 1,110,575 | | | | 1,150,772 | |
| | | | | | | | | | | | | | | | | | | | | | | | | | | | | | | | |
| (1) | Calculated based on the Observed Exchange Rate as of September 30, 2015, which was Ch$ 698.72 per US$ 1.00. |
| (2) | As of September 30, 2015, fair value was calculated based on the discounted value of future cash flows expected to be paid (or received), considering current discount rates that reflect the different risks involved. |
| (3) | “Other currencies” include the Brazilian real, Colombian peso, Argentine peso and Peruvian Nuevo Sol. |
158
The carrying values of our debt as of September 30, 2014, are detailed below, according to maturity. Total values do not include the effect of derivatives.
| | | | | | | | | | | | | | | | | | | | | | | | | | | | | | | | |
| | | Expected maturity date | |
For the year ended December 31, | | 2014 | | | 2015 | | | 2016 | | | 2017 | | | 2018 | | | Thereafter | | | Total | | | Fair
Value(2) | |
| | | (in millions of Ch$)(1) | |
Fixed Rate | | | | | | | | | | | | | | | | | | | | | | | | | | | | | | | | |
US$ | | | 90,407 | | | | 4,817 | | | | 12,994 | | | | 1,009 | | | | 7,001 | | | | 17,130 | | | | 133,359 | | | | 169,555 | |
Weighted average interest rate | | | 7.5 | % | | | 6.2 | % | | | 5.9 | % | | | 3.3 | % | | | 5.9 | % | | | 6.4 | % | | | 7.0 | % | | | — | |
Other currencies(3) | | | 1,227 | | | | 2,669 | | | | 3,034 | | | | 184 | | | | — | | | | 228,001 | | | | 235,115 | | | | 291,759 | |
Weighted average interest rate | | | 26.1 | % | | | 31.5 | % | | | 31.5 | % | | | 31.0 | % | | | — | | | | 10.0 | % | | | 10.6 | % | | | — | |
| | | | | | | | | | | | | | | | | | | | | | | | | | | | | | | | |
Total fixed rate | | | 91,635 | | | | 7,486 | | | | 16,027 | | | | 1,193 | | | | 7,001 | | | | 245,131 | | | | 368,474 | | | | 461,315 | |
Weighted average interest rate | | | 7.7 | % | | | 15.2 | % | | | 10.8 | % | | | 7.6 | % | | | 5.9 | % | | | 9.7 | % | | | 9.3 | % | | | — | |
| | | | | | | | |
Variable Rate | | | | | | | | | | | | | | | | | | | | | | | | | | | | | | | | |
US$ | | | 3,575 | | | | 28,907 | | | | 48,670 | | | | 29,766 | | | | 15,046 | | | | — | | | | 125,965 | | | | 125,965 | |
Weighted average interest rate | | | 2.7 | % | | | 8.0 | % | | | 3.0 | % | | | 2.7 | % | | | 3.9 | % | | | — | | | | 4.2 | % | | | — | |
Other currencies(3) | | | 1,518 | | | | 81,814 | | | | 11,102 | | | | 62,576 | | | | 76,470 | | | | 639,097 | | | | 872,579 | | | | 950,177 | |
Weighted average interest rate | | | 28.4 | % | | | 9.6 | % | | | 19.0 | % | | | 8.4 | % | | | 8.3 | % | | | 7.1 | % | | | 7.7 | % | | | — | |
| | | | | | | | | | | | | | | | | | | | | | | | | | | | | | | | |
Total variable rate | | | 5,093 | | | | 110,721 | | | | 59,772 | | | | 92,343 | | | | 91,517 | | | | 639,097 | | | | 998,543 | | | | 1,076,141 | |
Weighted average interest rate | | | 10.4 | % | | | 9.2 | % | | | 5.9 | % | | | 6.6 | % | | | 7.6 | % | | | 7.1 | % | | | 7.3 | % | | | — | |
| | | | | | | | | | | | | | | | | | | | | | | | | | | | | | | | |
Total | | | 96,728 | | | | 118,207 | | | | 75,799 | | | | 93,536 | | | | 98,518 | | | | 884,229 | | | | 1,367,017 | | | | 1,537,456 | |
| | | | | | | | | | | | | | | | | | | | | | | | | | | | | | | | |
| (1) | Calculated based on the Observed Exchange Rate as of September 30, 2014, which was Ch$ 599.22 per US$ 1.00. |
| (2) | As of September 30, 2014, fair value was calculated based on the discounted value of future cash flows expected to be paid (or received), considering current discount rates that reflect the different risks involved. |
| (3) | “Other currencies” include the Brazilian real, Colombian peso, Argentine peso and Peruvian Nuevo Sol. |
The carrying values of our debt as of December 31, 2014, are detailed below, according to maturity. Total values do not include the effect of derivatives.
| | | | | | | | | | | | | | | | | | | | | | | | | | | | | | | | |
| | | Expected maturity date | |
For the year ended December 31, | | 2015 | | | 2016 | | | 2017 | | | 2018 | | | 2019 | | | Thereafter | | | Total | | | Fair
Value(2) | |
| | | (in millions of Ch$)(1) | |
Fixed Rate | | | | | | | | | | | | | | | | | | | | | | | | | | | | | | | | |
US$ | | | 6,698 | | | | 13,791 | | | | 1,656 | | | | 7,724 | | | | 5,984 | | | | 35,784 | | | | 71,637 | | | | 75,517 | |
Weighted average interest rate | | | 4.4 | % | | | 5.5 | % | | | 2.1 | % | | | 5.3 | % | | | 6.3 | % | | | 2.1 | % | | | 3.6 | % | | | — | |
Other currencies(3) | | | 3,366 | | | | 3,028 | | | | 184 | | | | — | | | | 5,075 | | | | 191,924 | | | | 203,577 | | | | 255,534 | |
Weighted average interest rate | | | 30.7 | % | | | 31.8 | % | | | 31.9 | % | | | — | | | | 6.3 | % | | | 10.1 | % | | | 10.7 | % | | | — | |
| | | | | | | | | | | | | | | | | | | | | | | | | | | | | | | | |
Total fixed rate | | | 10.065 | | | | 16,819 | | | | 1,840 | | | | 7,724 | | | | 11,059 | | | | 227,708 | | | | 275,214 | | | | 331,051 | |
Weighted average interest rate | | | 13.2 | % | | | 10.3 | % | | | 5.1 | % | | | 5.3 | % | | | 6.3 | % | | | 8.8 | % | | | 8.8 | % | | | — | |
| | | | | | | | |
Variable Rate | | | | | | | | | | | | | | | | | | | | | | | | | | | | | | | | |
US$ | | | 31,510 | | | | 47,041 | | | | 30,140 | | | | 15,235 | | | | — | | | | — | | | | 123,928 | | | | 123,928 | |
Weighted average interest rate | | | 8.6 | % | | | 2.2 | % | | | 2.7 | % | | | 3.8 | % | | | — | | | | — | | | | 4.1 | % | | | — | |
Other currencies(3) | | | 71,008 | | | | 16,277 | | | | 55,322 | | | | 65,651 | | | | 102,128 | | | | 446,549 | | | | 756,934 | | | | 814,731 | |
Weighted average interest rate | | | 10.8 | % | | | 12.1 | % | | | 8.8 | % | | | 8.5 | % | | | 7.8 | % | | | 7.2 | % | | | 8.0 | % | | | — | |
| | | | | | | | | | | | | | | | | | | | | | | | | | | | | | | | |
Total variable rate | | | 102.518 | | | | 63,318 | | | | 85,462 | | | | 80,886 | | | | 102,128 | | | | 446,549 | | | | 880,862 | | | | 938,659 | |
Weighted average interest rate | | | 10.1 | % | | | 4.8 | % | | | 6.6 | % | | | 7.6 | % | | | 7.8 | % | | | 7.2 | % | | | 7.4 | % | | | — | |
| | | | | | | | | | | | | | | | | | | | | | | | | | | | | | | | |
Total | | | 112,583 | | | | 80,137 | | | | 87,302 | | | | 88,610 | | | | 113,187 | | | | 674,257 | | | | 1,156,076 | | | | 1,269,710 | |
| | | | | | | | | | | | | | | | | | | | | | | | | | | | | | | | |
| (1) | Calculated based on the Observed Exchange Rate as of December 31, 2014, which was Ch$ 606.75 per US$ 1.00. |
| (2) | As of December 31, 2014, fair value was calculated based on the discounted value of future cash flows expected to be paid (or received), considering current discount rates that reflect the different risks involved. |
| (3) | “Other currencies” include the Brazilian real, Colombian peso, Argentine peso and Peruvian Nuevo Sol. |
159
The carrying values of our debt as of December 31, 2013, are detailed below, according to maturity. Total values do not include the effect of derivatives.
| | | | | | | | | | | | | | | | | | | | | | | | | | | | | | | | |
| | | Expected maturity date | |
For the year ended December 31, | | 2014 | | | 2015 | | | 2016 | | | 2017 | | | 2018 | | | Thereafter | | | Total | | | Fair
Value(2) | |
| | | (in millions of Ch$)(1) | |
Fixed Rate | | | | | | | | | | | | | | | | | | | | | | | | | | | | | | | | |
US$ | | | 81,028 | | | | 3,334 | | | | 10,492 | | | | — | | | | 5,246 | | | | 14,776 | | | | 114,876 | | | | 142,613 | |
Weighted average interest rate | | | 7.3 | % | | | 6.9 | % | | | 6.1 | % | | | — | | | | 6.3 | % | | | 6.4 | % | | | 7.0 | % | | | — | |
Other currencies(3) | | | 51,568 | | | | — | | | | — | | | | — | | | | — | | | | 209,979 | | | | 261,548 | | | | 365,581 | |
Weighted average interest rate | | | 11.7 | % | | | — | | | | — | | | | — | | | | — | | | | 10.0 | % | | | 10.3 | % | | | — | |
| | | | | | | | | | | | | | | | | | | | | | | | | | | | | | | | |
Total fixed rate | | | 132,597 | | | | 3,334 | | | | 10,492 | | | | — | | | | 5,246 | | | | 224,756 | | | | 376,424 | | | | 499,194 | |
Weighted average interest rate | | | 9.0 | % | | | 6.9 | % | | | 6.1 | % | | | — | | | | 6.3 | % | | | 9.8 | % | | | 9.3 | % | | | — | |
| | | | | | | | |
Variable Rate | | | | | | | | | | | | | | | | | | | | | | | | | | | | | | | | |
US$ | | | 19,947 | | | | 17,281 | | | | 20,913 | | | | 26,060 | | | | 13,173 | | | | — | | | | 97,374 | | | | 97,374 | |
Weighted average interest rate | | | 7.0 | % | | | 3.3 | % | | | 2.9 | % | | | 2.7 | % | | | 3.9 | % | | | — | | | | 3.9 | % | | | — | |
Other currencies(3) | | | 18,892 | | | | 74,847 | | | | 10,067 | | | | 57,357 | | | | 70,481 | | | | 428,403 | | | | 660,047 | | | | 741,493 | |
Weighted average interest rate | | | 11.6 | % | | | 8.4 | % | | | 16.9 | % | | | 6.4 | % | | | 7.6 | % | | | 6.4 | % | | | 7.1 | % | | | — | |
| | | | | | | | | | | | | | | | | | | | | | | | | | | | | | | | |
Total variable rate | | | 38,839 | | | | 92,128 | | | | 30,980 | | | | 83,417 | | | | 83,654 | | | | 428,403 | | | | 757,421 | | | | 838,867 | |
Weighted average interest rate | | | 9.3 | % | | | 7.4 | % | | | 7.4 | % | | | 5.3 | % | | | 7.0 | % | | | 6.4 | % | | | 6.7 | % | | | — | |
| | | | | | | | | | | | | | | | | | | | | | | | | | | | | | | | |
Total | | | 171,436 | | | | 95,462 | | | | 41,472 | | | | 83,417 | | | | 88,900 | | | | 653,159 | | | | 1,133,845 | | | | 1,338,061 | |
| | | | | | | | | | | | | | | | | | | | | | | | | | | | | | | | |
| (1) | Calculated based on the Observed Exchange Rate as of December 31, 2013, which was Ch$ 524.61 per US$ 1.00. |
| (2) | As of December 31, 2014, fair value was calculated based on the discounted value of future cash flows expected to be paid (or received), considering current discount rates that reflect the different risks involved. |
| (3) | “Other currencies” include the Brazilian real, Colombian peso, Argentine peso and Peruvian Nuevo Sol. |
Interest Rate Risk
At September 30, 2015 and 2014, 68% and 62%, respectively, of our outstanding net debt obligations were subject to variable interest rates.
At December 31, 2014 and 2013, 64% and 51%, respectively, of our outstanding net debt obligations were subject to variable interest rates.
We manage interest rate risk by maintaining a mixture of both variable and fixed rate debt, according to a policy that will be approved by our Board of Directors. Additionally, we manage interest rate risk through the use of interest rate derivatives. The above percentages include the effect of interest rate derivatives (swaps) that hedge part of our debt.
As of September 30, 2015, the carrying values for financial reporting purposes and the corresponding fair value of the instruments that hedge our interest rate risk exposure were as follows:
| | | | | | | | | | | | | | | | | | | | | | | | | | | | | | | | |
| | | Expected Maturity Date | |
For the year ended December 31, | | 2015 | | | 2016 | | | 2017 | | | 2018 | | | 2019 | | | Thereafter | | | Total | | | Fair
Value(2) | |
| | | (in millions of Ch$)(1) | |
Variable to fixed rates | | | — | | | | — | | | | 24,095 | | | | — | | | | — | | | | — | | | | 24,095 | | | | (448 | ) |
Fixed to variable rates | | | — | | | | — | | | | — | | | | — | | | | — | | | | — | | | | — | | | | — | |
| | | | | | | | | | | | | | | | | | | | | | | | | | | | | | | | |
Total | | | — | | | | — | | | | 24,095 | | | | — | | | | — | | | | — | | | | 24,095 | | | | (448 | ) |
| | | | | | | | | | | | | | | | | | | | | | | | | | | | | | | | |
| (1) | Calculated based on the Observed Exchange Rate as of September 30, 2015, which was Ch$ 698.72 per US$ 1.00. |
160
| (2) | Fair values were calculated based on the discounted value of future cash flows expected to be paid (or received), considering current discount rates that reflect the different risks involved. |
By comparison, as of September 30, 2014, the carrying values for financial reporting purposes and the corresponding fair value of the instruments that hedge for our interest rate risk exposure were as follows:
| | | | | | | | | | | | | | | | | | | | | | | | | | | | | | | | |
| | | Expected Maturity Date | |
For the year ended December 31, | | 2014 | | | 2015 | | | 2016 | | | 2017 | | | 2018 | | | Thereafter | | | Total | | | Fair
Value(2) | |
| | | (in millions of Ch$)(1) | |
Variable to fixed rates | | | — | | | | — | | | | — | | | | 27,858 | | | | — | | | | — | | | | 27,858 | | | | (646 | ) |
Fixed to variable rates | | | — | | | | — | | | | — | | | | — | | | | — | | | | — | | | | — | | | | — | |
| | | | | | | | | | | | | | | | | | | | | | | | | | | | | | | | |
Total | | | — | | | | — | | | | — | | | | 27,858 | | | | — | | | | — | | | | 27,858 | | | | (646 | ) |
| | | | | | | | | | | | | | | | | | | | | | | | | | | | | | | | |
| (1) | Calculated based on the Observed Exchange Rate as of September 30, 2014, which was Ch$ 599.22 per US$ 1.00. |
| (2) | Fair values were calculated based on the discounted value of future cash flows expected to be paid (or received), considering current discount rates that reflect the different risks involved. |
As of December 31, 2014, the carrying values for financial reporting purposes and the corresponding fair value of the instruments that hedge for our interest rate risk exposure were as follows:
| | | | | | | | | | | | | | | | | | | | | | | | | | | | | | | | |
| | | Expected Maturity Date | |
As of December 31, | | 2015 | | | 2016 | | | 2017 | | | 2018 | | | 2019 | | | Thereafter | | | Total | | | Fair
Value(2) | |
| | | (in millions of Ch$)(1) | |
Variable to fixed rates | | | — | | | | — | | | | 26,700 | | | | — | | | | — | | | | — | | | | 26,700 | | | | (581 | ) |
Fixed to variable rates | | | — | | | | — | | | | — | | | | — | | | | — | | | | — | | | | — | | | | — | |
| | | | | | | | | | | | | | | | | | | | | | | | | | | | | | | | |
Total | | | — | | | | — | | | | 26,700 | | | | — | | | | — | | | | — | | | | 26,700 | | | | (581 | ) |
| | | | | | | | | | | | | | | | | | | | | | | | | | | | | | | | |
| (1) | Calculated based on the Observed Exchange Rate as of December 31, 2014, which was Ch$ 606.75 per US$ 1.00. |
| (2) | Fair values were calculated based on the discounted value of future cash flows expected to be paid (or received), considering current discount rates that reflect the different risks involved. |
By comparison, as of December 31, 2013, the carrying values for financial reporting purposes and the corresponding fair value of the instruments that hedge for our interest rate risk exposure were as follows:
| | | | | | | | | | | | | | | | | | | | | | | | | | | | | | | | |
| | | Expected Maturity Date | |
For the year ended December 31, | | 2014 | | | 2015 | | | 2016 | | | 2017 | | | 2018 | | | Thereafter | | | Total | | | Fair
Value(2) | |
| | | (in millions of Ch$)(1) | |
Variable to fixed rates | | | — | | | | — | | | | — | | | | 28,300 | | | | — | | | | — | | | | 28,300 | | | | (903 | ) |
Fixed to variable rates | | | — | | | | — | | | | — | | | | — | | | | — | | | | — | | | | — | | | | — | |
| | | | | | | | | | | | | | | | | | | | | | | | | | | | | | | | |
Total | | | — | | | | — | | | | — | | | | 28,300 | | | | — | | | | — | | | | 28,300 | | | | (903 | ) |
| | | | | | | | | | | | | | | | | | | | | | | | | | | | | | | | |
| (1) | Calculated based on the Observed Exchange Rate as of December 31, 2013, which was Ch$ 524.61 per US$1.00. |
| (2) | Fair values were calculated based on the discounted value of future cash flows expected to be paid (or received), considering current discount rates that reflect the different risks involved. |
161
Foreign Currency Risk
Our corporate currency risk policy will be approved by our Board of Directors after the completion of the Spin-Off. Our policy will seek to maintain a balance between the currency in which cash flows are indexed and the currency of the principal debt of each company. Most of our combined entities have access to funding in the same currency as their revenues, therefore reducing the exchange rate volatility impact. In some cases, we cannot fully benefit from this, and therefore, we try to manage the exposure with financial derivatives such as cross currency swaps or currency forwards, among others. However, this may not always be possible due to market conditions. It is the case, for example, of Costanera in Argentina which has its revenues linked to the Argentine peso, and a substantial part of its debt is denominated in U.S. dollars, with no possibility of hedging this debt under reasonable conditions. Argentine combined entities’ debt denominated in U.S. dollars amounted to Ch$ 43.9 billion as of September 30, 2015.
As of September 30, 2015, 2014 and December 31, 2014 we did not hold derivatives to hedge our foreign currency risk.
As of December 31, 2013 the carrying values for financial reporting purposes and the corresponding fair value of the instruments that hedge for our interest rate risk were as follows:
| | | | | | | | | | | | | | | | | | | | | | | | | | | | | | | | |
| | | Expected Maturity Date | |
For the year ended December 31, | | 2014 | | | 2015 | | | 2016 | | | 2017 | | | 2018 | | | Thereafter | | | Total | | | Fair
Value(2) | |
| | | (in millions of Ch$)(1) | |
US$ to other currencies(3) | | | — | | | | — | | | | — | | | | — | | | | — | | | | — | | | | — | | | | — | |
Other currencies to US$(4) | | | 4,605 | | | | — | | | | — | | | | — | | | | — | | | | — | | | | 4,605 | | | | 121 | |
| | | | | | | | | | | | | | | | | | | | | | | | | | | | | | | | |
Total | | | 4,605 | | | | — | | | | — | | | | — | | | | — | | | | — | | | | 4,605 | | | | 121 | |
| | | | | | | | | | | | | | | | | | | | | | | | | | | | | | | | |
| (1) | Calculated based on the Observed Exchange Rate as of December 31, 2013, which was Ch$ 524.61 per US$1.00. |
| (2) | Fair values were calculated based on the discounted value of future cash flows expected to be paid (or received), considering current discount rates that reflect the different risks involved. |
| (3) | “Other currencies” include the Brazilian real, Colombian peso, Argentine peso and Peruvian Nuevo Sol. |
| (4) | Includes a Peruvian soles to US dollar hedge of Edegel (Chinango). |
The information in this “Item 11. Quantitative and Qualitative Disclosures About Market Risk,” contains information that may constitute forward-looking statements. See “Forward-Looking Statements” in the Introduction of this information statement for safe harbor provisions.
Item 12. Description of Securities Other Than Equity Securities
Not applicable.
Not applicable.
Not applicable.
162
| D. | American Depositary Shares |
Endesa Américas is expected to appoint Citibank, N.A. as depositary pursuant to a deposit agreement (“Deposit Agreement”). Citibank, N.A.’s depositary offices are located at 388 Greenwich Street, New York, New York 10013. The terms and provisions of the Deposit Agreement is expected to be substantially the same as the Deposit Agreement entered into by Endesa Chile. Upon the execution of the Deposit Agreement, Endesa Américas will file the Deposit Agreement with the SEC and a copy of the Deposit Agreement will be obtainable from the SEC’s Public Reference Room at 100 F Street, N.E., Washington, D.C. 20549 and from the SEC’s website (www.sec.gov). The depositary typically appoints a custodian to safe keep the securities on deposit. In the case of Endesa Américas, the custodian is expected to be Banco Santander (Chile), located at Bandera 140, Santiago, Chile.
The following is a summary description of the material terms of the Deposit Agreement to be entered into by Endesa Américas and Endesa Américas’ ADSs to be issued thereunder. This summary is based on the terms of the deposit agreement of Endesa Chile and the actual terms of the Deposit Agreement entered into by Endesa Américas may be different. Please remember that summaries by their nature lack the precision of the information summarized and that rights and obligations as an owner of Endesa Américas ADSs will be determined by reference to the terms of the Deposit Agreement and not by this summary.
Each Endesa Américas ADS will represent 30 shares of common stock of Endesa Américas on deposit with the custodian. An ADS will also represent any other property received by the depositary or the custodian on behalf of the owner of the ADS but that has not been distributed to the owners of ADSs because of legal restrictions or practical considerations.
If you become an owner of ADSs, you will become a party to the Deposit Agreement and therefore will be bound to its terms and to the terms of the ADR that represents your ADSs. The Deposit Agreement and the ADR will specify the rights and obligations of Endesa Américas as well as your rights and obligations as owner of ADSs and those of the depositary. As an ADS holder you will be appointing the depositary to act on your behalf in certain circumstances. The Deposit Agreement and the ADRs will be governed by New York law. However, Endesa Américas’ obligations to the holders of shares of Endesa Américas common stock will continue to be governed by the laws of Chile, which are different from New York law.
As an owner of ADSs, you may hold your ADSs either by means of an ADR registered in your name, through a brokerage or safekeeping account, or through an account established by the depositary in your name reflecting the registration of uncertificated ADSs directly on the books of the depositary (commonly referred to as the “direct registration system” or “DRS”). The direct registration system reflects the uncertificated (book-entry) registration of ownership of ADSs by the depositary. Under the direct registration system, ownership of ADSs is evidenced by periodic statements issued by the depositary to the holders of the ADSs. The direct registration system includes automated transfers between the depositary and the Depository Trust Company, or DTC, the central book-entry clearing and settlement system for equity securities in the United States. If you decide to hold your ADSs through your brokerage or safekeeping account, you must rely on the procedures of your broker or bank to assert your rights as an ADS owner. Banks and brokers typically hold securities such as the ADSs through clearing and settlement systems such as DTC. The procedures of such clearing and settlement systems may limit your ability to exercise your rights as an owner of ADSs. All ADSs held through DTC will be registered in the name of a nominee of DTC. This summary description assumes you have opted to own the ADSs directly by means of an ADR registered in your name and, as such, we will refer to you as the “holder.” When we refer to “you,” we assume the reader owns ADSs and will own ADSs at the relevant time.
Dividends and Distributions
As a holder, you will generally have the right to receive the distributions made by Endesa Américas on the securities deposited with the custodian. Your receipt of these distributions may be limited, however, by practical
163
considerations and legal limitations. Holders will receive such distributions under the terms of the Deposit Agreement in proportion to the number of ADSs held as of a specified record date.
Distributions of Cash
Upon receipt by the custodian of a cash distribution for the securities on deposit, the depositary will arrange for the funds to be converted into U.S. dollars and for the distribution of the U.S. dollars to the holders. The conversion into U.S. dollars will take place only if reasonable, in the judgment of the depositary, if the U.S. dollars are transferable to the United States and if permitted by Chilean law and regulations and, if in effect, the foreign exchange agreements among the Central Bank of Chile, the depositary and Endesa Américas. The amounts distributed to holders will be net of the fees, expenses, taxes and governmental charges payable by holders under the terms of the Deposit Agreement. The depositary will apply the same method for distributing the proceeds of the sale of any property, such as undistributed rights, held by the custodian in respect of securities on deposit.
Distributions of Shares
Upon receipt of a dividend or free distribution of shares, the depositary may and will, at the request of Endesa Américas, distribute to holders, in proportion to the number of ADSs held, new ADSs representing the shares of common stock deposited. Only whole new ADSs will be distributed. Fractional entitlements will be sold and the proceeds of such sale will be distributed as in the case of a cash distribution.
The distribution of new ADSs upon a distribution of shares of common stock will be made net of the fees, expenses, taxes and governmental charges payable by holders under the terms of the Deposit Agreement. In order to pay such taxes or governmental charges, the depositary may sell all or a portion of the new shares of common stock so distributed.
No such distribution of new ADSs will be made if it would violate a law, including the U.S. securities laws. If the depositary does not distribute new ADSs as described above, it will sell the shares of common stock received and will distribute the proceeds of the sale as in the case of a distribution of cash.
Distributions of Rights
If Endesa Américas offers to its holders of shares rights to purchase additional ADSs, the depositary will have discretion as to the procedures to follow in making such rights available to the holders of ADSs or selling such rights on behalf of holders and making the net proceeds available in U.S. dollars to such holders. If requested by Endesa Américas, the depositary will take the following actions:
| | • | | If at the time of the offering the depositary determines that it is lawful and feasible to make such rights available to holders, the depositary will distribute such rights to holders in proportion to the number of ADSs held, or the depositary will employ such other method as it may deem feasible in order to facilitate the exercise, sale or transfer of rights by such holders; |
| | • | | If at the time of the offering the depositary determines that it is not lawful or not feasible to make such rights available to holders, or if the rights are not exercised and appear about to lapse, the depositary in its discretion may sell such rights at public or private sale, and may allocate the net proceeds of any such sale, upon an averaged or other practicable basis; or |
| | • | | If by the terms of the offering or for any other reason the depositary cannot make those rights available to the holders, then the depositary may allow those rights to lapse. |
If the distribution of rights requires the rights to be registered under the Securities Act, the depositary will not distribute such rights unless and until such registration statement is in effect, or unless the transaction is exempt from registration under the provisions of the Securities Act.
164
If the depositary has distributed the rights to holders of ADSs, the depositary will exercise such rights on behalf of the holders upon receipt of the following:
| | • | | payment of the purchase price for the share to be purchased upon the exercise of the right; |
| | • | | a duly completed and signed exercise instruction; and |
| | • | | payment of the applicable fee and charges. |
The depositary will sell the rights that are not exercised or not distributed if such sale is lawful. The proceeds of such sale will be distributed to holders as in the case of a cash distribution. If the depositary is unable to sell the rights, it will allow the rights to lapse.
Elective Distributions
Whenever Endesa Américas intends to distribute a dividend payable at the election of shareholders either in cash or in additional shares, Endesa Américas will give prior notice thereof to the depositary and will indicate whether Endesa Américas wishes the elective distribution to be made available to you. In such case, Endesa Américas will assist the depositary in determining whether such distribution is lawful and reasonably practicable.
The depositary will make the election available to you only if it is reasonably practicable and if Endesa Américas provides all of the documentation contemplated in the Deposit Agreement. In such case, the depositary will establish procedures to enable you to elect to receive either cash or additional ADSs, in each case as described in the Deposit Agreement.
If the election is not made available to you, you will receive either cash or additional ADSs, depending on what a shareholder in Chile would receive upon failing to make an election, as more fully described in the Deposit Agreement.
Other Distributions
Whenever Endesa Américas distributes property other than cash, shares of common stock or rights to purchase additional shares of Endesa Américas common stock, the depositary will consult with Endesa Américas to the extent practicable and distribute such property to holders of ADSs in proportion to the number of ADSs held, in any manner that the depositary, with consent of Endesa Américas, deems equitable and practicable for accomplishing the distribution.
If the depositary determines that such distribution cannot be made proportionately among the holders of ADRs, or for any other reason the depositary deems such distribution not to be reasonably practicable, the depositary may, with our approval, adopt such distribution method, including a sale, as it deems equitable and practicable.
If the depositary sells such property, the net proceeds of such sale will be distributed to holders as in the case of a cash distribution, net of fees, expenses, taxes or governmental charges payable by holders under the Deposit Agreement.
The proceeds of such a sale will be distributed to holders as in the case of a cash distribution.
Changes Affecting Shares of Common Stock
The shares of common stock held on deposit for ADSs may change from time to time. For example, there may be a change in nominal or par value, a split-up, cancellation, consolidation or classification of such shares of common stock or a recapitalization, reorganization, merger, consolidation or sale of assets.
165
If any such change were to occur, your ADSs would, to the extent permitted by law, represent the right to receive the property received or exchanged in respect of the shares of common stock held on deposit. The depositary may, with our approval, or at the request of Endesa Américas, in such circumstances deliver new ADSs to you or call for the exchange of your existing ADSs for new ADSs. If the depositary may not lawfully distribute such property to you, the depositary may sell such property and distribute the net proceeds to you as in the case of a cash distribution.
Redemption
To the extent permitted by applicable law, whenever Endesa Américas decides to redeem any of the securities on deposit with the custodian, Endesa Américas will notify the depositary in advance. If it is practicable and if Endesa Américas provides all of the documentation contemplated in the Deposit Agreement, the depositary will provide notice of the redemption to the holders of ADSs.
The custodian will be instructed to surrender the shares being redeemed against payment of the applicable redemption price. The depositary will convert the redemption funds received into U.S. dollars upon the terms of the Deposit Agreement and will establish procedures to enable holders of ADSs to receive the net proceeds from the redemption upon surrender of their ADSs to the depositary. You may have to pay fees, expenses, taxes and other governmental charges upon the redemption of your ADSs. If less than all ADSs are being redeemed, the ADSs to be retired will be selected by lot or on a pro rata basis, as the depositary may determine.
Issuance of ADSs Upon Deposit of Shares of Common Stock
The depositary may create ADSs on your behalf if you or your broker deposits shares of common stock with the custodian. The depositary will deliver these ADSs to the person you indicate only after you pay any applicable issuance fees and any charges and taxes payable for the transfer of the shares of common stock to the custodian.
The issuance of ADSs may be delayed until the depositary or the custodian receives confirmation that all required approvals have been given and that the shares of common stock have been duly transferred to the custodian. The depositary will only issue ADSs in whole numbers.
When you make a deposit of shares of common stock, you will be responsible for transferring good and valid title to the depositary. As such, you will be deemed to represent and warrant that:
| | • | | The shares are duly authorized, validly issued, fully paid, non assessable and legally obtained. |
| | • | | All preemptive (and similar) rights, if any, with respect to such shares have been validly waived or exercised. |
| | • | | You are duly authorized to deposit the shares. |
| | • | | The shares presented for deposit are free and clear of any lien, encumbrance, security interest, charge, mortgage or adverse claim, and are not, and the ADSs issuable upon such deposit will not be, “restricted securities” (as defined in the Deposit Agreement). |
| | • | | The shares presented for deposit have not been stripped of any rights or entitlements. |
If any of the representations or warranties is incorrect in any way, Endesa Américas and the depositary may, at your cost and expense, take any and all actions necessary to attempt to correct the consequences of the misrepresentations.
166
Transfer, Combination and Split Up of ADRs
As an ADR holder, you will be entitled to transfer, combine or split up your ADRs and the ADSs evidenced thereby. For transfers of ADRs, you will have to surrender the ADRs to be transferred to the depositary and also must:
| | • | | duly deliver the ADRs to the depositary at its principal office |
| | • | | ensure that the surrendered ADR certificate is properly endorsed or otherwise in proper form for transfer; |
Withdrawal of Shares Upon Cancellation of ADSs
As a holder, you will be entitled to present your ADSs to the depositary for cancellation and then receive the underlying shares of common stock at the custodian’s offices. In order to withdraw the shares of common stock represented by your ADSs, you will be required to pay to the depositary the fees for cancellation of ADSs and any charges and taxes payable upon the transfer of the shares of common stock being withdrawn. You assume the risk for delivery of all funds and securities upon withdrawal. Once canceled, the ADSs will not have any rights under the Deposit Agreement.
If you hold an ADS registered in your name, the depositary may ask you to provide proof of identity and genuineness of any signature and certain other documents as the depositary may deem appropriate before it will cancel your ADSs. The withdrawal of the shares of common stock represented by your ADSs may be delayed until the depositary receives satisfactory evidence of compliance with all applicable laws and regulations. Please keep in mind that the depositary will only accept ADSs for cancellation that represent a whole number of securities on deposit.
You will have the right to withdraw the securities represented by your ADSs at any time except for:
| | • | | Temporary delays that are caused by clearing of the transfer books for the shares of common stock or the ADSs or the payment of dividends. |
| | • | | Obligations to pay fees, taxes and similar charges. |
| | • | | Restrictions imposed due to laws or regulations applicable to ADSs or the withdrawal of deposited securities. |
The Deposit Agreement may not be modified to impair your right to withdraw the securities represented by your ADSs except to comply with mandatory provisions of law.
Voting Rights
As a holder, you will generally have the right under the Deposit Agreement to instruct the depositary to exercise the voting rights for the shares of common stock represented by your ADSs. The voting rights of holders of shares of common stock are described in “Item 10. Additional Information — B. Memorandum and Articles of Association — Description of Share Capital — Shareholders’ Meetings and Voting Rights.”
The depositary will mail to you any notice of a shareholders’ meeting received from Endesa Américas together with information explaining how to instruct the depositary to exercise the voting rights of the securities represented by ADSs.
If the depositary timely receives voting instructions from a holder of ADSs, it will endeavor insofar as practicable to vote the securities represented by the holder’s ADSs in accordance with such voting instructions.
Please note that the ability of the depositary to carry out voting instructions may be limited by practical and legal limitations and the terms of the securities on deposit. There will be no assurance that you will receive voting materials in time to enable you to return voting instructions to the depositary in a timely manner.
167
If the depositary does not receive your voting instructions in a timely manner you will nevertheless be treated as having instructed the depositary to give a discretionary proxy with full power of substitution to our Chairman of the Board or to a person designated by him to vote the shares represented by your ADSs in his/her discretion. The depositary will deliver such discretionary proxy to vote on any matter other than:
| | • | | substantial opposition exists by holders of ADSs, it being understood that an election of directors at an annual or extraordinary meeting of shareholders is not a contested matter involving substantial opposition; |
| | • | | matters that materially and adversely affect the rights of holders of ADSs; |
| | • | | any matter as to which the Chairman of the Board directs the depositary that he or she does not wish such proxy to be given. |
Fees and Charges
The holders of Endesa Américas ADSs are expected to be required to pay the following fees of the depositary:
| | |
Service Fees | | Fees |
| Issuance of ADS upon deposit of shares (i.e., an issuance upon a deposit of shares or upon a change in the ADS(s)-to-share(s) ratio), excluding issuances as a result of distributions described in paragraph (4) below | | Up to US$5 per 100 ADSs (or fraction thereof) issued. |
| |
| Delivery of deposited securities against surrender of ADS | | Up to US$5 per 100 ADSs (or fraction thereof) surrendered. |
| |
| Distribution of cash dividends or other cash distributions (i.e., sale of rights and other entitlements) | | Up to US$5 per 100 ADSs (or fraction thereof) held. |
| |
| Distribution of ADS pursuant to (i) stock dividends or other free stock distributions, or (ii) exercise of rights to purchase additional ADS | | Up to US$5 per 100 ADSs (or fraction thereof) held. |
| |
| Distribution of securities other than ADS or rights to purchase additional ADS (i.e., spin-off of shares) | | Up to US$5 per 100 ADSs (or fraction thereof) held. |
| |
| Depositary services | | Up to US$5 per 100 ADSs (or fraction thereof) held on the applicable record date(s) established by the depositary. |
As an ADS holder you will also be responsible to pay certain fees and expenses incurred by the depositary and certain taxes and governmental charges such as:
| | • | | Fees for the transfer, exchange or registration of shares of common stock, such as upon deposit and withdrawal of shares of common stock. |
| | • | | Expenses incurred for converting foreign currency into U.S. dollars. |
| | • | | Expenses for cable, telex and fax transmissions and for delivery of securities. |
| | • | | Taxes and other governmental charges upon the transfer of securities, such as when shares of common stock are deposited or withdrawn from deposit. |
| | • | | Fees and expenses incurred in connection with the delivery or servicing of shares of common stock on deposit. |
Endesa Américas will agree to pay certain other charges and expenses of the depositary. Note that the fees and charges you may be required to pay may vary over time and may be changed by us and by the depositary. You will receive prior notice of such changes.
168
Amendments and Termination
Endesa Américas may agree with the depositary to modify the Deposit Agreement at any time without your consent. Endesa Américas will undertake to give holders 30 days’ prior notice of any modifications that increase any fees or charges or that would materially prejudice any of their existing substantial rights under the Deposit Agreement, except in very limited circumstances enumerated in the Deposit Agreement.
You will be bound by the modifications to the Deposit Agreement if you continue to hold your ADSs after the modifications to the Deposit Agreement become effective. The Deposit Agreement cannot be amended to prevent you from withdrawing the shares of common stock represented by your ADSs, except as permitted by law.
Endesa Américas will have the right to direct the depositary to terminate the Deposit Agreement. Similarly, the depositary may in certain circumstances on its own initiative terminate the Deposit Agreement. In either case, the depositary must give notice to the holders at least 30 days before termination. Until termination, your rights under the Deposit Agreement will be unaffected.
After termination, the depositary will continue to collect distributions received (but will not distribute any such property until you request the cancellation of your ADSs) and may sell the securities held on deposit. After the sale, the depositary will hold the proceeds from such sale and any other funds then held for the holders of ADSs in a non-interest bearing account. At that point, the depositary will have no further obligations to holders other than to account for the funds then held for the holders of ADSs still outstanding (after deduction of applicable fees, taxes and expenses).
Books of Depositary
The depositary will maintain ADS holder records at its depositary office. You may inspect such records at such office at all reasonable times but solely for the purpose of communicating with other holders in the interest of matters relating to the ADSs, the Deposit Agreement or our business.
The depositary will maintain in New York facilities to record and process the issuance, cancellation, combination, split-up and transfer of ADRs. These facilities may be closed from time to time, to the extent not prohibited by law.
Limitations on Obligations and Liabilities
The Deposit Agreement will limit Endesa Américas’ obligations and the depositary’s obligations to you. Please note the following:
| | • | | Endesa Américas and the depositary will be obligated only to take the actions specifically stated in the Deposit Agreement without negligence or bad faith. |
| | • | | The depositary disclaims any liability for any failure to carry out voting instructions, for any manner in which a vote is cast or for the effect of any vote, provided it acts in good faith and in accordance with the terms of the Deposit Agreement. |
| | • | | Endesa Américas and the depositary will not be obligated to perform any act that is inconsistent with the terms of the Deposit Agreement. |
| | • | | Endesa Américas and the depositary disclaim any liability if we or the depositary are prevented or forbidden from, or delayed in, doing or performing any act or thing required by the terms of the Deposit Agreement, by reason of any provision, present or future of any law or regulation, or by reason of any present or future provision of foreign exchange contract or our by-laws, or any provision of or governing the securities on deposit, or by reason of any act of God or war or other circumstances beyond our control. |
| | • | | We and the depositary disclaim any liability by reason of the performance or non-performance or delay in the performance of any act or thing that may be done in their discretion. |
169
| | • | | We and the depositary disclaim any liability by reason of any exercise or failure to exercise discretion contemplated in the Deposit Agreement. |
| | • | | We and the depositary also disclaim liability for the inability by a holder to benefit from any distribution, offering, right or other benefit that is made available to holders of shares but is not, under the terms of the Deposit Agreement, made available to you. |
| | • | | We and the depositary may rely without any liability upon any written notice, request or other document believed to be genuine and to have been signed or presented by the proper parties. |
| | • | | We and the depositary also disclaim liability for any consequential or punitive damages resulting from any breach of the terms of the Deposit Agreement. |
Pre-Release Transactions
The depositary may, in certain circumstances, issue ADSs before receiving a deposit of shares or release shares of common stock before receiving ADSs. These transactions are commonly referred to as “pre-release transactions”. The Deposit Agreement limits the aggregate size of pre-release transactions and imposes a number of conditions on such transactions, including the need to receive collateral, the type of collateral required and the representations required from brokers. The depositary may retain the compensation received from the pre-release transactions.
Taxes
You will be responsible for the taxes and other governmental charges payable on the ADSs and the securities represented by the ADSs. We, the depositary and the custodian may deduct from any distribution the taxes and governmental charges payable by holders and may sell any and all property on deposit to pay the taxes and governmental charges payable by holders. You will be liable for any deficiency if the sale proceeds do not cover the taxes that are due.
The depositary may refuse to issue ADSs, to deliver transfer, split and combine ADRs or to release securities on deposit until all taxes and charges are paid by the applicable holder. The depositary and the custodian may take reasonable administrative actions to obtain tax refunds and reduce tax withholding for any distribution on behalf of holders of ADSs. However, you may be required to provide to the depositary and to the custodian proof of taxpayer status and residence and such other information as the depositary and the custodian may require to fulfill legal obligations. You are required to indemnify us, the depositary and the custodian for any claims with respect to taxes based on any tax benefit obtained for you.
Foreign Currency Conversion
The depositary will arrange for the conversion of all foreign currency received into U.S. dollars if such conversion can be done on a practicable basis and will distribute the U.S. dollars in accordance with the terms of the Deposit Agreement. You may have to pay fees and expenses incurred in converting foreign currency, such as fees and expenses incurred in complying with currency exchange controls and other governmental requirements.
If the conversion of foreign currency cannot be done on a practicable basis, or if any required approvals are denied or not obtainable at a reasonable cost or within a reasonable period, the depositary may take the following actions in its discretion:
| | • | | Convert the foreign currency to the extent permissible and distribute the U.S. dollars to the holders for whom the conversion and distribution is practicable. |
| | • | | Distribute the foreign currency to holders for whom the distribution is lawful and practicable. |
| | • | | Hold the foreign currency, without liability for interest, for the applicable holders. |
170
PART II
Item 13. Defaults, Dividend Arrearages and Delinquencies
Not applicable.
Item 14. Material Modifications to the Rights of Security Holders and Use of Proceeds
Not applicable.
Item 15. Controls and Procedures
Not applicable.
Item 16. Reserved
Item 16A. Audit Committee Financial Expert
Not applicable.
Item 16B. Code of Ethics
Not applicable.
Item 16C. Principal Accountant Fees and Services
Not applicable.
Item 16D. Exemptions from the Listing Standards for Audit Committees
Not applicable.
Item 16E. Purchases of Equity Securities by the Issuer and Affiliated Purchasers
Not applicable.
Item 16F. Change in Registrant’s Certifying Accountant
Not applicable.
Item 16G. Corporate Governance
Not applicable.
Item 16H. Mine Safety Disclosure
Not applicable.
171
PART III
Item 17. Financial Statements
None.
Item 18. Financial Statements
Index to the Combined Financial Statements
| | | | |
Reports of Independent Registered Public Accounting Firms: | |
| |
Report of KPMG Auditores Consultores Ltda. — Endesa Américas as of September 30, 2015 and December 31, 2014 | | | F-1 | |
Report of KPMG Auditores Consultores Ltda. — Endesa Américas as of December 31, 2014 and 2013 and January 1, 2013 | | | F-3 | |
Report of Pistrelli, Henry Martin y Asociados S.R.L., member Firm of Ernst & Young Global — Endesa Argentina S.A. as of September 30, 2015 | | | F-4 | |
Report of Pistrelli, Henry Martin y Asociados S.R.L., member Firm of Ernst & Young Global — Endesa Argentina S.A. as of December 31, 2014 and 2013 | | | F-5 | |
Report of Pistrelli, Henry Martin y Asociados S.R.L., member Firm of Ernst & Young Global — Endesa Argentina S.A. as of December 31, 2013 and 2012 | | | F-6 | |
Report of Ernst & Young Auditores Independentes S.S. — Enel Brasil S.A. as of September 30, 2015 and December 31, 2014 and 2013 | | | F-7 | |
|
Interim Combined Financial Statements: | |
| |
Interim Combined Statements of Financial Position as of September 30, 2015 and December 31, 2014 | | | F-9 | |
Interim Combined Statements of Comprehensive Income for the nine months ended September 30, 2015 and 2014 | | | F-10 | |
Interim Combined Statements of Changes in Equity for the nine months ended September 30, 2015 and 2014 | | | F-12 | |
Interim Combined Statements of Direct Cash Flows for the nine months ended September 30, 2015 and 2014 | | | F-13 | |
Notes to the Interim Combined Financial Statements | | | F-14 | |
|
Annual Combined Financial Statements: | |
| |
Combined Statements of Financial Position as of December 31, 2014 and 2013 and January 1, 2013 | | | F-132 | |
Combined Statements of Comprehensive Income for the years ended December 31, 2014 and 2013 | | | F-133 | |
Combined Statements of Changes in Equity for the years ended December 31, 2014 and 2013 | | | F-135 | |
Combined Statements of Direct Cash Flows for the years ended December 31, 2014 and 2013 | | | F-136 | |
Notes to the Combined Financial Statements | | | F-137 | |
|
S-X Rule 3-09 Financial Statements: | |
| |
Consolidated Financial Statements of Enel Brasil S.A | | | G-1 | |
| | |
Ch$ | | Chilean pesos |
US$ | | U.S. dollars |
UF | | The UF is a Chilean inflation-indexed, peso-denominated monetary unit that is set daily in advance based on the previous month’s inflation rate. |
ThCh$ | | Thousands of Chilean pesos |
ThUS$ | | Thousands of U.S. dollars |
172
Item 19. Exhibits
| | |
Exhibit | | Description |
| |
| 1.1 | | By-laws (Estatutos) of Endesa Américas S.A. |
| |
| 2.1 | | Form of Specimen Share Certificate for Endesa Américas S.A. Common Stock |
| |
| 8.1 | | List of Principal Combined Entities as of September 30, 2015. |
| |
| 23.1 | | Consent of KPMG Auditores Consultores Ltda., an independent registered public accounting firm (Endesa Américas S.A. interim combined financial statements) |
| |
| 23.2 | | Consent of KPMG Auditores Consultores Ltda., an independent registered public accounting firm (Endesa Américas S.A. annual combined financial statements) |
| |
| 23.3 | | Consent of Pistrelli, Henry Martin y Asociados S.R.L., member Firm of Ernst & Young Global Limited, an independent registered public accounting firm (Endesa Argentina S.A.) |
| |
| 23.4 | | Consent of Ernst & Young Auditores Independentes S.S., member Firm of Ernst & Young Global Limited, an independent registered public accounting firm (Enel Brasil S.A.) |
| |
| 23.5 | | Consent of Chadbourne & Parke LLP (included in Exhibit 99.1). |
| |
| 99.1 | | Opinion of Chadbourne & Parke LLP as to U.S. taxation. |
We will furnish to the Securities and Exchange Commission, upon request, copies of any unfiled instruments that define the rights of stakeholders of Endesa Américas.
173
SIGNATURES
The registrant hereby certifies that it meets all of the requirements for filing on Form 20-F and that it has duly caused and authorized the undersigned to sign this Registration Statement on its behalf.
| | |
| ENDESA AMÉRICAS S.A. |
| |
| By: | | /s/ Ramiro Alfonsín |
| Name: | | Ramiro Alfonsín |
| Title: | | Chief Financial Officer |
Date: March 30, 2016
174
ENDESA AMÉRICAS
INDEX TO THE COMBINED FINANCIAL STATEMENTS
| | | | |
Reports of Independent Registered Public Accounting Firms: | |
| |
Report of KPMG Auditores Consultores Ltda. — Endesa Américas as of September 30, 2015 and December 31, 2014 | | | F-1 | |
Report of KPMG Auditores Consultores Ltda. — Endesa Américas as of December 31, 2014 and 2013 and January 1, 2013 | | | F-3 | |
Report of Pistrelli, Henry Martin y Asociados S.R.L., member Firm of Ernst & Young Global — Endesa Argentina S.A. as of September 30, 2015 | | | F-4 | |
Report of Pistrelli, Henry Martin y Asociados S.R.L., member Firm of Ernst & Young Global — Endesa Argentina S.A. as of December 31, 2014 and 2013 | | | F-5 | |
Report of Pistrelli, Henry Martin y Asociados S.R.L., member Firm of Ernst & Young Global — Endesa Argentina S.A. as of December 31, 2013 and 2012 | | | F-6 | |
Report of Ernst & Young Auditores Independentes S.S. — Enel Brasil S.A. As of September 30, 2015 and December 31, 2014 and 2013 | | | F-7 | |
| |
Combined Financial Statements: | | | | |
| |
Interim Combined Statements of Financial Position at September 30, 2015 and December 31, 2014 | | | F-9 | |
Interim Combined Statements of Comprehensive Income for the nine months ended September 30, 2015 and 2014 | | | F-10 | |
Interim Combined Statements of Changes in Equity for the nine months ended September 30, 2015
and 2014 | | | F-12 | |
Interim Combined Statements of Direct Cash Flows for the nine months ended September 30, 2015
and 2014 | | | F-13 | |
Notes to the Interim Combined Financial Statements | | | F-14 | |
| |
Combined Statements of Financial Position as of December 31, 2014 and 2013 and January 1, 2013 | | | F-132 | |
Combined Statements of Comprehensive Income for the years ended December 31, 2014 and 2013 | | | F-133 | |
Combined Statements of Changes in Equity for the years ended December 31, 2014 and 2013 | | | F-135 | |
Combined Statements of Direct Cash Flows for the years ended December 31, 2014 and 2013 | | | F-136 | |
Notes to the Combined Financial Statements | | | F-137 | |
| |
S-X Rule 3-09 Financial Statements: | | | | |
| |
Consolidated Financial Statements of Enel Brasil S.A. | | | G-1 | |
| | |
| |
Ch$ | | Chilean pesos |
US$ | | U.S. dollars |
UF | | The UF is a Chilean inflation-indexed, peso-denominated monetary unit that is set daily in advance based on the previous month’s inflation rate. |
ThCh$ | | Thousands of Chilean pesos |
ThUS$ | | Thousands of U.S. dollars |

Report of Independent Registered Public Accounting Firm
The Board of Directors
Empresa Nacional de Electricidad S.A.:
We have audited the accompanying interim combined statement of financial position of Endesa Américas (the “Combined Group”) as of September 30, 2015, and the related combined interim statements of comprehensive income, changes in equity, and cash flows for the nine-month period ended September 30, 2015. These interim combined financial statements are the responsibility of Empresa Nacional de Electricidad S.A. management. Our responsibility is to express an opinion on these combined interim financial statements based on our audit. We did not audit the financial statements of certain combined entities which financial statements reflect total assets constituting 12.04 percent as of September 30, 2015 and total revenues constituting 12.59 percent for the nine-month period ended September 30, 2015, of the related combined totals. In addition, we did not audit the financial statements of Enel Brasil S.A (a 38.64 percent owner investee company). The Combined Group’s investment in Enel Brasil S.A. as of September 30, 2015 was ThCh$ 426,453,134, and its equity in earnings was ThCh$ 27,869,847 for the nine-month period ended September 30, 2015. Those financial statements, which were prepared in accordance with applicable local statutory accounting standards, were audited by other auditors whose reports have been furnished to us, and our opinion, insofar as it relates to the amounts of those entities whose financial statements have been prepared based on such accounting standards, is based solely on the reports of the other auditors. Accordingly, we have audited the conversion adjustments to the financial statements of these combined entities and non-combined investees to conform them to the Combined Group’s accounting policies in accordance with International Accounting Standards (“IAS”) 34, Interim Financial Reporting, as issued by the International Accounting Standards Board (“IASB”).
We conducted our audit in accordance with the standards of the Public Company Accounting Oversight Board (United States). Those standards require that we plan and perform the audit to obtain reasonable assurance about whether the financial statements are free of material misstatement. An audit includes examining, on a test basis, evidence supporting the amounts and disclosures in the financial statements. An audit also includes assessing the accounting principles used and significant estimates made by management, as well as evaluating the overall financial statement presentation. We believe that our audit provides a reasonable basis for our opinion.
In our opinion, based on our audit and the reports of the other auditors, the interim combined financial statements referred to above present fairly, in all material respects, the combined interim financial position of Endesa Américas as of September 30, 2015, and the combined interim results of its operations and its cash flows for the nine-month period ended September 30, 2015, in conformity with IAS 34, Interim Financial Reporting, as issued by the IASB.
We have separately audited, in accordance with standards of the Public Company Accounting Oversight Board (United States), the combined statement of financial position of the Combined Group as of December 31, 2014, and the related combined statements of comprehensive income, changes in equity, and cash flows for the year then ended included in this registration statement; and in our report dated December 21, 2015, which is also included in this registration statement and is based on our audit and the reports of the other auditors, we expressed an unqualified opinion on those combined financial statements. In our opinion, the information set forth in the accompanying combined interim statement of financial position as of December 31, 2014, is fairly stated, in all material respects, in relation to the combined financial statements of the Combined Group as of and for the year ended December 31, 2014 from which it has been derived.
KPMG Auditores Consultores Ltda, a Chilean limited liability partnership and a member firm of the KPMG network of independent member firms affiliated with KPMG International Cooperative (“KPMG International”), a Swiss entity. All rights reserved.
F-1

The interim combined statements of comprehensive income, changes in equity, and cash flows of the Endesa Américas for the nine-month period ended September 30, 2014 were not audited by us, accordingly, we do not express an opinion on them.
Without modifying our opinion, we draw attention to Notes 1 and 2 to the interim combined financial statements, which describes their basis of preparation, including the approach to and the purpose for preparing them.
|
| /s/ KPMG |
| KPMG Auditores Consultores Ltda. |
Santiago, Chile December 21, 2015 |
KPMG Auditores Consultores Ltda, a Chilean limited liability partnership and a member firm of the KPMG network of independent member firms affiliated with KPMG International Cooperative (“KPMG International”), a Swiss entity. All rights reserved.
F-2
| | | | |
| | KPMG Auditores Consultores Ltda. Av. Isidora Goyenechea 3520, Piso 2 Las Condes, Santiago, Chile | | Teléfono +56 (2) 2798 1000 Fax +56 (2) 2798 1001 www.kpmg.cl |
Report of Independent Registered Public Accounting Firm
The Board of Directors
Empresa Nacional de Electricidad S.A.:
We have audited the accompanying combined statements of financial position of Endesa Américas (the “Combined Group”) as of December 31, 2014, 2013 and January 1, 2013, and the related combined statements of comprehensive income, changes in equity, and cash flows for the years ended December 31, 2014 and 2013. These combined financial statements are the responsibility of Empresa Nacional de Electricidad S.A. management. Our responsibility is to express an opinion on these combined financial statements based on our audits. We did not audit the financial statements of certain combined entities which financial statements reflect total assets constituting 12.11 percent, 11.23 percent and 12.99 percent as of December 31, 2014, 2013, and January 1, 2013, respectively, and total revenues constituting 15.58 percent and 12.21 percent for the years ended December 31, 2014 and 2013, respectively, of the related combined totals. In addition, we did not audit the financial statements of Enel Brasil S.A (a 38.64 percent owner investee company). The Combined Group’s investment in Enel Brasil S.A. as of December 31, 2014, 2013 and January 1, 2013 was ThCh$ 538,876,929, ThCh$ 543,713,349, and ThCh$ 574,168,681, respectively, and its equity in earnings was ThCh$ 62,181,301 and ThCh$ 94,402,624 for the years ended December 31, 2014 and 2013, respectively. Those financial statements, which were prepared in accordance with applicable local statutory accounting standards, were audited by other auditors whose reports have been furnished to us, and our opinion, insofar as it relates to the amounts of those entities whose financial statements have been prepared based on such accounting standards, is based solely on the reports of the other auditors. Accordingly, we have audited the conversion adjustments to the financial statements of these combined entities and non-combined investees to conform them to the Combined Group’s accounting policies in accordance with International Financial Reporting Standards (“IFRS”) as issued by the International Accounting Standards Board (“IASB”).
We conducted our audits in accordance with the standards of the Public Company Accounting Oversight Board (United States). Those standards require that we plan and perform the audit to obtain reasonable assurance about whether the financial statements are free of material misstatement. An audit includes examining, on a test basis, evidence supporting the amounts and disclosures in the financial statements. An audit also includes assessing the accounting principles used and significant estimates made by management, as well as evaluating the overall financial statement presentation. We believe that our audits provide a reasonable basis for our opinion.
In our opinion, based on our audits and the reports of the other auditors, the combined financial statements referred to above present fairly, in all material respects, the combined financial position of Endesa Américas as of December 31, 2014, 2013 and January 1, 2013, and the combined results of its operations and its cash flows for the years ended December 31, 2014 and 2013, in conformity with IFRS as issued by the IASB.
Without modifying our opinion, we draw attention to Notes 1 and 2 to the combined financial statements, which describes their basis of preparation, including the approach to and the purpose for preparing them.
|
| /s/ KPMG |
| KPMG Auditores Consultores Ltda. |
| Santiago, Chile |
| December 21, 2015 |
KPMG Auditores Consultores Ltda, a Chilean limited liability partnership and a member firm of the KPMG network of independent member firms affiliated with KPMG International Cooperative (“KPMG International”), a Swiss entity. All rights reserved.
F-3
Report of Independent Registered Public Accounting Firm
To the Board of Directors of Endesa Argentina S.A.:
We have audited the consolidated balance sheet of Endesa Argentina S.A. (a wholly-owned subsidiary of Endesa Chile S.A.) as of September 30, 2015, and the related consolidated statements of income, shareholders’ equity, and cash flows for the nine-month period ended September 30, 2015 (not presented separately herein). These financial statements are the responsibility of the Company’s management. Our responsibility is to express an opinion on these financial statements based on our audits.
We conducted our audits in accordance with the standards of the Public Company Accounting Oversight Board (United States of America). Those standards require that we plan and perform the audit to obtain reasonable assurance about whether the financial statements are free of material misstatement. We were not engaged to perform an audit of the Company’s internal control over financial reporting. Our audits included consideration of internal control over financial reporting as a basis for designing audit procedures that are appropriate in the circumstances, but not for the purpose of expressing an opinion on the effectiveness of the Company’s internal control over financial reporting. Accordingly, we express no such opinion. An audit also includes examining, on a test basis, evidence supporting the amounts and disclosures in the financial statements, assessing the accounting principles used and significant estimates made by management, and evaluating the overall financial statement presentation. We believe that our audits provide a reasonable basis for our opinion.
In our opinion, the financial statements referred to above present fairly, in all material respects, the consolidated financial position of Endesa Argentina S.A. at September 30, 2015, and the consolidated results of their operations and their cash flows for the nine-month period ended September 30, 2015, in conformity with accounting principles generally accepted in the Buenos Aires City, Argentine Republic.
We have not audited, reviewed or compiled the summarized comparative consolidated information (not presented separately herein) for the period ended September 30, 2014, and, accordingly, we express no opinion on it.
November 24, 2015
Buenos Aires, Argentina
/S/ PISTRELLI, HENRY MARTIN Y ASOCIADOSS.R.L.
Member of EY Global
F-4
Report of Independent Registered Public Accounting Firm
To the Board of Directors of Endesa Argentina S.A.:
We have audited the consolidated balance sheet of Endesa Argentina S.A. and subsidiaries as of December 31, 2014 and 2013, and the related consolidated statements of income, shareholders’ equity, and cash flows for the years then ended (not presented separately herein). These financial statements are the responsibility of the Company’s management. Our responsibility is to express an opinion on these financial statements based on our audits.
We conducted our audits in accordance with the standards of the Public Company Accounting Oversight Board (United States of America). Those standards require that we plan and perform the audit to obtain reasonable assurance about whether the financial statements are free of material misstatement. We were not engaged to perform an audit of the Company’s internal control over financial reporting. Our audits included consideration of internal control over financial reporting as a basis for designing audit procedures that are appropriate in the circumstances, but not for the purpose of expressing an opinion on the effectiveness of the Company’s internal control over financial reporting. Accordingly, we express no such opinion. An audit also includes examining, on a test basis, evidence supporting the amounts and disclosures in the financial statements, assessing the accounting principles used and significant estimates made by management, and evaluating the overall financial statement presentation. We believe that our audits provide a reasonable basis for our opinion.
In our opinion, the financial statements referred to above present fairly, in all material respects, the consolidated financial position of Endesa Argentina S.A. and subsidiaries at December 31, 2014 and 2013, and the consolidated results of their operations and their cash flows for the years then ended, in conformity with accounting principles generally accepted in the Buenos Aires City, Argentine Republic.
April 20, 2015
Buenos Aires, Argentina
/S/ PISTRELLI, HENRY MARTIN Y ASOCIADOSS.R.L.
Member of EY Global
F-5
Report of Independent Registered Public Accounting Firm
To the Board of Directors of Endesa Argentina S.A.:
We have audited the consolidated balance sheet of Endesa Argentina S.A. and subsidiaries as of December 31, 2013 and 2012, and the related consolidated statements of income, shareholders’ equity, and cash flows for the years then ended (not presented separately herein). These financial statements are the responsibility of the Company’s management. Our responsibility is to express an opinion on these financial statements based on our audits.
We conducted our audits in accordance with the standards of the Public Company Accounting Oversight Board (United States of America). Those standards require that we plan and perform the audit to obtain reasonable assurance about whether the financial statements are free of material misstatement. We were not engaged to perform an audit of the Company’s internal control over financial reporting. Our audits included consideration of internal control over financial reporting as a basis for designing audit procedures that are appropriate in the circumstances, but not for the purpose of expressing an opinion on the effectiveness of the Company’s internal control over financial reporting. Accordingly, we express no such opinion. An audit also includes examining, on a test basis, evidence supporting the amounts and disclosures in the financial statements, assessing the accounting principles used and significant estimates made by management, and evaluating the overall financial statement presentation. We believe that our audits provide a reasonable basis for our opinion.
In our opinion, the financial statements referred to above present fairly, in all material respects, the consolidated financial position of Endesa Argentina S.A. and subsidiaries at December 31, 2013 and 2012, and the consolidated results of their operations and their cash flows for the years then ended, in conformity with accounting principles generally accepted in the Buenos Aires City, Argentine Republic.
February 28, 2014
Buenos Aires, Argentina
/S/ PISTRELLI, HENRY MARTINY ASOCIADOSS.R.L.
Member of Ernst & Young Global
F-6

Report of Independent Registered Public Accounting Firm
To the Board of Directors and Shareholders of
Enel Brasil S.A.
We have audited the accompanying consolidated statements of financial position of Enel Brasil S.A. and subsidiaries as of September 30, 2015, December 31, 2014 and 2013 and January 1, 2013 and the related consolidated statements of income, other comprehensive income, changes in equity, and cash flows for the nine month period ended September 30, 2015 and for each of the two years in the period ended December 31, 2014. These financial statements are the responsibility of the Company’s management. Our responsibility is to express an opinion on these financial statements based on our audits.
We conducted our audits in accordance with the standards of the Public Company Accounting Oversight Board (United States). Those standards require that we plan and perform the audit to obtain reasonable assurance about whether the financial statements are free of material misstatement. We were not engaged to perform an audit of the Company’s internal control over financial reporting. Our audits included consideration of internal control over financial reporting as a basis for designing audit procedures that are appropriate in the circumstances, but not for the purpose of expressing an opinion on the effectiveness of the Company’s internal control over financial reporting. Accordingly, we express no such opinion. An audit also includes examining, on a test basis, evidence supporting the amounts and disclosures in the financial statements, assessing the accounting principles used and significant estimates made by management, and evaluating the overall financial statement presentation. We believe that our audits provide a reasonable basis for our opinion.
In our opinion, the financial statements referred to above present fairly, in all material respects, the consolidated financial position of Enel Brasil S.A. and subsidiaries at September 30, 2015 and the consolidated results of their operations and their cash flows for the nine month period ended September 30, 2015, in conformity with IAS 34, and the consolidated financial position of Enel Brasil S.A. at December 31, 2014 and 2013 and January 1, 2013, and the consolidated results of their operations and their cash flows for each of the two years in the period ended December 31, 2014, in conformity with International Financial Reporting Standards as issued by the International Accounting Standards Board.
ERNST & YOUNG
Auditores Independentes S.S.
/s/ Márcio F. Ostwald
Partner
Rio de Janeiro, RJ – Brazil
November 27, 2015
F-7
Endesa Américas
Interim Combined Financial Statements as of September 30, 2015 and December 31, 2014 and for the nine months ended September 30, 2015 and 2014
F-8
ENDESA AMÉRICAS
Interim Combined Statements of Financial Position
As of September 30, 2015 and December 31, 2014
(In thousands of Chilean pesos)
| | | | | | | | | | |
| | | Note | | 9-30-2015 | | | 12-31-2014 | |
| ASSETS | | | | | | | | | | |
CURRENT ASSETS | | | | | | | | | | |
Cash and cash equivalents | | 5 | | | 167,949,606 | | | | 298,442,230 | |
Other current financial assets | | 6 | | | 12,785,890 | | | | 23,385,199 | |
Other current non-financial assets | | | | | 18,224,388 | | | | 30,273,484 | |
Trade and other current receivables, net | | 7 | | | 194,759,627 | | | | 116,156,318 | |
Current accounts receivable from related parties | | 8 | | | 38,562,305 | | | | 26,125,993 | |
Inventories | | 9 | | | 23,636,397 | | | | 28,899,937 | |
Current income tax receivables | | 10 | | | 119,634 | | | | 2,588,814 | |
| | | | | | | | | | |
TOTAL CURRENT ASSETS | | | | | 456,037,847 | | | | 525,871,975 | |
| | | | | | | | | | |
NON-CURRENT ASSETS | | | | | | | | | | |
Other non-current financial assets | | 6 | | | 630,294 | | | | 1,216,953 | |
Other non-current non-financial assets | | | | | 3,911,758 | | | | 2,331,504 | |
Trade and other non-current receivables, net | | 7 | | | 119,792,042 | | | | 141,216,512 | |
Investments accounted for using the equity method | | 11 | | | 428,410,790 | | | | 540,856,061 | |
Intangible assets other than goodwill | | 12 | | | 31,494,143 | | | | 33,599,920 | |
Goodwill | | 13 | | | 106,169,681 | | | | 100,749,542 | |
Property, plant and equipment, net | | 14 | | | 2,724,602,767 | | | | 2,609,314,957 | |
Deferred income tax assets | | 15 | | | 20,980,619 | | | | 47,559,617 | |
| | | | | | | | | | |
TOTAL NON-CURRENT ASSETS | | | | | 3,435,992,094 | | | | 3,476,845,066 | |
| | | | | | | | | | |
TOTAL ASSETS | | | | | 3,892,029,941 | | | | 4,002,717,041 | |
| | | | | | | | | | |
CURRENT LIABILITIES | | | | | | | | | | |
Other current financial liabilities | | 16 | | | 256,058,853 | | | | 144,394,860 | |
Trade and other current payables | | 19 | | | 241,126,388 | | | | 359,620,851 | |
Current accounts payable to related parties | | 8 | | | 43,466,612 | | | | 113,060,776 | |
Provisions | | 20 | | | 109,102,383 | | | | 27,419,411 | |
Current income tax liabilities | | 10 | | | 30,706,802 | | | | 62,912,077 | |
Other current non-financial liabilities | | | | | 21,209,536 | | | | 17,752,031 | |
| | | | | | | | | | |
TOTAL CURRENT LIABILITIES | | | | | 701,670,574 | | | | 725,160,006 | |
| | | | | | | | | | |
NON-CURRENT LIABILITIES | | | | | | | | | | |
Other non-current financial liabilities | | 16 | | | 887,227,704 | | | | 1,047,567,699 | |
Provisions | | 20 | | | 33,744,505 | | | | 3,692,437 | |
Deferred income tax liabilities | | 15 | | | 160,776,532 | | | | 158,274,836 | |
Non-current provisions for employee benefits | | 21 | | | 22,512,843 | | | | 24,924,791 | |
Other non-current non-financial liabilities | | | | | 41,321,935 | | | | 26,041,215 | |
| | | | | | | | | | |
TOTAL NON-CURRENT LIABILITIES | | | | | 1,145,583,519 | | | | 1,260,500,978 | |
| | | | | | | | | | |
TOTAL LIABILITIES | | | | | 1,847,254,093 | | | | 1,985,660,984 | |
| | | | | | | | | | |
EQUITY | | | | | | | | | | |
Allocated capital | | 22 | | | 899,433,829 | | | | 899,433,829 | |
Retained earnings | | | | | 1,250,597,877 | | | | 1,176,110,289 | |
Other reserves | | 22 | | | (942,817,077 | ) | | | (850,834,523 | ) |
Equity attributable to Parent Company | | | | | 1,207,214,629 | | | | 1,224,709,595 | |
Non-controlling interests | | | | | 837,561,219 | | | | 792,346,462 | |
| | | | | | | | | | |
TOTAL EQUITY | | | | | 2,044,775,848 | | | | 2,017,056,057 | |
| | | | | | | | | | |
TOTAL LIABILITIES AND EQUITY | | | | | 3,892,029,941 | | | | 4,002,717,041 | |
| | | | | | | | | | |
See accompanying notes to the interim combined financial statements.
F-9
ENDESA AMÉRICAS
Interim Combined Statements of Comprehensive Income, by Nature
For the nine months ended September 30, 2015 and 2014
(In thousands of Chilean pesos)
| | | | | | | | | | |
| | | | | For the nine months ended | |
| | | Note | | 9-30-2015 | | | 9-30-2014
Unaudited | |
Revenues | | 23 | | | 867,061,191 | | | | 889,905,531 | |
Other operating income | | 23 | | | 38,857,158 | | | | 35,919,275 | |
Revenues and Other Operating Income | | | | | 905,918,349 | | | | 925,824,806 | |
| | | |
Raw materials and consumables used | | 24 | �� | | (283,832,790 | ) | | | (274,874,799 | ) |
Contribution Margin | | | | | 622,085,559 | | | | 650,950,007 | |
| | | |
Other work performed by the entity and capitalized | | 3 | | | 7,684,811 | | | | 8,412,098 | |
Employee benefits expense | | 25 | | | (61,720,250 | ) | | | (50,283,778 | ) |
Depreciation and amortization expense | | 26 | | | (78,847,321 | ) | | | (74,923,174 | ) |
Impairment losses | | 26 | | | 113,041 | | | | (1,241,940 | ) |
Other expenses | | 27 | | | (52,006,915 | ) | | | (42,146,826 | ) |
Operating Income | | | | | 437,308,925 | | | | 490,766,387 | |
| | | |
Other gains, net | | | | | 38,032 | | | | 737,963 | |
Financial income | | 28 | | | 14,063,112 | | | | 9,852,438 | |
Financial costs | | 28 | | | (57,693,259 | ) | | | (53,349,067 | ) |
Share of profit and losses of investments accounted for using the equity method | | 11 | | | 29,168,039 | | | | 34,443,390 | |
Foreign currency exchange gains (losses), net | | 28 | | | 326,433 | | | | (24,482,024 | ) |
| | | |
Profit before taxes | | | | | 423,211,282 | | | | 457,969,087 | |
Income tax expense | | 29 | | | (167,559,834 | ) | | | (172,219,622 | ) |
NET PROFIT | | | | | 255,651,448 | | | | 285,749,465 | |
| | | |
Net profit attributable to | | | | | | | | | | |
Parent Company | | | | | 93,789,014 | | | | 93,080,587 | |
Non-controlling interests | | 22.6 | | | 161,862,434 | | | | 192,668,878 | |
NET PROFIT | | | | | 255,651,448 | | | | 285,749,465 | |
See accompanying notes to the interim combined financial statements.
F-10
ENDESA AMÉRICAS
Interim Combined Statements of Comprehensive Income, by Nature (continued)
For the nine months ended September 30, 2015 and 2014
(In thousands of Chilean pesos)
| | | | | | | | | | | | |
| | | | | | For the nine months ended | |
| | | Note | | | 9-30-2015 | | | 9-30-2014
Unaudited | |
Net profit | | | | | | | 255,651,448 | | | | 285,749,465 | |
Components of other comprehensive income that will not be reclassified subsequently to profit or loss, before taxes | | | | | | | | | | | | |
Gains from defined benefit plans | | | 21 | | | | 659,949 | | | | — | |
Other comprehensive income that will not be reclassified subsequently to profit or loss, before taxes | | | | | | | 659,949 | | | | — | |
Components of other comprehensive income (loss) that may be reclassified subsequently to profit or loss, before taxes | | | | | | | | | | | | |
Foreign currency translation gains (losses), net | | | | | | | (169,202,400 | ) | | | 170,799,224 | |
Losses from available-for-sale financial assets | | | | | | | (441,557 | ) | | | — | |
Net losses from cash flow hedges | | | | | | | (8,164,260 | ) | | | (3,161,953 | ) |
Reclassification adjustments on cash flow hedges | | | | | | | (474,858 | ) | | | (1,891,366 | ) |
Share of other comprehensive loss from investments accounted for using the equity method | | | | | | | (1,018,783 | ) | | | (69,472 | ) |
Other comprehensive income that may be reclassified subsequently to profit or loss, before taxes | | | | | | | (179,301,858 | ) | | | 165,676,433 | |
Components of other comprehensive income, before taxes | | | | | | | (178,641,909 | ) | | | 165,676,433 | |
Income tax related to defined benefit plans | | | | | | | (256,589 | ) | | | — | |
Income tax related to components of other comprehensive income that will not be reclassified subsequently to profit or loss | | | | | | | (256,589 | ) | | | — | |
Components of other comprehensive income that will be reclassified subsequently to profit or loss, before taxes | | | | | | | | | | | | |
Income tax related to cash flow hedge | | | | | | | 2,652,518 | | | | 1,501,298 | |
Income tax related to components of comprehensive income that will be reclassified subsequently to profit or loss | | | | | | | 2,652,518 | | | | 1,501,298 | |
| | | | | | | | | | | | |
Total Other Comprehensive Income (Loss) | | | | | | | (176,245,980 | ) | | | 167,177,731 | |
| | | | | | | | | | | | |
TOTAL COMPREHENSIVE INCOME | | | | | | | 79,405,468 | | | | 452,927,196 | |
| | | | | | | | | | | | |
Comprehensive income (loss) attributable to | | | | | | | | | | | | |
Parent Company | | | | | | | (27,274,775 | ) | | | 199,223,320 | |
Non-controlling interests | | | | | | | 106,680,243 | | | | 253,703,876 | |
| | | | | | | | | | | | |
TOTAL COMPREHENSIVE INCOME | | | | | | | 79,405,468 | | | | 452,927,196 | |
| | | | | | | | | | | | |
See accompanying notes to the interim combined financial statements.
F-11
ENDESA AMÉRICAS
Interim Combined Statements of Changes in Equity
For the nine months ended September 30, 2015 and 2014
(In thousands of Chilean pesos)
| | | | | | | | | | | | | | | | | | | | | | | | | | | | | | | | | | | | | | | | |
| | | | | | Change in Reserves | | | | | | | | | | |
Statements of Changes in
Equity | | Allocated
Capital | | | Reserve for
Exchange
Differences in
Translation | | | Reserve
for
Cash Flow
Hedges | | | Reserve for Gains
and Losses on
Remeasuring
Available-
for-Sale
Financial Assets | | | Other
Miscellaneous
Reserves | | | Total
Reserves
other than
Retained
Earnings | | | Retained
Earnings | | | Equity
Attributable to
the Parent
Company | | | Non-
controlling
Interests | | | Total Equity | |
Equity as of 1-1-2015 | | | 899,433,829 | | | | (28,331,643 | ) | | | (1,991,688 | ) | | | — | | | | (820,511,192 | ) | | | (850,834,523 | ) | | | 1,176,110,289 | | | | 1,224,709,595 | | | | 792,346,462 | | | | 2,017,056,057 | |
Changes in equity | | | | | | | | | | | | | | | | | | | | | | | | | | | | | | | | | | | | | | | | |
Comprehensive income | | | | | | | | | | | | | | | | | | | | | | | | | | | | | | | | | | | | | | | | |
Profit (loss) | | | | | | | | | | | | | | | | | | | | | | | | | | | 93,789,014 | | | | 93,789,014 | | | | 161,862,434 | | | | 255,651,448 | |
Other comprehensive income | | | | | | | (116,214,023 | ) | | | (3,751,738 | ) | | | (118,664 | ) | | | (979,364 | ) | | | (121,063,789 | ) | | | | | | | (121,063,789 | ) | | | (55,182,191 | ) | | | (176,245,980 | ) |
| | | | | | | | | | | | | | | | | | | | | | | | | | | | | | | (27,274,775 | ) | | | 106,680,243 | | | | 79,405,468 | |
Distributions to the Parent Company (unaudited) | | | | | | | | | | | | | | | | | | | | | | | | | | | (44,030,181 | ) | | | (44,030,181 | ) | | | (61,465,486 | ) | | | (105,495,667 | ) |
Other | | | — | | | | — | | | | — | | | | — | | | | 29,081,235 | | | | 29,081,235 | | | | 24,728,755 | | | | 53,809,990 | | | | — | | | | 53,809,990 | |
Equity as of 9-30-2015 | | | 899,433,829 | | | | (144,545,666 | ) | | | (5,743,426 | ) | | | (118,664 | ) | | | (792,409,321 | ) | | | (942,817,077 | ) | | | 1,250,597,877 | | | | 1,207,214,629 | | | | 837,561,219 | | | | 2,044,775,848 | |
| | | | | | | | | | | | | | | | | | | | | | | | | | | | | | | | | | | | |
| | | | | | Change in Reserves | | | | | | | |
Statements of Changes in Equity | | Allocated
Capital | | | Reserve for
Exchange
Differences in
Translation | | | Reserve
for
Cash Flow
Hedges | | | Other
Miscellaneous
Reserves | | | Total
Reserves
Other than
Retained
Earnings | | | Retained
Earnings | | | Equity
Attributable to
the Parent
Company | | | Non-
controlling
Interests | | | Total Equity | |
Equity as of 1-1-2014 | | | 899,433,829 | | | | (50,898,021 | ) | | | 2,118,519 | | | | (760,605,537 | ) | | | (809,385,039 | ) | | | 1,116,137,754 | | | | 1,206,186,544 | | | | 908,398,637 | | | | 2,114,585,181 | |
Changes in equity (unaudited) | | | | | | | | | | | | | | | | | | | | | | | | | | | | | | | | | | | | |
Comprehensive income (unaudited) | | | | | | | | | | | | | | | | | | | | | | | | | | | | | | | | | | | | |
Profit (loss) (unaudited) | | | | | | | | | | | | | | | | | | | | | | | 93,080,587 | | | | 93,080,587 | | | | 192,668,878 | | | | 285,749,465 | |
Other comprehensive income (unaudited) | | | | | | | 108,453,705 | | | | (2,244,194 | ) | | | (66,778 | ) | | | 106,142,733 | | | | — | | | | 106,142,733 | | | | 61,034,998 | | | | 167,177,731 | |
| | | | | | | | | | | | | | | | | | | | | | | | | | | 199,223,320 | | | | 253,703,876 | | | | 452,927,196 | |
Distributions to the Parent Company (unaudited) | | | | | | | | | | | | | | | | | | | | | | | (51,083,379 | ) | | | (51,083,379 | ) | | | (194,382,659 | ) | | | (245,466,038 | ) |
Other | | | — | | | | — | | | | — | | | | (6,247,843 | ) | | | (6,247,843 | ) | | | (8,516,928 | ) | | | (14,764,771 | ) | | | — | | | | (14,764,771 | ) |
Equity as of 9-30-2014 (unaudited) | | | 899,433,829 | | | | 57,555,684 | | | | (125,675 | ) | | | (766,920,158 | ) | | | (709,490,149 | ) | | | 1,149,618,034 | | | | 1,339,561,714 | | | | 967,719,854 | | | | 2,307,281,568 | |
See accompanying notes to the interim combined financial statements.
F-12
ENDESA AMÉRICAS
Interim Combined Statements of Cash Flows
For the nine months ended September 30, 2015 and 2014
(In thousands of Chilean pesos)
| | | | | | | | | | | | |
| | | | | | For the nine months ended | |
| | | Note | | | 9-30-2015 | | | 9-30-2014
ThCh$
Unaudited | |
Cash flow from operating activities | | | | | | | | | | | | |
Types of collection from operating activities | | | | | | | | | | | | |
Collections from the sale of goods and services | | | | | | | 872,334,749 | | | | 950,730,542 | |
Collections from royalties, payments, commissions, and other income from ordinary activities | | | | | | | 2,580,117 | | | | 3,196,635 | |
Collections from premiums and services, annual payments, and other benefits from policies held | | | | | | | 11,393,266 | | | | 9,380,593 | |
Other collections from operating activities | | | | | | | 23,959,377 | | | | — | |
Types of payment in cash from operating activities | | | | | | | | | | | | |
Payments to suppliers for goods and services | | | | | | | (323,098,685 | ) | | | (327,766,947 | ) |
Payments to and on behalf of employees | | | | | | | (37,468,335 | ) | | | (42,396,404 | ) |
Payments on premiums and services, annual payments, and other obligations from policies held | | | | | | | (4,447,138 | ) | | | (4,537,652 | ) |
Other payments for operating activities | | | | | | | (37,390,119 | ) | | | (29,609,404 | ) |
Cash flows from operating activities | | | | | | | | | | | | |
Income taxes paid | | | | | | | (141,492,966 | ) | | | (126,385,871 | ) |
Other outflows of cash, net | | | | | | | (30,966,673 | ) | | | (33,786,321 | ) |
Net cash provided by operating activities | | | | | | | 335,403,593 | | | | 398,825,171 | |
Cash flow from investment activities | | | | | | | | | | | | |
Other collections from the sale of equity or debt instruments belonging to other entities | | | | | | | 18,769,607 | | | | 75,594,666 | |
Other payments to acquire equity or debt instruments belonging to other entities | | | | | | | — | | | | (93,620,969 | ) |
Purchases of property, plant and equipment | | | | | | | (204,099,285 | ) | | | (196,820,043 | ) |
Purchases of intangible assets | | | | | | | (12,049,927 | ) | | | — | |
Payments from future, forward, option and swap contracts | | | | | | | (216,650 | ) | | | (2,575,124 | ) |
Collections from future, forward, option and swap contracts | | | | | | | 4,780,532 | | | | 1,780,880 | |
Dividends received | | | | | | | 1,086,871 | | | | 48,410,179 | |
Interest received | | | | | | | 5,256,700 | | | | 7,551,379 | |
Other inflows of cash, net | | | | | | | — | | | | 7,906,450 | |
Net cash used in investing activities | | | | | | | (186,472,152 | ) | | | (151,772,582 | ) |
Cash flows from financing activities | | | | | | | | | | | | |
Total proceeds from loans | | | | | | | 264,059,732 | | | | 199,464,254 | |
Proceeds from long-term loans | | | | | | | 47,872,909 | | | | 191,779,258 | |
Proceeds from short-term loans | | | | | | | 216,186,823 | | | | 7,684,996 | |
Loans from related parties | | | | | | | 26,566,087 | | | | — | |
Payments on borrowings | | | | | | | (218,307,849 | ) | | | (72,755,417 | ) |
Payments on financial lease liabilities | | | | | | | (6,703,444 | ) | | | (4,235,967 | ) |
Payments on loans to related parties | | | | | | | (24,761,278 | ) | | | — | |
Distributions paid to the Parent Company | | | | | | | (260,927,115 | ) | | | (225,484,267 | ) |
Interest paid | | | | | | | (72,350,562 | ) | | | (70,705,509 | ) |
Net proceeds from the Parent | | | | | | | 14,012,734 | | | | (53,604,218 | ) |
Other outflows of cash, net | | | | | | | (3,090,278 | ) | | | (3,056,112 | ) |
Net cash used in finance activities | | | | | | | (281,501,973 | ) | | | (230,377,236 | ) |
Net increase (decrease) in cash and cash equivalents before the effect of exchange rate changes | | | | | | | (132,570,532 | ) | | | 16,675,353 | |
Effect of exchange rate changes on cash and cash equivalents | | | | | | | | | | | | |
Effect of exchange rate changes on cash and cash equivalents | | | | | | | 2,077,908 | | | | 14,277,718 | |
Net increase in cash and cash equivalents | | | | | | | (130,492,624 | ) | | | 30,953,071 | |
Cash and cash equivalents at beginning of period | | | 5 | | | | 298,442,230 | | | | 286,218,693 | |
Cash and cash equivalents at end of period | | | 5 | | | | 167,949,606 | | | | 317,171,764 | |
See accompanying notes to the interim combined financial statements.
F-13
ENDESA AMÉRICAS
NOTES TO THE INTERIM COMBINED FINANCIAL STATEMENTS
Table of Contents
F-14
F-15
ENDESA AMÉRICAS
NOTES TO THE INTERIM COMBINED FINANCIAL STATEMENTS AS OF SEPTEMBER 30, 2015 AND DECEMBER 31, 2014 AND FOR THE NINE MONTHS ENDED SEPTEMBER 30, 2015 AND 2014.
(In thousands of Chilean pesos)
On April 28, 2015, Empresa Nacional de Electricidad S.A. (“Endesa”) informed the Superintendence of Securities and Insurance (the “SVS”) through a significant event, that the Board of Directors of its direct parent, Enersis S.A., communicated that it had decided to initiate an analysis of a corporate reorganization aimed at the separation of the activities of power generation and distribution in Chile from other activities conducted outside of Chile by Enersis S.A. and its subsidiaries Endesa and Chilectra S.A., maintaining its inclusion in the Enel S.p.A. group.
In the same significant event, the Board of Directors of Endesa reported that it had agreed to initiate studies to analyze a possible corporate reorganization consisting of the spin-off of Endesa’s businesses in Chile from those outside of Chile, and eventually merge the latter into a single company. Furthermore, it indicated that the objective of this reorganization is to create value for all of its shareholders, as none of these operations require the contribution of additional resources from shareholders. The possible corporate reorganization would take into account the best interests as well as all shareholder’s interests, with special attention paid to minority interests, and if it were approved, be subject to approval at an Extraordinary Shareholders’ Meeting.
On July 27, 2015, pursuant to the provisions of Articles 9 and 10 of the Securities Market Law No. 18,045 and the provisions of General Norm No. 30 of the SVS, Endesa informed the SVS by means of a significant event, that the Board of Directors of the Endesa had decided unanimously, that if the separation of power generation and distribution activities in Chile from the rest of the activities of Enersis group outside of Chile were approved, the reorganization would be carried out through the following corporate transactions:
Steps to carry out the corporate reorganization:
| a) | Related to the preparation of the Combined Financial Statements |
| | • | | Each of the direct and indirect subsidiaries of Enersis S.A., Endesa and Chilectra S.A., would effect spin-offs, resulting in the formation of a new company from the spin-off by Endesa (“Endesa Américas”) and a new company from the spin-off by Chilectra S.A. (“Chilectra Américas”), which would be allocated equity interests and other assets that both Endesa and Chilectra S.A. have outside Chile, as well as certain other assets and liabilities related to them. |
The continuing companies of Endesa and Chilectra S.A. are to be called Empresa Nacional de Electricidad S.A. (“Endesa Chile”) and Chilectra S.A. (“Chilectra Chile”) after the spin-offs.
| | • | | At the same time, Enersis S.A. will effect a spin-off and, resulting from this spin-off, will form a new company (“Enersis Chile”), which will hold the equity interests and assets of Enersis in Chile allocated to it, including the equity interests in Endesa Chile and Chilectra Chile (after the spin-offs by these companies described above), and certain other assets and liabilities related to them. Remaining in continuing Enersis (to be called “Enersis Américas” after the spin-off) are the equity interests and corresponding liabilities of Enersis outside of Chile, as well as those held by each of the new companies “Endesa Américas,” and “Chilectra Américas” created as a result of the spin-offs of Endesa Américas and Chilectra Américas mentioned above, and the liabilities related to them. |
| b) | Related to the subsequent processes of the division phase. |
| | • | | Once the previously mentioned spin-offs are completed, “Enersis Américas” would absorb by merger Chilectra Américas and Endesa Américas, and would dissolve them without liquidation, thus grouping all international shares of the Enersis group outside of Chile in Enersis Américas. The merger involving Enersis Américas, Endesa Américas and Chilectra Américas would take place as soon as legally possible and in accordance with the applicable regulations. |
F-16
The preparation of these combined financial statements of “Endesa Américas”, do not include effects that could potentially arise as a result of the previously mentioned merger.
The resulting companies would be based in Chile and their shares would be listed in the same markets that Endesa is currently listed. As stated earlier, none of the transactions described above require the contribution of additional financial resources.
On November 10, 2015, in the Endesa’s Extraordinary Board of Directors’ Meeting, the Board of Directors of Endesa agreed to summon an Extraordinary Shareholders’ Meeting (“ESM”), on December 18, 2015. The purpose of this meeting is for the shareholders to acknowledge and rule on, among others, the proposed corporate reorganization and all supporting information related to it.
| 1.1 | The Combined Group’s activities |
Endesa Américas comprises of its combined entities and investments in associates and joint ventures (the “Combined Group”).
Endesa Américas will be a publicly traded corporation with registered address and head office located at Avenida Santa Rosa, No. 76, in Santiago, Chile. Endesa Américas will be registered in the securities register of the SVS. In addition, Endesa Américas will be registered with the Securities and Exchange Commission of the United States of America (the “SEC”).
Endesa Américas’ corporate purpose consists of generating, transporting, producing, and distributing electrical energy. The Combined Group’s corporate purpose also includes investing in financial assets, developing projects, carrying out activities in the energy industry and in other fields in which electrical energy is essential, and participating in public civil or hydroelectric infrastructure concessions in which it may participate directly or through combined entities or associate companies outside of Chile.
| 2. | BASIS OF PREPARATION OF THE COMBINED FINANCIAL STATEMENTS |
The combined interim financial statements as of September 30, 2015 of Endesa Américas have been prepared in accordance with the International Accounting Standards (IAS) 34, Interim Financial Reporting, as issued by the International Accounting Standards Board (IASB). They were approved by the Endesa Board of Directors at its meeting held on December 17, 2015.
As of September 30, 2015, the Combined Group does not represent a group for consolidated financial statement reporting purposes in accordance with IFRS 10 Consolidated Financial Statements.
The combined financial statements reflect the combined financial position and operations of the Combined Group as it would have been incorporated following the spin-off, whose date would have been January 1, 2013. The combined financial statements may not be indicative of the Combined Group’s future performance and do not necessarily reflect what the results of operations, financial position and cash flows would have been had it operated, since January 1, 2013 as an independent company during the periods presented.
Appendix 1 of these combined financial statements includes the list of combined entities.
The Combined Group used the same accounting policies and valuation methods for the preparation of these combined financial statements, as those used by the consolidated foreign consolidated subsidiaries and non-consolidated investee entities of Endesa for the preparation of Endesa’s Consolidated Financial Statements. Consequently, the reconciliation requirements of IFRS 1 for first time adopters is not applicable because there are no reconciling differences. These accounting policies have been disclosed under this note and Note 3 Accounting policies. The entities and associates are included these combined financial statements using their respective historical carrying values and amounts included in Endesa’s Consolidated Financial Statements.
F-17
Since IFRS does not provide any guidance for the preparation of combined financial statements, paragraph 12 of IAS 8 Accounting Policies, Changes in Accounting Estimates and Errors has been used for the preparation of the combined financial statements. This paragraph requires that the latest pronouncements of other standard setters, other accounting literature and accepted industry practice should be considered. The combined financial statements of Endesa Américas have been derived from the aggregation of the net assets of the foreign business of Endesa. All intra-group balances, revenues, expenses and unrealized gains and losses arising from transactions between companies belonging to Combined Group were eliminated when preparing the combined financial statements. In addition, the investments of the holding companies in the Combined Group were eliminated against the equity of the respective combined entities. Transactions with Endesa group companies, which do not belong to the Combined Group, have been disclosed as transactions with related parties.
The combined financial statements have been prepared and published in thousands of Chilean peso (ThCh$). Foreign operations are reported in accordance with the accounting policies stated in Note 3.k. Rounding differences may occur in respect of individual amounts or percentages.
Principles applied in preparing the Combined Financial Statements
The following summarizes the accounting and other principles applied in preparing the combined financial statements. Management considers that the allocations described below have been made on a reasonable basis, but are not necessarily indicative of the costs that would have been incurred if the Combined Group had been a stand-alone entity.
Net assets of the Parent (equity)
The Combined Group has not previously formed a separate legal group nor presented any stand-alone financial statements, and accordingly it is not conceivable to present share capital or an analysis of equity reserves. The net assets of the Combined Group are represented by capital invested in the Combined Group and are shown as “Equity” using the same captions as those used by Endesa. Paid-in capital, share premium and retained earnings of Endesa have been allocated to Endesa Américas based on net assets book value ratio assigned to it. Other reserves (which are primarily composed of the equity effects of past reorganizations, business combinations under common control, residual effects of first-time adoption of IFRS and the equity effects of the current spin-off process) have been allocated considering the transaction and circumstances that led to creation of these reserves.
Earnings per share information is not presented because Endesa Americas currently does not have any authorized, issued and outstanding shares.
Cash and cash equivalents
Cash and cash equivalents of the foreign subsidiaries of Endesa are included in these combined financial statements. In addition, based on the exercise carried out by Endesa’s Management, the ratios obtained for the division of the cash and cash equivalents Endesa on a stand-alone basis, are as follows:
| | | | | | | | |
| | | Proportion of Economic Assets | |
Entity | | Endesa Chile | | | Endesa Américas | |
Endesa | | | 66 | % | | | 34 | % |
Intercompany balances and transactions with related parties
Intercompany balances with successors of Endesa were allocated by identifying the entity that provided/received the service as well as the nature of it. Intercompany balances with Endesa Américas were eliminated in full for the purpose of these combined financial statements. Intercompany balances with Endesa Chile were included in these combined financial statements and disclosed as accounts with related parties.
F-18
Debt instruments and related interest expenses, exchange differences and effects of hedge accounting strategies
Financial debt and related interest expenses and exchange rate differences of the foreign subsidiaries of Endesa are included in these combined financial statements. Financial debt and related interest expenses and exchange rate differences of Endesa on a stand-alone basis have been 100% allocated to Endesa Chile and not included in these combined financial statements.
In relation to derivative instruments designated as hedging instruments the foreign subsidiaries of Endesa are included in these combined financial statements. Endesa’s Management has adopted as a criterion to keep the strategies of hedge accounting. Therefore, all effects on the statement of financial position, income and other comprehensive income are assigned to the different companies to which the hedged items were assigned. In the case of Endesa on a stand-alone basis, the main items covered by the hedging strategies are related to debt (hedging exposure to foreign currency debt and variability of the interest rate). Therefore, the main derivative instruments associated with such hedging strategies have been assigned according to debt criteria mentioned in the previous paragraph.
Personnel, salary expenses other employee benefits
For purposes of properly allocating the accounting effect of personnel from Endesa on a stand-alone basis between Endesa Chile and Endesa Américas, the Endesa’s Management defined as a criterion to identify those employees whose main activities are related 100% to the operations based in Chile, which resulted in virtually all employees from Endesa assigned to Endesa Chile. On the other hand, Management also identified those employees whose main activities relate 100% to foreign operations. This group of employees was assigned to Endesa Américas.
Below is a summary table presenting the breakdown of the employees to be allocated to Endesa Chile and Endesa Américas:
| | | | | | | | |
| | | Employees Allocation | |
Entity | | Endesa Chile | | | Endesa Américas | |
Endesa | | | 925 | | | | 7 | |
Once the allocation of personnel was determined Endesa management applied the following criteria to the division of all personnel related accounts of the statements of financial position and comprehensive income:
| | • | | In relation with the costs directly related to the personnel, such as wages and salaries, post-employment benefit obligations expense and social security and other benefits, travel expenses, etc. allocation was performed based on the assignment of the related personnel to the Combined Group, described above. |
Other shared costs
The combined statements of income include expense allocations for certain corporate functions provided by Endesa, including but not limited to, human resources administration, treasury, risk management, internal audit, accounting, tax, legal, insurance, medical services, information technology support, communication management, and other shared services. These expenses were allocated to Endesa Chile and Endesa Américas based on a specific identification basis, or in certain cases based on a pro-rata basis of headcount or some other basis depending on the nature of the allocated cost. Management considers the basis on which the expenses have been allocated to reasonably reflect the utilization of services provided to or the benefit received by Endesa Américas during the periods presented.
Dividends receivable and payable
The criterion defined by Endesa’s Management to allocate to both Endesa Chile as well as to Endesa Américas a portion of dividends receivable accounts as of the date of the corporate spin-off, has been based mainly on identifying the origin of each one of those dividends receivable.
F-19
Income tax
The tax effect (income statement and income tax provision) related to the foreign subsidiaries of Endesa are included in these combined financial statements and was calculated using the statutory corporate tax rates according to the country where the adjustment was originated.
In addition, the tax effect in the income statement of Endesa on a stand-alone basis has been allocated to these combined financial statements by determining a hypothetical taxable income as if Endesa Chile and Endesa Americas’ had operated as separate tax payers. However, from a tax point of view, there is currently only one taxpaying company, which is Endesa, and whose successor entity would be Endesa Chile, if the corporate reorganization is finally approved. Accordingly, the income tax provision of Endesa has not been allocated to the combined financial statements.
Deferred income tax assets and liabilities, have been allocated to Endesa Américas, taking into account the underlying assets and liabilities, whose respective temporary differences have generated such deferred taxes.
Other working capital accounts
Working capital items such as accounts receivable, accounts payable and inventories that are directly attributable to the operations of the Combined Group are included in the combined financial statements.
| 2.2 | New accounting pronouncements |
| a) | Accounting pronouncements effective from January 1, 2015: |
| | |
Standards, Interpretations and Amendments | | Mandatory Application for: |
| Amendment to IAS 19: Employee Benefits | | |
| |
| The purpose of this amendment is to simplify the accounting for contributions from employees or third parties that are not determined on the basis of an employee’s years of service, such as employee contributions calculated according to a fixed percentage of salary. | | Annual periods beginning on or after July 1, 2014. |
| |
Improvements to IFRS (2010-2012 and 2011-2013 Cycles) | | |
| |
| These are a set of improvements that were necessary, but not urgent, and that amend the following standards: IFRS 2, IFRS 3, IFRS 8, IFRS 13, IAS 16, IAS 24, IAS 38 and IAS 40. | | Annual periods beginning on or after July 1, 2014. |
The new interpretation and amendments adopted, which went into effect on January 1, 2015, had no effect on the combined financial statements of Endesa Américas.
F-20
| b) | Accounting pronouncements effective from January 1, 2016 and subsequent periods: |
As of the date of issue of these combined financial statements, the following accounting pronouncements had been issued by the IASB, but their application was not yet mandatory:
| | |
Standards, Interpretations and Amendments | | Mandatory Application for: |
IFRS 9: Financial Instruments This is the final version of the standard issued in July 2014 and which completes the IASB project to replace IAS 39 “Financial Instruments: Recognition and Measurement”. This project was divided into 3 phases: Phase 1 – Classification and measurement of financial assets and financial liabilities. This introduces a logical focus for the classification of financial assets driven by cash flow characteristics and the business model. This new model also results in a single impairment model being applied to all financial instruments. Phase 2 – Impairment methodology. The objective is a more timely recognition of expected credit losses. The standard requires entities to account for expected credit losses from the time when financial instruments are first recognized in the financial statements. Phase 3 – Hedge accounting. This establishes a new model aimed at reflecting better alignment between hedge accounting and risk management activity. Also included are enhancements to required disclosures. This final version of IFRS 9 replaces the previous versions of the Standard. | | Annual periods beginning on or after January 1, 2018. |
| |
| IFRS 14: Regulatory Deferral Accounts | | |
| |
| The purpose of this interim standard is to reduce the barriers to adoption of the IFRS by entities that carry out business activities that are subject to price or rate regulation. This standard allows those who are first-time adopters of IFRS, and who meet the requirements, to continue to account for regulatory deferral balances in their first IFRS financial statements using their previous GAAP accounting practices regarding regulated rates. It also establishes specific requirements for presenting balances and disclosing information. | | Annual periods beginning on or after January 1, 2016. |
| |
| IFRS 15: Revenue from Contracts with Customers | | |
| |
| This new standard applies to all contracts with customers except leases, financial instruments and insurance contracts. Its purpose is to make financial information more comparable, and it provides a new model for revenue recognition and more detailed requirements for contracts with multiple obligations. It also requires more itemized information. This standard will replace IAS 11 and IAS 18 as well as their interpretations (IFRIC 13, IFRIC 15, IFRIC 18 and SIC 31). | | Annual periods beginning on or after January 1, 2016. |
| |
| Amendment to IFRS 11: Joint Arrangements | | |
| |
| This amendment states that the accounting standards contained in IFRS 3 and other standards that are applicable to business combinations accounting must be applied to the accounting for acquiring an interest in a joint operation in which the activities constitutes a business. | | Annual periods beginning on or after January 1, 2016. |
| |
| Amendment to IAS 16 and IAS 38: Clarification of Acceptable Methods of Depreciation and Amortization | | |
| |
| The amendment to IAS 16 explicitly forbids the use of revenue-based depreciation for property, plant and equipment. The amendment to IAS 38 introduces the rebuttable presumption that, for intangible assets, the revenue-based amortization method is inappropriate and establishes two limited exceptions. | | Annual periods beginning on or after January 1, 2016. |
F-21
| | |
Standards, Interpretations and Amendments | | Mandatory Application for: |
| |
| Improvements to IFRS (2012-2014 Cycles) | | |
| |
| These are a set of improvements that were necessary, but not urgent, and that amend the following standards IFRS 5, IFRS7, IAS19 and IAS 34. | | Annual periods beginning on or after January 1, 2016. |
| |
| Amendment to IFRS 10 and IAS 28: Sale or Contribution of Assets | | |
| |
| The amendment corrects an inconsistency between IFRS 10 and IAS 28 relating to the accounting treatment of the sale or contributions of assets between an Investor and its Associate or Joint Venture. | | Annual periods beginning on or after January 1, 2016. |
| |
| Amendment to IAS 27: Equity Method in Separate Financial Statements | | |
| |
| This improvement allows entities to use the equity method to account for investments in subsidiaries, joint ventures and associates in their separate financial statements. The objective of the improvement is to minimize the costs associated with complying with the IFRS, particularly for those entities applying IFRS for the first time, without reducing the information available to investors. | | Annual periods beginning on or after January 1, 2016. |
| |
| Amendment to IAS 1: Disclosure Initiative | | |
| |
| The IASB has issued amendments to IAS 1 as part of its principal initiative to improve the presentation and disclosure of information in financial statements. These amendments are designed to assist companies in applying professional judgment to determine the disclosures that should be included in their financial statements. | | Annual periods beginning on or after January 1, 2016. |
| |
| Amendment to IFRS 10, IFRS 12 and IAS 28: Investment Entities, Application of the Consolidation Exception | | |
| |
| The amendments, which have a restricted scope, introduce clarifications to the requirements for the accounting of investment entities. The modifications also provide relief in some circumstances, which will reduce the costs of applying the Standards. | | Annual periods beginning on or after January 1, 2016. |
The Combined Group is assessing the impact of applying IFRS 9 and IFRS 15 as of their effective date. In Management’s opinion, the application of the other standards and amendments pending application is not expected to have a significant effect on the combined financial statements of Endesa Américas.
| 2.3 | Responsibility for the information, judgments and estimates provided |
Management is responsible for the information contained in these combined financial statements and expressly states that all IFRS principles and standards, as issued by the IASB, have been fully implemented.
In preparing the combined financial statements, certain judgments and estimates made by the Combined Group’s management have been used to quantify some of the assets, liabilities, revenues, expenses and commitments recognized in the statements.
The most important areas that have required professional judgment are:
| • | | In a service concession agreement, the decision as to whether a principal controls or regulates which services the operator should provide, to whom and at what price. These are essential details when applying IFRIC 12 Service Concession Arrangements (see Note 3.c.1). |
| • | | The identification of Cash Generating Units (CGU) for impairment testing (see Note 3.d). |
| • | | The hierarchy of information used to value assets and liabilities measured at fair value (see Note 3.g). |
F-22
These estimates refer basically to:
| • | | The valuations performed to determine the existence of impairment losses in assets and goodwill (see Note 3.d). |
| • | | The assumptions used to calculate the actuarial liabilities and obligations with employees, such as discount rates, mortality tables, salary increases, etc. (see Notes 3.i.1 and 21). |
| • | | The useful lives of property, plant and equipment, and intangible assets (see Notes 3.a and 3.c). |
| • | | The assumptions used to calculate the fair value of financial instruments (see Notes 3.f.5 and 18). |
| • | | Energy supplied to customers whose meter readings are pending. |
| • | | Certain assumptions inherent in the electricity system affecting transactions with other companies, such as production, customer billings, energy consumption, etc. that allow for estimating electricity system settlements that must occur on the corresponding final settlement dates, but that are pending as of the date of issuance of the combined financial statements and could affect the balances of assets, liabilities, revenues and expenses recognized in the statements (see Appendix 5.2). |
| • | | The probability that uncertain or contingent liabilities will be incurred and their related amounts (see Note 3.i). |
| • | | Future disbursements for the closure of facilities and restoration of land, as well as the discount rates to be used (see Note 3.a). |
| • | | The tax results of the various combined entities of the Combined Group that will be reported to the respective tax authorities in the future, and that have been used as the basis for recording different balances related to income taxes in these combined financial statements (see Note 3.l). |
| • | | The fair values of assets acquired and liabilities assumed, and any pre-existing interest in the Combined Group acquired in a business combination. |
Although these judgments and estimates have been based on the best information available on the issuance date of these combined financial statements, future events may occur that would require a change (increase or decrease) to these judgments and estimates in subsequent periods. This change would be made prospectively, recognizing the effects this change of judgments and estimates in the corresponding future combined financial statements.
| 2.4.1 | Combined entities with an ownership interest of less than 50% |
Although the Combined Group, directly and indirectly, holds a 26.87% ownership in the company Empresa Generadora de Energía Eléctrica S.A. (also hereafter “Emgesa” or “Emgesa S.A.E.S.P.”), it is considered a combined entities since the Combined Group exercises control over the entity through contracts or agreements with shareholders, or as a consequence of its structure, composition and shareholder classes. As a result of these facts, while having less than 50% ownership, the Combined Group holds 56.43% of the voting shares of Emgesa and its subsidiary Emgesa Panama S.A.
| 2.5 | Investments in combined associated companies and joint arrangements |
Combined associated are those entities in which the Combined Group, either directly or indirectly, exercises significant influence.
Significant influence is the power to participate in the financial and operational policy decisions of the investee but does not control or does not have joint control over these policies. In general, if the Combined Group holds 20% or more of the voting power of an investee, it is presumed that the Combined Group has significant influence over an investee.
F-23
Joint arrangements are those agreements in which the Combined Group exercises joint control. Joint control is the contractually agreed sharing of control of an arrangement, which exists only when decisions about the entities’ relevant activities require the unanimous consent of the parties sharing control. Joint arrangements are classified as:
| • | | Joint venture: an agreement whereby the parties exercising joint control have rights to the net assets of the arrangement. |
| • | | Joint operation: an agreement whereby the parties exercising joint control have rights to the assets and obligations for the liabilities relating to the arrangement. At the end of the reporting period, the Combined Group does not have any joint arrangements that qualify as joint operations. |
The Combined Group’s interests in joint ventures and associates are recognized using the equity method.
Under the equity method, an investment in an associate or joint venture is initially recognized at cost. As of the acquisition date, the investment is recognized in the statement of financial position based on the share of its equity that the Combined Group’s interest represents in its capital, adjusted for, if appropriate, the effect of transactions with subsidiaries plus any goodwill generated in acquiring the company. If the resulting amount is negative, zero is recognized for that investment in the statement of financial position, unless the Combined Group has a present obligation (either legal or implicit) to support the company’s negative equity position, in which case a provision is recognized.
Goodwill from the associate or joint venture is included in the carrying amount of the investment. It is not amortized but is subject to impairment testing as part of the overall investment carrying amount when there are indicators of impairment.
Dividends received from these companies are deducted from the value of the investment, and any profit or loss obtained from them to which the Combined Group is entitled based on its interest is recognized under “Share of profit (loss) of associates accounted for using equity method”.
Appendix 2 to these combined financial statements, entitled “Associated Companies and Joint Ventures”, describes the relationship of the Combined Group and each of these companies.
Acquisitions of businesses are accounted for using the acquisition method. The consideration transferred in a business combination is measured at fair value, which is calculated as the sum of the acquisition-date fair values of the assets transferred by the Combined Group, liabilities incurred by the Combined Group to the former owners of the acquiree and the equity interests issued by the Combined Group in exchange control of the acquiree. Acquisition-related costs are generally recognized in profit or loss as incurred.
At the acquisition date, the identifiable assets acquired and liabilities assumed are recognized at their fair value, except for certain assets and liabilities that are recognized using valuation principles established in other IFRS standards.
Goodwill is measured as the excess of the sum of the consideration transferred, the amount of any non-controlling interests in the acquiree, and the fair value of the acquirer’s previously held equity interest in the acquiree (if any) over the net of the acquisition-date amounts of the identifiable assets acquired and liabilities assumed. If, after reassessment, the net of the acquisition-date amounts of the identifiable assets acquired and liabilities assumed exceeds the sum of the consideration transferred, the amount of any non-controlling interests in the acquiree and the fair value of the acquirer’s previously held interest in the acquiree (if any), the excess is recognized immediately in profit or loss as a bargain purchase gain.
F-24
Non-controlling interests that are present ownership interests and entitle their holders to a proportionate share of the entity’s net assets in the event of liquidation may be initially measured either at fair value or at the non-controlling interests’ proportionate share of the recognized amounts of the acquiree’s identifiable net assets. The choice of measurement basis is made on a transaction-by-transaction basis.
When a business combination is achieved in stages, the Combined Group’s previously held equity interest in the acquiree is remeasured to its acquisition-date fair value and the resulting gain or loss, if any, is recognized in profit or loss. Amounts arising from interests in the acquiree prior to the acquisition date that have previously been recognized in other comprehensive income are reclassified to profit or loss where such treatment would be appropriate if that interest were disposed of.
If the initial accounting for a business combination is incomplete by the end of the reporting period in which the combination occurs, the Combined Group reports provisional amounts for the items for which the accounting is incomplete. Those provisional amounts are adjusted during the measurement period (which cannot exceed one year from the acquisition date), or additional assets or liabilities are recognized, to reflect new information obtained about facts and circumstances that existed at the acquisition date that, if known, would have affected the amounts recognized at that date.
Business combinations between entities under common control are accounted for using, as a reference, the ‘pooling of interest’ method. Under this method, the assets and liabilities involved in the transaction remain reflected at the same carrying amounts at which they were recognized in the ultimate controlling company, although subsequent accounting adjustments may need to be made to align the accounting policies of the companies involved. Any difference between the assets and liabilities contributed to the consolidation and the consideration given is recognized directly in equity as a debit or credit to other reserves. The Combined Group does not restate comparative periods in its combined financial statements for business combinations under common control.
The main accounting policies used in preparing the accompanying combined financial statements are the following:
| a) | Property, plant and equipment |
Property, plant and equipment are measured at acquisition cost, net of accumulated depreciation and any impairment losses they may have experienced. In addition to the price paid to acquire each item, the cost also includes, where applicable, the following concepts.
| • | | Financing expenses accrued during the construction period that are directly attributable to the acquisition, construction, or production of qualified assets, which require a substantial period of time before being ready for use such as, for example, electricity generation or distribution facilities. The Combined Group defines “substantial period” as one that exceeds 12 months. The interest rate used is that of the specific financing or, if none exists, the weighted average financing rate of the company carrying out the investment. The weighted average financing is 8.8% as of September 30, 2015 (8.56% as of December 31, 2014). The amount capitalized for this concept amounted to ThCh$34,164,179 and ThCh$28,777,699 during the nine months ended September 30, 2015 and 2014, respectively (see Note 28). |
| • | | Employee expenses directly related to construction in progress. The amounts capitalized under this concept during the nine months ended September 30, 2015 and 2014 were ThCh$ 7,864,811 and ThCh$ 8,412,098 respectively. |
| • | | Future disbursements that the Combined Group will have to make to close their facilities are incorporated into the value of the asset at fair value, recording in the accounting the corresponding provision for dismantling or |
F-25
| | restoration. The Combined Group reviews its estimate of these future disbursements on a yearly basis, increasing or decreasing the value of the asset based on the results of this estimate (see Note 20). |
Items for construction work in progress are transferred to operating assets once the testing period has been completed and they are available for use, at which time depreciation begins.
Expansion, modernization or improvement costs that represent an increase in productivity, capacity or efficiency, or a longer useful life are capitalized as increasing the cost of the corresponding assets.
The replacement or overhaul of entire components that increase the asset’s useful life or economic capacity are recognized as an increase in cost for the respective assets, derecognizing the replaced or overhauled components.
Expenditures for periodic maintenance, conservation and repair are recognized directly as an expense for the period in which they are incurred.
The Combined Group’s management, based on the outcome of impairment testing performed explained in Note 3.d, considers that the carrying amount of assets does not exceed their recoverable amount.
Property, plant and equipment, net of its residual value, is depreciated by distributing the cost of the different items that comprise it on a straight-line basis over its estimated useful life, which is the period during which the Combined Group expects to use the assets. Useful life estimates and residual values are reviewed on an annual basis and if appropriate adjusted prospectively.
The following are the main categories of property, plant and equipment with their respective estimated useful lives:
| | |
Categories of Property, plant and equipment | | Years of estimated
useful lives |
Buildings | | 22 – 100 |
Plant and equipment | | 3 – 85 |
IT equipment | | 3 – 15 |
Fixtures and fittings | | 5 – 21 |
Motor vehicles | | 5 – 10 |
Other | | 2 – 33 |
Additionally, the following provides greater detail on the useful lives of plant and equipment items:
| | |
Categories of Property, plant and equipment | | Years of estimated
useful lives |
Generating facilities: | | |
Hydroelectric plants | | |
Civil engineering works | | 35 – 65 |
Electromechanical equipment | | 10 – 85 |
Fuel oil/coal-fired power plants | | 25 – 40 |
Combined cycle plants | | 10 – 35 |
Renewable energy power plants | | 35 |
Natural gas transport facilities: | | |
Pipelines | | 35 |
Land is not depreciated since it has an indefinite useful life.
Regarding the administrative concessions held by the Combined Group’s electric companies, the following lists the periods remaining until expiration for the concessions that do not have an indefinite term.
F-26
| | | | | | | | | | | | | | | | |
Concession holder and operator | | Country | | | Year
concession
started | | | Concession
term | | | Period remaining
to expiration | |
Hidroeléctrica El Chocón S.A. (Generación) | | | Argentina | | | | 1993 | | | | 30 years | | | | 8 years | |
To the extent that the Combined Group recognizes assets as Property, plant and equipment, they are amortized over their economic life or the concession term, whichever is shorter. Any required investment, improvement or replacement made by the Combined Group is considered in the impairment test to Property, plant, and equipment as a future contractual cash outflow that is necessary to obtain future cash inflow.
Combined Group’s management has evaluated the specific case of the concession described above and has concluded that there are no conclusive factors indicating that the grantor of the concession (a governmental body) has control over the infrastructure and that it can simultaneously determine the service price on a permanent basis. These are essential requirements for applying IFRIC 12 Service Concession Arrangements, an interpretation that establishes how to recognize and value certain types of concessions. (Those that are within the scope of this Standard are presented in Note 3.c.1).
Gains or losses that arise from the sale or disposal of items of Property, plant, and equipment are recognized as “Other gains, net” in the combined comprehensive income statement and are calculated by deducting the carrying amount of the asset and any sales expenses from the amount received in the sale.
Goodwill arising from business combinations represents the excess of the consideration paid plus the amount of any non-controlling interests over the Combined Group’s share of the net value of the assets acquired and liabilities assumed, measured at fair value at the acquisition date. If the accounting for a business combination is completed, as well as the determination of goodwill, after the end of the reporting period in which the combination occurs, the amounts previously reported presented are adjusted, for comparative purposes, to include the value of the assets acquired and liabilities assumed and the value of the final goodwill as of acquisition date.
Goodwill arising from acquisition of entities with functional currencies other than the Chilean peso is measured in the functional currency of the acquired company and translated to Chilean pesos using the closing exchange rate.
Goodwill is not amortized; instead, at the end of each reporting period or when there are indicators that an impairment might have occurred, the Combined Group’s management estimates whether any impairment loss has reduced its recoverable amount to an amount less than the carrying amount and, if so, it impairment loss is immediately recognized in profit or loss (see Note 3.d).
| c) | Intangible assets other than goodwill |
Intangible assets are initially recognized at their acquisition cost or production cost, and are subsequently measured at their cost, net of their accumulated amortization and impairment losses they may have experienced.
Intangible assets are amortized on a straight line basis during their useful lives, starting from the date when they are ready for use, except for those with an indefinite useful life, which are not amortized. As of September 30, 2015 and December 31, 2014 there are no significant intangible assets with an indefinite useful life.
The criteria for recognizing these assets impairment losses and, if applicable, recovery of impairment losses recognized in previous periods are explained in Note 3.d below.
F-27
Public-to-private service concession agreements are recognized in accordance with IFRIC 12, Service Concession Agreements. This accounting interpretation applies if:
| a) | The grantor controls or regulates what services the operator must provide with the infrastructure, to whom it must provide them, and at what price; and |
| b) | The grantor controls — through ownership, beneficial entitlement, or otherwise — any significant residual interest in the infrastructure at the end of the term of the agreement. |
If both of the above conditions are met simultaneously, the operator shall recognize an intangible asset to the extent that it receives a right (a license) to charge users of the public service. A right to charge users of the public service is not an unconditional right to receive cash because the amounts are contingent on the extent that the public uses the service.
If the operator is paid for the construction services partly by a financial asset and partly by an intangible asset it is necessary to account separately for each component of the operator’s consideration. The consideration received or receivable for both components shall be recognized initially at the fair value of the consideration received or receivable.
These intangible assets are initially recognized at cost, i.e. the fair value of consideration transferred to acquire the asset, which is the fair value of the consideration received or receivable for the construction services delivered. They are then amortized over the term of the concession.
| c.2) | Research and development expenses |
The Combined Group recognizes the costs incurred in a project’s development phase as intangible assets in the statement of financial position as long as the project’s technical feasibility and future economic benefits have been demonstrated.
Expenditures on research activities are recognized as an expense in the year in which they are incurred. Research activities expenses amounted to ThCh$ 24,139 and ThCh$ 451,856, for the nine months ended September 2015 and 2014, respectively.
| c.3) | Other intangible assets |
Other intangible assets correspond to computer software, water rights, and easements. They are initially recognized at acquisition or production cost and are subsequently measured at cost less accumulated amortization and impairment losses, if any.
Computer software is amortized (on average) over five years. Certain easements and water rights have indefinite useful lives and, therefore, are not amortized, while others have useful lives ranging from 40 to 60 years, depending on their characteristics, and they are amortized over that term.
During the period, and principally at the end of each reporting period, the Combined Group’s management evaluates whether there is any indication that an asset has been impaired. If any such indication exists, the Combined Group’s management estimates the recoverable amount of that asset to determine the amount of the impairment loss. In the case of identifiable assets that do not generate cash flows independently, the Combined
F-28
Group’s management estimates the recoverable amount of the Cash Generating Unit (CGU) to which the asset belongs, which is understood to be the smallest identifiable group of assets that generates independent cash inflows.
Notwithstanding the preceding paragraph, in the case of CGUs to which goodwill or intangible assets with indefinite useful lives have been allocated, a recoverability analysis is performed routinely at each period end.
Recoverable amount is the higher of fair value less costs of disposal and value in use, which is defined as the present value of the estimated future cash flows. In order to calculate the recoverable amount of Property, plant, and equipment, as well as of goodwill, and intangible assets, the Combined Group uses value-in-use criteria in practically all cases.
To estimate value in use, the Combined Group prepares future pre-tax cash flow projections based on the most recent budgets available. These budgets incorporate management’s best estimates of a CGUs’ revenue and costs using sector projections, past experience and future expectations.
In general, these projections cover the next ten years, estimating cash flows for subsequent years by applying reasonable growth rates which, in no case, are increasing rates nor exceed the average long-term growth rates for the particular sector and country in which the Combined Group operates. As of September 30, 2015 and December 31, 2014 future cash flows projections were extrapolated from the following rates:
| | | | | | | | | | |
Country | | Currency | | 9-30-2015
Rate | | | 12-31-2014
Rate | |
| | | |
Argentina | | Argentine peso (Ar$) | | | 13.1 | % | | | 6.9 | % |
Brazil | | Brazilian real | | | 4.9%-5.6 | % | | | 5.0%-5.9 | % |
Peru | | Peruvian nuevo sol (Sol) | | | 3.6 | % | | | 3.4 | % |
Colombia | | Colombian peso (CP) | | | 4.2 | % | | | 4.3 | % |
Future cash flows are discounted to calculate their present value at a pre-tax rate that covers the cost of capital for the business activity and the geographic area in which it is being carried out. The time value of money and risk premiums generally used among analysts for the business activity and the geographic zone are taken into account to calculate the pre-tax rate.
The following are the pre-tax discount rates applied as of September 30, 2015 and December 31, 2014, expressed in nominal terms:
| | | | | | | | | | | | | | | | | | |
Country | | Currency | | 9-30-2015 | | | 12-31-2014 | |
| | | Minimum | | | Maximum | | | Minimum | | | Maximum | |
Argentina | | Argentine peso | | | 33.9 | % | | | 38.0 | % | | | 37.2 | % | | | 38.9 | % |
Brazil | | Brazilian real | | | 10.9 | % | | | 20.0 | % | | | 9.7 | % | | | 22.7 | % |
Peru | | Peruvian sol | | | 12.1% | | | | 12.6% | |
Colombia | | Colombian peso | | | 14.9% | | | | 13.3% | |
If the recoverable amount of the CGU is estimated to be less than its carrying amount, an impairment loss is recognized in the combined statement of comprehensive income. The impairment is first allocated to reduce the carrying amount of any goodwill allocated to the CGU, and then to the other assets of the unit pro rata on the basis of the carrying amount of each asset in the unit. The carrying amount of an asset is not reduced below the highest of fair value less costs of disposal, its value in use; or zero.
Impairment losses recognized for an asset in prior periods are reversed when there are indications that the impairment loss no longer exists or may have decreased, thus increasing the asset’s carrying amount with a credit to earnings. The increase in the asset’s carrying amount shall not exceed that carrying amount that would have been determined had no impairment loss been recognized for the asset. Goodwill impairment losses are not reversed in subsequent periods.
F-29
The following criteria are used to determine if a financial asset has been impaired:
| • | | For trade receivables in the electricity generation, transmission and distribution businesses, the Combined Group’s policy is to recognize impairment losses based on the aging of past-due balances. This is the policy generally applied except in cases where a specific collective basis analysis is recommended, such as in the case of receivables from government-owned companies (see Note 7). |
| • | | In the case of receivables of a financial nature, impairment is determined on case-by-case basis. As of the date of issuance of these combined financial statements, the Combined Group had no significant past-due non-commercial financial assets (see Notes 6 and 18). |
In order to determine whether an arrangement is, or contains, a lease, the Combined Group assesses the economic substance of the agreement, in order to determine whether fulfillment of the arrangement depends on the use of a specific asset and whether the agreement conveys the right to use an asset. If both conditions are met, at the inception of the arrangement the Combined Group separates the payments and other considerations relating to the lease, at their fair values, from those corresponding to other components of the agreement.
Leases that substantially transfer all the risks and rewards of ownership to the Combined Group are classified as finance leases. All others leases are classified as operating leases.
Finance leases in which the Combined Group acts as a lessee are recognized at the inception of the arrangement. At that time, the Combined Group records an asset based on the nature of the lease and a liability for the same amount, equal to the fair value of the leased asset or the present value of the minimum lease payments, if the latter is lower. Subsequently, the minimum lease payments are apportioned between finance expenses and reduction of the lease obligation. Finance expenses are recognized immediately in the income statement and allocated over the lease term, so as to achieve a constant interest rate on the remaining balance of the liability. Leased assets are depreciated on the same terms as other similar depreciable assets, as long as there is reasonable certainty that the lessee will acquire ownership of the asset at the end of the lease. If no such certainty exists, the leased assets are depreciated over the shorter of the useful lives of the assets and their lease term.
In the case of operating leases, payments are recognized as an expense in the case of the lessee and as income in the case of the lessor, both on a straight-line basis, over the term of the lease unless another type of systematic basis of distribution is deemed more representative.
Financial instruments are contracts that give rise to both a financial asset in one entity and a financial liability or equity instrument in another entity.
Purchases and sales of financial assets are accounted for using their trade date.
The Combined Group classifies its financial assets into four categories:
| • | | Trade and other receivables and accounts receivable from related parties: These financial assets, that are not quoted in the active market, are measured at amortized cost, which is the initial fair value minus principal repayments made, plus accrued interest, calculated using the effective interest method, minus any reduction through the use of an allowance account for impairment or uncollectibility. |
F-30
| • | | The effective interest method is used to calculate the amortized cost of a financial asset or liability (or group of financial assets or financial liabilities) and is charged to finance income or cost over the relevant period. The effective interest rate is the discount rate that exactly matches discounts the estimated future cash flows to be received or paid over the expected life of the financial instrument (or, when appropriate, over a shorter period) to the net carrying amount of the financial asset or financial liability. |
| • | | Held-to-maturity investments: Investments quoted in an active market that the Combined Group intends to hold and is capable of holding until their maturity are accounted for at amortized cost as defined in the preceding paragraph. |
| • | | Financial assets at fair value through profit or loss: This category includes the trading portfolio and those financial assets that have been designated as such upon initial recognition and that are managed and evaluated on a fair value basis. They are measured in the combined statement of financial position at fair value, with changes in value recognized directly in income when they occur. |
| • | | Available-for-sale financial assets: These are financial assets specifically designated as available for sale or that do not fit within any of the three preceding categories. They are almost all financial investments in equity instruments (see Note 6). |
These financial assets are recognized in the combined statement of financial position at fair value when it can be reliably determined. For investments in equity instruments in unlisted companies or companies with lower levels of liquidity, normally the fair value cannot be reliably measured. When this occurs, those investments in equity instruments are measured at cost less impairment losses, if any.
Changes in fair value, net of tax, are recognized in other comprehensive income, until the investments are disposed of, at which time the amount accumulated in other comprehensive income is reclassified to profit or loss.
If the fair value is lower than cost, and if there is objective evidence that the asset has been more than temporarily impaired, the difference is recognized directly in profit or loss.
| f.2) | Cash and cash equivalents |
This item within the combined statement of financial position includes cash and bank balances, time deposits with original maturity of less than or equal to 90 days, and other highly liquid investments (with original maturity of less than or equal to 90 days) that are readily convertible to cash and are subject to insignificant risk of changes in value.
| f.3) | Financial liabilities |
Financial liabilities are recognized based on cash received, net of any costs incurred in the transaction. In subsequent periods, these obligations are measured at their amortized cost using the effective interest method (see Note 3.f.1).
In the particular case that a liability is the hedged item in a fair value hedge, as an exception, such liability is measured at its fair value for the portion of the hedged risk.
In order to calculate the fair value of debt, both when it is recognized in the statement of financial position and for fair value disclosure purposes as shown in Note 16, debt has been divided into fixed interest rate debt (hereinafter “fixed-rate debt”) and variable interest rate debt (hereinafter “floating-rate debt”). Fixed-rate debt is that on which fixed-interest coupons established at the beginning of the transaction are paid explicitly or implicitly over its term. Floating-rate debt is that debt issued at a variable interest rate, i.e., each coupon is established at the beginning of each period based on the reference interest rate. All debt has been measured by discounting expected future cash flows with a market interest rate curve based on the payment currency.
F-31
| f.4) | Derivative financial instruments and hedge accounting |
Derivatives held by the Combined Group are transactions entered into to hedge interest and/or exchange rate risk, intended to eliminate or significantly reduce these risks in the underlying transactions being hedged.
Derivatives are recognized at fair value at the end of each reporting period as follows: if their fair value is positive, they are recognized within “Other financial assets”; and if their fair value is negative, they are recognized within “Other financial liabilities”. For derivatives on commodities, the positive fair value is recognized in “Trade and other receivables”, and negative fair values are recognized in “Trade and other liabilities”.
Changes in fair value are recognized directly in profit or loss, except when the derivative has been designated for hedge accounting purposes as a hedge instrument (in a cash flow hedge) and all of the conditions for applying hedge accounting are met, including that the hedge be highly effective. In this case, changes are recognized as follows:
| • | | Fair value hedges: The underlying portion for which the risk is being hedged (hedged risk) and the hedge instrument are measured at fair value, and any changes in value of both items are recognized in the combined statement of comprehensive income by offsetting the effects in the same comprehensive income statement account. |
| • | | Cash flow hedges: Changes in the fair value of the effective portion of the hedged item and hedge instrument are recognized in other comprehensive income an accumulated in an equity reserve known as “Reserve for cash flow hedges”. The cumulative loss or gain or loss in this accounting this reserve is transferred reclassified to the combined statement of comprehensive income to the extent that the hedged item impacts the combined statement of comprehensive income because of the hedged risk, offsetting the effect in the same comprehensive income statement account. Gains or losses from the ineffective portion of the hedging relationship are recognized directly in the combined statement of comprehensive income. |
A hedge relationship is considered highly effective when changes in fair value or in cash flows of the underlying item directly attributable to the hedged risk are offset by changes in fair value or cash flows of the hedging instrument, with an effectiveness ranging from 80% to 125%.
As a general rule, long-term commodity purchase or sale agreements are recognized in the combined statement of financial position at their fair value at the end of each reporting period, recognizing any differences in value directly in profit or loss, except for, when all of the following conditions are met:
| • | | The sole purpose of the agreement is for the Combined Group’s own use, which is understood as: (i) in the case of fuel purchase agreements its used to generate electricity; (ii) in the case of electrical energy purchased for sale, its sale to the end-customers; and, (iii) in the case of electricity sales its sale to the end-customers. |
| • | | The Combined Group’s future projections evidence the existence of these agreements for its own use. |
| • | | Past experience with agreements evidence that they have been utilized for the Combined Group’s own use, except in certain isolated cases when for exceptional reasons or reasons associated with logistical issues have been used beyond the control and projection of the Combined Group. |
| • | | The agreement does not stipulate settlement of differences and the parties have not made it a practice to settle similar contracts with differences in the past. |
The long-term commodity purchase or sale agreements maintained by the Combined Group, which are mainly for electricity, fuel, and other supplies, meet the conditions described above. Thus, the purpose of fuel purchase agreements is to use them to generate electricity, electricity purchase contracts are used to sell to end-customers, and electricity sale contracts are used to sell the Combined Group’s own products.
F-32
The Combined Group’s management also evaluates the existence of derivatives embedded in contracts or financial instruments to determine if their characteristics and risk are closely related to the principal contract, provided that when taken as a whole they are not being accounted for at fair value. If they are not closely related, they are recognized separately and changes in value are accounted for directly in profit or loss.
| f.5) | Fair value of derivative instruments |
The fair value of derivative financial instruments is calculated as follows:
| • | | For derivatives traded on an active market, by its quoted price as of the end of the period. |
| • | | The Combined Group measures derivatives not traded on active markets by using the discounted cash flow method and generally accepted options valuation models, based on current and future market conditions as of the close of the financial statements. It also adjusts the value according to its own credit risk (Debt Valuation Adjustment, DVA), and the counterparty risk (Credit Valuation Adjustment, CVA). These CVA and DVA adjustments are measured on the basis of the potential future exposure of the instrument (creditor or borrower position) and the risk profile of both the counterparties and the Combined Group itself. |
| f.6) | Derecognition of financial assets and liabilities |
Financial assets are derecognized when:
| • | | The contractual rights to receive cash flows from the financial asset expire or have been transferred or, if the contractual rights are retained, the Combined Group has assumed a contractual obligation to pay these cash flows to one or more recipients, if and only if, all of the three conditions are met: (i) The Combined Group has no obligation to pay amounts to eventual recipients unless it collects equivalent amounts from the original asset; (ii) The Combined Group is prohibited by the terms of the transfer contract from selling or pledging the original asset other than as a security to the eventual recipients for the obligation to pay them cash flows; and (iii) The Combined Group has an obligation to remit any cash flows it collects on behalf of the eventual recipients without material delay. |
| • | | The Combined Group has substantially transferred all the risks and rewards of ownership of the financial asset, or, if it has neither transferred nor retained substantially all the risks and rewards, when it does not retain control of the financial asset. |
Transactions in which the Combined Group retains substantially all the inherent risks and rewards of ownership of the transferred asset, it continues recognizing the transferred asset in its entirety and recognizes a financial liability for the consideration received. Transactions costs are recognized in profit and loss by using the effective interest method (see Note 3.f.1).
Financial liabilities are derecognized when they are extinguished, that is, when the obligation arising from the liability has been paid or cancelled, or has expired.
| f.7) | Offsetting of financial assets and liabilities |
The Combined Group offsets financial assets and liabilities, and the net amount is presented in the statement of financial position only when:
| • | | there is a legally binding right to set-off recognized amounts; and |
| • | | the company intends to settle them on a net basis, or to simultaneously realize the asset and settle the liability. |
| g) | Measurement of fair value |
The fair value of an asset or liability is defined as the price that would be received from the sale of an asset or paid to transfer a liability in an orderly transaction between market participants at the measurement date.
F-33
Fair value measurement assumes that the transaction to sell an asset or transfer a liability occurs in the principal market, namely, the market with the greatest volume and level of activity for that asset or liability. In the absence of a principal market, it is assumed that the transaction is carried out in the most advantageous market available to the entity, namely, the market that maximizes the amount that would be received to sell the asset or minimizes the amount that would be paid to transfer the liability.
In estimating fair value of an asset or liability, the Combined Group uses market-observable data to the extent it is available. Where Level 1 inputs are not available, the Combined Group uses valuation techniques that are appropriate for the circumstances and for which there is sufficient data to conduct the measurement. The Combined Group maximizes the use of relevant observable data and minimizes the use of unobservable data.
Given the hierarchy of the entry data used in the valuation techniques, assets and liabilities measured at fair value can be classified at the following levels:
Level 1: Quoted prices (unadjusted) in active markets for identical assets or liabilities;
Level 2: Inputs other than quoted prices included within Level 1 that are observable for the assets or liabilities, either directly (i.e. as prices) or indirectly (i.e. derived from prices). The methods and assumptions used to determine the fair values at Level 2 by type of financial assets or financial liabilities take into consideration estimated future cash flows discounted at market rates. Future cash flows for financial assets and financial liabilities are discounted with the zero coupon interest rate curves for each currency (these valuations are carried out using external tools such as Bloomberg); and
Level 3: Inputs for assets or liabilities that are not based on observable market data (unobservable inputs).
When measuring fair value, the Combined Group takes into account the characteristics of the asset or liability, particularly:
| • | | For non-financial assets, fair value measurement takes into account the ability of a market participant to generate economic benefits by using the asset in its highest and best use or by selling it to another market participant that would use the asset in its highest and best use; |
| • | | For liabilities and equity instruments, the fair value measurement assumes that the liability would not be settled and an equity instrument would not be cancelled or otherwise extinguished on the measurement date. The fair value of the liability reflects the effect of non-performance risk, namely, the risk that an entity will not fulfill the obligation, which includes, but is not limited to, the Combined Group’s own credit risk; |
| • | | In the case of financial assets and financial liabilities with offsetting positions in market risks or counterparty credit risks, it is permitted to measure the fair value on a net basis. However, this must be consistent with the manner in which market participants would price the net risk exposure at the measurement date. |
Inventories are measured at their weighted average acquisition cost or the net realizable value, whichever is lower.
Provisions are recognized when the Combined Group has a present obligation (legal or constructive) as a result of a past event, it is probable that an outflow of economic benefits will be required to settle the obligation, and a reliable estimate can be made of the amount of the obligation.
The amount recognized as a provision is the best estimate of the consideration required to settle the present obligation at the end of the reporting period, taking into account the risks and uncertainties surrounding the
F-34
obligation. When a provision is measured using the cash flows estimated to settle the present obligation, its carrying amount is the present value of those cash flows (when the effect of the time value of money is material). The unwinding of the discount is recognized as finance cost. Incremental legal cost expected to be incurred in resolving a legal claim is included in measuring of the provision.
Provisions are reviewed at the end of each reporting period and adjusted to reflect the current best estimate. If it is no longer probable that an outflow of resources embodying economic benefits will be required to settle the obligation, the provision is reversed.
A contingent liability does not result in the recognition of a provision. Legal costs expected to be incurred in defending a legal claim are expensed as they are incurred. Significant contingent liabilities are disclosed unless the likelihood of an outflow of resources embodying economic benefits is remote.
| j.1) | Provisions for post-employment benefits and similar obligations |
Some of the combined entities have pension and similar obligations with their employees. These obligations, which can be defined benefits and defined contributions, are basically formalized through pension plans, except for certain non-monetary benefits, mainly electricity supply commitments, which, due to their nature, have not been externalized and are covered by the related in-house provisions.
For defined benefit plans, the cost of providing benefits is determined using the Projected Unit Credit Method, with actuarial valuations being carried out at the end of each reporting period. Past service costs relating to changes in benefits are recognized immediately.
The defined benefit plan obligations in the statement of financial position represent the present value of the accrued obligations, adjusted, once the fair value of the different plans’ assets has been deducted, if any.
For each of the defined benefit plans, any deficit between the actuarial liability and the plan assets is recognized under line item “Provisions for employee benefits” within current and non-current liabilities in the consolidated statement of financial position.
Actuarial gains and losses arising in measurement of both the plan liabilities and the plan assets are recognized directly in other comprehensive income.
Contributions to defined contribution benefit plans are recognized as an expense in the consolidated statement of comprehensive income when the employees have rendered their services.
| j) | Translation of foreign currency balances |
Transactions carried out by each entity in a currency other than its functional currency are recognized using the exchange rates prevailing as of the date of the transactions. During the period, any differences that arise between the prevailing exchange rate at the date of the transaction and the exchange rate as of the date of collection or payment are recognized as “Foreign currency exchange gains (losses), net” in the combined statement of comprehensive income.
Likewise, at the end of each reporting period, receivable or payable balances denominated in a currency other than each entity’s functional currency are translated using the closing exchange rate. Any differences are recognized as “Foreign currency exchange gains (losses), net” in the combined statement of comprehensive income.
The Combined Group has established a policy to hedge the portion of revenue from its combined entities that is directly linked to variations in the U.S. dollar, through obtaining financing in such currency. Exchange differences related to this debt, which is regarded as the hedging instrument in cash flow hedge transactions, are recognized, net
F-35
of taxes, in other comprehensive income and are accumulated in an equity reserve and reclassified to profit or loss when the hedged cash flows impact profit or loss. This term has been estimated at ten years.
For the purposes of presenting these combined financial statements, the financial of entities with functional currencies other than the Chilean peso are translated as follows:
| a. | For assets and liabilities is used the prevailing closing exchange rate. |
| b. | For income and expenses items is used the average exchange rate for the period (unless this average is not a reasonable approximation of the cumulative effect of the exchange rates prevailing on the dates of the transactions, in which case the exchange rate prevailing on the date of each transaction is used). |
| c. | For equity accounts is used the historical exchange rate from the date of acquisition or contribution, and retained earnings at the average exchange rate at the date of origination. |
Exchange differences arising in translation of financial statements are recognized in the item “Foreign currency translation gains (losses), net” in other comprehensive income and accumulated in equity (see Note 22).
| k) | Current/non-current classification |
In these combined statements of financial position, assets and liabilities expected to be recovered or settled within twelve months are presented as current items, except for post-employment and other similar obligations. Those assets and liabilities expected to be recovered or settled in more than twelve months are presented as non-current items. Deferred income tax assets and liabilities are classified as non-current.
When the Combined Group have any obligations that mature in less than twelve months but can be refinanced over the long term at the Combined Group’s discretion, through unconditionally available credit agreements with long-term maturities, such obligations are classified as long-term liabilities.
Income tax expense for the period is determined as the sum of current taxes from the Combined Group’s different combined entities and results from applying the tax rate to the taxable income for the period, after permitted deductions have been made, plus any changes in deferred income tax assets and liabilities and tax credits, both for tax losses and deductions. Differences between the carrying amount and tax basis of assets and liabilities generate deferred income tax assets and liabilities, which are calculated using the tax rates expected to apply when the assets and liabilities are realized or settled, based on tax rates that have been enacted or substantively enacted by the end of the reporting period.
Deferred income tax assets are recognized for all deductible temporary differences, tax losses and unused tax credits to the extent that it is probable that sufficient future taxable profits exist to recover the deductible temporary differences and make use of the tax credits. Such deferred tax asset is not recognized if the deductible temporary difference arises from the initial recognition of an asset or liability that:
| • | | Did not arise from a business combination, and |
| • | | At initial recognition affected neither accounting profit nor taxable profit (loss). |
With respect to deductible temporary differences associated with investments in combined entities, associates and joint arrangements, deferred income tax assets are recognized only to the extent that it is probable that the temporary differences will reverse in the foreseeable future and taxable profits will be available against which the temporary differences can be utilized.
F-36
Deferred income tax liabilities are recognized for all temporary differences, except those derived from the initial recognition of goodwill and those that arose from investments in combined entities, associates and joint ventures in which the Combined Group can control their reversal and where it is probable that they will not be reversed in the foreseeable future.
Current tax and changes in deferred income tax assets or liabilities are recognized in profit or loss or in equity, depending on where the gains or losses that triggered these tax entries have been recognized.
Any tax deductions that can be applied to current income tax liabilities are credited to earnings within the line item “Income tax expense”, except when doubts exist about their tax realization, in which case they are not recognized until they are effectively realized, or when they correspond to specific tax incentives, in which case they are recognized as government grants.
At the end of each reporting period, the Combined Group reviews the deferred taxes assets and liabilities recognized, and makes, if any, necessary corrections based on the results of its review.
Deferred income tax assets and deferred income tax liabilities are offset in the combined statement of financial position if has a legally enforceable right to set off current income tax receivables against current income tax liabilities, and only when the deferred taxes relate to income taxes levied by the same taxation authority.
Interim period income tax is accrued based on the estimated average annual effective income tax rate.
| m) | Revenue and expense recognition |
Revenue is the gross inflow of economic benefits during the period arising in the course of the ordinary activities of the Combined Group when those inflows result in increases in equity, other than increases relating to contributions from equity participants.
Revenue is measured at the fair value of the consideration received or receivable that gives rise to the revenue.
Revenue is recognized based on the economic substance of the transaction and is recognized when all of the following conditions are met:
| • | | the entity has transferred to the buyer the significant risks and rewards of ownership of the goods; |
| • | | the entity retains neither continuing managerial involvement to the degree usually associated with ownership nor effective control over the goods sold; |
| • | | the amount of revenue can be measured reliably; |
| • | | it is probable that the economic benefits associated with the transaction will flow to the entity; and |
| • | | the costs incurred or to be incurred in respect of the transaction can be measured reliably. |
Revenues from generation, transmission are recognized based on the following criteria:
| • | | Generation and transmission of electricity: Revenue is recognized based on physical delivery of energy and power, at prices established in the respective contracts; at prices stipulated in the electricity market by applicable regulations; or at marginal cost determined on the spot market, as the case. This revenue includes an estimate of the service provided and not billed until the closing date (see Note 2.3). |
In arrangements under which the Combined Group will perform multiple revenue-generating activities (multiple-element arrangement), the recognition criteria are applied to the separately identifiable components of the transaction in order to reflect the substance of the transaction or to two or more transactions together when they are linked in such a way that the commercial effect cannot be understood without reference to the series of transactions as a whole.
F-37
Revenue from rendering of services is recognized, if it can be estimated reliably, by reference to the stage of completion of the service at the end of the reporting period.
The Combined Group excludes from revenue those gross inflows of economic benefits it receives when it acts as an agent or commission agent on behalf of third parties, and only recognizes as revenue economic benefits received for its own activity.
When goods or services are exchanged or swapped for goods or services of a similar nature and value, the exchange is not regarded as a revenue-generating transaction.
The Combined Group recognizes the net amount of non-financial asset purchases or sale contracts that are settled for a net amount of cash or through some other financial instruments. Contracts entered into and maintained for the purpose of receiving or delivering these non-financial assets are recognized on the basis of the contractual terms of the purchase, sale, or usage requirements expected by the entity.
Finance income (expense) is recognized using the effective interest method.
Expenses are recognized on an accruals basis, immediately in the event of expenditures that do not generate future economic benefits or when they do not meet the requirements for recording them as assets.
Endesa Américas S.A. will be located in Chile, hence, will be subject to Chilean laws and regulations, in particularly related to approval and payment of dividends.
Article No. 79 of the Chilean Public Companies Act establishes that, unless unanimously agreed otherwise by the shareholders of all issued shares, listed corporations must distribute a cash dividend to shareholders on an annual basis, pro rata to the shares owned or the proportion established in the company’s by-laws if there are preferred shares, of at least 30% of profit for each year, except when accumulated deficit from prior years must be absorbed.
As it is practically impossible to achieve a unanimous agreement not to approve the mandatory dividend, given the intended Combined Group’s highly fragmented share capital, at the end of each reporting period the amount of the minimum statutory dividend obligation to its shareholders is determined, net of interim dividends approved during the period, and then accounted for in “Trade and other payables” and “Accounts payable to related parties”, as appropriate, and recognized in Equity.
Interim and final dividends are deducted from Equity when they are approved by the competent body, which in the first case is normally the Board of Directors and in the second case is the shareholders as agreed at an Ordinary Shareholders’ Meeting.
Since Endesa Américas has not yet been established as a legal entity, no chief operating decision maker existed for this Combined Group. Consequently, the Combined Group does not yet have any operating segments as the term is defined under IFRS 8, Operating Segments. The Combined Group has elected to provide supplemental geographic information not required by IFRS 8 in Note 30.
F-38
| 4. | SECTOR REGULATIONS AND ELECTRICITY SYSTEM OPERATIONS |
Argentina
Argentina has shown signs of intervention in the electricity market since the crisis of 2002. Under the previous regulations, generators sold to distributors at prices obtained from centralized calculations at the average spot market price. The distributers’ purchase price was the average price forecast for the next six months, called the Seasonal Price (Precio Estacional). Any differences between the Seasonal Price (the purchase price) and the actual spot price (the selling price) was charged to the Seasonal Fund (Fondo Estacional) managed by the Electricity Wholesale Market Administration Company (CAMMESA — Compañía Administradora del Mercado Mayorista Eléctrico).
However, after the 2002 crisis, the authorities changed the pricing criteria, bringing the marginal pricing system to an end. First, marginal prices were calculated without taking into account restrictions on natural gas. In effect, despite the fact that generation is dispatched on the basis of the fuels actually used, Resolution SE 240/2003 establishes that the marginal price is to be calculated taking into consideration all of the generation units as if there were no restrictions in effect on natural gas supplies. In addition, the expense of water is not included in the calculations if its opportunity cost is higher than the cost of generating power with natural gas. Second, it established a spot price ceiling of Ar$120/MWh. However, CAMMESA pays the actual variable costs of the liquid fuel-fired thermal plants through the Temporary Dispatch Cost Overruns program.
In addition, as the dollarized economy was devalued and went back to the Argentine peso, payment for capacity fell from US$10 to Ar$10 per MWh. Capacity payments have subsequently risen slightly, to Ar$12.
Additionally, the freezing of prices paid by distributors caused a difference with the real generation costs, resulting in various types of special agreements aimed at recovering costs, in accordance with regulations in force.
It was within this context that the government announced in 2012 its plan to replace the current regulatory framework with one based on an average cost scheme.
Resolution 95/2013 was published in March 2013, significantly changing the system for generators’ remunerations and setting new prices for capacity depending on the type of technology and availability. It also established new remuneration values for non-fuel variable costs and included additional fee for energy generated.
In May 2013, the Combined Group’s generating companies (Central Costanera S.A. and Hidroeléctrica El Chocón S.A.) accepted the terms of Resolution SE 95/2013.
This resolution marked the end of marginal pricing as a payment system in the Argentine power generation market and established, instead, payment by type of technology and size of plant. For each case, it recognizes fixed costs (determined on the basis of fulfillment of availability) and variable costs, plus an additional fee (the two parts are determined on the basis of the energy generated). Part of the additional fee will be placed in a trust for future investments.
In principle, commercial management and fuel dispatch will be in the hands of CAMMESA; Terminal Market agreements cannot be extended or renewed, and large users, once their respective contracts are up, must purchase their supply from CAMMESA. However, the Energy Secretary, in Note SE 1807/13, gave generators the opportunity to express their intention to continue handling collections for their entire contract portfolio, thus ensuring a certain amount of cash flow and a continuing relationship with the customer.
It is also important to mention that Central Costanera S.A. has availability contracts signed in 2012 that are still in effect, as well as combined cycle contracts (until 2015) and steam generation contracts (until 2019) that will
F-39
enable the company to implement a plan for investing in the Central Costanera S.A. plant generation units in order to optimize the reliability and availability of that plant. The contracts also include payment of the commitments under the Long-Term Service Agreement (LTSA) for the plant’s combined cycles.
Through Resolution 529/2014, the Energy Secretary updated generators’ fee, which had been in effect since they were set in February 2013 under Resolution 95/2013. The new resolution increased recognition of fixed costs for combined cycle and large hydroelectric plants by 25%; and adjusted variable costs by 41% for thermal plants and 25% for hydroelectric plants. A new variable fee was set for biodiesel-fired plants. The additional fee increased 25% for thermal plants, and a new charge of AR$21/MWh was set for one-time maintenance for combined cycle and Ar$24/MWh for other thermal generation plants. The resolution is retroactive to February 2014.
Through Resolution 482/2015, Energy Secretary updated generators’ fee, which had been in effect since they were set in February 2014 under Resolution 529/2014. The new resolution increased recognition of fixed costs for combined cycle and large hydroelectric plants by 28%, and 64% for mid-size hydroelectric plants. The variable costs were adjusted by 23%, hydroelectric plants are exempted of variable electric transmission payments and has been implemented a new incentive scheme for generation and operating effectiveness for thermal plants. The additional fee increased by 26% for thermal plants and 10% for mid-size hydroelectric plants. For non-recurring maintenance was increased by 17% and the same concept is created for hydroelectric plants in Ar$8/MWh. Finally, a new charge of Ar$15.8/MWh for thermal plants and Ar$6.3/MWh for hydroelectric plants was set for investments funding, which will be effective from February 2015 to December 2018 only for those generators participating in the projects. The new generation will have an additional fee equivalent to 50% of the direct additional fee based on technology for a 10-years period. The resolution is retroactive to February 2015.
Brazil
Legislation in Brazil allows the participation of private capital in the electricity sector, upholds free competition among companies in electricity generation, and defines criteria to avoid certain levels of economic concentration and/or market practices that may cause a decline in free competition.
Based on the contract requirements as stated by distribution companies, the Ministry of Energy has been involved in planning the expansion of the electricity system, setting capacity quotas by type of technology on the one hand and, on the other, promoting separate tender processes thermal, hydroelectric, or renewable energies, or directly holding tender processes for specific projects. The operation is being coordinated in a centralized fashion in which one independent operator coordinates centralized load dispatch based on variable production costs and seeks to guarantee to meet demand at the minimum cost for the system. The price at which transactions take place on the spot market is called the Difference Liquidation Price (Precio de Liquidación de las Diferencias, PLD), which takes into account the players’ aversion to risk.
Generation companies sell their energy on the regulated or unregulated market through contracts, and they trade their surpluses or deficits on the spot market. The free market is aimed at large users, with a limit of 3,000 kW or 500 kW if they purchase energy produced with renewable resources.
In the unregulated market, suppliers and their clients directly negotiate energy purchase conditions; whereas in the regulated market, where distribution companies operate, energy purchases must go through a tender process coordinated by the National Electricity Agency (ANEEL). Accordingly, the regulated purchase price used in the determination of tariffs to end users is based on average prices of open bids, and there are separate bidding processes for existing and new energy. Bidding processes for new energy contemplate long-term generation contracts in which new generation projects must cover the growth of demand foreseen by distributors. The open bid for existing energy considers shorter contractual terms and seeks to cover the distributors’ contractual needs arising from the expiry of prior contracts. Each bidding process is coordinated centrally. Authorities set maximum prices and, as a result, contracts are signed where all distributors participating in the process buy pro rata from each offering generator.
F-40
On November 25, 2014, the ANEEL approved the new PLD limits for 2015. The maximum limits decreased from R$823 to R$388/MWh and the minimum increased from R$16 to R$30/MWh. The decision was the result of extensive debate, which began with Public Consultation number 09/2014 and later with Public Hearing number 54/2014.
The main effect of the new limit is to reduce the financial impact for distributors of potential future risks when contracting energy in the spot market, as in 2014 the spot price was at its maximum for much of the year. The new maximum price also mitigates the risk of unrecoverable economic and financial losses for generators, when production is below contract values. However, the possibility of selling excess energy at higher prices decreases. Currently generators can divide their excess energy across the months of the year, to boost their revenues by allocating more energy to those months where higher prices are expected, as the ceiling is lower.
These regulatory mechanisms ensure the creation of regulatory assets, whose rate adjustment for deficits in 2014, will take place in the tariff adjustments starting in 2015 (March for Ampla Energía E Serviços S.A. (Ampla) and April for Compañía Energética Do Ceará S.A. (Coelce), subsidiaries of our associate). This mechanism has existed since 2001, and is called the Compensation Clearing Account — Part A (Cuenta de Compensación de Valores — Parte A, “CVA”). They aimed to maintain consistent operating margins for the dealer by allowing tariff revenue due to the costs of Parcel A.
Compensation Clearing Account (“CVA” for its acronym in Portuguese) helps maintain stability in the market and enables the creation of deferred costs, which is compensated through tariff adjustments based on the fees necessary to compensate for deficits from the previous year.
In December 2014 an addendum was signed to the concession contract for distributors in Brazil (including Ampla y Coelce), which allows these regulatory assets (CVA’s and others) to be included in indemnizable assets at the end of the concession, and if this is not possible over time, it allows compensation through tariffs. Therefore, the recognition for these regulatory assets/liabilities is allowed under IFRS.
Colombia
The Public Utility Law (Ley de Servicios Públicos Domiciliarios, Law No. 142) and the Electricity Law (Ley Eléctrica, Law No. 143) were passed in 1994 establishing the new framework ordered by the Constitution. These laws set out the general criteria and policies that are to govern public utility service provision in the country, as well as the procedures and mechanisms for regulating, monitoring and overseeing them.
The Electricity Law puts the constitutional focus into practice, regulating the generation, transmission, distribution and sale of electricity, creating the market and competitive environment, strengthening the industry and setting the boundaries for government intervention. Taking into account the nature of each activity or business, general guidelines were established for developing the regulatory framework, creating and implementing the rules that would allow for free competition in the power generation and sales industries, while the directives for the transmission and distribution industries were geared toward treating these activities as monopolies while seeking out competitive conditions wherever possible.
The main institution in the electricity sector is the Mining and Energy Ministry, whose Mining Energy Planning Unit (Unidad de Planeación Minero Energética, UPME) draws up the National Energy Plan and the Generation and Transmission Expansion Plan. The Energy and Gas Regulatory Commission (Comisión de Regulación de Energía y Gas, CREG) and the Public Service Superintendency (Superintendencia de Servicios Públicos, SSPD) regulate and oversee, respectively, the companies in the industry, and the Superintendency of Industry and Commerce is the national authority for free trade protection issues.
The electricity industry operates on the basis of electricity-selling companies and the large consumers being able to buy and sell energy through bilateral contracts or on a short-term energy exchange market, called the energy
F-41
exchange, which operates freely according to supply and demand conditions. In addition, long-term auctions of Firm Energy within a Reliable Charge scheme are carried out to promote the expansion of the system. The market is operated and administered by XM, which is in charge of the National Dispatch Center (Centro Nacional de Despacho, CND), and the Commercial Interchange System Manager (Administrador del Sistema de Intercambios Comerciales, ASIC).
Peru
The Electricity Concessions Law and its regulations, the Law to Ensure Efficient Development of Electricity Generation (Law No. 28,832), the Electricity Industry Antimonopoly and Oligopoly Law, the Technical Standard for Electricity Service Quality, the Environmental Protection Regulations for Electricity Activities, the Law Creating the Energy and Mining Investment Supervisory Agency (Osinergmin) and its regulations, and the Regulations for Unregulated Electricity Users and Decree Law No. 1221 which improves the regulation of the distribution of electricity to promote access to electricity in Peru, all comprise the main legislation in the regulatory framework for doing business in the power industry in Peru.
Law No. 28,832, whose purpose is to ensure enough efficient power generation to reduce the risk of price volatility and rationing, promotes the establishment of market prices based on competition, planning and ensuring a mechanism that guarantees expansion of the transmission grid, and also allows Large Unregulated Users and Distributors to participate in the short-term market. Accordingly, the law promotes tender processes for long-term power supply contracts at firm prices in order to encourage investment in efficient generation and contracts with distribution companies. Distribution companies must begin the tender processes at least three years ahead of time in order to keep Regulated Users’ demand covered.
Expansion in transmission must be planned through a binding Transmission Plan drawn up by the COES SINAC and approved first by the Osinergmin and then by the Energy and Mining Ministry. There are two types of systems: a) the Guaranteed Transmission System, which is paid for by the demand; and b) the Complementary Transmission System, which is financed jointly by the generation companies and by the demand.
The purpose of the COES SINAC is to coordinate operations at the lowest possible cost while ensuring a reliable system and the best use of energy resources, to plan transmission and to manage the short-term market. It is made up of generation, transmission and distribution companies and Large Unregulated Users (those with demand of 10 MW or higher) who belong to the National Interconnected Grid (Sistema Eléctrico Interconectado Nacional).
Generation companies may sell their power to: (i) Distribution companies through tender contracts or regulated bilateral contracts; (ii) Unregulated clients; and (iii) the spot market, where surplus energy is traded among generation companies. Generation companies are also paid for the firm capacity they contribute to the system regardless of their dispatch.
Peru’s spot price, given the definition of its ideal marginal cost, does not necessarily reflect the costs in the system, as it does not consider the current shortages in the natural gas and electricity transport system. Furthermore, it sets a ceiling price for the market. This was established in an emergency regulation in 2008 (Emergency Decree 049 of 2008) that will remain in effect at least until the end of 2016.
Legislative Decree No. 1221, published on September 24, 2015, amends certain aspects of the current framework, among others:
| • | | In tariff distribution, VAD (Value Added Distribution) and the Internal Rate of Return (IRR) calculation will be made individually for each distribution company with more than 50,000 customers. |
| • | | The Energy and Mining Ministry will define a Technical Responsibility Zone (ZRT) for each distributor, taking into consideration the environment of the regions where they operate (near to concession zones). The |
F-42
| | works conducted at the ZRT shall be approved by the Distributor, and it will have priority to conduct them or might be subsequently transferred to them. A VAD will be recognized for investment and audited actual costs (with an upper threshold). |
| • | | Add to the VAD a charge for Technological Innovation and/or Energy Efficiency in Distribution. |
| • | | Add an adjustment factor to the VAD that encourages service quality in distribution. |
| • | | Establishes an obligation to the Distributors to assure their regulated demand for 24 months. |
| • | | Establishes an obligation to the Distributor for electric works for urban housing or return the contribution once housing has reached 40%. |
| • | | Regarding the concessions, it limits to 30 years those granted through bidding processes, it establish a requirement for a favorable report of basin management for hydroelectric generation, and the granting and expiration of concessions shall be ruled through Ministry Resolution. |
| • | | Establish conditions for distributed generation of non-conventional renewable energy and co-generation that allows them to inject the surpluses to the distribution system without affecting the operational assurance. |
The description of the regulatory framework in the document does not include this Legislative Decree, since most of the amended aspects will be finalized by the end of 2015 or beginning of 2016, for its subsequent implementation.
Non-conventional renewable energy
| • | | In Brazil, the ANEEL holds auctions by technology considering the expansion plan set by the EPE, the planning agency, so that the target amount set for non-conventional renewable energy capacity is met. |
| • | | In Colombia, Law No. 697 was issued in 2001 by the Program for the Rational and Efficient Use of Energy and Other Forms of Non-Conventional Energy (Programa de Uso Racional y Eficiente de la Energía y demás formas de Energías No Convencionales — PROURE). Subsequently, indicative targets were defined for NCRE of 3.5% for 2015 and 6.5% for 2020. Law No. 1715 was enacted in 2014, which created a legal framework for the development of non-conventional renewable energy, in which guidelines for declarations of public interest, as well as tax, tariff and accounting incentives were established. As part of the implementation, the Ministry of Mines and Energy enacted Decree 2469 in 2014, establishing the guidelines for energy policy on supply of self-generation surpluses. Likewise, the Energy and Gas Regulatory Commission (CREG) issued Resolution 24/2015 regulating high-scale self-generation activity, and the Mining Energy Planning Unit (UPME) published resolution 281/2015, establishing the limit for low-scale (equal to 1MW) self-generation. Additionally, the CREG issued Resolution 11/2015 encouraging demand response mechanisms. In 2015 the CREG issued Resolution 138 that amends the remuneration scheme for confidence charged for minor plants. This new regulation establishes that such plants will belong to the centralized scheme of the charge and will declare ENFICC in order to obtain OEF assignments. If the difference between actual and programmed generation in those plants is lower than +/- 5%, they could keep the current remuneration scheme. The Ministry of Mines and Energy issued in 2015 Decree 1623 that establish guidelines on zone expansion policies. |
| • | | In Peru, a target of 5% has been set as the NCRE’s share in the country’s energy system. It is a nonbinding target and the regulatory agency, the Osinergmin, holds differential auctions by technology to help reach the goal. |
| • | | In Argentina, on September 23, 2015, the House of Representatives approved the new law for Renewable Energy in Argentina, replacing the current Law No. 26,190. The new regulation postpones to December 31, 2017 the goal to reach an 8% share in the national demand of energy with renewable sources for generation and establishes as a second goal to reach a 20% share in 2025 establishing mid-objectives of 12%, 16% and 18% for the end of years 2019, 2021 and 2023. The enacted Law creates a Fiduciary Fund (“FODER”) to |
F-43
| | finance works, grants tax benefits to renewable energy projects and establishes exemptions for specific taxes, national, provincial and municipality royalties until December 31, 2025. The customers categorized as Large Users (> 300 kW) shall comply on an individual basis with the renewable share goals, establishing that the price of the contracts shall not exceed 113 US$/MWh, and setting sanctions to those not fulfilling the goals. |
Limits on integration and concentration
In general, all of the countries have legislation in effect that defends free competition and, together with specific regulations that apply to the electricity market, defines criteria to avoid certain levels of economic concentration and/or abusive market practices.
In principle, the regulators allow the participation of companies in different activities (e.g. generation, distribution, and commercialization) as long as there is an adequate separation of each activity, for both accounting and company purposes. Nevertheless, most of the restrictions imposed involve the transmission sector mainly due to its nature and to the need to guarantee adequate access to all agents. In Argentina and Colombia there are specific restrictions if generation or distribution companies want to become majority shareholders in transmission companies.
Regarding concentration in a specific sector, in Argentina, there are no specific limits that affect the vertical or horizontal integration of a company. In Chile, while there are regulations on free competition, there are no specific quantitative limits on vertical or horizontal integration. However, the General Law on Electrical Services provides that companies that operate on or have ownership in the Trunk Transmission Systems cannot engage in, either directly or indirectly, activities that are in any way involved in the business of power generation or distribution. In Peru, integrations are subject to authorization. In Colombia, no company may have a direct or indirect market share of over 25% in electricity sale activities, although two criteria have been established for generating activity. One of these relates to participation limits depending on market concentration (HHI) and the size of the players according to their Firm Energy, and the other relates to pivotality conditions in the market depending on the availability of resources to meet system demand. In addition, Colombian companies created after the Public Service Law was enacted in 1994 can only engage in activities that complement generation/sales and distribution/sales. Finally, in Brazil, with the changes taking place in the power industry under Law No. 10,848/2004 and Decree 5,163/2004, the ANEEL gradually perfected regulations, eliminating concentration limits as no longer compatible with the prevailing regulatory environment. However, regulatory approval is required for consolidations or mergers to take place between players operating within the same business segment.
Market for unregulated customers
In all of the countries where the Combined Group operates, distributing companies can supply their customers under regulated or freely agreed conditions. The supply limitations imposed on the unregulated market are as follows:
| | |
Country | | kW threshold |
Argentina | | > 30 kW |
Brazil | | > 3,000 kW or > 500 kW (1) |
Colombia | | > 100 kW or 55 MWh-month |
Peru | | > 200 kW (2) |
| (1) | The >500 kW limit applies if energy is purchased from renewable sources, for which the government provides incentives through a discount on tolls. |
| (2) | In April 2009, it was established that clients between 200 kW and 2,500 kW could choose between the regulated and unregulated markets. Those using over 2,500 kW are required to be unregulated customers. |
F-44
| 5. | CASH AND CASH EQUIVALENTS |
| a) | The detail of cash and cash equivalents as of September 30, 2015 and December 31, 2014: |
| | | | | | | | |
Cash and cash equivalents | | Balance as of | |
| | 9-30-2015
ThCh$ | | | 12-31-2014
ThCh$ | |
Cash balances | | | 147,356 | | | | 23,111 | |
Bank balances | | | 114,099,709 | | | | 118,036,459 | |
Time deposits | | | 33,520,782 | | | | 165,339,077 | |
Other fixed-income instruments | | | 20,181,759 | | | | 15,043,583 | |
| | | | | | | | |
Total | | | 167,949,606 | | | | 298,442,230 | |
| | | | | | | | |
Time deposits included in cash and cash equivalents represent interest-bearing time deposits with original maturity of less than or equal to 90 days. Other fixed-income investments are mainly comprised of repurchase agreements with original maturities of less than or equal to 90 days. There is no significant available cash held by the Combined Group that is restricted.
| b) | The detail of cash and cash equivalents by currency is as follows: |
| | | | | | | | |
| | | Balance as of | |
Currency | | 9-30-2015
ThCh$ | | | 12-31-2014
ThCh$ | |
Chilean peso | | | 595,116 | | | | 12,398,834 | |
Argentine peso | | | 12,494,101 | | | | 12,479,893 | |
Colombian peso | | | 128,265,463 | | | | 224,221,908 | |
Peruvian nuevo sol | | | 18,281,598 | | | | 27,175,201 | |
U.S. dollar | | | 8,313,328 | | | | 22,166,394 | |
| | | | | | | | |
Total | | | 167,949,606 | | | | 298,442,230 | |
| | | | | | | | |
The detail of other financial assets as of September 30, 2015 and December 31, 2014 is as follows:
| | | | | | | | | | | | | | | | |
Other Financial Assets | | Balance as of | |
| | Current | | | Non-current | |
| | 9-30-2015 | | | 12-31-2014 | | | 9-30-2015 | | | 12-31-2014 | |
| | ThCh$ | | | ThCh$ | | | ThCh$ | | | ThCh$ | |
Available-for-sale financial investments — non-quoted equity securities or with limited liquidity | | | — | | | | — | | | | 624,898 | | | | 1,200,787 | |
Financial assets held to maturity (**) | | | 2,760,067 | | | | 19,747,428 | | | | — | | | | — | |
Hedging derivatives (*) | | | 318,966 | | | | 712,883 | | | | 5,396 | | | | 16,166 | |
Non-hedging derivatives (*) | | | 9,706,857 | | | | 2,924,888 | | | | — | | | | — | |
| | | | | | | | | | | | | | | | |
Total | | | 12,785,890 | | | | 23,385,199 | | | | 630,294 | | | | 1,216,953 | |
| | | | | | | | | | | | | | | | |
| (**) | The amounts included in “financial assets held to maturity” and “financial assets at fair value through profit or loss” correspond mainly to time deposits and other highly liquid investments that are readily convertible to cash and subject to a low risk of changes in value, but that do not fulfill the definition of cash equivalent as defined in Note 3.f.2 (e.g. with maturity over 90 days from time of investment). |
F-45
| 7. | TRADE AND OTHER RECEIVABLES |
| a) | The detail of trade and other receivables as of September 30, 2015 and December 31, 2014 is as follows: |
| | | | | | | | | | | | | | | | |
Trade and Other Receivables, Gross | | Balance as of | |
| | 9-30-2015 | | | 12-31-2014 | |
| | Current
ThCh$ | | | Non-current
ThCh$ | | | Current
ThCh$ | | | Non-current
ThCh$ | |
Trade and other receivables, gross | | | 196,990,172 | | | | 119,792,042 | | | | 118,610,475 | | | | 141,216,512 | |
Trade receivables, gross | | | 191,541,973 | | | | 115,981,188 | | | | 114,159,619 | | | | 136,744,799 | |
Other receivables, gross (*) | | | 5,448,199 | | | | 3,810,854 | | | | 4,450,856 | | | | 4,471,713 | |
| | | | | | | | | | | | | | | | |
Trade and Other Receivables, Net | | Balance as of | |
| | 9-30-2015 | | | 12-31-2014 | |
| | Current
ThCh$ | | | Non-current
ThCh$ | | | Current
ThCh$ | | | Non-current
ThCh$ | |
Trade and other receivables, net | | | 194,759,627 | | | | 119,792,042 | | | | 116,156,318 | | | | 141,216,512 | |
Trade and other receivables, net | | | 190,686,270 | | | | 115,981,188 | | | | 113,015,897 | | | | 136,744,799 | |
Other receivables, net (*) | | | 4,073,357 | | | | 3,810,854 | | | | 3,140,421 | | | | 4,471,713 | |
| (*) | Includes mainly accounts receivable from personnel for ThCh$2,790,224 (ThCh$3,077,508 as of December 31, 2014) and accounts receivable from FONINVEMEM (Fondo para Inversiones Necesarias que Permitan Incrementar la Oferta de Energía Eléctrica en el Mercado Eléctrico Mayorista), Argentina for ThCh$2,197,386 (ThCh$2,370,563 as of December 31, 2014). |
There are no significant trade and other receivables balances held by the Combined Group that are not available for its use.
The balances in this account do not generally accrue interest.
The Combined Group does not have customers for which it has sales representing 10% or more of its total combined revenues in the nine-month periods ended September 30, 2015 and 2014.
Refer to Note 8.1 for detailed information on amounts, terms and conditions associated with accounts receivable from related parties.
| b) | As of September 30, 2015 and December 31, 2014 the balance of unimpaired past due trade receivables is as follows: |
| | | | | | | | |
Trade Receivables Past Due But Not Impaired | | Balance as of | |
| | 9-30-2015 | | | 12-31-2014 | |
| | ThCh$ | | | ThCh$ | |
Less than three months | | | 16,696,073 | | | | 5,708,854 | |
Between three and six months | | | 5,337,460 | | | | 185,872 | |
Between six and twelve months | | | 3,715,283 | | | | 1,499,267 | |
| | | | | | | | |
Total | | | 25,748,816 | | | | 7,393,993 | |
| | | | | | | | |
F-46
| c) | The reconciliation of changes in the allowance for impairment of trade receivables is as follows: |
| | | | |
Trade Receivables Past Due and Impaired | | Current and
Non-current
ThCh$ | |
Balance as of January 1, 2014 | | | 1,822,903 | |
Increases (decreases) for the year | | | 869,239 | |
Amounts written off | | | (163,973 | ) |
Foreign currency translation differences | | | (74,012 | ) |
Balance as of December 31, 2014 | | | 2,454,157 | |
Increases (decreases) for the nine months (*) | | | (144,840 | ) |
Foreign currency translation differences | | | (78,772 | ) |
Balance as of September 30, 2015 | | | 2,230,545 | |
Write-offs of a bad debt
Past-due debt is written off once all collection measures and legal proceedings have been exhausted and the debtors’ insolvency has been demonstrated. In our power generation business, this process normally takes at least one year of procedures for the few cases that arise in each country.
| d) | Additional information: |
| • | | Additional statistical information required under Official Bulletin 715 of the Superintendencia de Valores y Seguros (Chilean Superintendency of Securities and Insurance) of February 3, 2012, XBRL Taxonomy: see Appendix 5. |
| • | | Complementary information on trade receivables: see Appendix 5.1. |
| 8. | BALANCES AND TRANSACTIONS WITH RELATED PARTIES |
Related party transactions are performed at current market conditions.
Transactions between entities with Combined Group have been eliminated on consolidation and are not itemized in this note.
As of the date of these financial statements, no guarantees have been granted or received nor has any allowance for bad or doubtful accounts been recognized with respect to receivable balances for related party transactions.
The controlling shareholder of the Combined Group is the Italian corporation Enel S.p.A.
F-47
| 8.1 | Balances and transactions with related parties |
The balances of accounts receivable and payables between the Combined Group and its non-combined related parties are as follows:
a) Receivables from related parties:
| | | | | | | | | | | | | | | | | | | | |
| | | | | | | | | | | | | | | Current balance as of | |
Taxpayer ID No. (RUT) | | Company | | Description of
Transaction | | Term of
transaction | | Relationship | | Currency | | Country | | 9-30-2015
ThCh$ | | | 12-31-2014
ThCh$ | |
| | | | | | | | |
Foreign | | Endesa Cemsa S.A. | | Energy sale | | Less than 90 days | | Associate | | Ar$ | | Argentina | | | 91,459 | | | | — | |
Foreign | | Endesa Cemsa S.A. | | Other services | | Less than 90 days | | Associate | | Ar$ | | Argentina | | | 509,599 | | | | — | |
Foreign | | Companhía Interconexao Energética S.A. | | Toll | | Less than 90 days | | Common control | | Ar$ | | Brazil | | | 8,365,589 | | | | 7,467,263 | |
Foreign | | Compañía Distribuidora y Comercializadora de Energía S.A. | | Energy sale | | Less than 90 days | | Common control | | CP | | Colombia | | | 5,923,997 | | | | 7,529,800 | |
Foreign | | Compañía Distribuidora y Comercializadora de Energía S.A. | | Other services | | Less than 90 days | | Common control | | CP | | Colombia | | | 69,847 | | | | 27,827 | |
Foreign | | Empresa de Energía de Piura S.A. | | Other services | | Less than 90 days | | Common control | | Sol | | Peru | | | 212,324 | | | | 321,910 | |
Foreign | | Empresa de Energía de Piura S.A. | | Other services | | Less than 90 days | | Common control | | Ch$ | | Chile | | | 168,913 | | | | 23,983 | |
Foreign | | Empresa de Distribución Eléctrica de Lima Norte S.A.A. | | Energy sale | | Less than 90 days | | Common control | | Sol | | Peru | | | 6,479,455 | | | | 5,507,890 | |
Foreign | | Empresa de Distribución Eléctrica de Lima Norte S.A.A. | | Other services | | Less than 90 days | | Common control | | Sol | | Peru | | | 446,371 | | | | 653,237 | |
Foreign | | Empresa de Distribución Eléctrica de Lima Norte S.A.A. | | Toll | | Less than 90 days | | Common control | | Sol | | Peru | | | 1,632,858 | | | | 926,965 | |
Foreign | | Empresa Distribuidora Sur S.A. | | Current account | | Less than 90 days | | Common control | | Ar$ | | Argentina | | | 5,560 | | | | 3,415 | |
Foreign | | Empresa de Energía de Cundinamarca S.A. | | Energy sale | | Less than 90 days | | Common control | | CP | | Colombia | | | 379,897 | | | | 260,417 | |
NewCo | | Enersis Chile S.A. | | Other services | | Less than 90 days | | Common control | | CP | | Chile | | | 1,478 | | | | — | |
Foreign | | Generalima S.A. | | Other services | | Less than 90 days | | Common control | | Ch$ | | Peru | | | 1,377,317 | | | | 3,176,838 | |
Foreign | | Distrilec Inversora S.A. | | Dividends | | Less than 90 days | | Associate | | US$ | | Argentina | | | 6,416 | | | | 6,158 | |
Foreign | | Endesa Generación S.A. | | Other services | | Less than 90 days | | Common control | | Ch$ | | Spain | | | 36,067 | | | | 36,066 | |
Foreign | | Central Dock Sud S.A. | | Other services | | Less than 90 days | | Common control | | Ch$ | | Spain | | | 2,033 | | | | — | |
Foreign | | Endesa Energía S.A. | | Other services | | Less than 90 days | | Common control | | Ch$ | | Chile | | | 497 | | | | — | |
Foreign | | Enel Brasil S.A. | | Dividends | | Less than 90 days | | Associate | | Ch$ | | Brazil | | | 10,707,564 | | | | — | |
Foreign | | Enel Brasil S.A. | | Dividends | | Less than 90 days | | Associate | | Real | | Brazil | | | 1,231,532 | | | | — | |
Foreign | | Compania Energetica Veracruz S.A.C. | | Other services | | Less than 90 days | | Common control | | Ch$ | | Peru | | | 913,532 | | | | — | |
Foreign | | Endesa Cemsa S.A. | | Other services | | Less than 90 days | | Parent | | Ar$ | | Chile | | | — | | | | 180,969 | |
96.764.840-K | | Enel Trade S.p.A. | | Other services | | Less than 90 days | | Common control | | Ch$ | | Chile | | | — | | | | 3,255 | |
| | | | | | | | | | | | | | | | | | | | |
| | Total | | | | | | | | | | | | | 38,562,305 | | | | 26,125,993 | |
| | | | | | | | | | | | | | | | | | | | |
As of September 30, 2015 and December 31, 2014 the Combined Group did not have non-current receivables from related parties.
F-48
| b) | Accounts payable to related parties: |
| | | | | | | | | | | | | | | | | | | | | | |
| | | | | | | | | | | | | | | | Current balance as of | |
Taxpayer ID No. (RUT) | | Company | | Description of
Transaction | | Term of
transaction | | Relationship | | Currency | | | Country | | 9-30-2015
ThCh$ | | | 9-30-2015
ThCh$ | |
| | | | | | | | |
Foreign | | Compañía Distribuidora y Comercializadora de Energía S.A. | | Energy purchase | | Less than 90 days | | Common control | | | CP | | | Colombia | | | 2,329,599 | | | | 2,088,174 | |
Foreign | | Compañía Distribuidora y Comercializadora de Energía S.A. | | Other services | | Less than 90 days | | Common control | | | CP | | | Colombia | | | 30,345 | | | | 59,568 | |
Foreign | | Compañía de Transmisión del Mercosur S.A. | | Toll | | Less than 90 days | | Common control | | | Ar$ | | | Argentina | | | 8,365,589 | | | | 7,467,263 | |
Foreign | | Empresa de Energía de Piura S.A. | | Toll | | Less than 90 days | | Common control | | | Sol | | | Peru | | | 422,857 | | | | 207,716 | |
Foreign | | Empresa de Energía de Piura S.A. | | Energy purchase | | Less than 90 days | | Common control | | | Sol | | | Peru | | | 4,964 | | | | — | |
Foreign | | Empresa de Energía de Piura S.A. | | Loans | | Less than 90 days | | Common control | | | Sol | | | Peru | | | 1,955,491 | | | | — | |
Foreign | | Empresa de Distribución Eléctrica de Lima Norte S.A.A. | | Other services | | Less than 90 days | | Common control | | | Sol | | | Peru | | | 382,490 | | | | 478,950 | |
Foreign | | Empresa de Distribución Eléctrica de Lima Norte S.A.A. | | Toll | | Less than 90 days | | Common control | | | Sol | | | Peru | | | 19,772 | | | | 35,678 | |
Foreign | | Empresa Distribuidora Sur S.A. | | Current account | | Less than 90 days | | Common control | | | Ar$ | | | Argentina | | | 144,444 | | | | 176,620 | |
Foreign | | Empresa de Energía de Cundinamarca S.A. | | Energy purchase | | Less than 90 days | | Common control | | | CP | | | Colombia | | | 159,117 | | | | 127,568 | |
NewCo | | Enersis Américas | | Dividends | | Less than 90 days | | Parent | | | CP | | | Chile | | | 26,510,224 | | | | 97,037,640 | |
NewCo | | Enersis Chile S.A. | | Other services | | Less than 90 days | | Common control | | | CP | | | Chile | | | 37,263 | | | | 54,845 | |
NewCo | | Enersis Chile S.A. | | Other services | | Less than 90 days | | Common control | | | Ch$ | | | Chile | | | 17,753 | | | | — | |
91.081.000-6 | | Empresa Nacional de Electricidad S.A | | Other services | | Less than 90 days | | Parent | | | Ch$ | | | Chile | | | 59,749 | | | | — | |
96.770.940-9 | | Compañía Eléctrica Tarapacá S.A. | | Other services | | Less than 90 days | | Parent | | | Ch$ | | | Chile | | | 5,916 | | | | 2,929 | |
Foreign | | Endesa Cemsa S.A. | | Other services | | Less than 90 days | | Parent | | | Ar$ | | | Chile | | | 1,609,990 | | | | 1,815,583 | |
NewCo | | Enersis América | | Dividends | | Less than 90 days | | Parent | | | Sol | | | Chile | | | — | | | | 3,139,149 | |
Foreign | | Enel Iberoamérica SRL | | Other services | | Less than 90 days | | Parent | | | CP | | | Spain | | | 48,659 | | | | 7,961 | |
Foreign | | Enel Iberoamérica SRL | | Other services | | Less than 90 days | | Parent | | | Ar$ | | | Spain | | | 158,650 | | | | 20,444 | |
Foreign | | Enel Iberoamérica SRL | | Other services | | Less than 90 days | | Parent | | | Eur | | | Spain | | | 46,414 | | | | 209,1323 | |
Foreign | | Enel Produzione S.p.A. | | Other services | | Less than 90 days | | Common control | | | Ch$ | | | Italy | | | 112,871 | | | | — | |
Foreign | | Enel Ingegneria & Ricerca | | Other services | | Less than 90 days | | Common control | | | Ch$ | | | Italy | | | 99,147 | | | | 131,555 | |
Foreign | | Endesa España S.A. | | Other services | | Less than 90 days | | Common control | | | Ch$ | | | Spain | | | 55,604 | | | | — | |
Foreign | | Enel Latinoamercia | | Other services | | Less than 90 days | | Parent | | | CP | | | Spain | | | 61,598 | | | | — | |
Foreign | | Enel S.p.A. | | Other services | | Less than 90 days | | Parent | | | Eur | | | Chile | | | 9,620 | | | | — | |
Foreign | | Enel S.p.A. | | Other services | | Less than 90 days | | Parent | | | Eur | | | Chile | | | 811,971 | | | | — | |
Foreign | | Endesa Energía S.A. | | Other services | | Less than 90 days | | Common control | | | Ch$ | | | Spain | | | 6,515 | | | | — | |
| | | | | | | | | | | | | | | | | | | | | | |
| | Total | | | | | | | | | | | | | | | 43,466,612 | | | | 113,060,776 | |
| | | | | | | | | | | | | | | | | | | | | | |
F-49
| c) | Significant transactions and effects on income/expenses: |
Transactions with related parties that are not consolidated and their effects on profit or loss are as follows:
| | | | | | | | | | | | | | | | |
| | | | | | | | | | | For the nine months ended | |
Taxpayer ID No. (RUT) | | Company | | Relationship | | Description of
Transaction | | Country | | 9-30-2015
ThCh$ | | | 9-30-2014
ThCh$
(Unaudited) | |
| | | | | | |
94.271.000-3 | | Enersis Chile | | Parent | | Services received | | Chile | | | (291,962 | ) | | | (239,547 | ) |
Foreign | | Empresa Distribuidora Sur S.A. | | Common control | | Services received | | Argentina | | | — | | | | (74,759 | ) |
Foreign | | Empresa Distribuidora Sur S.A. | | Common control | | Energy sale | | Argentina | | | 12,033 | | | | 11,838 | |
Foreign | | Compañía Distribuidora y Comercializadora de Energía S.A. | | Common control | | Energy sale | | Colombia | | | 51,043,886 | | | | 80,047,653 | |
Foreign | | Compañía Distribuidora y Comercializadora de Energía S.A. | | Common control | | Energy purchase | | Colombia | | | (673,267 | ) | | | (739,125 | ) |
Foreign | | Compañía Distribuidora y Comercializadora de Energía S.A. | | Common control | | Services provided | | Colombia | | | 73,900 | | | | 85,293 | |
Foreign | | Compañía Distribuidora y Comercializadora de Energía S.A. | | Common control | | Services received | | Colombia | | | (156,064 | ) | | | (97,546 | ) |
Foreign | | Compañía Distribuidora y Comercializadora de Energía S.A. | | Common control | | Loans | | Colombia | | | (13,165 | ) | | | — | |
Foreign | | Compañía Distribuidora y Comercializadora de Energía S.A. | | Common control | | Electricity tolls | | Colombia | | | (18,082,177 | ) | | | (19,920,406 | ) |
Foreign | | Empresa de Distribución Eléctrica de Lima Norte S.A.A. | | Common control | | Energy sale | | Peru | | | 52,652,749 | | | | 56,577,738 | |
Foreign | | Empresa de Distribución Eléctrica de Lima Norte S.A.A. | | Common control | | Electricity tolls | | Peru | | | (38,702 | ) | | | (106,555 | ) |
Foreign | | Empresa de Distribución Eléctrica de Lima Norte S.A.A. | | Common control | | Services provided | | Peru | | | 11,305,793 | | | | 95,652 | |
Foreign | | Empresa de Energía de Piura S.A. | | Common control | | Energy sale | | Peru | | | 209,857 | | | | 17,703 | |
Foreign | | Empresa de Energía de Piura S.A. | | Common control | | Energy purchase | | Peru | | | (1,666,499 | ) | | | (491,881 | ) |
Foreign | | Empresa de Energía de Piura S.A. | | Common control | | Services provided | | Peru | | | 345,407 | | | | 111,719 | |
Foreign | | Empresa de Energía de Piura S.A. | | Common control | | Services received | | Peru | | | — | | | | (1,701,451 | ) |
Foreign | | Empresa de Energía de Piura S.A. | | Common control | | Loans | | Peru | | | (14,686 | ) | | | — | |
Foreign | | Generalima S.A. | | Common control | | Services provided | | Peru | | | 329,311 | | | | 1,790,299 | |
Foreign | | Empresa de Energía de Cundinamarca S.A. | | Common control | | Electricity tolls | | Colombia | | | (808,977 | ) | | | (793,189 | ) |
Foreign | | Empresa de Energía de Cundinamarca S.A. | | Common control | | Energy sale | | Colombia | | | 3,168,848 | | | | 2,426,064 | |
Foreign | | Compañía de Transmisión del Mercosur S.A. | | Common control | | Electricity tolls | | Argentina | | | — | | | | (603,839 | ) |
Foreign | | Companhía Interconexao Energética S.A. | | Common control | | Electricity tolls | | Brazil | | | — | | | | 603,839 | |
Foreign | | Enel Iberoamérica SRL | | Parent | | Services received | | Spain | | | (84,579 | ) | | | (141,167 | ) |
Foreign | | Central Térmica Manuel Belgrano S.A. | | Associate | | Loans | | Argentina | | | — | | | | 292,044 | |
Foreign | | Central Térmica San Martin S.A. | | Associate | | Loans | | Argentina | | | — | | | | 376,073 | |
Foreign | | Central Dock Sud S.A. | | Common control | | Services provided | | Argentina | | | 2,444 | | | | 1,832 | |
96.770.940-9 | | Compañía Eléctrica Tarapacá S.A. | | Common control | | Services received | | Chile | | | (9,565 | ) | | | (8,112 | ) |
Foreign | | Endesa Cemsa S.A. | | Common control | | Services received | | Argentina | | | (8,694 | ) | | | (405,890 | ) |
Foreign | | Endesa Energía S.A. | | Common control | | Services received | | Spain | | | (6,465 | ) | | | — | |
Foreign | | Enel Ingegneria & Ricerca | | Common control | | Services received | | Italy | | | (106,524 | ) | | | (109,832 | ) |
Foreign | | Endesa España S.A. | | Common control | | Services received | | Spain | | | (52,034 | ) | | | — | |
Foreign | | Compania Energetica Veracruz S.A.C. | | Common control | | Services provided | | Peru | | | 1,132,769 | | | | — | |
Foreign | | Enel Produzione S.p.A. | | Common control | | Services received | | Italy | | | (121,269 | ) | | | — | |
Foreign | | Enel Latinoamercia | | Parent | | Services received | | Spain | | | (66,183 | ) | | | — | |
Foreign | | Enel S.p.A | | Parent | | Services received | | Italy | | | (9,086 | ) | | | — | |
Foreign | | Enel S.p.A | | Parent | | Services received | | Italy | | | (766,661 | ) | | | — | |
Foreign | | Inversiones Distrilima | | Common control | | Loans | | Peru | | | (1,734 | ) | | | — | |
| | | | | | | | | | | | | | | | |
| | | | | | Total | | | | | 97,298,704 | | | | 117,004,448 | |
| | | | | | | | | | | | | | | | |
Transfers of short-term funds between related parties are treated as current accounts changes, with variable interest rates based on market conditions used for the monthly balance. The resulting amounts receivable or payable are usually at 30 day terms, with automatic rollover for the same periods and amortization in line with cash flows.
| 8.2 | Key management personnel |
Key management of the Combined Group is defined as those persons who, due to their function within the companies of the Combined Group and in the interests of Endesa, are responsible for the worldwide operating business of the Combined Group. As of the reporting date of these Combined Financial Statements the key management of the Combined Group has not been elected. For the periods indicated in these Combined Financial Statements, the Combined Group was managed centrally by the managing directors of Endesa.
The Board of Directors of Endesa Américas initially consists of nine members who were elected for an interim term at an Extraordinary Shareholders’ Meeting of Endesa held on December 18, 2015 to hold office until the first Ordinary Shareholders’ Meeting of Endesa Américas to be held in April 2016 (the “2016 OSM”). At the 2016 OSM, the entire Board of Directors consisting of nine members are expected to be elected to a three-year term. Following the end of their term, they may be re-elected or replaced. If a vacancy occurs in the interim, the Board of Directors will elect a temporary director to fill the vacancy until the next OSM, at which time the entire Board of Directors will be elected to new three-year term. The Executive Officers of Endesa Américas are expected be appointed by the Board of Directors and hold office at the discretion of the Board.
F-50
| 8.3 | Compensation plans linked to share price |
There are no compensation plans linked to the share price.
As of September 30, 2015 and December 31, 2014, this caption is composed of the following:
| | | | | | | | |
Classes of Inventories | | Balance as of | |
| | 9-30-2015 | | | 12-31-2014 | |
| | ThCh$ | | | ThCh$ | |
Supplies for Production | | | 7,109,724 | | | | 14,197,499 | |
Oil | | | 4,182,691 | | | | 9,852,369 | |
Coal | | | 2,927,033 | | | | 4,345,130 | |
Supplies for projects and spare parts | | | 16,526,673 | | | | 14,702,438 | |
| | | | | | | | |
Total | | | 23,636,397 | | | | 28,899,937 | |
| | | | | | | | |
For the nine months ended September 30, 2015, the amount for raw materials and consumables recognized as fuel consumption was ThCh$90,406,491 (ThCh$73,640,796 for the nine months ended September 30, 2014). See Note 24.
As of September 30, 2015 and December 31, 2014, there are no inventories pledged as collateral to hedge any liability.
As of September 30, 2015 and December 31, 2014, no inventories have been written down due to obsolescence.
| 10. | CURRENT TAX RECEIVABLES AND PAYABLES |
The detail of current tax receivables as of September 30, 2015 and December 31, 2014 is as follows:
| | | | | | | | |
Tax Receivables | | Balance as of | |
| | 9-30-2015
ThCh$ | | | 12-31-2014
ThCh$ | |
| | |
Monthly provisional tax payments | | | 47,671 | | | | 47,214 | |
Tax credit for absorbed profits | | | 64,899 | | | | 1,117,399 | |
Other | | | 7,064 | | | | 1,424,201 | |
| | | | | | | | |
Total | | | 119,634 | | | | 2,588,814 | |
| | | | | | | | |
The detail of current tax payables as of September 30, 2015 and December 31, 2014 is as follows:
| | | | | | | | |
Tax Payables | | Balance as of | |
| | 9-30-2015 | | | 12-31-2014 | |
| | ThCh$ | | | ThCh$ | |
Income tax | | | 30,706,802 | | | | 62,911,253 | |
Other | | | — | | | | 824 | |
| | | | | | | | |
Total | | | 30,706,802 | | | | 62,912,077 | |
| | | | | | | | |
F-51
| 11. | INVESTMENTS ACCOUNTED FOR USING THE EQUITY METHOD |
| 11.1 | Investments accounted for using the equity method |
| a) | The following tables present the changes in investments in investments accounted for with the equity method as of September 30, 2015 and December 31, 2014: |
| | | | | | | | | | | | | | | | | | | | | | | | | | | | | | | | | | | | | | | | | | | | | | |
Changes in Investments in Combined
Associates | | Relationship | | Country | | Currency | | Ownership
interest | | | Balance as
of
1-1-2015 | | | Additions | | | Share of
Profit
(Loss) | | | Dividends
Declared | | | Foreign
Currency
Translation | | | Other
Comprehensive
Income | | | Balance as
of
9-30-2015 | | | Negative
Equity
Provision | | | Balance as
of
9-30-2015 | |
| | | | | | ThCh$ | | | ThCh$ | | | ThCh$ | | | ThCh$ | | | ThCh$ | | | ThCh$ | | | ThCh$ | | | ThCh$ | | | ThCh$ | |
Enel Brasil S.A. | | Associate | | Brazil | | Brazilian
real | | | 38.6367 | % | | | 538,876,929 | | | | — | | | | 27,869,847 | | | | (16,468,784 | ) | | | (122,809,790 | ) | | | (1,015,067 | ) | | | 426,453,135 | | | | — | | | | 426,453,135 | |
Endesa Cemsa S.A. | | Associate | | Argentina | | Argentine
peso | | | 45.0000 | % | | | 1,979,132 | | | | — | | | | (1,174,821 | ) | | | — | | | | 22,452 | | | | — | | | | 826,763 | | | | — | | | | 826,763 | |
Distrilec Inversora S.A. (**) | | Associate | | Argentina | | Argentine
peso | | | 0.8875 | % | | | — | | | | — | | | | 330,926 | | | | — | | | | 1,958 | | | | (3,716 | ) | | | 329,168 | | | | (315,634 | ) | | | 13,534 | |
Central Térmica Manuel Belgrano S.A. | | Associate | | Argentina | | Argentine
peso | | | 24.1760 | % | | | — | | | | 8,699 | | | | 1,125,211 | | | | (590,465 | ) | | | 21,524 | | | | — | | | | 564,969 | | | | — | | | | 564,969 | |
Central Térmica San Martin S.A. | | Associate | | Argentina | | Argentine
peso | | | 24.1760 | % | | | — | | | | 8,699 | | | | 1,016,876 | | | | (506,552 | ) | | | 20,557 | | | | — | | | | 539,580 | | | | — | | | | 539,580 | |
Central Vuelta Obligada S.A. | | Associate | | Argentina | | Argentine
peso | | | 3.4500 | % | | | — | | | | 12,321 | | | | — | | | | — | | | | 488 | | | | — | | | | 12,809 | | | | — | | | | 12,809 | |
| | | | | | | | | | | | | | | | | | | | | | | | | | | | | | | | | | | | | | | | | | | | | | |
| | | | | | | | | TOTALES | | | | 540,856,061 | | | | 29,719 | | | | 29,168,039 | | | | (17,565,801 | ) | | | (122,742,811 | ) | | | (1,018,783 | ) | | | 428,726,424 | | | | (315,634 | ) | | | 428,410,790 | |
| | | | | | | | | | | | | | | | | | | | | | | | | | | | | | | | | | | | | | | | | | | | | | |
| | | | | | | | | | | | | | | | | | | | | | | | | | | | | | | | | | | | | | | | | | | | | | |
Changes in Investments in Combined
Associates | | Relationship | | | Country | | | Currency | | Ownership
Interest
% | | | Balance as
of
1-1-2014 | | | Share of
Profit
(Loss) | | | Dividends
Declared | | | Foreign
Currency
Translation | | | Other
Comprehensive
Income | | | Balance as
of
12-31-2014 | | | Negative
Equity
Provision | | | Balance as
of
12-31-2014 | |
| | | | | | ThCh$ | | | ThCh$ | | | ThCh$ | | | ThCh$ | | | ThCh$ | | | ThCh$ | | | ThCh$ | | | ThCh$ | |
Enel Brasil S.A. (*) | | | Associate | | | | Brazil | | | Brazilian real | | | 38.6367 | | | | 543,713,349 | | | | 62,181,301 | | | | (75,642,378 | ) | | | 10,619,850 | | | | (1,995,193 | ) | | | 538,876,929 | | | | — | | | | 538,876,929 | |
Endesa Cemsa S.A. | | | Associate | | | | Argentina | | | Ar$ | | | 45.0000 | | | | 2,400,103 | | | | (153,554 | ) | | | — | | | | (267,417 | ) | | | — | | | | 1,979,132 | | | | — | | | | 1,979,132 | |
Distrilec Inversora S.A. (**) | | | Associate | | | | Argentina | | | Ar$ | | | 0.8875 | | | | 141,706 | | | | (429,336 | ) | | | — | | | | (24,724 | ) | | | (3,280 | ) | | | (315,634 | ) | | | 315,634 | | | | — | |
| | | | | | | | | | | | | | | | | | | | | | | | | | | | | | | | | | | | | | | | | | | | | | |
| | | | | | | | | | | | | TOTAL | | | | 546,255,158 | | | | 61,598,411 | | | | (75,642,378 | ) | | | 10,327,709 | | | | (1,998,473 | ) | | | 540,540,427 | | | | 315,634 | | | | 540,856,061 | |
| | | | | | | | | | | | | | | | | | | | | | | | | | | | | | | | | | | | | | | | | | | | | | |
| (*) | Change in legal name on December 12, 2014 from Endesa Brasil S.A. to Enel Brasil S.A. |
| (**) | There is a significant influence since Enersis, parent company, owns a 51.5% interest in Distrilec Inversora S.A. |
| b) | As of September 30, 2015 and December 31, 2014, no changes in ownership interest in our combined investment associates had occurred. |
F-52
| 11.2 | Additional financial information on investments in significant combined associated companies |
The following tables show financial information as of September 30, 2015 and December 31, 2014 and for the nine months ended September 30, 2015 and for the year ended December 31, 2014 from the financial statements of the significant investments in combined associates where the Combined Group has significant influence:
| | | | | | | | | | | | | | | | | | | | | | | | | | | | | | | | | | | | | | | | |
Investments with Significant Influence | | As of and for the nine months ended September 30, 2015 | |
| | Ownership
Interest
% | | | Current
Assets | | | Non-current
Assets | | | Current
Liabilities | | | Non-current
Liabilities | | | Revenues | | | Expenses | | | Profit
(Loss) | | | Other
Comprehensive
Income | | | Comprehensive
Income | |
| | | ThCh$ | | | ThCh$ | | | ThCh$ | | | ThCh$ | | | ThCh$ | | | ThCh$ | | | ThCh$ | | | ThCh$ | | | ThCh$ | |
Enel Brasil S.A. | | | 38.64 | | | | 751,013,504 | | | | 1,890,667,594 | | | | 553,750,060 | | | | 730,565,092 | | | | 1,561,860,090 | | | | (1,469,218,293 | ) | | | 92,641,797 | | | | (398,989,929 | ) | | | (306,348,132 | ) |
Endesa Cemsa S.A. | | | 45.00 | | | | 29,203,797 | | | | 113,568 | | | | 27,480,116 | | | | — | | | | 589,988 | | | | (3,200,702 | ) | | | (2,610,714 | ) | | | 49,894 | | | | (2,560,820 | ) |
Distrilec Inversora S.A. | | | 0.89 | | | | 791,329 | | | | — | | | | 869,680 | | | | 37,012,422 | | | | 37,288,813 | | | | — | | | | 37,288,813 | | | | 1,393,654 | | | | 38,682,467 | |
| | | | | | | | | | | | | | | | | | | | | | | | | | | | | | | | | | | | | | | | |
Investments with Significant Influence | | As of and for the year ended December 31, 2014 | |
| | Ownership
Interest % | | | Current
Assets | | | Non-current
Assets | | | Current
Liabilities | | | Non-current
Liabilities | | | Revenues | | | Expenses | | | Profit
(Loss) | | | Other
Comprehensive
Income | | | Comprehensive
Income | |
| | | ThCh$ | | | ThCh$ | | | ThCh$ | | | ThCh$ | | | ThCh$ | | | ThCh$ | | | ThCh$ | | | ThCh$ | | | ThCh$ | |
Enel Brasil S.A. | | | 38.64 | | | | 754,829,591 | | | | 2,402,919,071 | | | | 481,334,130 | | | | 959,822,163 | | | | 2,269,559,959 | | | | (2,058,056,356 | ) | | | 211,503,603 | | | | 23,085,739 | | | | 234,589,342 | |
Endesa Cemsa S.A. | | | 45.00 | | | | 28,225,495 | | | | 873,712 | | | | 24,701,137 | | | | — | | | | 1,280,939 | | | | (1,622,171 | ) | | | (341,232 | ) | | | (594,259 | ) | | | (935,491 | ) |
Distrilec Inversora S.A. | | | 0.89 | | | | 759,186 | | | | — | | | | 823,444 | | | | 35,501,499 | | | | — | | | | (48,377,741 | ) | | | (48,377,741 | ) | | | — | | | | (48,377,741 | ) |
None of our associates have published price quotations.
Appendix 2 to these combined financial statements provides information on the main activities of our associated companies and the ownership interest the Combined Group holds in them.
| c) | There are no significant commitments and contingencies, or restrictions on funds transfers to its owners in combined associated companies. |
F-53
| 12. | INTANGIBLE ASSETS OTHER THAN GOODWILL |
Intangible assets as of September 30, 2015 and December 31, 2014 are detailed as follows:
| | | | | | | | |
Intangible Assets, Net | | Balance as of | |
| | 9-30-2015
ThCh$ | | | 12-31-2014
ThCh$ | |
Easements and water rights | | | 22,395,307 | | | | 23,857,707 | |
Development costs | | | 6,034,173 | | | | 5,666,572 | |
Patents, registered trademarks and other rights | | | 1,038,126 | | | | 1,514,216 | |
Computer software | | | 1,933,523 | | | | 2,180,863 | |
Other identifiable intangible assets | | | 93,014 | | | | 380,562 | |
| | | | | | | | |
Total | | | 31,494,143 | | | | 33,599,920 | |
| | | | | | | | |
| | | | | | | | |
Intangible Assets, Gross | | Balance as of | |
| | 9-30-2015
ThCh$ | | | 12-31-2014
ThCh$ | |
Easements and water rights | | | 29,394,806 | | | | 30,761,192 | |
Development costs | | | 8,268,500 | | | | 8,192,203 | |
Patents, registered trademarks and other rights | | | 2,436,635 | | | | 2,662,312 | |
Computer software | | | 6,712,148 | | | | 6,727,772 | |
Other identifiable intangible assets | | | 2,572,510 | | | | 2,906,351 | |
| | | | | | | | |
Total | | | 49,384,599 | | | | 51,249,830 | |
| | | | | | | | |
| | | | | | | | |
Accumulated Amortization and Impairment | | Balance as of | |
| | 9-30-2015
ThCh$ | | | 12-31-2014
ThCh$ | |
Easements and water rights | | | (6,999,499 | ) | | | (6,903,485 | ) |
Development costs | | | (2,234,327 | ) | | | (2,525,631 | ) |
Patents, registered trademarks and other rights | | | (1,398,509 | ) | | | (1,148,096 | ) |
Computer software | | | (4,778,625 | ) | | | (4,546,909 | ) |
Other identifiable intangible assets | | | (2,479,496 | ) | | | (2,525,789 | ) |
| | | | | | | | |
Total | | | (17,890,456 | ) | | | (17,649,910 | ) |
| | | | | | | | |
F-54
The reconciliation of the carrying amounts of intangible assets during the nine months ended September 30, 2015 and the year ended December 31, 2014 is as follows:
| | | | | | | | | | | | | | | | | | | | | | | | |
Changes in Intangible Assets | | Development
Costs
ThCh$ | | | Easements
and
Water
Rights
ThCh$ | | | Patents,
Registered
Trademarks,
and Other
Rights
ThCh$ | | | Computer
Software
ThCh$ | | | Other
Identifiable
Intangible
Assets, Net
ThCh$ | | | Intangible
Assets, Net
ThCh$ | |
Opening Balance as of January 1, 2015 | | | 5,666,572 | | | | 23,857,707 | | | | 1,514,216 | | | | 2,180,863 | | | | 380,562 | | | | 33,599,920 | |
Changes in identifiable intangible assets | | | | | | | | | | | | | | | | | | | | | | | | |
Increases other than those from business combinations | | | 3,445,461 | | | | — | | | | 87,449 | | | | 145,056 | | | | — | | | | 3,677,966 | |
Increase (decrease) from net foreign exchange differences, net | | | (729,559 | ) | | | (1,078,764 | ) | | | (152,220 | ) | | | (28,507 | ) | | | (12,127 | ) | | | (2,001,177 | ) |
Amortization (*) | | | — | | | | (659,055 | ) | | | (411,319 | ) | | | (377,589 | ) | | | — | | | | (1,447,963 | ) |
Increases (decreases) from transfers and other changes | | | (2,348,301 | ) | | | 275,419 | | | | — | | | | 13,700 | | | | (275,421 | ) | | | (2,334,603 | ) |
Increases (decreases) from transfers | | | (581,282 | ) | | | 275,419 | | | | — | | | | 1 | | | | (275,421 | ) | | | (581,283 | ) |
Increases (decreases) from other changes | | | (1,767,019 | ) | | | — | | | | | | | | 13,699 | | | | — | | | | (1,753,320 | ) |
| | | | | | | | | | | | | | | | | | | | | | | | |
Total changes in identifiable intangible assets | | | 367,601 | | | | (1,462,400 | ) | | | (476,090 | ) | | | (247,340 | ) | | | (287,548 | ) | | | (2,105,777 | ) |
| | | | | | | | | | | | | | | | | | | | | | | | |
Closing Balance as of September 30, 2015 | | | 6,034,173 | | | | 22,395,307 | | | | 1,038,126 | | | | 1,933,523 | | | | 93,014 | | | | 31,494,143 | |
| | | | | | | | | | | | | | | | | | | | | | | | |
Changes in Intangible Assets | | Development
Costs
ThCh$ | | | Easements
and
Water
Rights
ThCh$ | | | Patents,
Registered
Trademarks,
and Other
Rights
ThCh$ | | | Computer
Software
ThCh$ | | | Other
Identifiable
Intangible
Assets, Net
ThCh$ | | | Intangible
Assets, Net
ThCh$ | |
| | | | | | |
Opening balance as of January 1, 2014 | | | 7,365,668 | | | | 21,315,038 | | | | 1,824,735 | | | | 816,264 | | | | 3,224,267 | | | | 34,545,972 | |
Changes in identifiable intangible assets | | | | | | | | | | | | | | | | | | | | | | | | |
Increases other than those from business combinations | | | 1,990,879 | | | | 1,797,729 | | | | 280,380 | | | | 1,381,534 | | | | — | | | | 5,450,522 | |
Increase (decrease) from net foreign exchange differences, net | | | (331,951 | ) | | | (434,490 | ) | | | (91,295 | ) | | | (18,092 | ) | | | 121,365 | | | | (754,463 | ) |
Amortization (*) | | | (2,734,208 | ) | | | (1,289,449 | ) | | | (613,665 | ) | | | (413,419 | ) | | | — | | | | (5,050,741 | ) |
Increases (decreases) from transfers and other changes | | | (510,099 | ) | | | 392,822 | | | | (5,381 | ) | | | (81,615 | ) | | | (2,512,462 | ) | | | (2,716,735 | ) |
Increases (decreases) from transfers | | | — | | | | (1 | ) | | | (5,381 | ) | | | 5,382 | | | | — | | | | — | |
Increases (decreases) from other changes | | | (510,099 | ) | | | 392,823 | | | | — | | | | (86,997 | ) | | | (2,512,462 | ) | | | (2,716,735 | ) |
Disposals and withdrawals from service | | | (113,717 | ) | | | — | | | | — | | | | — | | | | — | | | | (113,717 | ) |
Withdrawals from service | | | (113,717 | ) | | | — | | | | — | | | | — | | | | — | | | | (113,717 | ) |
Other increases/(decreases) | | | — | | | | 2,076,057 | | | | 119,442 | | | | 496,191 | | | | (452,608 | ) | | | 2,239,082 | |
| | | | | | | | | | | | | | | | | | | | | | | | |
Total changes in identifiable intangible assets | | | (1,699,096 | ) | | | 2,542,669 | | | | (310,519 | ) | | | 1,364,599 | | | | (2,843,705 | ) | | | (946,052 | ) |
| | | | | | | | | | | | | | | | | | | | | | | | |
Closing Balance as of December 31, 2014 | | | 5,666,572 | | | | 23,857,707 | | | | 1,514,216 | | | | 2,180,863 | | | | 380,562 | | | | 33,599,920 | |
According to the Combined Group management’s estimates and projections, the expected future cash flows attributable to intangible assets allow recovery of the carrying amount of these assets recognized as of September 30, 2015 and December 31, 2014 (see Note 3.d).
F-55
As of September 30, 2015 and December 31, 2014 the Combined Group does not have significant intangible assets with an indefinite useful life.
The following table shows goodwill by the Cash-Generating Unit or group of Cash-Generating Units to which it belongs and changes for the nine months ended September 30, 2015 and for the year ended December 31, 2014:
| | | | | | | | | | | | | | | | |
Company | | Cash-Generating Unit | | | Balance as of
1-1-2015
ThCh$ | | | Foreign
Currency
Exchange
Differences
ThCh$ | | | Balance as of
9-30-2015
ThCh$ | |
Hidroeléctrica El Chocón S.A. | | | Hidroeléctrica El Chocón S.A. | | | | 7,622,438 | | | | 265,681 | | | | 7,888,119 | |
Edegel S.A.A. | | | Edegel S.A.A. | | | | 88,241,040 | | | | 5,718,014 | | | | 93,959,054 | |
Emgesa S.A.E.S.P. | | | Emgesa S.A.E.S.P. | | | | 4,886,064 | | | | (563,556 | ) | | | 4,322,508 | |
| | | | | | | | | | | | | | | | |
Total | | | | | | | 100,749,542 | | | | 5,420,139 | | | | 106,169,681 | |
| | | | | | | | | | | | | | | | |
| | | | | | | | | | | | | | |
Company | | Cash-Generating Unit | | Balance as of
1-1-2014
ThCh$ | | | Foreign
Currency
Exchange
Differences
ThCh$ | | | Balance as of
12-31-2014
ThCh$ | |
Hidroeléctrica El Chocón S.A | | Hidroeléctrica El Chocón S.A. | | | 8,565,202 | | | | (942,764 | ) | | | 7,622,438 | |
Edegel S.A.A. | | Edegel S.A.A. | | | 81,661,135 | | | | 6,579,905 | | | | 88,241,040 | |
Emgesa S.A.E.S.P. | | Emgesa S.A.E.S.P. | | | 5,213,756 | | | | (327,692 | ) | | | 4,886,064 | |
| | | | | | | | | | | | | | |
Total | | | | | 95,440,093 | | | | 5,309,449 | | | | 100,749,542 | |
| | | | | | | | | | | | | | |
The origin of goodwill is detailed below:
| 1. | Hidroeléctrica El Chocón S.A. |
On August 31, 1993, the Combined Group acquired 59% of Hidroeléctrica El Chocón in an international public bidding process held by the Argentine government.
On October 9, 2009, in a transaction on the Lima Stock Exchange in Peru, the Combined Group acquired an additional 29.3974% interest in Edegel S.A.A.
On October 23, 1997, the Combined Group, together with Endesa Spain, bought 48.5% of Generadora de Electricidad Emgesa de Santa Fé de Bogotá in Colombia. The purchase was made in an international public bidding process held by the Colombian government.
According to the Combined Group management’s estimates and projections, the expected future cash flows projections attributable to the Cash-Generating Units or groups of Cash-Generating Units, to which the acquired goodwill has been allocated, allow recovery of its carrying amount as of September 30, 2015 and December 31, 2014 (see Note 3.b).
F-56
| 14. | PROPERTY, PLANT AND EQUIPMENT |
| a) | Property, plant, and equipment as of September 30, 2015 and December 31, 2014: |
| | | | | | | | |
Classes of Property, Plant and Equipment, Net | | Balance as of | |
| | 9-30-2015 | | | 12-31-2014 | |
| | ThCh$ | | | ThCh$ | |
Construction in progress | | | 965,212,226 | | | | 736,836,581 | |
Land | | | 19,110,576 | | | | 19,166,794 | |
Buildings | | | 14,444,863 | | | | 16,261,602 | |
Plant and equipment | | | 1,681,908,428 | | | | 1,792,187,832 | |
Fixtures and fittings | | | 8,319,114 | | | | 9,932,658 | |
Finance leases | | | 35,607,560 | | | | 34,929,490 | |
| | | | | | | | |
Total | | | 2,724,602,767 | | | | 2,609,314,957 | |
| | | | | | | | |
| | | | | | | | |
Classes of Property, Plant and Equipment, Gross | | Balance as of | |
| | 9-30-2015 | | | 12-31-2014 | |
| | ThCh$ | | | ThCh$ | |
Construction in progress | | | 965,212,226 | | | | 736,836,581 | |
Land | | | 19,110,576 | | | | 19,166,794 | |
Buildings | | | 26,649,686 | | | | 28,782,635 | |
Plant and equipment | | | 3,098,153,985 | | | | 3,170,873,041 | |
Fixtures and fittings | | | 34,861,051 | | | | 37,210,304 | |
Finance leases | | | 54,400,434 | | | | 50,315,614 | |
| | | | | | | | |
Total | | | 4,198,387,958 | | | | 4,043,184,969 | |
| | | | | | | | |
| | | | | | | | |
Classes of Accumulated Depreciation and
Impairment of Property, Plant and Equipment | | Balance as of | |
| | 9-30-2015 | | | 12-31-2014 | |
| | ThCh$ | | | ThCh$ | |
Buildings | | | (12,204,823 | ) | | | (12,521,033 | ) |
Plant and equipment | | | (1,416,245,557 | ) | | | (1,378,685,209 | ) |
Fixtures and fittings | | | (26,541,937 | ) | | | (27,277,646 | ) |
Finance leases | | | (18,792,874 | ) | | | (15,386,124 | ) |
| | | | | | | | |
Total | | | (1,473,785,191 | ) | | | (1,433,870,012 | ) |
| | | | | | | | |
F-57
| b) | The detail of, and changes in, property, plant, and equipment for the nine months ended September 30, 2015 and for the year ended December 31, 2014 are as follows: |
| | | | | | | | | | | | | | | | | | | | | | | | | | | | | | |
Changes in nine months ended
September 30, 2015 | | Construction
in Progress | | | Land | | | Buildings,
Net | | | Plant and
Equipment,
Net | | | Fixtures
and
Fittings,
Net | | | Other
Property,
Plant and
Equipment
under
Finance
Leases, Net | | | Property,
Plant and
Equipment,
Net | |
| | ThCh$ | | | ThCh$ | | | ThCh$ | | | ThCh$ | | | ThCh$ | | | ThCh$ | | | ThCh$ | |
Opening Balance as of January 1, 2015 | | | 736,836,581 | | | | 19,166,794 | | | | 16,261,602 | | | | 1,792,187,832 | | | | 9,932,658 | | | | 34,929,490 | | | | 2,609,314,957 | |
Change
| | Increases other than those from business combinations | | | 348,014,124 | | | | 18,184 | | | | 2,404 | | | | 65,775 | | | | 19,724 | | | | 100,970 | | | | 348,221,181 | |
| | Increase (decrease) from net foreign exchange differences | | | (84,309,220 | ) | | | (1,094,012 | ) | | | (1,123,211 | ) | | | (76,450,869 | ) | | | (429,140 | ) | | | 2,169,002 | | | | (161,237,450 | ) |
| | Depreciation (*) | | | — | | | | — | | | | (1,015,993 | ) | | | (72,560,897 | ) | | | (1,529,411 | ) | | | (2,293,057 | ) | | | (77,399,358 | ) |
| | Impairment losses recognized in profit or loss (*) | | | — | | | | — | | | | — | | | | (31,799 | ) | | | — | | | | — | | | | (31,799 | ) |
| | Increases (decreases) from transfers and other changes | | | (41,150,020 | ) | | | 1,019,610 | | | | 320,061 | | | | 38,866,305 | | | | 813,203 | | | | 712,121 | | | | 581,280 | |
| | Increases (decreases) from transfers from construction in process | | | (41,150,020 | ) | | | 1,019,610 | | | | 320,061 | | | | 38,866,305 | | | | 813,203 | | | | 712,121 | | | | 581,280 | |
| | Disposals and withdrawals from service | | | (25,356 | ) | | | — | | | | — | | | | (10,287 | ) | | | (21,750 | ) | | | (10,966 | ) | | | (68,359 | ) |
| | Withdrawals | | | (25,356 | ) | | | — | | | | — | | | | (10,287 | ) | | | (21,750 | ) | | | (10,966 | ) | | | (68,359 | ) |
| | Other increases / (decreases) | | | 5,846,117 | | | | — | | | | — | | | | (157,632 | ) | | | (466,170 | ) | | | — | | | | 5,222,315 | |
| | Total changes | | | 228,375,645 | | | | (56,218 | ) | | | (1,816,739 | ) | | | (110,279,404 | ) | | | (1,613,544 | ) | | | 678,070 | | | | 115,287,810 | |
| | | | | | | | | | | | | | | | | | | | | | | | | | | | | | |
Closing balance as of September 30, 2015 | | | 965,212,226 | | | | 19,110,576 | | | | 14,444,863 | | | | 1,681,908,428 | | | | 8,319,114 | | | | 35,607,560 | �� | | | 2,724,602,767 | |
| | | | | | | | | | | | | | | | | | | | | | | | | | | | | | |
| | | | | | | | | | | | | | | | | | | | | | | | | | | | | | |
Changes in 2014 | | Construction
in Progress | | | Land | | | Buildings,
Net | | | Plant and
Equipment,
Net | | | Fixtures
and
Fittings,
Net | | | Other
Property,
Plant and
Equipment
under
Finance
Leases, Net | | | Property,
Plant and
Equipment,
Net | |
| | ThCh$ | | | ThCh$ | | | ThCh$ | | | ThCh$ | | | ThCh$ | | | ThCh$ | | | ThCh$ | |
Opening balance as of January 1, 2014 | | | 522,211,534 | | | | 19,637,844 | | | | 14,600,432 | | | | 1,875,010,043 | | | | 10,851,896 | | | | — | | | | 2,442,311,749 | |
Change | | Increases other than those from business combinations | | | 346,724,045 | | | | — | | | | — | | | | — | | | | 494,213 | | | | — | | | | 347,218,258 | |
| | Increase (decrease) from net foreign exchange differences | | | (50,181,221 | ) | | | (432,098 | ) | | | (631,466 | ) | | | (31,210,466 | ) | | | (229,490 | ) | | | 2,853,252 | | | | (79,831,489 | ) |
| | Depreciation (*) | | | — | | | | — | | | | (929,038 | ) | | | (92,532,672 | ) | | | (2,316,992 | ) | | | (3,006,892 | ) | | | (98,785,594 | ) |
| | Impairment losses recognized in profit or loss (*) | | | — | | | | — | | | | — | | | | (1,188,617 | ) | | | — | | | | — | | | | (1,188,617 | ) |
| | Increases (decreases) from transfers and other changes | | | (82,412,095 | ) | | | — | | | | 1,801,536 | | | | 79,484,527 | | | | 1,126,032 | | | | — | | | | — | |
| | Increases (decreases) from transfers from construction in process | | | (82,412,095 | ) | | | — | | | | 1,801,536 | | | | 79,484,527 | | | | 1,126,032 | | | | — | | | | — | |
| | Disposals and withdrawals from service | | | (1 | ) | | | — | | | | — | | | | (186,817 | ) | | | (4,730 | ) | | | — | | | | (191,548 | ) |
| | Withdrawals | | | (1 | ) | | | — | | | | — | | | | (186,817 | ) | | | (4,730 | ) | | | — | | | | (191,548 | ) |
| | Other increases / (decreases) | | | 494,319 | | | | (38,952 | ) | | | 1,420,138 | | | | (1,392,917 | ) | | | 11,729 | | | | (712,119 | ) | | | (217,802 | ) |
| | Total changes | | | 214,625,047 | | | | (471,050 | ) | | | 1,661,170 | | | | (47,026,962 | ) | �� | | (919,238 | ) | | | (865,759 | ) | | | 167,003,208 | |
| | | | | | | | | | | | | | | | | | | | | | | | | | | | | | |
Closing balance as of December 31, 2014 | | | 736,836,581 | | | | 19,166,794 | | | | 16,261,602 | | | | 1,792,187,832 | | | | 9,932,658 | | | | 34,929,490 | | | | 2,609,314,957 | |
| | | | | | | | | | | | | | | | | | | | | | | | | | | | | | |
F-58
Additional information on property, plant and equipment, net
Material investments in the electricity generation business include developments in the program to create new capacity, including progress on the construction of the El Quimbo Hydroelectric Plant in Colombia with 400 MW of installed capacity and an average annual generation of 2,216 GWh. The construction involved additions of ThCh$ 276,220,039 for the nine months ended September 30, 2015 (ThCh$175,419,903 for the year ended December 31, 2014).
The present value of future lease payments derived from our finance leases is as follows:
| | | | | | | | | | | | | | | | | | | | | | | | |
| | | 9-30-2015 | | | 12-31-2014 | |
| | Gross
ThCh$ | | | Unearned
Interest
ThCh$ | | | Present
Value
ThCh$ | | | Gross
ThCh$ | | | Unearned
Interest
ThCh$ | | | Present
Value
ThCh$ | |
Less than one year | | | 10,212,331 | | | | 509,518 | | | | 9,702,813 | | | | 9,065,537 | | | | 630,649 | | | | 8,434,888 | |
From one to five years | | | 17,929,901 | | | | 179,520 | | | | 17,750,381 | | | | 22,369,473 | | | | 645,774 | | | | 21,723,699 | |
| | | | | | | | | | | | | | | | | | | | | | | | |
Total | | | 28,142,232 | | | | 689,038 | | | | 27,453,194 | | | | 31,435,010 | | | | 1,276,423 | | | | 30,158,587 | |
| | | | | | | | | | | | | | | | | | | | | | | | |
Leased assets primarily relate to combined subsidiary Edegel S.A.A. They represent lease agreements to finance the project of converting the Ventanilla thermoelectric plant to a combined cycle plant. The agreements were signed between Edegel S.A.A. and the financial institutions BBVA — Banco Continental, Banco de Crédito del Perú, Citibank del Peru, and Banco Internacional del Perú — Interbank. These agreements have an average term of 8 years and bear interest at an annual rate of Libor + 1.75% as of September 30, 2015 and December 31, 2014. The company also has an agreement with Scotiabank, which financed the construction of a new open cycle plant at the Santa Rosa Plant. This agreement has a term of 9 years and bears interest an annual rate of Libor + 1.75%.
As of September 30, 2015 and December 31, 2014 the Combined Group did not have operating lease agreements.
| 1. | As of September 30, 2015 and December 31, 2014 the Combined Group had property, plant and equipment pledged as security for liabilities in the amount of ThCh$ 19,618,343 and ThCh$ 21,952,283, respectively (see Note 31). |
| 2. | The Combined Group has insurance policies for all risks, earthquake and machinery breakdown and damages for business interruption with a €1,000 million limit. Additionally, the Combined Group has Civil Liability insurance to meet claims from third parties with a €500 million limit. The premiums associated with these policies are presented proportionally for each company in the caption “Prepaid Expenses”. |
| a) | The origin and changes in deferred income tax assets and liabilities as of September 30, 2015 and December 31, 2014 are as follows: |
| | | | | | | | | | | | | | | | | | | | | | | | | | |
Deferred Income Tax Assets | | Deferred Income Tax Assets Relating to | |
| | Accumulated
Depreciation | | | Provisions | | | Post-
Employment
Benefit
Obligations | | | Revaluation
of Financial
Instruments | | | Other | | | Deferred
Tax
Assets | |
Opening Balance as of January 1, 2015 | | | 42,483,159 | | | | 3,067,481 | | | | 534,650 | | | | 54,260 | | | | 1,420,067 | | | | 47,559,617 | |
Change
| | Increase (decrease) in profit or loss | | | (3,198,319 | ) | | | 387,488 | | | | (16,199 | ) | | | (51,573 | ) | | | 87,922 | | | | (2,790,681 | ) |
| | Increase (decrease) in other comprehensive income | | | — | | | | — | | | | (12,027 | ) | | | — | | | | — | | | | (12,027 | ) |
| | Foreign currency translation | | | (3,368,151 | ) | | | (314,268 | ) | | | (54,120 | ) | | | (2,687 | ) | | | (158,239 | ) | | | (3,897,465 | ) |
| | Other increase (decrease) | | | (18,921,278 | ) | | | (969,533 | ) | | | 9,401 | | | | — | | | | 2,585 | | | | (19,878,825 | ) |
Closing Balance as of September 30, 2015 | | | 16,995,411 | | | | 2,171,168 | | | | 461,705 | | | | — | | | | 1,352,335 | | | | 20,980,619 | |
F-59
| | | | | | | | | | | | | | | | | | | | | | | | | | |
Deferred Income Tax Assets | | Deferred Income Tax Assets Relating to | |
| | Accumulated
Depreciation | | | Provisions | | | Post-
Employment
Benefit
Obligations | | | Revaluation
of Financial
Instruments | | | Other | | | Deferred
Tax
Assets | |
Opening balance as of January 1, 2014 | | | 43,045,134 | | | | 2,164,028 | | | | 391,111 | | | | — | | | | 236,623 | | | | 45,836,896 | |
Change
| | Increase (decrease) in profit or loss | | | 1,939,582 | | | | 1,342,330 | | | | 110,333 | | | | — | | | | 4,388 | | | | 3,396,633 | |
| | Increase (decrease) in other comprehensive income | | | — | | | | — | | | | 230,837 | | | | (350,303 | ) | | | — | | | | (119,466 | ) |
| | Foreign currency translation | | | (2,365,601 | ) | | | (425,101 | ) | | | (55,492 | ) | | | 12,753 | | | | (69,349 | ) | | | (2,902,790 | ) |
| | Other increase (decrease) | | | (135,956 | ) | | | (13,776 | ) | | | (142,139 | ) | | | 391,810 | | | | 1,248,405 | | | | 1,348,344 | |
Closing Balance as of December 31, 2014 | | | 42,483,159 | | | | 3,067,481 | | | | 534,650 | | | | 54,260 | | | | 1,420,067 | | | | 47,559,617 | |
| | | | | | | | | | | | | | | | | | | | | | |
| | | | | Deferred Income Tax Liabilities Relating to | |
Deferred Income Tax Liabilities | | Accumulated
Depreciation | | | Provisions | | | Revaluation
of Financial
Instruments | | | Other | | | Deferred
Tax
Liabilities | |
Opening Balance as of January 1, 2015 | | | 131,736,197 | | | | 41,174 | | | | 163,062 | | | | 26,334,403 | | | | 158,274,836 | |
Change
| | Increase (decrease) in profit or loss | | | 17,307,636 | | | | — | | | | — | | | | (3,941,117 | ) | | | 13,366,519 | |
| | Increase (decrease) in other comprehensive income | | | — | | | | — | | | | (93,247 | ) | | | — | | | | (93,247 | ) |
| | Foreign currency translation | | | 8,323,316 | | | | 2,668 | | | | 10,566 | | | | 787,946 | | | | 9,124,496 | |
| | Other increase (decrease) | | | (19,059,085 | ) | | | — | | | | 137,806 | | | | (974,793 | ) | | | (19,896,072 | ) |
Closing Balance as of September 30, 2015 | | | 138,308,064 | | | | 43,842 | | | | 218,187 | | | | 22,206,439 | | | | 160,776,532 | |
| | | | | | | | | | | | | | | | | | | | | | |
Deferred Income Tax Liabilities | | Deferred Income Tax Liabilities Relating to | |
| | Accumulated
Depreciation | | | Provisions | | | Revaluation
of Financial
Instruments | | | Other | | | Deferred
Tax
Liabilities | |
Opening balance as of January 1, 2014 | | | 134,632,915 | | | | 20,222 | | | | 170,603 | | | | 10,907,651 | | | | 145,731,391 | |
Change
| | Increase (decrease) in profit or loss | | | (13,061,065 | ) | | | — | | | | 14,115,519 | | | | 1,054,454 | | | | (13,061,065 | ) |
| | Increase (decrease) in other comprehensive income | | | — | | | | — | | | | — | | | | 108,000 | | | | — | |
| | Foreign currency translation | | | 11,216,877 | | | | (307,279 | ) | | | (890,509 | ) | | | 10,032,708 | | | | 11,216,877 | |
| | Other increase (decrease) | | | (1,052,530 | ) | | | 328,231 | | | | 2,201,742 | | | | 1,348,283 | | | | (1,052,530 | ) |
Closing Balance as of December 31, 2014 | | | 131,736,197 | | | | 41,174 | | | | 163,062 | | | | 26,334,403 | | | | 158,274,836 | |
Recovery of deferred income tax assets will depend on whether sufficient tax profits are obtained in the future. Management of the Combined Group believes that the future profit projections for various combined entities will allow these assets to be recovered.
| b) | As of September 30, 2015 and December 31, 2014 the Combined Group has not recognized deferred income tax assets related to tax losses carry forward totaling ThCh$ 23.145.840 and ThCh$ 8,735,477, respectively (see Note 3.l). |
The Combined Group has not recognized deferred income tax liabilities for taxable temporary differences associated with investment in combined entities and joint ventures, as it is able to control the timing of the reversal of the temporary differences and considers that it is probable that such temporary differences will not reverse in the foreseeable future. The aggregate amount of taxable temporary differences associated with investments in combined entities and joint ventures for which deferred income tax liabilities have not been recognized totaled ThCh$ 266,458,118 as of September 30, 2015 (ThCh$ 278,617,731 as of December 31, 2014).
Additionally, the Combined Group has not recognized deferred tax asset for deductible temporary differences which as of September 30, 2015, totaled ThCh$ 263,399,562 (ThCh$ 216,259,651 as of December 31, 2014), because that it is not probable that sufficient future taxable profits exist to recover such temporary differences.
F-60
The Combined Group companies are potentially subject to income tax audits by the tax authorities of each country in which the Combined Group operates. Such tax audits are limited to a number of annual tax periods and once these have expired audits of these periods can no longer be performed. Tax audits by nature are often complex and can require several years to complete. The following table presents a summary of tax periods potentially subject to examination:
| | | | |
Country | | Period | |
Argentina | | | 2008-2014 | |
Brazil | | | 2009-2014 | |
Colombia | | | 2012-2014 | |
Peru | | | 2009-2014 | |
Given the range of possible interpretations of tax standards, the results of any future inspections carried out by tax authorities for the years subject to audit can give rise to tax liabilities that cannot currently be quantified objectively. Nevertheless, the Combined Group’s management estimates that the liabilities, if any, that may arise from such audits, would not significantly impact the companies’ future results.
The effects of deferred tax on the components of Other Comprehensive Income (Loss) are as follows:
| | | | | | | | | | | | | | | | | | | | | | | | |
Effects of Deferred Tax on the
Components of Other Comprehensive Income | | Nine months ended September 30, 2015 | | | Nine months ended September 30, 2014
(Unaudited) | |
| | Amount
Before Tax | | | Income
Tax
Expense
(Benefit) | | | Amount
After Tax | | | Amount
Before Tax | | | Income
Tax
Expense
(Benefit) | | | Amount
After Tax | |
| | ThCh$ | | | ThCh$ | | | ThCh$ | | | ThCh$ | | | ThCh$ | | | ThCh$ | |
Available-for-sale financial assets | | | (441,557 | ) | | | — | | | | (441,557 | ) | | | — | | | | — | | | | — | |
Cash flow hedge | | | (8,639,118 | ) | | | 2,652,518 | | | | (5,986,600 | ) | | | (5,053,319 | ) | | | 1,501,298 | | | | (3,552,021 | ) |
Foreign currency translation | | | (169,202,400 | ) | | | — | | | | (169,202,400 | ) | | | 170,799,224 | | | | — | | | | 170,799,224 | |
Amount of other comprehensive income from investments accounted for using the equity method | | | (1,018,783 | ) | | | — | | | | (1,018,783 | ) | | | (69,472 | ) | | | — | | | | (69,472 | ) |
Actuarial income on defined-benefit pension plans | | | 659,949 | | | | (256,589 | ) | | | 403,360 | | | | — | | | | — | | | | — | |
Income tax related to components of other income and expenses debited or credited to Equity | | | (178,641,909 | ) | | | 2,395,929 | | | | (176,245,980 | ) | | | 165,676,433 | | | | 1,501,298 | | | | 167,177,731 | |
| c) | In Colombia, Law 1,739 dated 2014 increased from 8% to 9% indefinitely the rate for the specific income tax for financing social programs known as CREE, levied on taxable profits earned each year for the tax year 2016 onwards. Additionally, this Law established the CREE surcharge of 5%, 6%, 8% and 9% for 2015, 2016, 2017 and 2018, respectively. |
The effect of temporary differences involving the payment of less or more income tax in the current period is recognized as a deferred tax credit or debit respectively at the tax rates in effect when the differences are reversed (39% in 2015 40% in 2016, 42% in 2017, 43% in 2018 and 34% from 2019), provided there is a reasonable expectation that such differences will reverse in the future and that the asset will generate sufficient taxable income.
F-61
| d) | In Peru, the rate of corporate income tax is 30% on taxable income, after deducting the employees profit share of 5% of taxable income, as of September 30, 2015 and December 31, 2014. |
Law No. 30296 establishes that the applicable rate of corporate income tax on taxable income, after deducting the employees profit share will be as follows: 28% in 2015 and 2016, 27% in 2017 and 2018, and 26% from 2019 onwards.
| 16. | OTHER FINANCIAL LIABILITIES |
The balance of other financial liabilities as of September 30, 2015 and December 31, 2014 is as follows:
| | | | | | | | | | | | | | | | |
Other Financial Liabilities | | Balance as of | |
| | 9-30-2015 | | | 12-31-2014 | |
| | Current
ThCh$ | | | Non-current
ThCh$ | | | Current
ThCh$ | | | Non-current
ThCh$ | |
Interest-bearing borrowings | | | 255,655,744 | | | | 886,787,519 | | | | 144,380,202 | | | | 1,046,984,911 | |
Hedging derivatives (*) | | | 12,260 | | | | 440,185 | | | | 14,658 | | | | 582,788 | |
Non-hedging derivatives (**) | | | 390,849 | | | | — | | | | — | | | | — | |
| | | | | | | | | | | | | | | | |
Total | | | 256,058,853 | | | | 887,227,704 | | | | 144,394,860 | | | | 1,047,567,699 | |
| | | | | | | | | | | | | | | | |
| 16.1 | Interest-bearing borrowings |
The detail of current and non-current interest-bearing borrowings as of September 30, 2015 and December 31, 2014 is as follows:
| | | | | | | | | | | | | | | | |
Interest-bearing borrowings | | Balance as of | |
| | 9-30-2015 | | | 12-31-2014 | |
| | Current
ThCh$ | | | Non-current
ThCh$ | | | Current
ThCh$ | | | Non-current
ThCh$ | |
Bank loans | | | 192,629,246 | | | | 94,814,734 | | | | 33,899,668 | | | | 158,762,494 | |
Unsecured liabilities | | | 33,406,923 | | | | 732,000,411 | | | | 95,676,216 | | | | 830,468,792 | |
Finance leases | | | 9,702,813 | | | | 17,750,381 | | | | 8,434,888 | | | | 21,723,699 | |
Other obligations | | | 19,916,762 | | | | 42,221,993 | | | | 6,369,430 | | | | 36,029,926 | |
| | | | | | | | | | | | | | | | |
Total | | | 255,655,744 | | | | 886,787,519 | | | | 144,380,202 | | | | 1,046,984,911 | |
| | | | | | | | | | | | | | | | |
Bank loans by currency and contractual maturity as of September 30, 2015 and December 31, 2014 are as follows:
| • | | Summary of bank loans by currency and contractual maturity |
| | | | | | | | | | | | | | | | | | | | | | | | | | | | | | | | | | | | | | | | | | | | | | | | |
Country | | Currency | | Effective
Interest
Rate | | | Nominal
Interest
Rate | | | Secured
(Yes/No) | | Balance as of 9-30-2015 | |
| | | | | | Current | | | Non-current | |
| | | | | | One to
three
months | | | Three to
twelve
months | | | Total
Current | | | One to
two years | | | Two to
three years | | | Three to
four years | | | Four to
five years | | | More than
five years | | | Total Non-
current | |
| | | | | | ThCh$ | | | ThCh$ | | | ThCh$ | | | ThCh$ | | | ThCh$ | | | ThCh$ | | | ThCh$ | | | ThCh$ | | | ThCh$ | |
Peru | | US$ | | | 2.09 | % | | | 2.01 | % | | No | | | 1,025,266 | | | | 27,850,642 | | | | 28,875,908 | | | | 3,700,177 | | | | 19,483,122 | | | | 586,562 | | | | — | | | | — | | | | 23,769,861 | |
Argentina | | US$ | | | 13.76 | % | | | 13.06 | % | | No | | | 5,221,615 | | | | 2,381,035 | | | | 7,602,650 | | | | — | | | | — | | | | — | | | | — | | | | — | | | | — | |
Argentina | | Ar$ | | | 40.97 | % | | | 35.30 | % | | No | | | 3,335,731 | | | | 6,511,624 | | | | 9,847,355 | | | | 2,261,799 | | | | — | | | | — | | | | — | | | | — | | | | 2,261,799 | |
Colombia | | CP | | | 6.04 | % | | | 5.92 | % | | No | | | 63,087,089 | | | | 83,216,244 | | | | 146,303,333 | | | | — | | | | — | | | | — | | | | — | | | | 68,783,074 | | | | 68,783,074 | |
| | | | | | | | | | | | | | | | | | | | | | | | | | | | | | | | | | | | | | | | | | | | | | | | |
| | | | | | | | | | | | Total | | | 72,669,701 | | | | 119,959,545 | | | | 192,629,246 | | | | 5,961,976 | | | | 19,483,122 | | | | 586,562 | | | | — | | | | 68,783,074 | | | | 94,814,734 | |
| | | | | | | | | | | | | | | | | | | | | | | | | | | | | | | | | | | | | | | | | | | | | | | | |
F-62
| | | | | | | | | | | | | | | | | | | | | | | | | | | | | | | | | | | | | | | | | | | | | | | | | | |
Country | | Currency | | Effective
Interest
Rate | | | Nominal
Interest
Rate | | | Secured
(Yes/No) | | | Balance as of 12-31-2014 | |
| | | | | | Current | | | Non-current | |
| | | | | | One to
three
months | | | Three to
twelve
months | | | Total
Current | | | One to
two years | | | Two to
three years | | | Three to
four years | | | Four to
five years | | | More than
five years | | | Total Non-
current | |
| | | | | | ThCh$ | | | ThCh$ | | | ThCh$ | | | ThCh$ | | | ThCh$ | | | ThCh$ | | | ThCh$ | | | ThCh$ | | | ThCh$ | |
Peru | | US$ | | | 3.01 | % | | | 2.93 | % | | | No | | | | 2,472,247 | | | | 8,382,913 | | | | 10,855,160 | | | | 38,628,554 | | | | 17,850,471 | | | | 16,254,959 | | | | 255,432 | | | | — | | | | 72,989,416 | |
Argentina | | US$ | | | 13.68 | % | | | 13.03 | % | | | No | | | | 11,451,387 | | | | 2,126,669 | | | | 13,578,056 | | | | 1,022,595 | | | | — | | | | — | | | | — | | | | — | | | | 1,022,595 | |
Argentina | | Ar$ | | | 39.91 | % | | | 35.13 | % | | | No | | | | 2,861,876 | | | | 6,395,181 | | | | 9,257,057 | | | | 6,999,683 | | | | — | | | | — | | | | — | | | | — | | | | 6,999,683 | |
Colombia | | CP | | | 8.29 | % | | | 8.13 | % | | | No | | | | — | | | | 209,395 | | | | 209,395 | | | | — | | | | — | | | | — | | | | — | | | | 77,750,800 | | | | 77,750,800 | |
| | | | | | | | | | | | | | | | | | | | | | | | | | | | | | | | | | | | | | | | | | | | | | | | | | |
| | | | | | | | | | | | | Total | | | | 16,785,510 | | | | 17,114,158 | | | | 33,899,668 | | | | 46,650,832 | | | | 17,850,471 | | | | 16,254,959 | | | | 255,432 | | | | 77,750,800 | | | | 158,762,494 | |
| | | | | | | | | | | | | | | | | | | | | | | | | | | | | | | | | | | | | | | | | | | | | | | | | | |
| • | | Fair value measurement and hierarchy |
The fair value of current and non-current bank borrowings as of September 30, 2015 and December 31, 2014 totaled ThCh$ 281,061,609 and ThCh$ 201,007,394, respectively. During both periods, the borrowings have been classified as Level 2 fair values based on the inputs from the valuation techniques used (see Note 3.g).
F-63
| • | | Identification of Bank Loans by Company |
| | | | | | | | | | | | | | | | | | | | | | | | | | | | | | | | | | | | | | | | | | | | | | | | | | | | | | | | | | |
Taxpayer ID
No. (RUT) | | Company | | Country | | ID No.
Financial
Institution | | Financial Institution | | Country | | Cur-
rency | | Effective
Interest
Rate | | | Nominal
Interest
Rate | | | Amortization | | Balance as of 9-30-2015 | |
| | | | | | | | | | | Current | | | Non-current | |
| | | | | | | | | | | Less
than 90
days | | | More
than 90
days | | | Total
Current | | | One to
two
years | | | Two to
three
years | | | Three
to four
years | | | Four to
five
years | | | More
than five
years | | | Total
Non-
current | |
Foreign | | Chinango S.A.C. | | Peru | | Foreign | | Banco de Credito del Peru | | Peru | | US$ | | | 2.12 | % | | | 2.01 | % | | Quarterly | | | 237,628 | | | | 589,274 | | | | 826,902 | | | | 785,699 | | | | 17,874,659 | | | | — | | | | — | | | | — | | | | 18,660,358 | |
Foreign | | Chinango S.A.C. | | Peru | | Foreign | | Bank Of Nova Scotia | | Peru | | US$ | | | 3.18 | % | | | 3.01 | % | | Quarterly | | | 450,042 | | | | 1,306,016 | | | | 1,756,058 | | | | 1,741,355 | | | | 435,340 | | | | — | | | | — | | | | — | | | | 2,176,695 | |
Foreign | | Chinango S.A.C. | | Peru | | Foreign | | Bank Of Nova Scotia | | Peru | | US$ | | | 3.48 | % | | | 3.40 | % | | Quarterly | | | 323,528 | | | | 879,842 | | | | 1,203,370 | | | | 1,173,123 | | | | 1,173,123 | | | | 586,562 | | | | — | | | | — | | | | 2,932,808 | |
Foreign | | Edegel S.A.A | | Peru | | Foreign | | Bank Nova Scotia | | Peru | | US$ | | | 1.02 | % | | | 1.00 | % | | At maturity | | | 14,068 | | | | 25,075,510 | | | | 25,089,578 | | | | — | | | | — | | | | — | | | | — | | | | — | | | | — | |
Foreign | | Emgesa S.A. E.S.P. | | Colombia | | Foreign | | BBVA Colombia | | Colombia | | CP | | | 6.71 | % | | | 6.60 | % | | At maturity | | | 948,652 | | | | — | | | | 948,652 | | | | — | | | | — | | | | — | | | | — | | | | 50,741,612 | | | | 50,741,612 | |
Foreign | | Emgesa S.A. E.S.P. | | Colombia | | Foreign | | Banco de Bogota | | Colombia | | CP | | | 6.74 | % | | | 6.63 | % | | At maturity | | | 338,858 | | | | — | | | | 338,858 | | | | — | | | | — | | | | — | | | | — | | | | 18,041,462 | | | | 18,041,462 | |
Foreign | | Emgesa S.A. E.S.P. | | Colombia | | Foreign | | AV VILLAS | | Colombia | | CP | | | 5.62 | % | | | 5.51 | % | | At maturity | | | 74,355 | | | | 11,050,396 | | | | 11,124,751 | | | | — | | | | — | | | | — | | | | — | | | | — | | | | — | |
Foreign | | Emgesa S.A. E.S.P. | | Colombia | | Foreign | | AV VILLAS | | Colombia | | CP | | | 5.50 | % | | | 5.38 | % | | At maturity | | | 8,155,090 | | | | — | | | | 8,155,090 | | | | — | | | | — | | | | — | | | | — | | | | — | | | | — | |
Foreign | | Emgesa S.A. E.S.P. | | Colombia | | Foreign | | BBVA Colombia | | Colombia | | CP | | | 5.67 | % | | | 5.53 | % | | At maturity | | | 2,912,182 | | | | — | | | | 2,912,182 | | | | — | | | | — | | | | — | | | | — | | | | — | | | | — | |
Foreign | | Emgesa S.A. E.S.P. | | Colombia | | Foreign | | Citibank Colombia | | Colombia | | CP | | | 5.51 | % | | | 5.38 | % | | At maturity | | | 6,553,828 | | | | — | | | | 6,553,828 | | | | — | | | | — | | | | — | | | | — | | | | — | | | | — | |
Foreign | | Emgesa S.A. E.S.P. | | Colombia | | Foreign | | Citibank Colombia | | Colombia | | CP | | | 5.73 | % | | | 5.61 | % | | At maturity | | | 9,402,690 | | | | — | | | | 9,402,690 | | | | — | | | | — | | | | — | | | | — | | | | — | | | | — | |
Foreign | | Emgesa S.A. E.S.P. | | Colombia | | Foreign | | Citibank Colombia | | Colombia | | CP | | | 5.57 | % | | | 5.46 | % | | At maturity | | | 26,738 | | | | 5,186,920 | | | | 5,213,658 | | | | — | | | | — | | | | — | | | | — | | | | — | | | | — | |
Foreign | | Emgesa S.A. E.S.P. | | Colombia | | Foreign | | BBVA Colombia | | Colombia | | CP | | | 5.76 | % | | | 5.64 | % | | At maturity | | | 24,861,401 | | | | | | | | 24,861,401 | | | | — | | | | — | | | | — | | | | — | | | | — | | | | — | |
Foreign | | Emgesa S.A. E.S.P. | | Colombia | | Foreign | | Banco de Bogota | | Colombia | | CP | | | 5.90 | % | | | 5.81 | % | | At maturity | | | 9,447,875 | | | | | | | | 9,447,875 | | | | — | | | | — | | | | — | | | | — | | | | — | | | | — | |
Foreign | | Emgesa S.A. E.S.P. | | Colombia | | Foreign | | Banco de Bogota | | Colombia | | CP | | | 6.26 | % | | | 6.12 | % | | At maturity | | | 268,494 | | | | 52,996,794 | | | | 53,265,288 | | | | — | | | | — | | | | — | | | | — | | | | — | | | | — | |
Foreign | | Emgesa S.A. E.S.P. | | Colombia | | Foreign | | Banco de Bogota | | Colombia | | CP | | | 6.27 | % | | | 6.12 | % | | At maturity | | | 81,597 | | | | 11,050,396 | | | | 11,131,993 | | | | — | | | | — | | | | — | | | | — | | | | — | | | | — | |
Foreign | | Emgesa S.A. E.S.P. | | Colombia | | Foreign | | Banco Davivienda | | Colombia | | CP | | | 6.30 | % | | | 6.15 | % | | At maturity | | | 15,329 | | | | 2,931,738 | | | | 2,947,067 | | | | — | | | | — | | | | — | | | | — | | | | — | | | | — | |
Foreign | | Endesa Argentina S.A. | | Argentina | | Foreign | | Citibank | | Argentina | | Ar$ | | | 28.00 | % | | | 28.00 | % | | At maturity | | | 594,029 | | | | — | | | | 594,029 | | | | — | | | | — | | | | — | | | | — | | | | — | | | | — | |
Foreign | | Central Costanera S.A. | | Argentina | | Foreign | | Banco Galicia | | Argentina | | Ar$ | | | 51.47 | % | | | 42.24 | % | | At maturity | | | — | | | | 728,225 | | | | 728,225 | | | | 573,089 | | | | — | | | | — | | | | — | | | | — | | | | 573,089 | |
Foreign | | Central Costanera S.A. | | Argentina | | Foreign | | Banco Itau | | Argentina | | Ar$ | | | 55.08 | % | | | 44.68 | % | | At maturity | | | — | | | | 277,439 | | | | 277,439 | | | | 247,277 | | | | — | | | | — | | | | — | | | | — | | | | 247,277 | |
Foreign | | Central Costanera S.A. | | Argentina | | Foreign | | Banco Santander Río | | Argentina | | Ar$ | | | 44.17 | % | | | 37.14 | % | | At maturity | | | — | | | | 186,243 | | | | 186,243 | | | | 152,170 | | | | — | | | | — | | | | — | | | | — | | | | 152,170 | |
Foreign | | Central Costanera S.A. | | Argentina | | Foreign | | Banco Supervielle | | Argentina | | Ar$ | | | 49.97 | % | | | 41.21 | % | | At maturity | | | — | | | | 265,408 | | | | 265,408 | | | | 237,766 | | | | — | | | | — | | | | — | | | | — | | | | 237,766 | |
Foreign | | Central Costanera S.A. | | Argentina | | Foreign | | Citibank | | Argentina | | Ar$ | | | 45.11 | % | | | 37.81 | % | | At maturity | | | — | | | | 873,704 | | | | 873,704 | | | | 785,199 | | | | — | | | | — | | | | — | | | | — | | | | 785,199 | |
Foreign | | Central Costanera S.A. | | Argentina | | Foreign | | Credit Suisse
International | | Argentina | | US$ | | | 14.84 | % | | | 13.92 | % | | Quarterly | | | — | | | | 2,381,035 | | | | 2,381,035 | | | | — | | | | — | | | | — | | | | — | | | | — | | | | — | |
Foreign | | Central Costanera S.A. | | Argentina | | Foreign | | ICB Argentina | | Argentina | | Ar$ | | | 51.99 | % | | | 42.59 | % | | Quarterly | | | — | | | | 298,144 | | | | 298,144 | | | | 266,298 | | | | — | | | | — | | | | — | | | | — | | | | 266,298 | |
Foreign | | H. El Chocón S.A. | | Argentina | | Foreign | | Banco Macro | | Argentina | | Ar$ | | | 30.56 | % | | | 27.87 | % | | At maturity | | | 1,544,778 | | | | — | | | | 1,544,778 | | | | — | | | | — | | | | — | | | | — | | | | — | | | | — | |
Foreign | | H. El Chocón S.A. | | Argentina | | Foreign | | Deutsche Bank | | Argentina | | US$ | | | 13.40 | % | | | 12.78 | % | | Quarterly | | | 2,610,811 | | | | — | | | | 2,610,811 | | | | — | | | | — | | | | — | | | | — | | | | — | | | | — | |
Foreign | | H. El Chocón S.A. | | Argentina | | Foreign | | Standard Bank | | Argentina | | US$ | | | 13.40 | % | | | 12.78 | % | | Quarterly | | | 1,305,402 | | | | — | | | | 1,305,402 | | | | — | | | | — | | | | — | | | | — | | | | — | | | | — | |
Foreign | | H. El Chocón S.A. | | Argentina | | Foreign | | Banco Itau | | Argentina | | US$ | | | 13.40 | % | | | 12.78 | % | | Quarterly | | | 1,305,402 | | | | — | | | | 1,305,402 | | | | — | | | | — | | | | — | | | | — | | | | — | | | | — | |
Foreign | | H. El Chocón S.A. | | Argentina | | Foreign | | Banco Santander —
Sindicado IV | | Argentina | | Ar$ | | | 36.21 | % | | | 32.11 | % | | Quarterly | | | 275,292 | | | | 892,966 | | | | 1,168,258 | | | | — | | | | — | | | | — | | | | — | | | | — | | | | — | |
Foreign | | H. El Chocón S.A. | | Argentina | | Foreign | | Banco Itau — Sindicado
IV | | Argentina | | Ar$ | | | 36.21 | % | | | 32.11 | % | | Quarterly | | | 251,354 | | | | 815,317 | | | | 1,066,671 | | | | — | | | | — | | | | — | | | | — | | | | — | | | | — | |
Foreign | | H. El Chocón S.A. | | Argentina | | Foreign | | Banco Galicia —
Sindicado IV | | Argentina | | Ar$ | | | 36.21 | % | | | 32.11 | % | | Quarterly | | | 239,385 | | | | 776,492 | | | | 1,015,877 | | | | — | | | | — | | | | — | | | | — | | | | — | | | | — | |
Foreign | | H. El Chocón S.A. | | Argentina | | Foreign | | Banco Hipotecario —
Sindicado IV | | Argentina | | Ar$ | | | 36.21 | % | | | 32.11 | % | | Quarterly | | | 83,785 | | | | 271,772 | | | | 355,557 | | | | — | | | | — | | | | — | | | | — | | | | — | | | | �� | |
Foreign | | H. El Chocón S.A. | | Argentina | | Foreign | | Banco Ciudad —
Sindicado IV | | Argentina | | Ar$ | | | 36.21 | % | | | 32.11 | % | | Quarterly | | | 35,908 | | | | 116,474 | | | | 152,382 | | | | — | | | | — | | | | — | | | | — | | | | — | | | | — | |
Foreign | | H. El Chocón S.A. | | Argentina | | Foreign | | ICB Argentina | | Argentina | | Ar$ | | | 36.21 | % | | | 32.11 | % | | Quarterly | | | 311,200 | | | | 1,009,440 | | | | 1,320,640 | | | | — | | | | — | | | | — | | | | — | | | | — | | | | — | |
| | | | | | | | | | | | | | | | | | | | | | | | | | | | | | | | | | | | | | | | | | | | | | | | | | | | | | | | | | |
| | | | | | | | Total ThCh$ | | | | | | | | | | | | | | | | | 72,669,701 | | | | 119,959,545 | | | | 192,629,246 | | | | 5,961,976 | | | | 19,483,122 | | | | 586,562 | | | | — | | | | 68,783,074 | | | | 94,814,734 | |
| | | | | | | | | | | | | | | | | | | | | | | | | | | | | | | | | | | | | | | | | | | | | | | | | | | | | | | | | | |
F-64
| | | | | | | | | | | | | | | | | | | | | | | | | | | | | | | | | | | | | | | | | | | | | | | | | | | | | | | | | | |
Taxpayer ID
No. (RUT) | | Company | | Country | | ID No.
Financial
Institution | | Financial Institution | | Country | | Currency | | Effective
Interest
Rate | | | Nominal
Interest
Rate | | | Amortization | | Balance as of 12-31-2014 | |
| | | | | | | | | | | Current | | | Non-current | |
| | | | | | | | | | | One to
three
months | | | Three to
twelve
months | | | Total
Current | | | One to
two years | | | Two to
three
years | | | Three to
four years | | | Four to
five
years | | | More
than five
years | | | Total Non-
current | |
| | | | | | | | | | | ThCh$ | | | ThCh$ | | | ThCh$ | | | ThCh$ | | | ThCh$ | | | ThCh$ | | | ThCh$ | | | ThCh$ | | | ThCh$ | |
Foreign | | Chinango S.A.C. | | Peru | | Foreign | | Banco Scotiabank | | Peru | | US$ | | | 3.98 | % | | | 3.96 | % | | Quarterly | | | 260,672 | | | | 564,193 | | | | 824,865 | | | | 752,258 | | | | 752,258 | | | | 15,233,217 | | | | — | | | | | | | | 16,737,733 | |
Foreign | | Chinango S.A.C. | | Peru | | Foreign | | Bank Of Nova Scotia | | Peru | | US$ | | | 3.18 | % | | | 3.01 | % | | Quarterly | | | 395,746 | | | | 1,137,486 | | | | 1,533,232 | | | | 1,516,648 | | | | 1,516,648 | | | | — | | | | — | | | | — | | | | 3,033,296 | |
Foreign | | Chinango S.A.C. | | Peru | | Foreign | | Bank Of Nova Scotia | | Peru | | US$ | | | 3.48 | % | | | 3.40 | % | | Quarterly | | | 287,425 | | | | 766,306 | | | | 1,053,731 | | | | 1,021,742 | | | | 1,021,742 | | | | 1,021,742 | | | | 255,432 | | | | — | | | | 3,320,658 | |
Foreign | | Edegel S.A.A | | Peru | | Foreign | | Banco Continental | | Peru | | US$ | | | 3.44 | % | | | 3.36 | % | | Quarterly | | | 1,516,649 | | | | 5,914,928 | | | | 7,431,577 | | | | 13,498,170 | | | | 14,559,823 | | | | — | | | | — | | | | — | | | | 28,057,993 | |
Foreign | | Edegel S.A.A | | Peru | | Foreign | | Bank Nova Scotia | | Peru | | US$ | | | 1.02 | % | | | 1.00 | % | | At maturity | | | 11,755 | | | | — | | | | 11,755 | | | | 21,839,736 | | | | — | | | | — | | | | — | | | | — | | | | 21,839,736 | |
Foreign | | Emgesa S.A. E.S.P. | | Colombia | | Foreign | | Banco Corpbanca | | Colombia | | CP | | | 8.39 | % | | | 8.22 | % | | At maturity | | | — | | | | 55,892 | | | | 55,892 | | | | — | | | | — | | | | — | | | | — | | | | 20,393,652 | | | | 20,393,652 | |
Foreign | | Emgesa S.A. E.S.P. | | Colombia | | Foreign | | BBVA Colombia | | Colombia | | CP | | | 6.71 | % | | | 6.60 | % | | At maturity | | | — | | | | 153,503 | | | | 153,503 | | | | — | | | | — | | | | — | | | | — | | | | 57,357,148 | | | | 57,357,148 | |
Foreign | | Endesa Argentina S.A. | | Argentina | | Foreign | | Citibank | | Argentina | | Ar$ | | | 28.00 | % | | | 28.00 | % | | At maturity | | | 710,351 | | | | — | | | | 710,351 | | | | — | | | | — | | | | — | | | | — | | | | — | | | | — | |
Foreign | | Central Costanera S.A. | | Argentina | | Foreign | | Banco Galicia | | Argentina | | Ar$ | | | 51.47 | % | | | 42.24 | % | | At maturity | | | — | | | | 800,033 | | | | 800,033 | | | | 853,856 | | | | — | | | | — | | | | — | | | | — | | | | 853,856 | |
Foreign | | Central Costanera S.A. | | Argentina | | Foreign | | Banco Itau | | Argentina | | Ar$ | | | 55.08 | % | | | 44.68 | % | | At maturity | | | — | | | | 302,809 | | | | 302,809 | | | | 350,571 | | | | — | | | | — | | | | — | | | | — | | | | 350,571 | |
Foreign | | Central Costanera S.A. | | Argentina | | Foreign | | Banco Santander Río | | Argentina | | Ar$ | | | 44.17 | % | | | 37.14 | % | | At maturity | | | — | | | | 185,138 | | | | 185,138 | | | | 215,736 | | | | — | | | | — | | | | — | | | | — | | | | 215,736 | |
Foreign | | Central Costanera S.A. | | Argentina | | Foreign | | Banco Supervielle | | Argentina | | Ar$ | | | 49.97 | % | | | 41.21 | % | | At maturity | | | — | | | | 289,401 | | | | 289,401 | | | | 337,088 | | | | — | | | | — | | | | — | | | | — | | | | 337,088 | |
Foreign | | Central Costanera S.A. | | Argentina | | Foreign | | Citibank | | Argentina | | Ar$ | | | 45.11 | % | | | 37.81 | % | | At maturity | | | — | | | | 955,718 | | | | 955,718 | | | | 1,113,199 | | | | — | | | | — | | | | — | | | | — | | | | 1,113,199 | |
Foreign | | Central Costanera S.A. | | Argentina | | Foreign | | Credit Suisse International | | Argentina | | US$ | | | 14.84 | % | | | 13.92 | % | | Quarterly | | | — | | | | 2,126,669 | | | | 2,126,669 | | | | 1,022,595 | | | | — | | | | — | | | | — | | | | — | | | | 1,022,595 | |
Foreign | | Central Costanera S.A. | | Argentina | | Foreign | | ICB Argentina | | Argentina | | Ar$ | | | 51.99 | % | | | 42.59 | % | | Quarterly | | | — | | | | 324,772 | | | | 324,772 | | | | 377,538 | | | | — | | | | — | | | | — | | | | — | | | | 377,538 | |
Foreign | | H. El Chocón S.A. | | Argentina | | Foreign | | Banco Macro | | Argentina | | Ar$ | | | 30.56 | % | | | 27.87 | % | | At maturity | | | 1,461,573 | | | | — | | | | 1,461,573 | | | | — | | | | — | | | | — | | | | — | | | | — | | | | — | |
Foreign | | H. El Chocón S.A. | | Argentina | | Foreign | | Deutsche Bank | | Argentina | | US$ | | | 13.40 | % | | | 12.78 | % | | Quarterly | | | 5,725,691 | | | | — | | | | 5,725,691 | | | | — | | | | — | | | | — | | | | — | | | | — | | | | — | |
Foreign | | H. El Chocón S.A. | | Argentina | | Foreign | | Standard Bank | | Argentina | | US$ | | | 13.40 | % | | | 12.78 | % | | Quarterly | | | 2,862,848 | | | | — | | | | 2,862,848 | | | | — | | | | — | | | | — | | | | — | | | | — | | | | — | |
Foreign | | H. El Chocón S.A. | | Argentina | | Foreign | | Banco Itau | | Argentina | | US$ | | | 13.40 | % | | | 12.78 | % | | Quarterly | | | 2,862,848 | | | | — | | | | 2,862,848 | | | | — | | | | — | | | | — | | | | — | | | | — | | | | — | |
Foreign | | H. El Chocón S.A. | | Argentina | | Foreign | | Banco Santander — Sindicado
IV | | Argentina | | Ar$ | | | 36.21 | % | | | 32.11 | % | | Quarterly | | | 158,689 | | | | 813,581 | | | | 972,270 | | | | 862,890 | | | | — | | | | — | | | | — | | | | — | | | | 862,890 | |
Foreign | | H. El Chocón S.A. | | Argentina | | Foreign | | Banco Itau — Sindicado IV | | Argentina | | Ar$ | | | 36.21 | % | | | 32.11 | % | | Quarterly | | | 144,890 | | | | 742,835 | | | | 887,725 | | | | 787,856 | | | | — | | | | — | | | | — | | | | — | | | | 787,856 | |
Foreign | | H. El Chocón S.A. | | Argentina | | Foreign | | Banco Galicia — Sindicado IV | | Argentina | | Ar$ | | | 36.21 | % | | | 32.11 | % | | Quarterly | | | 137,990 | | | | 707,462 | | | | 845,452 | | | | 750,339 | | | | — | | | | — | | | | — | | | | — | | | | 750,339 | |
Foreign | | H. El Chocón S.A. | | Argentina | | Foreign | | Banco Hipotecario —
Sindicado IV | | Argentina | | Ar$ | | | 36.21 | % | | | 32.11 | % | | Quarterly | | | 48,297 | | | | 247,612 | | | | 295,909 | | | | 262,618 | | | | — | | | | — | | | | — | | | | — | | | | 262,618 | |
Foreign | | H. El Chocón S.A. | | Argentina | | Foreign | | Banco Ciudad — Sindicado
IV | | Argentina | | Ar$ | | | 36.21 | % | | | 32.11 | % | | Quarterly | | | 20,699 | | | | 106,119 | | | | 126,818 | | | | 112,552 | | | | — | | | | — | | | | — | | | | — | | | | 112,552 | |
Foreign | | H. El Chocón S.A. | | Argentina | | Foreign | | ICB Argentina | | Argentina | | Ar$ | | | 36.21 | % | | | 32.11 | % | | Quarterly | | | 179,387 | | | | 919,701 | | | | 1,099,088 | | | | 975,440 | | | | — | | | | — | | | | — | | | | — | | | | 975,440 | |
| | | | | | | | | | | | | | | | | | | | | | | | | | | | | | | | | | | | | | | | | | | | | | | | | | | | | | | | | | |
| | | | | | | | Total ThCh$ | | | | | | | | | | | | | | | | | 16,785,510 | | | | 17,114,158 | | | | 33,899,668 | | | | 46,650,832 | | | | 17,850,471 | | | | 16,254,959 | | | | 255,432 | | | | 77,750,800 | | | | 158,762,494 | |
| | | | | | | | | | | | | | | | | | | | | | | | | | | | | | | | | | | | | | | | | | | | | | | | | | | | | | | | | | |
Appendix No.4, letter a), presents details of estimated future cash flows (undiscounted) that the Combined Group will have to disburse to settle the bank loans detailed above.
F-65
| 16.2 | Unsecured liabilities |
The detail of Unsecured Liabilities by currency and maturity as of September 30, 2015 and December 31, 2014 is as follows:
| | | | | | | | | | | | | | | | | | | | | | | | | | | | | | | | | | | | | | | | | | | | | | | | |
Country | | Currency | | Effective
Interest
Rate | | | Nominal
Interest
Rate | | | Secured
(Yes/No) | | Balance as of 9-30-2015 | |
| | | | | | Current | | | Non-current | |
| | | | | | One to
three
months | | | Three to
twelve
months | | | Total
Current | | | One to
two years | | | Two to
three years | | | Three to
four years | | | Four to
five years | | | More than
five years | | | Total Non-
current | |
| | | | | | ThCh$ | | | ThCh$ | | | ThCh$ | | | ThCh$ | | | ThCh$ | | | ThCh$ | | | ThCh$ | | | ThCh$ | | | ThCh$ | |
Peru | | US$ | | | 6.61 | % | | | 6.50 | % | | No | | | — | | | | 14,280,866 | | | | 14,280,866 | | | | — | | | | 6,965,419 | | | | 5,687,962 | | | | 6,965,419 | | | | 6,965,419 | | | | 26,584,219 | |
Peru | | Sol | | | 6.40 | % | | | 6.30 | % | | No | | | 93,791 | | | | 82,014 | | | | 175,805 | | | | — | | | | — | | | | 5,402,901 | | | | — | | | | 5,402,901 | | | | 10,805,802 | |
Colombia | | CP | | | 9.34 | % | | | 9.09 | % | | No | | | 5,044,051 | | | | 13,906,201 | | | | 18,950,252 | | | | 38,332,931 | | | | 49,201,445 | | | | 36,091,582 | | | | 99,834,906 | | | | 471,149,526 | | | | 694,610,390 | |
| | | | | | | | | | | | | | | | | | | | | | | | | | | | | | | | | | | | | | | | | | | | | | | | |
| | | | | | | | | | | | Total | | | 5,137,842 | | | | 28,269,081 | | | | 33,406,923 | | | | 38,332,931 | | | | 56,166,864 | | | | 47,182,445 | | | | 106,800,325 | | | | 483,517,846 | | | | 732,000,411 | |
| | | | | | | | | | | | | | | | | | | | | | | | | | | | | | | | | | | | | | | | | | | | | | | | |
| | | | | | | | | | | | | | | | | | | | | | | | | | | | | | | | | | | | | | | | | | | | | | | | |
Country | | Currency | | Effective
Interest
Rate | | | Nominal
Interest
Rate | | | Secured
(Yes/No) | | Balance as of 12-31-2014 | |
| | | | | | Current | | | Non-current | |
| | | | | | One to
three
months | | | Three to
twelve
months | | | Total
Current | | | One to
two years | | | Two to
three years | | | Three to
four years | | | Four to
five years | | | More than
five years | | | Total Non-
current | |
| | | | | | ThCh$ | | | ThCh$ | | | ThCh$ | | | ThCh$ | | | ThCh$ | | | ThCh$ | | | ThCh$ | | | ThCh$ | | | ThCh$ | |
Peru | | US$ | | | 6.70 | % | | | 6.59 | % | | No | | | 4,852,113 | | | | — | | | | 4,852,113 | | | | 12,133,186 | | | | — | | | | 6,066,593 | | | | 4,953,980 | | | | 12,133,186 | | | | 35,286,945 | |
Peru | | Sol | | | 6.40 | % | | | 6.30 | % | | No | | | 156,702 | | | | 8,008 | | | | 164,710 | | | | — | | | | — | | | | — | | | | 5,074,099 | | | | 5,074,099 | | | | 10,148,198 | |
Colombia | | CP | | | 8.67 | % | | | 8.45 | % | | No | | | 90,659,393 | | | | — | | | | 90,659,393 | | | | — | | | | 43,326,710 | | | | 55,611,108 | | | | 92,241,270 | | | | 593,854,561 | | | | 785,033,649 | |
| | | | | | | | | | | | | | | | | | | | | | | | | | | | | | | | | | | | | | | | | | | | | | | | |
| | | | | | | | | | | | Total | | | 95,668,208 | | | | 8,008 | | | | 95,676,216 | | | | 12,133,186 | | | | 43,326,710 | | | | 61,677,701 | | | | 102,269,349 | | | | 611,061,846 | | | | 830,468,792 | |
| | | | | | | | | | | | | | | | | | | | | | | | | | | | | | | | | | | | | | | | | | | | | | | | |
The detail of secured liabilities by currency and maturity as of September 30, 2015 and December 31, 2014 is as follows:
| • | | Summary of secured liabilities by currency and maturity |
There are no secured liabilities as of September 30, 2015 and December 31, 2014.
| • | | Fair value measurement and hierarchy |
The fair value of current and non-current bond obligations, both secured and unsecured, as of September 30, 2015 and December 31, 2014 totaled ThCh$ 785,069,775 and ThCh$ 999,933,639, respectively. During both periods, the obligations have been classified as Level 2 fair values based on the entry data from the valuation techniques used (see Note 3.g).
F-66
| • | | Secured and Unsecured Liabilities by Company |
| | | | | | | | | | | | | | | | | | | | | | | | | | | | | | | | | | | | | | | | | | | | | | | | | | | | | | | | | | |
Taxpayer ID
No. (RUT) | | Company | | Country | | ID No.
Financial
Institution | | Financial Institution | | Country | | Currency | | Effective
Interest
Rate | | | Nominal
Interest
Rate | | | Secured
(Yes/No) | | Balance as of 9-30-2015 | |
| | | | | | | | | | | Current | | | Non-current | |
| | | | | | | | | | | One to
three
months | | | Three to
twelve
months | | | Total
Current | | | One to
two
years | | | Two to
three
years | | | Three
to four
years | | | Four
to five
years | | | More than
five years | | | Total
Non-
current | |
| | | | | | | | | | | ThCh$ | | | ThCh$ | | | ThCh$ | | | ThCh$ | | | ThCh$ | | | ThCh$ | | | ThCh$ | | | ThCh$ | | | ThCh$ | |
Foreign | | Edegel S.A.A | | Peru | | Foreign | | Banco Continental | | Peru | | Sol | | | 6.41 | % | | | 6.31 | % | | No | | | 93,791 | | | | — | | | | 93,791 | | | | — | | | | — | | | | — | | | | — | | | | 5,402,901 | | | | 5,402,901 | |
Foreign | | Edegel S.A.A | | Peru | | Foreign | | Banco Continental | | Peru | | Sol | | | 6.38 | % | | | 6.28 | % | | No | | | — | | | | 82,014 | | | | 82,014 | | | | — | | | | — | | | | 5,402,901 | | | | — | | | | — | | | | 5,402,901 | |
Foreign | | Edegel S.A.A | | Peru | | Foreign | | Banco Continental | | Peru | | US$ | | | 6.44 | % | | | 6.34 | % | | No | | | — | | | | 79,782 | | | | 79,782 | | | | — | | | | — | | | | — | | | | — | | | | 6,965,419 | | | | 6,965,419 | |
Foreign | | Edegel S.A.A | | Peru | | Foreign | | Banco Continental | | Peru | | US$ | | | 7.93 | % | | | 7.78 | % | | No | | | — | | | | 86,060 | | | | 86,060 | | | | — | | | | — | | | | 5,687,962 | | | | — | | | | — | | | | 5,687,962 | |
Foreign | | Edegel S.A.A | | Peru | | Foreign | | Banco Continental | | Peru | | US$ | | | 7.25 | % | | | 7.13 | % | | No | | | — | | | | — | | | | — | | | | — | | | | — | | | | — | | | | — | | | | — | | | | — | |
Foreign | | Edegel S.A.A | | Peru | | Foreign | | Banco Scotiabank | | Peru | | US$ | | | 6.73 | % | | | 6.63 | % | | No | | | — | | | | 7,061,557 | | | | 7,061,557 | | | | — | | | | — | | | | — | | | | — | | | | — | | | | — | |
Foreign | | Edegel S.A.A | | Peru | | Foreign | | Banco Scotiabank | | Peru | | US$ | | | 6.09 | % | | | 6.00 | % | | No | | | — | | | | 6,975,868 | | | | 6,975,868 | | | | — | | | | — | | | | — | | | | — | | | | — | | | | — | |
Foreign | | Edegel S.A.A | | Peru | | Foreign | | Banco Scotiabank | | Peru | | US$ | | | 5.86 | % | | | 5.78 | % | | No | | | — | | | | — | | | | — | | | | — | | | | — | | | | — | | | | 6,965,419 | | | | — | | | | 6,965,419 | |
Foreign | | Edegel S.A.A | | Peru | | Foreign | | Banco Scotiabank | | Peru | | US$ | | | 6.57 | % | | | 6.47 | % | | No | | | — | | | | 77,599 | | | | 77,599 | | | | — | | | | 6,965,419 | | | | — | | | | — | | | | — | | | | 6,965,419 | |
Foreign | | Emgesa S.A. E.S.P. | | Colombia | | Foreign | | Bonds Series A-10 | | Colombia | | CP | | | 8.87 | % | | | 8.59 | % | | No | | | — | | | | — | | | | — | | | | — | | | | — | | | | — | | | | — | | | | — | | | | — | |
Foreign | | Emgesa S.A. E.S.P. | | Colombia | | Foreign | | Bonds Series A102 | | Colombia | | CP | | | 8.87 | % | | | 8.59 | % | | No | | | — | | | | — | | | | — | | | | — | | | | — | | | | — | | | | — | | | | — | | | | — | |
Foreign | | Emgesa S.A. E.S.P. | | Colombia | | Foreign | | Bonds Series B-103 | | Colombia | | CP | | | 9.79 | % | | | 9.79 | % | | No | | | — | | | | 2,373,712 | | | | 2,373,712 | | | | 38,332,931 | | | | — | | | | — | | | | — | | | | — | | | | 38,332,931 | |
Foreign | | Emgesa S.A. E.S.P. | | Colombia | | Foreign | | Bonds Series B10 | | Colombia | | CP | | | 10.44 | % | | | 10.06 | % | | No | | | 523,722 | | | | — | | | | 523,722 | | | | — | | | | — | | | | 36,091,582 | | | | — | | | | — | | | | 36,091,582 | |
Foreign | | Emgesa S.A. E.S.P. | | Colombia | | Foreign | | Bonds Series B15 | | Colombia | | CP | | | 10.77 | % | | | 10.36 | % | | No | | | 186,850 | | | | — | | | | 186,850 | | | | — | | | | — | | | | — | | | | — | | | | 12,514,575 | | | | 12,514,575 | |
Foreign | | Emgesa S.A. E.S.P. | | Colombia | | Foreign | | Bonds Series B09-09 | | Colombia | | CP | | | 10.57 | % | | | 10.17 | % | | No | | | 1,288,185 | | | | — | | | | 1,288,185 | | | | — | | | | 49,201,445 | | | | — | | | | — | | | | — | | | | 49,201,445 | |
Foreign | | Emgesa S.A. E.S.P. | | Colombia | | Foreign | | Bonds Series B12 | | Colombia | | CP | | | 10.78 | % | | | 10.37 | % | | No | | | 538,604 | | | | — | | | | 538,604 | | | | — | | | | — | | | | — | | | | — | | | | 20,199,200 | | | | 20,199,200 | |
Foreign | | Emgesa S.A. E.S.P. | | Colombia | | Foreign | | Foreign Bonds | | Colombia | | CP | | | 10.17 | % | | | 10.17 | % | | No | | | — | | | | 1,408,768 | | | | 1,408,768 | | | | — | | | | — | | | | — | | | | — | | | | 19,507,969 | | | | 19,507,969 | |
Foreign | | Emgesa S.A. E.S.P. | | Colombia | | Foreign | | Quimbo Bonds | | Colombia | | CP | | | 10.17 | % | | | 10.17 | % | | No | | | — | | | | 10,123,721 | | | | 10,123,721 | | | | — | | | | — | | | | — | | | | — | | | | 145,856,200 | | | | 145,856,200 | |
Foreign | | Emgesa S.A. E.S.P. | | Colombia | | Foreign | | Quimbo Bonds B10 | | Colombia | | CP | | | 8.09 | % | | | 7.85 | % | | No | | | 272,680 | | | | — | | | | 272,680 | | | | — | | | | — | | | | — | | | | — | | | | 67,598,654 | | | | 67,598,654 | |
Foreign | | Emgesa S.A. E.S.P. | | Colombia | | Foreign | | Quimbo Bonds B15 | | Colombia | | CP | | | 8.21 | % | | | 7.97 | % | | No | | | 184,410 | | | | — | | | | 184,410 | | | | — | | | | — | | | | — | | | | — | | | | 45,061,185 | | | | 45,061,185 | |
Foreign | | Emgesa S.A. E.S.P. | | Colombia | | Foreign | | Quimbo Bonds B12-13 | | Colombia | | CP | | | 9.63 | % | | | 9.30 | % | | No | | | 431,715 | | | | — | | | | 431,715 | | | | — | | | | — | | | | — | | | | — | | | | 81,803,138 | | | | 81,803,138 | |
Foreign | | Emgesa S.A. E.S.P. | | Colombia | | Foreign | | Quimbo Bonds B6-13 | | Colombia | | CP | | | 8.85 | % | | | 8.57 | % | | No | | | 167,569 | | | | — | | | | 167,569 | | | | — | | | | — | | | | — | | | | 34,376,145 | | | | — | | | | 34,376,145 | |
Foreign | | Emgesa S.A. E.S.P. | | Colombia | | Foreign | | Bonds Series B6-13 | | Colombia | | CP | | | 8.85 | % | | | 8.57 | % | | No | | | 54,315 | | | | — | | | | 54,315 | | | | — | | | | — | | | | — | | | | 11,142,432 | | | | — | | | | 11,142,432 | |
Foreign | | Emgesa S.A. E.S.P. | | Colombia | | Foreign | | Quimbo Bonds B16-14 | | Colombia | | CP | | | 8.74 | % | | | 8.47 | % | | No | | | 393,494 | | | | — | | | | 393,494 | | | | — | | | | — | | | | — | | | | — | | | | 36,610,314 | | | | 36,610,314 | |
Foreign | | Emgesa S.A. E.S.P. | | Colombia | | Foreign | | Quimbo Bonds B10-14 | | Colombia | | CP | | | 8.41 | % | | | 8.16 | % | | No | | | 449,254 | | | | — | | | | 449,254 | | | | — | | | | — | | | | — | | | | — | | | | 41,998,291 | | | | 41,998,291 | |
Foreign | | Emgesa S.A. E.S.P. | | Colombia | | Foreign | | Quimbo Bonds B6-14 | | Colombia | | CP | | | 7.98 | % | | | 7.75 | % | | No | | | 300,804 | | | | — | | | | 300,804 | | | | — | | | | — | | | | — | | | | 29,531,704 | | | | — | | | | 29,531,704 | |
Foreign | | Emgesa S.A. E.S.P. | | Colombia | | Foreign | | Bonds Series B6-14 | | Colombia | | CP | | | 7.98 | % | | | 7.75 | % | | No | | | 252,449 | | | | — | | | | 252,449 | | | | — | | | | — | | | | — | | | | 24,784,625 | | | | — | | | | 24,784,625 | |
| | | | | | | | | | | | | | | | | | | | | | | | | | | | | | | | | | | | | | | | | | | | | | | | | | | | | | | | | | |
| | | | | | | | Total ThCh$ | | | | | | | | | | | | | | 5,137,842 | | | | 28,269,081 | | | | 33,406,923 | | | | 38,332,931 | | | | 56,166,864 | | | | 47,182,445 | | | | 106,800,325 | | | | 483,517,846 | | | | 732,000,411 | |
| | | | | | | | | | | | | | | | | | | | | | | | | | | | | | | | | | | | | | | | | | | | | | | | | | | | | | | | | | |
| | | | | | | | | | |
Taxpayer ID
No. (RUT) | | Company | | Country | | ID No.
Financial
Institution | | Financial Institution | | Country | | Currency | | Effective
Interest
Rate | | | Nominal
Interest
Rate | | | Secured
(Yes/No) | | 12-31-2014 | |
| | | | | | | | | | | Current | | | Non-current | |
| | | | | | | | | | | Less
than
90 days | | | More
than
90 days | | | Total
Current | | | One to
two
years | | | Two to
three
years | | | Three to
four
years | | | Four to
five years | | | More than
five years | | | Total
Non-
current | |
Foreign | | Edegel S.A.A | | Peru | | Foreign | | Banco Continental | | Peru | | Sol | | | 6.41 | % | | | 6.31 | % | | No | | | — | | | | 8,008 | | | | 8,008 | | | | — | | | | — | | | | — | | | | — | | | | 5,074,099 | | | | 5,074,099 | |
Foreign | | Edegel S.A.A | | Peru | | Foreign | | Banco Continental | | Peru | | Sol | | | 6.38 | % | | | 6.28 | % | | No | | | 156,702 | | | | — | | | | 156,702 | | | | — | | | | — | | | | — | | | | 5,074,099 | | | | — | | | | 5,074,099 | |
Foreign | | Edegel S.A.A | | Peru | | Foreign | | Banco Continental | | Peru | | US$ | | | 6.44 | % | | | 6.34 | % | | No | | | 165,699 | | | | — | | | | 165,699 | | | | — | | | | — | | | | — | | | | — | | | | 6,066,593 | | | | 6,066,593 | |
Foreign | | Edegel S.A.A | | Peru | | Foreign | | Banco Continental | | Peru | | US$ | | | 7.93 | % | | | 7.78 | % | | No | | | 171,325 | | | | — | | | | 171,325 | | | | — | | | | — | | | | — | | | | 4,953,980 | | | | — | | | | 4,953,980 | |
Foreign | | Edegel S.A.A | | Peru | | Foreign | | Banco Continental | | Peru | | US$ | | | 7.25 | % | | | 7.13 | % | | No | | | 3,977,405 | | | | — | | | | 3,977,405 | | | | — | | | | — | | | | — | | | | — | | | | — | | | | — | |
Foreign | | Edegel S.A.A | | Peru | | Foreign | | Banco Scotiabank | | Peru | | US$ | | | 6.73 | % | | | 6.63 | % | | No | | | 184,210 | | | | — | | | | 184,210 | | | | 6,066,593 | | | | — | | | | — | | | | — | | | | — | | | | 6,066,593 | |
Foreign | | Edegel S.A.A | | Peru | | Foreign | | Banco Scotiabank | | Peru | | US$ | | | 6.09 | % | | | 6.00 | % | | No | | | 100,099 | | | | — | | | | 100,099 | | | | 6,066,593 | | | | — | | | | — | | | | — | | | | — | | | | 6,066,593 | |
Foreign | | Edegel S.A.A | | Peru | | Foreign | | Banco Scotiabank | | Peru | | US$ | | | 6.57 | % | | | 6.47 | % | | No | | | 165,694 | | | | — | | | | 165,694 | | | | — | | | | — | | | | 6,066,593 | | | | — | | | | — | | | | 6,066,593 | |
Foreign | | Edegel S.A.A | | Peru | | Foreign | | Banco Scotiabank | | Peru | | US$ | | | 5.86 | % | | | 5.78 | % | | No | | | 87,681 | | | | — | | | | 87,681 | | | | — | | | | — | | | | — | | | | — | | | | 6,066,593 | | | | 6,066,593 | |
Foreign | | Emgesa S.A. E.S.P. | | Colombia | | Foreign | | Bonds Series A-10 | | Colombia | | CP | | | 8.21 | % | | | 7.97 | % | | No | | | 54,029,298 | | | | — | | | | 54,029,298 | | | | — | | | | — | | | | — | | | | — | | | | — | | | | — | |
Foreign | | Emgesa S.A. E.S.P. | | Colombia | | Foreign | | Bonds Series A102 | | Colombia | | CP | | | 8.21 | % | | | 7.97 | % | | No | | | 10,288,151 | | | | — | | | | 10,288,151 | | | | — | | | | — | | | | — | | | | — | | | | — | | | | — | |
Foreign | | Emgesa S.A. E.S.P. | | Colombia | | Foreign | | Bonds Series B-103 | | Colombia | | CP | | | 8.33 | % | | | 8.33 | % | | No | | | 3,361,512 | | | | — | | | | 3,361,512 | | | | — | | | | 43,326,710 | | | | — | | | | — | | | | — | | | | 43,326,710 | |
Foreign | | Emgesa S.A. E.S.P. | | Colombia | | Foreign | | Bonds Series B10 | | Colombia | | CP | | | 8.97 | % | | | 8.69 | % | | No | | | 530,887 | | | | — | | | | 530,887 | | | | — | | | | — | | | | — | | | | 40,793,373 | | | | — | | | | 40,793,373 | |
Foreign | | Emgesa S.A. E.S.P. | | Colombia | | Foreign | | Bonds Series B15 | | Colombia | | CP | | | 9.29 | % | | | 8.99 | % | | No | | | 190,004 | | | | — | | | | 190,004 | | | | — | | | | — | | | | — | | | | — | | | | 14,144,897 | | | | 14,144,897 | |
Foreign | | Emgesa S.A. E.S.P. | | Colombia | | Foreign | | Bonds Series B09-09 | | Colombia | | CP | | | 9.00 | % | | | 8.71 | % | | No | | | 1,307,418 | | | | — | | | | 1,307,418 | | | | — | | | | — | | | | 55,611,108 | | | | — | | | | — | | | | 55,611,108 | |
Foreign | | Emgesa S.A. E.S.P. | | Colombia | | Foreign | | Bonds Series B12 | | Colombia | | CP | | | 9.30 | % | | | 9.00 | % | | No | | | 547,749 | | | | — | | | | 547,749 | | | | — | | | | — | | | | — | | | | — | | | | 22,830,628 | | | | 22,830,628 | |
Foreign | | Emgesa S.A. E.S.P. | | Colombia | | Foreign | | Foreign Bonds | | Colombia | | CP | | | 10.17 | % | | | 10.17 | % | | No | | | 2,180,810 | | | | — | | | | 2,180,810 | | | | — | | | | — | | | | — | | | | — | | | | 22,942,859 | | | | 22,942,859 | |
Foreign | | Emgesa S.A. E.S.P. | | Colombia | | Foreign | | Quimbo Bonds | | Colombia | | CP | | | 10.17 | % | | | 10.17 | % | | No | | | 15,671,786 | | | | — | | | | 15,671,786 | | | | — | | | | — | | | | — | | | | — | | | | 163,885,784 | | | | 163,885,784 | |
Foreign | | Emgesa S.A. E.S.P. | | Colombia | | Foreign | | Quimbo Bonds B10 | | Colombia | | CP | | | 6.65 | % | | | 6.49 | % | | No | | | 282,892 | | | | — | | | | 282,892 | | | | — | | | | — | | | | — | | | | — | | | | 76,406,981 | | | | 76,406,981 | |
Foreign | | Emgesa S.A. E.S.P. | | Colombia | | Foreign | | Quimbo Bonds B15 | | Colombia | | CP | | | 6.77 | % | | | 6.60 | % | | No | | | 191,716 | | | | — | | | | 191,716 | | | | — | | | | — | | | | — | | | | — | | | | 50,934,262 | | | | 50,934,262 | |
Foreign | | Emgesa S.A. E.S.P. | | Colombia | | Foreign | | Quimbo Bonds B12-13 | | Colombia | | CP | | | 8.17 | % | | | 7.93 | % | | No | | | 455,387 | | | | — | | | | 455,387 | | | | — | | | | — | | | | — | | | | — | | | | 92,464,960 | | | | 92,464,960 | |
Foreign | | Emgesa S.A. E.S.P. | | Colombia | | Foreign | | Quimbo Bonds B6-13 | | Colombia | | CP | | | 7.40 | % | | | 7.20 | % | | No | | | 174,976 | | | | — | | | | 174,976 | | | | — | | | | — | | | | — | | | | 38,854,059 | | | | — | | | | 38,854,059 | |
Foreign | | Emgesa S.A. E.S.P. | | Colombia | | Foreign | | Bonds Series B6-13 | | Colombia | | CP | | | 7.40 | % | | | 7.20 | % | | No | | | 56,716 | | | | — | | | | 56,716 | | | | — | | | | — | | | | — | | | | 12,593,838 | | | | — | | | | 12,593,838 | |
Foreign | | Emgesa S.A. E.S.P. | | Colombia | | Foreign | | Quimbo Bonds B16-14 | | Colombia | | CP | | | 7.30 | % | | | 7.10 | % | | No | | | 403,310 | | | | — | | | | 403,310 | | | | — | | | | — | | | | — | | | | — | | | | 41,380,613 | | | | 41,380,613 | |
Foreign | | Emgesa S.A. E.S.P. | | Colombia | | Foreign | | Quimbo Bonds B10-14 | | Colombia | | CP | | | 6.97 | % | | | 6.79 | % | | No | | | 443,930 | | | | — | | | | 443,930 | | | | — | | | | — | | | | — | | | | — | | | | 47,472,761 | | | | 47,472,761 | |
Foreign | | Emgesa S.A. E.S.P. | | Colombia | | Foreign | | Quimbo Bonds B6-14 | | Colombia | | CP | | | 6.54 | % | | | 6.39 | % | | No | | | 295,149 | | | | — | | | | 295,149 | | | | — | | | | — | | | | — | | | | — | | | | 33,378,162 | | | | 33,378,162 | |
Foreign | | Emgesa S.A. E.S.P. | | Colombia | | Foreign | | Bonds Series B6-14 | | Colombia | | CP | | | 6.54 | % | | | 6.39 | % | | No | | | 247,702 | | | | — | | | | 247,702 | | | | — | | | | — | | | | — | | | | — | | | | 28,012,654 | | | | 28,012,654 | |
| | | | | | | | | | | | | | | | | | | | | | | | | | | | | | | | | | | | | | | | | | | | | | | | | | | | | | | | | | |
| | | | | | | | Total ThCh$ | | | | | | | | | | | | | | 95,668,208 | | | | 8,008 | | | | 95,676,216 | | | | 12,133,186 | | | | 43,326,710 | | | | 61,677,701 | | | | 102,269,349 | | | | 611,061,846 | | | | 830,468,792 | |
| | | | | | | | | | | | | | | | | | | | | | | | | | | | | | | | | | | | | | | | | | | | | | | | | | | | | | | | | | |
Appendix No. 4, letter b) shows the detail of estimated future cash flows (undiscounted) that the Combined Group will have to disburse to settle the secured and unsecured liabilities detailed above.
F-67
| • | | Detail of Finance Lease Obligations |
| | | | | | | | | | | | | | | | | | | | | | | | | | | | | | | | | | | | | | | | | | | | | | | | | | | | |
Taxpayer ID No. (RUT) | | Company | | Country | | ID No.
Financial
Institution | | Financial Institution | | Country | | Currency | | Nominal
Interest
Rate | | | September 30, 2015 | |
| | | | | | | | | Current | | | Non-current | |
| | | | | | | | | Less
than 90
days | | | More
than 90
days | | | Total
Current | | | One to
two years | | | Two to
three
years | | | Three
to four
years | | | Four
to five
years | | | Over
five
years | | | Total
Non-
current | |
| | | | | | | | | ThCh$ | | | ThCh$ | | | ThCh$ | | | ThCh$ | | | ThCh$ | | | ThCh$ | | | ThCh$ | | | ThCh$ | | | ThCh$ | |
Foreign | | Edegel S.A.A. | | Peru | | Foreign | | Banco Scotiabank | | Peru | | US$ | | | 2.02 | % | | | 2,431,797 | | | | 7,247,627 | | | | 9,679,424 | | | | 17,694,656 | | | | — | | | | — | | | | — | | | | — | | | | 17,694,656 | |
Foreign | | Emgesa S.A. E.S.P. | | Colombia | | Foreign | | Banco Corpbanca | | Colombia | | CP | | | 10.80 | % | | | 4,541 | | | | 13,677 | | | | 18,218 | | | | 19,820 | | | | 21,515 | | | | 3,727 | | | | — | | | | — | | | | 45,062 | |
Foreign | | Emgesa S.A. E.S.P. | | Colombia | | Foreign | | Equirent S.A. | | Colombia | | CP | | | 6.55 | % | | | 469 | | | | 1,454 | | | | 1,923 | | | | 2,052 | | | | 354 | | | | — | | | | — | | | | — | | | | 2,406 | |
Foreign | | Emgesa S.A. E.S.P. | | Colombia | | Foreign | | Mareauto Colombia SAS | | Colombia | | CP | | | 10.08 | % | | | 782 | | | | 2,466 | | | | 3,248 | | | | 3,590 | | | | 3,969 | | | | 698 | | | | — | | | | — | | | | 8,257 | |
| | | | | | | | | | | | | | | | | | | | | | | | | | | | | | | | | | | | | | | | | | | | | | | | | | | | |
| | | | | | | | Total ThCh$ | | | | | | | | | | | | | | | | | | | 9,702,813 | | | | | | | | | | | | | | | | | | | | | | | | 17,750,381 | |
| | | | | | | | | | | | | | | | | | | | | | | | | | | | | | | | | | | | | | | | | | | | | | | | | | | | |
| | | | | | | | | | | | | | | | | | | | | | | | | | | | | | | | | | | | | | | | | | | | | | | | | | | | |
Taxpayer ID
No. (RUT) | | Company | | Country | | ID No.
Financial
Institution | | Financial Institution | | Country | | Currency | | Nominal
Interest
Rate | | | 12-31-2014 | |
| | | | | | | | | Current | | | Non-current | |
| | | | | | | | | Less
than 90
days | | | More
than 90
days | | | Total
Current | | | One to
two
years | | | Two to
three
years | | | Three to
four
years | | | Four to
five
years | | | More
than five
years | | | Total
Non-
current | |
| | | | | | | | | ThCh$ | | | ThCh$ | | | ThCh$ | | | ThCh$ | | | ThCh$ | | | ThCh$ | | | ThCh$ | | | ThCh$ | | | ThCh$ | |
Foreign | | Edegel S.A.A. | | Peru | | Foreign | | Banco Scotiabank | | Peru | | US$ | | | 1.98 | % | | | 2,122,504 | | | | 6,312,384 | | | | 8,434,888 | | | | 8,416,512 | | | | 13,307,187 | | | | — | | | | — | | | | — | | | | 21,723,699 | |
| | | | | | | | | | | | | | | | | | | | | | | | | | | | | | | | | | | | | | | | | | | | | | | | | | | | |
| | | | | | | | Total | | ThCh$ | | | | | | | | | | | | | | | | | 8,434,888 | | | | | | | | | | | | | | | | | | | | | | | | 21,723,699 | |
| | | | | | | | | | | | | | | | | | | | | | | | | | | | | | | | | | | | | | | | | | | | | | | | | | | | |
Appendix No. 4 letter c) presents details of estimated future cash flows (undiscounted) that the Combined Group will have to disburse to settle the finance lease obligations detailed above.
| • | | Detail of other obligations |
| | | | | | | | | | | | | | | | | | | | | | | | | | | | | | | | | | | | | | | | | | | | | | | | | | | | |
Taxpayer ID
No. (RUT) | | Company | | Country | | ID No.
Financial
Institution | | Financial institution | | Country | | Currency | | Nominal
Interest
Rate | | | Balance as of September 30, 2015 | |
| | | | | | | | | Current | | | Non-current | |
| | | | | | | | | Less
than 90
days | | | More
than 90
days | | | Total
Current | | | One to
two
years | | | Two to
three
years | | | Three to
four
years | | | Four to
five
years | | | More
than five
years | | | Total
Non-
current | |
Foreign | | Central Costanera S.A. | | Argentina | | Foreign | | Mitsubishi (secured debt) | | Argentina | | US$ | | | 0.25 | % | | | — | | | | 3,681,779 | | | | 3,681,779 | | | | 2,098,851 | | | | 2,098,851 | | | | 2,098,851 | | | | 2,098,851 | | | | 23,362,135 | | | | 31,757,539 | |
Foreign | | Central Costanera S.A. | | Argentina | | Foreign | | Others | | Argentina | | Ar$ | | | 17.29 | % | | | 1,034,686 | | | | — | | | | 1,034,686 | | | | — | | | | — | | | | — | | | | — | | | | — | | | | — | |
Foreign | | Hidroinvest S.A. | | Argentina | | Foreign | | Others | | Argentina | | US$ | | | 2.33 | % | | | — | | | | 381,589 | | | | 381,589 | | | | — | | | | — | | | | — | | | | — | | | | — | | | | — | |
Foreign | | Endesa Argentina S.A. | | Argentina | | Foreign | | Others | | Argentina | | Ar$ | | | 30.00 | % | | | — | | | | — | | | | — | | | | — | | | | — | | | | — | | | | — | | | | — | | | | — | |
Foreign | | Hidroeléctrica El Chocón S.A. | | Argentina | | Foreign | | Others | | Argentina | | Ar$ | | | 22.97 | % | | | 14,818,708 | | | | — | | | | 14,818,708 | | | | 10,464,454 | | | | — | | | | — | | | | — | | | | — | | | | 10,464,454 | |
| | | | | | | | | | | | | | | | | | | | | | | | | | | | | | | | | | | | | | | | | | | | | | | | | | | | |
| | | | | | | | Total ThCh$ | | | | | | | | | | | | | | | | | | | 19,916,762 | | | | | | | | | | | | | | | | | | | | | | | | 42,221,993 | |
| | | | | | | | | | | | | | | | | | | | | | | | | | | | | | | | | | | | | | | | | | | | | | | | | | | | |
F-68
| | | | | | | | | | | | | | | | | | | | | | | | | | | | | | | | | | | | | | | | | | | | | | | | | | | | |
Taxpayer ID
No. (RUT) | | Company | | Country | | ID No.
Financial
Institution | | Financial Institution | | Country | | Currency | | Nominal
Interest
Rate | | | 12-31-2014 | |
| | | | | | | | | Current | | | Non-current | |
| | | | | | | | | Less
than 90
days | | | More
than 90
days | | | Total
Current | | | One to
two
years | | | Two to
three
years | | | Three to
four
years | | | Four to
five
years | | | More than
five years | | | Total
Non-
current | |
Foreign | | Central Costanera S.A. | | Argentina | | Foreign | | Mitsubishi (secured debt) | | Argentina | | US$ | | | 7.42 | % | | | — | | | | 2,391,399 | | | | 2,391,399 | | | | 7,362,677 | | | | 7,362,678 | | | | 7,362,678 | | | | 4,532,769 | | | | — | | | | 26,620,802 | |
Foreign | | Central Costanera S.A. | | Argentina | | Foreign | | Others | | Argentina | | Ar$ | | | 17.29 | % | | | — | | | | 3,099,889 | | | | 3,099,889 | | | | — | | | | — | | | | — | | | | — | | | | — | | | | — | |
Foreign | | Hidroinvest S.A. | | Argentina | | Foreign | | Others | | Argentina | | US$ | | | 2.33 | % | | | — | | | | 331,928 | | | | 331,928 | | | | — | | | | — | | | | — | | | | — | | | | — | | | | — | |
Foreign | | Hidroeléctrica El Chocón S.A. | | Argentina | | Foreign | | Others | | Argentina | | Ar$ | | | 23.54 | % | | | 32,719 | | | | — | | | | 32,719 | | | | — | | | | — | | | | — | | | | — | | | | — | | | | — | |
Foreign | | Chinango S.A.C. | | Peru | | Foreign | | Banco Scotiabank | | Peru | | US$ | | | 0.78 | % | | | 513,495 | | | | — | | | | 513,495 | | | | 9,409,124 | | | | — | | | | — | | | | — | | | | — | | | | 9,409,124 | |
| | | | | | | | | | | | | | | | | | | | | | | | | | | | | | | | | | | | | | | | | | | | | | | | | | | | |
| | | | | | | | Total | | ThCh$ | | | | | | | | | | | | | | | | | 6,369,430 | | | | | | | | | | | | | | | | | | | | | | | | 36,029,926 | |
| | | | | | | | | | | | | | | | | | | | | | | | | | | | | | | | | | | | | | | | | | | | | | | | | | | | |
Appendix No. 4 letter d) presents details of estimated future cash flows (undiscounted) that the Combined Group will have to disburse to settle these Other Obligations.
As of September 30, 2015 and December 31, 2014 Combined Group had long-term lines of credit unconditionally available for use amounting to ThCh 40,464,607 and ThCh 20,603,923, respectively.
| 17. | RISK MANAGEMENT POLICY |
The Combined Group’s companies are exposed to certain risks that are managed by systems that identify, measure, limit concentration of, and monitor these risks.
The main principles in the Combined Group’s risk management policy include the following:
| • | | Compliance with good corporate governance standards. |
| • | | Strict compliance with all the Combined Group’s internal policies. |
| • | | Each business and corporate area determines: |
| | I. | The markets in which it can operate based on its knowledge and ability to ensure effective risk management. |
| | II. | Criteria regarding counterparts. |
| | III. | Authorized operators. |
| • | | Business and corporate areas establish their risk tolerance in a manner consistent with the defined strategy for each market in which they operate. |
| • | | All of the operations of the businesses and corporate areas are conducted within the limits approved for each case. |
| • | | Businesses, corporate areas, lines of business and companies design the risk management controls necessary to ensure that transactions in the markets are conducted in accordance with the Combined Group policies, standards, and procedures. |
F-69
Changes in interest rates affect the fair value of assets and liabilities bearing fixed interest rates, as well as the expected future cash flows of assets and liabilities subject to floating interest rates.
The objective of managing interest rate risk exposure is to achieve a balance in the debt structure to minimize the cost of debt with reduced volatility in profit or loss.
In compliance with the current interest rate hedging policy, the proportion of fixed debt and/or hedged debt over the net total debt was 19% as of September 30, 2015.
Depending on the Combined Group’s estimates and on the objectives of the debt structure, hedging transactions are performed by entering into derivatives contracts that mitigate interest rate risk. Derivative instruments currently used to comply with the risk management policy are interest rate swaps to set floating rate at fixed rate.
The financial debt structure of the Combined Group detailed by fixed and/or hedged and floating interest rate on total net debt, net of hedging derivative instruments, is as follows:
Net position:
| | | | | | | | |
| | | Balance as of | |
| | | 9-30-2015
% | | | 12-31-2014
% | |
Fixed interest rate | | | 19 | | | | 25 | |
Floating interest rate | | | 81 | | | | 75 | |
| | | | | | | | |
Total | | | 100 | | | | 100 | |
| | | | | | | | |
Exchange rate risks involve basically the following transactions:
| • | | Debt taken on by the Combined Group’s companies that is denominated in a currency other than that in which its cash flows are indexed. |
| • | | Payments to be made for the acquisition of project-related materials in a currency other than that in which its cash flows are indexed. |
| • | | Revenues in Combined Group companies directly linked to changes in currencies other than those of its cash flows. |
| • | | Cash flows from foreign combined entities to parent companies which are exposed to exchange rate fluctuations. |
In order to mitigate exchange rate risk, the Combined Group’s foreign currency risk management policy is based on cash flows and includes maintaining a balance between U.S. dollar flows and the levels of assets and liabilities denominated in this currency. The objective is to minimize the exposure to variability in cash flows that are attributable to foreign exchange risk.
The hedging instruments currently being used to comply with the policy are currency swaps and forward exchange contracts. In addition, the policy seeks to refinance debt in the functional currency of each of the Combined Group’s companies.
F-70
The Combined Group’s liquidity risk management policy consists of entering into long-term committed banking facilities and temporary financial investments for amounts that cover the projected needs over a period of time that is determined based on the situation and expectations for debt and capital markets.
The projected needs mentioned above include maturities of financial debt, net of financial derivatives. For further details regarding the features and conditions of financial obligations and financial derivatives, see Notes 16, 18, and Appendix No. 4.
As of September 30, 2015 the Combined Group has liquidity of cash and cash equivalent totaling ThCh$ 167,949,606 and unconditionally available long-term lines of credit totaling ThCh$ 40,464,607 (as of December 31, 2014 ThCh$ 298,442,230 and ThCh$ 20,603,923, respectively).
Management closely monitors credit risk.
Trade receivables:
The credit risk for receivables from the Combined Group’s commercial activity has historically been very low, due to the short-term period of collections from customers, resulting in non-significant cumulative receivables amounts.
In some countries, regulations allow the suspension of energy service to customers with outstanding payments, and most contracts have termination clauses for payment default. Management monitors credit risk on an ongoing basis and measures maximum exposure to payment default risk, which, as stated above, is very low.
Financial assets, other than trade receivables:
Cash surpluses are invested in the highest-rated local and foreign financial entities (with risk rating equivalent to investment grade whenever possible) with thresholds established for each entity.
Banks that have received investment grade ratings from the three major international rating agencies (Moody’s, S&P, and Fitch) are selected for making investments.
Investments may be backed with treasury bonds from the countries in which the company operates and/or with commercial paper issued by the highest rated banks; the latter are preferred, as they offer higher returns (always in line with current investment policies).
Derivative instruments are entered into with entities with solid creditworthiness; all derivative transactions are performed with entities with investment grade ratings.
The Combined Group measures the Value at Risk (VaR) of its debt positions and financial derivatives in order to monitor the risk assumed by the Combined Group, thereby reducing volatility in the income statement.
The portfolio of positions included in calculating the current Value at Risk consists of the following:
| • | | Hedge derivatives for debt, dividends and projects. |
F-71
The VaR determined represents the potential variation in value of the portfolio of positions described above within a quarter with a 95% confidence level. To determine the VaR, we take into account the volatility of the risk variables affecting the value of the portfolio of positions including:
| • | | U.S. dollar Libor interest rate. |
| • | | The different currencies with which our companies operate and the customary local indices used in the banking industry. |
| • | | The exchange rates of the various currencies used in the calculation. |
The calculation of VaR is based on generating possible future scenarios (at one quarter) of market values (both spot and term) for the risk variables, using Bootstrapping simulations. The number of scenarios generated ensures compliance with the simulation convergence criteria. The table of volatilities and correlations between the various risk variables calculated based on the historical values of the logarithmic price returns has been applied to simulate the future price scenario.
Once the price scenarios have been obtained, the fair value of the portfolio is calculated using such scenarios, thereby obtaining a distribution of possible quarterly values. The one-day 95%-confidence VaR number is calculated as the 5% percentile of the potential quarterly variations in the fair value of the portfolio.
Given the aforementioned assumptions, the quarterly VaR of the positions discussed above corresponds to ThCh$94,520,239.
These values represent the potential increase of the Debt and Derivatives’ Portfolio, thus these Values At Risk are inherently related, among other factors, to the Portfolio’s value at each quarter’ end.
The VaR positions have varied during the nine-month periods ended September 30, 2015 and 2014 depending on the start/maturity of operations.
F-72
| 18.1 | Financial instruments, classified by type and category |
| a) | The detail of financial assets, classified by type and category, as of September 30, 2015 and December 31, 2014 is as follows: |
| | | | | | | | | | | | | | | | | | | | |
| | | Balance as of September 30, 2015 | |
| | | Financial assets held
for trading
ThCh$ | | | Held-to-maturity
investments
ThCh$ | | | Loans and
receivables
ThCh$ | | | Available-for-sale
financial assets
ThCh$ | | | Financial
derivatives
designated for
hedging
ThCh$ | |
Derivative instruments | | | 9,706,857 | | | | — | | | | — | | | | — | | | | 318,966 | |
Other financial assets | | | — | | | | 2,760,067 | | | | 232,990,139 | | | | — | | | | — | |
Total current | | | 9,706,857 | | | | 2,760,067 | | | | 232,990,139 | | | | — | | | | 318,966 | |
Equity instruments | | | — | | | | — | | | | — | | | | 624,898 | | | | — | |
Derivative instruments | | | — | | | | — | | | | — | | | | — | | | | 5,396 | |
Other financial assets | | | — | | | | — | | | | 119,792,042 | | | | — | | | | — | |
Total non-current | | | — | | | | — | | | | 119,792,042 | | | | 624,898 | | | | 5,396 | |
| | | | | | | | | | | | | | | | | | | | |
Total | | | 9,706,857 | | | | 2,760,067 | | | | 352,782,181 | | | | 624,898 | | | | 324,362 | |
| | | | | | | | | | | | | | | | | | | | |
| | | | | | | | | | | | | | | | | | | | |
| | | Balance as of December 31, 2014 | |
| | | Financial assets held
for trading
ThCh$ | | | Held-to-maturity
investments
ThCh$ | | | Loans and
receivables
ThCh$ | | | Available-for-sale
financial assets
ThCh$ | | | Financial
derivatives
designated for
hedging
ThCh$ | |
Derivative instruments | | | 2,924,888 | | | | — | | | | — | | | | — | | | | 712,883 | |
Other financial assets | | | — | | | | 19,747,428 | | | | 142,282,311 | | | | — | | | | — | |
Total current | | | 2,924,888 | | | | 19,747,428 | | | | 142,282,311 | | | | — | | | | 712,883 | |
Equity instruments | | | — | | | | — | | | | — | | | | 1,200,787 | | | | — | |
Derivative instruments | | | — | | | | — | | | | — | | | | — | | | | 16,166 | |
Other financial assets | | | — | | | | — | | | | 141,216,512 | | | | — | | | | — | |
Total non-current | | | — | | | | — | | | | 141,216,512 | | | | 1,200,787 | | | | 16,166 | |
| | | | | | | | | | | | | | | | | | | | |
Total | | | 2,924,888 | | | | 19,747,428 | | | | 283,498,823 | | | | 1,200,787 | | | | 729,049 | |
| | | | | | | | | | | | | | | | | | | | |
F-73
| b) | The detail of financial liabilities, classified by type and category, as of September 30, 2015 and December 31, 2014 is as follows: |
| | | | | | | | | | | | |
| | | Balance as of September 31, 2015 | |
| | | Financial liabilities held
for trading | | | Loans and payables | | | Financial derivatives
designated for hedging | |
| | | ThCh$ | | | ThCh$ | | | ThCh$ | |
Interest-bearing loans | | | — | | | | 255,655,744 | | | | — | |
Derivative instruments | | | — | | | | — | | | | 12,260 | |
Other financial liabilities | | | 390,849 | | | | 284,593,000 | | | | — | |
| | | | | | | | | | | | |
Total current | | | 390,849 | | | | 540,248,744 | | | | 12,260 | |
| | | | | | | | | | | | |
Interest-bearing loans | | | — | | | | 886,787,519 | | | | — | |
Derivative instruments | | | — | | | | — | | | | 440,185 | |
| | | | | | | | | | | | |
Total non-current | | | — | | | | 886,787,519 | | | | 440,185 | |
| | | | | | | | | | | | |
Total | | | 390,849 | | | | 1,427,036,263 | | | | 452,445 | |
| | | | | | | | | | | | |
| |
| | | Balance as of December 31, 2014 | |
| | | Financial liabilities held
for trading | | | Loans and payables | | | Financial derivatives
designated for hedging | |
| | | ThCh$ | | | ThCh$ | | | ThCh$ | |
Interest-bearing loans | | | — | | | | 144,380,202 | | | | — | |
Derivative instruments | | | — | | | | — | | | | 14,658 | |
Other financial liabilities | | | — | | | | 472,681,627 | | | | — | |
| | | | | | | | | | | | |
Total current | | | — | | | | 617,061,829 | | | | 14,658 | |
| | | | | | | | | | | | |
Interest-bearing loans | | | — | | | | 1,046,984,911 | | | | — | |
Derivative instruments | | | — | | | | — | | | | 582,788 | |
| | | | | | | | | | | | |
Total non-current | | | — | | | | 1,046,984,911 | | | | 582,788 | |
| | | | | | | | | | | | |
Total | | | — | | | | 1,664,046,740 | | | | 597,446 | |
| | | | | | | | | | | | |
| 18.2 | Derivative instruments |
The risk management policy of the Combined Group primarily uses interest rate and foreign exchange rate derivatives to hedge its exposure to interest rate and foreign currency risks.
The Combined Group classifies its derivatives as follows:
| • | | Derivatives designated for Cash flow hedges: Those that hedge the cash flows of the underlying hedged item. |
| • | | Derivatives designated for Fair value hedges: Those that hedge the fair value of the underlying hedged item. |
| • | | Non-hedge derivatives: Financial derivatives that do not meet the requirements established by IFRS to be designated as hedge instruments are recognized at fair value through profit or loss (assets held for trading). |
F-74
| a) | Assets and liabilities for hedge derivative instruments |
As of September 30, 2015 and December 31, 2014 financial derivative transactions qualifying as hedge instruments resulted in recognition of the following assets and liabilities in the combined statement of financial position:
| | | | | | | | | | | | | | | | | | | | | | | | | | | | | | | | |
| | | 9-30-2015 | | | 12-31-2014 | |
| | | Assets | | | Liabilities | | | Assets | | | Liabilities | |
| | | Current
ThCh$ | | | Non-current
ThCh$ | | | Current
ThCh$ | | | Non-current
ThCh$ | | | Current
ThCh$ | | | Non-current
ThCh$ | | | Current
ThCh$ | | | Non-current
ThCh$ | |
Interest rate hedges: | | | — | | | | 5,396 | | | | 12,260 | | | | 440,185 | | | | — | | | | 16,166 | | | | 14,637 | | | | 582,788 | |
Cash flow hedges | | | — | | | | 5,396 | | | | 12,260 | | | | 440,185 | | | | — | | | | 16,166 | | | | 14,637 | | | | 582,788 | |
Exchange rate hedges: | | | 318,966 | | | | — | | | | — | | | | — | | | | 712,883 | | | | — | | | | 21 | | | | — | |
Cash flow hedges | | | 318,966 | | | | — | | | | — | | | | — | | | | 712,883 | | | | — | | | | 21 | | | | — | |
| | | | | | | | | | | | | | | | | | | | | | | | | | | | | | | | |
TOTAL | | | 318,966 | | | | 5,396 | | | | 12,260 | | | | 440,185 | | | | 712,883 | | | | 16,166 | | | | 14,658 | | | | 582,788 | |
| | | | | | | | | | | | | | | | | | | | | | | | | | | | | | | | |
| • | | General information on hedge derivative instruments |
Hedge derivative instruments and their corresponding hedged instruments are shown in the following table:
| | | | | | | | | | | | | | | | |
Detail of hedge instruments | | Description of
hedge
instrument | | Description of instrument
hedged | | Fair value of
instruments hedged | | | Fair value of
instruments hedged | | | Type of risks
hedged | |
| | | | 9-30-2015
ThCh$ | | | 12-31-2014
ThCh$ | | |
SWAP | | Interest rate | | Bank borrowings | | | (447,050 | ) | | | (581,259 | ) | | | Cash flow hedge | |
SWAP | | Exchange rate | | Unsecured liabilities
(bonds) | | | 318,967 | | | | 712,862 | | | | Cash flow hedge | |
For the nine months ended September 30, 2015 and 2014 the Combined Group has not recognized significant gains or losses for ineffective cash flow hedges.
| b) | Financial derivative instrument assets and liabilities at fair through profit or loss |
As of September 30, 2015 and December 31, 2014 financial derivative transactions recognized at fair value through profit or loss, resulted in the recognition of the following assets and liabilities in the statement of financial position:
| | | | | | | | | | | | | | | | |
| | | Non-hedging derivative instruments | |
| | | Current | | | Current | | | Non-current | | | Non-current | |
| | | Assets
ThCh$ | | | Liabilities
ThCh$ | | | assets
ThCh$ | | | liabilities
ThCh$ | |
September 30, 2015 | | | 9,706,857 | | | | 390,849 | | | | — | | | | — | |
December 31, 2014 | | | 2,924,888 | | | | — | | | | — | | | | — | |
F-75
| c) | Other disclosures on derivatives |
The following tables present the fair value of hedging and non-hedging derivatives entered into by the Combined Group as well as the remaining contractual maturities as of September 30, 2015 and December 31, 2014:
| | | | | | | | | | | | | | | | | | | | |
Financial Derivatives | | Balance as of September 30, 2015 | |
| | Fair Value
ThCh$ | | | Notional Value | |
| | | Less than
one year
ThCh$ | | | 1 - 2 years
ThCh$ | | | 2 - 3 years
ThCh$ | | | Total
ThCh$ | |
Interest rate hedges: | | | (447,049 | ) | | | 8,869,549 | | | | 14,789,132 | | | | 436,700 | | | | 24,095,381 | |
Cash flow hedges | | | (447,049 | ) | | | 8,869,549 | | | | 14,789,132 | | | | 436,700 | | | | 24,095,381 | |
Exchange rate hedges: | | | 318,966 | | | | 2,002,979 | | | | — | | | | — | | | | 2,002,979 | |
Cash flow hedges | | | 318,966 | | | | 2,002,979 | | | | — | | | | — | | | | 2,002,979 | |
Derivatives not designated for hedge accounting | | | 9,316,008 | | | | 105,028,736 | | | | 51,987,038 | | | | 37,442,611 | | | | 194,458,385 | |
| | | | | | | | | | | | | | | | | | | | |
Total | | | 9,187,925 | | | | 115,901,264 | | | | 66,776,170 | | | | 37,879,311 | | | | 220,556,745 | |
| | | | | | | | | | | | | | | | | | | | |
| | | | | | | | | | | | | | | | | | | | |
Financial Derivatives | | Balance as of December 31, 2014 | |
| | Fair Value
ThCh$ | | | Notional Value | |
| | | Less than
one year
ThCh$ | | | 1 - 2 years
ThCh$ | | | 2 - 3 years
ThCh$ | | | Total
ThCh$ | |
Interest rate hedges: | | | (581,259 | ) | | | 7,702,083 | | | | 7,702,083 | | | | 11,296,190 | | | | 26,700,356 | |
Cash flow hedges | | | (581,259 | ) | | | 7,702,083 | | | | 7,702,083 | | | | 11,296,190 | | | | 26,700,356 | |
Exchange rate hedges: | | | 712,862 | | | | 7,029,775 | | | | — | | | | — | | | | 7,029,775 | |
Cash flow hedges | | | 712,862 | | | | 7,029,775 | | | | — | | | | — | | | | 7,029,775 | |
Derivatives not designated for hedge accounting | | | 2,924,888 | | | | 22,242,663 | | | | — | | | | — | | | | 22,242,663 | |
| | | | | | | | | | | | | | | | | | | | |
Total | | | 3,056,491 | | | | 36,974,521 | | | | 7,702,083 | | | | 11,296,190 | | | | 55,972,794 | |
| | | | | | | | | | | | | | | | | | | | |
The hedging and non-hedging derivatives contractual maturities do not represent the Combined Group’s total risk exposure, as the amounts recorded in the above tables have been drawn up based on undiscounted contractual cash inflows and outflows for their settlement.
| a) | Financial instruments recognized at fair value in the combined statement of financial position are classified based on the hierarchy described in Note 3.f.5 above. |
F-76
The following table presents financial assets and liabilities measured at fair value as of September 30, 2015 and December 31, 2014:
| | | | | | | | | | | | | | | | |
Financial instruments measured at fair value | | | | | Fair value measured at end of
reporting period using: | |
| | | 9-30-2015
ThCh$ | | | Level 1
ThCh$ | | | Level 2
ThCh$ | | | Level 3
ThCh$ | |
Financial Assets | | | | | | | | | | | | | | | | |
Financial derivatives designated as cash flow hedges | | | 324,362 | | | | — | | | | 324,362 | | | | — | |
Financial derivatives not designated for hedge accounting | | | 9,706,857 | | | | — | | | | 9,706,857 | | | | — | |
| | | | | | | | | | | | | | | | |
Total | | | 10,031,219 | | | | — | | | | 10,031,219 | | | | — | |
| | | | | | | | | | | | | | | | |
Financial Liabilities | | | | | | | | | | | | | | | | |
Financial derivatives designated as cash flow hedges | | | 452,445 | | | | — | | | | 452,445 | | | | — | |
Financial derivatives not designated for hedge accounting | | | 390,849 | | | | — | | | | 390,849 | | | | — | |
| | | | | | | | | | | | | | | | |
Total | | | 843,294 | | | | — | | | | 843,294 | | | | — | |
| | | | | | | | | | | | | | | | |
| | | | | | | | | | | | | | | | |
Financial instruments measured at fair value | | | | | Fair value measured at end of
reporting period using: | |
| | | 12-31-2014
ThCh$ | | | Level 1
ThCh$ | | | Level 2
ThCh$ | | | Level 3
ThCh$ | |
Financial Assets | | | | | | | | | | | | | | | | |
Financial derivatives designated as cash flow hedges | | | 729,049 | | | | — | | | | 729,049 | | | | — | |
Financial derivatives not designated for hedge accounting | | | 2,924,888 | | | | — | | | | 2,924,888 | | | | — | |
| | | | | | | | | | | | | | | | |
Total | | | 3,653,937 | | | | — | | | | 3,653,937 | | | | — | |
| | | | | | | | | | | | | | | | |
Financial Liabilities | | | | | | | | | | | | | | | | |
Financial derivatives designated as cash flow hedges | | | 597,446 | | | | — | | | | 597,446 | | | | — | |
| | | | | | | | | | | | | | | | |
Total | | | 597,446 | | | | — | | | | 597,446 | | | | — | |
| | | | | | | | | | | | | | | | |
| b) | Financial instruments whose fair value is classified at Level 3 |
The Combined Group is involved in certain operations which require recognition of a financial liability at fair value. The fair value of Level 3 has been calculated by applying a traditional discounted cash flow method. These projected cash flows include assumptions that are primarily based on estimates for prices and levels of energy production and firm capacity, as well as the costs of operating and maintaining certain of the Combined Group’s plants.
None of the possible reasonable scenarios foreseeable in the assumptions mentioned in the above paragraph would result in a significant change in the fair value of the financial instruments included at this level. The fair value of these financial liabilities was ThCh$0 as of September 30, 2015 and December 31, 2014.
| 19. | TRADE AND OTHER PAYABLES |
The breakdown of trade and other payables as of September 30, 2015 and December 31, 2014 is as follows:
| | | | | | | | |
Trade and other payables | | Current | |
| | 9-30-2015
ThCh$ | | | 12-31-2014
ThCh$ | |
Trade payables | | | 23,964,157 | | | | 25,694,778 | |
Other payables | | | 217,162,231 | | | | 333,926,073 | |
| | | | | | | | |
Total | | | 241,126,388 | | | | 359,620,851 | |
| | | | | | | | |
F-77
As of September 30, 2015 and December 31, 2014 the Combined Group did not have non-current trade and other payables.
The detail of trade and other payables as of September 30, 2015 and December 31, 2014 is as follows:
| | | | | | | | |
| | | Current | |
Trade and other payables | | 9-30-2015
ThCh$ | | | 12-31-2014
ThCh$ | |
Energy suppliers | | | 16,664,862 | | | | 14,226,815 | |
Fuel and gas suppliers | | | 7,299,295 | | | | 11,467,963 | |
Payables to tax authorities other than Corporate Income Tax | | | 12,781,330 | | | | — | |
Payables for goods and services | | | 75,418,500 | | | | 91,549,044 | |
VAT (IGV / ICMS) | | | 18,484,110 | | | | — | |
Dividends payable to non-controlling interests | | | 63,717,447 | | | | 137,780,947 | |
Mitsubishi contract (LTSA) | | | — | | | | 34,214,611 | |
Other payables | | | 46,760,844 | | | | 70,381,471 | |
| | | | | | | | |
Total | | | 241,126,388 | | | | 359,620,851 | |
| | | | | | | | |
See Note 17.3 for the description of the liquidity risk management policy.
The detail of payments due and paid as of September 30, 2015 and December 31, 2014 is presented in Appendix 6.
| a) | The breakdown of provisions as of September 30, 2015 and December 31, 2014 is as follows: |
| | | | | | | | | | | | | | | | |
Provisions | | Current | | | Non-current | |
| | 9-30-2015
ThCh$ | | | 12-31-2014
ThCh$ | | | 9-30-2015
ThCh$ | | | 12-31-2014
ThCh$ | |
Provision for legal proceedings (*) | | | 4,043,974 | | | | 18,753,051 | | | | 796,631 | | | | 388,126 | |
Decommissioning or restoration (**) | | | — | | | | — | | | | 3,567,719 | | | | 3,226,928 | |
Provision for environmental issues | | | 102,978,797 | | | | 6,689,829 | | | | 29,380,155 | | | | 77,383 | |
Other provisions | | | 2,079,612 | | | | 1,976,531 | | | | — | | | | — | |
| | | | | | | | | | | | | | | | |
Total | | | 109,102,383 | | | | 27,419,411 | | | | 33,744,505 | | | | 3,692,437 | |
| | | | | | | | | | | | | | | | |
| (*) | Provision for legal proceedings as of December 31, 2014 includes provisions of Emgesa (Colombian entities) associated with contracts related to Quimbo project for the amount of ThCh$17,381,792 and paid during 2015 for the amount of ThCh$16,914,262. |
The expected timing and amount of any cash outflows related to the above provisions is uncertain and depends on the final resolution of the provisioned matters (See Note 3.i). For example, in the specific case of the legal proceedings it depends on the final resolution of the related legal claim.
Management considers that the provisions recognized in the Combined Statements of Financial Position adequately cover the related risks.
F-78
| b) | Changes in provisions in the nine-month period ended September 30, 2015 and for the year ended December 31, 2014 are as follows: |
| | | | | | | | | | | | | | | | | | | | |
Changes in Provisions | | Legal
Proceedings
ThCh$ | | | Decommissioning
and Restoration
ThCh$ | | | Environmental
issues
ThCh$ | | | Other
Provisions
ThCh$ | | | Total
ThCh$ | |
Opening Balance as of January 1, 2015 | | | 19,141,177 | | | | 3,226,928 | | | | 6,767,212 | | | | 1,976,531 | | | | 31,111,848 | |
Changes in Provisions | | | | | | | | | | | | | | | | | | | | |
Increase in existing provisions | | | 2,581,207 | | | | — | | | | 135,069,755 | | | | 1,494,474 | | | | 139,145,436 | |
Provisions used | | | (16,978,315 | ) | | | — | | | | — | | | | — | | | | (16,978,315 | ) |
Increase for adjustment to value of money over time | | | — | | | | 124,338 | | | | — | | | | 47,817 | | | | 172,155 | |
Foreign currency translation | | | 96,536 | | | | 216,453 | | | | (9,478,015 | ) | | | (1,439,209 | ) | | | (10,604,235 | ) |
| | | | | | | | | | | | | | | | | | | | |
Total changes in provisions | | | (14,300,572 | ) | | | 340,791 | | | | 125,591,740 | | | | 103,081 | | | | 111,735,040 | |
| | | | | | | | | | | | | | | | | | | | |
Closing Balance as of September 30, 2015 | | | 4,840,605 | | | | 3,567,719 | | | | 132,358,952 | | | | 2,079,612 | | | | 142,846,888 | |
| | | | | | | | | | | | | | | | | | | | |
| | | | | | | | | | | | | | | | | | | | |
Changes in Provisions | | Legal
Proceedings
ThCh$ | | | Decommissioning
and Restoration
ThCh$ | | | Environmental
issues
ThCh$ | | | Other
Provisions
ThCh$ | | | Total
ThCh$ | |
Opening balance as of January 1, 2014 | | | 2,692,424 | | | | 2,841,123 | | | | 12,139,002 | | | | 2,988,124 | | | | 20,660,673 | |
Changes in Provisions | | | | | | | | | | | | | | | | | | | | |
Increase in existing provisions | | | 17,139,243 | | | | — | | | | | | | | 234,682 | | | | 17,373,925 | |
Provisions used | | | (579,586 | ) | | | — | | | | (4,608,836 | ) | | | — | | | | (5,188,422 | ) |
Increase for adjustment to value of money over time | | | — | | | | 155,280 | | | | — | | | | 62,493 | | | | 217,773 | |
Foreign currency translation | | | (110,904 | ) | | | 230,525 | | | | (762,954 | ) | | | (1,308,768 | ) | | | (1,952,101 | ) |
| | | | | | | | | | | | | | | | | | | | |
Total changes in provisions | | | 16,448,753 | | | | 385,805 | | | | (5,371,790 | ) | | | (1,011,593 | ) | | | 10,451,175 | |
| | | | | | | | | | | | | | | | | | | | |
Closing Balance as of December 31, 2014 | | | 19,141,177 | | | | 3,226,928 | | | | 6,767,212 | | | | 1,976,531 | | | | 31,111,848 | |
| | | | | | | | | | | | | | | | | | | | |
| 21. | EMPLOYEE BENEFIT OBLIGATIONS |
Endesa Américas and certain combined entities of the Combined Group in Colombia, Peru and Argentina provide various post-employment benefits for all or some of their active or retired employees. These benefits are calculated and recognized in the financial statements according to the criteria described in Note 3.i.1, and include primarily the following:
Complementary pension: The beneficiary is entitled to receive a monthly amount that supplements the pension obtained from the respective social security system.
Employee severance indemnities: The beneficiary receives a certain number of contractual salaries upon retirement. Such benefit is subject to a vesting minimum service requirement period, which depending on the company, varies within a range from 5 to 15 years.
F-79
Electricity: The beneficiary receives a monthly bonus to cover a portion of their billed residential electricity consumption.
Health benefit: The beneficiary receives health coverage in addition to that to which they are entitled to under applicable social security regime.
Five-year benefits: A benefit certain employees receive after 5 years; accrues from the second year onwards.
Unemployment: A benefit paid regardless of whether the employee is fired or leaves voluntarily. This benefit accrues on a daily basis and is paid at the time of contract termination (although the law allows for partial withdrawals for housing and education).
Seniority bonuses in Peru: There is an agreement to give workers (“subject to the collective agreement”) an extraordinary bonus for years of service upon completion of the equivalent of five years of actual work. This benefit is given according to the following scale:
| | | | |
| After 5, 10, and 15 years | | – | | 1 basic monthly salary |
| After 20 years | | – | | 1 1⁄2 basic monthly salaries |
| After 25, 30, 35, and 40 years | | – | | 2 1⁄2 basic monthly salaries |
| • | | Defined contribution benefits: |
The Combined Group makes contributions to a retirement benefit plan where the beneficiary receives additional pension supplements upon his/her retirement, disability or death.
| 21.2 | Details, changes and presentation in financial statements |
| a) | The post-employment obligations associated with the defined benefits plan as of September 30, 2015 and December 31, 2014 are as follows: |
| | | | | | | | |
| | | Balance as of | |
| | | 9-30-2015
ThCh$ | | | 12-31-2014
ThCh$ | |
Post-employment obligations | | | 22,512,843 | | | | 24,924,791 | |
| | | | | | | | |
Total | | | 22,512,843 | | | | 24,924,791 | |
| | | | | | | | |
Non-current portion | | | 22,512,843 | | | | 24,924,791 | |
| | | | | | | | |
| b) | The following amounts were recognized in the combined statement of comprehensive income for the nine months ended September 30, 2015 and 2014: |
| | | | | | | | |
Expense Recognized in the Statement of Comprehensive Income | | For the nine months ended | |
| | 9-30-2015
ThCh$ | | | 9-30-2014
ThCh$
(Unaudited) | |
Current service cost for defined benefits plan | | | 560,892 | | | | 233,768 | |
Interest cost for defined benefits plan | | | 1,903,716 | | | | 1,718,603 | |
Past service costs | | | 43,079 | | | | — | |
Expenses recognized in the Statement of Income | | | 2,507,687 | | | | 1,952,371 | |
Losses from remeasurement of defined benefit plans | | | (659,949 | ) | | | — | |
| | | | | | | | |
Total expense recognized in the Statement of Comprehensive Income | | | 1,847,738 | | | | 1,952,371 | |
| | | | | | | | |
F-80
The balance and changes in post-employment defined benefit obligations as of and for the nine months ended September 30, 2015 and for the year ended December 31, 2014 are as follows:
| | | | |
Actuarial Value of Post-employment Obligations | | ThCh$ | |
Opening Balance as of January 1, 2014 | | | 25,721,273 | |
Current service cost | | | 493,357 | |
Net interest cost | | | 2,258,362 | |
Actuarial losses from changes in financial assumptions | | | 524,052 | |
Actuarial losses from changes in seniority adjustments | | | 535,619 | |
Foreign currency translation differences | | | (1,590,439 | ) |
Contributions paid | | | (3,019,325 | ) |
Other | | | 1,892 | |
Closing balance as of December 31, 2014 | | | 24,924,791 | |
Current service cost | | | 560,892 | |
Net interest cost | | | 1,903,716 | |
Actuarial gains from changes in financial assumptions | | | (883,070 | ) |
Actuarial losses from changes in seniority adjustments | | | 223,121 | |
Foreign currency translation differences | | | (2,025,123 | ) |
Contributions paid | | | (2,141,061 | ) |
Defined benefit plan obligations from the past service costs | | | 43,079 | |
Transfer of personnel | | | (93,502 | ) |
Closing balance as of September 30, 2015 | | | 22,512,843 | |
Combined Group companies make no contributions to funds for financing the payment of these benefits.
Actuarial assumptions
As of September 30, 2015 and December 31, 2014 the following assumptions were used in the actuarial calculation of defined benefits:
| | | | | | | | | | | | | | | | | | | | | | | | | | | | | | | | |
| | | Chile | | | Colombia | | | Argentina | | | Peru | |
| | | 9-30-2015 | | | 12-31-2014 | | | 9-30-2015 | | | 12-31-2014 | | | 9-30-2015 | | | 12-31-2014 | | | 9-30-2015 | | | 12-31-2014 | |
Discount rate used | | | 4.6 | % | | | 4.6 | % | | | 7.51 | % | | | 7.40 | % | | | 5.50 | % | | | 5.50 | % | | | 7.30 | % | | | 6.35 | % |
Expected rate of salary increases | | | 3.0 | % | | | 4.0 | % | | | 3.00 | % | | | 4.00 | % | | | 0.00 | % | | | 0.00 | % | | | 3.00 | % | | | 3.00 | % |
Mortality tables | | | RV 2009 | | | | RV 2009 | | | | RV 2008 | | | | RV 2008 | | | | RV 2004 | | | | RV 2004 | | | | RV 2009 | | | | RV 2009 | |
Sensitivity
As of September 30, 2015, the sensitivity of the value of the actuarial liability for post-employment benefits to variations of 100 basis points in the discount rate assumes a decrease of ThCh$1,774,117 (ThCh$2,125,543 as of December 31, 2014) if the rate rises and an increase of ThCh$2,268,695 (ThCh$2,533,901 as of December 31, 2014) if the rate falls.
Defined contributions
The total expense recognized in the combined statement of comprehensive income in the caption “Employee expenses” represents contributions payables to the defined contribution plans by the Combined Group. For the nine months ended September 30, 2015, the amount recognized as expense was ThCh$495,598 (ThCh$437,423 for the nine months ended September 30, 2014).
F-81
Future disbursements
The estimates available indicate that disbursements for defined benefit plans will increase to ThCh$2,770,185 in the next year.
Term of commitments
The Combined Group’s obligations have a weighted average length of 7.55 years, and the flow for benefits for the next 5 years and more is expected to be as follows:
| | | | |
Years | | ThCh$ | |
1 | | | 2,770,185 | |
2 | | | 2,252,161 | |
3 | | | 2,519,626 | |
4 | | | 2,857,363 | |
5 | | | 2,864,703 | |
More than 5 | | | 14,899,548 | |
| 22.1 | Net assets (Combined financial statements) |
As stated in Note 2.1 “Basis of preparation” Endesa Américas S.A. was not a group for Consolidated Financial Statements reporting purposes in accordance with IFRS 10 Consolidated Financial Statements and was presented on the basis of the aggregation of the net assets of the legal entities of Endesa Chile group located outside of Chile. The Combined Group currently does not have any subscribed or issued capital.
| 22.2 | Foreign currency translation reserves |
The following table details currency translation adjustments attributable to the Parent Company of the Combined Group for the nine-months periods ended September 30, 2015 and 2014:
| | | | | | | | |
Reserves for Accumulated Currency Translation
Differences | | For the nine months ended | |
| | September 30,
2015
ThCh$ | | | September 30,
2014
ThCh$
(Unaudited) | |
Emgesa S.A. E.S.P. | | | 43,843,537 | | | | 113,254,649 | |
Generandes Perú S.A. | | | 95,379,184 | | | | 76,160,276 | |
Hidroeléctrica el Chocón S.A. | | | (51,103,155 | ) | | | (54,310,834 | ) |
Endesa Argentina S.A. | | | (13,447,697 | ) | | | (13,657,210 | ) |
Central Costanera S.A. | | | 10,918,347 | | | | 9,512,098 | |
Enel Brasil | | | (225,883,149 | ) | | | (69,103,155 | ) |
Others | | | (4,252,733 | ) | | | (4,300,140 | ) |
| | | | | | | | |
TOTAL | | | (144,545,666 | ) | | | 57,555,684 | |
| | | | | | | | |
| 22.3 | Restrictions on combined entities transferring funds to the parent |
Certain of the Combined Group’s entities must comply with financial ratio covenants which require them to have a minimum level of equity or other requirements that restrict the transfer of assets to the parent company. The Combined Group’s restricted net assets as of September 30, 2015 from its combined entities Edegel S.A.A. and Hidroeléctrica El Chocón S.A. are ThCh$63,551,468 and ThCh$71,631,835, respectively.
F-82
Other reserves within Equity attributable to the Parent Company of the Combined Group for the nine-month periods ended September 30, 2015 and 2014 are as follows:
| | | | | | | | | | | | |
| | | Balance as of
January 1,
2015
ThCh$ | | | Changes
ThCh$ | | | Balance as of
September 30,
2015
ThCh$ | |
Exchange differences on translation | | | (28,331,643 | ) | | | (116,214,023 | ) | | | (144,545,666 | ) |
Cash flow hedges | | | (1,991,688 | ) | | | (3,751,738 | ) | | | (5,743,426 | ) |
Remeasurement of available-for-sale financial assets | | | — | | | | (118,664 | ) | | | (118,664 | ) |
Other miscellaneous reserves | | | (820,511,192 | ) | | | 28,101,871 | | | | (792,409,321 | ) |
| | | | | | | | | | | | |
TOTAL | | | (850,834,523 | ) | | | (91,982,554 | ) | | | (942,817,077 | ) |
| | | | | | | | | | | | |
| | | | | | | | | | | | |
| | | Balance as of
January 1,
2014
ThCh$ | | | Changes
ThCh$
(Unaudited) | | | Balance as of
September 30,
2014
ThCh$
(Unaudited) | |
Exchange differences on translation | | | (50,898,021 | ) | | | 108,453,705 | | | | 57,555,684 | |
Cash flow hedges | | | 2,118,519 | | | | (2,244,194 | ) | | | (125,675 | ) |
Other miscellaneous reserves | | | (760,604,463 | ) | | | (6,315,694 | ) | | | (766,920,157 | ) |
| | | | | | | | | | | | |
TOTAL | | | (809,383,965 | ) | | | 99,893,817 | | | | (709,490,148 | ) |
| | | | | | | | | | | | |
| • | | Reserves for Exchange differences on translation: These arise primarily from exchange differences relating to: |
| • | | Translation of the financial statements of our foreign operations from their functional currencies to our presentation currency (i.e. Chilean peso) (see Note 3.k); |
| • | | Translation of goodwill arising from the acquisition of foreign operations with a functional currency other than the Chilean peso (see Note 3.b). |
| • | | Cash flow hedges reserves: These represent the cumulative portion of gains and losses on hedging instruments deemed effective in cash flow hedges (see Note 3.f.4). |
| • | | Remeasurement of available-for-sale financial assets: These represent variations in fair value, net of their effect on the available-for-sale investments (see Note 3.f.1). |
| • | | Other miscellaneous reserves: |
Other miscellaneous reserves primarily include the following as of September 30, 2015 and December 31, 2014:
| (i). | In accordance with Official Bulletin (Oficio Circular) No. 456 from issued by the Chilean Superintendence of Securities and Insurance, this caption records the price-level adjustment of cumulative paid-in capital from the date of the transition to IFRS, January 1, 2004, to December 31, 2008. |
Please note that, while the Combined Group adopted the IFRS as its statutory accounting standards on January 1, 2009, the date of transition to that international standard used was January 1, 2004. This results from applying the exemption for that purpose in IFRS 1, “First Time Adoption”.
| (ii). | Foreign currency translation differences existing at the time of transition to IFRS (IFRS 1 exemption, First Time Adoption). |
| (iii). | The effects of business combinations under common control, arising primarily from the creation of the holding company Enel Brasil S.A. in 2005 and the merger of our Colombian combined entities Emgesa and Betania in 2007. |
F-83
| 22.5 | Non-controlling interests |
| | | | | | | | | | | | | | | | | | | | |
| | | | | | Non-controlling Interests (% financial interest) | |
| | | | | | Equity
Balance as of | | | Profit (Loss)
For the nine months ended | |
Companies | | Non-controlling
interests | | | 9-30-2015
ThCh$ | | | 12-31-2014
ThCh$ | | | 9-30-2015
ThCh$ | | | 9-30-2014
ThCh$
(Unaudited) | |
Emgesa S.A. E.S.P. | | | 73.13 | % | | | 562,884,002 | | | | 536,351,255 | | | | 127,985,448 | | | | 170,495,899 | |
Generandes Perú S.A. | | | 39.00 | % | | | 125,361,913 | | | | 116,762,865 | | | | 14,510,877 | | | | 13,082,946 | |
Edegel S.A.A. | | | 16.40 | % | | | 93,268,432 | | | | 90,506,207 | | | | 11,253,304 | | | | 10,176,297 | |
Chinango S.A.C. | | | 20.00 | % | | | 14,759,060 | | | | 14,707,216 | | | | 2,279,936 | | | | 1,441,425 | |
Central Costanera S.A. | | | 24.32 | % | | | 6,979,685 | | | | 5,197,207 | | | | 1,540,474 | | | | (5,878,006 | ) |
Hidroeléctrica El Chocón S.A. | | | 32.33 | % | | | 31,960,302 | | | | 26,841,549 | | | | 4,005,714 | | | | 3,128,549 | |
Others | | | | | | | 2,347,825 | | | | 1,980,163 | | | | 286,681 | | | | 221,768 | |
| | | | | | | | | | | | | | | | | | | | |
TOTAL | | | | | | | 837,561,219 | | | | 792,346,462 | | | | 161,862,434 | | | | 192,668,878 | |
| | | | | | | | | | | | | | | | | | | | |
| 23. | REVENUE AND OTHER INCOME |
The detail of revenues presented in the statement of comprehensive income for the nine months ended September 30, 2015 and 2014 is as follows:
| | | | | | | | |
Revenues | | For the nine months ended | |
| | 9-30-2015
ThCh$ | | | 9-30-2014
ThCh$
(Unaudited) | |
Energy sales | | | 814,403,068 | | | | 870,119,373 | |
Generation | | | 814,403,068 | | | | 870,119,373 | |
Regulated customers | | | 132,340,812 | | | | 285,135,155 | |
Non-regulated customers | | | 486,406,776 | | | | 356,611,351 | |
Spot market sales | | | 166,885,922 | | | | 209,614,500 | |
Other customers | | | 28,769,558 | | | | 18,758,367 | |
Other sales | | | 4,941,357 | | | | — | |
Natural gas sales | | | 4,941,357 | | | | — | |
Revenue from other services | | | 47,716,766 | | | | 19,786,158 | |
Tolls and transmission | | | 15,417,369 | | | | 7,433,245 | |
Metering equipment leases | | | 53,125 | | | | 62,601 | |
Other services | | | 32,246,272 | | | | 12,290,312 | |
| | | | | | | | |
Total operating revenue | | | 867,061,191 | | | | 889,905,531 | |
| | | | | | | | |
| | | | | | | | |
Other Operating Income | | For the nine months ended | |
| | 9-30-2015
ThCh$ | | | 9-30-2014
ThCh$
(Unaudited) | |
Other revenue (*) | | | 38,857,158 | | | | 35,919,275 | |
| | | | | | | | |
Total other operating income | | | 38,857,158 | | | | 35,919,275 | |
| | | | | | | | |
| (*) | For the nine month period ended September 30, 2015, includes ThCh$36,938,241 (ThCh$24,608,169 for nine month period ended September 30, 2014) from availability agreements in effect starting in December 2012 between our subsidiary Central Costanera S.A. and CAMMESA. |
F-84
| 24. | RAW MATERIALS AND CONSUMABLES USED |
The detail of raw materials and consumables presented in profit or loss for the nine months ended September 30, 2015 and 2014 is as follows:
| | | | | | | | |
Raw Materials and Consumables | | For the nine months ended | |
| | 9-30-2015
ThCh$ | | | 9-30-2014
ThCh$
(Unaudited) | |
Energy purchases | | | (75,187,564 | ) | | | (81,247,670 | ) |
Fuel consumption | | | (90,406,491 | ) | | | (73,640,796 | ) |
Transportation costs | | | (77,180,289 | ) | | | (75,906,564 | ) |
Other raw materials and consumables | | | (41,058,446 | ) | | | (44,079,769 | ) |
| | | | | | | | |
Total | | | (283,832,790 | ) | | | (274,874,799 | ) |
| | | | | | | | |
| 25. | EMPLOYEE BENEFITS EXPENSE |
Employee expenses recognized in profit or loss for the nine months ended September 30, 2015 and 2014 are as follows:
| | | | | | | | |
Employee Benefits Expense | | For the nine months ended | |
| | 9-30-2015
ThCh$ | | | 9-30-2014
ThCh$
(Unaudited) | |
Wages and salaries | | | (48,691,440 | ) | | | (39,821,979 | ) |
Post-employment benefit obligations expense | | | (1,099,569 | ) | | | (671,191 | ) |
Social security and other contributions | | | (11,397,910 | ) | | | (9,610,081 | ) |
Other employee expenses | | | (531,331 | ) | | | (180,527 | ) |
| | | | | | | | |
Total | | | (61,720,250 | ) | | | (50,283,778 | ) |
| | | | | | | | |
| 26. | DEPRECIATION, AMORTIZATION AND IMPAIRMENT LOSSES |
The detail of depreciation, amortization and impairment losses recognized in profit or loss for the nine months ended September 30, 2015 and 2014 is as follows:
| | | | | | | | |
| | | For the nine months ended | |
| | | 9-30-2015
ThCh$ | | | 9-30-2014
ThCh$
(Unaudited) | |
Depreciation | | | (77,399,358 | ) | | | (73,043,230 | ) |
Amortization | | | (1,447,963 | ) | | | (1,879,944 | ) |
Total depreciation and amortization | | | (78,847,321 | ) | | | (74,923,174 | ) |
Reversal (losses) from impairment (*) | | | 113,041 | | | | (1,241,940 | ) |
| | | | | | | | |
Total depreciation and amortization and impairment losses | | | (78,734,280 | ) | | | (76,165,114 | ) |
| | | | | | | | |
| | | | | | | | |
(*) Impairment Losses | | For the nine months ended | |
| | 9-30-2015
ThCh$ | | | 9-30-2014
ThCh$
(Unaudited) | |
Impairment reversal (loss) on financial assets (see Note 7) | | | 144,840 | | | | (446,598 | ) |
Impairment reversal (loss) on property, plant and equipment (see Note 14) | | | (31,799 | ) | | | (795,342 | ) |
| | | | | | | | |
Total | | | 113,041 | | | | (1,241,940 | ) |
| | | | | | | | |
F-85
Other miscellaneous operating expenses for the nine months ended September 30, 2015 and 2014 are as follows:
| | | | | | | | |
Other Expenses | | For the nine months ended | |
| | 9-30-2015
ThCh$ | | | 9-30-2014
ThCh$
(Unaudited) | |
Professional, outsourced and other services | | | (8,818,002 | ) | | | (7,281,430 | ) |
Other supplies and services | | | (6,093,598 | ) | | | (4,865,539 | ) |
Insurance premiums | | | (13,966,655 | ) | | | (9,824,108 | ) |
Taxes and charges | | | (11,488,719 | ) | | | (5,334,667 | ) |
Repairs and maintenance | | | (7,539,165 | ) | | | (8,750,586 | ) |
Marketing, public relations and advertising | | | (195,306 | ) | | | (177,891 | ) |
Leases and rental costs | | | (1,012,910 | ) | | | (3,571,991 | ) |
Environmental expenses | | | (669,288 | ) | | | (650,026 | ) |
Other supplies | | | (1,900,262 | ) | | | (172,184 | ) |
Travel expenses | | | (323,010 | ) | | | (329,655 | ) |
Indemnities and fines | | | — | | | | (1,188,749 | ) |
| | | | | | | | |
Total | | | (52,006,915 | ) | | | (42,146,826 | ) |
| | | | | | | | |
Financial income and costs for the nine months ended September 30, 2015 and 2014 are as follows:
| | | | | | | | |
Financial Income | | For the nine months ended | |
| | 9-30-2015
ThCh$ | | | 9-30-2014
ThCh$
(Unaudited) | |
Term deposits and other fixed-income investments | | | 13,752,712 | | | | 8,833,968 | |
Other financial income | | | 310,400 | | | | 1,018,470 | |
| | | | | | | | |
Total | | | 14,063,112 | | | | 9,852,438 | |
| | | | | | | | |
| | | | | | | | |
Financial Costs | | For the nine months ended | |
| | 9-30-2015
ThCh$ | | | 9-30-2014
ThCh$
(Unaudited) | |
Financial costs | | | (57,693,259 | ) | | | (53,349,067 | ) |
Bank loans | | | (11,330,650 | ) | | | (12,628,926 | ) |
Secured and unsecured liabilities | | | (53,995,202 | ) | | | (57,675,984 | ) |
Valuation of financial derivatives | | | (198,459 | ) | | | (301,793 | ) |
Post-employment benefit obligations | | | (1,903,716 | ) | | | (1,718,603 | ) |
Capitalized borrowing costs | | | 34,164,179 | | | | 28,777,699 | |
Other financial costs | | | (24,429,411 | ) | | | (9,801,460 | ) |
Foreign currency exchange gains (losses), net (1) | | | 326,433 | | | | (24,482,024 | ) |
Positive | | | 22,831,209 | | | | 16,699,833 | |
Negative | | | (22,504,776 | ) | | | (41,181,857 | ) |
| | | | | | | | |
Total Financial Costs | | | (57,366,826 | ) | | | (77,831,091 | ) |
| | | | | | | | |
Total Financial Results | | | (43,303,714 | ) | | | (67,978,653 | ) |
| | | | | | | | |
F-86
The effects on financial results from exchange differences and the application of indexed assets and liabilities originated from the following:
| | | | | | | | |
(1) Foreign currency exchange gains (losses), net | | For the nine months ended | |
| | 9-30-2015
ThCh$ | | | 9-30-2014
ThCh$
(Unaudited) | |
Cash and cash equivalents | | | 1,035,306 | | | | 1,546,793 | |
Other financial assets (derivative instruments) | | | 17,606,931 | | | | 7,689,774 | |
Other non-financial assets | | | 203,447 | | | | 556,706 | |
Trade and other accounts receivable | | | 925,632 | | | | (449,848 | ) |
Other financial liabilities (financial debt and derivative instruments) | | | (10,123,675 | ) | | | (30,967,279 | ) |
Trade and other accounts payable | | | (8,620,600 | ) | | | (410,987 | ) |
Other non-financial liabilities | | | (700,608 | ) | | | (2,447,183 | ) |
| | | | | | | | |
Total | | | 326,433 | | | | (24,482,024 | ) |
| | | | | | | | |
The following table presents the components of the income tax expense/(benefit) recognized in the accompanying Combined Statement of Comprehensive Income for the nine months ended September 30, 2015 and 2014:
| | | | | | | | |
Current Income Tax and Adjustments to Current Income Tax for Previous
Periods | | For the nine months ended | |
| | 9-30-2015
ThCh$ | | | 9-30-2014
ThCh$
(Unaudited) | |
Current income tax | | | (159,197,139 | ) | | | (176,324,846 | ) |
Tax benefit arising from previously unrecognized tax credit of prior period used to reduce current tax expense | | | 11,525,445 | | | | 9,333,058 | |
Adjustments to current tax from the previous period | | | (1,165,383 | ) | | | (206,774 | ) |
Other current tax expense | | | (2,565,557 | ) | | | (11,274 | ) |
Current tax expense, net | | | (151,402,634 | ) | | | (167,209,836 | ) |
Expense from deferred taxes for origination and reversal of temporary differences | | | (16,879,738 | ) | | | (5,009,786 | ) |
Deferred tax adjustments from previous periods | | | 722,538 | | | | — | |
Total deferred tax expense | | | (16,157,200 | ) | | | (5,009,786 | ) |
| | | | | | | | |
Income tax expense | | | (167,559,834 | ) | | | (172,219,622 | ) |
| | | | | | | | |
F-87
The following table reconciles the computed income tax expense resulting from applying the applicable statutary tax rate to “Profit before taxes” and the actual income tax expense recognized in the accompanying Combined Statement of Comprehensive Income for the nine months ended September 30, 2015 and 2014:
| | | | | | | | | | | | | | | | |
Reconciliation of Tax Expense | | For the nine months ended | |
| | RATE
% | | | 9-30-2015
ThCh$ | | | RATE
% | | | 9-30-2014
ThCh$
(Unaudited) | |
PROFIT BEFORE TAX | | | | | | | 423,211,282 | | | | | | | | 457,969,087 | |
Income tax expense using statutory rate | | | (22.50 | %) | | | (95,222,539 | ) | | | (21.00 | %) | | | (96,173,509 | ) |
Tax effect of rates applied in other countries | | | (12.59 | %) | | | (53,285,866 | ) | | | (11.30 | %) | | | (51,772,351 | ) |
Tax effect of non-taxable revenues | | | 5.69 | % | | | 24,088,857 | | | | 3.82 | % | | | 17,504,212 | |
Tax effect of non-tax-deductible expenses | | | (2.88 | %) | | | (12,195,241 | ) | | | (4.48 | %) | | | (20,538,245 | ) |
Tax effect of adjustments to current taxes in previous periods | | | (0.28 | %) | | | (1,165,383 | ) | | | (0.05 | %) | | | (206,774 | ) |
Tax effect of adjustments to deferred taxes in previous periods | | | 0.17 | % | | | 722,538 | | | | | | | | — | |
Price level restatement for tax purposes (investments and equity) | | | (7.21 | %) | | | (30,502,200 | ) | | | (4.59 | %) | | | (21,032,956 | ) |
| | | | | | | | | | | | | | | | |
Total adjustments to tax expense using statutory rates | | | (17.09 | %) | | | (72,337,295 | ) | | | (16.61 | %) | | | (76,046,114 | ) |
| | | | | | | | | | | | | | | | |
Actual income tax expense | | | (39.59 | %) | | | (167,559,834 | ) | | | (37.61 | %) | | | (172,219,623 | ) |
| | | | | | | | | | | | | | | | |
The principal temporary differences are detailed in Note 15.a.
| 30. | GEOGRAPHIC INFORMATION |
Since Endesa Américas has not yet been established as a legal entity, no chief operating decision maker existed for this Combined Group. Consequently, the Combined Group does not yet have any operating segments as the term is defined under IFRS 8 Operating Segments. The following supplemental financial information of financial position, results of operations and cash flows by geographical location is provided to enhance the understanding the Combined Group. It is not intended to, and does not, present operating segment information in accordance with IFRS 8.
The supplemental financial information has been organized by the geographical areas in which the Combined Group operates:
The accounting policies used to determine the supplement georgaphic information are the same as those used in the preparation of the Combined Group’s combined financial statements.
F-88
The following tables present the supplemental financial information.
| | | | | | | | | | | | | | | | | | | | | | | | | | | | | | | | | | | | | | | | | | | | | | | | |
Country | | Chile | | | Argentina | | | Colombia | | | Peru | | | Eliminations | | | Total | |
ASSETS | | 9-30-2015 | | | 12-31-2014 | | | 9-30-2015 | | | 12-31-2014 | | | 9-30-2015 | | | 12-31-2014 | | | 9-30-2015 | | | 12-31-2014 | | | 9-30-2015 | | | 12-31-2014 | | | 9-30-2015 | | | 12-31-2014 | |
| | ThCh$ | | | ThCh$ | | | ThCh$ | | | ThCh$ | | | ThCh$ | | | ThCh$ | | | ThCh$ | | | ThCh$ | | | ThCh$ | | | ThCh$ | | | ThCh$ | | | ThCh$ | |
CURRENT ASSETS | | | 64,258,394 | | | | 96,302,445 | | | | 87,515,521 | | | | 56,079,003 | | | | 228,628,778 | | | | 329,704,908 | | | | 116,342,382 | | | | 121,446,536 | | | | (40,707,228 | ) | | | (77,660,917 | ) | | | 456,037,847 | | | | 525,871,975 | |
Cash and cash equivalents | | | 595,116 | | | | 12,441,019 | | | | 13,196,025 | | | | 13,044,779 | | | | 128,514,786 | | | | 224,564,345 | | | | 25,643,679 | | | | 48,392,087 | | | | — | | | | — | | | | 167,949,606 | | | | 298,442,230 | |
Other current financial assets | | | 9,706,857 | | | | 2,924,888 | | | | — | | | | — | | | | 3,079,033 | | | | 20,460,311 | | | | — | | | | — | | | | — | | | | — | | | | 12,785,890 | | | | 23,385,199 | |
Other current non-financial assets | | | 48 | | | | — | | | | 4,943,219 | | | | 1,436,607 | | | | 3,030,306 | | | | 9,272,519 | | | | 10,250,815 | | | | 19,564,358 | | | | — | | | | — | | | | 18,224,388 | | | | 30,273,484 | |
Trade and other current receivables, net | | | 7,783 | | | | 32,544 | | | | 57,222,360 | | | | 31,777,379 | | | | 80,620,775 | | | | 53,822,823 | | | | 56,877,157 | | | | 30,523,540 | | | | 31,552 | | | | 32 | | | | 194,759,627 | | | | 116,156,318 | |
Current accounts receivable from related parties | | | 53,948,590 | | | | 80,903,994 | | | | 8,974,240 | | | | 7,651,647 | | | | 6,375,715 | | | | 7,818,044 | | | | 10,002,540 | | | | 7,413,257 | | | | (40,738,780 | ) | | | (77,660,949 | ) | | | 38,562,305 | | | | 26,125,993 | |
Inventories | | | �� | | | | — | | | | 3,132,006 | | | | 2,121,378 | | | | 7,001,099 | | | | 12,342,664 | | | | 13,503,292 | | | | 14,435,895 | | | | — | | | | — | | | | 23,636,397 | | | | 28,899,937 | |
Current income tax receivables | | | — | | | | — | | | | 47,671 | | | | 47,213 | | | | 7,064 | | | | 1,424,202 | | | | 64,899 | | | | 1,117,399 | | | | — | | | | — | | | | 119,634 | | | | 2,588,814 | |
NON-CURRENT ASSETS | | | 1,075,156,399 | | | | 1,075,119,472 | | | | 312,472,283 | | | | 297,803,641 | | | | 1,805,943,214 | | | | 1,787,224,363 | | | | 836,426,783 | | | | 816,077,567 | | | | (594,006,585 | ) | | | (499,379,977 | ) | | | 3,435,992,094 | | | | 3,476,845,066 | |
Other non-current financial assets | | | — | | | | — | | | | — | | | | 29,855 | | | | 624,898 | | | | 1,170,931 | | | | 5,396 | | | | 16,167 | | | | — | | | | — | | | | 630,294 | | | | 1,216,953 | |
Other non-current non-financial assets | | | — | | | | — | | | | 2,915,019 | | | | 1,255,693 | | | | 996,739 | | | | 1,075,811 | | | | — | | | | — | | | | — | | | | — | | | | 3,911,758 | | | | 2,331,504 | |
Trade and other non-current receivables, net | | | — | | | | — | | | | 117,934,239 | | | | 139,038,803 | | | | 1,857,803 | | | | 2,177,709 | | | | — | | | | — | | | | — | | | | — | | | | 119,792,042 | | | | 141,216,512 | |
Investments accounted for using the equity method | | | 1,075,104,160 | | | | 1,075,079,502 | | | | 2,723,783 | | | | 2,732,534 | | | | — | | | | — | | | | 38,475,197 | | | | 48,358,846 | | | | (687,892,350 | ) | | | (585,314,821 | ) | | | 428,410,790 | | | | 540,856,061 | |
Intangible assets other than goodwill | | | — | | | | — | | | | — | | | | — | | | | 20,574,588 | | | | 22,960,562 | | | | 10,919,555 | | | | 10,639,358 | | | | — | | | | — | | | | 31,494,143 | | | | 33,599,920 | |
Goodwill | | | — | | | | — | | | | 1,450,321 | | | | 1,401,472 | | | | 4,322,509 | | | | 4,886,065 | | | | 6,511,086 | | | | 8,527,161 | | | | 93,885,765 | | | | 85,934,844 | | | | 106,169,681 | | | | 100,749,542 | |
Property, plant and equipment | | | — | | | | — | | | | 187,380,607 | | | | 153,233,565 | | | | 1,756,706,611 | | | | 1,707,545,357 | | | | 780,515,549 | | | | 748,536,035 | | | | — | | | | — | | | | 2,724,602,767 | | | | 2,609,314,957 | |
Deferred income tax assets | | | 52,239 | | | | 39,970 | | | | 68,314 | | | | 111,719 | | | | 20,860,066 | | | | 47,407,928 | | | | — | | | | — | | | | — | | | | — | | | | 20,980,619 | | | | 47,559,617 | |
| | | | | | | | | | | | | | | | | | | | | | | | | | | | | | | | | | | | | | | | | | | | | | | | |
TOTAL ASSETS | | | 1,139,414,793 | | | | 1,171,421,917 | | | | 399,987,804 | | | | 353,882,644 | | | | 2,034,571,992 | | | | 2,116,929,271 | | | | 952,769,165 | | | | 937,524,103 | | | | (634,713,813 | ) | | | (577,040,894 | ) | | | 3,892,029,941 | | | | 4,002,717,041 | |
| | | | | | | | | | | | | | | | | | | | | | | | | | | | | | | | | | | | | | | | | | | | | | | | |
F-89
| | | | | | | | | | | | | | | | | | | | | | | | | | | | | | | | | | | | | | | | | | | | | | | | |
Country | | Chile | | | Argentina | | | Colombia | | | Peru | | | Eliminations | | | Total | |
LIABILITIES AND EQUITY | | 9-30-2015 | | | 12-31-2014 | | | 9-30-2015 | | | 12-31-2014 | | | 9-30-2015 | | | 12-31-2014 | | | 9-30-2015 | | | 12-31-2014 | | | 9-30-2015 | | | 12-31-2014 | | | 9-30-2015 | | | 12-31-2014 | |
| | ThCh$ | | | ThCh$ | | | ThCh$ | | | ThCh$ | | | ThCh$ | | | ThCh$ | | | ThCh$ | | | ThCh$ | | | ThCh$ | | | ThCh$ | | | ThCh$ | | | ThCh$ | |
CURRENT LIABILITIES | | | 572,727 | | | | 66,254,194 | | | | 171,500,459 | | | | 140,463,117 | | | | 454,385,377 | | | | 500,427,460 | | | | 115,919,238 | | | | 95,676,184 | | | | (40,707,227 | ) | | | (77,660,949 | ) | | | 701,670,574 | | | | 725,160,006 | |
Other current financial liabilities | | | 390,851 | | | | — | | | | 37,366,767 | | | | 29,204,543 | | | | 165,276,971 | | | | 90,868,809 | | | | 53,024,264 | | | | 24,321,508 | | | | — | | | | — | | | | 256,058,853 | | | | 144,394,860 | |
Trade and other current payables | | | 2,680 | | | | 26,431,188 | | | | 91,058,260 | | | | 80,964,391 | | | | 101,625,847 | | | | 194,459,886 | | | | 48,179,051 | | | | 57,377,029 | | | | 260,550 | | | | 388,357 | | | | 241,126,388 | | | | 359,620,851 | |
Current accounts payable to related parties | | | 38,337 | | | | 39,677,940 | | | | 15,285,861 | | | | 13,946,683 | | | | 62,402,109 | | | | 131,257,351 | | | | 6,708,082 | | | | 6,228,108 | | | | (40,967,777 | ) | | | (78,049,306 | ) | | | 43,466,612 | | | | 113,060,776 | |
Provisions | | | — | | | | — | | | | 2,902,279 | | | | 666,299 | | | | 102,978,797 | | | | 24,071,622 | | | | 3,221,307 | | | | 2,681,490 | | | | — | | | | — | | | | 109,102,383 | | | | 27,419,411 | |
Current income tax liabilities | | | — | | | | — | | | | 12,916,710 | | | | 6,819,509 | | | | 17,617,347 | | | | 55,331,792 | | | | 172,745 | | | | 760,776 | | | | — | | | | — | | | | 30,706,802 | | | | 62,912,077 | |
Other current non-financial liabilities | | | 140,859 | | | | 145,066 | | | | 11,970,582 | | | | 8,861,692 | | | | 4,484,306 | | | | 4,438,000 | | | | 4,613,789 | | | | 4,307,273 | | | | — | | | | — | | | | 21,209,536 | | | | 17,752,031 | |
NON-CURRENT LIABILITIES | | | 283,116 | | | | 345,751 | | | | 94,618,915 | | | | 101,749,459 | | | | 810,442,545 | | | | 883,041,284 | | | | 240,238,943 | | | | 275,049,420 | | | | — | | | | 315,064 | | | | 1,145,583,519 | | | | 1,260,500,978 | |
Other non-current financial liabilities | | | — | | | | — | | | | 44,483,791 | | | | 44,052,205 | | | | 763,449,190 | | | | 862,784,448 | | | | 79,294,723 | | | | 140,731,046 | | | | — | | | | — | | | | 887,227,704 | | | | 1,047,567,699 | |
Other non-current provisions | | | — | | | | — | | | | — | | | | — | | | | 30,176,786 | | | | 465,509 | | | | 3,567,719 | | | | 3,226,928 | | | | — | | | | — | | | | 33,744,505 | | | | 3,692,437 | |
Deferred income tax liabilities | | | — | | | | — | | | | 23,753,960 | | | | 27,977,026 | | | | — | | | | — | | | | 137,022,572 | | | | 130,297,810 | | | | — | | | | — | | | | 160,776,532 | | | | 158,274,836 | |
Non-current provisions for employee benefits | | | 283,116 | | | | 345,181 | | | | 4,630,240 | | | | 3,994,647 | | | | 16,816,569 | | | | 19,791,327 | | | | 782,918 | | | | 793,636 | | | | — | | | | — | | | | 22,512,843 | | | | 24,924,791 | |
Other non-current non-financial liabilities | | | — | | | | 570 | | | | 21,750,924 | | | | 25,725,581 | | | | — | | | | — | | | | 19,571,011 | | | | — | | | | — | | | | 315,064 | | | | 41,321,935 | | | | 26,041,215 | |
EQUITY | | | 1,138,558,950 | | | | 1,104,821,972 | | | | 133,868,430 | | | | 111,670,068 | | | | 769,744,070 | | | | 733,460,527 | | | | 596,610,984 | | | | 566,798,499 | | | | (594,006,586 | ) | | | (499,695,009 | ) | | | 2,044,775,848 | | | | 2,017,056,057 | |
Equity attributable to the Parent Company | | | 1,138,558,950 | | | | 1,104,821,972 | | | | 133,868,430 | | | | 111,670,068 | | | | 769,744,070 | | | | 733,460,527 | | | | 596,610,984 | | | | 566,798,499 | | | | (594,006,586 | ) | | | (499,695,009 | ) | | | 1,207,214,629 | | | | 1,224,709,595 | |
Allocated capital | | | 780,568,219 | | | | 758,944,075 | | | | 51,894,930 | | | | 50,147,052 | | | | 147,764,606 | | | | 167,029,702 | | | | 214,385,285 | | | | 201,338,557 | | | | (295,179,211 | ) | | | (278,025,557 | ) | | | 899,433,829 | | | | 899,433,829 | |
Retained earnings | | | 577,839,792 | | | | 512,170,634 | | | | 22,390,156 | | | | 14,567,871 | | | | 181,099,737 | | | | 110,289,985 | | | | 99,753,262 | | | | 130,039,328 | | | | 369,514,930 | | | | 409,042,471 | | | | 1,250,597,877 | | | | 1,176,110,289 | |
Other reserves, including | | | (219,849,061 | ) | | | (166,292,737 | ) | | | 59,583,344 | | | | 46,955,145 | | | | 440,879,727 | | | | 456,140,840 | | | | 282,472,437 | | | | 235,420,614 | | | | (668,342,305 | ) | | | (630,711,923 | ) | | | (942,817,077 | ) | | | (850,834,523 | ) |
Non-controlling interests | | | | | | | | | | | | | | | | | | | | | | | | | | | | | | | | | | | | | | | | | | | 837,561,219 | | | | 792,346,462 | |
| | | | | | | | | | | | | | | | | | | | | | | | | | | | | | | | | | | | | | | | | | | | | | | | |
TOTAL LIABILITIES AND EQUITY | | | 1,139,414,793 | | | | 1,171,421,917 | | | | 399,987,804 | | | | 353,882,644 | | | | 2,034,571,992 | | | | 2,116,929,271 | | | | 952,769,165 | | | | 937,524,103 | | | | (634,713,813 | ) | | | (577,040,894 | ) | | | 3,892,029,941 | | | | 4,002,717,041 | |
| | | | | | | | | | | | | | | | | | | | | | | | | | | | | | | | | | | | | | | | | | | | | | | | |
The eliminations column corresponds to transactions between companies in different lines of business and country, primarily purchases and sales of energy and services.
F-90
| | | | | | | | | | | | | | | | | | | | | | | | | | | | | | | | | | | | | | | | | | | | | | | | |
Country | | Chile | | | Argentina | | | Colombia | | | Peru | | | Eliminations | | | Total | |
STATEMENTS OF COMPREHENSIVE
INCOME | | 9-30-2015 | | | 9-30-2014 | | | 9-30-2015 | | | 9-30-2014 | | | 9-30-2015 | | | 9-30-2014 | | | 9-30-2015 | | | 9-30-2014 | | | 9-30-2015 | | | 9-30-2014 | | | 9-30-2015 | | | 9-30-2014 | |
| | ThCh$ | | | ThCh$ | | | ThCh$ | | | ThCh$ | | | ThCh$ | | | ThCh$ | | | ThCh$ | | | ThCh$ | | | ThCh$ | | | ThCh$ | | | ThCh$ | | | ThCh$ | |
REVENUES AND OTHER OPERATING INCOME | | | 2,848,293 | | | | 3,012,497 | | | | 102,315,860 | | | | 76,759,414 | | | | 525,171,889 | | | | 588,367,745 | | | | 276,760,968 | | | | 257,949,831 | | | | (1,178,661 | ) | | | (264,681 | ) | | | 905,918,349 | | | | 925,824,806 | |
Revenue from ordinary activities | | | 2,848,293 | | | | 3,012,497 | | | | 65,455,203 | | | | 48,831,734 | | | | 523,974,162 | | | | 586,850,188 | | | | 275,962,194 | | | | 251,475,793 | | | | (1,178,661 | ) | | | (264,681 | ) | | | 867,061,191 | | | | 889,905,531 | |
Energy sales | | | — | | | | — | | | | 65,225,341 | | | | 41,416,703 | | | | 518,967,380 | | | | 586,438,386 | | | | 230,210,347 | | | | 242,264,284 | | | | — | | | | — | | | | 814,403,068 | | | | 870,119,373 | |
Other sales | | | — | | | | — | | | | — | | | | — | | | | 4,941,357 | | | | — | | | | — | | | | — | | | | — | | | | — | | | | 4,941,357 | | | | — | |
Other services rendered | | | 2,848,293 | | | | 3,012,497 | | | | 229,862 | | | | 7,415,031 | | | | 65,425 | | | | 411,802 | | | | 45,751,847 | | | | 9,211,509 | | | | (1,178,661 | ) | | | (264,681 | ) | | | 47,716,766 | | | | 19,786,158 | |
Other operating revenue | | | — | | | | — | | | | 36,860,657 | | | | 27,927,680 | | | | 1,197,727 | | | | 1,517,557 | | | | 798,774 | | | | 6,474,038 | | | | — | | | | — | | | | 38,857,158 | | | | 35,919,275 | |
RAW MATERIALS AND CONSUMABLES | | | — | | | | — | | | | (9,127,051 | ) | | | (11,131,539 | ) | | | (165,121,364 | ) | | | (164,120,970 | ) | | | (109,584,375 | ) | | | (99,622,290 | ) | | | — | | | | — | | | | (283,832,790 | ) | | | (274,874,799 | ) |
Energy purchases | | | — | | | | — | | | | (1,067,280 | ) | | | (4,106,247 | ) | | | (61,439,525 | ) | | | (65,311,529 | ) | | | (12,680,759 | ) | | | (11,829,894 | ) | | | — | | | | — | | | | (75,187,564 | ) | | | (81,247,670 | ) |
Fuel consumption | | | — | | | | — | | | | (1,409,918 | ) | | | — | | | | (32,941,562 | ) | | | (23,949,234 | ) | | | (56,055,011 | ) | | | (49,691,562 | ) | | | — | | | | — | | | | (90,406,491 | ) | | | (73,640,796 | ) |
Transportation expenses | | | — | | | | — | | | | (1,280,567 | ) | | | (2,156,356 | ) | | | (48,363,228 | ) | | | (51,593,024 | ) | | | (27,536,494 | ) | | | (22,157,184 | ) | | | — | | | | — | | | | (77,180,289 | ) | | | (75,906,564 | ) |
Other miscellaneous supplies and services | | | — | | | | — | | | | (5,369,286 | ) | | | (4,868,936 | ) | | | (22,377,049 | ) | | | (23,267,183 | ) | | | (13,312,111 | ) | | | (15,943,650 | ) | | | — | | | | — | | | | (41,058,446 | ) | | | (44,079,769 | ) |
CONTRIBUTION MARGIN | | | 2,848,293 | | | | 3,012,497 | | | | 93,188,809 | | | | 65,627,875 | | | | 360,050,525 | | | | 424,246,775 | | | | 167,176,593 | | | | 158,327,541 | | | | (1,178,661 | ) | | | (264,681 | ) | | | 622,085,559 | | | | 650,950,007 | |
Other work performed by the entity and capitalized | | | — | | | | — | | | | 2,552,876 | | | | 3,737,580 | | | | 4,137,329 | | | | 4,375,116 | | | | 269,538 | | | | 299,402 | | | | 725,068 | | | | — | | | | 7,684,811 | | | | 8,412,098 | |
Employee benefits expense | | | (307,043 | ) | | | (301,793 | ) | | | (35,367,685 | ) | | | (24,084,368 | ) | | | (14,433,443 | ) | | | (14,806,213 | ) | | | (11,612,079 | ) | | | (11,091,404 | ) | | | — | | | | — | | | | (61,720,250 | ) | | | (50,283,778 | ) |
Other expenses | | | (816,528 | ) | | | (247,659 | ) | | | (11,461,384 | ) | | | (10,244,882 | ) | | | (23,337,866 | ) | | | (17,143,747 | ) | | | (16,844,730 | ) | | | (14,775,219 | ) | | | 453,593 | | | | 264,681 | | | | (52,006,915 | ) | | | (42,146,826 | ) |
GROSS OPERATING RESULT | | | 1,724,722 | | | | 2,463,045 | | | | 48,912,616 | | | | 35,036,205 | | | | 326,416,545 | | | | 396,671,931 | | | | 138,989,322 | | | | 132,760,320 | | | | — | | | | — | | | | 516,043,205 | | | | 566,931,501 | |
Depreciation and amortization expense | | | — | | | | — | | | | (17,376,178 | ) | | | (13,196,198 | ) | | | (27,100,609 | ) | | | (30,606,505 | ) | | | (34,370,534 | ) | | | (31,120,471 | ) | | | — | | | | — | | | | (78,847,321 | ) | | | (74,923,174 | ) |
Impairment losses (reversal of impairment losses) recognized in profit or loss | | | — | | | | — | | | | — | | | | (81,597 | ) | | | 144,840 | | | | (365,001 | ) | | | (31,799 | ) | | | (795,342 | ) | | | — | | | | — | | | | 113,041 | | | | (1,241,940 | ) |
NET OPERATING INCOME | | | 1,724,722 | | | | 2,463,045 | | | | 31,536,438 | | | | 21,758,410 | | | | 299,460,776 | | | | 365,700,425 | | | | 104,586,989 | | | | 100,844,507 | | | | — | | | | — | | | | 437,308,925 | | | | 490,766,387 | |
FINANCIAL RESULT | | | 2,784,356 | | | | (854,754 | ) | | | (14,546,243 | ) | | | (31,963,374 | ) | | | (23,178,990 | ) | | | (25,926,253 | ) | | | (8,362,837 | ) | | | (5,187,899 | ) | | | — | | | | (4,046,373 | ) | | | (43,303,714 | ) | | | (67,978,653 | ) |
Financial income | | | 48,327 | | | | 436,758 | | | | 11,418,071 | | | | 1,283,014 | | | | 2,169,443 | | | | 7,737,733 | | | | 427,271 | | | | 394,933 | | | | — | | | | — | | | | 14,063,112 | | | | 9,852,438 | |
Financial costs | | | (1,484,075 | ) | | | (1,861,245 | ) | | | (23,988,717 | ) | | | (12,771,549 | ) | | | (26,054,607 | ) | | | (33,653,718 | ) | | | (6,165,860 | ) | | | (5,062,555 | ) | | | — | | | | — | | | | (57,693,259 | ) | | | (53,349,067 | ) |
Foreign currency exchange gains (losses), net | | | 4,220,104 | | | | 569,733 | | | | (1,975,597 | ) | | | (20,474,839 | ) | | | 706,174 | | | | (10,268 | ) | | | (2,624,248 | ) | | | (520,277 | ) | | | — | | | | (4,046,373 | ) | | | 326,433 | | | | (24,482,024 | ) |
Positive | | | 16,349,248 | | | | 6,836,224 | | | | 5,053,607 | | | | 13,215,099 | | | | 1,428,221 | | | | 707,811 | | | | 108 | | | | 590 | | | | 25 | | | | (4,059,891 | ) | | | 22,831,209 | | | | 16,699,833 | |
Negative | | | (12,129,144 | ) | | | (6,266,491 | ) | | | (7,029,204 | ) | | | (33,689,938 | ) | | | (722,047 | ) | | | (718,079 | ) | | | (2,624,356 | ) | | | (520,867 | ) | | | (25 | ) | | | 13,518 | | | | (22,504,776 | ) | | | (41,181,857 | ) |
Share of profit of investments accounted for using the equity method | | | 25,317,907 | | | | 30,864,678 | | | | 967,265 | | | | (59,633 | ) | | | — | | | | — | | | | 2,882,867 | | | | 3,638,345 | | | | — | | | | — | | | | 29,168,039 | | | | 34,443,390 | |
Other gains, net | | | — | | | | — | | | | 14,349 | | | | 673,343 | | | | 6,419 | | | | 53,062 | | | | 17,264 | | | | 11,558 | | | | — | | | | — | | | | 38,032 | | | | 737,963 | |
Gain (loss) from other investments | | | — | | | | — | | | | — | | | | 668,116 | | | | — | | | | — | | | | — | | | | — | | | | — | | | | — | | | | — | | | | 668,116 | |
Gain (loss) from the sale of assets | | | — | | | | — | | | | 14,349 | | | | 5,227 | | | | 6,419 | | | | 53,062 | | | | 17,264 | | | | 11,558 | | | | — | | | | — | | | | 38,032 | | | | 69,847 | |
Income before tax | | | 29,826,985 | | | | 32,472,969 | | | | 17,971,809 | | | | (9,591,254 | ) | | | 276,288,205 | | | | 339,827,234 | | | | 99,124,283 | | | | 99,306,511 | | | | — | | | | (4,046,373 | ) | | | 423,211,282 | | | | 457,969,087 | |
Income tax | | | (37,656,325 | ) | | | (24,917,282 | ) | | | (418,522 | ) | | | (4,722,242 | ) | | | (101,267,986 | ) | | | (106,673,929 | ) | | | (28,217,001 | ) | | | (35,906,169 | ) | | | — | | | | — | | | | (167,559,834 | ) | | | (172,219,622 | ) |
NET PROFIT (LOSS) | | | (7,829,340 | ) | | | 7,555,687 | | | | 17,553,287 | | | | (14,313,496 | ) | | | 175,020,219 | | | | 233,153,305 | | | | 70,907,282 | | | | 63,400,342 | | | | — | | | | (4,046,373 | ) | | | 255,651,448 | | | | 285,749,465 | |
Net profit attributable to: | | | | | | | | | | | | | | | | | | | | | | | | | | | | | | | | | | | | | | | | | | | | | | | | |
Parent Company | | | | | | | | | | | | | | | | | | | | | | | | | | | | | | | | | | | | | | | | | | | 93,789,014 | | | | 93,080,587 | |
Non-controlling interests | | | | | | | | | | | | | | | | | | | | | | | | | | | | | | | | | | | | | | | | | | | 161,862,434 | | | | 192,668,878 | |
F-91
| | | | | | | | | | | | | | | | | | | | | | | | | | | | | | | | | | | | | | | | | | | | | | | | |
Country | | Chile | | | Argentina | | | Colombia | | | Peru | | | Eliminations | | | Totals | |
STATEMENTS OF CASH FLOW | | 9-30-2015 | | | 9-30-2014 | | | 9-30-2015 | | | 9-30-2014 | | | 9-30-2015 | | | 9-30-2014 | | | 9-30-2015 | | | 9-30-2014 | | | 9-30-2015 | | | 9-30-2014 | | | 9-30-2015 | | | 9-30-2014 | |
| | ThCh$ | | | ThCh$ | | | ThCh$ | | | ThCh$ | | | ThCh$ | | | ThCh$ | | | ThCh$ | | | ThCh$ | | | ThCh$ | | | ThCh$ | | | ThCh$ | | | ThCh$ | |
Cash flow from (used in) operating activities | | | 1,244,480 | | | | (377,134 | ) | | | 44,161,882 | | | | 44,149,671 | | | | 174,995,673 | | | | 266,851,440 | | | | 117,088,321 | | | | 87,812,535 | | | | (2,086,763 | ) | | | 388,659 | | | | 335,403,593 | | | | 398,825,171 | |
Cash flow from (used in) investment activities | | | 80,269,064 | | | | 124,362,425 | | | | (35,309,450 | ) | | | (26,003,109 | ) | | | (124,895,746 | ) | | | (140,081,700 | ) | | | (29,492,015 | ) | | | (27,051,717 | ) | | | (77,044,005 | ) | | | (82,998,481 | ) | | | (186,472,152 | ) | | | (151,772,582 | ) |
Cash flows from (used in) financing activities | | | (94,048,324 | ) | | | (144,103,218 | ) | | | (8,972,083 | ) | | | (12,344,178 | ) | | | (145,739,083 | ) | | | (81,576,337 | ) | | | (111,873,251 | ) | | | (74,963,325 | ) | | | 79,130,768 | | | | 82,609,822 | | | | (281,501,973 | ) | | | (230,377,236 | ) |
The eliminations column corresponds to transactions between companies in different lines of business and country, primarily purchases and sales of energy and services.
| 31. | THIRD PARTY GUARANTEES, OTHER CONTINGENT ASSETS AND LIABILITIES, AND OTHER COMMITMENTS |
| | | | | | | | | | | | | | | | | | | | | | | | | | | | | | | | | | | | | | | | | | | | | | | | | | | | | | | | | | | | |
Creditor of Guarantee | | Debtor | | | Type of
guarantee | | | Assets Committed | | | Balance Pending as of | | | Guarantees Released | |
| | | | Type | | | Currency | | | Book
Value | | | |
| | Company | | | Relationship | | | | | | | Currency | | | 9-30-15 | | | 12-31-14 | | | 2015 | | | Assets | | | 2016 | | | Assets | | | 2017 | | | Assets | |
Mitsubishi Corporation | |
| Central
Costanera
S.A. |
| | | Creditor | | | | Pledge | | |
| Combined
cycle |
| | ThCh$ | | | | | 15,228,584 | | | ThCh$ | | | | | 35,385,098 | | | | 73,177,119 | | | | — | | | | — | | | | — | | | | — | | | | — | | | | — | |
Credit Suisse First Boston | |
| Central
Costanera
S.A. |
| | | Creditor | | | | Pledge | | |
| Combined
cycle |
| | ThCh$ | | | | | 4,389,759 | | | ThCh$ | | | | | 2,329,066 | | | | 3,033,750 | | | | — | | | | — | | | | — | | | | — | | | | — | | | | — | |
Citibank N.A. | |
| Endesa
Argentina
S.A. |
| | | Creditor | | | | Pledge | | |
| Cash
deposit |
| | ThCh$ | | | | | 593,267 | | | ThCh$ | | | | | 593,267 | | | | 702,470 | | | | — | | | | — | | | | — | | | | — | | | | — | | | | — | |
As of September 30, 2015 and December 31, 2014, the amount of the Combined Group’s property, plant and equipment pledged as collateral for liabilities amounted to ThCh$ 19,618,343 and ThCh$ 21,952,283, respectively.
As of September 30, 2015 and December 31, 2014, the Combined Group had future energy purchase commitments totaled ThCh$ 10,566,875 and ThCh$27,059,338, respectively.
As of September 30, 2015 and December 31, 2014 the Combined Group did not have indirect guarantees.
| 31.3 | Litigation and arbitration |
As of the date of these Combined Financial Statements, the most relevant contingent liabilities involving the Combined Group, for which no provisions have been recognized because management believes that a present obligation does not exists, are as follows:
F-92
| a) | Pending lawsuits of combined entities |
Empresa Generadora de Energía Eléctrica S.A. (Emgesa)
| 1. | In 2001, a lawsuit was filed against Emgesa, as well as the non-related companies, Empresa de Energía de Bogotá S.A. E.S.P. (EEB) and Corporación Autónoma Regional de Cundinamarca (CAR), by the residents of Sibaté, in the Colombian Department of Cundinamarca. This lawsuit seeks to hold the defendants jointly liable for the damages and prejudices derived from the pollution to the El Muñá dam reservoir, resulting from the pumping of polluted waters from the Bogotá River by Emgesa. Emgesa has denied these allegations arguing, among others, that it does not have any responsibility since it receives the waters already contaminated. The plaintiffs’ initial demand was for approximately CPs 3,000 billion (approximately ThCh$ 672,000,000). Emgesa filed a motion for the joinder of numerous public and private entities that dump into the waters of the Bogotá River or that in any way are responsible for the environmental stewardship of the river basin. The Third Section of the State Council has received the petition and ordered certain companies joined as defendants. In January 2013, several of the defendants filed responses to the complaint. In June 2013, a motion to annul the proceedings was denied. The resolving preliminary objections and the summons to a conciliation hearing are currently pending. In June 2015 a resolution was enacted instructing the dismissal of EEB by reason of a nullity defect, as well as the exclusion of those entities that had been identified by the Cundinamarca Administrative Court as defendants for having polluted the waters of Bogotá River, which had been confirmed by the State Council. A motion for reversal was filed against this decision, or an appeal. The resolution of such actions is pending. |
| 2. | A class action lawsuit has been filed by residents of the Colombian Municipality of Garzón, alleging that the construction of the El Quimbo hydroelectric project has caused the plaintiffs’ income from handicrafts or entrepreneurial activities to decrease by an average of 30%. The lawsuit claims the decrease was not considered when the project’s social-economic impact report was drafted. Emgesa has denied these allegations on the basis that (i) the social-economic impact report complied with all methodological criteria, including giving all interested parties the opportunity to be registered in the report, (ii) the plaintiffs are not residents and therefore, compensation is allowed only for those whose revenues are, in their majority, coming from of their activity in the direct area of influence of the El Quimbo hydroelectric project and (iii) compensation must not go beyond the “first link” of the production chain and must be based on the status of the income indicators of each affected person. A proceeding was filed in parallel by 38 inhabitants of the Municipality of Garzón, who are claiming compensation for being affected by the El Quimbo hydroelectric project since they were not included in the social-economic impact report. A mandatory settlement hearing was unsuccessful. The court ordered a test, which is currently in the preliminary phase. In the parallel proceeding, an exception previous of pending lawsuit was filed, based on the existence of the principal proceeding. The proposed exception is pending ruling. The amount involved in this proceeding is estimated to be approximately CPs 93 billion (approximately ThCh$20,832,000). |
| 3. | Corporación Autónoma Regional de Cudinamarca (CAR) in Colombia, through Resolution 506, enacted on March 28, 2005 and Resolution 1189, enacted on July 8, 2005, imposed on Emgesa, EEB and Empresa de Acueducto y Alcantarillado de Bogotá (EAAB) the execution of construction work on the El Muña dam reservoir, whose effectiveness, among others things, depends on maintaining Emgesa’s water concession. Emgesa filed an action for annulment and reestablishment of Law against these resolutions before the Administrative Court of Law of Cundinamarca, Section One. The first instance court denied the nullity of the above-mentioned resolutions. Appeals were filed by Emgesa, EEB and EAAB, which are pending a decision. The amount at issue is undetermined. |
| 4. | In February 2015, Emgesa was notified of a Popular Action filed by Comepez S.A. and other fish farming companies located near the Betania dam, on the grounds of protection of the right to a healthy environment, public health and food safety in order to prevent, in the opinion of the plaintiffs, the danger of a massive fish mortality among other damages from the filling of the reservoir for the El Quimbo Hydroelectric Project dam, also located at the basin of the Magdalena river. Regarding the status of the proceeding, the Huila administrative court issued in February 2015 a preliminary injuction that prevents the filling of the El Quimbo dam reservoir until the river has reached the optimal flow, among other requirements. Emgesa filed |
F-93
| | a motion for reversal against this decision requesting a probation order and the release of such measure, which motion was dismissed by the court. The appeal filed by Emgesa was granted only in the remand effect. The preliminary injuction was amended, allowing Emgesa to start filling the dam reservoir. Nevertheless the Regional Environmental Authority (CAM) in Resolution 1503 issued on July 3, 2015 directed Emgesa to temporarily stop filling the El Quimbo dam reservoir. The legal actions to be adopted are under analysis by Emgesa, notwithstanding the filling procedure continues normally. The appeal is pending. The Colombian government, through Decree 1979 has requested the lifting of the generation suspension and reported that Emgesa must abide by such Decree. The amount of this proceeding is undetermined. |
Edegel S.A.A. (Edegel)
| 1. | The fiscal authority in Peru, SUNAT, questioned Edegel in 2001 regarding the manner in which it was accounting for the valuation of its depreciating assets. Edegel had conducted a voluntary reevaluation for the 1996 fiscal year, and as a result of such reevaluation it recorded a reduction of goodwill with respect to assets. This depreciation was recorded as an expense. The amount rejected by SUNAT is related to financial interest paid during the construction phase of the power plants. SUNAT claims (i) that Edegel has not demonstrated that it was necessary to obtain financing to build the power plants and (ii) that such financing was actually incurred. Edegel has responded that SUNAT cannot request such evidence because the reevaluation assigns the assets a market value when the reevaluation was performed, instead of the historical value of the assets. In this case, the methodology considered that the power plants of such scale were built with financings. In addition, Edegel claimed that if SUNAT disagreed with the valuation, it should have conducted its own appraisal, which it failed to do. On February 2, 2012, the Tax Court (TF) issued a ruling for the 1999 fiscal year in favor of two of Edegel’s power plants, and against four power plants, based on the fact that a verified financing was only evidenced for the first two power plants. Consequently, the TF ordered SUNAT to recalculate the taxes payable by Edegel, which amounted to €11 million that were paid by Edegel in June 2012. This amount will be recovered if Edegel obtains favorable rulings in the following claims it has subsequently filed: |
| | i) | an administrative contentious claim before the Judicial System against the TF’s ruling, filed in May 2012 (which would result in a complete recovery of the taxes). |
| | ii) | a partial appeal against the recalculation that SUNAT performed according to TF’s ruling, on the basis that the recalculation was incorrect, filed in July 2012 (which would result in a partial recovery of the taxes). |
In August 2013, Edegel received notice of an unfavorable ruling with respect to claim i). Edegel filed an annulment appeal against the ruling, since the resolution violates its motivation right and it is untimely. In May 2015, Edegel received notice of the resolution of the Court of Appeal which annulled the resolution of the Judicial System.
For the 2000 to 2001 fiscal years, Edegel paid the equivalent of €5 million and made a provision of €1 million. For the 1999 fiscal year it is expected that the Judicial System will enact a new resolution on the Edegel lawsuit and that the TF will decide on the partial appeal filed by Edegel. For the 2000 and 2001 fiscal years, Edegel paid the equivalent of €5 million and made a provision of €1 million. Edegel filed new evidence in order to reduce amount of that could be paid from €6 million to €1.3 million; however, the TF could determine that the evidence is inadmissible as untimely. In December 2014, the TF enacted a resolution on the appeal filed by Edegel, but it has not yet been notified. Notification is expected.
The taxes involved in these proceedings is S/.127.6 million (approximately ThCh$27,662,659), which is divided between the assets amount of S/.59,8 million (approximately ThCh$12,142,825) and the liabilities amount of S/. 67.8 (approximately ThCh$14,698,497).
F-94
| b) | Pending lawsuits of associates |
Enel Brasil
| 1. | The Brazilian Internal Revenue Service (IRS) claims an alleged underreporting of dividends by Endesa Brasil, now called Enel Brasil, than it reported. The Brazilian IRS claims that the total amortization of goodwill (greater value) recorded by Enel Brasil in 2009 in the equity accounts, should have been recorded in the comprehensive income accounts. As a result, the procedure performed was inadequate and a greater profit would have been generated and consequently, a higher amount of dividends distributed. The alleged surplus in dividends was interpreted by the Brazilian IRS as payments to non-residents, which would be subject to a 15% income tax retained at the source. Enel Brasil responded that all the procedures adopted by Enel Brasil were based on the company’s interpretation and in accordance with Brazilian accounting standards (Brazilian GAAP), and confirmed by the external auditor and by a legal opinion from Souza Leão Advogados. Enel Brasil has filed its defense in the administrative first instance and is waiting for an administrative first instance ruling. The amount involved in this proceeding is R$228 million (approximately ThCh$40,098,816). |
Ampla Energía S.A. (Ampla)
| 1. | In Brazil, Basilus S/A Serviços, Empreendimentos e Participações (successor to Meridional S/A Serviços, Empreendimentos e Participações from 2008) is the holder of the litigation rights that it acquired from the construction companies Mistral and CIVEL, which had a civil works contract with Centrais Elétricas Fluminense S.A. (CELF). This contract was terminated before CELF’s privatization process. Since CELF’s assets were transferred to Ampla during the privatization process, Basilus (previously Meridional) sued Ampla in 1998, arguing that the transfer of the referred assets was done in detriment of its rights. Ampla only acquired assets from CELF, but is not its legal successor since CELF, a state-owned company, still exits and maintains its legal personality. Basilus demanded payment of pending invoices and contractual penalties for termination of the civil works contract. In March 2009, the court decided in favor of Basilus, and Ampla and the State of Río de Janeiro filed the corresponding appeals. On December 15, 2009, the State Court accepted the appeal and overturned the lower court’s decision obtained by Basilus, in Ampla’s favor. Basilus filed an appeal against the resolution, which was denied. In July 2010, Basilus filed an Appeal under Specific Court Regulations (Agravo Regimental) before the Superior Court of Justice of Brazil, which also rejected the appeal in August 2010. Seeking to overturn such decision, Basilus filed a Petition for Writ of Mandamus (Mandado de Seguranca), which was also rejected. In June 2011, Basilus filed an Appeal to Amendment of Judgment (Embargos de Declaração) in order to clarify a supposed omission by the Superior Court of Justice in the decision on the Petition for Writ of Mandamus, which was not accepted by the court. Against this decision, Basilus filed an Ordinary Appeal (Recurso Ordinario) before the Superior Court of Justice (in Brasilia). On March 28, 2012 the Reporting Justice decided the Ordinary Appeal in favor of Basilus. Ampla and the State of Río de Janeiro filed an Appeal under Specific Court Regulations against the Reporting Justice’s decision, which was accepted by the First Court Room of the Superior Court of Justice on August 28, 2012, determining that the Ordinary Appeal of the Petition for Writ of Mandamus must be submitted to the decision by an en banc session and not by a single Reporting Justice. Basilus challenged the decision. The decision of August 28, 2012 was published on December 10, 2012, and the Appeal to Amendment of Judgment had been filed by Ampla and the State of Río de Janeiro to remedy the existing error in its publication, in order to avoid future divergence. Basilus filed its arguments and on May 27, 2013, the Appeal to Amendment of Judgment filed by Ampla and the State of Río de Janeiro were accepted and the error corrected. On August 25, 2015, the appeal filed by the plaintiff was rejected. An appeal before the Supreme Federal Court is expected. The amount involved in this proceeding is estimated to be approximately R$1,202 million (approximately ThCh$211,398,144). |
| 2. | In December 2001, the Brazilian Federal Constitution was amended to apply the CONFINS tax (Contribuicao para o Financiamento da Seguridade Social), a tax levied on revenues, to electricity energy sales. The Constitution states that the changes on social contributions are effective 90 days after their |
F-95
| | publication. Ampla started to pay this COFINS tax in April 2002. However, the Brazilian Internal Revenue Service notified Ampla that the 90-day delay of entry into force is applied to statutory amendments, but are not applicable to constitutional amendments, which are effective immediately. In November 2007, the appeal filed before the Taxpayers Council (Consejo de Contribuyentes), the administrative appeals level, ruled against Ampla. In October 2008, Ampla filed a special appeal that was denied. On December 30, 2013, Ampla was notified of the decision to reject its position that the COFINS tax payments were not due for the period from December 2001 to March 2002 based on the Constitution providing that legislative changes are effective 90 days after their publication. Ampla filed a judicial proceeding to obtain a certification of fiscal good standing in order to continue receiving public funds and was required to post a bond for the tax debt. Under the new standard on surety bonds published in March 2014, the bond amount must be 120% rather than the previous 130%, of the tax debt and the bond was reduced to € 44 million. Ampla submitted the new surety bond, complying with the new requirements. The Brazilian Treasury accepted the surety bond and granted the certification of fiscal good standing. The Brazilian Treasury submitted the fiscal execution and Ampla opposed its defense in July 2014. It is not necessary to submit a new surety bond since the bond posted to obtain the certification of fiscal good standing can be used for this proceeding. The amount involved in this case is estimated to be approximately R$147 million (approximately ThCh$ 25,853,184). |
| 3. | Companhia Brasileira de Antibióticos (Cibran) filed suit against Ampla in order to receive compensation for the loss of products and raw materials, machinery breakdown, among other things that occurred as a consequence of poor service provided by Ampla between 1987 and May 1994 and compensation for moral damages. This litigation is related to other five actions filed by Cibran against Ampla based on power outages allegedly caused by Ampla in the period from 1987 to 1994, 1994 to 1999 and part of 2002. The judge decided to conduct a single expert assessment for these various claims, which was in part adverse to Ampla. Ampla challenged such assessment and requested a new expert assessment. On September 5, 2013, the judge rejected the prior petition, whereupon Ampla filed a Petition for Clarification of the Decision (Embargo de Aclaración) and subsequently a Special Appeal (Agravo de Instrumento), both of which were rejected by the court. Against the latter, Ampla filed a Special Appeal before the Superior Court of Justice, which is pending review. In September 2014, a first instance judgment in one of these proceedings ordered Ampla to pay compensation of R$ 200,000 (approximately ThCh$ 35,174) for moral damages, in addition to the payment of material damages caused due to failures in supply of service, which have to be assessed by an expert in the sentence execution stage. Ampla filed a Clarification Attachment against this ruling that was rejected. In December 2014, Ampla filed an appeal, currently pending decision. On June 1, 2015, a judgement in other of the proceeding ordered Ampla to pay moral damages of R$ 80,000 (approximately ThCh$14,070), in addition to material damages for Ampla’s failures in supply of service of R$ 95,465,103 (approximately ThCh$ 16,789,639) (plus price-level restatement and interest). Ampla filed a Petition for Clarification of the Decision (Embargo de Aclaración) against this judgement, which was rejected by the court. Ampla has filed an appeal. In the remaining proceedings, a first instance court ruling is pending. The amount involved for all these cases is estimated to be approximately R$333 million (approximately ThCh$58,564,546). |
| 4. | In August 1996, Ampla obtained a favorable ruling granting it an exemption from paying the COFINS tax for the period prior to the 2001 amendment of the Brazilian Federal Constitution which expressly made electric power operations subject to the COFINS tax. Following the definite decision in favor of Ampla issued in 2010, the Brazilian Treasury attempted to overturn the 1996 decision favorable to Ampla through a recession action. Ampla refiled a suit originally filed in 1996 seeking a refund of its COFINS tax payments from April 1992 to June 1996, based on the favorable ruling in the first lawsuit described above. The suit seeking a refund of the COFINS tax had been suspended pending the resolution of the first lawsuit above. In June 2013, Ampla received a favorable decision entitling it to a refund of its COFINS tax payments for the periods requested. The Brazilian Treasury appealed the decision. In October 2014, the Court of the State of Río de Janeiro ordered a new trial since it considered that the Brazilian Treasury did not have the opportunity to manifest in the prior decision judgment. In May 2015, the Brazilian Treasury presented its |
F-96
| | final plea and in July 2015 a new favorable first instance ruling entitling Ampla to a refund of its COFINS made from 1992 to 1996 was issued. The sum Ampla has requested as a tax refund amounts to R$ 165 million (approximately ThCh$ 29,018,880). |
| 5. | Perma Industria de Bebidas (Perma) filed a lawsuit against Ampla, based on the electric energy tariff adjustment applied by concessionaires based on Orders No. 38 and 45 granted by the National Department of Water and Electric Energy (DNAEE), in February 1986. The Orders authorized an increase of 20% over the tariff for industrial clients during the frozen price period, also implemented by the Federal Government through Decree Law No. 2283, of 28/02/1986. On April 16, 2010 a ruling rejected Perma’s request, and Perma filed an appeal against such ruling, which was accepted and Ampla was ordered to pay the amounts unduly collected during 1986. Ampla and Perma each filed a Special Appeal before the Supreme Court of Justice, which were rejected by means of “eligibility trial”. In July 2011, the parties filed a Special Appeal, which ruling by the court is pending. The amount involved is R$ 65,313,756 (approximately ThCh$ 11,486,861). |
| 6. | The Trade Union of Niterói, representing 2,841 employees, filed a labor claim against Ampla, requesting the payment of salary differences of 26.05% retroactive to February 1989, pursuant to the Economic Plan instituted by Law Decree No.2,335/87. In the court of first instance, the decision was partially unfavorable for Ampla. The court ordered payment of the salary differences requested retroactive to February 1, 1989, and legal fees of 15% of such amount. Ampla filed several appeals, among them an Extraordinary Appeal which is currently pending. A mandatory mediation was unsuccessful. In parallel, Ampla has filed a motion for Advanced Dismissal of Enforcement (Exceção de Pré-Executividade) based on the jurisprudence of the Federal Supreme Court, which has previously declared the non-existence of a right acquired on the URP readjustment of Law Decree No.2,335/87. In addition, Ampla alleged the exception of the payment for these readjustments and, alternatively, requested the limitation of this readjustment using October 1989 salaries as a baseline. In the court of first instance, Ampla obtained the declaration of unenforceability of legal title, against which the applicant filed an appeal (Agravo de Petição). The decision was partly favorable regarding the exception of payment, but not regarding the limitation of the salary differences, using October 1989 salaries as a baseline. On September 10, 2014, the court rejected the Special Appeals (Agravo de Instrumento) presented by both parties, who filed a Petition for Clarification of the Decision (Embargos de Aclaración) against this judgment. In June 2015, Ampla presented its arguments to the Court regarding the Extraordinary Appeal filed by the Union, which were rejected by the Court. The amount involved in this proceeding is estimated to be approximately R$ 60,657,583 (approximately ThCh$ 10,667,970). |
| 7. | In 2002, the State of Rio de Janeiro issued a decree stating that the ICMS (a tax similar to the Chilean Value Added Tax) should be paid and filed on the 10th, 20th and 30th days of the same month of the tax accrual. Ampla continued paying ICMS in accordance with the previous system (filing within five days after the end of the month of its accrual) and did not adopt the new system between September 2002 and February 2005 due to cash flow issues. Additionally, Ampla filed a lawsuit to dispute the constitutionality of the new filing requirement. These lawsuits were unsuccessful, and Ampla has filed suit alleging constitutional violations before the Brazilian Supreme Federal Tribune. Since March 2005, Ampla has been paying the ICMS according to the new system. In September 2005, the IRF imposed on Ampla a penalty fee and interests due to the delay in filling the ICMS as set forth in the aforementioned decree of 2002. Ampla appealed the resolution before the Administrative Courts, based on the fiscal Amnesty Laws of the State of Río de Janeiro published in 2004 and 2005 (forgiving interest and penalties if the taxpayer paid the taxes due). Ampla alleges that if the aforementioned tax amnesties are found to be inapplicable to it, the law would punish taxpayers that are delayed only a few days in their tax payments (as in the case of Ampla) more harshly than those who failed to pay their taxes and later formally adopted the various tax amnesties and thus, regulate their tax situation through the filing of overdue unpaid taxes. |
On May 9, 2012, The “En Banc Council” (a special body within the Taxpayers Council, representing the last administrative instance) issued a judgment against Ampla. The decision was notified on August 29, 2012. Ampla appealed to the State Public Treasury (Hacienda Pública Estadual) using a special review procedure based on the equity principle, before the Governor of the State of Río de Janeiro. The appeal has not been
F-97
resolved and, therefore, the tax should be suspended. However, the State of Río de Janeiro recorded the tax due in the Public Register as if demandable and, therefore, on November 12, 2012, Ampla was obliged to post a surety bond in the amount of € 101 million (R$ 293 million) in order to receive a certification of fiscal good standing to continue receiving public funds. On June 4, 2013, in a decision of second instance, the State Public Treasury obtained a ruling against Ampla’s surety bond. In September 2013, Ampla filed a letter of guarantee to substitute for the surety bond rejected by the court. However, Ampla reiterated to the attorney of the State, the petition of review, which is still pending decision. Despite this, the State Public Treasury submitted the fiscal execution and Ampla opposed its defense. It is not necessary to submit a new surety bond since the bond posted to obtain the certification of fiscal good standing can be used for this proceeding. In June 2015, the Supreme Court of Brasilia issued a favorable ruling for Ampla for a lawsuit filed in 2002 to dispute the constitutionality of the new filing requirements. This resolution will lead to the suspension of the collection procedures of penalties and interests, since the tax is already paid. The State of Río de Janeiro might eventually appeal; but its likelihood of winning are very limited as the outcome of the procedure was issued by the plenary. Also, the sentence will mean the release of the guarantee. The decision was published on February 10, 2015 and the Brazilian Treasury has 10 days to appeal. Once elapsed the period the resolution will become final, and at that time the resolution will be presented to the administrative collection body (process). The amount involved in this proceeding is R$ 281 million (approximately ThCh$ 49,420,000).
In order to fund the purchase of Coelce in 1998, Ampla issued long-term debt abroad through securities called Fixed Rate Notes (FRNs) which were governed by a special tax regime whereby interest payments received by non-resident holders were exempt from taxation in Brazil, as long as the debt was issued with a minimum maturity of 8 years. In 2005, the Brazilian IRS notified Ampla the special tax regime did not apply based on its understanding that prepayments were made before the stated maturity, due to the fact that Ampla had received financing in Brazil which was allocated to the FRN holders. Ampla argues that these two transactions are independent and legally valid. The non-application of the special tax regime means that Ampla would have failed to comply with its obligation to retain the tax and to record it as interest payments made to non-resident holders. The tax resolution was appealed and in 2007 the Taxpayers Council (Consejo de Contribuyentes), the administrative appeals level, annulled it. However, the Brazilian Internal Revenue Service (responsible for tax collection and compliance with tax laws) contested this decision before the Superior Chamber of Fiscal Resources (Cámara Superior de Recursos Fiscales), the final administrative appeals level, and on November 6, 2012, it ruled against Ampla. The decision was notified to Ampla on December 21, 2012. On December 28, 2012, Ampla filed a Petition for Clarification of the Decision (Embargo de Aclaración) before the Superior Chamber of Fiscal Resources in order to obtain a final resolution regarding contradictory points of the decision and to incorporate in it the relevant defense arguments that were omitted. The petition was denied. As a consequence, Ampla filed a judicial proceeding to obtain a certification of fiscal good standing in order to continue receiving public funds. Ampla was required to post a bond for the tax debt. Under the new standard on surety bonds published in March 2014, the bond amount must be 120%, rather than the previous 130%, of the tax debt and the bond was reduced to € 331 million. Ampla submitted the new surety bond, complying with the new requirements. The Brazilian Treasury accepted the surety bond and granted the certification of fiscal good standing. The Brazilian Treasury submitted the fiscal execution and Ampla opposed its defense on June 27, 2014. It is not necessary to submit a new surety bond since the bond posted to obtain the certification of fiscal good standing can be used for this proceeding. It is important to mention that the final unfavorable decision of the Superior Chamber of Fiscal Resources could lead to a possible criminal proceeding against some employees and managers of Ampla. The amount involved in this case is estimated to be approximately R$ 1,112 million (approximately ThCh$ 195,569,664).
Companhia Energética do Ceará S.A. (Coelce)
| 1. | In 1982 and under the framework of an electricity supply network expansion in Brazilian rural areas, which was financed principally by international development banks (IDBs), the then-state-owned Companhia Energética do Ceará S.A. (Coelce) signed contracts with 13 cooperatives at the request of the Brazilian |
F-98
| | government and the IDBs to implement this project. Under the contracts, Coelce operated and maintained the assets and paid a monthly fee, which was adjusted for inflation. These contracts were of indefinite length and failed to clearly identify the networks that were under their scope due the public nature of Coelce and the fact that they were often repaired, creating confusion between the assets that were operated and maintained by Coelce, and the assets that were owned by it. After 13 years of regular performance of the lease by making payments adjusted for inflation, in 1995 Coelce started making payments without adjustment, and continued to do so after its privatization in 1998. In view of the foregoing, some of these cooperatives have filed claims against Coelce for the payment of the adjustment for inflation. Coelce’s defense is basically grounded on the argument that the adjustment is not applicable, since the assets lacked value due to their very extended useful lives, taking into consideration their depreciation; or, alternatively, if the assets were deemed to have any value, it would be very low since Coelce performed their replacement, extension and maintenance. The amount involved in this litigation is approximately R$ 175,816,705 (approximately ThCh$ 30,921,235). |
One of the plaintiffs in this litigation, Cooperativa de Eletrificação Rural do V do Acarau Ltda (Coperva), filed a review action requesting expert evaluation of the issue. Once the expert report was delivered, Coelce claimed there were technical inconsistencies therein and requested a new evaluation to be conducted, but the court denied the claim and ruled the “anticipated execution of the decision”, which entails the preliminary determination of the adjusted monthly payments Coelce should have made and ordering the immediate payment of the difference between such adjusted values and the values Coelce actually paid. An appeal has been filed and a precautionary measure has been obtained in favor of Coelce, staying the anticipated execution of the decision. On April 4, 2014 a court of first instance denied Coperva’s claims. Coperva has appealed and the decision is pending. Another plaintiff in the ligation filed a review action in 2007, through which Coperva is attempting to readjust the lease value of its distribution lines (in the central region of the State of Ceará), to be calculated at 1% of the value of the asset leased, estimated by Coperca to be at R$ 15.6 million (approximately ThCh$ 2,743,603). This proceeding is in a first instance and has not yet started the evidence presenting stage. The amount involved in this proceeding is estimated to be R$ 92,986,525 (approximately ThCh$ 16,353,726). In Coerce’s case, the review action was filed in 2006 and Coerce is attempting to readjust the lease value of its distribution lines (in the central region of the State of Ceará), to be calculated at 2% of the value of the asset leased. The amount involved in this proceeding is R$ 107,048,131 (approximately ThCh$ 18,826,769). This proceeding, as well as the one for Coperva, has not been advanced by the plaintiff and both are in their first instance.
| 2. | Coelce bills the “low income” consumer with a social discount that determines a final rate called “baja renta” (low income). The State compensates Coelce for this discount as a state subsidy. The ICMS (a tax similar to the Chilean Value Added Tax) is transferred (deducted) by Coelce over the amount of the normal rate (without the discount). On the other hand, the State of Ceará establishes that the ICMS does not apply to billings that fluctuate between 0 and 140 kW/h. Also, Coelce, in order to calculate the ICMS deducible amount in reference to the total ICMS supported in energy purchases must apply the “pro rata” rule. The rule states that the percentage that represents revenues subject to ICMS over the total income (whether or not subject to ICMS). Coelce considers, for the purpose of its inclusion in the pro rata denominator, that the revenue not subject to ICM is the result of applying the end sales price of energy (price after the subsidy is discounted) and the Brazilian IRS holds that the income not subject to ICMS is the price of the normal rate (without discounting the subsidy). The Brazilian IRS’s position implies a lower ICMS deduction percentage. The Brazilian Treasury view is that the “ICMS pro rata” calculation should be based on the normal rate value in “low income” energy sales cases, instead of the reduced rate that Coelce uses. The Brazilian Treasury criteria results in a greater ICMS non-recoverable percentage, which results in a higher ICMS payable. Coelce argues that its calculation is correct, since it must be used in the “ICMS Pro Rata” calculation, reducing the value of the ICMS rate since that is the accurate value of the energy sales transaction (the ICMS’s base is the transaction value of the merchandise sold). In reference to the 2005 and 2006 litigation, after the unfavorable decision in the administrative process, Coelce is waiting for the filing of the State’s judicial execution. However, Coelce has already presented the banking guarantee in order to assure its right to obtain the Regular Tax Certification. In reference to the 2007, 2008 and 2009 litigation, |
F-99
| | Coelce filed the administration defense, and the decision is pending. In reference to 2010, the proceeding was received in January 2015 and Coelce filed first instance administrative defense. The next step is to continue with the defense of judicial and administrative processes. The amount of these claims is R$ 121 million (approximately ThCh$ 21,280,512). |
| 3. | Vicunha do Nordeste S/A (Finobrasa) filed a lawsuit against Coelce by reason of the adjustment to the electric energy tariffs applied by concessionaires based on Orders No. 38 and 45 granted by the National Department of Water and Electric Energy (DNAEE), in February 1986. These Orders authorized an increase of 20% over the tariff for industrial clients during the frozen price period, also implemented by the Federal Government through Decree Law No. 2283 of February 28, 1986. The intention of the lawsuit is to declare such adjustment illegal, seeking to extend illegality effects until the present time. During the proceeding, FINOBRASA filed another lawsuit with similar requests. Regarding the first process, Finobrasa obtained a final ruling against Coelce, which ordered Coelce to pay the unduly collected amounts, extending the effects of such ruling until the present time, which does not coincide with the jurisprudence of the Supreme Court of Justice. Considering the above, Coelce filed a rescission action, which seeks to amend a final decision and may be filed up to 2 years after the final period to file appeals has ended. This is a new action, with extremely restrictive requirements and its proceeding is started on second instance, with the purpose of questioning an error in the decision, either any procedural defect or a substantial defect of rulings by supreme courts (which is the basis for this lawsuit). Regarding the second action, the judge dismissed it due to his pendency and matter adjudged, since both are similar petitions. For this reason, the purpose of the three lawsuits is the same, that is, to assess the wide or restrictive effect of the 1986 adjustment illegality. Coelce filed this Rescission Action in 1999, and on September 28, 2010 a ruling was passed and the “Civil United Chambers” unanimously declared that the illegality of the collection made by Coelce is limited to 9 months of 1986 (March to November). On September 30, 2015 a ruling rejected the Special Appeal filed by Finobrasa; the figure involved amounts to R$ 66,361,016 (approximately ThCh$ 11,671,045). |
| 4. | Lawsuits filed by Industria Barbalhense di Cemento Portland S.A. (IBACIP) against Coelce, by reason of the adjustment to the electric energy tariffs applied by concessionaires based on Orders No. 38 and 45 granted by the National Department of Water and Electric Energy (DNAEE), in February 1986. These Orders authorized an increase of 20% over the tariff for industrial clients during the frozen price period, also implemented by the Federal Government through Decree Law No. 2283, of 28/02/1986. The intention of the lawsuit is to obtain a refund of the values that the petitioner would have paid in excess for the use of electric energy by reason of the allegedly illegal 20% increase over the tariffs of industrial clients. On March 17, 2008 a ruling was issued declaring illegal to charge the tariff increased by the DNAEE Orders, but only with respect to the invoices issued within the period between March and November 1986. Both parties filed appeals against this ruling before the Court of Justice and they were both dismissed. Coelce has filed a Special Appeal with the Supreme Court of Justice, and the Court has not yet issued a decision. The amounts involved are R$ 59,599,546 (approximately ThCh$ 10,481,891). |
| 5. | Collective lawsuit filed by Sindeletro against Coelce with the intention of obtaining a supplementary salary payment based on a 30% over the base salary for employees exposed to hazards. |
In its defense, Coelce sustains that the amendments made in the payment and determination of this salary supplement were legal, since they were the result of an analysis made by a commission established for this purpose aimed to identify which activities were hazardous and which employees worked in such areas.
In the first instance Coelce was condemned to pay to all employees a hazardous salary supplement by 30% as of January 1, 1986. Also, it was ordered to pay attorney fees of 15% over the punishment value. Coelce filed an ordinary appeal with the Regional Labor Court (TRT).
In the second instance, the ordinary appeal filed by Coelce was partly accepted, it states that such supplement should not be paid to employees not performing hazardous activities. Also, it acknowledged that the percentage due for this hazardous salary supplement could be reduced according to the length of time of the employee’s exposure to hazards. Sindeletro filed a review appeal against this ruling in the second instance before the Supreme Labor Court (TST).
F-100
In the third instance, the TST accepted the review appeal filed by Sindeletro, rejecting the possibility of reducing the percentage based on a shorter length of time of exposure to hazards. The TST declared that if an employee has performed a hazardous activity the employee is entitled to receive a 30% supplement over his or her base salary, regardless if he performed such hazardous activity only for one day or for the entire month. The TST ruling is based on the TST jurisprudence of its Statement 361 and is not subject to appeals.
The settlement phase (values assessment) has begun with the calculation delivered by Sindeletro. Coelce has been urged to make its statement. After starting the execution phase, Coelce was urged to pay or to guarantee execution for an amount of R$ 5,014,269.49 (€1,538,119). Thus, Coelce made a deposit of the guarantee and filed its disclaim to execution. The amount involved is R$ 67,000,000 (approximately ThCh$ 11,783,424).
| 6. | The State of Ceará filed complaints against Coelce for the periods 2003, and 2004 to 2010, since it considered that the ICMS calculation for fixed assets acquisition was incorrect. Specifically, the State of Río de Janeiro states that Coelce does not have all the necessary supporting documents and that some fixed assets were not devoted to the activity of electric energy production or distribution. In its defense, Coelce explains that (i) the corresponding legislation does not specify the different types of fixed assets that could be used for the ICMS credit purposes; (ii) such fixed assets are related to the main activity of the companies, even if they are used at the offices and administrative premises. It also intends to compare the credits with the acquisition invoices; Coelce filed an administrative defense. It was decided to request an expert report to determine the tax value after accepting some issues, such as ICMS credits over the public lighting assets. After ending the investigation, the proceeding will undergo a new trial. The first instance decision was partially favorable. A second instance appeal will be filed; the figure involved amounts to R$ 99 million (approximately ThCh$ 17,411,328). |
Compañía de Interconexión Energética S.A. (CIEN, subsidiary of our associate)
| 1. | In October 2009, Tractebel Energía S.A. sued CIEN claiming an alleged breach of the contract “Purchase & Sale Agreement for 300 MW of Firm Capacity with related energy originating from Argentina” signed in 1999 between CIEN and Centrais Geradoras do Sul do Brasil S.A (which is now known as Tractebel Energía). Tractebel Energía asked the court to order CIEN to pay a rescission penalty of R$ 117,666,976 (approximately ThCh$ 20,694,326) plus other fines due to the unavailability of energy. The breach allegedly occurred due to a failure by CIEN to ensure sufficient capacity as contracted with Tractebel Energía during the 20-year period, which allegedly took place beginning in March 2005. In May 2010, Tractebel Energía notified CIEN via a written statement, but not judicially, its intention to exercise step-in rights of Line I (30%). The proceeding is currently at the first instance. CIEN petitioned to join this proceeding with the lawsuit filed by it against Tractebel Energía in 2001, which involves a dispute relative to exchange rates and taxing issues. The petition to join both proceedings was rejected by the court. Subsequently, CIEN filed a request to suspend the proceeding for 180 days in order to avoid potentially divergent decisions. The court ordered the suspension of proceedings for one year pending the outcome of the other lawsuit of CIEN against Tractebel Energía. The court issued a resolution extending this suspension until July 9, 2015. |
| 2. | In 2010, Furnas Centrais Eletricas S.A. filed a suit against CIEN, based on CIEN’s alleged breach of the contract “Firm Capacity Purchase with Related Energy for the purchase of 700 MW of firm capacity with related energy originating from Argentina”, which was signed in 1998 with a term of 20 years beginning in June 2000. In its lawsuit, Furnas requested a compensation of R$ 520,800,659 (approximately ThCh$ 91,594,253) corresponding to a rescission penalty included in the contract, plus adjustments and default interests, from the date of filing of the claim until actual payment. Furnas also requested for additional penalties based on the lack of availability of the “firm power and related energy” and for other damages to be determined upon the final decision. The first trial judgment denied the claims of Furnas for CIEN’s responsibility for breach of its contractual obligations. The Court recognized the existence of force majeure because of the energy crisis in Argentina. Regarding the foreign language documents presented by CIEN, the judge of first instance determined that those documents would be excluded from the lawsuit, which |
F-101
| | decision was confirmed by the 12th Civil Section of the State Court. CIEN has filed a Special Appeal (Recurso Especial) against this decision, which will be decided by the Superior Court of Justice. In addition to the foregoing, CIEN received a notice from Furnas, not at the judicial headquarters, indicating that in case of rescission due to CIEN’s breach, Furnas would have the right to acquire 70% of Line I. |
Endesa Fortaleza
| 1. | In February 2004, two Brazilian taxes, COFINS and PIS were amended from an accrued regime (rate of 3.65% without credit deduction) to a non-accrued regime (9.25% with credit). According to legislation, long-term assets and service supply agreements performed before October 31, 2003 under “predetermined price” could remain in the accrued regime. Endesa Fortaleza had entered into energy purchase agreements that complied with the requirements, and as a result, the revenues for such agreements were initially taxed under the accrued regime, which is more advantageous. In November 2004, an administrative order was released which defines the concept of “predetermined price”. According to it, CGTF agreements (Endesa Fortaleza) must be subject to the non-accrued regime. In November 2005, a new Law clarified the “predetermined price” concept. On the basis of the 2005 legislation, the regime that should be applied to the agreements was the accrued regimen (more advantageous). Besides, the ANEEL issued a (Administrative Law) Technical Note indicating that the agreements entered into by virtue of its standards and with its approval comply with the legislative requirement. PIS and COFINS paid in excess under the non-accrued regime by CGTF and CIEN between November 2004 and November 2005, originate tax credits which were used to pay other taxes due. Nevertheless, in 2009 the tax authorities rejected the compensation procedures. In February 2007, the Brazilian tax authorities audited Endesa Fortaleza regarding the payment of PIS/COFINS tax during December 2003 and from February 2004 to November 2004. The audit resulted in a claim alleging differences between the amounts stated in Endesa Fortaleza’s annual tax return (where the PIS/COFINS tax amounts were reported under the new non-accrued regime) and the amounts stated in monthly tax returns (where the amounts due were reported under an older accrual system). The amount involved in this proceeding is R$ 74 million (approximately ThCh$ 13,014,528). |
| 31.4 | Financial restrictions |
As of September 30, 2015, Endesa Américas, on a stand-alone basis, had no debt obligations and is therefore not affected by any covenants or events of default. However, a number of the Combined Group’s loan agreements include the obligation to comply with certain financial covenants, which is normal in contracts of this nature. There are also affirmative and negative covenants requiring the monitoring of these commitments. In addition, there are restrictions in the agreements’ events-of-default clauses that must be complied with.
Financial covenants are contractual commitments with respect to minimum or maximum financial ratios that the company is obliged to meet at certain periods of time (quarterly, annually, etc.). Most of the Combined Group’s financial covenants limit the level of indebtedness and evaluate the ability to generate cash flows in order to service the companies’ debts. Various companies are also required to certify these covenants periodically. The types of covenants and their respective limits vary according to the type of debt.
In Peru, the debt of Edegel S.A.A. (Edgel) includes the following covenants: Debt and Debt Coverage (Debt Ratio/EBITDA) Ratios. As of September 30, 2015, the most restrictive financial covenant for Edegel was the Debt/EBITDA Ratio corresponding to the finance lease with Scotiabank expiring in March 2017.
In Argentina, Central Costanera S.A. (Costanera) has just one covenant, the maximum debt, related to a borrowing from Credit Suisse First Boston International which matures in February 2016. The debt of Hidroeléctrica El Chocón S.A. (El Chocón) includes covenants related to Maximum Debt, Net Consolidated Equity, Interest Coverage, Debt Coverage (Debt Ratio/EBITDA) and a Leverage ratio. In the case of El Chocón,
F-102
as of September 30, 2015, June 30, 2015, March 31, 2015 and December 31, 2014, the Interest Coverage covenant (EBITDA/Financial Expenses) was in default, for the loan with Standard Bank, Deutsche Bank and Itau, which expires in February 2016. El Chocón has made payments of principal owed and interest on a timely basis and has been negotiating with creditors for the granting of a waiver for the default. However, El Chocón has not received acceleration notices for its most recent failure to comply with the ratio. The latter do not represents a cross default risk or a breach for Endesa Américas.
In Colombia, the debt of Empresa Generadora de Energía Eléctrica S.A. (Emgesa) is not subject to compliance with financial covenants, a situation that also applies to the debt of the rest of the Combined Group’s companies not mentioned in this Note.
In most of the contracts, debt acceleration for non-compliance with these covenants does not occur automatically but is subject to certain conditions, such as a cure period.
As of September 30, 2015 and December 31, 2014, no company of the Combined Group was in default under their financial obligations summarized herein or other financial obligations whose defaults might trigger the acceleration of their financial commitments, with the exception of our power generation Argentine combined entities Hidroeléctrica El Chocón at the close of September 2015 and December 2014 as mentioned above.
Costanera had not made the biannual payments on a supplier loan with Mitsubishi Corporation since March of 2012, for a total US$107.1 million, including principal and interest. After a long period of negotiations, a restructuring agreement was signed on October 27, 2014. The main conditions of this restructuring include: the elimination of accrued interest as of September 30, 2014 of US$66 million; the rescheduling of the capital repayment of US$120.6 million over 18 years with a grace period of 12 months, to be fully repaid by December 15, 2032; a minimum annual capital repayment of US$3,000,000 in quarterly installments; an interest rate of 0.25% per annum; the maintaining of the pledge over assets; and restrictions on the payment of dividends. The preceding condition to making the agreement effective was that Central Costanera S.A. should pay US$5,000,000 of the debt due within 15 business days of signing the agreement; this was carried out on November 14, 2014.
None of this represents a cross default risk or a breach for Endesa Américas.
The following sanctions have been received from administrative authorities:
| a) | Endesa Américas S.A. and combined entities |
| 1. | Hidroeléctrica El Chocón S.A. (El Chocón) |
| • | | For the fiscal year ended December 31, 2013, the Electricity Regulatory Body (ENRE) imposed a fine of Th$20 Argentine pesos (approximately ThCh$1,483). El Chocón has filed an appeal. |
| • | | For the period between January 1, 2014 and March 31, 2014, the ENRE imposed a fine of Th$11 Argentine pesos (approximately ThCh$816). El Chocón has filed an appeal. |
| • | | Finally, for the period between April 1, 2014 and June 30, 2014, the ENRE imposed two fines amounting to Th$3 Argentine pesos (approximately ThCh$222). |
| • | | During the first nine months of 2015 there were no sanctions imposed by administrative authorities. |
| 2. | Central Costanera S.A. (Central Costanera) |
| • | | During the 2012 fiscal year and until June 30, 2013, the company was condemned to pay two fines for a total amount of Th$47 Argentine pesos (approximately ThCh$3,555) by the General Customs Authority |
F-103
| | (Dirección General de Aduanas). Possible liability on the part of Mitsubishi is being assessed, in which case that amount could be claimed from this supplier. The ENRE also imposed two fines totaling Th$51 Argentine pesos (approximately ThCh$3,782). The company has filed an appeal. |
| • | | For the period from April 1, 2014 to June 30, 2014, the ENRE imposed a fine of Th$40 Argentine pesos (approximately ThCh$2,718), which was paid on June 30, 2014. |
| • | | For the period from July 1, 2014 to December 31, 2014, the ENRE imposed a fine of Th$102 Argentine pesos (approximately ThCh$7,245), which was paid on November 20, 2014. |
| • | | During the first nine months of 2015 there were no sanctions imposed by administrative authorities. |
| • | | In April 2013, Edegel received the following fines from the OSINERGMIN: (i) S/.7,604.57 (approximately ThCh$1,649) for failure to perform maintenance in a timely fashion on its thermal generation units for the last quarter of 2008; (ii) S/.200,941.48 (approximately ThCh$43,562) for failure to perform maintenance in a timely fashion on its hydraulic generation units for the last quarter of 2008; (iii) S/.40,700 (11 Tax Units, UIT) (approximately ThCh$8,823) for failure to submit technical justification in a timely fashion for the second quarter of 2008; and (iv) S/.106,073.17 (approximately ThCh$22,996) for failure to have its generation unit available after having been notified that it was required by the SEIN for the fourth quarter of 2008. Edegel has not protested fines (i) and (iv) and paid them on May 2, 2013 in order to take advantage of early payment benefits. It has, however, appealed sanctions (ii) and (iii), and Edegel was notified on April 15, 2014 of Resolution 107-2014-OS/TASTEM-S1 issued by the OSINERGMIN’s Energy and Mining Sanctions Appeal Court declaring null and void the Management Resolution imposing the fine, as it did not have the authority to do so. The agency with competence in this area is the Electrical Oversight Management (Gerencia de Fiscalización Eléctrica). |
Accordingly, on September 1, 2014, Edegel received notification of the OSINERGMIN’s Electrical Oversight Management Resolution 1380-2014 imposing on Edegel the same fines contained in the voided Management Resolution. Edegel has again protested, noting that sanctions (i) and (iv) had already been paid.
| • | | In May 2013, Edegel was fined by the SUNAT for issues related to the determination of its 2007 tax payments. The amount of the fine, updated as of September 30, 2015, was S/.9,755,900 (approximately ThCh$2,114,999). An appeal filed before the Tax Court is pending. |
| • | | In June 2013, Edegel was notified by Electroperú S.A. of a penalty applied under contract no. 132991, “Additional Generation Capacity Service through Conversion of Equipment to the Dual Generation System”. The penalty, amounting to S/.481,104.53 (approximately ThCh$104,300), was applied for breach the conditions for executing the service agreed under that contract. |
| • | | In July 2013, Edegel was fined S/. 453.86 (approximately ThCh$90) by the OSINERGMIN for failure to perform maintenance on its hydraulic generation units in a timely fashion as required under number 6, “Procedure for Overseeing Availability and the Operating Conditions of SEIN Generating Units”. As the company paid the fine prior to the 15-day deadline, the fine was reduced to S/. 340.40 (approximately ThCh$67). |
| • | | In July 2013, Edegel was fined S/. 4,070 (approximately ThCh$805) by the OSINERGMIN for failure to submit the pertinent technical justification in a timely fashion as required under number 6 of the “Procedures for Overseeing Availability and the Operating Conditions of SEIN Generating Units”. As the company paid the fine prior to the 15-day deadline, the fine was reduced to S/. 3,052.50 (approximately ThCh$603). |
| • | | In November 2013, Edegel was fined S/.37,000 (approximately ThCh$8,021 or 10 Tax Units – UIT) by the Callahuanca District Municipality (MDC) in Municipal Resolution 060-2013. The MDC imposed the sanction for failure to submit the technical inspection report on multidisciplinary civil defense safety as required under Law No. 29,664 and its regulations. |
F-104
| • | | In November 2013, Edegel was fined by the SUNAT for issues related to the calculation of its 2008 tax payments. The amount of the fine, updated as of September 30, 2015, was S/.1,759,227 (approximately ThCh$381,386). The appeal filed is pending resolution by SUNAT. |
| • | | In December 2013, Scotiabank Perú S.A.A., with whom Edegel has signed a lease agreement for the Santa Rosa Project, was fined by the SUNAT for duties allegedly unpaid in an import operation. The amount of the fine, restated as of September 20, 2015, was S/.15,721.523 (approximately ThCh$3,408). Scotiabank Perú S.A.A. filed the respective appeal in January 2014, pending before the Tax Court. |
| • | | On December 23, 2013, the OSINERGMIN filed an administrative proceeding against Edegel for outdated payment of the regulation contribution. Finally, on June 5, 2015, the OSINERGMIN archived the mentioned proceeding. |
| • | | On January 28, 2014, the National Authority of Water (ANA) filed an administrative proceeding against Edegel for reuse of industrial sewage water treated for garden irrigation. Subsequent to Edegel presenting its case, on June 5, 2015, ANA archive the proceeding. |
| • | | On March 20, 2014, the OSINERGMIN filed an administrative proceeding against Edegel for non-compliance of current regulations on implementation and execution of the Fondo de Inclusión Social Energético (FISE). On June 12, 2015, the proceeding was archived. |
| • | | In May 2014, Electrical Oversight Management Resolution No. 743-2014 issued by the OSINERGMIN on May 27, 2014, ordered Edegel to pay a fine of 0.50 tax units (UIT) for having violated the CCIT indicator, regarding compliance with the correct calculation of indicators and compensation amounts for voltage quality, in the second half of 2012. The fine was imposed in accordance with number 5.1.2, section B) of the Procedures for Supervising the Technical Standards for Electricity Service Quality and their Methodology Base. |
| • | | In June 2014, as a result of the inspection of its 2009 income tax return, Edegel corrected an omission made in determining the tax owed and paid a penalty of S/.2,070 (approximately ThCh$449). |
| • | | On December 23, 2013, the OSINERGMIN filed an administrative proceeding against Edegel for outdated payment of the regulation contribution. Finally, on June 5, 2015, the OSINERGMIN archived the proceeding. |
| • | | On January 28, 2014, the National Authority of Water (ANA) filed an administrative proceeding against Edegel for reuse of industrial sewage water treated for garden irrigation. Subsequent to Edegel presenting its case, on June 5, 2015, ANA archived the proceeding. |
| • | | On March 20, 2014, the OSINERGMIN filed an administrative proceeding against Edegel for non-compliance of current regulations on implementation and execution of the Fondo de Inclusión Social Energético (FISE). On June 12, 2015, the proceeding was archived. |
| • | | In September 2014, Edegel was fined by the SUNAT in connection with its 2009 income tax return for an amount updated at September 30, 2014 of S/.315,230 (approximately ThCh$68,339). Edegel accepted the fine and paid the penalty. |
| • | | On December 4, 2014, the OSINERGMIN notified Edegel of the filing of an administrative proceeding for non-compliance of the procedures to verify availability and the operative status of the generation units of SEIN. On April 24, 2015, Edegel paid the fine for S/2,928.42 (approximately ThCh$635) imposed by Directorial Resolution 691-2015. |
| • | | On March 11, 2015, the Environmental Assessment and Supervisory Agency (OEFA) filed an administrative proceeding against Edegel for noise contamination caused for failing to install noise mitigation panels at the Santa Rosa de Ventanilla Thermal Plant. Through Resolution No. 388-2015-OEFA-DSAI issued on April 30, 2015, Edegel was fined for 1 to 100 UIT. On June 16, 2015, Edegel filed an appeal against such Resolution, which was accepted on June 19, 2015. |
| • | | On May 13, 2015, the OSINERGMIN started an administrative proceeding against Edegel for non-compliance with the Electric Concessions Law and the Transmission of Electricity Final Concession |
F-105
| | Contract related to transmission line 220kV Callahuanca-Chavarria, since it does not comply with formalities of the goods affected to such concession as stated in term No.9 of such contract. Edegel has presented its defense. |
| • | | In June 2015, Edegel was fined by the OSINERGMIN for an allege omission of the Regulation Contribution declaration for several months during the years 2011 to 2014. The contingency updated to September 30, 2015 amounts to S/85,695 (approximately ThCh$18,578). Edegel accepted the fines and paid them without filing any appeal. |
| 4. | Chinango S.A.C. (Chinango) |
| • | | In January 2013, Chinango received a fine totaling S/.367,915 (approximately ThCh$79,761) from the SUNAT for issues related to the determination of its 2010 income tax. The company challenged the measure despite paying a reduced fine in February 2013. The appeal filed is pending resolution by the Tax Court. |
| • | | In June 2013, Chinango was notified through Coactive Execution Resolution 0398-2012 of a fine of S/.3,800 (approximately ThCh$824) imposed by the OSINERGMIN for the following infractions: (i) failure to comply with the CCII indicator in the first half of 2010 as required under paragraph A of number 5.2.2 of the “Procedure for Overseeing the Technical Quality Standard for Electrical Services and its Base Methodology”; (ii) failure to comply with the CPCI indicator in the first half of 2010 as required under paragraph C) of number 5.2.2 of the “Procedure for Overseeing the Technical Quality Standard for Electrical Services and its Base Methodology”; and (iii) submitting empty service interruption reports (RIN and RDI files) for the first half of 2010 despite the interruptions affecting its customers, as required under Article 31 of the Electricity Concession Law. |
| • | | In September 2013, Chinango was notified through Electrical Oversight Management Resolution No. 19693 issued by the OSINERGMIN of a fine of S/.1,850 (approximately ThCh$401 or 0.50 Tax Units – UIT) for: (i) failure to submit voltage quality information in a timely fashion in the first half of 2012. As the fine was paid within fifteen (15) days of notification, it was reduced by 25%. |
| • | | In March 2014, Chinango was notified through Coactive Execution Resolution No. 0350-2014 that it must pay a balance of S/.12,100 (approximately ThCh$2,623) on a fine imposed by the OSINERGMIN. The total amount of the fine, imposed through sanction No. 014799-2012-OS/CG, was 11 tax units (UIT) or S/.48,800 (approximately ThCh$10,579). |
| • | | In January 2014, Chinango was fined S/.613,390 (approximately ThCh$132,978) by the SUNAT in connection with the determination of its 2011 income tax. The company challenged the decision despite paying a reduced fine in February 2014. The appeal was rejected by SUNAT Resolution dated December 2014, and Chinango has filed the respective appeal in January 2015, and the decision is still pending. |
| • | | On May 19, 2015, the Environmental Assessment and Supervisory Agency (OEFA) filed an administrative proceeding against Chinango for allegedly presenting an incomplete third quarter report of environmental monitoring for the year 2013. On June 16, 2015, Chinango presented its defense. |
| • | | In June 2015, Chinango was fined by the OSINERGMIN for an alleged omission in presenting the Regulation Contribution declaration in several months during the year 2014. The amount at issue updated to September 30, 2015 is for S/79,857 (approximately ThCh$17,312). Chinango accepted the fines imposed and paid them without filing any appeal. |
| • | | In September 2015, Chinango was notified of several Resolutions of Fines for S/1,424.122 (approximately ThCh$309) related to the determination of the Income Tax for year 2012 and the corresponding payment in such year. In October 2015, Chinango paid the aforementioned debt using the current gradually regime, notwithstanding the filing of the corresponding appeal. |
F-106
| 5. | Empresa Generadora de Energía Eléctrica S.A. (Emgesa) |
| • | | On July 30, 2013, through Resolution 20138100353652, the Superintendence of Public Household Services (SPPD) imposed an admonishment (without value) to Emgesa, for failure to attend a non-regulated user (SUNCHINE BOUQUET LTDA). Through resolution 20148150176905 issued on October 28, 2014, the SPPD confirmed the fine. Closed. |
| 6. | Sociedad Portuaria Central Cartagena (SPCC) |
| • | | By resolution 1312 of January 30, 2014, the Superintendence of Ports and Transport penalized SPCC with the payment of the amount of Col$ 2,142,400 (approximately ThCh$521) for reporting late the accounting and financial information for the year 2010, which in accordance with the resolutions 6051 of 2007 and 759 of 2010, issued in February 2011 must be reported on February 2011. The penalty was paid on February 14, 2014. Closed and paid. |
| 1. | Enel Brasil S.A. and subsidiaries |
| 1.1 | Ampla Energía S.A. (Ampla) |
| • | | The company received seven fines in 2013 totaling R$29,810,687 (approximately ThCh$5,242,851) from the National Electrical Energy Agency (ANEEL) due to problems with technical quality, erroneous evidence presented in inspections and for other reasons. The company appealed, and four fines are still awaiting final rulings. The other fines were either revoked or paid, for a total of R$143,601 (approximately ThCh$25,255). Only two fines were received in 2012 totaling R$3,557,786 (approximately ThCh$625,713), of which R$2,112,600 (approximately ThCh$371,546) have been paid. |
| • | | In 2013, the company received 19 fines totaling R$120,204 * (approximately ThCh$21,140) from the environmental agencies (IBAMA, Instituto Brasileiro do Meio Ambiente e dos Recursos Naturais Renováveis, ICMBio—Instituto Chico Mendes de Conservação da Biodiversidade, INEA – Instituto Estadual de Ambiente and others) for unauthorized removal of vegetation, death of animals because of contact with the energy network, and construction in forbidden areas or without permission. The company filed appeals against almost all of the fines assessed, but no ruling has yet been given. Ampla has paid R$66,310 in fines (approximately ThCh$11,662). (*Clarification: The amount of some of the fines has not yet been determined; the amounts will be set after Ampla submits certain data.) The company had received 14 fines in 2012 for a total of R$76,426 (approximately ThCh$13,441). |
| • | | In 2013, the company received four fines totaling R$24,234 (approximately ThCh$4,262) from the Consumer Defense and Protection Agency (PROCON/RJ) due to problems in reimbursing improper payments and other irregularities. The company has filed appeals against all of the fines, and rulings are pending. Ampla had received three fines in 2012 for a total of R$20,840 (approximately ThCh$3,665); rulings on the appeals filed by the company against these sanctions are also pending. |
| • | | The company received one fine in 2013 from the employee defense agencies (SRTE) due to problems with formalities. The company filed an appeal, and the ruling is pending. The labor agencies have not specified the amount of the fine, which it does only after analyzing the appeal. Ampla had received other five fines in 2012, for which rulings are also pending after appeals filed by the company. |
| • | | In 2014, the company received two fines from the National Electrical Energy Agency (ANEEL) for technical quality, totaling €6,759,518 (approximately ThCh$5,294,345). The company has appealed, one was rejected, while the other is still pending resolution. Ampla has paid €1,202,986 (approximately ThCh$942,230). In 2013, Ampla was fined 7 times for service quality totaling €9,368,747 (approximately ThCh$7,338,005), and has paid €843,869 (approximately ThCh$660,954). There are two appeals pending, which were filed by Ampla against the 2013 fines. |
F-107
| • | | In 2014, the company received 15 fines totaling €80,263* (approximately ThCh$62,865) from the environmental agencies (ICMBio, Instituto Chico Mendes de Conservação da Biodiversidade and the INEA, Instituto Estadual de Medioambiente y órgano municipal del medioambiente) for unauthorized suppression of vegetation, the death of animals that have come in contact with the power network, waste dumping and power network construction in prohibited or forbidden areas. The company has appealed almost all of the fines assessed, but no rulings have been handed down as yet. Ampla has paid €460 in fines (approximately ThCh$360). The company received 19 fines in 2013 totaling €35,940* (approximately ThCh$28,150) from the environmental agencies for the same violations as in 2014. The company filed appeals against almost all of the fines received, but no rulings have been handed down as yet. Ampla paid three fines totaling €19,826 (approximately ThCh$15,529) in 2013. (*) Clarification: The amount of some of the fines has not yet been determined; the amounts will be set after Ampla submits certain data.) |
| • | | In 2014 Ampla has received 14 fines totaling €665,565 (approximately ThCh$521,299) from the Brazilian Consumer Defense and Protection Agency (Autarquía de Defensa a Protección del Consumidor, PROCON/RJ) for problems with the quality of its power supply. It has appealed the fines. Only one appeal has been resolved, and Ampla has paid €1,958 (approximately ThCh$1,534). It received four fines totaling €7,616 (approximately ThCh$5,965) in 2013, for which appeals filed by Ampla also remain pending. |
| • | | In 2014, the company received four fines from the employee defense agencies (SRTE) against which it has filed administrative appeals. An appeal was rejected and Ampla has paid the amount of €61.74 (approximately ThCh$48); the others have not yet decided. In 2013, Ampla received one fine for €641 which has already been paid (approximately ThCh$502). |
| • | | In 2015, the company has received 2 fines totaling €134,031 (approximately ThCh$104,979) from the National Electrical Energy Agency (ANEEL) because of the rate “low rent”. The appeals filed by Ampla were partially accepted, and amounts of fines were reduced to €107,261 (approximately ThCh$84,011). Ampla has paid these fines. In 2014, the company received two fines for technical quality of the service, totaling €6,743,609 (approximately ThCh$5,281,884). Ampla has paid €974,291 (approximately ThCh$763,107) of them. One appeal filed by Ampla in 2014 against the fines is still pending. |
| • | | In 2015, the company received 18 fines totaling €167,677 (approximately ThCh$131,332) from the environmental agencies INEA, Instituto Estadual de Medioambiente and ICMBio, Instituto Chico Mendes de Conservação da Biodiversidade and Secretaria Municipal de Medio Ambiente de Niterói and Secretaria Municipal de Medio Ambiente de Angra dos Reis, consisted in 8 warnings and 10 fines for unauthorized suppression of vegetation, death of animals that have come in contact with the power network, waste dumping and power network construction in forbidden areas and others (notification breaches). The company has appealed almost all of the fines assessed, but no rulings have been handed down as yet. The company received 17 fines in 2014 totaling €80,263* (approximately ThCh$62,865) from the environmental agencies (ICMBio, Instituto Chico Mendes de Conservação da Biodiversidade and the INEA, Instituto Estadual de Medioambiente y órgano municipal del medioambiente) for the same violations. The company has appealed almost all of the fines assessed, but no rulings have been handed down as yet. Ampla has paid €460 (approximately ThCh$360) in fines. (*) Clarification: The amount of some of the fines has not yet been determined; the amounts will be set after Ampla submits certain data.) |
| • | | In 2015, Ampla has received 9 fines totaling €1,483,573 (approximately ThCh$1,161,998) from the Brazilian Consumer Defense and Protection Agency (Autarquía de Defensa a Protección del Consumidor, PROCON/RJ) for problems with the quality of its power supply. Ampla has filed 5 appeals against the fines and there are 4 administrative appeals pending of judgment from the agency. In 2014, Ampla received 14 fines totaling €663,530 (approximately ThCh$519,705). Ampla appealed against all of the fines, which remain pending. Ampla has filed 4 appeals against the fines and there are 8 administrative appeals pending of judgment from the agency. Ampla has paid 2 fines for €2,343 (approximately ThCh$1,835). |
F-108
| • | | In 2015, Ampla has not been fined by the employee defense agencies (SRTE). In 2014, the company received four fines from the employee defense agencies (SRTE) against which it has filed administrative appeals. An appeal was rejected and Ampla has paid the amount of €62 (approximately ThCh$49); the others have not been decided yet. |
| 1.2 | Compañía Energética Do Ceará S.A. (Coelce) |
| • | | In 2013, the company received 32 fines totaling R$34,877,282 (approximately ThCh$6,133,921) from the National Electrical Energy Agency (ANEEL) or its local representative (ARCE) for accidents with third parties (there were seven), problems with technical quality of service, erroneous evidence submitted in inspections, irregularities with the Coelce Plus project, and other reasons. The company has filed appeals, and final decisions are pending on 26 sanctions. The other fines were either revoked or paid, for a total of R$395,125 (approximately ThCh$69,491). In 2012 Coelce received 24 fines totaling R$53,810,352 (approximately ThCh$9,463,709), of which R$707,423 (approximately ThCh$124,416) have been paid; the final decision on 16 of the appeals are pending. |
| • | | The company had not been sanctioned by the environmental agencies in 2013 and 2014 (IBAMA, Instituto Brasileiro do Meio Ambiente e dos Recursos Naturals Renováveis, and ICMBio, Instituto Chico Mendes de Conservação da Biodiversidade). |
| • | | Coelce received four fines in 2013 totaling R$21,837 (approximately ThCh$3,841) from the Consumer Defense and Protection Agency (PROCON/CE) for alleged violations of consumer rights. The company filed appeals against all of the fines, and one has not yet been resolved. The other appeals were rejected, and Coelce paid R$15,901 (approximately ThCh$2,797) in fines. Two fines for a total of R$12,953 (approximately ThCh$2,278) were received in 2012, which have been paid. |
| • | | In 2013 the company received two fines from the employee defense agencies (SRTE) due to problems with formalities. The appeal filed by the company was unsuccessful, and the amount of R$9,694 (approximately ThCh$1,705) was paid. The company was not fined by these agencies in 2012. |
| • | | In 2014 the company has received eight fines totaling €8,702,775 (approximately ThCh$6,816,387) from the National Electrical Energy Agency (ANEEL) or its local representative (ARCE) for accidents with third parties among the population, technical quality of the service and errors in the asset base. Coelce has paid €16,319 (approximately ThCh$12,782) for one of the fines and has filed appeals against the others. The company received 32 fines from ANEEL or ARCE in 2013 totaling €10,938,249 (approximately ThCh$8,567,306) for accidents with third parties among the population (there were seven), problems with technical quality of the service, erroneous evidence presented during inspections, irregularities with the Coelce Plus Project and other reasons. The company filed appeals, of which 17 are still pending the final ruling. The other fines were either revoked or paid, for a total of €1,418,561 (approximately ThCh$1,111,078). |
| • | | The company has not been fined in 2013 and 2014 by the environmental agencies (IBAMA, Instituto Brasileiro do Meio Ambiente e dos Recursos Naturals Renováveis, and ICMBio, Instituto Chico Mendes de Conservação da Biodiversidade). |
| • | | Coelce has received four fines in 2014 totaling €24,743 (approximately ThCh$19,380) from the Brazilian Consumer Defense and Protection Agency (PROCON/CE) for allegedly failing to meet deadlines and for damaged equipment. The company has filed three administrative appeals and has paid one fine for €933 (approximately ThCh$731). The company received four fines in 2013 from PROCON/CE totaling €7,220 (approximately ThCh$5,655) for allegedly violating consumers’ rights. The company appealed all of the sanctions, but they were rejected and Coelce has paid the fines. |
| • | | The company received six resolutions from the employee defense agencies (SRTE) in 2014, for accidents suffered by workers. It received two fines in 2013 from the SRTE for failure to comply with formalities. Coelce paid €3,206 (approximately ThCh$2,511) for the 2013 fines. |
F-109
| • | | In 2015, the company has received two fines totaling €1,885,503 (approximately ThCh$1,476,807) from ANEEL or its local representative (ARCE) for problems with technical quality of the service. The company has filed appeals. One case is pending and another one has been rejected. Coelce paid €90,744 (approximately ThCh$71,075) for the fine. The company has received eight fines in 2014 totaling €8,676,161 (approximately ThCh$6,795,542) from the National Electrical Energy Agency (ANEEL) or its local representative (ARCE) for accidents with third parties among the population, technical quality of the service and errors in the asset base. Coelce has paid €16,270 (approximately ThCh$12,743) for two fines and has filed appeals against the others. |
| • | | In 2015, the company has been received one fine totaling €5,731 (approximately ThCh$4,489) for irregular vegetation suppression and others such as notification breach. The company filed the appeal against this fine, which is currently pending. The company has not been fined in 2014 by the environmental agencies (IBAMA, Instituto Brasileiro do Meio Ambiente e dos Recursos Naturals Renováveis, and ICMBio, Instituto Chico Mendes de Conservação da Biodiversidade). |
| • | | In 2015, the company has received a fine totaling €196 (approximately ThCh$154) from the Brazilian Consumer Defense and Protection Agency (PROCON/CE) for allegedly failing to meet deadlines. Coelce has received four fines in 2014 totaling €26,492 (approximately ThCh$20,750) from the Brazilian Consumer Defense and Protection Agency (PROCON/CE) for allegedly failing to meet deadlines and for damaged equipment. The company has filed three administrative appeals, one is still pending, and has paid one fine for €6,874 (approximately ThCh$5,384). |
| • | | In 2015, the company received 14 resolutions from the employee defense agencies (SRTE), for failure to comply with formalities and social securities contributions. The company received six resolutions from the employee defense agencies (SRTE) in 2014, for the same reason. |
| 1.3 | Compañía de Interconexión Energética S.A. (CIEN) |
| • | | In 2013 the company received one fine for R$32,136 (approximately ThCh$5,562) from the National Electrical Energy Agency (ANEEL) for a formal breach (a failure to submit documentation). The company appealed, and the decision is pending. The company was not fined by this agency in 2012. |
| • | | The company has not been fined for other matters in 2012 and 2013 (environmental, consumer or labor). |
| • | | CIEN has not been fined by the National Electrical Energy Agency (ANEEL) in 2014. In 2013, the company received one fine from the ANEEL for €10,100 (approximately ThCh$7,911) for a formal breach (a failure to present documentation). Cien filed an appeal, which was accepted, and the fine was annulled by the court. |
| • | | In 2014, the company received two fines from the employee defense agencies (SRTE) and the company has filed appeals against them. CIEN has paid a fine of €61.74 (approximately Ch$48) and the appeal against the other fine has not yet been decided. In 2013, the company was not fined. |
| • | | The company has not been fined for other matters in 2013 and 2014 (environmental or labor). |
| • | | CIEN has not been fined by ANEEL or by any other supervisory authority in 2014 and 2015. |
| • | | In 2015 the company has not been fined. In 2014, the company received two fines from the employee defense agencies (SRTE) and the company has filed appeals against them. CIEN has paid a fine of €61.74 (approximately Ch$48) and the appeal against the other fine has not yet been decided. In 2013, the company was not fined. |
| • | | The company has not been fined for other environmental matters in 2014 and 2015. |
F-110
| 1.4. | Transportadora de Energía S.A. (TESA, or Transener S.A.) |
| • | | During 2013, the Electricity Regulatory Body (ENRE) issued penalties related to scheduled maintenance of the Rincón Santa Maria transformer station and transmission line down-time, for $38,487.65 Argentine pesos (approximately ThCh$2,854). In 2014, TESA made a partial payment, including interests, of $46,072.38 Argentine pesos (approximately ThCh$3,417). |
| • | | During 2014, the ENRE issued penalties related to scheduled maintenance of the Rincón Santa Maria transformer station and transmission line down-time for $15,820 Argentine pesos (approximately ThCh$1,173). To date, Transportadora de Energía S.A. made a partial payment, including interests, of $17,951 Argentine pesos (approximately ThCh$1,331). |
| • | | During the first three quarters of 2015, the ENRE issued penalties related to scheduled maintenance of the Rincón Santa Maria transformer station and transmission line down-time, for $17,104 Argentine pesos (approximately ThCh$1,268) which are pending payment, as the invoices from Transener S.A. have not been received yet. |
| 1.5. | Compañía de Transmisión del Mercosur S.A. (CTM S.A.) |
| • | | During 2013, the ENRE issued five penalties related to scheduled maintenance of the Rincón Santa Maria transformer station and transmission line down-time for $7,896.95 Argentine pesos (approximately ThCh$586) which Compañía de Transmisión del Mercosur S.A. in 2013 and 2014 made a payment of $11,337.32 Argentine pesos (approximately ThCh$841) including interests. |
| • | | During 2014, the ENRE issued three penalties related to scheduled maintenance of the Rincón Santa Maria transformer station for $5,268 Argentine pesos (approximately ThCh$391) which Compañía de Transmisión del Mercosur S.A. in 2014 made a payment of $7,543.73 Argentine pesos (approximately ThCh$559) including interests. |
| • | | During the first three quarters of 2015, the ENRE issued two penalties related to scheduled maintenance of the Rincón Santa Maria transformer station and transmission line down-time, for $34,618 Argentine pesos (approximately ThCh$2,567) which Compañía de Transmisión del Mercosur S.A. made a partial payment for $2,945 Argentine pesos (approximately ThCh$218), the remaining amount will be paid once the invoices from Transener S.A. are received. |
The Combined Group has not received other fines from the SVS nor from other administrative authorities.
F-111
Environmental expenses for the nine months ended September 30, 2015 and 2014 are as follows:
| | | | | | | | | | | | | | | | | | | | | | | | | | | | | | | | | | |
Company | | Project Name | | Description of the Environment | | Project
Status
(Finished,
In
process) | | 9-30-2015
ThCh$ | | | 9-30-2014
ThCh$ | |
| | | | | Disbursement
amount | | | Prior period
disbursement
amount | | | Expense
amount | | | Future
disbur-
sement
amount | | | Estimated
date of
future
disbur-
sement | | | Total
disbursements | | | Prior period
disbursement
amount | |
Empresa Generadora de Energía Eléctrica S.A. | | El Quimbo Hydroelectric Project | | Central construction environmental management El Quimbo | | In process | | | — | | | | — | | | | — | | | | 132,358,952 | | | | 12-31-2020 | | | | 132,358,952 | | | | 39,951,369 | |
| | Environmental management
HIDRA | | Central Environmental Management Plan | | In process | | | 115,659 | | | | 115,659 | | | | — | | | | — | | | | — | | | | 115,659 | | | | 492,472 | |
Edegel S.A.A. | | Prevention activities | | Biodiversity protection of the environment, waste water treatment | | Finished | | | 64,048 | | | | — | | | | 64,048 | | | | 22,904 | | | | 12-31-2015 | | | | 86,952 | | | | 156,570 | |
| | Landscaping and green areas | | Maintenance of green areas, landscaping and minor fauna | | Finished | | | — | | | | — | | | | — | | | | 4,742 | | | | 12-31-2015 | | | | 4,742 | | | | 206,909 | |
| | Environmental monitoring | | Protection of air and climate, noise reduction, protection against radiation | | Finished | | | 18,445 | | | | — | | | | 18,445 | | | | 19,671 | | | | 12-31-2015 | | | | 38,116 | | | | 16,722 | |
| | Waste management | | Hazardous waste management | | Finished | | | 111,559 | | | | — | | | | 111,559 | | | | 28,779 | | | | 12-31-2015 | | | | 140,338 | | | | 8,044 | |
| | Environmental studies | | Studies on environmental issues | | Finished | | | 2,529 | | | | — | | | | 2,529 | | | | 26,277 | | | | 12-31-2015 | | | | 28,806 | | | | 6,824 | |
| | Mitigations and restorations | | Protection and reclamation and water | | Finished | | | 127,718 | | | | — | | | | 127,718 | | | | 13,070 | | | | 12-31-2015 | | | | 140,788 | | | | 177,830 | |
| | Compensation for impacts | | Compensation increases of green areas | | Finished | | | 88,643 | | | | — | | | | 88,643 | | | | 48,482 | | | | 12-31-2015 | | | | 137,125 | | | | 76,405 | |
Chinango S.A.C. | | Prevention activities | | Biodiversity protection of the environment, waste water treatment | | Finished | | | 71,008 | | | | — | | | | 71,008 | | | | — | | | | 12-31-2015 | | | | 71,008 | | | | 5,974 | |
| | Landscaping and green areas | | Maintenance of green areas, landscaping and minor fauna | | Finished | | | 4,960 | | | | — | | | | 4,960 | | | | 3,042 | | | | 12-31-2015 | | | | 8,002 | | | | 5,934 | |
| | Environmental monitoring | | Protection of air and climate, noise reduction, protection against radiation | | Finished | | | 153,635 | | | | — | | | | 153,635 | | | | 4,826 | | | | 12-31-2015 | | | | 158,461 | | | | 239,904 | |
| | Waste management | | Hazardous waste management | | Finished | | | 26,743 | | | | — | | | | 26,743 | | | | 21,267 | | | | 12-31-2015 | | | | 48,010 | | | | 31,460 | |
| | Environmental studies | | Studies on environmental issues | | Finished | | | — | | | | — | | | | — | | | | 19,204 | | | | 12-31-2015 | | | | 19,204 | | | | 5,229 | |
| | Mitigations and restorations | | Protection and reclamation and water | | Finished | | | — | | | | — | | | | — | | | | 9,602 | | | | 12-31-2015 | | | | 9,602 | | | | 4,398 | |
| | Compensation for impacts | | Compensation increases of green areas | | Finished | | | — | | | | — | | | | — | | | | 3,783 | | | | 12-31-2015 | | | | 3,783 | | | | 49,390 | |
| | | | | | | | | | | | | | | | | | | | | | | | | | | | | | | | | | |
Total | | | | | | | | | 784,947 | | | | 115,659 | | | | 669,288 | | | | 132,584,601 | | | | | | | | 133,369,548 | | | | 41,435,434 | |
| | | | | | | | | | | | | | | | | | | | | | | | | | | | | | | | | | |
| | | | | | | | | | | | | | | | | | | | | | | | | | | | | | |
Company | | Project Name | | Description of the Environment | | Project
Status
(Finished,
In
Process) | | 9-30-2014
ThCh$ (Unaudited) | |
| | | | | Disbursement
amount | | | Capitalized
amount | | | Expense
amount | | | Future
disbursement
amount | | | Estimated
date of
future
disbursement | | | Total
disbur-
sements | |
Empresa Generadora de Energía Eléctrica S.A. | | El Quimbo Hydroelectric Project | | Central construction environmental management El Quimbo | | In process | | | 32,093,193 | | | | 32,093,193 | | | | — | | | | 7,858,176 | | | | 12-31-2015 | | | | 39,951,369 | |
| | Environmental management
HIDRA | | Central Environmental Management Plan | | In process | | | 492,472 | | | | 492,472 | | | | — | | | | — | | | | — | | | | 492,472 | |
Edegel S.A.A. | | Environmental studies | | Studies on environmental issues | | Finished | | | 111,334 | | | | — | | | | 111,334 | | | | 45,236 | | | | 12-31-2014 | | | | 156,570 | |
| | Waste management | | Hazardous waste management | | Finished | | | 83,436 | | | | — | | | | 83,436 | | | | 123,473 | | | | 12-31-2014 | | | | 206,909 | |
| | Environmental monitoring | | Protection of air and climate, noise reduction, protection against radiation | | Finished | | | 24,449 | | | | — | | | | 24,449 | | | | -7,727 | | | | 12-31-2014 | | | | 16,722 | |
| | Mitigations and restorations | | Protection and reclamation and water | | Finished | | | 3,964 | | | | — | | | | 3,964 | | | | 4,080 | | | | 12-31-2014 | | | | 8,044 | |
| | Compensation for impacts | | Compensation increases of green areas | | Finished | | | 2,317 | | | | — | | | | 2,317 | | | | 4,507 | | | | 12-31-2014 | | | | 6,824 | |
| | Landscaping and green areas | | Maintenance of green areas, landscaping and minor fauna | | Finished | | | 110,910 | | | | — | | | | 110,910 | | | | 66,920 | | | | 12-31-2014 | | | | 177,830 | |
| | Prevention activities | | Biodiversity protection of the environment, waste water treatment | | Finished | | | 67,369 | | | | — | | | | 67,369 | | | | 9,036 | | | | 12-31-2014 | | | | 76,405 | |
Chinango S.A.C. | | Prevention activities | | Biodiversity protection of the environment, waste water treatment | | Finished | | | — | | | | — | | | | — | | | | 5,974 | | | | 12-31-2014 | | | | 5,974 | |
| | Landscaping and green areas | | Maintenance of green areas, landscaping and minor fauna | | Finished | | | 5,210 | | | | — | | | | 5,210 | | | | 724 | | | | 12-31-2014 | | | | 5,934 | |
| | Environmental monitoring | | Protection of air and climate, noise reduction, protection against radiation | | Finished | | | 182,051 | | | | — | | | | 182,051 | | | | 57,853 | | | | 12-31-2014 | | | | 239,904 | |
| | Waste management | | Hazardous waste management | | Finished | | | 25,192 | | | | — | | | | 25,192 | | | | 6,268 | | | | 12-31-2014 | | | | 31,460 | |
| | Environmental studies | | Studies on environmental issues | | Finished | | | 5,146 | | | | — | | | | 5,146 | | | | 83 | | | | 12-31-2014 | | | | 5,229 | |
| | Mitigations and restorations | | Protection and reclamation and water | | Finished | | | — | | | | — | | | | — | | | | 4,398 | | | | 12-31-2014 | | | | 4,398 | |
| | Compensation for impacts | | Compensation increases of green areas | | Finished | | | 28,648 | | | | — | | | | 28,648 | | | | 20,742 | | | | 12-31-2014 | | | | 49,390 | |
| | | | | | | | | | | | | | | | | | | | | | | | | | | | | | |
Total | | | | | | | | | 33,235,691 | | | | 32,585,665 | | | | 650,026 | | | | 8,199,743 | | | | | | | | 41,435,434 | |
| | | | | | | | | | | | | | | | | | | | | | | | | | | | | | |
F-112
| 34. | FINANCIAL INFORMATION ON COMBINED ENTITIES, SUMMARIZED |
As of September 30, 2015 and December 31, 2014, and for the nine months ended September 30, 2015 and for the year ended December 31, 2014 the summarized financial information of our principal combined entities under IFRS is as follows:
| | | | | | | | | | | | | | | | | | | | | | | | | | | | | | | | | | | | | | | | | | | | | | | | | | | | |
SUMMARY OF THE COMBINED GROUP CONSOLIDATION, BY COMBINED ENTITIES | |
| | | As of and for the nine months ended September 30, 2015 | |
| | | Financial
Statements | | | Current
Assets | | | Non-current
Assets | | | Total Assets | | | Current
Liabilities | | | Non-current
Liabilities | | | Equity | | | Total
Liabilities | | | Revenues | | | Costs | | | Profit
(Loss) | | | Other
Comprehensive
Income | | | Total
Comprehensive
Income | |
| | | | ThCh$ | | | ThCh$ | | | ThCh$ | | | ThCh$ | | | ThCh$ | | | ThCh$ | | | ThCh$ | | | ThCh$ | | | ThCh$ | | | ThCh$ | | | ThCh$ | | | ThCh$ | |
Endesa Argentina S.A. | | | Separate | | | | 2,179,342 | | | | 43,315,153 | | | | 45,494,495 | | | | (594,993 | ) | | | — | | | | (44,899,502 | ) | | | (45,494,495 | ) | | | — | | | | — | | | | 131,136 | | | | 1,512,867 | | | | 1,644,003 | |
Central Costanera S.A. | | | Separate | | | | 36,476,564 | | | | 160,998,482 | | | | 197,475,046 | | | | (117,075,430 | ) | | | (52,504,176 | ) | | | (27,895,440 | ) | | | (197,475,046 | ) | | | 72,153,948 | | | | (3,423,004 | ) | | | 6,334,526 | | | | 968,009 | | | | 7,302,535 | |
Hidroinvest S.A. | | | Separate | | | | 607,023 | | | | 15,483,726 | | | | 16,090,749 | | | | (457,254 | ) | | | — | | | | (15,633,495 | ) | | | (16,090,749 | ) | | | — | | | | — | | | | 5,928 | | | | 526,581 | | | | 532,509 | |
H. El Chocón S.A. | | | Separate | | | | 49,578,049 | | | | 147,904,679 | | | | 197,482,728 | | | | (54,693,928 | ) | | | (43,623,730 | ) | | | (99,165,070 | ) | | | (197,482,728 | ) | | | 30,239,495 | | | | (5,704,047 | ) | | | 12,487,976 | | | | 3,453,593 | | | | 15,941,569 | |
Southern Cone Power Argentina S.A. | | | Separate | | | | 10,841 | | | | 779,663 | | | | 790,504 | | | | (15,149 | ) | | | — | | | | (775,355 | ) | | | (790,504 | ) | | | — | | | | — | | | | (5,071 | ) | | | 26,092 | | | | 21,021 | |
Emgesa S.A. E.S.P. | | | Separate | | | | 228,589,111 | | | | 1,801,619,258 | | | | 2,030,208,369 | | | | (454,396,679 | ) | | | (810,442,545 | ) | | | (765,369,145 | ) | | | (2,030,208,369 | ) | | | 525,190,774 | | | | (165,225,231 | ) | | | 175,012,364 | | | | (84,540,490 | ) | | | 90,471,874 | |
Generandes Perú S.A. | | | Separate | | | | 13,255,720 | | | | 233,538,302 | | | | 246,794,022 | | | | (10,078 | ) | | | — | | | | (246,783,944 | ) | | | (246,794,022 | ) | | | 0 | | | | — | | | | 34,793,070 | | | | 14,602,802 | | | | 49,395,872 | |
Edegel S.A.A. | | | Separate | | | | 95,859,858 | | | | 752,272,073 | | | | 848,131,931 | | | | (106,976,611 | ) | | | (198,659,324 | ) | | | (542,495,996 | ) | | | (848,131,931 | ) | | | 248,775,223 | | | | (103,959,244 | ) | | | 69,610,468 | | | | 26,818,381 | | | | 96,428,849 | |
Chinango S.A.C. | | | Separate | | | | 7,428,928 | | | | 117,080,661 | | | | 124,509,589 | | | | (9,134,670 | ) | | | (41,579,620 | ) | | | (73,795,299 | ) | | | (124,509,589 | ) | | | 28,305,180 | | | | (5,944,175 | ) | | | 11,399,682 | | | | 3,024,897 | | | | 14,424,579 | |
Grupo Generandes Perú | | | Consolidated | | | | 116,342,382 | | | | 836,426,782 | | | | 952,769,164 | | | | (115,919,237 | ) | | | (240,238,943 | ) | | | (596,610,984 | ) | | | (952,769,164 | ) | | | 276,760,968 | | | | (109,584,373 | ) | | | 70,907,283 | | | | 13,921,474 | | | | 84,828,757 | |
Grupo Endesa Argentina | | | Consolidated | | | | 87,504,682 | | | | 311,692,619 | | | | 399,197,301 | | | | (171,485,311 | ) | | | (94,618,916 | ) | | | (133,093,074 | ) | | | (399,197,301 | ) | | | 102,315,860 | | | | (9,127,051 | ) | | | 17,558,360 | | | | 4,618,982 | | | | 22,177,342 | |
| | | | | | | | | | | | | | | | | | | | | | | | | | | | | | | | | | | | | | | | | | | | | | | | | | | | |
SUMMARY OF THE COMBINED GROUP CONSOLIDATION, BY COMBINED ENTITIES | |
| | | As of and for the year ended December 31, 2014 | |
| | | Financial
Statements | | | Current
Assets | | | Non-current
Assets | | | Total Assets | | | Current
Liabilities | | | Non-current
Liabilities | | | Equity | | | Total
Liabilities | | | Revenues | | | Costs | | | Profit
(Loss) | | | Other
Comprehensive
Income | | | Total
Comprehensive
Income | |
| | | | ThCh$ | | | ThCh$ | | | ThCh$ | | | ThCh$ | | | ThCh$ | | | ThCh$ | | | ThCh$ | | | ThCh$ | | | ThCh$ | | | ThCh$ | | | ThCh$ | | | ThCh$ | |
Endesa Argentina S.A. | | | Separate | | | | 1,924,047 | | | | 42,081,267 | | | | 44,005,314 | | | | 749,815 | | | | — | | | | 43,255,499 | | | | 44,005,314 | | | | — | | | | — | | | | 340,599 | | | | (5,299,756 | ) | | | (4,959,157 | ) |
Central Costanera S.A. | | | Separate | | | | 31,868,372 | | | | 154,649,134 | | | | 186,517,506 | | | | 108,956,607 | | | | 56,967,994 | | | | 20,592,905 | | | | 186,517,506 | | | | 75,193,639 | | | | (6,777,139 | ) | | | 45,532,654 | | | | 3,989,198 | | | | 49,521,852 | |
Hidroinvest S.A. | | | Separate | | | | 562,612 | | | | 14,962,217 | | | | 15,524,829 | | | | 423,843 | | | | — | | | | 15,100,986 | | | | 15,524,829 | | | | — | | | | — | | | | (2,811 | ) | | | (1,868,145 | ) | | | (1,870,956 | ) |
H. El Chocón S.A. | | | Separate | | | | 22,930,536 | | | | 137,891,546 | | | | 160,822,082 | | | | 31,540,350 | | | | 46,058,232 | | | | 83,223,500 | | | | 160,822,082 | | | | 30,173,576 | | | | (8,427,057 | ) | | | 11,036,822 | | | | (8,763,212 | ) | | | 2,273,610 | |
Southern Cone Power Argentina S.A. | | | Separate | | | | 4,162 | | | | 753,403 | | | | 757,565 | | | | 3,229 | | | | — | | | | 754,336 | | | | 757,565 | | | | — | | | | — | | | | (4,919 | ) | | | (94,023 | ) | | | (98,942 | ) |
Emgesa S.A. E.S.P. | | | Separate | | | | 329,672,209 | | | | 1,782,307,979 | | | | 2,111,980,188 | | | | 500,414,812 | | | | 883,041,284 | | | | 728,524,092 | | | | 2,111,980,188 | | | | 753,385,348 | | | | (220,460,069 | ) | | | 288,821,398 | | | | (73,145,883 | ) | | | 215,675,515 | |
Generandes Perú S.A. | | | Separate | | | | 3,473,185 | | | | 219,325,990 | | | | 222,799,175 | | | | 3,148,425 | | | | — | | | | 219,650,750 | | | | 222,799,175 | | | | — | | | | — | | | | 46,503,610 | | | | 12,303,680 | | | | 58,807,290 | |
Edegel S.A.A. | | | Separate | | | | 110,164,628 | | | | 720,449,664 | | | | 830,614,292 | | | | 85,724,692 | | | | 235,667,176 | | | | 509,222,424 | | | | 830,614,292 | | | | 319,346,826 | | | | (127,881,082 | ) | | | 106,139,399 | | | | 23,688,400 | | | | 129,827,799 | |
Chinango S.A.C. | | | Separate | | | | 8,439,096 | | | | 111,912,667 | | | | 120,351,763 | | | | 7,433,439 | | | | 39,382,244 | | | | 73,536,080 | | | | 120,351,763 | | | | 34,656,130 | | | | (6,061,046 | ) | | | 15,011,421 | | | | 3,041,428 | | | | 18,052,849 | |
Grupo Generandes Perú | | | Consolidated | | | | 121,446,538 | | | | 816,077,565 | | | | 937,524,103 | | | | 95,676,185 | | | | 275,049,420 | | | | 566,798,498 | | | | 937,524,103 | | | | 353,794,700 | | | | (133,734,610 | ) | | | 111,350,114 | | | | 23,873,097 | | | | 135,223,211 | |
Grupo Endesa Argentina | | | Consolidated | | | | 56,074,841 | | | | 297,050,238 | | | | 353,125,079 | | | | 140,459,888 | | | | 101,749,459 | | | | 110,915,732 | | | | 353,125,079 | | | | 105,265,323 | | | | (15,204,196 | ) | | | 56,511,593 | | | | (5,660,609 | ) | | | 50,850,984 | |
The interim combined financial statements reflect our evaluation of all events that have occurred subsequent to September 30, 2015 through December 17, 2015, which is the date that the interim combined financial statements are available to be issued.
F-113
APPENDIX 1 COMBINED GROUP COMPANIES
This appendix is part of Note 2.4, “Combined Entities”. It presents the Combined Group’s percentage of control in each combined entity.
| | | | | | | | | | | | | | | | | | | | | | | | | | | | | | | | | | |
Taxpayer ID No. | | Company | | | | Percentage of control as of
9-30-2015 | | | Percentage of control as of
12-31-2014 | | | Country | | | Activity |
| | (in alphabetical order) | | Currency | | Direct | | | Indirect | | | Total | | | Direct | | | Indirect | | | Total | | | |
Foreign | | Chinango S.A.C. | | Peruvian sol | | | 0.00 | % | | | 80.00 | % | | | 80.00 | % | | | 0.00 | % | | | 80.00 | % | | | 80.00 | % | | | Peru | | | Electric energy generation, sales, and distribution |
Foreign | | Edegel S.A.A. | | Peruvian sol | | | 29.40 | % | | | 54.20 | % | | | 83.60 | % | | | 29.40 | % | | | 54.20 | % | | | 83.60 | % | | | Peru | | | Electric energy generation, sales, and distribution |
Foreign | | Emgesa S.A. E.S.P. (1) | | Colombian peso | | | 56.43 | % | | | 0.00 | % | | | 56.43 | % | | | 56.43 | % | | | 0.00 | % | | | 56.43 | % | | | Colombia | | | Electric energy generation |
Foreign | | Emgesa Panama S.A. (1) | | U.S. dollar | | | 0.00 | % | | | 56.43 | % | | | 56.43 | % | | | 0.00 | % | | | 56.43 | % | | | 56.43 | % | | | Colombia | | | Electric energy purchases and sales |
Foreign | | Endesa Argentina S.A. | | Argentine peso | | | 99.66 | % | | | 0.34 | % | | | 100.00 | % | | | 99.66 | % | | | 0.34 | % | | | 100.00 | % | | | Argentina | | | Portfolio company |
Foreign | | Central Costanera S.A. | | Argentine peso | | | 24.85 | % | | | 50.82 | % | | | 75.67 | % | | | 24.85 | % | | | 50.82 | % | | | 75.67 | % | | | Argentina | | | Electric energy generation and sales |
Foreign | | Generandes Perú S.A. | | Peruvian sol | | | 61.00 | % | | | 00.00 | % | | | 61.00 | % | | | 61.00 | % | | | 00.00 | % | | | 61.00 | % | | | Peru | | | Portfolio company |
Foreign | | Hidroeléctrica El Chocón S.A. | | Argentine peso | | | 2.48 | % | | | 65.19 | % | | | 67.67 | % | | | 2.48 | % | | | 65.19 | % | | | 67.67 | % | | | Argentina | | | Electric energy production and sales |
Foreign | | Hidroinvest S.A. | | Argentine peso | | | 41.94 | % | | | 54.15 | % | | | 96.09 | % | | | 41.94 | % | | | 54.15 | % | | | 96.09 | % | | | Argentina | | | Portfolio company |
Foreign | | Ingendesa do Brasil Ltda. | | Brazilian real | | | 1.00 | % | | | 99.00 | % | | | 100.00 | % | | | 1.00 | % | | | 99.00 | % | | | 100.00 | % | | | Brazil | | | Project engineering consulting |
Foreign | | Sociedad Portuaria Central Cartagena S.A. | | Colombian peso | | | 0.00 | % | | | 94.95 | % | | | 94.95 | % | | | 0.00 | % | | | 94.95 | % | | | 94.95 | % | | | Colombia | | | Investment, construction and maintenance of public or private wharves and ports |
Foreign | | Southern Cone Power Argentina S.A. | | Argentine peso | | | 98.00 | % | | | 2.00 | % | | | 100.00 | % | | | 98.00 | % | | | 2.00 | % | | | 100.00 | % | | | Argentina | | | Portfolio company |
F-114
APPENDIX 2 ASSOCIATED COMPANIES AND JOINT VENTURES
This appendix is part of Note 2.5, “Investments in combined associated companies and joint arrangements”
| | | | | | | | | | | | | | | | | | | | | | | | | | | | | | | | | | | | | | |
Taxpayer ID No. | | Company (in alphabetical order) | | Currency | | Ownership Interest
as of 9-30-2015 | | | Ownership Interest as of
12-31-2014 | | | | | | Country | | | Activity |
| | | | Direct | | | Indirect | | | Total | | | Direct | | | Indirect | | | Total | | | Relationship | | | |
Foreign | | Enel Brasil S.A. (1) | | Brazilian real | | | 34.64 | % | | | 4.00 | % | | | 38.64 | % | | | 34.64 | % | | | 4.00 | % | | | 38.64 | % | | | Associate | | | | Brazil | | | Portfolio company |
Foreign | | Endesa Cemsa S.A. | | Argentine peso | | | 0.00 | % | | | 45.00 | % | | | 45.00 | % | | | 0.00 | % | | | 45.00 | % | | | 45.00 | % | | | Associate | | | | Argentina | | | Wholesale purchase and sale of electric energy |
Foreign | | Distrilec Inversora S.A. (2) | | Argentine peso | | | 0.89 | % | | | 0.00 | % | | | 0.89 | % | | | 0.89 | % | | | 0.00 | % | | | 0.89 | % | | | Associate | | | | Argentina | | | Portfolio company |
Foreign | | Central Térmica Manuel Belgrano | | Argentine peso | | | 0.00 | % | | | 24.18 | % | | | 24.18 | % | | | 0.00 | % | | | 24.18 | % | | | 24.18 | % | | | Associate | | | | Argentina | | | Production and Marketing of Electric Energy |
Foreign | | Central Térmica San Martin | | Argentine peso | | | 0.00 | % | | | 24.18 | % | | | 24.18 | % | | | 0.00 | % | | | 24.18 | % | | | 24.18 | % | | | Associate | | | | Argentina | | | Production and Marketing of Electric Energy |
Foreign | | Central Vuelta Obligada S.A. | | Argentine peso | | | 0.00 | % | | | 3.45 | % | | | 3.45 | % | | | 0.00 | % | | | 3.45 | % | | | 3.45 | % | | | Associate | | | | Argentina | | | Production and Marketing of Electric Energy |
| (1) | Change in legal name on December 12, 2014 from Endesa Brasil S.A. to Enel Brasil S.A. |
| (2) | There is a significant influence because our ultimate controlling company owns directly and indirectly a 51.5% interest in Distrilec Inversora S.A. |
F-115
APPENDIX 3 ADDITIONAL INFORMATION ON FINANCIAL DEBT
This appendix is part of Note 16, “Other financial liabilities”.
The following tables present the contractual undiscounted cash flows by type of financial debt:
| • | | Summary of bank borrowing by currency and maturity |
| | | | | | | | | | | | | | | | | | | | | | | | | | | | | | | | | | | | | | | | | | | | | | | | | | |
Country | | Currency | | Effective
Interest
Rate | | | Nominal
Interest
Rate | | | Secured
(Yes/No) | | | Balance as of 9-30-2015 | |
| | | | | | Current | | | Non-current | |
| | | | | | One to
three
months | | | Three to
twelve
months | | | Total
Current | | | One to
two years | | | Two to
three
years | | | Three to
four years | | | Four to
five years | | | More
than five
years | | | Total Non-
current | |
| | | | | | ThCh$ | | | ThCh$ | | | ThCh$ | | | ThCh$ | | | ThCh$ | | | ThCh$ | | | ThCh$ | | | ThCh$ | | | ThCh$ | |
Peru | | US$ | | | 2.45 | % | | | 2.35 | % | | | No | | | | 1,150,824 | | | | 28,456,241 | | | | 29,607,065 | | | | 4,205,622 | | | | 19,746,552 | | | | 592,873 | | | | — | | | | — | | | | 24,545,047 | |
Argentina | | US$ | | | 13.76 | % | | | 13.06 | % | | | No | | | | 3,979,603 | | | | 3,839,835 | | | | 7,819,438 | | | | — | | | | — | | | | — | | | | — | | | | — | | | | — | |
Argentina | | Ar$ | | | 40.97 | % | | | 35.30 | % | | | No | | | | 4,203,047 | | | | 7,676,216 | | | | 11,879,263 | | | | 2,536,846 | | | | — | | | | — | | | | — | | | | — | | | | 2,536,846 | |
Colombia | | CP | | | 5.94 | % | | | 5.81 | % | | | No | | | | 63,516,739 | | | | 86,943,486 | | | | 150,460,225 | | | | 13,586,099 | | | | 12,946,231 | | | | 12,306,362 | | | | 11,666,493 | | | | 35,793,758 | | | | 86,298,943 | |
| | | | | | | | | | | | | | | | | | | | | | | | | | | | | | | | | | | | | | | | | | | | | | | | | | |
| | | | | | | | | | | | | Total | | | | 72,850,213 | | | | 126,915,778 | | | | 199,765,991 | | | | 20,328,567 | | | | 32,692,783 | | | | 12,899,235 | | | | 11,666,493 | | | | 35,793,758 | | | | 113,380,836 | |
| | | | | | | | | | | | | | | | | | | | | | | | | | | | | | | | | | | | | | | | | | | | | | | | | | |
| | | | | | | | | | | | | | | | | | | | | | | | | | | | | | | | | | | | | | | | | | | | | | | | | | |
Country | | Currency | | Effective
Interest
Rate | | | Nominal
Interest
Rate | | | Secured
(Yes/No) | | | Balance as of 12-31-2014 | |
| | | | | | Current | | | Non-current | |
| | | | | | One to
three
months | | | Three to
twelve
months | | | Total
Current | | | One to
two years | | | Two to
three
years | | | Three to
four years | | | Four to
five years | | | More
than five
years | | | Total Non-
current | |
| | | | | | ThCh$ | | | ThCh$ | | | ThCh$ | | | ThCh$ | | | ThCh$ | | | ThCh$ | | | ThCh$ | | | ThCh$ | | | ThCh$ | |
Perú | | US$ | | | 2.45 | % | | | 2.35 | % | | | No | | | | 2,914,574 | | | | 9,996,364 | | | | 12,910,938 | | | | 40,274,383 | | | | 18,781,256 | | | | 16,391,794 | | | | 256,394 | | | | — | | | | 75,703,827 | |
Argentina | | US$ | | | 13.76 | % | | | 13.06 | % | | | No | | | | 2,808,939 | | | | 12,054,341 | | | | 14,863,280 | | | | 1,039,398 | | | | — | | | | — | | | | — | | | | — | | | | 1,039,398 | |
Argentina | | Ar$ | | | 40.97 | % | | | 35.30 | % | | | No | | | | 4,667,574 | | | | 8,107,262 | | | | 12,774,836 | | | | 7,968,912 | | | | 188,784 | | | | — | | | | — | | | | — | | | | 8,157,696 | |
Colombia | | CP | | | 5.94 | % | | | 5.81 | % | | | No | | | | 1,401,291 | | | | 4,203,875 | | | | 5,605,166 | | | | 10,766,379 | | | | 15,367,075 | | | | 14,619,719 | | | | 13,872,363 | | | | 48,015,897 | | | | 102,641,433 | |
| | | | | | | | | | | | | | | | | | | | | | | | | | | | | | | | | | | | | | | | | | | | | | | | | | |
| | | | | | | | | | | | | Total | | | | 11,792,378 | | | | 34,361,842 | | | | 46,154,220 | | | | 60,049,072 | | | | 34,337,115 | | | | 31,011,513 | | | | 14,128,757 | | | | 48,015,897 | | | | 187,542,354 | |
| | | | | | | | | | | | | | | | | | | | | | | | | | | | | | | | | | | | | | | | | | | | | | | | | | |
F-116
| • | | Identification of bank borrowings by company |
| | | | | | | | | | | | | | | | | | | | | | | | | | | | | | | | | | | | | | | | | | | | | | | | | | | | | | | | |
Taxpayer ID
No. (RUT) | | Company | | Country | | ID No.
Financial
Institution | | Financial Institution | | Country | | Currency | | Effective
Interest
Rate | | | Nominal
Interest
Rate | | | Balance as of 9-30-2015 | |
| | | | | | | | | | Current | | | Non-current | |
| | | | | | | | | | One to
three
months | | | Three to
twelve
months | | | Total
Current | | | One to
two years | | | Two to
three
years | | | Three to
four years | | | Four to
five years | | | More
than five
years | | | Total Non-
current | |
| | | | | | | | | | ThCh$ | | | ThCh$ | | | ThCh$ | | | ThCh$ | | | ThCh$ | | | ThCh$ | | | ThCh$ | | | ThCh$ | | | ThCh$ | |
Foreign | | Chinango S.A.C. | | Peru | | Foreign | | Banco de Credito del Perú | | Peru | | US$ | | | 2.12 | % | | | 2.01 | % | | | 295,857 | | | | 881,570 | | | | 1,177,427 | | | | 1,161,422 | | | | 18,091,967 | | | | — | | | | — | | | | — | | | | 19,253,389 | |
Foreign | | Chinango S.A.C. | | Peru | | Foreign | | Bank Of Nova Scotia | | Peru | | US$ | | | 3.18 | % | | | 3.01 | % | | | 465,218 | | | | 1,376,092 | | | | 1,841,310 | | | | 1,789,142 | | | | 439,134 | | | | — | | | | — | | | | — | | | | 2,228,276 | |
Foreign | | Chinango S.A.C. | | Peru | | Foreign | | Bank Of Nova Scotia | | Peru | | US$ | | | 3.48 | % | | | 3.40 | % | | | 327,380 | | | | 967,286 | | | | 1,294,666 | | | | 1,255,058 | | | | 1,215,451 | | | | 592,873 | | | | — | | | | — | | | | 3,063,382 | |
Foreign | | Edegel S.A.A | | Peru | | Foreign | | Bank Nova Scotia | | Peru | | US$ | | | 1.02 | % | | | 1.00 | % | | | 62,369 | | | | 25,231,293 | | | | 25,293,662 | | | | — | | | | — | | | | — | | | | — | | | | — | | | | — | |
Foreign | | Emgesa S.A. E.S.P. | | Colombia | | Foreign | | BBVA Colombia | | Colombia | | CP | | | 6.71 | % | | | 6.60 | % | | | 902,606 | | | | 2,707,818 | | | | 3,610,424 | | | | 10,088,020 | | | | 9,606,631 | | | | 9,125,241 | | | | 8,643,851 | | | | 26,462,533 | | | | 63,926,276 | |
Foreign | | Emgesa S.A. E.S.P. | | Colombia | | Foreign | | Banco de Bogota | | Colombia | | CP | | | 6.74 | % | | | 6.63 | % | | | 297,148 | | | | 891,445 | | | | 1,188,593 | | | | 3,498,079 | | | | 3,339,600 | | | | 3,181,121 | | | | 3,022,642 | | | | 9,331,225 | | | | 22,372,667 | |
Foreign | | Emgesa S.A. E.S.P. | | Colombia | | Foreign | | AV VILLAS | | Colombia | | CP | | | 5.62 | % | | | 5.51 | % | | | 150,501 | | | | 11,073,544 | | | | 11,224,045 | | | | — | | | | — | | | | — | | | | — | | | | — | | | | — | |
Foreign | | Emgesa S.A. E.S.P. | | Colombia | | Foreign | | AV VILLAS | | Colombia | | CP | | | 5.50 | % | | | 5.38 | % | | | 8,135,175 | | | | — | | | | 8,135,175 | | | | — | | | | — | | | | — | | | | — | | | | — | | | | — | |
Foreign | | Emgesa S.A. E.S.P. | | Colombia | | Foreign | | BBVA Colombia | | Colombia | | CP | | | 5.67 | % | | | 5.53 | % | | | 2,909,832 | | | | — | | | | 2,909,832 | | | | — | | | | — | | | | — | | | | — | | | | — | | | | — | |
Foreign | | Emgesa S.A. E.S.P. | | Colombia | | Foreign | | Citibank Colombia | | Colombia | | CP | | | 5.51 | % | | | 5.38 | % | | | 6,539,972 | | | | — | | | | 6,539,972 | | | | — | | | | — | | | | — | | | | — | | | | — | | | | — | |
Foreign | | Emgesa S.A. E.S.P. | | Colombia | | Foreign | | Citibank Colombia | | Colombia | | CP | | | 5.73 | % | | | 5.61 | % | | | 9,383,275 | | | | — | | | | 9,383,275 | | | | — | | | | — | | | | — | | | | — | | | | — | | | | — | |
Foreign | | Emgesa S.A. E.S.P. | | Colombia | | Foreign | | Citibank Colombia | | Colombia | | CP | | | 5.57 | % | | | 5.46 | % | | | 73,418 | | | | 5,199,636 | | | | 5,273,054 | | | | — | | | | — | | | | — | | | | — | | | | — | | | | — | |
Foreign | | Emgesa S.A. E.S.P. | | Colombia | | Foreign | | BBVA Colombia | | Colombia | | CP | | | 5.76 | % | | | 5.64 | % | | | 24,968,484 | | | | — | | | | 24,968,484 | | | | — | | | | — | | | | — | | | | — | | | | — | | | | — | |
Foreign | | Emgesa S.A. E.S.P. | | Colombia | | Foreign | | Banco de Bogota | | Colombia | | CP | | | 5.90 | % | | | 5.81 | % | | | 9,316,392 | | | | — | | | | 9,316,392 | | | | — | | | | — | | | | — | | | | — | | | | — | | | | — | |
Foreign | | Emgesa S.A. E.S.P. | | Colombia | | Foreign | | Banco de Bogota | | Colombia | | CP | | | 6.26 | % | | | 6.12 | % | | | 621,690 | | | | 53,041,077 | | | | 53,662,767 | | | | — | | | | — | | | | — | | | | — | | | | — | | | | — | |
Foreign | | Emgesa S.A. E.S.P. | | Colombia | | Foreign | | Banco de Bogota | | Colombia | | CP | | | 6.27 | % | | | 6.12 | % | | | 171,946 | | | | 11,087,840 | | | | 11,259,786 | | | | — | | | | — | | | | — | | | | — | | | | — | | | | — | |
Foreign | | Emgesa S.A. E.S.P. | | Colombia | | Foreign | | Banco Davivienda | | Colombia | | CP | | | 6.30 | % | | | 6.15 | % | | | 46,300 | | | | 2,942,126 | | | | 2,988,426 | | | | — | | | | — | | | | — | | | | — | | | | — | | | | — | |
Foreign | | Endesa Argentina S.A. | | Argentina | | Foreign | | Citibank | | Argentina | | Ar$ | | | 28.00 | % | | | 28.00 | % | | | 635,804 | | | | — | | | | 635,804 | | | | — | | | | — | | | | — | | | | — | | | | — | | | | — | |
Foreign | | Central Costanera S.A. | | Argentina | | Foreign | | Banco Galicia | | Argentina | | Ar$ | | | 51.47 | % | | | 42.24 | % | | | 103,402 | | | | 851,851 | | | | 955,253 | | | | 633,817 | | | | — | | | | — | | | | — | | | | — | | | | 633,817 | |
Foreign | | Central Costanera S.A. | | Argentina | | Foreign | | Banco Itaú Argentina | | Argentina | | Ar$ | | | 55.08 | % | | | 44.68 | % | | | 38,656 | | | | 322,179 | | | | 360,835 | | | | 273,823 | | | | — | | | | — | | | | — | | | | — | | | | 273,823 | |
Foreign | | Central Costanera S.A. | | Argentina | | Foreign | | Banco Santander Río | | Argentina | | Ar$ | | | 44.17 | % | | | 37.14 | % | | | 26,023 | | | | 203,438 | | | | 229,461 | | | | 170,421 | | | | — | | | | — | | | | — | | | | — | | | | 170,421 | |
Foreign | | Central Costanera S.A. | | Argentina | | Foreign | | Banco Supervielle | | Argentina | | Ar$ | | | 49.97 | % | | | 41.21 | % | | | 45,035 | | | | 327,994 | | | | 373,029 | | | | 270,030 | | | | — | | | | — | | | | — | | | | — | | | | 270,030 | |
Foreign | | Central Costanera S.A. | | Argentina | | Foreign | | Citibank | | Argentina | | Ar$ | | | 14.84 | % | | | 13.92 | % | | | 143,732 | | | | 1,071,616 | | | | 1,215,348 | | | | 887,471 | | | | — | | | | — | | | | — | | | | — | | | | 887,471 | |
Foreign | | Central Costanera S.A. | | Argentina | | Foreign | | Credit Suisse International | | Argentina | | US$ | | | 51.99 | % | | | 42.59 | % | | | 1,231,715 | | | | 1,191,823 | | | | 2,423,538 | | | | — | | | | — | | | | — | | | | — | | | | — | | | | — | |
Foreign | | Central Costanera S.A. | | Argentina | | Foreign | | ICB Argentina | | Argentina | | Ar$ | | | 36.00 | % | | | 42.59 | % | | | 49,097 | | | | 364,248 | | | | 413,345 | | | | 301,284 | | | | — | | | | — | | | | — | | | | — | | | | 301,284 | |
Foreign | | H. El Chocón S.A. | | Argentina | | Foreign | | Deutsche Bank | | Argentina | | US$ | | | 13.40 | % | | | 12.78 | % | | | 1,372,167 | | | | 1,323,295 | | | | 2,695,462 | | | | — | | | | — | | | | — | | | | — | | | | — | | | | — | |
Foreign | | H. El Chocón S.A. | | Argentina | | Foreign | | Standard Bank | | Argentina | | US$ | | | 13.40 | % | | | 12.78 | % | | | 687,768 | | | | 662,321 | | | | 1,350,089 | | | | — | | | | — | | | | — | | | | — | | | | — | | | | — | |
Foreign | | H. El Chocón S.A. | | Argentina | | Foreign | | Banco Itau | | Argentina | | US$ | | | 13.40 | % | | | 12.78 | % | | | 687,953 | | | | 662,396 | | | | 1,350,349 | | | | — | | | | — | | | | — | | | | — | | | | — | | | | — | |
Foreign | | H. El Chocón S.A. | | Argentina | | Foreign | | Banco Macro | | Argentina | | Ar$ | | | 30.56 | % | | | 27.87 | % | | | 1,517,506 | | | | — | | | | 1,517,506 | | | | — | | | | — | | | | — | | | | — | | | | — | | | | — | |
Foreign | | H. El Chocón S.A. | | Argentina | | Foreign | | Banco Santander—Sindicado IV | | Argentina | | Ar$ | | | 36.21 | % | | | 32.11 | % | | | 384,443 | | | | 1,062,757 | | | | 1,447,200 | | | | — | | | | — | | | | — | | | | — | | | | — | | | | — | |
Foreign | | H. El Chocón S.A. | | Argentina | | Foreign | | Banco Itau- Sindicado IV | | Argentina | | Ar$ | | | 36.21 | % | | | 32.11 | % | | | 351,974 | | | | 961,994 | | | | 1,313,968 | | | | — | | | | — | | | | — | | | | — | | | | — | | | | — | |
Foreign | | H. El Chocón S.A. | | Argentina | | Foreign | | Banco Galicia—Sindicado IV | | Argentina | | Ar$ | | | 36.21 | % | | | 32.11 | % | | | 330,218 | | | | 911,531 | | | | 1,241,749 | | | | — | | | | — | | | | — | | | | — | | | | — | | | | — | |
Foreign | | H. El Chocón S.A. | | Argentina | | Foreign | | Banco Hipotecario—Sindicado IV | | Argentina | | Ar$ | | | 36.21 | % | | | 32.11 | % | | | 104,127 | | | | 294,444 | | | | 398,571 | | | | — | | | | — | | | | — | | | | — | | | | — | | | | — | |
Foreign | | H. El Chocón S.A. | | Argentina | | Foreign | | Banco Ciudad -Sindicado IV | | Argentina | | Ar$ | | | 36.21 | % | | | 32.11 | % | | | 44,395 | | | | 122,549 | | | | 166,944 | | | | — | | | | — | | | | — | | | | — | | | | — | | | | — | |
Foreign | | H. El Chocón S.A. | | Argentina | | Foreign | | ICB Argentina | | Argentina | | Ar$ | | | 36.21 | % | | | 32.11 | % | | | 428,635 | | | | 1,181,615 | | | | 1,610,250 | | | | — | | | | — | | | | — | | | | — | | | | — | | | | — | |
| | | | | | | | | | | | | | | | | | | | | | | | | | | | | | | | | | | | | | | | | | | | | | | | | | | | | | | | |
| | | | | | | | Total ThCh$ | | | | | | | | | | | | | | | 72,850,213 | | | | 126,915,778 | | | | 199,765,991 | | | | 20,328,567 | | | | 32,692,783 | | | | 12,899,235 | | | | 11,666,493 | | | | 35,793,758 | | | | 113,380,836 | |
| | | | | | | | | | | | | | | | | | | | | | | | | | | | | | | | | | | | | | | | | | | | | | | | | | | | | | | | |
F-117
| | | | | | | | | | | | | | | | | | | | | | | | | | | | | | | | | | | | | | | | | | | | | | | | | | | | | | | | |
Taxpayer ID No.
(RUT) | | Company | | Country | | ID No.
Financial
Institution | | Financial Institution | | Country | | Currency | | Effective
Interest
Rate | | | Nominal
Interest
Rate | | | Balance as of 12-31-2014 | |
| | | | | | | | | | Current | | | Non-current | |
| | | | | | | | | | One to
three
months | | | Three to
twelve
months | | | Total
Current | | | One to
two years | | | Two to
three
years | | | Three to
four years | | | Four to
five years | | | More
than five
years | | | Total Non-
current | |
| | | | | | | | | | ThCh$ | | | ThCh$ | | | ThCh$ | | | ThCh$ | | | ThCh$ | | | ThCh$ | | | ThCh$ | | | ThCh$ | | | ThCh$ | |
Foreign | | Chinango S.A.C. | | Peru | | Foreign | | Banco Scotiabank | | Peru | | US$ | | | 3.98 | % | | | 3.96 | % | | | 353,913 | | | | 1,051,014 | | | | 1,404,927 | | | | 1,376,324 | | | | 1,347,722 | | | | 15,345,293 | | | | — | | | | — | | | | 18,069,339 | |
Foreign | | Chinango S.A.C. | | Peru | | Foreign | | Bank Of Nova Scotia | | Peru | | US$ | | | 3.18 | % | | | 3.01 | % | | | 411,404 | | | | 1,217,828 | | | | 1,629,232 | | | | 1,585,546 | | | | 1,541,859 | | | | — | | | | — | | | | | | | | 3,127,405 | |
Foreign | | Chinango S.A.C. | | Peru | | Foreign | | Bank Of Nova Scotia | | Peru | | US$ | | | 3.48 | % | | | 3.40 | % | | | 289,876 | | | | 857,071 | | | | 1,146,947 | | | | 1,113,465 | | | | 1,079,983 | | | | 1,046,501 | | | | 256,394 | | | | | | | | 3,496,343 | |
Foreign | | Edegel S.A.A | | Peru | | Foreign | | Banco Continental | | Peru | | US$ | | | 3.44 | % | | | 3.36 | % | | | 1,807,054 | | | | 6,713,471 | | | | 8,520,525 | | | | 14,284,700 | | | | 14,811,692 | | | | — | | | | — | | | | — | | | | 29,096,392 | |
Foreign | | Edegel S.A.A | | Peru | | Foreign | | Bank Nova Scotia | | Peru | | US$ | | | 1.02 | % | | | 1.00 | % | | | 52,327 | | | | 156,980 | | | | 209,307 | | | | 21,914,348 | | | | — | | | | — | | | | — | | | | — | | | | 21,914,348 | |
Foreign | | Emgesa S.A. E.S.P. | | Colombia | | Foreign | | Banco Corpbanca | | Colombia | | CP | | | 8.39 | % | | | 8.22 | % | | | 373,517 | | | | 1,120,552 | | | | 1,494,069 | | | | 2,847,830 | | | | 4,052,184 | | | | 3,852,974 | | | | 3,653,765 | | | | 12,622,968 | | | | 27,029,721 | |
Foreign | | Emgesa S.A. E.S.P. | | Colombia | | Foreign | | BBVA Colombia | | Colombia | | CP | | | 6.71 | % | | | 6.60 | % | | | 1,027,774 | | | | 3,083,323 | | | | 4,111,097 | | | | 7,918,549 | | | | 11,314,891 | | | | 10,766,745 | | | | 10,218,598 | | | | 35,392,929 | | | | 75,611,712 | |
Foreign | | Endesa Argentina S.A. | | Argentina | | Foreign | | Citibank | | Argentina | | Ar$ | | | 28.00 | % | | | 28.00 | % | | | 749,636 | | | | — | | | | 749,636 | | | | — | | | | — | | | | — | | | | — | | | | — | | | | — | |
Foreign | | Central Costanera S.A. | | Argentina | | Foreign | | Banco Galicia | | Argentina | | Ar$ | | | 51.47 | % | | | 42.24 | % | | | 308,554 | | | | 836,632 | | | | 1,145,186 | | | | 990,314 | | | | — | | | | — | | | | — | | | | — | | | | 990,314 | |
Foreign | | Central Costanera S.A. | | Argentina | | Foreign | | Banco Itaú Argentina | | Argentina | | Ar$ | | | 55.08 | % | | | 44.68 | % | | | 119,500 | | | | 337,442 | | | | 456,942 | | | | 390,884 | | | | 27,716 | | | | — | | | | — | | | | — | | | | 418,600 | |
Foreign | | Central Costanera S.A. | | Argentina | | Foreign | | Banco Santander Río | | Argentina | | Ar$ | | | 44.17 | % | | | 37.14 | % | | | 70,593 | | | | 200,874 | | | | 271,467 | | | | 236,632 | | | | 17,012 | | | | — | | | | — | | | | — | | | | 253,644 | |
Foreign | | Central Costanera S.A. | | Argentina | | Foreign | | Banco Supervielle | | Argentina | | Ar$ | | | 49.97 | % | | | 41.21 | % | | | 112,554 | | | | 319,053 | | | | 431,607 | | | | 372,729 | | | | 26,615 | | | | — | | | | — | | | | — | | | | 399,344 | |
Foreign | | Central Costanera S.A. | | Argentina | | Foreign | | Citibank | | Argentina | | Ar$ | | | 14.84 | % | | | 13.92 | % | | | 347,807 | | | | 998,639 | | | | 1,346,446 | | | | 1,199,174 | | | | 87,541 | | | | — | | | | — | | | | — | | | | 1,286,715 | |
Foreign | | Central Costanera S.A. | | Argentina | | Foreign | | Credit Suisse International | | Argentina | | US$ | | | 51.99 | % | | | 42.59 | % | | | 122,704 | | | | 2,324,204 | | | | 2,446,908 | | | | 1,039,398 | | | | — | | | | — | | | | — | | | | — | | | | 1,039,398 | |
Foreign | | Central Costanera S.A. | | Argentina | | Foreign | | ICB Argentina | | Argentina | | Ar$ | | | 36.00 | % | | | 42.59 | % | | | 132,215 | | | | 371,509 | | | | 503,724 | | | | 425,630 | | | | 29,900 | | | | — | | | | — | | | | — | | | | 455,530 | |
Foreign | | H. El Chocón S.A. | | Argentina | | Foreign | | Deutsche Bank | | Argentina | | US$ | | | 13.40 | % | | | 12.78 | % | | | 1,331,375 | | | | 4,844,938 | | | | 6,176,313 | | | | — | | | | — | | | | — | | | | — | | | | — | | | | — | |
Foreign | | H. El Chocón S.A. | | Argentina | | Foreign | | Standard Bank | | Argentina | | US$ | | | 13.40 | % | | | 12.78 | % | | | 667,376 | | | | 2,425,364 | | | | 3,092,740 | | | | — | | | | — | | | | — | | | | — | | | | — | | | | — | |
Foreign | | H. El Chocón S.A. | | Argentina | | Foreign | | Banco Itau | | Argentina | | US$ | | | 13.40 | % | | | 12.78 | % | | | 687,484 | | | | 2,459,835 | | | | 3,147,319 | | | | — | | | | — | | | | — | | | | — | | | | — | | | | — | |
Foreign | | H. El Chocón S.A. | | Argentina | | Foreign | | Banco Macro | | Argentina | | Ar$ | | | 30.56 | % | | | 27.87 | % | | | 1,522,852 | | | | — | | | | 1,522,852 | | | | — | | | | — | | | | — | | | | — | | | | — | | | | — | |
Foreign | | H. El Chocón S.A. | | Argentina | | Foreign | | Banco Santander - Sindicado IV | | Argentina | | Ar$ | | | 36.21 | % | | | 32.11 | % | | | 306,765 | | | | 1,185,867 | | | | 1,492,632 | | | | 1,023,289 | | | | — | | | | — | | | | — | | | | — | | | | 1,023,289 | |
Foreign | | H. El Chocón S.A. | | Argentina | | Foreign | | Banco Itau - Sindicado IV | | Argentina | | Ar$ | | | 36.21 | % | | | 32.11 | % | | | 273,493 | | | | 1,057,510 | | | | 1,331,003 | | | | 912,706 | | | | — | | | | — | | | | — | | | | — | | | | 912,706 | |
Foreign | | H. El Chocón S.A. | | Argentina | | Foreign | | Banco Galicia - Sindicado IV | | Argentina | | Ar$ | | | 36.21 | % | | | 32.11 | % | | | 262,403 | | | | 1,014,727 | | | | 1,277,130 | | | | 875,846 | | | | — | | | | — | | | | — | | | | — | | | | 875,846 | |
Foreign | | H. El Chocón S.A. | | Argentina | | Foreign | | Banco Hipotecario - Sindicado IV | | Argentina | | Ar$ | | | 36.21 | % | | | 32.11 | % | | | 86,271 | | | | 335,251 | | | | 421,522 | | | | 290,454 | | | | — | | | | — | | | | — | | | | — | | | | 290,454 | |
Foreign | | H. El Chocón S.A. | | Argentina | | Foreign | | Banco Ciudad - Sindicado IV | | Argentina | | Ar$ | | | 36.21 | % | | | 32.11 | % | | | 34,894 | | | | 135,536 | | | | 170,430 | | | | 117,383 | | | | — | | | | — | | | | — | | | | — | | | | 117,383 | |
Foreign | | H. El Chocón S.A. | | Argentina | | Foreign | | ICB Argentina | | Argentina | | Ar$ | | | 36.21 | % | | | 32.11 | % | | | 340,037 | | | | 1,314,222 | | | | 1,654,259 | | | | 1,133,871 | | | | — | | | | — | | | | — | | | | — | | | | 1,133,871 | |
| | | | | | | | | | | | | | | | | | | | | | | | | | | | | | | | | | | | | | | | | | | | | | | | | | | | | | | | |
| | | | | | | | Total ThCh$ | | | | | | | | | | | | | | | 11,792,378 | | | | 34,361,842 | | | | 46,154,220 | | | | 60,049,072 | | | | 34,337,115 | | | | 31,011,513 | | | | 14,128,757 | | | | 48,015,897 | | | | 187,542,354 | |
| | | | | | | | | | | | | | | | | | | | | | | | | | | | | | | | | | | | | | | | | | | | | | | | | | | | | | | | |
F-118
| b) | Secured and unsecured liabilities |
| | • | | Summary of secured and unsecured liabilities by currency and maturity |
| | | | | | | | | | | | | | | | | | | | | | | | | | | | | | | | | | | | | | | | | | | | | | | | | | |
Country | | Country | | Effective
Interest
Rate | | | Nominal
Interest
Rate | | | Secured
(Yes/No) | | | Balance as of 9-30-2015 | |
| | | | | | Current | | | Non-current | |
| | | | | | One to
three
months | | | Three to
twelve
months | | | Total
Current | | | One to two
years | | | Two to
three years | | | Three to
four years | | | Four to five
years | | | More than
five years | | | Total Non-
current | |
| | | | | | ThCh$ | | | ThCh$ | | | ThCh$ | | | ThCh$ | | | ThCh$ | | | ThCh$ | | | ThCh$ | | | ThCh$ | | | ThCh$ | |
Peru | | US$ | | | 6.61 | % | | | 6.50 | % | | | No | | | | 643,105 | | | | 15,802,221 | | | | 16,445,326 | | | | 1,708,052 | | | | 8,404,166 | | | | 6,684,298 | | | | 7,821,502 | | | | 10,176,403 | | | | 34,794,421 | |
Peru | | Sol | | | 6.40 | % | | | 6.30 | % | | | No | | | | 171,209 | | | | 513,629 | | | | 684,838 | | | | 684,839 | | | | 684,839 | | | | 6,050,939 | | | | 343,269 | | | | 6,023,749 | | | | 13,787,635 | |
Colombia | | CP | | | 9.64 | % | | | 9.38 | % | | | No | | | | 16,037,154 | | | | 48,111,466 | | | | 64,148,620 | | | | 99,961,949 | | | | 108,307,966 | | | | 134,215,195 | | | | 100,248,276 | | | | 600,219,217 | | | | 1,042,952,603 | |
| | | | | | | | | | | | | | | | | | | | | | | | | | | | | | | | | | | | | | | | | | | | | | | | | | |
| | | | | | | | | | | | | Total | | | | 16,851,468 | | | | 64,427,316 | | | | 81,278,784 | | | | 102,354,840 | | | | 117,396,971 | | | | 146,950,432 | | | | 108,413,047 | | | | 616,419,369 | | | | 1,091,534,659 | |
| | | | | | | | | | | | | | | | | | | | | | | | | | | | | | | | | | | | | | | | | | | | | | | | | | |
| | | | | | | | | | | | | | | | | | | | | | | | | | | | | | | | | | | | | | | | | | | | | | | | | | |
Country | | Currency | | Effective
Interest
Rate | | | Nominal
Interest
Rate | | | Secured
(Yes/No) | | | Balance as of 12-31-2014 | |
| | | | | | Current | | | Non-current | |
| | | | | | One to
three
months | | | Three to
twelve
months | | | Total
Current | | | One to
two years | | | Two to
three years | | | Three to
four years | | | Four to five
years | | | More than
five years | | | Total Non-
current | |
| | | | | | ThCh$ | | | ThCh$ | | | ThCh$ | | | ThCh$ | | | ThCh$ | | | ThCh$ | | | ThCh$ | | | ThCh$ | | | ThCh$ | |
Peru | | US$ | | | 6.61 | % | | | 6.50 | % | | | No | | | | 4,424,492 | | | | 1,630,232 | | | | 6,054,724 | | | | 14,072,738 | | | | 1,443,269 | | | | 7,173,013 | | | | 5,691,115 | | | | 15,362,941 | | | | 43,743,076 | |
Peru | | Sol | | | 6.40 | % | | | 6.30 | % | | | No | | | | 159,918 | | | | 479,754 | | | | 639,672 | | | | 639,671 | | | | 639,671 | | | | 639,671 | | | | 5,586,014 | | | | 5,880,850 | | | | 13,385,877 | |
Colombia | | CP | | | 9.64 | % | | | 9.38 | % | | | No | | | | 80,341,828 | | | | 48,241,503 | | | | 128,583,331 | | | | 64,322,005 | | | | 104,199,084 | | | | 113,756,973 | | | | 143,560,968 | | | | 753,218,536 | | | | 1,179,057,566 | |
| | | | | | | | | | | | | | | | | | | | | | | | | | | | | | | | | | | | | | | | | | | | | | | | | | |
| | | | | | | | | | | | | Total | | | | 84,926,238 | | | | 50,351,489 | | | | 135,277,727 | | | | 79,034,414 | | | | 106,282,024 | | | | 121,569,657 | | | | 154,838,097 | | | | 774,462,327 | | | | 1,236,186,519 | |
| | | | | | | | | | | | | | | | | | | | | | | | | | | | | | | | | | | | | | | | | | | | | | | | | | |
F-119
| • | | Secured and unsecured liabilities by company |
| | | | | | | | | | | | | | | | | | | | | | | | | | | | | | | | | | | | | | | | | | | | | | | | | | | | | | | | | | | | |
Taxpayer ID
No. (RUT) | | Company | | Country | | ID No.
Financial
Institution | | Financial Institution | | Country | | Currency | | Effective
Interest
Rate | | | Nominal
Interest
Rate | | | Secured
(Yes/
No) | | | Balance as of 9-30-2015 | |
| | | | | | | | | | | Current | | | Non-current | |
| | | | | | | | | | | One to
three
months | | | Three to
twelve
months | | | Total
Current | | | One to two
years | | | Two to
three years | | | Three to
four years | | | Four to five
years | | | More than
five years | | | Total Non-
current | |
| | | | | | | | | | | ThCh$ | | | ThCh$ | | | ThCh$ | | | ThCh$ | | | ThCh$ | | | ThCh$ | | | ThCh$ | | | ThCh$ | | | ThCh$ | |
Foreign | | Edegel S.A.A | | Peru | | Foreign | | Banco Continental | | Peru | | Sol | | | 6.41 | % | | | 6.31 | % | | | No | | | | 85,817 | | | | 257,452 | | | | 343,269 | | | | 343,269 | | | | 343,269 | | | | 343,269 | | | | 343,269 | | | | 6,023,749 | | | | 7,396,825 | |
Foreign | | Edegel S.A.A | | Peru | | Foreign | | Banco Continental | | Peru | | Sol | | | 6.38 | % | | | 6.28 | % | | | No | | | | 85,392 | | | | 256,177 | | | | 341,569 | | | | 341,570 | | | | 341,570 | | | | 5,707,670 | | | | — | | | | — | | | | 6,390,810 | |
Foreign | | Edegel S.A.A | | Peru | | Foreign | | Banco Continental | | Peru | | US$ | | | 6.44 | % | | | 6.34 | % | | | No | | | | 108,581 | | | | 325,742 | | | | 434,323 | | | | 434,323 | | | | 434,323 | | | | 434,323 | | | | 434,323 | | | | 10,176,403 | | | | 11,913,695 | |
Foreign | | Edegel S.A.A | | Peru | | Foreign | | Banco Continental | | Peru | | US$ | | | 7.93 | % | | | 7.78 | % | | | No | | | | 108,759 | | | | 326,277 | | | | 435,036 | | | | 435,036 | | | | 435,036 | | | | 5,854,163 | | | | — | | | | — | | | | 6,724,235 | |
Foreign | | Edegel S.A.A | | Peru | | Foreign | | Banco Scotiabank | | Peru | | US$ | | | 6.73 | % | | | 6.63 | % | | | No | | | | 113,395 | | | | 7,255,955 | | | | 7,369,350 | | | | — | | | | — | | | | — | | | | — | | | | — | | | | — | |
Foreign | | Edegel S.A.A | | Peru | | Foreign | | Banco Scotiabank | | Peru | | US$ | | | 6.09 | % | | | 6.00 | % | | | No | | | | 102,697 | | | | 7,265,227 | | | | 7,367,924 | | | | — | | | | — | | | | — | | | | — | | | | — | | | | — | |
Foreign | | Edegel S.A.A | | Peru | | Foreign | | Banco Scotiabank | | Peru | | US$ | | | 6.57 | % | | | 6.47 | % | | | No | | | | 110,720 | | | | 332,161 | | | | 442,881 | | | | 442,881 | | | | 7,138,995 | | | | — | | | | — | | | | — | | | | 7,581,876 | |
Foreign | | Edegel S.A.A | | Peru | | Foreign | | Banco Scotiabank | | Peru | | US$ | | | 5.86 | % | | | 5.78 | % | | | No | | | | 98,953 | | | | 296,859 | | | | 395,812 | | | | 395,812 | | | | 395,812 | | | | 395,812 | | | | 7,387,179 | | | | | | | | 8,574,615 | |
Foreign | | Emgesa S.A. E.S.P. | | Colombia | | Foreign | | Bonds Series B-103 | | Colombia | | CP | | | 9.79 | % | | | 9.79 | % | | | No | | | | 967,282 | | | | 2,901,847 | | | | 3,869,129 | | | | 39,682,457 | | | | — | | | | — | | | | — | | | | — | | | | 39,682,457 | |
Foreign | | Emgesa S.A. E.S.P. | | Colombia | | Foreign | | Bonds Series B10 | | Colombia | | CP | | | 10.44 | % | | | 10.06 | % | | | No | | | | 909,854 | | | | 2,729,563 | | | | 3,639,417 | | | | 3,639,417 | | | | 3,639,417 | | | | 37,360,749 | | | | — | | | | — | | | | 44,639,583 | |
Foreign | | Emgesa S.A. E.S.P. | | Colombia | | Foreign | | Bonds Series B15 | | Colombia | | CP | | | 10.77 | % | | | 10.36 | % | | | No | | | | 324,810 | | | | 974,430 | | | | 1,299,240 | | | | 1,299,241 | | | | 1,299,241 | | | | 1,299,241 | | | | 1,299,241 | | | | 16,867,911 | | | | 22,064,875 | |
Foreign | | Emgesa S.A. E.S.P. | | Colombia | | Foreign | | Bonds Series B09-09 | | Colombia | | CP | | | 10.57 | % | | | 10.17 | % | | | No | | | | 1,253,852 | | | | 3,761,556 | | | | 5,015,408 | | | | 5,015,408 | | | | 53,043,882 | | | | — | | | | — | | | | — | | | | 58,059,290 | |
Foreign | | Emgesa S.A. E.S.P. | | Colombia | | Foreign | | Bonds Series B12 | | Colombia | | CP | | | 10.78 | % | | | 10.37 | % | | | No | | | | 524,460 | | | | 1,573,380 | | | | 2,097,840 | | | | 2,097,840 | | | | 2,097,840 | | | | 2,097,840 | | | | 2,097,840 | | | | 21,809,019 | | | | 30,200,379 | |
Foreign | | Emgesa S.A. E.S.P. | | Colombia | | Foreign | | Foreign Bonds | | Colombia | | CP | | | 10.17 | % | | | 10.17 | % | | | No | | | | 512,659 | | | | 1,537,978 | | | | 2,050,637 | | | | 2,050,638 | | | | 2,050,638 | | | | 2,050,638 | | | | 2,050,638 | | | | 20,838,421 | | | | 29,040,973 | |
Foreign | | Emgesa S.A. E.S.P. | | Colombia | | Foreign | | Quimbo Bonds | | Colombia | | CP | | | 10.17 | % | | | 10.17 | % | | | No | | | | 3,684,084 | | | | 11,052,253 | | | | 14,736,337 | | | | 14,736,337 | | | | 14,736,337 | | | | 14,736,337 | | | | 14,736,337 | | | | 149,749,523 | | | | 208,694,871 | |
Foreign | | Emgesa S.A. E.S.P. | | Colombia | | Foreign | | Quimbo Bonds B10 | | Colombia | | CP | | | 8.09 | % | | | 7.85 | % | | | No | | | | 1,346,459 | | | | 4,039,377 | | | | 5,385,836 | | | | 5,385,835 | | | | 5,385,835 | | | | 5,385,835 | | | | 5,385,835 | | | | 79,301,046 | | | | 100,844,386 | |
Foreign | | Emgesa S.A. E.S.P. | | Colombia | | Foreign | | Quimbo Bonds B15 | | Colombia | | CP | | | 8.21 | % | | | 7.97 | % | | | No | | | | 910,857 | | | | 2,732,572 | | | | 3,643,429 | | | | 3,643,429 | | | | 3,643,429 | | | | 3,643,429 | | | | 3,643,429 | | | | 71,203,470 | | | | 85,777,186 | |
Foreign | | Emgesa S.A. E.S.P. | | Colombia | | Foreign | | Quimbo Bonds B12-13 | | Colombia | | CP | | | 9.63 | % | | | 9.30 | % | | | No | | | | 1,925,764 | | | | 5,777,292 | | | | 7,703,056 | | | | 7,703,056 | | | | 7,703,056 | | | | 7,703,056 | | | | 7,703,056 | | | | 119,813,330 | | | | 150,625,554 | |
Foreign | | Emgesa S.A. E.S.P. | | Colombia | | Foreign | | Quimbo Bonds B6-13 | | Colombia | | CP | | | 8.85 | % | | | 8.57 | % | | | No | | | | 746,501 | | | | 2,239,503 | | | | 2,986,004 | | | | 2,986,004 | | | | 2,986,004 | | | | 37,144,038 | | | | — | | | | — | | | | 43,116,046 | |
Foreign | | Emgesa S.A. E.S.P. | | Colombia | | Foreign | | Bonds Series B6-13 | | Colombia | | CP | | | 8.85 | % | | | 8.57 | % | | | No | | | | 241,966 | | | | 725,897 | | | | 967,863 | | | | 967,862 | | | | 967,862 | | | | 12,039,607 | | | | — | | | | — | | | | 13,975,331 | |
Foreign | | Emgesa S.A. E.S.P. | | Colombia | | Foreign | | Quimbo Bonds B16-14 | | Colombia | | CP | | | 8.74 | % | | | 8.47 | % | | | No | | | | 773,184 | | | | 2,319,551 | | | | 3,092,735 | | | | 3,092,735 | | | | 3,092,735 | | | | 3,092,735 | | | | 3,092,735 | | | | 66,287,181 | | | | 78,658,121 | |
Foreign | | Emgesa S.A. E.S.P. | | Colombia | | Foreign | | Quimbo Bonds B10-14 | | Colombia | | CP | | | 8.41 | % | | | 8.16 | % | | | No | | | | 859,064 | | | | 2,577,193 | | | | 3,436,257 | | | | 3,436,258 | | | | 3,436,258 | | | | 3,436,258 | | | | 3,436,258 | | | | 54,349,316 | | | | 68,094,348 | |
Foreign | | Emgesa S.A. E.S.P. | | Colombia | | Foreign | | Quimbo Bonds B6-14 | | Colombia | | CP | | | 7.98 | % | | | 7.75 | % | | | No | | | | 574,343 | | | | 1,723,029 | | | | 2,297,372 | | | | 2,297,372 | | | | 2,297,372 | | | | 2,297,372 | | | | 30,883,797 | | | | — | | | | 37,775,913 | |
Foreign | | Emgesa S.A. E.S.P. | | Colombia | | Foreign | | Bonds Series B6-14 | | Colombia | | CP | | | 7.98 | % | | | 7.75 | % | | | No | | | | 482,015 | | | | 1,446,045 | | | | 1,928,060 | | | | 1,928,060 | | | | 1,928,060 | | | | 1,928,060 | | | | 25,919,110 | | | | — | | | | 31,703,290 | |
| | | | | | | | | | | | | | | | | | | | | | | | | | | | | | | | | | | | | | | | | | | | | | | | | | | | | | | | | | | | |
| | | | | | | | Total ThCh$ | | | | | | | | | | | | | | | | | | | 16,851,468 | | | | 64,427,316 | | | | 81,278,784 | | | | 102,354,840 | | | | 117,396,971 | | | | 146,950,432 | | | | 108,413,047 | | | | 616,419,369 | | | | 1,091,534,659 | |
| | | | | | | | | | | | | | | | | | | | | | | | | | | | | | | | | | | | | | | | | | | | | | | | | | | | | | | | | | | | |
| | | | | | | | | | | | | | | | | | | | | | | | | | | | | | | | | | | | | | | | | | | | | | | | | | | | | | | | | | | | | | |
Taxpayer ID No.
(RUT) | | Company | | Country | | ID No.
Financial
Institution | | Financial Institution | | Country | | Currency | | | Effective
Interest
Rate | | | Nominal
Interest
Rate | | | Secured
(Yes/
No) | | | Balance as of 12-31-2014 | |
| | | | | | | | | | | Current | | | Non-current | |
| | | | | | | | | | | One to
three
months | | | Three to
twelve
months | | | Total
Current | | | One to
two years | | | Two to
three years | | | Three to
four years | | | Four to five
years | | | More than
five years | | | Total Non-
current | |
| | | | | | | | | | | ThCh$ | | | ThCh$ | | | ThCh$ | | | ThCh$ | | | ThCh$ | | | ThCh$ | | | ThCh$ | | | ThCh$ | | | ThCh$ | |
Foreign | | Edegel S.A.A | | Peru | | Foreign | | Banco Continental | | Peru | | | Sol | | | | 6.41 | % | | | 6.31 | % | | | No | | | | 80,157 | | | | 240,472 | | | | 320,629 | | | | 320,629 | | | | 320,629 | | | | 320,629 | | | | 320,629 | | | | 5,880,850 | | | | 7,163,366 | |
Foreign | | Edegel S.A.A | | Peru | | Foreign | | Banco Continental | | Peru | | | Sol | | | | 6.38 | % | | | 6.28 | % | | | No | | | | 79,761 | | | | 239,282 | | | | 319,043 | | | | 319,042 | | | | 319,042 | | | | 319,042 | | | | 5,265,385 | | | | | | | | 6,222,511 | |
Foreign | | Edegel S.A.A | | Peru | | Foreign | | Banco Continental | | Peru | | US$ | | | | | 6.44 | % | | | 6.34 | % | | | No | | | | 91,749 | | | | 275,246 | | | | 366,995 | | | | 366,994 | | | | 366,994 | | | | 366,994 | | | | 366,994 | | | | 9,039,318 | | | | 10,507,294 | |
Foreign | | Edegel S.A.A | | Peru | | Foreign | | Banco Continental | | Peru | | US$ | | | | | 7.93 | % | | | 7.78 | % | | | No | | | | 91,899 | | | | 275,698 | | | | 367,597 | | | | 367,597 | | | | 367,597 | | | | 367,597 | | | | 4,989,668 | | | | | | | | 6,092,459 | |
Foreign | | Edegel S.A.A | | Peru | | Foreign | | Banco Continental | | Peru | | US$ | | | | | 7.25 | % | | | 7.13 | % | | | No | | | | 3,881,082 | | | | — | | | | 3,881,082 | | | | — | | | | — | | | | — | | | | — | | | | — | | | | — | |
Foreign | | Edegel S.A.A | | Peru | | Foreign | | Banco Scotiabank | | Peru | | US$ | | | | | 6.73 | % | | | 6.63 | % | | | No | | | | 95,816 | | | | 287,449 | | | | 383,265 | | | | 6,296,355 | | | | — | | | | — | | | | — | | | | — | | | | 6,296,355 | |
Foreign | | Edegel S.A.A | | Peru | | Foreign | | Banco Scotiabank | | Peru | | US$ | | | | | 6.09 | % | | | 6.00 | % | | | No | | | | 86,777 | | | | 260,331 | | | | 347,108 | | | | 6,333,114 | | | | — | | | | — | | | | — | | | | — | | | | 6,333,114 | |
Foreign | | Edegel S.A.A | | Peru | | Foreign | | Banco Scotiabank | | Peru | | US$ | | | | | 6.57 | % | | | 6.47 | % | | | No | | | | 93,556 | | | | 280,669 | | | | 374,225 | | | | 374,225 | | | | 374,225 | | | | 6,103,969 | | | | — | | | | — | | | | 6,852,419 | |
Foreign | | Edegel S.A.A | | Peru | | Foreign | | Banco Scotiabank | | Peru | | US$ | | | | | 5.86 | % | | | 5.78 | % | | | No | | | | 83,613 | | | | 250,839 | | | | 334,452 | | | | 334,453 | | | | 334,453 | | | | 334,453 | | | | 334,453 | | | | 6,323,623 | | | | 7,661,435 | |
Foreign | | Emgesa S.A. E.S.P. | | Colombia | | Foreign | | Bonds Series A-10 | | Colombia | | | CP | | | | 8.87 | % | | | 8.59 | % | | | No | | | | 53,979,516 | | | | — | | | | 53,979,516 | | | | — | | | | — | | | | — | | | | — | | | | — | | | | — | |
Foreign | | Emgesa S.A. E.S.P. | | Colombia | | Foreign | | Bonds Series A102 | | Colombia | | | CP | | | | 8.87 | % | | | 8.59 | % | | | No | | | | 10,281,812 | | | | — | | | | 10,281,812 | | | | — | | | | — | | | | — | | | | — | | | | — | | | | — | |
Foreign | | Emgesa S.A. E.S.P. | | Colombia | | Foreign | | Bonds Series B-103 | | Colombia | | | CP | | | | 9.79 | % | | | 9.79 | % | | | No | | | | 982,211 | | | | 2,946,634 | | | | 3,928,845 | | | | 3,928,846 | | | | 43,805,925 | | | | — | | | | — | | | | — | | | | 47,734,771 | |
Foreign | | Emgesa S.A. E.S.P. | | Colombia | | Foreign | | Bonds Series B10 | | Colombia | | | CP | | | | 10.44 | % | | | 10.06 | % | | | No | | | | 882,562 | | | | 2,647,687 | | | | 3,530,249 | | | | 3,530,250 | | | | 3,530,250 | | | | 3,530,250 | | | | 41,216,421 | | | | — | | | | 51,807,171 | |
Foreign | | Emgesa S.A. E.S.P. | | Colombia | | Foreign | | Bonds Series B15 | | Colombia | | | CP | | | | 10.77 | % | | | 10.36 | % | | | No | | | | 316,557 | | | | 949,671 | | | | 1,266,228 | | | | 1,266,228 | | | | 1,266,228 | | | | 1,266,228 | | | | 1,266,228 | | | | 19,363,519 | | | | 24,428,431 | |
Foreign | | Emgesa S.A. E.S.P. | | Colombia | | Foreign | | Bonds Series B09-09 | | Colombia | | | CP | | | | 10.57 | % | | | 10.17 | % | | | No | | | | 1,213,148 | | | | 3,639,445 | | | | 4,852,593 | | | | 4,852,593 | | | | 4,852,593 | | | | 58,216,407 | | | | — | | | | — | | | | 67,921,593 | |
Foreign | | Emgesa S.A. E.S.P. | | Colombia | | Foreign | | Bonds Series B12 | | Colombia | | | CP | | | | 10.78 | % | | | 10.37 | % | | | No | | | | 509,006 | | | | 1,527,019 | | | | 2,036,025 | | | | 2,036,026 | | | | 2,036,026 | | | | 2,036,026 | | | | 2,036,026 | | | | 25,961,808 | | | | 34,105,912 | |
Foreign | | Emgesa S.A. E.S.P. | | Colombia | | Foreign | | Foreign Bonds | | Colombia | | | CP | | | | 10.17 | % | | | 10.17 | % | | | No | | | | 581,078 | | | | 1,743,234 | | | | 2,324,312 | | | | 2,324,312 | | | | 2,324,312 | | | | 2,324,312 | | | | 2,324,312 | | | | 25,362,714 | | | | 34,659,962 | |
Foreign | | Emgesa S.A. E.S.P. | | Colombia | | Foreign | | Quimbo Bonds | | Colombia | | | CP | | | | 10.17 | % | | | 10.17 | % | | | No | | | | 4,175,756 | | | | 12,527,267 | | | | 16,703,023 | | | | 16,703,023 | | | | 16,703,023 | | | | 16,703,023 | | | | 16,703,023 | | | | 182,262,097 | | | | 249,074,189 | |
Foreign | | Emgesa S.A. E.S.P. | | Colombia | | Foreign | | Quimbo Bonds B10 | | Colombia | | | CP | | | | 8.09 | % | | | 7.85 | % | | | No | | | | 1,246,095 | | | | 3,738,285 | | | | 4,984,380 | | | | 4,984,380 | | | | 4,984,380 | | | | 4,984,380 | | | | 4,984,380 | | | | 91,102,169 | | | | 111,039,689 | |
Foreign | | Emgesa S.A. E.S.P. | | Colombia | | Foreign | | Quimbo Bonds B15 | | Colombia | | | CP | | | | 8.21 | % | | | 7.97 | % | | | No | | | | 845,671 | | | | 2,537,012 | | | | 3,382,683 | | | | 3,382,682 | | | | 3,382,682 | | | | 3,382,682 | | | | 3,382,682 | | | | 77,827,476 | | | | 91,358,204 | |
Foreign | | Emgesa S.A. E.S.P. | | Colombia | | Foreign | | Quimbo Bonds B12-13 | | Colombia | | | CP | | | | 9.63 | % | | | 9.30 | % | | | No | | | | 1,843,223 | | | | 5,529,669 | | | | 7,372,892 | | | | 7,372,892 | | | | 7,372,892 | | | | 7,372,892 | | | | 7,372,892 | | | | 134,542,069 | | | | 164,033,637 | |
Foreign | | Emgesa S.A. E.S.P. | | Colombia | | Foreign | | Quimbo Bonds B6-13 | | Colombia | | | CP | | | | 8.85 | % | | | 8.57 | % | | | No | | | | 703,731 | | | | 2,111,194 | | | | 2,814,925 | | | | 2,814,926 | | | | 2,814,926 | | | | 2,814,926 | | | | 40,827,900 | | | | — | | | | 49,272,678 | |
Foreign | | Emgesa S.A. E.S.P. | | Colombia | | Foreign | | Bonds Series B6-13 | | Colombia | | | CP | | | | 8.85 | % | | | 8.57 | % | | | No | | | | 228,103 | | | | 684,309 | | | | 912,412 | | | | 912,412 | | | | 912,412 | | | | 912,412 | | | | 13,233,669 | | | | — | | | | 15,970,905 | |
Foreign | | Emgesa S.A. E.S.P. | | Colombia | | Foreign | | Quimbo Bonds B16-14 | | Colombia | | | CP | | | | 8.74 | % | | | 8.47 | % | | | No | | | | 743,130 | | | | 2,229,390 | | | | 2,972,520 | | | | 2,972,520 | | | | 2,972,520 | | | | 2,972,520 | | | | 2,972,520 | | | | 72,211,138 | | | | 84,101,218 | |
Foreign | | Emgesa S.A. E.S.P. | | Colombia | | Foreign | | Quimbo Bonds B10-14 | | Colombia | | | CP | | | | 8.41 | % | | | 8.16 | % | | | No | | | | 816,008 | | | | 2,448,025 | | | | 3,264,033 | | | | 3,264,033 | | | | 3,264,033 | | | | 3,264,033 | | | | 3,264,033 | | | | 61,737,690 | | | | 74,793,822 | |
Foreign | | Emgesa S.A. E.S.P. | | Colombia | | Foreign | | Quimbo Bonds B6-14 | | Colombia | | | CP | | | | 7.98 | % | | | 7.75 | % | | | No | | | | 540,559 | | | | 1,621,676 | | | | 2,162,235 | | | | 2,162,235 | | | | 2,162,235 | | | | 2,162,235 | | | | 2,162,235 | | | | 34,170,442 | | | | 42,819,382 | |
Foreign | | Emgesa S.A. E.S.P. | | Colombia | | Foreign | | Bonds Series B6-14 | | Colombia | | | CP | | | | 7.98 | % | | | 7.75 | % | | | No | | | | 453,662 | | | | 1,360,986 | | | | 1,814,648 | | | | 1,814,647 | | | | 1,814,647 | | | | 1,814,647 | | | | 1,814,647 | | | | 28,677,414 | | | | 35,936,002 | |
| | | | | | | | | | | | | | | | | | | | | | | | | | | | | | | | | | | | | | | | | | | | | | | | | | | | | | | | | | | | | | |
| | | | | | | | Total ThCh$ | | | | | | | | | | | | | | | | | | | | | 84,926,238 | | | | 50,351,489 | | | | 135,277,727 | | | | 79,034,414 | | | | 106,282,024 | | | | 121,569,657 | | | | 154,838,097 | | | | 774,462,327 | | | | 1,236,186,519 | |
| | | | | | | | | | | | | | | | | | | | | | | | | | | | | | | | | | | | | | | | | | | | | | | | | | | | | | | | | | | | | | |
F-120
| c) | Finance lease obligations |
| • | | Finance lease obligations by company |
| | | | | | | | | | | | | | | | | | | | | | | | | | | | | | | | | | | | | | | | | | | | | | | | | | | | |
Taxpayer
ID No.
(RUT) | | Company | | Country | | ID No.
Financial
Institution | | Financial Institution | | Country | | Currency | | Nominal
Interest
Rate | | | Balance as of 9-30-2015 | |
| | | | | | | | | Current | | | Non-current | |
| | | | | | | | | One to
three
months | | | Three to
twelve
months | | | Total
Current | | | One to
two
years | | | Two to
three
years | | | Three to
four
years | | | Four to
five
years | | | More
than
five
years | | | Total
Non-
current | |
| | | | | | | | | ThCh$ | | | ThCh$ | | | ThCh$ | | | ThCh$ | | | ThCh$ | | | ThCh$ | | | ThCh$ | | | ThCh$ | | | ThCh$ | |
Foreign | | Edegel S.A.A. | | Peru | | Foreign | | Banco Scotiabank | | Peru | | US$ | | | 2.02 | % | | | 2,562,026 | | | | 7,613,412 | | | | 10,175,438 | | | | 17,925,875 | | | | — | | | | — | | | | — | | | | — | | | | 17,925,875 | |
Foreign | | Emgesa S.A. E.S.P. | | Colombia | | Foreign | | Banco Corpbanca | | Colombia | | CP | | | 10.80 | % | | | 7,768 | | | | 22,333 | | | | 30,101 | | | | 27,378 | | | | 24,859 | | | | 3,898 | | | | — | | | | — | | | | 56,135 | |
Foreign | | Emgesa S.A. E.S.P. | | Colombia | | Foreign | | Equirent S.A. | | Colombia | | CP | | | 6.55 | % | | | 1,095 | | | | 2,992 | | | | 4,087 | | | | 3,614 | | | | 482 | | | | — | | | | — | | | | — | | | | 4,096 | |
| | | | | | | | | | | | | | | | | | | 2,570,889 | | | | 7,638,737 | | | | 10,209,626 | | | | 17,956,867 | | | | 25,341 | | | | 3,898 | | | | — | | | | — | | | | 17,986,106 | |
| | | | | | | | | | | | | | | | | | | | | | | | | | | | | | | | | | | | | | | | | | | | | | | | | | | | | | |
Taxpayer
ID No.
(RUT) | | Company | | Country | | ID No.
Financial
Institution | | Financial Institution | | Country | | Currency | | | Nominal
Interest
Rate | | | Balance as of 12-31-2014 | |
| | | | | | | | | Current | | | Non-current | |
| | | | | | | | | One to
three
months | | | Three to
twelve
months | | | Total
Current | | | One to
two
years | | | Two to
three
years | | | Three to
four
years | | | Four to
five
years | | | More
than
five
years | | | Total
Non-
current | |
| | | | | | | | | ThCh$ | | | ThCh$ | | | ThCh$ | | | ThCh$ | | | ThCh$ | | | ThCh$ | | | ThCh$ | | | ThCh$ | | | ThCh$ | |
Foreign | | Edegel S.A.A. | | Peru | | Foreign | | Banco Scotiabank | | Peru | | US$ | | | | | 2.02 | % | | | 2,250,920 | | | | 6,692,173 | | | | 8,943,093 | | | | 8,781,527 | | | | 13,384,629 | | | | — | | | | — | | | | — | | | | 22,166,156 | |
| | | | | | | | | | | | | | | | | | | | | 2,250,920 | | | | 6,692,173 | | | | 8,943,093 | | | | 8,781,527 | | | | 13,384,629 | | | | — | | | | — | | | | — | | | | 22,166,156 | |
| • | | Other liabilities by company |
| | | | | | | | | | | | | | | | | | | | | | | | | | | | | | | | | | | | | | | | | | | | | | | | | | | | | | |
Taxpayer
ID No.
(RUT) | | Company | | Country | | ID No.
Financial
Institution | | Financial Institution | | Country | | Currency | | | Nominal
Interest
Rate | | | Balance as of 9-30-2015 | |
| | | | | | | | | Current | | | Non-current | |
| | | | | | | | | One to
three
months | | | Three to
twelve
months | | | Total
Current | | | One to
two
years | | | Two to
three
years | | | Three to
four
years | | | Four to
five
years | | | More
than five
years | | | Total
Non-
current | |
| | | | | | | | | ThCh$ | | | ThCh$ | | | ThCh$ | | | ThCh$ | | | ThCh$ | | | ThCh$ | | | ThCh$ | | | ThCh$ | | | ThCh$ | |
Foreign | | Central Costanera S..A. | | Argentina | | Foreign | | Mitsubishi (secured debt) | | Argentina | | US$ | | | | | 0.25 | % | | | 2,158,883 | | | | 1,751,743 | | | | 3,910,626 | | | | 4,858,565 | | | | 1,819,943 | | | | 1,823,369 | | | | 1,889,553 | | | | 23,485,208 | | | | 33,876,638 | |
Foreign | | H. El Chocón S.A. | | Argentina | | Foreign | | Others | | Argentina | | | Ar$ | | | | 23.54 | % | | | 1,256,321 | | | | 14,723,806 | | | | 15,980,127 | | | | 10,546,466 | | | | 766,788 | | | | — | | | | — | | | | — | | | | 11,313,254 | |
Foreign | | Hidroinvest S.A. | | Argentina | | Foreign | | Others | | Argentina | | | US$ | | | | 2.33 | % | | | 992 | | | | 193,317 | | | | 194,309 | | | | — | | | | — | | | | — | | | | — | | | | — | | | | — | |
| | | | | | | | | | | | | | | | | | | | | 3,416,196 | | | | 16,668,866 | | | | 20,085,062 | | | | 15,405,031 | | | | 2,586,731 | | | | 1,823,369 | | | | 1,889,553 | | | | 23,485,208 | | | | 45,189,892 | |
| | | | | | | | | | | | | | | | | | | | | | | | | | | | | | | | | | | | | | | | | | | | | | | | | | | | | | | | | | |
Taxpayer
ID No.
(RUT) | | Company | | Country | | | ID No.
Financial
Institution | | | Financial Institution | | Country | | | Currency | | | Nominal
Interest
Rate | | Balance as of 12-31-2014 | |
| | | | | | | | | Current | | | Non-current | |
| | | | | | | | | One to
three
months | | | Three to
twelve
months | | | Total
Current | | | One to
two
years | | | Two to
three
years | | | Three to
four
years | | | Four to
five
years | | | More
than five
years | | | Total
Non-
current | |
| | | | | | | | | ThCh$ | | | ThCh$ | | | ThCh$ | | | ThCh$ | | | ThCh$ | | | ThCh$ | | | ThCh$ | | | ThCh$ | | | ThCh$ | |
Foreign | | Central Costanera S..A. | | | Argentina | | | | Foreign | | | Mitsubishi (secured debt) | | | Argentina | | | US$ | | | | 0.25% | | | 9,523 | | | | 1,850,404 | | | | 1,859,927 | | | | 671,565 | | | | 670,617 | | | | 669,670 | | | | 808,784 | | | | 23,886,776 | | | | 26,707,412 | |
Foreign | | Central Costanera S.A. | | | Argentina | | | | Foreign | | | Others | | | Argentina | | | Ar$ | | | | 17.29% | | | 1,097,278 | | | | 1,294,252 | | | | 2,391,530 | | | | — | | | | — | | | | — | | | | — | | | | — | | | | — | |
Foreign | | H. El Chocón S.A. | | | Argentina | | | | Foreign | | | Others | | | Argentina | | | Ar$ | | | | 23.54% | | | 127,042 | | | | 381,125 | | | | 508,167 | | | | 7,769,157 | | | | 1,945,985 | | | | — | | | | — | | | | — | | | | 9,715,142 | |
Foreign | | Hidroinvest S.A. | | | Argentina | | | | Foreign | | | Others | | | Argentina | | | US$ | | | | 2.33% | | | 952 | | | | 168,039 | | | | 168,991 | | | | — | | | | — | | | | — | | | | — | | | | — | | | | — | |
| | | | | | | | | | | | | | | | | | | | | | | | | 1,234,795 | | | | 3,693,820 | | | | 4,928,615 | | | | 8,440,722 | | | | 2,616,602 | | | | 669,670 | | | | 808,784 | | | | 23,886,776 | | | | 36,422,554 | |
F-121
APPENDIX 4 DETAIL OF ASSETS AND LIABILITIES IN FOREIGN CURRENCY
This appendix forms an integral part of the Combined Group’s financial statements.
The detail of assets denominated in foreign currencies is the following:
| | | | | | | | | | | | |
| | | | | | | Balance as of | |
| | | Foreign Currency | | Functional Currency | | 9-30-2015 | | | 31-12-2014 | |
| | | | ThCh$ | | | ThCh$ | |
| ASSETS | | | | | | | | | | | | |
CURRENT ASSETS | | | | | | | | | | | | |
Cash and cash equivalents | | | | | | | 8,313,328 | | | | 22,166,394 | |
| | US$ | | Ch$ | | | — | | | | 42,185 | |
| | US$ | | CP | | | 249,322 | | | | 342,438 | |
| | US$ | | Sol | | | 7,362,081 | | | | 21,216,886 | |
| | US$ | | Ar$ | | | 701,925 | | | | 564,885 | |
| | | | | | | | | | | | |
TOTAL CURRENT ASSETS | | | 8,313,328 | | | | 22,166,394 | |
| | | | | | | | | | | | |
NON-CURRENT ASSETS | | | | | | | | | | | | |
Investments accounted for using the equity method | | | | | | | 427,293,431 | | | | 540,856,061 | |
| | Ar$ | | Ch$ | | | 840,297 | | | | 1,979,132 | |
| | Brazilian real | | Sol | | | 44,986,283 | | | | 56,886,006 | |
| | Brazilian real | | Ch$ | | | 381,466,851 | | | | 481,990,923 | |
Goodwill | | | | | | | 100,396,852 | | | | 94,462,005 | |
| | Sol | | Ch$ | | | 93,959,054 | | | | 88,241,039 | |
| | Ar$ | | Ch$ | | | 6,437,798 | | | | 6,220,966 | |
| | | | | | | | | | | | |
TOTAL NON-CURRENT ASSETS | | | 527,690,283 | | | | 635,318,066 | |
| | | | | | | | | | | | |
TOTAL ASSETS | | | | | | | 536,003,611 | | | | 657,484,460 | |
| | | | | | | | | | | | |
F-122
The detail of liabilities denominated in foreign currencies is the following:
| | | | | | | | | | | | | | | | | | | | | | | | | | | | | | | | | | | | | | | | |
| | | Balance as of 9-30-2015 | |
| | Current | | | Non-current | |
| | One to
three
months | | | Three to
twelve
months | | | Total
Current | | | One to
two years | | | Two to
three
years | | | Three to
four
years | | | Four to
five years | | | More than
five years | | | Total
Non-
current | |
| | | Foreign
Currency | | Functional
Currency | | ThCh$ | | | ThCh$ | | | ThCh$ | | | ThCh$ | | | ThCh$ | | | ThCh$ | | | ThCh$ | | | ThCh$ | | | ThCh$ | |
Other financial liabilities | | US$ | | | | | 10,495,433 | | | | 57,656,769 | | | | 68,152,202 | | | | 28,698,114 | | | | 29,970,661 | | | | 9,100,540 | | | | 9,711,055 | | | | 33,661,611 | | | | 111,141,981 | |
| | US$ | | Sol | | | 4,355,955 | | | | 51,871,874 | | | | 56,227,829 | | | | 23,839,549 | | | | 28,150,718 | | | | 7,277,171 | | | | 7,821,502 | | | | 10,176,403 | | | | 77,265,343 | |
| | US$ | | Ar$ | | | 6,139,478 | | | | 5,784,895 | | | | 11,924,373 | | | | 4,858,565 | | | | 1,819,943 | | | | 1,823,369 | | | | 1,889,553 | | | | 23,485,208 | | | | 33,876,638 | |
| | | | | | | | | | | | | | | | | | | | | | | | | | | | | | | | | | | | | | | | |
TOTAL LIABILITIES | | | 10,495,433 | | | | 57,656,769 | | | | 68,152,202 | | | | 28,698,114 | | | | 29,970,661 | | | | 9,100,540 | | | | 9,711,055 | | | | 33,661,611 | | | | 111,141,981 | |
| | | | | | | | | | | | | | | | | | | | | | | | | | | | | | | | | | | | | | | | |
| | | | | | | | | | | | | | | | | | | | | | | | | | | | | | | | | | | | | | | | |
| | | Balance as of 12-31-2014 | |
| | Current | | | Non-current | |
| | One to
three
months | | | Three to
twelve
months | | | Total
Current | | | One to
two years | | | Two to
three
years | | | Three to
four years | | | Four to
five years | | | More than
five years | | | Total
Non-
current | |
| | | Foreign
Currency | | Functional
Currency | | ThCh$ | | | ThCh$ | | | ThCh$ | | | ThCh$ | | | ThCh$ | | | ThCh$ | | | ThCh$ | | | ThCh$ | | | ThCh$ | |
Other financial liabilities | | US$ | | | | | 12,409,400 | | | | 32,391,553 | | | | 44,800,953 | | | | 64,839,611 | | | | 34,279,771 | | | | 24,234,477 | | | | 6,756,293 | | | | 39,249,717 | | | | 169,359,869 | |
| | US$ | | Sol | | | 9,589,986 | | | | 18,318,769 | | | | 27,908,755 | | | | 63,128,648 | | | | 33,609,154 | | | | 23,564,807 | | | | 5,947,509 | | | | 15,362,941 | | | | 141,613,059 | |
| | US$ | | Ar$ | | | 2,819,414 | | | | 14,072,784 | | | | 16,892,198 | | | | 1,710,963 | | | | 670,617 | | | | 669,670 | | | | 808,784 | | | | 23,886,776 | | | | 27,746,810 | |
| | | | | | | | | | | | | | | | | | | | | | | | | | | | | | | | | | | | | | | | |
TOTAL LIABILITIES | | | 12,409,400 | | | | 32,391,553 | | | | 44,800,953 | | | | 64,839,611 | | | | 34,279,771 | | | | 24,234,477 | | | | 6,756,293 | | | | 39,249,717 | | | | 169,359,869 | |
| | | | | | | | | | | | | | | | | | | | | | | | | | | | | | | | | | | | | | | | |
F-123
APPENDIX 5 ADDITIONAL INFORMATION CIRCULAR NO. 715 OF FEBRUARY 3, 2012
This appendix forms an integral part of the Combined Group’s financial statements.
| a) | Portfolio stratification |
| • | | Trade and other receivables by aging: |
| | | | | | | | | | | | | | | | | | | | | | | | | | | | | | | | | | | | | | | | | | | | | | | | |
Trade and Other Receivables | | Balance as of 9-30-2015 | |
| | Current
portfolio | | | 1-30
days | | | 31-60
days | | | 61-90
days | | | 91-120
days | | | 121-150
days | | | 151-180
days | | | 181-210
days | | | 211-250
days | | | More
than
251 days | | | Total
Current | | | Total Non-
current | |
| | ThCh$ | | | ThCh$ | | | ThCh$ | | | ThCh$ | | | ThCh$ | | | ThCh$ | | | ThCh$ | | | ThCh$ | | | ThCh$ | | | ThCh$ | | | ThCh$ | | | ThCh$ | |
Trade receivables, gross | | | 165,225,487 | | | | 9,630,940 | | | | 3,569,921 | | | | 3,495,212 | | | | 5,182,023 | | | | 78,122 | | | | 77,316 | | | | 583,027 | | | | 2,681,221 | | | | 1,018,704 | | | | 191,541,973 | | | | 115,981,188 | |
Allowance for doubtful accounts | | | (288,033 | ) | | | — | | | | — | | | | — | | | | — | | | | — | | | | — | | | | — | | | | — | | | | (567,670 | ) | | | (855,703 | ) | | | — | |
Other receivables, gross | | | 5,448,199 | | | | — | | | | — | | | | — | | | | — | | | | — | | | | — | | | | — | | | | — | | | | — | | | | 5,448,199 | | | | 3,810,854 | |
Allowance for doubtful accounts | | | (1,374,842 | ) | | | — | | | | — | | | | — | | | | — | | | | — | | | | — | | | | — | | | | — | | | | — | | | | (1,374,842 | ) | | | — | |
| | | | | | | | | | | | | | | | | | | | | | | | | | | | | | | | | | | | | | | | | | | | | | | | |
Total | | | 169,010,811 | | | | 9,630,940 | | | | 3,569,921 | | | | 3,495,212 | | | | 5,182,023 | | | | 78,122 | | | | 77,316 | | | | 583,027 | | | | 2,681,221 | | | | 451,034 | | | | 194,759,627 | | | | 119,792,042 | |
| | | | | | | | | | | | | | | | | | | | | | | | | | | | | | | | | | | | | | | | | | | | | | | | |
| | | | | | | | | | | | | | | | | | | | | | | | | | | | | | | | | | | | | | | | | | | | | | | | |
Trade and Other Receivables | | Balance as of 12-31-2014 | |
| | Current
portfolio | | | 1-30
days | | | 31-60
days | | | 61-90
days | | | 91-120
days | | | 121-150
days | | | 151-180
days | | | 181-210
days | | | 211-250
days | | | More
than
251 days | | | Total
Current | | | Total Non-
current | |
| | ThCh$ | | | ThCh$ | | | ThCh$ | | | ThCh$ | | | ThCh$ | | | ThCh$ | | | ThCh$ | | | ThCh$ | | | ThCh$ | | | ThCh$ | | | ThCh$ | | | ThCh$ | |
Trade receivables, gross | | | 105,900,237 | | | | 5,522,879 | | | | 121,723 | | | | 64,251 | | | | 62,605 | | | | 61,242 | | | | 62,025 | | | | 60,783 | | | | 125,437 | | | | 2,178,437 | | | | 114,159,619 | | | | 136,744,799 | |
Allowance for doubtful accounts | | | (278,332 | ) | | | — | | | | — | | | | — | | | | — | | | | — | | | | — | | | | — | | | | — | | | | (865,390 | ) | | | (1,143,722 | ) | | | — | |
Other receivables, gross | | | 4,450,856 | | | | — | | | | — | | | | — | | | | — | | | | — | | | | — | | | | — | | | | — | | | | — | | | | 4,450,856 | | | | 4,471,713 | |
Allowance for doubtful accounts | | | (1,310,435 | ) | | | — | | | | — | | | | — | | | | — | | | | — | | | | — | | | | — | | | | — | | | | — | | | | (1,310,435 | ) | | | — | |
| | | | | | | | | | | | | | | | | | | | | | | | | | | | | | | | | | | | | | | | | | | | | | | | |
Total | | | 108,762,326 | | | | 5,522,879 | | | | 121,723 | | | | 64,251 | | | | 62,605 | | | | 61,242 | | | | 62,025 | | | | 60,783 | | | | 125,437 | | | | 1,313,047 | | | | 116,156,318 | | | | 141,216,512 | |
| | | | | | | | | | | | | | | | | | | | | | | | | | | | | | | | | | | | | | | | | | | | | | | | |
F-124
| | | | | | | | | | | | | | | | | | | | | | | | | | | | | | | | | | | | | | | | | | | | | | | | |
Aging of balances | | Balance as of 9-30-2015 | | | Balance as of 12-31-2014 | |
| | Non-renegotiated
portfolio | | | Portfolio with
renegotiation terms | | | Total gross portfolio | | | Non-renegotiated
portfolio | | | Portfolio with
renegotiation terms | | | Total gross portfolio | |
| | Number
of
customers | | | Gross value | | | Number
of
customers | | | Gross value | | | Number
of
customers | | | Gross value | | | Number
of
customers | | | Gross value | | | Number
of
customers | | | Gross value | | | Number
of
customers | | | Gross value | |
| | | ThCh$ | | | | ThCh$ | | | | ThCh$ | | | | ThCh$ | | | | ThCh$ | | | | ThCh$ | |
Current | | | 135 | | | | 281,206,675 | | | | — | | | | — | | | | 135 | | | | 281,206,675 | | | | 137 | | | | 242,645,036 | | | | — | | | | — | | | | 137 | | | | 242,645,036 | |
1 to 30 days | | | 39 | | | | 9,630,940 | | | | — | | | | — | | | | 39 | | | | 9,630,940 | | | | 53 | | | | 5,522,879 | | | | — | | | | — | | | | 53 | | | | 5,522,879 | |
31 to 60 days | | | 9 | | | | 3,569,921 | | | | — | | | | — | | | | 9 | | | | 3,569,921 | | | | 11 | | | | 121,723 | | | | — | | | | — | | | | 11 | | | | 121,723 | |
61 to 90 days | | | 8 | | | | 3,495,212 | | | | — | | | | — | | | | 8 | | | | 3,495,212 | | | | 4 | | | | 64,251 | | | | — | | | | — | | | | 4 | | | | 64,251 | |
91 to 120 days | | | 4 | | | | 5,182,023 | | | | — | | | | — | | | | 4 | | | | 5,182,023 | | | | 3 | | | | 62,605 | | | | — | | | | — | | | | 3 | | | | 62,605 | |
121 to 150 days | | | 2 | | | | 78,122 | | | | — | | | | — | | | | 2 | | | | 78,122 | | | | 3 | | | | 61,242 | | | | — | | | | — | | | | 3 | | | | 61,242 | |
151 to 180 days | | | 3 | | | | 77,316 | | | | — | | | | — | | | | 3 | | | | 77,316 | | | | 1 | | | | 62,025 | | | | — | | | | — | | | | 1 | | | | 62,025 | |
181 to 210 days | | | 5 | | | | 583,027 | | | | — | | | | — | | | | 5 | | | | 583,027 | | | | 2 | | | | 60,783 | | | | — | | | | — | | | | 2 | | | | 60,783 | |
211 to 250 days | | | 3 | | | | 2,681,221 | | | | — | | | | — | | | | 3 | | | | 2,681,221 | | | | 2 | | | | 125,437 | | | | — | | | | — | | | | 2 | | | | 125,437 | |
More than 251 days | | | 35 | | | | 1,018,704 | | | | — | | | | — | | | | 35 | | | | 1,018,704 | | | | 33 | | | | 2,178,437 | | | | — | | | | — | | | | 33 | | | | 2,178,437 | |
| | | | | | | | | | | | | | | | | | | | | | | | | | | | | | | | | | | | | | | | | | | | | | | | |
Total | | | 243 | | | | 307,523,161 | | | | — | | | | — | | | | 243 | | | | 307,523,161 | | | | 249 | | | | 250,904,418 | | | | — | | | | — | | | | 249 | | | | 250,904,418 | |
| | | | | | | | | | | | | | | | | | | | | | | | | | | | | | | | | | | | | | | | | | | | | | | | |
F-125
| b) | Portfolio in default and in legal collection process |
| | | | | | | | | | | | | | | | |
| | | Balance as of 9-30-2015 | | | Balance as of 12-31-2014 | |
| | Number of
customers | | | Amount | | | Number of
customers | | | Amount | |
Portfolio in Default and in Legal Collection Process | | | ThCh$ | | | | ThCh$ | |
Notes receivable in legal collection process (*) | | | 5 | | | | 186,025 | | | | 5 | | | | 186,025 | |
| | | | | | | | | | | | | | | | |
Total | | | 5 | | | | 186,025 | | | | 5 | | | | 186,025 | |
| | | | | | | | | | | | | | | | |
| (*) | Legal collections are included in the portfolio in arrears. |
| c) | Provisions and write-offs |
| | | | | | | | |
| | | For the nine months ended | |
| | 9-30-2015 | | | 9-30-2014 | |
Provisions and Write-offs | | ThCh$ | | | ThCh$
(Unaudited) | |
Provision for non-renegotiated portfolio | | | (144,840 | ) | | | 446,598 | |
| | | | | | | | |
Total | | | (144,840 | ) | | | 446,598 | |
| | | | | | | | |
| d) | Number and value of operations |
| | | | | | | | | | | | | | | | |
Number and Value of Operations | | For the nine months ended | |
| | 9-30-2015 | | | 9-30-2014
(Unaudited) | |
| | Last
quarter | | | Nine-month
period | | | Last
quarter | | | Nine-month
period | |
Impairment provision and recoveries | | | | | | | | | | | | | | | | |
Number of operations | | | 45 | | | | 180 | | | | 19 | | | | 159 | |
Value of operations, in ThCh$ | | | 427,006 | | | | (144,840 | ) | | | 171,686 | | | | 446,598 | |
F-126
APPENDIX 5.1 SUPPLEMENTARY INFORMATION ON TRADE RECEIVABLES
This appendix forms an integral part of the Combined Group’s financial statements.
| a) | Portfolio stratification |
| • | | Trade receivables by aging: |
| | | | | | | | | | | | | | | | | | | | | | | | | | | | | | | | | | | | | | | | | | | | | | | | |
Trade and Other Receivables | | Balance as of 9-30-2015 | | | Balance as of 9-30-2015 | |
| | Current | | | 1-30
days | | | 31-60
days | | | 61-90
days | | | 91-120
days | | | 121-150
days | | | 151-180
days | | | 181-210
days | | | 211-250
days | | | More
than
251 days | | | Total
Current | | | Total Non-
current | |
| | ThCh$ | | | ThCh$ | | | ThCh$ | | | ThCh$ | | | ThCh$ | | | ThCh$ | | | ThCh$ | | | ThCh$ | | | ThCh$ | | | ThCh$ | | | ThCh$ | | | ThCh$ | |
Generation and transmission receivables | | | 165,225,487 | | | | 9,630,940 | | | | 3,569,921 | | | | 3,495,212 | | | | 5,182,023 | | | | 78,122 | | | | 77,316 | | | | 583,027 | | | | 2,681,221 | | | | 1,018,704 | | | | 191,541,973 | | | | 115,981,188 | |
— Large customers | | | 106,196,877 | | | | 9,630,940 | | | | 3,569,921 | | | | 3,495,212 | | | | 5,182,023 | | | | 78,122 | | | | 77,316 | | | | 583,027 | | | | 2,681,221 | | | | 1,018,660 | | | | 132,513,319 | | | | — | |
— Institutional customers | | | 56,260,943 | | | | — | | | | — | | | | — | | | | — | | | | — | | | | — | | | | — | | | | — | | | | — | | | | 56,260,943 | | | | 115,981,188 | |
— Others | | | 2,767,667 | | | | — | | | | — | | | | — | | | | — | | | | — | | | | — | | | | — | | | | — | | | | 44 | | | | 2,767,711 | | | | — | |
Allowance for doubtful accounts | | | (288,033 | ) | | | — | | | | — | | | | — | | | | — | | | | — | | | | — | | | | — | | | | — | | | | (567,670 | ) | | | (855,703 | ) | | | — | |
| | | | | | | | | | | | |
Unbilled services | | | 93,432,729 | | | | — | | | | — | | | | — | | | | — | | | | — | | | | — | | | | — | | | | — | | | | — | | | | 93,432,729 | | | | 4,254,101 | |
Services billed | | | 71,792,758 | | | | 9,630,940 | | | | 3,569,921 | | | | 3,495,212 | | | | 5,182,023 | | | | 78,122 | | | | 77,316 | | | | 583,027 | | | | 2,681,221 | | | | 1,018,704 | | | | 98,109,244 | | | | 111,727,087 | |
| | | | | | | | | | | | | | | | | | | | | | | | | | | | | | | | | | | | | | | | | | | | | | | | |
Total Trade Receivables, Gross | | | 165,225,487 | | | | 9,630,940 | | | | 3,569,921 | | | | 3,495,212 | | | | 5,182,023 | | | | 78,122 | | | | 77,316 | | | | 583,027 | | | | 2,681,221 | | | | 1,018,704 | | | | 191,541,973 | | | | 115,981,188 | |
| | | | | | | | | | | | | | | | | | | | | | | | | | | | | | | | | | | | | | | | | | | | | | | | |
Total Allowance for doubtful accounts | | | (288,033 | ) | | | — | | | | — | | | | — | | | | — | | | | — | | | | — | | | | — | | | | — | | | | (567,670 | ) | | | (855,703 | ) | | | — | |
| | | | | | | | | | | | | | | | | | | | | | | | | | | | | | | | | | | | | | | | | | | | | | | | |
Total Trade Receivables, Net | | | 164,937,454 | | | | 9,630,940 | | | | 3,569,921 | | | | 3,495,212 | | | | 5,182,023 | | | | 78,122 | | | | 77,316 | | | | 583,027 | | | | 2,681,221 | | | | 451,034 | | | | 190,686,270 | | | | 115,981,188 | |
| | | | | | | | | | | | | | | | | | | | | | | | | | | | | | | | | | | | | | | | | | | | | | | | |
Trade and Other Receivables | | Balance as of 12-31-2014 | | | Balance as of 12-31-2014 | |
| | Current | | | 1-30
days | | | 31-60
days | | | 61-90
days | | | 91-120
days | | | 121-150
days | | | 151-180
days | | | 181-210
days | | | 211-250
days | | | More
than
251 days | | | Total
Current | | | Total Non-
current | |
| | ThCh$ | | | ThCh$ | | | ThCh$ | | | ThCh$ | | | ThCh$ | | | ThCh$ | | | ThCh$ | | | ThCh$ | | | ThCh$ | | | ThCh$ | | | ThCh$ | | | ThCh$ | |
Generation and transmission receivables | | | | | | | | | | | | | | | | | | | | | | | | | | | | | | | | | | | | | | | | | | | | | | | | |
— Large customers | | | 72,719,222 | | | | 5,522,879 | | | | 121,723 | | | | 64,251 | | | | 62,605 | | | | 61,242 | | | | 62,025 | | | | 60,783 | | | | 125,437 | | | | 2,178,437 | | | | 80,978,604 | | | | — | |
— Institutional customers | | | 31,379,347 | | | | — | | | | — | | | | — | | | | — | | | | — | | | | — | | | | — | | | | — | | | | — | | | | 31,379,347 | | | | 136,744,799 | |
— Others | | | 1,801,668 | | | | — | | | | — | | | | — | | | | — | | | | — | | | | — | | | | — | | | | — | | | | — | | | | 1,801,668 | | | | — | |
Allowance for doubtful accounts | | | (278,332 | ) | | | — | | | | — | | | | — | | | | — | | | | — | | | | — | | | | — | | | | — | | | | (865,390 | ) | | | (1,143,722 | ) | | | — | |
| | | | | | | | | | | | |
Unbilled services | | | 65,286,822 | | | | — | | | | — | | | | — | | | | — | | | | — | | | | — | | | | — | | | | — | | | | — | | | | 65,286,822 | | | | — | |
Services billed | | | 40,613,415 | | | | 5,522,879 | | | | 121,723 | | | | 64,251 | | | | 62,605 | | | | 61,242 | | | | 62,025 | | | | 60,783 | | | | 125,437 | | | | 2,178,437 | | | | 48,872,797 | | | | 136,744,799 | |
| | | | | | | | | | | | | | | | | | | | | | | | | | | | | | | | | | | | | | | | | | | | | | | | |
Total Trade Receivables, Gross | | | 105,900,237 | | | | 5,522,879 | | | | 121,723 | | | | 64,251 | | | | 62,605 | | | | 61,242 | | | | 62,025 | | | | 60,783 | | | | 125,437 | | | | 2,178,437 | | | | 114,159,619 | | | | 136,744,799 | |
| | | | | | | | | | | | | | | | | | | | | | | | | | | | | | | | | | | | | | | | | | | | | | | | |
Total Allowance for doubtful accounts | | | (278,332 | ) | | | — | | | | — | | | | — | | | | — | | | | — | | | | — | | | | — | | | | — | | | | (865,390 | ) | | | (1,143,722 | ) | | | — | |
| | | | | | | | | | | | | | | | | | | | | | | | | | | | | | | | | | | | | | | | | | | | | | | | |
Total Trade Receivables, Net | | | 105,621,905 | | | | 5,522,879 | | | | 121,723 | | | | 64,251 | | | | 62,605 | | | | 61,242 | | | | 62,025 | | | | 60,783 | | | | 125,437 | | | | 1,313,047 | | | | 113,015,897 | | | | 136,744,799 | |
| | | | | | | | | | | | | | | | | | | | | | | | | | | | | | | | | | | | | | | | | | | | | | | | |
F-127
| | | | | | | | | | | | | | | | | | | | | | | | | | | | | | | | | | | | | | | | | | | | |
Portfolio Type | | Balance as of 9-30-2015 | |
| | Current | | | 1-30 days | | | 31-60
days | | | 61-90
days | | | 91-120
days | | | 121-150
days | | | 151-180
days | | | 181-210
days | | | 211-250
days | | | More than
251 days | | | Total gross
portfolio | |
| | ThCh$ | | | ThCh$ | | | ThCh$ | | | ThCh$ | | | ThCh$ | | | ThCh$ | | | ThCh$ | | | ThCh$ | | | ThCh$ | | | ThCh$ | | | ThCh$ | |
GENERATION AND TRANSMISSION | | | | | | | | | | | | | | | | | | | | | | | | | | | | | | | | | | | | | | | | | | | | |
Non-renegotiated portfolio | | | 165,225,487 | | | | 9,630,940 | | | | 3,569,921 | | | | 3,495,212 | | | | 5,182,023 | | | | 78,122 | | | | 77,316 | | | | 583,027 | | | | 2,681,221 | | | | 1,018,704 | | | | 191,541,973 | |
— Large customers | | | 125,499,570 | | | | 9,630,940 | | | | 3,569,921 | | | | 3,495,212 | | | | 5,182,023 | | | | 78,122 | | | | 77,316 | | | | 583,027 | | | | 2,681,221 | | | | 1,018,660 | | | | 151,816,012 | |
— Institutional customers | | | 37,012,636 | | | | — | | | | — | | | | — | | | | — | | | | — | | | | — | | | | — | | | | — | | | | — | | | | 37,012,636 | |
— Others | | | 2,713,281 | | | | — | | | | — | | | | — | | | | — | | | | — | | | | — | | | | — | | | | — | | | | 44 | | | | 2,713,325 | |
| | | | | | | | | | | | | | | | | | | | | | | | | | | | | | | | | | | | | | | | | | | | |
Total gross portfolio | | | 165,225,487 | | | | 9,630,940 | | | | 3,569,921 | | | | 3,495,212 | | | | 5,182,023 | | | | 78,122 | | | | 77,316 | | | | 583,027 | | | | 2,681,221 | | | | 1,018,704 | | | | 191,541,973 | |
| | | | | | | | | | | | | | | | | | | | | | | | | | | | | | | | | | | | | | | | | | | | |
| | | | | | | | | | | | | | | | | | | | | | | | | | | | | | | | | | | | | | | | | | | | |
Portfolio Type | | Balance as of 12-31-2014 | |
| | Current | | | 1-30 days | | | 31-60
days | | | 61-90
days | | | 91-120
days | | | 121-150
days | | | 151-180
days | | | 181-210
days | | | 211-250
days | | | More than
251 days | | | Total gross
portfolio | |
| | ThCh$ | | | ThCh$ | | | ThCh$ | | | ThCh$ | | | ThCh$ | | | ThCh$ | | | ThCh$ | | | ThCh$ | | | ThCh$ | | | ThCh$ | | | ThCh$ | |
GENERATION AND TRANSMISSION | | | | | | | | | | | | | | | | | | | | | | | | | | | | | | | | | | | | | | | | | | | | |
Non-renegotiated portfolio | | | 105,900,237 | | | | 5,522,879 | | | | 121,723 | | | | 64,251 | | | | 62,605 | | | | 61,242 | | | | 62,025 | | | | 60,783 | | | | 125,437 | | | | 2,178,437 | | | | 114,159,619 | |
— Large customers | | | 72,719,222 | | | | 5,522,879 | | | | 121,723 | | | | 64,251 | | | | 62,605 | | | | 61,242 | | | | 62,025 | | | | 60,783 | | | | 125,437 | | | | 2,178,437 | | | | 80,978,604 | |
— Institutional customers | | | 31,379,347 | | | | — | | | | — | | | | — | | | | — | | | | — | | | | — | | | | — | | | | — | | | | — | | | | 31,379,347 | |
— Others | | | 1,801,668 | | | | — | | | | — | | | | — | | | | — | | | | — | | | | — | | | | — | | | | — | | | | — | | | | 1,801,668 | |
| | | | | | | | | | | | | | | | | | | | | | | | | | | | | | | | | | | | | | | | | | | | |
Total gross portfolio | | | 105,900,237 | | | | 5,522,879 | | | | 121,723 | | | | 64,251 | | | | 62,605 | | | | 61,242 | | | | 62,025 | | | | 60,783 | | | | 125,437 | | | | 2,178,437 | | | | 114,159,619 | |
| | | | | | | | | | | | | | | | | | | | | | | | | | | | | | | | | | | | | | | | | | | | |
F-128
APPENDIX 5.2 ESTIMATED SALES AND PURCHASES OF ENERGY AND CAPACITY
This appendix forms an integral part of the Combined Group’s financial statements.
| | | | | | | | | | | | | | | | | | | | | | | | | | | | | | | | | | | | | | | | | | | | | | | | | | | | | | | | | | | | | | | | |
Country | | Colombia | | | Peru | | | Argentina | | | Total | |
Balance as of | | 30-09-2015 | | | 31-12-2014 | | | 30-09-2015 | | | 31-12-2014 | | | 30-09-2015 | | | 31-12-2014 | | | 30-09-2015 | | | 31-12-2014 | |
| | | Energy
and
Capacity | | | Tolls | | | Energy
and
Capacity | | | Tolls | | | Energy
and
Capacity | | | Tolls | | | Energy
and
Capacity | | | Tolls | | | Energy
and
Capacity | | | Tolls | | | Energy
and
Capacity | | | Tolls | | | Energy
and
Capacity | | | Tolls | | | Energy
and
Capacity | | | Tolls | |
STATEMENT OF FINANCIAL POSITION | | | | | | | | | | | | | | | | | | | | | | | | | | | | | | | | | | | | | | | | | | | | | | | | | | | | | | | | | | | | | | | | |
Current accounts receivable from related parties | | | 6,303,894 | | | | — | | | | 7,786,508 | | | | — | | | | 6,479,455 | | | | 1,632,858 | | | | 5,507,890 | | | | 926,965 | | | | — | | | | — | | | | — | | | | — | | | | 12,783,349 | | | | 1,632,858 | | | | 13,294,398 | | | | 926,965 | |
Trade and other current receivables, net | | | 49,425,809 | | | | — | | | | 40,601,712 | | | | — | | | | 20,846,673 | | | | 4,883,952 | | | | 17,854,876 | | | | 3,306,253 | | | | 10,017,777 | | | | 85,424 | | | | 4,480,943 | | | | 2,247,911 | | | | 80,290,259 | | | | 4,969,376 | | | | 62,937,531 | | | | 5,554,164 | |
| | | | | | | | | | | | | | | | | | | | | | | | | | | | | | | | | | | | | | | | | | | | | | | | | | | | | | | | | | | | | | | | |
Total Estimated Assets | | | 55,729,703 | | | | — | | | | 48,388,220 | | | | — | | | | 27,326,128 | | | | 6,516,810 | | | | 23,362,766 | | | | 4,233,218 | | | | 10,017,777 | | | | 85,424 | | | | 4,480,943 | | | | 2,247,911 | | | | 93,073,608 | | | | 6,602,234 | | | | 76,231,929 | | | | 6,481,129 | |
| | | | | | | | | | | | | | | | | | | | | | | | | | | | | | | | | | | | | | | | | | | | | | | | | | | | | | | | | | | | | | | | |
Current accounts payables to related parties | | | — | | | | 2,238,975 | | | | — | | | | — | | | | — | | | | — | | | | — | | | | — | | | | — | | | | — | | | | — | | | | — | | | | — | | | | 2,238,975 | | | | — | | | | — | |
Trade and other current payables | | | — | | | | 3,388,217 | | | | 7,649,456 | | | | — | | | | 262,557 | | | | 3,341,795 | | | | 1,154,319 | | | | 2,732,796 | | | | 21,361 | | | | — | | | | 600,929 | | | | 6,529 | | | | 283,918 | | | | 6,730,012 | | | | 9,404,704 | | | | 2,739,325 | |
| | | | | | | | | | | | | | | | | | | | | | | | | | | | | | | | | | | | | | | | | | | | | | | | | | | | | | | | | | | | | | | | |
Total Estimated Liabilities | | | — | | | | 5,627,192 | | | | 7,649,456 | | | | — | | | | 262,557 | | | | 3,341,795 | | | | 1,154,319 | | | | 2,732,796 | | | | 21,361 | | | | — | | | | 600,929 | | | | 6,529 | | | | 283,918 | | | | 8,968,987 | | | | 9,404,704 | | | | 2,739,325 | |
| | | | | | | | | | | | | | | | | | | | | | | | | | | | | | | | | | | | | | | | | | | | | | | | | | | | | | | | | | | | | | | | |
| | | | | | | | | | | | | | | | | | | | | | | | | | | | | | | | | | | | | | | | | | | | | | | | | | | | | | | | | | | | | | | | |
Country | | Colombia | | | Peru | | | Argentina | | | Total | |
For the nine months ended | | 30-09-2015 | | | 30-09-2014 | | | 30-09-2015 | | | 30-09-2014 | | | 30-09-2015 | | | 30-09-2014 | | | 30-09-2015 | | | 30-09-2014 | |
| | | Energy
and
Capacity | | | Tolls | | | Energy
and
Capacity | | | Tolls | | | Energy
and
Capacity | | | Tolls | | | Energy
and
Capacity | | | Tolls | | | Energy
and
Capacity | | | Tolls | | | Energy
and
Capacity | | | Tolls | | | Energy
and
Capacity | | | Tolls | | | Energy
and
Capacity | | | Tolls | |
STATEMENT OF INCOME | | | | | | | | | | | | | | | | | | | | | | | | | | | | | | | | | | | | | | | | | | | | | | | | | | | | | | | | | | | | | | | | |
Energy Sales | | | 59,876,258 | | | | — | | | | 63,670,982 | | | | — | | | | 25,801,281 | | | | 6,153,161 | | | | 27,068,936 | | | | 588,587 | | | | 6,103,807 | | | | 82,170 | | | | 10,049 | | | | 479,746 | | | | 91,781,346 | | | | 6,235,331 | | | | 90,749,967 | | | | 1,068,333 | |
Energy Purchases | | | — | | | | 5,992,136 | | | | — | | | | 11,409,456 | | | | 247,905 | | | | 3,155,317 | | | | 733,971 | | | | 2,689,703 | | | | 143,898 | | | | — | | | | — | | | | — | | | | 391,803 | | | | 9,147,453 | | | | 733,971 | | | | 14,099,159 | |
F-129
APPENDIX 6 DETAILS OF DUE DATES OF PAYMENTS TO SUPPLIERS
This appendix forms an integral part of the Combined Group’s financial statements.
| | | | | | | | | | | | | | | | | | | | | | | | | | | | | | | | |
Suppliers with Current
Payment Amounts | | Balance as of | |
| | 9-30-2015 | | | 12-31-2014 | |
| | Goods | | | Services | | | Other | | | Total | | | Goods | | | Services | | | Other | | | Total | |
| | ThCh$ | | | ThCh$ | | | ThCh$ | | | ThCh$ | | | ThCh$ | | | ThCh$ | | | ThCh$ | | | ThCh$ | |
Up to 30 days | | | — | | | | 17,179,767 | | | | — | | | | 17,179,767 | | | | — | | | | 99,765,926 | | | | — | | | | 99,765,926 | |
From 31 to 60 days | | | — | | | | 6,784,390 | | | | — | | | | 6,784,390 | | | | — | | | | 6,067,846 | | | | — | | | | 6,067,846 | |
| | | | | | | | | | | | | | | | | | | | | | | | | | | | | | | | |
Total | | | — | | | | 23,964,157 | | | | — | | | | 23,964,157 | | | | — | | | | 105,833,772 | | | | — | | | | 105,833,772 | |
| | | | | | | | | | | | | | | | | | | | | | | | | | | | | | | | |
| | | | | | | | | | | | | | | | | | | | | | | | | | | | | | | | |
Suppliers with Pas Due Amounts | | Balance as of | |
| | 9-30-2015 | | | 12-31-2014 | |
| | Goods | | | Services | | | Other | | | Total | | | Goods | | | Services | | | Other | | | Total | |
| | ThCh$ | | | ThCh$ | | | ThCh$ | | | ThCh$ | | | ThCh$ | | | ThCh$ | | | ThCh$ | | | ThCh$ | |
More than 180 days | | | — | | | | — | | | | — | | | | — | | | | — | | | | 1,137,018 | | | | — | | | | 1,137,018 | |
| | | | | | | | | | | | | | | | | | | | | | | | | | | | | | | | |
Total | | | — | | | | — | | | | — | | | | — | | | | — | | | | 1,137,018 | | | | — | | | | 1,137,018 | |
| | | | | | | | | | | | | | | | | | | | | | | | | | | | | | | | |
F-130
Endesa Américas
Combined Financial Statements as of December 31, 2014, 2013 and January 1, 2013, and for the years ended December 31, 2014 and 2013
F-131
ENDESA AMÉRICAS
Combined Statements of Financial Position
As of December 31, 2014 and 2013 and January 1, 2013
(In thousands of Chilean pesos)
| | | | | | | | | | | | | | | | |
| | | Note | | | 12-31-2014 | | | 12-31-2013 | | | 1-1-2013 | |
| ASSETS | | | | | | | | | | | | | | | | |
CURRENT ASSETS | | | | | |
Cash and cash equivalents | | | 5 | | | | 298,442,230 | | | | 286,218,693 | | | | 231,325,290 | |
Other current financial assets | | | 6 | | | | 23,385,199 | | | | 1,882,217 | | | | 25,119,785 | |
Other current non-financial assets | | | | | | | 30,273,484 | | | | 35,132,748 | | | | 11,974,799 | |
Trade and other current receivables, net | | | 7 | | | | 116,156,318 | | | | 102,240,411 | | | | 76,237,955 | |
Current accounts receivable from related parties | | | 8 | | | | 26,125,993 | | | | 77,109,976 | | | | 41,420,094 | |
Inventories | | | 9 | | | | 28,899,937 | | | | 31,492,081 | | | | 29,308,072 | |
Current income tax receivables | | | 10 | | | | 2,588,814 | | | | 1,759,716 | | | | 1,753,747 | |
| | | | | | | | | | | | | | | | |
TOTAL CURRENT ASSETS | | | | | | | 525,871,975 | | | | 535,835,842 | | | | 417,139,742 | |
| | | | | | | | | | | | | | | | |
NON-CURRENT ASSETS | | | | | | | | |
Other non-current financial assets | | | 6 | | | | 1,216,953 | | | | 1,300,409 | | | | 1,868,798 | |
Other non-current non-financial assets | | | | | | | 2,331,504 | | | | 12,151 | | | | 1,888,628 | |
Trade and other non-current receivables, net | | | 7 | | | | 141,216,512 | | | | 131,597,410 | | | | 146,964,151 | |
Investments accounted for using the equity method | | | 11 | | | | 540,856,061 | | | | 546,255,158 | | | | 576,912,406 | |
Intangible assets other than goodwill | | | 12 | | | | 33,599,920 | | | | 34,545,972 | | | | 33,657,103 | |
Goodwill | | | 13 | | | | 100,749,542 | | | | 95,440,093 | | | | 97,090,981 | |
Property, plant and equipment, net | | | 14 | | | | 2,609,314,957 | | | | 2,442,311,749 | | | | 2,305,586,621 | |
Deferred income tax assets | | | 15 | | | | 47,559,617 | | | | 45,836,896 | | | | 47,640,756 | |
| | | | | | | | | | | | | | | | |
TOTAL NON-CURRENT ASSETS | | | | 3,476,845,066 | | | | 3,297,299,838 | | | | 3,211,609,444 | |
| | | | | | | | | | | | | | | | |
TOTAL ASSETS | | | | 4,002,717,041 | | | | 3,833,135,680 | | | | 3,628,749,186 | |
| | | | | | | | | | | | | | | | |
CURRENT LIABILITIES | | | | | | | | |
Other current financial liabilities | | | 16 | | | | 144,394,860 | | | | 226,471,389 | | | | 186,098,282 | |
Trade and other current payables | | | 19 | | | | 359,620,851 | | | | 210,559,930 | | | | 200,916,859 | |
Current accounts payable to related parties | | | 8 | | | | 113,060,776 | | | | 56,162,964 | | | | 64,444,224 | |
Provisions | | | 20 | | | | 27,419,411 | | | | 17,080,710 | | | | 14,962,818 | |
Current income tax liabilities | | | 10 | | | | 62,912,077 | | | | 40,795,355 | | | | 33,208,153 | |
Other current non-financial liabilities | | | | | | | 17,752,031 | | | | 7,216,942 | | | | 5,849,229 | |
| | | | | | | | | | | | | | | | |
TOTAL CURRENT LIABILITIES | | | | 725,160,006 | | | | 558,287,290 | | | | 505,479,565 | |
| | | | | | | | | | | | | | | | |
NON-CURRENT LIABILITIES | | | | | | | | |
Other non-current financial liabilities | | | 16 | | | | 1,047,567,699 | | | | 961,359,003 | | | | 868,970,589 | |
Provisions | | | 20 | | | | 3,692,437 | | | | 3,579,963 | | | | 3,048,950 | |
Deferred income tax liabilities | | | 15 | | | | 158,274,836 | | | | 145,731,390 | | | | 149,350,792 | |
Non-current provisions for employee benefits | | | 21 | | | | 24,924,791 | | | | 25,721,273 | | | | 25,359,991 | |
Other non-current non-financial liabilities | | | | | | | 26,041,215 | | | | 23,871,580 | | | | 36,885,702 | |
| | | | | | | | | | | | | | | | |
TOTAL NON-CURRENT LIABILITIES | | | | 1,260,500,978 | | | | 1,160,263,209 | | | | 1,083,616,024 | |
| | | | | | | | | | | | | | | | |
TOTAL LIABILITIES | | | | 1,985,660,984 | | | | 1,718,550,499 | | | | 1,589,095,589 | |
| | | | | | | | | | | | | | | | |
EQUITY | | | | | | | | |
Allocated capital | | | 22 | | | | 899,433,829 | | | | 899,433,829 | | | | 899,433,829 | |
Retained earnings | | | | | | | 1,176,110,289 | | | | 1,116,137,754 | | | | 999,835,880 | |
Other reserves | | | 22 | | | | (850,834,523 | ) | | | (809,385,039 | ) | | | (734,883,937 | ) |
Equity attributable to Parent Company | | | | 1,224,709,595 | | | | 1,206,186,544 | | | | 1,164,385,772 | |
Non-controlling interests | | | 22.5 | | | | 792,346,462 | | | | 908,398,637 | | | | 875,267,825 | |
| | | | | | | | | | | | | | | | |
TOTAL EQUITY | | | | 2,017,056,057 | | | | 2,114,585,181 | | | | 2,039,653,597 | |
| | | | | | | | | | | | | | | | |
TOTAL LIABILITIES AND EQUITY | | | | 4,002,717,041 | | | | 3,833,135,680 | | | | 3,628,749,186 | |
| | | | | | | | | | | | | | | | |
See accompanying notes to the combined financial statements.
F-132
ENDESA AMÉRICAS
Combined Statements of Comprehensive Income, by Nature
For the years ended December 31, 2014 and 2013
(In thousands of Chilean pesos)
| | | | | | | | | | | | |
| | | Note | | | 2014 | | | 2013 | |
Revenues | | | 23 | | | | 1,154,414,240 | | | | 997,632,514 | |
Other operating income | | | 23 | | | | 61,145,248 | | | | 59,762,114 | |
Revenues and Other Operating Income | | | | | | | 1,215,559,488 | | | | 1,057,394,628 | |
Raw materials and consumables used | | | 24 | | | | (369,241,528 | ) | | | (335,977,638 | ) |
Contribution Margin | | | | | | | 846,317,960 | | | | 721,416,990 | |
Other work performed by the entity and capitalized | | | 3 | | | | 12,704,316 | | | | 8,356,167 | |
Employee benefits expense | | | 25 | | | | (70,044,869 | ) | | | (60,148,919 | ) |
Depreciation and amortization expense | | | 26 | | | | (103,836,335 | ) | | | (97,054,335 | ) |
Impairment losses | | | 26 | | | | (2,057,856 | ) | | | (6,523,091 | ) |
Other expenses | | | 27 | | | | (60,036,018 | ) | | | (52,540,675 | ) |
Operating Income | | | | | | | 623,047,198 | | | | 513,506,137 | |
Other gains, net | | | | | | | 749,878 | | | | 843,216 | |
Financial income | | | 28 | | | | 93,967,597 | | | | 15,137,466 | |
Financial costs | | | 28 | | | | (65,211,336 | ) | | | (66,695,425 | ) |
Share of profits and losses of investments accounted for using the equity method | | | 11 | | | | 61,598,411 | | | | 95,037,838 | |
Foreign currency exchange losses, net | | | 28 | | | | (20,192,761 | ) | | | (11,576,858 | ) |
Profit before taxes | | | | 693.958.987 | | | | 546,252,374 | |
Income tax expense | | | 29 | | | | (204,051,052 | ) | | | (167,912,189 | ) |
| | | | | | | | | | | | |
NET PROFIT | | | | | | | 489,907,935 | | | | 378,340,185 | |
| | | | | | | | | | | | |
Net profit attributable to: | | | | | | | | | | | | |
Parent Company | | | | | | | 220,154,609 | | | | 180,783,612 | |
Non-controlling interests | | | 22.6 | | | | 269,753,326 | | | | 197,556,573 | |
| | | | | | | | | | | | |
NET PROFIT | | | | | | | 489,907,935 | | | | 378,340,185 | |
| | | | | | | | | | | | |
See accompanying notes to the combined financial statements.
F-133
ENDESA AMÉRICAS
Combined Statements of Comprehensive Income, by Nature (continued)
For the years ended December 31, 2014 and 2013
(In thousands of Chilean pesos)
| | | | | | | | | | | | |
| | | Note | | | 2014 | | | 2013 | |
NET PROFIT | | | | | | | 489,907,935 | | | | 378,340,185 | |
Other comprehensive loss items that will not be reclassified subsequently to profit or loss, before taxes | | | | | | | | | | | | |
Net losses from defined benefit plans | | | 21 | | | | (1,059,671 | ) | | | (1,886,866 | ) |
Other comprehensive loss items that will not be reclassified subsequently to profit or loss, before taxes | | | | | | | (1,059,671 | ) | | | (1,886,866 | ) |
Other comprehensive income (loss) items that may be reclassified subsequently to profit or loss, before taxes | | | | | | | | | | | | |
Foreign currency translation losses, net | | | | | | | (20,011,384 | ) | | | (21,255,438 | ) |
Net losses from cash flow hedges | | | | | | | (9,061,264 | ) | | | (12,202,810 | ) |
Share of other comprehensive income (losses) from investments accounted for using the equity method | | | | | | | (1,998,473 | ) | | | 1,597,229 | |
Other net comprehensive loss items that may be reclassified subsequently to profit or loss, before taxes | | | | | | | (31,071,121 | ) | | | (31,861,019 | ) |
Total net other comprehensive loss, before taxes | | | | | | | (32,130,792 | ) | | | (33,747,885 | ) |
Income tax related to other comprehensive income items that will not be reclassified subsequently to profit or loss | | | | | | | | | | | | |
Income tax related to defined benefit plans | | | | | | | (361,308 | ) | | | 644,029 | |
Income tax related to other comprehensive income items that will not be reclassified subsequently to profit or loss | | | | | | | (361,308 | ) | | | 644,029 | |
Income tax related to other comprehensive income items that may be reclassified subsequently to profit or loss | | | | | | | | | | | | |
Income tax related to cash flow hedge | | | | | | | 2,615,522 | | | | 3,622,664 | |
Income tax related to other comprehensive income items that may be reclassified subsequently to profit or loss | | | | | | | 2,615,522 | | | | 3,622,664 | |
| | | | | | | | | | | | |
Total net other comprehensive loss | | | | | | | (29,876,578 | ) | | | (29,481,192 | ) |
| | | | | | | | | | | | |
TOTAL COMPREHENSIVE INCOME | | | | | | | 460,031,357 | | | | 348,858,993 | |
| | | | | | | | | | | | |
Attributable to | | | | | | | | | | | | |
Parent Company | | | | | | | 236,689,787 | | | | 145,057,118 | |
Non-controlling interests | | | | | | | 223,341,570 | | | | 203,801,875 | |
See accompanying notes to the combined financial statements.
F-134
ENDESA AMÉRICAS
Combined Statements of Changes in Equity
For the years ended December 31, 2014 and 2013
(In thousands of Chilean pesos)
| | | | | | | | | | | | | | | | | | | | | | | | | | | | | | | | | | | | |
| | | | | | Change in Reserves | | | | | | | | | | |
| | | Allocated
Capital | | | Reserve for
Exchange
Differences in
Foreign
Currency
Translation | | | Reserve for
Cash Flow
Hedges | | | Other
Miscellaneous
Reserves | | | Total
Reserves
Other than
Retained
Earnings | | | Retained
Earnings | | | Equity
Attributable to
the Parent
Company | | | Non-
controlling
Interests | | | Total Equity | |
Balance as of 1-1-2014 | | | 899,433,829 | | | | (50,898,021 | ) | | | 2,118,519 | | | | (760,605,537 | ) | | | (809,385,039 | ) | | | 1,116,137,754 | | | | 1,206,186,544 | | | | 908,398,637 | | | | 2,114,585,181 | |
Comprehensive income: | | | | | | | | | | | | | | | | | | | | | | | | | | | | | | | | | | | | |
Net profit for the year | | | | | | | | | | | | | | | | | | | | | | | 220,154,609 | | | | 220,154,609 | | | | 269,753,326 | | | | 489,907,935 | |
Other comprehensive income (loss) | | | | | | | 22,566,378 | | | | (4,110,207 | ) | | | (1,920,993 | ) | | | 16,535,178 | | | | | | | | 16,535,178 | | | | (46,411,756 | ) | | | (29,876,578 | ) |
Total comprehensive income | | | | | | | | | | | | | | | | | | | | | | | | | | | 236,689,787 | | | | 223,341,570 | | | | 460,031,357 | |
Distributions to the Parent Company | | | | | | | | | | | | | | | | | | | | | | | (87,423,513 | ) | | | (87,423,513 | ) | | | (339,248,687 | ) | | | (426,672,200 | ) |
Other | | | — | | | | — | | | | — | | | | (57,984,662 | ) | | | (57,984,662 | ) | | | (72,758,561 | ) | | | (130,743,223 | ) | | | (145,058 | ) | | | (130,888,281 | ) |
| | | | | | | | | | | | | | | | | | | | | | | | | | | | | | | | | | | | |
Balance as of 12-31-2014 | | | 899,433,829 | | | | (28,331,643 | ) | | | (1,991,688 | ) | | | (820,511,192 | ) | | | (850,834,523 | ) | | | 1,176,110,289 | | | | 1,224,709,595 | | | | 792,346,462 | | | | 2,017,056,057 | |
| | | | | | | | | | | | | | | | | | | | | | | | | | | | | | | | | | | | |
| | | | | | | | | | | | | | | | | | | | | | | | | | | | | | | | | | | | |
| | | | | | Change in Reserves | | | | | | | | | | |
| | | Allocated
Capital | | | Reserve for
Exchange
Differences in
Foreign
Currency
Translation | | | Reserve for
Cash Flow
Hedges | | | Other
Miscellaneous
Reserves | | | Total
Reserves
Other than
Retained
Earnings | | | Retained
Earnings | | | Equity
Attributable to
the Parent
Company | | | Non-
controlling
Interests | | | Total Equity | |
Balance as of 1-1-2013 | | | 899,433,829 | | | | (18,394,521 | ) | | | 7,565,902 | | | | (724,055,318 | ) | | | (734,883,937 | ) | | | 999,835,880 | | | | 1,164,385,772 | | | | 875,267,825 | | | | 2,039,653,597 | |
Comprehensive income: | | | | | | | | | | | | | | | | | | | | | | | | | | | | | | | | | | | | |
Net profit for the year | | | | | | | | | | | | | | | | | | | | | | | 180,783,612 | | | | 180,783,612 | | | | 197,556,573 | | | | 378,340,185 | |
Other comprehensive income (loss) | | | | | | | (32,503,500 | ) | | | (5,447,383 | ) | | | 2,224,389 | | | | (35,726,494 | ) | | | | | | | (35,726,494 | ) | | | 6,245,302 | | | | (29,481,192 | ) |
| | | | | | | | | | | | | | | | | | | | | | | | | | | 145,057,118 | | | | 203,801,875 | | | | 348,858,993 | |
Distributions to the Parent Company | | | | | | | | | | | | | | | | | | | | | | | (110,447,460 | ) | | | (110,447,460 | ) | | | (180,094,469 | ) | | | (290,541,929 | ) |
Other | | | — | | | | — | | | | — | | | | (38,774,608 | ) | | | (38,774,608 | ) | | | 45,965,722 | | | | 7,191,114 | | | | 9,423,406 | | | | 16,614,520 | |
| | | | | | | | | | | | | | | | | | | | | | | | | | | | | | | | | | | | |
Balance as of 12-31-2013 | | | 899,433,829 | | | | (50,898,021 | ) | | | 2,118,519 | | | | (760,605,537 | ) | | | (809,385,039 | ) | | | 1,116,137,754 | | | | 1,206,186,544 | | | | 908,398,637 | | | | 2,114,585,181 | |
| | | | | | | | | | | | | | | | | | | | | | | | | | | | | | | | | | | | |
See accompanying notes to the combined financial statements.
F-135
ENDESA AMÉRICAS
Combined Statements of Cash Flows
For the years ended December 31, 2014 and 2013
(In thousands of Chilean pesos)
| | | | | | | | | | | | |
| | | Note | | | 2014 | | | 2013 | |
Cash flows from operating activities | | | | | | | | | | | | |
Types of collection from operating activities | | | | | | | | | | | | |
Collections from the sale of goods and services | | | | | | | 1,270,600,531 | | | | 1,087,393,208 | |
Collections from royalties, payments, commissions, and other income from ordinary activities | | | | | | | 3,680,012 | | | | 6,152,266 | |
Collections from premiums and services, annual payments, and other benefits from policies held | | | | | | | 20,348,278 | | | | 565,098 | |
Types of payment in cash from operating activities | | | | | | | | | | | | |
Payments to suppliers for goods and services | | | | | | | (439,067,397 | ) | | | (437,043,462 | ) |
Payments to and on behalf of employees | | | | | | | (55,252,086 | ) | | | (63,832,629 | ) |
Payments on premiums and services, annual payments, and other obligations from policies held | | | | | | | (4,483,416 | ) | | | (105,916 | ) |
Other payments for operating activities | | | | | | | (41,309,466 | ) | | | (33,439,518 | ) |
Cash flows from operating activities | | | | | | | | | | | | |
Income taxes paid | | | | | | | (144,763,880 | ) | | | (126,909,606 | ) |
Other outflows of cash, net | | | | | | | (41,856,525 | ) | | | (37,392,670 | ) |
| | | | | | | | | | | | |
Net cash provided by operating activities | | | | | | | 567,896,051 | | | | 395,386,771 | |
| | | | | | | | | | | | |
Cash flow from investment activities | | | | | | | | | | | | |
Other collections from the sale of equity or debt instruments belonging to other entities | | | | | | | 90,115,470 | | | | 24,340,564 | |
Other payments to acquire equity or debt instruments belonging to other entities | | | | | | | (110,243,608 | ) | | | — | |
Purchases of property, plant and equipment | | | | | | | (266,280,552 | ) | | | (206,847,802 | ) |
Payments from future, forward, option and swap contracts | | | | | | | (1,873,006 | ) | | | (618,468 | ) |
Collections from future, forward, option and swap contracts | | | | | | | 7,735,582 | | | | 13,093,303 | |
Dividends received | | | | | | | 126,202,089 | | | | 44,033,477 | |
Interest received | | | | | | | 9,790,130 | | | | 7,647,857 | |
Other inflows (outflows) of cash, net | | | | | | | 7,906,450 | | | | (394,428 | ) |
| | | | | | | | | | | | |
Net cash used in investing activities | | | | | | | (136,647,445 | ) | | | (118,745,497 | ) |
| | | | | | | | | | | | |
Cash flows from financing activities | | | | | | | | | | | | |
Proceeds from issuance of shares of Central Costanera S.A. to non-controlling interests | | | | | | | — | | | | 11,465,088 | |
Net proceeds from the Parent | | | | | | | (141,744,973 | ) | | | (31,649,544 | ) |
| | | | | | | | | | | | |
Total proceeds from loans | | | | | | | 199,479,100 | | | | 172,786,521 | |
| | | | | | | | | | | | |
Proceeds from long-term loans | | | | | | | 191,794,104 | | | | 164,871,359 | |
Proceeds from short-term loans | | | | | | | 7,684,996 | | | | 7,915,162 | |
Payments on borrowings | | | | | | | (86,161,052 | ) | | | (40,693,405 | ) |
Payments on financial lease liabilities | | | | | | | (5,730,333 | ) | | | (5,071,087 | ) |
Distributions paid to the Parent Company | | | | | | | (273,589,151 | ) | | | (254,701,256 | ) |
Interest paid | | | | | | | (82,627,111 | ) | | | (66,489,311 | ) |
Other outflows of cash, net | | | | | | | (3,211,245 | ) | | | (3,198,921 | ) |
| | | | | | | | | | | | |
Net cash used in finance activities | | | | | | | (393,584,765 | ) | | | (217,551,915 | ) |
| | | | | | | | | | | | |
Net increase in cash and cash equivalents before the effect of exchange rate changes | | | | | | | 37,663,841 | | | | 59,089,359 | |
Effect of exchange rate changes on cash and cash equivalents | | | | | | | (25,440,304 | ) | | | (4,195,956 | ) |
| | | | | | | | | | | | |
Net increase in cash and cash equivalents | | | | | | | 12,223,537 | | | | 54,893,403 | |
| | | | | | | | | | | | |
Cash and cash equivalents at beginning of the year | | | 5 | | | | 286,218,693 | | | | 231,325,290 | |
| | | | | | | | | | | | |
Cash and cash equivalents at end of the year | | | 5 | | | | 298,442,230 | | | | 286,218,693 | |
| | | | | | | | | | | | |
See accompanying notes to the combined financial statements.
F-136
ENDESA AMÉRICAS
NOTES TO THE COMBINED FINANCIAL STATEMENTS
Table of Contents
F-137
F-138
ENDESA AMÉRICAS
NOTES TO COMBINED FINANCIAL STATEMENTS
(In thousands of Chilean pesos)
On April 28, 2015, Empresa Nacional de Electricidad S.A. (“Endesa”) informed the Superintendence of Securities and Insurance (the “SVS”) through a significant event, that the Board of Directors of its direct parent, Enersis S.A., communicated that it had decided to initiate an analysis of a corporate reorganization aimed at the separation of the activities of power generation and distribution in Chile from other activities conducted outside of Chile by Enersis S.A. and its subsidiaries Endesa and Chilectra S.A., maintaining its inclusion in the Enel S.p.A. group.
In the same significant event, the Board of Directors of Endesa reported that it had agreed to initiate studies to analyze a possible corporate reorganization consisting of the spin-off of Endesa’s businesses in Chile from those outside of Chile, and eventually merge the latter into a single company. Furthermore, it indicated that the objective of this reorganization is to create value for all of its shareholders, as none of these operations require the contribution of additional resources from shareholders. The possible corporate reorganization would take into account the best interests as well as all shareholder’s interests, with special attention paid to minority interests, and if it were approved, be subject to approval at an Extraordinary Shareholders’ Meeting.
On July 27, 2015, pursuant to the provisions of Articles 9 and 10 of the Securities Market Law No. 18,045 and the provisions of General Norm No. 30 of the SVS, Endesa informed the SVS by means of a significant event, that the Board of Directors of Endesa had decided unanimously, that if the separation of power generation and distribution activities in Chile from the rest of the activities of Enersis group outside of Chile were approved, the reorganization would be carried out through the following corporate transactions:
Steps to carry out the corporate reorganization:
| a) | Related to the preparation of the Combined Financial Statements |
| | • | | Each of the direct and indirect subsidiaries of Enersis S.A., Endesa and Chilectra S.A., would effect a spin-off, resulting in the formation of a new company from the spin-off by Endesa (“Endesa Américas”) and a new company from the spin-off by Chilectra S.A. (“Chilectra Américas”), to which would be allocated the equity interests and other assets that both Endesa and Chilectra S.A. have outside of Chile, as well as certain other assets and liabilities related to them. |
The continuing companies of Endesa and Chilectra S.A. are to be called Empresa Nacional de Electricidad S.A. (“Endesa Chile”) and Chilectra S.A. (“Chilectra Chile”) after the spin-offs.
| | • | | At the same time, Enersis S.A. will effect a spin-off and, resulting from this spin-off, will form a new company (“Enersis Chile”), which will hold the equity interests and assets of Enersis in Chile allocated to it, including the equity interests in Endesa Chile and Chilectra Chile (after the spin-offs by these companies described above), and certain other assets and liabilities related to them. Remaining in continuing Enersis (to be called “Enersis Américas” after the spin-off) are the equity interests and corresponding liabilities of Enersis outside of Chile, as well as those held by each of the new companies “Endesa Américas”, and “Chilectra Américas” created as a result of the spin-offs of Endesa Américas and Chilectra Américas mentioned above, and the liabilities related to them. |
| b) | Related to the subsequent processes of the division phase. |
| | • | | Once the previously mentioned spin-off are completed, “Enersis Américas” would absorb by merger Chilectra Américas and Endesa Américas, and would dissolve them without liquidation, thus grouping all international shares of the Enersis group outside of Chile in Enersis Américas. The merger involving Enersis Américas, Endesa Américas and Chilectra Américas would take place as soon as legally possible and in accordance with the applicable regulations. |
F-139
The preparation of these combined financial statements of “Endesa Américas”, do not include effects that could potentially arise as a result of the previously mentioned merger.
The resulting companies would be based in Chile and their shares would be listed in the same markets that Endesa is currently listed. As stated earlier, none of the transactions described above require the contribution of additional financial resources.
On November 10, 2015, in the Endesa’s Extraordinary Board of Directors’ Meeting, the Board of Directors of Endesa agreed to summon an Extraordinary Shareholders’ Meeting (“ESM”), on December 18, 2015. The purpose of this meeting is for the shareholders to acknowledge and rule on, among others, the proposed corporate reorganization and all supporting information related to it.
| 1.1 | The Combined Group’s activities |
Endesa Américas comprises of its combined entities and investments in associates and joint ventures (the “Combined Group”).
Endesa Américas will be a publicly traded corporation with registered address and head office located at Avenida Santa Rosa, No. 76, in Santiago, Chile. Endesa Américas will be registered in the securities register of the SVS. In addition, Endesa Américas will be registered with the Securities and Exchange Commission of the United States of America (the “SEC”).
Endesa Américas’ corporate purpose consists of generating, transporting, producing, and distributing electrical energy. The Combined Group’s corporate purpose also includes investing in financial assets, developing projects, carrying out activities in the energy industry and in other fields in which electrical energy is essential, and participating in public civil or hydroelectric infrastructure concessions in which it may participate directly or through combined entities or associate companies outside of Chile.
| 2. | BASIS OF PREPARATION OF THE COMBINED FINANCIAL STATEMENTS |
The combined financial statements as of December 31, 2014 of Endesa Américas have been prepared in accordance with the International Financial Reporting Standards (IFRS) as issued by the International Accounting Standards Board (IASB). They were approved by the Endesa Board of Directors at its meeting held on December 17, 2015.
As of December 31, 2014, the Combined Group does not represent a group for consolidated financial statement reporting purposes in accordance with IFRS 10 Consolidated Financial Statements.
The Combined Group is considered a first time adopter of since no financial statements were prepared for the Combined Group prior to this registration statement. Combined Group prepared the combined financial statements using IFRS 1.D16(a) (“predecessor accounting method”). The combined financial statements reflect the combined operations of the Combined Group as it will be constituted following the spin-off. The combined financial statements may not be indicative of the Combined Group’s future performance and do not necessarily reflect what the results of operations, financial position and cash flows would have been had it operated as an independent company during the periods presented.
Appendix 1 of these combined financial statements includes the list of combined entities.
The Combined Group used the same accounting policies and valuation methods for the preparation of these combined financial statements, as those used by the foreign consolidated subsidiaries of Endesa and non-consolidated investee entities for the preparation of Endesa’s Consolidated Financial Statements. Consequently,
F-140
the reconciliation requirements of IFRS 1 for first time adopters is not applicable because there are no reconciling differences. These accounting policies have been disclosed under this note and Note 3 Accounting policies. The entities and associates are included these combined financial statements using their respective historical carrying values and amounts as included in Endesa’s Consolidated Financial Statements.
Since IFRS does not provide any guidance for the preparation of combined financial statements, paragraph 12 of IAS 8 Accounting Policies, Changes in Accounting Estimates and Errors has been used for the preparation of the combined financial statements. This paragraph requires that the latest pronouncements of other standard setters, other accounting literature and accepted industry practice should be considered. The combined financial statements of Endesa Américas have been derived from the aggregation of the net assets of the foreign business of Endesa. All intra-group balances, revenues, expenses and unrealized gains and losses arising from transactions between companies belonging to Combined Group were eliminated when preparing the combined financial statements. In addition, the investments of the holding companies in the Combined Group were eliminated against the equity of the respective subsidiaries. Transactions with Endesa group companies, which do not belong to the Combined Group, have been disclosed as transactions with related parties.
The combined financial statements have been prepared and published in thousands of Chilean peso (ThCh$). Foreign operations are reported in accordance with the accounting policies stated in Note 3.k. Rounding differences may occur in respect of individual amounts or percentages.
Principles applied in preparing the Combined Financial Statements
The following summarizes the accounting and other principles applied in preparing the combined financial statements. Management considers that the allocations described below have been made on a reasonable basis, but are not necessarily indicative of the costs that would have been incurred if the Combined Group had been a stand-alone entity.
Net assets of the Parent (equity)
The Combined Group has not previously formed a separate legal group nor presented any stand-alone financial statements, and accordingly it is not conceivable to present share capital or an analysis of equity reserves. The net assets of the Combined Group are represented by capital invested in the Combined Group and are shown as “Equity” using the same captions as those used by Endesa. Paid-in capital, share premium and retained earnings of Endesa have been allocated to Endesa Américas based on net assets book value ratio assigned to it. Other reserves (which are primarily composed of the equity effects of past reorganizations, business combinations under common control, residual effects of first-time adoption of IFRS and the equity effects of the current spin-off process) have been allocated considering the transaction and circumstances that led to creation of these reserves.
Earnings per share information is not presented because Endesa Américas currently does not have any authorized, issued and outstanding shares.
Cash and cash equivalents
Cash and cash equivalents of the foreign subsidiaries of Endesa are included in these combined financial statements. In addition, based on the exercise carried out by Endesa’s Management, the ratios obtained for the division of the cash and cash equivalents Endesa on a stand-alone basis, are as follows:
| | | | | | | | |
| | | Proportion of Economic Assets | |
| | | Endesa Chile | | | Endesa Américas | |
Entity | | | | | | | | |
Endesa | | | 66 | % | | | 34 | % |
F-141
Intercompany balances and transactions with related parties
Intercompany balances with successors of Endesa were allocated by identifying the entity that provided/received the service as well as the nature of it. Intercompany balances with Endesa Américas were eliminated in full for the purpose of these combined financial statements. Intercompany balances with Endesa Chile were included in these combined financial statements and disclosed as accounts with related parties.
Debt instruments and related interest expenses, exchange differences and effects of hedge accounting strategies
Financial debt and related interest expenses and exchange rate differences of the foreign subsidiaries of Endesa are included in these combined financial statements . Financial debt and related interest expenses and exchange rate differences of Endesa on a stand-alone basis have been 100% allocated to Endesa Chile and not included in these combined financial statements.
In relation to derivative instruments designated as hedging instruments the foreign subsidiaries of Endesa are included in these combined financial statements. Endesa’s Management has adopted as a criterion to keep the strategies of hedge accounting. Therefore, all effects on the statement of financial position, income and other comprehensive income are assigned to the different companies to which the hedged items were assigned. In the case of Endesa on a stand-alone basis, the main items covered by the hedging strategies are related to debt (hedging exposure to foreign currency debt and variability of the interest rate). Therefore, the main derivative instruments associated with such hedging strategies have been assigned according to debt criteria mentioned in the previous paragraph.
Personnel, salary expenses other employee benefits
For purposes of properly allocating the accounting effect of personnel from Endesa on a stand-alone basis between Endesa Chile and Endesa Américas, the Endesa’s Management defined as a criterion to identify those employees whose main activities are related 100% with the operations based in Chile, which resulted in virtually all employees from Endesa assigned to Endesa Chile. On the other hand, Management also identified those employees whose main activities relate 100% to foreign operations. This group of employees was assigned to Endesa Américas.
Below is a summary table presenting the breakdown of the employees to be allocated to Endesa Chile and Endesa Américas:
| | | | | | | | |
| | | Employees Allocation | |
Entity | | Endesa Chile | | | Endesa Américas | |
Endesa | | | 925 | | | | 7 | |
Once the allocation of personnel was determined Endesa management applied the following criteria to the division of all personnel related accounts of the statements of financial position and comprehensive income:
| | • | | In relation with the costs directly related to the personnel, such as wages and salaries, post-employment benefit obligations expense and social security and other benefits, travel expenses, etc. allocation was performed based on the assignment of the related personnel to the Combined Group, described above. |
Other shared costs
The combined statements of income include expense allocations for certain corporate functions provided by Endesa, including but not limited to, human resources administration, treasury, risk management, internal audit, accounting, tax, legal, insurance, medical services, information technology support, communication management, and other shared services. These expenses were allocated to Endesa Chile and Endesa Américas
F-142
based on a specific identification basis, or in certain cases based on a pro-rata basis of headcount or some other basis depending on the nature of the allocated cost. Management considers the basis on which the expenses have been allocated to reasonably reflect the utilization of services provided to or the benefit received by Endesa Américas during the periods presented.
Dividends receivable and payable
The criterion defined by Endesa’s Management to allocate to both Endesa Chile as well as to Endesa Américas a portion of dividends receivable accounts as of the date of the corporate spin-off, has been based mainly on identifying the origin of each one of those dividends receivable.
Income tax
The tax effect (income statement and income tax provision) related to the foreign subsidiaries of Endesa are included in these combined financial statements and was calculated using the statutory corporate tax rates according to the country where the adjustment was originated.
In addition, the tax effect in the income statement of Endesa on a stand-alone basis has been allocated to these combined financial statements by determining a hypothetical taxable income as if Endesa Chile and Endesa Americas’ had operated as separate tax payers. However, from a tax point of view, there is currently only one taxpaying company, which is Endesa, and whose successor entity would be Endesa Chile, if the corporate reorganization is finally approved. Accordingly, the income tax provision of Endesa has not been allocated to the combined financial statements.
Deferred income tax assets and liabilities have been allocated to Endesa Américas, taking into account the underlying assets and liabilities, whose respective temporary differences have generated such deferred taxes.
Other working capital accounts
Working capital items such as accounts receivable, accounts payable and inventories that are directly attributable to the operations of the Combined Group are included in the combined financial statements.
F-143
| 2.2 | New accounting pronouncements |
| a) | Accounting pronouncements effective from January 1, 2014: |
| | |
Standards, Interpretations and Amendments | | Mandatory Application for: |
Amendment to IAS 32: Financial Instruments: Presentation Clarifies the requirements for offsetting financial assets and financial liabilities in order to eliminate inconsistencies from the application of the current IAS 32 offsetting criteria. | | Annual periods beginning on or after January 1, 2014. |
| |
Amendments to IFRS 10 and 12, and IAS 27: Investment Entities Under IFRS 10 requirements, the reporting entities must consolidate all of the companies over which they have control. The amendment establishes an exception to these requirements, allowing the Investment Entities to measure their investments at fair value with changes in income as per IFRS 9 instead of consolidating them. | | Annual periods beginning on or after January 1, 2014. |
| |
IFRIC 21: Levies This interpretation of IAS 37, “Provisions, Contingent Liabilities and Contingent Assets” outlines when an entity must recognize a government-imposed levy other than income tax as a liability in its financial statements. | | Annual periods beginning on or after January 1, 2014. |
| |
Amendment to IAS 36: Impairment of Assets This amendment removes the unintended consequences of IFRS 13 on the disclosures required under IAS 36. In addition, the amendment requires disclosure of the recoverable amounts for the assets or CGUs for which impairment loss has been recognized or reversed during the period. | | Annual periods beginning on or after January 1, 2014. |
| |
Amendment to IAS 39: Financial Instruments: Recognition and Measurement (Novation of derivatives) This amendment incorporates into the Standard the criteria that must be met in order not to discontinue hedge accounting in circumstances when a hedging instrument is novated. | | Annual periods beginning on or after January 1, 2014. |
The new interpretation and amendments adopted, which went into effect on January 1, 2014, had no effect on the combined financial statements of Endesa Américas.
F-144
| b) | Accounting pronouncements effective from January 1, 2015 and subsequent periods: |
As of the date of issue of these combined financial statements, the following accounting pronouncements had been issued by the IASB, but their application was not yet mandatory:
| | |
Standards, Interpretations and Amendments | | Mandatory Application for: |
IFRS 9: Financial Instruments This is the final version of the standard issued in July 2014 and which completes the IASB project to replace IAS 39 “Financial Instruments: Recognition and Measurement”. This project was divided into 3 phases: Phase 1 — Classification and measurement of financial assets and financial liabilities. This introduces a logical focus for the classification of financial assets driven by cash flow characteristics and the business model. This new model also results in a single impairment model being applied to all financial instruments. Phase 2 — Impairment methodology. The objective is a more timely recognition of expected credit losses. The standard requires entities to account for expected credit losses from the time when financial instruments are first recognized in the financial statements. Phase 3 — Hedge accounting. This establishes a new model aimed at reflecting better alignment between hedge accounting and risk management activity. Also included are enhancements to required disclosures. This final version of IFRS 9 replaces the previous versions of the Standard. | | Annual periods beginning on or after January 1, 2018. |
| |
IFRS 14: Regulatory Deferral Accounts The purpose of this interim standard is to reduce the barriers to adoption of the IFRS by entities that carry out business activities that are subject to price or rate regulation. This standard allows those who are first-time adopters of IFRS, and who meet the requirements, to continue to account for regulatory deferral balances in their first IFRS financial statements using their previous GAAP accounting practices regarding regulated rates. It also establishes specific requirements for presenting balances and disclosing information. | | Annual periods beginning on or after January 1, 2016. |
| |
IFRS 15: Revenue from Contracts with Customers This new standard applies to all contracts with customers except leases, financial instruments and insurance contracts. Its purpose is to make financial information more comparable, and it provides a new model for revenue recognition and more detailed requirements for contracts with multiple obligations. It also requires more itemized information. This standard will replace IAS 11 and IAS 18 as well as their interpretations (IFRIC 13, IFRIC 15, IFRIC 18 and SIC 31). | | Annual periods beginning on or after January 1, 2018. |
| |
Amendment to IAS 19: Employee Benefits The purpose of this amendment is to simplify the accounting for contributions from employees or third parties that are not determined on the basis of an employee’s years of service, such as employee contributions calculated according to a fixed percentage of salary. | | Annual periods beginning on or after July 1, 2014. |
| |
Improvements to IFRS (2010-2012 and 2011-2013 Cycles) These are a set of improvements that were necessary, but not urgent, and that amend the following standards: IFRS 2, IFRS 3, IFRS 8, IFRS 13, IAS 16, IAS 24, IAS 38 and IAS 40. | | Annual periods beginning on or after July 1, 2014. |
F-145
| | |
Standards, Interpretations and Amendments | | Mandatory Application for: |
| |
Amendment to IFRS 11: Joint Arrangements This amendment states that the accounting standards contained in IFRS 3 and other standards that are applicable to business combinations accounting must be applied to the accounting for acquiring an interest in a joint operation in which the activities constitutes a business. | | Annual periods beginning on or after January 1, 2016. |
| |
Amendment to IAS 16 and IAS 38: Clarification of Acceptable Methods of Depreciation and Amortization The amendment to IAS 16 explicitly forbids the use of revenue-based depreciation for property, plant and equipment. The amendment to IAS 38 introduces the rebuttable presumption that, for intangible assets, the revenue-based amortization method is inappropriate and establishes two limited exceptions. | | Annual periods beginning on or after January 1, 2016. |
| |
Improvements to IFRS (2012-2014 Cycles) These are a set of improvements that were necessary, but not urgent, and that amend the following standards IFRS 5, IFRS7, IAS19 and IAS 34. | | Annual periods beginning on or after January 1, 2016. |
| |
Amendment to IFRS 10 and IAS 28: Sale or Contribution of Assets The amendment corrects an inconsistency between IFRS 10 and IAS 28 relating to the accounting treatment of the sale or contributions of assets between an Investor and its Associate or Joint Venture. | | Annual periods beginning on or after January 1, 2016. |
| |
Amendment to IAS 27: Equity Method in Separate Financial Statements This improvement allows entities to use the equity method to account for investments in subsidiaries, joint ventures and associates in their separate financial statements. The objective of the improvement is to minimize the costs associated with complying with the IFRS, particularly for those entities applying IFRS for the first time, without reducing the information available to investors. | | Annual periods beginning on or after January 1, 2016. |
| |
Amendment to IAS 1: Disclosure Initiative The IASB has issued amendments to IAS 1 as part of its principal initiative to improve the presentation and disclosure of information in financial statements. These amendments are designed to assist companies in applying professional judgment to determine the disclosures that should be included in their financial statements. | | Annual periods beginning on or after January 1, 2016. |
| |
Amendment to IFRS 10, IFRS 12 and IAS 28: Investment Entities, Application of the Consolidation Exception The amendments, which have a restricted scope, introduce clarifications to the requirements for the accounting of investment entities. The modifications also provide relief in some circumstances, which will reduce the costs of applying the Standards. | | Annual periods beginning on or after January 1, 2016. |
The Combined Group is assessing the impact of applying IFRS 9 and IFRS 15 as of their effective date. In Management’s opinion, the application of the other standards and amendments pending application is not expected to have a significant effect on the combined financial statements of Endesa Américas.
| 2.3 | Responsibility for the information, judgments and estimates provided |
Management is responsible for the information contained in these combined financial statements and expressly states that all IFRS principles and standards, as issued by the IASB, have been fully implemented.
F-146
In preparing the combined financial statements, certain judgments and estimates made by the Combined Group’s management have been used to quantify some of the assets, liabilities, revenues, expenses and commitments recognized in the statements.
The most important areas that have required professional judgment are:
| • | | In a service concession agreement, the decision as to whether a principal controls or regulates which services the operator should provide, to whom and at what price. These are essential details when applying IFRIC 12 Service Concession Arrangements (see Note 3.c.1). |
| • | | The identification of Cash Generating Units (CGU) for impairment testing (see Note 3.d). |
| • | | The hierarchy of information used to value assets and liabilities measured at fair value (see Note 3.g). |
These estimates refer basically to:
| • | | The valuations performed to determine the existence of impairment losses in assets and goodwill (see Note 3.d). |
| • | | The assumptions used to calculate the actuarial liabilities and obligations with employees, such as discount rates, mortality tables, salary increases, etc. (see Notes 3.i.1 and 21). |
| • | | The useful lives of property, plant and equipment, and intangible assets (see Notes 3.a and 3.c). |
| • | | The assumptions used to calculate the fair value of financial instruments (see Notes 3.f.5 and 18). |
| • | | Energy supplied to customers whose meter readings are pending. |
| • | | Certain assumptions inherent in the electricity system affecting transactions with other companies, such as production, customer billings, energy consumption, etc. that allow for estimating electricity system settlements that must occur on the corresponding final settlement dates, but that are pending as of the date of issuance of the combined financial statements and could affect the balances of assets, liabilities, revenues and expenses recognized in the statements (see Appendix 5.2). |
| • | | The probability that uncertain or contingent liabilities will be incurred and their related amounts (see Note 3.i). |
| • | | Future disbursements for the closure of facilities and restoration of land, as well as the discount rates to be used (see Note 3.a). |
| • | | The tax results of the various combined entities of the Combined Group that will be reported to the respective tax authorities in the future, and that have been used as the basis for recording different balances related to income taxes in these combined financial statements (see Note 3.l). |
| • | | The fair values of assets acquired and liabilities assumed, and any pre-existing interest in the Combined Group acquired in a business combination. |
Although these judgments and estimates have been based on the best information available on the issuance date of these combined financial statements, future events may occur that would require a change (increase or decrease) to these judgments and estimates in subsequent periods. This change would be made prospectively, recognizing the effects this change of judgments and estimates in the corresponding future combined financial statements.
| 2.4.1 | Combined companies with an ownership interest of less than 50% |
Although the Combined Group, directly and indirectly, holds a 26.87% ownership in the company Empresa Generadora de Energía Eléctrica S.A. (also hereafter “Emgesa” or “Emgesa S.A.E.S.P.”), it is considered a combined entity since the Combined Group exercises control over the entity through contracts or agreements
F-147
with shareholders, or as a consequence of its structure, composition and shareholder classes. As a result of these facts, while having less than 50% ownership, the Combined Group holds 56.43% of the voting shares of Emgesa and its subsidiary Emgesa Panama S.A.
| 2.5 | Investments in combined associated companies and joint arrangements |
Combined associated are those entities in which the Combined Group, either directly or indirectly, exercises significant influence.
Significant influence is the power to participate in the financial and operational policy decisions of the investee but does not control or does not have joint control over these policies. In general, if the Combined Group holds 20% or more of the voting power of an investee, it is presumed that the Combined Group has significant influence over an investee.
Joint arrangements are those agreements in which the Combined Group exercises joint control. Joint control is the contractually agreed sharing of control of an arrangement, which exists only when decisions about the entities’ relevant activities require the unanimous consent of the parties sharing control. Joint arrangements are classified as:
| • | | Joint venture: an agreement whereby the parties exercising joint control have rights to the net assets of the arrangement. |
| • | | Joint operation: an agreement whereby the parties exercising joint control have rights to the assets and obligations for the liabilities relating to the arrangement. At the end of the reporting period, the Combined Group does not have any joint arrangements that qualify as joint operations. |
The Combined Group’s interests in joint ventures and associates are recognized using the equity method.
Under the equity method, an investment in an associate or joint venture is initially recognized at cost. As of the acquisition date, the investment is recognized in the statement of financial position based on the share of its equity that the Combined Group’s interest represents in its capital, adjusted for, if appropriate, the effect of transactions with subsidiaries plus any goodwill generated in acquiring the company. If the resulting amount is negative, zero is recognized for that investment in the statement of financial position, unless the Combined Group has a present obligation (either legal or implicit) to support the company’s negative equity position, in which case a provision is recognized.
Goodwill from the associate or joint venture is included in the carrying amount of the investment. It is not amortized but is subject to impairment testing as part of the overall investment carrying amount when there are indicators of impairment.
Dividends received from these companies are deducted from the value of the investment, and any profit or loss obtained from them to which the Combined Group is entitled based on its interest is recognized under “Share of profit (loss) of associates accounted for using equity method”.
Appendix 2 to these combined financial statements, entitled “Associated Companies and Joint Ventures”, describes the relationship of the Combined Group and each of these companies.
Acquisitions of businesses are accounted for using the acquisition method. The consideration transferred in a business combination is measured at fair value, which is calculated as the sum of the acquisition-date fair values of the assets transferred by the Combined Group, liabilities incurred by the Combined Group to the former owners of the acquiree and the equity interests issued by the Combined Group in exchange control of the acquiree. Acquisition-related costs are generally recognized in profit or loss as incurred.
F-148
At the acquisition date, the identifiable assets acquired and liabilities assumed are recognized at their fair value, except for certain assets and liabilities that are recognized using valuation principles established in other IFRS standards.
Goodwill is measured as the excess of the sum of the consideration transferred, the amount of any non-controlling interests in the acquiree, and the fair value of the acquirer’s previously held equity interest in the acquiree (if any) over the net of the acquisition-date amounts of the identifiable assets acquired and liabilities assumed. If, after reassessment, the net of the acquisition-date amounts of the identifiable assets acquired and liabilities assumed exceeds the sum of the consideration transferred, the amount of any non-controlling interests in the acquiree and the fair value of the acquirer’s previously held interest in the acquiree (if any), the excess is recognized immediately in profit or loss as a bargain purchase gain.
Non-controlling interests that are present ownership interests and entitle their holders to a proportionate share of the entity’s net assets in the event of liquidation may be initially measured either at fair value or at the non-controlling interests’ proportionate share of the recognized amounts of the acquiree’s identifiable net assets. The choice of measurement basis is made on a transaction-by-transaction basis.
When a business combination is achieved in stages, the Combined Group’s previously held equity interest in the acquiree is remeasured to its acquisition-date fair value and the resulting gain or loss, if any, is recognized in profit or loss. Amounts arising from interests in the acquiree prior to the acquisition date that have previously been recognized in other comprehensive income are reclassified to profit or loss where such treatment would be appropriate if that interest were disposed of.
If the initial accounting for a business combination is incomplete by the end of the reporting period in which the combination occurs, the Combined Group reports provisional amounts for the items for which the accounting is incomplete. Those provisional amounts are adjusted during the measurement period (which cannot exceed one year from the acquisition date), or additional assets or liabilities are recognized, to reflect new information obtained about facts and circumstances that existed at the acquisition date that, if known, would have affected the amounts recognized at that date.
Business combinations between entities under common control are accounted for using, as a reference, the ‘pooling of interest’ method. Under this method, the assets and liabilities involved in the transaction remain reflected at the same carrying amounts at which they were recognized in the ultimate controlling company, although subsequent accounting adjustments may need to be made to align the accounting policies of the companies involved. Any difference between the assets and liabilities contributed to the consolidation and the consideration given is recognized directly in equity as a debit or credit to other reserves. The Combined Group does not restate comparative periods in its combined financial statements for business combinations under common control.
The principal accounting policies used in preparing the accompanying combined financial statements are the following:
| a) | Property, plant and equipment |
Property, plant and equipment are measured at acquisition cost, net of accumulated depreciation and any impairment losses they may have experienced. In addition to the price paid to acquire each item, the cost also includes, where applicable, the following concepts:
| • | | Financing expenses accrued during the construction period that are directly attributable to the acquisition, construction, or production of qualified assets, which require a substantial period of time before being ready for use such as, for example, electricity generation or distribution facilities. The Combined Group defines |
F-149
| | “substantial period” as one that exceeds 12 months. The interest rate used is that of the specific financing or, if none exists, the weighted average financing rate of the company carrying out the investment. The weighted average financing rate is 8.56% as of December 31, 2014 (9.31% and 8.83% as of December 31, 2013 and January 1, 2013, respectively). The amount capitalized for this concept amounted to ThCh$40,012,531 and ThCh$23,519,951 during the years ended December 31, 2014 and 2013, respectively (see Note 28). |
| • | | Employee expenses directly related to construction in progress. The amounts capitalized under this concept during the years ended December 31, 2014 and 2013 were ThCh$ 12,704,316 and ThCh$ 8,356,167, respectively. |
| • | | Future disbursements that the Combined Group will have to make to close their facilities are incorporated into the value of the asset at fair value, recording in the accounting the corresponding provision for dismantling or restoration. The Combined Group reviews its estimate of these future disbursements on a yearly basis, increasing or decreasing the value of the asset based on the results of this estimate (see Note 20). |
Items for construction work in progress are transferred to operating assets once the testing period has been completed and they are available for use, at which time depreciation begins.
Expansion, modernization or improvement costs that represent an increase in productivity, capacity or efficiency, or a longer useful life are capitalized as increasing the cost of the corresponding assets.
The replacement or overhaul of entire components that increase the asset’s useful life or economic capacity are recognized as an increase in cost for the respective assets, derecognizing the replaced or overhauled components.
Expenditures for periodic maintenance, conservation and repair are recognized directly as an expense for the year in which they are incurred.
The Combined Group’s management, based on the outcome of impairment testing performed explained in Note 3.d, considers that the carrying amount of assets does not exceed their recoverable amount.
Property, plant and equipment, net of its residual value, is depreciated by distributing the cost of the different items that comprise it on a straight-line basis over its estimated useful life, which is the period during which the Combined Group expects to use the assets. Useful life estimates and residual values are reviewed on an annual basis and if appropriate adjusted prospectively.
The following are the main categories of property, plant and equipment with their respective estimated useful lives:
| | |
Categories of Property, plant and equipment | | Years of estimated useful lives |
Buildings | | 22 – 100 |
Plant and equipment | | 3 – 85 |
IT equipment | | 3 – 15 |
Fixtures and fittings | | 5 – 21 |
Motor vehicles | | 5 – 10 |
Other | | 2 – 33 |
F-150
Additionally, the following provides greater detail on the useful lives of plant and equipment items:
| | |
Categories of Property, plant and equipment | | Years of estimated useful lives |
Generating facilities: | | |
Hydroelectric plants | | |
Civil engineering works | | 35 – 65 |
Electromechanical equipment | | 10 – 85 |
Fuel oil/coal-fired power plants | | 25 – 40 |
Combined cycle plants | | 10 – 35 |
Renewable energy power plants | | 35 |
Natural gas transport facilities: | | |
Pipelines | | 35 |
Land is not depreciated since it has an indefinite useful life.
Regarding the administrative concessions held by the Combined Group’s electric companies, the following lists the periods remaining until expiration for the concessions that do not have an indefinite term.
| | | | | | | | |
Concession holder and operator | | Country | | Year
concession started | | Concession term | | Period remaining to expiration |
Hidroeléctrica El Chocón S.A. (Generación) | | Argentina | | 1993 | | 30 years | | 9 years |
To the extent that the Combined Group recognizes assets as Property, plant and equipment, they are amortized over their economic life or the concession term, whichever is shorter. Any required investment, improvement or replacement made by the Combined Group is considered in the impairment test to Property, plant, and equipment as a future contractual cash outflow that is necessary to obtain future cash inflow.
Combined Group’s management has evaluated the specific case of the concession described above and has concluded that there are no conclusive factors indicating that the grantor of the concession (a governmental body) has control over the infrastructure and that it can simultaneously determine the service price on a permanent basis. These are essential requirements for applying IFRIC 12 Service Concession Arrangements, an interpretation that establishes how to recognize and value certain types of concessions. (Those that are within the scope of this Standard are presented in Note 3.c.1).
Gains or losses that arise from the sale or disposal of items of Property, plant, and equipment are recognized as “Other gains, net” in the combined comprehensive income statement and are calculated by deducting the carrying amount of the asset and any sales expenses from the amount received in the sale.
Goodwill arising from business combinations represents the excess of the consideration paid plus the amount of any non-controlling interests over the Combined Group’s share of the net value of the assets acquired and liabilities assumed, measured at fair value at the acquisition date. If the accounting for a business combination is completed, as well as the determination of goodwill, after the end of the reporting period in which the combination occurs, the amounts previously reported presented are adjusted, for comparative purposes, to include the value of the assets acquired and liabilities assumed and the value of the final goodwill as of acquisition date.
Goodwill arising from acquisition of entities with functional currencies other than the Chilean peso is measured in the functional currency of the acquired company and translated to Chilean pesos using the closing exchange rate.
F-151
Goodwill is not amortized; instead, at the end of each reporting period or when there are indicators that an impairment might have occurred, the Combined Group’s management estimates whether any impairment loss has reduced its recoverable amount to an amount less than the carrying amount and, if so, it impairment loss is immediately recognized in profit or loss (see Note 3.d).
| c) | Intangible assets other than goodwill |
Intangible assets are initially recognized at their acquisition cost or production cost, and are subsequently measured at their cost, net of their accumulated amortization and impairment losses they may have experienced.
Intangible assets are amortized on a straight line basis during their useful lives, starting from the date when they are ready for use, except for those with an indefinite useful life, which are not amortized. As of December 31, 2014, 2013 and January 1, 2013, there are no significant intangible assets with an indefinite useful life.
The criteria for recognizing these assets impairment losses and, if applicable, recovery of impairment losses recognized in previous years are explained in Note 3.d below.
c.1) Concessions
Public-to-private service concession agreements are recognized in accordance with IFRIC 12, Service Concession Agreements. This accounting interpretation applies if:
| a) | The grantor controls or regulates what services the operator must provide with the infrastructure, to whom it must provide them, and at what price; and |
| b) | The grantor controls — through ownership, beneficial entitlement, or otherwise — any significant residual interest in the infrastructure at the end of the term of the agreement. |
If both of the above conditions are met simultaneously, the operator shall recognize an intangible asset to the extent that it receives a right (a license) to charge users of the public service. A right to charge users of the public service is not an unconditional right to receive cash because the amounts are contingent on the extent that the public uses the service.
If the operator is paid for the construction services partly by a financial asset and partly by an intangible asset it is necessary to account separately for each component of the operator’s consideration. The consideration received or receivable for both components shall be recognized initially at the fair value of the consideration received or receivable.
These intangible assets are initially recognized at cost, i.e. the fair value of consideration transferred to acquire the asset, which is the fair value of the consideration received or receivable for the construction services delivered. They are then amortized over the term of the concession.
| c.2) | Research and development expenses |
The Combined Group recognizes the costs incurred in a project’s development phase as intangible assets in the statement of financial position as long as the project’s technical feasibility and future economic benefits have been demonstrated.
Expenditures on research activities are recognized as an expense in the year in which they are incurred. Research activities expenses amounted to ThCh$ 791,428 and ThCh$ 771,449 for the years ended December 31, 2014 and 2013, respectively.
| c.3) | Other intangible assets |
Other intangible assets correspond to computer software, water rights, and easements. They are initially recognized at acquisition or production cost and are subsequently measured at cost less accumulated amortization and impairment losses, if any.
F-152
Computer software is amortized (on average) over five years. Certain easements and water rights have indefinite useful lives and, therefore, are not amortized, while others have useful lives ranging from 40 to 60 years, depending on their characteristics, and they are amortized over that term.
During the year, and principally at the end of each reporting period, the Combined Group’s management evaluates whether there is any indication that an asset has been impaired. If any such indication exists, the Combined Group’s management estimates the recoverable amount of that asset to determine the amount of the impairment loss. In the case of identifiable assets that do not generate cash flows independently, the Combined Group’s management estimates the recoverable amount of the Cash Generating Unit (CGU) to which the asset belongs, which is understood to be the smallest identifiable group of assets that generates independent cash inflows.
Notwithstanding the preceding paragraph, in the case of CGUs to which goodwill or intangible assets with indefinite useful lives have been allocated, a recoverability analysis is performed routinely at each period end.
Recoverable amount is the higher of fair value less costs of disposal and value in use, which is defined as the present value of the estimated future cash flows. In order to calculate the recoverable amount of Property, plant, and equipment, as well as of goodwill, and intangible assets, the Combined Group uses value-in-use criteria in practically all cases.
To estimate value in use, the Combined Group prepares future pre-tax cash flow projections based on the most recent budgets available. These budgets incorporate management’s best estimates of a CGUs’ revenue and costs using sector projections, past experience and future expectations.
In general, these projections cover the next ten years, estimating cash flows for subsequent years by applying reasonable growth rates which, in no case, are increasing rates nor exceed the average long-term growth rates for the particular sector and country in which the Combined Group operates. As of December 31, 2014, 2013 and January 1, 2013, future cash flows projections were extrapolated from the following rates:
| | | | | | | | | | | | | | |
| | | | | 12-31-2014 | | | 12-31-2013 | | | 1-1-2013 | |
Country | | Currency | | Rate | | | Rate | | | Rate | |
Argentina | | Argentine peso (Ar$) | | | 6.9 | % | | | 8.6 | % | | | 8.6 | % |
Brazil | | Brazilian real | | | 5.0% – 5.9 | % | | | 5.1% – 6.1 | % | | | 5.1% – 6.1 | % |
Peru | | Peruvian nuevo sol (Sol) | | | 3.4 | % | | | 3.6 | % | | | 3.7 | % |
Colombia | | Colombian peso (CP) | | | 4.3 | % | | | 4.3 | % | | | 4.3 | % |
Future cash flows are discounted to calculate their present value at a pre-tax rate that covers the cost of capital for the business activity and the geographic area in which it is being carried out. The time value of money and risk premiums generally used among analysts for the business activity and the geographic zone are taken into account to calculate the pre-tax rate.
The following are the pre-tax discount rates applied as of December 31, 2014 and 2013 and January 1, 2013 expressed in nominal terms:
| | | | | | | | | | | | | | | | | | | | | | | | | | |
| | | | | 12-31-2014 | | | 12-31-2013 | | | 1-1-2013 | |
| | | | | Minimum | | | Maximum | | | Minimum | | | Maximum | | | Minimum | | | Maximum | |
Argentina | | Ar$ | | | 37.2 | % | | | 38.9 | % | | | 42.0 | % | | | 44.4 | % | | | 26.0 | % | | | 29.0 | % |
Brazil | | Brazilian real | | | 9.7 | % | | | 22.7 | % | | | 9.0 | % | | | 18.8 | % | | | 13.5 | % | | | 18.0 | % |
Peru | | Sol | | | 12.6% | | | | 11.8 | % | | | 12.3 | % | | | 12.5% | |
Colombia | | CP | | | 13.3% | | | | 14.2% | | | | 14.5% | |
F-153
If the recoverable amount of the CGU is estimated to be less than its carrying amount, an impairment loss is recognized in the combined statement of comprehensive income. The impairment is first allocated to reduce the carrying amount of any goodwill allocated to the CGU, and then to the other assets of the unit pro rata on the basis of the carrying amount of each asset in the unit. The carrying amount of an asset is not reduced below the highest of fair value less costs of disposal, its value in use; or zero.
Impairment losses recognized for an asset in prior periods are reversed when there are indications that the impairment loss no longer exists or may have decreased, thus increasing the asset’s carrying amount with a credit to earnings. The increase in the asset’s carrying amount shall not exceed that carrying amount that would have been determined had no impairment loss been recognized for the asset. Goodwill impairment losses are not reversed in subsequent periods.
The following criteria are used to determine if a financial asset has been impaired:
| • | | For trade receivables in the electricity generation, transmission and distribution businesses, the Combined Group’s policy is to recognize impairment losses based on the aging of past-due balances. This is the policy generally applied except in cases where a specific collective basis analysis is recommended, such as in the case of receivables from government-owned companies (see Note 7). |
| • | | In the case of receivables of a financial nature, impairment is determined on case-by-case basis. As of the date of issuance of these combined financial statements, the Combined Group had no significant past-due non-commercial financial assets (see Notes 6 and 18). |
In order to determine whether an arrangement is, or contains, a lease, the Combined Group assesses the economic substance of the agreement, in order to determine whether fulfillment of the arrangement depends on the use of a specific asset and whether the agreement conveys the right to use an asset. If both conditions are met, at the inception of the arrangement the Combined Group separates the payments and other considerations relating to the lease, at their fair values, from those corresponding to other components of the agreement.
Leases that substantially transfer all the risks and rewards of ownership to the Combined Group are classified as finance leases. All others leases are classified as operating leases.
Finance leases in which the Combined Group acts as a lessee are recognized at the inception of the arrangement. At that time, the Combined Group records an asset based on the nature of the lease and a liability for the same amount, equal to the fair value of the leased asset or the present value of the minimum lease payments, if the latter is lower. Subsequently, the minimum lease payments are apportioned between finance expenses and reduction of the lease obligation. Finance expenses are recognized immediately in the income statement and allocated over the lease term, so as to achieve a constant interest rate on the remaining balance of the liability. Leased assets are depreciated on the same terms as other similar depreciable assets, as long as there is reasonable certainty that the lessee will acquire ownership of the asset at the end of the lease. If no such certainty exists, the leased assets are depreciated over the shorter of the useful lives of the assets and their lease term.
In the case of operating leases, payments are recognized as an expense in the case of the lessee and as income in the case of the lessor, both on a straight-line basis, over the term of the lease unless another type of systematic basis of distribution is deemed more representative.
Financial instruments are contracts that give rise to both a financial asset in one entity and a financial liability or equity instrument in another entity.
Purchases and sales of financial assets are accounted for using their trade date.
F-154
The Combined Group classifies its financial assets into four categories:
| • | | Trade and other receivables and accounts receivable from related parties: These financial assets, that are not quoted in the active market, are measured at amortized cost, which is the initial fair value minus principal repayments made, plus accrued interest, calculated using the effective interest method, minus any reduction through the use of an allowance account for impairment or uncollectibility. |
| | The effective interest method is used to calculate the amortized cost of a financial asset or liability (or group of financial assets or financial liabilities) and is charged to finance income or cost over the relevant period. The effective interest rate is the discount rate that exactly matches discounts the estimated future cash flows to be received or paid over the expected life of the financial instrument (or, when appropriate, over a shorter period) to the net carrying amount of the financial asset or financial liability. |
| • | | Held-to-maturity investments: Investments quoted in an active market that the Combined Group intends to hold and is capable of holding until their maturity are accounted for at amortized cost as defined in the preceding paragraph. |
| • | | Financial assets at fair value through profit or loss: This category includes the trading portfolio and those financial assets that have been designated as such upon initial recognition and that are managed and evaluated on a fair value basis. They are measured in the combined statement of financial position at fair value, with changes in value recognized directly in income when they occur. |
| • | | Available-for-sale financial assets: These are financial assets specifically designated as available for sale or that do not fit within any of the three preceding categories. They are almost all financial investments in equity instruments (see Note 6). |
These financial assets are recognized in the combined statement of financial position at fair value when it can be reliably determined. For investments in equity instruments in unlisted companies or companies with lower levels of liquidity, normally the fair value cannot be reliably measured. When this occurs, those investments in equity instruments are measured at cost less impairment losses, if any.
Changes in fair value, net of tax, are recognized in other comprehensive income, until the investments are disposed of, at which time the amount accumulated in other comprehensive income is reclassified to profit or loss.
If the fair value is lower than cost, and if there is objective evidence that the asset has been more than temporarily impaired, the difference is recognized directly in profit or loss.
| f.2) | Cash and cash equivalents |
This item within the combined statement of financial position includes cash and bank balances, time deposits with original maturity of less than or equal to 90 days, and other highly liquid investments (with original maturity of less than or equal to 90 days) that are readily convertible to cash and are subject to insignificant risk of changes in value.
| f.3) | Financial liabilities |
Financial liabilities are recognized based on cash received, net of any costs incurred in the transaction. In subsequent periods, these obligations are measured at their amortized cost using the effective interest method (see Note 3.f.1).
In the particular case that a liability is the hedged item in a fair value hedge, as an exception, such liability is measured at its fair value for the portion of the hedged risk.
F-155
In order to calculate the fair value of debt, both when it is recognized in the statement of financial position and for fair value disclosure purposes as shown in Note 16, debt has been divided into fixed interest rate debt (hereinafter “fixed-rate debt”) and variable interest rate debt (hereinafter “floating-rate debt”). Fixed-rate debt is that on which fixed-interest coupons established at the beginning of the transaction are paid explicitly or implicitly over its term. Floating-rate debt is that debt issued at a variable interest rate, i.e., each coupon is established at the beginning of each period based on the reference interest rate. All debt has been measured by discounting expected future cash flows with a market interest rate curve based on the payment currency.
| f.4) | Derivative financial instruments and hedge accounting |
Derivatives held by the Combined Group are transactions entered into to hedge interest and/or exchange rate risk, intended to eliminate or significantly reduce these risks in the underlying transactions being hedged.
Derivatives are recognized at fair value at the end of each reporting period as follows: if their fair value is positive, they are recognized within “Other financial assets”; and if their fair value is negative, they are recognized within “Other financial liabilities”. For derivatives on commodities, the positive fair value is recognized in “Trade and other receivables”, and negative fair values are recognized in “Trade and other liabilities”.
Changes in fair value are recognized directly in profit or loss, except when the derivative has been designated for hedge accounting purposes as a hedge instrument (in a cash flow hedge) and all of the conditions for applying hedge accounting are met, including that the hedge be highly effective. In this case, changes are recognized as follows:
| • | | Fair value hedges: The underlying portion for which the risk is being hedged (hedged risk) and the hedge instrument are measured at fair value, and any changes in value of both items are recognized in the combined statement of comprehensive income by offsetting the effects in the same comprehensive income statement account. |
| • | | Cash flow hedges: Changes in the fair value of the effective portion of the hedged item and hedge instrument are recognized in other comprehensive income an accumulated in an equity reserve known as “Reserve for cash flow hedges”. The cumulative loss or gain or loss in this accounting this reserve is transferred reclassified to the combined statement of comprehensive income to the extent that the hedged item impacts the combined statement of comprehensive income because of the hedged risk, offsetting the effect in the same comprehensive income statement account. Gains or losses from the ineffective portion of the hedging relationship are recognized directly in the combined statement of comprehensive income. |
A hedge relationship is considered highly effective when changes in fair value or in cash flows of the underlying item directly attributable to the hedged risk are offset by changes in fair value or cash flows of the hedging instrument, with an effectiveness ranging from 80% to 125%.
As a general rule, long-term commodity purchase or sale agreements are recognized in the combined statement of financial position at their fair value at the end of each reporting period, recognizing any differences in value directly in profit or loss, except for, when all of the following conditions are met:
| • | | The sole purpose of the agreement is for the Combined Group’s own use, which is understood as: (i) in the case of fuel purchase agreements its used to generate electricity; (ii) in the case of electrical energy purchased for sale, its sale to the end-customers; and, (iii) in the case of electricity sales its sale to the end-customers. |
| • | | The Combined Group’s future projections evidence the existence of these agreements for its own use. |
| • | | Past experience with agreements evidence that they have been utilized for the Combined Group’s own use, except in certain isolated cases when for exceptional reasons or reasons associated with logistical issues have been used beyond the control and projection of the Combined Group. |
| • | | The agreement does not stipulate settlement of differences and the parties have not made it a practice to settle similar contracts with differences in the past. |
F-156
The long-term commodity purchase or sale agreements maintained by the Combined Group, which are mainly for electricity, fuel, and other supplies, meet the conditions described above. Thus, the purpose of fuel purchase agreements is to use them to generate electricity, electricity purchase contracts are used to sell to end-customers, and electricity sale contracts are used to sell the Combined Group’s own products.
The Combined Group’s management also evaluates the existence of derivatives embedded in contracts or financial instruments to determine if their characteristics and risk are closely related to the principal contract, provided that when taken as a whole they are not being accounted for at fair value. If they are not closely related, they are recognized separately and changes in value are accounted for directly in profit or loss.
| f.5) | Fair value of derivative instruments |
The fair value of derivative financial instruments is calculated as follows:
| • | | For derivatives traded on an active market, by its quoted price as of the end of the year. |
| • | | The Combined Group measures derivatives not traded on active markets by using the discounted cash flow method and generally accepted options valuation models, based on current and future market conditions as of the close of the financial statements. It also adjusts the value according to its own credit risk (Debt Valuation Adjustment, DVA), and the counterparty risk (Credit Valuation Adjustment, CVA). These CVA and DVA adjustments are measured on the basis of the potential future exposure of the instrument (creditor or borrower position) and the risk profile of both the counterparties and the Combined Group itself. |
| f.6) | Derecognition of financial assets and liabilities |
Financial assets are derecognized when:
| • | | The contractual rights to receive cash flows from the financial asset expire or have been transferred or, if the contractual rights are retained, the Combined Group has assumed a contractual obligation to pay these cash flows to one or more recipients, if and only if, all of the three conditions are met: (i) The Combined Group has no obligation to pay amounts to eventual recipients unless it collects equivalent amounts from the original asset; (ii) The Combined Group is prohibited by the terms of the transfer contract from selling or pledging the original asset other than as a security to the eventual recipients for the obligation to pay them cash flows; and (iii) The Combined Group has an obligation to remit any cash flows it collects on behalf of the eventual recipients without material delay. |
| • | | The Combined Group has substantially transferred all the risks and rewards of ownership of the financial asset, or, if it has neither transferred nor retained substantially all the risks and rewards, when it does not retain control of the financial asset. |
Transactions in which the Combined Group retains substantially all the inherent risks and rewards of ownership of the transferred asset, it continues recognizing the transferred asset in its entirety and recognizes a financial liability for the consideration received. Transactions costs are recognized in profit and loss by using the effective interest method (see Note 3.f.1).
Financial liabilities are derecognized when they are extinguished, that is, when the obligation arising from the liability has been paid or cancelled, or has expired.
| f.7) | Offsetting of financial assets and liabilities |
The Combined Group offsets financial assets and liabilities, and the net amount is presented in the statement of financial position only when:
| • | | there is a legally binding right to set-off recognized amounts; and |
| • | | the company intends to settle them on a net basis, or to simultaneously realize the asset and settle the liability. |
F-157
| g) | Measurement of fair value |
The fair value of an asset or liability is defined as the price that would be received from the sale of an asset or paid to transfer a liability in an orderly transaction between market participants at the measurement date.
Fair value measurement assumes that the transaction to sell an asset or transfer a liability occurs in the principal market, namely, the market with the greatest volume and level of activity for that asset or liability. In the absence of a principal market, it is assumed that the transaction is carried out in the most advantageous market available to the entity, namely, the market that maximizes the amount that would be received to sell the asset or minimizes the amount that would be paid to transfer the liability.
In estimating fair value of an asset or liability, the Combined Group uses market-observable data to the extent it is available. Where Level 1 inputs are not available, the Combined Group uses valuation techniques that are appropriate for the circumstances and for which there is sufficient data to conduct the measurement. The Combined Group maximizes the use of relevant observable data and minimizes the use of unobservable data.
Given the hierarchy of the entry data used in the valuation techniques, assets and liabilities measured at fair value can be classified at the following levels:
Level 1: Quoted prices (unadjusted) in active markets for identical assets or liabilities;
Level 2: Inputs other than quoted prices included within Level 1 that are observable for the assets or liabilities, either directly (i.e. as prices) or indirectly (i.e. derived from prices). The methods and assumptions used to determine the fair values at Level 2 by type of financial assets or financial liabilities take into consideration estimated future cash flows discounted at market rates. Future cash flows for financial assets and financial liabilities are discounted with the zero coupon interest rate curves for each currency (these valuations are carried out using external tools such as Bloomberg); and
Level 3: Inputs for assets or liabilities that are not based on observable market data (unobservable inputs).
When measuring fair value, the Combined Group takes into account the characteristics of the asset or liability, particularly:
| • | | For non-financial assets, fair value measurement takes into account the ability of a market participant to generate economic benefits by using the asset in its highest and best use or by selling it to another market participant that would use the asset in its highest and best use; |
| • | | For liabilities and equity instruments, the fair value measurement assumes that the liability would not be settled and an equity instrument would not be cancelled or otherwise extinguished on the measurement date. The fair value of the liability reflects the effect of non-performance risk, namely, the risk that an entity will not fulfill the obligation, which includes, but is not limited to, the Combined Group’s own credit risk; |
| • | | In the case of financial assets and financial liabilities with offsetting positions in market risks or counterparty credit risks, it is permitted to measure the fair value on a net basis. However, this must be consistent with the manner in which market participants would price the net risk exposure at the measurement date. |
Inventories are measured at their weighted average acquisition cost or the net realizable value, whichever is lower.
F-158
Provisions are recognized when the Combined Group has a present obligation (legal or constructive) as a result of a past event, it is probable that an outflow of economic benefits will be required to settle the obligation, and a reliable estimate can be made of the amount of the obligation.
The amount recognized as a provision is the best estimate of the consideration required to settle the present obligation at the end of the reporting period, taking into account the risks and uncertainties surrounding the obligation. When a provision is measured using the cash flows estimated to settle the present obligation, its carrying amount is the present value of those cash flows (when the effect of the time value of money is material). The unwinding of the discount is recognized as finance cost. Incremental legal cost expected to be incurred in resolving a legal claim is included in measuring of the provision.
Provisions are reviewed at the end of each reporting period and adjusted to reflect the current best estimate. If it is no longer probable that an outflow of resources embodying economic benefits will be required to settle the obligation, the provision is reversed.
A contingent liability does not result in the recognition of a provision. Legal costs expected to be incurred in defending a legal claim are expensed as they are incurred. Significant contingent liabilities are disclosed unless the likelihood of an outflow of resources embodying economic benefits is remote.
| i.1) | Provisions for post-employment benefits and similar obligations |
Some of the combined entities have pension and similar obligations with their employees. These obligations, which can be defined benefits and defined contributions, are basically formalized through pension plans, except for certain non-monetary benefits, mainly electricity supply commitments, which, due to their nature, have not been externalized and are covered by the related in-house provisions.
For defined benefit plans, the cost of providing benefits is determined using the Projected Unit Credit Method, with actuarial valuations being carried out at the end of each reporting period. Past service costs relating to changes in benefits are recognized immediately.
The defined benefit plan obligations in the statement of financial position represent the present value of the accrued obligations, adjusted, once the fair value of the different plans’ assets has been deducted, if any.
For each of the defined benefit plans, any deficit between the actuarial liability and the plan assets is recognized under line item “Provisions for employee benefits” within current and non-current liabilities in the consolidated statement of financial position.
Actuarial gains and losses arising in measurement of both the plan liabilities and the plan assets are recognized directly in other comprehensive income.
Contributions to defined contribution benefit plans are recognized as an expense in the consolidated statement of comprehensive income when the employees have rendered their services.
| j) | Translation of foreign currency balances |
Transactions carried out by each entity in a currency other than its functional currency are recognized using the exchange rates prevailing as of the date of the transactions. During the year, any differences that arise between the prevailing exchange rate at the date of the transaction and the exchange rate as of the date of collection or payment are recognized as “Foreign currency exchange losses, net” in the combined statement of comprehensive income.
F-159
Likewise, at the end of each reporting period, receivable or payable balances denominated in a currency other than each entity’s functional currency are translated using the closing exchange rate. Any differences are recognized as “Foreign currency exchange losses, net” in the combined statement of comprehensive income.
The Combined Group has established a policy to hedge the portion of revenue from its subsidiaries that is directly linked to variations in the U.S. dollar, through obtaining financing in such currency. Exchange differences related to this debt, which is regarded as the hedging instrument in cash flow hedge transactions, are recognized, net of taxes, in other comprehensive income and are accumulated in an equity reserve and reclassified to profit or loss when the hedged cash flows impact profit or loss. This term has been estimated at ten years.
For the purposes of presenting these combined financial statements, the financial of entities with functional currencies other than the Chilean peso are translated as follows:
| a. | For assets and liabilities is used the prevailing closing exchange rate. |
| b. | For income and expenses items is used the average exchange rate for the period (unless this average is not a reasonable approximation of the cumulative effect of the exchange rates prevailing on the dates of the transactions, in which case the exchange rate prevailing on the date of each transaction is used). |
| c. | For equity accounts is used the historical exchange rate from the date of acquisition or contribution, and retained earnings at the average exchange rate at the date of origination. |
Exchange differences arising in translation of financial statements are recognized in the item “Foreign currency translation losses, net” in other comprehensive income and accumulated in equity (see Note 22).
| k) | Current/non-current classification |
In these combined statements of financial position, assets and liabilities expected to be recovered or settled within twelve months are presented as current items, except for post-employment and other similar obligations. Those assets and liabilities expected to be recovered or settled in more than twelve months are presented as non-current items. Deferred income tax assets and liabilities are classified as non-current.
When the Combined Group have any obligations that mature in less than twelve months but can be refinanced over the long term at the Combined Group’s discretion, through unconditionally available credit agreements with long-term maturities, such obligations are classified as long-term liabilities.
Income tax expense for the period is determined as the sum of current taxes from the Combined Group’s different combined entities and results from applying the tax rate to the taxable income for the period, after permitted deductions have been made, plus any changes in deferred income tax assets and liabilities and tax credits, both for tax losses and deductions. Differences between the carrying amount and tax basis of assets and liabilities generate deferred income tax assets and liabilities, which are calculated using the tax rates expected to apply when the assets and liabilities are realized or settled, based on tax rates that have been enacted or substantively enacted by the end of the reporting period.
Deferred income tax assets are recognized for all deductible temporary differences, tax losses and unused tax credits to the extent that it is probable that sufficient future taxable profits exist to recover the deductible temporary differences and make use of the tax credits. Such deferred tax asset is not recognized if the deductible temporary difference arises from the initial recognition of an asset or liability that:
| • | | Did not arise from a business combination, and |
| • | | At initial recognition affected neither accounting profit nor taxable profit (loss). |
F-160
With respect to deductible temporary differences associated with investments in combined entities, associates and joint arrangements, deferred income tax assets are recognized only to the extent that it is probable that the temporary differences will reverse in the foreseeable future and taxable profits will be available against which the temporary differences can be utilized.
Deferred income tax liabilities are recognized for all temporary differences, except those derived from the initial recognition of goodwill and those that arose from investments in combined entities, associates and joint ventures in which the Combined Group can control their reversal and where it is probable that they will not be reversed in the foreseeable future.
Current tax and changes in deferred income tax assets or liabilities are recognized in profit or loss or in equity, depending on where the gains or losses that triggered these tax entries have been recognized.
Any tax deductions that can be applied to current income tax liabilities are credited to earnings within the line item “Income tax expenses”, except when doubts exist about their tax realization, in which case they are not recognized until they are effectively realized, or when they correspond to specific tax incentives, in which case they are recognized as government grants.
At the end of each reporting period, the Combined Group reviews the deferred taxes assets and liabilities recognized, and makes, if any, necessary corrections based on the results of its review.
Deferred income tax assets and deferred income tax liabilities are offset in the combined statement of financial position if has a legally enforceable right to set off current income tax receivables against current income tax liabilities, and only when the deferred taxes relate to income taxes levied by the same taxation authority.
| m) | Revenue and expense recognition |
Revenue is the gross inflow of economic benefits during the period arising in the course of the ordinary activities of the Combined Group when those inflows result in increases in equity, other than increases relating to contributions from equity participants.
Revenue is measured at the fair value of the consideration received or receivable that gives rise to the revenue.
Revenue is recognized based on the economic substance of the transaction and is recognized when all of the following conditions are met:
| • | | the entity has transferred to the buyer the significant risks and rewards of ownership of the goods; |
| • | | the entity retains neither continuing managerial involvement to the degree usually associated with ownership nor effective control over the goods sold; |
| • | | the amount of revenue can be measured reliably; |
| • | | it is probable that the economic benefits associated with the transaction will flow to the entity; and |
| • | | the costs incurred or to be incurred in respect of the transaction can be measured reliably. |
Revenues from generation, transmission are recognized based on the following criteria:
| • | | Generation and transmission of electricity: Revenue is recognized based on physical delivery of energy and power, at prices established in the respective contracts; at prices stipulated in the electricity market by applicable regulations; or at marginal cost determined on the spot market, as the case. This revenue includes an estimate of the service provided and not billed until the closing date (see Note 2.3). |
In arrangements under which the Combined Group will perform multiple revenue-generating activities (multiple-element arrangement), the recognition criteria are applied to the separately identifiable components of the
F-161
transaction in order to reflect the substance of the transaction or to two or more transactions together when they are linked in such a way that the commercial effect cannot be understood without reference to the series of transactions as a whole.
Revenue from rendering of services is recognized, if it can be estimated reliably, by reference to the stage of completion of the service at the end of the reporting period.
The Combined Group excludes from revenue those gross inflows of economic benefits it receives when it acts as an agent or commission agent on behalf of third parties, and only recognizes as revenue economic benefits received for its own activity.
When goods or services are exchanged or swapped for goods or services of a similar nature and value, the exchange is not regarded as a revenue-generating transaction.
The Combined Group recognizes the net amount of non-financial asset purchases or sale contracts that are settled for a net amount of cash or through some other financial instruments. Contracts entered into and maintained for the purpose of receiving or delivering these non-financial assets are recognized on the basis of the contractual terms of the purchase, sale, or usage requirements expected by the entity.
Finance income (expense) is recognized using the effective interest method.
Expenses are recognized on an accruals basis, immediately in the event of expenditures that do not generate future economic benefits or when they do not meet the requirements for recording them as assets.
Endesa Américas S.A. will be located in Chile, hence, will be subject to Chilean laws and regulations, in particularly related to approval and payment of dividends.
Article No. 79 of the Chilean Public Companies Act establishes that, unless unanimously agreed otherwise by the shareholders of all issued shares, listed corporations must distribute a cash dividend to shareholders on an annual basis, pro rata to the shares owned or the proportion established in the company’s by-laws if there are preferred shares, of at least 30% of profit for each year, except when accumulated deficit from prior years must be absorbed.
As it is practically impossible to achieve a unanimous agreement not to approve the mandatory dividend, given the intended Combined Group’s highly fragmented share capital, at the end of each reporting period the amount of the minimum statutory dividend obligation to its shareholders is determined, net of interim dividends approved during the year, and then accounted for in “Trade and other payables” and “Accounts payable to related parties”, as appropriate, and recognized in Equity.
Interim and final dividends are deducted from Equity when they are approved by the competent body, which in the first case is normally the Board of Directors and in the second case is the shareholders as agreed at an Ordinary Shareholders’ Meeting.
Since Endesa Américas has not yet been established as a legal entity, no chief operating decision maker existed for this Combined Group. Consequently, the Combined Group does not yet have any operating segments as the term is defined under IFRS 8, Operating Segments. The Combined Group has elected to provide supplemental geographic information not required by IFRS 8 in Note 30.
F-162
| 4. | SECTOR REGULATIONS AND ELECTRICITY SYSTEM OPERATIONS |
Argentina
Argentina has shown signs of intervention in the electricity market since the crisis of 2002. Under the previous regulations, generators sold to distributors at prices obtained from centralized calculations at the average spot market price. The distributers’ purchase price was the average price forecast for the next six months, called the Seasonal Price (Precio Estacional). Any differences between the Seasonal Price (the purchase price) and the actual spot price (the selling price) was charged to the Seasonal Fund (Fondo Estacional) managed by the Electricity Wholesale Market Administration Company (CAMMESA — Compañía Administradora del Mercado Mayorista Eléctrico).
However, after the 2002 crisis, the authorities changed the pricing criteria, bringing the marginal pricing system to an end. First, marginal prices were calculated without taking into account restrictions on natural gas. In effect, despite the fact that generation is dispatched on the basis of the fuels actually used, Resolution SE 240/2003 establishes that the marginal price is to be calculated taking into consideration all of the generation units as if there were no restrictions in effect on natural gas supplies. In addition, the expense of water is not included in the calculations if its opportunity cost is higher than the cost of generating power with natural gas. Second, it established a spot price ceiling of Ar$120/MWh. However, CAMMESA pays the actual variable costs of the liquid fuel-fired thermal plants through the Temporary Dispatch Cost Overruns program.
In addition, as the dollarized economy was devalued and went back to the Argentine peso, payment for capacity fell from US$10 to Ar$10 per MWh. Capacity payments have subsequently risen slightly, to Ar$12.
Additionally, the freezing of prices paid by distributors caused a difference with the real generation costs, resulting in various types of special agreements aimed at recovering costs, in accordance with regulations in force.
It was within this context that the government announced in 2012 its plan to replace the current regulatory framework with one based on an average cost scheme.
Resolution 95/2013 was published in March 2013, significantly changing the system for generators’ remunerations and setting new prices for capacity depending on the type of technology and availability. It also established new remuneration values for non-fuel variable costs and included additional fee for energy generated.
In May 2013, the Combined Group’s generating companies (Central Costanera S.A. and Hidroeléctrica El Chocón S.A.) accepted the terms of Resolution SE 95/2013.
This resolution marked the end of marginal pricing as a payment system in the Argentine power generation market and established, instead, payment by type of technology and size of plant. For each case, it recognizes fixed costs (determined on the basis of fulfillment of availability) and variable costs, plus an additional fee (the two parts are determined on the basis of the energy generated). Part of the additional fee will be placed in a trust for future investments.
In principle, commercial management and fuel dispatch will be in the hands of CAMMESA; Terminal Market agreements cannot be extended or renewed, and large users, once their respective contracts are up, must purchase their supply from CAMMESA. However, the Energy Secretary, in Note SE 1807/13, gave generators the opportunity to express their intention to continue handling collections for their entire contract portfolio, thus ensuring a certain amount of cash flow and a continuing relationship with the customer.
It is also important to mention that Central Costanera S.A. has availability contracts signed in 2012 that are still in effect, as well as combined cycle contracts (until 2015) and steam generation contracts (until 2019) that will
F-163
enable the company to implement a plan for investing in the Central Costanera plant generation units in order to optimize the reliability and availability of that plant. The contracts also include payment of the commitments under the Long-Term Service Agreement (LTSA) for the plant’s combined cycles.
Through Resolution 529/2014, the Energy Secretary updated generators’ fee, which had been in effect since they were set in February 2013 under Resolution 95/2013. The new resolution increased recognition of fixed costs for combined cycle and large hydroelectric plants by 25%; and adjusted variable costs by 41% for thermal plants and 25% for hydroelectric plants. A new variable fee was set for biodiesel-fired plants. The additional fee increased 25% for thermal plants, and a new charge of AR$21/MWh was set for one-time maintenance for combined cycle and Ar$24/MWh for other thermal generation plants. The resolution is retroactive to February 2014.
Brazil
Legislation in Brazil allows the participation of private capital in the electricity sector, upholds free competition among companies in electricity generation, and defines criteria to avoid certain levels of economic concentration and/or market practices that may cause a decline in free competition.
Based on the contract requirements as stated by distribution companies, the Ministry of Energy has been involved in planning the expansion of the electricity system, setting capacity quotas by type of technology on the one hand and, on the other, promoting separate tender processes thermal, hydroelectric, or renewable energies, or directly holding tender processes for specific projects. The operation is being coordinated in a centralized fashion in which one independent operator coordinates centralized load dispatch based on variable production costs and seeks to guarantee to meet demand at the minimum cost for the system. The price at which transactions take place on the spot market is called the Difference Liquidation Price (Precio de Liquidación de las Diferencias, PLD), which takes into account the players’ aversion to risk.
Generation companies sell their energy on the regulated or unregulated market through contracts, and they trade their surpluses or deficits on the spot market. The free market is aimed at large users, with a limit of 3,000 kW or 500 kW if they purchase energy produced with renewable resources.
In the unregulated market, suppliers and their clients directly negotiate energy purchase conditions; whereas in the regulated market, where distribution companies operate, energy purchases must go through a tender process coordinated by the National Electricity Agency (ANEEL). Accordingly, the regulated purchase price used in the determination of tariffs to end users is based on average prices of open bids, and there are separate bidding processes for existing and new energy. Bidding processes for new energy contemplate long-term generation contracts in which new generation projects must cover the growth of demand foreseen by distributors. The open bid for existing energy considers shorter contractual terms and seeks to cover the distributors’ contractual needs arising from the expiry of prior contracts. Each bidding process is coordinated centrally. Authorities set maximum prices and, as a result, contracts are signed where all distributors participating in the process buy pro rata from each offering generator.
On November 25, 2014, the ANEEL approved the new PLD limits for 2015. The maximum limits decreased from R$823 to R$388/MWh and the minimum increased from R$16 to R$30/MWh. The decision was the result of extensive debate, which began with Public Consultation number 09/2014 and later with Public Hearing number 54/2014.
The main effect of the new limit is to reduce the financial impact for distributors of potential future risks when contracting energy in the spot market, as in 2014 the spot price was at its maximum for much of the year. The new maximum price also mitigates the risk of unrecoverable economic and financial losses for generators, when production is below contract values. However, the possibility of selling excess energy at higher prices decreases. Currently generators can divide their excess energy across the months of the year, to boost their revenues by allocating more energy to those months where higher prices are expected, as the ceiling is lower.
F-164
These regulatory mechanisms ensure the creation of regulatory assets, whose rate adjustment for deficits in 2014, will take place in the tariff adjustments starting in 2015 (March for Ampla Energía E Serviços S.A. (Ampla) and April for Compañía Energética Do Ceará S.A. (Coelce), subsidiaries of our associate). This mechanism has existed since 2001, and is called the Compensation Clearing Account — Part A (Cuenta de Compensación de Valores — Parte A, “CVA”). They aimed to maintain consistent operating margins for the dealer by allowing tariff revenue due to the costs of Parcel A.
Colombia
The Public Utility Law (Ley de Servicios Públicos Domiciliarios, Law 142) and the Electricity Law (Ley Eléctrica, Law 143) were passed in 1994 establishing the new framework ordered by the Constitution. These laws set out the general criteria and policies that are to govern public utility service provision in the country, as well as the procedures and mechanisms for regulating, monitoring and overseeing them.
The Electricity Law puts the constitutional focus into practice, regulating the generation, transmission, distribution and sale of electricity, creating the market and competitive environment, strengthening the industry and setting the boundaries for government intervention. Taking into account the nature of each activity or business, general guidelines were established for developing the regulatory framework, creating and implementing the rules that would allow for free competition in the power generation and sales industries, while the directives for the transmission and distribution industries were geared toward treating these activities as monopolies while seeking out competitive conditions wherever possible.
The main institution in the electricity sector is the Mining and Energy Ministry, whose Planning Unit (Unidad de Planeación Minero Energética, UPME) draws up the National Energy Plan and the Generation and Transmission Expansion Plan. The Energy and Gas Regulatory Commission (Comisión de Regulación de Energía y Gas, CREG) and the Public Service Superintendency (Superintendencia de Servicios Públicos, SSPD) regulate and oversee, respectively, the companies in the industry, and the Superintendency of Industry and Commerce is the national authority for free trade protection issues.
The electricity industry operates on the basis of electricity-selling companies and the large consumers being able to buy and sell energy through bilateral contracts or on a short-term energy exchange market, called the energy exchange, which operates freely according to supply and demand conditions. In addition, long-term auctions of Firm Energy within a Reliable Charge scheme are carried out to promote the expansion of the system. The market is operated and administered by XM, which is in charge of the National Dispatch Center (Centro Nacional de Despacho, CND), and the Commercial Interchange System Manager (Administrador del Sistema de Intercambios Comerciales, ASIC).
Peru
The Electricity Concessions Law and its regulations, the Law to Ensure Efficient Development of Electricity Generation (Law No. 28,832), the Electricity Industry Antimonopoly and Oligopoly Law, the Technical Standard for Electricity Service Quality, the Environmental Protection Regulations for Electricity Activities, the Law Creating the Energy and Mining Investment Supervisory Agency (Osinergmin) and its regulations, and the Regulations for Unregulated Electricity Users and Decree Law No. 1221 which improves the regulation of the distribution of electricity to promote access to electricity in Peru, all comprise the main legislation in the regulatory framework for doing business in the power industry in Peru.
Law No. 28,832, whose purpose is to ensure enough efficient power generation to reduce the risk of price volatility and rationing, promotes the establishment of market prices based on competition, planning and ensuring a mechanism that guarantees expansion of the transmission grid, and also allows Large Unregulated Users and Distributors to participate in the short-term market. Accordingly, the law promotes tender processes for long-term power supply contracts at firm prices in order to encourage investment in efficient generation and contracts with distribution companies. Distribution companies must begin the tender processes at least three years ahead of time in order to keep Regulated Users’ demand covered.
F-165
Expansion in transmission must be planned through a binding Transmission Plan drawn up by the COES SINAC and approved first by the Osinergmin and then by the Energy and Mining Ministry. There are two types of systems: a) the Guaranteed Transmission System, which is paid for by the demand; and b) the Complementary Transmission System, which is financed jointly by the generation companies and by the demand.
The purpose of the COES SINAC is to coordinate operations at the lowest possible cost while ensuring a reliable system and the best use of energy resources, to plan transmission and to manage the short-term market. It is made up of generation, transmission and distribution companies and Large Unregulated Users (those with demand of 10 MW or higher) who belong to the National Interconnected Grid (Sistema Eléctrico Interconectado Nacional).
Generation companies may sell their power to: (i) Distribution companies through tender contracts or regulated bilateral contracts; (ii) Unregulated clients; and (iii) the spot market, where surplus energy is traded among generation companies. Generation companies are also paid for the firm capacity they contribute to the system regardless of their dispatch.
Peru’s spot price, given the definition of its ideal marginal cost, does not necessarily reflect the costs in the system, as it does not consider the current shortages in the natural gas and electricity transport system. Furthermore, it sets a ceiling price for the market. This was established in an emergency regulation in 2008 (Emergency Decree 049 of 2008) that will remain in effect at least until the end of 2016.
Non-conventional renewable energy
| • | | In Brazil, the ANEEL holds auctions by technology considering the expansion plan set by the EPE, the planning agency, so that the target amount set for non-conventional renewable energy capacity is met. |
| • | | In Colombia, Law No. 697 was issued in 2001 by the Program for the Rational and Efficient Use of Energy and Other Forms of Non-Conventional Energy (Programa de Uso Racional y Eficiente de la Energía y demás formas de Energías No Convencionales — PROURE). Subsequently, indicative targets were defined for NCRE of 3.5% for 2015 and 6.5% for 2020. Law No. 1715 was enacted in 2014, which created a legal framework for the development of non-conventional renewable energy, in which guidelines for declarations of public interest, as well as tax, tariff and accounting incentives were established. As part of the implementation, the Ministry of Mines and Energy enacted Decree 2469 in 2014, establishing the guidelines for energy policy on supply of self-generation surpluses. Likewise, the Energy and Gas Regulatory Commission (CREG) issued Resolution 24/2015 regulating high-scale self-generation activity, and the Mining Energy Planning Unit (UPME) published resolution 281/2015, establishing the limit for low-scale (equal to 1MW) self-generation. Additionally, the CREG issued Resolution 11/2015 encouraging demand response mechanisms. In 2015 the CREG issued Resolution 138 that amends the remuneration scheme for confidence charged for minor plants. This new regulation establishes that such plants will belong to the centralized scheme of the charge and will declare ENFICC in order to obtain OEF assignments. If the difference between actual and programmed generation in those plants is lower than +/- 5%, they could keep the current remuneration scheme. The Ministry of Mines and Energy issued in 2015 Decree 1623 that establish guidelines on zone expansion policies. |
| • | | In Peru, a target of 5% has been set as the NCRE’s share in the country’s energy system. It is a nonbinding target and the regulatory agency, the Osinergmin, holds differential auctions by technology to help reach the goal. |
Limits on integration and concentration
In general, all of the countries have legislation in effect that defends free competition and, together with specific regulations that apply to the electricity market, defines criteria to avoid certain levels of economic concentration and/or abusive market practices.
In principle, the regulators allow the participation of companies in different activities (e.g. generation, distribution, and commercialization) as long as there is an adequate separation of each activity, for both
F-166
accounting and company purposes. Nevertheless, most of the restrictions imposed involve the transmission sector mainly due to its nature and to the need to guarantee adequate access to all agents. In Argentina and Colombia there are specific restrictions if generation or distribution companies want to become majority shareholders in transmission companies.
Regarding concentration in a specific sector, in Argentina, there are no specific limits that affect the vertical or horizontal integration of a company. In Chile, while there are regulations on free competition, there are no specific quantitative limits on vertical or horizontal integration. However, the General Law on Electrical Services provides that companies that operate on or have ownership in the Trunk Transmission Systems cannot engage in, either directly or indirectly, activities that are in any way involved in the business of power generation or distribution. In Peru, integrations are subject to authorization. In Colombia, no company may have a direct or indirect market share of over 25% in electricity sale activities, although two criteria have been established for generating activity. One of these relates to participation limits depending on market concentration (HHI) and the size of the players according to their Firm Energy, and the other relates to pivotality conditions in the market depending on the availability of resources to meet system demand. In addition, Colombian companies created after the Public Service Law was enacted in 1994 can only engage in activities that complement generation/sales and distribution/sales. Finally, in Brazil, with the changes taking place in the power industry under Law No. 10,848/2004 and Decree 5,163/2004, the ANEEL gradually perfected regulations, eliminating concentration limits as no longer compatible with the prevailing regulatory environment. However, regulatory approval is required for consolidations or mergers to take place between players operating within the same business segment.
Market for unregulated customers
In all of the countries where the Combined Group operates, distributing companies can supply their customers under regulated or freely agreed conditions. The supply limitations imposed on the unregulated market are as follows:
| | |
Country | | kW threshold |
Argentina | | > 30 kW |
Brazil | | > 3,000 kW or > 500 kW (1) |
Colombia | | > 100 kW or 55 MWh-month |
Peru | | > 200 kW (2) |
| (1) | The >500 kW limit applies if energy is purchased from renewable sources, for which the government provides incentives through a discount on tolls. |
| (2) | In April 2009, it was established that clients between 200 kW and 2,500 kW could choose between the regulated and unregulated markets. Those using over 2,500 kW are required to be unregulated customers. |
| 5. | CASH AND CASH EQUIVALENTS |
| a) | The detail of cash and cash equivalents as of December 31, 2014, 2013 and January 1, 2013 is as follows: |
| | | | | | | | | | | | |
| | | Balance as of | |
Cash and cash equivalents | | 12-31-2014
ThCh$ | | | 12-31-2013
ThCh$ | | | 1-1-2013
ThCh$ | |
Cash balances | | | 23,111 | | | | 16,457 | | | | 12,554 | |
Bank balances | | | 118,036,459 | | | | 92,614,326 | | | | 187,992,665 | |
Time deposits | | | 165,339,077 | | | | 182,555,535 | | | | 41,286,491 | |
Other fixed-income instruments | | | 15,043,583 | | | | 11,032,375 | | | | 2,033,580 | |
| | | | | | | | | | | | |
Total | | | 298,442,230 | | | | 286,218,693 | | | | 231,325,290 | |
| | | | | | | | | | | | |
Time deposits included in cash and cash equivalents represent interest-bearing time deposits with original maturity of less than or equal to 90 days. Other fixed-income investments are mainly comprised of repurchase agreements with original maturities of less than or equal to 90 days. There is no significant available cash held by the Combined Group that is restricted.
F-167
| b) | The detail of cash and cash equivalents by currency is as follows: |
| | | | | | | | | | | | |
| | | Balance as of | |
Currency | | 12-31-2014
ThCh$ | | | 12-31-2013
ThCh$ | | | 1-1-2013
ThCh$ | |
Chilean peso (Ch$) | | | 12,398,834 | | | | 18,337,745 | | | | 1,931,655 | |
Argentine peso (Ar$) | | | 12,479,893 | | | | 6,248,527 | | | | 5,902,409 | |
Colombian peso (CP) | | | 224,221,908 | | | | 227,767,858 | | | | 187,767,447 | |
Peruvian nuevo sol (Sol) | | | 27,175,201 | | | | 20,637,363 | | | | 31,593,851 | |
U.S. dollar (US$) | | | 22,166,394 | | | | 13,227,200 | | | | 4,129,928 | |
| | | | | | | | | | | | |
Total | | | 298,442,230 | | | | 286,218,693 | | | | 231,325,290 | |
| | | | | | | | | | | | |
The detail of other financial assets as of December 31, 2014, 2013 and January 1, 2013 is as follows:
| | | | | | | | | | | | | | | | | | | | | | | | |
| | | Balance as of | |
| | | Current | | | Non-current | |
Other Financial Assets | | 12-31-2014
ThCh$ | | | 12-31-2013
ThCh$ | | | 1-1-2013
ThCh$ | | | 12-31-2014
ThCh$ | | | 12-31-2013
ThCh$ | | | 1-1-2013
ThCh$ | |
Available-for-sale financial investments — non-quoted equity securities or with limited liquidity | | | — | | | | — | | | | — | | | | 1,200,787 | | | | 1,283,902 | | | | 1,242,506 | |
Financial assets held to maturity (***) | | | 19,747,428 | | | | — | | | | — | | | | — | | | | — | | | | — | |
Hedging derivatives (*) | | | 712,883 | | | | 180,399 | | | | 51,876 | | | | 16,166 | | | | 16,507 | | | | 524,133 | |
Financial assets at fair value through profit or loss (***) | | | — | | | | — | | | | 25,067,909 | | | | — | | | | — | | | | — | |
Non-hedging derivatives (**) | | | 2,924,888 | | | | 1,701,818 | | | | — | | | | — | | | | — | | | | — | |
Others | | | — | | | | — | | | | — | | | | — | | | | — | | | | 102,159 | |
| | | | | | | | | | | | | | | | | | | | | | | | |
Total | | | 23,385,199 | | | | 1,882,217 | | | | 25,119,785 | | | | 1,216,953 | | | | 1,300,409 | | | | 1,868,798 | |
| | | | | | | | | | | | | | | | | | | | | | | | |
| (***) | The amounts included in “financial assets held to maturity” and “financial assets at fair value through profit or loss” correspond mainly to time deposits and other highly liquid investments that are readily convertible to cash and subject to a low risk of changes in value, but that do not fulfill the definition of cash equivalent as defined in Note 3.f.2 (e.g. with maturity over 90 days from time of investment). |
| 7. | TRADE AND OTHER RECEIVABLES |
| a) | The detail of trade and other receivables as of December 31, 2014, 2013 and January 1, 2013 is as follows: |
| | | | | | | | | | | | | | | | | | | | | | | | |
| | | Balance as of | |
| | | 12-31-2014 | | | 12-31-2013 | | | 1-1-2013 | |
Trade and Other Receivables, Gross | | Current
ThCh$ | | | Non-current
ThCh$ | | | Current
ThCh$ | | | Non-current
ThCh$ | | | Current
ThCh$ | | | Non-current
ThCh$ | |
Trade and other receivables, gross | | | 118,610,475 | | | | 141,216,512 | | | | 104,063,314 | | | | 131,597,410 | | | | 76,564,897 | | | | 78,209,513 | |
Trade receivables, gross | | | 114,159,619 | | | | 136,744,799 | | | | 93,752,473 | | | | 125,349,056 | | | | 73,729,940 | | | | 140,323,852 | |
Other receivables, gross (*) | | | 4,450,856 | | | | 4,471,713 | | | | 10,310,841 | | | | 6,248,354 | | | | 2,834,957 | | | | 4,479,573 | |
F-168
| | | | | | | | | | | | | | | | | | | | | | | | |
| | | Balance as of | |
| | | 12-31-2014 | | | 12-31-2013 | | | 1-1-2013 | |
Trade and Other Receivables, Net | | Current
ThCh$ | | | Non-current
ThCh$ | | | Current
ThCh$ | | | Non-current
ThCh$ | | | Current
ThCh$ | | | Non-current
ThCh$ | |
Trade and other receivables, net | | | 116,156,318 | | | | 141,216,512 | | | | 102,240,411 | | | | 131,597,410 | | | | 76,237,955 | | | | 146,964,151 | |
Trade receivables, net | | | 113,015,897 | | | | 136,744,799 | | | | 93,226,822 | | | | 125,349,056 | | | | 73,020,489 | | | | 140,323,852 | |
Other receivables, net (*) | | | 3,140,421 | | | | 4,471,713 | | | | 9,013,589 | | | | 6,248,354 | | | | 3,217,466 | | | | 6,640,299 | |
| (*) | Includes mainly accounts receivable from personnel for ThCh$3,077,508 (ThCh$4,260,999 and ThCh$3,143,094 as of December 31, 2013 and January 1, 2013, respectively) and accounts receivable from FONINVEMEM (Fondo para Inversiones Necesarias que Permitan Incrementar la Oferta de Energía Eléctrica en el Mercado Eléctrico Mayorista), Argentina for ThCh$2,370,563 (ThCh$2,298,197 and ThCh$2,430,362 as of December 31, 2013 and January 1, 2013, respectively). |
There are no significant trade and other receivables balances held by the Combined Group that are not available for its use.
The balances in this account do not generally accrue interest.
The Combined Group does not have customers for which it has sales representing 10% or more of its total combined revenues in the years ended December 31, 2014 and 2013.
Refer to Note 8.1 for detailed information on amounts, terms and conditions associated with accounts receivable from related parties.
| b) | As of December 31, 2014, 2013 and January 1, 2013, the balance of unimpaired past due trade receivables is as follows: |
| | | | | | | | | | | | |
| | | Balance as of | |
Trade Receivables Past Due but Not Impaired | | 12-31-2014
ThCh$ | | | 12-31-2013
ThCh$ | | | 1-1-2013
ThCh$ | |
Less than three months | | | 5,708,854 | | | | 880,162 | | | | 130,676 | |
Between three and six months | | | 185,872 | | | | 581,103 | | | | 355,271 | |
Between six and twelve months | | | 1,499,267 | | | | 255,732 | | | | 33,409 | |
| | | | | | | | | | | | |
Total | | | 7,393,993 | | | | 1,716,997 | | | | 519,356 | |
| | | | | | | | | | | | |
| c) | The reconciliation of changes in the allowance for impairment of trade receivables is as follows: |
| | | | |
Trade Receivables Past Due and Impaired | | Current and
Non-current
ThCh$ | |
Balance as of January 1, 2013 | | | 1,971,558 | |
Increases (decreases) for the year (*) | | | (76,227 | ) |
Amounts written off | | | (29,396 | ) |
Foreign currency translation differences | | | (43,032 | ) |
| | | | |
Balance as of December 31, 2013 | | | 1,822,903 | |
| | | | |
Increases (decreases) for the year (*) | | | 869,239 | |
Amounts written off | | | (163,973 | ) |
Foreign currency translation differences | | | (74,012 | ) |
| | | | |
Balance as of December 31, 2014 | | | 2,454,157 | |
| | | | |
F-169
Write-offs of a bad debt
Past-due debt is written off once all collection measures and legal proceedings have been exhausted and the debtors’ insolvency has been demonstrated. In our power generation business, this process normally takes at least one year of procedures for the few cases that arise in each country.
| d) | Additional information: |
| • | | Additional statistical information required under Official Bulletin 715 of the Superintendencia de Valores y Seguros (Chilean Superintendency of Securities and Insurance) of February 3, 2012, XBRL Taxonomy: see Appendix 5. |
| • | | Complementary information on trade receivables: see Appendix 5.1. |
| 8. | BALANCES AND TRANSACTIONS WITH RELATED PARTIES |
Related party transactions are performed at current market conditions.
Transactions within the Combined Group have been eliminated on consolidation and are not itemized in this note.
As of the date of these financial statements, no guarantees have been granted or received nor has any allowance for bad or doubtful accounts been recognized with respect to receivable balances for related party transactions.
The controlling shareholder of the Combined Group is the Italian corporation Enel S.p.A.
| 8.1 | Balances and transactions with related parties |
The balances of accounts receivable and payables between the Combined Group and its non-combined related parties are as follows:
| a) | Receivables from related parties: |
| | | | | | | | | | | | | | | | | | | | | | | | |
Taxpayer ID No.
(RUT) | | Company | | Description of Transaction | | Term of
Transaction | | Relationship | | Currency | | Country | | Current balance as of | |
| | | | | | | | 12-31-2014 | | | 12-31-2013 | | | 1-1-2013 | |
| | | | | | | | ThCh$ | | | ThCh$ | | | ThCh$ | |
Foreign | | Endesa Cemsa S.A. | | Energy sale | | Less than 90 days | | Associate | | Ar$ | | Argentina | | | 180,969 | | | | 1,202,518 | | | | 3,259,940 | |
Foreign | | Endesa Cemsa S.A. | | Other services | | Less than 90 days | | Associate | | Ar$ | | Argentina | | | — | | | | — | | | | 5,788,317 | |
Foreign | | Companhía Interconexao Energética S.A. | | Toll | | Less than 90 days | | Common control | | Real | | Brazil | | | 7,467,263 | | | | 7,467,073 | | | | — | |
Foreign | | Companhía Interconexao Energética S.A. | | Current account | | Less than 90 days | | Common control | | US$ | | Brazil | | | — | | | | — | | | | 7,903,684 | |
Foreign | | Compañía Distribuidora y Comercializadora de Energía S.A. | | Energy sale | | Less than 90 days | | Common control | | CP | | Colombia | | | 7,529,800 | | | | 12,572,444 | | | | 14,882,710 | |
Foreign | | Compañía Distribuidora y Comercializadora de Energía S.A. | | Other services | | Less than 90 days | | Common control | | CP | | Colombia | | | 27,827 | | | | 20,674 | | | | 84,496 | |
Foreign | | Empresa de Energía de Piura S.A. | | Other services | | Less than 90 days | | Common control | | Sol | | Peru | | | 321,910 | | | | 139,579 | | | | — | |
Foreign | | Empresa de Energía de Piura S.A. | | Other services | | Less than 90 days | | Common control | | Ch$ | | Chile | | | 23,983 | | | | 15,899 | | | | — | |
Foreign | | Empresa de Distribución Eléctrica de Lima Norte S.A.A. | | Energy sale | | Less than 90 days | | Common control | | Sol | | Peru | | | 5,507,890 | | | | 7,085,960 | | | | 9,221,914 | |
Foreign | | Empresa de Distribución Eléctrica de Lima Norte S.A.A. | | Other services | | Less than 90 days | | Common control | | Sol | | Peru | | | 653,237 | | | | 10,191 | | | | — | |
Foreign | | Empresa de Distribución Eléctrica de Lima Norte S.A.A. | | Toll | | Less than 90 days | | Common control | | Sol | | Peru | | | 926,965 | | | | — | | | | — | |
Foreign | | Empresa Distribuidora Sur S.A. | | Current account | | Less than 90 days | | Common control | | Ar$ | | Argentina | | | 3,415 | | | | 29,719 | | | | 9,428 | |
Foreign | | Empresa de Energía de Cundinamarca S.A. | | Energy sale | | Less than 90 days | | Common control | | CP | | Colombia | | | 260,417 | | | | 934,281 | | | | 243,906 | |
Foreign | | Generalima S.A. | | Other services | | Less than 90 days | | Common control | | Sol | | Peru | | | 3,176,838 | | | | 50,298 | | | | — | |
Foreign | | Distrilec Inversora S.A. | | Dividends | | Less than 90 days | | Associate | | Ar$ | | Argentina | | | 6,158 | | | | — | | | | — | |
Foreign | | Distrilec Inversora S.A. | | Dividends | | Less than 90 days | | Associate | | US$ | | Argentina | | | — | | | | 6,960 | | | | 8,443 | |
Foreign | | Enel Brasil S.A. | | Dividends | | Less than 90 days | | Associate | | CH$ | | Brazil | | | — | | | | 42,603,758 | | | | — | |
Foreign | | Enel Brasil S.A. | | Dividends | | Less than 90 days | | Associate | | Sol | | Brazil | | | — | | | | 4,918,900 | | | | — | |
Foreign | | Endesa Generación | | Other services | | Less than 90 days | | Common control | | Eur | | Spain | | | 36,066 | | | | — | | | | — | |
Foreign | | Central Dock Sud | | Other services | | Less than 90 days | | Common control | | Ch$ | | Spain | | | — | | | | — | | | | 17,256 | |
Foreign | | Endesa Energía S.A. | | Gas sale | | Less than 90 days | | Associate | | Ch$ | | Chile | | | — | | | | 51,722 | | | | — | |
96.764.840-K | | Enel Trade S.p.A. | | Other services | | Less than 90 days | | Common control | | Ch$ | | Chile | | | 3,255 | | | | — | | | | — | |
| | | | | | | | | | | | | | | | | | | | | | | | |
| | Total | | | | | | | | | | | | | 26,125,993 | | | | 77,109,976 | | | | 41,420,094 | |
| | | | | | | | | | | | | | | | | | | | | | | | |
F-170
As of December 31, 2014, 2013 and January 1, 2013 the Combined Group did not have non-current receivables from related parties.
| b) | Accounts payable to related parties: |
| | | | | | | | | | | | | | | | | | | | | | | | |
Taxpayer
ID
No.
(RUT) | | Company | | Description of
Transaction | | Term of
Transaction | | Relationship | | Currency | | Country | | Current balance as of | |
| | | | | | | | 12-31-2014 | | | 12-31-2013 | | | 1-1-2013 | |
| | | | | | | | ThCh$ | | | ThCh$ | | | ThCh$ | |
Foreign | | Comercializadora de Energía del Mercosur S.A. | | Fuel purchase | | Less than 90 days | | Associate | | Ar$ | | Argentina | | | 1,782,295 | | | | 1,739,120 | | | | 7,202,746 | |
Foreign | | Comercializadora de Energía del Mercosur S.A. | | Other services | | Less than 90 days | | Associate | | Ar$ | | Argentina | | | 33,288 | | | | 2,319 | | | | 752 | |
Foreign | | Compañía Distribuidora y Comercializadora de Energía S.A. | | Energy purchase | | Less than 90 days | | Common control | | CP | | Colombia | | | 2,088,174 | | | | 2,231,822 | | | | 1,881,909 | |
Foreign | | Compañía Distribuidora y Comercializadora de Energía S.A. | | Other services | | Less than 90 days | | Common control | | CP | | Colombia | | | 59,568 | | | | 44,023 | | | | 58,906 | |
Foreign | | Compañía de Transmisión del Mercosur S.A. | | Toll | | Less than 90 days | | Common control | | Ar$ | | Argentina | | | 7,467,263 | | | | 7,467,073 | | | | 7,903,684 | |
Foreign | | Empresa de Energía de Piura S.A. | | Other services | | Less than 90 days | | Common control | | Sol | | Peru | | | 207,716 | | | | 165,479 | | | | 19,405 | |
Foreign | | Empresa de Distribución Eléctrica de Lima Norte S.A.A. | | Other services | | Less than 90 days | | Common control | | Sol | | Peru | | | 478,950 | | | | 15,799 | | | | — | |
Foreign | | Empresa de Distribución Eléctrica de Lima Norte S.A.A. | | Toll | | Less than 90 days | | Common control | | Sol | | Peru | | | 35,678 | | | | — | | | | — | |
Foreign | | Empresa Distribuidora Sur S.A. | | Current account | | Less than 90 days | | Common control | | Ar$ | | Argentina | | | 176,620 | | | | 85,350 | | | | 74,533 | |
Foreign | | Empresa de Energía de Cundinamarca S.A. | | Energy purchase | | Less than 90 days | | Common control | | CP | | Colombia | | | 127,568 | | | | 108,829 | | | | 95,007 | |
Foreign | | Endesa Latinoamérica S.A. | | Dividends | | Less than 90 days | | Common control | | CP | | Colombia | | | — | | | | — | | | | 9,726,465 | |
New Co | | Enersis Chile S.A. | | Other services | | Less than 90 days | | Common control | | Ch$ | | Chile | | | 54,845 | | | | 29,578 | | | | 79,754 | |
New Co | | Enersis Américas | | Dividends | | Less than 90 days | | Parent | | CP | | Chile | | | — | | | | 11,513,845 | | | | 30,429,978 | |
New Co | | Enersis Américas | | Dividends | | Less than 90 days | | Parent | | Ch$ | | Chile | | | 100,176,789 | | | | 32,530,354 | | | | — | |
76.107.186-6 | | ICT Servicios Informáticos Ltda. | | Other services | | Less than 90 days | | Common control | | Ch$ | | Chile | | | — | | | | — | | | | 23,797 | |
Foreign | | Enel Energy Europe S.L. | | Other services | | Less than 90 days | | Common control | | Eur | | Spain | | | 7,961 | | | | — | | | | — | |
Foreign | | Enel Energy Europe S.L. | | Other services | | Less than 90 days | | Common control | | Eur | | Spain | | | 20,444 | | | | — | | | | — | |
Foreign | | Enel Energy Europe S.L. | | Other services | | Less than 90 days | | Common control | | Eur | | Spain | | | 209,133 | | | | — | | | | — | |
Foreign | | Enel Energy Europe S.L. | | Other services | | Less than 90 days | | Common control | | Col | | Spain | | | — | | | | — | | | | 34,487 | |
Foreign | | Enel Energy Europe S.L. | | Other services | | Less than 90 days | | Common control | | Ar$ | | Spain | | | — | | | | 66,996 | | | | 45,107 | |
Foreign | | Enel Energy Europe S.L. | | Other services | | Less than 90 days | | Common control | | Sol | | Spain | | | — | | | | 45,523 | | | | 48,086 | |
Foreign | | Central Dock Sud | | Other services | | Less than 90 days | | Common control | | Eur | | Spain | | | — | | | | — | | | | 408 | |
Foreign | | Enel Ingegneria e Innovazione | | Other services | | Less than 90 days | | Common control | | Eur | | Italy | | | 131,555 | | | | 112,597 | | | | — | |
96.827.970-K | | Endesa Eco | | Other services | | Less than 90 days | | Common control | | Ch$ | | Chile | | | — | | | | — | | | | 89,578 | |
96.783.220-0 | | San Isidro | | Current account | | Less than 90 days | | Common control | | US$ | | Chile | | | — | | | | — | | | | 6,729,622 | |
96.770.940-9 | | Compañía Eléctrica Tarapacá S.A. | | Other services | | Less than 90 days | | Common control | | Ch$ | | Chile | | | 2,929 | | | | 4,257 | | | | — | |
| | | | | | | | | | | | | | | | | | | | | | | | |
| | Total | | | | | | | | | | | | | 113,060,776 | �� | | | 56,162,964 | | | | 64,444,224 | |
| | | | | | | | | | | | | | | | | | | | | | | | |
As of December 31, 2014, 2013 and January 1, 2013 the Combined Group did not have non-current accounts payable to related parties.
F-171
| c) | Significant transactions and effects on income/expenses: |
Transactions with related parties that are not consolidated and their effects on profit or loss are as follows:
| | | | | | | | | | | | | | | | |
Taxpayer ID No. (RUT) | | Company | | Relationship | | Description of
Transaction | | Country | | For the years ended | |
| | | | | | 12-31-2014 | | | 12-31-2013 | |
| | | | | | ThCh$ | | | ThCh$ | |
New Co | | Enersis Chile S.A. | | Common control | | Services received | | Chile | | | (349,920 | ) | | | (294,789 | ) |
96.770.940-9 | | Compañía Eléctrica Tarapacá S.A. | | Common control | | Services received | | Chile | | | (10,930 | ) | | | (1,870 | ) |
New Co | | Endesa Américas S.A. | | Parent | | Services received | | Chile | | | — | | | | (8,687 | ) |
Foreign | | Empresa Distribuidora Sur S.A. | | Common control | | Services received | | Argentina | | | (118,566 | ) | | | (35,012 | ) |
Foreign | | Empresa Distribuidora Sur S.A. | | Common control | | Services provided | | Argentina | | | — | | | | 20,319 | |
Foreign | | Empresa Distribuidora Sur S.A. | | Common control | | Energy sale | | Argentina | | | 17,099 | | | | — | |
Foreign | | Compañía Distribuidora y Comercializadora de Energía S.A. | | Common control | | Energy sale | | Colombia | | | 106,451,872 | | | | 155,432,080 | |
Foreign | | Compañía Distribuidora y Comercializadora de Energía S.A. | | Common control | | Energy purchase | | Colombia | | | (1,015,099 | ) | | | (25,482 | ) |
Foreign | | Compañía Distribuidora y Comercializadora de Energía S.A. | | Common control | | Services provided | | Colombia | | | 112,364 | | | | 102,046 | |
Foreign | | Compañía Distribuidora y Comercializadora de Energía S.A. | | Common control | | Services received | | Colombia | | | (147,705 | ) | | | (156,355 | ) |
Foreign | | Compañía Distribuidora y Comercializadora de Energía S.A. | | Common control | | Loans | | Colombia | | | — | | | | — | |
Foreign | | Compañía Distribuidora y Comercializadora de Energía S.A. | | Common control | | Electricity tolls | | Colombia | | | (26,321,732 | ) | | | (24,036,652 | ) |
Foreign | | Comercializadora de Energía del Mercosur S.A. | | Associate | | Services received | | Argentina | | | (525,601 | ) | | | (586,483 | ) |
Foreign | | Empresa de Distribución Eléctrica de Lima Norte S.A.A. | | Common control | | Energy sale | | Peru | | | 63,798,914 | | | | 82,950,522 | |
Foreign | | Empresa de Distribución Eléctrica de Lima Norte S.A.A. | | Common control | | Electricity tolls | | Peru | | | (141,495 | ) | | | (122,031 | ) |
Foreign | | Empresa de Distribución Eléctrica de Lima Norte S.A.A. | | Common control | | Services provided | | Peru | | | 11,966,790 | | | | 141,190 | |
Foreign | | Empresa de Energía de Piura S.A. | | Common control | | Energy sale | | Peru | | | 67,108 | | | | 856,559 | |
Foreign | | Empresa de Energía de Piura S.A. | | Common control | | Energy purchase | | Peru | | | (2,879,068 | ) | | | (141,984 | ) |
Foreign | | Empresa de Energía de Piura S.A. | | Common control | | Services provided | | Peru | | | 255,582 | | | | 137,866 | |
Foreign | | Empresa de Energía de Piura S.A. | | Common control | | Services received | | Peru | | | — | | | | (726,425 | ) |
Foreign | | Generalima S.A. | | Common control | | Services provided | | Peru | | | 3,126,444 | | | | 1,826,218 | |
Foreign | | Empresa de Energía de Cundinamarca S.A. | | Common control | | Electricity tolls | | Colombia | | | (1,055,225 | ) | | | (883,691 | ) |
Foreign | | Empresa de Energía de Cundinamarca S.A. | | Common control | | Energy sale | | Colombia | | | 3,230,442 | | | | 9,145,949 | |
Foreign | | Compañía de Transmisión del Mercosur S.A. | | Common control | | Electricity tolls | | Argentina | | | (805,099 | ) | | | (1,036,437 | ) |
Foreign | | Companhía Interconexao Energética S.A. | | Common control | | Electricity tolls | | Brazil | | | 805,099 | | | | 1,036,437 | |
Foreign | | Enel Iberoamérica, srl | | Common control | | Services received | | Spain | | | (134,627 | ) | | | — | |
Foreign | | Enel Energy Europe S.L. | | Common control | | Services received | | Spain | | | — | | | | (113,054 | ) |
Foreign | | Central Térmica Manuel Belgrano | | Common control | | Services received | | Argentina | | | — | | | | — | |
Foreign | | Central Dock Sud | | Common control | | Services provided | | Argentina | | | 2,442 | | | | 3,091 | |
91.081.000-6 | | Empresa nacional de Energía | | Common control | | Loans | | Argentina | | | — | | | | (293,256 | ) |
Foreign | | Enel Ingegneria e Innovazione | | Common control | | Services received | | Chile | | | (168,527 | ) | | | (243,953 | ) |
96.764.840-K | | Enel Trade S.p. A. | | Common control | | Services provided | | Chile | | | 3,222 | | | | — | |
| | | | | | | | | | | | | | | | |
| | Total | | | | | | | | | 156,163,784 | | | | 222,946,116 | |
| | | | | | | | | | | | | | | | |
Transfers of short-term funds between related parties are treated as current accounts changes, with variable interest rates based on market conditions used for the monthly balance. The resulting amounts receivable or payable are usually at 30 day terms, with automatic rollover for the same periods and amortization in line with cash flows.
| 8.2 | Key management personnel |
Key management of the Combined Group is defined as those persons who, due to their function within the companies of the Combined Group and in the interests of Endesa, are responsible for the worldwide operating business of the Combined Group. As of the reporting date of these combined financial statements the key
F-172
management of the Combined Group has not been elected. For the periods indicated in these Combined financial statements, the Combined Group was managed centrally by the managing directors of Endesa Chile.
The Board of Directors of Endesa Américas initially consists of nine members who were elected for an interim term at an Extraordinary Shareholders’ Meeting of Endesa held on December 18, 2015 to hold office until the first Ordinary Shareholders’ Meeting of Endesa Américas to be held in April 2016 (the “2016 OSM”). At the 2016 OSM, the entire Board of Directors consisting of nine members are expected to be elected to a three-year term. Following the end of their term, they may be re-elected or replaced. If a vacancy occurs in the interim, the Board of Directors will elect a temporary director to fill the vacancy until the next OSM, at which time the entire Board of Directors will be elected to new three-year term. The Executive Officers of Endesa Américas are expected to be appointed by the Board of Directors and hold office at the discretion of the Board.
| 8.3 | Compensation plans linked to share price |
There are no compensation plans linked to the share price.
As of December 31, 2014, 2013 and January 1, 2013, this caption is composed of the following:
| | | | | | | | | | | | |
Classes of Inventories | | Balance as of | |
| | 12-31-2014
ThCh$ | | | 12-31-2013
ThCh$ | | | 1-1-2013
ThCh$ | |
Supplies for production | | | 14,197,499 | | | | 17,070,919 | | | | 16,442,644 | |
Oil | | | 9,852,369 | | | | 8,653,771 | | | | 8,776,165 | |
Coal | | | 4,345,130 | | | | 8,417,148 | | | | 7,666,479 | |
Supplies for projects and spare parts | | | 14,702,438 | | | | 14,421,162 | | | | 12,865,428 | |
| | | | | | | | | | | | |
Total | | | 28,899,937 | | | | 31,492,081 | | | | 29,308,072 | |
| | | | | | | | | | | | |
For the year ended December 31, 2014, the amount for raw materials and consumables recognized as fuel consumption was ThCh$100,755,311 (ThCh$96,236,839 for the year ended December 31, 2013). See Note 24.
As of December 31, 2014, 2013 and January 1, 2013, there are no inventories pledged as collateral to hedge any liability.
As of December 31, 2014, 2013 and January 1, 2013, no inventories have been written down due to obsolescence.
| 10. | CURRENT TAX RECEIVABLES AND PAYABLES |
The detail of current tax receivables as of December 31, 2014, 2013 and January 1, 2013 is as follows:
| | | | | | | | | | | | |
Current Tax Receivables | | Balance as of | |
| | 12-31-2014
ThCh$ | | | 12-31-2013
ThCh$ | | | 1-1-2013
ThCh$ | |
Monthly provisional tax payments | | | 47,214 | | | | — | | | | 11,776 | |
Tax credit for absorbed profits | | | 1,117,399 | | | | 232,648 | | | | 232,333 | |
Minimum presumptive income (Argentina) | | | — | | | | 5,402 | | | | 5,775 | |
Other | | | 1,424,201 | | | | 1,521,666 | | | | 1,503,863 | |
| | | | | | | | | | | | |
Total | | | 2,588,814 | | | | 1,759,716 | | | | 1,753,747 | |
| | | | | | | | | | | | |
F-173
The detail of current tax payables as of December 31, 2014, 2013 and January 1, 2013 is as follows:
| | | | | | | | | | | | |
Current Tax Payables | | Balance as of | |
| | 12-31-2014
ThCh$ | | | 12-31-2013
ThCh$ | | | 1-1-2013
ThCh$ | |
Income tax | | | 62,911,253 | | | | 40,795,355 | | | | 33,208,153 | |
Other | | | 824 | | | | — | | | | — | |
| | | | | | | | | | | | |
Total | | | 62,912,077 | | | | 40,795,355 | | | | 33,208,153 | |
| | | | | | | | | | | | |
| 11. | INVESTMENTS ACCOUNTED FOR USING THE EQUITY METHOD |
11.1 Investments accounted for using the equity method
| a) | The following tables present the changes in investments accounted for with the equity method as of December 31, 2014 and 2013: |
| | | | | | | | | | | | | | | | | | | | | | | | | | | | | | | | | | | | | | | | | | |
Changes in Investments in
Combined Associates | | Relati-
onship | | Country | | Currency | | Owner-
ship
Interest
% | | | Balance as
of
1-1-2014 | | | Share of
Profit
(Loss) | | | Dividends
Declared | | | Foreign
Currency
Translation | | | Other
Comprehensive
Income | | | Balance as
of
12-31-2014 | | | Negative
Equity
Provision | | | Balance as
of
12-31-2014 | |
| | | | | | ThCh$ | | | ThCh$ | | | ThCh$ | | | ThCh$ | | | ThCh$ | | | ThCh$ | | | ThCh$ | | | ThCh$ | |
Enel Brasil S.A. | | Associate | | Brazil | | Brazilian real | | | 38.6367 | | | | 543,713,349 | | | | 62,181,301 | | | | (75,642,378 | ) | | | 10,619,850 | | | | (1,995,193 | ) | | | 538,876,929 | | | | — | | | | 538,876,929 | |
Endesa Cemsa S.A. | | Associate | | Argentina | | Ar$ | | | 45.0000 | | | | 2,400,103 | | | | (153,554 | ) | | | — | | | | (267,417 | ) | | | — | | | | 1,979,132 | | | | — | | | | 1,979,132 | |
Distrilec Inversora S.A. (**) | | Associate | | Argentina | | Ar$ | | | 0.8875 | | | | 141,706 | | | | (429,336 | ) | | | — | | | | (24,724 | ) | | | (3,280 | ) | | | (315,634 | ) | | | 315,634 | | | | — | |
| | | | | | | | | | | | | | | | | | | | | | | | | | | | | | | | | | | | | | | | | | |
| | | | | | | | | TOTAL | | | | 546,255,158 | | | | 61,598,411 | | | | (75,642,378 | ) | | | 10,327,709 | | | | (1,998,473 | ) | | | 540,540,427 | | | | 315,634 | | | | 540,856,061 | |
| | | | | | | | | | | | | | | | | | | | | | | | | | | | | | | | | | | | | | | | | | |
| | | | | | | | | | | | | | | | | | | | | | | | | | | | | | | | | | | | | | | | | | | | | | |
Changes in Investments in
Combined Associates | | Relati-
onship | | Country | | Currency | | Owner-
ship
Interest
% | | | Balance as
of
1-1-2013 | | | Share of
Profit (Loss) | | | Dividends
Declared | | | Foreign
Currency
Translation | | | Other
Compre-
hensive
Income | | | Other increase /
decrease | | | Balance as
of
12-31-2013 | | | Negative
Equity
Provision | | | Balance as
of
12-31-2013 | |
| | | | | | ThCh$ | | | ThCh$ | | | ThCh$ | | | ThCh$ | | | ThCh$ | | | ThCh$ | | | ThCh$ | | | ThCh$ | | | ThCh$ | |
Enel Brasil S.A. (*) | | Associate | | Brazil | | Brazilian real | | | 38.6367 | | | | 574,168,681 | | | | 94,402,624 | | | | (101,388,548 | ) | | | (21,447,127 | ) | | | 1,597,229 | | | | (3,619,510 | ) | | | 543,713,349 | | | | — | | | | 543,713,349 | |
Endesa Cemsa S.A. | | Associate | | Argentina | | Ar$ | | | 45.0000 | | | | 2,743,725 | | | | 144,312 | | | | — | | | | (487,934 | ) | | | — | | | | — | | | | 2,400,103 | | | | — | | | | 2,400,103 | |
Distrilec Inversora S.A. (**) | | Associate | | Argentina | | Ar$ | | | 0.8875 | | | | — | | | | 490,902 | | | | — | | | | 7,572 | | | | — | | | | (7,363 | ) | | | 491,111 | | | | (349,405 | ) | | | 141,706 | |
| | | | | | | | | | | | | | | | | | | | | | | | | | | | | | | | | | | | | | | | | | | | | | |
| | | | | | | | | TOTAL | | | | 576,912,406 | | | | 95,037,838 | | | | (101,388,548 | ) | | | (21,927,489 | ) | | | 1,597,229 | | | | (3,626,873 | ) | | | 546,604,563 | | | | (349,405 | ) | | | 546,255,158 | |
| | | | | | | | | | | | | | | | | | | | | | | | | | | | | | | | | | | | | | | | | | | | | | |
| (*) | Change in legal name on December 12, 2014 from Endesa Brasil S.A. to Enel Brasil S.A. |
| (**) | There is a significant influence because our ultimate controlling company owns directly and indirectly a 51.5% interest in Distrilec Inversora S.A. |
| b) | As of December 31, 2014, 2013 and January 1, 2013, no material changes in ownership interest in our combined investment associates had occurred. |
| 11.2 | Additional financial information on investments in combined associated companies |
The following tables show financial information as of and for the years ended December 31, 2014, 2013 and January 1, 2013 from the financial statements of the investments in combined associates where the Combined Group has significant influence:
| | | | | | | | | | | | | | | | | | | | | | | | | | | | | | | | | | | | | | | | |
| | | As of and for the year ended December 31, 2014 | |
Investments with Significant Influence | | Owner-
ship
Interest
% | | | Current
Assets | | | Non-current
Assets | | | Current
Liabilities | | | Non-current
Liabilities | | | Revenues | | | Expenses | | | Profit
(Loss) | | | Other
Compre-
hensive
Income | | | Comprehensive
Income | |
| | | ThCh$ | | | ThCh$ | | | ThCh$ | | | ThCh$ | | | ThCh$ | | | ThCh$ | | | ThCh$ | | | ThCh$ | | | ThCh$ | |
Enel Brasil S.A. | | | 38.64 | | | | 754,829,591 | | | | 2,402,919,071 | | | | 481,334,130 | | | | 959,822,163 | | | | 2,269,559,959 | | | | (2,058,056,356 | ) | | | 211,503,603 | | | | 23,085,739 | | | | 234,589,342 | |
Endesa Cemsa S.A. | | | 45.00 | | | | 28,225,495 | | | | 873,712 | | | | 24,701,137 | | | | — | | | | 1,280,939 | | | | (1,622,171 | ) | | | (341,232 | ) | | | (594,259 | ) | | | (935,491 | ) |
Distrilec Inversora S.A. | | | 0.89 | | | | 759,186 | | | | — | | | | 823,444 | | | | 35,501,499 | | | | — | | | | (48,377,741 | ) | | | (48,377,741 | ) | | | — | | | | (48,377,741 | ) |
| | | | | | | | | | | | | | | | | | | | | | | | | | | | | | | | | | | | | | | | |
| | | As of and for the year ended December 31, 2013 | |
Investments with Significant Influence | | Owner-
ship
Interest % | | | Current
Assets | | | Non-current
Assets | | | Current
Liabilities | | | Non-current
Liabilities | | | Revenues | | | Expenses | | | Profit
(Loss) | | | Other
Comprehensive
Income | | | Comprehensive
Income | |
| | | ThCh$ | | | ThCh$ | | | ThCh$ | | | ThCh$ | | | ThCh$ | | | ThCh$ | | | ThCh$ | | | ThCh$ | | | ThCh$ | |
Enel Brasil S.A. | | | 38.64 | | | | 828,001,927 | | | | 2,190,312,917 | | | | 507,172,891 | | | | 806,219,181 | | | | 1,871,470,844 | | | | (1,548,922,343 | ) | | | 322,548,501 | | | | (54,523,686 | ) | | | 268,024,815 | |
Endesa Cemsa S.A. | | | 45.00 | | | | 31,020,655 | | | | 838,347 | | | | 26,525,440 | | | | — | | | | 2,162,235 | | | | (1,841,541 | ) | | | 320,694 | | | | (1,084,299 | ) | | | (763,605 | ) |
Distrilec Inversora S.A. | | | 0.89 | | | | 812,462 | | | | 16,019,631 | | | | 864,657 | | | | — | | | | 55,329,841 | | | | (14,799 | ) | | | 55,315,042 | | | | 853,216 | | | | 56,168,258 | |
F-174
| | | | | | | | | | | | | | | | | | | | | | | | | | | | | | | | | | | | | | | | |
| | | As of January 1, 2013 and for the year ended December 31, 2012 | |
Investments with Significant Influence | | Owner-
ship
Interest
% | | | Current
Assets | | | Non-current
Assets | | | Current
Liabilities | | | Non-current
Liabilities | | | Revenues | | | Expenses | | | Profit (Loss) | | | Other
Comprehensive
Income | | | Comprehensive
Income | |
| | | ThCh$ | | | ThCh$ | | | ThCh$ | | | ThCh$ | | | ThCh$ | | | ThCh$ | | | ThCh$ | | | ThCh$ | | | ThCh$ | |
Enel Brasil S.A. | | | 40.45 | | | | 760,292,147 | | | | 2,272,323,291 | | | | 444,024,393 | | | | 861,339,706 | | | | 2,132,750,328 | | | | (1,754,354,455 | ) | | | 378,395,873 | | | | (288,136,798 | ) | | | 90,259,075 | |
Endesa Cemsa S.A. | | | 45.00 | | | | 46,897,389 | | | | 873,409 | | | | 41,673,631 | | | | — | | | | 3,255,026 | | | | (3,309,953 | ) | | | (54,929 | ) | | | (1,466,678 | ) | | | (1,521,607 | ) |
Distrilec Inversora S.A. | | | 0.89 | | | | 965,234 | | | | — | | | | 1,013,028 | | | | 39,323,517 | | | | — | | | | (45,557,576 | ) | | | (45,557,576 | ) | | | — | | | | (45,557,576 | ) |
None of our associates have published price quotations.
Appendix 2 to these combined financial statements provides information on the main activities of our associated companies and the ownership interest the Combined Group holds in them.
c) There are no significant commitments and contingencies, or restrictions on funds transfers to its owners in combined associated companies.
| 12. | INTANGIBLE ASSETS OTHER THAN GOODWILL |
Intangible assets as of December 31, 2014, 2013 and January 1, 2013 are detailed as follows:
| | | | | | | | | | | | |
Intangible Assets, Net | | Balance as of | |
| | 12-31-2014
ThCh$ | | | 12-31-2013
ThCh$ | | | 1-1-2013
ThCh$ | |
Easements and water rights | | | 23,857,707 | | | | 21,315,038 | | | | 21,873,248 | |
Development costs | | | 5,666,572 | | | | 7,365,668 | | | | 6,254,624 | |
Patents, registered trademarks and other rights | | | 1,514,216 | | | | 1,824,735 | | | | 1,482,187 | |
Computer software | | | 2,180,863 | | | | 816,264 | | | | 850,395 | |
Other identifiable intangible assets | | | 380,562 | | | | 3,224,267 | | | | 3,196,649 | |
| | | | | | | | | | | | |
Total | | | 33,599,920 | | | | 34,545,972 | | | | 33,657,103 | |
| | | | | | | | | | | | |
| | | | | | | | | | | | |
Intangible Assets, Gross | | Balance as of | |
| | 12-31-2014
ThCh$ | | | 12-31-2013
ThCh$ | | | 1-1-2013
ThCh$ | |
Easements and water rights | | | 30,037,242 | | | | 26,604,223 | | | | 27,127,436 | |
Concessions | | | 723,950 | | | | 660,723 | | | | — | |
Development costs | | | 8,192,203 | | | | 7,427,041 | | | | 6,299,974 | |
Patents, registered trademarks and other rights | | | 2,662,312 | | | | 2,578,734 | | | | 1,798,218 | |
Computer software | | | 6,727,772 | | | | 4,888,880 | | | | 4,633,664 | |
Other identifiable intangible assets | | | 2,906,351 | | | | 4,178,620 | | | | 4,141,960 | |
| | | | | | | | | | | | |
Total | | | 51,249,830 | | | | 46,338,221 | | | | 44,001,252 | |
| | | | | | | | | | | | |
| | | | | | | | | | | | |
Accumulated Amortization and Impairment | | Balance as of | |
| | 12-31-2014
ThCh$ | | | 12-31-2013
ThCh$ | | | 1-1-2013
ThCh$ | |
Easements and water rights | | | (6,179,535 | ) | | | (5,289,186 | ) | | | (5,254,188 | ) |
Concessions | | | (723,950 | ) | | | (660,723 | ) | | | — | |
Development costs | | | (2,525,631 | ) | | | (61,373 | ) | | | (45,350 | ) |
Patents, registered trademarks and other rights | | | (1,148,096 | ) | | | (753,999 | ) | | | (316,031 | ) |
Computer software | | | (4,546,909 | ) | | | (4,072,617 | ) | | | (3,783,269 | ) |
Other identifiable intangible assets | | | (2,525,789 | ) | | | (954,351 | ) | | | (945,311 | ) |
| | | | | | | | | | | | |
Total | | | (17,649,910 | ) | | | (11,792,249 | ) | | | (10,344,149 | ) |
| | | | | | | | | | | | |
F-175
The reconciliation of the carrying amounts of intangible assets during the years 2014, 2013 and January 1, 2013 is as follows:
| | | | | | | | | | | | | | | | | | | | | | | | |
| | | Development
Costs | | | Easements and
Water Rights | | | Patents,
Registered
Trademarks,
and Other
Rights | | | Computer
Software | | | Other
Identifiable
Intangible
Assets, Net | | | Intangible
Assets, Net | |
Changes in Intangible Assets | | ThCh$ | | | ThCh$ | | | ThCh$ | | | ThCh$ | | | ThCh$ | | | ThCh$ | |
Opening balance as of January 1, 2014 | | | 7,365,668 | | | | 21,315,038 | | | | 1,824,735 | | | | 816,264 | | | | 3,224,267 | | | | 34,545,972 | |
Changes in identifiable intangible assets | | | | | | | | | | | | | | | | | | | | | | | | |
Increases other than those from business combinations | | | 1,990,879 | | | | 1,797,729 | | | | 280,380 | | | | 1,381,534 | | | | — | | | | 5,450,522 | |
Increase (decrease) from net foreign exchange differences, net | | | (331,951 | ) | | | (434,490 | ) | | | (91,295 | ) | | | (18,092 | ) | | | 121,365 | | | | (754,463 | ) |
Amortization (*) | | | (2,734,208 | ) | | | (1,289,449 | ) | | | (613,665 | ) | | | (413,419 | ) | | | — | | | | (5,050,741 | ) |
Increases (decreases) from transfers and other changes | | | (510,100 | ) | | | 2,468,879 | | | | (5,382 | ) | | | 414,576 | | | | (2,965,070 | ) | | | (597,097 | ) |
Increases (decreases) from transfers | | | — | | | | (1 | ) | | | (5,382 | ) | | | 5,383 | | | | — | | | | — | |
Increases (decreases) from other changes | | | (510,100 | ) | | | 2,468,880 | | | | — | | | | 409,193 | | | | (2,965,070 | ) | | | (597,097 | ) |
Disposals and withdrawals from service | | | (113,716 | ) | | | — | | | | 119,443 | | | | — | | | | — | | | | 5,727 | |
Disposals | | | — | | | | — | | | | 119,443 | | | | — | | | | — | | | | 119,443 | |
Withdrawals from service | | | (113,716 | ) | | | — | | | | — | | | | — | | | | — | | | | (113,716 | ) |
| | | | | | | | | | | | | | | | | | | | | | | | |
Total changes in identifiable intangible assets | | | (1,699,096 | ) | | | 2,542,669 | | | | (310,519 | ) | | | 1,364,599 | | | | (2,843,705 | ) | | | (946,052 | ) |
| | | | | | | | | | | | | | | | | | | | | | | | |
Closing Balance as of December 31, 2014 | | | 5,666,572 | | | | 23,857,707 | | | | 1,514,216 | | | | 2,180,863 | | | | 380,562 | | | | 33,599,920 | |
| | | | | | | | | | | | | | | | | | | | | | | | |
| | | | | | | | | | | | | | | | | | | | | | | | |
| | | Development
Costs | | | Easements and
Water Rights | | | Patents,
Registered
Trademarks,
and Other
Rights | | | Computer
Software | | | Other
Identifiable
Intangible
Assets, Net | | | Intangible
Assets, Net | |
Changes in Intangible Assets | | ThCh$ | | | ThCh$ | | | ThCh$ | | | ThCh$ | | | ThCh$ | | | ThCh$ | |
Opening balance as of January 1, 2013 | | | 6,254,624 | | | | 21,873,249 | | | | 1,482,187 | | | | 850,395 | | | | 3,196,649 | | | | 33,657,104 | |
Changes in identifiable intangible assets | | | | | | | | | | | | | | | | | | | | | | | | |
Increases other than those from business combinations | | | 1,365,305 | | | | — | | | | 335,933 | | | | 129,760 | | | | 465,262 | | | | 2,296,260 | |
Increase (decrease) from net foreign exchange differences, net | | | 51,063 | | | | 44,314 | | | | 14,118 | | | | 1,570 | | | | 11,502 | | | | 122,567 | |
Amortization (*) | | | (15,449 | ) | | | (660,756 | ) | | | (425,669 | ) | | | (272,414 | ) | | | (5,369 | ) | | | (1,379,657 | ) |
Increases (decreases) from transfers and other changes | | | (377,406 | ) | | | 58,231 | | | | 418,165 | | | | 106,954 | | | | (205,944 | ) | | | — | |
Increases (decreases) from other changes | | | (377,406 | ) | | | 58,231 | | | | 418,165 | | | | 106,954 | | | | (205,944 | ) | | | — | |
Disposals and withdrawals from service | | | (173,662 | ) | | | — | | | | — | | | | — | | | | (609 | ) | | | (174,271 | ) |
Withdrawals from service | | | (173,662 | ) | | | — | | | | — | | | | — | | | | (609 | ) | | | (174,271 | ) |
Other increases/(decreases) | | | 261,193 | | | | — | | | | 1 | | | | (1 | ) | | | (237,224 | ) | | | 23,969 | |
| | | | | | | | | | | | | | | | | | | | | | | | |
Total changes in identifiable intangible assets | | | 1,111,044 | | | | (558,211 | ) | | | 342,548 | | | | (34,131 | ) | | | 27,618 | | | | 888,868 | |
| | | | | | | | | | | | | | | | | | | | | | | | |
Closing Balance as of December 31, 2013 | | | 7,365,668 | | | | 21,315,038 | | | | 1,824,735 | | | | 816,264 | | | | 3,224,267 | | | | 34,545,972 | |
| | | | | | | | | | | | | | | | | | | | | | | | |
(*) See Note 26
According to the Combined Group management’s estimates and projections, the expected future cash flows attributable to intangible assets allow recovery of the carrying amount of these assets recognized as of December 31, 2014, 2013 and January 1, 2013 (see Note 3.d).
As of December 31, 2014, 2013 and January 1, 2013, the Combined Group does not have significant intangible assets with an indefinite useful life.
F-176
The following table shows goodwill by the Cash-Generating Unit or group of Cash-Generating Units to which it belongs and changes for the years 2014 and 2013:
| | | | | | | | | | | | | | |
| | | | | Balance as of
1-1-2014 | | | Foreign
Currency
Exchange
Differences | | | Balance as of
12-31-2014 | |
Company | | Cash-Generating Unit | | ThCh$ | | | ThCh$ | | | ThCh$ | |
Hidroeléctrica El Chocón S.A | | Hidroeléctrica El Chocón S.A. | | | 8,565,202 | | | | (942,764 | ) | | | 7,622,438 | |
Edegel S.A.A. | | Edegel S.A.A. | | | 81,661,135 | | | | 6,579,905 | | | | 88,241,040 | |
Emgesa S.A.E.S.P. | | Emgesa S.A.E.S.P. | | | 5,213,756 | | | | (327,692 | ) | | | 4,886,064 | |
| | | | | | | | | | | | | | |
Total | | | | | 95,440,093 | | | | 5,309,449 | | | | 100,749,542 | |
| | | | | | | | | | | | | | |
| | | | | | | | | | | | | | |
| | | | | Balance as of
1-1-2013 | | | Foreign
Currency
Exchange
Differences | | | Balance as of
12-31-2013 | |
Company | | Cash-Generating Unit | | ThCh$ | | | ThCh$ | | | ThCh$ | |
Hidroeléctrica El Chocón S.A | | Hidroeléctrica El Chocón S.A. | | | 10,345,927 | | | | (1,780,725 | ) | | | 8,565,202 | |
Edegel S.A.A. | | Edegel S.A.A. | | | 81,550,712 | | | | 110,423 | | | | 81,661,135 | |
Emgesa S.A.E.S.P. | | Emgesa S.A.E.S.P. | | | 5,194,342 | | | | 19,414 | | | | 5,213,756 | |
| | | | | | | | | | | | | | |
Total | | | | | 97,090,981 | | | | (1,650,888 | ) | | | 95,440,093 | |
| | | | | | | | | | | | | | |
The origin of goodwill is detailed below:
| 1. | Hidroeléctrica El Chocón S.A. |
On August 31, 1993, the Combined Group acquired 59% of Hidroeléctrica El Chocón in an international public bidding process held by the Argentine government.
On October 9, 2009, in a transaction on the Lima Stock Exchange in Peru, the Combined Group acquired an additional 29.3974% interest in Edegel S.A.A.
On October 23, 1997, the Combined Group, together with Endesa Spain, bought 48.5% of Generadora de Electricidad Emgesa de Santa Fé de Bogotá in Colombia. The purchase was made in an international public bidding process held by the Colombian government.
According to the Combined Group management’s estimates and projections, the expected future cash flows projections attributable to the Cash-Generating Units or groups of Cash-Generating Units, to which the acquired goodwill has been allocated, allow recovery of its carrying amount as of December 31, 2014, 2013 and January 1, 2013 (see Note 3.b).
F-177
| 14. | PROPERTY, PLANT AND EQUIPMENT |
| a) | Property, plant, and equipment as of December 31, 2014, 2013 and January 1, 2013: |
| | | | | | | | | | | | |
| | | Balance as of | |
Classes of Property, Plant and Equipment,
Net | | 12-31-2014 | | | 12-31-2013 | | | 1-1-2013 | |
| | ThCh$ | | | ThCh$ | | | ThCh$ | |
Construction in progress | | | 736,836,581 | | | | 522,211,534 | | | | 337,261,727 | |
Land | | | 19,166,794 | | | | 19,637,844 | | | | 19,825,608 | |
Buildings | | | 16,261,602 | | | | 14,600,432 | | | | 13,806,204 | |
Plant and equipment | | | 1,792,187,832 | | | | 1,839,214,794 | | | | 1,883,889,386 | |
Fixtures and fittings | | | 9,932,658 | | | | 10,851,896 | | | | 11,305,763 | |
Finance leases | | | 34,929,490 | | | | 35,795,249 | | | | 39,497,933 | |
| | | | | | | | | | | | |
Total | | | 2,609,314,957 | | | | 2,442,311,749 | | | | 2,305,586,621 | |
| | | | | | | | | | | | |
| | | | | | | | | | | | |
| | | Balance as of | |
Classes of Property, Plant and Equipment,
Gross | | 12-31-2014 | | | 12-31-2013 | | | 1-1-2013 | |
| | ThCh$ | | | ThCh$ | | | ThCh$ | |
Construction in progress | | | 736,836,581 | | | | 522,211,534 | | | | 337,261,727 | |
Land | | | 19,166,794 | | | | 19,637,844 | | | | 19,825,608 | |
Buildings | | | 28,782,635 | | | | 22,360,121 | | | | 21,368,581 | |
Plant and equipment | | | 3,170,873,041 | | | | 3,158,234,480 | | | | 3,141,118,953 | |
Fixtures and fittings | | | 37,210,304 | | | | 36,723,169 | | | | 35,851,570 | |
Finance leases | | | 50,315,614 | | | | 47,222,729 | | | | 72,535,924 | |
| | | | | | | | | | | | |
Total | | | 4,043,184,969 | | | | 3,806,389,877 | | | | 3,627,962,363 | |
| | | | | | | | | | | | |
| | | | | | | | | | | | |
| | | Balance as of | |
Classes of Accumulated Depreciation and
Impairment of Property, Plant and
Equipment | | 12-31-2014 | | | 12-31-2013 | | | 1-1-2013 | |
| | ThCh$ | | | ThCh$ | | | ThCh$ | |
Buildings | | | (12,521,033 | ) | | | (7,759,689 | ) | | | (7,562,377 | ) |
Plant and equipment | | | (1,378,685,209 | ) | | | (1,319,019,686 | ) | | | (1,257,229,567 | ) |
Fixtures and fittings | | | (27,277,646 | ) | | | (25,871,273 | ) | | | (24,545,807 | ) |
Finance leases | | | (15,386,124 | ) | | | (11,427,480 | ) | | | (33,037,991 | ) |
| | | | | | | | | | | | |
Total | | | (1,433,870,012 | ) | | | (1,364,078,128 | ) | | | (1,322,375,742 | ) |
| | | | | | | | | | | | |
F-178
| b) | The detail of, and changes in, property, plant, and equipment for the years 2014 and 2013 are as follows: |
| | | | | | | | | | | | | | | | | | | | | | | | | | | | | | |
| | | Construction in
Progress | | | Land | | | Buildings, Net | | | Plant and
Equipment, Net | | | Fixtures and
Fittings, Net | | | Other Property,
Plant and
Equipment under
Finance Leases, Net | | | Property,
Plant and
Equipment,
Net | |
Changes in 2014 | | ThCh$ | | | ThCh$ | | | ThCh$ | | | ThCh$ | | | ThCh$ | | | ThCh$ | | | ThCh$ | |
Opening balance as of January 1, 2014 | | | 522,211,534 | | | | 19,637,844 | | | | 14,600,432 | | | | 1,839,214,794 | | | | 10,851,896 | | | | 35,795,249 | | | | 2,442,311,749 | |
Change | | Increases other than those from business combinations | | | 346,724,045 | | | | — | | | | — | | | | — | | | | 494,213 | | | | — | | | | 347,218,258 | |
| | Increase (decrease) from net foreign exchange differences | | | (50,181,221 | ) | | | (432,098 | ) | | | (631,466 | ) | | | (31,210,466 | ) | | | (229,490 | ) | | | 2,853,252 | | | | (79,831,489 | ) |
| | Depreciation (*) | | | — | | | | — | | | | (929,038 | ) | | | (92,532,672 | ) | | | (2,316,992 | ) | | | (3,006,892 | ) | | | (98,785,594 | ) |
| | Impairment losses recognized in profit or loss (*) | | | — | | | | — | | | | — | | | | (1,188,617 | ) | | | — | | | | — | | | | (1,188,617 | ) |
| | Increases (decreases) from transfers and other changes | | | (82,412,095 | ) | | | — | | | | 1,801,536 | | | | 79,484,527 | | | | 1,126,032 | | | | — | | | | — | |
| | Increases (decreases) from transfers from construction in process | | | (82,412,095 | ) | | | — | | | | 1,801,536 | | | | 79,484,527 | | | | 1,126,032 | | | | — | | | | — | |
| | Disposals and withdrawals from service | | | (1 | ) | | | — | | | | — | | | | (186,817 | ) | | | (4,730 | ) | | | — | | | | (191,548 | ) |
| | Withdrawals | | | (1 | ) | | | — | | | | — | | | | (186,817 | ) | | | (4,730 | ) | | | — | | | | (191,548 | ) |
| | Other increases / (decreases) | | | 494,319 | | | | (38,952 | ) | | | 1,420,138 | | | | (1,392,917 | ) | | | 11,729 | | | | (712,119 | ) | | | (217,802 | ) |
| | | | | | | | | | | | | | | | | | | | | | | | | | | | | | |
| | Total changes | | | 214,625,047 | | | | (471,050 | ) | | | 1,661,170 | | | | (47,026,962 | ) | | | (919,238 | ) | | | (865,759 | ) | | | 167,003,208 | |
| | | | | | | | | | | | | | | | | | | | | | | | | | | | | | |
Closing balance as of December 31, 2014 | | | 736,836,581 | | | | 19,166,794 | | | | 16,261,602 | | | | 1,792,187,832 | | | | 9,932,658 | | | | 34,929,490 | | | | 2,609,314,957 | |
| | | | | | | | | | | | | | | | | | | | | | | | | | | | | | |
| | | | | | | | | | | | | | | | | | | | | | | | | | | | | | |
| | | Construction in
Progress | | | Land | | | Buildings, Net | | | Plant and
Equipment, Net | | | Fixtures and
Fittings, Net | | | Other Property,
Plant and
Equipment under
Finance Leases, Net | | | Property,
Plant and
Equipment,
Net | |
Changes in 2013 | | ThCh$ | | | ThCh$ | | | ThCh$ | | | ThCh$ | | | ThCh$ | | | ThCh$ | | | ThCh$ | |
Opening balance as of January 1, 2013 | | | 337,261,727 | | | | 19,825,608 | | | | 13,806,204 | | | | 1,883,889,386 | | | | 11,305,763 | | | | 39,497,933 | | | | 2,305,586,621 | |
Change | | Increases other than those from business combinations | | | 251,256,207 | | | | — | | | | 22,103 | | | | 697,174 | | | | 550,381 | | | | 361,737 | | | | 252,887,602 | |
| | Increase (decrease) from net foreign exchange differences | | | 1,013,731 | | | | 57,138 | | | | 65,224 | | | | (12,811,471 | ) | | | (153,197 | ) | | | (1,321,091 | ) | | | (13,149,666 | ) |
| | Depreciation (*) | | | — | | | | — | | | | (869,750 | ) | | | (89,948,748 | ) | | | (2,112,852 | ) | | | (2,743,328 | ) | | | (95,674,678 | ) |
| | Impairment losses recognized in profit or loss (*) | | | — | | | | — | | | | — | | | | (6,599,318 | ) | | | — | | | | — | | | | (6,599,318 | ) |
| | Increases (decreases) from transfers and other changes | | | (67,090,644 | ) | | | — | | | | 1,587,110 | | | | 64,018,511 | | | | 1,485,023 | | | | — | | | | — | |
| | Increases (decreases) from transfers from construction in process | | | (67,090,644 | ) | | | — | | | | 1,587,110 | | | | 64,018,511 | | | | 1,485,023 | | | | — | | | | — | |
| | Disposals and withdrawals from service | | | (205,518 | ) | | | (244,902 | ) | | | — | | | | (212,532 | ) | | | (16,072 | ) | | | — | | | | (679,024 | ) |
| | Withdrawals | | | (205,518 | ) | | | (244,902 | ) | | | — | | | | (212,532 | ) | | | (16,072 | ) | | | — | | | | (679,024 | ) |
| | Other increases / (decreases) | | | (23,969 | ) | | | — | | | | (10,459 | ) | | | 181,792 | | | | (207,150 | ) | | | (2 | ) | | | (59,788 | ) |
| | | | | | | | | | | | | | | | | | | | | | | | | | | | | | |
| | Total changes | | | 184,949,807 | | | | (187,764 | ) | | | 794,228 | | | | (44,674,592 | ) | | | (453,867 | ) | | | (3,702,684 | ) | | | 136,725,128 | |
| | | | | | | | | | | | | | | | | | | | | | | | | | | | | | |
Closing balance as of December 31, 2013 | | | 522,211,534 | | | | 19,637,844 | | | | 14,600,432 | | | | 1,839,214,794 | | | | 10,851,896 | | | | 35,795,249 | | | | 2,442,311,749 | |
| | | | | | | | | | | | | | | | | | | | | | | | | | | | | | |
Additional information on property, plant and equipment, net
Material investments in the electricity generation business include developments in the program to create new capacity, including progress on the construction of the El Quimbo Hydroelectric Plant in Colombia with 400 MW of installed capacity and an average annual generation of 2,216 GWh. The construction involved additions of ThCh$175,419,903 for the year ended December 31, 2014 (ThCh$150,262,546 for the year ended December 31, 2013).
F-179
The present value of future lease payments derived from our finance leases is as follows:
| | | | | | | | | | | | | | | | | | | | | | | | | | | | | | | | | | | | |
| | | 12-31-2014 | | | 12-31-2013 | | | 1-1-2013 | |
| | Gross
ThCh$ | | | Unearned
Interest
ThCh$ | | | Present
Value
ThCh$ | | | Gross
ThCh$ | | | Unearned
Interest
ThCh$ | | | Present
Value
ThCh$ | | | Gross
ThCh$ | | | Unearned
Interest
ThCh$ | | | Present
Value
ThCh$ | |
Less than one year | | | 9,065,537 | | | | 630,649 | | | | 8,434,888 | | | | 5,972,314 | | | | 638,277 | | | | 5,334,037 | | | | 5,526,777 | | | | 663,278 | | | | 4,863,499 | |
From one to five years | | | 22,369,473 | | | | 645,774 | | | | 21,723,699 | | | | 27,206,667 | | | | 1,124,301 | | | | 26,082,366 | | | | 30,200,245 | | | | 1,614,937 | | | | 28,585,308 | |
| | | | | | | | | | | | | | | | | | | | | | | | | | | | | | | | | | | | |
Total | | | 31,435,010 | | | | 1,276,423 | | | | 30,158,587 | | | | 33,178,981 | | | | 1,762,578 | | | | 31,416,403 | | | | 35,727,022 | | | | 2,278,215 | | | | 33,448,807 | |
| | | | | | | | | | | | | | | | | | | | | | | | | | | | | | | | | | | | |
Leased assets primarily relate to combined subsidiary Edegel S.A.A. They represent lease agreements to finance the project of converting the Ventanilla thermoelectric plant to a combined cycle plant. The agreements were signed between Edegel S.A.A. and the financial institutions BBVA — Banco Continental, Banco de Crédito del Perú, Citibank del Peru, and Banco Internacional del Perú — Interbank. These agreements have an average term of 8 years and bear interest at an annual rate of Libor + 1.75% as of December 31, 2014, 2013 and January 1, 2013. The company also has an agreement with Scotiabank, which financed the construction of a new open cycle plant at the Santa Rosa Plant. This agreement has a term of 9 years and bears interest an annual rate of Libor + 1.75%.
As of December 31, 2014, 2013 and January 1, 2013 the Combined Group did not have operating lease agreements.
| 1. | As of December 31, 2014, 2013 and January 1, 2013, the Combined Group had contractual commitments for the acquisition of property, plant and equipment amounting to ThCh$ 1,765,834, ThCh$2,947,284 and ThCh$4,658,198, respectively. |
| 2. | As of December 31, 2014, 2013 and January 1, 2013, the Combined Group had property, plant and equipment pledged as security for liabilities in the amount of ThCh$ 21,952,283, ThCh$ 35,100,296 and ThCh$ 57,129,918, respectively (see Note 31). |
| 3. | The Combined Group has insurance policies for all risks, earthquake and machinery breakdown and damages for business interruption with a €1,000 million limit. Additionally, the Combined Group has Civil Liability insurance to meet claims from third parties with a €500 million limit. The premiums associated with these policies are presented proportionally for each company in the caption “Prepaid Expenses”. |
| a) | The origin and changes in deferred income tax assets and liabilities as of December 31, 2014, 2013 and January 1, 2013 are as follows: |
| | | | | | | | | | | | | | | | | | | | | | | | | | |
| | | Deferred Income Tax Assets Relating to | |
Deferred Income Tax Assets | | Accumulated
Depreciation | | | Provisions | | | Post-
Employment
Benefit
Obligations | | | Revaluation
of Financial
Instruments | | | Other | | | Deferred Tax
Assets | |
Opening balance as of January 1, 2014 | | | 43,045,134 | | | | 2,164,028 | | | | 391,111 | | | | — | | | | 236,623 | | | | 45,836,896 | |
Change | | Increase (decrease) in profit or loss | | | 1,939,582 | | | | 1,342,330 | | | | 110,333 | | | | — | | | | 4,388 | | | | 3,396,633 | |
| | Increase (decrease) in other comprehensive income | | | — | | | | — | | | | 230,837 | | | | (350,303 | ) | | | — | | | | (119,466 | ) |
| | Foreign currency translation | | | (2,365,601 | ) | | | (425,101 | ) | | | (55,492 | ) | | | 12,753 | | | | (69,349 | ) | | | (2,902,790 | ) |
| | Other increase (decrease) | | | (135,956 | ) | | | (13,776 | ) | | | (142,139 | ) | | | 391,810 | | | | 1,248,405 | | | | 1,348,344 | |
| | | | | | | | | | | | | | | | | | | | | | | | | | |
Closing Balance as of December 31, 2014 | | | 42,483,159 | | | | 3,067,481 | | | | 534,650 | | | | 54,260 | | | | 1,420,067 | | | | 47,559,617 | |
| | | | | | | | | | | | | | | | | | | | | | | | | | |
F-180
| | | | | | | | | | | | | | | | | | | | | | | | | | |
| | | Deferred Income Tax Assets Relating to | |
Deferred Income Tax Assets | | Accumulated
Depreciation | | | Provisions | | | Post-
Employment
Benefit
Obligations | | | Revaluation
of Financial
Instruments | | | Other | | | Deferred Tax
Assets | |
Opening balance as of January 1, 2013 | | | 44,826,586 | | | | — | | | | 485,156 | | | | — | | | | 2,329,014 | | | | 47,640,756 | |
Change | | Increase (decrease) in profit or loss | | | (1,101,882 | ) | | | 601,350 | | | | (361,238 | ) | | | — | | | | (969,582 | ) | | | (1,831,352 | ) |
| | Increase (decrease) in other comprehensive income | | | (418,615 | ) | | | — | | | | 359,588 | | | | — | | | | — | | | | (59,027 | ) |
| | Foreign currency translation | | | 128,591 | | | | 12,459 | | | | (954 | ) | | | 559 | | | | (96,200 | ) | | | 44,455 | |
| | Other increase (decrease) | | | (389,546 | ) | | | 1,550,219 | | | | (91,441 | ) | | | (559 | ) | | | (1,026,609 | ) | | | 42,064 | |
| | | | | | | | | | | | | | | | | | | | | | | | | | |
Closing Balance as of December 31, 2013 | | | 43,045,134 | | | | 2,164,028 | | | | 391,111 | | | | — | | | | 236,623 | | | | 45,836,896 | |
| | | | | | | | | | | | | | | | | | | | | | | | | | |
| | | | | | | | | | | | | | | | | | | | | | |
| | | Deferred Income Tax Liabilities Relating to | |
Deferred Income Tax Liabilities | | Accumulated
Depreciation | | | Provisions | | | Revaluation of
Financial
Instruments | | | Other | | | Deferred Tax
Liabilities | |
Opening balance as of January 1, 2014 | | | 134,632,915 | | | | 20,222 | | | | 170,603 | | | | 10,907,650 | | | | 145,731,390 | |
Change | | Increase (decrease) in profit or loss | | | (13,061,065 | ) | | | — | | | | — | | | | 14,115,519 | | | | 1,054,454 | |
| | Increase (decrease) in other comprehensive income | | | — | | | | — | | | | 108,000 | | | | — | | | | 108,000 | |
| | Foreign currency translation | | | 11,216,877 | | | | (307,279 | ) | | | 13,619 | | | | (890,509 | ) | | | 10,032,708 | |
| | Other increase (decrease) | | | (1,052,530 | ) | | | 328,231 | | | | (129,160 | ) | | | 2,201,743 | | | | 1,348,284 | |
| | | | | | | | | | | | | | | | | | | | | | |
Closing Balance as of December 31, 2014 | | | 131,736,197 | | | | 41,174 | | | | 163,062 | | | | 26,334,403 | | | | 158,274,836 | |
| | | | | | | | | | | | | | | | | | | | | | |
| | | | | | | | | | | | | | | | | | | | | | |
| | | Deferred Income Tax Liabilities Relating to | |
Deferred Income Tax Liabilities | | Accumulated
Depreciation | | | Provisions | | | Revaluation of
Financial
Instruments | | | Other | | | Deferred Tax
Liabilities | |
Opening balance as of January 1, 2013 | | | 141,235,514 | | | | — | | | | 155,409 | | | | 7,959,869 | | | | 149,350,792 | |
Change | | Increase (decrease) in profit or loss | | | (7,307,497 | ) | | | 20,099 | | | | — | | | | 3,119,122 | | | | (4,168,276 | ) |
| | Increase (decrease) in other comprehensive income | | | — | | | | — | | | | 14,715 | | | | (61,706 | ) | | | (46,991 | ) |
| | Foreign currency translation | | | (455,085 | ) | | | 498 | | | | 575 | | | | (1,817,043 | ) | | | (2,271,055 | ) |
| | Other increase (decrease) | | | 1,159,983 | | | | (375 | ) | | | (96 | ) | | | 1,707,408 | | | | 2,866,920 | |
| | | | | | | | | | | | | | | | | | | | | | |
Closing Balance as of December 31, 2013 | | | 134,632,915 | | | | 20,222 | | | | 170,603 | | | | 10,907,650 | | | | 145,731,390 | |
| | | | | | | | | | | | | | | | | | | | | | |
Recovery of deferred income tax assets will depend on whether sufficient tax profits are obtained in the future. Management of the Combined Group believes that the future profit projections for various combined entities will allow these assets to be recovered.
| b) | As of December 31, 2014, 2013 and January 1, 2013, the Combined Group has not recognized deferred income tax assets related to tax losses carry forward totaling ThCh$ 8,735,477, ThCh$ 19,563,320 and ThCh$ 24,244,660, respectively (see Note 3.l). |
The Combined Group has not recognized deferred income tax liabilities for taxable temporary differences associated with investment in combined entities and joint ventures, as it is able to control the timing of the reversal of the temporary differences and considers that it is probable that such temporary differences will not reverse in the foreseeable future. The aggregate amount of taxable temporary differences associated with investments in combined entities and joint ventures for which deferred income tax liabilities have not been recognized totaled ThCh$ 278,617,731 as of December 31, 2014 (ThCh$ 388,742,307 and ThCh$ 517,045,248 as of December 31, 2013 and January 1, 2013, respectively).
F-181
Additionally, the Combined Group has not recognized deferred tax asset for deductible temporary differences which as of December 31, 2014, totaled ThCh$ 216,259,651 (ThCh$ 235,248,460 and ThCh$ 157,572,086 as of December 31, 2013 and January 1, 2013, respectively), because that it is not probable that sufficient future taxable profits exist to recover such temporary differences.
The Combined Group companies are potentially subject to income tax audits by the tax authorities of each country in which the Combined Group operates. Such tax audits are limited to a number of annual tax periods and once these have expired audits of these periods can no longer be performed. Tax audits by nature are often complex and can require several years to complete. The following table presents a summary of tax periods potentially subject to examination:
| | |
Country | | Period |
Argentina | | 2008-2014 |
Brazil | | 2019-2014 |
Colombia | | 2012-2014 |
Peru | | 2009-2014 |
Given the range of possible interpretations of tax standards, the results of any future inspections carried out by tax authorities for the years subject to audit can give rise to tax liabilities that cannot currently be quantified objectively. Nevertheless, Combined Group’s management estimates that the liabilities, if any, that may arise from such audits, would not significantly impact the companies’ future results.
The effects of deferred tax on the components of Other Comprehensive Income are as follows:
| | | | | | | | | | | | | | | | | | | | | | | | |
| | | Year ended December 31, 2014 | | | Year ended December 31, 2013 | |
| | | Amount
Before Tax | | | Income
Tax
Expense
(Benefit) | | | Amount
After Tax | | | Amount
Before Tax | | | Income
Tax
Expense
(Benefit) | | | Amount
After Tax | |
Effects of Deferred Tax on the Components of Other
Comprehensive Income | | ThCh$ | | | ThCh$ | | | ThCh$ | | | ThCh$ | | | ThCh$ | | | ThCh$ | |
Available-for-sale financial assets | | | — | | | | — | | | | — | | | | — | | | | — | | | | — | |
Cash flow hedge | | | (9,061,264 | ) | | | 2,615,522 | | | | (6,445,742 | ) | | | (12,202,810 | ) | | | 3,622,664 | | | | (8,580,146 | ) |
Amount of other comprehensive income from investments accounted for using the equity method | | | (1,998,473 | ) | | | — | | | | (1,998,473 | ) | | | 1,597,229 | | | | — | | | | 1,597,229 | |
Foreign currency translation | | | (20,011,384 | ) | | | — | | | | (20,011,384 | ) | | | (21,255,438 | ) | | | — | | | | (21,255,438 | ) |
Actuarial income on defined-benefit pension plans | | | (1,059,671 | ) | | | (361,308 | ) | | | (1,420,979 | ) | | | (1,886,866 | ) | | | 644,029 | | | | (1,242,837 | ) |
| | | | | | | | | | | | | | | | | | | | | | | | |
Income tax related to components of other income and expenses debited or credited to Equity | | | (32,130,792 | ) | | | 2,254,214 | | | | (29,876,578 | ) | | | (33,747,885 | ) | | | 4,266,693 | | | | (29,481,192 | ) |
| | | | | | | | | | | | | | | | | | | | | | | | |
| c) | In Colombia, Law 1,739 dated 2014 increased from 8% to 9% indefinitely the rate for the specific income tax for financing social programs known as CREE, levied on taxable profits earned each year for the tax year 2016 onwards. Additionally, this Law established the CREE surcharge of 5%, 6%, 8% and 9% for 2015, 2016, 2017 and 2018, respectively. |
The effect of temporary differences involving the payment of less or more income tax in the current year is recognized as a deferred tax credit or debit respectively at the tax rates in effect when the differences are reversed (39% in 2015 40% in 2016, 42% in 2017, 43% in 2018 and 34% from 2019), provided there is a reasonable expectation that such differences will reverse in the future and that the asset will generate sufficient taxable income.
Due to this rate increase, the Colombian combined entities have recognized changes in their deferred income tax assets and liabilities as of December 31, 2014. The net effect on income was a profit of ThCh$ 1,766,232
| d) | In Peru, the rate of corporate income tax is 30% on taxable income, after deducting the employees profit share of 5% of taxable income, as of December 31, 2014, 2013 and January 1, 2013. |
F-182
Law No. 30296 establishes that the applicable rate of corporate income tax on taxable income, after deducting the employees profit share will be as follows: 28% in 2015 and 2016, 27% in 2017 and 2018, and 26% from 2019 onwards.
Due to this rate increase, the Peruvian combined entities have recognized changes in their deferred income tax assets and liabilities as of December 31, 2014. The net effect on income was a profit of ThCh$ 18,906,796.
| 16. | OTHER FINANCIAL LIABILITIES |
The balance of other financial liabilities as of December 31, 2014, 2013 and January 1, 2013 is as follows:
| | | | | | | | | | | | | | | | | | | | | | | | |
| | | Balance as of | |
| | | 12-31-2014 | | | 12-31-2013 | | | 1-1-2013 | |
Other Financial Liabilities | | Current
ThCh$ | | | Non-current
ThCh$ | | | Current
ThCh$ | | | Non-current
ThCh$ | | | Current
ThCh$ | | | Non-current
ThCh$ | |
Interest-bearing borrowings | | | 144,380,202 | | | | 1,046,984,911 | | | | 226,161,105 | | | | 960,458,076 | | | | 185,214,469 | | | | 867,177,450 | |
Hedging derivatives (*) | | | 14,658 | | | | 582,788 | | | | 310,284 | | | | 900,927 | | | | 883,813 | | | | 1,793,139 | |
| | | | | | | | | | | | | | | | | | | | | | | | |
Total | | | 144,394,860 | | | | 1,047,567,699 | | | | 226,471,389 | | | | 961,359,003 | | | | 186,098,282 | | | | 868,970,589 | |
| | | | | | | | | | | | | | | | | | | | | | | | |
| 16.1 | Interest-bearing borrowings |
The detail of current and non-current interest-bearing borrowings as of December 31, 2014, 2013 and January 1, 2013 is as follows:
| | | | | | | | | | | | | | | | | | | | | | | | |
| | | Balance as of | |
| | | 12-31-2014 | | | 12-31-2013 | | | 1-1-2013 | |
Interest-bearing borrowings | | Current
ThCh$ | | | Non-current
ThCh$ | | | Current
ThCh$ | | | Non-current
ThCh$ | | | Current
ThCh$ | | | Non-current
ThCh$ | |
Bank loans | | | 33,899,668 | | | | 158,762,494 | | | | 32,676,197 | | | | 143,280,439 | | | | 43,358,192 | | | | 146,071,456 | |
Unsecured liabilities | | | 95,676,216 | | | | 830,468,792 | | | | 80,719,151 | | | | 788,672,039 | | | | 42,360,399 | | | | 682,180,708 | |
Secured liabilities | | | — | | | | — | | | | 4,828,233 | | | | — | | | | 4,880,687 | | | | 4,689,387 | |
Finance leases | | | 8,434,888 | | | | 21,723,699 | | | | 5,334,037 | | | | 26,082,366 | | | | 4,842,455 | | | | 28,606,352 | |
Other obligations | | | 6,369,430 | | | | 36,029,926 | | | | 102,603,487 | | | | 2,423,232 | | | | 89,772,736 | | | | 5,629,547 | |
| | | | | | | | | | | | | | | | | | | | | | | | |
Total | | | 144,380,202 | | | | 1,046,984,911 | | | | 226,161,105 | | | | 960,458,076 | | | | 185,214,469 | | | | 867,177,450 | |
| | | | | | | | | | | | | | | | | | | | | | | | |
Bank loans by currency and contractual maturity as of December 31, 2014, 2013 and January 1, 2013 are as follows:
| • | | Summary of bank loans by currency and contractual maturity |
| | | | | | | | | | | | | | | | | | | | | | | | | | | | | | | | | | | | | | | | | | | | | | | | | | |
Country | | Currency | | Effective
Interest
Rate | | | Nominal
Interest
Rate | | | Secured
(Yes/No) | | | Balance as of 12-31-2014 | |
| | | | | | Current | | | Non-current | |
| | | | | | One to
three
months | | | Three to
twelve
months | | | Total
Current | | | One to
two years | | | Two to
three
years | | | Three to
four
years | | | Four to
five years | | | More
than
five years | | | Total Non-
current | |
| | | | | | ThCh$ | | | ThCh$ | | | ThCh$ | | | ThCh$ | | | ThCh$ | | | ThCh$ | | | ThCh$ | | | ThCh$ | | | ThCh$ | |
Peru | | US$ | | | 3.01 | % | | | 2.93 | % | | | No | | | | 2,472,247 | | | | 8,382,913 | | | | 10,855,160 | | | | 38,628,554 | | | | 17,850,471 | | | | 16,254,959 | | | | 255,432 | | | | — | | | | 72,989,416 | |
Argentina | | US$ | | | 13.68 | % | | | 13.03 | % | | | No | | | | 11,451,387 | | | | 2,126,669 | | | | 13,578,056 | | | | 1,022,595 | | | | — | | | | — | | | | — | | | | — | | | | 1,022,595 | |
Argentina | | Ar$ | | | 39.91 | % | | | 35.13 | % | | | No | | | | 2,861,876 | | | | 6,395,181 | | | | 9,257,057 | | | | 6,999,683 | | | | — | | | | — | | | | — | | | | — | | | | 6,999,683 | |
Colombia | | CP | | | 8.29 | % | | | 8.13 | % | | | No | | | | — | | | | 209,395 | | | | 209,395 | | | | — | | | | — | | | | — | | | | — | | | | 77,750,800 | | | | 77,750,800 | |
| | | | | | | | | | | | | | | | | | | | | | | | | | | | | | | | | | | | | | | | | | | | | | | | | | |
| | | | | | | | | | | | | Total | | | | 16,785,510 | | | | 17,114,158 | | | | 33,899,668 | | | | 46,650,832 | | | | 17,850,471 | | | | 16,254,959 | | | | 255,432 | | | | 77,750,800 | | | | 158,762,494 | |
| | | | | | | | | | | | | | | | | | | | | | | | | | | | | | | | | | | | | | | | | | | | | | | | | | |
F-183
| | | | | | | | | | | | | | | | | | | | | | | | | | | | | | | | | | | | | | | | | | | | | | | | | | |
Country | | Currency | | Effective
Interest
Rate | | | Nominal
Interest
Rate | | | Secured
(Yes/No) | | | Balance as of 12-31-2013 | |
| | | | | | Current | | | Non-current | |
| | | | | | One to
three
months | | | Three to
twelve
months | | | Total
Current | | | One to
two years | | | Two to
three
years | | | Three to
four
years | | | Four to
five years | | | More
than
five years | | | Total Non-
current | |
| | | | | | ThCh$ | | | ThCh$ | | | ThCh$ | | | ThCh$ | | | ThCh$ | | | ThCh$ | | | ThCh$ | | | ThCh$ | | | ThCh$ | |
Peru | | US$ | | | 2.81 | % | | | 2.78 | % | | | No | | | | 2,676,462 | | | | 2,785,037 | | | | 5,461,499 | | | | 8,394,485 | | | | 13,644,318 | | | | 14,563,037 | | | | 13,182,334 | | | | — | | | | 49,784,174 | |
Argentina | | US$ | | | 9.59 | % | | | 9.31 | % | | | No | | | | 6,425,910 | | | | 4,853,256 | | | | 11,279,166 | | | | 1,617,752 | | | | — | | | | — | | | | — | | | | — | | | | 1,617,752 | |
Argentina | | Ar$ | | | 31.73 | % | | | 28.22 | % | | | No | | | | 13,579,212 | | | | 2,168,081 | | | | 15,747,293 | | | | 8,913,225 | | | | — | | | | — | | | | — | | | | — | | | | 8,913,225 | |
Colombia | | CP | | | 6.95 | % | | | 6.84 | % | | | No | | | | — | | | | 188,239 | | | | 188,239 | | | | — | | | | — | | | | — | | | | — | | | | 82,965,288 | | | | 82,965,288 | |
| | | | | | | | | | | | | | | | | | | | | | | | | | | | | | | | | | | | | | | | | | | | | | | | | | |
| | | | | | | | | | | | | Total | | | | 22,681,584 | | | | 9,994,613 | | | | 32,676,197 | | | | 18,925,462 | | | | 13,644,318 | | | | 14,563,037 | | | | 13,182,334 | | | | 82,965,288 | | | | 143,280,439 | |
| | | | | | | | | | | | | | | | | | | | | | | | | | | | | | | | | | | | | | | | | | | | | | | | | | |
| | | | | | | | | | | | | | | | | | | | | | | | | | | | | | | | | | | | | | | | | | | | | | | | | | |
Country | | Currency | | Effective
Interest
Rate | | | Nominal
Interest
Rate | | | Secured
(Yes/No) | | | Balance as of 1-1-2013 | |
| | | | | | Current | | | Non-current | |
| | | | | | One to
three
months | | | Three to
twelve
months | | | Total
Current | | | One to
two years | | | Two to
three
years | | | Three to
four
years | | | Four to
five years | | | More
than
five years | | | Total Non-
current | |
| | | | | | ThCh$ | | | ThCh$ | | | ThCh$ | | | ThCh$ | | | ThCh$ | | | ThCh$ | | | ThCh$ | | | ThCh$ | | | ThCh$ | |
Peru | | US$ | | | 3.54 | % | | | 3.49 | % | | | No | | | | 1,806,758 | | | | 444,835 | | | | 2,251,593 | | | | 2,984,702 | | | | 7,648,297 | | | | 12,431,472 | | | | 13,268,528 | | | | 12,010,552 | | | | 48,343,549 | |
Argentina | | US$ | | | 9.09 | % | | | 8.91 | % | | | No | | | | 7,214,852 | | | | 4,421,192 | | | | 11,636,044 | | | | 7,368,666 | | | | — | | | | — | | | | — | | | | — | | | | 7,368,666 | |
Argentina | | Ar$ | | | 23.18 | % | | | 21.63 | % | | | No | | | | 18,788,048 | | | | 8,972,376 | | | | 27,760,424 | | | | 7,702,892 | | | | — | | | | — | | | | — | | | | — | | | | 7,702,892 | |
Colombia | | CP | | | 9.41 | % | | | 9.20 | % | | | No | | | | 1,710,131 | | | | — | | | | 1,710,131 | | | | — | | | | — | | | | 82,656,349 | | | | — | | | | — | | | | 82,656,349 | |
| | | | | | | | | | | | | | | | | | | | | | | | | | | | | | | | | | | | | | | | | | | | | | | | | | |
| | | | | | | | | | | | | Total | | | | 29,519,789 | | | | 13,838,403 | | | | 43,358,192 | | | | 18,056,260 | | | | 7,648,297 | | | | 95,087,821 | | | | 13,268,528 | | | | 12,010,552 | | | | 146,071,456 | |
| | | | | | | | | | | | | | | | | | | | | | | | | | | | | | | | | | | | | | | | | | | | | | | | | | |
| • | | Fair value measurement and hierarchy |
The fair value of current and non-current bank borrowings as of December 31, 2014 totaled ThCh$ 201,007,394 (ThCh$ 140,677,911 and ThCh$ 184,794,537 as of December 31, 2013 and January 1, 2013, respectively). During both years, the borrowings have been classified as Level 2 fair values based on the inputs from the valuation techniques used (see Note 3.g).
F-184
| • | | Identification of Bank Loans by Company |
| | | | | | | | | | | | | | | | | | | | | | | | | | | | | | | | | | | | | | | | | | | | | | | | | | | | | | | | | | |
Taxpayer ID No.
(RUT) | | Company | | Country | | ID No.
Financial
Institution | | Financial
Institution | | Country | | Currency | | Effective
Interest
Rate | | | Nominal
Interest
Rate | | | Amortization | | Balance as of 12-31-2014 | |
| | | | | | | | | | | Current | | | Non-current | |
| | | | | | | | | | | One to
three
months | | | Three to
twelve
months | | | Total
Current | | | One to
two years | | | Two to
three
years | | | Three to
four years | | | Four to
five
years | | | More
than five
years | | | Total Non-
current | |
| | | | | | | | | | | ThCh$ | | | ThCh$ | | | ThCh$ | | | ThCh$ | | | ThCh$ | | | ThCh$ | | | ThCh$ | | | ThCh$ | | | ThCh$ | |
Foreign | | Chinango S.A.C. | | Peru | | Foreign | | Banco Scotiabank | | Peru | | US$ | | | 3.98 | % | | | 3.96 | % | | Quarterly | | | 260,672 | | | | 564,193 | | | | 824,865 | | | | 752,258 | | | | 752,258 | | | | 15,233,217 | | | | — | | | | | | | | 16,737,733 | |
Foreign | | Chinango S.A.C. | | Peru | | Foreign | | Bank Of Nova Scotia | | Peru | | US$ | | | 3.18 | % | | | 3.01 | % | | Quarterly | | | 395,746 | | | | 1,137,486 | | | | 1,533,232 | | | | 1,516,648 | | | | 1,516,648 | | | | — | | | | — | | | | — | | | | 3,033,296 | |
Foreign | | Chinango S.A.C. | | Peru | | Foreign | | Bank Of Nova Scotia | | Peru | | US$ | | | 3.48 | % | | | 3.40 | % | | Quarterly | | | 287,425 | | | | 766,306 | | | | 1,053,731 | | | | 1,021,742 | | | | 1,021,742 | | | | 1,021,742 | | | | 255,432 | | | | — | | | | 3,320,658 | |
Foreign | | Edegel S.A.A | | Peru | | Foreign | | Banco Continental | | Peru | | US$ | | | 3.44 | % | | | 3.36 | % | | Quarterly | | | 1,516,649 | | | | 5,914,928 | | | | 7,431,577 | | | | 13,498,170 | | | | 14,559,823 | | | | — | | | | — | | | | — | | | | 28,057,993 | |
Foreign | | Edegel S.A.A | | Peru | | Foreign | | Bank Nova Scotia | | Peru | | US$ | | | 1.02 | % | | | 1.00 | % | | At maturity | | | 11,755 | | | | — | | | | 11,755 | | | | 21,839,736 | | | | — | | | | — | | | | — | | | | — | | | | 21,839,736 | |
Foreign | | Emgesa S.A. E.S.P. | | Colombia | | Foreign | | Banco Corpbanca | | Colombia | | CP | | | 8.39 | % | | | 8.22 | % | | At maturity | | | — | | | | 55,892 | | | | 55,892 | | | | — | | | | — | | | | — | | | | — | | | | 20,393,652 | | | | 20,393,652 | |
Foreign | | Emgesa S.A. E.S.P. | | Colombia | | Foreign | | BBVA Colombia | | Colombia | | CP | | | 6.71 | % | | | 6.60 | % | | At maturity | | | — | | | | 153,503 | | | | 153,503 | | | | — | | | | — | | | | — | | | | — | | | | 57,357,148 | | | | 57,357,148 | |
Foreign | | Endesa Argentina S.A. | | Argentina | | Foreign | | Citibank | | Argentina | | Ar$ | | | 28.00 | % | | | 28.00 | % | | At maturity | | | 710,351 | | | | — | | | | 710,351 | | | | — | | | | — | | | | — | | | | — | | | | — | | | | — | |
Foreign | | Central Costanera S.A. | | Argentina | | Foreign | | Banco Galicia | | Argentina | | Ar$ | | | 51.47 | % | | | 42.24 | % | | At maturity | | | — | | | | 800,033 | | | | 800,033 | | | | 853,856 | | | | — | | | | — | | | | — | | | | — | | | | 853,856 | |
Foreign | | Central Costanera S.A. | | Argentina | | Foreign | | Banco Itau | | Argentina | | Ar$ | | | 55.08 | % | | | 44.68 | % | | At maturity | | | — | | | | 302,809 | | | | 302,809 | | | | 350,571 | | | | — | | | | — | | | | — | | | | — | | | | 350,571 | |
Foreign | | Central Costanera S.A. | | Argentina | | Foreign | | Banco Santander Río | | Argentina | | Ar$ | | | 44.17 | % | | | 37.14 | % | | At maturity | | | — | | | | 185,138 | | | | 185,138 | | | | 215,736 | | | | — | | | | — | | | | — | | | | — | | | | 215,736 | |
Foreign | | Central Costanera S.A. | | Argentina | | Foreign | | Banco Supervielle | | Argentina | | Ar$ | | | 49.97 | % | | | 41.21 | % | | At maturity | | | — | | | | 289,401 | | | | 289,401 | | | | 337,088 | | | | — | | | | — | | | | — | | | | — | | | | 337,088 | |
Foreign | | Central Costanera S.A. | | Argentina | | Foreign | | Citibank | | Argentina | | Ar$ | | | 45.11 | % | | | 37.81 | % | | At maturity | | | — | | | | 955,718 | | | | 955,718 | | | | 1,113,199 | | | | — | | | | — | | | | — | | | | — | | | | 1,113,199 | |
Foreign | | Central Costanera S.A. | | Argentina | | Foreign | | Credit Suisse
International | | Argentina | | US$ | | | 14.84 | % | | | 13.92 | % | | Quarterly | | | — | | | | 2,126,669 | | | | 2,126,669 | | | | 1,022,595 | | | | — | | | | — | | | | — | | | | — | | | | 1,022,595 | |
Foreign | | Central Costanera S.A. | | Argentina | | Foreign | | ICB Argentina | | Argentina | | Ar$ | | | 51.99 | % | | | 42.59 | % | | Quarterly | | | — | | | | 324,772 | | | | 324,772 | | | | 377,538 | | | | — | | | | — | | | | — | | | | — | | | | 377,538 | |
Foreign | | H. El Chocón S.A. | | Argentina | | Foreign | | Banco Macro | | Argentina | | Ar$ | | | 30.56 | % | | | 27.87 | % | | At maturity | | | 1,461,573 | | | | — | | | | 1,461,573 | | | | — | | | | — | | | | — | | | | — | | | | — | | | | — | |
Foreign | | H. El Chocón S.A. | | Argentina | | Foreign | | Deutsche Bank | | Argentina | | US$ | | | 13.40 | % | | | 12.78 | % | | Quarterly | | | 5,725,691 | | | | — | | | | 5,725,691 | | | | — | | | | — | | | | — | | | | — | | | | — | | | | — | |
Foreign | | H. El Chocón S.A. | | Argentina | | Foreign | | Standard Bank | | Argentina | | US$ | | | 13.40 | % | | | 12.78 | % | | Quarterly | | | 2,862,848 | | | | — | | | | 2,862,848 | | | | — | | | | — | | | | — | | | | — | | | | — | | | | — | |
Foreign | | H. El Chocón S.A. | | Argentina | | Foreign | | Banco Itau | | Argentina | | US$ | | | 13.40 | % | | | 12.78 | % | | Quarterly | | | 2,862,848 | | | | — | | | | 2,862,848 | | | | — | | | | — | | | | — | | | | — | | | | — | | | | — | |
Foreign | | H. El Chocón S.A. | | Argentina | | Foreign | | Banco Santander -
Sindicado IV | | Argentina | | Ar$ | | | 36.21 | % | | | 32.11 | % | | Quarterly | | | 158,689 | | | | 813,581 | | | | 972,270 | | | | 862,890 | | | | — | | | | — | | | | — | | | | — | | | | 862,890 | |
Foreign | | H. El Chocón S.A. | | Argentina | | Foreign | | Banco Itau-
Sindicado IV | | Argentina | | Ar$ | | | 36.21 | % | | | 32.11 | % | | Quarterly | | | 144,890 | | | | 742,835 | | | | 887,725 | | | | 787,856 | | | | — | | | | — | | | | — | | | | — | | | | 787,856 | |
Foreign | | H. El Chocón S.A. | | Argentina | | Foreign | | Banco Galicia -
Sindicado IV | | Argentina | | Ar$ | | | 36.21 | % | | | 32.11 | % | | Quarterly | | | 137,990 | | | | 707,462 | | | | 845,452 | | | | 750,339 | | | | — | | | | — | | | | — | | | | — | | | | 750,339 | |
Foreign | | H. El Chocón S.A. | | Argentina | | Foreign | | Banco Hipotecario -
Sindicado IV | | Argentina | | Ar$ | | | 36.21 | % | | | 32.11 | % | | Quarterly | | | 48,297 | | | | 247,612 | | | | 295,909 | | | | 262,618 | | | | — | | | | — | | | | — | | | | — | | | | 262,618 | |
Foreign | | H. El Chocón S.A. | | Argentina | | Foreign | | Banco Ciudad -
Sindicado IV | | Argentina | | Ar$ | | | 36.21 | % | | | 32.11 | % | | Quarterly | | | 20,699 | | | | 106,119 | | | | 126,818 | | | | 112,552 | | | | — | | | | — | | | | — | | | | — | | | | 112,552 | |
Foreign | | H. El Chocón S.A. | | Argentina | | Foreign | | ICB Argentina | | Argentina | | Ar$ | | | 36.21 | % | | | 32.11 | % | | Quarterly | | | 179,387 | | | | 919,701 | | | | 1,099,088 | | | | 975,440 | | | | — | | | | — | | | | — | | | | — | | | | 975,440 | |
| | | | | | | | | | | | | | | | | | | | | | | | | | | | | | | | | | | | | | | | | | | | | | | | | | | | | | | | | | |
| | | | | | | | Total ThCh$ | | | | | | | | | | | | | | | | | 16,785,510 | | | | 17,114,158 | | | | 33,899,668 | | | | 46,650,832 | | | | 17,850,471 | | | | 16,254,959 | | | | 255,432 | | | | 77,750,800 | | | | 158,762,494 | |
| | | | | | | | | | | | | | | | | | | | | | | | | | | | | | | | | | | | | | | | | | | | | | | | | | | | | | | | | | |
F-185
| | | | | | | | | | | | | | | | | | | | | | | | | | | | | | | | | | | | | | | | | | | | | | | | | | | | | | | | | | |
Taxpayer ID No.
(RUT) | | Company | | Country | | ID No.
Financial
Institution | | Financial
Institution | | Country | | Currency | | Effective
Interest
Rate | | | Nominal
Interest
Rate | | | Amortization | | Balance as of 12-31-2013 | |
| | | | | | | | | | | Current | | | Non-current | |
| | | | | | | | | | | Less
than 90
days | | | More
than 90
days | | | Total
Current | | | One to
two
years | | | Two to
three
years | | | Three to
four years | | | Four to
five years | | | More
than five
years | | | Total Non-
current | |
Foreign | | Chinango S.A.C. | | Peru | | Foreign | | Banco Scotiabank | | Peru | | US$ | | | 4.08 | % | | | 3.93 | % | | Quarterly | | | 228,354 | | | | 488,235 | | | | 716,589 | | | | 650,979 | | | | 650,980 | | | | 650,980 | | | | 13,182,334 | | | | — | | | | 15,135,273 | |
Foreign | | Chinango S.A.C. | | Peru | | Foreign | | Bank Of Nova Scotia | | Peru | | US$ | | | 3.07 | % | | | 2.97 | % | | Quarterly | | | 348,176 | | | | 984,344 | | | | 1,332,520 | | | | 1,312,459 | | | | 1,312,458 | | | | 1,312,456 | | | | — | | | | — | | | | 3,937,373 | |
Foreign | | Chinango S.A.C. | | Peru | | Foreign | | Banco Scotiabank | | Peru | | US$ | | | 0.76 | % | | | 0.78 | % | | At maturity | | | 2,099,932 | | | | — | | | | 2,099,932 | | | | — | | | | — | | | | — | | | | — | | | | — | | | | — | |
Foreign | | Edegel S.A.A | | Peru | | Foreign | | Banco Continental | | Peru | | US$ | | | 3.48 | % | | | 3.36 | % | | Quarterly | | | — | | | | 1,312,458 | | | | 1,312,458 | | | | 6,431,047 | | | | 11,680,880 | | | | 12,599,601 | | | | — | | | | — | | | | 30,711,528 | |
Foreign | | Empresa Generadora
de Energía Eléctrica
S.A. | | Colombia | | Foreign | | Banco Corpbanca | | Colombia | | CP | | | 7.88 | % | | | 7.73 | % | | At maturity | | | — | | | | 50,016 | | | | 50,016 | | | | — | | | | — | | | | — | | | | — | | | | 21,761,387 | | | | 21,761,387 | |
Foreign | | Empresa Generadora
de Energía Eléctrica
S.A. | | Colombia | | Foreign | | BBVA Colombia | | Colombia | | CP | | | 7.68 | % | | | 7.54 | % | | At maturity | | | — | | | | 138,223 | | | | 138,223 | | | | — | | | | — | | | | — | | | | — | | | | 61,203,901 | | | | 61,203,901 | |
Foreign | | Endesa Argentina S.A. | | Argentina | | Foreign | | Citibank | | Argentina | | Ar$ | | | 30.40 | % | | | 30.40 | % | | At maturity | | | 798,209 | | | | — | | | | 798,209 | | | | — | | | | — | | | | — | | | | — | | | | — | | | | — | |
Foreign | | Central Costanera S.A. | | Argentina | | Foreign | | Banco Ciudad | | Argentina | | Ar$ | | | 25.59 | % | | | 23.00 | % | | At maturity | | | 99,258 | | | | — | | | | 99,258 | | | | — | | | | — | | | | — | | | | — | | | | — | | | | — | |
Foreign | | Central Costanera S.A. | | Argentina | | Foreign | | Banco Galicia | | Argentina | | Ar$ | | | 35.75 | % | | | 42.24 | % | | At maturity | | | 2,530,765 | | | | — | | | | 2,530,765 | | | | — | | | | — | | | | — | | | | — | | | | — | | | | — | |
Foreign | | Central Costanera S.A. | | Argentina | | Foreign | | Banco Itau | | Argentina | | Ar$ | | | 37.50 | % | | | 44.68 | % | | At maturity | | | 1,075,305 | | | | — | | | | 1,075,305 | | | | — | | | | — | | | | — | | | | — | | | | — | | | | — | |
Foreign | | Central Costanera S.A. | | Argentina | | Foreign | | Banco Nación
Argentina | | Argentina | | Ar$ | | | 18.85 | % | | | 20.57 | % | | At maturity | | | 531,359 | | | | — | | | | 531,359 | | | | — | | | | — | | | | — | | | | �� | | | | — | | | | — | |
Foreign | | Central Costanera S.A. | | Argentina | | Foreign | | Banco Santander Rĺo | | Argentina | | Ar$ | | | 32.00 | % | | | 37.14 | % | | At maturity | | | 658,713 | | | | — | | | | 658,713 | | | | — | | | | — | | | | — | | | | — | | | | — | | | | — | |
Foreign | | Central Costanera S.A. | | Argentina | | Foreign | | Standard Bank | | Argentina | | Ar$ | | | 36.00 | % | | | 42.59 | % | | At maturity | | | 1,154,665 | | | | — | | | | 1,154,665 | | | | — | | | | — | | | | — | | | | — | | | | — | | | | — | |
Foreign | | Central Costanera S.A. | | Argentina | | Foreign | | Banco Supervielle | | Argentina | | Ar$ | | | 35.00 | % | | | 41.21 | % | | At maturity | | | 1,031,807 | | | | — | | | | 1,031,807 | | | | | | | | — | | | | — | | | | — | | | | — | | | | — | |
Foreign | | Central Costanera S.A. | | Argentina | | Foreign | | Citibank | | Argentina | | Ar$ | | | 32.50 | % | | | 37.81 | % | | At maturity | | | 3,450,479 | | | | — | | | | 3,450,479 | | | | — | | | | — | | | | — | | | | — | | | | — | | | | — | |
Foreign | | Central Costanera S.A. | | Argentina | | Foreign | | Credit Suisse
International | | Argentina | | US$ | | | 13.25 | % | | | 13.92 | % | | Quarterly | | | 3,155,920 | | | | — | | | | 3,155,920 | | | | — | | | | — | | | | — | | | | — | | | | — | | | | — | |
Foreign | | Hidroeléctrica El
Chocón S.A. | | Argentina | | Foreign | | Banco Macro | | Argentina | | Ar$ | | | 33.89 | % | | | 30.63 | % | | At maturity | | | 1,651,420 | | | | — | | | | 1,651,420 | | | | — | | | | — | | | | — | | | | — | | | | — | | | | — | |
Foreign | | Hidroeléctrica El
Chocón S.A. | | Argentina | | Foreign | | Deutsche Bank | | Argentina | | US$ | | | 13.35 | % | | | 12.73 | % | | Quarterly | | | 1,634,992 | | | | 2,426,628 | | | | 4,061,620 | | | | 808,876 | | | | — | | | | — | | | | — | | | | — | | | | 808,876 | |
Foreign | | Hidroeléctrica El
Chocón S.A. | | Argentina | | Foreign | | Standard Bank | | Argentina | | US$ | | | 13.35 | % | | | 12.73 | % | | Quarterly | | | 817,499 | | | | 1,213,314 | | | | 2,030,813 | | | | 404,438 | | | | — | | | | — | | | | — | | | | — | | | | 404,438 | |
Foreign | | Hidroeléctrica El
Chocón S.A. | | Argentina | | Foreign | | Banco Itau | | Argentina | | US$ | | | 13.35 | % | | | 12.73 | % | | Quarterly | | | 817,499 | | | | 1,213,314 | | | | 2,030,813 | | | | 404,438 | | | | — | | | | — | | | | — | | | | — | | | | 404,438 | |
Foreign | | Hidroeléctrica El
Chocón S.A. | | Argentina | | Foreign | | Banco Itau | | Argentina | | Ar$ | | | 33.70 | % | | | 29.25 | % | | At maturity | | | 161,254 | | | | — | | | | 161,254 | | | | — | | | | — | | | | — | | | | — | | | | — | | | | — | |
Foreign | | Hidroeléctrica El
Chocón S.A. | | Argentina | | Foreign | | Banco Santander -
Sindicado IV | | Argentina | | Ar$ | | | 41.43 | % | | | 36.19 | % | | Quarterly | | | 100,275 | | | | 498,659 | | | | 598,934 | | | | 2,050,042 | | | | — | | | | — | | | | — | | | | — | | | | 2,050,042 | |
Foreign | | Hidroeléctrica El
Chocón S.A. | | Argentina | | Foreign | | Banco Itau -
Sindicado IV | | Argentina | | Ar$ | | | 41.43 | % | | | 36.19 | % | | Quarterly | | | 91,555 | | | | 455,297 | | | | 546,852 | | | | 1,871,777 | | | | — | | | | — | | | | — | | | | — | | | | 1,871,777 | |
Foreign | | Hidroeléctrica El
Chocón S.A. | | Argentina | | Foreign | | Banco Galicia -
Sindicado IV | | Argentina | | Ar$ | | | 41.43 | % | | | 36.19 | % | | Quarterly | | | 87,195 | | | | 433,616 | | | | 520,811 | | | | 1,782,645 | | | | — | | | | — | | | | — | | | | — | | | | 1,782,645 | |
Foreign | | Hidroeléctrica El
Chocón S.A. | | Argentina | | Foreign | | Banco Hipotecario -
Sindicado IV | | Argentina | | Ar$ | | | 41.43 | % | | | 36.19 | % | | Quarterly | | | 30,519 | | | | 151,766 | | | | 182,285 | | | | 623,926 | | | | — | | | | — | | | | — | | | | — | | | | 623,926 | |
Foreign | | Hidroeléctrica El
Chocón S.A. | | Argentina | | Foreign | | Banco Ciudad -
Sindicado IV | | Argentina | | Ar$ | | | 41.43 | % | | | 36.19 | % | | Quarterly | | | 13,080 | | | | 65,042 | | | | 78,122 | | | | 267,397 | | | | — | | | | — | | | | — | | | | — | | | | 267,397 | |
Foreign | | Hidroeléctrica El
Chocón S.A. | | Argentina | | Foreign | | ICB Argentina | | Argentina | | Ar$ | | | 41.43 | % | | | 36.19 | % | | Quarterly | | | 113,354 | | | | 563,701 | | | | 677,055 | | | | 2,317,438 | | | | — | | | | — | | | | — | | | | — | | | | 2,317,438 | |
| | | | | | | | | | | | | | | | | | | | | | | | | | | | | | | | | | | | | | | | | | | | | | | | | | | | | | | | | | |
| | | | | | | | Total | | | | | | | | | | | | | | | | | | | | | | | | | 32,676,197 | | | | | | | | | | | | | | | | | | | | | | | | 143,280,439 | |
| | | | | | | | | | | | | | | | | | | | | | | | | | | | | | | | | | | | | | | | | | | | | | | | | | | | | | | | | | |
F-186
| | | | | | | | | | | | | | | | | | | | | | | | | | | | | | | | | | | | | | | | | | | | | | | | | | | | | | | | | | | | |
Taxpayer ID No. (RUT) | | Company | | Country | | ID No.
Financial
Institution | | Financial Institution | | Country | | Currency | | | Effective
Interest
Rate | | | Nominal
Interest
Rate | | | Amortization | | Balance as of 1-1-2013 | |
| | | | | | | | | | | Current | | | Non-current | |
| | | | | | | | | | | One to
three
months | | | Three to
twelve
months | | | Total
Current | | | One to
two years | | | Two to
three
years | | | Three to
four years | | | Four to
five years | | | More
than five
years | | | Total Non-
current | |
| | | | | | | | | | | ThCh$ | | | ThCh$ | | | ThCh$ | | | ThCh$ | | | ThCh$ | | | ThCh$ | | | ThCh$ | | | ThCh$ | | | ThCh$ | |
Foreign | | Chinango S.A.C. | | Peru | | Foreign | | Banco Scotiabank | | Peru | | US$ | | | | | 4.07 | % | | | 4.01 | % | | Quarterly | | | 62,786 | | | | 444,835 | | | | 507,621 | | | | 593,114 | | | | 593,114 | | | | 593,114 | | | | 593,114 | | | | 12,010,552 | | | | 14,383,006 | |
Foreign | | Chinango S.A.C. | | Peru | | Foreign | | Bank Of Nova Scotia | | Peru | | US$ | | | | | 3.10 | % | | | 3.06 | % | | Quarterly | | | 18,702 | | | | — | | | | 18,702 | | | | 1,195,794 | | | | 1,195,794 | | | | 1,195,794 | | | | 1,195,794 | | | | — | | | | 4,783,176 | |
Foreign | | Edegel S.A.A | | Peru | | Foreign | | Banco Continental | | Peru | | US$ | | | | | 3.54 | % | | | 3.49 | % | | Quarterly | | | — | | | | — | | | | — | | | | 1,195,794 | | | | 5,859,389 | | | | 10,642,564 | | | | 11,479,620 | | | | — | | | | 29,177,367 | |
Foreign | | Edegel S.A.A | | Peru | | Foreign | | Banco Scotiabank | | Peru | | US$ | | | | | 3.45 | % | | | 3.41 | % | | Quarterly | | | 1,725,270 | | | | — | | | | 1,725,270 | | | | — | | | | — | | | | — | | | | — | | | | — | | | | — | |
Foreign | | Emgesa S.A. E.S.P. | | Colombia | | Foreign | | AV VILLAS | | Colombia | | | CP | | | | 9.41 | % | | | 9.20 | % | | At maturity | | | 162,350 | | | | — | | | | 162,350 | | | | — | | | | — | | | | 7,846,933 | | | | — | | | | — | | | | 7,846,933 | |
Foreign | | Emgesa S.A. E.S.P. | | Colombia | | Foreign | | Bancolombia | | Colombia | | | CP | | | | 9.41 | % | | | 9.20 | % | | At maturity | | | 383,776 | | | | — | | | | 383,776 | | | | — | | | | — | | | | 18,549,169 | | | | — | | | | — | | | | 18,549,169 | |
Foreign | | Emgesa S.A. E.S.P. | | Colombia | | Foreign | | Bancolombia | | Colombia | | | CP | | | | 9.41 | % | | | 9.20 | % | | At maturity | | | 126,712 | | | | — | | | | 126,712 | | | | — | | | | — | | | | 6,124,429 | | | | | | | | — | | | | 6,124,429 | |
Foreign | | Emgesa S.A. E.S.P. | | Colombia | | Foreign | | BBVA Colombia | | Colombia | | | CP | | | | 9.41 | % | | | 9.20 | % | | At maturity | | | 1,037,293 | | | | — | | | | 1,037,293 | | | | — | | | | — | | | | 50,135,818 | | | | — | | | | — | | | | 50,135,818 | |
Foreign | | Endesa Costanera S.A. | | Argentina | | Foreign | | Banco Ciudad | | Argentina | | Ar$ | | | | | 18.64 | % | | | 18.64 | % | | At maturity | | | 395,963 | | | | — | | | | 395,963 | | | | — | | | | — | | | | — | | | | — | | | | — | | | | — | |
Foreign | | Endesa Costanera S.A. | | Argentina | | Foreign | | Banco Galicia | | Argentina | | Ar$ | | | | | 18.75 | % | | | 18.75 | % | | At maturity | | | 3,395,077 | | | | — | | | | 3,395,077 | | | | — | | | | — | | | | — | | | | — | | | | — | | | | — | |
Foreign | | Endesa Costanera S.A. | | Argentina | | Foreign | | Banco Itau | | Argentina | | Ar$ | | | | | 23.75 | % | | | 23.75 | % | | At maturity | | | 1,341,282 | | | | — | | | | 1,341,282 | | | | — | | | | — | | | | — | | | | — | | | | — | | | | — | |
Foreign | | Endesa Costanera S.A. | | Argentina | | Foreign | | Banco Nación Argentina | | Argentina | | Ar$ | | | | | 18.85 | % | | | 18.85 | % | | At maturity | | | 659,346 | | | | 1,881,095 | | | | 2,540,441 | | | | 402,562 | | | | — | | | | — | | | | — | | | | — | | | | 402,562 | |
Foreign | | Endesa Costanera S.A. | | Argentina | | Foreign | | Banco Provincia de Buenos
Aires | | Argentina | | Ar$ | | | | | 18.09 | % | | | 18.09 | % | | At maturity | | | 209,414 | | | | — | | | | 209,414 | | | | — | | | | — | | | | — | | | | — | | | | — | | | | — | |
Foreign | | Endesa Costanera S.A. | | Argentina | | Foreign | | Banco Santander Río | | Argentina | | Ar$ | | | | | 22.00 | % | | | 22.00 | % | | At maturity | | | 878,233 | | | | — | | | | 878,233 | | | | — | | | | — | | | | — | | | | — | | | | — | | | | — | |
Foreign | | Endesa Costanera S.A. | | Argentina | | Foreign | | Standard Bank | | Argentina | | Ar$ | | | | | 21.00 | % | | | 21.00 | % | | At maturity | | | 1,390,448 | | | | — | | | | 1,390,448 | | | | — | | | | — | | | | — | | | | — | | | | — | | | | — | |
Foreign | | Endesa Costanera S.A. | | Argentina | | Foreign | | Banco Supervielle | | Argentina | | Ar$ | | | | | 20.75 | % | | | 20.75 | % | | At maturity | | | 1,239,740 | | | | — | | | | 1,239,740 | | | | — | | | | — | | | | — | | | | — | | | | — | | | | — | |
Foreign | | Endesa Costanera S.A. | | Argentina | | Foreign | | Citibank | | Argentina | | Ar$ | | | | | 17.00 | % | | | 17.00 | % | | At maturity | | | 4,347,020 | | | | — | | | | 4,347,020 | | | | — | | | | — | | | | — | | | | — | | | | — | | | | — | |
Foreign | | Endesa Costanera S.A. | | Argentina | | Foreign | | Credit Suisse International | | Argentina | | US$ | | | | | 11.45 | % | | | 11.45 | % | | Quarterly | | | 5,696,590 | | | | — | | | | 5,696,590 | | | | — | | | | — | | | | — | | | | — | | | | — | | | | — | |
Foreign | | H. El Chocón S.A. | | Argentina | | Foreign | | Banco Ciudad -Sindicado II | | Argentina | | Ar$ | | | | | 26.96 | % | | | 24.11 | % | | Semi-annual | | | 159,475 | | | | 261,271 | | | | 420,746 | | | | 132,576 | | | | — | | | | — | | | | — | | | | — | | | | 132,576 | |
Foreign | | H. El Chocón S.A. | | Argentina | | Foreign | | Banco Galicia -Sindicado II | | Argentina | | Ar$ | | | | | 26.96 | % | | | 24.11 | % | | Semi-annual | | | 199,084 | | | | 326,151 | | | | 525,235 | | | | 165,510 | | | | — | | | | — | | | | — | | | | — | | | | 165,510 | |
Foreign | | H. El Chocón S.A. | | Argentina | | Foreign | | Banco Galicia -Sindicado III | | Argentina | | Ar$ | | | | | 26.95 | % | | | 24.10 | % | | Semi-annual | | | 555,645 | | | | 486,949 | | | | 1,042,594 | | | | 1,460,847 | | | | — | | | | — | | | | — | | | | — | | | | 1,460,847 | |
Foreign | | H. El Chocón S.A. | | Argentina | | Foreign | | Banco Hipotecario | | Argentina | | Ar$ | | | | | 27.64 | % | | | 24.65 | % | | At maturity | | | 339,482 | | | | 324,633 | | | | 664,115 | | | | — | | | | — | | | | — | | | | — | | | | — | | | | — | |
Foreign | | H. El Chocón S.A. | | Argentina | | Foreign | | Banco Hipotecario -
Sindicado II | | Argentina | | Ar$ | | | | | 26.96 | % | | | 24.11 | % | | Semi-annual | | | 199,084 | | | | 326,151 | | | | 525,235 | | | | 165,510 | | | | — | | | | — | | | | — | | | | — | | | | 165,510 | |
Foreign | | H. El Chocón S.A. | | Argentina | | Foreign | | Banco Itau | | Argentina | | US$ | | | | | 8.30 | % | | | 8.06 | % | | Quarterly | | | 379,564 | | | | 1,105,298 | | | | 1,484,862 | | | | 1,842,165 | | | | — | | | | — | | | | — | | | | — | | | | 1,842,165 | |
Foreign | | H. El Chocón S.A. | | Argentina | | Foreign | | Banco Itau - Sindicado II | | Argentina | | Ar$ | | | | | 26.96 | % | | | 24.11 | % | | Semi-annual | | | 248,855 | | | | 407,689 | | | | 656,544 | | | | 206,887 | | | | — | | | | — | | | | — | | | | — | | | | 206,887 | |
Foreign | | H. El Chocón S.A. | | Argentina | | Foreign | | Banco Itau - Sindicado III | | Argentina | | Ar$ | | | | | 26.95 | % | | | 24.10 | % | | Semi-annual | | | 555,645 | | | | 486,949 | | | | 1,042,594 | | | | 1,460,847 | | | | — | | | | — | | | | — | | | | — | | | | 1,460,847 | |
Foreign | | H. El Chocón S.A. | | Argentina | | Foreign | | Banco Macro | | Argentina | | Ar$ | | | | | 18.81 | % | | | 18.00 | % | | At maturity | | | 29,777 | | | | 1,947,796 | | | | 1,977,573 | | | | — | | | | — | | | | — | | | | — | | | | — | | | | — | |
Foreign | | H. El Chocón S.A. | | Argentina | | Foreign | | Banco Santander -
Sindicado III | | Argentina | | Ar$ | | | | | 26.95 | % | | | 24.10 | % | | Semi-annual | | | 555,645 | | | | 486,949 | | | | 1,042,594 | | | | 1,460,847 | | | | — | | | | — | | | | — | | | | — | | | | 1,460,847 | |
Foreign | | H. El Chocón S.A. | | Argentina | | Foreign | | Banco Santander Río | | Argentina | | Ar$ | | | | | 22.42 | % | | | 20.75 | % | | At maturity | | | 98,269 | | | | — | | | | 98,269 | | | | — | | | | — | | | | — | | | | — | | | | — | | | | — | |
Foreign | | H. El Chocón S.A. | | Argentina | | Foreign | | Banco Santander -Sindicado
II | | Argentina | | Ar$ | | | | | 26.96 | % | | | 24.11 | % | | Semi-annual | | | 398,343 | | | | 652,590 | | | | 1,050,933 | | | | 331,165 | | | | — | | | | — | | | | — | | | | — | | | | 331,165 | |
Foreign | | H. El Chocón S.A. | | Argentina | | Foreign | | Deutsche Bank | | Argentina | | US$ | | | | | 8.30 | % | | | 8.06 | % | | Quarterly | | | 759,134 | | | | 2,210,596 | | | | 2,969,730 | | | | 3,684,336 | | | | — | | | | — | | | | — | | | | — | | | | 3,684,336 | |
Foreign | | H. El Chocón S.A. | | Argentina | | Foreign | | Standard Bank | | Argentina | | US$ | | | | | 8.30 | % | | | 8.06 | % | | Quarterly | | | 379,564 | | | | 1,105,298 | | | | 1,484,862 | | | | 1,842,165 | | | | — | | | | — | | | | — | | | | — | | | | 1,842,165 | |
Foreign | | H. El Chocón S.A. | | Argentina | | Foreign | | Standard Bank - Sindicado
III | | Argentina | | US$ | | | | | 26.95 | % | | | 24.10 | % | | Semi-annual | | | 555,645 | | | | 486,949 | | | | 1,042,594 | | | | 1,460,847 | | | | — | | | | — | | | | — | | | | — | | | | 1,460,847 | |
Foreign | | H. El Chocón S.A. | | Argentina | | Foreign | | Standard Bank -Sindicado II | | Argentina | | US$ | | | | | 26.96 | % | | | 24.11 | % | | Semi-annual | | | 547,656 | | | | 897,204 | | | | 1,444,860 | | | | 455,294 | | | | — | | | | — | | | | — | | | | — | | | | 455,294 | |
Foreign | | H. El Chocón S.A. | | Argentina | | Foreign | | Standard Bank | | Argentina | | US$ | | | | | 23.14 | % | | | 21.00 | % | | At maturity | | | 195,452 | | | | — | | | | 195,452 | | | | — | | | | — | | | | — | | | | — | | | | — | | | | — | |
Foreign | | H. El Chocón S.A. | | Argentina | | Foreign | | Banco Macro I | | Argentina | | US$ | | | | | 23.14 | % | | | 21.00 | % | | At maturity | | | 293,468 | | | | — | | | | 293,468 | | | | — | | | | — | | | | — | | | | — | | | | — | | | | — | |
| | | | | | | | | | | | | | | | | | | | | | | | | | | | | | | | | | | | | | | | | | | | | | | | | | | | | | | | | | | | |
| | | | | | | | | | | | | | | | | | | | | | | | | | | 29,519,789 | | | | 13,838,403 | | | | 43,358,192 | | | | 18,056,260 | | | | 7,648,297 | | | | 95,087,821 | | | | 13,268,528 | | | | 12,010,552 | | | | 146,071,456 | |
| | | | | | | | | | | | | | | | | | | | | | | | | | | | | | | | | | | | | | | | | | | | | | | | | | | | | | | | | | | | |
Appendix No.4, letter a), presents details of estimated future cash flows (undiscounted) that the Combined Group will have to disburse to settle the bank loans detailed above.
F-187
| 16.2 | Unsecured liabilities |
The detail of Unsecured Liabilities by currency and maturity as of December 31, 2014, 2013 and January 1, 2013 is as follows:
| | | | | | | | | | | | | | | | | | | | | | | | | | | | | | | | | | | | | | | | | | | | | | | | | | |
| Country | | Cur-
rency | | Effective
Interest
Rate | | | Nominal
Interest
Rate | | | Secured
(Yes/No) | | | Balance as of 12-31-2014 | |
| | | | | | Current | | | Non-current | |
| | | | | | One to
three
months | | | Three to
twelve
months | | | Total
Current | | | One to
two years | | | Two to
three
years | | | Three to
four
years | | | Four
to five
years | | | More than
five years | | | Total Non-
current | |
| | | | | | ThCh$ | | | ThCh$ | | | ThCh$ | | | ThCh$ | | | ThCh$ | | | ThCh$ | | | ThCh$ | | | ThCh$ | | | ThCh$ | |
Peru | | US$ | | | 6.70 | % | | | 6.59 | % | | | No | | | | 4,852,113 | | | | — | | | | 4,852,113 | | | | 12,133,186 | | | | — | | | | 6,066,593 | | | | 4,953,980 | | | | 12,133,186 | | | | 35,286,945 | |
Peru | | Sol | | | 6.40 | % | | | 6.30 | % | | | No | | | | 156,702 | | | | 8,008 | | | | 164,710 | | | | — | | | | — | | | | — | | | | 5,074,099 | | | | 5,074,099 | | | | 10,148,198 | |
Colombia | | CP | | | 8.67 | % | | | 8.45 | % | | | No | | | | 90,659,393 | | | | — | | | | 90,659,393 | | | | — | | | | 43,326,710 | | | | 55,611,108 | | | | 92,241,270 | | | | 593,854,561 | | | | 785,033,649 | |
| | | | | | | | | | | | | | | | | | | | | | | | | | | | | | | | | | | | | | | | | | | | | | | | | | |
| | | | | | | | | | | | | Total | | | | 95,668,208 | | | | 8,008 | | | | 95,676,216 | | | | 12,133,186 | | | | 43,326,710 | | | | 61,677,701 | | | | 102,269,349 | | | | 611,061,846 | | | | 830,468,792 | |
| | | | | | | | | | | | | | | | | | | | | | | | | | | | | | | | | | | | | | | | | | | | | | | | | | |
| | | | | | | | | | | | | | | | | | | | | | | | | | | | | | | | | | | | | | | | | | | | | | | | | | |
| Country | | Cur-
rency | | Effective
Interest
Rate | | | Nominal
Interest
Rate | | | Secured
(Yes/No) | | | Balance as of 12-31-2013 | |
| | | | | | Current | | | Non-current | |
| | | | | | One to
three
months | | | Three to
twelve
months | | | Total
Current | | | One to
two years | | | Two to
three
years | | | Three to
four
years | | | Four to
five
years | | | More than
five years | | | Total Non-
current | |
| | | | | | ThCh$ | | | ThCh$ | | | ThCh$ | | | ThCh$ | | | ThCh$ | | | ThCh$ | | | ThCh$ | | | ThCh$ | | | ThCh$ | |
Peru | | US$ | | | 7.01 | % | | | 6.89 | % | | | No | | | | 862,593 | | | | 5,164,073 | | | | 6,026,666 | | | | 3,336,269 | | | | 10,499,668 | | | | — | | | | 5,249,833 | | | | 14,786,682 | | | | 33,872,452 | |
Peru | | Sol | | | 6.59 | % | | | 6.48 | % | | | No | | | | 5,655,132 | | | | 3,763,999 | | | | 9,419,131 | | | | — | | | | — | | | | — | | | | — | | | | 9,391,474 | | | | 9,391,474 | |
Colombia | | CP | | | 7.32 | % | | | 7.19 | % | | | No | | | | 39,022,019 | | | | 26,251,335 | | | | 65,273,354 | | | | 68,210,526 | | | | — | | | | 46,227,482 | | | | 59,334,333 | | | | 571,635,772 | | | | 745,408,113 | |
| | | | | | | | | | | | | | | | | | | | | | | | | | | | | | | | | | | | | | | | | | | | | | | | | | |
| | | | | | | | | | | | | Total | | | | 45,539,744 | | | | 35,179,407 | | | | 80,719,151 | | | | 71,546,795 | | | | 10,499,668 | | | | 46,227,482 | | | | 64,584,166 | | | | 595,813,928 | | | | 788,672,039 | |
| | | | | | | | | | | | | | | | | | | | | | | | | | | | | | | | | | | | | | | | | | | | | | | | | | |
| | | | | | | | | | | | | | | | | | | | | | | | | | | | | | | | | | | | | | | | | | | | | | | | | | |
| Country | | Currency | | Effective
Interest
Rate | | | Nominal
Interest
Rate | | | Secured
(Yes/No) | | | Balance as of 1-1-2013 | |
| | | | | | Current | | | Non-current | |
| | | | | | One to
three
months | | | Three to
twelve
months | | | Total
Current | | | One to
two years | | | Two to
three
years | | | Three to
four
years | | | Four to
five
years | | | More than
five years | | | Total Non-
current | |
| | | | | | ThCh$ | | | ThCh$ | | | ThCh$ | | | ThCh$ | | | ThCh$ | | | ThCh$ | | | ThCh$ | | | ThCh$ | | | ThCh$ | |
Peru | | US$ | | | 7.01 | % | | | 6.89 | % | | | No | | | | 785,915 | | | | 55,795 | | | | 841,710 | | | | 4,649,246 | | | | 3,039,708 | | | | 9,566,350 | | | | — | | | | 18,255,463 | | | | 35,510,767 | |
Peru | | Sol | | | 6.61 | % | | | 6.50 | % | | | No | | | | 5,114,847 | | | | 9,434,412 | | | | 14,549,259 | | | | 9,059,897 | | | | — | | | | — | | | | — | | | | 9,378,776 | | | | 18,438,673 | |
Colombia | | CP | | | 8.41 | % | | | 8.25 | % | | | No | | | | 26,969,430 | | | | | | | | 26,969,430 | | | | 38,390,487 | | | | 66,775,146 | | | | — | | | | 46,070,752 | | | | 476,994,883 | | | | 628,231,268 | |
| | | | | | | | | | | | | | | | | | | | | | | | | | | | | | | | | | | | | | | | | | | | | | | | | | |
| | | | | | | | | | | | | Total | | | | 32,870,192 | | | | 9,490,207 | | | | 42,360,399 | | | | 52,099,630 | | | | 69,814,854 | | | | 9,566,350 | | | | 46,070,752 | | | | 504,629,122 | | | | 682,180,708 | |
| | | | | | | | | | | | | | | | | | | | | | | | | | | | | | | | | | | | | | | | | | | | | | | | | | |
The detail of secured liabilities by currency and maturity as of December 31, 2014, 2013 and January 1, 2013 is as follows:
| • | | Summary of secured liabilities by currency and maturity |
There are no secured liabilities as of December 31, 2014. The secured liabilities as of December 31, 2013 and January 1, 2013 are as follows:
| | | | | | | | | | | | | | | | | | | | | | | | | | | | | | | | | | | | | | | | | | | | | | | | | | |
| Country | | Currency | | Effective
Interest
Rate | | | Nominal
Interest
Rate | | | Secured
(Yes/No) | | | Balance as of 12-31-2013 | |
| | | | | | Current | | | Non-current | |
| | | | | | One to
three
months | | | Three to
twelve
months | | | Total
Current | | | One to
two years | | | Two to
three
years | | | Three to
four
years | | | Four to
five
years | | | More
than
five
years | | | Total
Non-
current
as | |
| | | | | | ThCh$ | | | ThCh$ | | | ThCh$ | | | ThCh$ | | | ThCh$ | | | ThCh$ | | | ThCh$ | | | ThCh$ | | | ThCh$ | |
Peru | | Sol | | | 6.25 | % | | | 6.16 | % | | | Yes | | | | 4,828,233 | | | | — | | | | 4,828,233 | | | | — | | | | — | | | | — | | | | — | | | | — | | | | — | |
| | | | | | | | | | | | | | | | | | | | | | | | | | | | | | | | | | | | | | | | | | | | | | | | | | |
| | | | | | | | | | | | | Total | | | | 4,828,233 | | | | — | | | | 4,828,233 | | | | — | | | | — | | | | — | | | | — | | | | — | | | | — | |
| | | | | | | | | | | | | | | | | | | | | | | | | | | | | | | | | | | | | | | | | | | | | | | | | | |
| | | | | | | | | | | | | | | | | | | | | | | | | | | | | | | | | | | | | | | | | | | | | | | | |
| Country | | Currency | | Effective
Interest
Rate | | | Nominal
Interest
Rate | | | Secured
(Yes/No) | | | Balance as of 1-1-2013 | |
| | | | | | Current | | | Non-current | |
| | | | | | One to
three
months | | | Three to
twelve
months | | | Total
Current | | | One to
two
years | | | Two to
three
years | | Three to
four
years | | | Four to
five
years | | | More
than
five
years | | | Total
Non-
current
as | |
| | | | | | ThCh$ | | | ThCh$ | | | ThCh$ | | | ThCh$ | | | ThCh$ | | ThCh$ | | | ThCh$ | | | ThCh$ | | | ThCh$ | |
Peru | | Sol | | | 6.41 | % | | | 6.31 | % | | | Yes | | | | 132,316 | | | | 4,748,371 | | | | 4,880,687 | | | | 4,689,387 | | | | | | — | | | | — | | | | — | | | | 4,689,387 | |
| | | | | | | | | | | | | | | | | | | | | | | | | | | | | | | | | | | | | | | | | | | | | | | | |
| | | | | | | | | | | | | Total | | | | 132,316 | | | | 4,748,371 | | | | 4,880,687 | | | | 4,689,387 | | | | | | — | | | | — | | | | — | | | | 4,689,387 | |
| | | | | | | | | | | | | | | | | | | | | | | | | | | | | | | | | | | | | | | | | | | | | | | | |
F-188
| • | | Fair value measurement and hierarchy |
The fair value of current and non-current bond obligations, both secured and unsecured, as of December 31, 2014 totaled ThCh$ 999,933,639 (ThCh$ 1,063,904,520 and ThCh$ 772,288,485 as of December 31, 2013 and January 1, 2013, respectively). During both periods, the obligations have been classified as Level 2 fair values based on the entry data from the valuation techniques used (see Note 3.g).
F-189
| • | | Secured and Unsecured Liabilities by Company |
| | | | | | | | | | | | | | | | | | | | | | | | | | | | | | | | | | | | | | | | | | | | | | | | | | | | | | | | | | | | |
Taxpayer
ID No.
(RUT) | | Company | | Country | | ID No.
Financial
Institution | | Financial
Institution | | Country | | Currency | | Effective
Interest
Rate | | | Nominal
Interest
Rate | | | Secured
(Yes/No) | | | 12-31-2014 | |
| | | | | | | | | | | Current | | | Non-current | |
| | | | | | | | | | | Less than
90 days | | | More than
90 days | | | Total
Current | | | One to
two
years | | | Two to
three
years | | | Three to
four
years | | | Four to
five years | | | More than
five years | | | Total
Non-
current | |
Foreign | | Edegel S.A.A | | Peru | | Foreign | | Banco Continental | | Peru | | Sol | | | 6.41 | % | | | 6.31 | % | | | No | | | | — | | | | 8,008 | | | | 8,008 | | | | — | | | | — | | | | — | | | | — | | | | 5,074,099 | | | | 5,074,099 | |
Foreign | | Edegel S.A.A | | Peru | | Foreign | | Banco Continental | | Peru | | Sol | | | 6.38 | % | | | 6.28 | % | | | No | | | | 156,702 | | | | — | | | | 156,702 | | | | — | | | | — | | | | — | | | | 5,074,099 | | | | — | | | | 5,074,099 | |
Foreign | | Edegel S.A.A | | Peru | | Foreign | | Banco Continental | | Peru | | US$ | | | 6.44 | % | | | 6.34 | % | | | No | | | | 165,699 | | | | — | | | | 165,699 | | | | — | | | | — | | | | — | | | | — | | | | 6,066,593 | | | | 6,066,593 | |
Foreign | | Edegel S.A.A | | Peru | | Foreign | | Banco Continental | | Peru | | US$ | | | 7.93 | % | | | 7.78 | % | | | No | | | | 171,325 | | | | — | | | | 171,325 | | | | — | | | | — | | | | — | | | | 4,953,980 | | | | — | | | | 4,953,980 | |
Foreign | | Edegel S.A.A | | Peru | | Foreign | | Banco Continental | | Peru | | US$ | | | 7.25 | % | | | 7.13 | % | | | No | | | | 3,977,405 | | | | — | | | | 3,977,405 | | | | — | | | | — | | | | — | | | | — | | | | — | | | | — | |
Foreign | | Edegel S.A.A | | Peru | | Foreign | | Banco Scotiabank | | Peru | | US$ | | | 6.73 | % | | | 6.63 | % | | | No | | | | 184,210 | | | | — | | | | 184,210 | | | | 6,066,593 | | | | — | | | | — | | | | — | | | | — | | | | 6,066,593 | |
Foreign | | Edegel S.A.A | | Peru | | Foreign | | Banco Scotiabank | | Peru | | US$ | | | 6.09 | % | | | 6.00 | % | | | No | | | | 100,099 | | | | — | | | | 100,099 | | | | 6,066,593 | | | | — | | | | — | | | | — | | | | — | | | | 6,066,593 | |
Foreign | | Edegel S.A.A | | Peru | | Foreign | | Banco Scotiabank | | Peru | | US$ | | | 6.57 | % | | | 6.47 | % | | | No | | | | 165,694 | | | | — | | | | 165,694 | | | | — | | | | — | | | | 6,066,593 | | | | — | | | | — | | | | 6,066,593 | |
Foreign | | Edegel S.A.A | | Peru | | Foreign | | Banco Scotiabank | | Peru | | US$ | | | 5.86 | % | | | 5.78 | % | | | No | | | | 87,681 | | | | — | | | | 87,681 | | | | — | | | | — | | | | — | | | | — | | | | 6,066,593 | | | | 6,066,593 | |
Foreign | | Emgesa S.A. E.S.P. | | Colombia | | Foreign | | Bonds Series A-10 | | Colombia | | CP | | | 8.21 | % | | | 7.97 | % | | | No | | | | 54,029,298 | | | | — | | | | 54,029,298 | | | | — | | | | — | | | | — | | | | — | | | | — | | | | — | |
Foreign | | Emgesa S.A. E.S.P. | | Colombia | | Foreign | | Bonds Series A102 | | Colombia | | CP | | | 8.21 | % | | | 7.97 | % | | | No | | | | 10,288,151 | | | | — | | | | 10,288,151 | | | | — | | | | — | | | | — | | | | — | | | | — | | | | — | |
Foreign | | Emgesa S.A. E.S.P. | | Colombia | | Foreign | | Bonds Series B-103 | | Colombia | | CP | | | 8.33 | % | | | 8.33 | % | | | No | | | | 3,361,512 | | | | — | | | | 3,361,512 | | | | — | | | | 43,326,710 | | | | — | | | | — | | | | — | | | | 43,326,710 | |
Foreign | | Emgesa S.A. E.S.P. | | Colombia | | Foreign | | Bonds Series B10 | | Colombia | | CP | | | 8.97 | % | | | 8.69 | % | | | No | | | | 530,887 | | | | — | | | | 530,887 | | | | — | | | | — | | | | — | | | | 40,793,373 | | | | — | | | | 40,793,373 | |
Foreign | | Emgesa S.A. E.S.P. | | Colombia | | Foreign | | Bonds Series B15 | | Colombia | | CP | | | 9.29 | % | | | 8.99 | % | | | No | | | | 190,004 | | | | — | | | | 190,004 | | | | — | | | | — | | | | — | | | | — | | | | 14,144,897 | | | | 14,144,897 | |
Foreign | | Emgesa S.A. E.S.P. | | Colombia | | Foreign | | Bonds Series B09-09 | | Colombia | | CP | | | 9.00 | % | | | 8.71 | % | | | No | | | | 1,307,418 | | | | — | | | | 1,307,418 | | | | — | | | | — | | | | 55,611,108 | | | | — | | | | — | | | | 55,611,108 | |
Foreign | | Emgesa S.A. E.S.P. | | Colombia | | Foreign | | Bonds Series B12 | | Colombia | | CP | | | 9.30 | % | | | 9.00 | % | | | No | | | | 547,749 | | | | — | | | | 547,749 | | | | — | | | | — | | | | — | | | | — | | | | 22,830,628 | | | | 22,830,628 | |
Foreign | | Emgesa S.A. E.S.P. | | Colombia | | Foreign | | Foreign Bonds | | Colombia | | CP | | | 10.17 | % | | | 10.17 | % | | | No | | | | 2,180,810 | | | | — | | | | 2,180,810 | | | | — | | | | — | | | | — | | | | — | | | | 22,942,859 | | | | 22,942,859 | |
Foreign | | Emgesa S.A. E.S.P. | | Colombia | | Foreign | | Quimbo Bonds | | Colombia | | CP | | | 10.17 | % | | | 10.17 | % | | | No | | | | 15,671,786 | | | | — | | | | 15,671,786 | | | | — | | | | — | | | | — | | | | — | | | | 163,885,784 | | | | 163,885,784 | |
Foreign | | Emgesa S.A. E.S.P. | | Colombia | | Foreign | | Quimbo Bonds B10 | | Colombia | | CP | | | 6.65 | % | | | 6.49 | % | | | No | | | | 282,892 | | | | — | | | | 282,892 | | | | — | | | | — | | | | — | | | | — | | | | 76,406,981 | | | | 76,406,981 | |
Foreign | | Emgesa S.A. E.S.P. | | Colombia | | Foreign | | Quimbo Bonds B15 | | Colombia | | CP | | | 6.77 | % | | | 6.60 | % | | | No | | | | 191,716 | | | | — | | | | 191,716 | | | | — | | | | — | | | | — | | | | — | | | | 50,934,262 | | | | 50,934,262 | |
Foreign | | Emgesa S.A. E.S.P. | | Colombia | | Foreign | | Quimbo Bonds B12-13 | | Colombia | | CP | | | 8.17 | % | | | 7.93 | % | | | No | | | | 455,387 | | | | — | | | | 455,387 | | | | — | | | | — | | | | — | | | | — | | | | 92,464,960 | | | | 92,464,960 | |
Foreign | | Emgesa S.A. E.S.P. | | Colombia | | Foreign | | Quimbo Bonds B6-13 | | Colombia | | CP | | | 7.40 | % | | | 7.20 | % | | | No | | | | 174,976 | | | | — | | | | 174,976 | | | | — | | | | — | | | | — | | | | 38,854,059 | | | | — | | | | 38,854,059 | |
Foreign | | Emgesa S.A. E.S.P. | | Colombia | | Foreign | | Quimbo Bonds B6-13 | | Colombia | | CP | | | 7.40 | % | | | 7.20 | % | | | No | | | | 56,716 | | | | — | | | | 56,716 | | | | — | | | | — | | | | ��� | | | | 12,593,838 | | | | — | | | | 12,593,838 | |
Foreign | | Emgesa S.A. E.S.P. | | Colombia | | Foreign | | Quimbo Bonds Quimbo B16-14 | | Colombia | | CP | | | 7.30 | % | | | 7.10 | % | | | No | | | | 403,310 | | | | — | | | | 403,310 | | | | — | | | | — | | | | — | | | | — | | | | 41,380,613 | | | | 41,380,613 | |
Foreign | | Emgesa S.A. E.S.P. | | Colombia | | Foreign | | Quimbo Bonds Quimbo B10-14 | | Colombia | | CP | | | 6.97 | % | | | 6.79 | % | | | No | | | | 443,930 | | | | — | | | | 443,930 | | | | — | | | | — | | | | — | | | | — | | | | 47,472,761 | | | | 47,472,761 | |
Foreign | | Emgesa S.A. E.S.P. | | Colombia | | Foreign | | Quimbo Bonds Quimbo B6-14 | | Colombia | | CP | | | 6.54 | % | | | 6.39 | % | | | No | | | | 295,149 | | | | — | | | | 295,149 | | | | — | | | | — | | | | — | | | | — | | | | 33,378,162 | | | | 33,378,162 | |
Foreign | | Emgesa S.A. E.S.P. | | Colombia | | Foreign | | Quimbo Bonds B6-14 | | Colombia | | CP | | | 6.54 | % | | | 6.39 | % | | | No | | | | 247,702 | | | | — | | | | 247,702 | | | | — | | | | — | | | | — | | | | — | | | | 28,012,654 | | | | 28,012,654 | |
| | | | | | | | | | | | | | | | | | | | | | | | | | | | | | | | | | | | | | | | | | | | | | | | | | | | | | | | | | | | |
| | | | | | | | Total ThCh$ | | | | | | | | | | | | | | | | | | | | | | | | | | | 95,676,216 | | | | | | | | | | | | | | | | | | | | | | | | 830,468,792 | |
| | | | | | | | | | | | | | | | | | | | | | | | | | | | | | | | | | | | | | | | | | | | | | | | | | | | | | | | | | | | |
F-190
| | | | | | | | | | | | | | | | | | | | | | | | | | | | | | | | | | | | | | | | | | | | | | | | | | | | | | | | | | | | | | |
Taxpayer ID No. (RUT) | | Company | | Country | | ID No.
Financial
Institution | | Financial Institution | | Country | | Cur-
rency | | | Effec-
tive
Interest
Rate | | | Nomi-
nal
Inte-
rest
Rate | | | Secured
(Yes/
No) | | | 12-31-2013 | |
| | | | | | | | | | | Current | | | Non-current | |
| | | | | | | | | | | Less than
90 days | | | More than
90 days | | | Total
Current | | | One to
two years | | | Two to
three
years | | | Three to
four years | | | Four to
five years | | | More than
five years | | | Total Non-
current | |
Foreign | | Chinango S.A.C. | | Peru | | Foreign | | Banco Continental | | Peru | | | Sol | | | | 6.25 | % | | | 6.16 | % | | | Yes | | | | 4,828,233 | | | | — | | | | 4,828,233 | | | | — | | | | — | | | | — | | | | — | | | | — | | | | — | |
Foreign | | Edegel S.A.A. | | Peru | | Foreign | | Banco Continental | | Peru | | | Sol | | | | 6.70 | % | | | 6.59 | % | | | No | | | | 5,425,591 | | | | — | | | | 5,425,591 | | | | — | | | | — | | | | — | | | | — | | | | — | | | | — | |
Foreign | | Edegel S.A.A. | | Peru | | Foreign | | Banco Continental | | Peru | | | Sol | | | | 6.41 | % | | | 6.31 | % | | | No | | | | — | | | | 7,410 | | | | 7,410 | | | | — | | | | — | | | | — | | | | — | | | | 4,695,737 | | | | 4,695,737 | |
Foreign | | Edegel S.A.A. | | Peru | | Foreign | | Banco Continental | | Peru | | | Sol | | | | 6.38 | % | | | 6.28 | % | | | No | | | | 145,018 | | | | — | | | | 145,018 | | | | — | | | | — | | | | — | | | | — | | | | 4,695,737 | | | | 4,695,737 | |
Foreign | | Edegel S.A.A. | | Peru | | Foreign | | Banco Continental | | Peru | | | Sol | | | | 6.86 | % | | | 6.75 | % | | | No | | | | 84,523 | | | | 3,756,589 | | | | 3,841,112 | | | | — | | | | — | | | | — | | | | — | | | | — | | | | — | |
Foreign | | Edegel S.A.A. | | Peru | | Foreign | | Banco Continental | | Peru | | | US$ | | | | 6.44 | % | | | 6.34 | % | | | No | | | | 143,391 | | | | — | | | | 143,391 | | | | — | | | | — | | | | — | | | | — | | | | 5,249,834 | | | | 5,249,834 | |
Foreign | | Edegel S.A.A. | | Peru | | Foreign | | Banco Continental | | Peru | | | US$ | | | | 9.20 | % | | | 9.00 | % | | | No | | | | — | | | | 5,164,073 | | | | 5,164,073 | | | | — | | | | — | | | | — | | | | — | | | | — | | | | — | |
Foreign | | Edegel S.A.A. | | Peru | | Foreign | | Banco Continental | | Peru | | | US$ | | | | 7.93 | % | | | 7.78 | % | | | No | | | | 148,259 | | | | — | | | | 148,259 | | | | — | | | | — | | | | — | | | | — | | | | 4,287,014 | | | | 4,287,014 | |
Foreign | | Edegel S.A.A. | | Peru | | Foreign | | Banco Continental | | Peru | | | US$ | | | | 7.25 | % | | | 7.13 | % | | | No | | | | 105,649 | | | | — | | | | 105,649 | | | | 3,336,269 | | | | — | | | | — | | | | — | | | | — | | | | 3,336,269 | |
Foreign | | Edegel S.A.A. | | Peru | | Foreign | | Banco Scotiabank | | Peru | | | US$ | | | | 6.73 | % | | | 6.63 | % | | | No | | | | 159,409 | | | | — | | | | 159,409 | | | | — | | | | 5,249,834 | | | | — | | | | — | | | | — | | | | 5,249,834 | |
Foreign | | Edegel S.A.A. | | Peru | | Foreign | | Banco Scotiabank | | Peru | | | US$ | | | | 6.09 | % | | | 6.00 | % | | | No | | | | 86,622 | | | | — | | | | 86,622 | | | | — | | | | 5,249,834 | | | | — | | | | — | | | | — | | | | 5,249,834 | |
Foreign | | Edegel S.A.A. | | Peru | | Foreign | | Banco Scotiabank | | Peru | | | US$ | | | | 6.57 | % | | | 6.47 | % | | | No | | | | 143,386 | | | | — | | | | 143,386 | | | | — | | | | — | | | | — | | | | 5,249,833 | | | | — | | | | 5,249,833 | |
Foreign | | Edegel S.A.A. | | Peru | | Foreign | | Banco Scotiabank | | Peru | | | US$ | | | | 5.86 | % | | | 5.78 | % | | | No | | | | 75,877 | | | | — | | | | 75,877 | | | | — | | | | — | | | | — | | | | — | | | | 5,249,834 | | | | 5,249,834 | |
Foreign | | Empresa Generadora de Energía Eléctrica S.A. | | Colombia | | Foreign | | Bonds Series A5 | | Colombia | | | CP | | | | 5.54 | % | | | 5.43 | % | | | No | | | | 13,546,078 | | | | — | | | | 13,546,078 | | | | — | | | | — | | | | — | | | | — | | | | — | | | | — | |
Foreign | | Empresa Generadora de Energía Eléctrica S.A. | | Colombia | | Foreign | | Bonds Series A10 | | Colombia | | | CP | | | | 8.21 | % | | | 7.97 | % | | | No | | | | 410,041 | | | | — | | | | 410,041 | | | | 57,333,471 | | | | — | | | | — | | | | — | | | | — | | | | 57,333,471 | |
Foreign | | Empresa Generadora de Energía Eléctrica S.A. | | Colombia | | Foreign | | Bonds Series A102 | | Colombia | | | CP | | | | 8.21 | % | | | 7.97 | % | | | No | | | | 78,103 | | | | — | | | | 78,103 | | | | 10,877,055 | | | | — | | | | — | | | | — | | | | — | | | | 10,877,055 | |
Foreign | | Empresa Generadora de Energía Eléctrica S.A. | | Colombia | | Foreign | | Bonds Series B-103 | | Colombia | | | CP | | | | 8.33 | % | | | 8.33 | % | | | No | | | | 2,793,820 | | | | — | | | | 2,793,820 | | | | — | | | | — | | | | 46,227,482 | | | | — | | | | — | | | | 46,227,482 | |
Foreign | | Empresa Generadora de Energía Eléctrica S.A. | | Colombia | | Foreign | | Bonds Series B10 | | Colombia | | | CP | | | | 8.97 | % | | | 8.69 | % | | | No | | | | 452,160 | | | | — | | | | 452,160 | | | | — | | | | — | | | | — | | | | — | | | | 43,524,534 | | | | 43,524,534 | |
Foreign | | Empresa Generadora de Energía Eléctrica S.A. | | Colombia | | Foreign | | Bonds Series B15 | | Colombia | | | CP | | | | 9.29 | % | | | 8.99 | % | | | No | | | | 163,078 | | | | — | | | | 163,078 | | | | — | | | | — | | | | — | | | | — | | | | 15,091,913 | | | | 15,091,913 | |
Foreign | | Empresa Generadora de Energía Eléctrica S.A. | | Colombia | | Foreign | | Bonds Series E5-09 | | Colombia | | | CP | | | | 9.10 | % | | | 8.80 | % | | | No | | | | — | | | | 26,251,335 | | | | 26,251,335 | | | | — | | | | — | | | | — | | | | — | | | | — | | | | — | |
Foreign | | Empresa Generadora de Energía Eléctrica S.A. | | Colombia | | Foreign | | Bonds Series B09-09 | | Colombia | | | CP | | | | 9.00 | % | | | 8.71 | % | | | No | | | | 1,116,939 | | | | — | | | | 1,116,939 | | | | — | | | | — | | | | — | | | | 59,334,333 | | | | — | | | | 59,334,333 | |
Foreign | | Empresa Generadora de Energía Eléctrica S.A. | | Colombia | | Foreign | | Bonds Series B12 | | Colombia | | | CP | | | | 9.30 | % | | | 9.00 | % | | | No | | | | 470,239 | | | | — | | | | 470,239 | | | | — | | | | — | | | | — | | | | — | | | | 24,359,164 | | | | 24,359,164 | |
Foreign | | Empresa Generadora de Energía Eléctrica S.A. | | Colombia | | Foreign | | Foreign Bonds | | Colombia | | | CP | | | | 10.17 | % | | | 10.17 | % | | | No | | | | 2,327,070 | | | | — | | | | 2,327,070 | | | | — | | | | — | | | | — | | | | — | | | | 24,481,561 | | | | 24,481,561 | |
Foreign | | Empresa Generadora de Energía Eléctrica S.A. | | Colombia | | Foreign | | Quimbo Bonds | | Colombia | | | CP | | | | 10.17 | % | | | 10.17 | % | | | No | | | | 16,722,841 | | | | — | | | | 16,722,841 | | | | — | | | | — | | | | — | | | | — | | | | 174,754,259 | | | | 174,754,259 | |
Foreign | | Empresa Generadora de Energía Eléctrica S.A. | | Colombia | | Foreign | | Quimbo Bonds B10 | | Colombia | | | CP | | | | 6.65 | % | | | 6.49 | % | | | No | | | | 222,497 | | | | — | | | | 222,497 | | | | — | | | | — | | | | — | | | | — | | | | 81,524,318 | | | | 81,524,318 | |
Foreign | | Empresa Generadora de Energía Eléctrica S.A. | | Colombia | | Foreign | | Quimbo Bonds B15 | | Colombia | | | CP | | | | 6.77 | % | | | 6.60 | % | | | No | | | | 151,650 | | | | — | | | | 151,650 | | | | — | | | | — | | | | — | | | | — | | | | 54,347,606 | | | | 54,347,606 | |
Foreign | | Empresa Generadora de Energía Eléctrica S.A. | | Colombia | | Foreign | | Quimbo Bonds B12-13 | | Colombia | | | CP | | | | 8.17 | % | | | 7.93 | % | | | No | | | | 379,429 | | | | — | | | | 379,429 | | | | — | | | | — | | | | — | | | | — | | | | 98,661,277 | | | | 98,661,277 | |
Foreign | | Empresa Generadora de Energía Eléctrica S.A. | | Colombia | | Foreign | | Quimbo Bonds B6-13 | | Colombia | | | CP | | | | 7.40 | % | | | 7.20 | % | | | No | | | | 142,037 | | | | — | | | | 142,037 | | | | — | | | | — | | | | — | | | | — | | | | 41,454,410 | | | | 41,454,410 | |
Foreign | | Empresa Generadora de Energía Eléctrica S.A. | | Colombia | | Foreign | | Bonds Series B6-13 | | Colombia | | | CP | | | | 7.40 | % | | | 7.20 | % | | | No | | | | 46,037 | | | | — | | | | 46,037 | | | | — | | | | — | | | | — | | | | — | | | | 13,436,730 | | | | 13,436,730 | |
| | | | | | | | | | | | | | | | | | | | | | | | | | | | | | | | | | | | | | | | | | | | | | | | | | | | | | | | | | | | | | |
| | | | | | | | | | Total | | ThCh$ | | | | | | | | | | | | | | | | | | | | | | | | | 85,547,384 | | | | | | | | | | | | | | | | | | | | | | | | 788,672,039 | |
| | | | | | | | | | | | | | | | | | | | | | | | | | | | | | | | | | | | | | | | | | | | | | | | | | | | | | | | | | | | | | |
F-191
| | | | | | | | | | | | | | | | | | | | | | | | | | | | | | | | | | | | | | | | | | | | | | | | | | | | | | | | | | |
Taxpayer
ID No.
(RUT) | | Company | | Country | | ID No.
Financial
Institution | | Financial Institution | | Country | | Currency | | Effective
Interest
Rate | | | Nominal
Interest
Rate | | | Secured
(Yes/No) | | Balance as of 1-1-2013 | |
| | | | | | | | | | | Current | | | Non-current | |
| | | | | | | | | | | One to
three
months | | | Three to
twelve
months | | | Total
Current | | | One to two
years | | | Two to
three years | | | Three to
four
years | | | Four to
five years | | | More than
five years | | | Total Non-
current | |
| | | | | | | | | | | ThCh$ | | | ThCh$ | | | ThCh$ | | | ThCh$ | | | ThCh$ | | | ThCh$ | | | ThCh$ | | | ThCh$ | | | ThCh$ | |
Foreign | | Chinango S.A.C. | | Peru | | Foreign | | Banco Continental | | Peru | | Sol | | | 6.57 | % | | | 6.47 | % | | Yes | | | — | | | | 4,748,371 | | | | 4,748,371 | | | | — | | | | — | | | | — | | | | — | | | | — | | | | — | |
Foreign | | Chinango S.A.C. | | Peru | | Foreign | | Banco Continental | | Peru | | Sol | | | 6.25 | % | | | 6.16 | % | | Yes | | | 132,316 | | | | — | | | | 132,316 | | | | 4,689,387 | | | | — | | | | — | | | | — | | | | — | | | | 4,689,387 | |
Foreign | | Edegel S.A.A | | Peru | | Foreign | | Banco Continental | | Peru | | US$ | | | 6.57 | % | | | 6.47 | % | | No | | | 130,640 | | | | — | | | | 130,640 | | | | — | | | | — | | | | — | | | | — | | | | 4,783,175 | | | | 4,783,175 | |
Foreign | | Edegel S.A.A | | Peru | | Foreign | | Banco Continental | | Peru | | Sol | | | 6.41 | % | | | 6.31 | % | | No | | | — | | | | 7,400 | | | | 7,400 | | | | — | | | | — | | | | — | | | | — | | | | 4,689,388 | | | | 4,689,388 | |
Foreign | | Edegel S.A.A | | Peru | | Foreign | | Banco Continental | | Peru | | Sol | | | 6.38 | % | | | 6.28 | % | | No | | | 144,821 | | | | — | | | | 144,821 | | | | — | | | | — | | | | — | | | | — | | | | 4,689,388 | | | | 4,689,388 | |
Foreign | | Edegel S.A.A | | Peru | | Foreign | | Banco Continental | | Peru | | Sol | | | 6.86 | % | | | 6.75 | % | | No | | | 84,409 | | | | — | | | | 84,409 | | | | 3,751,510 | | | | — | | | | — | | | | — | | | | — | | | | 3,751,510 | |
Foreign | | Edegel S.A.A | | Peru | | Foreign | | Banco Continental | | Peru | | Sol | | | 6.61 | % | | | 6.50 | % | | No | | | 4,775,750 | | | | — | | | | 4,775,750 | | | | — | | | | — | | | | — | | | | — | | | | — | | | | — | |
Foreign | | Edegel S.A.A | | Peru | | Foreign | | Banco Continental | | Peru | | Sol | | | 6.54 | % | | | 6.44 | % | | No | | | — | | | | 4,722,091 | | | | 4,722,091 | | | | — | | | | — | | | | — | | | | — | | | | — | | | | — | |
Foreign | | Edegel S.A.A | | Peru | | Foreign | | Banco Continental | | Peru | | Sol | | | 6.74 | % | | | 6.63 | % | | No | | | — | | | | 4,704,921 | | | | 4,704,921 | | | | — | | | | — | | | | — | | | | — | | | | — | | | | — | |
Foreign | | Edegel S.A.A | | Peru | | Foreign | | Banco Continental | | Peru | | Sol | | | 6.70 | % | | | 6.59 | % | | No | | | 109,867 | | | | — | | | | 109,867 | | | | 5,308,387 | | | | — | | | | — | | | | — | | | | — | | | | 5,308,387 | |
Foreign | | Edegel S.A.A | | Peru | | Foreign | | Banco Continental | | Peru | | US$ | | | 6.44 | % | | | 6.34 | % | | No | | | 130,645 | | | | — | | | | 130,645 | | | | — | | | | — | | | | — | | | | — | | | | — | | | | — | |
Foreign | | Edegel S.A.A | | Peru | | Foreign | | Banco Continental | | Peru | | US$ | | | 9.20 | % | | | 9.00 | % | | No | | | — | | | | 55,795 | | | | 55,795 | | | | 4,649,246 | | | | — | | | | — | | | | — | | | | 4,783,175 | | | | 9,432,421 | |
Foreign | | Edegel S.A.A | | Peru | | Foreign | | Banco Continental | | Peru | | US$ | | | 7.93 | % | | | 7.78 | % | | No | | | 135,080 | | | | — | | | | 135,080 | | | | — | | | | — | | | | — | | | | — | | | | 3,905,938 | | | | 3,905,938 | |
Foreign | | Edegel S.A.A | | Peru | | Foreign | | Banco Continental | | Peru | | US$ | | | 7.25 | % | | | 7.13 | % | | No | | | 96,257 | | | | — | | | | 96,257 | | | | — | | | | 3,039,708 | | | | — | | | | — | | | | — | | | | 3,039,708 | |
Foreign | | Edegel S.A.A | | Peru | | Foreign | | Banco Scotiabank | | Peru | | US$ | | | 6.74 | % | | | 6.63 | % | | No | | | 145,239 | | | | — | | | | 145,239 | | | | — | | | | — | | | | 4,783,175 | | | | — | | | | — | | | | 4,783,175 | |
Foreign | | Edegel S.A.A | | Peru | | Foreign | | Banco Scotiabank | | Peru | | US$ | | | 6.09 | % | | | 6.00 | % | | No | | | 78,922 | | | | — | | | | 78,922 | | | | — | | | | — | | | | 4,783,175 | | | | — | | | | — | | | | 4,783,175 | |
Foreign | | Edegel S.A.A | | Peru | | Foreign | | Banco Scotiabank | | Peru | | US$ | | | 5.87 | % | | | 5.78 | % | | No | | | 69,132 | | | | — | | | | 69,132 | | | | — | | | | — | | | | — | | | | — | | | | 4,783,175 | | | | 4,783,175 | |
Foreign | | Emgesa S.A. E.S.P. | | Colombia | | Foreign | | Bonds series A-10 | | Colombia | | CP | | | 7.95 | % | | | 7.72 | % | | No | | | 469,671 | | | | — | | | | 469,671 | | | | — | | | | 56,910,929 | | | | — | | | | — | | | | — | | | | 56,910,929 | |
Foreign | | Emgesa S.A. E.S.P. | | Colombia | | Foreign | | Bonds series A102 | | Colombia | | CP | | | 7.95 | % | | | 7.72 | % | | No | | | 89,461 | | | | — | | | | 89,461 | | | | — | | | | 9,864,217 | | | | — | | | | — | | | | — | | | | 9,864,217 | |
Foreign | | Emgesa S.A. E.S.P. | | Colombia | | Foreign | | Bonds series A5 | | Colombia | | CP | | | 8.06 | % | | | 8.06 | % | | No | | | 3,205,705 | | | | — | | | | 3,205,705 | | | | — | | | | — | | | | — | | | | 46,070,752 | | | | — | | | | 46,070,752 | |
Foreign | | Emgesa S.A. E.S.P. | | Colombia | | Foreign | | Bonds series B09-09 | | Colombia | | CP | | | 7.38 | % | | | 7.19 | % | | No | | | 134,607 | | | | — | | | | 134,607 | | | | 13,398,459 | | | | — | | | | — | | | | — | | | | — | | | | 13,398,459 | |
Foreign | | Emgesa S.A. E.S.P. | | Colombia | | Foreign | | Bonds series B10 | | Colombia | | CP | | | 8.71 | % | | | 8.44 | % | | No | | | 511,529 | | | | — | | | | 511,529 | | | | — | | | | — | | | | — | | | | — | | | | 43,376,968 | | | | 43,376,968 | |
Foreign | | Emgesa S.A. E.S.P. | | Colombia | | Foreign | | Bonds series B-103 | | Colombia | | CP | | | 9.03 | % | | | 8.74 | % | | No | | | 183,657 | | | | — | | | | 183,657 | | | | — | | | | — | | | | — | | | | — | | | | 15,040,745 | | | | 15,040,745 | |
Foreign | | Emgesa S.A. E.S.P. | | Colombia | | Foreign | | Bonds series B12 | | Colombia | | CP | | | 9.27 | % | | | 9.27 | % | | No | | | 1,161,554 | | | | — | | | | 1,161,554 | | | | 24,992,028 | | | | — | | | | — | | | | — | | | | — | | | | 24,992,028 | |
Foreign | | Emgesa S.A. E.S.P. | | Colombia | | Foreign | | Bonds series B15 | | Colombia | | CP | | | 8.83 | % | | | 8.56 | % | | No | | | 1,261,346 | | | | — | | | | 1,261,346 | | | | — | | | | — | | | | — | | | | — | | | | 59,133,165 | | | | 59,133,165 | |
Foreign | | Emgesa S.A. E.S.P. | | Colombia | | Foreign | | Bonds series E5-09 | | Colombia | | CP | | | 9.04 | % | | | 8.75 | % | | No | | | 529,504 | | | | — | | | | 529,504 | | | | — | | | | — | | | | — | | | | — | | | | 24,276,576 | | | | 24,276,576 | |
Foreign | | Emgesa S.A. E.S.P. | | Colombia | | Foreign | | Foreign bonds | | Colombia | | CP | | | 10.17 | % | | | 10.17 | % | | No | | | 2,318,404 | | | | — | | | | 2,318,404 | | | | — | | | | — | | | | — | | | | — | | | | 24,390,398 | | | | 24,390,398 | |
Foreign | | Emgesa S.A. E.S.P. | | Colombia | | Foreign | | Quimbo Bonds | | Colombia | | CP | | | 10.17 | % | | | 10.17 | % | | No | | | 16,660,570 | | | | — | | | | 16,660,570 | | | | — | | | | — | | | | — | | | | — | | | | 175,274,820 | | | | 175,274,820 | |
Foreign | | Emgesa S.A. E.S.P. | | Colombia | | Foreign | | Bonds Quimbo B10 | | Colombia | | CP | | | 6.39 | % | | | 6.24 | % | | No | | | 264,062 | | | | — | | | | 264,062 | | | | — | | | | — | | | | — | | | | — | | | | 81,301,327 | | | | 81,301,327 | |
Foreign | | Emgesa S.A. E.S.P. | | Colombia | | Foreign | | Bonds Quimbo B15 | | Colombia | | CP | | | 6.39 | % | | | 6.24 | % | | No | | | 179,360 | | | | — | | | | 179,360 | | | | — | | | | — | | | | — | | | | — | | | | 54,200,884 | | | | 54,200,884 | |
| | | | | | | | | | | | | | | | | | | | | | | | | | | | | | | | | | | | | | | | | | | | | | | | | | | | | | | | | | |
| | | | | | | | | | | | | | | | | | | | | | | | | 33,002,508 | | | | 14,238,578 | | | | 47,241,086 | | | | 56,789,017 | | | | 69,814,854 | | | | 9,566,350 | | | | 46,070,752 | | | | 504,629,122 | | | | 686,870,095 | |
| | | | | | | | | | | | | | | | | | | | | | | | | | | | | | | | | | | | | | | | | | | | | | | | | | | | | | | | | | |
Appendix No. 4, letter b) shows the detail of estimated future cash flows (undiscounted) that the Combined Group will have to disburse to settle the secured and unsecured liabilities detailed above.
F-192
| • | | Detail of Finance Lease Obligations |
| | | | | | | | | | | | | | | | | | | | | | | | | | | | | | | | | | | | | | | | | | | | | | | | | | | | |
Taxpayer
ID No.
(RUT) | | Company | | Country | | ID No.
Financial
Institution | | Financial
Institution | | Country | | Currency | | Nominal
Interest
Rate | | | 12-31-2014 | |
| | | | | | | | | Current | | | Non-current | |
| | | | | | | | | Less
than 90
days | | | More
than
90 days | | | Total
Current | | | One to
two
years | | | Two to
three
years | | | Three to
four
years | | | Four to
five
years | | | More
than five
years | | | Total
Non-
current | |
Foreign | | Edegel S.A.A. | | Peru | | Foreign | | Banco Scotiabank | | Peru | | US$ | | | 1.98 | % | | | 2,122,504 | | | | 6,312,384 | | | | 8,434,888 | | | | 8,416,512 | | | | 13,307,187 | | | | — | | | | — | | | | — | | | | 21,723,699 | |
| | | | | | | | | | | | | | | | | | | | | | | | | | | | | | | | | | | | | | | | | | | | | | | | | | | | |
| | | | | | | | Total | | ThCh$ | | | | | | | | | | | | | | | | | 8,434,888 | | | | | | | | | | | | | | | | | | | | | | | | 21,723,699 | |
| | | | | | | | | | | | | | | | | | | | | | | | | | | | | | | | | | | | | | | | | | | | | | | | | | | | |
| | | | | | | | | | | | | | | | | | | | | | | | | | | | | | | | | | | | | | | | | | | | | | | | | | | | |
Taxpayer
ID No.
(RUT) | | Company | | Country | | ID No.
Financial
Institution | | Financial
Institution | | Country | | Currency | | Nominal
Interest
Rate | | | 12-31-2013 | |
| | | | | | | | | Current | | | Non-current | |
| | | | | | | | | Less
than 90
days | | | More
than
90 days | | | Total
Current | | | One to
two
years | | | Two to
three
years | | | Three to
four
years | | | Four to
five
years | | | More
than five
years | | | Total
Non-
current | |
Foreign | | Edegel S.A.A. | | Peru | | Foreign | | Banco Scotiabank | | Peru | | US$ | | | 1.98 | % | | | 1,347,864 | | | | 3,986,173 | | | | 5,334,037 | | | | 7,283,379 | | | | 7,283,379 | | | | 11,515,608 | | | | — | | | | — | | | | 26,082,366 | |
| | | | | | | | | | | | | | | | | | | | | | | | | | | | | | | | | | | | | | | | | | | | | | | | | | | | |
| | | | | | | | Total | | ThCh$ | | | | | | | | | | | | | | | | | 5,334,037 | | | | | | | | | | | | | | | | | | | | | | | | 26,082,366 | |
| | | | | | | | | | | | | | | | | | | | | | | | | | | | | | | | | | | | | | | | | | | | | | | | | | | | |
| | | | | | | | | | | | | | | | | | | | | | | | | | | | | | | | | | | | | | | | | | | | | | | | | | | | |
Taxpayer
ID No.
(RUT) | | Company | | Country | | ID No.
Financial
Institution | | Financial
Institution | | Country | | Currency | | Nominal
Interest
Rate | | | 1-1-2013 | |
| | | | | | | | | Current | | | Non-current | |
| | | | | | | | | Less
than 90
days | | | More
than
90 days | | | Total
Current | | | One to
two
years | | | Two to
three
years | | | Three to
four
years | | | Four to
five
years | | | More
than five
years | | | Total
Non-
current | |
Foreign | | Edegel S.A.A. | | Peru | | Foreign | | Banco Scotiabank | | Peru | | US$ | | | 2.13 | % | | | 1,231,661 | | | | 3,610,794 | | | | 4,842,455 | | | | 4,842,455 | | | | 6,635,956 | | | | 6,635,957 | | | | 10,491,984 | | | | — | | | | 28,606,352 | |
| | | | | | | | | | | | | | | | | | | | | | | | | | | | | | | | | | | | | | | | | | | | | | | | | | | | |
| | | | | | | | Total | | ThCh$ | | | | | | | | | | | | | | | | | 4,842,455 | | | | | | | | | | | | | | | | | | | | | | | | 28,606,352 | |
| | | | | | | | | | | | | | | | | | | | | | | | | | | | | | | | | | | | | | | | | | | | | | | | | | | | |
Appendix No. 4 letter c) presents details of estimated future cash flows (undiscounted) that the Combined Group will have to disburse to settle the finance lease obligations detailed above.
F-193
| • | | Detail of other obligations |
| | | | | | | | | | | | | | | | | | | | | | | | | | | | | | | | | | | | | | | | | | | | | | | | | | | | |
Tax-
payer
ID No.
(RUT) | | Company | | Country | | ID No.
Financial
Institution | | Financial
Institution | | Country | | Currency | | Nominal
Interest
Rate | | | 12-31-2014 | |
| | | | | | | | | Current | | | Non-current | |
| | | | | | | | | Less
than
90 days | | | More
than
90 days | | | Total
Current | | | One to
two
years | | | Two to
three
years | | | Three to
four
years | | | Four to
five
years | | | More
than five
years | | | Total
Non-
current | |
Foreign | | Central Costanera S.A. | | Argentina | | Foreign | | Mitsubishi (secured debt) | | Argentina | | US$ | | | 7.42 | % | | | — | | | | 2,391,399 | | | | 2,391,399 | | | | 7,362,677 | | | | 7,362,678 | | | | 7,362,678 | | | | 4,532,769 | | | | — | | | | 26,620,802 | |
Foreign | | Central Costanera S.A. | | Argentina | | Foreign | | Others | | Argentina | | Ar$ | | | 17.29 | % | | | — | | | | 3,099,889 | | | | 3,099,889 | | | | — | | | | — | | | | — | | | | — | | | | — | | | | — | |
Foreign | | Hidroinvest S.A. | | Argentina | | Foreign | | Others | | Argentina | | US$ | | | 2.33 | % | | | — | | | | 331,928 | | | | 331,928 | | | | — | | | | — | | | | — | | | | — | | | | — | | | | — | |
Foreign | | Hidroeléctrica El Chocón S.A. | | Argentina | | Foreign | | Others | | Argentina | | Ar$ | | | 23.54 | % | | | 32,719 | | | | — | | | | 32,719 | | | | — | | | | — | | | | — | | | | — | | | | — | | | | — | |
Foreign | | Chinango S.A.C. | | Peru | | Foreign | | Banco Scotiabank | | Peru | | US$ | | | 0.78 | % | | | 513,495 | | | | — | | | | 513,495 | | | | 9,409,124 | | | | — | | | | — | | | | — | | | | — | | | | 9,409,124 | |
| | | | | | | | | | | | | | | | | | | | | | | | | | | | | | | | | | | | | | | | | | | | | | | | | | | | |
| | | | | | | | Total | | ThCh$ | | | | | | | | | | | | | | | | | 6,369,430 | | | | | | | | | | | | | | | | | | | | | | | | 36,029,926 | |
| | | | | | | | | | | | | | | | | | | | | | | | | | | | | | | | | | | | | | | | | | | | | | | | | | | | |
| | | | | | | | | | | | | | | | | | | | | | | | | | | | | | | | | | | | | | | | | | | | | | | | | | | | |
Tax-
payer
ID No.
(RUT) | | Company | | Country | | ID No.
Financial
Institution | | Financial
Institution | | Country | | Currency | | Nominal
Interest
Rate | | | 12-31-2013 | |
| | | | | | | | | Current | | | Non-current | |
| | | | | | | | | Less
than
90 days | | | More
than
90 days | | | Total
Current | | | One to
two
years | | | Two to
three
years | | | Three to
four
years | | | Four to
five
years | | | More
than five
years | | | Total
Non-
current | |
Foreign | | Central Costanera S.A. | | Argentina | | Foreign | | Mitsubishi (secured debt) | | Argentina | | US$ | | | 7.42 | % | | | 73,993,677 | | | | — | | | | 73,993,677 | | | | | | | | — | | | | — | | | | — | | | | — | | | | — | |
Foreign | | Central Costanera S.A. | | Argentina | | Foreign | | Mitsubishi (unsecured debt) | | Argentina | | US$ | | | 7.42 | % | | | 22,907,475 | | | | — | | | | 22,907,475 | | | | | | | | — | | | | — | | | | — | | | | — | | | | — | |
Foreign | | Central Costanera S.A. | | Argentina | | Foreign | | Others | | Argentina | | Ar$ | | | 17.29 | % | | | 3,249,165 | | | | 2,171,469 | | | | 5,420,634 | | | | 1,447,643 | | | | — | | | | — | | | | — | | | | — | | | | 1,447,643 | |
Foreign | | Hidroinvest S.A. | | Argentina | | Foreign | | Others | | Argentina | | US$ | | | 2.33 | % | | | — | | | | 281,066 | | | | 281,066 | | | | | | | | — | | | | — | | | | — | | | | — | | | | — | |
Foreign | | Hidroeléctrica El Chocón S.A. | | Argentina | | Foreign | | Others | | Argentina | | Ar$ | | | 23.54 | % | | | — | | | | — | | | | — | | | | 975,589 | | | | — | | | | — | | | | — | | | | — | | | | 975,589 | |
Foreign | | Chinango S.A.C. | | Peru | | Foreign | | Banco Scotiabank | | Peru | | US$ | | | 0.78 | % | | | 635 | | | | — | | | | 635 | | | | | | | | — | | | | — | | | | — | | | | — | | | | — | |
| | | | | | | | | | | | | | | | | | | | | | | | | | | | | | | | | | | | | | | | | | | | | | | | | | | | |
| | | | | | | | Total | | ThCh$ | | | | | | | | | | | | | | | | | 102,603,487 | | | | | | | | | | | | | | | | | | | | | | | | 2,423,232 | |
| | | | | | | | | | | | | | | | | | | | | | | | | | | | | | | | | | | | | | | | | | | | | | | | | | | | |
| | | | | | | | | | | | | | | | | | | | | | | | | | | | | | | | | | | | | | | | | | | | | | | | | | | | |
Tax- payer
ID No.
(RUT) | | Company | | Country | | ID No.
Financial
Institution | | Financial
Institution | | Country | | Currency | | Nominal
Interest
Rate | | | 1-1-2013 | |
| | | | | | | | | Current | | | Non-current | |
| | | | | | | | | Less
than
90 days | | | More
than
90 days | | | Total
Current | | | One to
two
years | | | Two to
three
years | | | Three to
four
years | | | Four to
five
years | | | More
than five
years | | | Total
Non-
current | |
Foreign | | Central Costanera S.A. | | Argentina | | Foreign | | Mitsubishi (secured debt) | | Argentina | | US$ | | | 0.25 | % | | | 70,025,346 | | | | — | | | | 70,025,346 | | | | — | | | | — | | | | — | | | | — | | | | — | | | | — | |
Foreign | | Central Costanera S.A. | | Argentina | | Foreign | | Mitsubishi (unsecured debt) | | Argentina | | US$ | | | 0.25 | % | | | 14,355,259 | | | | — | | | | 14,355,259 | | | | — | | | | — | | | | — | | | | — | | | | — | | | | — | |
Foreign | | Central Costanera S.A. | | Argentina | | Foreign | | Others | | Argentina | | Ar$ | | | 17.29 | % | | | 1,791,317 | | | | 3,600,814 | | | | 5,392,131 | | | | 5,629,547 | | | | — | | | | — | | | | — | | | | — | | | | 5,629,547 | |
| | | | | | | | | | | | | | | | | | | | | | | | | | | | | | | | | | | | | | | | | | | | | | | | | | | | |
| | | | | | | | Total | | ThCh$ | | | | | | | | | | | | | | | | | 89,772,736 | | | | | | | | | | | | | | | | | | | | | | | | 5,629,547 | |
| | | | | | | | | | | | | | | | | | | | | | | | | | | | | | | | | | | | | | | | | | | | | | | | | | | | |
Appendix No. 4 letter d) presents details of estimated future cash flows (undiscounted) that the Combined Group will have to disburse to settle these Other Obligations.
F-194
As of December 31, 2014, 2013 and January 1, 2013, Combined Group had long-term lines of credit unconditionally available for use amounting to ThCh 20,603,923, ThCh 98,015,705 and ThCh 97,716,700, respectively.
| 17. | RISK MANAGEMENT POLICY |
The Combined Group’s companies are exposed to certain risks that are managed by systems that identify, measure, limit concentration of, and monitor these risks.
The main principles in the Combined Group’s risk management policy include the following:
| • | | Compliance with good corporate governance standards. |
| • | | Strict compliance with all the Combined Group’s internal policies. |
| • | | Each business and corporate area determines: |
| | I. | The markets in which it can operate based on its knowledge and ability to ensure effective risk management. |
| | II. | Criteria regarding counterparts. |
| | III. | Authorized operators. |
| • | | Business and corporate areas establish their risk tolerance in a manner consistent with the defined strategy for each market in which they operate. |
| • | | All of the operations of the businesses and corporate areas are conducted within the limits approved for each case. |
| • | | Businesses, corporate areas, lines of business and companies design the risk management controls necessary to ensure that transactions in the markets are conducted in accordance with the Combined Group policies, standards, and procedures. |
Changes in interest rates affect the fair value of assets and liabilities bearing fixed interest rates, as well as the expected future cash flows of assets and liabilities subject to floating interest rates.
The objective of managing interest rate risk exposure is to achieve a balance in the debt structure to minimize the cost of debt with reduced volatility in profit or loss.
In compliance with the current interest rate hedging policy, the proportion of fixed debt and/or hedged debt over the net total debt was 25% as of December 31, 2014.
Depending on the Combined Group’s estimates and on the objectives of the debt structure, hedging transactions are performed by entering into derivatives contracts that mitigate interest rate risk. Derivative instruments currently used to comply with the risk management policy are interest rate swaps to set floating rate at fixed rate.
The financial debt structure of the Combined Group detailed by fixed and/or hedged and floating interest rate on total net debt, net of hedging derivative instruments, is as follows:
Net position:
| | | | | | | | | | | | |
| | | Balance as of | |
| | | 12-31-2014
% | | | 12-31-2013
% | | | 1-1-2013
% | |
Fixed interest rate | | | 25 | | | | 25 | | | | 25 | |
Floating interest rate | | | 75 | | | | 75 | | | | 75 | |
| | | | | | | | | | | | |
Total | | | 100 | | | | 100 | | | | 100 | |
| | | | | | | | | | | | |
F-195
Exchange rate risks involve basically the following transactions:
| • | | Debt taken on by the Combined Group’s companies that is denominated in a currency other than that in which its cash flows are indexed. |
| • | | Payments to be made for the acquisition of project-related materials in a currency other than that in which its cash flows are indexed. |
| • | | Revenues in Combined Group companies directly linked to changes in currencies other than those of its cash flows. |
| • | | Cash flows from foreign combined entities to parent companies which are exposed to exchange rate fluctuations. |
In order to mitigate exchange rate risk, the Combined Group’s foreign currency risk management policy is based on cash flows and includes maintaining a balance between U.S. dollar flows and the levels of assets and liabilities denominated in this currency. The objective is to minimize the exposure to variability in cash flows that are attributable to foreign exchange risk.
The hedging instruments currently being used to comply with the policy are currency swaps and forward exchange contracts. In addition, the policy seeks to refinance debt in the functional currency of each of the Combined Group’s companies.
The Combined Group’s liquidity risk management policy consists of entering into long-term committed banking facilities and temporary financial investments for amounts that cover the projected needs over a period of time that is determined based on the situation and expectations for debt and capital markets.
The projected needs mentioned above include maturities of financial debt, net of financial derivatives. For further details regarding the features and conditions of financial obligations and financial derivatives, see Notes 16, 18, and Appendix No. 4.
As of December 31, 2014, the Combined Group has liquidity of cash and cash equivalent totaling ThCh$ 298,442,230 (ThCh$ 286,218,693 and ThCh$ 231,325,290 as of December 31, 2013 and January 1, 2013, respectively) and unconditionally available long-term lines of credit totaling ThCh$ 20,603,923 (ThCh$ 98,015,705 and ThCh$ 97,716,700 as of December 31, 2013 and January 1, 2013, respectively).
Management closely monitors credit risk.
Trade receivables:
The credit risk for receivables from the Combined Group’s commercial activity has historically been very low, due to the short-term period of collections from customers, resulting in non-significant cumulative receivables amounts.
In some countries, regulations allow the suspension of energy service to customers with outstanding payments, and most contracts have termination clauses for payment default. Management monitors credit risk on an ongoing basis and measures maximum exposure to payment default risk, which, as stated above, is very low.
Financial assets, other than trade receivables:
Cash surpluses are invested in the highest-rated local and foreign financial entities (with risk rating equivalent to investment grade whenever possible) with thresholds established for each entity.
F-196
Banks that have received investment grade ratings from the three major international rating agencies (Moody’s, S&P, and Fitch) are selected for making investments.
Investments may be backed with treasury bonds from the countries in which the company operates and/or with commercial paper issued by the highest rated banks; the latter are preferred, as they offer higher returns (always in line with current investment policies).
Derivative instruments are entered into with entities with solid creditworthiness; all derivative transactions are performed with entities with investment grade ratings.
The Combined Group measures the Value at Risk (VaR) of its debt positions and financial derivatives in order to monitor the risk assumed by the Combined Group, thereby reducing volatility in the income statement.
The portfolio of positions included in calculating the current Value at Risk consists of the following:
| • | | Hedge derivatives for debt, dividends and projects. |
The VaR determined represents the potential variation in value of the portfolio of positions described above within a quarter with a 95% confidence level. To determine the VaR, we take into account the volatility of the risk variables affecting the value of the portfolio of positions including:
| • | | U.S. dollar Libor interest rate. |
| • | | The different currencies with which our companies operate and the customary local indices used in the banking industry. |
| • | | The exchange rates of the various currencies used in the calculation. |
The calculation of VaR is based on generating possible future scenarios (at one quarter) of market values (both spot and term) for the risk variables, using Bootstrapping simulations. The number of scenarios generated ensures compliance with the simulation convergence criteria. The table of volatilities and correlations between the various risk variables calculated based on the historical values of the logarithmic price returns has been applied to simulate the future price scenario.
Once the price scenarios have been obtained, the fair value of the portfolio is calculated using such scenarios, thereby obtaining a distribution of possible quarterly values. The one-day 95%-confidence VaR number is calculated as the 5% percentile of the potential quarterly variations in the fair value of the portfolio.
Given the aforementioned assumptions, the quarterly VaR of the positions discussed above corresponds to ThCh$139,540,427.
These values represent the potential increase of the Debt and Derivatives’ Portfolio, thus these Values At Risk are inherently related, among other factors, to the Portfolio’s value at each quarter’ end.
F-197
| 18.1 | Financial instruments, classified by type and category |
| a) | The detail of financial assets, classified by type and category, as of December 31, 2014, 2013 and January 1, 2013 is as follows: |
| | | | | | | | | | | | | | | | | | | | | | | | |
| | | Balance as of December 31, 2014 | |
| | Financial
assets held
for trading
ThCh$ | | | Financial assets
at fair
value through
profit or loss
ThCh$ | | | Held-to-maturity
investments
ThCh$ | | | Loans and
receivables
ThCh$ | | | Available-for-sale
financial assets
ThCh$ | | | Financial
derivatives
designated
for hedging
ThCh$ | |
Derivative instruments | | | 2,924,888 | | | | — | | | | — | | | | — | | | | — | | | | 712,883 | |
Other financial assets | | | — | | | | — | | | | 19,747,428 | | | | 142,282,311 | | | | — | | | | — | |
Total current | | | 2,924,888 | | | | — | | | | 19,747,428 | | | | 142,282,311 | | | | — | | | | 712,883 | |
Equity instruments | | | — | | | | — | | | | — | | | | — | | | | 1,200,787 | | | | — | |
Derivative instruments | | | — | | | | — | | | | — | | | | — | | | | — | | | | 16,166 | |
Other financial assets | | | — | | | | — | | | | — | | | | 141,216,512 | | | | — | | | | — | |
Total non-current | | | — | | | | — | | | | — | | | | 141,216,512 | | | | 1,200,787 | | | | 16,166 | |
| | | | | | | | | | | | | | | | | | | | | | | | |
Total | | | 2,924,888 | | | | — | | | | 19,747,428 | | | | 283,498,823 | | | | 1,200,787 | | | | 729,049 | |
| | | | | | | | | | | | | | | | | | | | | | | | |
| | | | | | | | | | | | | | | | | | | | | | | | |
| | | Balance as of December 31, 2013 | |
| | Financial
assets held
for trading
ThCh$ | | | Financial assets
at fair
through profit
or loss
ThCh$ | | | Held-to-maturity
investments
ThCh$ | | | Loans and
receivables
ThCh$ | | | Available-for-sale
financial assets
ThCh$ | | | Financial
derivatives
designated
for hedging
ThCh$ | |
Derivative instruments | | | 1,701,819 | | | | — | | | | — | | | | — | | | | — | | | | 180,399 | |
Other financial assets | | | — | | | | — | | | | — | | | | 179,350,386 | | | | — | | | | — | |
Total current | | | 1,701,819 | | | | — | | | | — | | | | 179,350,386 | | | | — | | | | 180,399 | |
Equity instruments | | | — | | | | — | | | | — | | | | — | | | | 1,283,902 | | | | — | |
Derivative instruments | | | — | | | | — | | | | — | | | | — | | | | — | | | | 16,507 | |
Other financial assets | | | — | | | | — | | | | — | | | | 131,597,410 | | | | — | | | | — | |
Total non-current | | | — | | | | — | | | | — | | | | 131,597,410 | | | | 1,283,902 | | | | 16,507 | |
| | | | | | | | | | | | | | | | | | | | | | | | |
Total | | | 1,701,819 | | | | — | | | | — | | | | 310,947,796 | | | | 1,283,902 | | | | 196,906 | |
| | | | | | | | | | | | | | | | | | | | | | | | |
| | | | | | | | | | | | | | | | | | | | | | | | |
| | | Balance as of January 1, 2013 | |
| | Financial
assets held
for trading
ThCh$ | | | Financial assets
at fair
through profit
or loss
ThCh$ | | | Held-to-maturity
investments
ThCh$ | | | Loans and
receivables
ThCh$ | | | Available-for-sale
financial assets
ThCh$ | | | Financial
derivatives
designated
for hedging
ThCh$ | |
Derivative instruments | | | — | | | | — | | | | — | | | | — | | | | — | | | | 51,876 | |
Other financial assets | | | — | | | | 25,067,909 | | | | — | | | | 117,658,049 | | | | — | | | | — | |
Total current | | | — | | | | 25,067,909 | | | | — | | | | 117,658,049 | | | | — | | | | 51,876 | |
Equity instruments | | | — | | | | — | | | | — | | | | — | | | | 1,242,506 | | | | — | |
Derivative instruments | | | — | | | | — | | | | — | | | | — | | | | — | | | | 524,133 | |
Other financial assets | | | — | | | | — | | | | — | | | | 147,066,310 | | | | — | | | | — | |
Total non-current | | | — | | | | — | | | | — | | | | 147,066,310 | | | | 1,242,506 | | | | 524,133 | |
| | | | | | | | | | | | | | | | | | | | | | | | |
Total | | | — | | | | 25,067,909 | | | | — | | | | 264,724,359 | | | | 1,242,506 | | | | 576,009 | |
| | | | | | | | | | | | | | | | | | | | | | | | |
F-198
| b) | The detail of financial liabilities, classified by type and category, as of December 31, 2014, 2013 and January 1, 2013 is as follows: |
| | | | | | | | |
| | | Balance as of December 31, 2014 | |
| | | Loans and payables | | | Financial derivatives
designated for
hedging | |
| | | ThCh$ | | | ThCh$ | |
Interest-bearing loans | | | 144,380,202 | | | | — | |
Derivative instruments | | | — | | | | 14,658 | |
Other financial liabilities | | | 472,681,627 | | | | — | |
Total current | | | 617,061,829 | | | | 14,658 | |
Interest-bearing loans | | | 1,046,984,911 | | | | — | |
Derivative instruments | | | — | | | | 582,788 | |
Total non-current | | | 1,046,984,911 | | | | 582,788 | |
| | | | | | | | |
Total | | | 1,664,046,740 | | | | 597,446 | |
| | | | | | | | |
| | | | | | | | |
| | | Balance as of December 31, 2013 | |
| | | Loans and payables | | | Financial derivatives
designated for
hedging | |
| | | ThCh$ | | | ThCh$ | |
Interest-bearing loans | | | 226,161,105 | | | | — | |
Derivative instruments | | | — | | | | 310,284 | |
Other financial liabilities | | | 266,722,894 | | | | — | |
Total current | | | 492,883,999 | | | | 310,284 | |
Interest-bearing loans | | | 960,458,076 | | | | — | |
Derivative instruments | | | — | | | | 900,927 | |
Total non-current | | | 960,458,076 | | | | 900,927 | |
| | | | | | | | |
Total | | | 1,453,342,075 | | | | 1,211,211 | |
| | | | | | | | |
| | | | | | | | |
| | | Balance as of January 1, 2013 | |
| | | Loans and payables | | | Financial derivatives
designated for
hedging | |
| | | ThCh$ | | | ThCh$ | |
Interest-bearing loans | | | 185,214,469 | | | | — | |
Derivative instruments | | | — | | | | 883,813 | |
Other financial liabilities | | | 265,361,083 | | | | — | |
Total current | | | 450,575,552 | | | | 883,813 | |
Interest-bearing loans | | | 867,177,450 | | | | — | |
Derivative instruments | | | — | | | | 1,793,139 | |
Total non-current | | | 867,177,450 | | | | 1,793,139 | |
| | | | | | | | |
Total | | | 1,317,753,002 | | | | 2,676,952 | |
| | | | | | | | |
| 18.2 | Derivative instruments |
The risk management policy of the Combined Group primarily uses interest rate and foreign exchange rate derivatives to hedge its exposure to interest rate and foreign currency risks.
The Combined Group classifies its derivatives as follows:
| • | | Derivatives designated for Cash flow hedges: Those that hedge the cash flows of the underlying hedged item. |
| • | | Derivatives designated for Fair value hedges: Those that hedge the fair value of the underlying hedged item. |
F-199
| • | | Non-hedge derivatives: Financial derivatives that do not meet the requirements established by IFRS to be designated as hedge instruments are recognized at fair value through profit or loss (assets held for trading). |
| a) | Assets and liabilities for hedge derivative instruments |
As of December 31, 2014, 2013 and January 1, 2013, financial derivative transactions qualifying as hedge instruments resulted in recognition of the following assets and liabilities in the combined statement of financial position:
| | | | | | | | | | | | | | | | |
| | | Balance as of December 31, 2014 | |
| | Assets | | | Liabilities | |
| | Current
ThCh$ | | | Non-current
ThCh$ | | | Current
ThCh$ | | | Non-current
ThCh$ | |
Interest rate hedges: | | | — | | | | 16,166 | | | | 14,637 | | | | 582,788 | |
Cash flow hedges | | | — | | | | 16,166 | | | | 14,637 | | | | 582,788 | |
Exchange rate hedges: | | | 712,883 | | | | — | | | | 21 | | | | — | |
Cash flow hedges | | | 712,883 | | | | — | | | | 21 | | | | — | |
| | | | | | | | | | | | | | | | |
Total | | | 712,883 | | | | 16,166 | | | | 14,658 | | | | 582,788 | |
| | | | | | | | | | | | | | | | |
| | | | | | | | | | | | | | | | |
| | | Balance as of December 31, 2013 | |
| | Assets | | | Liabilities | |
| | Current
ThCh$ | | | Non-current
ThCh$ | | | Current
ThCh$ | | | Non-current
ThCh$ | |
Interest rate hedges: | | | — | | | | 6,692 | | | | 18,434 | | | | 892,361 | |
Cash flow hedges | | | — | | | | 6,692 | | | | 18,434 | | | | 892,361 | |
Exchange rate hedges: | | | 180,399 | | | | 9,815 | | | | 291,850 | | | | 8,566 | |
Cash flow hedges | | | 180,399 | | | | 9,815 | | | | 291,850 | | | | 8,566 | |
| | | | | | | | | | | | | | | | |
Total | | | 180,399 | | | | 16,507 | | | | 310,284 | | | | 900,927 | |
| | | | | | | | | | | | | | | | |
| | | | | | | | | | | | | | | | |
| | | Balance as of January 1, 2013 | |
| | Assets | | | Liabilities | |
| | Current
ThCh$ | | | Non-current
ThCh$ | | | Current
ThCh$ | | | Non-current
ThCh$ | |
Interest rate hedges: | | | — | | | | — | | | | 29,239 | | | | 1,371,930 | |
Cash flow hedges | | | — | | | | — | | | | 29,239 | | | | 1,371,930 | |
Exchange rate hedges: | | | 51,876 | | | | 524,133 | | | | 854,574 | | | | 421,209 | |
Cash flow hedges | | | 51,876 | | | | 524,133 | | | | 854,574 | | | | 421,209 | |
| | | | | | | | | | | | | | | | |
Total | | | 51,876 | | | | 524,133 | | | | 883,813 | | | | 1,793,139 | |
| | | | | | | | | | | | | | | | |
General information on hedge derivative instruments
Hedge derivative instruments and their corresponding hedged instruments are shown in the following table:
| | | | | | | | | | | | | | | | | | | | |
Detail of hedge instruments | | Description of
hedge
instrument | | Description of instrument hedged | | Fair value of
instruments
hedged
12-31-2014
ThCh$ | | | Fair value of
instruments
hedged
12-31-2013
ThCh$ | | | Fair value of
instruments
hedged
1-1-2013
ThCh$ | | | Type of risks
hedged | |
SWAP | | Interest rate | | Bank borrowings | | | (581,259 | ) | | | (904,103 | ) | | | (1,401,169 | ) | | | Cash flow hedge | |
SWAP | | Exchange rate | | Unsecured liabilities (bonds) | | | 712,862 | | | | (110,202 | ) | | | (699,774 | ) | | | Cash flow hedge | |
For the years ended December 31, 2014 and 2013, the Combined Group has not recognized significant gains or losses for ineffective cash flow hedges.
F-200
| b) | Financial derivative instrument assets and liabilities at fair through profit or loss |
As of December 31, 2014, 2013 and January 1, 2013, financial derivative transactions recognized at fair value through profit or loss, resulted in the recognition of the following assets and liabilities in the statement of financial position:
| | | | | | | | | | | | | | | | |
| | | Non-hedging derivative instruments | |
| | | Current
assets
ThCh$ | | | Current
liabilities
ThCh$ | | | Non-current
assets
ThCh$ | | | Non-current
liabilities
ThCh$ | |
December 31, 2014 | | | 2,924,888 | | | | — | | | | — | | | | — | |
December 31, 2013 | | | 1,701,818 | | | | — | | | | — | | | | — | |
January 1, 2013 | | | — | | | | — | | | | — | | | | — | |
| c) | Other disclosures on derivatives |
The following tables present the fair value of hedging and non-hedging derivatives entered into by the Combined Group as well as the remaining contractual maturities as of December 31, 2014, 2013 and January 1, 2013:
| | | | | | | | | | | | | | | | | | | | |
Financial Derivatives | | Balance as of December 31, 2014 | |
| | Fair Value
ThCh$ | | | Notional Value | |
| | | Less than
one year
ThCh$ | | | 1 – 2 years
ThCh$ | | | 2 – 3 years
ThCh$ | | | Total
ThCh$ | |
Interest rate hedges: | | | (581,259 | ) | | | 7,702,083 | | | | 7,702,083 | | | | 11,296,190 | | | | 26,700,356 | |
Cash flow hedges | | | (581,259 | ) | | | 7,702,083 | | | | 7,702,083 | | | | 11,296,190 | | | | 26,700,356 | |
Exchange rate hedges: | | | 712,862 | | | | 7,029,775 | | | | — | | | | — | | | | 7,029,775 | |
Cash flow hedges | | | 712,862 | | | | 7,029,775 | | | | — | | | | — | | | | 7,029,775 | |
Derivatives not designated for hedge accounting | | | 2,924,888 | | | | 22,242,663 | | | | — | | | | — | | | | 22,242,663 | |
| | | | | | | | | | | | | | | | | | | | |
Total | | | 3,056,491 | | | | 36,974,521 | | | | 7,702,083 | | | | 11,296,190 | | | | 55,972,794 | |
| | | | | | | | | | | | | | | | | | | | |
| | | | | | | | | | | | | | | | | | | | | | | | |
Financial Derivatives | | Balance as of December 31, 2013 | |
| | Fair Value
ThCh$ | | | Notional Value | |
| | | Less than
one year
ThCh$ | | | 1 – 2 years
ThCh$ | | | 2 – 3 years
ThCh$ | | | 3 – 4 years
ThCh$ | | | Total
ThCh$ | |
Interest rate hedges: | | | (904,103 | ) | | | 5,214,027 | | | | 6,659,398 | | | | 6,659,398 | | | | 9,766,945 | | | | 28,299,768 | |
Cash flow hedges | | | (904,103 | ) | | | 5,214,027 | | | | 6,659,398 | | | | 6,659,398 | | | | 9,766,945 | | | | 28,299,768 | |
Exchange rate hedges: | | | (110,202 | ) | | | 22,240,631 | | | | 1,041,243 | | | | — | | | | — | | | | 23,281,874 | |
Cash flow hedges | | | (110,202 | ) | | | 22,240,631 | | | | 1,041,243 | | | | — | | | | — | | | | 23,281,874 | |
Derivatives not designated for hedge accounting | | | 1,701,818 | | | | 96,073,197 | | | | — | | | | — | | | | — | | | | 96,073,197 | |
| | | | | | | | | | | | | | | | | | | | | | | | |
Total | | | 687,513 | | | | 123,527,855 | | | | 7,700,641 | | | | 6,659,398 | | | | 9,766,945 | | | | 147,654,839 | |
| | | | | | | | | | | | | | | | | | | | | | | | |
F-201
| | | | | | | | | | | | | | | | | | | | | | | | | | | | | | | | |
Financial Derivatives | | Balance as of January 1, 2013 | |
| | Fair Value
ThCh$ | | | Notional Value | |
| | | Less than
one year
ThCh$ | | | 1 – 2 years
ThCh$ | | | 2 – 3 years
ThCh$ | | | 3 – 4 years
ThCh$ | | | 4 – 5 years
ThCh$ | | | More than
5 years
ThCh$ | | | Total
ThCh$ | |
Interest rate hedges: | | | (1,401,169 | ) | | | 5,298,212 | | | | 4,770,256 | | | | 6,092,611 | | | | 6,092,611 | | | | 8,935,672 | | | | — | | | | 31,189,362 | |
Cash flow hedges | | | (1,401,169 | ) | | | 5,298,212 | | | | 4,770,256 | | | | 6,092,611 | | | | 6,092,611 | | | | 8,935,672 | | | | — | | | | 31,189,362 | |
Exchange rate hedges: | | | (699,774 | ) | | | 9,407,392 | | | | 8,289,247 | | | | 65,598 | | | | — | | | | — | | | | — | | | | 17,762,237 | |
Cash flow hedges | | | (699,774 | ) | | | 9,407,392 | | | | 8,289,247 | | | | 65,598 | | | | — | | | | — | | | | — | | | | 17,762,237 | |
| | | | | | | | | | | | | | | | | | | | | | | | | | | | | | | | |
Total | | | (2,100,943 | ) | | | 14,705,604 | | | | 13,059,503 | | | | 6,158,209 | | | | 6,092,611 | | | | 8,935,672 | | | | — | | | | 48,951,599 | |
| | | | | | | | | | | | | | | | | | | | | | | | | | | | | | | | |
The hedging and non-hedging derivatives contractual maturities do not represent the Combined Group’s total risk exposure, as the amounts recorded in the above tables have been drawn up based on undiscounted contractual cash inflows and outflows for their settlement.
| a) | Financial instruments recognized at fair value in the combined statement of financial position are classified based on the hierarchy described in Note 3.f.5 above. |
The following table presents financial assets and liabilities measured at fair value as of December 31, 2014, 2013 and January 1, 2013:
| | | | | | | | | | | | | | | | |
| | | | Fair value measured at end of
reporting period using: | |
| | | 12-31-2014 | | | Level 1 | | | Level 2 | | | Level 3 | |
Financial instruments measured at fair value | | ThCh$ | | | ThCh$ | | | ThCh$ | | | ThCh$ | |
Financial Assets | | | | | | | | | | | | | | | | |
Financial derivatives designated as cash flow hedges | | | 729,049 | | | | — | | | | 729,049 | | | | — | |
Financial derivatives not designated for hedge accounting | | | 2,924,888 | | | | — | | | | 2,924,888 | | | | — | |
| | | | | | | | | | | | | | | | |
Total | | | 3,653,937 | | | | — | | | | 3,653,937 | | | | — | |
| | | | | | | | | | | | | | | | |
Financial Liabilities | | | | | | | | | | | | | | | | |
Financial derivatives designated as cash flow hedges | | | 597,446 | | | | — | | | | 597,446 | | | | — | |
| | | | | | | | | | | | | | | | |
Total | | | 597,446 | | | | — | | | | 597,446 | | | | — | |
| | | | | | | | | | | | | | | | |
| | | | | | | | | | | | | | | | |
| | | | Fair value measured at end of
reporting period using: | |
| | | 12-31-2013 | | | Level 1 | | | Level 2 | | | Level 3 | |
Financial instruments measured at fair value | | ThCh$ | | | ThCh$ | | | ThCh$ | | | ThCh$ | |
Financial Assets | | | | | | | | | | | | | | | | |
Financial derivatives designated as cash flow hedges | | | 196,906 | | | | — | | | | 196,906 | | | | — | |
Financial derivatives not designated for hedge accounting | | | 1,701,818 | | | | — | | | | 1,701,818 | | | | — | |
| | | | | | | | | | | | | | | | |
Total | | | 1,898,724 | | | | — | | | | 1,898,724 | | | | — | |
| | | | | | | | | | | | | | | | |
Financial Liabilities | | | | | | | | | | | | | | | | |
Financial derivatives designated as cash flow hedges | | | 1,211,211 | | | | — | | | | 1,211,211 | | | | — | |
| | | | | | | | | | | | | | | | |
Total | | | 1,211,211 | | | | — | | | | 1,211,211 | | | | — | |
| | | | | | | | | | | | | | | | |
F-202
| | | | | | | | | | | | | | | | |
| | | | Fair value measured at end of
reporting period using: | |
| | | 1-1-2013 | | | Level 1 | | | Level 2 | | | Level 3 | |
Financial instruments measured at fair value | | ThCh$ | | | ThCh$ | | | ThCh$ | | | ThCh$ | |
Financial Assets | | | | | | | | | | | | | | | | |
Financial derivatives designated as cash flow hedges | | | 576,009 | | | | — | | | | 576,009 | | | | — | |
Financial assets at fair value through profit or loss | | | 25,067,909 | | | | 25,067,909 | | | | — | | | | — | |
| | | | | | | | | | | | | | | | |
Total | | | 25,643,918 | | | | 25,067,909 | | | | 576,009 | | | | — | |
| | | | | | | | | | | | | | | | |
Financial Liabilities | | | | | | | | | | | | | | | | |
Financial derivatives designated as cash flow hedges | | | 2,676,952 | | | | — | | | | 2,676,952 | | | | — | |
| | | | | | | | | | | | | | | | |
Total | | | 2,676,952 | | | | — | | | | 2,676,952 | | | | — | |
| | | | | | | | | | | | | | | | |
| b) | Financial instruments whose fair value is classified at Level 3 |
The Combined Group is involved in certain operations which require recognition of a financial liability at fair value. The fair value of Level 3 has been calculated by applying a traditional discounted cash flow method. These projected cash flows include assumptions that are primarily based on estimates for prices and levels of energy production and firm capacity, as well as the costs of operating and maintaining certain of the Combined Group’s plants.
None of the possible reasonable scenarios foreseeable in the assumptions mentioned in the above paragraph would result in a significant change in the fair value of the financial instruments included at this level. The fair value of these financial liabilities was ThCh$0 as of December 31, 2014, 2013 and January 1, 2013.
| 19. | TRADE AND OTHER PAYABLES |
The breakdown of trade and other payables as of December 31, 2014, 2013 and January 1, 2013 is as follows:
| | | | | | | | | | | | |
| | | Current | |
Trade and Other Payables | | 12-31-2014
ThCh$ | | | 12-31-2013
ThCh$ | | | 1-1-2013
ThCh$ | |
Trade payables | | | 25,694,778 | | | | 21,892,209 | | | | 32,000,855 | |
Other payables | | | 333,926,073 | | | | 188,667,721 | | | | 168,916,004 | |
| | | | | | | | | | | | |
Total | | | 359,620,851 | | | | 210,559,930 | | | | 200,916,859 | |
| | | | | | | | | | | | |
As of December 31, 2014, 2013 and January 1, 2013 the Combined Group did not have non-current trade and other payables.
The detail of trade and other payables as of December 31, 2014, 2013 and January 1, 2013 is as follows:
| | | | | | | | | | | | |
| | | Current | |
Trade and Other Payables | | 12-31-2014
ThCh$ | | | 12-31-2013
ThCh$ | | | 1-1-2013
ThCh$ | |
Energy suppliers | | | 14,226,815 | | | | 8,685,453 | | | | 11,677,266 | |
Fuel and natural gas suppliers | | | 11,467,963 | | | | 13,206,756 | | | | 20,323,590 | |
Payables for goods and services | | | 91,549,044 | | | | 75,527,296 | | | | 81,747,850 | |
Dividends payable to non-controlling interests | | | 137,780,947 | | | | 49,233,868 | | | | 43,562,588 | |
Mitsubishi contract (LTSA) | | | 34,214,611 | | | | 11,379,023 | | | | 11,906,710 | |
Other payables | | | 70,381,471 | | | | 52,527,534 | | | | 31,698,855 | |
| | | | | | | | | | | | |
Total | | | 359,620,851 | | | | 210,559,930 | | | | 200,916,859 | |
| | | | | | | | | | | | |
See Note 17.3 for the description of the liquidity risk management policy.
F-203
The detail of payments due and paid as of December 31, 2014, 2013 and January 1, 2013 is presented in Appendix 6.
| a) | The breakdown of provisions as of December 31, 2014, 2013 and January 1, 2013 is as follows: |
| | | | | | | | | | | | | | | | | | | | | | | | |
Provisions | | Current | | | Non-current | |
| | 12-31-2014
ThCh$ | | | 12-31-2013
ThCh$ | | | 1-1-2013
ThCh$ | | | 12-31-2014
ThCh$ | | | 12-31-2013
ThCh$ | | | 1-1-2013
ThCh$ | |
Provision for legal proceedings (*) | | | 18,753,051 | | | | 1,953,584 | | | | 2,221,813 | | | | 388,126 | | | | 738,840 | | | | 316,755 | |
Provision for decommissioning and restoration (**) | | | — | | | | — | | | | — | | | | 3,226,928 | | | | 2,841,123 | | | | 2,732,195 | |
Provision for environmental issues | | | 6,689,829 | | | | 12,139,002 | | | | 9,802,203 | | | | 77,383 | | | | — | | | | — | |
Other provisions | | | 1,976,531 | | | | 2,988,124 | | | | 2,938,802 | | | | — | | | | — | | | | — | |
| | | | | | | | | | | | | | | | | | | | | | | | |
Total | | | 27,419,411 | | | | 17,080,710 | | | | 14,962,818 | | | | 3,692,437 | | | | 3,579,963 | | | | 3,048,950 | |
| | | | | | | | | | | | | | | | | | | | | | | | |
| (*) | Provision for legal proceedings as of December 31, 2014 includes provisions of Emgesa (Colombian entities) associated with contracts related to Quimbo project for the amount of ThCh$17,381,792 and paid during 2015 for the amount of ThCh$16,914,262. |
The expected timing and amount of any cash outflows related to the above provisions is uncertain and depends on the final resolution of the provisioned matters (See Note 3.i). For example, in the specific case of the legal proceedings it depends on the final resolution of the related legal claim.
Management considers that the provisions recognized in the Combined Statements of Financial Position adequately cover the related risks.
| b) | Changes in provisions in the years ended December 31, 2014 and 2013 are as follows: |
| | | | | | | | | | | | | | | | | | | | |
Changes in Provisions | | Legal
Proceedings
ThCh$ | | | Decommissioning
and Restoration
ThCh$ | | | Environmental
issues
ThCh$ | | | Other
Provisions
ThCh$ | | | Total
ThCh$ | |
Opening balance as of January 1, 2014 | | | 2,692,424 | | | | 2,841,123 | | | | 12,139,002 | | | | 2,988,124 | | | | 20,660,673 | |
Changes in Provisions | | | | | | | | | | | | | | | | | | | | |
Increase in existing provisions | | | 17,139,243 | | | | — | | | | | | | | 234,682 | | | | 17,373,925 | |
Provisions used | | | (579,586 | ) | | | — | | | | (4,608,836 | ) | | | — | | | | (5,188,422 | ) |
Increase for adjustment to value of money over time | | | — | | | | 155,280 | | | | — | | | | 62,493 | | | | 217,773 | |
Foreign currency translation | | | (110,904 | ) | | | 230,525 | | | | (762,954 | ) | | | (1,308,768 | ) | | | (1,952,101 | ) |
| | | | | | | | | | | | | | | | | | | | |
Total changes in provisions | | | 16,448,753 | | | | 385,805 | | | | (5,371,790 | ) | | | (1,011,593 | ) | | | 10,451,175 | |
| | | | | | | | | | | | | | | | | | | | |
Closing Balance as of December 31, 2014 | | | 19,141,177 | | | | 3,226,928 | | | | 6,767,212 | | | | 1,976,531 | | | | 31,111,848 | |
| | | | | | | | | | | | | | | | | | | | |
F-204
| | | | | | | | | | | | | | | | | | | | |
Changes in Provisions | | Legal
Proceedings
ThCh$ | | | Decommissioning
and Restoration
ThCh$ | | | Environmental
issues
ThCh$ | | | Other
Provisions
ThCh$ | | | Total
ThCh$ | |
Opening balance as of January 1, 2013 | | | 2,538,568 | | | | 2,732,195 | | | | 9,802,203 | | | | 2,938,802 | | | | 18,011,768 | |
Increase in existing provisions | | | 857,272 | | | | — | | | | 2,300,162 | | | | — | | | | 3,157,434 | |
Provisions used | | | (23,642 | ) | | | — | | | | — | | | | (4,811 | ) | | | (28,453 | ) |
Increase for adjustment to value of money over time | | | — | | | | 102,683 | | | | — | | | | 54,712 | | | | 157,395 | |
Foreign currency translation | | | (257,350 | ) | | | 6,245 | | | | 36,637 | | | | 62,498 | | | | (151,970 | ) |
Other increase | | | (422,424 | ) | | | — | | | | — | | | | (63,077 | ) | | | (485,501 | ) |
| | | | | | | | | | | | | | | | | | | | |
Total changes in provisions | | | 153,856 | | | | 108,928 | | | | 2,336,799 | | | | 49,322 | | | | 2,648,905 | |
| | | | | | | | | | | | | | | | | | | | |
Closing Balance as of December 31, 2013 | | | 2,692,424 | | | | 2,841,123 | | | | 12,139,002 | | | | 2,988,124 | | | | 20,660,673 | |
| | | | | | | | | | | | | | | | | | | | |
| 21. | EMPLOYEE BENEFIT OBLIGATIONS |
Endesa Américas and certain combined entities of the Combined Group in Colombia, Peru and Argentina provide various post-employment benefits for all or some of their active or retired employees. These benefits are calculated and recognized in the financial statements according to the criteria described in Note 3.i.1, and include primarily the following:
Complementary pension: The beneficiary is entitled to receive a monthly amount that supplements the pension obtained from the respective social security system.
Employee severance indemnities: The beneficiary receives a certain number of contractual salaries upon retirement. Such benefit is subject to a vesting minimum service requirement period, which depending on the company, varies within a range from 5 to 15 years.
Electricity: The beneficiary receives a monthly bonus to cover a portion of their billed residential electricity consumption.
Health benefit: The beneficiary receives health coverage in addition to that to which they are entitled to under applicable social security regime.
Five-year benefits: A benefit certain employees receive after 5 years; accrues from the second year onwards.
Unemployment: A benefit paid regardless of whether the employee is fired or leaves voluntarily. This benefit accrues on a daily basis and is paid at the time of contract termination (although the law allows for partial withdrawals for housing and education).
Seniority bonuses in Peru: There is an agreement to give workers (“subject to the collective agreement”) an extraordinary bonus for years of service upon completion of the equivalent of five years of actual work. This benefit is given according to the following scale:
| | |
| After 5, 10, and 15 years | | — 1 basic monthly salary |
| After 20 years | | — 1 1⁄2 basic monthly salaries |
| After 25, 30, 35, and 40 years | | — 2 1⁄2 basic monthly salaries |
F-205
| • | | Defined contribution benefits: |
The Combined Group makes contributions to a retirement benefit plan where the beneficiary receives additional pension supplements upon his/her retirement, disability or death.
| 21.2 | Details, changes and presentation in financial statements |
| a) | The post-employment obligations associated with the defined benefits plan as of December 31, 2014, 2013 and January 1, 2013 are as follows: |
| | | | | | | | | | | | |
| | | Balance as of | |
| | | 12-31-2014 | | | 12-31-2013 | | | 1-1-2013 | |
| | ThCh$ | | | ThCh$ | | | ThCh$ | |
Post-employment obligations | | | 24,924,791 | | | | 25,721,273 | | | | 25,359,991 | |
| | | | | | | | | | | | |
Total | | | 24,924,791 | | | | 25,721,273 | | | | 25,359,991 | |
| | | | | | | | | | | | |
Non-current portion | | | 24,924,791 | | | | 25,721,273 | | | | 25,359,991 | |
| | | | | | | | | | | | |
| b) | The following amounts were recognized in the combined statement of comprehensive income for the years ended December 31, 2014 and 2013: |
| | | | | | | | |
Expense Recognized in the Statements of Comprehensive Income | | For the years ended | |
| | 12-31-2014 | | | 12-31-2013 | |
| | ThCh$ | | | ThCh$ | |
Current service cost for defined benefits plan | | | 493,357 | | | | 530,191 | |
Interest cost for defined benefits plan | | | 2,258,362 | | | | 1,746,001 | |
Past service costs | | | — | | | | — | |
| | | | | | | | |
Expenses recognized in the Statement of Income | | | 2,751,719 | | | | 2,276,192 | |
| | | | | | | | |
Gains from remeasurement of defined benefit plans | | | 1,059,671 | | | | 1,886,866 | |
| | | | | | | | |
Total expense recognized in the Statement of Comprehensive Income | | | 3,811,390 | | | | 4,163,058 | |
| | | | | | | | |
| c) | The balance and changes in post-employment defined benefit obligations as of and for the years ended December 31, 2014 and 2013 are as follows: |
| | | | |
Actuarial Value of Post-employment Obligations | | ThCh$ | |
Closing balance as of January 1, 2013 | | | 25,359,991 | |
Current service cost | | | 530,191 | |
Net interest cost | | | 1,746,001 | |
Actuarial losses from changes in financial assumptions | | | 483,129 | |
Actuarial losses from changes in seniority adjustments | | | 1,403,737 | |
Foreign currency translation differences | | | (502,403 | ) |
Contributions paid | | | (3,286,555 | ) |
Other changes | | | (12,818 | ) |
Closing balance as of December 31, 2013 | | | 25,721,273 | |
Current service cost | | | 493,357 | |
Net interest cost | | | 2,258,362 | |
Actuarial losses from changes in financial assumptions | | | 524,052 | |
Actuarial losses from changes in seniority adjustments | | | 535,619 | |
Foreign currency translation differences | | | (1,590,439 | ) |
Contributions paid | | | (3,019,325 | ) |
Other changes | | | 1,892 | |
Closing balance as of December 31, 2014 | | | 24,924,791 | |
F-206
Combined Group companies make no contributions to funds for financing the payment of these benefits.
Actuarial assumptions
As of December 31, 2014, 2013 and January 1, 2013 the following assumptions were used in the actuarial calculation of defined benefits:
| | | | | | | | | | | | | | | | | | | | | | | | |
Key actuarial assumptions used in defined benefit plans | | Chile | | Colombia | | Argentina | | Peru |
| | 12-31-2014 | | 12-31-2013 | | 1-1-2013 | | 12-31-2014 | | 12-31-2013 | | 1-1-2013 | | 12-31-2014 | | 12-31-2013 | | 1-1-2013 | | 12-31-2014 | | 12-31-2013 | | 1-1-2013 |
Discount rates used | | 4.6% | | 5.4% | | 6.0% | | 7.04% | | 7.25% | | 8.00% | | 5.50% | | 5.50% | | 5.50% | | 6.35% | | 6.82% | | 5.55% |
Expected rate of salary increases | | 4.0% | | 3.0% | | 3.0% | | 4.00% | | 4.00% | | 3.5% – 4.0% – 4.5% | | 0.00% | | 0.00% | | 0.00% | | 3.0% | | 3.0% | | 3.0% |
Mortality tables | | RV 2009 | | RV 2004 | | RV 2004 | | RV 2008 | | RV 2008 | | RV 2008 | | RV 2004 | | RV 2004 | | RV 2004 | | RV 2009 | | RV 2004 | | RV 2004 |
As of December 31, 2014, the sensitivity of the value of the actuarial liability for post-employment benefits to variations of 100 basis points in the discount rate assumes a decrease of ThCh$2,125,543 (ThCh$2,148,507 and ThCh$2,300,726 as of December 31, 2013 and January 1, 2013, respectively) if the rate rises and an increase of ThCh$2,533,901 (ThCh$2,568,518 and ThCh$2,750,141 as of December 31, 2013 and January 1, 2013, respectively) if the rate falls.
Defined contributions
The total expense recognized in the combined statement of comprehensive income in the caption “Employee expenses” represents contributions payables to the defined contribution plans by the Combined Group. For the year ended December 31, 2014, the amount recognized as expense was ThCh$586,839 (ThCh$425,242 for the year ended December 31, 2013).
Future disbursements
The estimates available indicate that disbursements for defined benefit plans will increase to ThCh$2,627,246 in the next year (ThCh$3,827,408 and ThCh$2,156,878 as of December 31, 2013 and January 1, 2013, respectively).
Term of commitments
The Combined Group’s obligations have a weighted average length of 10.77 years, and the flow for benefits for the next 5 years and more is expected to be as follows:
| | | | | | | | | | | | |
Years | | Balance as of | |
| | 12-31-2014 | | | 12-31-2013 | | | 1-1-2013 | |
| | ThCh$ | | | ThCh$ | | | ThCh$ | |
1 | | | 2,627,246 | | | | 3,827,408 | | | | 2,156,878 | |
2 | | | 2,277,837 | | | | 3,615,923 | | | | 1,724,692 | |
3 | | | 2,155,552 | | | | 3,866,864 | | | | 1,665,840 | |
4 | | | 2,446,033 | | | | 3,879,207 | | | | 1,526,237 | |
5 | | | 2,182,707 | | | | 4,145,667 | | | | 1,392,967 | |
More than 5 | | | 14,316,847 | | | | 25,162,032 | | | | 16,645,081 | |
| 22.1 | Net assets (Combined financial statements) |
As stated in Note 2.1 “Basis of preparation” Endesa Américas S.A. was not a group for Consolidated Financial Statements reporting purposes in accordance with IFRS 10 Consolidated Financial Statements and was presented on the basis of the aggregation of the net assets of the legal entities of Endesa Chile group located outside of Chile. The Combined Group currently does not have any subscribed or issued capital.
F-207
| 22.2 | Foreign currency translation reserves |
The following table details currency translation adjustments attributable to the Parent Company of the Combined Group. for the years ended December 31, 2014 and 2013:
| | | | | | | | |
Reserves for Accumulated Currency Translation Differences | | For the years ended | |
| | December 31,
2014
ThCh$ | | | December 31,
2013
ThCh$ | |
Emgesa | | | 69,075,372 | | | | 89,562,631 | |
Generandes Perú | | | 69,304,036 | | | | 38,809,462 | |
Hidroeléctrica el Chocón | | | (53,592,630 | ) | | | (46,868,871 | ) |
Endesa Argentina | | | (13,561,202 | ) | | | (13,287,564 | ) |
Endesa Costanera | | | 10,185,346 | | | | 7,083,247 | |
Endesa Brasil | | | (105,465,588 | ) | | | (122,479,241 | ) |
Others | | | (4,276,977 | ) | | | (3,717,685 | ) |
| | | | | | | | |
TOTAL | | | (28,331,643 | ) | | | (50,898,021 | ) |
| | | | | | | | |
| 22.3 | Restrictions on combined entities transferring funds to the parent |
Certain of the Combined Group’s entities must comply with financial ratio covenants which require them to have a minimum level of equity or other requirements that restrict the transfer of assets to the parent company. The Combined Group’s restricted net assets as of December 31, 2014 from its combined entities Edegel and Chocón are ThCh$76,179,011 and ThCh$56,298,520, respectively.
Other reserves within Equity attributable to the Parent Company of the Combined Group for the years ended December 31, 2014 and 2013 are as follows:
| | | | | | | | | | | | |
| | | Balance as of
January 1,
2014
ThCh$ | | | 2014
Changes
ThCh$ | | | Balance as of
December 31,
2014
ThCh$ | |
Exchange differences on translation | | | (50,898,021 | ) | | | 22,566,378 | | | | (28,331,643 | ) |
Cash flow hedges | | | 2,118,519 | | | | (4,110,207 | ) | | | (1,991,688 | ) |
Other miscellaneous reserves | | | (760,605,537 | ) | | | (59,905,655 | ) | | | (820,511,192 | ) |
| | | | | | | | | | | | |
TOTAL | | | (809,383,965 | ) | | | (41,449,484 | ) | | | (850,834,523 | ) |
| | | | | | | | | | | | |
| | | |
| | | Balance as of
January 1,
2013
ThCh$ | | | 2013
Changes
ThCh$ | | | Balance as of
December 31,
2013
ThCh$ | |
Exchange differences on translation | | | (18,394,521 | ) | | | (32,503,500 | ) | | | (50,898,021 | ) |
Cash flow hedges | | | 7,565,902 | | | | (5,447,383 | ) | | | 2,118,519 | |
Other miscellaneous reserves | | | (724,055,318 | ) | | | (36,550,219 | ) | | | (760,605,537 | ) |
| | | | | | | | | | | | |
TOTAL | | | (734,883,937 | ) | | | (74,501,102 | ) | | | (809,385,039 | ) |
| | | | | | | | | | | | |
| • | | Reserves for Exchange differences on translation: These arise primarily from exchange differences relating to: |
| • | | Translation of the financial statements of our foreign operations from their functional currencies to our presentation currency (i.e. Chilean peso) (see Note 3.k); |
| • | | Translation of goodwill arising from the acquisition of foreign operations with a functional currency other than the Chilean peso (see Note 3.b). |
F-208
| • | | Cash flow hedges reserves: These represent the cumulative portion of gains and losses on hedging instruments deemed effective in cash flow hedges (see Note 3.f.4). |
| • | | Remeasurement of available-for-sale financial assets: These represent variations in fair value, net of their effect on the available-for-sale investments (see Note 3.f.1). |
| • | | Other miscellaneous reserves: |
Other miscellaneous reserves primarily include the following as of December 31, 2014, 2013 and January 1, 2013:
| (i). | In accordance with Official Bulletin (Oficio Circular) No. 456 from issued by the Chilean Superintendence of Securities and Insurance, this caption records the price-level adjustment of cumulative paid-in capital from the date of the transition to IFRS, January 1, 2004, to December 31, 2008. |
| | Please note that, while the Combined Group adopted the IFRS as its statutory accounting standards on January 1, 2009, the date of transition to that international standard used was January 1, 2004. This results from applying the exemption for that purpose in IFRS 1, “First Time Adoption”. |
| (ii). | Foreign currency translation differences existing at the time of transition to IFRS (IFRS 1 exemption, First Time Adoption). |
| (iii). | The effects of business combinations under common control, arising primarily from the creation of the holding company Enel Brasil S.A. in 2005 and the merger of our Colombian combined entities Emgesa and Betania in 2007. |
| 22.5 | Non-controlling interests |
| | | | | | | | | | | | | | | | | | | | | | | | |
| | | | | | Non-controlling Interests
(% financial interest) | |
| | | | | | Equity | | | Profit (Loss) | |
| Companies | | Non-controlling
interests | | | 12-31-2014
ThCh$ | | | 12-31-2013
ThCh$ | | | 1-1-2013
ThCh$ | | | 12-31-2014
ThCh$ | | | 12-31-2013
ThCh$ | |
Emgesa S.A. E.S.P. | | | 73.13 | % | | | 536,351,255 | | | | 686,990,638 | | | | 666,924,919 | | | | 211,210,105 | | | | 168,793,015 | |
Generandes Perú S.A. | | | 39.00 | % | | | 116,762,865 | | | | 105,507,715 | | | | 103,810,129 | | | | 22,882,930 | | | | 17,074,639 | |
Edegel S.A.A. | | | 16.40 | % | | | 90,506,207 | | | | 81,809,239 | | | | 61,082,646 | | | | 17,790,998 | | | | 13,397,572 | |
Chinango S.A.C. | | | 20.00 | % | | | 14,707,216 | | | | 12,810,412 | | | | 32,238,489 | | | | 3,002,284 | | | | 2,033,307 | |
Central Costanera S.A. | | | 24.32 | % | | | 5,197,207 | | | | (6,822,454 | ) | | | (18,741,352 | ) | | | 11,072,950 | | | | (7,538,477 | ) |
Hidroeléctrica El Chocón S.A. | | | 32.33 | % | | | 26,841,549 | | | | 26,167,780 | | | | 29,800,992 | | | | 3,538,006 | | | | 3,557,468 | |
Others | | | | | | | 1,980,163 | | | | 1,935,307 | | | | 152,002 | | | | 256,053 | | | | 239,049 | |
| | | | | | | | | | | | | | | | | | | | | | | | |
TOTAL | | | | | | | 792,346,462 | | | | 908,398,637 | | | | 875,267,825 | | | | 269,753,326 | | | | 197,556,573 | |
| | | | | | | | | | | | | | | | | | | | | | | | |
F-209
| 23. | REVENUE AND OTHER INCOME |
The detail of revenues presented in the statement of comprehensive income for the years ended December 31, 2014 and 2013 is as follows:
| | | | | | | | |
Revenues | | For the years ended | |
| | 12-31-2014
ThCh$ | | | 12-31-2013
ThCh$ | |
Energy sales | | | 1,085,422,840 | | | | 984,879,971 | |
Generation | | | 1,085,422,840 | | | | 984,879,971 | |
Regulated customers | | | 166,599,553 | | | | 153,107,195 | |
Non-regulated customers | | | 658,206,673 | | | | 605,123,358 | |
Spot market sales | | | 237,107,416 | | | | 198,576,158 | |
Other customers | | | 23,509,198 | | | | 28,073,260 | |
Other sales | | | 476,853 | | | | — | |
Natural gas sales | | | 476,853 | | | | — | |
Revenue from other services | | | 68,514,547 | | | | 12,752,543 | |
Tolls and transmission | | | 51,448,733 | | | | 6,094,776 | |
Engineering services | | | 3,229,708 | | | | 5,006,203 | |
Other services | | | 13,836,106 | | | | 1,651,564 | |
| | | | | | | | |
Total operating revenue | | | 1,154,414,240 | | | | 997,632,514 | |
| | | | | | | | |
| | | | | | | | |
Other Operating Income | | For the years ended | |
| | 12-31-2014
ThCh$ | | | 12-31-2013
ThCh$ | |
Other revenue (*) | | | 61,145,248 | | | | 59,762,114 | |
| | | | | | | | |
Total other operating income | | | 61,145,248 | | | | 59,762,114 | |
| | | | | | | | |
| (*) | For the year ended December 31, 2014, includes ThCh$39,282,571 (ThCh$33,846,438 and December 31, 2013) from new availability agreements in effect starting in December 2012 between our subsidiary Central Costanera S.A. and CAMMESA. |
| 24. | RAW MATERIALS AND CONSUMABLES USED |
The detail of raw materials and consumables presented in profit or loss for the years ended December 31, 2014 and 2013 is as follows:
| | | | | | | | |
Raw Materials and Consumables | | For the years ended | |
| | 12-31-2014
ThCh$ | | | 12-31-2013
ThCh$ | |
Energy purchases | | | (108,348,536 | ) | | | (113,257,831 | ) |
Fuel consumption | | | (100,755,311 | ) | | | (96,236,839 | ) |
Transportation costs | | | (103,553,233 | ) | | | (84,159,191 | ) |
Other raw materials and consumables | | | (56,584,448 | ) | | | (42,323,777 | ) |
| | | | | | | | |
Total | | | (369,241,528 | ) | | | (335,977,638 | ) |
| | | | | | | | |
F-210
| 25. | EMPLOYEE BENEFITS EXPENSE |
Employee expenses recognized in profit or loss for the years ended December 31, 2014 and 2013 are as follows:
| | | | | | | | |
Employee Benefits Expense | | For the years ended | |
| | 12-31-2014
ThCh$ | | | 12-31-2013
ThCh$ | |
Wages and salaries | | | (57,153,307 | ) | | | (46,023,568 | ) |
Post-employment benefit obligations expense | | | (1,080,196 | ) | | | (955,433 | ) |
Social security and other contributions | | | (11,563,083 | ) | | | (12,945,061 | ) |
Other employee expenses | | | (248,283 | ) | | | (224,857 | ) |
| | | | | | | | |
Total | | | (70,044,869 | ) | | | (60,148,919 | ) |
| | | | | | | | |
| 26. | DEPRECIATION, AMORTIZATION AND IMPAIRMENT LOSSES |
The detail of depreciation, amortization and impairment losses recognized in profit or loss for the years ended December 31, 2014 and 2013 is as follows:
| | | | | | | | |
| | | For the years ended | |
| | 12-31-2014
ThCh$ | | | 12-31-2013
ThCh$ | |
Depreciation | | | (98,785,594 | ) | | | (95,674,678 | ) |
Amortization | | | (5,050,741 | ) | | | (1,379,657 | ) |
Total depreciation and amortization | | | (103,836,335 | ) | | | (97,054,335 | ) |
Reversal (losses) from impairment (*) | | | (2,057,856 | ) | | | (6,523,091 | ) |
| | | | | | | | |
Total depreciation and amortization and impairment losses | | | (105,894,191 | ) | | | (103,577,426 | ) |
| | | | | | | | |
| | | | | | | | |
(*) Impairment Losses | | For the years ended | |
| | 12-31-2014
ThCh$ | | | 12-31-2013
ThCh$ | |
Impairment reversal (loss) on financial assets (see Note 7) | | | (869,239 | ) | | | 76,227 | |
Impairment reversal (loss) on property, plant and equipment (see Note 14) | | | (1,188,617 | ) | | | (6,599,318 | ) |
| | | | | | | | |
Total | | | (2,057,856 | ) | | | (6,523,091 | ) |
| | | | | | | | |
F-211
Other miscellaneous operating expenses for the years ended December 31, 2014 and 2013 are as follows:
| | | | | | | | |
Other Expenses | | For the years ended | |
| | 12-31-2014
ThCh$ | | | 12-31-2013
ThCh$ | |
Professional, outsourced and other services | | | (12,628,535 | ) | | | (8,304,552 | ) |
Other supplies and services | | | (8,915,875 | ) | | | (8,336,771 | ) |
Insurance premiums | | | (13,507,356 | ) | | | (10,518,069 | ) |
Taxes and charges | | | (2,242,872 | ) | | | (7,731,180 | ) |
Repairs and maintenance | | | (11,971,605 | ) | | | (11,696,692 | ) |
Marketing, public relations and advertising | | | (334,152 | ) | | | (338,765 | ) |
Leases and rental costs | | | (1,525,709 | ) | | | (1,119,001 | ) |
Environmental expenses | | | (975,993 | ) | | | (417,966 | ) |
Other supplies | | | (5,721,478 | ) | | | (2,827,161 | ) |
Travel expenses | | | (517,295 | ) | | | (389,286 | ) |
Indemnities and fines | | | (1,695,148 | ) | | | (861,232 | ) |
| | | | | | | | |
Total | | | (60,036,018 | ) | | | (52,540,675 | ) |
| | | | | | | | |
Financial income and costs for the years ended December 31, 2014 and 2013 are as follows:
| | | | | | | | |
Financial Income | | For the years ended | |
| | 12-31-2014
ThCh$ | | | 12-31-2013
ThCh$ | |
Term deposits and other fixed-income investments | | | 12,612,215 | | | | 11,863,619 | |
Other financial income | | | 81,355,382 | | | | 3,273,847 | |
| | | | | | | | |
Total | | | 93,967,597 | | | | 15,137,466 | |
| | | | | | | | |
| | | | | | | | |
Financial Costs | | For the years ended | |
| | 12-31-2014
ThCh$ | | | 12-31-2013
ThCh$ | |
Financial costs | | | (65,211,336 | ) | | | (66,695,425 | ) |
Bank loans | | | (16,616,920 | ) | | | (17,550,897 | ) |
Secured and unsecured liabilities | | | (78,729,951 | ) | | | (55,830,043 | ) |
Valuation of financial derivatives | | | (439,151 | ) | | | (473,911 | ) |
Provisions | | | 645,130 | | | | — | |
Post-employment benefit obligations | | | (2,258,362 | ) | | | (1,746,002 | ) |
Capitalized borrowing costs | | | 40,012,531 | | | | 23,519,951 | |
Other financial costs (*) | | | (7,824,613 | ) | | | (14,614,523 | ) |
Foreign currency exchange losses, net (1) | | | (20,192,761 | ) | | | (11,576,858 | ) |
Positive | | | 26,949,322 | | | | 33,457,324 | |
Negative | | | (47,142,083 | ) | | | (45,034,182 | ) |
| | | | | | | | |
Total Financial Costs | | | (85,404,097 | ) | | | (78,272,283 | ) |
| | | | | | | | |
Total Financial Results | | | 8,563,500 | | | | (63,134,817 | ) |
| | | | | | | | |
| (*) | On December 31, 2014 our combined subsidiary Central Costanera S.A. was forgiven interest owed to Mitsubish and the present value of the Mitsubishi debt amounting to ThCh$84,534,955, under a restructuring agreement for this debt. The main conditions of the restructuring agreement include: the |
F-212
| | forgiveness of interest due and accrued as of September 30, 2014; the rescheduling of capital repayments over a period of 18 years, with a 12 month grace period so that obligations must be fully repaid before December 15, 2032; a minimum annual payment of US$3,000,000 in principal in quarterly installments at an interest rate of 0.25% per annum; the maintenance of a pledge over assets and restrictions on the payment of dividends. |
The effects on financial results from exchange differences and the application of indexed assets and liabilities originated from the following:
| | | | | | | | |
(1) Foreign currency exchange losses, net | | For the years ended | |
| | 12-31-2014
ThCh$ | | | 12-31-2013
ThCh$ | |
Cash and cash equivalents | | | 1,697,907 | | | | 1,344,567 | |
Other financial assets (derivative instruments) | | | 16,998,599 | | | | 27,129,918 | |
Other non-financial assets | | | 589,555 | | | | — | |
Trade and other accounts receivable | | | (2,923,337 | ) | | | (3,725,260 | ) |
Other financial liabilities (financial debt and derivative instruments) | | | (32,626,374 | ) | | | (33,326,873 | ) |
Trade and other accounts payable | | | (1,908,775 | ) | | | (228,360 | ) |
Other non-financial liabilities | | | (2,020,336 | ) | | | (2,770,850 | ) |
| | | | | | | | |
Total | | | (20,192,761 | ) | | | (11,576,858 | ) |
| | | | | | | | |
The following table presents the components of the income tax expense/(benefit) recognized in the accompanying Combined Statement of Comprehensive Income for the years ended December 31, 2014 and 2013:
| | | | | | | | |
Current Income Tax and Adjustments to Current Income Tax for Previous Periods | | For the years ended | |
| | 12-31-2014
ThCh$ | | | 12-31-2013
ThCh$ | |
Current income tax | | | (219,525,684 | ) | | | (165,130,899 | ) |
Tax benefit arising from previously unrecognized tax credit of prior period used to reduce current tax expense | | | 13,376,346 | | | | — | |
Adjustments to current tax from the previous period | | | (217,951 | ) | | | (1,033,731 | ) |
Other current tax expense | | | (25,942 | ) | | | (4,084,483 | ) |
Current tax expense, net | | | (206,393,231 | ) | | | (170,249,113 | ) |
Benefit/(expense) from deferred taxes for origination and reversal of temporary differences | | | (18,334,897 | ) | | | 2,326,472 | |
Benefit from deferred taxes due to changes in tax rate or the introduction of new taxes (*) | | | 20,677,076 | | | | 10,452 | |
| | | | | | | | |
Total deferred tax benefit | | | 2,342,179 | | | | 2,336,924 | |
| | | | | | | | |
Income tax expense | | | (204,051,052 | ) | | | (167,912,189 | ) |
| | | | | | | | |
F-213
The following table reconciles the computed income tax expense resulting from applying the applicable statutary tax rate to “Profit before taxes” and the actual income tax expense recognized in the accompanying Combined Statement of Comprehensive Income for the years ended December 31, 2014 and 2013:
| | | | | | | | | | | | | | | | |
Reconciliation of Tax Expense | | RATE
% | | | Year ended
12-31-2014
ThCh$ | | | RATE
% | | | Year ended
12-31-2013
ThCh$ | |
PROFIT BEFORE TAX | | | | | | | 693,958,987 | | | | | | | | 546,252,374 | |
Income tax expense using statutory rate | | | (21.00 | %) | | | (145,731,388 | ) | | | (20.00 | %) | | | (109,250,475 | ) |
Tax effect of rates applied in other countries | | | (11.16 | %) | | | (77,448,621 | ) | | | (10.70 | %) | | | (58,441,486 | ) |
Tax effect of non-taxable revenues | | | 14.31 | % | | | 99,293,836 | | | | 9.89 | % | | | 54,036,599 | |
Tax effect of non-tax-deductible expenses | | | (11.65 | %) | | | (80,876,742 | ) | | | (7.57 | %) | | | (41,349,671 | ) |
Tax effect from change in tax rate (*) | | | 2.98 | % | | | 20,677,078 | | | | 0.00 | % | | | 10,451 | |
Tax effect of adjustments to taxes in previous periods | | | (0.03 | %) | | | (217,951 | ) | | | (0.19 | %) | | | (1,033,731 | ) |
Price level restatement for tax purposes (investments and equity) | | | (2.85 | %) | | | (19,747,264 | ) | | | (2.18 | %) | | | (11,883,877 | ) |
Total adjustments to tax expense using statutory rates | | | (8.40 | %) | | | (58,319,664 | ) | | | (10.74 | %) | | | (58,661,715 | ) |
Actual income tax expense | | | (29.40 | %) | | | (204,051,052 | ) | | | (30.74 | %) | | | (167,912,190 | ) |
The principal temporary differences are detailed in Note 15.a.
| 30. | GEOGRAPHIC INFORMATION |
Since Endesa Américas has not yet been established as a legal entity, no chief operating decision maker existed for this Combined Group. Consequently, the Combined Group does not yet have any operating segments as the term is defined under IFRS 8 Operating Segments. The following supplemental financial information of financial position, results of operations and cash flows by geographical location is provided to enhance the understanding the Combined Group. It is not intended to, and does not, present operating segment information in accordance with IFRS 8.
The supplemental financial information has been organized by the geographical areas in which the Combined Group operates:
The accounting policies used to determine the supplement geographic information are the same as those used in the preparation of the Combined Group’s combined financial statements.
F-214
The following tables present the supplemental financial information.
| | | | | | | | | | | | | | | | | | | | | | | | | | | | | | | | | | | | | | | | | | | | | | | | | | | | | | | | | | | | | | | | | | | | | | | | |
Country | | Chile | | | Argentina | | | Colombia | | | Peru | | | Eliminations | | | Total | |
| | | 12-31-2014 | | | 12-31-2013 | | | 1-1-2013 | | | 12-31-2014 | | | 12-31-2013 | | | 1-1-2013 | | | 12-31-2014 | | | 12-31-2013 | | | 1-1-2013 | | | 12-31-2014 | | | 12-31-2013 | | | 1-1-2013 | | | 12-31-2014 | | | 12-31-2013 | | | 1-1-2013 | | | 12-31-2014 | | | 12-31-2013 | | | 1-1-2013 | |
ASSETS | | ThCh$ | | | ThCh$ | | | ThCh$ | | | ThCh$ | | | ThCh$ | | | ThCh$ | | | ThCh$ | | | ThCh$ | | | ThCh$ | | | ThCh$ | | | ThCh$ | | | ThCh$ | | | ThCh$ | | | ThCh$ | | | ThCh$ | | | ThCh$ | | | ThCh$ | | | ThCh$ | |
CURRENT ASSETS | | | 96,302,445 | | | | 82,838,635 | | | | 31,117,044 | | | | 56,079,003 | | | | 46,128,070 | | | | 42,454,667 | | | | 329,704,908 | | | | 321,118,495 | | | | 285,719,119 | | | | 121,446,536 | | | | 104,859,261 | | | | 80,363,360 | | | | (77,660,917 | ) | | | (19,108,619 | ) | | | (22,514,448 | ) | | | 525,871,975 | | | | 535,835,842 | | | | 417,139,742 | |
Cash and cash equivalents | | | 12,441,019 | | | | 19,231,077 | | | | 1,931,656 | | | | 13,044,779 | | | | 6,729,682 | | | | 6,336,505 | | | | 224,564,345 | | | | 227,781,003 | | | | 187,772,861 | | | | 48,392,087 | | | | 32,476,931 | | | | 35,284,268 | | | | — | | | | — | | | | — | | | | 298,442,230 | | | | 286,218,693 | | | | 231,325,290 | |
Other current financial assets | | | 2,924,888 | | | | 1,701,819 | | | | — | | | | — | | | | — | | | | — | | | | 20,460,311 | | | | 59,041 | | | | 25,067,909 | | | | — | | | | 121,357 | | | | 51,876 | | | | — | | | | — | | | | — | | | | 23,385,199 | | | | 1,882,217 | | | | 25,119,785 | |
Other current non-financial assets | | | — | | | | — | | | | — | | | | 1,436,607 | | | | 2,760,874 | | | | 217,513 | | | | 9,272,519 | | | | 7,825,842 | | | | 7,515,740 | | | | 19,564,358 | | | | 24,546,032 | | | | 4,241,546 | | | | — | | | | — | | | | — | | | | 30,273,484 | | | | 35,132,748 | | | | 11,974,799 | |
Trade and other current receivables, net | | | 32,544 | | | | 35,801 | | | | 23,314 | | | | 31,777,379 | | | | 25,025,243 | | | | 21,546,107 | | | | 53,822,823 | | | | 54,562,170 | | | | 35,378,529 | | | | 30,523,540 | | | | 22,584,515 | | | | 18,439,139 | | | | 32 | | | | 32,682 | | | | 850,866 | | | | 116,156,318 | | | | 102,240,411 | | | | 76,237,955 | |
Current accounts receivable from related parties | | | 80,903,994 | | | | 61,869,938 | | | | 29,162,074 | | | | 7,651,647 | | | | 8,699,310 | | | | 11,190,308 | | | | 7,818,044 | | | | 13,527,398 | | | | 15,211,112 | | | | 7,413,257 | | | | 12,154,631 | | | | 9,221,914 | | | | (77,660,949 | ) | | | (19,141,301 | ) | | | (23,365,314 | ) | | | 26,125,993 | | | | 77,109,976 | | | | 41,420,094 | |
Inventories | | | — | | | | — | | | | — | | | | 2,121,378 | | | | 2,907,560 | | | | 3,158,460 | | | | 12,342,664 | | | | 15,841,374 | | | | 13,257,329 | | | | 14,435,895 | | | | 12,743,147 | | | | 12,892,283 | | | | — | | | | — | | | | — | | | | 28,899,937 | | | | 31,492,081 | | | | 29,308,072 | |
Current income tax receivables | | | — | | | | — | | | | — | | | | 47,213 | | | | 5,401 | | | | 5,774 | | | | 1,424,202 | | | | 1,521,667 | | | | 1,515,639 | | | | 1,117,399 | | | | 232,648 | | | | 232,334 | | | | — | | | | — | | | | — | | | | 2,588,814 | | | | 1,759,716 | | | | 1,753,747 | |
NON-CURRENT ASSETS | | | 1,075,119,472 | | | | 1,075,103,636 | | | | 1,046,187,645 | | | | 297,803,641 | | | | 252,145,380 | | | | 274,123,434 | | | | 1,787,224,363 | | | | 1,712,544,281 | | | | 1,563,308,503 | | | | 816,077,567 | | | | 773,833,383 | | | | 786,613,843 | | | | (499,379,977 | ) | | | (516,326,842 | ) | | | (458,623,981 | ) | | | 3,476,845,066 | | | | 3,297,299,838 | | | | 3,211,609,444 | |
Other non-current financial assets | | | — | | | | — | | | | — | | | | 29,855 | | | | 33,548 | | | | 108,154 | | | | 1,170,931 | | | | 1,260,169 | | | | 1,236,511 | | | | 16,167 | | | | 6,692 | | | | 524,133 | | | | — | | | | — | | | | — | | | | 1,216,953 | | | | 1,300,409 | | | | 1,868,798 | |
Other non-current non-financial assets | | | — | | | | — | | | | — | | | | 1,255,693 | | | | 12,151 | | | | 1,252,852 | | | | 1,075,811 | | | | — | | | | 635,776 | | | | — | | | | — | | | | — | | | | — | | | | — | | | | — | | | | 2,331,504 | | | | 12,151 | | | | 1,888,628 | |
Trade and other non-current receivables net | | | — | | | | — | | | | — | | | | 139,038,803 | | | | 128,087,762 | | | | 143,949,453 | | | | 2,177,709 | | | | 3,509,648 | | | | 3,014,698 | | | | — | | | | — | | | | — | | | | — | | | | — | | | | — | | | | 141,216,512 | | | | 131,597,410 | | | | 146,964,151 | |
Investments accounted for using the equity method | | | 1,075,079,502 | | | | 1,075,079,502 | | | | 1,046,174,468 | | | | 2,732,534 | | | | 3,246,689 | | | | 3,766,318 | | | | — | | | | — | | | | — | | | | 48,358,846 | | | | 49,498,978 | | | | 51,856,848 | | | | (585,314,821 | ) | | | (581,570,011 | ) | | | (524,885,228 | ) | | | 540,856,061 | | | | 546,255,158 | | | | 576,912,406 | |
Intangible assets other than goodwill | | | — | | | | — | | | | — | | | | — | | | | — | | | | — | | | | 22,960,562 | | | | 24,751,366 | | | | 23,938,624 | | | | 10,639,358 | | | | 9,794,606 | | | | 9,718,479 | | | | — | | | | — | | | | — | | | | 33,599,920 | | | | 34,545,972 | | | | 33,657,103 | |
Goodwill | | | — | | | | — | | | | — | | | | 1,401,472 | | | | 1,574,810 | | | | 1,902,217 | | | | 4,886,065 | | | | 5,213,756 | | | | 5,194,342 | | | | 8,527,161 | | | | 8,287,322 | | | | 8,703,399 | | | | 85,934,844 | | | | 80,364,205 | | | | 81,291,023 | | | | 100,749,542 | | | | 95,440,093 | | | | 97,090,981 | |
Property, plant and equipment | | | — | | | | — | | | | — | | | | 153,233,565 | | | | 117,875,481 | | | | 121,684,051 | | | | 1,707,545,357 | | | | 1,618,190,483 | | | | 1,469,930,901 | | | | 748,536,035 | | | | 706,245,785 | | | | 713,971,669 | | | | — | | | | — | | | | — | | | | 2,609,314,957 | | | | 2,442,311,749 | | | | 2,305,586,621 | |
Deferred income tax assets | | | 39,970 | | | | 24,134 | | | | 13,177 | | | | 111,719 | | | | 1,314,939 | | | | 1,460,389 | | | | 47,407,928 | | | | 59,618,859 | | | | 59,357,651 | | | | — | | | | — | | | | 1,839,315 | | | | — | | | | (15,121,036 | ) | | | (15,029,776.0 | ) | | | 47,559,617 | | | | 45,836,896 | | | | 47,640,756 | |
| | | | | | | | | | | | | | | | | | | | | | | | | | | | | | | | | | | | | | | | | | | | | | | | | | | | | | | | | | | | | | | | | | | | | | | | |
TOTAL ASSETS | | | 1,171,421,917 | | | | 1,157,942,271 | | | | 1,077,304,689 | | | | 353,882,644 | | | | 298,273,450 | | | | 316,578,101 | | | | 2,116,929,271 | | | | 2,033,662,776 | | | | 1,849,027,622 | | | | 937,524,103 | | | | 878,692,644 | | | | 866,977,203 | | | | (577,040,894 | ) | | | (535,435,461 | ) | | | (481,138,429 | ) | | | 4,002,717,041 | | | | 3,833,135,680 | | | | 3,628,749,186 | |
| | | | | | | | | | | | | | | | | | | | | | | | | | | | | | | | | | | | | | | | | | | | | | | | | | | | | | | | | | | | | | | | | | | | | | | | |
F-215
| | | | | | | | | | | | | | | | | | | | | | | | | | | | | | | | | | | | | | | | | | | | | | | | | | | | | | | | | | | | | | | | | | | | | | | | |
Country | | Chile | | | Argentina | | | Colombia | | | Peru | | | Eliminations | | | Total | |
LIABILITIES AND
EQUITY | | 12-31-2014 | | | 12-31-2013 | | | 1-1-2013 | | | 12-31-2014 | | | 12-31-2013 | | | 1-1-2013 | | | 12-31-2014 | | | 12-31-2013 | | | 1-1-2013 | | | 12-31-2014 | | | 12-31-2013 | | | 1-1-2013 | | | 12-31-2014 | | | 12-31-2013 | | | 1-1-2013 | | | 12-31-2014 | | | 12-31-2013 | | | 1-1-2013 | |
| | ThCh$ | | | ThCh$ | | | ThCh$ | | | ThCh$ | | | ThCh$ | | | ThCh$ | | | ThCh$ | | | ThCh$ | | | ThCh$ | | | ThCh$ | | | ThCh$ | | | ThCh$ | | | ThCh$ | | | ThCh$ | | | ThCh$ | | | ThCh$ | | | ThCh$ | | | ThCh$ | |
CURRENT LIABILITIES | | | 66,254,194 | | | | 54,433,386 | | | | 50,940,529 | | | | 140,463,117 | | | | 183,233,754 | | | | 211,961,697 | | | | 500,427,460 | | | | 229,570,429 | | | | 179,614,548 | | | | 95,676,184 | | | | 110,158,340 | | | | 80,997,179 | | | | (77,660,949 | ) | | | (19,108,619 | ) | | | (18,034,388 | ) | | | 725,160,006 | | | | 558,287,290 | | | | 505,479,565 | |
Other current financial liabilities | | | — | | | | — | | | | — | | | | 29,204,543 | | | | 129,629,312 | | | | 129,148,163 | | | | 90,868,809 | | | | 65,753,442 | | | | 29,534,134 | | | | 24,321,508 | | | | 31,088,635 | | | | 27,415,985 | | | | — | | | | — | | | | — | | | | 144,394,860 | | | | 226,471,389 | | | | 186,098,282 | |
Trade and other current payables | | | 26,431,188 | | | | 21,704,729 | | | | 20,303,564 | | | | 80,964,391 | | | | 34,983,124 | | | | 48,006,817 | | | | 194,459,886 | | | | 88,750,766 | | | | 88,020,514 | | | | 57,377,029 | | | | 65,121,311 | | | | 44,588,083 | | | | 388,357 | | | | — | | | | (2,119 | ) | | | 359,620,851 | | | | 210,559,930 | | | | 200,916,859 | |
Current accounts payable to related parties | | | 39,677,940 | | | | 32,566,507 | | | | 30,514,916 | | | | 13,946,683 | | | | 13,530,857 | | | | 27,129,874 | | | | 131,257,351 | | | | 28,331,191 | | | | 23,917,636 | | | | 6,228,108 | | | | 843,028 | | | | 914,067 | | | | (78,049,306 | ) | | | (19,108,619 | ) | | | (18,032,269 | ) | | | 113,060,776 | | | | 56,162,964 | | | | 64,444,224 | |
Provisions | | | — | | | | 158,661 | | | | 118,563 | | | | 666,299 | | | | 1,301,192 | | | | 1,564,413 | | | | 24,071,622 | | | | 12,139,002 | | | | 9,808,093 | | | | 2,681,490 | | | | 3,481,855 | | | | 3,471,749 | | | | — | | | | — | | | | — | | | | 27,419,411 | | | | 17,080,710 | | | | 14,962,818 | |
Current income tax liabilities | | | — | | | | — | | | | — | | | | 6,819,509 | | | | 2,291,242 | | | | 4,730,282 | | | | 55,331,792 | | | | 32,330,315 | | | | 26,603,127 | | | | 760,776 | | | | 6,173,798 | | | | 1,874,744 | | | | — | | | | — | | | | — | | | | 62,912,077 | | | | 40,795,355 | | | | 33,208,153 | |
Other current non-financial liabilities | | | 145,066 | | | | 3,489 | | | | 3,486 | | | | 8,861,692 | | | | 1,498,027 | | | | 1,382,148 | | | | 4,438,000 | | | | 2,265,713 | | | | 1,731,044 | | | | 4,307,273 | | | | 3,449,713 | | | | 2,732,551 | | | | — | | | | — | | | | — | | | | 17,752,031 | | | | 7,216,942 | | | | 5,849,229 | |
NON-CURRENT LIABILITIES | | | 345,751 | | | | 288,358 | | | | 248,296 | | | | 101,749,459 | | | | 54,121,669 | | | | 62,998,737 | | | | 883,041,284 | | | | 864,631,943 | | | | 757,392,281 | | | | 275,049,420 | | | | 256,342,275 | | | | 282,137,010 | | | | 315,064 | | | | (15,121,036 | ) | | | (19,160,300 | ) | | | 1,260,500,978 | | | | 1,160,263,209 | | | | 1,083,616,024 | |
Other non-current financial liabilities | | | — | | | | — | | | | — | | | | 44,052,205 | | | | 12,954,207 | | | | 20,701,104 | | | | 862,784,448 | | | | 828,381,968 | | | | 711,308,825 | | | | 140,731,046 | | | | 120,022,828 | | | | 136,960,660 | | | | — | | | | — | | | | — | | | | 1,047,567,699 | | | | 961,359,003 | | | | 868,970,589 | |
Non-current accounts payable to related parties | | | — | | | | — | | | | — | | | | — | | | | — | | | | 4,479,929 | | | | — | | | | — | | | | — | | | | — | | | | — | | | | — | | | | — | | | | — | | | | (4,479,929 | ) | | | — | | | | — | | | | — | |
Other non-current provisions | | | — | | | | — | | | | — | | | | — | | | | — | | | | — | | | | 465,509 | | | | 738,840 | | | | 316,755 | | | | 3,226,928 | | | | 2,841,123 | | | | 2,732,195 | | | | — | | | | — | | | | — | | | | 3,692,437 | | | | 3,579,963 | | | | 3,048,950 | |
Deferred income tax liabilities | | | — | | | | — | | | | — | | | | 27,977,026 | | | | 14,019,574 | | | | 10,607,957 | | | | — | | | | 13,991,943 | | | | 12,001,108 | | | | 130,297,810 | | | | 132,840,909 | | | | 141,771,503 | | | | — | | | | (15,121,036 | ) | | | (15,029,776 | ) | | | 158,274,836 | | | | 145,731,390 | | | | 149,350,792 | |
Non-current provisions for employee benefits | | | 345,181 | | | | 288,358 | | | | 248,296 | | | | 3,994,647 | | | | 3,276,308 | | | | 2,382,287 | | | | 19,791,327 | | | | 21,519,192 | | | | 22,056,756 | | | | 793,636 | | | | 637,415 | | | | 672,652 | | | | — | | | | — | | | | — | | | | 24,924,791 | | | | 25,721,273 | | | | 25,359,991 | |
Other non-current non-financial liabilities | | | 570 | | | | — | | | | — | | | | 25,725,581 | | | | 23,871,580 | | | | 24,827,460 | | | | — | | | | — | | | | 11,708,837 | | | | — | | | | — | | | | — | | | | 315,064 | | | | — | | | | 349,405 | | | | 26,041,215 | | | | 23,871,580 | | | | 36,885,702 | |
EQUITY | | | 1,104,821,972 | | | | 1,103,220,527 | | | | 1,026,115,864 | | | | 111,670,068 | | | | 60,918,027 | | | | 41,617,667 | | | | 733,460,527 | | | | 939,460,404 | | | | 912,020,793 | | | | 566,798,499 | | | | 512,192,029 | | | | 503,843,014 | | | | (499,695,009 | ) | | | (501,205,806 | ) | | | (443,943,741 | ) | | | 2,017,056,057 | | | | 2,114,585,181 | | | | 2,039,653,597 | |
Equity attributable to Parent Company | | | 1,104,821,972 | | | | 1,103,220,527 | | | | 1,026,115,864 | | | | 111,670,068 | | | | 60,918,027 | | | | 41,617,667 | | | | 733,460,527 | | | | 939,460,404 | | | | 912,020,793 | | | | 566,798,499 | | | | 512,192,029 | | | | 503,843,014 | | | | (499,695,009 | ) | | | (501,205,806 | ) | | | (443,943,741 | ) | | | 1,224,709,595 | | | | 1,206,186,544 | | | | 1,164,385,772 | |
Allocated capital | | | 758,944,075 | | | | 695,269,100 | | | | 659,781,101 | | | | 50,147,052 | | | | 56,349,375 | | | | 54,192,633 | | | | 167,029,702 | | | | 165,215,801 | | | | 164,600,583 | | | | 201,338,557 | | | | 186,325,265 | | | | 186,073,314 | | | | (278,025,557 | ) | | | (203,725,712 | ) | | | (165,213,802 | ) | | | 899,433,829 | | | | 899,433,829 | | | | 899,433,829 | |
Retained earnings | | | 512,170,634 | | | | 519,878,400 | | | | 447,026,137 | | | | 14,567,871 | | | | (15,857,261 | ) | | | (11,005,738 | ) | | | 110,289,985 | | | | 543,834,487 | | | | 524,280,383 | | | | 130,039,328 | | | | 103,895,288 | | | | 75,744,989 | | | | 409,042,471 | | | | (35,613,160 | ) | | | (36,209,891 | ) | | | 1,176,110,289 | | | | 1,116,137,754 | | | | 999,835,880 | |
Other reserves, including | | | (166,292,737 | ) | | | (111,926,973 | ) | | | (80,691,374 | ) | | | 46,955,145 | | | | 20,425,913 | | | | (1,569,228 | ) | | | 456,140,840 | | | | 230,410,116 | | | | 223,139,827 | | | | 235,420,614 | | | | 221,971,476 | | | | 242,024,711 | | | | (630,711,923 | ) | | | (261,866,934 | ) | | | (242,520,048 | ) | | | (850,834,523 | ) | | | (809,385,039 | ) | | | (734,883,937 | ) |
Non-controlling interests | | | | | | | | | | | | | | | | | | | | | | | | | | | | | | | | | | | | | | | | | | | | | | | | | | | | | | | | | | | | | | | 792,346,462 | | | | 908,398,637 | | | | 875,267,825 | |
| | | | | | | | | | | | | | | | | | | | | | | | | | | | | | | | | | | | | | | | | | | | | | | | | | | | | | | | | | | | | | | | | | | | | | | | |
TOTAL LIABILITIES AND EQUITY | | | 1,171,421,917 | | | | 1,157,942,271 | | | | 1,077,304,689 | | | | 353,882,644 | | | | 298,273,450 | | | | 316,578,101 | | | | 2,116,929,271 | | | | 2,033,662,776 | | | | 1,849,027,622 | | | | 937,524,103 | | | | 878,692,644 | | | | 866,977,203 | | | | (577,040,894 | ) | | | (535,435,461 | ) | | | (481,138,429 | ) | | | 4,002,717,041 | | | | 3,833,135,680 | | | | 3,628,749,186 | |
| | | | | | | | | | | | | | | | | | | | | | | | | | | | | | | | | | | | | | | | | | | | | | | | | | | | | | | | | | | | | | | | | | | | | | | | |
F-216
The eliminations column corresponds to transactions between companies in different lines of business and country, primarily purchases and sales of energy and services.
| | | | | | | | | | | | | | | | | | | | | | | | | | | | | | | | | | | | | | | | | | | | | | | | |
Country | | Chile | | | Argentina | | | Colombia | | | Peru | | | Eliminations | | | Total | |
STATEMENTS OF COMPREHENSIVE
INCOME | | 12-31-2014 | | | 12-31-2013 | | | 12-31-2014 | | | 12-31-2013 | | | 12-31-2014 | | | 12-31-2013 | | | 12-31-2014 | | | 12-31-2013 | | | 12-31-2014 | | | 12-31-2013 | | | 12-31-2014 | | | 12-31-2013 | |
| | ThCh$ | | | ThCh$ | | | ThCh$ | | | ThCh$ | | | ThCh$ | | | ThCh$ | | | ThCh$ | | | ThCh$ | | | ThCh$ | | | ThCh$ | | | ThCh$ | | | ThCh$ | |
REVENUES AND OTHER OPERATING INCOME | | | 5,160,988 | | | | 3,102,453 | | | | 105,265,322 | | | | 131,443,285 | | | | 753,373,023 | | | | 639,503,535 | | | | 353,794,700 | | | | 283,805,991 | | | | (2,034,545 | ) | | | (460,636 | ) | | | 1,215,559,488 | | | | 1,057,394,628 | |
Revenue from ordinary activities | | | 5,160,988 | | | | 3,102,453 | | | | 62,653,767 | | | | 97,596,845 | | | | 744,252,510 | | | | 634,847,624 | | | | 344,381,520 | | | | 262,546,228 | | | | (2,034,545 | ) | | | (460,636 | ) | | | 1,154,414,240 | | | | 997,632,514 | |
Energy sales | | | — | | | | — | | | | 51,748,523 | | | | 95,315,523 | | | | 743,649,327 | | | | 634,181,459 | | | | 290,024,990 | | | | 255,382,989 | | | | — | | | | — | | | | 1,085,422,840 | | | | 984,879,971 | |
Other sales | | | — | | | | — | | | | — | | | | — | | | | 476,853 | | | | — | | | | — | | | | — | | | | — | | | | — | | | | 476,853 | | | | — | |
Other services rendered | | | 5,160,988 | | | | 3,102,453 | | | | 10,905,244 | | | | 2,281,322 | | | | 126,330 | | | | 666,165 | | | | 54,356,530 | | | | 7,163,239 | | | | (2,034,545 | ) | | | (460,636 | ) | | | 68,514,547 | | | | 12,752,543 | |
Other operating revenue | | | — | | | | — | | | | 42,611,555 | | | | 33,846,440 | | | | 9,120,513 | | | | 4,655,911 | | | | 9,413,180 | | | | 21,259,763 | | | | — | | | | — | | | | 61,145,248 | | | | 59,762,114 | |
RAW MATERIALS AND CONSUMABLES | | | — | | | | — | | | | (15,204,196 | ) | | | (36,478,648 | ) | | | (220,302,722 | ) | | | (204,419,041 | ) | | | (133,734,610 | ) | | | (95,079,949 | ) | | | — | | | | — | | | | (369,241,528 | ) | | | (335,977,638 | ) |
Energy purchases | | | — | | | | — | | | | (4,795,537 | ) | | | (15,687,976 | ) | | | (80,294,031 | ) | | | (87,695,910 | ) | | | (23,258,968 | ) | | | (9,873,945 | ) | | | — | | | | — | | | | (108,348,536 | ) | | | (113,257,831 | ) |
Fuel consumption | | | — | | | | — | | | | (1,531,860 | ) | | | (9,173,816 | ) | | | (33,015,871 | ) | | | (34,870,502 | ) | | | (66,207,580 | ) | | | (52,192,521 | ) | | | — | | | | — | | | | (100,755,311 | ) | | | (96,236,839 | ) |
Transportation expenses | | | — | | | | — | | | | (2,765,795 | ) | | | (4,541,378 | ) | | | (68,739,282 | ) | | | (59,719,072 | ) | | | (32,048,156 | ) | | | (19,898,741 | ) | | | — | | | | — | | | | (103,553,233 | ) | | | (84,159,191 | ) |
Other miscellaneous supplies and services | | | — | | | | — | | | | (6,111,004 | ) | | | (7,075,478 | ) | | | (38,253,538 | ) | | | (22,133,557 | ) | | | (12,219,906 | ) | | | (13,114,742 | ) | | | — | | | | — | | | | (56,584,448 | ) | | | (42,323,777 | ) |
CONTRIBUTION MARGIN | | | 5,160,988 | | | | 3,102,453 | | | | 90,061,126 | | | | 94,964,637 | | | | 533,070,301 | | | | 435,084,494 | | | | 220,060,090 | | | | 188,726,042 | | | | (2,034,545 | ) | | | (460,636 | ) | | | 846,317,960 | | | | 721,416,990 | |
Other work performed by the entity and capitalized | | | — | | | | — | | | | 4,717,344 | | | | 2,994,025 | | | | 5,763,279 | | | | 5,001,430 | | | | 550,306 | | | | 360,712 | | | | 1,673,387 | | | | — | | | | 12,704,316 | | | | 8,356,167 | |
Employee benefits expense | | | (398,886 | ) | | | (395,543 | ) | | | (35,160,437 | ) | | | (28,253,599 | ) | | | (20,155,909 | ) | | | (18,284,458 | ) | | | (14,329,637 | ) | | | (13,215,319 | ) | | | — | | | | — | | | | (70,044,869 | ) | | | (60,148,919 | ) |
Other expenses | | | (360,850 | ) | | | (313,807 | ) | | | (13,992,507 | ) | | | (13,905,969 | ) | | | (24,525,495 | ) | | | (20,227,858 | ) | | | (21,518,324 | ) | | | (18,553,677 | ) | | | 361,158 | | | | 460,636 | | | | (60,036,018 | ) | | | (52,540,675 | ) |
GROSS OPERATING RESULT | | | 4,401,252 | | | | 2,393,103 | | | | 45,625,526 | | | | 55,799,094 | | | | 494,152,176 | | | | 401,573,608 | | | | 184,762,435 | | | | 157,317,758 | | | | — | | | | — | | | | 728,941,389 | | | | 617,083,563 | |
Depreciation and amortization expense | | | — | | | | — | | | | (17,588,468 | ) | | | (20,870,696 | ) | | | (43,831,768 | ) | | | (37,656,687 | ) | | | (42,416,099 | ) | | | (38,526,952 | ) | | | — | | | | — | | | | (103,836,335 | ) | | | (97,054,335 | ) |
Impairment losses (reversal of impairment losses) recognized in profit or loss | | | — | | | | — | | | | (81,595 | ) | | | — | | | | (787,644 | ) | | | 76,227 | | | | (1,188,617 | ) | | | (6,599,318 | ) | | | — | | | | — | | | | (2,057,856 | ) | | | (6,523,091 | ) |
NET OPERATING INCOME | | | 4,401,252 | | | | 2,393,103 | | | | 27,955,463 | | | | 34,928,398 | | | | 449,532,764 | | | | 363,993,148 | | | | 141,157,719 | | | | 112,191,488 | | | | — | | | | — | | | | 623,047,198 | | | | 513,506,137 | |
FINANCIAL RESULT | | | (4,284,233 | ) | | | 11,086,404 | | | | 49,186,699 | | | | (36,683,640 | ) | | | (34,612,888 | ) | | | (26,968,562 | ) | | | (7,267,238 | ) | | | (8,116,369 | ) | | | 5,541,160 | | | | (2,452,650 | ) | | | 8,563,500 | | | | (63,134,817 | ) |
Financial income | | | 443,158 | | | | 390,116 | | | | 81,628,144 | | | | 2,824,892 | | | | 11,360,916 | | | | 11,243,116 | | | | 535,379 | | | | 909,512 | | | | — | | | | (230,170 | ) | | | 93,967,597 | | | | 15,137,466 | |
Financial costs | | | (2,261,919 | ) | | | (1,551,540 | ) | | | (11,071,561 | ) | | | (18,723,405 | ) | | | (44,883,364 | ) | | | (38,653,807 | ) | | | (6,994,492 | ) | | | (7,996,843 | ) | | | — | | | | 230,170 | | | | (65,211,336 | ) | | | (66,695,425 | ) |
Foreign currency exchange losses, net | | | (2,465,472 | ) | | | 12,247,828 | | | | (21,369,884 | ) | | | (20,785,127 | ) | | | (1,090,440 | ) | | | 442,129 | | | | (808,125 | ) | | | (1,029,038 | ) | | | 5,541,160 | | | | (2,452,650 | ) | | | (20,192,761 | ) | | | (11,576,858 | ) |
Positive | | | 13,428,723 | | | | 20,015,266 | | | | 13,670,821 | | | | 15,593,040 | | | | 1,172,568 | | | | 740,030 | | | | 904 | | | | 618 | | | | (1,323,694 | ) | | | (2,891,630 | ) | | | 26,949,322 | | | | 33,457,324 | |
Negative | | | (15,894,195 | ) | | | (7,767,438 | ) | | | (35,040,705 | ) | | | (36,378,167 | ) | | | (2,263,008 | ) | | | (297,901 | ) | | | (809,029 | ) | | | (1,029,656 | ) | | | 6,864,854 | | | | 438,980 | | | | (47,142,083 | ) | | | (45,034,182 | ) |
Share of profit of investments accounted for using the equity method | | | 55,319,910 | | | | 84,856,568 | | | | (153,555 | ) | | | 144,312 | | | | — | | | | — | | | | 6,432,056 | | | | 10,036,958 | | | | — | | | | — | | | | 61,598,411 | | | | 95,037,838 | |
Other gains, net | | | — | | | | — | | | | 622,942 | | | | 725,673 | | | | 74,183 | | | | 310,238 | | | | 52,753 | | | | (192,695 | ) | | | — | | | | — | | | | 749,878 | | | | 843,216 | |
Gain (loss) from other investments | | | — | | | | — | | | | 668,100 | | | | 725,673 | | | | — | | | | — | | | | — | | | | — | | | | — | | | | — | | | | 668,100 | | | | 725,673 | |
Gain (loss) from the sale of assets | | | — | | | | — | | | | (45,158 | ) | | | — | | | | 74,183 | | | | 310,238 | | | | 52,753 | | | | (192,695 | ) | | | — | | | | — | | | | 81,778 | | | | 117,543 | |
Income before tax | | | 55,436,929 | | | | 98,336,075 | | | | 77,611,549 | | | | (885,257 | ) | | | 414,994,059 | | | | 337,334,824 | | | | 140,375,290 | | | | 113,919,382 | | | | 5,541,160 | | | | (2,452,650 | ) | | | 693,958,987 | | | | 546,252,374 | |
Income tax | | | (27,757,029 | ) | | | (21,650,895 | ) | | | (21,104,876 | ) | | | (8,988,962 | ) | | | (126,163,971 | ) | | | (106,510,265 | ) | | | (29,025,176 | ) | | | (30,762,067 | ) | | | — | | | | — | | | | (204,051,052 | ) | | | (167,912,189 | ) |
NET PROFIT | | | 27,679,900 | | | | 76,685,180 | | | | 56,506,673 | | | | (9,874,219 | ) | | | 288,830,088 | | | | 230,824,559 | | | | 111,350,114 | | | | 83,157,315 | | | | 5,541,160 | | | | (2,452,650 | ) | | | 489,907,935 | | | | 378,340,185 | |
Net profit attributable to: | | | 27,679,900 | | | | 76,685,180 | | | | 56,506,673 | | | | (9,874,219 | ) | | | 288,830,088 | | | | 230,824,559 | | | | 111,350,114 | | | | 83,157,315 | | | | 5,541,160 | | | | (2,452,650 | ) | | | 489,907,935 | | | | 378,340,185 | |
Parent Company | | | | | | | | | | | | | | | | | | | | | | | | | | | | | | | | | | | | | | | | | | | 220,154,609 | | | | 180,783,612 | |
Non-controlling interests | | | | | | | | | | | | | | | | | | | | | | | | | | | | | | | | | | | | | | | | | | | 269,753,326 | | | | 197,556,573 | |
F-217
| | | | | | | | | | | | | | | | | | | | | | | | | | | | | | | | | | | | | | | | | | | | | | | | |
Country | | Chile | | | Argentina | | | Colombia | | | Peru | | | Eliminations | | | Total | |
| | | 12-31-2014 | | | 12-31-2013 | | | 12-31-2014 | | | 12-31-2013 | | | 12-31-2014 | | | 12-31-2013 | | | 12-31-2014 | | | 12-31-2013 | | | 12-31-2014 | | | 12-31-2013 | | | 12-31-2014 | | | 12-31-2013 | |
STATEMENT OF CASH FLOW | | ThCh$ | | | ThCh$ | | | ThCh$ | | | ThCh$ | | | ThCh$ | | | ThCh$ | | | ThCh$ | | | ThCh$ | | | ThCh$ | | | ThCh$ | | | ThCh$ | | | ThCh$ | |
Cash flow from (used in) operating activities | | | (755,692 | ) | | | 1,998,178 | | | | 73,261,969 | | | | 23,604,635 | | | | 364,425,931 | | | | 273,903,244 | | | | 131,371,133 | | | | 96,410,549 | | | | (407,290 | ) | | | (529,835 | ) | | | 567,896,051 | | | | 395,386,771 | |
Cash flow from (used in) investment activities | | | 225,357,810 | | | | 131,847,619 | | | | (46,912,356 | ) | | | (39,495,666 | ) | | | (185,214,366 | ) | | | (125,834,718 | ) | | | (21,749,651 | ) | | | (4,785,154 | ) | | | (108,128,882 | ) | | | (80,477,578 | ) | | | (136,647,445 | ) | | | (118,745,497 | ) |
Cash flows from (used in) financing activities | | | (232,307,811 | ) | | | (116,489,811 | ) | | | (20,558,700 | ) | | | 16,625,223 | | | | (151,340,516 | ) | | | (104,425,180 | ) | | | (97,913,910 | ) | | | (94,269,560 | ) | | | 108,536,172 | | | | 81,007,413 | | | | (393,584,765 | ) | | | (217,551,915 | ) |
The eliminations column corresponds to transactions between companies in different lines of business and country, primarily purchases and sales of energy and services.
| 31. | THIRD PARTY GUARANTEES, OTHER CONTINGENT ASSETS AND LIABILITIES, AND OTHER COMMITMENTS |
| | | | | | | | | | | | | | | | | | | | | | | | | | | | | | | | | | | | | | | | | | | | | | | | | | | | | | |
Creditor of Guarantee | | Debtor | | Type of
guarantee | | Assets Committed | | | Balance Pending as of | | | Guarantees Released | |
| | | | Type | | Currency | | Book
Value | | | |
| | Company | | Relationship | | | | | | Currency | | | 12-31-14 | | | 12-31-13 | | | 1-1-13 | | | 2015 | | | Assets | | | 2016 | | | Assets | | | 2017 | | | Assets | |
Mitsubishi | | Central Costanera S.A. | | Creditor | | Pledge | | Combined cycle | | ThCh$ | | | 16,050,998 | | | ThCh$ | | | | | 73,177,119 | | | | 73,830,430 | | | | 73,262,031 | | | | — | | | | — | | | | — | | | | — | | | | — | | | | — | |
Credit Suisse First Boston | | Central Costanera S.A. | | Creditor | | Pledge | | Combined cycle | | ThCh$ | | | 5,901,285 | | | ThCh$ | | | | | 3,033,750 | | | | 3,147,660 | | | | 5,192,000 | | | | — | | | | — | | | | — | | | | — | | | | — | | | | — | |
Banco de la Nación Argentina | | Central Costanera S.A. | | Creditor | | Pledge on revenues
and other | | CAMMESA cash
collection | | ThCh$ | | | — | | | ThCh$ | | | | | — | | | | 521,832 | | | | — | | | | — | | | | — | | | | — | | | | — | | | | — | | | | — | |
Varios Acreedores | | Edegel S.A.A. | | Creditor | | Pledge | | Property and
Equipment | | ThCh$ | | | — | | | ThCh$ | | | | | — | | | | — | | | | 7,127,904 | | | | | | | | | | | | | | | | | | | | | | | | | |
Scotiabank | | Chinango S.A.C. | | Creditor | | Pledge | | Cash collection | | ThCh$ | | | — | | | ThCh$ | | | | | — | | | | — | | | | 16,095,200 | | | | — | | | | — | | | | — | | | | — | | | | — | | | | — | |
As of December 31, 2014, 2013 and January 1, 2013, the amount of the Combined Group’s property, plant and equipment pledged as collateral for liabilities amounted to ThCh$ 21,952,283, ThCh$ 35,100,296 and ThCh$57,129,918, respectively.
As of December 31, 2014, the Combined Group had future energy purchase commitments totaled ThCh$ 27,059,338 (ThCh$ 6,281,541 and ThCh$ 0 as of December 31, 2013 and January 1, 2013, respectively).
| | | | | | | | | | | | | | | | | | | | | | | | | | | | | | | | | | | | | | | | | | | | | | | | | | | | | | | | | | | | |
Creditor of Guarantee | | Debtor | | | Assets Committed | | | Balance Pending as of | | | Guarantees Released | |
| | | Type | | | Currency | | | Book
Value | | | |
| | Company | | | Relationship | | | | | | Currency | | | 12-31-14 | | | 12-31-13 | | | 1-1-13 | | | 2015 | | | Assets | | | 2016 | | | Assets | | | 2017 | | | Assets | |
Bonds and bank loans | | | Chinango S.A.C. | | | | Subsidiary | | | | Aval | | | ThCh$ | | | | | — | | | ThCh$ | | | | | — | | | | 4,692,397 | | | | 15,245,788 | | | | — | | | | — | | | | — | | | | — | | | | — | | | | — | |
F-218
| 31.3 | Litigation and arbitration |
As of the date of these combined financial statements, the most relevant contingent liabilities involving the Combined Group, for which no provisions have been recognized because management believes that a present obligation does not exists, are as follows:
| a) | Pending lawsuits of combined entities |
Empresa Generadora de Energía Eléctrica S.A. (Emgesa)
| 1. | In 2001, a lawsuit was filed against Emgesa, as well as the non-related companies, Empresa de Energía de Bogotá S.A. E.S.P. (EEB) and Corporación Autónoma Regional de Cundinamarca (CAR), by the residents of Sibaté, in the Colombian Department of Cundinamarca. This lawsuit seeks to hold the defendants jointly liable for the damages and prejudices derived from the pollution to the El Muñá dam, resulting from the pumping of polluted waters from the Bogotá River by Emgesa. Emgesa has denied these allegations arguing, among others, that it does not have any responsibility since it receives the waters already contaminated. The plaintiffs’ initial demand was for approximately CPs 3,000 billion (approximately ThCh$ 750,000,000). Emgesa filed a motion for the joinder of numerous public and private entities that dump into the waters of the Bogotá River or that in any way are responsible for the environmental stewardship of the river basin. The Third Section of the State Council has received the petition and ordered certain companies joined as defendants. In January 2013, several of the defendants filed responses to the complaint. In June 2013, a motion to annul the proceedings was denied. The resolving preliminary objections and the summons to a conciliation hearing are currently pending. |
| 2. | A class action lawsuit has been filed by residents of the Colombian Municipality of Garzón, alleging that the construction of the El Quimbo hydroelectric project has caused the plaintiffs’ income from handicrafts or entrepreneurial activities to decrease by an average of 30%. The lawsuit claims the decrease was not considered when the project’s social-economic impact report was drafted. Emgesa has denied these allegations on the basis that (i) the social-economic impact report complied with all methodological criteria, including giving all interested parties the opportunity to be registered in the report, (ii) the plaintiffs are not residents and therefore, compensation is allowed only for those whose revenues are, in their majority, coming from of their activity in the direct area of influence of the El Quimbo hydroelectric project and (iii) compensation must not go beyond the “first link” of the production chain and must be based on the status of the income indicators of each affected person. A proceeding was filed in parallel by 38 inhabitants of the Municipality of Garzón, who are claiming compensation for being affected by the El Quimbo hydroelectric project since they were not included in the social-economic impact report. A mandatory settlement hearing was unsuccessful. The court ordered a test, which is currently in the preliminary phase. In the parallel proceeding, an exception previous of pending lawsuit was filed, based on the existence of the principal proceeding. The proposed exception is pending ruling. The amount involved in this proceeding is estimated to be approximately CPs 94 billion (approximately ThCh$ 23,500,000). |
| 3. | The Colombian Constitutional Court, under its competence to review records of a guardian’s actions already ruled upon in first and second instance, selected seven guardian’s actions related to the El Quimbo hydroelectric project, which had been decided in favor of Emgesa. The plaintiffs of these guardian’s actions sought compensation saying that they belonged to trade associations such as: small handicraft fishermen, transporters, “paleros”, foremen, constructors and contractors. As a result of this review, which consolidated the actions into one proceeding, the Constitutional Court issued ruling T-135, and notified Emgesa on February 11, 2014. The Constitutional Court determined that the manner of conducting the census of the El Quimbo hydroelectric project was in violation of the principle of the citizen participation. Although the decision does not impact the validity of the project’s environmental license, it expands its geographical coverage and potentially adds additional affected parties. As a consequence of the above mentioned review, the Constitutional Court overturned the rulings of the courts in the first and second instances and ruled in favor of the plaintiffs. The Constitutional Court ordered the inclusion and grant of the benefits included in the environmental license to them, and ordered, as protective measure for other similarly-situated people, |
F-219
| | that a new census be conducted in accordance with its order, particularly with respect to the right to effective participation by the local residents. On February 14, 2014, Emgesa filed before the Constitutional Court a petition, while not disputing the decision, to clarify or limit its effects, particularly the economic effects. On March 6, 2014, Emgesa filed a writ to inform the Court the actions it has taken to comply with the decision, such as: (i) including the seven plaintiffs identified by the Constitutional Court within the census of the El Quimbo hydroelectric project, (ii) holding informational sessions and social-economic interviews with the plaintiffs, (iii) forming a multi-disciplinary team to develop a structured methodological proposal to uphold the Court’s ruling and (iv) providing a timetable of activities to develop by the company to comply with the objectives indicated. The Constitutional Court ruled on the petition for clarification that Emgesa requested, finding it inadmissible because in its opinion, the scope of the protected fundamental rights is well established in ruling T-135. Similarly, the Court ruled that, since it is a proceeding in which seven protected lawsuits were consolidated, the competent authority to verify compliance with the Court’s order is the court that ruled in the first instance on the first of the accrued proceedings (i.e. the Civil Chamber, Family Division of the High Court of the District of Neiva). This court will be responsible for carrying out public audiences requested by Emgesa to verify compliance with the judgment. There are no pending appeals. The amount of this proceeding is undetermined. |
Edegel S.A.A. (Edegel)
| 1. | The fiscal authority in Peru, SUNAT, questioned Edegel in 2001 regarding the manner in which it was accounting for the valuation of its depreciating assets. Edegel had conducted a voluntary reevaluation for the 1996 fiscal year, and as a result of such reevaluation it recorded a reduction of goodwill with respect to assets. This depreciation was recorded as an expense. The amount rejected by SUNAT is related to financial interest paid during the construction phase of the power plants. SUNAT claims (i) that Edegel has not demonstrated that it was necessary to obtain financing to build the power plants and (ii) that such financing was actually incurred. Edegel has responded that SUNAT cannot request such evidence because the reevaluation assigns the assets a market value when the reevaluation was performed, instead of the historical value of the assets. In this case, the methodology considered that the power plants of such scale were built with financings. In addition, Edegel claimed that if SUNAT disagreed with the valuation, it should have conducted its own appraisal, which it failed to do. On February 2, 2012, the Tax Court (TF) issued a ruling for the 1999 fiscal year in favor of two of Edegel’s power plants, and against four power plants, based on the fact that a verified financing was only evidenced for the first two power plants. Consequently, the TF ordered SUNAT to recalculate the taxes payable by Edegel, which amounted to €11 million that were paid by Edegel in June 2012. This amount will be recovered if Edegel obtains favorable rulings in the following claims it has subsequently filed: |
| | iii) | an administrative contentious claim before the Judicial System against the TF’s ruling, filed in May 2012 (which would result in a complete recovery of the taxes). |
| | iv) | a partial appeal against the recalculation that SUNAT performed according to TF’s ruling, on the basis that the recalculation was incorrect, filed in July 2012 (which would result in a partial recovery of the taxes). |
In August 2013, Edegel received notice of an unfavorable ruling with respect to claim i). Edegel filed an annulment appeal against the ruling, since the resolution violates its motivation right and it is untimely. In May 2015, Edegel received notice of the resolution of the Court of Appeal which annulled the resolution of the Judicial System.
For the 2000 to 2001 fiscal years, Edegel paid the equivalent of €5 million and made a provision of €1 million. Edegel filed new evidence in order to reduce the amount of that could be paid from €6 million to €1.3 million; however, the TF could determine that the evidence is inadmissible as untimely.
The taxes involved in these proceedings is S/. 122,556,694 (approximately ThCh$ 24,877,783), which is divided between the asset amount of S/. 59,819,819 (approximately ThCh$ 12,142,825) and the liability amount of S/. 62,736,874 (approximately ThCh$ 12,734,958).
F-220
| b) | Pending lawsuits of associates |
Enel Brasil S.A. (Enel Brasil) and subsidiaries
Enel Brasil
| 1. | The Brazilian Internal Revenue Service (IRS) claims an alleged underreporting of dividends by Endesa Brasil, now called Enel Brasil than it reported. The Brazilian IRS claims that the total amortization of goodwill (greater value) recorded by Enel Brasil in 2009 in the equity accounts, should have been recorded in the comprehensive income accounts. As a result, the procedure performed was inadequate and a greater profit would have been generated and consequently, a higher amount of dividends distributed. The alleged surplus in dividends was interpreted by the Brazilian IRS as payments to non-residents, which would be subject to a 15% income tax retained at the source. Enel Brasil responded that all the procedures adopted by Enel Brasil were based on the company’s interpretation and in accordance with Brazilian accounting standards (Brazilian GAAP), and confirmed by the external auditor and by a legal opinion from Souza Leão Advogados. Enel Brasil has filed its defense in the administrative first instance and is waiting for an administrative first instance ruling. The amount involved in this proceeding is R$ 212 million (approximately ThCh$ 48,427,160). |
Ampla Energia S.A. (Ampla)
| 1. | In Brazil, Basilus S/A Serviços, Empreendimentos e Participações (successor to Meridional S/A Serviços, Empreendimentos e Participações from 2008) is the holder of the litigation rights that it acquired from the construction companies Mistral and CIVEL, which had a civil works contract with Centrais Elétricas Fluminense S.A. (CELF). This contract was terminated before CELF’s privatization process. Since CELF’s assets were transferred to Ampla during the privatization process, Basilus (previously Meridional) sued Ampla in 1998, arguing that the transfer of the referred assets was done in detriment of its rights. Ampla only acquired assets from CELF, but is not its legal successor since CELF, a state-owned company, still exits and maintains its legal personality. Basilus demanded payment of pending invoices and contractual penalties for termination of the civil works contract. In March 2009, the court decided in favor of Basilus, and Ampla and the State of Río de Janeiro filed the corresponding appeals. On December 15, 2009, the State Court accepted the appeal and overturned the lower court’s decision obtained by Basilus, in Ampla’s favor. Basilus filed an appeal against the resolution, which was denied. In July 2010, Basilus filed an Appeal under Specific Court Regulations (Agravo Regimental) before the Superior Court of Justice of Brazil, which also rejected the appeal in August 2010. Seeking to overturn such decision, Basilus filed a Petition for Writ of Mandamus (Mandado de Seguranca), which was also rejected. In June 2011, Basilus filed an Appeal to Amendment of Judgment (Embargos de Declaração) in order to clarify a supposed omission by the Superior Court of Justice in the decision on the Petition for Writ of Mandamus, which was not accepted by the court. Against this decision, Basilus filed an Ordinary Appeal (Recurso Ordinario) before the Superior Court of Justice (in Brasilia). On March 28, 2012 the Reporting Justice decided the Ordinary Appeal in favor of Basilus. Ampla and the State of Río de Janeiro filed an Appeal under Specific Court Regulations against the Reporting Justice’s decision, which was accepted by the First Court Room of the Superior Court of Justice on August 28, 2012, determining that the Ordinary Appeal of the Petition for Writ of Mandamus must be submitted to the decision by an en banc session and not by a single Reporting Justice. Basilus challenged the decision. The decision of August 28, 2012 was published on December 10, 2012, and the Appeal to Amendment of Judgment had been filed by Ampla and the State of Río de Janeiro to remedy the existing error in its publication, in order to avoid future divergence. Basilus filed its arguments and on May 27, 2013, the Appeal to Amendment of Judgment filed by Ampla and the State of Río de Janeiro were accepted and the error corrected. Consequently, the proceeding is in its second legal instance with a decision favorable to Ampla and there are pending proceedings before the Superior Court of Law. The amount involved in this proceeding is estimated to be approximately R$ 1,096 million (approximately ThCh$ 250,359,280). |
| 2. | In December 2001, the Brazilian Federal Constitution was amended to apply the CONFINS tax (Contribuicao para o Financiamento da Seguridade Social), a tax levied on revenues, to electricity energy |
F-221
| | sales. The Constitution states that the changes on social contributions are effective 90 days after their publication. Ampla started to pay this COFINS tax in April 2002. However, the Brazilian IRS notified Ampla that the 90-day delay of entry into force is applied to statutory amendments, but are not applicable to constitutional amendments, which are effective immediately. In November 2007, the appeal filed before the Taxpayers Council (Consejo de Contribuyentes), the administrative appeals level, ruled against Ampla. In October 2008, Ampla filed a special appeal that was denied. On December 30, 2013, Ampla was notified of the decision to reject its position that the COFINS tax payments were not due for the period from December 2001 to March 2002 based on the Constitution providing that legislative changes are effective 90 days after their publication. Ampla filed a judicial proceeding to obtain a certification of fiscal good standing in order to continue receiving public funds and was required to post a bond for the tax debt. Under the new standard on surety bonds published in March 2014, the bond amount must be120% rather than the previous 130%, of the tax debt and the bond was reduced to € 44 million. Ampla submitted the new surety bond, complying with the new requirements. The Brazilian Treasury accepted the surety bond and granted the certification of fiscal good standing. The Brazilian Treasury submitted the fiscal execution and Ampla opposed its defense in July 2014. It is not necessary to submit a new surety bond since the bond posted to obtain the certification of fiscal good standing can be used for this proceeding. The amount involved in this case is estimated to be approximately R$ 142 million (approximately ThCh$ 32,437,060). |
| 3. | Companhia Brasileira de Antibióticos (Cibran) filed suit against Ampla in order to receive compensation for the loss of products and raw materials, machinery breakdown, among other things, that occurred as a consequence of poor service provided by Ampla between 1987 and May 1994, and compensation for moral damages. This litigation is related to other five actions filed by Cibran against Ampla based on power outages allegedly caused by Ampla in the period from 1987 to 1994, 1994 to 1999 and part of 2002. The judge decided to conduct a single expert assessment for these various claims, which was in part adverse to Ampla. Ampla challenged such assessment and requested a new expert assessment. On September 5, 2013, the judge rejected the prior petition, whereupon Ampla filed a Petition for Clarification of the Decision (Embargo de Aclaración) and subsequently a Special Appeal (Agravo de Instrumento), both of which were rejected by the court. Against the latter, Ampla filed a Special Appeal before the Superior Court of Justice, which is pending review. In September 2014, a first instance judgment in one of these proceedings ordered Ampla to pay compensation of R$ 200,000 (approximately ThCh$ 48,896) for moral damages, in addition to the payment of material damages caused due to failures in supply of service, which have to be assessed by an expert in the sentence execution stage. Ampla filed a Clarification Attachment against this ruling that was rejected. In December 2014, Ampla filed an appeal, currently pending decision. In the remaining proceedings, a first instance ruling is pending. The amount involved for all these cases is estimated to be approximately R$166 million (approximately ThCh$ 37,919,380). |
| 4. | In August 1996, Ampla obtained a favorable ruling granting it an exemption from paying the COFINS tax for the period prior to the 2001 amendment of the Brazilian Federal Constitution which expressly made electric power operations subject to the COFINS tax. Following the definite decision in favor of Ampla issued in 2010, the Brazilian Treasury attempted to overturn the 1996 decision favorable to Ampla through a recession action. Ampla refiled a suit originally filed in 1996 seeking a refund of its COFINS tax payments from April 1992 to June 1996, based on the favorable ruling in the first lawsuit described above. The suit seeking a refund of the COFINS tax had been suspended pending the resolution of the first lawsuit above. In June 2013, Ampla received a favorable decision entitling it to a refund of its COFINS tax payments for the periods requested. The Brazilian Treasury appealed the decision. In October 2014, the Court of the State of Río de Janeiro ordered a new trial since it considered that the Brazilian Treasury did not have the opportunity to manifest in the prior decision judgment. A new first instance judgment is expected. The sum Ampla has requested as a tax refund amounts to R$ 161 million (approximately ThCh$ 36,777,230). |
| 5. | Perma Industria de Bebidas (Perma) filed a lawsuit against Ampla based on the electric energy tariff adjustment applied by concessionaires based on Orders No. 38 and 45 granted by the National Department of Water and Electric Energy (DNAEE), in February 1986. The Orders authorized an increase of 20% over |
F-222
| | the tariff for industrial clients during the frozen price period, also implemented by the Federal Government through Decree Law No. 2283, of 28/02/1986. On April 16, 2010 a ruling rejected Perma’s request, and Perma filed an appeal against such ruling, which was accepted and Ampla was ordered to pay the amounts unduly collected during 1986. Ampla and Perma each filed a Special Appeal before the Supreme Court of Justice, which were rejected by means of “eligibility trial”. In July 2011, the parties filed a Special Appeal, which ruling by the court is pending. The amount involved is R$ 57,923,996 (approximately ThCh$ 13,231,578). |
| 6. | In 2002, the State of Río de Janeiro issued a decree stating that the ICMS (a tax similar to the Chilean Value Added Tax) should be paid and filed on the 10th, 20th and 30th days of the same month of the tax accrual. Ampla continued paying ICMS in accordance with the previous system (filing it within five days after the end of the month of its accrual) and did not adopt the new system between September 2002 and February 2005 due to cash flow issues. Additionally, Ampla filed a lawsuit to dispute the constitutionality of the new filing requirement. These lawsuits were unsuccessful, and Ampla has filed suit alleging constitutional violations before the Brazilian Supreme Federal Tribune. Since March 2005, Ampla has been paying the ICMS according to the new system. In September 2005, the IRF imposed on Ampla a penalty fee and interests due to the delay in filling the ICMS as set forth in the aforementioned decree of 2002. Ampla appealed the resolution before the Administrative Courts, based on the fiscal Amnesty Laws of the State of Río de Janeiro published in 2004 and 2005 (forgiving interest and penalties if the taxpayer paid the taxes due). Ampla alleges that if the aforementioned tax amnesties are found to be inapplicable to it, the law would punish taxpayers that are delayed only a few days in their tax payments (as in the case of Ampla) more harshly than those who failed to pay their taxes and later formally adopted the various tax amnesties and thus, regulate their tax situation through the filing of overdue unpaid taxes. |
On May 9, 2012, The “En Banc Council” (a special body within the Taxpayers Council, representing the last administrative instance) issued a judgment against Ampla. The decision was notified on August 29, 2012. Ampla appealed to the State Public Treasury (Hacienda Pública Estadual) using a special review procedure based on the equity principle, before the Governor of the State of Río de Janeiro. The appeal has not been resolved and, therefore, the tax should be suspended. However, the State of Río de Janeiro recorded the tax due in the Public Register as if demandable and, therefore, on November 12, 2012, Ampla was obliged to post a surety bond in the amount of € 101 million (R$ 293 million) in order to receive a certification of fiscal good standing to continue receiving public funds. On June 4, 2013, in a decision of second instance, the State Public Treasury obtained a ruling against Ampla’s surety bond. In September 2013, Ampla filed a letter of guarantee to substitute for the surety bond rejected by the court. However, Ampla reiterated to the attorney of the State, the petition of review, which is still pending decision. Despite this, the State Public Treasury submitted the fiscal execution and Ampla opposed its defense. It is not necessary to submit a new surety bond since the bond posted to obtain the certification of fiscal good standing can be used for this proceeding. The amount involved in this proceeding is R$ 269 million (approximately ThCh$ 61,447,670).
| 7. | In order to fund the purchase of Coelce in 1998, Ampla issued long-term debt abroad through securities called Fixed Rate Notes (FRNs) which were governed by a special tax regime whereby interest payments received by non-resident holders were exempt from taxation in Brazil, as long as the debt was issued with a minimum maturity of 8 years. In 2005, the Brazilian IRS notified Ampla that the special tax regime did not apply based on its understanding that prepayments were made before the stated maturity, due to the fact that Ampla had received financing in Brazil which was allocated to the FRN holders. Ampla argues that these two transactions are independent and legally valid. The non-application of the special tax regime means that Ampla would have failed to comply with its obligation to retain the tax and to record it as interest payments made to non-resident holders. The tax resolution was appealed and in 2007 the Taxpayers Council (Consejo de Contribuyentes), the administrative appeals level, annulled it. However, the Brazilian Internal Revenue Service (responsible for tax collection and compliance with tax laws) contested this decision before the Superior Chamber of Fiscal Resources (Cámara Superior de Recursos Fiscales), the final administrative appeals level, and on November 6, 2012, it ruled against Ampla. The decision was notified to Ampla on December 21, 2012. On December 28, 2012, Ampla filed a Petition for Clarification of the Decision |
F-223
| | (Embargo de Aclaración) before the Superior Chamber of Fiscal Resources in order to obtain a final resolution regarding contradictory points of the decision and to incorporate in it the relevant defense arguments that were omitted. The petition was denied. On October 15, 2013, Ampla was informed of the decision to deny the Petition for Clarification of the Decision filed on December 28, 2012. As a consequence, Ampla filed a judicial proceeding to obtain a certification of fiscal good standing in order to continue receiving public funds. Ampla was required to post a bond for the tax debt. Under the new standard on surety bonds published in March 2014, the bond amount must be 120%, rather than the previous 130%, of the tax debt and the bond was reduced to € 331 million. Ampla submitted the new surety bond, complying with the new requirements. The Brazilian Treasury accepted the surety bond and granted the certification of fiscal good standing. The Brazilian Treasury submitted the fiscal execution and Ampla opposed its defense on June 27, 2014. It is not necessary to submit a new surety bond since the bond posted to obtain the certification of fiscal good standing can be used for this proceeding. It is important to mention that the final unfavorable decision of the Superior Chamber of Fiscal Resources could lead to a possible criminal proceeding against some employees and managers of Ampla. The amount involved in this case is estimated to be approximately R$ 1,068 million (approximately ThCh$ 243,963,240). |
Companhia Energética do Ceará S.A. (Coelce)
| 1. | In 1982 under the framework of an electricity supply network expansion in Brazilian rural areas, which was financed principally by international development banks (IDBs), the then-state-owned Coelce executed contracts with 13 cooperatives at the request of the Brazilian government and the IDBs to implement this project. Under the contracts, Coelce operated and maintained the assets and paid a monthly fee, which was adjusted for inflation. These contracts were of indefinite length and failed to clearly identify the networks that were under their scope due the public nature of Coelce and the fact that they were often amended, creating confusion between the assets that were operated and maintained by Coelce, and the assets that were owned by it. After 13 years of regular performance of the lease by making payments adjusted for inflation, in 1995 Coelce started making payments without adjustment, and continued to do so after its privatization in 1998. In view of the foregoing, some of these cooperatives have filed claims against Coelce for the payment of the adjustment for inflation. Coelce’s defense is basically grounded on the argument that the adjustment is not applicable, since the assets lacked value due to their very extended useful lives, taking into consideration their depreciation, or, alternatively, if the assets were deemed to have any value, that said value would be very low since Coelce performed their replacement, extension and maintenance. The amount involved in this litigation is approximately R$ 161,742,815 (approximately ThCh$ 36,946,911). One of the plaintiffs in this litigation, Cooperativa de Eletrificação Rural do V do Acarau Ltda (Coperva), filed a review action requesting expert evaluation of the issue. Once the expert report was delivered, Coelce claimed there were technical inconsistencies therein and requested a new evaluation to be conducted, but the court denied the claim and ruled the “anticipated execution of the decision”, which entails the preliminary determination of the adjusted monthly payments Coelce should have made and ordering the immediate payment of the difference between such adjusted values and the values Coelce actually paid. An appeal has been filed and a precautionary measure has been obtained in favor of Coelce, staying the anticipated execution of the decision. On April 4, 2014 a court of first instance denied Coperva’s claims. Coperva filed an appeal which is pending decision. Another plaintiff in the litigation filed a review action in 2007, through which Coperva is attempting to readjust the lease value of its distribution lines (in the central region of the State of Ceará), to be calculated at 1% of the value of the asset leased, estimated by Coperca to be at R$ 15.6 million (approximately ThCh$ 3,563,508). This proceeding is in a first instance, and has not yet started the evidence presenting stage. The amount involved in this proceeding is estimated to be R$ 87,843,275 (approximately ThCh$ 20,066,039). In Coerce’s case, the review action was filed in 2006 and Coerce is attempting to readjust the lease value of its distribution lines (in the central region of the State of Ceará),to be calculated at 2% of the value of the asset leased. The amount involved in this proceeding is R$ 101,127,109 (approximately ThCh$ 23,100,466). This proceeding, as well as the one of for Coperva, has not been advanced by the plaintiff and both are in their first instance. |
F-224
| 2. | Vicunha do Nordeste S/A (Finobrasa) filed a lawsuit against Coelce by reason of the adjustment to the electric energy tariffs applied by concessionaires based on Orders No. 38 and 45 granted by the National Department of Water and Electric Energy (DNAEE), in February 1986. These Orders authorized an increase of 20% over the tariff for industrial clients during the frozen price period, also implemented by the Federal Government through Decree Law No. 2283 of February 28, 1986. The intention of the lawsuit is to declare such adjustment illegal, seeking to extend illegality effects until the present time. During the proceeding, Finobrasa filed another lawsuit with similar requests. Regarding the first process, Finobrasa obtained a final ruling against Coelce, which was ordered to pay the unduly collected amounts, extending the effects of such ruling until the present time, which does not coincide with the jurisprudence of the Supreme Court of Justice. Considering the above, Coelce filed a rescission action, which seeks to amend a final decision and may be filed up to 2 years after the final period to file appeals has ended. This is a new action, with extremely restrictive requirements and its proceeding is started on second instance, with the purpose of questioning an error in the decision, either any procedural defect or a substantial defect of rulings by supreme courts (which is the basis for this lawsuit). Regarding the second action, the judge dismissed it due to his pendency and matter adjudged, since both are similar petitions. For this reason, the purpose of the three lawsuits is the same, that is, to assess the wide or restrictive effect of the 1986 adjustment illegality. Coelce filed this Rescission Action in 1999, and on September 28, 2010 a ruling was issued and the “Civil United Chambers” unanimously declared that the illegality of the collection made by Coelce is limited to 9 months of 1986 (March to November). On September 30, 2015 a ruling rejected the Special Appeal filed by Finobrasa. The amounts involved are R$ 59,506,738 (approximately ThCh$ 13,593,124). |
| 3. | Lawsuits filed by Industria Barbalhense di Cemento Portland S.A. (IBACIP) against Coelce, by reason of the adjustment to the electric energy tariffs applied by concessionaires based on Orders No. 38 and 45 granted by the National Department of Water and Electric Energy (DNAEE), in February 1986. These Orders authorized an increase of 20% over the tariff for industrial clients during the frozen price period, also implemented by the Federal Government through Decree Law No. 2283, of 28/02/1986. The intention of the lawsuit is to obtain a refund of the values that the petitioner would have paid in excess for the use of electric energy by reason of the allegedly illegal 20% increase over the tariffs of industrial clients. On March 17, 2008 a ruling was issued declaring illegal to charge the tariff increased by the DNAEE Orders, but only with respect to the invoices issued within the period between March and November 1986. Both parties filed an Appeal against this ruling before the Court of Justice and they were both dismissed. Coelce has filed a Special Appeal with the Supreme Court of Justice, and the Court has not yet issued a decision. The amount involved is R$ 53,443,644 (approximately ThCh$ 12,208,132). |
| 4. | Collective lawsuit filed by Sindeletro against Coelce with the intention of obtaining a supplementary salary payment based on a 30% over the base salary for employees exposed to hazards. |
In its defense, Coelce sustains that the amendments made in the payment and determination of this salary supplement were legal, since they were the result of an analysis made by a Commission established for this purpose aimed to identify which activities were hazardous and which employees worked in such areas.
In the first instance the lawsuit was declared admissible, and Coelce was ordered to pay to all employees a hazardous salary supplement of 30% as of January 1, 1986. Also, it was ordered to pay attorney fees of 15% of the punishment value. Coelce filed an ordinary appeal with the Regional Labor Court (TRT).
In the second instance, the ordinary appeal filed by Coelce was partly accepted, it states that such supplement should not be paid to employees not performing hazardous activities. Also, it acknowledged that the percentage due for this hazardous salary supplement could be reduced according to the length of time of the employee’s exposure to hazards. Sindeletro filed a review appeal against this ruling in the second instance before the Supreme Labor Court (TST).
In the third instance, the TST accepted the review appeal filed by Sindeletro, rejecting the possibility of reducing the percentage based on a shorter length of time of exposure to hazards. The TST declared that if an employee has performed a hazardous activity the employee is entitled to receive a 30% supplement over
F-225
his or her base salary, regardless of whether the employee performed such hazardous activity only for one day or for the entire month. The TST ruling is based on the TST jurisprudence of its Statement 361 and is not subject to appeals.
The settlement phase (values assessment) has begun with the calculation delivered by Sindeletro. The figure involved amounts to R$ 67,000,000 (approximately ThCh$ 15,304,810).
| 5. | The State of Ceará filed complaints against Coelce for the periods 2003, and 2004 to 2010, since it considered that the ICMS calculation for fixed assets acquisition was incorrect. Specifically, the State of Río de Janeiro states that Coelce does not have all the necessary supporting documents and that some fixed assets were not devoted to the activity of electric energy production or distribution. In its defense, Coelce explains that (i) the corresponding legislation does not specify the different types of fixed assets that could be used for the ICMS credit purposes; (ii) such fixed assets are related to the main activity of the companies, even if they are used at the offices and administrative premises. It also intends to compare the credits with the acquisition invoices; Coelce filed an administrative defense. It was decided to request an expert report to determine the tax value after accepting some issues, such as ICMS credits over the public lighting assets. After ending the investigation, the proceeding will undergo a new trial. The first instance decision was partially favorable. A second instance appeal will be filed; the figure involved amounts to R$ 71 million (approximately ThCh$ 16,218,530). |
Compañía de Interconexión Energética S.A. (CIEN, subsidiary of our associate)
| 1. | In October 2009, Tractebel Energía S.A. sued CIEN claiming an alleged breach of the contract “Purchase & Sale Agreement for 300 MW of Firm Capacity with related energy originating from Argentina” signed in 1999 between CIEN and Centrais Geradoras do Sul do Brasil S.A (which is now known as Tractebel Energía). Tractebel Energía asked the court to order CIEN to pay a rescission penalty of R$ 117,666,976 (approximately ThCh$ 26,878,667) plus other fines due to the unavailability of energy. The breach allegedly occurred due to a failure by CIEN to ensure sufficient capacity as contracted with Tractebel Energía during the 20-year period, which allegedly took place beginning in March 2005. In May 2010, Tractebel Energía notified CIEN via a written statement, but not judicially, its intention to exercise step-in rights of Line I (30%). The proceeding is currently at the first instance. CIEN petitioned to join this proceeding with the lawsuit filed by it against Tractebel Energía in 2001, which involves a dispute relative to exchange rates and taxing issues. The petition to join both proceedings was rejected by the court. Subsequently, CIEN filed a request to suspend the proceeding for 180 days in order to avoid potentially divergent decisions. The court ordered the suspension of proceedings for one year pending the outcome of the other lawsuit of CIEN against Tractebel Energía. |
| 2. | In 2010, Furnas Centrais Eletricas S.A. filed a suit against CIEN, based on CIEN’s alleged breach of the contract “Firm Capacity Purchase with Related Energy for the purchase of 700 MW of firm capacity with related energy originating from Argentina”, which was signed in 1998 with a term of 20 years beginning in June 2000. In its lawsuit, Furnas requested a compensation of R$ 520,800,659 (approximately ThCh$ 118,966,495) corresponding to a rescission penalty included in the contract, plus adjustments and default interests, from the date of filing of the claim until actual payment. Furnas also requested for additional penalties based on the lack of availability of the “firm power and related energy” and for other damages to be determined upon the final decision. The first trial judgment denied the claims of Furnas for CIEN’s responsibility for breach of its contractual obligations. The Court recognized the existence of force majeure because of the energy crisis in Argentina. Regarding the foreign language documents presented by CIEN, the judge of first instance determined that those documents would be excluded from the lawsuit, which decision was confirmed by the 12th Civil Section of the State Court. CIEN has filed a Special Appeal (Recurso Especial) against this decision, which will be decided by the Superior Court of Justice. In addition to the foregoing, CIEN received a notice from Furnas, not at the judicial headquarters, indicating that in case of rescission due to CIEN’s breach, Furnas would have the right to acquire 70% of Line I. |
F-226
Endesa Fortaleza
| 1. | At the end of 2002, Endesa Fortaleza filed an action against the Brazilian federal government in order to obtain a ruling that considered imported goods for the turbo-generating units to be qualified as “Other Power Generating Units” under the applicable tax legislation, which would be entitled to a 0% rate of import tax (II) and industrialized products tax(IPI). Endesa Fortaleza obtained a preliminary favorable ruling in the principal proceeding which allows it to import goods at a 0% rate, provided it deposited the applicable taxes as a bond in the event of a final adverse ruling. To date, Endesa Fortaleza has obtained favorable rulings in an administrative proceeding and from the Superior Court of Justice (Brasilia), for its principal proceeding. In 2002, Endesa Fortaleza filed an action due to the tax increase from 0% to 14% applicable to the importation of generator. In this proceeding, Endesa Fortaleza obtained a favorable decision in the first and second instances. The Brazilian Treasury re-filed a proceeding and Endesa Fortaleza obtained a favorable ruling, which will allow it to recover the € 27 million (approximately ThCh$ 20,347,991) bond. In December 2014, Endesa Fortaleza recovered € 25.3 million (approximately ThCh$ 18,274,400) of the bond and the remaining € 1.7 million (approximately ThCh$ 685,290) of the bond is pending of recovery. The matter was resolved in favor of Endesa Fortaleza. |
| 2. | In February 2007, the Brazilian tax authorities audited Endesa Fortaleza regarding the payment of PIS/COFINS tax during December 2003 and from February 2004 to November 2004. The audit resulted in a claim alleging differences between the amounts stated in Endesa Fortaleza annual tax return (where the PIS/COFINS tax amounts were reported under the new non-accrued regime) and the amounts stated in monthly tax returns (where the amounts due were reported under an older accrual system). On appeal, the Taxpayer’s Council confirmed the validity of the compensations of credits resulting from the regime change of PIS/COFINS. The Brazilian Treasury can file a Special Appeal before the Superior Chamber of Fiscal Resources (Cámara Superior de Recursos Fiscales). The amount involved in this proceeding is R$ 85 million (approximately ThCh$ 19,416,550). |
| 31.4 | Financial restrictions |
As of December 31, 2014, Endesa Américas, on a stand-alone basis, had no debt obligations and is therefore not affected by any covenants or events of default. However, a number of the Combined Group’s loan agreements include the obligation to comply with certain financial covenants, which is normal in contracts of this nature. There are also affirmative and negative covenants requiring the monitoring of these commitments. In addition, there are restrictions in the agreements’ events-of-default clauses that must be complied with.
Financial covenants
Financial covenants are contractual commitments with respect to minimum or maximum financial ratios that the company is obliged to meet at certain periods of time (quarterly, annually, etc.). Most of the Combined Group’s financial covenants limit the level of indebtedness and evaluate the ability to generate cash flows in order to service the companies’ debts. Various companies are also required to certify these covenants periodically. The types of covenants and their respective limits vary according to the type of debt.
In Peru, the debt of Edegel S.A.A. (Edgel) includes the following covenants: Debt and Debt Coverage (Debt Ratio/EBITDA) Ratios. As of December 31, 2014, the most restrictive financial covenant for Edegel was the Debt/EBITDA Ratio corresponding to the finance lease with Scotiabank expiring in March 2017.
In Argentina, Central Costanera S.A. (Costanera) has just one covenant, the maximum debt, related to a borrowing from Credit Suisse First Boston International which matures in February 2016. The debt of Hidroeléctrica El Chocón S.A. (El Chocón) includes covenants related to Maximum Debt, Net Consolidated Equity, Interest Coverage, Debt Coverage (Debt Ratio/EBITDA) and a Leverage ratio. In the case of El Chocón, as of December 31, 2014, the Interest Coverage covenant (EBITDA/Financial Expenses) was in default, for the
F-227
loan with Standard Bank, Deutsche Bank and Itau, which expires in February 2016. El Chocón has made payments of principal owed and interest on a timely basis and has been negotiating with creditors for the granting of a waiver for the default. However, El Chocón has not received acceleration notices for its most recent failure to comply with the ratio. The latter do not represents a cross default risk or a breach for Endesa Américas.
In Colombia, the debt of Empresa Generadora de Energía Eléctrica S.A. (Emgesa) is not subject to compliance with financial covenants, a situation that also applies to the debt of the rest of the Combined Group’s companies not mentioned in this Note.
In most of the contracts, debt acceleration for non-compliance with these covenants does not occur automatically but is subject to certain conditions, such as a cure period.
As of December 31, 2014 and 2013, no company of the Combined Group was in default under their financial obligations summarized herein or other financial obligations whose defaults might trigger the acceleration of their financial commitments, with the exception of our power generation Argentine combined entities Hidroeléctrica El Chocón at the close of 2014 as mentioned above, and Costanera at the close of 2013.
Costanera had not made the biannual payments on a supplier loan with Mitsubishi Corporation since March of 2012, for a total US$107.1 million, including principal and interest. After a long period of negotiations, a restructuring agreement was signed on October 27, 2014. The main conditions of this restructuring include: the elimination of accrued interest as of September 30, 2014 of US$66 million; the rescheduling of the capital repayment of US$120.6 million over 18 years with a grace period of 12 months, to be fully repaid by December 15, 2032; a minimum annual capital repayment of US$3,000,000 in quarterly installments; an interest rate of 0.25% per annum; the maintaining of the pledge over assets; and restrictions on the payment of dividends. The preceding condition to making the agreement effective was that Central Costanera S.A. should pay US$5,000,000 of the debt due within 15 business days of signing the agreement; this was carried out on November 14, 2014.
None of this represents a cross default risk or a breach for Endesa Américas.
Central Costanera S.A. (Central Constanera)
| • | | Resolution 95/13 from the Argentine Energy Secretariat was published on March 26, 2013 making significant changes to the remunerations system for generating companies and other aspects of operations in the wholesale electricity market. Among the measures set forth in Argentine Energy Secretariat Resolution 529/14, published on May 23, 2014, is an update of the system for remunerating generation companies, replacing Appendices I, II and III of Resolution 95/13 and incorporating a new system for one-time maintenance remuneration that is determined monthly and is calculated on the basis of the total power generated. These funds will be used to finance major maintenance, subject to the approval of the Energy Secretariat. Nevertheless, our Argentine subsidiary Central Costanera still has a deficit in working capital, which is causing difficulties in its short-term financial equilibrium and compromising the company’s future ability to continue operating successfully and to maintain its assets. Central Costanera expects to correct the present situation depending on a favorable resolution of requests made to the Argentine government. |
F-228
The following sanctions have been received from administrative authorities:
| a) | Endesa Américas and combined entities |
Hidroeléctrica El Chocón S.A. (El Chocón)
| • | | For the year ended December 31, 2012, El Chocón was fined Th$3,069 Argentine pesos (approximately ThCh$217,766) by the Jurisdictional Authority of the Limay, Neuquén and Negro River Basins (Autoridad Jurisdiccional de las Cuencas de los Ríos Limay, Neuquén y Negro, AIC) for failure to comply with certain obligations contained in the Concession Agreement. The company has filed the respective appeal, so the ruling is not yet final. The AIC also fined El Chocón Th$43 Argentine pesos (approximately ThCh$3,051) for failure to submit required reports. On June 11, 2014, the company paid Th$58.91 Argentine pesos (approximately ThCh$4) in penalty interest on this fine. |
| • | | For the year ended December 31, 2013, the Electricity Regulatory Body (ENRE) imposed a fine of Th$20 Argentine pesos (approximately ThCh$1,419) on the company. El Chocón has filed an appeal. |
| • | | For the period between January 1, 2014 and March 31, 2014, ENRE imposed a fine of Th$11 Argentine pesos (approximately ThCh$781). El Chocón has filed an appeal. |
| • | | For the period between April 1, 2014 and June 30, 2014, ENRE imposed two fines amounting to Th$3 Argentine pesos (approximately ThCh$213). |
Central Costanera S.A. (Central Costanera)
| • | | During the 2012 year and until June 30, 2013, the company was issued two fines for a total amount of Th$47,949 Argentine pesos (approximately ThCh$3,402,299) by the General Customs Authority (Dirección General de Aduanas). Possible liability on the part of Mitsubishi is being assessed, in which case that amount could be claimed from this supplier. The ENRE also imposed two fines totaling Th$51 Argentine pesos (approximately ThCh$3,619). Central Costanera has filed an appeal. |
| • | | For the period from April 1, 2014 to June 30, 2014, ENRE imposed a fine of Th$40 Argentine pesos (approximately ThCh$2,843), which was paid on June 30, 2014. |
| • | | For the period from July 1, 2014 to December 31, 2014, ENRE imposed a fine of Th$102 Argentine pesos (approximately ThCh$7,238), which was paid on November 20, 2014. |
Edegel S.A.A. (Edegel)
| • | | In April 2011, Edegel was fined by the SUNAT (the Peruvian Tax Administration) for issues with the calculation of its 2006 income tax. The amount of the fines, restated as of December 31, 2014, was S/.10,162,561 (approximately ThCh$2,062,942). The company has filed an appeal, which is pending resolution by the Tax Court. |
| • | | In February 2012, the SUNAT ordered Edegel to pay S/.38,433,190.24 (ThCh$7,597,565) for omitted taxes plus interest and penalties in connection with an audit of its 1999 income tax that began in January of 2006. Edegel paid the penalty imposed by the SUNAT and filed an administrative claim disputing the assessment; a decision on the claim is pending. |
| • | | In August 2012, Edegel received a fine for a total of S/.18,250 (5 Tax Units, UIT, or approximately ThCh$3,704) from the Agency for the Supervision of Investment in Energy and Mining (OSINERGMIN) for the following violations: (i) CCIT violations for incorrectly calculating indicators and the compensation amount for voltage quality in the first half of 2011; (ii) not having met the deadline for submitting information on product quality for the same period; and (iii) having submitted empty RDI and RIN extension files. |
F-229
| | • | | In April 2013, Edegel received the following fines from the OSINERGMIN: (i) S/.7,604.57 (approximately ThCh$1,391) for failure to perform maintenance in a timely fashion on its thermal generation units for the last quarter of 2008; (ii) S/.200,941.48 (approximately ThCh$40,789) for failure to perform maintenance in a timely fashion on its hydraulic generation units for the last quarter of 2008; (iii) S/.40,700 (11 Tax Units, UIT) (approximately ThCh$8,261) for failure to submit technical justification in a timely fashion for the second quarter of 2008; and (iv) S/.106,073.17 (approximately ThCh$19,404) for failure to have its generation unit available after having been notified that it was required by the SEIN for the fourth quarter of 2008. |
| | • | | Edegel has not protested fines (i) and (iv) and paid them on May 2, 2013 in order to take advantage of early payment benefits. It has, however, appealed sanctions (ii) and (iii), and Edegel was notified on April 15, 2014 of Resolution 107-2014-OS/TASTEM-S1 issued by the OSINERGMIN’s Energy and Mining Sanctions Appeal Court declaring null and void the Management Resolution imposing the fine, as it did not have the authority to do so. The agency with competence in this area is the Electrical Oversight Management (Gerencia de Fiscalización Eléctrica). |
| | • | | Accordingly, on September 1, 2014, Edegel received notification of the OSINERGMIN’s Electrical Oversight Management Resolution 1380-2014 imposing on Edegel the same fines contained in the voided Management Resolution. Edegel has again protested, noting that sanctions (i) and (iv) had already been paid. |
| • | | In May 2013, Edegel was fined by the SUNAT for issues related to the determination of its 2007 tax payments. The amount of the fine, restated as of December 31, 2014, was S/.9,384,971 (approximately ThCh$1,905,095). An appeal filed with the Tax Court is pending. |
| • | | In June 2013, Edegel was notified by Electroperú S.A. of a penalty applied under contract no. 132991, “Additional Generation Capacity Service through Conversion of Equipment to the Dual Generation System”. The penalty, amounting to S/.481,104.53 (approximately ThCh$97,661), was applied for breach of the conditions for executing the service agreed under that contract. |
| • | | In July 2013, Edegel was fined S/.453.86 (approximately ThCh$90) by the OSINERGMIN for failure to perform maintenance on its hydraulic generation units in a timely fashion as required under number 6, “Procedure for Overseeing Availability and the Operating Conditions of SEIN Generating Units”. As the company paid the fine prior to the 15-day deadline, the fine was reduced to S/.340.40 (approximately ThCh$67). |
| • | | In July 2013, Edegel was fined S/.4,070 (approximately ThCh$805) by the OSINERGMIN for failure to submit the pertinent technical justification in a timely fashion as required under number 6 of the “Procedures for Overseeing Availability and the Operating Conditions of SEIN Generating Units”. As the company paid the fine prior to the 15-day deadline, the fine was reduced to S/.3,052.50 (approximately ThCh$603). |
| • | | In November 2013, Edegel was fined S/.37,000 (approximately ThCh$7,510 or 10 Tax Units – UIT) by the Callahuanca District Municipality (MDC) in Municipal Resolution 060-2013. The MDC imposed the sanction for failure to submit the technical inspection report on multidisciplinary civil defense safety as required under Law 29664 and its regulations. |
| • | | In November 2013, Edegel was fined by the SUNAT for issues with the calculation of its 2008 tax payments. The amount of the fine, restated as of December 31, 2014, was S/.1,695,331 (approximately ThCh$344,142). The appeal filed is pending resolution by the SUNAT. |
| | • | | In December 2013, Scotiabank Perú S.A.A., with whom Edegel has signed a lease agreement for the Santa Rosa Project, was fined by the SUNAT for duties allegedly unpaid in an import operation. The amount of the fine, restated as of December 31, 2014, was S/.13,515.230 (approximately ThCh$2,743). Scotiabank Perú S.A.A. filed the respective appeal in January 2014, pending before the Tax Court. |
| • | | In May 2014, Electrical Oversight Management Resolution No. 743-2014 issued by the OSINERGMIN on May 27, 2014, ordered Edegel to pay a fine of 0.50 tax units (UIT) for having violated the CCIT indicator, |
F-230
| | regarding compliance with the correct calculation of indicators and compensation amounts for voltage quality, in the second half of 2012. The fine was imposed in accordance with number 5.1.2, section B) of the Procedures for Supervising the Technical Standards for Electricity Service Quality and their Methodology Base. |
| • | | In June 2014, as a result of the inspection of its 2009 income tax return, Edegel corrected an omission made in determining the tax owed and paid a penalty of S/.2,070 (approximately ThCh$409). |
| • | | In September 2014, Edegel was fined by the SUNAT in connection with its 2009 income tax return for an amount restated as of September 30, 2014 of S/.315,230 (approximately ThCh$65,315). Edegel accepted the fine and proceeded to pay the penalty. |
Chinango S.A.C. (Chinango)
| • | | In October 2010, Chinango was fined by the District Municipality of San Ramón regarding the Alcabala tax imposed on the transfer of certain assets in the Simple Reorganization that took place between another combined subsidiary, Edegel S.A.A., and Chinango and which went into effect on May 31, 2009. The amount of the fine, restated as of December 31, 2014, was S/.1,786,533 (approximately ThCh$362,656). The appeal filed is pending resolution. |
| • | | In May 2012, Chinango received a fine totaling S/.40,150 (approximately ThCh$7,937 or 11 Taxation Units, UIT) from the OSINERGMIN for the following violations: (i) failure to meet the deadline for submitting information on product quality in NTCSE source files; and (ii) having submitted RIN and CII files with errors (incorrect information) in accordance with the Electricity Concessions Law. The fine was paid. |
| • | | In August 2012, Chinango received a fine totaling S/.18,250 (approximately ThCh$3,608 or five Taxation Units, UIT) from the OSINERGMIN for the following violations: (i) CCIT indicator violations; (ii) failure to submit information in a timely fashion; and (iii) having submitted two empty RIN and RD files. The fine was paid. |
| • | | In August 2012, Chinango received a fine totaling S/.29,200 (approximately ThCh$5,772 or eight Taxation Units, UIT) from the Appeals and Sanctions Court of the OSINERGMIN when it ruled as groundless the appeal filed by Chinango against Executive Management Resolution No. 014801 penalizing the failure to comply with the “Procedure for Overseeing the Technical Quality Standard for Electricity Services and its Base Methodology” (NTCSE) in the first half of 2010 and confirmed the Resolution in all of its details. The fine was paid. |
| • | | In January 2013, Chinango received a fine totaling S/.367,915 (approximately ThCh$76,232) from the SUNAT for issues with the determination of its 2010 income tax. The company challenged the measure despite paying a reduced fine in February 2013. The appeal filed is pending resolution by the Tax Court. |
| • | | In June 2013, Chinango was notified through Coactive Execution Resolution 0398-2012 of a fine of S/.3,800 (approximately ThCh$771) imposed by the OSINERGMIN for the following infractions: (i) failure to comply with the CCII indicator in the first half of 2010 as required under paragraph A of number 5.2.2 of the “Procedure for Overseeing the Technical Quality Standard for Electrical Services and its Base Methodology”; (ii) failure to comply with the CPCI indicator in the first half of 2010 as required under paragraph C) of number 5.2.2 of the “Procedure for Overseeing the Technical Quality Standard for Electrical Services and its Base Methodology”; and (iii) submitting empty service interruption reports (RIN and RDI files) for the first half of 2010 despite the interruptions affecting its customers, as required under Article 31 of the Electricity Concession Law. |
| • | | In September 2013, Chinango was notified through Electrical Oversight Management Resolution No. 19693 issued by the OSINERGMIN of a fine of S/.1,850 (approximately ThCh$366 or 0.50 Tax Units – UIT) for: (i) failure to submit voltage quality information in a timely fashion in the first half of 2012. As the fine was paid within fifteen (15) days of notification, it was reduced by 25%. |
F-231
| • | | In March 2014, Chinango was notified through Coactive Execution Resolution No. 0350-2014 that it must pay a balance of S/.12,100 (approximately ThCh$2,456) on a fine imposed by the OSINERGMIN. The total amount of the fine, imposed through sanction No. 014799-2012-OS/CG, was 11 tax units (UIT) or S/.48,800 (approximately ThCh$9,906). |
| • | | In January 2014, Chinango was fined S/.613,390 (approximately ThCh$122,542) by the SUNAT in connection with the determination of its 2011 income tax. The company challenged the decision despite paying a reduced fine in February 2014. The appeal was rejected under SUNAT Resolution dated December 2014, and Chinango has filed the appeal. |
Empresa Generadora de Energía Eléctrica S.A. (Emgesa)
| • | | In Resolution 10 of August 2012, the Colombian Institute of Anthropology and History (ICANH) imposed a fine of 200 minimum legal monthly salaries, CP113,340,000 (approximately ThCh$28,744) on the company since it determined that the company did not comply with standards and established procedures in cases of archaeological findings, between April 3 and April 6, 2011 in the area of the El Quimbo Hydroelectric Project. Emgesa filed an appeal against the resolution, but ICANH confirmed the fine in Resolution 149 of October 22, 2012. |
Enel Brasil S.A. and subsidiaries
Ampla Energía S.A. (Ampla)
| • | | For the period ended December 31, 2012, the company received one fine for RTh$2,863 (approximately ThCh$653,989) from the National Electrical Energy Agency (Agencia Nacional de Energía Eléctrica, ANEEL) for power consumption metering. In 2011, it received three fines totaling RTh$7,079 (approximately ThCh$1,617,041) for violation of telemarketing and energy sale tariff indicators. For the period ended December 31, 2012, Ampla was also fined RTh$7,478 (approximately ThCh$1,708,183) by the Federal Revenue Office (Secretaria de Receita Federal) for failure to meet tax obligations. The company has filed the respective appeals. |
The company received seven fines in 2013 totaling R$29,810,687 (approximately ThCh$6,809,591) from the National Electrical Energy Agency (ANEEL) due to problems with technical quality, erroneous evidence presented in inspections and for other reasons. The company appealed, and four fines are still awaiting final rulings. The other fines were either revoked or paid, for a total of R$143,601 (approximately ThCh$36,037). Only two fines were received in 2012 totaling R$3,557,786 (approximately ThCh$812,697), of which R$2,112,600 (approximately ThCh$530,159) have been paid.
| • | | In 2013, the company received 19 fines totaling R$120,204 * (approximately ThCh$27,457) from the environmental agencies (IBAMA, Instituto Brasileiro do Meio Ambiente e dos Recursos Naturais Renováveis, ICMBio – Instituto Chico Mendes de Conservação da Biodiversidade, INEA – Instituto Estadual de Ambiente and others) for unauthorized removal of vegetation, the death of animals through contact with the energy network, and construction in prohibited areas or without permission. The company filed appeals against almost all of the fines assessed, but no ruling has yet been given. Ampla has paid R$66,310 in fines (approximately ThCh$16,641). (*Clarification: The amount of some of the fines has not yet been determined; the amounts will be set after Ampla submits certain data.) The company had received 14 fines in 2012 for a total of R$76,426 (approximately ThCh$17,457). |
| • | | In 2013, the company received four fines totaling R$24,234 (approximately ThCh$5,535) from the Consumer Defense and Protection Agency (PROCON/RJ) due to problems in reimbursing improper charges and other irregularities. The company has filed appeals against all of the fines, and rulings are pending. Ampla had received three fines in 2012 for a total of R$20,840 (approximately ThCh$4,760); rulings on the appeals filed by the company against these sanctions are also pending. |
F-232
| • | | The company received one fine in 2013 from the employee defense agencies (SRTE) due to problems with formalities. The company filed an appeal, and the ruling is pending. The labor agencies have not specified the amount of the fine, which it does only after analyzing the appeal. Ampla had received five fines in 2012, for which rulings are also pending after appeals filed by the company. |
| • | | In 2014, the company received two fines from the National Electrical Energy Agency (ANEEL) for technical quality, totaling €6,759,518 (approximately ThCh$4,983,770). The company has appealed, and one was rejected, while the other is still pending resolution. Ampla has paid €1,202,986 (approximately ThCh$886,957). In 2013, Ampla was fined 7 times for service quality totaling €9,368,747 (approximately ThCh$6,907,545), and has paid €843,869 (approximately ThCh$622,181). There are two appeals pending, which were filed by Ampla against the 2013 fines. |
| • | | The company received 15 fines in 2014 totaling €80,263* (approximately ThCh$59,177) from the environmental agencies (ICMBio, Instituto Chico Mendes de Conservação da Biodiversidade and the INEA, Instituto Estadual de Medioambiente y órgano municipal del medioambiente) for unauthorized suppression of vegetation, the death of animals that have come in contact with the power network, waste dumping and power network construction in prohibited or unauthorized areas. The company has appealed almost all of the fines assessed, but no rulings have been handed down as yet. Ampla has paid €460 in fines. The company received 19 fines in 2013 totaling €35,940* (approximately ThCh$26,498) from the environmental agencies for the same violations as in 2014. The company filed appeals against almost all of the fines received, but no rulings have been handed down as yet. Ampla paid three fines totaling €19,826 (approximately ThCh$14,617) in 2013. |
| | (*) | Clarification: The amount of some of the fines has not yet been determined; the amounts will be set after Ampla submits certain data.) |
| • | | Ampla has received 14 fines in 2014 totaling €665,565 (approximately ThCh$490,718) from the Brazilian Consumer Defense and Protection Agency (Autarquía de Defensa a Protección del Consumidor, PROCON/RJ) for problems with the quality of its power supply. It has appealed against the fines, Only one appeal has been resolved, and Ampla has paid €1,958 (approximately ThCh$1,443). It received four fines totaling €7,616 (approximately ThCh$5,615) in 2013, for which appeals filed by Ampla also remain pending. |
| • | | In 2014, the company received four fines from the employee defense agencies (SRTE) against which it has filed administrative appeals. An appeal was rejected and Ampla has paid the amount of €61.74 (approximately ThCh$46); the others have not yet received rulings. In 2013, Ampla received one fine for €641 which has already been paid. |
Coelce
| • | | For the fiscal year ended December 31, 2012, the company received two fines totaling RTh$689 (approximately ThCh$157,387) from the National Electrical Energy Agency (ANEEL) for failure to comply with technical regulations. |
| • | | In 2013, the company received 32 fines totaling R$34,877,282 (approximately ThCh$7,966,942) from the National Electrical Energy Agency (ANEEL) or its local representative (ARCE) for accidents with third parties (there were seven), problems with technical quality, erroneous evidence submitted in inspections, irregularities with the Coelce Plus project, and other reasons. The company has filed appeals, and final decisions are pending on 26 sanctions. The other fines were either revoked or paid, for a total of R$395,125 (approximately ThCh$90,257). In 2012 Coelce had received 24 fines totaling R$53,810,352 (approximately ThCh$12,291,781), of which R$707,423 (approximately ThCh$177,529) have been paid; the final decision on 16 of the sanctions is pending. |
| • | | The company was not fined by the environmental agencies in 2013 and 2014 (IBAMA, Instituto Brasileiro do Meio Ambiente e dos Recursos Naturals Renováveis, and ICMBio, Instituto Chico Mendes de Conservação da Biodiversidade). |
F-233
| • | | Coelce received four fines in 2013 totaling R$21,837 (approximately ThCh$4,988) from the Consumer Defense and Protection Agency (PROCON/CE) for alleged violations of consumer rights. The company filed appeals against all of the fines, and one has yet to be resolved. The other appeals were rejected, and Coelce paid R$15,901 (approximately ThCh$3,990) in fines. Two fines for a total of R$12,953 (approximately ThCh$3,251) were received in 2012, which have been paid. |
| • | | The company received two fines in 2013 from the employee defense agencies (SRTE) due to problems with formalities. The appeal filed by the company was unsuccessful, and the amount of R$9,694 (approximately ThCh$2,433) was paid. The company was not fined by these agencies in 2012. |
| • | | The company has received eight fines in 2014 totaling €8,702,775 (approximately ThCh$6,416,527) from the National Electrical Energy Agency (ANEEL) or its local representative (ARCE) for accidents with third parties among the population, technical quality and errors in the asset base. Coelce has paid €16,319 for one of the fines and has filed appeals against the others. The company received 32 fines from ANEEL or ARCE in 2013 totaling €10,938,249 (approximately ThCh$8,064,734) for accidents with third parties among the population (there were seven), problems with technical quality, erroneous evidence presented during inspections, irregularities with the Coelce Plus Project and other reasons. The company filed appeals, of which 17 are still pending the final ruling. The other fines were either revoked or paid, for a total of €1,418,561 (approximately ThCh$1,045,900). |
| • | | The company has not been fined in 2013 and 2014 by the environmental agencies (IBAMA, Instituto Brasileiro do Meio Ambiente e dos Recursos Naturals Renováveis, and ICMBio, Instituto Chico Mendes de Conservação da Biodiversidade). |
| • | | Coelce has received four fines in 2014 totaling €24,743 (approximately ThCh$18,242) from the Brazilian Consumer Defense and Protection Agency (PROCON/CE) for allegedly failing to meet deadlines and for damaged equipment. The company has filed three administrative appeals and has paid one fine for €933. The company received four fines in 2013 from PROCON/CE totaling €7,220 (approximately ThCh$5,323) for allegedly violating consumers’ rights. The company appealed all of the sanctions, but they were rejected and Coelce has paid the fines. |
| • | | The company received six violation notifications from the employee defense agencies (SRTE) in 2014, for accidents suffered by workers. It received two fines in 2013 from the SRTE for failure to comply with formalities. Coelce paid €3,206 (approximately ThCh$2,363) for the 2013 fines. |
Cien
| • | | The company received one fine in 2013 for R$32,136 (approximately ThCh$7,340) from the National Electrical Energy Agency (ANEEL) for a formality (a failure to submit documentation). The company appealed, and the decision is pending. The company was not fined by this agency in 2012. |
| • | | The company has not been fined for other matters in 2012 and 2013 (environmental, consumer or labor). |
| • | | Cien has not been fined by the National Electrical Energy Agency (ANEEL) or by any other supervisory agency in 2014. In 2013, the company received one fine from the ANEEL for €10,100 (approximately ThCh$7,446) for a formality (a failure to present documentation). Cien filed an appeal, which was accepted, and the fine was cancelled by the judicial body. |
| • | | In 2014, the company received two fines from the employee defense agencies (SRTE) and the company has filed appeals against them. Cien has paid a fine of €61.74 (approximately Ch$45,521) and the appeal against the other fine has not yet been tried. In 2013, the company was not fined. |
| | • | | The company has not been fined for other matters in 2013 and 2014 (environmental or labor). |
The Company and its Board of Directors have not received other fines from the SVS nor from other administrative authorities.
F-234
Environmental expenses for the years ended December 31, 2014 and 2013 are as follows:
| | | | | | | | | | |
Company Incurring the Cost | | Project | | For the years ended | |
| | | 12-31-2014 | | | 12-31-2013 | |
| | | ThCh$ | | | ThCh$ | |
Edegel S.A.A. | | Environmental monitoring, waste management, mitigation, protection from radiation, vibration reduction, and restoration. | | | 975,993 | | | | 417,966 | |
| | | | | | | | | | |
Total | | | | | 975,993 | | | | 417,966 | |
| | | | | | | | | | |
F-235
| 34. | FINANCIAL INFORMATION ON COMBINED ENTITIES, SUMMARIZED |
As of and for the years ended December 31, 2014 and 2013, the summarized financial information of our principal combined entities under IFRS is as follows:
| | | | | | | | | | | | | | | | | | | | | | | | | | | | | | | | | | | | | | | | | | | | | | |
SUMMARY OF THE COMBINED GROUP CONSOLIDATION, BY COMBINED ENTITIES | |
| | | As of and for the year ended December 31, 2014 | |
| | | Financial
Statements | | Current
Assets | | | Non-current
Assets | | | Total Assets | | | Current
Liabilities | | | Non-current
Liabilities | | | Total
Liabilities | | | Revenues | | | Costs | | | Profit
(Loss) | | | Other
Comprehensive
Income | | | Total
Comprehensive
Income | |
| | | | | ThCh$ | | | ThCh$ | | | ThCh$ | | | ThCh$ | | | ThCh$ | | | ThCh$ | | | ThCh$ | | | ThCh$ | | | ThCh$ | | | ThCh$ | | | ThCh$ | |
Endesa Argentina S.A. | | Separate | | | 1,924,047 | | | | 42,081,267 | | | | 44,005,314 | | | | (749,815 | ) | | | — | | | | (749,815 | ) | | | 340,599 | | | | — | | | | 340,599 | | | | (5,299,756 | ) | | | (4,959,157 | ) |
Central Costanera S.A. | | Separate | | | 31,868,372 | | | | 154,649,134 | | | | 186,517,506 | | | | (108,956,607 | ) | | | (56,967,994 | ) | | | (165,924,601 | ) | | | 75,204,382 | | | | (29,671,728 | ) | | | 45,532,654 | | | | 3,989,198 | | | | 49,521,852 | |
Hidroinvest S.A. | | Separate | | | 562,612 | | | | 14,962,217 | | | | 15,524,829 | | | | (423,843 | ) | | | — | | | | (423,843 | ) | | | — | | | | (2,811 | ) | | | (2,811 | ) | | | (1,868,145 | ) | | | (1,870,956 | ) |
Hidroeléctrica El Chocón S.A. | | Separate | | | 22,930,536 | | | | 137,891,546 | | | | 160,822,082 | | | | (31,540,350 | ) | | | (46,058,232 | ) | | | (77,598,582 | ) | | | 30,178,802 | | | | (19,141,980 | ) | | | 11,036,822 | | | | (8,763,212 | ) | | | 2,273,610 | |
Southern Cone Power Argentina S.A. | | Separate | | | 4,162 | | | | 753,403 | | | | 757,565 | | | | (3,229 | ) | | | — | | | | (3,229 | ) | | | — | | | | (4,919 | ) | | | (4,919 | ) | | | (94,023 | ) | | | (98,942 | ) |
Empresa Generadora de Energía Eléctrica S.A. (Emgesa) | | Separate | | | 329,672,209 | | | | 1,782,307,979 | | | | 2,111,980,188 | | | | (500,414,812 | ) | | | (883,041,284 | ) | | | (1,383,456,096 | ) | | | 753,455,621 | | | | (464,634,223 | ) | | | 288,821,398 | | | | (73,145,883 | ) | | | 215,675,515 | |
Generandes Perú S.A. | | Separate | | | 3,473,185 | | | | 219,325,990 | | | | 222,799,175 | | | | (3,148,425 | ) | | | — | | | | (3,148,425 | ) | | | 46,503,610 | | | | — | | | | 46,503,610 | | | | 12,303,680 | | | | 58,807,290 | |
Edegel S.A.A. | | Separate | | | 110,164,628 | | | | 720,449,664 | | | | 830,614,292 | | | | (85,724,692 | ) | | | (235,667,176 | ) | | | (321,391,868 | ) | | | 319,399,578 | | | | (213,260,179 | ) | | | 106,139,399 | | | | 23,688,400 | | | | 129,827,799 | |
Chinango S.A.C. | | Separate | | | 8,439,096 | | | | 111,912,667 | | | | 120,351,763 | | | | (7,433,439 | ) | | | (39,382,244 | ) | | | (46,815,683 | ) | | | 34,656,130 | | | | (19,644,709 | ) | | | 15,011,421 | | | | 3,041,428 | | | | 18,052,849 | |
Grupo Generandes Perú | | Consolidated | | | 121,446,538 | | | | 816,077,565 | | | | 937,524,103 | | | | 95,676,185 | | | | (275,049,420 | ) | | | (179,373,235 | ) | | | 353,847,452 | | | | (242,497,338 | ) | | | 111,350,114 | | | | 23,990,135 | | | | 135,340,249 | |
Grupo Endesa Argentina | | Consolidated | | | 56,074,841 | | | | 297,050,238 | | | | 353,125,079 | | | | 140,459,888 | | | | (101,749,459 | ) | | | 38,710,429 | | | | 105,281,293 | | | | (48,769,700 | ) | | | 56,511,593 | | | | (5,660,609 | ) | | | 50,850,984 | |
| | | | | | | | | | | | | | | | | | | | | | | | | | | | | | | | | | | | | | | | | | | | | | |
SUMMARY OF THE COMBINED GROUP CONSOLIDATION, BY COMBINED ENTITIES | |
| | | As of and for the year ended December 31, 2013 | |
| | | Financial
Statements | | Current
Assets | | | Non-current
Assets | | | Total Assets | | | Current
Liabilities | | | Non-current
Liabilities | | | Total
Liabilities | | | Revenues | | | Costs | | | Profit
(Loss) | | | Other
Comprehensive
Income | | | Total
Comprehensive
Income | |
| | | | | ThCh$ | | | ThCh$ | | | ThCh$ | | | ThCh$ | | | ThCh$ | | | ThCh$ | | | ThCh$ | | | ThCh$ | | | ThCh$ | | | ThCh$ | | | ThCh$ | |
Endesa Argentina S.A. | | Separate | | | 1,796,454 | | | | 47,229,472 | | | | 49,025,926 | | | | (811,271 | ) | | | — | | | | (811,271 | ) | | | 2,541,610 | | | | — | | | | 2,541,610 | | | | (8,696,980 | ) | | | (6,155,370 | ) |
Central Costanera S.A. | | Separate | | | 30,153,983 | | | | 112,614,109 | | | | 142,768,092 | | | | (162,244,700 | ) | | | (9,452,339 | ) | | | (171,697,039 | ) | | | 94,887,720 | | | | (118,255,734 | ) | | | (23,368,014 | ) | | | 7,442,633 | | | | (15,925,381 | ) |
Hidroinvest S.A. | | Separate | | | 528,995 | | | | 16,812,785 | | | | 17,341,780 | | | | (369,837 | ) | | | — | | | | (369,837 | ) | | | 20,354 | | | | — | | | | 20,354 | | | | (3,526,947 | ) | | | (3,506,593 | ) |
Hidroeléctrica El Chocón S.A. | | Separate | | | 14,903,801 | | | | 132,833,440 | | | | 147,737,241 | | | | (21,069,801 | ) | | | (45,717,551 | ) | | | (66,787,352 | ) | | | 36,686,734 | | | | (25,681,727 | ) | | | 11,005,007 | | | | (16,110,208 | ) | | | (5,105,201 | ) |
Southern Cone Power Argentina S.A. | | Separate | | | 7,901 | | | | 846,585 | | | | 854,486 | | | | (1,209 | ) | | | — | | | | (1,209 | ) | | | — | | | | (14,112 | ) | | | (14,112 | ) | | | (178,479 | ) | | | (192,591 | ) |
Empresa Generadora de Energía Eléctrica S.A. (Emgesa) | | Separate | | | 321,051,970 | | | | 1,707,315,179 | | | | 2,028,367,149 | | | | (229,533,581 | ) | | | (864,631,943 | ) | | | (1,094,165,524 | ) | | | 639,770,439 | | | | (408,981,567 | ) | | | 230,788,872 | | | | 8,255,648 | | | | 239,044,520 | |
Generandes Perú S.A. | | Separate | | | 214,375 | | | | 202,971,423 | | | | 203,185,798 | | | | (10,853 | ) | | | — | | | | (10,853 | ) | | | 33,470,743 | | | | — | | | | 33,470,743 | | | | 450,172 | | | | 33,920,915 | |
Edegel S.A.A. | | Separate | | | 97,736,569 | | | | 678,847,872 | | | | 776,584,441 | | | | (98,497,242 | ) | | | (220,222,435 | ) | | | (318,719,677 | ) | | | 256,345,889 | | | | (175,933,003 | ) | | | 80,412,886 | | | | (6,517,312 | ) | | | 73,895,574 | |
Chinango S.A.C. | | Separate | | | 7,048,693 | | | | 104,913,829 | | | | 111,962,522 | | | | (11,790,622 | ) | | | (36,119,840 | ) | | | (47,910,462 | ) | | | 27,707,823 | | | | (17,541,290 | ) | | | 10,166,533 | | | | (1,599,071 | ) | | | 8,567,462 | |
Grupo Generandes Perú | | Consolidated | | | 104,859,262 | | | | 773,401,182 | | | | 878,260,444 | | | | 110,158,341 | | | | (256,342,275 | ) | | | (146,183,934 | ) | | | 283,613,705 | | | | (200,901,785 | ) | | | 82,711,920 | | | | (9,871,336 | ) | | | 72,840,584 | |
Grupo Endesa Argentina | | Consolidated | | | 46,120,168 | | | | 251,298,793 | | | | 297,418,961 | | | | 183,232,544 | | | | (54,121,669 | ) | | | 129,110,875 | | | | 131,443,285 | | | | (141,303,392 | ) | | | (9,860,107 | ) | | | (10,906,856 | ) | | | (20,766,963 | ) |
F-236
There are no subsequent events that have occurred between January 1, 2015 and the issuance date of these financial statements other than those include in theses combined financial statements.
F-237
APPENDIX 1 COMBINED GROUP COMPANIES
This appendix is part of Note 2.4, “Combined Entities”. It presents the Combined Group’s percentage of control in each combined entity.
| | | | | | | | | | | | | | | | | | | | | | | | | | | | | | | | | | | | | | | | | | | | |
Taxpayer ID No. | | Company (in alphabetical order) | | | | Percentage of control as of
12-31-2014 | | | Percentage of control as of
12-31-2013 | | | Percentage of control as of
1-1-2013 | | | Country | | Activity |
| | | Currency | | Direct | | | Indirect | | | Total | | | Direct | | | Indirect | | | Total | | | Direct | | | Indirect | | | Total | | | |
Foreign | | Chinango S.A.C. | | Sol | | | 0.00 | % | | | 80.00 | % | | | 80.00 | % | | | 0.00 | % | | | 80.00 | % | | | 80.00 | % | | | 0.00 | % | | | 80.00 | % | | | 80.00 | % | | Peru | | Electric energy generation, sales, and distribution |
Foreign | | Edegel S.A.A. | | Sol | | | 29.40 | % | | | 54.20 | % | | | 83.60 | % | | | 29.40 | % | | | 54.20 | % | | | 83.60 | % | | | 29.40 | % | | | 54.20 | % | | | 83.60 | % | | Peru | | Electric energy generation, sales, and distribution |
Foreign | | Empresa Generadora de Energía Eléctrica S.A. (1) | | CP | | | 56.43 | % | | | 0.00 | % | | | 56.43 | % | | | 56.43 | % | | | 0.00 | % | | | 56.43 | % | | | 56.43 | % | | | 0.00 | % | | | 56.43 | % | | Colombia | | Electric energy generation |
Foreign | | Emgesa Panama S.A. (1) | | US$ | | | 0.00 | % | | | 56.43 | % | | | 56.43 | % | | | 0.00 | % | | | 56.43 | % | | | 56.43 | % | | | 0.00 | % | | | 56.43 | % | | | 56.43 | % | | Colombia | | Electric energy purchases and sales |
Foreign | | Endesa Argentina S.A. | | Ar$ | | | 99.66 | % | | | 0.34 | % | | | 100.00 | % | | | 99.66 | % | | | 0.34 | % | | | 100.00 | % | | | 99.66 | % | | | 0.34 | % | | | 100.00 | % | | Argentina | | Portfolio company |
Foreign | | Central Costanera S.A. | | Ar$ | | | 24.85 | % | | | 50.82 | % | | | 75.67 | % | | | 24.85 | % | | | 50.82 | % | | | 75.67 | % | | | 12.33 | % | | | 57.43 | % | | | 69.76 | % | | Argentina | | Electric energy generation and sales |
Foreign | | Generandes Perú S.A. | | CP | | | 61.00 | % | | | 00.00 | % | | | 61.00 | % | | | 61.00 | % | | | 00.00 | % | | | 61.00 | % | | | 61.00 | % | | | 0.00 | % | | | 61.00 | % | | Peru | | Portfolio company |
Foreign | | Hidroeléctrica El Chocón S.A. | | Ar$ | | | 2.48 | % | | | 65.19 | % | | | 67.67 | % | | | 2.48 | % | | | 65.19 | % | | | 67.67 | % | | | 2.48 | % | | | 65.19 | % | | | 67.67 | % | | Argentina | | Electric energy production and sales |
Foreign | | Hidroinvest S.A. | | Ar$ | | | 41.94 | % | | | 54.15 | % | | | 96.09 | % | | | 41.94 | % | | | 54.15 | % | | | 96.09 | % | | | 41.94 | % | | | 54.15 | % | | | 96.09 | % | | Argentina | | Portfolio company |
Foreign | | Ingendesa do Brasil Ltda. | | Brazilian real | | | 1.00 | % | | | 99.00 | % | | | 100.00 | % | | | 1.00 | % | | | 99.00 | % | | | 100.00 | % | | | 1.00 | % | | | 99.00 | % | | | 100.00 | % | | Brazil | | Project engineering consulting |
Foreign | | Sociedad Portuaria Central Cartagena S.A. | | CP | | | 0.00 | % | | | 94.95 | % | | | 94.95 | % | | | 0.00 | % | | | 94.95 | % | | | 94.95 | % | | | 0.00 | % | | | 94.95 | % | | | 94.95 | % | | Colombia | | Investment, construction and maintenance of public or private wharves and ports |
Foreign | | Southern Cone Power Argentina S.A. | | Ar$ | | | 98.00 | % | | | 2.00 | % | | | 100.00 | % | | | 98.00 | % | | | 2.00 | % | | | 100.00 | % | | | 98.00 | % | | | 2.00 | % | | | 100.00 | % | | Argentina | | Portfolio company |
F-238
APPENDIX 2 ASSOCIATED COMPANIES AND JOINT VENTURES
This appendix is part of Note 2.5, “Investments in combined associated companies and joint arrangements”
| | | | | | | | | | | | | | | | | | | | | | | | | | | | | | | | | | | | | | | | | | | | | | | | |
Tax-payer ID No. | | Company
(in alphabetical order) | | Currency | | Ownership Interest as of
12-31-2014 | | | Ownership Interest as of
12-31-2013 | | | Ownership Interest as of
1-1-2013 | | | | | | | | |
| | | | Direct | | | Indirect | | | Total | | | Direct | | | Indirect | | | Total | | | Direct | | | Indirect | | | Total | | | Relationship | | | Country | | Activity |
Foreign | | Enel Brasil S.A. (1). | | Brazilian real | | | 34.64 | % | | | 4.00 | % | | | 38.64 | % | | | 34.64 | % | | | 4.00 | % | | | 38.64 | % | | | 36.27 | % | | | 4.18 | % | | | 40.45 | % | | | Associate | | | Brazil | | Portfolio company |
Foreign | | Endesa Cemsa S.A. | | Argentine peso | | | 0.00 | % | | | 45.00 | % | | | 45.00 | % | | | 0.00 | % | | | 45.00 | % | | | 45.00 | % | | | 0.00 | % | | | 45.00 | % | | | 45.00 | % | | | Associate | | | Argentina | | Wholesale purchase and sale of electric energy |
Foreign | | Distrilec Inversora S.A. (2) | | Argentine peso | | | 0.89 | % | | | 0.00 | % | | | 0.89 | % | | | 0.89 | % | | | 0.00 | % | | | 0.89 | % | | | 0.89 | % | | | 0.00 | % | | | 0.89 | % | | | Associate | | | Argentina | | Portfolio company |
| (1) | Change in legal name on December 12, 2014 from Endesa Brasil S.A. to Enel Brasil S.A. |
| (2) | There is a significant influence because our ultimate controlling company owns directly and indirectly a 51.5% interest in Distrilec Inversora S.A. |
F-239
APPENDIX 3 ADDITIONAL INFORMATION ON FINANCIAL DEBT
This appendix is part of Note 16, “Other financial liabilities”.
The following tables present the contractual undiscounted cash flows by type of financial debt:
| • | | Summary of bank borrowing by currency and maturity |
| | | | | | | | | | | | | | | | | | | | | | | | | | | | | | | | | | | | | | | | | | | | | | | | | | | | |
Country | | Currency | | | Effective
Interest
Rate | | | Nominal
Interest
Rate | | | Secured
(Yes/
No) | | | Balance as of 12-31-2014 | |
| | | | | | Current | | | Non-current | |
| | | | | | One to
three
months | | | Three to
twelve
months | | | Total
Current | | | One to two
years | | | Two to
three years | | | Three to
four years | | | Four to five
years | | | More than
five years | | | Total Non-
current | |
| | | | | | ThCh$ | | | ThCh$ | | | ThCh$ | | | ThCh$ | | | ThCh$ | | | ThCh$ | | | ThCh$ | | | ThCh$ | | | ThCh$ | |
Perú | | | US$ | | | | 3.01 | % | | | 2.93 | % | | | No | | | | 2,914,574 | | | | 9,996,364 | | | | 12,910,938 | | | | 40,274,383 | | | | 18,781,256 | | | | 16,391,794 | | | | 256,394 | | | | — | | | | 75,703,827 | |
Argentina | | | US$ | | | | 13.33 | % | | | 13.03 | % | | | No | | | | 2,808,939 | | | | 12,054,341 | | | | 14,863,280 | | | | 1,039,398 | | | | — | | | | — | | | | — | | | | — | | | | 1,039,398 | |
Argentina | | | Ar$ | | | | 34.36 | % | | | 35.13 | % | | | No | | | | 4,667,574 | | | | 8,107,262 | | | | 12,774,836 | | | | 7,968,912 | | | | 188,784 | | | | — | | | | — | | | | — | | | | 8,157,696 | |
Colombia | | | CP | | | | 8.29 | % | | | 8.13 | % | | | No | | | | 1,401,291 | | | | 4,203,875 | | | | 5,605,166 | | | | 10,766,379 | | | | 15,367,075 | | | | 14,619,719 | | | | 13,872,363 | | | | 48,015,897 | | | | 102,641,433 | |
| | | | | | | | | | | | | | | | | | | | | | | | | | | | | | | | | | | | | | | | | | | | | | | | | | | | |
| | | | | | | | | | | | | | | Total | | | | 11,792,378 | | | | 34,361,842 | | | | 46,154,220 | | | | 60,049,072 | | | | 34,337,115 | | | | 31,011,513 | | | | 14,128,757 | | | | 48,015,897 | | | | 187,542,354 | |
| | | | | | | | | | | | | | | | | | | | | | | | | | | | | | | | | | | | | | | | | | | | | | | | | | | | |
| | | | | | | | | | | | | | | | | | | | | | | | | | | | | | | | | | | | | | | | | | | | | | | | | | | | |
Country | | Currency | | | Effective
Interest
Rate | | | Nominal
Interest
Rate | | | Secured
(Yes/
No) | | | Balance as of 12-31-2013 | |
| | | | | | Current | | | Non-current | |
| | | | | | One to
three
months
ThCh$ | | | Three to
twelve
months
ThCh$ | | | Total
Current
ThCh$ | | | One to
two years
ThCh$ | | | Two to
three
years
ThCh$ | | | Three to
four
years
ThCh$ | | | Four to
five years
ThCh$ | | | More
than
five years
ThCh$ | | | Total Non-
current
ThCh$ | |
Peru | | | US$ | | | | 2.81 | % | | | 2.78 | % | | | No | | | | 3,055,656 | | | | 4,146,020 | | | | 7,201,676 | | | | 10,047,517 | | | | 14,963,210 | | | | 15,340,751 | | | | 13,282,260 | | | | — | | | | 53,633,738 | |
Argentina | | | US$ | | | | 9.59 | % | | | 9.31 | % | | | No | | | | 3,542,419 | | | | 8,408,627 | | | | 11,951,046 | | | | 1,641,372 | | | | — | | | | — | | | | — | | | | — | | | | 1,641,372 | |
Argentina | | | Ar$ | | | | 31.73 | % | | | 28.22 | % | | | No | | | | 14,276,066 | | | | 4,487,398 | | | | 18,763,464 | | | | 6,898,796 | | | | 4,852,373 | | | | — | | | | — | | | | — | | | | 11,751,169 | |
Colombia | | | CP | | | | 6.95 | % | | | 6.84 | % | | | No | | | | 1,431,306 | | | | 4,293,917 | | | | 5,725,223 | | | | 5,725,223 | | | | 11,271,083 | | | | 16,244,420 | | | | 15,481,057 | | | | 65,954,840 | | | | 114,676,623 | |
| | | | | | | | | | | | | | | | | | | | | | | | | | | | | | | | | | | | | | | | | | | | | | | | | | | | |
| | | | | | | | | | | | | | | | | | | 22,305,447 | | | | 21,335,962 | | | | 43,641,409 | | | | 24,312,908 | | | | 31,086,666 | | | | 31,585,171 | | | | 28,763,317 | | | | 65,954,840 | | | | 181,702,902 | |
| | | | | | | | | | | | | | | | | | | | | | | | | �� | | | | | | | | | | | | | | | | | | | | | | | | | | | |
| | | | | | | | | | | | | | | | | | | | | | | | | | | | | | | | | | | | | | | | | | | | | | | | | | | | |
Country | | Currency | | | Effective
Interest
Rate | | | Nominal
Interest
Rate | | | Secured
(Yes/
No) | | | Balance as of 1-1-2013 | |
| | | | | | Current | | | Non-current | |
| | | | | | One to
three
months
ThCh$ | | | Three to
twelve
months
ThCh$ | | | Total
Current
ThCh$ | | | One to
two years
ThCh$ | | | Two to
three
years
ThCh$ | | | Three to
four
years
ThCh$ | | | Four to
five years
ThCh$ | | | More
than
five years
ThCh$ | | | Total Non-
current
ThCh$ | |
Peru | | | US$ | | | | 3.54 | % | | | 3.49 | % | | | No | | | | 2,214,895 | | | | 1,865,048 | | | | 4,079,943 | | | | 4,840,923 | | | | 9,332,578 | | | | 13,773,959 | | | | 14,056,855 | | | | 12,109,598 | | | | 54,113,913 | |
Argentina | | | US$ | | | | 9.09 | % | | | 8.91 | % | | | No | | | | 6,645,902 | | | | 5,093,612 | | | | 11,739,514 | | | | 6,342,124 | | | | 1,494,591 | | | | | | | | | | | | | | | | 7,836,715 | |
Argentina | | | Ar$ | | | | 23.18 | % | | | 21.63 | % | | | No | | | | 19,209,089 | | | | 10,912,241 | | | | 30,121,330 | | | | 6,730,477 | | | | 2,020,148 | | | | | | | | | | | | | | | | 8,750,625 | |
Colombia | | | CP | | | | 9.41 | % | | | 9.20 | % | | | No | | | | 1,900,127 | | | | 5,700,379 | | | | 7,600,506 | | | | 7,600,504 | | | | 18,189,651 | | | | 17,176,251 | | | | 16,162,850 | | | | 60,191,993 | | | | 119,321,249 | |
| | | | | | | | | | | | | | | | | | | | | | | | | | | | | | | | | | | | | | | | | | | | | | | | | | | | |
| | | | | | | | | | | | | | | | | | | 29,970,013 | | | | 23,571,280 | | | | 53,541,293 | | | | 25,514,028 | | | | 31,036,968 | | | | 30,950,210 | | | | 30,219,705 | | | | 72,301,591 | | | | 190,022,502 | |
| | | | | | | | | | | | | | | | | | | | | | | | | | | | | | | | | | | | | | | | | | | | | | | | | | | | |
F-240
| • | | Identification of bank borrowings by company |
| | | | | | | | | | | | | | | | | | | | | | | | | | | | | | | | | | | | | | | | | | | | | | | | | | | | | | | | | | | | |
Taxpayer ID No. (RUT) | | Company | | Country | | ID No.
Financial
Institution | | | Financial Institution | | Country | | Currency | | | Effective
Interest
Rate | | | Nominal
Interest
Rate | | | Balance as of 12-31-2014 | |
| | | | | | | | | | Current | | | Non-current | |
| | | | | | | | | | One to
three
months | | | Three to
twelve
months | | | Total
Current | | | One to
two years | | | Two to
three
years | | | Three to
four years | | | Four to
five years | | | More
than five
years | | | Total Non-
current | |
| | | | | | | | | | ThCh$ | | | ThCh$ | | | ThCh$ | | | ThCh$ | | | ThCh$ | | | ThCh$ | | | ThCh$ | | | ThCh$ | | | ThCh$ | |
Foreign | | Chinango S.A.C. | | Peru | | | Foreign | | | Banco Scotiabank | | Peru | | | US$ | | | | 4.08 | % | | | 3.93 | % | | | 353,913 | | | | 1,051,014 | | | | 1,404,927 | | | | 1,376,324 | | | | 1,347,722 | | | | 15,345,293 | | | | — | | | | — | | | | 18,069,339 | |
Foreign | | Chinango S.A.C. | | Peru | | | Foreign | | | Bank Of Nova Scotia | | Peru | | | US$ | | | | 3.07 | % | | | 2.97 | % | | | 411,404 | | | | 1,217,828 | | | | 1,629,232 | | | | 1,585,546 | | | | 1,541,859 | | | | — | | | | — | | | | — | | | | 3,127,405 | |
Foreign | | Chinango S.A.C. | | Peru | | | Foreign | | | Bank Of Nova Scotia | | Peru | | | US$ | | | | 3.48 | % | | | 3.40 | % | | | 289,876 | | | | 857,071 | | | | 1,146,947 | | | | 1,113,465 | | | | 1,079,983 | | | | 1,046,501 | | | | 256,394 | | | | — | | | | 3,496,343 | |
Foreign | | Edegel S.A.A | | Peru | | | Foreign | | | Banco Continental | | Peru | | | US$ | | | | 3.44 | % | | | 3.36 | % | | | 1,807,054 | | | | 6,713,471 | | | | 8,520,525 | | | | 14,284,700 | | | | 14,811,692 | | | | — | | | | — | | | | — | | | | 29,096,392 | |
Foreign | | Edegel S.A.A | | Peru | | | Foreign | | | Bank Nova Scotia | | Peru | | | US$ | | | | 0.97 | % | | | 0.97 | % | | | 52,327 | | | | 156,980 | | | | 209,307 | | | | 21,914,348 | | | | — | | | | — | | | | — | | | | — | | | | 21,914,348 | |
Foreign | | Emgesa S.A. E.S.P. | | Colombia | | | Foreign | | | BBVA Colombia | | Colombia | | | CP | | | | 8.39 | % | | | 8.22 | % | | | 1,027,774 | | | | 3,083,323 | | | | 4,111,097 | | | | 7,918,549 | | | | 11,314,891 | | | | 10,766,745 | | | | 10,218,598 | | | | 35,392,929 | | | | 75,611,712 | |
Foreign | | Emgesa S.A. E.S.P. | | Colombia | | | Foreign | | | Banco Corpbanca | | Colombia | | | CP | | | | 8.19 | % | | | 8.03 | % | | | 373,517 | | | | 1,120,552 | | | | 1,494,069 | | | | 2,847,830 | | | | 4,052,184 | | | | 3,852,974 | | | | 3,653,765 | | | | 12,622,968 | | | | 27,029,721 | |
Foreign | | Endesa Argentina S.A. | | Argentina | | | Foreign | | | Citibank | | Argentina | | | Ar$ | | | | 30.00 | % | | | 30.00 | % | | | 749,636 | | | | — | | | | 749,636 | | | | — | | | | — | | | | — | | | | — | | | | — | | | | — | |
Foreign | | Central Costanera S.A. | | Argentina | | | Foreign | | | Banco Galicia | | Argentina | | | Ar$ | | | | 35.75 | % | | | 42.24 | % | | | 308,554 | | | | 836,632 | | | | 1,145,186 | | | | 990,314 | | | | — | | | | — | | | | — | | | | — | | | | 990,314 | |
Foreign | | Central Costanera S.A. | | Argentina | | | Foreign | | | Banco Itaú Argentina | | Argentina | | | Ar$ | | | | 37.50 | % | | | 44.68 | % | | | 119,500 | | | | 337,442 | | | | 456,942 | | | | 390,884 | | | | 27,716 | | | | — | | | | — | | | | — | | | | 418,600 | |
Foreign | | Central Costanera S.A. | | Argentina | | | Foreign | | | Banco Santander Río | | Argentina | | | Ar$ | | | | 32.00 | % | | | 37.14 | % | | | 70,593 | | | | 200,874 | | | | 271,467 | | | | 236,632 | | | | 17,012 | | | | — | | | | — | | | | — | | | | 253,644 | |
Foreign | | Central Costanera S.A. | | Argentina | | | Foreign | | | Banco Supervielle | | Argentina | | | Ar$ | | | | 35.00 | % | | | 41.21 | % | | | 112,554 | | | | 319,053 | | | | 431,607 | | | | 372,729 | | | | 26,615 | | | | — | | | | — | | | | — | | | | 399,344 | |
Foreign | | Central Costanera S.A. | | Argentina | | | Foreign | | | Citibank | | Argentina | | | Ar$ | | | | 32.50 | % | | | 37.81 | % | | | 347,807 | | | | 998,639 | | | | 1,346,446 | | | | 1,199,174 | | | | 87,541 | | | | — | | | | — | | | | — | | | | 1,286,715 | |
Foreign | | Central Costanera S.A. | | Argentina | | | Foreign | | | Credit Suisse International | | Argentina | | | US$ | | | | 13.25 | % | | | 13.92 | % | | | 122,704 | | | | 2,324,204 | | | | 2,446,908 | | | | 1,039,398 | | | | — | | | | — | | | | — | | | | — | | | | 1,039,398 | |
Foreign | | Central Costanera S.A. | | Argentina | | | Foreign | | | ICB Argentina | | Argentina | | | Ar$ | | | | 36.00 | % | | | 42.59 | % | | | 132,215 | | | | 371,509 | | | | 503,724 | | | | 425,630 | | | | 29,900 | | | | — | | | | — | | | | — | | | | 455,530 | |
Foreign | | H. El Chocón S.A. | | Argentina | | | Foreign | | | Deutsche Bank | | Argentina | | | US$ | | | | 13.35 | % | | | 12.73 | % | | | 1,331,375 | | | | 4,844,938 | | | | 6,176,313 | | | | — | | | | — | | | | — | | | | — | | | | — | | | | — | |
Foreign | | H. El Chocón S.A. | | Argentina | | | Foreign | | | Standard Bank | | Argentina | | | US$ | | | | 13.35 | % | | | 12.73 | % | | | 667,376 | | | | 2,425,364 | | | | 3,092,740 | | | | — | | | | — | | | | — | | | | — | | | | — | | | | — | |
Foreign | | H. El Chocón S.A. | | Argentina | | | Foreign | | | Banco Itau | | Argentina | | | US$ | | | | 13.35 | % | | | 12.73 | % | | | 687,484 | | | | 2,459,835 | | | | 3,147,319 | | | | — | | | | — | | | | — | | | | — | | | | — | | | | — | |
Foreign | | H. El Chocón S.A. | | Argentina | | | Foreign | | | Banco Macro | | Argentina | | | Ar$ | | | | 30.72 | % | | | 28.00 | % | | | 1,522,852 | | | | — | | | | 1,522,852 | | | | — | | | | — | | | | — | | | | — | | | | — | | | | — | |
Foreign | | H. El Chocón S.A. | | Argentina | | | Foreign | | | Banco Santander—Sindicado IV | | Argentina | | | Ar$ | | | | 35.26 | % | | | 31.36 | % | | | 306,765 | | | | 1,185,867 | | | | 1,492,632 | | | | 1,023,289 | | | | — | | | | — | | | | — | | | | — | | | | 1,023,289 | |
Foreign | | H. El Chocón S.A. | | Argentina | | | Foreign | | | Banco Itau- Sindicado IV | | Argentina | | | Ar$ | | | | 35.26 | % | | | 31.36 | % | | | 273,493 | | | | 1,057,510 | | | | 1,331,003 | | | | 912,706 | | | | — | | | | — | | | | — | | | | — | | | | 912,706 | |
Foreign | | H. El Chocón S.A. | | Argentina | | | Foreign | | | Banco Galicia—Sindicado IV | | Argentina | | | Ar$ | | | | 35.26 | % | | | 31.36 | % | | | 262,403 | | | | 1,014,727 | | | | 1,277,130 | | | | 875,846 | | | | — | | | | — | | | | — | | | | — | | | | 875,846 | |
Foreign | | H. El Chocón S.A. | | Argentina | | | Foreign | | | Banco Hipotecario—Sindicado IV | | Argentina | | | Ar$ | | | | 35.26 | % | | | 31.36 | % | | | 86,271 | | | | 335,251 | | | | 421,522 | | | | 290,454 | | | | — | | | | — | | | | — | | | | — | | | | 290,454 | |
Foreign | | H. El Chocón S.A. | | Argentina | | | Foreign | | | Banco Ciudad -Sindicado IV | | Argentina | | | Ar$ | | | | 35.26 | % | | | 31.36 | % | | | 34,894 | | | | 135,536 | | | | 170,430 | | | | 117,383 | | | | — | | | | — | | | | — | | | | — | | | | 117,383 | |
Foreign | | H. El Chocón S.A. | | Argentina | | | Foreign | | | ICB Argentina | | Argentina | | | Ar$ | | | | 35.26 | % | | | 31.36 | % | | | 340,037 | | | | 1,314,222 | | | | 1,654,259 | | | | 1,133,871 | | | | — | | | | — | | | | — | | | | — | | | | 1,133,871 | |
| | | | | | | | | | | | | | | | | | | | | | | | | | | | | | | | | | | | | | | | | | | | | | | | | | | | | | | | | | | | |
| | | | | | | | | | Total ThCh$ | | | | | | | | | | | | | | | | | 11,792,378 | | | | 34,361,842 | | | | 46,154,220 | | | | 60,049,072 | | | | 34,337,115 | | | | 31,011,513 | | | | 14,128,757 | | | | 48,015,897 | | | | 187,542,354 | |
| | | | | | | | | | | | | | | | | | | | | | | | | | | | | | | | | | | | | | | | | | | | | | | | | | | | | | | | | | | | |
| | | | | | | | | | | | | | | | | | | | | | | | | | | | | | | | | | | | | | | | | | | | | | | | | | | | | | | | | | | | |
Taxpayer ID No. (RUT) | | Company | | Country | | ID No.
Financial
Institution | | | Financial Institution | | Country | | Currency | | | Effective
Interest
Rate | | | Nominal
Interest
Rate | | | Balance as of 12-31-2013 | |
| | | | | | | | | | Current | | | Non-current | |
| | | | | | | | | | One to
three
months | | | Three to
twelve
months | | | Total
Current | | | One to
two years | | | Two to
three
years | | | Three to
four years | | | Four to
five years | | | More
than five
years | | | Total Non-
current | |
| | | | | | | | | | ThCh$ | | | ThCh$ | | | ThCh$ | | | ThCh$ | | | ThCh$ | | | ThCh$ | | | ThCh$ | | | ThCh$ | | | ThCh$ | |
Foreign | | Chinango S.A.C. | | Peru | | | Foreign | | | Banco Scotiabank | | Peru | | | US$ | | | | 3.85 | % | | | 3.80 | % | | | 316,892 | | | | 941,120 | | | | 1,258,012 | | | | 1,232,527 | | | | 1,207,041 | | | | 1,181,556 | | | | 13,282,260 | | | | — | | | | 16,903,384 | |
Foreign | | Chinango S.A.C. | | Peru | | | Foreign | | | Bank Of Nova Scotia | | Peru | | | US$ | | | | 4.02 | % | | | 3.96 | % | | | 366,751 | | | | 1,085,588 | | | | 1,452,339 | | | | 1,413,234 | | | | 1,374,130 | | | | 1,335,025 | | | | — | | | | — | | | | 4,122,389 | |
Foreign | | Chinango S.A.C. | | Peru | | | Foreign | | | Banco Scotiabank | | Peru | | | US$ | | | | 0.76 | % | | | 0.78 | % | | | 2,103,523 | | | | — | | | | 2,103,523 | | | | — | | | | — | | | | — | | | | — | | | | — | | | | — | |
Foreign | | Edegel S.A.A | | Peru | | | Foreign | | | Banco Continental | | Peru | | | US$ | | | | 3.42 | % | | | 3.38 | % | | | 268,490 | | | | 2,119,312 | | | | 2,387,802 | | | | 7,401,756 | | | | 12,382,039 | | | | 12,824,170 | | | | — | | | | — | | | | 32,607,965 | |
Foreign | | Empresa Generadora de Energía Eléctrica S.A. | | Colombia | | | Foreign | | | Banco Corpbanca | | Colombia | | | CP | | | | 7.01 | % | | | 6.90 | % | | | 380,303 | | | | 1,140,909 | | | | 1,521,212 | | | | 1,521,212 | | | | 2,975,864 | | | | 4,278,394 | | | | 4,075,566 | | | | 17,335,406 | | | | 30,186,442 | |
Foreign | | Empresa Generadora de Energía Eléctrica S.A. | | Colombia | | | Foreign | | | BBVA Colombia | | Colombia | | | CP | | | | 6.89 | % | | | 6.78 | % | | | 1,051,003 | | | | 3,153,008 | | | | 4,204,011 | | | | 4,204,011 | | | | 8,295,219 | | | | 11,966,026 | | | | 11,405,491 | | | | 48,619,434 | | | | 84,490,181 | |
Foreign | | Endesa Argentina S.A. | | Argentina | | | Foreign | | | Citibank | | Argentina | | | Ar$ | | | | 21.50 | % | | | 21.50 | % | | | 809,763 | | | | — | | | | 809,763 | | | | — | | | | — | | | | — | | | | — | | | | — | | | | — | |
Foreign | | Central Costanera S.A. | | Argentina | | | Foreign | | | Banco Ciudad | | Argentina | | | Ar$ | | | | 25.59 | % | | | 23.00 | % | | | 98,467 | | | | — | | | | 98,467 | | | | — | | | | — | | | | — | | | | — | | | | — | | | | — | |
Foreign | | Central Costanera S.A. | | Argentina | | | Foreign | | | Banco Galicia | | Argentina | | | Ar$ | | | | 35.75 | % | | | 42.24 | % | | | 2,514,705 | | | | — | | | | 2,514,705 | | | | — | | | | — | | | | — | | | | — | | | | — | | | | — | |
Foreign | | Central Costanera S.A. | | Argentina | | | Foreign | | | Banco Itau | | Argentina | | | Ar$ | | | | 35.15 | % | | | 30.50 | % | | | 1,071,559 | | | | — | | | | 1,071,559 | | | | — | | | | — | | | | — | | | | — | | | | — | | | | — | |
Foreign | | Central Costanera S.A. | | Argentina | | | Foreign | | | Banco Nación Argentina | | Argentina | | | Ar$ | | | | 18.85 | % | | | 18.85 | % | | | 533,563 | | | | — | | | | 533,563 | | | | — | | | | — | | | | — | | | | — | | | | — | | | | — | |
Foreign | | Central Costanera S.A. | | Argentina | | | Foreign | | | Banco Santander Río | | Argentina | | | Ar$ | | | | 32.00 | % | | | 37.14 | % | | | 656,552 | | | | — | | | | 656,552 | | | | — | | | | — | | | | — | | | | — | | | | — | | | | — | |
Foreign | | Central Costanera S.A. | | Argentina | | | Foreign | | | Standard Bank | | Argentina | | | Ar$ | | | | 30.61 | % | | | 27.00 | % | | | 1,150,992 | | | | — | | | | 1,150,992 | | | | — | | | | — | | | | — | | | | — | | | | — | | | | — | |
Foreign | | Central Costanera S.A. | | Argentina | | | Foreign | | | Banco Supervielle | | Argentina | | | Ar$ | | | | 35.00 | % | | | 41.21 | % | | | 1,028,903 | | | | — | | | | 1,028,903 | | | | — | | | | — | | | | — | | | | — | | | | — | | | | — | |
Foreign | | Central Costanera S.A. | | Argentina | | | Foreign | | | Citibank | | Argentina | | | Ar$ | | | | 32.50 | % | | | 37.81 | % | | | 3,391,799 | | | | — | | | | 3,391,799 | | | | — | | | | — | | | | — | | | | — | | | | — | | | | — | |
Foreign | | H. El Chocón S.A. | | Argentina | | | Foreign | | | Banco Macro | | Argentina | | | Ar$ | | | | 30.42 | % | | | 27.75 | % | | | 1,511,204 | | | | — | | | | 1,511,204 | | | | — | | | | — | | | | — | | | | — | | | | — | | | | — | |
Foreign | | H. El Chocón S.A. | | Argentina | | | Foreign | | | Banco Itau | | Argentina | | | Ar$ | | | | 33.70 | % | | | 29.25 | % | | | 163,618 | | | | — | | | | 163,618 | | | | — | | | | — | | | | — | | | | — | | | | — | | | | — | |
Foreign | | Central Costanera S.A. | | Argentina | | | Foreign | | | Credit Suisse International | | Argentina | | | US$ | | | | 13.67 | % | | | 13.25 | % | | | 113,672 | | | | 3,229,006 | | | | 3,342,678 | | | | — | | | | — | | | | — | | | | — | | | | — | | | | — | |
Foreign | | H. El Chocón S.A. | | Argentina | | | Foreign | | | Deutsche Bank | | Argentina | | | US$ | | | | 8.24 | % | | | 7.99 | % | | | 1,712,808 | | | | 2,587,169 | | | | 4,299,977 | | | | 820,490 | | | | — | | | | — | | | | — | | | | — | | | | 820,490 | |
Foreign | | H. El Chocón S.A. | | Argentina | | | Foreign | | | Standard Bank | | Argentina | | | US$ | | | | 8.24 | % | | | 7.99 | % | | | 857,292 | | | | 1,295,083 | | | | 2,152,375 | | | | 410,356 | | | | — | | | | — | | | | — | | | | — | | | | 410,356 | |
Foreign | | H. El Chocón S.A. | | Argentina | | | Foreign | | | Banco Itau | | Argentina | | | US$ | | | | 8.24 | % | | | 7.99 | % | | | 858,647 | | | | 1,297,369 | | | | 2,156,016 | | | | 410,526 | | | | — | | | | — | | | | — | | | | — | | | | 410,526 | |
Foreign | | H. El Chocón S.A. | | Argentina | | | Foreign | | | Banco Santander—Sindicated IV | | Argentina | | | Ar$ | | | | 33.84 | % | | | 30.22 | % | | | 316,184 | | | | 1,054,829 | | | | 1,371,013 | | | | 1,621,376 | | | | 1,140,227 | | | | — | | | | — | | | | — | | | | 2,761,603 | |
Foreign | | H. El Chocón S.A. | | Argentina | | | Foreign | | | Banco Itau—Sindicated IV | | Argentina | | | Ar$ | | | | 33.84 | % | | | 30.22 | % | | | 282,011 | | | | 940,860 | | | | 1,222,871 | | | | 1,446,280 | | | | 1,017,149 | | | | — | | | | — | | | | — | | | | 2,463,429 | |
Foreign | | H. El Chocón S.A. | | Argentina | | | Foreign | | | Banco Galicia—Sindicated IV | | Argentina | | | Ar$ | | | | 33.84 | % | | | 30.22 | % | | | 270,612 | | | | 902,848 | | | | 1,173,460 | | | | 1,387,893 | | | | 976,117 | | | | — | | | | — | | | | — | | | | 2,364,010 | |
Foreign | | H. El Chocón S.A. | | Argentina | | | Foreign | | | Banco Hipotecario—Sindicated IV | | Argentina | | | Ar$ | | | | 33.84 | % | | | 30.22 | % | | | 89,772 | | | | 299,691 | | | | 389,463 | | | | 461,142 | | | | 324,622 | | | | — | | | | — | | | | — | | | | 785,764 | |
Foreign | | H. El Chocón S.A. | | Argentina | | | Foreign | | | Banco Ciudad -Sindicated IV | | Argentina | | | Ar$ | | | | 33.84 | % | | | 30.22 | % | | | 36,008 | | | | 120,377 | | | | 156,385 | | | | 185,639 | | | | 130,955 | | | | — | | | | — | | | | — | | | | 316,594 | |
Foreign | | H. El Chocón S.A. | | Argentina | | | Foreign | | | ICB Argentina | | Argentina | | | Ar$ | | | | 33.84 | % | | | 30.22 | % | | | 350,354 | | | | 1,168,793 | | | | 1,519,147 | | | | 1,796,466 | | | | 1,263,303 | | | | — | | | | — | | | | — | | | | 3,059,769 | |
| | | | | | | | | | | | | | | | | | | | | | | | | | | | | | | | | | | | | | | | | | | | | | | | | | | | | | | | | | | | |
| | | | | | | | | | Total ThCh$ | | | | | | | | | | | | | | | | | 22,305,447 | | | | 21,335,962 | | | | 43,641,409 | | | | 24,312,908 | | | | 31,086,666 | | | | 31,585,171 | | | | 28,763,317 | | | | 65,954,840 | | | | 181,702,902 | |
| | | | | | | | | | | | | | | | | | | | | | | | | | | | | | | | | | | | | | | | | | | | | | | | | | | | | | | | | | | | |
F-241
| | | | | | | | | | | | | | | | | | | | | | | | | | | | | | | | | | | | | | | | | | | | | | | | | | | | | | | | | | | | | | |
Taxpayer
ID No.
(RUT) | | Company | | Country | | | ID No.
Financial
Institution | | | Financial Institution | | Country | | Currency | | | Effective
Interest
Rate | | | Nominal
Interest
Rate | | | Balance as of 1-1-2013 | |
| | | | | | | | | | Current | | | Non-current | |
| | | | | | | | | | One to
three
months | | | Three to
twelve
months | | | Total
Current | | | One to
two years | | | Two to
three
years | | | Three to
four years | | | Four to
five years | | | More
than five
years | | | Total Non-
current | |
| | | | | | | | | | ThCh$ | | | ThCh$ | | | ThCh$ | | | ThCh$ | | | ThCh$ | | | ThCh$ | | | ThCh$ | | | ThCh$ | | | ThCh$ | |
Foreign | | Chinango S.A.C. | | | Peru | | | | Foreign | | | Banco Scotiabank | | Peru | | | US$ | | | | 4.07 | % | | | 4.01 | % | | | 161,573 | | | | 923,528 | | | | 1,085,101 | | | | 1,208,750 | | | | 1,182,899 | | | | 1,157,047 | | | | 1,131,196 | | | | 12,109,598 | | | | 16,789,490 | |
Foreign | | Chinango S.A.C. | | | Peru | | | | Foreign | | | Bank Of Nova Scotia | | Peru | | | US$ | | | | 3.10 | % | | | 3.06 | % | | | 37,359 | | | | 112,077 | | | | 149,436 | | | | 1,329,281 | | | | 1,291,923 | | | | 1,254,563 | | | | 1,217,205 | | | | — | | | | 5,092,972 | |
Foreign | | Edegel | | | Peru | | | | Foreign | | | Banco de Crédito | | Peru | | | US$ | | | | 1.65 | % | | | 1.65 | % | | | 1,739,482 | | | | — | | | | 1,739,482 | | | | — | | | | — | | | | — | | | | — | | | | — | | | | — | |
Foreign | | Edegel | | | Peru | | | | Foreign | | | Banco Continental | | Peru | | | US$ | | | | 3.54 | % | | | 3.49 | % | | | 276,481 | | | | 829,443 | | | | 1,105,924 | | | | 2,302,892 | | | | 6,857,756 | | | | 11,362,349 | | | | 11,708,454 | | | | — | | | | 32,231,451 | |
Foreign | | Emgesa | | | Colombia | | | | Foreign | | | Bancolombia | | Colombia | | | CP | | | | 9.41 | % | | | 9.20 | % | | | 428,684 | | | | 1,286,051 | | | | 1,714,735 | | | | 1,714,734 | | | | 4,090,573 | | | | 3,861,942 | | | | 3,633,311 | | | | 13,520,587 | | | | 26,821,147 | |
Foreign | | Emgesa | | | Colombia | | | | Foreign | | | Bancolombia | | Colombia | | | CP | | | | 9.41 | % | | | 9.20 | % | | | 131,424 | | | | 394,271 | | | | 525,695 | | | | 525,694 | | | | 1,312,379 | | | | 1,242,287 | | | | 1,172,194 | | | | 4,407,478 | | | | 8,660,032 | |
Foreign | | Emgesa | | | Colombia | | | | Foreign | | | BBVA Colombia | | Colombia | | | CP | | | | 9.41 | % | | | 9.20 | % | | | 1,158,673 | | | | 3,476,018 | | | | 4,634,691 | | | | 4,634,690 | | | | 11,056,252 | | | | 10,438,293 | | | | 9,820,334 | | | | 36,544,265 | | | | 72,493,834 | |
Foreign | | Emgesa | | | Colombia | | | | Foreign | | | AV VILLAS | | Colombia | | | CP | | | | 9.41 | % | | | 9.20 | % | | | 181,346 | | | | 544,039 | | | | 725,385 | | | | 725,386 | | | | 1,730,447 | | | | 1,633,729 | | | | 1,537,011 | | | | 5,719,663 | | | | 11,346,236 | |
Foreign | | Central Costanera S.A. | | | Argentina | | | | Foreign | | | Banco Supervielle | | Argentina | | | Ar$ | | | | 20.75 | % | | | 20.75 | % | | | 1,483,661 | | | | — | | | | 1,483,661 | | | | — | | | | — | | | | — | | | | — | | | | — | | | | — | |
Foreign | | Central Costanera S.A. | | | Argentina | | | | Foreign | | | Banco Santander Río | | Argentina | | | Ar$ | | | | 22.00 | % | | | 22.00 | % | | | 879,133 | | | | — | | | | 879,133 | | | | — | | | | — | | | | — | | | | — | | | | — | | | | — | |
Foreign | | Central Costanera S.A. | | | Argentina | | | | Foreign | | | Banco Nación Argentina | | Argentina | | | Ar$ | | | | 18.85 | % | | | 18.85 | % | | | 946,327 | | | | 1,855,665 | | | | 2,801,992 | | | | 411,921 | | | | — | | | | — | | | | — | | | | — | | | | 411,921 | |
Foreign | | Central Costanera S.A. | | | Argentina | | | | Foreign | | | Citibank | | Argentina | | | Ar$ | | | | 17.00 | % | | | 17.00 | % | | | 4,349,740 | | | | — | | | | 4,349,740 | | | | — | | | | — | | | | — | | | | — | | | | — | | | | — | |
Foreign | | Central Costanera S.A. | | | Argentina | | | | Foreign | | | Banco Ciudad | | Argentina | | | Ar$ | | | | 18.75 | % | | | 18.75 | % | | | 395,870 | | | | — | | | | 395,870 | | | | — | | | | — | | | | — | | | | — | | | | — | | | | — | |
Foreign | | Central Costanera S.A. | | | Argentina | | | | Foreign | | | Standard Bank | | Argentina | | | Ar$ | | | | 21.00 | % | | | 21.00 | % | | | 1,388,486 | | | | — | | | | 1,388,486 | | | | — | | | | — | | | | — | | | | — | | | | — | | | | — | |
Foreign | | Central Costanera S.A. | | | Argentina | | | | Foreign | | | Banco Itau | | Argentina | | | Ar$ | | | | 23.75 | % | | | 23.75 | % | | | 2,459,388 | | | | — | | | | 2,459,388 | | | | — | | | | — | | | | — | | | | — | | | | — | | | | — | |
Foreign | | Central Costanera S.A. | | | Argentina | | | | Foreign | | | Banco Galicia | | Argentina | | | Ar$ | | | | 18.75 | % | | | 18.75 | % | | | 2,031,944 | | | | — | | | | 2,031,944 | | | | — | | | | — | | | | — | | | | — | | | | — | | | | — | |
Foreign | | Central Costanera S.A. | | | Argentina | | | | Foreign | | | Banco Provincia de Buenos Aires | | Argentina | | | Ar$ | | | | 18.09 | % | | | 18.09 | % | | | 96,871 | | | | 122,911 | | | | 219,782 | | | | — | | | | — | | | | — | | | | — | | | | — | | | | — | |
Foreign | | Central Costanera S.A. | | | Argentina | | | | Foreign | | | Credit Suisse International | | Argentina | | | US$ | | | | 11.45 | % | | | 11.45 | % | | | 4,883,837 | | | | — | | | | 4,883,837 | | | | — | | | | — | | | | — | | | | — | | | | — | | | | — | |
Foreign | | Hidroeléctrica El Chocón | | | Argentina | | | | Foreign | | | Deutsche Bank | | Argentina | | | US$ | | | | 8.30 | % | | | 8.06 | % | | | 881,121 | | | | 2,547,013 | | | | 3,428,134 | | | | 3,171,200 | | | | 747,302 | | | | — | | | | — | | | | — | | | | 3,918,502 | |
Foreign | | Hidroeléctrica El Chocón | | | Argentina | | | | Foreign | | | Standard Bank | | Argentina | | | US$ | | | | 8.30 | % | | | 8.06 | % | | | 440,417 | | | | 1,273,172 | | | | 1,713,589 | | | | 1,585,377 | | | | 373,640 | | | | — | | | | — | | | | — | | | | 1,959,017 | |
Foreign | | Hidroeléctrica El Chocón | | | Argentina | | | | Foreign | | | Banco Itau | | Argentina | | | US$ | | | | 8.30 | % | | | 8.06 | % | | | 440,527 | | | | 1,273,427 | | | | 1,713,954 | | | | 1,585,547 | | | | 373,649 | | | | — | | | | — | | | | — | | | | 1,959,196 | |
Foreign | | Hidroeléctrica El Chocón | | | Argentina | | | | Foreign | | | Banco Hipotecario — Sindicado I | | Argentina | | | Ar$ | | | | 25.42 | % | | | 23.31 | % | | | 354,694 | | | | 340,398 | | | | 695,092 | | | | — | | | | — | | | | — | | | | — | | | | — | | | | — | |
Foreign | | Hidroeléctrica El Chocón | | | Argentina | | | | Foreign | | | Banco Itau — Sindicado II | | Argentina | | | Ar$ | | | | 26.96 | % | | | 24.11 | % | | | 239,076 | | | | 488,681 | | | | 727,757 | | | | 230,121 | | | | — | | | | — | | | | — | | | | — | | | | 230,121 | |
Foreign | | Hidroeléctrica El Chocón | | | Argentina | | | | Foreign | | | Standard Bank — Sindicado II | | Argentina | | | Ar$ | | | | 26.96 | % | | | 24.11 | % | | | 527,542 | | | | 1,078,428 | | | | 1,605,970 | | | | 507,222 | | | | — | | | | — | | | | — | | | | — | | | | 507,222 | |
Foreign | | Hidroeléctrica El Chocón | | | Argentina | | | | Foreign | | | Banco Santander — Sindicado II | | Argentina | | | Ar$ | | | | 26.96 | % | | | 24.11 | % | | | 383,587 | | | | 784,144 | | | | 1,167,731 | | | | 368,840 | | | | — | | | | — | | | | — | | | | — | | | | 368,840 | |
Foreign | | Hidroeléctrica El Chocón | | | Argentina | | | | Foreign | | | Banco Hipotecario — Sindicado II | | Argentina | | | Ar$ | | | | 26.96 | % | | | 24.11 | % | | | 190,602 | | | | 389,550 | | | | 580,152 | | | | 183,696 | | | | — | | | | — | | | | — | | | | — | | | | 183,696 | |
Foreign | | Hidroeléctrica El Chocón | | | Argentina | | | | Foreign | | | Banco Galicia — Sindicado II | | Argentina | | | Ar$ | | | | 26.96 | % | | | 24.11 | % | | | 190,906 | | | | 390,193 | | | | 581,099 | | | | 183,881 | | | | — | | | | — | | | | — | | | | — | | | | 183,881 | |
Foreign | | Hidroeléctrica El Chocón | | | Argentina | | | | Foreign | | | Banco Ciudad — Sindicado II | | Argentina | | | Ar$ | | | | 26.96 | % | | | 24.11 | % | | | 152,374 | | | | 311,411 | | | | 463,785 | | | | 146,892 | | | | — | | | | — | | | | — | | | | — | | | | 146,892 | |
Foreign | | Hidroeléctrica El Chocón | | | Argentina | | | | Foreign | | | Banco Galicia — Sindicado III | | Argentina | | | Ar$ | | | | 26.95 | % | | | 24.10 | % | | | 614,638 | | | | 779,040 | | | | 1,393,678 | | | | 1,174,476 | | | | 505,037 | | | | — | | | | — | | | | — | | | | 1,679,513 | |
Foreign | | Hidroeléctrica El Chocón | | | Argentina | | | | Foreign | | | Banco Itau — Sindicado III | | Argentina | | | Ar$ | | | | 26.95 | % | | | 24.10 | % | | | 614,638 | | | | 779,040 | | | | 1,393,678 | | | | 1,174,476 | | | | 505,037 | | | | — | | | | — | | | | — | | | | 1,679,513 | |
Foreign | | Hidroeléctrica El Chocón | | | Argentina | | | | Foreign | | | Standard Bank — Sindicado III | | Argentina | | | Ar$ | | | | 26.95 | % | | | 24.10 | % | | | 614,638 | | | | 779,040 | | | | 1,393,678 | | | | 1,174,476 | | | | 505,037 | | | | — | | | | — | | | | — | | | | 1,679,513 | |
Foreign | | Hidroeléctrica El Chocón | | | Argentina | | | | Foreign | | | Banco Santander — Sindicado III | | Argentina | | | Ar$ | | | | 26.95 | % | | | 24.10 | % | | | 614,638 | | | | 779,040 | | | | 1,393,678 | | | | 1,174,476 | | | | 505,037 | | | | — | | | | — | | | | — | | | | 1,679,513 | |
Foreign | | Hidroeléctrica El Chocón | | | Argentina | | | | Foreign | | | Banco Macro | | Argentina | | | Ar$ | | | | 18.81 | % | | | 18.00 | % | | | 87,619 | | | | 2,034,700 | | | | 2,122,319 | | | | — | | | | — | | | | — | | | | — | | | | — | | | | — | |
Foreign | | Hidroeléctrica El Chocón | | | Argentina | | | | Foreign | | | Banco Macro I | | Argentina | | | Ar$ | | | | 23.14 | % | | | 21.00 | % | | | 295,652 | | | | — | | | | 295,652 | | | | — | | | | — | | | | — | | | | — | | | | — | | | | — | |
Foreign | | Hidroeléctrica El Chocón | | | Argentina | | | | Foreign | | | Standard Bank | | Argentina | | | Ar$ | | | | 23.14 | % | | | 21.00 | % | | | 198,116 | | | | — | | | | 198,116 | | | | — | | | | — | | | | — | | | | — | | | | — | | | | — | |
Foreign | | Hidroeléctrica El Chocón | | | Argentina | | | | Foreign | | | Banco Santander Río | | Argentina | | | Ar$ | | | | 22.42 | % | | | 20.75 | % | | | 98,949 | | | | — | | | | 98,949 | | | | — | | | | — | | | | — | | | | — | | | | — | | | | — | |
| | | | | | | | | | | | | | | | | | | | | | | | | | | | | | | | | | | | | | | | | | | | | | | | | | | | | | | | | | | | | | |
| | | | | | | | | | | | | | | | | | | | | | | | | | | | | 29,970,013 | | | | 23,571,280 | | | | 53,541,293 | | | | 25,514,028 | | | | 31,036,968 | | | | 30,950,210 | | | | 30,219,705 | | | | 72,301,591 | | | | 190,022,502 | |
| | | | | | | | | | | | | | | | | | | | | | | | | | | | | | | | | | | | | | | | | | | | | | | | | | | | | | | | | | | | | | |
F-242
| b) | Secured and unsecured liabilities |
| • | | Summary of secured and unsecured liabilities by currency and maturity |
| | | | | | | | | | | | | | | | | | | | | | | | | | | | | | | | | | | | | | | | | | | | | | | | | | | | |
Country | | Currency | | | Effective
Interest
Rate | | | Nominal
Interest
Rate | | | Secured
(Yes/
No) | | | Balance as of 12-31-2014 | |
| | | | | | Current | | | Non-current | |
| | | | | | One to
three
months | | | Three to
twelve
months | | | Total
Current | | | One to
two years | | | Two to
three years | | | Three to
four years | | | Four to five
years | | | More than
five years | | | Total
Non-current | |
| | | | | | ThCh$ | | | ThCh$ | | | ThCh$ | | | ThCh$ | | | ThCh$ | | | ThCh$ | | | ThCh$ | | | ThCh$ | | | ThCh$ | |
Peru | | | US$ | | | | 6.70 | % | | | 6.59 | % | | | No | | | | 4,424,492 | | | | 1,630,232 | | | | 6,054,724 | | | | 14,072,738 | | | | 1,443,269 | | | | 7,173,013 | | | | 5,691,115 | | | | 15,362,941 | | | | 43,743,076 | |
Peru | | | Sol | | | | 6.40 | % | | | 6.30 | % | | | No | | | | 159,918 | | | | 479,754 | | | | 639,672 | | | | 639,671 | | | | 639,671 | | | | 639,671 | | | | 5,586,014 | | | | 5,880,850 | | | | 13,385,877 | |
Colombia | | | CP | | | | 8.67 | % | | | 8.45 | % | | | No | | | | 80,341,828 | | | | 48,241,503 | | | | 128,583,331 | | | | 64,322,005 | | | | 104,199,084 | | | | 113,756,973 | | | | 143,560,968 | | �� | | 753,218,536 | | | | 1,179,057,566 | |
| | | | | | | | | | | | | | | | | | | | | | | | | | | | | | | | | | | | | | | | | | | | | | | | | | | | |
| | | | | | | | | | | | | | | Total | | | | 84,926,238 | | | | 50,351,489 | | | | 135,277,727 | | | | 79,034,414 | | | | 106,282,024 | | | | 121,569,657 | | | | 154,838,097 | | | | 774,462,327 | | | | 1,236,186,519 | |
| | | | | | | | | | | | | | | | | | | | | | | | | | | | | | | | | | | | | | | | | | | | | | | | | | | | |
| | | | | | | | | | | | | | | | | | | | | | | | | | | | | | | | | | | | | | | | | | | | | | | | | | | | |
Country | | Currency | | | Effective
Interest
Rate | | | Nominal
Interest
Rate | | | Secured
(Yes/
No) | | | Balance as of 12-31-2013 | |
| | | | | | Current | | | Non-current | |
| | | | | | One to
three
months
ThCh$ | | | Three to
twelve
months
ThCh$ | | | Total
Current
ThCh$ | | | One to
two years
ThCh$ | | | Two to
three
years
ThCh$ | | | Three to
four
years
ThCh$ | | | Four to
five years
ThCh$ | | | More than
five years
ThCh$ | | | Total
Non-current
ThCh$ | |
Peru | | | US$ | | | | 7.01 | % | | | 6.89 | % | | | No | | | | 649,265 | | | | 7,018,782 | | | | 7,668,047 | | | | 5,278,029 | | | | 12,212,120 | | | | 1,274,164 | | | | 6,226,695 | | | | 18,288,999 | | | | 43,280,007 | |
Peru | | | Sol | | | | 6.42 | % | | | 6.32 | % | | | No | | | | 10,345,168 | | | | 4,310,315 | | | | 14,655,483 | | | | 591,993 | | | | 591,995 | | | | 591,995 | | | | 591,993 | | | | 10,612,183 | | | | 12,980,159 | |
Colombia | | | CP | | | | 7.32 | % | | | 7.19 | % | | | No | | | | 28,242,856 | | | | 68,060,813 | | | | 96,303,669 | | | | 120,634,354 | | | | 51,702,167 | | | | 95,620,862 | | | | 106,354,371 | | | | 720,630,133 | | | | 1,094,941,887 | |
| | | | | | | | | | | | | | | | | | | | | | | | | | | | | | | | | | | | | | | | | | | | | | | | | | | | |
| | | | | | | | | | | | | | | Total | | | | 39,237,289 | | | | 79,389,910 | | | | 118,627,199 | | | | 126,504,376 | | | | 64,506,282 | | | | 97,487,021 | | | | 113,173,059 | | | | 749,531,315 | | | | 1,151,202,053 | |
| | | | | | | | | | | | | | | | | | | | | | | | | | | | | | | | | | | | | | | | | | | | | | | | | | | | |
| | | | | | | | | | | | | | | | | | | | | | | | | | | | | | | | | | | | | | | | | | | | | | | | | | | | |
Country | | Currency | | | Effective
Interest
Rate | | | Nominal
Interest
Rate | | | Secured
(Yes/
No) | | | Balance as of 1-1-2013 | |
| | | | | | Current | | | Non-current | |
| | | | | | One to
three
months
ThCh$ | | | Three to
twelve
months
ThCh$ | | | Total
Current
ThCh$ | | | One to
two years
ThCh$ | | | Two to
three
years
ThCh$ | | | Three to
four
years
ThCh$ | | | Four to
five years
ThCh$ | | | More than
five years
ThCh$ | | | Total
Non-current
ThCh$ | |
Peru | | | US$ | | | | 7.01 | % | | | 6.89 | % | | | No | | | | 628,048 | | | | 1,884,143 | | | | 2,512,191 | | | | 7,129,985 | | | | 4,917,629 | | | | 11,221,552 | | | | 1,232,554 | | | | 22,585,830 | | | | 47,087,550 | |
Peru | | | Sol | | | | 6.51 | % | | | 6.41 | % | | | No | | | | 5,368,613 | | | | 15,496,309 | | | | 20,864,922 | | | | 14,632,211 | | | | 589,536 | | | | 589,535 | | | | 589,534 | | | | 11,183,287 | | | | 27,584,103 | |
Colombia | | | CP | | | | 8.41 | % | | | 8.25 | % | | | No | | | | 13,359,451 | | | | 40,078,353 | | | | 53,437,804 | | | | 90,087,687 | | | | 113,553,254 | | | | 44,985,413 | | | | 88,035,680 | | | | 622,513,451 | | | | 959,175,485 | |
| | | | | | | | | | | | | | | | | | | | | | | | | | | | | | | | | | | | | | | | | | | | | | | | | | | | |
| | | | | | | | | | | | | | | Total | | | | 19,356,112 | | | | 57,458,805 | | | | 76,814,917 | | | | 111,849,883 | | | | 119,060,419 | | | | 56,796,500 | | | | 89,857,768 | | | | 656,282,568 | | | | 1,033,847,138 | |
| | | | | | | | | | | | | | | | | | | | | | | | | | | | | | | | | | | | | | | | | | | | | | | | | | | | |
F-243
| • | | Secured and unsecured liabilities by company |
| | | | | | | | | | | | | | | | | | | | | | | | | | | | | | | | | | | | | | | | | | | | | | | | | | | | | | | | | | | | | | | | |
Taxpayer ID No. (RUT) | | Company | | Country | | ID No.
Financial
Institution | | | Financial Institution | | Country | | Currency | | | Effective
Interest
Rate | | | Nominal
Interest
Rate | | | Secured
(Yes/
No) | | | Balance as of 12-31-2014 | |
| | | | | | | | | | | Current | | | Non-current | |
| | | | | | | | | | | One to
three
months | | | Three to
twelve
months | | | Total
Current | | | One to
two years | | | Two to
three years | | | Three to
four years | | | Four to five
years | | | More than
five years | | | Total Non-
current | |
| | | | | | | | | | | ThCh$ | | | ThCh$ | | | ThCh$ | | | ThCh$ | | | ThCh$ | | | ThCh$ | | | ThCh$ | | | ThCh$ | | | ThCh$ | |
Foreign | | Edegel S.A.A | | Peru | | | Foreign | | | Banco Continental | | Peru | | | Sol | | | | 6.41 | % | | | 6.31 | % | | | No | | | | 80,157 | | | | 240,472 | | | | 320,629 | | | | 320,629 | | | | 320,629 | | | | 320,629 | | | | 320,629 | | | | 5,880,850 | | | | 7,163,366 | |
Foreign | | Edegel S.A.A | | Peru | | | Foreign | | | Banco Continental | | Peru | | | Sol | | | | 6.38 | % | | | 6.28 | % | | | No | | | | 79,761 | | | | 239,282 | | | | 319,043 | | | | 319,042 | | | | 319,042 | | | | 319,042 | | | | 5,265,385 | | | | — | | | | 6,222,511 | |
Foreign | | Edegel S.A.A | | Peru | | | Foreign | | | Banco Continental | | Peru | | | US$ | | | | 6.44 | % | | | 6.34 | % | | | No | | | | 91,749 | | | | 275,246 | | | | 366,995 | | | | 366,994 | | | | 366,994 | | | | 366,994 | | | | 366,994 | | | | 9,039,318 | | | | 10,507,294 | |
Foreign | | Edegel S.A.A | | Peru | | | Foreign | | | Banco Continental | | Peru | | | US$ | | | | 7.93 | % | | | 7.78 | % | | | No | | | | 91,899 | | | | 275,698 | | | | 367,597 | | | | 367,597 | | | | 367,597 | | | | 367,597 | | | | 4,989,668 | | | | — | | | | 6,092,459 | |
Foreign | | Edegel S.A.A | | Peru | | | Foreign | | | Banco Continental | | Peru | | | US$ | | | | 7.25 | % | | | 7.13 | % | | | No | | | | 3,881,082 | | | | — | | | | 3,881,082 | | | | — | | | | — | | | | — | | | | — | | | | — | | | | — | |
Foreign | | Edegel S.A.A | | Peru | | | Foreign | | | Banco Scotiabank | | Peru | | | US$ | | | | 6.73 | % | | | 6.63 | % | | | No | | | | 95,816 | | | | 287,449 | | | | 383,265 | | | | 6,296,355 | | | | — | | | | — | | | | — | | | | — | | | | 6,296,355 | |
Foreign | | Edegel S.A.A | | Peru | | | Foreign | | | Banco Scotiabank | | Peru | | | US$ | | | | 6.09 | % | | | 6.00 | % | | | No | | | | 86,777 | | | | 260,331 | | | | 347,108 | | | | 6,333,114 | | | | — | | | | — | | | | — | | | | — | | | | 6,333,114 | |
Foreign | | Edegel S.A.A | | Peru | | | Foreign | | | Banco Scotiabank | | Peru | | | US$ | | | | 6.57 | % | | | 6.47 | % | | | No | | | | 93,556 | | | | 280,669 | | | | 374,225 | | | | 374,225 | | | | 374,225 | | | | 6,103,969 | | | | — | | | | — | | | | 6,852,419 | |
Foreign | | Edegel S.A.A | | Peru | | | Foreign | | | Banco Scotiabank | | Peru | | | US$ | | | | 5.86 | % | | | 5.78 | % | | | No | | | | 83,613 | | | | 250,839 | | | | 334,452 | | | | 334,453 | | | | 334,453 | | | | 334,453 | | | | 334,453 | | | | 6,323,623 | | | | 7,661,435 | |
Foreign | | Emgesa S.A. E.S.P. | | Colombia | | | Foreign | | | Bonds Series A-10 | | Colombia | | | CP | | | | 8.87 | % | | | 8.59 | % | | | No | | | | 53,979,516 | | | | — | | | | 53,979,516 | | | | — | | | | — | | | | — | | | | — | | | | — | | | | — | |
Foreign | | Emgesa S.A. E.S.P. | | Colombia | | | Foreign | | | Bonds Series A102 | | Colombia | | | CP | | | | 8.87 | % | | | 8.59 | % | | | No | | | | 10,281,812 | | | | — | | | | 10,281,812 | | | | — | | | | — | | | | — | | | | — | | | | — | | | | — | |
Foreign | | Emgesa S.A. E.S.P. | | Colombia | | | Foreign | | | Bonds Series B-103 | | Colombia | | | CP | | | | 8.99 | % | | | 8.99 | % | | | No | | | | 982,211 | | | | 2,946,634 | | | | 3,928,845 | | | | 3,928,846 | | | | 43,805,925 | | | | — | | | | — | | | | — | | | | 47,734,771 | |
Foreign | | Emgesa S.A. E.S.P. | | Colombia | | | Foreign | | | Bonds Series B10 | | Colombia | | | CP | | | | 9.64 | % | | | 9.31 | % | | | No | | | | 882,562 | | | | 2,647,687 | | | | 3,530,249 | | | | 3,530,250 | | | | 3,530,250 | | | | 3,530,250 | | | | 41,216,421 | | | | — | | | | 51,807,171 | |
Foreign | | Emgesa S.A. E.S.P. | | Colombia | | | Foreign | | | Bonds Series B15 | | Colombia | | | CP | | | | 9.96 | % | | | 9.61 | % | | | No | | | | 316,557 | | | | 949,671 | | | | 1,266,228 | | | | 1,266,228 | | | | 1,266,228 | | | | 1,266,228 | | | | 1,266,228 | | | | 19,363,519 | | | | 24,428,431 | |
Foreign | | Emgesa S.A. E.S.P. | | Colombia | | | Foreign | | | Bonds Series B09-09 | | Colombia | | | CP | | | | 9.77 | % | | | 9.43 | % | | | No | | | | 1,213,148 | | | | 3,639,445 | | | | 4,852,593 | | | | 4,852,593 | | | | 4,852,593 | | | | 58,216,407 | | | | — | | | | — | | | | 67,921,593 | |
Foreign | | Emgesa S.A. E.S.P. | | Colombia | | | Foreign | | | Bonds Series B12 | | Colombia | | | CP | | | | 9.97 | % | | | 9.62 | % | | | No | | | | 509,006 | | | | 1,527,019 | | | | 2,036,025 | | | | 2,036,026 | | | | 2,036,026 | | | | 2,036,026 | | | | 2,036,026 | | | | 25,961,808 | | | | 34,105,912 | |
Foreign | | Emgesa S.A. E.S.P. | | Colombia | | | Foreign | | | Foreign Bonds | | Colombia | | | CP | | | | 10.17 | % | | | 10.17 | % | | | No | | | | 581,078 | | | | 1,743,234 | | | | 2,324,312 | | | | 2,324,312 | | | | 2,324,312 | | | | 2,324,312 | | | | 2,324,312 | | | | 25,362,714 | | | | 34,659,962 | |
Foreign | | Emgesa S.A. E.S.P. | | Colombia | | | Foreign | | | Quimbo Bonds | | Colombia | | | CP | | | | 10.17 | % | | | 10.17 | % | | | No | | | | 4,175,756 | | | | 12,527,267 | | | | 16,703,023 | | | | 16,703,023 | | | | 16,703,023 | | | | 16,703,023 | | | | 16,703,023 | | | | 182,262,097 | | | | 249,074,189 | |
Foreign | | Emgesa S.A. E.S.P. | | Colombia | | | Foreign | | | Quimbo Bonds B10 | | Colombia | | | CP | | | | 7.30 | % | | | 7.11 | % | | | No | | | | 1,246,095 | | | | 3,738,285 | | | | 4,984,380 | | | | 4,984,380 | | | | 4,984,380 | | | | 4,984,380 | | | | 4,984,380 | | | | 91,102,169 | | | | 111,039,689 | |
Foreign | | Emgesa S.A. E.S.P. | | Colombia | | | Foreign | | | Quimbo Bonds B15 | | Colombia | | | CP | | | | 7.42 | % | | | 7.22 | % | | | No | | | | 845,671 | | | | 2,537,012 | | | | 3,382,683 | | | | 3,382,682 | | | | 3,382,682 | | | | 3,382,682 | | | | 3,382,682 | | | | 77,827,476 | | | | 91,358,204 | |
Foreign | | Emgesa S.A. E.S.P. | | Colombia | | | Foreign | | | Quimbo Bonds B12-13 | | Colombia | | | CP | | | | 8.83 | % | | | 8.55 | % | | | No | | | | 1,843,223 | | | | 5,529,669 | | | | 7,372,892 | | | | 7,372,892 | | | | 7,372,892 | | | | 7,372,892 | | | | 7,372,892 | | | | 134,542,069 | | | | 164,033,637 | |
Foreign | | Emgesa S.A. E.S.P. | | Colombia | | | Foreign | | | Quimbo Bonds B6-13 | | Colombia | | | CP | | | | 8.06 | % | | | 7.82 | % | | | No | | | | 703,731 | | | | 2,111,194 | | | | 2,814,925 | | | | 2,814,926 | | | | 2,814,926 | | | | 2,814,926 | | | | 40,827,900 | | | | — | | | | 49,272,678 | |
Foreign | | Emgesa S.A. E.S.P. | | Colombia | | | Foreign | | | Bonds Series B6-13 | | Colombia | | | CP | | | | 8.06 | % | | | 7.82 | % | | | No | | | | 228,103 | | | | 684,309 | | | | 912,412 | | | | 912,412 | | | | 912,412 | | | | 912,412 | | | | 13,233,669 | | | | — | | | | 15,970,905 | |
Foreign | | Emgesa S.A. E.S.P. | | Colombia | | | Foreign | | | Quimbo Bonds B16-14 | | Colombia | | | CP | | | | 7.95 | % | | | 7.73 | % | | | No | | | | 743,130 | | | | 2,229,390 | | | | 2,972,520 | | | | 2,972,520 | | | | 2,972,520 | | | | 2,972,520 | | | | 2,972,520 | | | | 72,211,138 | | | | 84,101,218 | |
Foreign | | Emgesa S.A. E.S.P. | | Colombia | | | Foreign | | | Quimbo Bonds B10-14 | | Colombia | | | CP | | | | 7.62 | % | | | 7.41 | % | | | No | | | | 816,008 | | | | 2,448,025 | | | | 3,264,033 | | | | 3,264,033 | | | | 3,264,033 | | | | 3,264,033 | | | | 3,264,033 | | | | 61,737,690 | | | | 74,793,822 | |
Foreign | | Emgesa S.A. E.S.P. | | Colombia | | | Foreign | | | Quimbo Bonds B6-14 | | Colombia | | | CP | | | | 7.19 | % | | | 7.01 | % | | | No | | | | 540,559 | | | | 1,621,676 | | | | 2,162,235 | | | | 2,162,235 | | | | 2,162,235 | | | | 2,162,235 | | | | 2,162,235 | | | | 34,170,442 | | | | 42,819,382 | |
Foreign | | Emgesa S.A. E.S.P. | | Colombia | | | Foreign | | | Bonds Series B6-14 | | Colombia | | | CP | | | | 7.19 | % | | | 7.01 | % | | | No | | | | 453,662 | | | | 1,360,986 | | | | 1,814,648 | | | | 1,814,647 | | | | 1,814,647 | | | | 1,814,647 | | | | 1,814,647 | | | | 28,677,414 | | | | 35,936,002 | |
| | | | | | | | | | | | | | | | | | | | | | | | | | | | | | | | | | | | | | | | | | | | | | | | | | | | | | | | | | | | | | | | |
| | | | | | | | | | Total ThCh$ | | | | | | | | | | | | | | | | | | | | | 84,926,238 | | | | 50,351,489 | | | | 135,277,727 | | | | 79,034,414 | | | | 106,282,024 | | | | 121,569,657 | | | | 154,838,097 | | | | 774,462,327 | | | | 1,236,186,519 | |
| | | | | | | | | | | | | | | | | | | | | | | | | | | | | | | | | | | | | | | | | | | | | | | | | | | | | | | | | | | | | | | | |
| | | | | | | | | | | | | | | | | | | | | | | | | | | | | | | | | | | | | | | | | | | | | | | | | | | | | | | | | | | | | | | | |
Taxpayer ID No. (RUT) | | Company | | Country | | ID No.
Financial
Institution | | | Financial
Institution | | Country | | Currency | | | Effective
Interest
Rate | | | Nominal
Interest
Rate | | | Secured
(Yes/No) | | | Balance as of 12-31-2013 | |
| | | | | | | | | | | Current | | | Non-current | |
| | | | | | | | | | | One to
three
months | | | Three to
twelve
months | | | Total
Current | | | One to
two years | | | Two to
three
years | | | Three to
four
years | | | Four to
five years | | | More than
five years | | | Total
Non-current
| |
| | | | | | | | | | | ThCh$ | | | ThCh$ | | | ThCh$ | | | ThCh$ | | | ThCh$ | | | ThCh$ | | | ThCh$ | | | ThCh$ | | | ThCh$ | |
Foreign | | Chinango S.A.C. | | Peru | | | Foreign | | | Banco Continental | | Peru | | | Sol | | | | 6.25 | % | | | 6.16 | % | | | Yes | | | | 4,724,809 | | | | — | | | | 4,724,809 | | | | — | | | | — | | | | — | | | | — | | | | — | | | | — | |
Foreign | | Edegel S.A.A | | Peru | | | Foreign | | | Banco Continental | | Peru | | | Sol | | | | 6.41 | % | | | 6.31 | % | | | No | | | | 74,183 | | | | 222,548 | | | | 296,731 | | | | 296,731 | | | | 296,732 | | | | 296,731 | | | | 296,732 | | | | 5,739,253 | | | | 6,926,179 | |
Foreign | | Edegel S.A.A | | Peru | | | Foreign | | | Banco Continental | | Peru | | | Sol | | | | 6.38 | % | | | 6.28 | % | | | No | | | | 73,816 | | | | 221,447 | | | | 295,263 | | | | 295,263 | | | | 295,262 | | | | 295,263 | | | | 295,262 | | | | 4,872,930 | | | | 6,053,980 | |
Foreign | | Edegel S.A.A | | Peru | | | Foreign | | | Banco Continental | | Peru | | | Sol | | | | 6.86 | % | | | 6.75 | % | | | No | | | | 63,459 | | | | 3,866,320 | | | | 3,929,779 | | | | — | | | | — | | | | — | | | | — | | | | — | | | | — | |
Foreign | | Edegel S.A.A | | Peru | | | Foreign | | | Banco Continental | | Peru | | | Sol | | | | 6.70 | % | | | 6.59 | % | | | No | | | | 5,408,901 | | | | — | | | | 5,408,901 | | | | — | | | | — | | | | — | | | | — | | | | — | | | | — | |
Foreign | | Edegel S.A.A | | Peru | | | Foreign | | | Banco Continental | | Peru | | | US$ | | | | 6.44 | % | | | 6.34 | % | | | No | | | | 80,999 | | | | 242,996 | | | | 323,995 | | | | 323,995 | | | | 323,994 | | | | 323,995 | | | | 323,994 | | | | 8,198,326 | | | | 9,494,304 | |
Foreign | | Edegel S.A.A | | Peru | | | Foreign | | | Banco Continental | | Peru | | | US$ | | | | 9.20 | % | | | 9.00 | % | | | No | | | | 111,697 | | | | 5,406,082 | | | | 5,517,779 | | | | — | | | | — | | | | — | | | | — | | | | — | | | | — | |
Foreign | | Edegel S.A.A | | Peru | | | Foreign | | | Banco Continental | | Peru | | | US$ | | | | 7.93 | % | | | 7.78 | % | | | No | | | | 81,132 | | | | 243,395 | | | | 324,527 | | | | 324,526 | | | | 324,527 | | | | 324,526 | | | | 324,527 | | | | 4,318,583 | | | | 5,616,689 | |
Foreign | | Edegel S.A.A | | Peru | | | Foreign | | | Banco Continental | | Peru | | | US$ | | | | 7.25 | % | | | 7.13 | % | | | No | | | | 57,826 | | | | 173,478 | | | | 231,304 | | | | 3,359,066 | | | | — | | | | — | | | | — | | | | — | | | | 3,359,066 | |
Foreign | | Edegel S.A.A | | Peru | | | Foreign | | | Banco Scotiabank | | Peru | | | US$ | | | | 6.74 | % | | | 6.63 | % | | | No | | | | 84,590 | | | | 253,769 | | | | 338,359 | | | | 338,359 | | | | 5,452,751 | | | | — | | | | — | | | | — | | | | 5,791,110 | |
Foreign | | Edegel S.A.A | | Peru | | | Foreign | | | Banco Scotiabank | | Peru | | | US$ | | | | 6.09 | % | | | 6.00 | % | | | No | | | | 76,610 | | | | 229,829 | | | | 306,439 | | | | 306,438 | | | | 5,485,204 | | | | — | | | | — | | | | — | | | | 5,791,642 | |
Foreign | | Edegel S.A.A | | Peru | | | Foreign | | | Banco Scotiabank | | Peru | | | US$ | | | | 5.87 | % | | | 5.78 | % | | | No | | | | 73,816 | | | | 221,449 | | | | 295,265 | | | | 295,266 | | | | 295,266 | | | | 295,266 | | | | 295,266 | | | | 5,772,090 | | | | 6,953,154 | |
Foreign | | Edegel S.A.A | | Peru | | | Foreign | | | Banco Scotiabank | | Peru | | | US$ | | | | 6.57 | % | | | 6.47 | % | | | No | | | | 82,595 | | | | 247,784 | | | | 330,379 | | | | 330,379 | | | | 330,378 | | | | 330,379 | | | | 5,282,906 | | | | — | | | | 6,274,042 | |
Foreign | | Emgesa S.A. E.S.P. | | Colombia | | | Foreign | | | Bonds Series A5 | | Colombia | | | CP | | | | 5.54 | % | | | 5.43 | % | | | No | | | | 13,616,326 | | | | — | | | | 13,616,326 | | | | — | | | | — | | | | — | | | | — | | | | — | | | | — | |
Foreign | | Emgesa S.A. E.S.P. | | Colombia | | | Foreign | | | Bonds Series A10 | | Colombia | | | CP | | | | 6.89 | % | | | 6.72 | % | | | No | | | | 939,183 | | | | 2,817,550 | | | | 3,756,733 | | | | 57,903,035 | | | | — | | | | — | | | | — | | | | — | | | | 57,903,035 | |
Foreign | | Emgesa S.A. E.S.P. | | Colombia | | | Foreign | | | Bonds Series A102 | | Colombia | | | CP | | | | 6.89 | % | | | 6.72 | % | | | No | | | | 178,890 | | | | 536,671 | | | | 715,561 | | | | 11,029,149 | | | | — | | | | — | | | | — | | | | — | | | | 11,029,149 | |
Foreign | | Emgesa S.A. E.S.P. | | Colombia | | | Foreign | | | Bonds Series B 103 | | Colombia | | | CP | | | | 7.00 | % | | | 7.00 | % | | | No | | | | 734,499 | | | | 2,203,498 | | | | 2,937,997 | | | | 2,937,997 | | | | 2,937,997 | | | | 46,856,691 | | | | — | | | | — | | | | 52,732,685 | |
Foreign | | Emgesa S.A. E.S.P. | | Colombia | | | Foreign | | | Bonds Series B10 | | Colombia | | | CP | | | | 7.64 | % | | | 7.43 | % | | | No | | | | 824,131 | | | | 2,472,393 | | | | 3,296,524 | | | | 3,296,525 | | | | 3,296,524 | | | | 3,296,524 | | | | 3,296,525 | | | | 44,205,339 | | | | 57,391,437 | |
Foreign | | Emgesa S.A. E.S.P. | | Colombia | | | Foreign | | | Bonds Series B15 | | Colombia | | | CP | | | | 7.96 | % | | | 7.73 | % | | | No | | | | 297,055 | | | | 891,166 | | | | 1,188,221 | | | | 1,188,222 | | | | 1,188,222 | | | | 1,188,222 | | | | 1,188,222 | | | | 21,276,616 | | | | 26,029,504 | |
Foreign | | Emgesa S.A. E.S.P. | | Colombia | | | Foreign | | | Bonds Series E5-09 | | Colombia | | | CP | | | | 9.27 | % | | | 9.27 | % | | | No | | | | 582,915 | | | | 25,929,967 | | | | 26,512,882 | | | | — | | | | — | | | | | | | | — | | | | — | | | | — | |
Foreign | | Emgesa S.A. E.S.P. | | Colombia | | | Foreign | | | Bonds Series B09-09 | | Colombia | | | CP | | | | 7.76 | % | | | 7.55 | % | | | No | | | | 1,153,945 | | | | 3,461,835 | | | | 4,615,780 | | | | 4,615,780 | | | | 4,615,779 | | | | 4,615,780 | | | | 62,205,978 | | | | — | | | | 76,053,317 | |
Foreign | | Emgesa S.A. E.S.P. | | Colombia | | | Foreign | | | Bonds Series B12 | | Colombia | | | CP | | | | 7.97 | % | | | 7.74 | % | | | No | | | | 485,500 | | | | 1,456,499 | | | | 1,941,999 | | | | 1,941,999 | | | | 1,941,999 | | | | 1,941,999 | | | | 1,941,999 | | | | 29,449,526 | | | | 37,217,522 | |
Foreign | | Emgesa S.A. E.S.P. | | Colombia | | | Foreign | | | Foreign Bonds | | Colombia | | | CP | | | | 10.17 | % | | | 10.17 | % | | | No | | | | 4,486,961 | | | | 13,460,883 | | | | 17,947,844 | | | | 2,497,535 | | | | 2,497,536 | | | | 2,497,535 | | | | 2,497,536 | | | | 29,750,447 | | | | 39,740,589 | |
Foreign | | Emgesa S.A. E.S.P. | | Colombia | | | Foreign | | | Quimbo Bonds | | Colombia | | | CP | | | | 10.17 | % | | | 10.17 | % | | | No | | | | 624,384 | | | | 1,873,151 | | | | 2,497,535 | | | | 17,947,843 | | | | 17,947,844 | | | | 17,947,843 | | | | 17,947,844 | | | | 213,793,324 | | | | 285,584,698 | |
Foreign | | Emgesa S.A. E.S.P. | | Colombia | | | Foreign | | | Quimbo Bonds B10 | | Colombia | | | CP | | | | 5.34 | % | | | 5.24 | % | | | No | | | | 1,100,769 | | | | 3,302,308 | | | | 4,403,077 | | | | 4,403,078 | | | | 4,403,077 | | | | 4,403,078 | | | | 4,403,077 | | | | 99,436,473 | | | | 117,048,783 | |
Foreign | | Emgesa S.A. E.S.P. | | Colombia | | | Foreign | | | Quimbo Bonds B15 | | Colombia | | | CP | | | | 5.46 | % | | | 5.36 | % | | | No | | | | 753,246 | | | | 2,259,737 | | | | 3,012,983 | | | | 3,012,983 | | | | 3,012,983 | | | | 3,012,983 | | | | 3,012,983 | | | | 81,666,289 | | | | 93,718,221 | |
Foreign | | Emgesa S.A. E.S.P. | | Colombia | | | Foreign | | | Quimbo Bonds B12-13 | | Colombia | | | CP | | | | 6.85 | % | | | 6.68 | % | | | No | | | | 1,648,116 | | | | 4,944,349 | | | | 6,592,465 | | | | 6,592,465 | | | | 6,592,466 | | | | 6,592,465 | | | | 6,592,466 | | | | 143,514,560 | | | | 169,884,422 | |
Foreign | | Emgesa S.A. E.S.P. | | Colombia | | | Foreign | | | Quimbo Bonds B6-13 | | Colombia | | | CP | | | | 6.08 | % | | | 5.95 | % | | | No | | | | 616,960 | | | | 1,850,879 | | | | 2,467,839 | | | | 2,467,839 | | | | 2,467,838 | | | | 2,467,839 | | | | 2,467,838 | | | | 43,453,010 | | | | 53,324,364 | |
Foreign | | Emgesa S.A. E.S.P. | | Colombia | | | Foreign | | | Bonds Series B6-13 | | Colombia | | | CP | | | | 6.08 | % | | | 5.95 | % | | | No | | | | 199,976 | | | | 599,927 | | | | 799,903 | | | | 799,903 | | | | 799,903 | | | | 799,903 | | | | 799,903 | | | | 14,084,549 | | | | 17,284,161 | |
| | | | | | | | | | | | | | | | | | | | | | | | | | | | | | | | | | | | | | | | | | | | | | | | | | | | | | | | | | | | | | | | |
| | | | | | | | | | Total ThCh$ | | | | | | | | | | | | | | | | | | | | | 39,237,289 | | | | 79,389,910 | | | | 118,627,199 | | | | 126,504,376 | | | | 64,506,282 | | | | 97,487,022 | | | | 113,173,058 | | | | 749,531,315 | | | | 1,151,202,053 | |
| | | | | | | | | | | | | | | | | | | | | | | | | | | | | | | | | | | | | | | | | | | | | | | | | | | | | | | | | | | | | | | | |
F-244
| | | | | | | | | | | | | | | | | | | | | | | | | | | | | | | | | | | | | | | | | | | | | | | | | | | | | | | | | | |
| | | | | | | | | | | | | | | | | | | | | | | Balance as of 1-1-2013 | |
| | | | | | | | | | | | | | | | | | | | | | | Current | | | Non-current | |
Taxpayer ID No.
(RUT) | | Company | | Country | | ID No.
Financial
Institution | | Financial Institution | | Country | | Currency | | Effective
Interest
Rate | | | Nominal
Interest
Rate | | | Secured
(Yes/
No) | | One to
three
months | | | Three to
twelve
months | | | Total
Current | | | One to
two
years | | | Two to
three
years | | | Three to
four
years | | | Four to
five
years | | | More
than
five
years | | | Total
Non-
current | |
| | | | | | | | | | | ThCh$ | | | ThCh$ | | | ThCh$ | | | ThCh$ | | | ThCh$ | | | ThCh$ | | | ThCh$ | | | ThCh$ | | | ThCh$ | |
Foreign | | Chinango S.A.C. | | Peru | | Foreign | | Banco Continental | | Peru | | Sol | | | 6.57 | % | | | 6.47 | % | | Si | | | 75,703 | | | | 4,870,634 | | | | 4,946,337 | | | | — | | | | — | | | | — | | | | — | | | | — | | | | — | |
Foreign | | Chinango S.A.C. | | Peru | | Foreign | | Banco Continental | | Peru | | Sol | | | 6.25 | % | | | 6.16 | % | | Si | | | 72,046 | | | | 216,138 | | | | 288,184 | | | | 4,718,008 | | | | — | | | | — | | | | — | | | | — | | | | 4,718,008 | |
Foreign | | Edegel S.A.A | | Peru | | Foreign | | Banco Continental | | Peru | | US$ | | | 6.57 | % | | | 6.47 | % | | No | | | 79,897 | | | | 239,692 | | | | 319,589 | | | | 319,589 | | | | 319,589 | | | | 319,589 | | | | 319,589 | | | | 4,814,505 | | | | 6,092,861 | |
Foreign | | Edegel S.A.A | | Peru | | Foreign | | Banco Continental | | Peru | | Sol | | | 6.41 | % | | | 6.31 | % | | No | | | 73,875 | | | | 221,624 | | | | 295,499 | | | | 295,499 | | | | 295,500 | | | | 295,499 | | | | 295,498 | | | | 6,023,737 | | | | 7,205,733 | |
Foreign | | Edegel S.A.A | | Peru | | Foreign | | Banco Continental | | Peru | | Sol | | | 6.38 | % | | | 6.28 | % | | No | | | 73,509 | | | | 220,527 | | | | 294,036 | | | | 294,036 | | | | 294,036 | | | | 294,036 | | | | 294,036 | | | | 5,159,550 | | | | 6,335,694 | |
Foreign | | Edegel S.A.A | | Peru | | Foreign | | Banco Continental | | Peru | | Sol | | | 6.86 | % | | | 6.75 | % | | No | | | 63,196 | | | | 189,587 | | | | 252,783 | | | | 3,923,716 | | | | — | | | | — | | | | — | | | | — | | | | 3,923,716 | |
Foreign | | Edegel S.A.A | | Peru | | Foreign | | Banco Continental | | Peru | | Sol | | | 6.61 | % | | | 6.50 | % | | No | | | 4,770,062 | | | | — | | | | 4,770,062 | | | | — | | | | — | | | | — | | | | — | | | | — | | | | — | |
Foreign | | Edegel S.A.A | | Peru | | Foreign | | Banco Continental | | Peru | | Sol | | | 6.54 | % | | | 6.44 | % | | No | | | 75,338 | | | | 4,744,218 | | | | 4,819,556 | | | | — | | | | — | | | | — | | | | — | | | | — | | | | — | |
Foreign | | Edegel S.A.A | | Peru | | Foreign | | Banco Continental | | Peru | | Sol | | | 6.74 | % | | | 6.63 | % | | No | | | 77,532 | | | | 4,771,525 | | | | 4,849,057 | | | | — | | | | — | | | | — | | | | — | | | | — | | | | — | |
Foreign | | Edegel S.A.A | | Peru | | Foreign | | Banco Continental | | Peru | | Sol | | | 6.70 | % | | | 6.59 | % | | No | | | 87,352 | | | | 262,056 | | | | 349,408 | | | | 5,400,952 | | | | — | | | | — | | | | — | | | | — | | | | 5,400,952 | |
Foreign | | Edegel S.A.A | | Peru | | Foreign | | Banco Continental | | Peru | | US$ | | | 6.44 | % | | | 6.34 | % | | No | | | 78,353 | | | | 235,060 | | | | 313,413 | | | | 313,413 | | | | 313,414 | | | | 313,413 | | | | 313,414 | | | | 7,948,123 | | | | 9,201,777 | |
Foreign | | Edegel S.A.A | | Peru | | Foreign | | Banco Continental | | Peru | | US$ | | | 9.20 | % | | | 9.00 | % | | No | | | 108,049 | | | | 324,147 | | | | 432,196 | | | | 5,049,991 | | | | — | | | | — | | | | — | | | | — | | | | 5,049,991 | |
Foreign | | Edegel S.A.A | | Peru | | Foreign | | Banco Continental | | Peru | | US$ | | | 7.93 | % | | | 7.78 | % | | No | | | 78,482 | | | | 235,446 | | | | 313,928 | | | | 313,928 | | | | 313,928 | | | | 313,928 | | | | 313,928 | | | | 4,249,866 | | | | 5,505,578 | |
Foreign | | Edegel S.A.A | | Peru | | Foreign | | Banco Continental | | Peru | | US$ | | | 7.25 | % | | | 7.13 | % | | No | | | 55,926 | | | | 167,777 | | | | 223,703 | | | | 223,703 | | | | 3,061,335 | | | | — | | | | — | | | | — | | | | 3,285,038 | |
Foreign | | Edegel S.A.A | | Peru | | Foreign | | Banco Scotiabank | | Peru | | US$ | | | 6.74 | % | | | 6.63 | % | | No | | | 81,827 | | | | 245,481 | | | | 327,308 | | | | 327,308 | | | | 327,309 | | | | 4,978,803 | | | | — | | | | — | | | | 5,633,420 | |
Foreign | | Edegel S.A.A | | Peru | | Foreign | | Banco Scotiabank | | Peru | | US$ | | | 6.09 | % | | | 6.00 | % | | No | | | 74,108 | | | | 222,323 | | | | 296,431 | | | | 296,430 | | | | 296,431 | | | | 5,010,196 | | | | — | | | | — | | | | 5,603,057 | |
Foreign | | Edegel S.A.A | | Peru | | Foreign | | Banco Scotiabank | | Peru | | US$ | | | 5.87 | % | | | 5.78 | % | | No | | | 71,406 | | | | 214,217 | | | | 285,623 | | | | 285,623 | | | | 285,623 | | | | 285,623 | | | | 285,623 | | | | 5,573,336 | | | | 6,715,828 | |
Foreign | | Emgesa S.A. E.S.P. | | Colombia | | Foreign | | Bonds Series A-10 | | Colombia | | CP | | | 7.95 | % | | | 7.72 | % | | No | | | 1,102,280 | | | | 3,306,839 | | | | 4,409,119 | | | | 4,409,118 | | | | 57,596,986 | | | | — | | | | — | | | | — | | | | 62,006,104 | |
Foreign | | Emgesa S.A. E.S.P. | | Colombia | | Foreign | | Bonds Series A102 | | Colombia | | CP | | | 7.95 | % | | | 7.72 | % | | No | | | 209,956 | | | | 629,869 | | | | 839,825 | | | | 839,825 | | | | 10,970,853 | | | | — | | | | — | | | | — | | | | 11,810,678 | |
Foreign | | Emgesa S.A. E.S.P. | | Colombia | | Foreign | | Bonds Series A5 | | Colombia | | CP | | | 8.06 | % | | | 8.06 | % | | No | | | 223,748 | | | | 671,245 | | | | 894,993 | | | | 13,536,136 | | | | — | | | | — | | | | — | | | | — | | | | 13,536,136 | |
Foreign | | Emgesa S.A. E.S.P. | | Colombia | | Foreign | | Bonds Series B09-09 | | Colombia | | CP | | | 7.38 | % | | | 7.19 | % | | No | | | 1,325,639 | | | | 3,976,917 | | | | 5,302,556 | | | | 5,302,556 | | | | 5,302,555 | | | | 5,302,556 | | | | 5,302,555 | | | | 62,175,621 | | | | 83,385,843 | |
Foreign | | Emgesa S.A. E.S.P. | | Colombia | | Foreign | | Bonds Series B10 | | Colombia | | CP | | | 8.71 | % | | | 8.44 | % | | No | | | 946,998 | | | | 2,840,995 | | | | 3,787,993 | | | | 3,787,993 | | | | 3,787,994 | | | | 3,787,993 | | | | 3,787,994 | | | | 47,759,102 | | | | 62,911,076 | |
Foreign | | Emgesa S.A. E.S.P. | | Colombia | | Foreign | | Bonds Series B-103 | | Colombia | | CP | | | 9.03 | % | | | 8.74 | % | | No | | | 894,296 | | | | 2,682,888 | | | | 3,577,184 | | | | 3,577,183 | | | | 3,577,184 | | | | 3,577,183 | | | | 46,627,448 | | | | — | | | | 57,358,998 | |
Foreign | | Emgesa S.A. E.S.P. | | Colombia | | Foreign | | Bonds Series B12 | | Colombia | | CP | | | 9.27 | % | | | 9.27 | % | | No | | | 555,900 | | | | 1,667,701 | | | | 2,223,601 | | | | 2,223,601 | | | | 2,223,602 | | | | 2,223,601 | | | | 2,223,602 | | | | 32,223,666 | | | | 41,118,072 | |
Foreign | | Emgesa S.A. E.S.P. | | Colombia | | Foreign | | Bonds Series B15 | | Colombia | | CP | | | 8.83 | % | | | 8.56 | % | | No | | | 339,573 | | | | 1,018,719 | | | | 1,358,292 | | | | 1,358,292 | | | | 1,358,291 | | | | 1,358,292 | | | | 1,358,292 | | | | 23,403,980 | | | | 28,837,147 | |
Foreign | | Emgesa S.A. E.S.P. | | Colombia | | Foreign | | Bonds Series E5-09 | | Colombia | | CP | | | 9.04 | % | | | 8.75 | % | | No | | | 577,113 | | | | 1,731,338 | | | | 2,308,451 | | | | 26,317,195 | | | | — | | | | — | | | | — | | | | — | | | | 26,317,195 | |
Foreign | | Emgesa S.A. E.S.P. | | Colombia | | Foreign | | Foreign Bonds | | Colombia | | CP | | | 10.17 | % | | | 10.17 | % | | No | | | 618,169 | | | | 1,854,506 | | | | 2,472,675 | | | | 2,472,674 | | | | 2,472,675 | | | | 2,472,674 | | | | 2,472,675 | | | | 31,993,565 | | | | 41,884,263 | |
Foreign | | Emgesa S.A. E.S.P. | | Colombia | | Foreign | | Quimbo Bonds | | Colombia | | CP | | | 10.17 | % | | | 10.17 | % | | No | | | 4,442,297 | | | | 13,326,891 | | | | 17,769,188 | | | | 17,769,188 | | | | 17,769,189 | | | | 17,769,188 | | | | 17,769,189 | | | | 229,912,869 | | | | 300,989,623 | |
Foreign | | Emgesa S.A. E.S.P. | | Colombia | | Foreign | | Quimbo Bonds B10 | | Colombia | | CP | | | 6.39 | % | | | 6.24 | % | | No | | | 1,264,032 | | | | 3,792,096 | | | | 5,056,128 | | | | 5,056,128 | | | | 5,056,127 | | | | 5,056,128 | | | | 5,056,127 | | | | 106,512,256 | | | | 126,736,766 | |
Foreign | | Emgesa S.A. E.S.P. | | Colombia | | Foreign | | Quimbo Bonds B15 | | Colombia | | CP | | | 6.39 | % | | | 6.24 | % | | No | | | 859,450 | | | | 2,578,349 | | | | 3,437,799 | | | | 3,437,798 | | | | 3,437,798 | | | | 3,437,798 | | | | 3,437,798 | | | | 88,532,392 | | | | 102,283,584 | |
| | | | | | | | | | | | | | | | | | | | | | | | | | | | | | | | | | | | | | | | | | | | | | | | | | | | | | | | | | |
| | | | | | | | | | | | | | | | | | | | | | | | | 19,356,112 | | | | 57,458,805 | | | | 76,814,917 | | | | 111,849,883 | | | | 119,060,419 | | | | 56,796,500 | | | | 89,857,768 | | | | 656,282,568 | | | | 1,033,847,138 | |
| | | | | | | | | | | | | | | | | | | | | | | | | | | | | | | | | | | | | | | | | | | | | | | | | | | | | | | | | | |
| c) | Finance lease obligations |
Finance lease obligations by company
| | | | | | | | | | | | | | | | | | | | | | | | | | | | | | | | | | | | | | | | | | | | | | | | | | | | |
Taxpayer ID No. (RUT) | | Company | | Country | | ID No.
Financial
Institution | | Financial Institution | | Country | | Currency | | Nominal
Interest
Rate | | | Balance as of 12-31-2014 | |
| | | | | | | | | Current | | | Non-current | |
| | | | | | | | | One to
three
months | | | Three to
twelve
months | | | Total
Current | | | One to
two
years | | | Two to
three
years | | | Three to
four
years | | | Four to
five
years | | | More
than
five
years | | | Total
Non-
current | |
| | | | | | | | | ThCh$ | | | ThCh$ | | | ThCh$ | | | ThCh$ | | | ThCh$ | | | ThCh$ | | | ThCh$ | | | ThCh$ | | | ThCh$ | |
Foreign | | Edegel S.A.A. | | Peru | | Foreign | | Banco Scotiabank | | Peru | | US$ | | | 1.98 | % | | | 2,250,920 | | | | 6,692,173 | | | | 8,943,093 | | | | 8,781,527 | | | | 13,384,629 | | | | — | | | | — | | | | — | | | | 22,166,156 | |
| | | | | | | | | | | | | | | | | | | | | | | | | | | | | | | | | | | | | | | | | | | | | | | | | | | | |
| | | | | | | | | | | | | | | | | | | 2,250,920 | | | | 6,692,173 | | | | 8,943,093 | | | | 8,781,527 | | | | 13,384,629 | | | | — | | | | — | | | | — | | | | 22,166,156 | |
| | | | | | | | | | | | | | | | | | | | | | | | | | | | | | | | | | | | | | | | | | | | | | | | | | | | |
F-245
| | | | | | | | | | | | | | | | | | | | | | | | | | | | | | | | | | | | | | | | | | | | | | | | | | | | |
Taxpayer ID No. (RUT) | | Company | | Country | | ID No.
Financial
Institution | | Financial
Institution | | Country | | Currency | | Effective
Interest
Rate | | | Balance as of 12-31-2013 | |
| | | | | | | | | Current | | | Non-current | |
| | | | | | | | | One to
three
months | | | Three to
twelve
months | | | Total
Current | | | One to
two
years | | | Two to
three
years | | | Three to
four
years | | | Four to
five
years | | | More
than
five
years | | | Total
Non-
current
| |
| | | | | | | | | ThCh$ | | | ThCh$ | | | ThCh$ | | | ThCh$ | | | ThCh$ | | | ThCh$ | | | ThCh$ | | | ThCh$ | | | ThCh$ | |
Foreign | | Edegel S.A.A. | | Peru | | Foreign | | Banco Scotiabank | | Peru | | US$ | | | 1.98 | % | | | 1,486,952 | | | | 4,421,036 | | | | 5,907,988 | | | | 7,757,609 | | | | 7,612,090 | | | | 11,585,284 | | | | — | | | | — | | | | 26,954,983 | |
| | | | | | | | | | | | | | | | | | | | | | | | | | | | | | | | | | | | | | | | | | | | | | | | | | | | |
| | | | | | | | Total ThCh$ | | | | | | | | | | | | | | | | | | | 5,907,988 | | | | | | | | | | | | | | | | | | | | | | | | 26,954,983 | |
| | | | | | | | | | | | | | | | | | | | | | | | | | | | | | | | | | | | | | | | | | | | | | | | | | | | |
| | | | | | | | | | | | | | | | | | | | | | | | | | | | | | | | | | | | | | | | | | | | | | | | | | | | |
Taxpayer ID No. (RUT) | | Company | | Country | | ID No.
Financial
Institution | | Financial
Institution | | Country | | Currency | | Effective
Interest
Rate | | | Balance as of 1-1-2013 | |
| | | | | | | | | Current | | | Non-current | |
| | | | | | | | | One to
three
months
ThCh$ | | | Three to
twelve
months
ThCh$ | | | Total
Current
ThCh$ | | | One to
two
years
ThCh$ | | | Two to
three
years
ThCh$ | | | Three to
four
years
ThCh$ | | | Four to
five
years
ThCh$ | | | More
than
five
years
ThCh$ | | | Total
Non-current
ThCh$ | |
Foreign | | Edegel S.A.A. | | Peru | | Foreign | | Banco Scotiabank | | Peru | | US$ | | | 2.13 | % | | | 1,406,430 | | | | 4,177,025 | | | | 5,583,455 | | | | 5,470,749 | | | | 7,137,652 | | | | 6,983,202 | | | | 10,563,340 | | | | — | | | | 30,154,943 | |
| | | | | | | | | | | | | | | | | | | | | | | | | | | | | | | | | | | | | | | | | | | | | | | | | | | | |
| | | | | | | | Total ThCh$ | | | | | | | | | | | | | | | | | | | 5,583,455 | | | | | | | | | | | | | | | | | | | | | | | | 30,154,943 | |
| | | | | | | | | | | | | | | | | | | | | | | | | | | | | | | | | | | | | | | | | | | | | | | | | | | | |
| • | | Other liabilities by company |
| | | | | | | | | | | | | | | | | | | | | | | | | | | | | | | | | | | | | | | | | | | | | | | | | | | | |
Taxpayer ID No. (RUT) | | Company | | Country | | ID No.
Financial
Institution | | Financial Institution | | Country | | Currency | | Nominal
Interest
Rate | | | Balance as of 12-31-2014 | |
| | | | | | | | | Current | | | Non-current | |
| | | | | | | | | One to
three
months | | | Three to
twelve
months | | | Total
Current | | | One to
two
years | | | Two to
three
years | | | Three
to four
years | | | Four to
five
years | | | More
than
five years | | | Total
Non-
current | |
| | | | | | | | | ThCh$ | | | ThCh$ | | | ThCh$ | | | ThCh$ | | | ThCh$ | | | ThCh$ | | | ThCh$ | | | ThCh$ | | | ThCh$ | |
Foreign | | Central Costanera S.A. | | Argentina | | Foreign | | Mitsubishi (secured debt) | | Argentina | | US$ | | | 7.42 | % | | | 9,523 | | | | 1,850,404 | | | | 1,859,927 | | | | 671,565 | | | | 670,617 | | | | 669,670 | | | | 808,784 | | | | 23,886,776 | | | | 26,707,412 | |
Foreign | | Central Costanera S.A. | | Argentina | | Foreign | | Others | | Argentina | | Ar$ | | | 17.29 | % | | | 1,097,278 | | | | 1,294,252 | | | | 2,391,530 | | | | — | | | | — | | | | — | | | | — | | | | — | | | | — | |
Foreign | | H. El Chocón S.A. | | Argentina | | Foreign | | Others | | Argentina | | Ar$ | | | 23.54 | % | | | 127,042 | | | | 381,125 | | | | 508,167 | | | | 7,769,157 | | | | 1,945,985 | | | | — | | | | — | | | | — | | | | 9,715,142 | |
Foreign | | Hidroinvest S.A. | | Argentina | | Foreign | | Others | | Argentina | | US$ | | | 2.33 | % | | | 952 | | | | 168,039 | | | | 168,991 | | | | — | | | | — | | | | — | | | | — | | | | — | | | | — | |
| | | | | | | | | | | | | | | | | | | | | | | | | | | | | | | | | | | | | | | | | | | | | | | | | | | | |
| | | | | | | | | | | | | | | | | | | | | | | | | | | 4,928,615 | | | | | | | | | | | | | | | | | | | | | | | | 36,422,554 | |
| | | | | | | | | | | | | | | | | | | | | | | | | | | | | | | | | | | | | | | | | | | | | | | | | | | | |
| | | | | | | | | | | | | | | | | | | | | | | | | | | | | | | | | | | | | | | | | | | | | | | | | | | | | | |
Taxpayer ID No. (RUT) | | Company | | Country | | ID No.
Financial
Institution | | Financial Institution | | Country | | Currency | | | Effective
Interest
Rate | | | Balance as of 12-31-2013 | |
| | | | | | | | | Current | | | Non-current | |
| | | | | | | | | One to
three
months
ThCh$ | | | Three to
twelve
months
ThCh$ | | | Total
Current
ThCh$ | | | One to
two
years
ThCh$ | | | Two to
three
years
ThCh$ | | | Three to
four
years
ThCh$ | | | Four to
five
years
ThCh$ | | | More
than
five
years
ThCh$ | | | Total
Non-
current
ThCh$ | |
Foreign | | Central Costanera S.A. | | Argentina | | Foreign | | Mitsubishi (secured debt) | | Argentina | | US$ | | | | | 7.42 | % | | | 72,176,231 | | | | — | | | | 72,176,231 | | | | — | | | | — | | | | — | | | | — | | | | — | | | | — | |
Foreign | | Central Costanera S.A. | | Argentina | | Foreign | | Mitsubishi (unsecured debt) | | Argentina | | US$ | | | | | 7.42 | % | | | 2,242,057 | | | | — | | | | 2,242,057 | | | | — | | | | — | | | | — | | | | — | | | | — | | | | — | |
Foreign | | Central Costanera S.A. | | Argentina | | Foreign | | Other | | Argentina | | Ar$ | | | | | 17.29 | % | | | 922,114 | | | | 2,556,048 | | | | 3,478,162 | | | | 1,528,787 | | | | — | | | | — | | | | — | | | | — | | | | 1,528,787 | |
Foreign | | Hidroinvest S.A. | | Argentina | | Foreign | | Other | | Argentina | | US$ | | | | | 2.33 | % | | | 767 | | | | 145,344 | | | | 146,111 | | | | — | | | | — | | | | — | | | | — | | | | — | | | | — | |
Foreign | | Hidroeléctrica El Chocón S.A. | | Argentina | | Foreign | | Other | | Argentina | | Ar$ | | | | | 23.54 | % | | | 48,246 | | | | 144,738 | | | | 192,984 | | | | 784,122 | | | | 343,815 | | | | — | | | | — | | | | — | | | | 1,127,937 | |
| | | | | | | | | | | | | | | | | | | | | | | | | | | | | | | | | | | | | | | | | | | | | | | | | | | | | | |
| | | | | | | | Total ThCh$ | | | | | | | | | | | | | | | | | | | | | 78,235,545 | | | | | | | | | | | | | | | | | | | | | | | | 2,656,724 | |
| | | | | | | | | | | | | | | | | | | | | | | | | | | | | | | | | | | | | | | | | | | | | | | | | | | | | | |
F-246
| | | | | | | | | | | | | | | | | | | | | | | | | | | | | | | | | | | | | | | | | | | | | | | | | | | | |
Taxpayer ID No. (RUT) | | Company | | Country | | ID No.
Financial
Institution | | Financial Institution | | Country | | Currency | | Effective
Interest
Rate | | | Balance as of 1-1-2013 | |
| | | | | | | | | Current | | | Non-current | |
| | | | | | | | | One to
three
months
ThCh$ | | | Three to
twelve
months
ThCh$ | | | Total
Current
ThCh$ | | | One to
two
years
ThCh$ | | | Two to
three
years
ThCh$ | | | Three to
four
years
ThCh$ | | | Four to
five
years
ThCh$ | | | More
than
five
years
ThCh$ | | | Total
Non-
current
ThCh$ | |
Foreign | | Central Costanera S.A. | | Argentina | | Foreign | | Mitsubishi (secured debt) | | Argentina | | US$ | | | 7.42 | % | | | 56,264,078 | | | | — | | | | 56,264,078 | | | | — | | | | — | | | | — | | | | — | | | | — | | | | — | |
Foreign | | Central Costanera S.A. | | Argentina | | Foreign | | Mitsubishi (unsecured debt) | | Argentina | | US$ | | | 7.42 | % | | | 11,534,186 | | | | — | | | | 11,534,186 | | | | — | | | | — | | | | — | | | | — | | | | — | | | | — | |
Foreign | | Central Costanera S.A. | | Argentina | | Foreign | | Other | | Argentina | | Ar$ | | | 17.29 | % | | | 799,346 | | | | 5,846,518 | | | | 6,645,864 | | | | 6,019,282 | | | | — | | | | — | | | | — | | | | — | | | | 6,019,282 | |
| | | | | | | | | | | | | | | | | | | | | | | | | | | | | | | | | | | | | | | | | | | | | | | | | | | | |
| | | | | | | | Total ThCh$ | | | | | | | | | | | | | | | | | | | 74,444,128 | | | | | | | | | | | | | | | | | | | | | | | | 6,019,282 | |
| | | | | | | | | | | | | | | | | | | | | | | | | | | | | | | | | | | | | | | | | | | | | | | | | | | | |
F-247
APPENDIX 4 DETAIL OF ASSETS AND LIABILITIES IN FOREIGN CURRENCY
This appendix forms an integral part of the Combined Group’s financial statements.
The detail of assets denominated in foreign currencies is the following:
| | | | | | | | | | | | | | | | |
| | | | | | | Balance as of | |
ASSETS | | Foreign
Currency | | Functional
Currency | | 12-31-2014
ThCh$ | | | 31-12-2013
ThCh$ | | | 1-1-2013
ThCh$ | |
CURRENT ASSETS | | | | | | | | | | | | | | | | |
Cash and cash equivalents | | | | | | | 22,166,394 | | | | 13,227,200 | | | | 4,129,928 | |
| | US$ | | Ch$ | | | 42,185 | | | | 893,331 | | | | — | |
| | US$ | | CP | | | 342,438 | | | | 13,145 | | | | 5,413 | |
| | US$ | | Sol | | | 21,216,886 | | | | 11,839,569 | | | | 3,690,418 | |
| | US$ | | Ar$ | | | 564,885 | | | | 481,155 | | | | 434,097 | |
| | | | | | | | | | | | | | | | |
TOTAL CURRENT ASSETS | | | | | | | 22,166,394 | | | | 13,227,200 | | | | 4,129,928 | |
| | | | | | | | | | | | | | | | |
NON-CURRENT ASSETS | | | | | | | | | | | | | | | | |
Investments accounted for using the equity method | | | | | | | 540,856,061 | | | | 546,255,158 | | | | 576,912,406 | |
| | Ar$ | | Ch$ | | | 1,979,132 | | | | 2,541,809 | | | | 2,743,725 | |
| | Brazilian real | | Sol | | | 56,886,006 | | | | 57,354,100 | | | | 60,560,247 | |
| | Brazilian real | | Ch$ | | | 481,990,923 | | | | 486,359,249 | | | | 513,608,434 | |
Goodwill | | | | | | | 94,462,005 | | | | 88,651,527 | | | | 89,994,422 | |
| | Sol | | Ch$ | | | 88,241,039 | | | | 81,661,135 | | | | 81,550,712 | |
| | Ar$ | | Ch$ | | | 6,220,966 | | | | 6,990,392 | | | | 8,443,710 | |
| | | | | | | | | | | | | | | | |
TOTAL NON-CURRENT ASSETS | | | | | | | 635,318,066 | | | | 634,906,685 | | | | 666,906,828 | |
| | | | | | | | | | | | | | | | |
TOTAL ASSETS | | | | | | | 657,484,460 | | | | 648,133,885 | | | | 671,036,756 | |
| | | | | | | | | | | | | | | | |
F-248
The detail of liabilities denominated in foreign currencies is the following:
| | | | | | | | | | | | | | | | | | | | | | | | | | | | | | | | | | | | | | | | |
| | | | | | | Balance as of 12-31-2014 | |
| | | | | | | Current | | | Non-current | |
| | | | | | | One to
three
months | | | Three to
twelve
months | | | Total
Current | | | One to
two years | | | Two to
three
years | | | Three to
four years | | | Four to
five years | | | More than
five years | | | Total
Non-
current | |
| | | Foreign
Currency | | Functional
Currency | | ThCh$ | | | ThCh$ | | | ThCh$ | | | ThCh$ | | | ThCh$ | | | ThCh$ | | | ThCh$ | | | ThCh$ | | | ThCh$ | |
Other financial liabilities | | US$ | | | | | 12,409,400 | | | | 32,391,553 | | | | 44,800,953 | | | | 64,839,611 | | | | 34,279,771 | | | | 24,234,477 | | | | 6,756,293 | | | | 39,249,717 | | | | 169,359,869 | |
| | US$ | | Sol | | | 9,589,986 | | | | 18,318,769 | | | | 27,908,755 | | | | 63,128,648 | | | | 33,609,154 | | | | 23,564,807 | | | | 5,947,509 | | | | 15,362,941 | | | | 141,613,059 | |
| | US$ | | Ar$ | | | 2,819,414 | | | | 14,072,784 | | | | 16,892,198 | | | | 1,710,963 | | | | 670,617 | | | | 669,670 | | | | 808,784 | | | | 23,886,776 | | | | 27,746,810 | |
| | | | | | | | | | | | | | | | | | | | | | | | | | | | | | | | | | | | | | | | |
TOTAL LIABILITIES | | | | | | | 12,409,400 | | | | 32,391,553 | | | | 44,800,953 | | | | 64,839,611 | | | | 34,279,771 | | | | 24,234,477 | | | | 6,756,293 | | | | 39,249,717 | | | | 169,359,869 | |
| | | | | | | | | | | | | | | | | | | | | | | | | | | | | | | | | | | | | | | | |
| | | | | | | | | | | | | | | | | | | | | | | | | | | | | | | | | | | | | | | | |
| | | Balance as of 12-31-2013 | |
| | Current | | | Non-current | |
| | One to
three
months | | | Three to
twelve
months | | | Total
Current | | | One to
two years | | | Two to
three
years | | | Three to
four years | | | Four to
five years | | | More than
five years | | | Total
Non-
current | |
| | | Foreign
Currency | | Functional
Currency | | ThCh$ | | | ThCh$ | | | ThCh$ | | | ThCh$ | | | ThCh$ | | | ThCh$ | | | ThCh$ | | | ThCh$ | | | ThCh$ | |
Other financial liabilities | | US$ | | | | | 81,049,824 | | | | 24,139,809 | | | | 105,189,633 | | | | 24,724,527 | | | | 34,787,422 | | | | 28,200,202 | | | | 19,508,956 | | | | 18,288,998 | | | | 125,510,105 | |
| | US$ | | Sol | | | 3,088,350 | | | | 15,585,838 | | | | 18,674,188 | | | | 23,083,155 | | | | 34,787,422 | | | | 28,200,202 | | | | 19,508,956 | | | | 18,288,998 | | | | 123,868,733 | |
| | US$ | | Ar$ | | | 77,961,474 | | | | 8,553,971 | | | | 86,515,445 | | | | 1,641,372 | | | | — | | | | — | | | | — | | | | — | | | | 1,641,372 | |
| | | | | | | | | | | | | | | | | | | | | | | | | | | | | | | | | | | | | | | | |
TOTAL LIABILITIES | | | | | | | 81,049,824 | | | | 24,139,809 | | | | 105,189,633 | | | | 24,724,527 | | | | 34,787,422 | | | | 28,200,202 | | | | 19,508,956 | | | | 18,288,998 | | | | 125,510,105 | |
| | | | | | | | | | | | | | | | | | | | | | | | | | | | | | | | | | | | | | | | |
| | | | | | | | | | | | | | | | | | | | | | | | | | | | | | | | | | | | | | | | |
| | | Balance as of 1-1-2013 | |
| | Current | | | Non-current | |
| | One to
three
months | | | Three to
twelve
months | | | Total
Current | | | One to
two years | | | Two to
three
years | | | Three to
four years | | | Four to
five years | | | More than
five years | | | Total
Non-
current | |
| | | Foreign
Currency | | Functional
Currency | | ThCh$ | | | ThCh$ | | | ThCh$ | | | ThCh$ | | | ThCh$ | | | ThCh$ | | | ThCh$ | | | ThCh$ | | | ThCh$ | |
Other financial liabilities | | US$ | | | | | 78,693,539 | | | | 13,151,311 | | | | 91,844,850 | | | | 23,783,781 | | | | 22,882,444 | | | | 31,978,714 | | | | 25,852,746 | | | | 34,695,428 | | | | 139,193,113 | |
| | US$ | | Sol | | | 4,249,373 | | | | 7,926,216 | | | | 12,175,589 | | | | 17,441,657 | | | | 21,387,855 | | | | 31,978,714 | | | | 25,852,746 | | | | 34,695,428 | | | | 131,356,400 | |
| | US$ | | Ar$ | | | 74,444,166 | | | | 5,225,095 | | | | 79,669,261 | | | | 6,342,124 | | | | 1,494,589 | | | | — | | | | — | | | | — | | | | 7,836,713 | |
| | | | | | | | | | | | | | | | | | | | | | | | | | | | | | | | | | | | | | | | |
TOTAL LIABILITIES | | | | | | | 78,693,539 | | | | 13,151,311 | | | | 91,844,850 | | | | 23,783,781 | | | | 22,882,444 | | | | 31,978,714 | | | | 25,852,746 | | | | 34,695,428 | | | | 139,193,113 | |
| | | | | | | | | | | | | | | | | | | | | | | | | | | | | | | | | | | | | | | | |
F-249
APPENDIX 5 ADDITIONAL INFORMATION CIRCULAR NO. 715 OF FEBRUARY 3, 2012
This appendix forms an integral part of the Combined Group’s financial statements.
| a) | Portfolio stratification |
| • | | Trade and other receivables by aging: |
| | | | | | | | | | | | | | | | | | | | | | | | | | | | | | | | | | | | | | | | | | | | | | | | |
Trade and Other Receivables | | Balance as of 12-31-2014 | |
| | Current
portfolio | | | 1-30 days | | | 31-60
days | | | 61-90
days | | | 91-120
days | | | 121-150
days | | | 151-180
days | | | 181-210
days | | | 211-250
days | | | More
than
251 days | | | Total
Current | | | Total Non-
current | |
| | ThCh$ | | | ThCh$ | | | ThCh$ | | | ThCh$ | | | ThCh$ | | | ThCh$ | | | ThCh$ | | | ThCh$ | | | ThCh$ | | | ThCh$ | | | ThCh$ | | | ThCh$ | |
Trade receivables, gross | | | 105,900,237 | | | | 5,522,879 | | | | 121,723 | | | | 64,251 | | | | 62,605 | | | | 61,242 | | | | 62,025 | | | | 60,783 | | | | 125,437 | | | | 2,178,437 | | | | 114,159,619 | | | | 136,744,799 | |
Allowance for doubtful accounts | | | (278,332 | ) | | | — | | | | — | | | | — | | | | — | | | | — | | | | — | | | | — | | | | — | | | | (865,390 | ) | | | (1,143,722 | ) | | | — | |
Other receivables, gross | | | 4,450,856 | | | | — | | | | — | | | | — | | | | — | | | | — | | | | — | | | | — | | | | — | | | | — | | | | 4,450,856 | | | | 4,471,713 | |
Allowance for doubtful accounts | | | (1,310,435 | ) | | | — | | | | — | | | | — | | | | — | | | | — | | | | — | | | | — | | | | — | | | | — | | | | (1,310,435 | ) | | | — | |
| | | | | | | | | | | | | | | | | | | | | | | | | | | | | | | | | | | | | | | | | | | | | | | | |
Total | | | 108,762,326 | | | | 5,522,879 | | | | 121,723 | | | | 64,251 | | | | 62,605 | | | | 61,242 | | | | 62,025 | | | | 60,783 | | | | 125,437 | | | | 1,313,047 | | | | 116,156,318 | | | | 141,216,512 | |
| | | | | | | | | | | | | | | | | | | | | | | | | | | | | | | | | | | | | | | | | | | | | | | | |
| | | | | | | | | | | | | | | | | | | | | | | | | | | | | | | | | | | | | | | | | | | | | | | | |
Trade and Other Receivables | | Balance as of 12-31-2013 | |
| | Current
portfolio | | | 1-30
days | | | 31-60
days | | | 61-90
days | | | 91-120
days | | | 121-150
days | | | 151-180
days | | | 181-210
days | | | 211-250
days | | | More
than
251 days | | | Total
Current | | | Total Non-
current | |
| | ThCh$ | | | ThCh$ | | | ThCh$ | | | ThCh$ | | | ThCh$ | | | ThCh$ | | | ThCh$ | | | ThCh$ | | | ThCh$ | | | ThCh$ | | | ThCh$ | | | ThCh$ | |
Trade receivables, gross | | | 91,725,332 | | | | 751,047 | | | | 60,100 | | | | 69,015 | | | | 68,747 | | | | 512,356 | | | | — | | | | 118 | | | | 843 | | | | 564,915 | | | | 93,752,473 | | | | 125,349,056 | |
Allowance for doubtful accounts | | | (215,507 | ) | | | — | | | | — | | | | — | | | | — | | | | — | | | | — | | | | — | | | | — | | | | (310,144 | ) | | | (525,651 | ) | | | — | |
Other receivables, gross | | | 10,310,841 | | | | — | | | | — | | | | — | | | | — | | | | — | | | | — | | | | — | | | | — | | | | — | | | | 10,310,841 | | | | 6,248,354 | |
Allowance for doubtful accounts | | | (1,297,252 | ) | | | — | | | | — | | | | — | | | | — | | | | — | | | | — | | | | — | | | | — | | | | — | | | | (1,297,252 | ) | | | — | |
| | | | | | | | | | | | | | | | | | | | | | | | | | | | | | | | | | | | | | | | | | | | | | | | |
Total | | | 100,523,414 | | | | 751,047 | | | | 60,100 | | | | 69,015 | | | | 68,747 | | | | 512,356 | | | | — | | | | 118 | | | | 843 | | | | 254,771 | | | | 102,240,411 | | | | 131,597,410 | |
| | | | | | | | | | | | | | | | | | | | | | | | | | | | | | | | | | | | | | | | | | | | | | | | |
| | | | | | | | | | | | | | | | | | | | | | | | | | | | | | | | | | | | | | | | | | | | | | | | |
Trade and Other Receivables | | Balance as of 1-1-2013 | | | Balance as of 1-1-2013 | |
| | Current
portfolio | | | 1-30
days | | | 31-60
days | | | 61-90
days | | | 91-120
days | | | 121-150
days | | | 151-180
days | | | 181-210
days | | | 211-250
days | | | More
than
251 days | | | Total
Current | | | Total Non-
current | |
| | ThCh$ | | | ThCh$ | | | ThCh$ | | | ThCh$ | | | ThCh$ | | | ThCh$ | | | ThCh$ | | | ThCh$ | | | ThCh$ | | | ThCh$ | | | ThCh$ | | | ThCh$ | |
Trade receivables, gross | | | 72,761,445 | | | | 123,848 | | | | 540 | | | | 6,288 | | | | 82,482 | | | | 272,789 | | | | — | | | | — | | | | 311 | | | | 482,237 | | | | 73,729,940 | | | | 140,323,852 | |
Allowance for doubtful accounts | | | (260,312 | ) | | | — | | | | — | | | | — | | | | — | | | | — | | | | — | | | | — | | | | — | | | | (449,139 | ) | | | (709,451 | ) | | | — | |
Other receivables, gross | | | 4,479,573 | | | | — | | | | — | | | | — | | | | — | | | | — | | | | — | | | | — | | | | — | | | | — | | | | 4,479,573 | | | | 6,640,299 | |
Allowance for doubtful accounts | | | (1,262,107 | ) | | | — | | | | — | | | | — | | | | — | | | | — | | | | — | | | | — | | | | — | | | | — | | | | (1,262,107 | ) | | | — | |
| | | | | | | | | | | | | | | | | | | | | | | | | | | | | | | | | | | | | | | | | | | | | | | | |
Total | | | 75,718,599 | | | | 123,848 | | | | 540 | | | | 6,288 | | | | 82,482 | | | | 272,789 | | | | — | | | | — | | | | 311 | | | | 33,098 | | | | 76,237,955 | | | | 146,964,151 | |
| | | | | | | | | | | | | | | | | | | | | | | | | | | | | | | | | | | | | | | | | | | | | | | | |
F-250
| • | | Trade receivables by type of portfolio: |
| | | | | | | | | | | | | | | | | | | | | | | | |
Aging of balances | | Balance as of 12-31-2014 | |
| | Non-renegotiated portfolio | | | Portfolio with renegotiation terms | | | Total gross portfolio | |
| | Number of
customers | | | Gross value
ThCh$ | | | Number of
customers | | | Gross value
ThCh$ | | | Number of
customers | | | Gross value
ThCh$ | |
Current | | | 137 | | | | 105,900,237 | | | | — | | | | — | | | | 137 | | | | 105,900,237 | |
1 to 30 days | | | 53 | | | | 5,522,879 | | | | — | | | | — | | | | 53 | | | | 5,522,879 | |
31 to 60 days | | | 11 | | | | 121,723 | | | | — | | | | — | | | | 11 | | | | 121,723 | |
61 to 90 days | | | 4 | | | | 64,251 | | | | — | | | | — | | | | 4 | | | | 64,251 | |
91 to 120 days | | | 3 | | | | 62,605 | | | | — | | | | — | | | | 3 | | | | 62,605 | |
121 to 150 days | | | 3 | | | | 61,242 | | | | — | | | | — | | | | 3 | | | | 61,242 | |
151 to 180 days | | | 1 | | | | 62,025 | | | | — | | | | — | | | | 1 | | | | 62,025 | |
181 to 210 days | | | 2 | | | | 60,783 | | | | — | | | | — | | | | 2 | | | | 60,783 | |
211 to 250 days | | | 2 | | | | 125,437 | | | | — | | | | — | | | | 2 | | | | 125,437 | |
More than 251 days | | | 33 | | | | 2,178,437 | | | | — | | | | — | | | | 33 | | | | 2,178,437 | |
| | | | | | | | | | | | | | | | | | | | | | | | |
Total | | | 249 | | | | 114,159,619 | | | | — | | | | — | | | | 249 | | | | 114,159,619 | |
| | | | | | | | | | | | | | | | | | | | | | | | |
| | | | | | | | | | | | | | | | | | | | | | | | |
Aging of balances | | Balance as of 12-31-2013 | |
| | Non-renegotiated portfolio | | | Portfolio with renegotiation terms | | | Total gross portfolio | |
| | Number of
customers | | | Gross value
ThCh$ | | | Number of
customers | | | Gross value
ThCh$ | | | Number of
customers | | | Gross value
ThCh$ | |
Current | | | 157 | | | | 91,725,332 | | | | — | | | | — | | | | 157 | | | | 91,725,332 | |
1 to 30 days | | | 30 | | | | 751,047 | | | | — | | | | — | | | | 30 | | | | 751,047 | |
31 to 60 days | | | 6 | | | | 60,100 | | | | — | | | | — | | | | 6 | | | | 60,100 | |
61 to 90 days | | | 9 | | | | 69,015 | | | | — | | | | — | | | | 9 | | | | 69,015 | |
91 to 120 days | | | 4 | | | | 68,747 | | | | — | | | | — | | | | 4 | | | | 68,747 | |
121 to 150 days | | | 11 | | | | 512,356 | | | | — | | | | — | | | | 11 | | | | 512,356 | |
151 to 180 days | | | — | | | | — | | | | — | | | | — | | | | — | | | | — | |
181 to 210 days | | | 4 | | | | 118 | | | | — | | | | — | | | | 4 | | | | 118 | |
211 to 250 days | | | 2 | | | | 843 | | | | — | | | | — | | | | 2 | | | | 843 | |
More than 251 days | | | 29 | | | | 564,915 | | | | — | | | | — | | | | 29 | | | | 564,915 | |
| | | | | | | | | | | | | | | | | | | | | | | | |
Total | | | 252 | | | | 93,752,473 | | | | — | | | | — | | | | 252 | | | | 93,752,473 | |
| | | | | | | | | | | | | | | | | | | | | | | | |
F-251
| | | | | | | | | | | | | | | | | | | | | | | | |
Aging of balances | | Balance as of 1-1-2013 | |
| | Non-renegotiated portfolio | | | Portfolio with renegotiation terms | | | Total gross portfolio | |
| | Number of
customers | | | Gross value
ThCh$ | | | Number of
customers | | | Gross value
ThCh$ | | | Number of
customers | | | Gross value
ThCh$ | |
Current | | | 149 | | | | 72,761,445 | | | | — | | | | — | | | | 149 | | | | 72,761,445 | |
1 to 30 days | | | 9 | | | | 123,848 | | | | — | | | | — | | | | 9 | | | | 123,848 | |
31 to 60 days | | | 2 | | | | 540 | | | | — | | | | — | | | | 2 | | | | 540 | |
61 to 90 days | | | 4 | | | | 6,288 | | | | — | | | | — | | | | 4 | | | | 6,288 | |
91 to 120 days | | | 2 | | | | 82,482 | | | | — | | | | — | | | | 2 | | | | 82,482 | |
121 to 150 days | | | 5 | | | | 272,789 | | | | — | | | | — | | | | 5 | | | | 272,789 | |
151 to 180 days | | | — | | | | — | | | | — | | | | — | | | | — | | | | — | |
181 to 210 days | | | — | | | | — | | | | — | | | | — | | | | — | | | | — | |
211 to 250 days | | | 3 | | | | 311 | | | | — | | | | — | | | | 3 | | | | 311 | |
More than 251 days | | | 16 | | | | 482,237 | | | | — | | | | — | | | | 16 | | | | 482,237 | |
| | | | | | | | | | | | | | | | | | | | | | | | |
Total | | | 190 | | | | 73,729,940 | | | | — | | | | — | | | | 190 | | | | 73,729,940 | |
| | | | | | | | | | | | | | | | | | | | | | | | |
| b) | Portfolio in default and in legal collection process |
| | | | | | | | | | | | | | | | | | | | | | | | |
Portfolio in Default and in Legal Collection Process | | Balance as of | |
| | 12-31-2014 | | | 12-31-2013 | | | 1-1-2013 | |
| | Number of
customers | | | Amount | | | Number of
customers | | | Amount | | | Number of
customers | | | Amount | |
| | | ThCh$ | | | | ThCh$ | | | | ThCh$ | |
Notes receivable in legal collection process (*) | | | 5 | | | | 186,025 | | | | 5 | | | | 223,563 | | | | 6 | | | | 298,950 | |
| | | | | | | | | | | | | | | | | | | | | | | | |
Total | | | 5 | | | | 186,025 | | | | 5 | | | | 223,563 | | | | 6 | | | | 298,950 | |
| | | | | | | | | | | | | | | | | | | | | | | | |
| (*) | Legal collections are included in the portfolio in arrears. |
| c) | Provisions and write-offs |
| | | | | | | | | | | | |
Provisions and Write-offs | | For the years ended | |
| | 12-31-2014 | | | 12-31-2013 | | | 1-1-2013 | |
| | ThCh$ | | | ThCh$ | | | ThCh$ | |
Provision for non-renegotiated portfolio | | | 869,239 | | | | (76,227 | ) | | | 421,482 | |
Write-offs during the period | | | — | | | | (29,397 | ) | | | (16,314 | ) |
Recoveries during the period | | | — | | | | — | | | | (331,977 | ) |
| | | | | | | | | | | | |
Total | | | 869,239 | | | | (105,624 | ) | | | 73,191 | |
| | | | | | | | | | | | |
F-252
| d) | Number and value of operationsO |
| | | | | | | | | | | | | | | | | | | | | | | | |
| | | For the years ended | |
| | 12-31-2014 | | | 12-31-2013 | | | 1-1-2013 | |
| | Last quarter | | | Year | | | Last quarter | | | Year | | | Last quarter | | | Year | |
Impairment provision and recoveries | | | | | | | | | | | | | | | | | | | | | | | | |
Number of operations | | | 45 | | | | 180 | | | | 24 | | | | 124 | | | | 7 | | | | 25 | |
Value of operations, in ThCh$ | | | 427,006 | | | | 869,239 | | | | (159,544 | ) | | | (76,227 | ) | | | 11,308 | | | | 89,505 | |
F-253
APPENDIX 5.1 SUPPLEMENTARY INFORMATION ON TRADE RECEIVABLES
This appendix forms an integral part of the Combined Group’s financial statements.
| a) | Portfolio stratification |
| • | | Trade receivables by aging: |
| | | | | | | | | | | | | | | | | | | | | | | | | | | | | | | | | | | | | | | | | | | | | | | | |
Trade and Other Receivables | | Balance as of 12-31-2014 | | | Balance as of 12-31-2014 | |
| | Current | | | 1-30 days | | | 31-60
days | | | 61-90
days | | | 91-120
days | | | 121-150
days | | | 151-180
days | | | 181-210
days | | | 211-250
days | | | More
than
251 days | | | Total
Current | | | Total Non-
current | |
| | ThCh$ | | | ThCh$ | | | ThCh$ | | | ThCh$ | | | ThCh$ | | | ThCh$ | | | ThCh$ | | | ThCh$ | | | ThCh$ | | | ThCh$ | | | ThCh$ | | | ThCh$ | |
Generation and transmission receivables | | | | | | | | | | | | | | | | | | | | | | | | | | | | | | | | | | | | | | | | | | | | | | | | |
— Large customers | | | 72,719,222 | | | | 5,522,879 | | | | 121,723 | | | | 64,251 | | | | 62,605 | | | | 61,242 | | | | 62,025 | | | | 60,783 | | | | 125,437 | | | | 2,178,437 | | | | 80,978,604 | | | | — | |
— Institutional customers | | | 31,379,347 | | | | — | | | | — | | | | — | | | | — | | | | — | | | | — | | | | — | | | | — | | | | — | | | | 31,379,347 | | | | 136,744,799 | |
— Others | | | 1,801,668 | | | | — | | | | — | | | | — | | | | — | | | | — | | | | — | | | | — | | | | — | | | | — | | | | 1,801,668 | | | | — | |
Allowance for doubtful account | | | (278,332 | ) | | | — | | | | — | | | | — | | | | — | | | | — | | | | — | | | | — | | | | — | | | | (865,390 | ) | | | (1,143,722 | ) | | | — | |
| | | | | | | | | | | | |
Unbilled services | | | 65,286,822 | | | | — | | | | — | | | | — | | | | — | | | | — | | | | — | | | | — | | | | — | | | | — | | | | 65,286,822 | | | | — | |
Services billed | | | 40,613,415 | | | | 5,522,879 | | | | 121,723 | | | | 64,251 | | | | 62,605 | | | | 61,242 | | | | 62,025 | | | | 60,783 | | | | 125,437 | | | | 2,178,437 | | | | 48,872,797 | | | | 136,744,799 | |
| | | | | | | | | | | | | | | | | | | | | | | | | | | | | | | | | | | | | | | | | | | | | | | | |
Total Trade Receivables, Gross | | | 105,900,237 | | | | 5,522,879 | | | | 121,723 | | | | 64,251 | | | | 62,605 | | | | 61,242 | | | | 62,025 | | | | 60,783 | | | | 125,437 | | | | 2,178,437 | | | | 114,159,619 | | | | 136,744,799 | |
| | | | | | | | | | | | | | | | | | | | | | | | | | | | | | | | | | | | | | | | | | | | | | | | |
Total Allowance for doubtful accounts | | | (278,332 | ) | | | — | | | | — | | | | — | | | | — | | | | — | | | | — | | | | — | | | | — | | | | (865,390 | ) | | | (1,143,722 | ) | | | — | |
| | | | | | | | | | | | | | | | | | | | | | | | | | | | | | | | | | | | | | | | | | | | | | | | |
Total Trade Receivables, Net | | | 105,621,905 | | | | 5,522,879 | | | | 121,723 | | | | 64,251 | | | | 62,605 | | | | 61,242 | | | | 62,025 | | | | 60,783 | | | | 125,437 | | | | 1,313,047 | | | | 113,015,897 | | | | 136,744,799 | |
| | | | | | | | | | | | | | | | | | | | | | | | | | | | | | | | | | | | | | | | | | | | | | | | |
| | | | | | | | | | | | | | | | | | | | | | | | | | | | | | | | | | | | | | | | | | | | | | | | |
Trade and Other Receivables | | Balance as of 12-31-2013 | | | Balance as of 12-31-2013 | |
| | Current | | | 1-30 days | | | 31-60
days | | | 61-90
days | | | 91-120
days | | | 121-150
days | | | 151-180
days | | | 181-210
days | | | 211-250
days | | | More
than
251 days | | | Total
Current | | | Total Non-
current | |
| | ThCh$ | | | ThCh$ | | | ThCh$ | | | ThCh$ | | | ThCh$ | | | ThCh$ | | | ThCh$ | | | ThCh$ | | | ThCh$ | | | ThCh$ | | | ThCh$ | | | ThCh$ | |
Generation and transmission receivables | | | | | | | | | | | | | | | | | | | | | | | | | | | | | | | | | | | | | | | | | | | | | | | | |
— Large customers | | | 66,609,983 | | | | 751,047 | | | | 60,100 | | | | 69,015 | | | | 68,747 | | | | 512,356 | | | | — | | | | 118 | | | | 843 | | | | 564,915 | | | | 68,637,124 | | | | — | |
— Institutional customers | | | 22,542,434 | | | | — | | | | — | | | | — | | | | — | | | | — | | | | — | | | | — | | | | — | | | | — | | | | 22,542,434 | | | | 125,349,056 | |
— Others | | | 2,572,915 | | | | — | | | | — | | | | — | | | | — | | | | — | | | | — | | | | — | | | | — | | | | — | | | | 2,572,915 | | | | — | |
Allowance for doubtful account | | | (215,507 | ) | | | — | | | | — | | | | — | | | | — | | | | — | | | | — | | | | — | | | | — | | | | (310,144 | ) | | | (525,651 | ) | | | — | |
| | | | | | | | | | | | |
Unbilled services | | | 64,161,755 | | | | — | | | | — | | | | — | | | | — | | | | — | | | | — | | | | — | | | | — | | | | — | | | | 64,161,755 | | | | 1,510,879 | |
Services billed | | | 27,563,577 | | | | 751,047 | | | | 60,100 | | | | 69,015 | | | | 68,747 | | | | 512,356 | | | | — | | | | 118 | | | | 843 | | | | 564,915 | | | | 29,590,718 | | | | 123,838,177 | |
| | | | | | | | | | | | | | | | | | | | | | | | | | | | | | | | | | | | | | | | | | | | | | | | |
Total Trade Receivables, Gross | | | 91,725,332 | | | | 751,047 | | | | 60,100 | | | | 69,015 | | | | 68,747 | | | | 512,356 | | | | — | | | | 118 | | | | 843 | | | | 564,915 | | | | 93,752,473 | | | | 125,349,056 | |
| | | | | | | | | | | | | | | | | | | | | | | | | | | | | | | | | | | | | | | | | | | | | | | | |
Total Allowance for doubtful accounts | | | (215,507 | ) | | | — | | | | — | | | | — | | | | — | | | | — | | | | — | | | | — | | | | — | | | | (310,144 | ) | | | (525,651 | ) | | | — | |
| | | | | | | | | | | | | | | | | | | | | | | | | | | | | | | | | | | | | | | | | | | | | | | | |
Total Trade Receivables, Net | | | 91,509,825 | | | | 751,047 | | | | 60,100 | | | | 69,015 | | | | 68,747 | | | | 512,356 | | | | — | | | | 118 | | | | 843 | | | | 254,771 | | | | 93,226,822 | | | | 125,349,056 | |
| | | | | | | | | | | | | | | | | | | | | | | | | | | | | | | | | | | | | | | | | | | | | | | | |
F-254
| | | | | | | | | | | | | | | | | | | | | | | | | | | | | | | | | | | | | | | | | | | | | | | | |
Trade and Other Receivables | | Balance as of 1-1-2013 | | | Balance as of 1-1-2013 | |
| | Current | | | 1-30
days | | | 31-60
days | | | 61-90
days | | | 91-120
days | | | 121-150
days | | | 151-180
days | | | 181-210
days | | | 211-250
days | | | More
than
251 days | | | Total
Current | | | Total Non-
current | |
| | ThCh$ | | | ThCh$ | | | ThCh$ | | | ThCh$ | | | ThCh$ | | | ThCh$ | | | ThCh$ | | | ThCh$ | | | ThCh$ | | | ThCh$ | | | ThCh$ | | | ThCh$ | |
Generation and transmission receivables | | | | | | | | | | | | | | | | | | | | | | | | | | | | | | | | | | | | | | | | | | | | | | | | |
— Large customers | | | 49,411,533 | | | | 123,848 | | | | 540 | | | | 6,288 | | | | 82,482 | | | | 272,789 | | | | — | | | | — | | | | 311 | | | | 482,237 | | | | 50,380,028 | | | | — | |
— Institutional customers | | | 18,748,525 | | | | — | | | | — | | | | — | | | | — | | | | — | | | | — | | | | — | | | | — | | | | — | | | | 18,748,525 | | | | 140,323,852 | |
— Others | | | 4,601,387 | | | | — | | | | — | | | | — | | | | — | | | | — | | | | — | | | | — | | | | — | | | | — | | | | 4,601,387 | | | | — | |
Allowance for doubtful account | | | (260,312 | ) | | | — | | | | — | | | | — | | | | — | | | | — | | | | — | | | | — | | | | — | | | | (449,139 | ) | | | (709,451 | ) | | | — | |
Unbilled services | | | 28,492,579 | | | | — | | | | — | | | | — | | | | — | | | | — | | | | — | | | | — | | | | — | | | | — | | | | 28,492,579 | | | | — | |
Services billed | | | 44,268,866 | | | | 123,848 | | | | 540 | | | | 6,288 | | | | 82,482 | | | | 272,789 | | | | — | | | | — | | | | 311 | | | | 482,237 | | | | 45,237,361 | | | | 140,323,852 | |
| | | | | | | | | | | | | | | | | | | | | | | | | | | | | | | | | | | | | | | | | | | | | | | | |
Total Trade Receivables, Gross | | | 72,761,445 | | | | 123,848 | | | | 540 | | | | 6,288 | | | | 82,482 | | | | 272,789 | | | | — | | | | — | | | | 311 | | | | 482,237 | | | | 73,729,940 | | | | 140,323,852 | |
| | | | | | | | | | | | | | | | | | | | | | | | | | | | | | | | | | | | | | | | | | | | | | | | |
Total Allowance for doubtful accounts | | | (260,312 | ) | | | — | | | | — | | | | — | | | | — | | | | — | | | | — | | | | — | | | | — | | | | (449,139 | ) | | | (709,451 | ) | | | — | |
| | | | | | | | | | | | | | | | | | | | | | | | | | | | | | | | | | | | | | | | | | | | | | | | |
Total Trade Receivables, Net | | | 72,501,133 | | | | 123,848 | | | | 540 | | | | 6,288 | | | | 82,482 | | | | 272,789 | | | | — | | | | — | | | | 311 | | | | 33,098 | | | | 73,020,489 | | | | 140,323,852 | |
| | | | | | | | | | | | | | | | | | | | | | | | | | | | | | | | | | | | | | | | | | | | | | | | |
| • | | Current trade receivables by type of portfolio: |
| | | | | | | | | | | | | | | | | | | | | | | | | | | | | | | | | | | | | | | | | | | | |
Portfolio Type | | Balance as of 12-31-2014 | |
| | Current | | | 1-30
days | | | 31-60
days | | | 61-90
days | | | 91-120
days | | | 121-150
days | | | 151-180
days | | | 181-210
days | | | 211-250
days | | | More
than
251 days | | | Total gross
portfolio | |
| | ThCh$ | | | ThCh$ | | | ThCh$ | | | ThCh$ | | | ThCh$ | | | ThCh$ | | | ThCh$ | | | ThCh$ | | | ThCh$ | | | ThCh$ | | | ThCh$ | |
GENERATION AND TRANSMISSION | | | | | | | | | | | | | | | | | | | | | | | | | | | | | | | | | | | | | | | | | | | | |
Non-renegotiated portfolio | | | 105,900,237 | | | | 5,522,879 | | | | 121,723 | | | | 64,251 | | | | 62,605 | | | | 61,242 | | | | 62,025 | | | | 60,783 | | | | 125,437 | | | | 2,178,437 | | | | 114,159,619 | |
— Large customers | | | 72,719,222 | | | | 5,522,879 | | | | 121,723 | | | | 64,251 | | | | 62,605 | | | | 61,242 | | | | 62,025 | | | | 60,783 | | | | 125,437 | | | | 2,178,437 | | | | 80,978,604 | |
— Institutional customers | | | 31,379,347 | | | | — | | | | — | | | | — | | | | — | | | | — | | | | — | | | | — | | | | — | | | | — | | | | 31,379,347 | |
— Others | | | 1,801,668 | | | | — | | | | — | | | | — | | | | — | | | | — | | | | — | | | | — | | | | — | | | | — | | | | 1,801,668 | |
| | | | | | | | | | | | | | | | | | | | | | | | | | | | | | | | | | | | | | | | | | | | |
Total gross portfolio | | | 105,900,237 | | | | 5,522,879 | | | | 121,723 | | | | 64,251 | | | | 62,605 | | | | 61,242 | | | | 62,025 | | | | 60,783 | | | | 125,437 | | | | 2,178,437 | | | | 114,159,619 | |
| | | | | | | | | | | | | | | | | | | | | | | | | | | | | | | | | | | | | | | | | | | | |
Portfolio Type | | Balance as of 12-31-2013 | |
| | Current | | | 1-30
days | | | 31-60
days | | | 61-90
days | | | 91-120
days | | | 121-150
days | | | 151-180
days | | | 181-210
days | | | 211-250
days | | | More
than
251 days | | | Total gross
portfolio | |
| | ThCh$ | | | ThCh$ | | | ThCh$ | | | ThCh$ | | | ThCh$ | | | ThCh$ | | | ThCh$ | | | ThCh$ | | | ThCh$ | | | ThCh$ | | | ThCh$ | |
GENERATION AND TRANSMISSION | | | | | | | | | | | | | | | | | | | | | | | | | | | | | | | | | | | | | | | | | | | | |
Non-renegotiated portfolio | | | 91,725,332 | | | | 751,047 | | | | 60,100 | | | | 69,015 | | | | 68,747 | | | | 512,356 | | | | — | | | | 118 | | | | 843 | | | | 564,915 | | | | 93,752,473 | |
— Large customers | | | 66,609,983 | | | | 751,047 | | | | 60,100 | | | | 69,015 | | | | 68,747 | | | | 512,356 | | | | — | | | | 118 | | | | 843 | | | | 564,915 | | | | 68,637,124 | |
— Institutional customers | | | 22,542,434 | | | | — | | | | — | | | | — | | | | — | | | | — | | | | — | | | | — | | | | — | | | | — | | | | 22,542,434 | |
— Others | | | 2,572,915 | | | | — | | | | — | | | | — | | | | — | | | | — | | | | — | | | | — | | | | — | | | | — | | | | 2,572,915 | |
| | | | | | | | | | | | | | | | | | | | | | | | | | | | | | | | | | | | | | | | | | | | |
Total gross portfolio | | | 91,725,332 | | | | 751,047 | | | | 60,100 | | | | 69,015 | | | | 68,747 | | | | 512,356 | | | | — | | | | 118 | | | | 843 | | | | 564,915 | | | | 93,752,473 | |
| | | | | | | | | | | | | | | | | | | | | | | | | | | | | | | | | | | | | | | | | | | | |
F-255
| | | | | | | | | | | | | | | | | | | | | | | | | | | | | | | | | | | | | | | | | | | | |
Portfolio Type | | Balance as of 1-1-2013 | |
| | Current | | | 1-30
days | | | 31-60
days | | | 61-90
days | | | 91-120
days | | | 121-150
days | | | 151-180
days | | | 181-210
days | | | 211-250
days | | | More
than
251 days | | | Total gross
portfolio | |
| | ThCh$ | | | ThCh$ | | | ThCh$ | | | ThCh$ | | | ThCh$ | | | ThCh$ | | | ThCh$ | | | ThCh$ | | | ThCh$ | | | ThCh$ | | | ThCh$ | |
GENERATION AND TRANSMISSION | | | | | | | | | | | | | | | | | | | | | | | | | | | | | | | | | | | | | | | | | | | | |
Non-renegotiated portfolio | | | 72,761,445 | | | | 123,848 | | | | 540 | | | | 6,288 | | | | 82,482 | | | | 272,789 | | | | — | | | | — | | | | 311 | | | | 482,237 | | | | 73,729,940 | |
— Large customers | | | 49,411,533 | | | | 123,848 | | | | 540 | | | | 6,288 | | | | 82,482 | | | | 272,789 | | | | — | | | | — | | | | 311 | | | | 482,237 | | | | 50,380,028 | |
— Institutional customers | | | 18,748,525 | | | | — | | | | — | | | | — | | | | — | | | | — | | | | — | | | | — | | | | — | | | | — | | | | 18,748,525 | |
— Others | | | 4,601,387 | | | | — | | | | — | | | | — | | | | — | | | | — | | | | — | | | | — | | | | — | | | | — | | | | 4,601,387 | |
| | | | | | | | | | | | | | | | | | | | | | | | | | | | | | | | | | | | | | | | | | | | |
Total gross portfolio | | | 72,761,445 | | | | 123,848 | | | | 540 | | | | 6,288 | | | | 82,482 | | | | 272,789 | | | | — | | | | — | | | | 311 | | | | 482,237 | | | | 73,729,940 | |
| | | | | | | | | | | | | | | | | | | | | | | | | | | | | | | | | | | | | | | | | | | | |
F-256
APPENDIX 5.2 ESTIMATED SALES AND PURCHASES OF ENERGY AND CAPACITY
This appendix forms an integral part of the Combined Group’s financial statements.
| | | | | | | | | | | | | | | | | | | | | | | | | | | | | | | | |
Balance as of 12-31-2014 | | Colombia | | | Peru | | | Argentina | | | Total | |
| | | Energy
and Tolls | | | Capacity | | | Energy
and Tolls | | | Capacity | | | Energy
and Tolls | | | Capacity | | | Energy
and Tolls | | | Capacity | |
STATEMENT OF FINANCIAL POSITION | | | | | | | | | | | | | | | | | | | | | | | | | | | | | | | | |
Current accounts receivable from related parties | | | 7,786,508 | | | | — | | | | 5,368,119 | | | | 1,066,736 | | | | — | | | | — | | | | 13,154,627 | | | | 1,066,736 | |
Trade and other current receivables, net | | | 40,601,712 | | | | — | | | | 17,278,485 | | | | 3,882,644 | | | | 4,480,943 | | | | 2,247,911 | | | | 62,361,140 | | | | 6,130,555 | |
| | | | | | | | | | | | | | | | | | | | | | | | | | | | | | | | |
Total Estimated Assets | | | 48,388,220 | | | | — | | | | 22,646,604 | | | | 4,949,380 | | | | 4,480,943 | | | | 2,247,911 | | | | 75,515,767 | | | | 7,197,291 | |
| | | | | | | | | | | | | | | | | | | | | | | | | | | | | | | | |
Trade and other current payables | | | 7,649,456 | | | | — | | | | 3,678,805 | | | | 208,310 | | | | 600,929 | | | | 6,529 | | | | 11,929,190 | | | | 6,529 | |
| | | | | | | | | | | | | | | | | | | | | | | | | | | | | | | | |
Total Estimated Liabilities | | | 7,649,456 | | | | — | | | | 3,678,805 | | | | 208,310 | | | | 600,929 | | | | 6,529 | | | | 11,929,190 | | | | 6,529 | |
| | | | | | | | | | | | | | | | | | | | | | | | | | | | | | | | |
| | | | | | | | | | | | | | | | | | | | | | | | | | | | | | | | |
For the year ended 12-31-2014 | | Colombia | | | Peru | | | Argentina | | | Total | |
| | | Energy
and Tolls | | | Capacity | | | Energy
and Tolls | | | Capacity | | | Energy
and Tolls | | | Capacity | | | Energy
and Tolls | | | Capacity | |
STATEMENT OF INCOME | | | | | | | | | | | | | | | | | | | | | | | | | | | | | | | | |
Energy Sales | | | 54,137,539 | | | | — | | | | 22,846,244 | | | | 4,468,362 | | | | 4,586,523 | | | | 2,405,065 | | | | 81,570,306 | | | | 6,873,427 | |
Energy Purchases | | | 7,769,885 | | | | — | | | | 3,641,295 | | | | 206,188 | | | | 623,093 | | | | 7,326 | | | | 12,034,273 | | | | 213,514 | |
F-257
| | | | | | | | | | | | | | | | | | | | | | | | | | | | | | | | |
Balance as of 12-31-2013 | | Colombia | | | Peru | | | Argentina | | | Total | |
| | | Energy
and Tolls | | | Capacity | | | Energy
and Tolls | | | Capacity | | | Energy
and Tolls | | | Capacity | | | Energy
and Tolls | | | Capacity | |
STATEMENT OF FINANCIAL POSITION | | | | | | | | | | | | | | | | | | | | | | | | | | | | | | | | |
Current accounts receivable from related parties | | | 13,456,841 | | | | — | | | | 4,951,544 | | | | 2,134,415 | | | | — | | | | — | | | | 18,408,385 | | | | 2,134,415 | |
Trade and other current receivables, net | | | 38,659,559 | | | | — | | | | 12,182,345 | | | | 4,158,171 | | | | 9,700,852 | | | | 3,817,585 | | | | 60,542,756 | | | | 7,975,756 | |
| | | | | | | | | | | | | | | | | | | | | | | | | | | | | | | | |
Total Estimated Assets | | | 52,116,400 | | | | — | | | | 17,133,889 | | | | 6,292,586 | | | | 9,700,852 | | | | 3,817,585 | | | | 78,951,141 | | | | 10,110,171 | |
| | | | | | | | | | | | | | | | | | | | | | | | | | | | | | | | |
Trade and other current payables | | | 6,624,845 | | | | — | | | | 1,532,078 | | | | 5,133 | | | | 1,668,713 | | | | 110,013 | | | | 9,825,636 | | | | 115,146 | |
| | | | | | | | | | | | | | | | | | | | | | | | | | | | | | | | |
Total Estimated Liabilities | | | 6,624,845 | | | | — | | | | 1,532,078 | | | | 5,133 | | | | 1,668,713 | | | | 110,013 | | | | 9,825,636 | | | | 115,146 | |
| | | | | | | | | | | | | | | | | | | | | | | | | | | | | | | | |
| | | | | | | | | | | | | | | | | | | | | | | | | | | | | | | | |
For the year ended 12-31-2013 | | Colombia | | | Peru | | | Argentina | | | Total | |
| | | Energy
and Tolls | | | Capacity | | | Energy
and Tolls | | | Capacity | | | Energy
and Tolls | | | Capacity | | | Energy
and Tolls | | | Capacity | |
STATEMENT OF INCOME | | | | | | | | | | | | | | | | | | | | | | | | | | | | | | | | |
Energy Sales | | | 50,812,335 | | | | — | | | | 17,235,999 | | | | 6,140,336 | | | | 10,371,211 | | | | 4,283,230 | | | | 78,419,545 | | | | 10,423,566 | |
Energy Purchases | | | 5,989,034 | | | | — | | | | 1,495,015 | | | | 5,009 | | | | 1,872,252 | | | | 123,432 | | | | 9,356,301 | | | | 128,441 | |
F-258
APPENDIX 6 DETAILS OF DUE DATES OF PAYMENTS TO SUPPLIERS
This appendix forms an integral part of the Combined Group’s financial statements.
| | | | | | | | | | | | | | | | |
Suppliers | | Balance as of 12-31-2014 | |
| | Goods | | | Services | | | Other | | | Total | |
| | ThCh$ | | | ThCh$ | | | ThCh$ | | | ThCh$ | |
Suppliers with Current Payment Amounts | | | | | | | | | | | | | | | | |
Up to 30 days | | | — | | | | 99,765,926 | | | | — | | | | 99,765,926 | |
From 31 to 60 days | | | — | | | | 6,067,846 | | | | — | | | | 6,067,846 | |
| | | | | | | | | | | | | | | | |
Total | | | — | | | | 105,833,772 | | | | — | | | | 105,833,772 | |
| | | | | | | | | | | | | | | | |
Suppliers with Past Due Amounts | | | | | | | | | | | | | | | | |
More than 180 days | | | — | | | | 1,137,018 | | | | — | | | | 1,137,018 | |
| | | | | | | | | | | | | | | | |
Total | | | — | | | | 1,137,018 | | | | — | | | | 1,137,018 | |
| | | | | | | | | | | | | | | | |
F-259
Pursuant to Rule 3-09 and Rule 1-02(w) of Regulation S-X, Endesa Chile is required to present separately the financial statements of Enel Brasil S.A. and subsidiaries as of September 30, 2015, prepared in accordance with International Financial Reporting Standards.
Enel Brasil S.A.
Consolidated financial statements
September 30, 2015
Contents
G-1
Enel Brasil S.A.
Consolidated statements of financial position
As of September 30, 2015, December 31, 2014 and 2013 and January 1, 2013
(In thousands of reais)
| | | | | | | | | | | | | | | | | | |
| | | Notes | | 09/30/2015 | | | 12/31/2014 | | | 12/31/2013 | | | 01/01/2013 | |
Assets | | | | | | | | | | | | | | | | | | |
Current assets | | | | | | | | | | | | | | | | | | |
Cash and cash equivalents | | 6 | | | 554,162 | | | | 864,071 | | | | 1,096,850 | | | | 814,805 | |
Marketable securities | | 7 | | | 128,400 | | | | 230,313 | | | | 735,678 | | | | 615,150 | |
Consumers, concessionaires and
permittees, net | | 8 | | | 1,781,088 | | | | 1,220,263 | | | | 1,100,387 | | | | 1,260,947 | |
CDE Subventions – tariff discount | | 9 | | | 340,037 | | | | 181,646 | | | | 20,385 | | | | — | |
Resources CCRBT | | | | | 44,298 | | | | — | | | | — | | | | — | |
CDE Subventions resources – Decree No. 7,945/2013 | | | | | — | | | | — | | | | 13,429 | | | | | |
Financial asset from Portion A and other | | 13 | | | 600,426 | | | | 487,333 | | | | — | | | | — | |
Taxes recoverable | | 10 | | | 261,612 | | | | 229,140 | | | | 322,072 | | | | 175,322 | |
Tax credit from merger | | 15 | | | 7,538 | | | | 8,049 | | | | 8,793 | | | | 9,609 | |
Guarantees deposits | | 11 | | | 70,211 | | | | 58,242 | | | | 52,939 | | | | 49,656 | |
Derivative financial instruments – gain on swap | | | | | 8,252 | | | | 844 | | | | 322 | | | | — | |
Other receivables | | 16 | | | 506,660 | | | | 490,671 | | | | 342,015 | | | | 262,170 | |
| | | | | | | | | | | | | | | | | | |
Total current assets | | | | | 4,302,684 | | | | 3,770,572 | | | | 3,692,870 | | | | 3,187,659 | |
| | | | | | | | | | | | | | | | | | |
Non-current assets | | | | | | | | | | | | | | | | | | |
Consumers, concessionaires and permittees, net | | 8 | | | 196,327 | | | | 148,073 | | | | 147,079 | | | | 170,983 | |
Financial asset from Portion A and other | | 13 | | | 312,358 | | | | 234,865 | | | | — | | | | — | |
Taxes recoverable | | 10 | | | 177,585 | | | | 148,178 | | | | 157,762 | | | | 163,107 | |
Escrow deposits | | 12 | | | 280,583 | | | | 261,720 | | | | 332,256 | | | | 300,475 | |
Guarantees deposits | | 11 | | | 25,089 | | | | 24,130 | | | | 64,054 | | | | 65,497 | |
Deferred taxes | | 14 | | | 461,403 | | | | 498,257 | | | | 387,531 | | | | 716,032 | |
Tax credit from merger | | 15 | | | 51,082 | | | | 56,606 | | | | 64,656 | | | | 73,449 | |
Derivative financial instruments – gain on swap | | | | | 9,699 | | | | 15,365 | | | | 19,719 | | | | — | |
Indemnification assets (concession) | | 17 | | | 2,406,338 | | | | 2,125,968 | | | | 2,014,096 | | | | 1,638,619 | |
Other receivables | | 16 | | | 19,574 | | | | 19,574 | | | | 2,124 | | | | 1,863 | |
Investments | | | | | 100 | | | | 100 | | | | 6,578 | | | | 100 | |
Property, plant and equipment | | 18 | | | 1,953,825 | | | | 1,969,507 | | | | 1,990,252 | | | | 2,006,697 | |
Intangible assets | | 19 | | | 4,832,674 | | | | 4,490,006 | | | | 4,606,872 | | | | 4,599,221 | |
| | | | | | | | | | | | | | | | | | |
Total non-current assets | | | | | 10,726,637 | | | | 9,992,349 | | | | 9,792,979 | | | | 9,736,043 | |
| | | | | | | | | | | | | | | | | | |
Total assets | | | | | 15,029,321 | | | | 13,762,921 | | | | 13,485,849 | | | | 12,923,702 | |
| | | | | | | | | | | | | | | | | | |
G-2
| | | | | | | | | | | | | | | | | | |
| | | Notes | | 09/30/2015 | | | 12/31/2014 | | | 12/31/2013 | | | 01/01/2013 | |
Liabilities and equity | | | | | | | | | | | | | | | | | | |
Current liabilities | | | | | | | | | | | | | | | | | | |
Trade accounts payable | | 20 | | | 1,571,760 | | | | 1,258,456 | | | | 847,571 | | | | 796,962 | |
Loans and financing | | 21 | | | 253,199 | | | | 187,495 | | | | 261,651 | | | | 319,687 | |
Debentures | | 22 | | | 300,758 | | | | 155,469 | | | | 25,737 | | | | 143,282 | |
Payroll | | | | | 104,682 | | | | 99,836 | | | | 85,517 | | | | 67,621 | |
Taxes payable | | 24 | | | 342,901 | | | | 173,405 | | | | 251,293 | | | | 215,647 | |
Regulatory charges | | 25 | | | 179,947 | | | | 18,881 | | | | 21,518 | | | | 76,717 | |
Dividends payable | | | | | 219,118 | | | | 219,327 | | | | 859,410 | | | | 375,873 | |
Post-employment benefit obligations | | 32 | | | 5,573 | | | | 770 | | | | 12,824 | | | | 12,098 | |
Installment tax program | | 27 | | | — | | | | 2,183 | | | | 14,478 | | | | 40,792 | |
Resources CCRBT | | | | | 16,791 | | | | — | | | | — | | | | — | |
Provision – “Luz para Todos” program | | | | | 55,502 | | | | 52,074 | | | | 27,367 | | | | 12,452 | |
Free energy | | | | | 36,608 | | | | 33,282 | | | | 29,869 | | | | 27,490 | |
Research, development and energy efficiency programs | | 26 | | | 77,234 | | | | 77,438 | | | | 95,238 | | | | 101,310 | |
Other obligations | | | | | 130,931 | | | | 85,950 | | | | 75,360 | | | | 63,191 | |
| | | | | | | | | | | | | | | | | | |
Total current liabilities | | | | | 3,295,004 | | | | 2,364,566 | | | | 2,607,833 | | | | 2,253,122 | |
| | | | | | | | | | | | | | | | | | |
Non-current liabilities | | | | | | | | | | | | | | | | | | |
Trade accounts payable | | 20 | | | 182,912 | | | | 126,363 | | | | 146,336 | | | | 126,753 | |
Loans and financing | | 21 | | | 1,187,513 | | | | 1,309,261 | | | | 1,113,456 | | | | 677,333 | |
Debentures | | 22 | | | 1,319,123 | | | | 1,434,910 | | | | 1,188,484 | | | | 1,310,051 | |
Deferred taxes | | 14 | | | 63,538 | | | | 73,077 | | | | 73,077 | | | | 398,912 | |
Post-employment benefit obligations | | 32 | | | 550,337 | | | | 535,345 | | | | 477,845 | | | | 551,794 | |
Research, development and energy efficiency programs | | 26 | | | 87,821 | | | | 105,527 | | | | 75,386 | | | | 32,291 | |
Installment tax program | | 27 | | | 14,413 | | | | 15,045 | | | | 19,130 | | | | 29,893 | |
Free energy | | | | | 6,744 | | | | 5,071 | | | | 4,572 | | | | 4,217 | |
Provision for tax, civil and labor risks | | 29 | | | 713,372 | | | | 666,896 | | | | 638,607 | | | | 591,471 | |
Other obligations | | | | | 10,818 | | | | 13,948 | | | | 3,163 | | | | 2,619 | |
| | | | | | | | | | | | | | | | | | |
Total non-current liabilities | | | | | 4,136,591 | | | | 4,285,443 | | | | 3,740,056 | | | | 3,725,334 | |
| | | | | | | | | | | | | | | | | | |
Equity | | 30 | | | | | | | | | | | | | | | | |
Attributed to controlling shareholder | | | | | | | | | | | | | | | | | | |
Capital | | | | | 1,320,049 | | | | 1,056,049 | | | | 1,056,049 | | | | 916,879 | |
Treasury shares | | | | | (111,025 | ) | | | (111,025 | ) | | | (111,025 | ) | | | (111,025 | ) |
Capital reserve | | | | | 2,504,370 | | | | 2,504,370 | | | | 2,504,370 | | | | 2,504,370 | |
Income reserve | | | | | 1,136,765 | | | | 1,400,765 | | | | 894,086 | | | | 780,426 | |
Retained earnings for the period | | | | | 445,747 | | | | — | | | | — | | | | — | |
Other comprehensive income | | | | | (49,440 | ) | | | 9,561 | | | | 8,170 | | | | (1,684 | ) |
Equity valuation adjustments | | | | | 167,722 | | | | 167,722 | | | | 205,398 | | | | 243,074 | |
Proposal for payment of additional dividends | | | | | — | | | | — | | | | 616,152 | | | | 741,665 | |
| | | | | | | | | | | | | | | | | | |
| | | | | 5,414,188 | | | | 5,027,442 | | | | 5,173,200 | | | | 5,073,705 | |
Attributed to non-controlling shareholders | | | | | | | | | | | | | | | | | | |
Attributed to other entities in the Enersis S.A. Group | | | | | 1,645,909 | | | | 1,629,264 | | | | 1,289,440 | | | | 1,041,964 | |
Attributed to other non-controlling shareholders | | | | | 537,629 | | | | 456,206 | | | | 675,320 | | | | 829,577 | |
| | | | | | | | | | | | | | | | | | |
| | | | | 2,183,538 | | | | 2,085,470 | | | | 1,964,760 | | | | 1,871,541 | |
| | | | | | | | | | | | | | | | | | |
Total equity | | | | | 7,597,726 | | | | 7,112,912 | | | | 7,137,960 | | | | 6,945,246 | |
| | | | | | | | | | | | | | | | | | |
Total liabilities and equity | | | | | 15,029,321 | | | | 13,762,921 | | | | 13,485,849 | | | | 12,923,702 | |
| | | | | | | | | | | | | | | | | | |
See accompanying notes.
G-3
Enel Brasil S.A.
Consolidated income statements
For the nine month periods ended September 30, 2015 and 2014 and for the years ended December 31, 2014 and 2013
(In thousands of reais)
| | | | | | | | | | | | | | | | | | |
| | | Notes | | 09/30/2015 | | | 12/31/2014 | | | 09/30/2014 | | | 12/31/2013 | |
| | | | | | | | | | | (Unaudited) | | | | |
Net revenue | | 34 | | | 7,656,412 | | | | 9,436,122 | | | | 6,381,275 | | | | 7,620,870 | |
| | | | | |
Cost of services | | 35 | | | (6,212,645 | ) | | | (7,129,289 | ) | | | (5,015,856 | ) | | | (5,439,340 | ) |
| | | | | | | | | | | | | | | | | | |
Gross profit | | | | | 1,443,767 | | | | 2,306,833 | | | | 1,365,419 | | | | 2,181,530 | |
| | | | | | | | | | | | | | | | | | |
Operating expenses | | | | | | | | | | | | | | | | | | |
Selling expenses | | 35 | | | (134,687 | ) | | | (85,313 | ) | | | (72,473 | ) | | | (128,789 | ) |
General and administrative expenses | | 35 | | | (435,543 | ) | | | (428,438 | ) | | | (309,494 | ) | | | (374,110 | ) |
Amortization and reversal of goodwill from merger | | 35 | | | (17,452 | ) | | | (22,622 | ) | | | (16,967 | ) | | | (24,720 | ) |
Other operating expenses | | 35 | | | (4,345 | ) | | | (20,371 | ) | | | (10,942 | ) | | | (65,822 | ) |
| | | | | | | | | | | | | | | | | | |
Total operating expenses | | | | | (592,027 | ) | | | (556,744 | ) | | | (409,876 | ) | | | (593,441 | ) |
| | | | | | | | | | | | | | | | | | |
Operating income | | | | | 851,740 | | | | 1,750,089 | | | | 955,543 | | | | 1,588,089 | |
| | | | | | | | | | | | | | | | | | |
Financial income (expenses) | | | | | | | | | | | | | | | | | | |
Financial income | | 36 | | | 464,002 | | | | 336,250 | | | | 250,284 | | | | 611,593 | |
Financial expenses | | 36 | | | (507,451 | ) | | | (912,338 | ) | | | (740,204 | ) | | | (515,711 | ) |
Foreign exchange variation, net | | 36 | | | 61,852 | | | | (18,650 | ) | | | (25,560 | ) | | | (17,760 | ) |
| | | | | | | | | | | | | | | | | | |
Income before taxes | | | | | 870,143 | | | | 1,155,351 | | | | 440,063 | | | | 1,666,211 | |
| | | | | | | | | | | | | | | | | | |
Current income and social contribution taxes | | 33 | | | (322,811 | ) | | | (450,304 | ) | | | (407,055 | ) | | | (496,337 | ) |
Deferred income and social contribution taxes | | 14 and 33 | | | (44,021 | ) | | | 91,484 | | | | 276,646 | | | | 32,856 | |
Tax incentives | | 33 | | | 55,246 | | | | 76,111 | | | | 78,518 | | | | 50,911 | |
| | | | | | | | | | | | | | | | | | |
Net income for the year / period | | | | | 558,557 | | | | 872,642 | | | | 388,172 | | | | 1,253,641 | |
| | | | | | | | | | | | | | | | | | |
Attributable to controlling shareholder | | | | | 445,664 | | | | 664,705 | | | | 377,416 | | | | 910,247 | |
| | | | | |
Attributed to other entities in the Enersis S.A. Group | | | | | 31.321 | | | | 102,773 | | | | (12.991 | ) | | | 275,232 | |
Other non-controlling shareholders | | | | | 81.572 | | | | 105,164 | | | | 23.747 | | | | 68,162 | |
See accompanying notes.
G-4
Enel Brasil S.A.
Consolidated statements of other comprehensive income
For the nine month periods ended September 30, 2015 and 2014 and for the years ended December 31, 2014 and 2013
(In thousands of reais)
| | | | | | | | | | | | | | | | |
| | | 09/30/2015 | | | 12/31/2014 | | | 09/30/2014 | | | 12/31/2013 | |
| | | | | | | | | (Unaudited) | | | | |
Net income for the year / period | | | 558,557 | | | | 872,642 | | | | 388,172 | | | | 1,253,641 | |
| | | | |
Other comprehensive income (loss) | | | | | | | | | | | | | | | | |
Other comprehensive income (loss) to be reclassified to income statements in subsequent periods | | | | | | | | | | | | | | | | |
Gain (loss) on derivative financial instruments | | | (5,332 | ) | | | (2,959 | ) | | | (2,527 | ) | | | 23,635 | |
Deferred tax on (gain) loss on derivative financial instruments | | | 1,813 | | | | 1,006 | | | | 860 | | | | (8,085 | ) |
Cumulative translation adjustment | | | (46,020 | ) | | | 2,089 | | | | 15,847 | | | | 1,824 | |
| | | | |
Net other comprehensive income (loss) to be reclassified to income statements in subsequent periods | | | (49,539 | ) | | | 136 | | | | 14,180 | | | | 17,374 | |
| | | | |
Other comprehensive income (loss) not to be reclassified to income statements in subsequent periods | | | | | | | | | | | | | | | | |
Remeasurement gain (loss) in subsidiary’s pension fund | | | (35,754 | ) | | | (63,747 | ) | | | — | | | | 75,734 | |
Deferred tax on remeasurement (gain) loss in pension fund | | | 12,156 | | | | 21,674 | | | | — | | | | (25,750 | ) |
Net other comprehensive income (loss) not to be reclassified to income statements in subsequent periods | | | (23,598 | ) | | | (42,073 | ) | | | — | | | | 49,984 | |
| | | | |
Other comprehensive income (loss), net of tax | | | (73,137 | ) | | | (41,937 | ) | | | 14,180 | | | | 67,358 | |
| | | | | | | | | | | | | | | | |
Comprehensive income for the year / period, net of tax | | | 485,420 | | | | 830,705 | | | | 402,352 | | | | 1,320,999 | |
| | | | | | | | | | | | | | | | |
Attributable to controlling shareholder | | | 386,663 | | | | 645,499 | | | | 392,531 | | | | 941,863 | |
Attributable to other entities in the Enersis S.A. Group | | | 16,892 | | | | 120,433 | | | | (13,787 | ) | | | 314,471 | |
Attributable to other non-controlling shareholders | | | 81,863 | | | | 64,773 | | | | 23,608 | | | | 64,665 | |
See accompanying notes.
G-5
Enel Brasil S.A.
Consolidated statements of changes in equity
For the nine month period ended September 30, 2015 and for the years ended December 31, 2014 and 2013
(In thousands of reais)
| | | | | | | | | | | | | | | | | | | | | | | | | | | | | | | | | | | | | | | | | | | | | | | | | | | | | | | | |
| | | | | | | | | Capital
Reserve | | | Income reserves | | | | | | | | | | | | | | | | | | | | | | | | | |
| | | Capital | | | Treasury
shares | | | Remuneration
of goodwill in
the issue
of shares | | | Legal
reserve | | | Other
reserves | | | Statutory
reserve
for
working
capital | | | Other
comprehensive
income | | | Equity
valuation
adjustment | | | Retained
earnings | | | Additional
dividend
distribution
proposal | | | Shareholders
Enel
Brasil | | | Other
shareholders
Enersis S.A.
Group | | | Non-
controlling
shareholders | | | Total | |
Balances at January 1st, 2013 | | | 916,879 | | | | (111,025 | ) | | | 2,504,370 | | | | 133,839 | | | | (1,124 | ) | | | 647,711 | | | | (1,684 | ) | | | 243,074 | | | | — | | | | 741,665 | | | | 5,073,705 | | | | 1,041,964 | | | | 829,577 | | | | 6,945,246 | |
| | | | | | | | | | | | | | | | | | | | | | | | | | | | | | | | | | | | | | | | | | | | | | | | | | | | | | | | |
Capital increase (merger) | | | 139,170 | | | | — | | | | — | | | | — | | | | — | | | | — | | | | — | | | | — | | | | — | | | | — | | | | 139,170 | | | | (139,170 | ) | | | — | | | | — | |
Capital reduction of subsidiary | | | — | | | | — | | | | — | | | | — | | | | — | | | | — | | | | — | | | | — | | | | — | | | | — | | | | — | | | | (315 | ) | | | (563 | ) | | | (878 | ) |
Depreciation of PP&E (deemed cost) | | | — | | | | — | | | | — | | | | — | | | | — | | | | — | | | | — | | | | (37,676 | ) | | | 37,676 | | | | — | | | | — | | | | — | | | | — | | | | — | |
Approval of proposed dividends | | | — | | | | — | | | | — | | | | — | | | | — | | | | — | | | | — | | | | — | | | | — | | | | (741,665 | ) | | | (741,665 | ) | | | (216 | ) | | | (48,648 | ) | | | (790,529 | ) |
Net income for the year | | | — | | | | — | | | | — | | | | — | | | | — | | | | — | | | | — | | | | — | | | | 910,247 | | | | — | | | | 910,247 | | | | 275,232 | | | | 68,162 | | | | 1,253,641 | |
Actuarial gain (loss) on subsidiary’s pension fund | | | — | | | | — | | | | — | | | | — | | | | — | | | | — | | | | 21,762 | | | | — | | | | — | | | | — | | | | 21,762 | | | | 33,745 | | | | (5,523 | ) | | | 49,984 | |
Transfer to retained earnings | | | — | | | | — | | | | — | | | | — | | | | — | | | | — | | | | (21,762 | ) | | | — | | | | 21,762 | | | | — | | | | — | | | | — | | | | — | | | | — | |
Gain on derivative financial instrument | | | — | | | | — | | | | — | | | | — | | | | — | | | | — | | | | 8,030 | | | | — | | | | — | | | | — | | | | 8,030 | | | | 5,494 | | | | 2,026 | | | | 15,550 | |
Effect of merger | | | — | | | | — | | | | — | | | | — | | | | (2,892 | ) | | | — | | | | — | | | | — | | | | — | | | | — | | | | (2,892 | ) | | | — | | | | — | | | | (2,892 | ) |
Transfer of participations | | | — | | | | — | | | | — | | | | — | | | | — | | | | — | | | | — | | | | — | | | | — | | | | — | | | | — | | | | 158,068 | | | | (158,068 | ) | | | — | |
Management’s proposal for net income allocation | | | | | | | | | | | | | | | | | | | | | | | | | | | | | | | | | | | | | | | | | | | | | | | | | | | | | | | | |
Interim dividends | | | — | | | | — | | | | — | | | | — | | | | — | | | | — | | | | — | | | | — | | | | — | | | | — | | | | — | | | | (336 | ) | | | (600 | ) | | | (936 | ) |
Mandatory dividends | | | — | | | | — | | | | — | | | | — | | | | — | | | | — | | | | — | | | | — | | | | (236,981 | ) | | | | | | | (236,981 | ) | | | (85,026 | ) | | | (11,043 | ) | | | (333,050 | ) |
Additional proposed | | | | | | | | | | | | | | | | | | | | | | | | | | | | | | | | | | | (616,152 | ) | | | 616,152 | | | | — | | | | — | | | | — | | | | — | |
Statutory reserve for working capital | | | — | | | | — | | | | — | | | | — | | | | — | | | | 116,552 | | | | — | | | | — | | | | (116,552 | ) | | | — | | | | — | | | | — | | | | — | | | | — | |
Cumulative translation adjustment | | | — | | | | — | | | | — | | | | — | | | | — | | | | — | | | | 1,824 | | | | — | | | | — | | | | — | | | | 1,824 | | | | — | | | | — | | | | 1,824 | |
| | | | | | | | | | | | | | | | | | | | | | | | | | | | | | | | | | | | | | | | | | | | | | | | | | | | | | | | |
Balances at December 31, 2013 | | | 1,056,049 | | | | (111,025 | ) | | | 2,504,370 | | | | 133,839 | | | | (4,016 | ) | | | 764,263 | | | | 8,170 | | | | 205,398 | | | | — | | | | 616,152 | | | | 5,173,200 | | | | 1,289,440 | | | | 675,320 | | | | 7,137,960 | |
| | | | | | | | | | | | | | | | | | | | | | | | | | | | | | | | | | | | | | | | | | | | | | | | | | | | | | | | |
Depreciation of PP&E (deemed Cost) | | | — | | | | — | | | | — | | | | — | | | | — | | | | — | | | | — | | | | (37,676 | ) | | | 37,676 | | | | — | | | | — | | | | — | | | | — | | | | — | |
Effect accounted for by subsidiary – unclaimed dividends | | | — | | | | — | | | | — | | | | — | | | | — | | | | — | | | | — | | | | — | | | | 654 | | | | — | | | | 654 | | | | 371 | | | | 153 | | | | 1,178 | |
Approval of proposed dividends | | | — | | | | — | | | | — | | | | — | | | | — | | | | — | | | | — | | | | — | | | | — | | | | (616,152 | ) | | | (616,152 | ) | | | (8,208 | ) | | | (14,045 | ) | | | (638,405 | ) |
Net income for the year | | | — | | | | — | | | | — | | | | — | | | | — | | | | — | | | | — | | | | — | | | | 664,705 | | | | — | | | | 664,705 | | | | 140,960 | | | | 66,977 | | | | 872,642 | |
Actuarial gain (loss) on subsidiary’s pension fund | | | — | | | | — | | | | — | | | | — | | | | �� | | | | — | | | | (20,597 | ) | | | — | | | | — | | | | — | | | | (20,597 | ) | | | (19,470 | ) | | | (2,006 | ) | | | (42,073 | ) |
Transfer to retained earnings | | | — | | | | — | | | | — | | | | — | | | | — | | | | — | | | | 20,597 | | | | — | | | | (20,597 | ) | | | — | | | | — | | | | — | | | | — | | | | — | |
Gain on derivative financial instrument | | | — | | | | — | | | | — | | | | — | | | | — | | | | — | | | | (698 | ) | | | — | | | | — | | | | — | | | | (698 | ) | | | (1,057 | ) | | | (198 | ) | | | (1,953 | ) |
G-6
| | | | | | | | | | | | | | | | | | | | | | | | | | | | | | | | | | | | | | | | | | | | | | | | | | | | | | | | |
| | | | | | | | | Capital
Reserve | | | Income reserves | | | | | | | | | | | | | | | | | | | | | | | | | |
| | | Capital | | | Treasury
shares | | | Remuneration
of goodwill in
the issue
of shares | | | Legal
reserve | | | Other
reserves | | | Statutory
reserve
for
working
capital | | | Other
comprehensive
income | | | Equity
valuation
adjustment | | | Retained
earnings | | | Additional
dividend
distribution
proposal | | | Shareholders
Enel
Brasil | | | Other
shareholders
Enersis S.A.
Group | | | Non-
controlling
shareholders | | | Total | |
Transfer of participations | | | — | | | | — | | | | — | | | | — | | | | — | | | | — | | | | — | | | | — | | | | — | | | | — | | | | — | | | | 258,385 | | | | (258,385 | ) | | | — | |
Management’s proposal for net income allocation | | | | | | | | | | | | | | | | | | | | | | | | | | | | | | | | | | | | | | | | | | | | | | | | | | | | | | | | |
Interim dividends | | | — | | | | — | | | | — | | | | — | | | | — | | | | — | | | | — | | | | — | | | | — | | | | — | | | | — | | | | (331 | ) | | | (593 | ) | | | (924 | ) |
Mandatory dividends | | | — | | | | — | | | | — | | | | — | | | | — | | | | — | | | | — | | | | — | | | | (175,759 | ) | | | — | | | | (175,759 | ) | | | (30,826 | ) | | | (11,017 | ) | | | (217,602 | ) |
Statutory reserve for working capital | | | — | | | | — | | | | — | | | | — | | | | — | | | | 506,679 | | | | — | | | | — | | | | (506,679 | ) | | | — | | | | — | | | | — | | | | — | | | | — | |
Cumulative translation adjustment | | | — | | | | — | | | | — | | | | — | | | | — | | | | — | | | | 2,089 | | | | — | | | | — | | | | — | | | | 2,089 | | | | — | | | | — | | | | 2,089 | |
| | | | | | | | | | | | | | | | | | | | | | | | | | | | | | | | | | | | | | | | | | | | | | | | | | | | | | | | |
Balances at December 31, 2014 | | | 1,056,049 | | | | (111,025 | ) | | | 2,504,370 | | | | 133,839 | | | | (4,016 | ) | | | 1,270,942 | | | | 9,561 | | | | 167,722 | | | | — | | | | — | | | | 5,027,442 | | | | 1,629,264 | | | | 456,206 | | | | 7,112,912 | |
| | | | | | | | | | | | | | | | | | | | | | | | | | | | | | | | | | | | | | | | | | | | | | | | | | | | | | | | |
Capital increase | | | 264,000 | | | | — | | | | — | | | | — | | | | — | | | | (264,000 | ) | | | — | | | | — | | | | — | | | | — | | | | — | | | | — | | | | — | | | | — | |
Approval of proposed dividends | | | — | | | | — | | | | — | | | | — | | | | — | | | | — | | | | — | | | | — | | | | — | | | | — | | | | — | | | | (79 | ) | | | (140 | ) | | | (219 | ) |
Effect accounted for by subsidiary – unclaimed dividends | | | — | | | | — | | | | — | | | | — | | | | — | | | | — | | | | — | | | | — | | | | 83 | | | | — | | | | 83 | | | | — | | | | — | | | | 83 | |
Net income for the period | | | — | | | | — | | | | — | | | | — | | | | — | | | | — | | | | — | | | | — | | | | 445,664 | | | | — | | | | 445,664 | | | | 31,321 | | | | 81,572 | | | | 558,557 | |
Actuarial gain (loss) on subsidiary’s pension fund | | | — | | | | — | | | | — | | | | — | | | | — | | | | — | | | | (10,703 | ) | | | — | | | | — | | | | — | | | | (10,703 | ) | | | (13,584 | ) | | | 688 | | | | (23,599 | ) |
Transfer to retained earnings | | | — | | | | — | | | | — | | | | — | | | | — | | | | — | | | | — | | | | — | | | | — | | | | — | | | | — | | | | — | | | | — | | | | — | |
Loss on derivative financial instrument | | | — | | | | — | | | | — | | | | — | | | | — | | | | — | | | | (2,278 | ) | | | — | | | | — | | | | — | | | | (2,278 | ) | | | (845 | ) | | | (397 | ) | | | (3,520 | ) |
Management’s proposal for net income allocation | | | | | | | | | | | | | | | | | | | | | | | | | | | | | | | | | | | | | | | | | | | | | | | | | | | | | | | | |
Interim dividends | | | — | | | | — | | | | — | | | | — | | | | — | | | | — | | | | — | | | | — | | | | — | | | | — | | | | — | | | | (168 | ) | | | (300 | ) | | | (468 | ) |
Statutory reserve for working capital | | | — | | | | — | | | | — | | | | — | | | | — | | | | — | | | | — | | | | — | | | | — | | | | — | | | | — | | | | — | | | | — | | | | — | |
Cumulative translation adjustment | | | — | | | | — | | | | — | | | | — | | | | — | | | | — | | | | (46,020 | ) | | | — | | | | — | | | | — | | | | (46,020 | ) | | | — | | | | — | | | | (46,020 | ) |
| | | | | | | | | | | | | | | | | | | | | | | | | | | | | | | | | | | | | | | | | | | | | | | | | | | | | | | | |
Balances at September 30, 2015 | | | 1,320,049 | | | | (111,025 | ) | | | 2,504,370 | | | | 133,839 | | | | (4,016 | ) | | | 1,006,942 | | | | (49,440 | ) | | | 167,722 | | | | 445,747 | | | | — | | | | 5,414,188 | | | | 1,645,909 | | | | 537,629 | | | | 7,597,726 | |
| | | | | | | | | | | | | | | | | | | | | | | | | | | | | | | | | | | | | | | | | | | | | | | | | | | | | | | | |
See accompanying notes.
G-7
Enel Brasil S.A.
Consolidated statements of changes in equity
For the nine month period ended September 30, 2014 (unaudited)
(In thousands of reais)
| | | | | | | | | | | | | | | | | | | | | | | | | | | | | | | | | | | | | | | | | | | | | | | | | | | | | | | | |
| | | | | | | | | Capital
Reserve | | | Income reserves | | | | | | | | | | | | | | | | | | | | | | | | | |
| | | Capital | | | Treasury
shares | | | Remuneration
of goodwill in
the issue of
shares | | | Legal
reserve | | | Other
reserves | | | Statutory
reserve for
working
capital | | | Other
comprehensive
income | | | Equity
valuation
adjustment | | | Retained
earnings | | | Additional
dividend
distribution
proposal | | | Shareholders
Enel Brasil | | | Other
shareholders
Enersis S.A.
Group | | | Non-
controlling
shareholders | | | Total | |
Balances at December 31, 2013 | | | 1,056,049 | | | | (111,025 | ) | | | 2,504,370 | | | | 133,839 | | | | (4,016 | ) | | | 764,263 | | | | 8,170 | | | | 205,398 | | | | — | | | | 616,152 | | | | 5,173,200 | | | | 1,289,440 | | | | 675,320 | | | | 7,137,960 | |
| | | | | | | | | | | | | | | | | | | | | | | | | | | | | | | | | | | | | | | | | | | | | | | | | | | | | | | | |
Approval of proposed dividends | | | — | | | | — | | | | — | | | | — | | | | — | | | | — | | | | — | | | | — | | | | — | | | | (616,152 | ) | | | (616,152 | ) | | | (8,232 | ) | | | (14,021 | ) | | | (638,405 | ) |
Net income for the period | | | — | | | | — | | | | — | | | | — | | | | — | | | | — | | | | — | | | | — | | | | 377,416 | | | | — | | | | 377,416 | | | | (12,991 | ) | | | 23,747 | | | | 388,172 | |
Loss on derivative financial instrument | | | — | | | | — | | | | — | | | | — | | | | — | | | | — | | | | (732 | ) | | | — | | | | — | | | | — | | | | (732 | ) | | | (796 | ) | | | (139 | ) | | | (1,667 | ) |
Transfer of participations | | | — | | | | — | | | | — | | | | — | | | | — | | | | — | | | | — | | | | — | | | | — | | | | — | | | | — | | | | 258,385 | | | | (258,385 | ) | | | — | |
Cumulative translation adjustment | | | — | | | | — | | | | — | | | | — | | | | — | | | | — | | | | 15,847 | | | | — | | | | — | | | | — | | | | 15,847 | | | | — | | | | — | | | | 15,847 | |
| | | | | | | | | | | | | | | | | | | | | | | | | | | | | | | | | | | | | | | | | | | | | | | | | | | | | | | | |
Balances at September 30, 2014 (unaudited) | | | 1,056,049 | | | | (111,025 | ) | | | 2,504,370 | | | | 133,839 | | | | (4,016 | ) | | | 764,263 | | | | 23,285 | | | | 205,398 | | | | 377,416 | | | | — | | | | 4,949,579 | | | | 1,525,806 | | | | 426,522 | | | | 6,901,907 | |
| | | | | | | | | | | | | | | | | | | | | | | | | | | | | | | | | | | | | | | | | | | | | | | | | | | | | | | | |
See accompanying notes.
G-8
Enel Brasil S.A.
Consolidated statements of cash flows
For the nine month period ended September 30, 2015 and 2014 and for the years ended December 31, 2014 and 2013
(In thousands of reais)
| | | | | | | | | | | | | | | | |
| | | 09/30/2015 | | | 12/31/2014 | | | 09/30/2014 | | | 12/31/2013 | |
| | | | | | | | | (Unaudited) | | | | |
| Operating activities | | | | | | | | | | | | |
Income before taxes for the year / period | | | 870,143 | | | | 1,155,351 | | | | 440,063 | | | | 1,666,211 | |
Adjustments to reconcile income before tax to cash from operating activities | | | | | | | | | | | | | | | | |
Allowance for doubtful accounts | | | 124,167 | | | | 60,262 | | | | 52,303 | | | | 98,419 | |
Depreciation and amortization | | | 398,395 | | | | 544,974 | | | | 388,987 | | | | 517,941 | |
Deferred tax from merger | | | 17,452 | | | | 22,622 | | | | 16,967 | | | | 24,720 | |
Impairment | | | — | | | | | | | | | | | | 10,919 | |
Provisions for tax, civil and labor risks, net | | | 165,662 | | | | 164,799 | | | | 119,163 | | | | 140,582 | |
Tax credit from merger | | | 6,035 | | | | 8,794 | | | | 6,595 | | | | 9,609 | |
Monetary restatements and interest | | | 318,366 | | | | 290,548 | | | | 213,226 | | | | 243,687 | |
Indemnification assets revenues | | | (145,580 | ) | | | 306,060 | | | | 318,798 | | | | (205,165 | ) |
Net book value of written off intangible assets and property, plant and equipment | | | 18,597 | | | | 56,318 | | | | 40,143 | | | | 119,704 | |
Research, development and energy efficiency programs | | | 65,619 | | | | 86,061 | | | | 66,270 | | | | 75,890 | |
Post-employment benefit obligations | | | 39,481 | | | | 55,109 | | | | 41,331 | | | | 50,214 | |
Provision for inventory losses | | | — | | | | (329 | ) | | | (4,346 | ) | | | 7,750 | |
Financial instruments through profit and loss | | | (4,707 | ) | | | (6,672 | ) | | | 2,446 | | | | (6,704 | ) |
Financial asset from Portion A and other | | | (1,396,551 | ) | | | (722,198 | ) | | | — | | | | — | |
Other revenues | | | — | | | | (2,363 | ) | | | (2,419 | ) | | | — | |
| | | | | | | | | | | | | | | | |
| | | 477,079 | | | | 2,019,336 | | | | 1,699,527 | | | | 2,753,777 | |
(Increase) decrease in operating assets | | | | | | | | | | | | | | | | |
Consumers, concessionaires and permittees | | | (731,687 | ) | | | (177,682 | ) | | | (126,326 | ) | | | 88,212 | |
Account receivables from Portion A and other financial items | | | 1,205,965 | | | | — | | | | — | | | | — | |
CDE Subventions – Tariff discount | | | (158,391 | ) | | | (161,261 | ) | | | (113,972 | ) | | | (20,385 | ) |
CDE Subventions resources | | | — | | | | 13,429 | | | | (113,255 | ) | | | (13,429 | ) |
Resources CCRBT, net | | | (27,507 | ) | | | — | | | | — | | | | — | |
Guarantees and judicial deposits | | | (12,928 | ) | | | 34,621 | | | | (3,250 | ) | | | (1,840 | ) |
Escrow deposits | | | (18,863 | ) | | | 78,083 | | | | 4,915 | | | | (290 | ) |
Other receivables | | | (26,174 | ) | | | (151,547 | ) | | | (49,207 | ) | | | (84,311 | ) |
Increase (decrease) in operating liabilities | | | | | | | | | | | | | | | | |
Trade accounts payable | | | 367,486 | | | | 390,912 | | | | 27,256 | | | | 74,429 | |
Payroll | | | 4,846 | | | | 14,319 | | | | 12,628 | | | | 17,896 | |
Regulatory charges | | | 161,066 | | | | (2,637 | ) | | | (10,151 | ) | | | (55,199 | ) |
Research, development and energy efficiency programs | | | (83,529 | ) | | | (73,720 | ) | | | (63,864 | ) | | | (38,867 | ) |
Post-employment benefit obligations | | | (55,440 | ) | | | (60,586 | ) | | | (43,583 | ) | | | (42,380 | ) |
Provisions of tax, civil and labor claims | | | (119,186 | ) | | | (136,510 | ) | | | (97,558 | ) | | | (93,446 | ) |
Other liabilities | | | 51,464 | | | | 56,007 | | | | 32,521 | | | | 30,362 | |
Taxes payable / recoverable, net | | | 107,617 | | | | 15,834 | | | | 70,654 | | | | (115,368 | ) |
Income taxes paid | | | (267,565 | ) | | | (365,399 | ) | | | (321,942 | ) | | | (435,817 | ) |
| | | | | | | | | | | | | | | | |
Net cash flows from operating activities | | | 874,253 | | | | 1,493,199 | | | | 904,393 | | | | 2,063,344 | |
| | | | | | | | | | | | | | | | |
Investing activities | | | | | | | | | | | | | | | | |
Marketable securities | | | 101,913 | | | | 505,365 | | | | 374,643 | | | | 120,528 | |
Result of merger | | | — | | | | — | | | | — | | | | (2,892 | ) |
Investments | | | — | | | | — | | | | — | | | | (2,324 | ) |
Investments in intangible assets and property, plant and equipment | | | (890,721 | ) | | | (909,636 | ) | | | (647,479 | ) | | | (843,125 | ) |
| | | | | | | | | | | | | | | | |
Net cash flows used in investing activities | | | (788,808 | ) | | | (404,271 | ) | | | (272,836 | ) | | | (968,869 | ) |
| | | | | | | | | | | | | | | | |
Financing activities | | | | | | | | | | | | | | | | |
Debentures funding | | | — | | | | 300,000 | | | | 300,000 | | | | — | |
Payment of debentures | | | (58,500 | ) | | | — | | | | — | | | | (296,251 | ) |
Loans and financing | | | 149,080 | | | | 594,603 | | | | 206,004 | | | | 717,557 | |
Payment of loans and financing | | | (222,527 | ) | | | (488,907 | ) | | | (233,531 | ) | | | (351,978 | ) |
Payment of interest on loans and financing | | | (114,040 | ) | | | (98,988 | ) | | | (78,341 | ) | | | (78,934 | ) |
Payment of interest on debentures | | | (100,107 | ) | | | (98,466 | ) | | | (55,173 | ) | | | (109,106 | ) |
Payment of debt agreement with Faelce | | | — | | | | (12,824 | ) | | | (13,241 | ) | | | (6,934 | ) |
Dividends payment | | | (425 | ) | | | (1,495,836 | ) | | | (524,731 | ) | | | (640,955 | ) |
Capital reduction | | | — | | | | — | | | | — | | | | (901 | ) |
Installment tax program payment | | | (2,815 | ) | | | (23,378 | ) | | | (23,300 | ) | | | (46,752 | ) |
| | | | | | | | | | | | | | | | |
Net cash flows used in financing activities | | | (349,334 | ) | | | (1,323,796 | ) | | | (422,313 | ) | | | (814,254 | ) |
| | | | | | | | | | | | | | | | |
Cumulative translation adjustment | | | (46,020 | ) | | | 2,089 | | | | 15,847 | | | | 1,824 | |
| | | | | | | | | | | | | | | | |
Increase (decrease) in net cash and cash equivalents | | | (309,909 | ) | | | (232,779 | ) | | | 225,091 | | | | 282,045 | |
| | | | | | | | | | | | | | | | |
Cash and cash equivalents at the beginning of year / period | | | 864,071 | | | | 1,096,850 | | | | 1,096,850 | | | | 814,805 | |
Cash and cash equivalents at the end of year / period | | | 554,162 | | | | 864,071 | | | | 1,321,941 | | | | 1,096,850 | |
| | | | | | | | | | | | | | | | |
Increase (decrease) in net cash and cash equivalents | | | (309,909 | ) | | | (232,779 | ) | | | 225,091 | | | | 282,045 | |
| | | | | | | | | | | | | | | | |
See accompanying notes.
G-9
Enel Brasil S.A.
Notes to the consolidated financial statements
September 30, 2015 and 2014, December 31, 2014 and 2013 and January 1st, 2013
(In thousands of reais, unless otherwise stated)
Operations
The business purpose of Enel Brasil S.A. (“Enel Brasil” or “Company”), with registered office located at Praça Leoni Ramos, No.01, Niterói, Rio de Janeiro, Brazil, is to hold interests in other entities that directly or indirectly operate or come to operate in any electric energy industry segment or as a provider of electric energy transmission, distribution, generation or trade services and related activities.
Enel Brasil S.A. is a subsidiary of Enersis S.A., a Chilean company controlled by Enel Iberoamérica S.R.L., a company controlled by Enel S.p.A. (“Enel”).
The Company holds interest in the following operational subsidiaries by segment, which together with the Company, form Enel Brasil Group (“Enel Group” or “Group”):
| | a) | Electric energy distribution |
Ampla Energia e Serviços S.A.
Ampla Energia e Serviços S.A. (“Ampla Energia”), is a publicly-held company, registered at BM&FBOVESPA S.A. – Bolsa de Valores, Mercadorias e Futuros, with registered office located at Praça Leoni Ramos, No.01, municipality of Niterói, State of Rio de Janeiro, electric energy utility concessionaire, designed to explore the distribution and marketing of electricity systems and participate in research related to the energy sector, such activities being regulated by the National Electric Energy Agency – ANEEL, which is under the Ministry of Mines and Energy.
Ampla Energia’s concession area includes 66 cities, 65 of which are in the State of Rio de Janeiro and one in the State of Minas Gerais. The concession of public distribution of electricity was arranged by the Concession Contract No. 005/1996 of December 9, 1996 from ANEEL, with maturity in December 2026.
As a consequence of Public Hearing No. 061/2014, on December 10, 2014, the addenda to the concession contract of the subsidiary was approved, whereby in the event that the concession ceases to exist, in addition to compensation amounts stemming from investments not amortized or depreciated in the course of the concession, the remaining balances of Portion A and other financial items that have not been recovered or returned through the tariff cycle(s) will also be subject to compensation or return by the Granting Power (see Note 13).
Enel Brasil holds direct interest of 46.89% of Ampla Energia’s capital.
Companhia Energética do Ceará – COELCE
Companhia Energética do Ceará – COELCE (“COELCE”), is a publicly-held company, registered at BM&FBOVESPA S.A. – Bolsa de Valores, Mercadorias e Futuros, at Rua Padre Valdevino, No.150, Fortaleza, Ceará, electric energy utility concessionaire, designed to research, study, plan and explore the distribution of electricity, such activities being regulated by the National Electric Energy Agency – ANEEL, which is under the Ministry of Mines and Energy.
COELCE’s concession area covers the whole State of Ceará. The concession of public distribution of electricity was arranged by the Concession Contract No. 001/1998 of May 13, 1998 from ANEEL, with maturity in May 2028.
As a consequence of Public Hearing No. 061/2014, on December 10, 2014, the addenda to the concession contract of the subsidiary was approved, whereby in the event that the concession ceases to
G-10
Enel Brasil S.A.
Notes to the consolidated financial statements (Continued)
September 30, 2015 and 2014, December 31, 2014 and 2013 and January 1st, 2013
(In thousands of reais, unless otherwise stated)
| 1. | Corporate information (Continued) |
Operations (Continued)
| | a) | Electric energy distribution (Continued) |
Companhia Energética do Ceará – COELCE (Continued)
exist, in addition to compensation amounts stemming from investments not amortized or depreciated in the course of the concession, the remaining balances of Portion A and other financial items that have not been recovered or returned through the tariff cycle(s) will also be subject to compensation or return by the Granting Power (see Note 13).
Enel Brasil holds direct interest of 58.87% of COELCE’s capital.
| | b) | Electric energy generation |
Centrais Elétricas Cachoeira Dourada S.A. – CDSA
Centrais Elétricas Cachoeira Dourada S.A. – CDSA (“CDSA”), is a privately-held company with registered office located at Rodovia GO 206, KM0, Cachoeira Dourada, Goiás, primarily engaged in conducting studies and projections, and in building, installing and operating electric generation power plants, as well as performing commercial acts deriving from such activities, which are regulated by the National Agency of Electric Energy – ANEEL under the Ministry of Mines and Energy – MME.
On September 5, 1997, a public auction was carried out for acquisition of representative shareholding in the CDSA capital by private entities. This transaction was recognized by the granting authorities by means of the Concession Agreement No. 011/97, of September 12, 1997, which establishes that the concession term is of 30 years, expiring in September 2027. The subsidiary’s fixed assets consist substantially of the power plant assets mentioned above, located in Rio Paranaíba, with installed capacity of 658 MW, subdivided into 10 generating units.
Enel Brasil holds direct interest of 99.61% of CDSA’s capital.
Central Geradora Termelétrica Fortaleza S.A. – CGTF
Central Geradora Termelétrica Fortaleza S.A. – CGTF (“CGTF”), is a privately-held company, with registered office located at Rodovia CE422, Km 01, Complexo Industrial e Portuária do Pecém, Caucaia, Ceará, organized on August 20, 2001 and authorized by the National Agency of Electric Energy -ANEEL to operate as an independent energy producer, by means of ANEEL Resolution No. 433, of October 19, 2001, formed by a combined cycle of two gas turbines and a vapor turbine, pursuant to ANEEL Decision No. 73/2002. Start-up of operations occurred on December 27, 2003.
As defined in the articles of incorporation, CGTF is engaged in the study, project, construction and exploration of energy production, transmission, distribution and sale systems that may be granted, permitted or authorized by any law, in addition to exercising other related activities and providing services of any nature referring to mentioned activities.
CGTF is part of the Federal Government’s Thermoelectric Priority Program (PPT) to expand the supply of electric energy throughout Brazil, and CGTF contracted on August 31, 2001 the sale of 2,690 GWh/year (equivalent to an average 307 MW) to the subsidiary COELCE, also belonging to Enel Group, over 20 years, as from the beginning of the energy supply in January 2004, at the price established by ANEEL, subject to annual adjustment based on a basket of indicators that includes IGPM, US dollar and contracted natural gas variations.
G-11
Enel Brasil S.A.
Notes to the consolidated financial statements (Continued)
September 30, 2015 and 2014, December 31, 2014 and 2013 and January 1st, 2013
(In thousands of reais, unless otherwise stated)
| 1. | Corporate information (Continued) |
Operations (Continued)
| | b) | Electric energy generation (Continued) |
Central Geradora Termelétrica Fortaleza S.A. – CGTF (Continued)
CGTF is a wholly-owned subsidiary of Enel Brasil.
Eólica Fazenda Nova – Geração e Comercialização de Energia Ltda.
Eólica Fazenda Nova – Geração e Comercialização de Energia Ltda. (“Fazenda Nova”) is a limited liability entity, headquartered at Rua Felipe Camarão, No. 507, sala 201, Cidade Alta – Natal/Rio grande do Norte, engaged in the generation, transmission, distribution and sale of electric energy and related activities.
On September 30, 2009, Enel Brasil completed the acquisition of a 99.95% equity stake in Eólica Fazenda Nova for R$ 3,942. This investee is in a pre-operational stage and was incorporated to take part in wind power auctions.
| | c) | Electric energy transmission |
CIEN – Companhia de Interconexão Energética
CIEN – Companhia de Interconexão Energética (“CIEN”), is a privately-held company with registered office located at Praça Leoni Ramos, No. 01, Niterói, Rio de Janeiro, primarily engaged in production, processing, distribution and sale of electricity, including related import and export activities, implementing the services required to achieve this business purpose. In this regard, CIEN will work on the study, planning and construction of facilities related to electricity production, transmission, conversion and distribution systems. CIEN may foster the implementation of associated projects, carry out activities related, incidental or supplementary to such services and work it may provide, and may also hold interest in other companies.
On April 4, 2011, by means of Administrative Rulings Nos. 210 and 211, Garabi I and Garabi II lines, respectively, started being treated as equivalent to transmission concessions. Such equivalence treatment subjects both transmission lines of the subsidiary to the methodology whereby revenue is recognized through annual ratification of the Allowed Annual Revenue – (“RAP”) by ANEEL.
The commercial and technical equivalence of that subsidiary to an electric power transmission concession, comprising the two lines, has a finite 9-year term to Garabi I, effective through June 20, 2020, and an 11-year term for Garabi II, effective through July 31, 2022.
By means of Approval Resolution No. 1756, of June 24, 2014, ANEEL approved RAP amounting to R$ 315,270, for the period from July 1, 2014 to June 30, 2015, and adjustment portion relating to transfers in excess amounting to R$ 3,488. RAP is adjusted annually, always in June of each year. Every four years, the subsidiary will be subject to a review of tax bases and RAP approval.
On June 10, 2015, through the Technical Note 139/2015, ANEEL held the company’s periodic review and approved RAP of R$ 291,723, for the period between July 1, 2015 and June 30, 2016.
Enel Brasil holds direct interest of 100.00% in CIEN.
G-12
Enel Brasil S.A.
Notes to the consolidated financial statements (Continued)
September 30, 2015 and 2014, December 31, 2014 and 2013 and January 1st, 2013
(In thousands of reais, unless otherwise stated)
| 1. | Corporate information (Continued) |
Operations (Continued)
En-Brasil Comércio e Serviços S.A.
En-Brasil Comércio e Serviços S.A. (“Prátil”) is a privately-held company, headquartered at Praça Leoni Ramos, No.01, municipality of Niterói, State of Rio de Janeiro, established on August 18, 2009, for the purpose of holding interest in the capital of other companies and/or entities, associations, consortiums and other forms of associations in Brazil and abroad, in addition to rendering of general services, directly or indirectly related to its activities, to the electric energy industry and other economy and general consumption sectors.
Enel Brasil owns a 99.99% direct interest in Prátil.
| 2. | Summary of significant accounting policies |
| | 2.1. | Statement of compliance |
The consolidated financial statements were prepared considering different assessment bases used in accounting estimates. The accounting estimates involved in the preparation of the financial statements were based on objective and subjective factors, considering management’s judgment to determine the appropriate amounts to be recorded in the financial statements. Significant items subject to such estimates and assumptions include the valuation of financial assets at fair value and present value, analysis of credit risks to determine the allowance for doubtful accounts, as well as analysis of other risks to determine other provisions, including the provision for contingencies.
Settlement of transactions involving these estimates may result in amounts significantly different from those recorded in the financial statements due to the probabilistic treatment inherent in the estimation process. The Group reviews its estimates and assumptions at least annually.
The consolidated financial statements of the Group have been prepared in accordance with International Financial Reporting Standards (IFRS) as issued by the International Accounting Standards Board (IASB). The accompanying interim financial statements of the Group as of September 30, 2015 and for the nine-month periods ended September 30, 2015 and 2014 have been prepared in accordance with Internal Accounting Standards 34, Interim Financial Reporting, using the same accounting policies applied in preparing the annual financial statements, except as explained below. The Group’s operations are not significantly exposed to seasonality.
The authorization for completion of preparation of these financial statements was on November 27, 2015.
G-13
Enel Brasil S.A.
Notes to the consolidated financial statements (Continued)
September 30, 2015 and 2014, December 31, 2014 and 2013 and January 1st, 2013
(In thousands of reais, unless otherwise stated)
| 2. | Summary of significant accounting policies (Continued) |
| | 2.2. | Basis of consolidation |
The consolidated financial statements comprise the financial statements of the Group and its subsidiaries at September 30, 2015 and include Enel Brasil’s operations, and those of its direct and indirect subsidiaries, with ownership interest at the balance sheet date being summarized as follows:
| | | | | | | | | | | | |
Subsidiary | | Shareholding
interest (%) | | | Direct | | | Indirect | |
Central Geradora Termelétrica Fortaleza S.A. – CGTF | | | 100.00 | | | | 100.00 | | | | — | |
Centrais Elétricas Cachoeira Dourada S.A. – CDSA | | | 99.61 | | | | 99.61 | | | | — | |
Ampla Energia e Serviços S.A. (i) | | | 46.89 | | | | 46.89 | | | | — | |
CIEN – Companhia de Interconexão Energética | | | 100.00 | | | | 100.00 | | | | — | |
Compañia de Transmisión del Mercosur S.A. – CTM (“CTM”) (ii) | | | 99.99 | | | | — | | | | 99.99 | |
Transportadora de Energia S.A. – Tesa (“TESA”) (ii) | | | 100.00 | | | | — | | | | 100.00 | |
Companhia Energética do Ceará – COELCE | | | 58.87 | | | | 58.87 | | | | — | |
EN-Brasil Comércio e Serviço S.A. – Prátil | | | 99.99 | | | | 99.99 | | | | — | |
Eólica Fazenda Nova Geração e Comercialização de Energia Ltda. | | | 99.95 | | | | 99.95 | | | | — | |
Santander FI Cordoba Renda Fixa Crédito Privado | | | 100.00 | | | | 59.00 | | | | 41.00 | |
Pienza Renda Fixa CP FI (iii) | | | 100,00 | | | | 29.00 | | | | 71.00 | |
Bradesco FI RF Crédito Privado Firenze | | | 100.00 | | | | — | | | | 100.00 | |
| | (i) | Even though the interest on Ampla Energia is below 50.1%, Enel Brasil has the control of this entity, considering it has the power through contract to govern the financial and operating policies of them so as to obtain benefits from their activities. |
| | (ii) | Indirect subsidiaries located abroad. |
| | (iii) | Exclusive investment fund Pienza are managed by Banco Itau S.A. |
The reporting period in the financial statements of consolidated subsidiaries is the same as that of the Company, and accounting policies have been consistently applied by the consolidated companies. The main consolidation procedures include:
| | (a) | Derecognizing the assets and liabilities balances among consolidated companies; |
| | (b) | Derecognizing the share held in the capital, reserves and retained earnings of consolidated companies; |
| | (c) | Derecognizing income and expense balances and unrealized income arising from intercompany transactions; and |
| | (d) | Segregation of non-controlling interests in the consolidated financial statements. |
The consolidated financial statements have been prepared on a historical cost basis, except for certain balances that have been measured at fair value when required by applicable regulations.
G-14
Enel Brasil S.A.
Notes to the consolidated financial statements (Continued)
September 30, 2015 and 2014, December 31, 2014 and 2013 and January 1st, 2013
(In thousands of reais, unless otherwise stated)
| 2. | Summary of significant accounting policies (Continued) |
| | 2.4. | Foreign currency translation |
The Group’s consolidated financial statements are presented in Brazilian Reais (R$), which is also the parent company’s functional currency. For each entity the Group determines the functional currency, and for those entities whose functional currency differs from the Brazilian Real, the financial statements were translated into Brazilian Real at the closing date.
In the preparation of the financial statements, foreign currency transactions, i.e., in any currency other than the functional currency, are recorded based on the exchange rate in force on the date of each transaction. At the end of each reporting period, the monetary items in foreign currency are retranslated at the rates in force at the end of the year. Gains and losses arising from the updates of these assets and liabilities noted between the exchange rate in force on the transaction date and the financial statements date are recognized as financial income or expense, in the income statements.
The financial statements of the indirect subsidiaries CTM and TESA were originally prepared in Argentinean pesos (ARS$ – functional currency). Assets and liabilities were translated into Brazilian Reais, at the exchange rate at September 30, 2015 – ARS1.00 – R$ 0,422, disclosed by the Central Bank of Brazil (December 31, 2014 – ARS1.00 – R$ 0,3172, December 31, 2013 – ARS1.00 – R$ 0,3592 and January 1st, 2013 – ARS1.00 – R$ 0,4156), whereas profit or loss accounts were translated at the average monthly rate.
Assets and liabilities of the foreign indirect subsidiaries are translated into Brazilian Reais at the exchange rate in force at the balance sheet date, and the corresponding income statements are translated at the average exchange rate for the month of the transaction date. Exchange rate differences arising from the referred to translation are recorded separately in equity. On disposal of a foreign operation, the component of other comprehensive income relating to that particular foreign operation is recognized in income statements.
Revenue is recognized to the extent that it is probable that the economic benefits will flow to the Enel Group and the revenue can be reliably measured, regardless of when the payment is being made. Revenue is measured at the fair value of the consideration received or receivable, taking into account contractually defined terms of payment and, excluding discounts, rebates and taxes or charges on sales.
| | 2.5.1. | Distribution revenue |
Electric energy distribution services are measured by reference to electric energy amounts delivered within a given period. This measurement takes place based on the electricity meter reading schedule defined by subsidiaries COELCE and Ampla Energia. Electric energy distribution services are billed considering this reading schedule, and service revenue is recorded as bills are issued. In order to adjust readings to the related accounting periods, the services rendered between the reading date and the end of each month are recorded on an estimated basis.
| | 2.5.2. | Transmission revenue |
Transmission revenue is recognized based on a specific document (Ratifying Resolution) issued annually by the National Electric Energy Agency (ANEEL) for a 1-year period from July 1 to June 30 each year. Monthly revenue is recognized by reference to amounts reported by the National System Operator (ONS) and refers to revenue from the transmission system availability.
G-15
Enel Brasil S.A.
Notes to the consolidated financial statements (Continued)
September 30, 2015 and 2014, December 31, 2014 and 2013 and January 1st, 2013
(In thousands of reais, unless otherwise stated)
| 2. | Summary of significant accounting policies (Continued) |
| | 2.5. | Revenue recognition (Continued) |
This corresponds to revenue from electric energy supplied to customers but not billed, and to revenue from the use of the distribution network but not yet billed. Unbilled revenue is estimated for the period between the last monthly reading and the last day of the month.
| | 2.5.4. | Construction revenue |
IFRIC 12 – Service Concession Arrangements (“IFRIC 12”) requires electric energy concessionaires to record and measure service revenue in accordance with IAS 11 – Construction Contracts (“IAS 11”) (construction or improvement services) and IAS 18 – Revenue (“IAS 18”) (operation – electric energy supply services), even if subject to one single concession arrangement.
The Enel Group accounts for revenue and costs relating to construction work or improvements to infrastructure facilities used for rendering electric energy distribution services. The construction margin adopted is defined as zero, considering that: (i) the core activity of the subsidiaries is the distribution of electric energy; (ii) all construction revenue refers to construction of infrastructure facilities in order to attain their business purpose, namely distribution of electric energy; and (iii) Enel Group outsources the construction of infrastructure facilities to unrelated parties. Each month, all additions to intangible assets in progress are transferred to the statement of income as construction costs, after deduction of amounts received in the form of special obligations.
Interest income is recognized on a time-proportion basis using the effective interest rate on the principal amount outstanding. The effective interest rate is the rate that exactly discounts the estimated future cash payment on receipts over the expected life of the financial instrument to the original net carrying amount of the financial asset.
| | 2.6. | Financial instruments – Initial recognition and subsequent measurement |
| | | Initial recognition and measurement |
Financial assets within the scope of IAS 39 – Financial Instruments: Recognition and Measurement – are classified as financial assets at fair value through profit or loss, loans and receivables, held-to-maturity investments, available-for-sale financial assets, or as derivatives designated as hedging instruments in an effective hedge, as appropriate. Enel Group determines the classification of its financial assets at initial recognition, as they become part of the instrument’s contractual provisions.
G-16
Enel Brasil S.A.
Notes to the consolidated financial statements (Continued)
September 30, 2015 and 2014, December 31, 2014 and 2013 and January 1st, 2013
(In thousands of reais, unless otherwise stated)
| 2. | Summary of significant accounting policies (Continued) |
| | 2.6. | Financial instruments – Initial recognition and subsequent measurement (Continued) |
| | 2.6.1. | Financial assets (Continued) |
| | | Initial recognition and measurement (Continued) |
Financial assets are recognized initially at fair value plus, in the case of investments not at fair value through profit or loss, transaction costs directly attributable to the acquisition of that financial asset.
Enel Group’s financial assets include cash and cash equivalents, marketable securities, accounts receivable from customers, financial asset from Portion A and other, public utility concession (indemnification assets), collaterals, and derivative financial instruments.
The subsequent measurement of financial assets depends on their classification as described below:
| | | Financial assets at fair value through profit or loss |
Financial assets at fair value through profit or loss include financial assets held for trading and financial assets designated in the initial recognition at fair value through profit or loss. Financial assets are classified as held for trading if they are acquired for the purpose of selling in the near term. This category includes derivative financial instruments entered into by Enel Group that do not qualify for hedge accounting, as set forth by IAS 39. Financial assets at fair value through profit or loss are carried in the statement of financial position at fair value with the related gains or losses recognized in the income statement.
| | | Held-to-maturity investments |
Non-derivative financial assets with fixed or determinable payments and fixed maturities are classified as held-to-maturity when the Enel Group has the positive intention and ability to hold them to maturity. After initial measurement, held-to-maturity investments are measured at amortized cost using the effective interest method, less impairment. Amortized cost is calculated by taking into account any discount or premium on acquisition and fees or costs that are an integral part of the effective interest rate. The amortization of the effective interest rate is included in the income statement as financial income.
Loans and receivables are non-derivative financial assets with fixed or determinable payments that are not quoted in an active market. After initial measurement, such financial assets are subsequently measured at amortized cost using the effective interest rate method, less impairment. Amortized cost is calculated by taking into account any discount or premium on acquisition and incurred fees or costs that are an integral part of the effective interest rate. The effective interest rate amortization is included in finance income in the income statement. The losses arising from impairment are recognized in the income statement as financial cost.
Interest income is recognized at the effective interest rate, except for short-term receivables when the recognition of interest is immaterial.
G-17
Enel Brasil S.A.
Notes to the consolidated financial statements (Continued)
September 30, 2015 and 2014, December 31, 2014 and 2013 and January 1st, 2013
(In thousands of reais, unless otherwise stated)
| 2. | Summary of significant accounting policies (Continued) |
| | 2.6. | Financial instruments – Initial recognition and subsequent measurement (Continued) |
| | 2.6.1. | Financial assets (Continued) |
| | | Subsequent measurement (Continued) |
| | | Available-for-sale financial assets |
Available-for-sale financial assets are those non-derivative financial assets not classified as:
| | (a) | Loans and receivables. |
| | (b) | Held-to-maturity investments. |
| | (c) | Financial assets at fair value through profit or loss. |
After initial measurement, available-for-sale financial assets are measured at fair value, with unrealized gains or losses recognized as other comprehensive income until the investment is derecognized, except for impairment losses, interest calculated using the effective interest rate method and exchange gains or losses on monetary assets, which are recognized in the profit or loss of the period.
When the investment is derecognized or determined to be impaired, cumulative gains or losses previously recognized in other comprehensive income must be recognized in the income statement.
| | | Derecognition (write-off) of financial assets |
A financial asset (or, where applicable, a part of a financial asset or part of a group of similar financial assets) is derecognized when:
| | • | | The rights to receive cash flows from the asset have expired. |
| | • | | Enel Group has transferred its rights to receive cash flows from the asset or has assumed an obligation to pay the received cash flows in full without material delay to a third party under a ‘pass- through’ arrangement; and either; and (i) the Group has transferred substantially all the risks and rewards of the asset, or (ii) the Group has neither transferred nor retained substantially all the risks and rewards of the asset, but has transferred control of the asset. |
When the Group has transferred its rights to receive cash flows from an asset or has entered into a pass-through arrangement, and has neither transferred nor retained substantially all of the risks and rewards of the asset nor transferred control of the asset, the asset is recognized to the extent of the Group’s continuing involvement in the asset.
In that case, the Group also recognizes an associated liability. The transferred asset and the associated liability are measured on a basis that reflects the rights and obligations that the Group has retained.
Continuing involvement that takes the form of a guarantee over the transferred asset is measured at the lower of the original carrying amount of the asset and the maximum amount of consideration that the Group could be required to repay.
G-18
Enel Brasil S.A.
Notes to the consolidated financial statements (Continued)
September 30, 2015 and 2014, December 31, 2014 and 2013 and January 1st, 2013
(In thousands of reais, unless otherwise stated)
| 2. | Summary of significant accounting policies (Continued) |
| | 2.6. | Financial instruments – Initial recognition and subsequent measurement (Continued) |
| | 2.6.1. | Financial assets (Continued) |
| | | Subsequent measurement (Continued) |
| | | Derecognition (write-off) of financial assets (Continued) |
| | 2.6.1.1. | Cash and cash equivalents and marketable securities |
Cash equivalents are held for the purpose of meeting short-term cash commitments rather than for investing or any other purposes. The Group considers cash equivalents to be short- term investments that are readily convertible to known amounts of cash and which are subject to an insignificant risk of changes in value. Thus, an investment normally qualifies as a cash equivalent if it has a short-term maturity, e.g. three months or less, from the date of acquisition, while an investment with maturities greater than three months are usually classified as marketable securities.
| | 2.6.1.2. | Accounts receivable from consumers, concessionaires and permittees |
This covers accounts receivable from (i) energy supply and use of network, billed and not billed, the latter of which is estimated, (ii) services rendered, late-payment increases, among others; (iii) sale of energy to concessionaires, permittees and free consumers; (iv) energy traded through the Electric Energy Commercialization Chamber – CCEE; and (v) availability of the electric energy transmission network, until the balance sheet closing date, recorded on an accrual basis. These are considered financial assets classified as loans and receivables.
| | 2.6.1.3. | Allowance for doubtful accounts |
The allowance for doubtful accounts is established, substantially, considering receivables from residential consumers in default for more than 90 days, commercial consumers in default for more than 180 days, and industrial, rural, public sector, public lighting and public services in default for more than 360 days, based on a detailed analysis in connection with significant defaulters. This is recognized in an amount considered sufficient by the Group’s management to cover probable losses on credits recorded by the Group’s subsidiaries.
| | 2.6.2. | Impairment of financial assets |
The Group assesses, at each reporting date, whether there is any objective evidence that a financial asset or a group of financial assets is impaired. A financial asset or a group of financial assets is deemed to be impaired if, and only if, there is objective evidence of impairment as a result of one or more events that has occurred after the initial recognition of the asset (an incurred “loss event’”) and that loss event has an impact on the estimated future cash flows of the financial asset or the group of financial assets that can be reliably estimated.
G-19
Enel Brasil S.A.
Notes to the consolidated financial statements (Continued)
September 30, 2015 and 2014, December 31, 2014 and 2013 and January 1st, 2013
(In thousands of reais, unless otherwise stated)
| 2. | Summary of significant accounting policies (Continued) |
| | 2.6. | Financial instruments – Initial recognition and subsequent measurement (Continued) |
| | 2.6.3. | Financial liabilities |
| | | Initial recognition and measurement |
Financial liabilities within the scope of IAS 39 are classified as financial liabilities at fair value through profit or loss, loans and borrowings, or as derivatives designated as hedging instruments in an effective hedge, as appropriate. The Group determines the classification of its financial liabilities at initial recognition.
Financial liabilities are initially recognized at fair value and in the case of loans and borrowings, net of directly attributable transaction costs.
The Group’s financial liabilities include trade and other payables, bank overdrafts, loans and borrowings, debentures and derivative financial instruments.
The measurement of financial liabilities depends on their classification as follows:
| | | Financial liabilities at fair value through income statement |
Financial liabilities at fair value through income statement include financial liabilities held for trading and financial assets designated upon initial recognition at fair value through income statement.
The Group does not present any financial liability at fair value through income statement.
Financial liabilities are classified as held for trading if they are acquired for the purpose of selling in the near term. This category includes derivative financial instruments entered into by the Group that do not qualify for hedge accounting as defined by IAS 39, unless they are designated as effective hedging instruments. Gains or losses on liabilities held for trading are recognized in the income statement.
| | | Loans, borrowings and debentures |
After initial recognition, interest bearing loans and borrowings and debentures are subsequently measured at amortized cost using the effective interest rate method. Gains and losses are recognized in the income statement when the liabilities are derecognized as well as through the effective interest rate method during the amortization process.
| | | Derecognition (write-off) of financial liabilities |
A financial liability is derecognized when the obligation under the liability is discharged or cancelled or expires. When an existing financial liability is replaced by another from the same lender on substantially different terms, or the terms of an existing liability are substantially modified, such an exchange or modification is treated as a derecognition of the original liability and the recognition of a new liability, and the difference in the respective carrying amounts is recognized in the income statement.
G-20
Enel Brasil S.A.
Notes to the consolidated financial statements (Continued)
September 30, 2015 and 2014, December 31, 2014 and 2013 and January 1st, 2013
(In thousands of reais, unless otherwise stated)
| 2. | Summary of significant accounting policies (Continued) |
| | 2.6. | Financial instruments – Initial recognition and subsequent measurement (Continued) |
| | | Subsequent measurement (Continued) |
| | 2.6.4. | Offsetting of financial instruments |
Financial assets and financial liabilities are offset and the net amount is reported in the consolidated statement of financial position if, and only if, there is a currently enforceable legal right to set off the recognized amounts and there is an intention to settle on a net basis, or to realize the assets and settle the liabilities simultaneously.
| | 2.6.5. | Fair value of financial instruments |
The fair value of financial instruments that are traded in active markets at each reporting date is determined by reference to quoted market prices, without any deduction for transaction costs.
For financial instruments not traded in an active market, the fair value is determined using appropriate valuation techniques. Such techniques may include using recent arm’s length market transactions; reference to the current fair value of another instrument that is substantially the same; a discounted cash flow analysis or other valuation models.
| | 2.7. | Derivative financial instruments |
Enel Group has derivative financial instruments represented by swap contracts, aiming at partially protecting its exposure to the CDI rate arising from debentures issued by Ampla Energia and COELCE and Non deliverable forward to provide protection against the risk of fluctuations in the exchange rates arising from the gas purchase contract signed between the subsidiary CGTF and Companhia de Gás do Ceará (CEGÁS).
Any gains or losses arising from changes in the fair value of derivatives are taken directly to profit or loss, except for the effective portion of cash flow hedges, which is recognized in OCI and later reclassified to profit or loss when the hedge item affects profit or loss. Gains or losses for the effective portion of these swaps are recognized directly in equity in other comprehensive income.
For the purpose of hedge accounting, hedges are classified as:
| | • | | Fair value hedges when hedging the exposure to changes in the fair value of a recognized asset or liability or an unrecognized firm commitment; |
| | • | | Cash flow hedges when hedging the exposure to variability in cash flows that is either attributable to a particular risk associated with a recognized asset or liability or a highly probable forecast transaction or the foreign currency risk in an unrecognized firm commitment |
Cash flow hedges
The effective portion of the gain or loss on the hedging instrument is recognized in OCI in the cash flow hedge reserve, while any ineffective portion is recognized immediately in the statement of profit or loss as other operating expenses.
When the hedged item is the cost of a non-financial asset or non-financial liability, the amounts recognized as OCI are transferred to the initial carrying amount of the non-financial asset or liability.
G-21
Enel Brasil S.A.
Notes to the consolidated financial statements (Continued)
September 30, 2015 and 2014, December 31, 2014 and 2013 and January 1st, 2013
(In thousands of reais, unless otherwise stated)
| 2. | Summary of significant accounting policies (Continued) |
| | 2.7. | Derivative financial instruments (Continued) |
If the hedging instrument expires or is sold, terminated or exercised without replacement or rollover (as part of the hedging strategy), or if its designation as a hedge is revoked, or when the hedge no longer meets the criteria for hedge accounting, any cumulative gain or loss previously recognized in OCI remains separately in equity until the forecast transaction occurs or the foreign currency firm commitment is met.
The Group uses forward currency contracts as hedges of its exposure to foreign currency risk in forecast transactions and firm commitments,
Note 23 include more detailed information on the derivative financial instruments entered into by the Company’s subsidiaries.
Enel Group does not use derivative contracts for commercial and speculative purposes.
| | 2.8. | Indemnification assets (Concession) |
The Distribution Concession Agreement No. 05/96 – ANEEL, of December 9, 1996, celebrated between the Federal Government (Granting Authority) and Ampla Energia e Serviços S.A. (Concessionaire), and the Distribution Concession Agreement No. 01/98 – ANEEL, of May 13, 1998 and further amendments, celebrated between the Federal Government (Granting Authority) and COELCE (Concessionaire), regulate the operation of the public services of electricity distribution by the Company’s subsidiaries, considering that:
| | a) | The agreements determine which services the operator has to provide and for whom (consumers). |
| | b) | These agreements determine the standard performance for the provision of public services, in relation to maintenance and improvement of customer service quality, and the operator has the obligation to, upon the end of the concession, return the infrastructure under the same conditions as received when these agreements were executed. To comply with these obligations, constant investments over the concession term are made. Therefore, the concession assets can be sometimes replaced until the end of the concession. |
| | c) | At the end of the concession, the assets linked to the infrastructure must be reversed to the granting authority upon payment of the indemnification. |
| | d) | The price is regulated through a fee mechanism established in the concession agreements based on parametric formulas (Portion A and B), the fee review modalities are also defined, and they must be sufficient enough to cover the costs, the amortization of investments and remuneration of invested capital. |
Based on the characteristics defined in the electricity distribution concession agreement of the Company’s subsidiaries, the Management understands that the conditions for application of IFRIC 12 – Service Concession Agreements, which provides instructions on accounting for concession of public services to private operators, in order to reflect the electricity distribution business, including:
| | 1. | Estimate portion of investments made and not amortized or depreciated until the end of the concession term determined based on the New Replacement Value (“VNR”) classified as financial asset as it is an unconditional right to receive cash or other financial asset directly from the granting authority; and |
G-22
Enel Brasil S.A.
Notes to the consolidated financial statements (Continued)
September 30, 2015 and 2014, December 31, 2014 and 2013 and January 1st, 2013
(In thousands of reais, unless otherwise stated)
| 2. | Summary of significant accounting policies (Continued) |
| | 2.8. | Indemnification assets (Concession) (Continued) |
| | 2. | Remaining portion of financial asset (net book value) determined in accordance with VNR classified as intangible asset once its recovery is conditioned to the use of the public service, i.e. the consumption of electricity. |
The infrastructure received or built for distribution activities, which was originally represented by the fixed and intangible assets of the Company’s subsidiaries, is recovered through two cash flows, as follows: (i) a portion through consumption of electricity by consumers (issue of monthly bill according to measurement of electricity consumed/sold) during the concession term; and (ii) a portion through indemnification of reversible assets at the end of the concession, to be received directly from the granting authority or whomever thereby appointed.
This indemnification is based on portions of the investments linked to reversible assets, still not amortized or depreciated, which had been made in order to ensure that the granted services are continuous.
Pursuant to Law No. 12783/2013 (“Law No. 12,783/13”), of January 11, 2013, the calculation of investments linked to reversible assets not yet amortized or depreciated for indemnification purposes must use the new replacement value method, according to the criteria defined by the granting authority.
The Company’s subsidiaries recognize financial assets from concession agreements when there is an unconditional contractual right to receive cash or other equivalent financial asset from the granting authority referring to construction or improvement services provided. These financial assets are measured at fair value upon initial recognition; after initial recognition these financial assets are measured at their VNR.
This financial asset, represented by the indemnification value of the Company’s subsidiaries, is classified as “available for sale”.
| | 2.9. | Property, plant and equipment |
Enel Group property, plant and equipment is stated at cost, net of accumulated depreciation and accumulated impairment losses, if any. When significant parts of property, plant and equipment are required to be replaced at intervals, the Group recognizes such parts as individual assets with specific useful lives and depreciates them accordingly. All other repair and maintenance costs are recognized in profit or loss as incurred. The residual values, useful lives and methods of depreciation of property, plant and equipment are reviewed at each financial year end and adjusted prospectively, if appropriate.
Depreciation is calculated on a straight-line basis over the estimated useful lives of the assets.
An item of property, plant and equipment and any significant part initially recognized is derecognized upon disposal or when no future economic benefits are expected from its use or disposal. Any gain or loss arising on derecognition of the asset (calculated as the difference between the net disposal proceeds and the carrying amount of the asset) is included in the income statement when the asset is derecognized.
This includes the right to use the infrastructure built or acquired by the operator, or provided by the granting authority to be used as part of the electric energy service concession arrangement (right to charge consumers for the utility service provided thereby), in accordance with IAS 38 – Intangible Assets (“IAS 38”) and IFRIC 12.
G-23
Enel Brasil S.A.
Notes to the consolidated financial statements (Continued)
September 30, 2015 and 2014, December 31, 2014 and 2013 and January 1st, 2013
(In thousands of reais, unless otherwise stated)
| 2. | Summary of significant accounting policies (Continued) |
| | 2.10. | Intangible assets (Continued) |
| | | Concession right-of-use (Continued) |
Intangible assets are amortized on a non-straight-line basis and limited to the remaining concession term of the Company’s subsidiaries or useful life of the related asset, whichever is lowers. These are valued at acquisition cost, less accumulated amortization and impairment losses, where applicable.
| | | Concession right from acquisition |
The fiscal benefit originated by the concession right from acquisition recorded in the balance sheet of Enel Brasil S.A. economically grounded on expected statements of operations over the concession exploration period of subsidiary COELCE, and stems from the acquisition of the concession right granted by the Government.
The fiscal benefit is amortized based on the concession arrangement, monthly proportional to its profitability projected through December 31, 2027.
| | 2.11. | Impairment of non-financial assets |
The Enel Group’s management annually reviews net book value of its assets so as to assess events or changes in economic, operating or technological circumstances which may indicate deterioration or impairment. When such evidence is identified and net book value exceeds recoverable amount, a provision for impairment is set up by adjusting net book value to recoverable value.
Recoverable amount of an asset item or of a cash-generating unit (CGU) is defined as the higher of value in use and fair value less cost to sell.
In estimating value in use of an asset item or CGU, estimated future cash flows are discounted to present value at a pre-tax discount rate reflecting the weighted average capital cost for the industry in which the asset or CGU operates.
Government grants are recognized where there is reasonable assurance that the grant will be received and all attached conditions will be complied with. When the grant relates to an expense item, it is recognized as income on a systematic basis over the periods that the related costs, for which it is intended to compensate, are expensed. When the grant relates to an asset, it is recognized as income in equal amounts over the expected useful life of the related asset.
When the Group receives grants of non-monetary assets, the asset and the grant are recorded at nominal amounts and released to profit or loss over the expected useful life in a pattern of consumption of the benefit of the underlying asset by equal annual instalments.
The subsidiary COELCE has tax incentives (ADENE benefit), such as a 75% decrease in income tax and non-refundable additions, calculated on the operation profit, referring to distribution activities until 2016 (based year). The amounts corresponding to decrease in income tax are recorded as reduction of the corresponding tax expenses in income statement for the year and then transferred to equity in account “Tax Incentive Reserve” of the subsidiary COELCE individual financial statements.
G-24
Enel Brasil S.A.
Notes to the consolidated financial statements (Continued)
September 30, 2015 and 2014, December 31, 2014 and 2013 and January 1st, 2013
(In thousands of reais, unless otherwise stated)
| 2. | Summary of significant accounting policies (Continued) |
Provisions are recognized when the Group has present (legal or not formalized) obligations as result of a past event, and it is likely that economic benefits are required to settle said obligations, and they can be reliably estimated. When the Group expects that the amount of one provision will be reimbursed, whether totally or partially, due to, for instance, an insurance contract, this reimbursement is separately recognized as an asset, but only when this reimbursement is virtually certain.
Expenses related to any provisions are presented in income statement, net of any reimbursements.
| | | Provisions for tax, civil and labor risks |
The Group is party to various legal and administrative proceedings. Provisions are set up for all contingencies referring to legal proceedings, the settlement of which is likely to require an outflow of funds, and that can be reliably estimated. Assessment of the likelihood of loss includes the evaluation of evidence available, hierarchy of laws and jurisdiction, the latest court decisions and their relevance in the legal realm, as well as evaluation of the Group’s legal counsel. Provisions are reviewed and adjusted to consider changes in circumstances such as applicable limitation period, conclusion of tax inspections or additional exposures found based in new legal issues or court decisions.
| | 2.14.1. | Income and social contribution taxes – current |
Current income and social contribution tax assets and liabilities are measure at the expected recoverable value or amount payable to tax authorities. The tax rates and laws used to calculate the respective amount are those in effect or substantially in effect at balance sheet date.
Current income and social contribution taxes relating to items recognized directly in equity are recognized under equity. Management periodically evaluates positions taken in the tax returns with respect to situations in which applicable tax regulations are subject to interpretation and establishes provisions where appropriate.
Deferred taxes are generated by temporary differences at the end of the reporting period between tax bases of assets and liabilities and their book value. Deferred tax liabilities are recognized for all temporary tax differences, except:
| | • | | When the deferred tax liability arises from the initial recognition of goodwill or an asset or liability in a transaction that is not a business combination and, at the time of the transaction, affects neither the accounting profit nor taxable profit or loss. |
| | • | | In respect of taxable temporary differences associated with investments in subsidiaries, associates and interests in joint ventures, when the timing of the reversal of the temporary differences can be controlled and it is probable that the temporary differences will not reverse in the foreseeable future. |
G-25
Enel Brasil S.A.
Notes to the consolidated financial statements (Continued)
September 30, 2015 and 2014, December 31, 2014 and 2013 and January 1st, 2013
(In thousands of reais, unless otherwise stated)
| 2. | Summary of significant accounting policies (Continued) |
| | 2.14. | Taxation (Continued) |
| | 2.14.2. | Deferred taxes (Continued) |
Deferred tax assets are recognized for all deductible temporary differences, the carry forward of unused tax credits and any unused tax losses. Deferred tax assets are recognized to the extent that it is probable that taxable profit will be available against which the deductible temporary differences, and the carry forward of unused tax credits and unused tax losses can be utilized, except:
| | • | | When the deferred tax asset relating to the deductible temporary difference arises from the initial recognition of an asset or liability in a transaction that is not a business combination and, at the time of the transaction, affects neither the accounting profit nor taxable profit or loss. |
| | • | | In respect of deductible temporary differences associated with investments in subsidiaries, deferred tax assets are recognized only to the extent that it is probable that the temporary differences will reverse in the foreseeable future and taxable profit will be available against which the temporary differences can be utilized. |
The carrying amount of deferred tax assets is reviewed at each reporting date and reduced to the extent that it is no longer probable that sufficient taxable profit will be available to allow all or part of the deferred tax asset to be utilized. Unrecognized deferred tax assets are re-assessed at each reporting date and are recognized to the extent that it has become probable that future taxable profits will allow the deferred tax asset to be recovered.
Deferred tax assets and liabilities are measured at the tax rates that are expected to apply in the year when the asset is realized or the liability is settled, based on tax rates (and tax laws) that have been enacted or substantively enacted at the reporting date.
Deferred tax assets and deferred tax liabilities are offset if a legally enforceable right exists to set off current tax assets against current income tax liabilities and the deferred taxes relate to the same taxable entity and the same taxation authority.
Income, expenses and assets are recognized net of taxes on sales, except:
| | • | | When the sales tax incurred on the purchase of goods or services is not recoverable from the tax authorities, in which case the sales tax is recognized as part of the acquisition cost of the asset or expense item, as the case may be. |
| | • | | When the amounts receivable or payable are presented together with the amount of tax on sales. |
| | • | | When the net amount of sales tax recoverable or payable is included as a component of the amounts receivable or payable in the balance sheets. |
G-26
Enel Brasil S.A.
Notes to the consolidated financial statements (Continued)
September 30, 2015 and 2014, December 31, 2014 and 2013 and January 1st, 2013
(In thousands of reais, unless otherwise stated)
| 2. | Summary of significant accounting policies (Continued) |
Since Ampla Energia, CDSA, CIEN, CGTF and COELCE, subsidiaries of Enel Brasil, operate in regulated segments, they are charged amounts as payment of regulatory charges, as follows:
| | 2.15.1. | Global Reversion Reserve (RGR) |
This refers to provision of amounts to be paid to Centrais Elétricas Brasileiras S.A. – Eletrobras, calculated based on 2.5% on Property Plant Equipment, limited to 3% of gross operating revenue from electric energy of subsidiaries CDSA and CIEN. The amounts are regulated on an annual basis, by means of decisions handed down by ANEEL’s Financial Supervisory Authority (SFF).
| | 2.15.2. | Energy Development Account (CDE) |
The objective is to foster the energy development in the Brazilian States and competitiveness of the energy produced from alternative sources, in areas covered by interconnected systems, enabling the universal use of the electric energy services. The amounts payable are also defined by ANEEL.
| | 2.15.3. | Energy Efficiency Programs (PEE) – Research and Development (P&D) – National Scientific and Technological Development Fund (FNDCT) and Energy Efficiency Company (EPE) |
These refer to reinvestment programs required by ANEEL for electric energy distribution companies, whereby 1% of net regulatory operating revenue (Regulatory ROL) must be annually allocated to such funds.
| | 2.15.4. | Public Electric Energy Service Inspection Fee (TFSEE) |
The inspection fees charged on distribution of electric energy are differentiated and proportional to the services offered, calculated annually by ANEEL, considering the economic value added by the concession operator.
| | 2.15.5. | System Service Charges (ESS) |
This represents the cost incurred to maintain the reliability and stability of the National Interconnected System to meet energy consumption demand in Brazil. This cost is calculated by CCEE on a monthly basis, and paid by agents of the consumption category to generating agents.
| | 2.15.6. | Financial compensation for use of water resources (CFURH) |
This corresponds to a percentage that concessionaires and companies authorized to produce energy for hydroelectric generation pay for the use of water resources, calculated by the value of energy produced.
| | 2.16. | Other current and non-current assets and liabilities |
These are stated at realization values (assets) and at known or determinable amounts increased, where applicable, by the corresponding charges and monetary restatements incurred (liabilities).
G-27
Enel Brasil S.A.
Notes to the consolidated financial statements (Continued)
September 30, 2015 and 2014, December 31, 2014 and 2013 and January 1st, 2013
(In thousands of reais, unless otherwise stated)
| 2. | Summary of significant accounting policies (Continued) |
The Enel Group recognizes a liability and a profit sharing expense from a formula that considers attainment of operating goals and specific objectives, established and approved at the beginning of each year. The amount assigned to this participation is registered as operational expense.
| | 2.18. | Payment of dividends |
The dividend recognition policy is in line with IAS 37 – Provisions, Contingent Liabilities and Contingent Assets (“IAS 37”), which determine that proposed dividends be paid and be grounded on statutory obligations, recorded as current liabilities.
The Group’s articles of incorporation establish that at least 25% of annual net income (except for the subsidiary CGTF – 2%) be paid for purposes of dividends, after allocation of the legal reserve.
As such, at the closing of the year and after the proper legal allocations have been made, the Group records the provision corresponding to the minimum mandatory dividends not yet paid in the year, whereas proposed dividends exceeding the minimum mandatory dividends are stated as “Proposal for payment of additional dividends” in equity.
| | 2.19. | Retirement and other post-employment benefits |
The Enel Group sponsors defined benefit pension plans to certain employees, in addition to post-employment health care and gratification in retirement, which require that contributions be made to funds administered separately from the subsidiaries’ own funds.
Obligations relating to post-employment benefits are accrued for based on actuarial calculation prepared annually by an independent actuary, using the projected unit credit method, net of collateral plan assets, where applicable, and corresponding costs are recognized over the service lives of employees. The projected unit credit method considers each service period as being a taxable event of an additional benefit unit, accumulated for calculation of the total obligation. Other actuarial assumptions are also used, such as biological and economic hypotheses, historical data on expenses incurred and employee contributions.
Remeasurement gains and losses generated by adjustments and changes in actuarial assumptions of pension and other retirement benefit plans are posted to other comprehensive income, based on actuarial calculations prepared by the independent actuary, as detailed in Note 32.
With respect to the interim consolidated financial statements, the service costs and net interest costs is calculated based on assumption used to determine the obligation at the beginning of the year, pursuant to IAS 34.B9.
G-28
Enel Brasil S.A.
Notes to the consolidated financial statements (Continued)
September 30, 2015 and 2014, December 31, 2014 and 2013 and January 1st, 2013
(In thousands of reais, unless otherwise stated)
| 2. | Summary of significant accounting policies (Continued) |
| | 2.20. | New accounting pronouncements |
| | 2.20.1. | Accounting pronouncements effective from January 1, 2015 |
| | |
Standards, Interpretations and Amendments | | Mandatory
Application for: |
Amendment to IAS 19: Employee Benefits The purpose of this amendment is to simplify the accounting for contributions from employees or third parties that are not determined on the basis of an employee’s years of service, such as employee contributions calculated according to a fixed percentage of salary. | | Annual periods
beginning on or
after July 1, 2014. |
| |
Improvements to IFRS (Cycles 2010-2012 and 2011-2013) These are a set of improvements that were necessary, but not urgent, and that amend the following standards: IFRS 2, IFRS 3, IFRS 8, IFRS 13, IAS 16, IAS 24, IAS 38 and IAS 40. | | Annual periods
beginning on or
after July 1, 2014. |
The new interpretation and amendments adopted, which went into effect on January 1, 2015, have not had a significant effect on the consolidated financial statements of Enel Brasil and its subsidiaries.
| | 2.20.2. | Accounting pronouncements in effect from January 1, 2016 and subsequent periods |
As of the date of issue of these consolidated financial statements, the following accounting pronouncements had been issued by the IASB, but their application was not yet mandatory:
| | |
Standards, Interpretations and Amendments | | Mandatory
Application for: |
IFRS 9: Financial Instruments This is the final version of the standard issued in July 2014 and which completes the IASB project to replace IAS 39 “Financial Instruments: Recognition and Measurement.” This project was divided into 3 phases: Phase 1 – Classification and measurement of financial assets and financial liabilities. This introduces a logical focus for the classification of financial assets driven by cash flow characteristics and the business model. This new model also results in a single impairment model being applied to all financial instruments. Phase 2 – Impairment methodology. The objective is a more timely recognition of expected credit losses. The standard requires entities to account for expected credit losses from the time when financial instruments are first recognized in the financial statements. Phase 3 – Hedge accounting. This establishes a new model aimed at reflecting better alignment between hedge accounting and risk management activity. Also included are enhancements to required disclosures. This final version of IFRS 9 replaces the previous versions of the Standard. | | Annual periods beginning on or after January 1, 2018. |
| |
IFRS 15: Revenue from Contracts with Customers This new standard applies to all contracts with customers except leases, financial instruments and insurance contracts. Its purpose is to make financial information more comparable, and it provides a new model for revenue recognition and more detailed requirements for contracts with multiple obligations. It also requires more itemized information. This standard will replace IAS 11 and IAS 18 as well as their interpretations (IFRIC 13, IFRIC 15, IFRIC 18 and SIC 31). | | Annual periods beginning on or after January 1, 2018. |
G-29
Enel Brasil S.A.
Notes to the consolidated financial statements (Continued)
September 30, 2015 and 2014, December 31, 2014 and 2013 and January 1st, 2013
(In thousands of reais, unless otherwise stated)
| 2. | Summary of significant accounting policies (Continued) |
| | 2.20. | New accounting pronouncements (Continued) |
| | 2.20.2. | Accounting pronouncements in effect from January 1, 2016 and subsequent periods (Continued) |
| | |
Standards, Interpretations and Amendments | | Mandatory
Application for: |
Amendment to IFRS 11: Joint Arrangements This amendment states that the accounting standards contained in IFRS 3 and other standards that are pertinent to business combinations accounting must be applied to the accounting for acquiring an interest in a joint operation in which the activities constitutes a business. | | Annual periods beginning on or after January 1, 2016. |
| |
Amendment to IAS 16 and IAS 38: Clarification of Acceptable Methods of Depreciation and Amortization The amendment to IAS 16 explicitly forbids the use of revenue-based depreciation for property, plant and equipment. The amendment to IAS 38 introduces the rebuttable presumption that, for intangible assets, the revenue-based amortization method is inappropriate and establishes two limited exceptions. | | Annual periods beginning on or after January 1, 2016. |
| |
Improvements to IFRS (Cycles 2012-2014) These are a set of improvements that were necessary, but not urgent, and that amend the following standards IFRS 5, IFRS7, IAS19 and IAS 34. | | Annual periods beginning on or after January 1, 2016. |
| |
Amendment to IFRS 10 and IAS 28: Sale or Contribution of Assets The amendment corrects an inconsistency between IFRS 10 and IAS 28 relating to the accounting treatment of the sale or contributions of assets between an Investor and its Associate or Joint Venture. | | Annual periods beginning on or after January 1, 2016. |
| |
Amendment to IAS 27: Equity Method in Separate Financial Statements This improvement allows entities to use the equity method to account for investments in subsidiaries, joint ventures and associates in their separate financial statements. The objective of the improvement is to minimize the costs associated with complying with the IFRS, particularly for those entities applying IFRS for the first time, without reducing the information available to investors. | | Annual periods beginning on or after January 1, 2016. |
| |
Amendment to IAS 1: Disclosure Initiative The IASB has issued amendments to IAS 1 as part of its principal initiative to improve the presentation and disclosure of information in financial statements. These amendments are designed to companies is applying professional judgment to determine what type of information to disclose in their financial statements. | | Annual periods beginning on or after January 1, 2016. |
| |
Amendment to IFRS 10, IFRS 12 and IAS 28: Investment Entities, Application of the Consolidation Exception The modifications, which have a restricted scope, introduce clarifications to the requirements for the accounting of investment entities. The modifications also provide relief in some circumstances, which will reduce the costs of applying the Standards. | | Annual periods beginning on or after January 1, 2016. |
The Group is assessing the impact of applying IFRS 9 and IFRS 15 from their effective date. In Management’s opinion, the application of the other standards and amendments pending application is not expected to have a significant effect on the consolidated financial statements of Enel Brasil and its subsidiaries.
G-30
Enel Brasil S.A.
Notes to the consolidated financial statements (Continued)
September 30, 2015 and 2014, December 31, 2014 and 2013 and January 1st, 2013
(In thousands of reais, unless otherwise stated)
| 3. | Significant accounting judgments, estimates and assumptions |
Judgments
The preparation of the Group’s financial statements requires management to make judgments, estimates and assumptions that affect the reported amounts of revenues, expenses, assets and liabilities, and the accompanying disclosures, and the disclosure of contingent liabilities, as of the financial statements date.
Estimates and assumptions
Significant assumptions regarding the sources of uncertainty of future estimates and other significant estimate-related sources of uncertainty as of the consolidated statement of financial position date, including significant risk of future adjustments in the book value of assets and liabilities for the following financial year, are discussed below. Management based its assumptions and estimates on parameters available at the financial statement date. Any future changes in these parameters will be reflected when the changes occur.
Impairment of non-financial assets
Impairment occurs when the book value of a non-financial asset or cash-generating unit exceeds its recoverable amount, which is the higher of the fair value less sale costs and the value in use. The calculation of fair value less costs of sales is based on the information available of sales transactions of similar assets or market prices less additional costs to sell the asset. The calculation of the value in use considers the discounted cash flow model. Cash flows derive from a budget prepared for the following five years and do not include reorganization activities not yet engaged by the Group or significant future investments that will improve the base of assets of the cash generating unit subject to testing. The recoverable amount is sensitive to the discount rate used in the discounted cash flow method, to receipts of expected future cash and to the growth rate adopted for extrapolation purposes.
Provisions for tax, civil and labor risks
The Group recognizes provision for tax, civil and labor contingencies. Assessment of the likelihood of loss includes an evaluation of available evidence, hierarchy of laws, available case laws, most recent court rulings and their relevance in the legal system, as well as the legal counsel’s opinion. The provisions are reviewed and adjusted to take into consideration changes in circumstances, such as applicable statute of limitations, conclusions of tax audits or additional exposures identified based on new matters or court rulings.
Allowance for doubtful accounts
An allowance for doubtful accounts is set up in an amount considered sufficient by Management to cover any losses on realization of receivables, considering historical losses and an individual assessment of accounts receivable subject to realization risks.
The allowance is set up based, substantially, on receivables from residential consumers overdue for more than 90 days, commercial consumers overdue for more than 180 days, industrial, rural, government entities, public lighting and utilities overdue for more than 360 days, also considering in-depth analyses for customers with significant debts.
G-31
Enel Brasil S.A.
Notes to the consolidated financial statements (Continued)
September 30, 2015 and 2014, December 31, 2014 and 2013 and January 1st, 2013
(In thousands of reais, unless otherwise stated)
| 3. | Significant accounting judgments, estimates and assumptions (Continued) |
Estimates and assumptions (Continued)
Taxes
There may be uncertainties regarding the interpretation of complex tax regulation as well as the amount and period of future taxable profit. Given the long-term nature and complexity of existing contractual arrangements, differences between actual results and assumptions adopted, or future changes to such assumptions could require future adjustments to the previously recorded tax income and expenses. The Group sets up provisions based on applicable estimates for possible consequences of audits by tax authorities of the jurisdictions in which it operates. The provision amounts are based on various factors, such as experience from prior tax audits and divergent interpretations of tax regulations by the taxable entity and the tax authority in charge. Such divergent interpretations could arise from a wide range of issues, depending on the conditions prevailing in the domicile of the Company and its subsidiaries.
Deferred tax asset is recognized to the extent that it is probable that taxable profit will be available to enable use of the referred to tax losses.
Management is required to make significant judgment to determine the deferred income tax amount to be recognized, based on the probable term and level of future taxable profit, together with future tax planning strategies.
Post-employment benefits
The cost of pension plans with defined benefit and other retirement benefits, and the present value of pension obligations are determined using actuarial valuation methods. The actuarial valuation involves use of assumptions about discount rates, future salary increases, mortality rates and future increases in retirement and pension benefits.
The defined benefit obligation is highly sensitive to changes in these assumptions. All assumptions are reviewed at each financial statement date. For more details on the assumptions used, see Note 32.
Unbilled revenue
The calculation of unbilled revenue is based on the number of days not billed in the month, the estimated amount of energy delivered during those days and the estimated average price per customer class for that month. Differences between actual and estimated unbilled revenue are usually immaterial.
| 4. | Tariff revision and adjustment |
Ampla Energia
In accordance with the concession agreement, the subsidiary Ampla Energia tariffs were adjusted on March 15, 2015. The average tariff adjustment stood at 42.19%, according to Approval Resolution Nº 1861, of March 10, 2015, revised on April 7, 2015, due to the extension of the deadline to repay the ACR account financing. In connection with this new approval and Resolution Nº 1869/2015, the new tariffs will have a 37.34% average effect on captive consumers. The increase in the revenues resulting from the tariff increase is expected to be substantially offset by a similar increase in the corresponding cost of energy purchases as well as regulatory charges.
G-32
Enel Brasil S.A.
Notes to the consolidated financial statements (Continued)
September 30, 2015 and 2014, December 31, 2014 and 2013 and January 1st, 2013
(In thousands of reais, unless otherwise stated)
| 4. | Tariff revision and adjustment (Continued) |
Coelce
In February 27, 2015, through the resolution 1.858, the extraordinary tariff review for COELCE was approved. Such review intended to include in the tariff to be charged to the customers the effect of the mismatching noted on the actual costs incurred and the tariff coverage previously considered on the Energy Development Account charges (CDE) and on the energy purchase costs. The average increase approved for COELCE totaled 10.28%. The increase in the revenues resulting from the tariff increase is expected to be substantially offset by a similar increase in the corresponding cost of energy purchases as well as regulatory charges.
On April 22, 2015, subsidiary Coelce had approved, on interim basis1, the 4th tariff revision cycle, as provided in the concession agreement. ANEEL set tariffs, through Resolution No. 1,882 / 2015. This definition leads to an average tariff effect for consumers of the distributor of 11.69%. The increase in the revenues resulting from the tariff increase is expected to be substantially offset by a similar increase in the corresponding cost of energy purchases as well as regulatory charges.
By virtue of the definition of the new BRR, management recalculated and adjusted the financial assets remaining at the end of the concession, and no significant adjustments have been identified. See Notes 17 and 19 for further details
| 5. | Amendments to Brazilian legislation and regulatory matters |
From January 2015 came into force the system of tariff flags. This implies in the rate of additional charge applied to all consumers depending on electricity conditions.
The flags seek to reduce any imbalances between the actual cost of energy purchased by the distributors and their tariff coverage. The system consists of three flags whose application and operating conditions are described in the following table:
| | | | | | | | |
Tariff Flags | | Applied when the CMO¹ (R$/MWh) | | Reference value January and February (R$/KWh) | | Current value between
March and August
(R$/KWh) | | Current value from September (R$/KWh) |
Green | | < 200,00 | | Without Addition | | Without Addition | | Without Addition |
Yellow | | Between 200,00 e 388,48² | | 0.015 | | 0.025 | | 0.025 |
Red | | > 388,48 | | 0.03 | | 0.055 | | 0.045 |
| ¹ | Marginal Cost of Operation – Higher cost of generation |
| ² | The limit is the top of the current Settlement Price for the Differences (PLD) |
The Decree No. 8,401, of February 4, 2015 determined that the proceeds from the enforcement of tariff flags by distribution agents are now reverted to the Centralizing Account of the Tariff flags Resources (“CCRBT”) administered by the Electricity Trading Chamber (“CCEE”).
| 1 | Up to April 22, 2015, part ot the methodology to be applied to the 4th tariff revision cycle of the distribution companies had not yet been approved by ANEEL. Thus, the 4th tariff revision of COELCE was partly carried out by adopting the 3th taiff revision cycle. To ensure equal treatment between COELCE and the other distribution companies, ANEEL elected to approve the 4th tariff revision of COELCE on a temporary basis. The differences arising from the energy tariffs approved and those resulting from the application of new methodology will be settled in the tariff adjustment in 2016. |
G-33
Enel Brasil S.A.
Notes to the consolidated financial statements (Continued)
September 30, 2015 and 2014, December 31, 2014 and 2013 and January 1st, 2013
(In thousands of reais, unless otherwise stated)
| 5. | Amendments to Brazilian legislation and regulatory matters (Continued) |
The resources available in that account will be transferred to distribution agents considering the difference between the amounts realized incurred by each distributor and the current tariff coverage of each agent. On September 30, 2015, is recorded in current account CCRBT for subsidiary Ampla Energia the amounted R$ 28,544, of which (i) R$ 7, is the non-performing ANEEL Order No. 2440 of 29 July / 2015; and (ii) remaining value of R$ 28,537 with respect to the estimated Flag account—CCRBT for July, August and September 2015. The subsidiary Coelce on September 30 has, in current liabilities the amount of R$ 1,236, of which (i) R$ 2 refers to the balance of the defaulted ANEEL Order No. 2440 of July 29, 2015; and (ii) remaining value of R$ 1,238 as estimated payment from Flag account—CCRBT to the competence of July, August and September.
| 6. | Cash and cash equivalents |
| | | | | | | | | | | | | | | | |
| | | 09/30/2015 | | | 12/31/2014 | | | 12/31/2013 | | | 01/01/2013 | |
Cash and checking accounts | | | 27,312 | | | | 104,758 | | | | 16,976 | | | | 124,035 | |
Short-term investments | | | 526,850 | | | | 759,313 | | | | 1,079,874 | | | | 690,770 | |
| | | | | | | | | | | | | | | | |
Total cash and cash equivalents | | | 554,162 | | | | 864,071 | | | | 1,096.850 | | | | 814,805 | |
| | | | | | | | | | | | | | | | |
The excess cash of the Company and its subsidiaries is invested on a conservative basis in low-risk financial assets, and the main financial instruments are represented by CDBs (Bank Deposit Certificates) and purchase and sales commitments. They are highly liquid investments, immediately convertible into available funds, in accordance with the cash needs of the Company and its subsidiaries. Short-term investments of the Company and its subsidiaries earn interest compatible with the CDI variations.
At September 30, 2015,December 31, 2014, 2013 and January 1st, 2013, financial instruments classified as short-term investment are as follows:
| | | | | | | | | | | | | | | | |
| | | 09/30/2015 | | | 12/31/2014 | | | 12/31/2013 | | | 01/01/2013 | |
Direct investments | | | | | | | | | | | | | | | | |
Bank Deposit Certificate – CDB | | | 85,658 | | | | 221,522 | | | | 92,252 | | | | 131,874 | |
Repurchase agreements | | | 104,539 | | | | 49,367 | | | | 56,723 | | | | 83,602 | |
| | | | | | | | | | | | | | | | |
Total direct investments | | | 190,197 | | | | 270,889 | | | | 148,975 | | | | 215,476 | |
| | | | | | | | | | | | | | | | |
Exclusive funds | | | | | | | | | | | | | | | | |
Bank Deposit Certificate – CDB | | | 119,637 | | | | 163,524 | | | | 432,843 | | | | 299,367 | |
Repurchase agreements | | | 217,016 | | | | 324,900 | | | | 498,056 | | | | 175,927 | |
| | | | | | | | | | | | | | | | |
Total exclusive funds | | | 336,653 | | | | 488,424 | | | | 930,899 | | | | 475,294 | |
| | | | | | | | | | | | | | | | |
Total short-term investments | | | 526,850 | | | | 759,313 | | | | 1,079,874 | | | | 690,770 | |
| | | | | | | | | | | | | | | | |
Short-term investments may be redeemed at any time, with possibility of immediate conversion into a known cash amount with an insignificant risk of change in value. Given the nature and characteristics of short-term investments, they are recognized at fair value against profit and loss.
G-34
Enel Brasil S.A.
Notes to the consolidated financial statements (Continued)
September 30, 2015 and 2014, December 31, 2014 and 2013 and January 1st, 2013
(In thousands of reais, unless otherwise stated)
At September 30, 2015, December 31, 2014, 2013 and January 1st, 2013, financial instruments classified as marketable securities are as follows:
| | | | | | | | | | | | | | | | |
| | | 09/30/2015 | | | 12/31/2014 | | | 12/31/2013 | | | 01/01/2013 | |
Investment funds | | | 2,809 | | | | 25,379 | | | | 22,827 | | | | 24,894 | |
| | | | | | | | | | | | | | | | |
Total investment funds | | | 2,809 | | | | 25,379 | | | | 22,827 | | | | 24,894 | |
| | | | | | | | | | | | | | | | |
Exclusive funds | | | | | | | | | | | | | | | | |
Public securities | | | 125,591 | | | | 204,729 | | | | 550,490 | | | | 379,654 | |
Investment fund quotas | | | — | | | | — | | | | 134,178 | | | | 165,829 | |
Other | | | — | | | | — | | | | 26,436 | | | | 43,557 | |
| | | | | | | | | | | | | | | | |
Total exclusive investment funds | | | 125,591 | | | | 204,729 | | | | 711,104 | | | | 589,040 | |
| | | | | | | | | | | | | | | | |
Argentine Republic Bonds | | | — | | | | 205 | | | | 1,747 | | | | 1,216 | |
| | | | | | | | | | | | | | | | |
Total marketable securities | | | 128,400 | | | | 230,313 | | | | 735,678 | | | | 615,150 | |
| | | | | | | | | | | | | | | | |
Through the exclusive funds, the Company and its subsidiaries invest their excess cash in post-fixed and pre-fixed government bonds, in addition to other traditional fixed-income securities with low credit risk and high liquidity
G-35
Enel Brasil S.A.
Notes to the consolidated financial statements (Continued)
September 30, 2015 and 2014, December 31, 2014 and 2013 and January 1st, 2013
(In thousands of reais, unless otherwise stated)
| 8. | Consumers, concessionaires and permittees, net |
| | a) | Analysis of accounts receivable and statement of the allowance for doubtful accounts balance |
| | | | | | | | | | | | | | | | | | | | | | | | | | | | |
| | | Maturing | | | Overdue until
90 days | | | Overdue for
more than
90 days | | | Total | |
| | | | | | 09/30/2015 | | | 12/31/2014 | | | 12/31/2013 | | | 01/01/2013 | |
Current | | | | | | | | | | | | | | | | | | | | | | | | | | | | |
Consumer class | | | | | | | | | | | | | | | | | | | | | | | | | | | | |
Residential | | | 255,790 | | | | 225,839 | | | | 78,888 | | | | 560,517 | | | | 385,422 | | | | 351,411 | | | | 387,492 | |
Industrial | | | 53,987 | | | | 14,326 | | | | 19,713 | | | | 88,026 | | | | 76,782 | | | | 76,119 | | | | 80,250 | |
Commercial | | | 82,769 | | | | 40,796 | | | | 31,047 | | | | 154,612 | | | | 138,834 | | | | 138,136 | | | | 140,675 | |
Rural | | | 46,968 | | | | 24,596 | | | | 14,761 | | | | 86,325 | | | | 57,755 | | | | 45,542 | | | | 43,315 | |
Government | | | 103,372 | | | | 73,435 | | | | 64,422 | | | | 241,229 | | | | 119,382 | | | | 103,704 | | | | 121,590 | |
Public lighting | | | 32,299 | | | | 20,100 | | | | 962 | | | | 53,361 | | | | 8,381 | | | | 4,902 | | | | — | |
Public service | | | 17,787 | | | | 2,918 | | | | 546 | | | | 21,251 | | | | 15,184 | | | | 13,028 | | | | 14,159 | |
Resale | | | 23,765 | | | | 2,153 | | | | 460 | | | | 26,378 | | | | 7,477 | | | | 5,461 | | | | 4,966 | |
| | | | | | | | | | | | | | | | | | | | | | | | | | | | |
Subtotal | | | 616,737 | | | | 404,163 | | | | 210,799 | | | | 1,231,699 | | | | 809,217 | | | | 738,303 | | | | 792,447 | |
| | | | | | | | | | | | | | | | | | | | | | | | | | | | |
Unbilled revenue (d) | | | 415,111 | | | | — | | | | — | | | | 415,111 | | | | 305,039 | | | | 271,853 | | | | 308,424 | |
Free consumers | | | 27,890 | | | | 8,421 | | | | 6,249 | | | | 42,560 | | | | 60,871 | | | | 53,978 | | | | 43,930 | |
Low income consumers (g) | | | 102,591 | | | | — | | | | — | | | | 102,591 | | | | 47,904 | | | | 67,929 | | | | 65,043 | |
Electric Energy Trade Chamber – CCEE | | | 38,867 | | | | — | | | | 4,136 | | | | 43,003 | | | | 57,447 | | | | 46,605 | | | | 88,028 | |
Installment payment of debts (c) | | | 41,301 | | | | — | | | | — | | | | 41,301 | | | | 12,447 | | | | 15,764 | | | | 17,059 | |
Energy auction – CCEAR | | | 12,739 | | | | — | | | | 1,164 | | | | 13,903 | | | | 16,985 | | | | 11,838 | | | | 14,871 | |
Emergency charges | | | — | | | | — | | | | 2,466 | | | | 2,466 | | | | 2,457 | | | | 2,487 | | | | 2,473 | |
Companhia Energética de Goiás – CELG | | | 230 | | | | 358 | | | | 82 | | | | 670 | | | | 206 | | | | 174 | | | | 136 | |
Receivables from clients questioned in court (b) | | | — | | | | — | | | | 69,355 | | | | 69,355 | | | | 65,980 | | | | 64,948 | | | | 63,303 | |
Furnas Centrais Elétricas S.A. (e) | | | — | | | | — | | | | 2,685 | | | | 2,685 | | | | 4,238 | | | | 4,128 | | | | 2,505 | |
Tractebel Energia S.A. (e) | | | — | | | | — | | | | — | | | | — | | | | 1,018 | | | | 872 | | | | 2,025 | |
Other | | | 10,130 | | | | 26,046 | | | | 9,197 | | | | 45,373 | | | | 29,945 | | | | 20,825 | | | | 60,287 | |
| | | | | | | | | | | | | | | | | | | | | | | | | | | | |
Subtotal | | | 1,265,596 | | | | 438,988 | | | | 306,133 | | | | 2,010,717 | | | | 1,413,754 | | | | 1,299,704 | | | | 1,460,531 | |
| | | | | | | | | | | | | | | | | | | | | | | | | | | | |
Allowance for doubtful accounts (a) | | | — | | | | — | | | | (229,629 | ) | | | (229,629 | ) | | | (193,491 | ) | | | (199,317 | ) | | | (199,584 | ) |
| | | | | | | | | | | | | | | | | | | | | | | | | | | | |
Total current assets | | | 1,265,596 | | | | 438,988 | | | | 76,504 | | | | 1,781,088 | | | | 1,220,263 | | | | 1,100,387 | | | | 1,260,947 | |
| | | | | | | | | | | | | | | | | | | | | | | | | | | | |
Non-current assets | | | | | | | | | | | | | | | | | | | | | | | | | | | | |
Furnas Centrais Elétricas S.A. (e) | | | — | | | | — | | | | 125,612 | | | | 125,612 | | | | 125,612 | | | | 125,612 | | | | 126,955 | |
Tractebel Energia S.A. (e) | | | — | | | | — | | | | 70,772 | | | | 70,772 | | | | 70,772 | | | | 70,772 | | | | 69,429 | |
Sale within Electric Energy Trade Chamber – CCEE | | | — | | | | — | | | | 15,289 | | | | 15,289 | | | | 15,289 | | | | 15,289 | | | | 15,289 | |
Installment payment of debts (c) | | | 85,211 | | | | — | | | | — | | | | 85,211 | | | | 83,259 | | | | 80,762 | | | | 86,100 | |
Receivables with third parties (f) | | | — | | | | 173,115 | | | | — | | | | 173,115 | | | | 119,697 | | | | 119,826 | | | | 120,475 | |
| | | | | | | | | | | | | | | | | | | | | | | | | | | | |
Subtotal | | | 85,211 | | | | 173,115 | | | | 211,673 | | | | 469,999 | | | | 414,629 | | | | 412,261 | | | | 418,248 | |
| | | | | | | | | | | | | | | | | | | | | | | | | | | | |
Allowance for doubtful accounts (a) | | | (1,741 | ) | | | — | | | | (271,931 | ) | | | (273,672 | ) | | | (266,556 | ) | | | (265,182 | ) | | | (247,265 | ) |
| | | | | | | | | | | | | | | | | | | | | | | | | | | | |
Total non-current assets | | | 83,470 | | | | 173,115 | | | | (60,258 | ) | | | 196,327 | | | | 148,073 | | | | 147,079 | | | | 170,983 | |
| | | | | | | | | | | | | | | | | | | | | | | | | | | | |
G-36
Enel Brasil S.A.
Notes to the consolidated financial statements (Continued)
September 30, 2015 and 2014, December 31, 2014 and 2013 and January 1st, 2013
(In thousands of reais, unless otherwise stated)
| 8. | Consumers, concessionaires and permittees, net (Continued) |
| | a) | Analysis of accounts receivable and statement of the allowance for doubtful accounts balance (Continued) |
Changes in allowance for doubtful accounts are as follows:
| | | | |
Balance at January 1, 2013 | | | (446,849 | ) |
| | | | |
(Additions) | | | (96,252 | ) |
Write-offs | | | 78,602 | |
| | | | |
Balance at December 31, 2013 | | | (464,499 | ) |
| | | | |
(Additions) | | | (56,812 | ) |
Write-offs | | | 61,264 | |
| | | | |
Balance at December 31, 2014 | | | (460,047 | ) |
| | | | |
(Additions) | | | (122,608 | ) |
Write-offs | | | 79,354 | |
| | | | |
Balance at September 30, 2015 | | | (503,301 | ) |
| | | | |
Current | | | (426,013 | ) |
Non-current | | | (77,288 | ) |
An allowance for doubtful accounts was set up based on criteria established by regulatory legislation and analysis of specific risks of losing the overdue amounts, legal matters and application of a percentage on installment payment of debts. The amount is considered sufficient by the subsidiaries’ management to cover any losses on realization of the receivables.
| | b) | Receivables from clients questioned in court |
The amount of R$ 69,355 at September 30, 2015 (R$ 65,980, R$ 64,948 and R$ 63,303 in December 31, 2014, 2013 and January 1st 2013, respectively) related to receivables from clients questioned in court.
These consumers were granted the right to offset the claimed credits against electricity bills, by means of lawsuits, but the merits of the case are not considered unappealable. The Group records an allowance for doubtful accounts of R$ 53,351 at September 30, 2015 (R$ 54,751, R$ 53,858 and R$ 52,812 in December 31, 2014, 2013 and January 1st, 2013), deemed sufficient to cover any losses in connection with such lawsuits.
| | c) | Installment payment of debts |
Installment payment of debts corresponds to agreements signed between the Group and their clients referring to renegotiation of electricity bills in arrears. These amounts are included in electricity bills, increased by fine and 1% interest per month, calculated on a pro rata daily basis and monetarily restated based on the General Market Price Index (IGPM) variation. After the amount payable in installments is restated, the first installment, if applicable, is deducted, and the interest agreed in the negotiation is applied, not exceeding 1.8% per month.
G-37
Enel Brasil S.A.
Notes to the consolidated financial statements (Continued)
September 30, 2015 and 2014, December 31, 2014 and 2013 and January 1st, 2013
(In thousands of reais, unless otherwise stated)
| 8. | Consumers, concessionaires and permittees, net (Continued) |
The Unbilled revenue corresponds to the income from electricity supply, delivered but not billed to consumer, computed on an estimated basis, referring to the monthly measurement period and until the last day of the month. At September 30, 2015 the Group has recorded in Accounts receivable a total balance of unbilled revenue of R$ 415,111 (R$ 305,039, R$271,853 and R$ 308,424 in December 31, 2014, 2013 and January 1st 2013, respectively).
| | e) | Furnas Centrais Elétricas S.A. (“Furnas”) and Tractebel Energia S.A. (“Tractebel”) |
At September 30, 2015, the subsidiary CIEN records accounts receivable from Furnas and Tractebel, respectively in the amounts of R$ 128,297 and R$ 70,772 (R$ 129,850 and R$ 71,790 in December 31, 2014, R$ 129,740 and R$ 71,644 in December 31, 2013, and R$ 129,460 and R$ 71,454 in January 1st, 2013) corresponding to the billing of firm capacity and associated energy charges, which were not paid in previous years. Based on the best estimate of receiving the amounts involved, the Group records an allowance for doubtful accounts in the total amount of R$ 198,138 at September 30, 2015 (R$ 198,224, R$ 196,384 and R$ 196,384 on December 31, 2014, 2013 and January 1st, 2013, respectively).
| | f) | Accounts receivable from related parties |
Terms and conditions involving related parties are presented in Note 28.
Based on ANEEL Rulings No. 407/2010 and No. 414/2010, Centrais Elétricas Brasileiras S.A. – Eletrobras will transfer to distribution companies the subsidy amount on a monthly basis, to adjust the discounts granted to low income consumers classified under the criteria of the former Rulings No. 246/2002 and 485/2004, arising from the Energy Development Account (CDE).
Considering the criteria set out by the mentioned rulings and the schedule for registration of clients entitled to the benefit, the consolidated balance receivable at September 30, 2015 totals R$ 102,591 (R$ 47,904 in 2014).
This subsidy is calculated on a monthly basis by the distribution company and submitted to ANEEL for approval and validation through Decision, after which the transfer occurs.
| 9. | CDE Subventions – tariff discount |
Amount to be transferred by Centrais Elétricas Brasileiras – Eletrobras referring to refund of discounts on fees applicable to public electricity distribution services to end users as provided for in article 13, item VII of Law No. 10,438, of April 26, 2002, whose wording was defined by the Provisional Executive Order No. 605 of January 23, 2013, according to article 3 of Decree No. 7,891 of January 23, 2013. These funds are from CDE and approved by ANEEL in the process for distributors’ annual adjustment.
In March and April 2014, approval Resolution Nº1861/2015 and Technical Note Nº87/2015, respectively, were enacted to approve monthly value of R$ 31,445 to be passed on by Eletrobras for the period spanning March 2015 to March 2016, R$ 2,218 of which corresponds to the adjustment regarding the budget to actual difference for the period April 2014 to March 2015, whilst the R$ 29,227 corresponds to the budget for the
G-38
Enel Brasil S.A.
Notes to the consolidated financial statements (Continued)
September 30, 2015 and 2014, December 31, 2014 and 2013 and January 1st, 2013
(In thousands of reais, unless otherwise stated)
| 9. | CDE Subventions – tariff discount (Continued) |
period April 2015 to March 2016 regarding subsidiary COELCE and the budget for the period March 2015 to February 2016 regarding subsidiary Ampla Energia.
At September 30, 2015 the Group recorded R$ 340,037 (R$ 181,646 and R$ 20,385 in December 31, 2014 and 2013, respectively), comprised of: (i) R$ 298,443 regarding the budget for October to September 2015; (ii) R$ 19,375 regarding the record of ten (5) installments of the adjustment for February 2013 to March 2014 and their respective monetary update; (iii) R$ 28,137 regarding the record of ten (12) installments of the adjustment for April 2014 to March 2015; and (iv) R$ (5,918) corresponds to the estimated adjustment of the difference between budget and the values approved by Resolution Nº1861/2015 and Technical Note Nº 87/2015 in 2015.
| | | | | | | | | | | | | | | | |
| | | 09/30/2015 | | | 12/31/2014 | | | 12/31/2013 | | | 01/01/2013 | |
Income and social contribution tax recoverable (a) | | | 133,328 | | | | 91,516 | | | | 80,780 | | | | 90,645 | |
Value-Added Tax – ICMS (“ICMS”) (b) | | | 209,366 | | | | 184,807 | | | | 172,600 | | | | 171,196 | |
Social Integration Program – PIS (“PIS”) and social investment program – COFINS (“COFINS”) ( c ) | | | 81,652 | | | | 73,303 | | | | 216,490 | | | | 65,789 | |
Employer’s contribution to INSS | | | 3,954 | | | | 18,645 | | | | — | | | | — | |
Other taxes | | | 10,897 | | | | 9,047 | | | | 9,964 | | | | 10,799 | |
| | | | | | | | | | | | | | | | |
| | | 439,197 | | | | 377,318 | | | | 479,834 | | | | 338,429 | |
| | | | | | | | | | | | | | | | |
Current | | | 261,612 | | | | 229,140 | | | | 322,072 | | | | 175,322 | |
Non-current | | | 177,585 | | | | 148,178 | | | | 157,762 | | | | 163,107 | |
| a) | The income tax recoverable balance refers to withholding income tax (IRRF) on short-term investments, government agency retentions (Law No. 9,430/96) and prepaid income tax balance. |
The social contribution tax recoverable balance refers to prepaid social contribution tax on net income referring to calendar years 2006 and 2012, in addition to government agency retentions, pursuant to Law No. 9,430/96.
| b) | This refers to credits arising from capital expenditures (according to concept established by tax legislation), which are subject to monthly offset against ICMS collected from customers at the rate of 1/48ths. |
| c) | The amounts classified under PIS and COFINS recoverable from subsidiary Ampla Energia in the total amount of R$ 40,251 in September 30, 2015 (R$ 31,845, R$ 162,853 and R$ 31,845 in December 31, 2014, 2013 and January 1st, 2013) refer to PIS and COFINS computed on the previous sixth-month billings, supported by a court decision in rem judicatam, whereby Decree-Laws Nos. 2,445/88 and 2,449/88 were declared unconstitutional and the right to refund corresponding to the difference between the amounts paid grounded on said Decrees and those due in accordance with Supplementary Law No. 7/70 was recognized. |
Additionally, Ampla Energia has PIS and COFINS withholdings from government agencies. PIS and COFINS amounts recoverable refer to subsidiary CIEN, totaling R$ 31,447 at September 30, 2015 (R$ 29,631, R$ 26,444 and R$ 25,511 in December 31, 2014, 2013 and January 1st, 2013), and they are related particularly to PIS and COFINS overpayments made in previous years in relation to the amounts effectively due in the ordinary course of its operations. As a consequence, CIEN filed a claim for offsetting taxes overpaid and currently awaits approval thereof by the Brazilian IRS in order to set these amounts off.
G-39
Enel Brasil S.A.
Notes to the consolidated financial statements (Continued)
September 30, 2015 and 2014, December 31, 2014 and 2013 and January 1st, 2013
(In thousands of reais, unless otherwise stated)
| 10. | Taxes recoverable (Continued) |
The other amounts of PIS and COFINS recoverable refer to the subsidiaries COELCE, CGTF, CDSA and Prátil, respectively of R$ 695, R$ 3,353, R$ 5,144 and R$ 762.
| | | | | | | | | | | | | | | | | | | | | | | | | | | | | | | | | | |
| | | | | 09/30/2015 | | | 12/31/2014 | | | 12/31/2013 | | | 01/01/2013 | |
Institution | | Type of investment | | Current | | | Non-
current | | | Current | | | Non-
current | | | Current | | | Non-
current | | | Current | | | Non-
current | |
Itaú-Unibanco | | Investment fund | | | 69,891 | | | | — | | | | 57,922 | | | | — | | | | 52,619 | | | | — | | | | 49,336 | | | | — | |
Bradesco | | Investment fund | | | — | | | | — | | | | — | | | | — | | | | — | | | | — | | | | — | | | | 8,027 | |
Bradesco | | CDB | | | — | | | | 13 | | | | — | | | | 81 | | | | — | | | | 436 | | | | — | | | | 104 | |
Itaú | | CDB | | | — | | | | 714 | | | | — | | | | 659 | | | | — | | | | 602 | | | | — | | | | 575 | |
Banco do Brasil | | CDB | | | — | | | | — | | | | — | | | | — | | | | — | | | | 9,729 | | | | | | | | 9,004 | |
BNB | | CDB | | | — | | | | 17,181 | | | | — | | | | 17,458 | | | | — | | | | 20,302 | | | | — | | | | 18,804 | |
Banco do Brasil | | US Treasury Security | | | — | | | | 6,907 | | | | — | | | | 5,912 | | | | — | | | | 4,582 | | | | — | | | | 4,442 | |
Banco Itaú BBA | | Time Deposit | | | — | | | | — | | | | — | | | | — | | | | — | | | | 28,383 | | | | | | | | 24,521 | |
Caixa Econômica Federal | | Guarantee | | | 320 | | | | — | | | | 320 | | | | — | | | | 320 | | | | — | | | | 320 | | | | — | |
Other | | | | | — | | | | 274 | | | | — | | | | 20 | | | | — | | | | 20 | | | | — | | | | 20 | |
| | | | | | | | | | | | | | | | | | | | | | | | | | | | | | | | | | |
Total | | | | | 70,211 | | | | 25,089 | | | | 58,242 | | | | 24,130 | | | | 52,939 | | | | 64,054 | | | | 49,656 | | | | 65,497 | |
| | | | | | | | | | | | | | | | | | | | | | | | | | | | | | | | | | |
At September 30, 2015 the balances of guarantees deposits recorded in subsidiaries Ampla Energia, COELCE and CDSA, of R$ 37,377, R$ 57,843 and R$ 80 (R$ 27,854, R$ 54,518 and nill, respectively, in December 2014) are basically related to the investment of amounts linked to electric energy purchase agreements, contractual retentions from service providers and financing agreement collateral.
Guarantee deposits are invested in fixed-income investment funds, CDBs and other low-risk financial instruments. They include guarantees required in loan and financing agreements, retained amounts of suppliers and electric energy acquisition agreements.
| | | | | | | | | | | | | | | | |
| | | 09/30/2015 | | | 12/31/2014 | | | 12/31/2013 | | | 01/01/2013 | |
Labor | | | 184,366 | | | | 169,315 | | | | 164,169 | | | | 132,901 | |
Civil | | | 67,693 | | | | 54,511 | | | | 53,551 | | | | 51,614 | |
Tax | | | 28,524 | | | | 37,894 | | | | 114,536 | | | | 115,960 | |
| | | | | | | | | | | | | | | | |
Total | | | 280,583 | | | | 261,720 | | | | 332,256 | | | | 300,475 | |
| | | | | | | | | | | | | | | | |
See Note 29 for further discussion of related provisions.
G-40
Enel Brasil S.A.
Notes to the consolidated financial statements (Continued)
September 30, 2015 and 2014, December 31, 2014 and 2013 and January 1st, 2013
(In thousands of reais, unless otherwise stated)
| 13. | Account receivables from Portion A and other financial items |
At December 31, 2014, subsidiaries Ampla Energia and Coelce recognized the CVA balances and other financial components on a prospective basis, in connection with the execution of the respective addenda to the concession agreement – commented on in Note 1. Accordingly, subsidiaries Ampla Energia and Coelce determined the net balance of assets and liabilities of CVA and other financial components, which resulted in recording a net asset in revenues from sales of products and services. Beginning January 1, 2015 the Company started recognizing in financial income the monetary restatement of such outstanding balances.
| | | | | | | | | | | | | | | | |
| | | 09/30/2015 | | | 12/31/2014 | |
| | | Current | | | Non-Current | | | Current | | | Non-current | |
Tariff deferrals (CVAs) (a) | | | 379,893 | | | | 138,882 | | | | 186,563 | | | | 63,755 | |
| | | | | | | | | | | | | | | | |
Energy purchase | | | 440,917 | | | | 84,928 | | | | 244,429 | | | | 82,246 | |
System Service Charge (ESS) | | | (191,542 | ) | | | (29,680 | ) | | | (98,086 | ) | | | (31,158 | ) |
Use of electric grid | | | 46,875 | | | | (2,488 | ) | | | 42,061 | | | | 13,560 | |
Other | | | 83,643 | | | | 86,122 | | | | (1,841 | ) | | | (893 | ) |
| | | | |
Other receivables from Portion A and other financial items | | | 220,533 | | | | 173,476 | | | | 300,770 | | | | 171,110 | |
| | | | | | | | | | | | | | | | |
Overcontracted energy (b) | | | 144,382 | | | | 115,218 | | | | 293,322 | | | | 74,929 | |
Restoration of State VAT (ICMS) (c) | | | 70,509 | | | | 47,053 | | | | 30,710 | | | | 91,210 | |
Eletronuclear Differential | | | 3,821 | | | | (4,512 | ) | | | 14,903 | | | | 4,826 | |
Postponement of tariff revision | | | 2,531 | | | | — | | | | (28,327 | ) | | | 1,589 | |
Other liabilities | | | (710 | ) | | | 15,717 | | | | (9,838 | ) | | | (1,444 | ) |
| | | | | | | | | | | | | | | | |
Total other receivables from Portion A and other financial items | | | 600,426 | | | | 312,358 | | | | 487,333 | | | | 234,865 | |
| | | | | | | | | | | | | | | | |
| | a) | Electricity charges not manageable to be offset of Portion A – CVA |
Interministerial Administrative Ruling of State Ministers of Finance and Mines and Energy No. 25, of January 24, 2002, established the Memorandum Account for Changes in Item Values of “Portion A” – CVA, in order to record changes in costs, either negative or positive, for the period between annual tariff adjustments, related to items provided for in electric energy distribution concession arrangements.
These changes are calculated by means of the difference between expenses effectively incurred and expenses estimated in establishing the electricity charge in annual tariff adjustments. The amounts considered in CVA are monetarily restated based on the SELIC rate.
| | b) | Overcontracted energy (exceeding energy or involuntary exposure) |
Electric energy distribution concessionaires are obliged to guarantee 100% of their energy market through contracts approved, registered and ratified by ANEEL.
Decree N° 5,163, of July 30, 2004, article 38, amended by Decree Nº 7,945, of March 7, 2013, establishes that, when passing on electric energy acquisition costs at end consumers’ electricity charges, ANEEL shall consider up to 105% of the total amount of the contracted electric energy in relation to the annual supply load of the distribution concessionaire. Such pass-through was regulated by ANEEL Resolution N° 255, of March 6, 2007.
G-41
Enel Brasil S.A.
Notes to the consolidated financial statements (Continued)
September 30, 2015 and 2014, December 31, 2014 and 2013 and January 1st, 2013
(In thousands of reais, unless otherwise stated)
| 13. | Account receivables from Portion A and other financial items (Continued) |
| | b) | Overcontracted energy (exceeding energy or involuntary exposure) (Continued) |
With regard to the involuntary exposure to the short-term market, the penalties arising from noncompliance with total electric energy market shall not be applicable, thus ensuring full pass-through of costs to end consumers’ electricity charges.
| | c) | Restoration of State VAT (ICMS) |
When adjusting charges, ANEEL authorized the non-offset historical cost to be passed on to the charge, which, as restated by the General Market Price Index (IGP-M) amount to R$ 149,556 regarding reference periods between May 2003 and February 2014, corresponding to the change to classification criteria of Low Income Household Subclass and to the increase in the tax rate in certain energy purchase agreements. Subsidiary COELCE has already amortized R$ 80,401 in connection with the present charge adjustment process.
G-42
Enel Brasil S.A.
Notes to the consolidated financial statements (Continued)
September 30, 2015 and 2014, December 31, 2014 and 2013 and January 1st, 2013
(In thousands of reais, unless otherwise stated)
Enel Group records deferred tax credits and assets and liabilities on temporary differences, as follows:
| | | | | | | | | | | | | | | | | | | | | | | | | | | | | | | | | | | | | | | | |
| | | Enel Brasil | | | Ampla
Energia | | | CDSA | | | CGTF | | | CIEN
(Consolidated) | | | COELCE | | | Consolidated | |
| | | 09/30/2015 | | | 09/30/2015 | | | 09/30/2015 | | | 09/30/2015 | | | 09/30/2015 | | | 09/30/2015 | | | 09/30/2015 | | | 12/31/2014 | | | 12/31/2013 | | | 01/01/2013 | |
Assets | | | | | | | | | | | | | | | | | | | | | | | | | | | | | | | | | | | | | | | | |
Provision for tax, civil and labor risks | | | — | | | | 170,388 | | | | 158 | | | | 601 | | | | 6,594 | | | | 66,127 | | | | 243,868 | | | | 194,992 | | | | 179,249 | | | | 169,035 | |
Allowance for doubtful accounts | | | — | | | | 67,742 | | | | — | | | | — | | | | 67,366 | | | | 43,069 | | | | 178,177 | | | | 162,941 | | | | 163,989 | | | | 161,027 | |
Provision for inventory obsolescence | | | — | | | | 249 | | | | — | | | | — | | | | — | | | | 1,193 | | | | 1,442 | | | | 1,288 | | | | 3,188 | | | | 291 | |
Derecognition of regulatory asset | | | — | | | | — | | | | — | | | | — | | | | — | | | | 3,713 | | | | 3,713 | | | | — | | | | 46,620 | | | | 29,468 | |
Post-employment benefit obligations | | | — | | | | 157,153 | | | | — | | | | — | | | | — | | | | 47,570 | | | | 204,723 | | | | 192,567 | | | | 170,890 | | | | 196,643 | |
Provision for ARCE fine | | | — | | | | — | | | | — | | | | — | | | | — | | | | — | | | | — | | | | 34,992 | | | | 24,452 | | | | 17,333 | |
Interest on construction in progress | | | — | | | | — | | | | 9,168 | | | | — | | | | — | | | | — | | | | 9,168 | | | | 9,633 | | | | 9,633 | | | | 9,633 | |
Reversal of exchange variation on property, plant and equipment | | | — | | | | — | | | | — | | | | — | | | | 52,253 | | | | — | | | | 52,253 | | | | 54,858 | | | | 58,337 | | | | 65,317 | |
Provision for third-party service | | | — | | | | — | | | | — | | | | — | | | | — | | | | — | | | | — | | | | 958 | | | | 1,247 | | | | 612 | |
Swap operations | | | — | | | | 8,688 | | | | — | | | | — | | | | — | | | | 3,038 | | | | 11,726 | | | | 7,055 | | | | 4,228 | | | | 5,406 | |
Deferred tax asset – swap | | | — | | | | — | | | | — | | | | 805 | | | | — | | | | — | | | | 805 | | | | — | | | | — | | | | — | |
Unrealized exchange variation | | | | | | | | | | | | | | | | | | | | | | | | | | | — | | | | — | | | | 3,812 | | | | 1,005 | |
Other | | | 983 | | | | 2,319 | | | | 200 | | | | 949 | | | | 40,379 | | | | 2,005 | | | | 46,835 | | | | 57,270 | | | | 73,191 | | | | 60,262 | |
| | | | | | | | | | | | | | | | | | | | | | | | | | | | | | | | | | | | | | | | |
Total | | | 983 | | | | 406,539 | | | | 9,526 | | | | 2,355 | | | | 166,592 | | | | 166,715 | | | | 752,710 | | | | 716,554 | | | | 738,836 | | | | 716,032 | |
| | | | | | | | | | | | | | | | | | | | | | | | | | | | | | | | | | | | | | | | |
Liabilities | | | | | | | | | | | | | | | | | | | | | | | | | | | | | | | | | | | | | | | | |
Special (CME) and supplementary (CMC) monetary restatement | | | — | | | | — | | | | — | | | | — | | | | — | | | | (1,773 | ) | | | (1,773 | ) | | | (1,832 | ) | | | (2,359 | ) | | | (2,598 | ) |
Derecognition of regulatory liability | | | — | | | | (150,086 | ) | | | — | | | | — | | | | — | | | | (51,329 | ) | | | (201,415 | ) | | | — | | | | (46,980 | ) | | | (129,452 | ) |
Indemnification assets (concession) | | | | | | | | | | | | | | | | | | | | | | | | | | | — | | | | (153,413 | ) | | | (255,977 | ) | | | (173,819 | ) |
Unrealized foreign exchange variation | | | — | | | | — | | | | — | | | | — | | | | (62,366 | ) | | | — | | | | (62,366 | ) | | | (38,443 | ) | | | (24,915 | ) | | | (9,948 | ) |
Deferred tax liability – swap | | | — | | | | (11,703 | ) | | | — | | | | (372 | ) | | | — | | | | (4,152 | ) | | | (16,227 | ) | | | (14,976 | ) | | | (11,441 | ) | | | (385 | ) |
Deemed Cost | | | — | | | | — | | | | (73,064 | ) | | | — | | | | — | | | | — | | | | (73,064 | ) | | | (82,710 | ) | | | (82,710 | ) | | | (82,710 | ) |
| | | | | | | | | | | | | | | | | | | | | | | | | | | | | | | | | | | | | | | | |
Total | | | — | | | | (161,789 | ) | | | (73,064 | ) | | | (372 | ) | | | (62,366 | ) | | | (57,254 | ) | | | (354,845 | ) | | | (291,374 | ) | | | (424,382 | ) | | | (398,912 | ) |
| | | | | | | | | | | | | | | | | | | | | | | | | | | | | | | | | | | | | | | | |
| | | | | | | |
| | | Enel Brasil | | | Ampla
Energia | | | CDSA | | | CGTF | | | CIEN
(Consolidated) | | | COELCE | | | Consolidated | |
| | | 09/30/2015 | | | 09/30/2015 | | | 09/30/2015 | | | 09/30/2015 | | | 09/30/2015 | | | 09/30/2015 | | | 09/30/2015 | | | 12/31/2014 | | | 12/31/2013 | | | 01/01/2013 | |
Deferred taxes | | | | | | | | | | | | | | | | | | | | | | | | | | | | | | | | | | | | | | | | |
Deferred assets | | | 983 | | | | 244,750 | | | | — | | | | 1,983 | | | | 104,226 | | | | 109,461 | | | | 461,403 | | | | 498,257 | | | | 387,531 | | | | 458,526 | |
Deferred liability | | | — | | | | — | | | | (63,538 | ) | | | — | | | | — | | | | — | | | | (63,538 | ) | | | (73,077 | ) | | | (73,077 | ) | | | (141.406 | ) |
G-43
Enel Brasil S.A.
Notes to the consolidated financial statements (Continued)
September 30, 2015 and 2014, December 31, 2014 and 2013 and January 1st, 2013
(In thousands of reais, unless otherwise stated)
| 14. | Deferred taxes (Continued) |
Changes in the deferred tax balances are shown below:
| | | | | | | | |
| | | Assets | | | Liabilities | |
Balances at January 1, 2013 | | | 716,032 | | | | 398,912 | |
Addition – profit or loss for the year – IR/CSLL | | | 442,461 | | | | 161,179 | |
(Reduction) – profit or loss for the year | | | (395,191 | ) | | | (146,765 | ) |
Additions – comprehensive income | | | (22,779 | ) | | | 11,056 | |
Effects of changes in foreign exchange rates | | | (1,687 | ) | | | — | |
| | | | | | | | |
Balances at December 31, 2013 | | | 738,836 | | | | 424,382 | |
| | | | | | | | |
Addition – profit or loss for the year – IR/CSLL | | | 636,704 | | | | 397,961 | |
(Reduction) – profit or loss for the year | | | (659,965 | ) | | | (512,706 | ) |
Additions – comprehensive income | | | 4,417 | | | | (18,263 | ) |
Effects of changes in foreign exchange rates | | | (3,438 | ) | | | — | |
| | | | | | | | |
Balances at December 31, 2014 | | | 716,554 | | | | 291,374 | |
| | | | | | | | |
Addition – profit or loss for the year – IR/CSLL | | | 78,291 | | | | 100,713 | |
(Reduction) – profit or loss for the year | | | (45,880 | ) | | | (24,281 | ) |
Additions – comprehensive income | | | 1,009 | | | | (12,961 | ) |
Effects of changes in foreign exchange rates | | | 2,736 | | | | — | |
| | | | | | | | |
Balances at September 30, 2015 | | | 752,710 | | | | 354,845 | |
| | | | | | | | |
Technical feasibility studies indicate the recovery of deferred income and social contribution tax assets in accordance to the parameters defined by the standard IAS 12 – Income Taxes (“IAS 12”), which correspond to Management’s best estimate regarding the recovery of such assets. Management’s expectancy of recovery of the deferred tax assets is shown below:
| | | | | | | | | | | | | | | | |
| | | Amount to be realized | |
Year of realization | | 09/30/2015 | | | 12/31/2014 | | | 12/31/2013 | | | 01/01/2013 | |
2013 | | | — | | | | — | | | | — | | | | 93,489 | |
2014 | | | — | | | | — | | | | 73,890 | | | | 95,264 | |
2015 | | | 228,771 | | | | 231,999 | | | | 90,581 | | | | 69,801 | |
2016 | | | 65,321 | | | | 46,698 | | | | 56,637 | | | | 95,106 | |
2017 | | | 48,504 | | | | 35,132 | | | | 57,066 | | | | 79,255 | |
2018 a 2020 | | | 121,205 | | | | 144,531 | | | | 171,274 | | | | 130,788 | |
2021 a 2024 | | | 288,909 | | | | 258,194 | | | | 289,388 | | | | 152,329 | |
| | | | | | | | | | | | | | | | |
Total | | | 752,710 | | | | 716,554 | | | | 738,836 | | | | 716,032 | |
| | | | | | | | | | | | | | | | |
Since the income and social contribution taxable base originates not only from income that could be generated but also from the existence of non-taxable revenue, non- deductible expenses, tax incentives and other variables, there is no direct correlation between net income and the income and social contribution tax income or expenses. As such, expected use of tax credits should not be the only indication of the Enel Group’s future income.
As from 2001, with establishment of the Tax Recovery Program (REFIS), the subsidiary CDSA now determines income and social contribution taxes whereby taxable profit is computed as a percentage of gross revenue (“presumed profits method”), according to liberality provided by Law No. 9,964 of April 10, 2000.
G-44
Enel Brasil S.A.
Notes to the consolidated financial statements (Continued)
September 30, 2015 and 2014, December 31, 2014 and 2013 and January 1st, 2013
(In thousands of reais, unless otherwise stated)
| 14. | Deferred taxes (Continued) |
The deferred tax assets in the subsidiary CDSA in the amount of R$ 9,168 are recorded on remuneration of third party capital applied in construction in progress, which was deferred pursuant to Administrative Rule DNAEE No. 250/85, transferred from CELG upon the split-off that gave origin to the subsidiary CDSA.
The deferred income tax balance was maintained in assets based on future positive income projections prepared by CDSA management, which began, as from the end of the REFIS in 2015, being deducted from the taxable profit calculation, by amounts sufficient to ensure realization of such asset.
The deferred tax liabilities in the subsidiary CDSA was recorded on the value of the effect of the deemed cost of fixed assets in CDSA, in the amount of R$ 73,064 (R$ 82,710 at December 31, 2014, 2013 and January 1st, 2013). The balance relating to such asset started being amortized on 2015, when CDSA started being taxed based on its actual profits after the end of REFIS.
| 15. | Tax credit from merger |
Tax credit arises from the merger operation conducted by COELCE with its parent company Distriluz Energia Elétrica S.A. (at that time), approved at the Special General Meeting of September 27, 1999, grounded on future income during the concession period, and is realized over the period between the merger and December 31, 2027, on a monthly basis, proportionally to projected profitability, as per ANEEL Resolution No. 269, of September 15, 1999.
The accumulated balance will be amortized as follows:
| | | | | | | | | | | | | | | | |
Year | | Amortization
factor | | | Year | | Amortization
factor | | | Year | | Amortization
factor | |
2015 | | | 0,03051 | | | 2021 | | | 0,01792 | | | 2027 | | | 0,01053 | |
2016 | | | 0,02792 | | | 2022 | | | 0,01640 | | | — | | | — | |
2017 | | | 0,02555 | | | 2023 | | | 0,01501 | | | — | | | — | |
2018 | | | 0,02338 | | | 2024 | | | 0,01374 | | | — | | | — | |
2019 | | | 0,02140 | | | 2025 | | | 0,01257 | | | — | | | — | |
2020 | | | 0,01958 | | | 2026 | | | 0,01151 | | | — | | | — | |
On April 26, 2004, ANEEL’s Financial Supervisory Authority issued an Inspection Monitoring Report stating that the capital reserve set up upon merger of Distriluz would not have assets with economic basis as a contra entry and, as such, pursuant to CVM Instruction No. 349/01 (CVM is Securities and Exchange Commission of Brazil), determined that only the portion corresponding to the tax credit resulting from goodwill amortization should be recorded in equity of COELCE, as it understood that only this portion has economic basis.
Given the conclusion of the understanding with ANEEL, at the Special General Meeting of April 28, 2005, the subsidiary COELCE approved the Board’s proposal of observing the regulatory agency’s recommendations, replacing the share split and redemption mechanism, after the risk of tax and corporate questioning and non- compliance with financial covenants with Financial Institutions have been ruled out, and after approval of the proper accounting adjustments by ANEEL, issued by means of Official Letter No. 584/05, of April 14, 2005. These adjustments were also in compliance with the provisions set out in CVM Instruction No. 319/99, as amended by CVM Instruction No. 349/01.
Accordingly, the share split and redemption operations of subsidiary COELCE to remunerate shareholders for decrease in profit caused by goodwill amortization from merger of Distriluz, suspended in 2003, were
G-45
Enel Brasil S.A.
Notes to the consolidated financial statements (Continued)
September 30, 2015 and 2014, December 31, 2014 and 2013 and January 1st, 2013
(In thousands of reais, unless otherwise stated)
| 15. | Tax credit from merger (Continued) |
replaced by provisions of CVM Rule No. 319/99, amended by CVM Rule No. 349/01, which provides for set up of provision on goodwill to be amortized matching against goodwill reserve (capital reserve), in amount which is not a tax benefit for subsidiary COELCE. To recalculate the impact on income of each year, the provision will be reversed to the same extent of amortization of the portion of goodwill for the respective year.
As a result of the aforementioned adjustments, in April 2005, a provision on unamortized goodwill was set up against capital reserve, in an amount that does not represent a tax credit for the subsidiary COELCE.
| | | | | | | | | | | | | | | | |
Tax credit from the incorporated goodwill | | 09/30/2015 | | | 12/31/2014 | | | 12/31/2013 | | | 01/01/2013 | |
Goodwill on acquisition | | | 775,960 | | | | 775,960 | | | | 775,960 | | | | 775,960 | |
Goodwill amortization | | | (602,817 | ) | | | (585,061 | ) | | | (559,198 | ) | | | (530,938 | ) |
Provision on goodwill | | | (429,365 | ) | | | (429,365 | ) | | | (429,365 | ) | | | (429,365 | ) |
Reversal of provision on goodwill | | | 314,842 | | | | 303,121 | | | | 286,052 | | | | 267,401 | |
| | | | | | | | | | | | | | | | |
Tax credit | | | 58,620 | | | | 64,655 | | | | 73,449 | | | | 83,058 | |
| | | | | | | | | | | | | | | | |
Current | | | 7,538 | | | | 8,049 | | | | 8,793 | | | | 9,609 | |
Non-current | | | 51,082 | | | | 56,606 | | | | 64,656 | | | | 73,449 | |
| | | | |
Capital reserve | | 09/30/2015 | | | 12/31/2014 | | | 12/31/2013 | | | 01/01/2013 | |
Merged Goodwill | | | 775,960 | | | | 775,960 | | | | 775,960 | | | | 775,960 | |
(-) Share split and redemption | | | (125,407 | ) | | | (125,407 | ) | | | (125,407 | ) | | | (125,407 | ) |
Provision on goodwill | | | (429,365 | ) | | | (429,365 | ) | | | (429,365 | ) | | | (429,365 | ) |
| | | | | | | | | | | | | | | | |
Balance | | | 221,188 | | | | 221,188 | | | | 221,188 | | | | 221,188 | |
| | | | | | | | | | | | | | | | |
With the new procedure adopted on April 30, 2005, the goodwill reserve recorded in the COELCE’s equity was decreased by R$ 429,365, with the effect of R$ 242,976.
G-46
Enel Brasil S.A.
Notes to the consolidated financial statements (Continued)
September 30, 2015 and 2014, December 31, 2014 and 2013 and January 1st, 2013
(In thousands of reais, unless otherwise stated)
| | | | | | | | | | | | | | | | |
| | | 09/30/2015 | | | 12/31/2014 | | | 12/31/2013 | | | 01/01/2013 | |
Disposal of assets and rights | | | 1,724 | | | | 1,583 | | | | 1,509 | | | | 1,656 | |
Health care plan to retirees | | | 6,453 | | | | 6,492 | | | | 6,422 | | | | 5,990 | |
Collection covenants | | | 40,319 | | | | 52,527 | | | | 35,433 | | | | 32,267 | |
Consumers – services rendered | | | 80,641 | | | | 77,048 | | | | 69,923 | | | | 61,379 | |
Deactivations in progress | | | 17,561 | | | | 50,528 | | | | — | | | | — | |
Expenses to be reimbursed – consumers | | | 3,576 | | | | 3,576 | | | | 3,496 | | | | 3,403 | |
Expenses to be reimbursed – public lighting | | | 2,795 | | | | 2,795 | | | | 2,795 | | | | 2,796 | |
Union | | | 5,658 | | | | 5,658 | | | | 5,658 | | | | 5,658 | |
Services to third parties | | | 18,612 | | | | 13,159 | | | | 4,475 | | | | 5,220 | |
Services in progress | | | 149,191 | | | | 176,099 | | | | 145,829 | | | | 100,902 | |
Supplier credits | | | 74,585 | | | | 16,149 | | | | 5,844 | | | | 6,039 | |
Advances to employees | | | 13,329 | | | | 10,909 | | | | 6,798 | | | | 6,399 | |
Advances to suppliers | | | 27,602 | | | | 6,111 | | | | 6,428 | | | | 12,182 | |
Free Energy | | | 2,732 | | | | 2,742 | | | | 2,775 | | | | 2,796 | |
New business expenses | | | 13,025 | | | | 11,955 | | | | 10,492 | | | | 4,814 | |
Consortium Tapajós | | | 16,921 | | | | 16,920 | | | | — | | | | — | |
Inventories | | | 5,021 | | | | 2,794 | | | | 3,627 | | | | 2,714 | |
Prepaid expenses | | | 9,981 | | | | 9,122 | | | | 15,246 | | | | 7,054 | |
Other | | | 62,199 | | | | 68,210 | | | | 38,240 | | | | 29,527 | |
Provision for losses on realization of other credits | | | (25,691 | ) | | | (24,132 | ) | | | (20,851 | ) | | | (26,763 | ) |
| | | | | | | | | | | | | | | | |
Total | | | 526,234 | | | | 510,245 | | | | 344,139 | | | | 264,033 | |
| | | | | | | | | | | | | | | | |
Current | | | 506,660 | | | | 490,671 | | | | 342,015 | | | | 262,170 | |
Non-current | | | 19,574 | | | | 19,574 | | | | 2,124 | | | | 1,863 | |
Changes in the allowance for doubtful accounts are as follows:
| | | | |
Balance at January 01, 2013 | | | (26,763 | ) |
| | | | |
Addition | | | (2,167 | ) |
Writte-off | | | 8,079 | |
Balance at December 31, 2013 | | | (20,851 | ) |
| | | | |
Addition | | | (3,450 | ) |
Write-off | | | 169 | |
| | | | |
Balance at December 31, 2014 | | | (24,132 | ) |
| | | | |
Addition | | | (1,559 | ) |
| | | | |
Balance at September 30, 2015 | | | (25,691 | ) |
| | | | |
| 17. | Indemnification assets (concession) |
Refers to a portion of investments made and not amortized by the subsidiaries Ampla Energia and COELCE until the end of the respective concessions classified as financial asset since this is an unconditional right to receive cash or other financial asset directly from the granting authority pursuant to IFRIC 12 – Service Concession Arrangements and SIC 19 – Service Concession Arrangements: Disclosures.
G-47
Enel Brasil S.A.
Notes to the consolidated financial statements (Continued)
September 30, 2015 and 2014, December 31, 2014 and 2013 and January 1st, 2013
(In thousands of reais, unless otherwise stated)
| 17. | Indemnification assets (concession) (Continued) |
New Replacement Value – Law No. 12,783/13
On January 11, 2013, Law No. 12,783 (“Law No. 12,783/13”) was enacted and made the Provision Executive Order (MP) No. 579, of September 11, 2012 (“MP No. 579/12”) definitive. This MP provides for the postponing and bidding processes for concession of generation, transmission and distribution of electricity, decrease in sectorial charges, low fees and other matters.
In accordance with this legal provision, the calculation of the value of investments linked to reversible assets, still not amortized or depreciated, for indemnification purposes, must use the VNR, pursuant to the criteria defined in a regulation of the granting authority.
The indemnification will be made based on the portion of the investments linked to reversible assets, still not amortized or depreciated, which had been made in order to ensure that the granted services are continuous and current.
The change in balances related to indemnification assets (concession) is as follows:
| | | | |
Balance at January 01, 2013 | | | 1,638,619 | |
| | | | |
Transfers from intangible assets | | | 170,312 | |
Mark-to-market – indemnification assets | | | 205,165 | |
| | | | |
Balance at December 31, 2013 | | | 2,014,096 | |
| | | | |
Transfers from intangible assets | | | 417,932 | |
Mark-to-market – indemnification assets | | | (306,060 | ) |
| | | | |
Balance at December 31, 2014 | | | 2,125,968 | |
| | | | |
Transfers from intangible assets | | | 204,648 | |
Mark-to-market – indemnification assets | | | 75,722 | |
| | | | |
Balance at September 30, 2015 | | | 2,406,338 | |
| | | | |
The Distribution’s concession of the subsidiaries Ampla Energia and COELCE is not onerous. Accordingly, there are no fixed financial liabilities and payments to be made to the granting authority.
G-48
Enel Brasil S.A.
Notes to the consolidated financial statements (Continued)
September 30, 2015 and 2014, December 31, 2014 and 2013 and January 1st, 2013
(In thousands of reais, unless otherwise stated)
| 18. | Property, plant and equipment |
| | | | | | | | | | | | | | | | | | | | | | | | |
| | | 09/30/2015 | | | 12/31/2014 | | | 12/31/2013 | | | 01/01/2013 | |
| | | Historical
cost | | | Accumulated
depreciation | | | Net value | | | Net value | | | Net value | | | Net value | |
In use | | | | | | | | | | | | | | | | | | | | | | | | |
Transmission | | | | | | | | | | | | | | | | | | | | | | | | |
Land | | | 1,076 | | | | — | | | | 1,076 | | | | 1,076 | | | | 1,076 | | | | 1,076 | |
Buildings | | | 86,360 | | | | (52,911 | ) | | | 33,449 | | | | 35,181 | | | | 37,216 | | | | 40,351 | |
Machinery and equipment | | | 1,217,394 | | | | (730,504 | ) | | | 486,890 | | | | 520,099 | | | | 572,506 | | | | 628,560 | |
Vehicles | | | 2,426 | | | | (1,672 | ) | | | 754 | | | | 861 | | | | 537 | | | | 679 | |
Furniture and fixtures | | | 1,256 | | | | (248 | ) | | | 1,008 | | | | 432 | | | | 361 | | | | 384 | |
Distribution | | | | | | | | | | | | | | | | | | | | | | | | |
Machinery and equipment | | | 62,433 | | | | (39,660 | ) | | | 22,773 | | | | 17,728 | | | | 14,853 | | | | 14,149 | |
Furniture and fixtures | | | 27,361 | | | | (14,903 | ) | | | 12,458 | | | | 10,603 | | | | 8,908 | | | | 7,290 | |
Other goods | | | 24,791 | | | | (15,765 | ) | | | 9,026 | | | | 9,371 | | | | 2,602 | | | | 2,783 | |
Generation | | | | | | | | | | | | | | | | | | | | | | | | |
Land | | | 2,194 | | | | — | | | | 2,194 | | | | 2,194 | | | | 2,194 | | | | 2,194 | |
Reservoirs | | | 243,081 | | | | (162,123 | ) | | | 80,958 | | | | 84,698 | | | | 88,046 | | | | 92,947 | |
Buildings | | | 113,709 | | | | (86,250 | ) | | | 27,459 | | | | 29,391 | | | | 31,875 | | | | 34,437 | |
Machinery and equipment | | | 2,912,897 | | | | (2,031,607 | ) | | | 881,290 | | | | 944,485 | | | | 951,484 | | | | 1,005,806 | |
Vehicles | | | 1,428 | | | | (1,226 | ) | | | 202 | | | | 249 | | | | 219 | | | | 270 | |
Furniture and fixtures | | | 11,764 | | | | (11,525 | ) | | | 239 | | | | 581 | | | | 1,298 | | | | 2,010 | |
| | | | | | |
Commercialization | | | | | | | | | | | | | | | | | | | | | | | | |
Machinery and equipment | | | 5,372 | | | | (5,082 | ) | | | 290 | | | | 652 | | | | 2,196 | | | | 5,621 | |
Furniture and fixtures | | | 7,716 | | | | (3,725 | ) | | | 3,991 | | | | 4,321 | | | | 4,270 | | | | 4,360 | |
| | | | | | |
Administration | | | | | | | | | | | | | | | | | | | | | | | | |
Land | | | 374 | | | | — | | | | 374 | | | | 374 | | | | 374 | | | | 374 | |
Buildings | | | 4,127 | | | | (1,867 | ) | | | 2,260 | | | | 2,395 | | | | 2,572 | | | | 2,752 | |
Machinery and equipment | | | 100,657 | | | | (64,123 | ) | | | 36,534 | | | | 26,225 | | | | 14,484 | | | | 8,129 | |
Vehicles | | | 2,016 | | | | (1,934 | ) | | | 82 | | | | 154 | | | | 342 | | | | 589 | |
Furniture and fixtures | | | 32,335 | | | | (25,090 | ) | | | 7,245 | | | | 7,054 | | | | 3,610 | | | | 4,565 | |
| | | | | | | | | | | | | | | | | | | | | | | | |
Total PPE in use | | | 4,860,767 | | | | (3,250,215 | ) | | | 1,610,552 | | | | 1,698,124 | | | | 1,741,023 | | | | 1,859,326 | |
| | | | | | | | | | | | | | | | | | | | | | | | |
In progress | | | | | | | | | | | | | | | | | | | | | | | | |
Generation | | | 227,236 | | | | — | | | | 227,236 | | | | 152,711 | | | | 132,872 | | | | 72,428 | |
Transmission | | | 76,443 | | | | — | | | | 76,443 | | | | 74,996 | | | | 65,794 | | | | 35,640 | |
Distribution | | | 14,903 | | | | — | | | | 14,903 | | | | 12,010 | | | | 9,880 | | | | 10,532 | |
Commercialization | | | 3,444 | | | | — | | | | 3,444 | | | | 5,101 | | | | 5,484 | | | | 5,638 | |
Administration | | | 21,247 | | | | — | | | | 21,247 | | | | 26,565 | | | | 35,199 | | | | 23,133 | |
| | | | | | | | | | | | | | | | | | | | | | | | |
Total PPE in progress | | | 343,273 | | | | — | | | | 343,273 | | | | 271,383 | | | | 249,229 | | | | 147,371 | |
| | | | | | | | | | | | | | | | | | | | | | | | |
Total property, plant and equipment | | | 5,204,040 | | | | (3,250,215 | ) | | | 1,953,825 | | | | 1,969,507 | | | | 1,990,252 | | | | 2,006,697 | |
| | | | | | | | | | | | | | | | | | | | | | | | |
G-49
Enel Brasil S.A.
Notes to the consolidated financial statements (Continued)
September 30, 2015 and 2014, December 31, 2014 and 2013 and January 1st, 2013
(In thousands of reais, unless otherwise stated)
| 18. | Property, plant and equipment (Continued) |
Changes in property, plant and equipment in the year are as follows:
| | | | | | | | | | | | | | | | | | | | |
| | | In use | | | In progress | | | | |
| | | Cost | | | Accumulated
depreciation | | | Net
balance | | | Cost | | | Total | |
Balances at January 01, 2013 | | | 4,666,952 | | | | (2,807,626 | ) | | | 1,859,326 | | | | 147,371 | | | | 2,006,697 | |
Transfers | | | 40,805 | | | | — | | | | 40,805 | | | | (40,805 | ) | | | — | |
Additions | | | 1,356 | | | | — | | | | 1,356 | | | | 143,071 | | | | 144,427 | |
Write-offs | | | (167 | ) | | | 73 | | | | (94 | ) | | | (408 | ) | | | (502 | ) |
Depreciation | | | — | | | | (156,274 | ) | | | (156,274 | ) | | | — | | | | (156,274 | ) |
Effects of changes in foreign exchange rates | | | (9,281 | ) | | | 5,185 | | | | (4,096 | ) | | | — | | | | (4,096 | ) |
| | | | | | | | | | | | | | | | | | | | |
Balances at December 31, 2013 | | | 4,699,665 | | | | (2,958,642 | ) | | | 1,741,023 | | | | 249,229 | | | | 1,990,252 | |
| | | | | | | | | | | | | | | | | | | | |
Transfers | | | 114,710 | | | | — | | | | 114,710 | | | | (114,710 | ) | | | — | |
Additions | | | 5,500 | | | | — | | | | 5,500 | | | | 139,570 | | | | 145,070 | |
Reclassifications | | | 5,478 | | | | (7,060 | ) | | | (1,582 | ) | | | (2,706 | ) | | | (4,288 | ) |
Write-offs | | | (3,828 | ) | | | 3,803 | | | | (25 | ) | | | | | | | (25 | ) |
Depreciation | | | | | | | (158,550 | ) | | | (158,550 | ) | | | — | | | | (158,550 | ) |
Effects of changes in foreign exchange rates | | | (6,988 | ) | | | 4,036 | | | | (2,952 | ) | | | — | | | | (2,952 | ) |
| | | | | | | | | | | | | | | | | | | | |
Balances at December 31, 2014 | | | 4,814,537 | | | | (3,116,413 | ) | | | 1,698,124 | | | | 271,383 | | | | 1,969,507 | |
| | | | | | | | | | | | | | | | | | | | |
Transfers | | | 28,750 | | | | — | | | | 28,750 | | | | (28,750 | ) | | | — | |
Additions | | | 135 | | | | — | | | | 135 | | | | 96,855 | | | | 96,990 | |
Reclassifications | | | — | | | | 184 | | | | 184 | | | | 3,985 | | | | 4,169 | |
Write-offs | | | — | | | | — | | | | — | | | | (200 | ) | | | (200 | ) |
Depreciation | | | — | | | | (122,116 | ) | | | (122,116 | ) | | | — | | | | (122,116 | ) |
Effects of changes in foreign exchange rates | | | 17,345 | | | | (11,870 | ) | | | 5,475 | | | | — | | | | 5,475 | |
| | | | | | | | | | | | | | | | | | | | |
Balances at September 30, 2015 | | | 4,860,767 | | | | (3,250,215 | ) | | | 1,610,552 | | | | 343,273 | | | | 1,953,825 | |
| | | | | | | | | | | | | | | | | | | | |
Property, plant and equipment of Enel Group are comprised by the balances in subsidiaries CGTF, CDSA and CIEN, in accordance with the characteristics of each one of them.
CGTF
The period over which the subsidiary CGTF is authorized to explore the activities described in its articles of incorporation is thirty years, as mentioned in article 5 of ANEEL Resolution nº 433, of October 19, 2001, as from the date thereof. Under this same article, this period may be extended at ANEEL’s discretion and by request of the authorized entity. CGTF’s property and equipment items are not considered reversible assets and, as such, they are not returned to the Federal Government at the end of the concession period.
These items are stated at acquisition or construction cost, less accumulated depreciation, calculated on a straight-line basis, at the rates defined by ANEEL.
G-50
Enel Brasil S.A.
Notes to the consolidated financial statements (Continued)
September 30, 2015 and 2014, December 31, 2014 and 2013 and January 1st, 2013
(In thousands of reais, unless otherwise stated)
| 18. | Property, plant and equipment (Continued) |
CGTF (Continued)
The main annual depreciation rates by macro activity, pursuant to ANEEL Resolution Normative nº 474/2012 are as follows:
| | | | |
| | | Annual
Depreciation
rate (%) | |
Generation | | | | |
Boiler | | | 4.00 | % |
Chimney | | | 4.00 | % |
Thermal cycle equipment | | | 4.55 | % |
Equipment support structure | | | 3.13 | % |
Generator | | | 3.33 | % |
Panel and control desk | | | 3.57 | % |
Reservoir, dam and pipeline | | | 2.00 | % |
Unit substation | | | 3.57 | % |
Power transformer | | | 2.86 | % |
Auxiliary transformer | | | 3.33 | % |
Turbo-generator | | | 4.00 | % |
| |
Administration | | | | |
General equipment | | | 6.25 | % |
General computer equipment | | | 16.67 | % |
Vehicles | | | 14.29 | % |
CDSA
CDSA’s property, plant and equipment items are stated at deemed cost, less accumulated depreciation, calculated on a straight-line basis, at the rates defined by ANEEL.
The Enel Group’s management understands that as the subsidiary CDSA is a public service concession operator, at the end of the concession period, non-depreciated assets will be indemnified for the minimum amount at the net book value, by the concession provider, should it not be renewed. Pursuant to articles 63 and 64 of Decree No. 41,019, of February 26, 1957, assets and facilities used for electric energy production, transmission and distribution, including sale, are tied to these services, and may not be disassembled, sold or assigned without prior express authorization from the regulating authorities.
Pursuant to sub-clauses two and three of clause eleven of the Concession Agreement No.11/1997, entered into between CDSA and ANEEL on September 12, 1997, upon termination of the final term of the Concession Agreement, assets and facilities related to independent production of electric energy used in hydroelectric plants, will be included as Federal Government’s assets, with indemnity of investments made and not yet amortized, provided that they are authorized and calculated by means of ANEEL audit.
G-51
Enel Brasil S.A.
Notes to the consolidated financial statements (Continued)
September 30, 2015 and 2014, December 31, 2014 and 2013 and January 1st, 2013
(In thousands of reais, unless otherwise stated)
| 18. | Property, plant and equipment (Continued) |
CDSA (Continued)
The main annual depreciation rates by macro activity, pursuant to ANEEL Resolution Normative nº 474/2012 are shown below:
| | | | |
| | | Annual
depreciation
rate (%) | |
Generation | | | | |
Boiler | | | 4.00 | % |
Chimney | | | 4.00 | % |
Thermal cycle equipment | | | 4.55 | % |
Equipment support structure | | | 3.13 | % |
Generator | | | 3.33 | % |
Panel and control desk | | | 3.57 | % |
Reservoir, dam and pipeline | | | 2.00 | % |
Unit substation | | | 3.57 | % |
Power transformer | | | 2.86 | % |
Auxiliary transformer | | | 3.33 | % |
Turbo-generator | | | 4.00 | % |
| |
Administration | | | | |
General equipment | | | 6.25 | % |
General computer equipment | | | 16.67 | % |
Vehicles | | | 14.29 | % |
CIEN
Property and equipment items are stated at acquisition or construction cost, less accumulated depreciation, calculated at the rates defined by ANEEL.
Pursuant to articles 63 and 64 of Decree Nº 41,019, of February 26, 1957, the assets and installations used in production, transmission, distribution, including sale, are linked to these services, and cannot be separated, sold or assigned without the previous and express authorization by the Regulator.
G-52
Enel Brasil S.A.
Notes to the consolidated financial statements (Continued)
September 30, 2015 and 2014, December 31, 2014 and 2013 and January 1st, 2013
(In thousands of reais, unless otherwise stated)
| 18. | Property, plant and equipment (Continued) |
CIEN (Continued)
The main annual depreciation rates by macro activity, pursuant to ANEEL Resolution Normative nº 474/2012 are shown below:
| | | | |
| | | Annual
depreciation
rate (%) | |
Transmission | | | | |
Capacitor bank | | | 5.00 | % |
Barring | | | 2.50 | % |
Switch | | | 3.33 | % |
Conductor | | | 2.70 | % |
Circuit breaker | | | 3.03 | % |
Frequency changer | | | 6.67 | % |
Structure (Pole, tower) | | | 2.70 | % |
Panel, Control desk and Cubicle | | | 3.57 | % |
Reactor (Resistor) | | | 2.78 | % |
Power transformer | | | 2.86 | % |
Auxiliary transformer | | | 3.33 | % |
| |
Administration | | | | |
General equipment | | | 6.25 | % |
Vehicles | | | 14.29 | % |
Intangible assets are broken down by nature as follows:
| | | | | | | | | | | | | | | | | | | | | | | | | | | | | | | | |
| | | | | | 09/30/2015 | | | 12/31/2014 | | | 12/31/2013 | | | 01/01/2013 | |
| | | Useful life
years | | | Cost | | | Accumulated
amortization | | | Special
obligations | | | Net value | | | Net value | | | Net value | | | Net value | |
In operation | | | 5 | % | | | | | | | | | | | | | | | | | | | | | | | | | | | | |
Concession right-of-use | | | | | | | 8,253,904 | | | | (3,912,994 | ) | | | (549,155 | ) | | | 3,791,755 | | | | 3,684,950 | | | | 3,483,337 | | | | 3,506,760 | |
Software | | | | | | | 311,329 | | | | (198,340 | ) | | | — | | | | 112,989 | | | | 117,842 | | | | 50,937 | | | | 25,171 | |
(-) Impairment | | | | | | | — | | | | — | | | | — | | | | — | | | | — | | | | (10,919 | ) | | | — | |
Concession right from acquisition | | | | | | | 435,755 | | | | (252,928 | ) | | | — | | | | 182,827 | | | | 200,278 | | | | 222,900 | | | | 247,620 | |
Goodwill | | | | | | | 2,104 | | | | — | | | | — | | | | 2,104 | | | | 2,104 | | | | 2,104 | | | | 2,104 | |
Trademarks and patents | | | | | | | — | | | | — | | | | — | | | | — | | | | — | | | | 137 | | | | 203 | |
| | | | | | | | |
In progress | | | | | | | | | | | | | | | | | | | | | | | | | | | | | | | | |
Concession right-of-use | | | | | | | 990,673 | | | | — | | | | (285,366 | ) | | | 705,307 | | | | 438,289 | | | | 776,922 | | | | 758,678 | |
Software | | | | | | | 35,740 | | | | — | | | | — | | | | 35,740 | | | | 44,946 | | | | 66,183 | | | | 49,434 | |
Other | | | | | | | 1,952 | | | | — | | | | — | | | | 1,952 | | | | 1,597 | | | | 4,352 | | | | 9,251 | |
| | | | | | | | | | | | | | | | | | | | | | | | | | | | | | | | |
Total | | | | | | | 10,031,457 | | | | (4,364,264 | ) | | | (834,521 | ) | | | 4,832,674 | | | | 4,490,006 | | | | 4,606,872 | | | | 4,599,221 | |
| | | | | | | | | | | | | | | | | | | | | | | | | | | | | | | | |
Intangible assets in progress refer substantially to expansion works in the electricity distribution system recognized to the extent that the Company is entitled to charge for services provided to utilities consumers.
G-53
Enel Brasil S.A.
Notes to the consolidated financial statements (Continued)
September 30, 2015 and 2014, December 31, 2014 and 2013 and January 1st, 2013
(In thousands of reais, unless otherwise stated)
| 19. | Intangible assets (Continued) |
Changes in intangible assets are shown below:
| | | | | | | | | | | | | | | | | | | | | | | | | | | | | | | | |
| | | In operation | | | In progress | |
| | | Cost | | | Accumulated
amortization | | | Special
obligations | | | Net value | | | Cost | | | Special
obligations | | | Net value | | | Total | |
Balances at January 01, 2013 | | | 7,963,186 | | | | (3,526,844 | ) | | | (654,484 | ) | | | 3,781,858 | | | | 1,052,839 | | | | (235,476 | ) | | | 817,363 | | | | 4,599,221 | |
Additions | | | — | | | | — | | | | — | | | | — | | | | 738,016 | | | | (39,318 | ) | | | 698,698 | | | | 698,698 | |
Write-offs | | | (267,395 | ) | | | 149,042 | | | | — | | | | (118,353 | ) | | | (849 | ) | | | — | | | | (849 | ) | | | (119,202 | ) |
Amortization | | | — | | | | (425,511 | ) | | | 39,124 | | | | (386,387 | ) | | | — | | | | — | | | | — | | | | (386,387 | ) |
Reclassification | | | | | | | | | | | | | | | | | | | (4,154 | ) | | | — | | | | (4,154 | ) | | | (4,154 | ) |
Transfers | | | 668,561 | | | | — | | | | (4,960 | ) | | | 663,601 | | | | (668,561 | ) | | | 4,960 | | | | (663,601 | ) | | | — | |
Transfers to indemnification assets | | | (170,312 | ) | | | — | | | | — | | | | (170,312 | ) | | | — | | | | — | | | | — | | | | (170,312 | ) |
Effects of changes in foreign exchange rates | | | (559 | ) | | | 486 | | | | — | | | | (73 | ) | | | — | | | | — | | | | — | | | | (73 | ) |
(-) Impairment | | | (21,930 | ) | | | 11,011 | | | | — | | | | (10,919 | ) | | | — | | | | — | | | | — | | | | (10,919 | ) |
| | | | | | | | | | | | | | | | | | | | | | | | | | | | | | | | |
Balances at December 31, 2013 | | | 8,171,551 | | | | (3,791,816 | ) | | | (620,320 | ) | | | 3,759,415 | | | | 1,117,291 | | | | (269,834 | ) | | | 847,457 | | | | 4,606,872 | |
Additions | | | — | | | | — | | | | — | | | | — | | | | 814,722 | | | | (50,156 | ) | | | 764,566 | | | | 764,566 | |
Write-offs | | | (232,050 | ) | | | 175,757 | | | | — | | | | (56,293 | ) | | | — | | | | — | | | | — | | | | (56,293 | ) |
Amortization | | | — | | | | (452,963 | ) | | | 43,917 | | | | (409,046 | ) | | | — | | | | — | | | | — | | | | (409,046 | ) |
Reclassification | | | (5,478 | ) | | | 7,060 | | | | — | | | | 1.582 | | | | 310 | | | | — | | | | 310 | | | | 1.892 | |
Transfers | | | 1,202,020 | | | | — | | | | (74,519 | ) | | | 1,127,501 | | | | (1,202,020 | ) | | | 74,519 | | | | (1,127,501 | ) | | | — | |
Transfers to indemnification assets | | | (417,932 | ) | | | — | | | | — | | | | (417,932 | ) | | | — | | | | — | | | | — | | | | (417,932 | ) |
Effects of changes in foreign exchange rates | | | (420 | ) | | | 367 | | | | — | | | | (53 | ) | | | — | | | | — | | | | — | | | | (53 | ) |
| | | | | | | | | | | | | | | | | | | | | | | | | | | | | | | | |
Balances at December 31, 2014 | | | 8,717,691 | | | | (4,061,595 | ) | | | (650,922 | ) | | | 4,005,174 | | | | 730,303 | | | | (245,471 | ) | | | 484,832 | | | | 4,490,006 | |
Additions | | | 1,097 | | | | — | | | | — | | | | 1,097 | | | | 837,299 | | | | (43,588 | ) | | | 793,711 | | | | 794,808 | |
Write-offs | | | (45,014 | ) | | | 26,617 | | | | 69,858 | | | | 51,461 | | | | — | | | | — | | | | — | | | | 51,461 | |
Amortization | | | — | | | | (328,848 | ) | | | 34,040 | | | | (294,808 | ) | | | — | | | | — | | | | — | | | | (294,808 | ) |
Reclassification | | | 200 | | | | (436 | ) | | | — | | | | (236 | ) | | | (3,909 | ) | | | — | | | | (3,909 | ) | | | (4,145 | ) |
Transfers | | | 535,328 | | | | — | | | | (3,693 | ) | | | 531,635 | | | | (535,328 | ) | | | 3,693 | | | | (531,635 | ) | | | — | |
Transfers to indemnification assets | | | (206,210 | ) | | | — | | | | 1,562 | | | | (204,648 | ) | | | — | | | | — | | | | — | | | | (204,648 | ) |
| | | | | | | | | | | | | | | | | | | | | | | | | | | | | | | | |
Balances at September 30, 2015 | | | 9,003,092 | | | | (4,364,262 | ) | | | (549,155 | ) | | | 4,089,675 | | | | 1,028,365 | | | | (285,366 | ) | | | 742,999 | | | | 4,832,674 | |
| | | | | | | | | | | | | | | | | | | | | | | | | | | | | | | | |
ANEEL is responsible for establishing the estimated economic useful life of each distribution-related infrastructure asset, in order to determine the tariff and calculate the indemnity of reversible assets upon termination of the concession period. This estimate is periodically reviewed and accepted by the market as a reasonable and adequate estimate for accounting and regulatory purposes, representing the best estimate of useful life of assets.
Enel Group’s management understands that amortization of intangible assets must observe the estimated useful life of each asset of the distribution infrastructure, as defined by ANEEL for purposes of pricing and compensating reversible assets. In connection with the use of such amortization criterion, total intangible assets will be amortized on a straight-line basis and limited to the remaining time of the concession contract entered into by the Company. Such intangible assets are valued at the acquisition cost, net of accumulated amortization and impairment losses, where applicable.
The net book value of each asset exceeding the deadline of the concession is allocated as Financial Asset pursuant to Law Nº 12,783. See also Note 17.
G-54
Enel Brasil S.A.
Notes to the consolidated financial statements (Continued)
September 30, 2015 and 2014, December 31, 2014 and 2013 and January 1st, 2013
(In thousands of reais, unless otherwise stated)
| 19. | Intangible assets (Continued) |
Special obligations linked to the concession of public electric energy services
Obligations linked to the concession of public electric energy services represent amounts from the Federal Government, States, municipalities and consumers, as well as donations not conditional upon any return in favor of the donor and subsidies intended for investments in the distribution activity. According to Circular Letter No. 1,314/2007-SFF/ANEEL, of June 27, 2007, which determines that this registration begins only after the Company’s second tariff review, the amortization started to be recorded in April 2009, based on an average rate.
The obligations linked to concessions, undergoes amortization as from the second tariff review cycle, at the same amortization rates as infrastructure assets of each distribution company, and the average rates of 4.10% p.a. and 3.98% p.a. are adopted for subsidiaries Ampla Energia and COELCE, respectively.
At the end of the concession period, the net replacement value of obligations linked to the concession of public electric energy services will be deducted from the indemnification asset.
| 20. | Trade accounts payable and notes payable |
| | | | | | | | | | | | | | | | |
| | | 09/30/2015 | | | 12/31/2014 | | | 12/31/2013 | | | 01/01/2013 | |
Energy supply and transportation | | | | | | | | | | | | | | | | |
Energy purchase | | | 941,373 | | | | 760,160 | | | | 406,302 | | | | 409,457 | |
Companhia de Gás do Ceará – CEGÁS | | | 38,308 | | | | 27,612 | | | | 24,172 | | | | 20,239 | |
Diferencial Eletronuclear | | | 4,660 | | | | 21,373 | | | | 39,458 | | | | — | |
Charge for network use | | | 28,527 | | | | 26,325 | | | | 20,314 | | | | 52,316 | |
Generation – Free energy | | | 22,849 | | | | 17,942 | | | | 5,602 | | | | 5,177 | |
Related parties (a) | | | 185,095 | | | | 125,414 | | | | 136,578 | | | | 127,882 | |
Notes payable (b) | | | 101,428 | | | | 84,000 | | | | — | | | | — | |
Derivative financial instruments – loss on swap (gas purchase) | | | 2,367 | | | | — | | | | — | | | | — | |
Other | | | 5,581 | | | | 5,051 | | | | 39,853 | | | | 47,082 | |
Materials and services | | | 424,484 | | | | 316,942 | | | | 321,628 | | | | 261,562 | |
| | | | | | | | | | | | | | | | |
Total | | | 1,754,672 | | | | 1,384,819 | | | | 993,907 | | | | 923,715 | |
| | | | | | | | | | | | | | | | |
Current | | | 1,571,760 | | | | 1,258,456 | | | | 847,571 | | | | 796,962 | |
Non-current | | | 182,912 | | | | 126,363 | | | | 146,336 | | | | 126,753 | |
| (a) | Terms and conditions involving related parties are presented in Note 28. |
| (b) | On September, 2015, subsidiary CGTF and Banco Itaú BBA S.A. (“Banco Itaú”) entered into a credit assignment agreement without right of recourse for a maximum R$ 101,428, transferring to Banco Itaú the partial right to credit due in connection with the electric energy supply service provided to Coelce regarding to the invoices. In order to advance receivables from Coelce, subsidiary CGTF used R$ 101,428 available in the credit assignment agreement entered into, which will be settled on the due date of each invoice. |
G-55
Enel Brasil S.A.
Notes to the consolidated financial statements (Continued)
September 30, 2015 and 2014, December 31, 2014 and 2013 and January 1st, 2013
(In thousands of reais, unless otherwise stated)
Loans and financing in local and foreign currencies are as follows:
| | | | | | | | | | | | | | | | | | | | | | | | |
| | | Debt charges | | | Principal | |
| | | Current | | | Current | | | Non-current | |
| | | 09/30/2015 | | | 12/31/2014 | | | 09/30/2015 | | | 12/31/2014 | | | 09/30/2015 | | | 12/31/2014 | |
Foreign currency: | | | | | | | | | | | | | | | | | | | | | | | | |
Federal Government – Discount bonus (a) | | | 30 | | | | 9 | | | | — | | | | — | | | | 4,534 | | | | 3,031 | |
Federal Government – Participant bonus (a) | | | 185 | | | | 56 | | | | — | | | | — | | | | 6,497 | | | | 4,344 | |
| | | | | | | | | | | | | | | | | | | | | | | | |
Total foreign currency: | | | 215 | | | | 65 | | | | — | | | | — | | | | 11,031 | | | | 7,375 | |
| | | | | | | | | | | | | | | | | | | | | | | | |
Local currency: | | | | | | | | | | | | | | | | | | | | | | | | |
Eletrobras (b) | | | — | | | | 16 | | | | 9,396 | | | | 10,212 | | | | 39,543 | | | | 52,006 | |
Banco do Nordeste – Proinfa (c) | | | 235 | | | | 304 | | | | 21,237 | | | | 21,237 | | | | 53,094 | | | | 69,022 | |
BNDES FINAME 2012-2013 (d) | | | 39 | | | | 46 | | | | 4,121 | | | | 4,121 | | | | 27,818 | | | | 30,909 | |
BNDES FINEM 2012-2013 A (d) | | | 217 | | | | 238 | | | | 12,975 | | | | 12,960 | | | | 48,657 | | | | 58,318 | |
BNDES FINEM 2012-2013 B (d) | | | 241 | | | | 268 | | | | 12,975 | | | | 12,960 | | | | 48,657 | | | | 58,319 | |
Itaú CCB (e) | | | 618 | | | | 5,070 | | | | — | | | | — | | | | 150,000 | | | | 150,000 | |
BNDES (Finame) (f) | | | 3 | | | | 2 | | | | 561 | | | | 236 | | | | 2,103 | | | | 1,063 | |
BNDES (Finame Seccionamento) (g) | | | 66 | | | | 39 | | | | 4,233 | | | | 2,115 | | | | 15,872 | | | | 9,516 | |
BNDES (Capex 2011) (h) | | | 203 | | | | 245 | | | | 10,139 | | | | 10,139 | | | | 48,160 | | | | 55,765 | |
BNDES (Capex 2011) (h) | | | 190 | | | | 230 | | | | 19,328 | | | | 19,305 | | | | 33,825 | | | | 48,263 | |
BNDES (Capex 2011) (h) | | | 211 | | | | 258 | | | | 19,328 | | | | 19,305 | | | | 33,825 | | | | 48,263 | |
BNDES (Capex 2012-2013) (i) | | | 78 | | | | 92 | | | | 8,256 | | | | 8,297 | | | | 55,041 | | | | 61,539 | |
BNDES (Capex 2012-2013) (i) | | | 392 | | | | 431 | | | | 23,472 | | | | 23,412 | | | | 88,018 | | | | 105,356 | |
BNDES (Capex 2012-2013) (i) | | | 435 | | | | 484 | | | | 23,472 | | | | 23,412 | | | | 88,018 | | | | 105,356 | |
Eletrobras (j) | | | 11 | | | | 2 | | | | 2,940 | | | | 2,941 | | | | 8,719 | | | | 10,923 | |
Eletrobras (k) | | | — | | | | 2 | | | | 2,806 | | | | 2,655 | | | | 5,132 | | | | 7,268 | |
Banco do Brasil (BB Agropecuário) (l) | | | 17,210 | | | | 4,692 | | | | — | | | | — | | | | 300,000 | | | | 300,000 | |
Banco do Brasil S.A (l) | | | 5,460 | | | | 1,384 | | | | — | | | | — | | | | 100,000 | | | | 100,000 | |
Banco do Brasil S.A (l) | | | 1,522 | | | | 320 | | | | — | | | | — | | | | 30,000 | | | | 30,000 | |
Working Capital Bradesco (m) | | | 4 | | | | — | | | | 50,610 | | | | — | | | | — | | | | — | |
| | | | | | | | | | | | | | | | | | | | | | | | |
Total local currency | | | 27,135 | | | | 14,123 | | | | 225,849 | | | | 173,307 | | | | 1,176,482 | | | | 1,301,886 | |
| | | | | | | | | | | | | | | | | | | | | | | | |
Total local currency, net of transaction costs | | | 27,135 | | | | 14,123 | | | | 225,849 | | | | 173,307 | | | | 1,176,482 | | | | 1,301,886 | |
| | | | | | | | | | | | | | | | | | | | | | | | |
Total with no effect of swap transactions | | | 27,350 | | | | 14,188 | | | | 225,849 | | | | 173,307 | | | | 1,187,513 | | | | 1,309,261 | |
| | | | | | | | | | | | | | | | | | | | | | | | |
Total loans and financing | | | 27,350 | | | | 14,188 | | | | 225,849 | | | | 173,307 | | | | 1,187,513 | | | | 1,309,261 | |
| | | | | | | | | | | | | | | | | | | | | | | | |
G-56
Enel Brasil S.A.
Notes to the consolidated financial statements (Continued)
September 30, 2015 and 2014, December 31, 2014 and 2013 and January 1st, 2013
(In thousands of reais, unless otherwise stated)
| 21. | Loans and financing (Continued) |
| | | | | | | | | | | | | | | | | | | | | | | | |
| | | Debt charges | | | Principal | |
| | | Current | | | Current | | | Non-current | |
| | | 12/31/2013 | | | 01/01/2013 | | | 12/31/2013 | | | 01/01/2013 | | | 12/31/2013 | | | 01/01/2013 | |
Foreign currency: | | | | | | | | | | | | | | | | | | | | | | | | |
Federal Government – Capitalization bonus (a) | | | 3 | | | | 7 | | | | 163 | | | | 284 | | | | — | | | | 142 | |
Federal Government – Discount bonus (a) | | | 8 | | | | 8 | | | | — | | | | — | | | | 2,673 | | | | 2,332 | |
Federal Government – Participant bonus (a) | | | 49 | | | | 44 | | | | — | | | | — | | | | 3,831 | | | | 3,342 | |
IFC – A (n) | | | 185 | | | | 182 | | | | 12,570 | | | | 10,208 | | | | 43,589 | | | | 48,989 | |
IFC – B (n) | | | (29 | ) | | | — | | | | 19,745 | | | | 16,075 | | | | 21,157 | | | | 35,680 | |
IFC – C (n) | | | 82 | | | | 67 | | | | — | | | | — | | | | 16,399 | | | | 14,305 | |
| | | | | | | | | | | | | | | | | | | | | | | | |
Total foreign currency: | | | 298 | | | | 308 | | | | 32,478 | | | | 26,567 | | | | 87,649 | | | | 104,790 | |
| | | | | | | | | | | | | | | | | | | | | | | | |
Local currency: | | | | | | | | | | | | | | | | | | | | | | | | |
Eletrobras (b) | | | 13 | | | | 15 | | | | 11,177 | | | | 13,338 | | | | 68,315 | | | | 74,858 | |
Federal Government – Law No. 8,727 (Caixa Econômica Federal) (o) | | | 1 | | | | 3 | | | | 76 | | | | 287 | | | | — | | | | 76 | |
Federal Government – Law No. 8,727 (Eletrobras) (o) | | | 25 | | | | 114 | | | | 3,092 | | | | 11,008 | | | | — | | | | 2,931 | |
Banco do Brasil (BB Fat Fomentar) | | | 2 | | | | 10 | | | | 936 | | | | 5,343 | | | | — | | | | 891 | |
Banco do Nordeste – Proinfa (c) | | | 412 | | | | 455 | | | | 61,315 | | | | 33,667 | | | | 90,259 | | | | 151,574 | |
BNDES Finem 2007 (Syndicate loan) (p) | | | 171 | | | | 337 | | | | 49,106 | | | | 49,106 | | | | — | | | | 49,106 | |
BNDES FINAME 2012-2013 (d) | | | 46 | | | | — | | | | 2,061 | | | | — | | | | 35,031 | | | | — | |
BNDES FINEM 2012-2013 A (d) | | | 244 | | | | — | | | | 6,480 | | | | — | | | | 71,278 | | | | — | |
BNDES FINEM 2012-2013 B (d) | | | 273 | | | | — | | | | 6,480 | | | | — | | | | 71,278 | | | | — | |
BNDES PEC (q) | | | — | | | | 9 | | | | — | | | | 2,328 | | | | — | | | | — | |
BNDES (Finame) (f) | | | 3 | | | | 7 | | | | 1,884 | | | | 2,214 | | | | — | | | | 1,884 | |
BNDES (Capex 2011) (h) | | | 265 | | | | 280 | | | | 10,139 | | | | 10,210 | | | | 65,904 | | | | 75,942 | |
BNDES (Capex 2011) (h) | | | 278 | | | | 341 | | | | 19,305 | | | | 19,324 | | | | 67,568 | | | | 86,846 | |
BNDES (Capex 2011) (h) | | | 311 | | | | 379 | | | | 19,305 | | | | 19,324 | | | | 67,568 | | | | 86,846 | |
BNDES (Capex 2012-2013) (i) | | | 91 | | | | — | | | | 4,149 | | | | — | | | | 69,836 | | | | — | |
BNDES (Capex 2012-2013) (i) | | | 440 | | | | — | | | | 11,706 | | | | — | | | | 128,768 | | | | — | |
BNDES (Capex 2012-2013) (i) | | | 495 | | | | — | | | | 11,706 | | | | — | | | | 128,768 | | | | — | |
Eletrobras (j) | | | 3 | | | | 3 | | | | 2,940 | | | | 2,940 | | | | 13,865 | | | | 16,804 | |
Eletrobras (k) | | | 2 | | | | 2 | | | | 2,650 | | | | 536 | | | | 9,917 | | | | 10,169 | |
Bradesco S.A. 4th, 5th and 6th agreements (m) | | | — | | | | 795 | | | | — | | | | 20,000 | | | | — | | | | — | |
Banco do Brasil S.A (l) | | | — | | | | 612 | | | | — | | | | 100,000 | | | | — | | | | — | |
Banco do Brasil S.A (l) | | | 1,142 | | | | — | | | | — | | | | — | | | | 100,000 | | | | — | |
Banco do Brasil S.A (l) | | | 251 | | | | — | | | | — | | | | — | | | | 30,000 | | | | — | |
| | | | | | | | | | | | | | | | | | | | | | | | |
Total local currency | | | 4,468 | | | | 3,362 | | | | 224,507 | | | | 289,625 | | | | 1,018,355 | | | | 557,927 | |
| | | | | | | | | | | | | | | | | | | | | | | | |
Transaction costs | | | — | | | | — | | | | (193 | ) | | | (285 | ) | | | — | | | | (193 | ) |
Total local currency, net of transaction costs | | | 4,468 | | | | 3,362 | | | | 224,314 | | | | 289,340 | | | | 1,018,355 | | | | 557,734 | |
| | | | | | | | | | | | | | | | | | | | | | | | |
Total with no effect of swap transactions | | | 4,766 | | | | 3,670 | | | | 256,792 | | | | 315,907 | | | | 1,106,004 | | | | 662,524 | |
Swap transaction gain/losses | | | 93 | | | | 110 | | | | — | | | | — | | | | 7,452 | | | | 14,809 | |
| | | | | | | | | | | | | | | | | | | | | | | | |
Total loans and financing | | | 4,859 | | | | 3,780 | | | | 256,792 | | | | 315,907 | | | | 1,113,456 | | | | 677,333 | |
| | | | | | | | | | | | | | | | | | | | | | | | |
G-57
Enel Brasil S.A.
Notes to the consolidated financial statements (Continued)
September 30, 2015 and 2014, December 31, 2014 and 2013 and January 1st, 2013
(In thousands of reais, unless otherwise stated)
| 21. | Loans and financing (Continued) |
| | | | | | | | | | |
Banks | | Start date | | Maturity | | Type of
amortization | | Guarantees | | Financial charges |
Foreign Currency: | | | | | | | | | | |
Federal Government – Discount bonus (a) | | 08/15/1997 | | 04/11/2024 | | At the end | | Receivables and secured account | | USD + Libor + 1.0125% p.a. |
Federal Government – Participant bonus (a) | | 08/15/1997 | | 04/11/2024 | | At the end | | Receivables and secured account | | USD + 6.2% p.a. |
National Currency | | | | | | | | | | |
Eletrobras (b) | | 03/3/2000 | | 09/30/2023 | | Monthly | | Receivables and promissory note | | 6.00% p.a. |
Banco do Nordeste – FNE (c) | | 12/29/2004 | | 03/15/2019 | | Monthly | | Guarantee and secured account | | 10% p.a. |
BNDES FINAME 2012-2013 (d) | | 08/28/2013 | | 06/15/2023 | | Monthly | | Receivables and secured account | | 3.00% p.a. |
BNDES FINEM 2012-2013 A (d) | | 08/28/2013 | | 06/15/2020 | | Monthly | | Receivables and secured account | | TJLP + 2.8% p.a. |
BNDES FINEM 2012-2013 B (d) | | 08/28/2013 | | 06/15/2020 | | Monthly | | Receivables and secured account | | TJLP + 3.8% p.a. |
Itaú CCB (e) | | 03/20/2014 | | 03/20/2019 | | Monthly | | — | | 112%CDI |
BNDES (Finame) (f) | | 03/24/2014 | | 06/15/2020 | | Monthly | | Receivables | | 3,5% |
BNDES (Finame seccionamento) (g) | | 03/24/2014 | | 06/15/2020 | | Monthly | | Receivables | | TJLP + 2.8% |
BNDES (Capex 2011) (h) | | 08/15/2011 | | 06/15/2021 | | Monthly | | Receivables | | 0.087 |
BNDES (Capex 2011) (h) | | 08/15/2011 | | 06/15/2018 | | Monthly | | Receivables | | TJLP + 2.96% |
BNDES (Capex 2011) (h) | | 08/15/2011 | | 06/15/2018 | | Monthly | | Receivables | | TJLP + 3.96% |
BNDES (Capex 2012-2013) (i) | | 08/16/2013 | | 05/15/2023 | | Monthly | | Receivables | | 3,0% |
BNDES (Capex 2012-2013) (i) | | 08/16/2013 | | 06/15/2020 | | Monthly | | Receivables | | TJLP + 2.80% |
BNDES (Capex 2012-2013) (i) | | 08/16/2013 | | 06/15/2020 | | Monthly | | Receivables | | TJLP + 3.80% |
Eletrobras (j) | | 11/23/2006 | | 06/30/2021 | | Monthly | | Receivables and promissory note | | 6.0% |
Eletrobras (k) | | 09/20/2011 | | 09/30/2018 | | Monthly | | Receivables and promissory note | | 7.0% |
Banco do Brasil S.A (l) | | 11/19/2013 | | 11/14/2019 | | Annual | | — | | 107% CDI |
Banco do Brasil S.A (l) | | 11/29/2013 | | 11/25/2019 | | Annual | | — | | 107% CDI |
Banco do Brasil S.A (BB Agropecuário) (l) | | 11/12/2014 | | 11/07/2019 | | Semiannual | | — | | 107% CDI |
Working Capital Bradesco (m) | | 4/01/2015 | | 9/30/2015 | | Variable | | — | | CDI + 2,40% |
| (a) | Federal Government (Financial agent: Banco do Brasil) – mid and long-term debt (DMLPs) – Acknowledgment of debt to the Federal Government on August 15, 1997. The agreement is divided into 7 (seven) sub loans (three of which have already been settled), bearing interest based on the foreign exchange variation (US dollars). |
| (b) | Eletrobras – Loan raised for financial coverage of direct costs of construction of the rural electrification program, which is part of the universal access and use of electric energy program “Luz Para Todos”, of the Ministry of Mines and Energy (MME), with funds from RGR and CDE. |
| (c) | Banco do Nordeste do Brasil – Program to Foster Alternative Electric Energy Sources (Proinfra): The subsidiary COELCE entered into an agreement with Banco do Nordeste do Brasil to finance fixed assets investments, with funds from the Constitutional Fund to Finance the Northeastern Region (FNE) / Proinfra. |
| (d) | BNDES FINAME/FINEM: Financing for investment plan 2013 of the Group contracted on June 28, 2013, amounting to R$ 217,185, through union approved by Itaú with transfer of funds from BNDES. Until September 30, 2015, BNDES had transferred 89% of the total amount. |
| (e) | Bank credit bond – Itaú: Loan maturing in March 2019, as working capital for financial support to subsidiary COELCE and used to cover operating costs. |
| (f) | BNDES Finame: Financing, totaling R$ 3,296, for implementing reinforcements in the electric grid of subsidiary CIEN, by sectioning transmission line Garabi II, which was taken out from Itaú, with funds raised from BNDES. Through September 30, 2015, subsidiary CIEN had used 89% of the amount taken out. |
| (g) | BNDES Finame sectioning: Financing, amounting to R$ 29,520, for acquisition of domestic machinery and equipment needed for implementing reinforcements in the electric grid of subsidiary CIEN, by sectioning transmission line Garabi II, which was taken out from Itaú, with funds raised from BNDES. Through September 30, 2015, subsidiary CIEN had used 75% of the amount taken out. |
| (h) | BNDES Capex 2011: Financing amounting to R$ 331,397 for investment plan 2010/2011 of subsidiary Ampla Energia, contract with union approved by Itaú, with funds transferred from BNDES. The Group took out 79% of the contracted amount. |
| (i) | BNDES Capex: 2012/2013: Financing amounting to R$ 450,171, for 2012/2013 investment plan of subsidiary Ampla Energia, contracted with union and approved by Itaú, with funds transferred from BNDES. Until September 30, 2015, subsidiary Ampla Energia had used 79% of the amount taken out. |
| (j) | Eletrobras: Loan raised for financial coverage of direct costs of construction of the rural electrification program, which is part of the universal access and use of electric energy program “Luz Para Todos”, of the Ministry of Mines and Energy (MME), with funds from RGR and CDE. |
G-58
Enel Brasil S.A.
Notes to the consolidated financial statements (Continued)
September 30, 2015 and 2014, December 31, 2014 and 2013 and January 1st, 2013
(In thousands of reais, unless otherwise stated)
| 21. | Loans and financing (Continued) |
| (k) | Eletrobras: Loan raised for financial coverage of costs of construction of the distribution and sub transmission network of the mountainous region of Rio de Janeiro, which were impacted by the heavy rains in the first quarter of 2011. Funds for this transaction originated from RGR. |
| (l) | Bank Credit Note (Banco do Brasil): Loan with maturing in November 2019, in the modality of Agrarian Credit for the financial support of the subsidiary Ampla Energia and Coelce in use in the amortization of previous debts. |
| (m) | Working Capital Bradesco: Guaranteed credit line with Banco Bradesco, used as the company’s working capital. |
| (n) | IFC – International Finance Corporation: The subsidiary CGTF has only one long-term financing agreement, entered into in 2006 in the amount of US$130,000 thousand. This project finance agreement is divided into 3 tranches (IFC-A, IFC-B and IFC-C, maturing in December 2017, 2015 and 2019, respectively). |
| (o) | Federal Government – Law No. 8,727: Credit assignment made by Eletrobras and the Caixa Econômica Federal (Federal Savings and Loans Bank) to the Federal Government. |
| (p) | BNDES FINEM: Financing for the 2007/2009 investment plan of COELCE on April 28, 2008, in the amount of R$ 330,000, raised through loan syndication led by Unibanco, with onlending from the Brazilian Development Bank (BNDES). |
| (q) | BNDES PEC: Loan taken out considering the need for working capital of subsidiary COELCE. This contract was settled in January 2013. |
In connection with the loans taken out with the Brazilian Development Bank (BNDES), Banco do Brasil, Banco Itaú and working capital operations, subsidiaries COELCE, Ampla Energia and CIEN undertook to comply with the following obligations during effectiveness of the agreements, which were adequately complied with at December 31, 2014:
| | | | |
Banco | | Financial obligations | | Rate |
| BNDES/FINEM/Itaú CCB | | Net financial debt/EBITDA (maximum) | | 3.50 |
| BNDES/FINEM/Itaú CCB | | Net financial debt/Net financial debt + Equity (maximum) | | 0.60 |
| Banco do Brasil S.A (BB Agropecuário) | | EBITDA / Net financial expenses (minimum) | | 3.00 |
| Working capital | | Net financial debt/EBITDA (maximum) | | 3.50 |
| Working capital | | EBITDA / Net financial expenses (minimum) | | 2.00 |
EBITDA – Earnings Before Interest, Taxes, Depreciation and Amortization.
The contractual amortization of the principal amounts of long-term loans and financing, without the effects of swap transactions engaged and funding costs, is as follows:
| | | | | | | | |
Year | | 09/30/2015 | | | 12/31/2014 | |
2016 | | | 118,370 | | | | 247,913 | |
2017 | | | 341,812 | | | | 340,041 | |
2018 | | | 320,372 | | | | 318,764 | |
2019 | | | 282,517 | | | | 280,789 | |
After 2019 | | | 124,442 | | | | 121,754 | |
| | | | | | | | |
Total | | | 1,187,513 | | | | 1,309,261 | |
| | | | | | | | |
G-59
Enel Brasil S.A.
Notes to the consolidated financial statements (Continued)
September 30, 2015 and 2014, December 31, 2014 and 2013 and January 1st, 2013
(In thousands of reais, unless otherwise stated)
| 21. | Loans and financing (Continued) |
The changes in loans and financing without the effects of funding costs are as follows:
| | | | | | | | | | | | | | | | | | | | |
| | | Local currency | | | Foreign currency | | | | |
| | | Current | | | Non-current | | | Current | | | Non-current | | | Total | |
At January 01, 2013 | | | 292,987 | | | | 557,927 | | | | 26,985 | | | | 119,599 | | | | 997,498 | |
Additions | | | — | | | | 717,557 | | | | — | | | | — | | | | 717,557 | |
Provisions for charges | | | 71,489 | | | | — | | | | 8,167 | | | | — | | | | 79,656 | |
Interest accrued paid | | | (70,384 | ) | | | — | | | | (8,550 | ) | | | — | | | | (78,934 | ) |
Monetary and exchange variation | | | — | | | | 636 | | | | 4,951 | | | | 13,288 | | | | 18,875 | |
Transfers | | | 257,765 | | | | (257,765 | ) | | | 30,429 | | | | (30,429 | ) | | | — | |
Swap transaction gain/losses | | | — | | | | — | | | | (17 | ) | | | (7,357 | ) | | | (7,374 | ) |
Amortization | | | (322,882 | ) | | | — | | | | (29,096 | ) | | | — | | | | (351,978 | ) |
| | | | | | | | | | | | | | | | | | | | |
At December 31, 2013 | | | 228,975 | | | | 1,018,355 | | | | 32,869 | | | | 95,101 | | | | 1,375,300 | |
Additions | | | 131,477 | | | | 463,126 | | | | — | | | | — | | | | 594,603 | |
Interest accrued | | | 109,070 | | | | — | | | | 7,069 | | | | — | | | | 116,139 | |
Interest accrued paid | | | (98,712 | ) | | | — | | | | (276 | ) | | | — | | | | (98,988 | ) |
Monetary and exchange variation | | | — | | | | 37 | | | | 12,684 | | | | 864 | | | | 13,585 | |
Transfers | | | 179,632 | | | | (179,632 | ) | | | 88,590 | | | | (88,590 | ) | | | — | |
Swap transaction gain/losses | | | — | | | | — | | | | (7,545 | ) | | | — | | | | (7,545 | ) |
Amortization | | | (363,012 | ) | | | — | | | | (133,326 | ) | | | — | | | | (496,338 | ) |
| | | | | | | | | | | | | | | | | | | | |
At December 31, 2014 | | | 187,430 | | | | 1,301,886 | | | | 65 | | | | 7,375 | | | | 1,496,756 | |
Additions | | | 141,684 | | | | 7,396 | | | | — | | | | — | | | | 149,080 | |
Interest accrued | | | 126,878 | | | | — | | | | 272 | | | | — | | | | 127,150 | |
Interest accrued paid | | | (113,860 | ) | | | — | | | | (180 | ) | | | — | | | | (114,040 | ) |
Monetary and exchange variation | | | 579 | | | | — | | | | — | | | | 3,714 | | | | 4,293 | |
Transfers | | | 132,800 | | | | (132,800 | ) | | | 58 | | | | (58 | ) | | | — | |
Amortization | | | (222,527 | ) | | | — | | | | — | | | | — | | | | (222,527 | ) |
| | | | | | | | | | | | | | | | | | | | |
At September 30, 2015 | | | 252,984 | | | | 1,176,482 | | | | 215 | | | | 11,031 | | | | 1,440,712 | |
| | | | | | | | | | | | | | | | | | | | |
G-60
Enel Brasil S.A.
Notes to the consolidated financial statements (Continued)
September 30, 2015 and 2014, December 31, 2014 and 2013 and January 1st, 2013
(In thousands of reais, unless otherwise stated)
| | | | | | | | | | | | | | | | | | | | | | | | | | |
| | | | | 09/30/2015 | | | 12/31/2014 | |
| | | | | Principal | | | Principal | |
Description | | Companies | | Charges | | | Current | | | Non-current | | | Charges | | | Current | | | Non-current | |
1st Serie 3rd Issue | | COELCE | | | 6,789 | | | | 52,000 | | | | 52,000 | | | | 2,613 | | | | 52,000 | | | | 52,000 | |
1st Serie 6th Issue | | Ampla Energia | | | 2,565 | | | | 58,501 | | | | — | | | | 508 | | | | 58,500 | | | | 58,500 | |
1st Serie 7th Issue | | Ampla Energia | | | 4,327 | | | | 50,000 | | | | 50,000 | | | | 428 | | | | — | | | | 100,000 | |
1st Serie 8th Issue | | Ampla Energia | | | 5,276 | | | | — | | | | 150,000 | | | | 8,392 | | | | — | | | | 150,000 | |
2nd Serie 3rd Issue | | COELCE | | | 25,154 | | | | — | | | | 384,530 | | | | 5,105 | | | | — | | | | 356,970 | |
2nd Serie 6th Issue | | Ampla Energia | | | 5,582 | | | | 80,207 | | | | 160,414 | | | | 9,638 | | | | — | | | | 223,375 | |
2nd Serie 7th Issue | | Ampla Energia | | | 6,661 | | | | — | | | | 375,717 | | | | 11,476 | | | | — | | | | 348,788 | |
2nd Serie 8th Issue | | Ampla Energia | | | 5,276 | | | | — | | | | 150,000 | | | | 8,392 | | | | — | | | | 150,000 | |
(-) Cost to be amortized | | | | | — | | | | (1,580 | ) | | | (3,538 | ) | | | — | | | | (1,583 | ) | | | (4,723 | ) |
| | | | | | | | | | | | | | | | | | | | | | | | | | |
Total with no effect of swap operations | | | | | 61,630 | | | | 239,128 | | | | 1,319,123 | | | | 46,552 | | | | 108,917 | | | | 1,434,910 | |
| | | | | | | | | | | | | | | | | | | | | | | | | | |
Swap transaction gain/losses | | | | | — | | | | (7,157 | ) | | | (9,699 | ) | | | — | | | | (844 | ) | | | (15,365 | ) |
| | | | | | | | | | | | | | | | | | | | | | | | | | |
Total debentures | | | | | 61,630 | | | | 231,971 | | | | 1,309,424 | | | | 46,552 | | | | 108,073 | | | | 1,419,545 | |
| | | | | | | | | | | | | | | | | | | | | | | | | | |
| | | | | | | | | | | | | | | | | | | | | | | | | | |
| | | | | 12/31/2013 | | | 01/01/2013 | |
| | | | | Principal | | | Principal | |
Description | | Companies | | Charges | | | Current | | | Non-current | | | Charges | | | Current | | | Non-current | |
1st Serie 3rd Issue | | COELCE | | | 2,219 | | | | — | | | | 104,000 | | | | 1,679 | | | | — | | | | 104,000 | |
1st Serie 6th Issue | | Ampla Energia | | | 490 | | | | — | | | | 117,000 | | | | 328 | | | | — | | | | 117,000 | |
1st Serie 7th Issue | | Ampla Energia | | | 411 | | | | — | | | | 100,000 | | | | 274 | | | | — | | | | 100,000 | |
2nd Serie 2nd Issue | | COELCE | | | — | | | | — | | | | — | | | | 4,175 | | | | 62,214 | | | | 62,214 | |
2nd Serie 3rd Issue | | COELCE | | | 4,698 | | | | — | | | | 334,764 | | | | 4,353 | | | | — | | | | 316,280 | |
2nd Serie 5th Issue | | Ampla Energia | | | — | | | | — | | | | — | | | | 459 | | | | 53,519 | | | | 107,038 | |
2nd Serie 6th Issue | | Ampla Energia | | | 8,972 | | | | — | | | | 209,480 | | | | 8,290 | | | | — | | | | 197,913 | |
2nd Serie 7th Issue | | Ampla Energia | | | 10,683 | | | | — | | | | 327,093 | | | | 9,872 | | | | — | | | | 309,031 | |
(-) Cost to be amortized | | | | | — | | | | (1,736 | ) | | | (3,853 | ) | | | — | | | | (2,191 | ) | | | (6,183 | ) |
| | | | | | | | | | | | | | | | | | | | | | | | | | |
Total with no effect of swap operations | | | | | 27,473 | | | | (1,736 | ) | | | 1,188,484 | | | | 29,430 | | | | 113,542 | | | | 1,307,293 | |
| | | | | | | | | | | | | | | | | | | | | | | | | | |
Swap transaction gain/losses | | | | | — | | | | (322 | ) | | | (19,719 | ) | | | — | | | | 310 | | | | 2,758 | |
| | | | | | | | | | | | | | | | | | | | | | | | | | |
Total debentures | | | | | 27,473 | | | | (2,058 | ) | | | 1,168,765 | | | | 29,430 | | | | 113,852 | | | | 1,310,051 | |
| | | | | | | | | | | | | | | | | | | | | | | | | | |
G-61
Enel Brasil S.A.
Notes to the consolidated financial statements (Continued)
September 30, 2015 and 2014, December 31, 2014 and 2013 and January 1st, 2013
(In thousands of reais, unless otherwise stated)
| 22. | Debentures (Continued) |
Change in debentures:
| | | | | | | | | | | | |
| | | Current | | | Non-current | | | Total | |
At January 01, 2013 | | | 143,282 | | | | 1,310,051 | | | | 1,453,333 | |
| | | | | | | | | | | | |
Provisions for charges | | | 107,148 | | | | — | | | | 107,148 | |
Interest accrued paid | | | (109,106 | ) | | | — | | | | (109,106 | ) |
Transfer of terms | | | 180,520 | | | | (180,520 | ) | | | — | |
Monetary variation | | | — | | | | 59,380 | | | | 59,380 | |
Repayment of principal | | | (296,251 | ) | | | — | | | | (296,251 | ) |
Transfer – transaction cost | | | (2,010 | ) | | | 2,010 | | | | — | |
Allocation of transaction cost | | | 2,465 | | | | 320 | | | | 2,785 | |
Swap transaction gain/losses | | | (633 | ) | | | (22,476 | ) | | | (23,109 | ) |
| | | | | | | | | | | | |
At December 31, 2013 | | | 25,415 | | | | 1,168,765 | | | | 1,194,180 | |
| | | | | | | | | | | | |
Funds raised | | | — | | | | 300,000 | | | | 300,000 | |
Provisions for charges | | | 117,542 | | | | — | | | | 117,542 | |
Interest accrued paid | | | (98,466 | ) | | | — | | | | (98,466 | ) |
Transfer of terms | | | 110,500 | | | | (110,500 | ) | | | — | |
Monetary variation | | | — | | | | 57,801 | | | | 57,801 | |
Transfer – transaction cost | | | (101 | ) | | | 101 | | | | — | |
Allocation of transaction cost | | | 257 | | | | (976 | ) | | | (719 | ) |
Swap transaction gain/losses | | | (522 | ) | | | 4,354 | | | | 3,832 | |
| | | | | | | | | | | | |
At December 31, 2014 | | | 154,625 | | | | 1,419,545 | | | | 1,574,170 | |
| | | | | | | | | | | | |
Provisions for charges | | | 115,188 | | | | — | | | | 115,188 | |
Interest accrued paid | | | (100,107 | ) | | | — | | | | (100,107 | ) |
Transfer of terms | | | 188,280 | | | | (188,280 | ) | | | — | |
Monetary variation | | | — | | | | 71,735 | | | | 71,735 | |
Repayment of principal | | | (58,500 | ) | | | — | | | | (58,500 | ) |
Transfer – transaction cost | | | 94 | | | | (94 | ) | | | — | |
Allocation of transaction cost | | | 282 | | | | 904 | | | | 1,186 | |
Swap transaction gain/losses | | | (6,261 | ) | | | 5,614 | | | | (647 | ) |
| | | | | | | | | | | | |
At September 30, 2015 | | | 293,601 | | | | 1,309,424 | | | | 1,603,025 | |
| | | | | | | | | | | | |
G-62
Enel Brasil S.A.
Notes to the consolidated financial statements (Continued)
September 30, 2015 and 2014, December 31, 2014 and 2013 and January 1st, 2013
(In thousands of reais, unless otherwise stated)
| 22. | Debentures (Continued) |
Characteristics of debenture issues
COELCE
| | | | |
Characteristics | | 3rd Issue – 1st Serie | | 3nd Issue – 2nd Serie |
| Convertibility | | Simple debentures non-convertible into shares | | Simple debentures non-convertible into shares |
| Type | | Unprivileged | | Unprivileged |
| Type and form | | Registered book-entry debentures, with no issue of certificates | | Registered book-entry debentures, with no issue of certificates |
| Number of securities | | 10,400 simple debentures | | 29,600 simple debentures |
| Par value | | R$ 10 | | R$ 10 |
| Issue date | | October 15, 2011 | | October 15, 2011 |
| Initial maturity | | October 15, 2015 | | October 15, 2016 |
| Maturity | | October 15, 2016 | | October 15, 2018 |
| Monetary restatement | | No restatement | | IPCA |
| Rescheduling | | No rescheduling | | No rescheduling |
| Remuneration | | CDI+0.97%pa | | 6.85%pa |
| Interest payment | | Semiannual | | Annual |
| Repayment | | Two annual installments | | Three annual installments |
| Repayment date | | 2015 and 2016 | | 2016, 2017 and 2018 |
Ampla Energia
| | | | |
Characteristics | | 1st Serie – 6th Issue | | 2nd Serie – 6th Issue |
| Convertibility | | Simple debentures non-convertible into shares | | Simple debentures non-convertible into shares |
| Type | | Unprivileged | | Unprivileged |
| Type and form | | Registered book-entry debentures, with no issue of certificates | | Registered book-entry debentures, with no issue of certificates |
| Number of securities | | 11,700 simple debentures | | 18,300 simple debentures |
| Par value | | R$ 10 | | R$ 10 |
| Issue date | | June 15, 2011 | | June 15, 2011 |
| Initial maturity | | June 15, 2015 | | June 15, 2016 |
| Maturity | | June 15, 2016 | | June 15, 2018 |
| Monetary restatement | | No restatement | | IPCA |
| Rescheduling | | No rescheduling | | No rescheduling |
| Remuneration | | CDI + 1.20% p.a. | | IPCA + 7.90% p.a. |
| Interest payment | | Semiannual | | Annual |
| Repayment | | Two annual installments | | Three annual installments |
| Repayment date | | 2015 and 2016 | | 2016, 2017 and 2018 |
G-63
Enel Brasil S.A.
Notes to the consolidated financial statements (Continued)
September 30, 2015 and 2014, December 31, 2014 and 2013 and January 1st, 2013
(In thousands of reais, unless otherwise stated)
| 22. | Debentures (Continued) |
Characteristics of debenture issues (Continued)
Ampla Energia (Continued)
| | | | |
Characteristics | | 1st Serie – 7th Issue | | 2nd Serie – 7th Issue |
Convertibility | | Simple debentures non-convertible into shares | | Simple debentures non-convertible into shares |
Type | | Unprivileged | | Unprivileged |
Type and form | | Registered book-entry debentures, with no issue of certificates | | Registered book-entry debentures, with no issue of certificates |
Number of securities | | 10,000 simple debentures | | 30,000 simple debentures |
Par value | | R$ 10 | | R$ 10 |
Issue date | | June 15, 2012 | | June 15, 2012 |
Initial maturity | | June 15, 2016 | | June 15, 2017 |
Maturity | | June 15, 2017 | | June 15, 2019 |
Monetary restatement | | No restatement | | IPCA |
Rescheduling | | No rescheduling | | No rescheduling |
Remuneration | | CDI + 1.02% p.a. | | IPCA + 6.00% p.a. |
Interest payment | | Semiannual | | Annual |
Repayment | | Two annual installments | | Three annual installments |
Repayment date | | 2016 and 2017 | | 2017, 2018 and 2019 |
| | | | |
Characteristics | | 1st Serie – 8th Issue | | 2nd Serie – 8th Issue |
Convertibility | | Simple debentures non-convertible into shares | | Simple debentures non-convertible into shares |
Type | | Unprivileged | | Unprivileged |
Type and form | | Registered book-entry debentures, with no issue of certificates | | Registered book-entry debentures, with no issue of certificates |
Number of securities | | 15,000 simple debentures | | 35,000 simple debentures |
Par value | | R$ 10 | | R$ 10 |
Issue date | | July 16, 2014 | | July 16, 2014 |
Initial maturity | | July 15, 2017 | | July 15, 2017 |
Maturity | | July 15, 2019 | | July 15, 2019 |
Monetary restatement | | No restatement | | No restatement |
Rescheduling | | No rescheduling | | No rescheduling |
Remuneration | | CDI + 1.45% p.a. | | CDI + 1.45% p.a. |
Interest payment | | Semiannual | | Semiannual |
Repayment | | Three annual installments | | Three annual installments |
Repayment date | | 2017, 2018 and 2019 | | 2017, 2018 and 2019 |
G-64
Enel Brasil S.A.
Notes to the consolidated financial statements (Continued)
September 30, 2015 and 2014, December 31, 2014 and 2013 and January 1st, 2013
(In thousands of reais, unless otherwise stated)
| 22. | Debentures (Continued) |
In accordance with the indenture of debentures, the subsidiaries COELCE and Ampla Energia are subject to maintaining certain financial ratios, calculated quarterly, based on its financial statements. As of September 30, 2015, the subsidiaries Ampla Energia and COELCE are complying with these ratios in the evaluation of its Management.
| | | | | | |
Issue | | Financial obligations | | Rate | |
3nd issue – COELCE | | Net financial debt/EBITDA (maximum) | | | 2.50 | |
3rd issue – COELCE | | EBITDA/Net financial debt (minimum) | | | 2.75 | |
6th issue – Ampla Energia | | Net financial debt/EBITDA (maximum) | | | 2.70 | |
6th issue – Ampla Energia | | EBITDA/Net financial expenses (minimum) | | | 2.50 | |
7th issue – Ampla Energia | | Net financial debt/EBITDA (maximum) | | | 2.70 | |
7th issue – Ampla Energia | | EBITDA/Net financial expenses (minimum) | | | 2.50 | |
8th issue – Ampla Energia | | Net financial debt/EBITDA (maximum) | | | 3.50 | |
8th issue – Ampla Energia | | Net financial debt/EBITDA (maximum) /Net financial expenses (minimum) | | | 0.60 | |
On September 30, 2015 the indicator net debt / EBITDA was 2.83, calculated as defined in the scriptures of the 6th and 7th issue of debentures for the subsidiary Ampla Energia. Nevertheless, the subsidiary is in compliance with the contractual terms, considering that according to the scriptures, only the lack of compliance by the subsidiary for two consecutive quarters in any of these financial ratios, implies the possibility of early maturity and immediate payment of debts.
Contractual amortization of long-term debentures is as follows:
| | | | | | | | | | | | | | | | | | | | |
| | | 2016 | | | 2017 | | | 2018 | | | After 2018 | | | Total | |
1th Serie – 3 th Issue – COELCE | | | 52,000 | | | | — | | | | — | | | | — | | | | 52,000 | |
1th Serie – 7 th Issue – Ampla Energia | | | — | | | | 50,000 | | | | — | | | | — | | | | 50,000 | |
1th Serie – 8 th Issue – Ampla Energia | | | — | | | | 50,000 | | | | 50,000 | | | | 50,000 | | | | 150,000 | |
2nd Serie – 3 th Issue – Coelce | | | 128,167 | | | | 128,167 | | | | 128,196 | | | | — | | | | 384,530 | |
2nd Serie – 6 th Issue – Ampla Energia | | | — | | | | 80,207 | | | | 80,207 | | | | — | | | | 160,414 | |
2nd Serie – 7 th Issue – Ampla Energia | | | — | | | | 125,239 | | | | 125,239 | | | | 125,239 | | | | 375,717 | |
2nd Serie – 8 th Issue – Ampla Energia | | | — | | | | 50,000 | | | | 50,000 | | | | 50,000 | | | | 150,000 | |
(-) Transaction costs | | | (341 | ) | | | (1,225 | ) | | | (1,009 | ) | | | (963 | ) | | | (3,538 | ) |
| | | | | | | | | | | | | | | | | | | | |
Total to be amortised | | | 179,826 | | | | 482,388 | | | | 432,633 | | | | 224,276 | | | | 1,319,123 | |
| | | | | | | | | | | | | | | | | | | | |
| 23. | Financial instruments and operating risks |
General considerations
The Enel Group has policies to mitigate financial risks and adopt operating and financial strategies to ensure liquidity, security and profitability of its assets. For this purpose, it maintains managerial systems for controlling and monitoring its financial transactions and corresponding amounts, in order to monitor the risks and rates charged by the market.
G-65
Enel Brasil S.A.
Notes to the consolidated financial statements (Continued)
September 30, 2015 and 2014, December 31, 2014 and 2013 and January 1st, 2013
(In thousands of reais, unless otherwise stated)
| 23. | Financial instruments and operating risks (Continued) |
Risk factors
| | a) | Foreign exchange rate risk |
This risk arises from the possibility of the Enel Group to incur losses due to fluctuations in foreign exchange rates, which increase financial expenses and liability balances of loans and financing in foreign currency taken out in the market.
The following table presents the carrying amount of foreign currency liabilities that are not hedged by currency swap instruments:
| | | | | | | | | | | | | | | | |
| | | Liabilities | |
| | | 09/30/2015 | | | 12/31/2014 | | | 12/31/2013 | | | 01/01/2013 | |
US dollars | | | 11,246 | | | | 7,440 | | | | 90,067 | | | | 92,983 | |
We set out below a sensitivity analysis chart related to the impacts on net income of the Enel Group if the variation of the exchange rate in 2014 were equal to that expected for 2015, according to projections based on the dollar forward curve of the BM&F (Brazilian Mercantile & Futures Exchange):
| | | | | | | | | | | | |
| | | | | | Effects | |
09/30/2015 | | Increase | | | On income
statement | | | On equity | |
US dollars | | | 3.20 | % | | | (290 | ) | | | (290 | ) |
This risk arises from the possibility of the Enel Group to incur losses due to fluctuations in interest rates or other debt indices, such as inflation rates, which would increase the financial expenses related to loans and financing taken out in the market. In order to minimize this risk, the Group prioritizes loans taken out at fixed rates (BNB and Eletrobras) and linked to other indices less volatile to financial market fluctuations, such as the Long-Term Interest Rate – TJLP (BNDES).
In order to avoid risks with changes in market indexes, the loans indexed to floating rate had its rates fixed through swap contracts, to hedge against the risk of rate fluctuation. The adjustment to the debit and credit of this operation is recorded in the income statement.
The table below shows the sensitivity analysis related to the impact on the Group’s net income if variations in interest rates and inflation rates for 2014 were equal to those expected for 2015, according to projections based on the forward curve of the BM&F:
| | | | | | | | | | | | |
| | | | | | Effects | |
09/30/2015 | | Increase/
reduction | | | On income
statement | | | On equity | |
Financial liabilities | | | | | | | | | | | | |
CDI | | | 0.47 | % | | | 5,196 | | | | 5,196 | |
IPCA | | | 7.34 | % | | | 1,302 | | | | 1,302 | |
TJLP | | | 7.69 | % | | | 760 | | | | 760 | |
| | | | | | | | | | | | |
Total | | | | | | | 7,258 | | | | 7,258 | |
| | | | | | | | | | | | |
G-66
Enel Brasil S.A.
Notes to the consolidated financial statements (Continued)
September 30, 2015 and 2014, December 31, 2014 and 2013 and January 1st, 2013
(In thousands of reais, unless otherwise stated)
| 23. | Financial instruments and operating risks (Continued) |
Risk factors (Continued)
The risk arises from the possibility of its subsidiaries to incur losses due to the difficulty in collecting amounts billed to its customers. This risk is assessed as low by the subsidiaries due to the diversification in the number of customers and the collection policy and cutting of electricity supply to customers in default. The allowance for doubtful accounts is established in an amount deemed sufficient by management of the Enel Group to cover possible risks of realization of accounts receivable.
| | d) | Accelerated debt maturity risk |
Some subsidiaries have loans and financing agreements and debentures with covenants that, in general, require the maintenance of economic and financial ratios at certain levels (financial covenants). Failure to comply with these covenants may result in acceleration of debt maturity. These restrictions are adequately monitored and do not restrict the subsidiaries’ capacity to carry out their normal business. Currently, the Enel Group’s debt ratio is at levels below the limit established by the financial covenants.
| | e) | Risk of revision and supply tariff adjustment |
Tariff adjustment and revision processes are secured by agreement and rely on previously set methodologies. Changes to the methodology in force should be extensively discussed and supported by contributions by Group companies, concessionaires and other agents in the industry.
In case of an unforeseeable event affects the economic and financial balance of the concession, Ampla Energia and Coelce may justify and require the Regulator to open an Extraordinary Tariff Revision, and it shall be at the Regulator’s discretion to determine whether or not such revision should be made. ANEEL itself also may carry out Extraordinary Revisions in case of introduction, change or exclusion of charges and/or taxes to be passed on to tariffs.
| | f) | Capital risk management |
The Enel Group manages its capital to ensure continuity of its normal activities, while maximizing the return to all parties interested or involved in its operations by optimizing the debt and equity balances.
The capital structure of the Enel Group is formed by net indebtedness (loans detailed in Notes 21 and 22, deducting cash and cash equivalents and temporary cash investments detailed in Notes 6 and 7), as well as by equity of the Group.
| | | | | | | | | | | | | | | | |
| | | 09/30/2015 | | | 12/31/2014 | | | 12/31/2013 | | | 01/01/2013 | |
Debt | | | 3,060,593 | | | | 3,070,926 | | | | 2,569,287 | | | | 2,450,353 | |
Cash and cash equivalents + Marketable securities | | | (682,562 | ) | | | (1,094,384 | ) | | | (1,832,528 | ) | | | (1,429,955 | ) |
| | | | | | | | | | | | | | | | |
Net debt (a) | | | 2,378,031 | | | | 1,976,542 | | | | 736,759 | | | | 1,020,398 | |
Equity (b) | | | 7,597,726 | | | | 7,112,912 | | | | 7,137,960 | | | | 6,945,246 | |
| | | | | | | | | | | | | | | | |
Net indebtedness ratio (a/[a+b]) | | | 24 | % | | | 22 | % | | | 9 | % | | | 13 | % |
| | | | | | | | | | | | | | | | |
| (a) | Net debt is represented by total outstanding loans, financing and debentures, including portions of current and non-current liabilities, net of balances of cash and cash equivalents and marketable securities. See more details in Notes 6, 7, 21 and 22. |
| (b) | Equity includes all capital and reserves of the Group. |
G-67
Enel Brasil S.A.
Notes to the consolidated financial statements (Continued)
September 30, 2015 and 2014, December 31, 2014 and 2013 and January 1st, 2013
(In thousands of reais, unless otherwise stated)
| 23. | Financial instruments and operating risks (Continued) |
Risk factors (Continued)
The Enel Group’s liquidity is managed through the monitoring of forecast and actual cash flows in order to meet possible cash needs in the short-term. So as to ensure the capacity of paying its obligations in a conservative manner, the management of temporary cash investments has focused on very short-term instruments, primarily with daily maturities in order to provide maximum liquidity.
The tables below present information on future maturities of loans, financing, debentures and related party operations in foreign currency of the Enel Group that are being considered in the projected cash flows (including interest and principal):
| | | | | | | | | | | | | | | | | | | | | | | | |
| | | Less than
one month | | | From one to
three months | | | From three
months to
one year | | | From one
to five years | | | Over five
years | | | Total | |
September 30, 2015 | | | | | | | | | | | | | | | | | | | | | | | | |
Fixed interest loans and financing | | | 6,620 | | | | 12,803 | | | | 56,516 | | | | 219,639 | | | | 64,354 | | | | 359,932 | |
Variable interest loans and financing | | | 73,037 | | | | 68,413 | | | | 209,652 | | | | 1,485,497 | | | | 5,054 | | | | 1,841,653 | |
Debentures | | | 85,657 | | | | 12,009 | | | | 296,847 | | | | 1,571,162 | | | | — | | | | 1,965,675 | |
| | | | | | | | | | | | | | | | | | | | | | | | |
| | | 165,314 | | | | 93,225 | | | | 563,015 | | | | 3,276,298 | | | | 69,408 | | | | 4,167,260 | |
| | | | | | | | | | | | | | | | | | | | | | | | |
December 31, 2014 | | | | | | | | | | | | | | | | | | | | | | | | |
Fixed interest loans and financing | | | 6,765 | | | | 14,118 | | | | 61,517 | | | | 263,033 | | | | 89,265 | | | | 434,698 | |
Variable interest loans and financing | | | 10,219 | | | | 37,003 | | | | 168,788 | | | | 1,216,925 | | | | 40,516 | | | | 1,473,451 | |
Debentures | | | 17,112 | | | | — | | | | 228,709 | | | | 1,739,708 | | | | — | | | | 1,985,529 | |
| | | | | | | | | | | | | | | | | | | | | | | | |
| | | 34,096 | | | | 51,121 | | | | 459,014 | | | | 3,219,666 | | | | 129,781 | | | | 3,893,678 | |
| | | | | | | | | | | | | | | | | | | | | | | | |
December 31, 2013 | | | | | | | | | | | | | | | | | | | | | | | | |
Fixed interest loans and financing | | | 8,873 | | | | 20,451 | | | | 111,342 | | | | 364,722 | | | | 138,188 | | | | 643,576 | |
Variable interest loans and financing | | | 10,363 | | | | 29,021 | | | | 161,126 | | | | 690,579 | | | | 196,642 | | | | 1,087,731 | |
Debentures | | | — | | | | — | | | | 96,284 | | | | 1,356,495 | | | | 117,689 | | | | 1,570,468 | |
| | | 19,236 | | | | 49,472 | | | | 368,752 | | | | 2,411,796 | | | | 452,519 | | | | 3,301,775 | |
| | | | | | | | | | | | | | | | | | | | | | | | |
January 1, 2013 | | | | | | | | | | | | | | | | | | | | | | | | |
Fixed interest loans and financing | | | 6,307 | | | | 14,476 | | | | 86,085 | | | | 362,775 | | | | 124,016 | | | | 593,659 | |
Variable interest loans and financing | | | 34,092 | | | | 21,715 | | | | 220,885 | | | | 280,990 | | | | 27,704 | | | | 585,386 | |
Debentures | | | — | | | | — | | | | 225,525 | | | | 1,270,146 | | | | 418,153 | | | | 1,913,824 | |
Loans and financings with related parties in foreign currency | | | — | | | | — | | | | 362,090 | | | | — | | | | — | | | | 362,090 | |
| | | 40,399 | | | | 36,191 | | | | 894,585 | | | | 1,913,911 | | | | 569,873 | | | | 3,454,959 | |
| | | | | | | | | | | | | | | | | | | | | | | | |
G-68
Enel Brasil S.A.
Notes to the consolidated financial statements (Continued)
September 30, 2015 and 2014, December 31, 2014 and 2013 and January 1st, 2013
(In thousands of reais, unless otherwise stated)
| 23. | Financial instruments and operating risks (Continued) |
Risk factors (Continued)
| | g) | Liquidity risk (Continued) |
The tables below present the amounts forecast for the next maturity of hedging instruments:
| | | | | | | | | | | | | | | | | | | | |
| | | Less than
one month | | | From one to
three months | | | From three
months to
one year | | | From one
to five years | | | Total | |
September 30, 2015 | | | | | | | | | | | | | | | | | | | | |
NDF BRL x USD | | | 256 | | | | 591 | | | | (2,268 | ) | | | — | | | | (1,421 | ) |
Interest rate swap | | | — | | | | 2,575 | | | | (7,339 | ) | | | (225 | ) | | | (4,989 | ) |
| | | | | | | | | | | | | | | | | | | | |
| | | 256 | | | | 3,166 | | | | (9,607 | ) | | | (225 | ) | | | (6,410 | ) |
| | | | | | | | | | | | | | | | | | | | |
December 31, 2014 | | | | | | | | | | | | | | | | | | | | |
Currency swap | | | — | | | | — | | | | — | | | | — | | | | — | |
Interest rate swap | | | — | | | | — | | | | (8,586 | ) | | | (3,032 | ) | | | (11,618 | ) |
| | | | | | | | | | | | | | | | | | | | |
| | | — | | | | — | | | | (8,586 | ) | | | (3,032 | ) | | | (11,618 | ) |
| | | | | | | | | | | | | | | | | | | | |
December 31, 2013 | | | | | | | | | | | | | | | | | | | | |
Currency swap | | | — | | | | — | | | | 4,172 | | | | 3,599 | | | | 7,771 | |
Interest rate swap | | | — | | | | — | | | | (2,365 | ) | | | (5,015 | ) | | | (7,380 | ) |
| | | | | | | | | | | | | | | | | | | | |
| | | — | | | | — | | | | 1,807 | | | | (1,416 | ) | | | 391 | |
| | | | | | | | | | | | | | | | | | | | |
January 1, 2013 | | | | | | | | | | | | | | | | | | | | |
Currency swap | | | — | | | | — | | | | 5,085 | | | | 8,647 | | | | 13,732 | |
Interest rate swap | | | — | | | | — | | | | 8,206 | | | | 14,364 | | | | 22,570 | |
| | | | | | | | | | | | | | | | | | | | |
| | | — | | | | — | | | | 13,291 | | | | 23,011 | | | | 36,302 | |
| | | | | | | | | | | | | | | | | | | | |
In order to avoid any emergency cash need, the Group uses overdraft facilities that it has taken out as a short-term cash source. We set out below the table on the final position of the September 30, 2015, December 31, 2014 and 2013, and January 1st, 2013 regarding the use of this facility:
| | | | | | | | | | | | | | | | |
Secured account | | 09/30/2015 | | | 12/31/2014 | | | 12/31/2013 | | | 01/01/2013 | |
Agreed | | | 460,000 | | | | 485,000 | | | | 350,000 | | | | 325,000 | |
Valuation of financial instruments
In order to determine the fair value of loans and financing, the Enel Group’s management used discounted future cash flows at rates deemed as fair to carry out new operations in the market. Regarding the fair value of debentures the quotations traded on the secondary market were adopted.
Hierarchical fair value
There are three levels for the classification of fair value relating to financial instruments and hierarchical level is considered to define priority for unadjusted quoted prices in an active market for financial assets or liabilities. The classification of hierarchical levels may be presented as outlined below:
| | • | | Level 1 – Data from an active market (unadjusted quoted price) allowing daily access including on the date of fair value measurement. |
G-69
Enel Brasil S.A.
Notes to the consolidated financial statements (Continued)
September 30, 2015 and 2014, December 31, 2014 and 2013 and January 1st, 2013
(In thousands of reais, unless otherwise stated)
| 23. | Financial instruments and operating risks (Continued) |
Hierarchical fair value (Continued)
| | • | | Level 2 – Data different from that from the active market (unadjusted quoted price) included in Level 1, extracted from the pricing model based on observable market data. |
| | • | | Level 3 – Data from a pricing model based on unobservable market data. |
| | | | | | | | | | | | | | | | | | | | | | |
| | | | | | | | 09/30/2015 | | | 12/31/2014 | |
| | | Category | | Level | | | Book value | | | Fair value | | | Book value | | | Fair value | |
Assets | | | | | | | | | | | | | | | | | | | | | | |
Cash and cash equivalents | | Fair value through P&L | | | 2 | | | | 554,162 | | | | 560,936 | | | | 864,071 | | | | 864,071 | |
Marketable securities | | Fair value through P&L | | | 2 | | | | 128,400 | | | | 138,781 | | | | 230,313 | | | | 230,313 | |
Guarantees deposits | | Loans and receivables | | | 2 | | | | 95,300 | | | | 95,300 | | | | 82,372 | | | | 82,372 | |
Consumers, concessionaires and permittees, net | | Loans and receivables | | | 2 | | | | 1,977,415 | | | | 1,977,415 | | | | 1,368,336 | | | | 1,368,336 | |
Derivative financial instruments | | Loans and receivables | | | 2 | | | | 17,951 | | | | 17,951 | | | | 16,209 | | | | 16,209 | |
Account receivables from Portion A and other financial items | | Loans and receivables | | | 2 | | | | 912,784 | | | | 912,784 | | | | 722,198 | | | | 722,198 | |
Indemnification assets (concession) | | Available for sale | | | 3 | | | | 2,406,338 | | | | 2,406,338 | | | | 2,125,968 | | | | 2,125,968 | |
| | | | | | |
Liabilities | | | | | | | | | | | | | | | | | | | | | | |
Loans and financing in local currency | | Loans and receivables | | | 2 | | | | 1,429,466 | | | | 1,481,984 | | | | 1,489,316 | | | | 1,473,502 | |
Debentures in local currency | | Loans and receivables | | | 2 | | | | 1,619,881 | | | | 1,584,203 | | | | 1,590,379 | | | | 1,592,056 | |
Loans and financing in foreign currency | | Loans and receivables | | | 2 | | | | 11,246 | | | | 11,180 | | | | 7,440 | | | | 7,034 | |
Derivative financial instruments – (energy purchase) | | Loans and receivables | | | 2 | | | | 2,367 | | | | 2,367 | | | | — | | | | — | |
Trade accounts payable | | Loans and receivables | | | 2 | | | | 1,613,572 | | | | 1,613,572 | | | | 1,384,819 | | | | 1,384,819 | |
The estimated market value of swap transactions was prepared based on the discounted present value of future cash flows model, discounted at market rates presented by the BM&F as of September 30, 2015.
At September 30, 2015, December, 2014, 2013 and January 1st, 2013 the Group had swap operations, as shown below:
COELCE
| | | | | | | | | | | | | | | | | | |
| | | Agreement
date | | | Maturity
date | | | Position | | Reference values | |
Counterparty | | | | | 09/30/2015 | | | 12/31/2014 | |
HSBC Bank Brasil S.A. | | | 11/8/2012 | | | | 10/17/2016 | | | CDI + 0.97% p.a. 9.43%p | | | (5,661 | ) | | | (5,569 | ) |
G-70
Enel Brasil S.A.
Notes to the consolidated financial statements (Continued)
September 30, 2015 and 2014, December 31, 2014 and 2013 and January 1st, 2013
(In thousands of reais, unless otherwise stated)
| 23. | Financial instruments and operating risks (Continued) |
COELCE (Continued)
| | | | | | | | | | | | | | | | | | | | | | | | | | |
| | | | | Fair value | | | Accumulated effect
up to 09/30/2015 | | | Accumulated effect
up to 12/31/2014 | |
Counterparty | | Description | | 09/30/2015 | | | 12/31/2014 | | | Receivables/
received | | | Payables/
Paid | | | Receivables/
received | | | Payables/paid | |
HSBC Bank Brasil S.A. | | (+) Assets | | | 108,555 | | | | 104,566 | | | | — | | | | — | | | | — | | | | — | |
| | (-) Liabilities | | | 102,894 | | | | 98,997 | | | | — | | | | — | | | | — | | | | — | |
| | | | | | | | | | | | | | | | | | | | | | | | | | |
| | (=) Adjustment | | | 5,661 | | | | 5,569 | | | | 5,661 | | | | — | | | | 5,569 | | | | — | |
| | | | | | | | | | | | | | | | | | | | | | | | | | |
| | | | | | | | | | | | | | | | | | |
| | | Agreement
date | | | Maturity
date | | | Position | | Reference values | |
Counterparty | | | | | 12/31/2013 | | | 01/01/2013 | |
HSBC Bank Brasil S.A. | | | 11/8/2012 | | | | 10/17/2016 | | | CDI + 0.97% p.a
9.43%p | | | (6,548 | ) | | | 637 | |
| | | | | | | | | | | | | | | | | | | | | | | | | | |
| | | | | Fair value | | | Accumulated effect up
to 12/31/2013 | | | Accumulated effect up
to 01/01/2013 | |
Counterparty | | Description | | 12/31/2013 | | | 01/01/2013 | | | Receivables/
Received | | | Payables/
Paid | | | Receivables/
Received | | | Payables/
Paid | |
HSBC Bank Brasil S.A. | | (+) Assets | | | 103,870 | | | | 108,167 | | | | — | | | | — | | | | — | | | | — | |
| | (-) Liabilities | | | 97,322 | | | | 108,804 | | | | — | | | | — | | | | — | | | | — | |
| | | | | | | | | | | | | | | | | | | | | | | | | | |
| | (=) Adjustment | | | 6,548 | | | | (637 | ) | | | 6,548 | | | | — | | | | — | | | | (637 | ) |
Ampla Energia
| | | | | | | | | | | | | | | | | | |
| | | | | | | | | | | Reference values | |
| | | Agreement
date | | | Maturity
date | | | Position | | Local currency | |
Counterparty | | | | | 09/30/2015 | | | 12/21/2014 | |
HSBC Bank Brasil S.A. | | | 09/03/2012 | | | | 06/16/2017 | | | CDI + 1.02% p.a.
10.05% p.a. | | | (7,820 | ) | | | (6,235 | ) |
HSBC Bank Brasil S.A. | | | 11/08/2012 | | | | 06/16/2016 | | | CDI + 1.20% p.a.
9.59% p.a. | | | (3,375 | ) | | | (4,405 | ) |
| | | | | | | | | | | | | | | | | | | | | | | | | | |
| | | | | Fair value | | | Accumulated effect
up to 09/30/2015 | | | Accumulated effect
up to 12/31/2014 | |
Counterparty | | Description | | 09/30/2015 | | | 12/31/2014 | | | Receivables/
received | | | Payables/
paid | | | Receivables/
received | | | Payables
paid | |
| | Swap agreements | | | | | | | | | | | | | | | | | | | | | | | | |
HSBC Bank Brasil S.A. | | (+) Assets | | | 102,003 | | | | 99,029 | | | | — | | | | — | | | | — | | | | — | |
| | (-) Liabilities | | | 94,183 | | | | 92,794 | | | | — | | | | — | | | | — | | | | — | |
| | | | | | | | | | | | | | | | | | | | | | | | | | |
| | (=) Adjustment | | | 7,820 | | | | 6,235 | | | | 7,820 | | | | — | | | | 6,235 | | | | — | |
| | | | | | | | | | | | | | | | | | | | | | | | | | |
HSBC Bank Brasil S.A. | | (+) Assets | | | 59,659 | | | | 115,057 | | | | — | | | | — | | | | — | | | | — | |
| | (-) Liabilities | | | 56,284 | | | | 110,652 | | | | — | | | | — | | | | — | | | | — | |
| | | | | | | | | | | | | | | | | | | | | | | | | | |
| | (=) Adjustment | | | 3,375 | | | | 4,405 | | | | 3,375 | | | | — | | | | 4,405 | | | | — | |
| | | | | | | | | | | | | | | | | | | | | | | | | | |
G-71
Enel Brasil S.A.
Notes to the consolidated financial statements (Continued)
September 30, 2015 and 2014, December 31, 2014 and 2013 and January 1st, 2013
(In thousands of reais, unless otherwise stated)
| 23. | Financial instruments and operating risks (Continued) |
Ampla Energia (Continued)
| | | | | | | | | | | | | | | | | | |
| | | | | | | | | | | Reference values | |
| | | Agreement
date | | | Maturity
date | | | Position | | Local currency | |
Counterparty | | | | | 12/31/2013 | | | 01/01/2013 | |
HSBC Bank Brasil S.A. | | | 09/03/2012 | | | | 6/16/2017 | | | CDI + 1.02% p.a.
10.05% p.a. | | | (7,224 | ) | | | 1,891 | |
HSBC Bank Brasil S.A. | | | 11/18/2012 | | | | 06/16/2016 | | | CDI + 1.20% p.a.
9.59% p.a. | | | (6,125 | ) | | | 540 | |
| | | | | | | | | | | | | | | | | | | | | | | | | | |
Counterparty | | Description | | Fair value | | | Accumulated effect
up to 12/31/2013 | | | Accumulated effect
up to 01/01/2013 | |
| | | 12/31/2013 | | | 01/01/2013 | | | Receivables/
Received | | | Payables/
Paid | | | Receivables/
Received | | | Payables
Paid | |
| | Swap agreements: | | | | | | | | | | | | | | | | | | | | | | | | |
HSBC Bank Brasil S.A. | | (+) Assets | | | 98,994 | | | | 103,991 | | | | — | | | | — | | | | — | | | | — | |
| | (-) Liabilities | | | 91,770 | | | | 105,882 | | | | — | | | | — | | | | — | | | | — | |
| | | | | | | | | | | | | | | | | | | | | | | | | | |
| | (=) Adjustment | | | 7,224 | | | | (1,891 | ) | | | 7,224 | | | | | | | | — | | | | (1,891 | ) |
| | | | | | | | | | | | | | | | | | | | | | | | | | |
HSBC Bank Brasil S.A. | | (+) Assets | | | 115,201 | | | | 121,243 | | | | — | | | | — | | | | — | | | | — | |
| | (-) Liabilities | | | 109,076 | | | | 121,784 | | | | — | | | | — | | | | — | | | | — | |
| | | | | | | | | | | | | | | | | | | | | | | | | | |
| | (=) Adjustment | | | 6,125 | | | | (541 | ) | | | 6,125 | | | | | | | | — | | | | (541 | ) |
| | | | | | | | | | | | | | | | | | | | | | | | | | |
G-72
Enel Brasil S.A.
Notes to the consolidated financial statements (Continued)
September 30, 2015 and 2014, December 31, 2014 and 2013 and January 1st, 2013
(In thousands of reais, unless otherwise stated)
| 23. | Financial instruments and operating risks (Continued) |
CGTF
| | | | | | | | | | | | | | | | | | | | | | | | | | | | | | | | | | |
| | | | | | | | | | | | | | Reference values | | | | | | | | | | |
| | | | | | | | | | | | | | Foreing
Currency | | | Local
Currency | | | Fair value | | | Accumulated effect
up to 09/30/2014 | |
Counterparty | | Description | | Agreement
date | | | Maturity
date | | | Position | | | 09/30/15 | | | 09/30/15 | | | 09/30/15 | | | Receivables/
received | | | Paybles/
paid | |
| | Swaps agreements: | | | | | | | | | | | | | | | | | | | | | | | | | | | | | | | | |
| | (+) Assets | | | | | | | | | | | USD | | | | USD 4.220 | | | R$ | 16.766 | | | | 16,777 | | | | — | | | | — | |
Itaú | | (-) Liabilities | | | 09/04/15 | | | | 10/22/15 | | | | BRL | | | | | | | | | | | | 16,523 | | | | — | | | | — | |
| | | | | | | | | | | | | | | | | | | | | | | | | | | | | | | | | | |
| | (=) Adjustment | | | | | | | | | | | | | | | | | | | | | | | 254 | | | | 254 | | | | — | |
| | | | | | | | | | | | | | | | | | | | | | | | | | | | | | | | | | |
| | (+) Assets | | | | | | | | | | | USD | | | | | | | | | | | | 17,343 | | | | — | | | | — | |
Itaú | | (-) Liabilities | | | 09/04/15 | | | | 11/23/15 | | | | BRL | | | | USD 4.360 | | | R$ | 17.322 | | | | 17,045 | | | | — | | | | — | |
| | | | | | | | | | | | | | | | | | | | | | | | | | | | | | | | | | |
| | (=) Adjustment | | | | | | | | | | | | | | | | | | | | | | | 298 | | | | 298 | | | | — | |
| | | | | | | | | | | | | | | | | | | | | | | | | | | | | | | | | | |
| | (+) Assets | | | | | | | | | | | USD | | | | | | | | | | | | 16,734 | | | | — | | | | — | |
Itaú | | (-) Liabilities | | | 09/04/15 | | | | 12/22/15 | | | | BRL | | | | USD 4.220 | | | R$ | 16.766 | | | | 16,455 | | | | — | | | | — | |
| | | | | | | | | | | | | | | | | | | | | | | | | | | | | | | | | | |
| | (=) Adjustment | | | | | | | | | | | | | | | | | | | | | | | 279 | | | | 279 | | | | — | |
| | | | | | | | | | | | | | | | | | | | | | | | | | | | | | | | | | |
| | (+) Assets | | | | | | | | | | | USD | | | | | | | | | | | | 17,227 | | | | — | | | | — | |
Itaú | | (-) Liabilities | | | 09/04/15 | | | | 01/22/16 | | | | BRL | | | | USD 4.360 | | | R$ | 17.322 | | | | 16,963 | | | | — | | | | — | |
| | | | | | | | | | | | | | | | | | | | | | | | | | | | | | | | | | |
| | (=) Adjustment | | | | | | | | | | | | | | | | | | | | | | | 264 | | | | 264 | | | | — | |
| | | | | | | | | | | | | | | | | | | | | | | | | | | | | | | | | | |
| | (+) Assets | | | | | | | | | | | USD | | | | | | | | | | | | 18,344 | | | | — | | | | — | |
Itaú | | (-) Liabilities | | | 09/28/15 | | | | 02/22/16 | | | | BRL | | | | USD 4.654 | | | R$ | 18.488 | | | | 18,961 | | | | — | | | | — | |
| | | | | | | | | | | | | | | | | | | | | | | | | | | | | | | | | | |
| | (=) Adjustment | | | | | | | | | | | | | | | | | | | | | | | (617 | ) | | | — | | | | (617 | ) |
| | | | | | | | | | | | | | | | | | | | | | | | | | | | | | | | | | |
| | (+) Assets | | | | | | | | | | | USD | | | | | | | | | | | | 17,061 | | | | — | | | | — | |
Itaú | | (-) Liabilities | | | 09/28/15 | | | | 03/22/16 | | | | BRL | | | | USD 4.353 | | | R$ | 17.295 | | | | 17,661 | | | | — | | | | — | |
| | | | | | | | | | | | | | | | | | | | | | | | | | | | | | | | | | |
| | (=) Adjustment | | | | | | | | | | | | | | | | | | | | | | | (600 | ) | | | — | | | | (600 | ) |
| | | | | | | | | | | | | | | | | | | | | | | | | | | | | | | | | | |
| | (+) Assets | | | | | | | | | | | USD | | | | | | | | | | | | 18,143 | | | | — | | | | — | |
Itaú | | (-) Liabilities | | | 09/28/15 | | | | 04/22/16 | | | | BRL | | | | USD 4.654 | | | R$ | 18.488 | | | | 18,811 | | | | — | | | | — | |
| | | | | | | | | | | | | | | | | | | | | | | | | | | | | | | | | | |
| | (=) Adjustment | | | | | | | | | | | | | | | | | | | | | | | (668 | ) | | | — | | | | (668 | ) |
| | | | | | | | | | | | | | | | | | | | | | | | | | | | | | | | | | |
| | (+) Assets | | | | | | | | | | | USD | | | | | | | | | | | | 12,218 | | | | — | | | | — | |
Itaú | | (-) Liabilities | | | 09/28/15 | | | | 05/23/16 | | | | BRL | | | | USD 3.152 | | | R$ | 12.524 | | | | 12,700 | | | | — | | | | — | |
| | | | | | | | | | | | | | | | | | | | | | | | | | | | | | | | | | |
| | (=) Adjustment | | | | | | | | | | | | | | | | | | | | | | | (482 | ) | | | — | | | | (482 | ) |
| | | | | | | | | | | | | | | | | | | | | | | | | | | | | | | | | | |
| | | | | | | | | | | | | | | | | | | | | | | | | (1,272 | ) | | | 1,095 | | | | (2,367 | ) |
| | | | | | | | | | | | | | | | | | | | | | | | | | | | | | | | | | |
G-73
Enel Brasil S.A.
Notes to the consolidated financial statements (Continued)
September 30, 2015 and 2014, December 31, 2014 and 2013 and January 1st, 2013
(In thousands of reais, unless otherwise stated)
| 23. | Financial instruments and operating risks (Continued) |
CGTF (Continued)
| | | | | | | | | | | | | | | | | | | | | | | | | | |
| | | | | | | | | | | Reference values | |
| | | Agreement
date | | | Maturity
date | | | Position | | Foreign currency | | | Local currency | |
Counterparty | | | | | 12/31/2013 | | | 01/01/2013 | | | 12/31/2013 | | | 01/01/2013 | |
| | | 06/15/2006 | | | | 12/15/2015 | | | Libor | | | | | | | | | | | | | | | | |
Banco Santander Brasil S.A. | | | | 5.4% (a/360) a.a | | | 5,961 | | | | 8,647 | | | | 13,965 | | | | 17,670 | |
| | | | | | | |
| | | | | | | | | | Libor + 2.25% | | | | | | | | | | | | | | | | |
Banco Citibank | | | 03/20/2007 | | | | 12/15/2015 | | | IGPM + 9.77%. | | | 6,807 | | | | 9,874 | | | | 15,946 | | | | 20,177 | |
| | | | | | | | | | | | | | | | | | | | | | | | | | |
| | | | | | | | | | | | | 12,768 | | | | 18,521 | | | | 29,911 | | | | 37,847 | |
| | | | | | | | | | | | | | | | | | | | | | | | | | |
| | | | | | | | | | | | | | | | | | | | | | | | | | |
| | | | | | | | Accumulated effect
up to 12/31/2013 | | | Accumulated effect
up to 01/01/2013 | |
| | | | | Fair value | | | Receivables/
Received | | | Payables/
Paid | | | Receivables/
Received | | | Payables/
Paid | |
Counterparty | | Description | | 12/31/2013 | | | 01/01/2013 | | | | | |
| | Swap agreements: | | | | | | | | | | | | | | | | | | | | | | | | |
Banco Santander Brasil S.A. | | (+) Assets | | | 14,036 | | | | 17,835 | | | | — | | | | — | | | | — | | | | — | |
| | (-) Liabilities | | | 14,909 | | | | 19,378 | | | | — | | | | — | | | | — | | | | — | |
| | | | | | | | | | | | | | | | | | | | | | | | | | |
| | (=) Adjustment | | | (873 | ) | | | (1,543 | ) | | | — | | | | (873 | ) | | | — | | | | (1,543 | ) |
Banco Citibank | | (+) Assets | | | 16,322 | | | | 20,846 | | | | — | | | | — | | | | — | | | | — | |
| | (-) Liabilities | | | 22,994 | | | | 34,222 | | | | — | | | | — | | | | — | | | | — | |
| | | | | | | | | | | | | | | | | | | | | | | | | | |
| | (=) Adjustment | | | (6,672 | ) | | | (13,376 | ) | | | — | | | | (6,672 | ) | | | — | | | | (13,376 | ) |
| | | | | (7,545 | ) | | | (14,919 | ) | | | — | | | | (7,545 | ) | | | — | | | | (14,919 | ) |
| | | | | | | | | | | | | | | | | | | | | | | | | | |
Supplementary sensitivity analysis on financial instruments
These analyzes are intended to illustrate the sensitivity to changes in market variables in the financial instruments of the Company. The Company’s management regularly reviews these estimates and assumptions used in the calculations. Nonetheless, settlement of transactions involving these estimates may result in amounts different from those estimated due to the subjectivity inherent to the process used in the preparation of these analyzes.
See below sensitivity analysis in the Company’s debts established by projecting financial expenses for the next 12 months according to the future curve of indicators published by BM & F.
COELCE
| | | | | | | | | | | | |
Agreement Index | | 09/30/2015 | | | Scenario + 25% | | | Scenario + 50% | |
CDI | | | 66,016 | | | | 81,276 | | | | 96,099 | |
IPCA | | | 57,810 | | | | 65,143 | | | | 72,358 | |
TJLP | | | 11,041 | | | | 12,742 | | | | 14,421 | |
Fixed | | | 18,649 | | | | 18,649 | | | | 18,649 | |
US Dollars | | | 3,865 | | | | 6,477 | | | | 8,648 | |
| | | | | | | | | | | | |
| | | 157,381 | | | | 184,287 | | | | 210,175 | |
| | | | | | | | | | | | |
G-74
Enel Brasil S.A.
Notes to the consolidated financial statements (Continued)
September 30, 2015 and 2014, December 31, 2014 and 2013 and January 1st, 2013
(In thousands of reais, unless otherwise stated)
| 23. | Financial instruments and operating risks (Continued) |
Supplementary sensitivity analysis on financial instruments (Continued)
Ampla Energia
| | | | | | | | | | | | |
Agreement Index | | 09/30/2015 | | | Scenario + 25% | | | Scenario + 50% | |
CDI | | | 75,765 | | | | 92,021 | | | | 107,813 | |
IPCA | | | 88,048 | | | | 99,297 | | | | 110,365 | |
TJLP | | | 29,792 | | | | 34,330 | | | | 38,812 | |
Fixed | | | 7,729 | | | | 7,729 | | | | 7,729 | |
| | | | | | | | | | | | |
| | | 201,334 | | | | 233,377 | | | | 264,719 | |
| | | | | | | | | | | | |
The sensitivity analysis established with the use of scenarios and projections regarding future events related to the behavior of swaps and NDFs of Group:
COELCE
| | | | | | | | | | | | |
Agreement Index | | 09/30/2015 | | | Scenario + 25% | | | Scenario + 50% | |
Debenture – 1st Serie 3rd Issue | | | 15,263 | | | | 18,567 | | | | 21,782 | |
Swap agreements – Assets | | | (15,263 | ) | | | (18,567 | ) | | | (21,782 | ) |
Swap agreements – Liabilities | | | 9,116 | | | | 9,116 | | | | 9,116 | |
| | | | | | | | | | | | |
| | | 9,116 | | | | 9,116 | | | | 9,116 | |
| | | | | | | | | | | | |
Ampla Energia
| | | | | | | | | | | | |
Agreement Index | | 09/30/2015 | | | Scenario + 25% | | | Scenario + 50% | |
Debenture – 1st Serie 6th and 7th Issue | | | 21,952 | | | | 26,670 | | | | 31,254 | |
Swap agreements – Assets | | | (21,952 | ) | | | (26,670 | ) | | | (31,254 | ) |
Swap agreements – Liabilities | | | 12,505 | | | | 12,505 | | | | 12,505 | |
| | | | | | | | | | | | |
| | | 12,505 | | | | 12,505 | | | | 12,505 | |
| | | | | | | | | | | | |
CGTF
| | | | | | | | | | | | |
Agreement Index | | 09/30/2015 | | | Scenario + 25% | | | Scenario + 50% | |
Gas Agreement – Take/Ship or pay | | | — | | | | — | | | | — | |
Swap agreements – Assets | | | 133,848 | | | | 167,310 | | | | 200,772 | |
Swap agreements – Liabilities | | | (135,120 | ) | | | (135,120 | ) | | | (135,120 | ) |
| | | | | | | | | | | | |
| | | (1,272 | ) | | | 32,190 | | | | 65,652 | |
| | | | | | | | | | | | |
G-75
Enel Brasil S.A.
Notes to the consolidated financial statements (Continued)
September 30, 2015 and 2014, December 31, 2014 and 2013 and January 1st, 2013
(In thousands of reais, unless otherwise stated)
| | | | | | | | | | | | | | | | |
| | | 09/30/2015 | | | 12/31/2014 | | | 12/31/2013 | | | 01/01/2013 | |
Value-Added Tax – ICMS | | | 132,746 | | | | 67,091 | | | | 72,540 | | | | 80,383 | |
Income tax and social contribution | | | 113,724 | | | | 33,702 | | | | 112,558 | | | | 57,639 | |
Services Tax – ISS | | | 3,189 | | | | 4,402 | | | | 3,268 | | | | 3,178 | |
Social Integration Program – PIS | | | 12,123 | | | | 5,933 | | | | 8,260 | | | | 10,264 | |
Social investment program – COFINS | | | 56,324 | | | | 27,568 | | | | 36,146 | | | | 44,826 | |
PIS/COFINS/IRRF/CSRF (withheld at source) | | | 3,705 | | | | 3,243 | | | | 1,852 | | | | 2,045 | |
Social contributions | | | 5,662 | | | | 4,292 | | | | 6,160 | | | | 6,280 | |
Other taxes and contributions | | | 15,428 | | | | 27,174 | | | | 10,509 | | | | 11,032 | |
| | | | | | | | | | | | | | | | |
Total | | | 342,901 | | | | 173,405 | | | | 251,293 | | | | 215,647 | |
| | | | | | | | | | | | | | | | |
| | | | | | | | | | | | | | | | |
| | | 09/30/2015 | | | 12/31/2014 | | | 12/31/2013 | | | 01/01/2013 | |
Fuel consumption bill (CCC) | | | — | | | | — | | | | — | | | | 10,389 | |
Energy development account (CDE) (*) | | | 175,582 | | | | 5,551 | | | | 2,945 | | | | 14,338 | |
Global reversal reserve (RGR) and others | | | 1,337 | | | | 6,039 | | | | 11,475 | | | | 38,596 | |
Reserve energy charges (EER) | | | — | | | | 2,620 | | | | — | | | | 1,999 | |
Financial offset for use of water resources (CFURH) | | | 101 | | | | 101 | | | | 2,507 | | | | 3,836 | |
Ex-isolated charges | | | 72 | | | | 72 | | | | 57 | | | | 3,028 | |
Inspection fee | | | 407 | | | | 2,030 | | | | 2,067 | | | | 2,066 | |
Emergency charges | | | 2,448 | | | | 2,468 | | | | 2,467 | | | | 2,465 | |
| | | | | | | | | | | | | | | | |
Total | | | 179,947 | | | | 18,881 | | | | 21,518 | | | | 76,717 | |
| | | | | | | | | | | | | | | | |
| (*) | During 2015, the amounts to be charged for CDE increased in order to recompose the balances on the fund that had been used in the prior years. Those amounts are paid by the consumer through tariff, collected by Ampla Energia and COELCE (distribution companies), and then paid to Centrais Elétricas Brasileiras S.A. – Eletrobras. At September 30, 2015, the balance includes provisions for payments related to the last 3 months, of which approximately R$ 73,000 was paid in October 2015. |
The balance of the global reversal reserve refers to the provision of the amounts to be paid to Centrais Elétricas Brasileiras S.A. – Eletrobras, calculated based on 2.5% of property, plant and equipment, limited to 3% of gross revenues from electric energy operations. These amounts are regulated on an annual basis through orders issued by the Economic and Financial Inspection Department (SFF) of ANEEL.
G-76
Enel Brasil S.A.
Notes to the consolidated financial statements (Continued)
September 30, 2015 and 2014, December 31, 2014 and 2013 and January 1st, 2013
(In thousands of reais, unless otherwise stated)
| 26. | Research, development and energy efficiency programs |
| | | | | | | | | | | | | | | | |
| | | 09/30/2015 | | | 12/31/2014 | |
| | | Current | | | Non-current | | | Current | | | Non-current | |
Electricity Efficiency Program (PEE) | | | 21,965 | | | | 45,532 | | | | 21,965 | | | | 64,797 | |
Research & Development Program (P&D) | | | 49,832 | | | | 42,289 | | | | 54,723 | | | | 40,730 | |
Brazilian National Fund for Scientific and Technological Development (FNDCT) | | | 548 | | | | — | | | | 493 | | | | — | |
Ministry of Mines and Energy (MME) | | | 4,889 | | | | — | | | | 257 | | | | — | |
| | | | | | | | | | | | | | | | |
Total | | | 77,234 | | | | 87,821 | | | | 77,438 | | | | 105,527 | |
| | | | | | | | | | | | | | | | |
| | | | | | | | | | | | | | | | |
| | | 12/31/2013 | | | 01/01/2013 | |
| | | Current | | | Non-current | | | Current | | | Non-current | |
Electricity Efficiency Program (PEE) | | | 36,058 | | | | 48,342 | | | | 42,475 | | | | 18,321 | |
Research & Development Program (P&D) | | | 58,756 | | | | 27,044 | | | | 57,976 | | | | 13,970 | |
Brazilian National Fund for Scientific and Technological Development (FNDCT) | | | 559 | | | | — | | | | 820 | | | | — | |
Energy Research Company (EPE) | | | (55 | ) | | | — | | | | — | | | | — | |
Ministry of Mines and Energy (MME) | | | (80 | ) | | | — | | | | 39 | | | | — | |
| | | | | | | | | | | | | | | | |
Total | | | 95,238 | | | | 75,386 | | | | 101,310 | | | | 32,291 | |
| | | | | | | | | | | | | | | | |
Under Law No. 9,991 of July 24, 2000, concessionaires and permittees of public electric energy distribution services must allocate each year, one percent (1%) of their net operating revenue to Research, Development and Energy Efficiency Program, distributed according to the percentages determined by ANEEL.
The subsidiaries COELCE, Ampla Energia, CGTF and CDSA account for expenditures relating to the Research, Development and Energy Efficiency Program on the accrual basis, also amounts are restated by Selic rate through to effective realization.
| 27. | Installment tax program |
| | | | | | | | | | | | | | | | | | | | | | | | | | | | | | | | | | | | |
| | | PAES | | | REFIS IV
Federal | | | REFIS
ICMS | | | REFIS
INSS | | | REFERJ | | | Auto
IRPJ/CSLL | | | ICMS | | | REFIS
IR | | | Total | |
Balances at January 01, 2013 | | | 11,824 | | | | 18,796 | | | | 2,594 | | | | 6,245 | | | | 1,717 | | | | 4,863 | | | | 16,085 | | | | 8,561 | | | | 70,685 | |
(+) Additions | | | — | | | | — | | | | 4,237 | | | | — | | | | — | | | | — | | | | — | | | | — | | | | 4,237 | |
(-) Payments | | | (4,786 | ) | | | (2,799 | ) | | | (3,441 | ) | | | (6,890 | ) | | | (752 | ) | | | (4,750 | ) | | | (17,014 | ) | | | (6,320 | ) | | | (46,752 | ) |
(+) Update | | | 756 | | | | 1,802 | | | | 424 | | | | 1,134 | | | | 163 | | | | 101 | | | | 929 | | | | 129 | | | | 5,438 | |
| | | | | | | | | | | | | | | | | | | | | | | | | | | | | | | | | | | | |
Balances at December 31, 2013 | | | 7,794 | | | | 17,799 | | | | 3,814 | | | | 489 | | | | 1,128 | | | | 214 | | | | — | | | | 2,370 | | | | 33,608 | |
| | | | | | | | | | | | | | | | | | | | | | | | | | | | | | | | | | | | |
Current | | | 5,196 | | | | 1,643 | | | | 3,814 | | | | 489 | | | | 752 | | | | 214 | | | | — | | | | 2,370 | | | | 14,478 | |
Non-current | | | 2,598 | | | | 16,156 | | | | — | | | | — | | | | 376 | | | | — | | | | — | | | | — | | | | 19,130 | |
G-77
Enel Brasil S.A.
Notes to the consolidated financial statements (Continued)
September 30, 2015 and 2014, December 31, 2014 and 2013 and January 1st, 2013
(In thousands of reais, unless otherwise stated)
| 27. | Installment tax program (Continued) |
| | | | | | | | | | | | | | | | | | | | | | | | | | | | | | | | |
| | | PAES | | | REFIS IV
Federal | | | REFIS
ICMS | | | REFIS
INSS | | | REFERJ | | | Auto
IRPJ/CSLL | | | REFIS
IR | | | Total | |
Balance at December 31 ,2013 | | | 7,794 | | | | 17,799 | | | | 3,814 | | | | 489 | | | | 1,128 | | | | 214 | | | | 2,370 | | | | 33,608 | |
(-) Write-offs | | | — | | | | — | | | | — | | | | — | | | | — | | | | — | | | | 6,013 | | | | 6,013 | |
(-) Payments | | | (8,229 | ) | | | (1,035 | ) | | | (4,201 | ) | | | (583 | ) | | | (726 | ) | | | (214 | ) | | | (8,390 | ) | | | (23,378 | ) |
(+) Updates | | | 435 | | | | — | | | | 387 | | | | 94 | | | | 62 | | | | — | | | | 7 | | | | 985 | |
| | | | | | | | | | | | | | | | | | | | | | | | | | | | | | | | |
Balance at December 31, 2014 | | | — | | | | 16,764 | | | | — | | | | — | | | | 464 | | | | — | | | | — | | | | 17,228 | |
| | | | | | | | | | | | | | | | | | | | | | | | | | | | | | | | |
Current | | | — | | | | 1,719 | | | | — | | | | — | | | | 464 | | | | — | | | | — | | | | 2,183 | |
Non-Current | | | — | | | | 15,045 | | | | — | | | | — | | | | — | | | | — | | | | — | | | | 15,045 | |
| | | | | | | | | | | | |
| | | REFIS IV
Federal | | | REFERJ | | | Total | |
Balance at December 31 ,2014 | | | 16,764 | | | | 464 | | | | 17,228 | |
(-) Payments | | | (2,351 | ) | | | (464 | ) | | | (2,815 | ) |
| | | | | | | | | | | | |
Balance at September 30, 2015 | | | 14,413 | | | | — | | | | 14,413 | |
| | | | | | | | | | | | |
Current | | | — | | | | — | | | | — | |
Non-current | | | 14,413 | | | | — | | | | 14,413 | |
G-78
Enel Brasil S.A.
Notes to the consolidated financial statements (Continued)
September 30, 2015 and 2014, December 31, 2014 and 2013 and January 1st, 2013
(In thousands of reais, unless otherwise stated)
The Enel Group carry out operations with related parties that belong to the same economic group, and the balances, nature and total of transactions and effects on the consolidated financial statements are as follows:
| | | | | | | | | | | | | | | | | | | | | | | | | | | | | | | | | | | | | | | | | | | | | | | | | | | | |
| | | | | | | 09/30/2015 | | | 12/31/2014 | | | 09/30/2014 | |
| | | | | | | | | | | | | (Unaudited) | |
Companies | | Ref, | | Type of
transaction | | Non-current
assets | | | Current
liabilities | | | Non-current
liabilities | | | Revenues
(expenses) | | | Intangible
assets | | | Non-current
assets | | | Current
liabilities | | | Non-current
liabilities | | | Revenues
(expenses) | | | Intangible
assets | | | Intangible
assets | | | Revenues
(expenses | |
Fundação COELCE de Seguridade Social – FAELCE | | | | Acknowledgment
of debt | | | — | | | | 5,573 | | | | — | | | | — | | | | — | | | | — | | | | 770 | | | | — | | | | — | | | | — | | | | — | | | | — | |
| | (a.1) | | Pension plan | | | — | | | | — | | | | 77,268 | | | | (6,224 | ) | | | 274 | | | | — | | | | — | | | | 90,312 | | | | (2,719 | ) | | | 406 | | | | 406 | | | | (1,639 | ) |
Fundação Brasiletros | | (a.2) | | Pension plan | | | — | | | | — | | | | 473,069 | | | | (33,568 | ) | | | — | | | | — | | | | — | | | | 445,033 | | | | (47,753 | ) | | | — | | | | — | | | | (35,814 | ) |
CEMSA – Comercializadora del Mercosulr S.A. | | (b) | | Energy
transportation | | | 125,571 | | | | — | | | | 127,389 | | | | (32,884 | ) | | | — | | | | 86,686 | | | | — | | | | 86,182 | | | | 20,527 | | | | — | | | | — | | | | 23,541 | |
Endesa Costanera S.A. | | (b) | | Energy
transportation | | | 47,544 | | | | — | | | | 47,505 | | | | (12,405 | ) | | | — | | | | 33,011 | | | | — | | | | 32,324 | | | | 7,557 | | | | — | | | | — | | | | 8,745 | |
Enel Energy Europe | | (c) | | Services rendered | | | — | | | | — | | | | 4,219 | | | | (4,219 | ) | | | — | | | | — | | | | 2,894 | | | | — | | | | (3,718 | ) | | | — | | | | — | | | | (2,722 | ) |
Enel Ingegneria e Innovazione | | (d) | | Services rendered | | | — | | | | — | | | | — | | | | — | | | | — | | | | — | | | | 2,417 | | | | — | | | | (630 | ) | | | — | | | | — | | | | — | |
Enel Green Power Desenvolvimento Ltda. | | | | Services rendered | | | — | | | | 5,982 | | | | — | | | | — | | | | — | | | | — | | | | 1,597 | | | | — | | | | — | | | | — | | | | — | | | | — | |
| | | | | | | | | | | | | | | | | | | | | | | | | | | | | | | | | | | | | | | | | | | | | | | | | | | | |
| | | | | | | 173,115 | | | | 11,555 | | | | 729,450 | | | | (89,300 | ) | | | 274 | | | | 119,697 | | | | 7,678 | | | | 653,851 | | | | (26,736 | ) | | | 406 | | | | 406 | | | | (7,889 | ) |
| | | | | | | | | | | | | | | | | | | | | | | | | | | | | | | | | | | | | | | | | | | | | | | | | | | | |
(-) Pension plan | | | | | | | — | | | | (5,573 | ) | | | (550,337 | ) | | | — | | | | — | | | | — | | | | (770 | ) | | | (535,345 | ) | | | | | | | — | | | | — | | | | — | |
| | | | | | | | | | | | | | | | | | | | | | | | | | | | | | | | | | | | | | | | | | | | | | | | | | | | |
Total related parties | | | | | | | 173,115 | | | | 5,982 | | | | 179,113 | | | | (89,300 | ) | | | 274 | | | | 119,697 | | | | 6,908 | | | | 118,506 | | | | (26,736 | ) | | | 406 | | | | 406 | | | | (7,889 | ) |
| | | | | | | | | | | | | | | | | | | | | | | | | | | | | | | | | | | | | | | | | | | | | | | | | | | | |
G-79
Enel Brasil S.A.
Notes to the consolidated financial statements (Continued)
September 30, 2015 and 2014, December 31, 2014 and 2013 and January 1st, 2013
(In thousands of reais, unless otherwise stated)
| 28. | Related parties (Continued) |
| | | | | | | | | | | | | | | | | | | | | | | | | | | | | | | | | | | | | | | | | | | | |
| | | | | | | 12/31/2013 | | | 01/01/2013 | |
Companies | | Ref, | | Type of transaction | | Non-current
assets | | | Current
liabilities | | | Non-current
liabilities | | | Revenues
(expenses) | | | Intangible
assets | | | Non-current
assets | | | Current
liabilities | | | Non-current
liabilities | | | Revenues
(expenses) | | | Intangible
assets | |
Enersis S,A, | | | | Other | | | — | | | | — | | | | — | | | | — | | | | — | | | | 235 | | | | 2 | | | | 99 | | | | — | | | | — | |
Fundação COELCE de Seguridade Social – FAELCE | | (a.1) | | Pension plan | | | | | | | | | | | 84,506 | | | | (7,406 | ) | | | 606 | | | | | | | | | | | | 64,849 | | | | (5,684 | ) | | | 574 | |
| | | | Acknowledgment of debt | | | — | | | | 12,824 | | | | — | | | | — | | | | — | | | | — | | | | 12,098 | | | | 6,049 | | | | | | | | — | |
Fundação Brasiletros | | (a.2) | | Pension plan | | | — | | | | — | | | | 393,339 | | | | (46,715 | ) | | | — | | | | — | | | | — | | | | 480,896 | | | | (50,069 | ) | | | — | |
CEMSA – Comercializadora del Mercosulr S,A, | | (b) | | Energy transportation | | | 86,541 | | | | — | | | | 87,737 | | | | 24,675 | | | | — | | | | 86,539 | | | | — | | | | 87,757 | | | | 9,824 | | | | — | |
Endesa Costanera S,A, | | (b) | | Energy transportation | | | 33,285 | | | | — | | | | 33,267 | | | | 9,072 | | | | — | | | | 33,701 | | | | — | | | | 33,720 | | | | 3,336 | | | | — | |
Enel Energy Europe | | (c) | | Services rendered | | | — | | | | 3,382 | | | | — | | | | (3,208 | ) | | | — | | | | — | | | | — | | | | — | | | | — | | | | — | |
Enel Ingegneria e Innovazione | | (d) | | Services rendered | | | — | | | | 1,789 | | | | — | | | | (1,789 | ) | | | — | | | | — | | | | — | | | | — | | | | — | | | | — | |
Enel Green Power Desenvolvimento Ltda | | | | Services rendered | | | — | | | | 1,597 | | | | — | | | | — | | | | — | | | | — | | | | — | | | | — | | | | — | | | | — | |
ICT – Serviciós Informáticos Ltda, | | | | Services rendered | | | — | | | | 8,806 | | | | — | | | | (2,494 | ) | | | — | | | | — | | | | 6,304 | | | | — | | | | (3,414 | ) | | | — | |
| | | | | | | | | | | | | | | | | | | | | | | | | | | | | | | | | | | | | | | | | | | | |
| | | | | | | 119,826 | | | | 28,398 | | | | 598,849 | | | | (27,865 | ) | | | 606 | | | | 120,475 | | | | 18,404 | | | | 673,370 | | | | (46,007 | ) | | | 574 | |
(-) Pension plan | | | | | | | — | | | | (12,824 | ) | | | (477,845 | ) | | | — | | | | — | | | | — | | | | (12,098 | ) | | | (551,794 | ) | | | — | | | | — | |
| | | | | | | | | | | | | | | | | | | | | | | | | | | | | | | | | | | | | | | | | | | | |
(-) Pension plan | | | | | | | 119,826 | | | | 15,574 | | | | 121,004 | | | | (27,865 | ) | | | 606 | | | | 120,475 | | | | 6,306 | | | | 121,576 | | | | (46,007 | ) | | | 574 | |
| | | | | | | | | | | | | | | | | | | | | | | | | | | | | | | | | | | | | | | | | | | | |
The main conditions related to transactions between related parties are described below:
| | a) | Private pension obligations |
| | a.1) | Private Pension – FAELCE |
Subsidiary COELCE, as the sponsor of FAELCE, performs monthly transfers for the financial maintenance of FAELCE and makes contributions to the actuarial reserve for private pension plans of employees of subsidiary COELCE, classified as for “Defined Benefits” and “Defined Contribution”.
The total expenditure on September 30, 2015 was R$ 6,498 (R$ 2,045 for September 30, 2015), comprising R$ 6,624 (R$ 1,639 for September 30, 2015) as operating expense of subsidiary COELCE and R$ 274 (R$ 406 for September 30, 2015) capitalized to intangible assets.
The balance at September 30, 2015 was R$ 82,841 (R$ 90,312 for December 31, 2014), which represents the amount of contribution of subsidiary COELCE (sponsor) payable to pension plans, see Note 32.
G-80
Enel Brasil S.A.
Notes to the consolidated financial statements (Continued)
September 30, 2015 and 2014, December 31, 2014 and 2013 and January 1st, 2013
(In thousands of reais, unless otherwise stated)
| 28. | Related parties (Continued) |
| | a) | Private pension obligations (Continued) |
| | a.2) | Fundação Ampla de Seguridade Social – BRASILETROS |
Subsidiary Ampla Energia, as the sponsor of Fundação Ampla de Seguridade Social – BRASILETROS, performs monthly transfers for the maintenance of that entity and financial contributions to the actuarial reserve of the private pension plans of employees of the subsidiary classified as PCA (Supplementary Private Pension Plan) and PACV (Private Pension Plan with Variable Contribution).
As a guarantee for the operation, subsidiary Ampla Energia offers the credit rights that it has or comes to have, represented by the collection of electricity bills, until the amount of debt due, also collection of amounts from the payment of credit rights will be made through authorized banking network, transferring funds to the bank account indicated by Brasiletros. The total expenditure for the nine month period ended September 30, 2015 was R$ 33,568 (R$ 35,814 for 2014).
At September 30, 2015, the balance of R$ 473,069 (R$ 445,033, R$ 393,339 and 480,896 for December 31, 2014, 2013 and January 1st, 2013, respectively) corresponds to contribution of subsidiary Ampla Energia (sponsor) payable to pension plans, see Note 32.
| | b) | CEMSA – Comercializadora del Mercosur S.A. and Endesa Costanera S.A. |
The accounts payable with CEMSA and Costanera in the amounts of R$ 174,894 as at September 30, 2015 (R$ 118,506, R$ 121,004 and R$ 121,477 for December 31, 2014, 2013 and January 1st, 2013, respectively) are due to the purchase of electricity for resale in the Brazilian market held in previous years. The balances are financially updated on a monthly basis, incurring also the currency fluctuations, as the contract was settled on US dollars.
The Company has a contract with Enel Energy referring to software licensing, implementation and maintenance services.
This agreement totaled R$ 4,219 as services cost for the nine month periods ended September 30, 2015 (R$ 2,722 for September 30, 2015), and the corresponding liability of R$ 4,219 at September 30, 2015 (R$ 2,893, R$ 3,382 for December 31, 2014 and 2013, respectively).
| | d) | Enel Ingegneria e Innovazione |
The Company has a contract with Enel Ingegneria e Innovazzione, referring to the performance of technological innovation, and R&D projects, and the corresponding liability of null at September 30, 2015 (R$ 2,417 and R$ 1,597 in December 31, 2014 and 2013, respectively).
Management Compensation
The Group’s compensation paid to the key personnel for the nine month period ended September 30, 2015 totaled R$ 9,772 (R$ 12,468 for December 31, 2014), which are short-term benefits. Management compensation paid by the Company and its subsidiaries for the nine month period ended September 30, 2015 aggregated are R$ 31,063 (R$ 38,217 in 2014).
G-81
Enel Brasil S.A.
Notes to the consolidated financial statements (Continued)
September 30, 2015 and 2014, December 31, 2014 and 2013 and January 1st, 2013
(In thousands of reais, unless otherwise stated)
| 29. | Provision for tax, civil and labor risks |
Management believes that all provisions set up are sufficient to cover any losses from the proceedings pending trial. Based on the opinion of legal counsel, a provision was set up for all legal proceedings of which the chances of loss were estimated as probable for the Group.
| | a) | Provisions for probable contingent liabilities |
Below is a statement showing the changes in provisions for contingencies in September 30, 2015, comparative to the prior periods:
| | | | | | | | | | | | | | | | | | | | | | | | |
Description | | 12/31/2014 | | | Additions | | | Disposals /
reversals | | | Monetary
restatement | | | Payment | | | 09/30/2015 | |
Labor (i) | | | 190,935 | | | | 26,975 | | | | (20,027 | ) | | | 25,567 | | | | (16,067 | ) | | | 207,383 | |
Civil (ii) | | | 313,126 | | | | 101,786 | | | | (41,811 | ) | | | 63,787 | | | | (67,715 | ) | | | 369,173 | |
Tax (iii) | | | 31,948 | | | | — | | | | — | | | | 2,585 | | | | (611 | ) | | | 33,922 | |
Regulatory (iv) | | | 127,887 | | | | 7,074 | | | | (2,243 | ) | | | 1,969 | | | | (34,793 | ) | | | 99,894 | |
Environmental (v) | | | 3,000 | | | | — | | | | — | | | | — | | | | — | | | | 3,000 | |
| | | | | | | | | | | | | | | | | | | | | | | | |
Total | | | 666,896 | | | | 135,835 | | | | (64,081 | ) | | | 93,908 | | | | (119,186 | ) | | | 713,372 | |
| | | | | | | | | | | | | | | | | | | | | | | | |
| | | | | | | | | | | | | | | | | | | | | | | | |
Description | | 12/31/2013 | | | Additions | | | Disposals /
reversals | | | Monetary
restatement | | | Payment | | | 12/31/2014 | |
Labor (i) | | | 186,506 | | | | 49,068 | | | | (44,161 | ) | | | 16,590 | | | | (17,068 | ) | | | 190,935 | |
Civil (ii) | | | 292,883 | | | | 122,203 | | | | (63,712 | ) | | | 42,907 | | | | (81,155 | ) | | | 313,126 | |
Tax (iii) | | | 68,341 | | | | 1,566 | | | | (1,407 | ) | | | (17,882 | ) | | | (18,670 | ) | | | 31,948 | |
Regulatory (iv) | | | 87,877 | | | | — | | | | — | | | | 59,627 | | | | (19,617 | ) | | | 127,887 | |
Environmental (v) | | | 3,000 | | | | — | | | | — | | | | — | | | | — | | | | 3,000 | |
| | | | | | | | | | | | | | | | | | | | | | | | |
Total | | | 638,607 | | | | 172,837 | | | | (109,280 | ) | | | 101,242 | | | | (136,510 | ) | | | 666,896 | |
| | | | | | | | | | | | | | | | | | | | | | | | |
| | | | | | | | | | | | | | | | | | | | |
Description | | 01/01/2013 | | | Additions /
reversals | | | Monetary
restatement | | | Payment | | | 12/31/2013 | |
Labor (i) | | | 180,953 | | | | 4,545 | | | | 12,624 | | | | (12,513 | ) | | | 185,609 | |
Civil (ii) | | | 284,550 | | | | 45,119 | | | | 48,827 | | | | (68,144 | ) | | | 310,352 | |
Tax (iii) | | | 68,592 | | | | (1,562 | ) | | | 3,614 | | | | (1,406 | ) | | | 69,238 | |
Regulatory (iv) | | | 54,376 | | | | 27,415 | | | | — | | | | (11,383 | ) | | | 70,408 | |
Environmental (v) | | | 3,000 | | | | — | | | | — | | | | — | | | | 3,000 | |
| | | | | | | | | | | | | | | | | | | | |
Total | | | 591,471 | | | | 75,517 | | | | 65,065 | | | | (93,446 | ) | | | 638,607 | |
| | | | | | | | | | | | | | | | | | | | |
They refer to various labor suits claiming, among others, indemnification for pain and suffering, reinstatement to work, overtime pay, risk exposure additional, severance pay and salary pay differences. In addition, there are suits relating to employees of subcontractors who claim employment relationship with the subsidiaries and equalization with rights of employees of such subsidiaries.
G-82
Enel Brasil S.A.
Notes to the consolidated financial statements (Continued)
September 30, 2015 and 2014, December 31, 2014 and 2013 and January 1st, 2013
(In thousands of reais, unless otherwise stated)
| 29. | Provision for tax, civil and labor risks (Continued) |
| | a) | Provisions for probable contingent liabilities (Continued) |
These encompass civil lawsuits, including consumer-related matters, in which the subsidiaries are defendants, and a significant portion of the provision is linked to proceedings claiming indemnification for accidents with electricity, compensation for tariff adjustment allegedly illegal and less complex proceedings pending trial by small claims courts.
The remaining provision balance is divided into lawsuits claiming indemnification for damages due to voltage fluctuation in electricity supply, disruption of supply, improper collection of amounts and others in connection with consumer-related matters.
Enel Brasil
Notices of delinquency – PIS/Cofins
In 2006, the Brazilian IRS served two notices of delinquency for PIS and Cofins on equity interest and other financial income earned from 2001 to 2005. At the Brazilian IRS appellate division level, the notices of delinquency were ruled to have partial grounds, but groundless as financial income was concerned.
In view of the foregoing and of the administrative case law, the Company established a provision for the portion of notices of delinquency whose likelihood of loss was rated as probable (amounts of PIS and Cofins levied on interest on equity). The remaining portion of the notices of delinquency was rated as possible loss (See Note 29.b)(iii)).
The Company settled this required probable portion in cash in August 2014 within the REFIS program, pursuant to Law Nº 12,996/14, recording a financial gain of R$ 12,902 (related to the benefit of the reduction of the penalties to settle the claim).
Subsidiary Ampla Energia:
Rio de Janeiro State filed a Tax Enforcement Claim to collect tax debts arising from alleged tax underpayment, from February 1999 to September 2000, amounting to R$ 12,158 at September 30, 2015 (restated).
Tax notices issued by the Rio de Janeiro State for collection of State value-added tax (ICMS), for the period from December 1996 to November 1998, and November 1998 to March 1999, arguing that assets acquired for fixed assets purposes were not related to the subsidiary’s business activity. Provisions equivalent to 40% and 20% of the tax notices, i.e., in the amount restated at September 30, 2015 of R$ 4,932 (notice amounts to R$ 12,331) and R$ 469 (notice amounts to R$ 2,345).
Subsidiary Ampla Energia
Punitive regulatory proceedings are regulated by ANEEL Administrative Ruling No. 063/2004. The penalties provided for in the regulation range from warning to revocation of the concession or permission.
G-83
Enel Brasil S.A.
Notes to the consolidated financial statements (Continued)
September 30, 2015 and 2014, December 31, 2014 and 2013 and January 1st, 2013
(In thousands of reais, unless otherwise stated)
| 29. | Provision for tax, civil and labor risks (Continued) |
| | a) | Provisions for probable contingent liabilities (Continued) |
| | (iv) | Regulatory Risk (Continued) |
Subsidiary Ampla Energia (Continued)
Initially, the subsidiary is served a notice by the regulator about any nonconformity identified. The subsidiary will have 15 days to respond to such notice. Subsequently, if any irregularities are confirmed, a violation notice is issued with penalties to nonconformities. The subsidiary will have 10 days to file an appeal.
These penalties are applicable to all agents of the electric energy industry and calculated based on billing.
| | (v) | Environmental Contingencies |
The provision made in the amount of R$ 3,000 refers to the environmental lawsuit filed in 2001 by the Goiás State Office of the Public Prosecutor against CDSA, pending trial in the judicial district of Cachoeira Dourada, for alleged damages caused by the installation of the dam where the hydroelectric Power plant of Cachoeira Dourada was built.
Lower trial court’s judgment was rendered in favor of CDSA, which was reversed by the Appellate Court, determining conduction of an expert inspection to determine any possible damages. CDSA filed a special appeal against the judgment.
Legal advisors, conservatively, recommended recognizing a provision, in view of the case nature and taking into account professional experience in similar cases involving environmental damage with resolution negotiated with the Office of the Public Prosecutor.
| | b) | Contingencies involving possible loss |
There are proceedings against the Enel Group of tax, civil and labor nature, for which a provision has not been recognized, since they involve risk of loss classified by management and its legal counsel as possible, which total approximately R$ 6,280,450 at September 30, 2015 (R$ 4,310,892, R$ 8,603,000 and R$7,440,000 in December 31, 2014, 2013 and January 1st, 2013).
Subsidiary Ampla Energia
Collective labor lawsuit – The group of former employees who were dismissed from AMPLA between the 1992 and 1995 years due to retirement, require their reinstatement, stating that possessed professional stability as a rule stated in normative act 29 of Council of the Ministry of Mines and Energy. The risk involved in the lawsuit is updated at September 30, 2015 is R$149 million.
The main labor cases are related to overtime payment, job reinstatement, secondary and joint liability, salary differences, severance pay, indemnification for pain and suffering and material damage, accidents at work, etc.
G-84
Enel Brasil S.A.
Notes to the consolidated financial statements (Continued)
September 30, 2015 and 2014, December 31, 2014 and 2013 and January 1st, 2013
(In thousands of reais, unless otherwise stated)
| 29. | Provision for tax, civil and labor risks (Continued) |
| | b) | Contingencies involving possible loss (Continued) |
The legal position of subsidiaries includes civil lawsuits mostly claiming from defendant indemnification for pain and suffering and material damages.
Subsidiary Ampla Energia
| | • | | CIBRAN is a pharmaceutical company, currently in judicial bankruptcy proceedings, filed (six) lawsuits against Ampla to obtain compensation for damages caused by failures in the AMPLA’s electricity distribution service. The relevant amount, updated at September 30, 2015, involved in the six is R$320,494. |
| | • | | Federal Prosecutor filed lawsuit against AMPLA to obtain compensation (return of value – tariff – to consumers) because of an error in the value of the charged tariff. The Brazilian regulatory agency (ANEEL) is also party in the lawsuit, since it is responsible for setting the tariff rate charged by AMPLA of its customers. The estimated amount, updated at September 30, 2015 is R$107 million. |
Subsidiary Coelce
COERCE is a rural cooperative that has leased some equipments (transformers and lines) used by COELCE in the electricity distribution service. The COERCE filed a lawsuit in which requires the revision of the amounts paid by COELCE for the use of equipments. The risk involved in the lawsuit at September 30, 2015 is R$107 million.
Subsidiary CIEN
Tractebel Energia S.A. (“Tractebel”)
Tractebel filed an ordinary action claiming alleged noncompliance, by CIEN, of the “Sale Agreement of 300MW of Firm Power and Associated Energy from Argentina” executed on October 20, 1999, by and between CIEN and Centrais Geradoras do Sul do Brasil S.A. (Gerasul), and Tractebel is its successor. According to this action, Tractebel requests that CIEN be condemned to pay the termination fine in the estimated amount of R$ 117 million, in addition to penalties alleged applicable for non-availability of “firm power and associated energy”, which amounts would be calculated at the stage of liquidation of the award and cannot be currently estimated. Also according to this action, Tractebel ignored the widely acknowledged current crisis in Argentina, which started in 2005, and its effects on said agreement and the ongoing statements made by the applicable Brazilian authorities who released CIEN, and its clients, including Tractebel itself, from any regulatory penalties, since they have recognized that the crisis in Argentina was a factor alien to CIEN’s willingness and beyond its control. CIEN has challenged the action and alleged “force majeure” event preventing the performance of contractual obligations. The claim is currently suspended until the outcome of another legal claim involving the parties, whose matter impairs the development of the former
G-85
Enel Brasil S.A.
Notes to the consolidated financial statements (Continued)
September 30, 2015 and 2014, December 31, 2014 and 2013 and January 1st, 2013
(In thousands of reais, unless otherwise stated)
| 29. | Provision for tax, civil and labor risks (Continued) |
| | b) | Contingencies involving possible loss (Continued) |
| | (ii) | Civil risks (Continued) |
Subsidiary CIEN (Continued)
Furnas – Centrais Elétricas S.A. (“Furnas”)
Furnas filed an ordinary action claiming alleged noncompliance by CIEN of the “Agreement for Firm Power with Associated Energy”, executed on May 5, 1998, to acquire 700 MW from Argentina. According to the action, Furnas requests that CIEN be condemned to pay the termination fine in the estimated amount of R$ 520 million and refunds and penalties which amounts would be calculated in the stage of liquidation of the award and these cannot be currently determined. Also, according to the action, Furnas ignored the widely acknowledged current crisis in Argentina, which started in 2005, and its effects on said agreement and the ongoing statements made by the applicable Brazilian authorities who released CIEN, and its clients, including Furnas itself, from any regulatory penalties, since they have recognized that the crisis in Argentina was a factor alien to CIEN’s willingness and beyond its control. CIEN has challenged the action and alleged “force majeure” event preventing the performance of contractual obligations. The claim was ruled not to have grounds in relation to all claims filed by Furnas. Within the deadline to file an appeal, a petition was presented by Furnas, currently pending decision. CIEN have not yet had access to the contents of such petition.
Enel Brasil
Notices of delinquency – Brazilian IR
In 2014, the Brazilian IRS served a notice of delinquency requiring the collection of income tax on dividends supposedly distributed in excess in 2009 and 2010. The Company filed a protest letter and waits for the decision to be handed down at the Brazilian IRS appellate division level. The relevant amount, updated at September 30, 2015, is R$ 227,727.
Notices of delinquency – PIS/Cofins
The remaining portion of the notices of delinquency mentioned on Note 29.a)(iii), whose likelihood of loss was rated as possible, amounts to R$ 21,137 for Cofins and R$ 2,992 for PIS (financial income earned during the effectiveness of Law Nº 9,718/98 and after the effectiveness of Decree Nº 5,164/2004).
Subsidiary Coelce
Following are significant claims to which legal advisors estimate the likelihood of loss as possible and which do not require any provision to be established.
| | • | | At the state level, the subsidiary has been holding discussions on various ICMS matters, amounting to R$ 338,791 at September 30, 2015, as follows: special regime from Agreement No. 035/91; master records of tax exempt, immune and non-taxable consumers; credit on capital expenditures; transfer of credits; cancellation of invoices; reversal of credit – low income consumer; tax on certain operations; energy acquired for own consumption and difference between values recorded and values reported in the tax statements. |
G-86
Enel Brasil S.A.
Notes to the consolidated financial statements (Continued)
September 30, 2015 and 2014, December 31, 2014 and 2013 and January 1st, 2013
(In thousands of reais, unless otherwise stated)
| 29. | Provision for tax, civil and labor risks (Continued) |
| | b) | Contingencies involving possible loss (Continued) |
| | (iii) | Tax risks (Continued) |
Subsidiary Coelce (Continued)
| | • | | At City level, the subsidiary is party to legal and administrative proceedings in the City of Fortaleza, referring to the Service tax (ISS), totaling R$ 34,753 at September 30, 2015. These refer to: ancillary services; personal property leases; amounts withheld at source, and services rendered in other cities. In the City of Iguatu, tax enforcement amounting to R$ 3,264 at September 30, 2015. |
| | • | | With regard to federal taxes, the subsidiary is a party to (i) administrative claims on IRPJ, amounting to R$ 7,952, (ii) legal claim on IRPJ and CSLL for R$ 20,285, and a (iii) legal claim on COFINS for R$ 1,092 at September 30, 2015. |
In addition to these proceedings, the subsidiary is party to other proceedings involving lower amounts, in connection with CSLL, Contribution tax on gross revenue for social integration program (PIS), Contribution tax on gross revenue for social security financing (COFINS), State value-added tax (ICMS), Municipal real property tax (IPTU) and Service tax (ISS), totaling R$ 7,952 (R$ 7,000 in 2014).
Subsidiary Ampla Energia
Tax withheld at source – Issue of Fixed Rate Notes (FRN)
In 2005 by the Brazilian IRS issued a tax notice, as it understood that the subsidiary was no longer subject to the zero rate tax benefit of the Withholding income tax (IRRF) levied on interest and other income transferred to parties abroad, due to Fixed Rate Notes (FRN) issued by the subsidiary in 1998. A decision awarded to an appeal was favorable to the subsidiary. The subsidiary was served notice about the decisions handed down by the Administrative Board of Tax Appeals (CARF), whereby the Tax Notice was deemed founded. As a result, the subsidiary filed for a provisional remedy for guarantee anticipation in order to obtain a certificate attesting to the regular payment of existing tax debts. This is still under discussion by means of a legal proceeding. The amount involved in this proceeding, restated at September 30, 2015, is R$ 1,111,937 (R$ 1,068,018 at December 31, 2014).
COFINS
Delinquent tax collection procedures in connection with a notice of delinquency served by the Brazilian IRS in 2003 to collect COFINS debts from a supposed default from December 2001 to March 2002. The value involved in the claim, restated at September 30, 2015, reaches R$ 147,305 (R$ 142,141 at December 31, 2014).
ICMS – Due date
The Rio de Janeiro State Finance Office served in 2005 a notice of delinquency in connection with a voluntary payment, out of the legal due date set by Decree No. 31,632/02, of ICMS and ICMS surtax earmarked for the State Fund to Combat Poverty, without payment of legal interest and fines. In 2012 the subsidiary was noticed of the decision made by the Full Bench Board, which upheld the notice of delinquency and filed an appeal to the State Finance Officer. Notwithstanding the appeal filed, delinquent tax collection procedures were initiated, and the subsidiary has been discussing the matter through legal claims. The amount involved in these claims, restated at September 30, 2015, reaches R$ 280,710 (R$ 268,912 at December 31, 2014).
G-87
Enel Brasil S.A.
Notes to the consolidated financial statements (Continued)
September 30, 2015 and 2014, December 31, 2014 and 2013 and January 1st, 2013
(In thousands of reais, unless otherwise stated)
| 29. | Provision for tax, civil and labor risks (Continued) |
| | b) | Contingencies involving possible loss (Continued) |
| | (iii) | Tax risks (Continued) |
Subsidiary Ampla Energia (Continued)
ICMS – Various subjects
At the state level, the subsidiary has been holding discussions on various ICMS matters, amounting to R$ 209,403 at September 30, 2015, as follows: due date; credit on capital expenditures; offsetting of credits; outgoing goods for repair; comparison between management reports and tax registers and prior months’ cancellations.
Local issues
At local level, the subsidiary has been challenging, with the Niterói, Rio Bonito and Rio das Ostras Cities, issues related to the Soil Use Charge, and, with the City of Niterói, issues related to the occupation charge, totaling R$ 37,072 at September 30, 2015. As regards the ISS, there is a tax notice issued by the City of Cabo Frio and tax enforcement filed by the City of Niterói, amounting to R$ 10,688 and R$ 1,848, respectively, at September 30, 2015.
In addition to these proceedings, as of September 30, 2015, the subsidiary is party to other proceedings involving lower amounts, in connection with IRPJ, PIS, COFINS, ICMS, IPTU and ISS, in the restated amount of R$ 6,889 (R$ 6,955 in 2014).
Subsidiary CDSA
CSLL – offsetting of tax loss balance
The Brazilian IRS served the subsidiary a tax notice for the offsetting of tax base losses computed in base years 1998 to 1999. The subsidiary filed a declaratory judgment action, claiming for full deposit of the debt amount, to discuss the matter in court. The appeal of this matter is pending judgment. The restated proceeding amount in September 2015 is R$ 17,732 (R$ 17,182 in 2014).
In addition to these proceedings, the subsidiary is party to other tax proceedings involving lower amounts, totaling R$ 759 at September 30, 2015.
Subsidiary CGTF
II and IPI – Eletrogêneo Group
The subsidiary filed two legal actions (a declaratory judgment action and an incidental declaratory action) in February 2002 and January 2003, respectively, to ensure its right to classify as “Eletrogêneo Group” imported machinery and equipment, thus levying II and IPI at 0% rate. The subsidiary was handed down a final favorable decision and, at December 5, 2014, and judicial deposits of R$ 80,615 were ultimately released to the subsidiary. The remaining value of judicial deposit, restated as R$ 3,710 in September 2015 (R$ 3,640 in 2014), is still pending release.
G-88
Enel Brasil S.A.
Notes to the consolidated financial statements (Continued)
September 30, 2015 and 2014, December 31, 2014 and 2013 and January 1st, 2013
(In thousands of reais, unless otherwise stated)
| 29. | Provision for tax, civil and labor risks (Continued) |
| | b) | Contingencies involving possible loss (Continued) |
| | (iii) | Tax risks (Continued) |
Subsidiary CGTF (Continued)
PIS and COFINS
The subsidiary was served a notice by the Brazilian IRS for differences between PIS and COFINS amounts reported and those recorded in November 2003 and from February to November 2004. The subsidiary is awaiting a decision on its appeal by CARF. The tax notice restated amount is R$ 74,352 in September 2015 (R$ 71,205 in 2014).
Subsidiary CIEN
PIS/COFINS
The National Finance Department filed two tax enforcement actions to collect PIS and COFINS debts, in the restated amount of R$ 1,070 and R$ 4,543 at September 30, 2015. The subsidiary is awaiting judgment of the appeals filed.
IRPJ/CSLL
Brazilian IRS issued a tax notice on December 29, 2008, to collect IRPJ and CSLL debts arising from underpayment in 2003. The subsidiary partially paid the tax notice, and challenged the portion related to the collection of a single fine in December 2003. The challenged amount is R$ 9,385 (restated) at September 30, 2015.
ICMS – rate differential
In 2008 the State of Rio Grande do Sul filed a delinquent tax collection suit for R$ 16,983 at September 30, 2015 to charge the rate differential levied in February, March and April 2001. The appeal filed by the State is still pending decision.
The subsidiary filed a petition for a writ of mandamus to ensure its right not to pay the rate differential on interstate acquisitions. Whereas the subsidiary has become a member in the “Adjust Program” (refinancing and installment payment of State debts), and in light of relevant conversion to income and partial release to the subsidiary , the remaining value currently deposited was as high as R$ 617 at September 30, 2015. The subsidiary expects this amount to be released.
Subsidiary Ampla Energia
In connection with the Motion to set aside the judgment filed by the Public Treasury, an unappealable decision by way of Writ of Mandamus whereby subsidiary Ampla COFINS contribution tax immunity until year 2001 had been recognized was confirmed in March 2010. Subsidiary Ampla currently seeks refund of amounts paid in a specific suit. The likelihood of loss is remote since the sole subject matter of this proceeding is claiming refund of amounts unduly paid (recognized as such by operation of the COFINS immunity confirmed), and there is nothing further to object to subsidiary Ampla’s right to said refund. The updated amount of this process at September 30, 2015 is R$ 165,410.
G-89
Enel Brasil S.A.
Notes to the consolidated financial statements (Continued)
September 30, 2015 and 2014, December 31, 2014 and 2013 and January 1st, 2013
(In thousands of reais, unless otherwise stated)
At September 30, 2015, fully subscribed and paid-in capital is represented by 178,692,925 voting common shares with no par value (178,692,925 in 2014)
At September 30, 2015 and December 31, 2014, the Company’s equity holding breaks down as follows:
| | | | | | | | | | | | | | | | | | | | | | | | | | | | | | | | |
| | | 09/30/2015 | | | 12/31/2014 | | | 12/31/2013 | | | 01/01/2013 | |
| | | Number of
common
shares | | | % equity
participation | | | Number of
common
shares | | | % equity
participation | | | Number of
common
shares | | | % equity
participation | | | Number of
common
shares | | | % equity
participation | |
Empresa Nacional de Electricidad S.A. | | | 60,299,607 | | | | 33.75 | | | | 60,299,607 | | | | 33.75 | | | | 60,299,607 | | | | 33.75 | | | | 60,299,607 | | | | 35.29 | |
Cono Sur Participaciones S.A. | | | — | | | | — | | | | — | | | | — | | | | — | | | | — | | | | 47,354,669 | | | | 27.71 | |
Enersis S.A. | | | 87,200,363 | | | | 48.80 | | | | 87,200,363 | | | | 48.80 | | | | 87,200,363 | | | | 48.80 | | | | 36,677,243 | | | | 21.47 | |
Chilectra S.A. | | | 9,275,291 | | | | 5.19 | | | | 9,275,291 | | | | 5.19 | | | | 9,275,291 | | | | 5.19 | | | | 7,742,714 | | | | 4.53 | |
Chilectra Inversud S.A. | | | 10,342,306 | | | | 5.79 | | | | 10,342,306 | | | | 5.79 | | | | 10,342,306 | | | | 5.79 | | | | 7,227,787 | | | | 4.23 | |
Edegel S.A. | | | 6,957,053 | | | | 3.89 | | | | 6,957,053 | | | | 3.89 | | | | 6,957,053 | | | | 3.89 | | | | 6,957,053 | | | | 4.07 | |
| | | | | | | | | | | | | | | | | | | | | | | | | | | | | | | | |
Grupo Enel | | | 174,074,620 | | | | 97.42 | | | | 174,074,620 | | | | 97.42 | | | | 174,074,620 | | | | 97.42 | | | | 166,259,073 | | | | 97.30 | |
| | | | | | | | | | | | | | | | | | | | | | | | | | | | | | | | |
Treasury shares | | | 4,618,298 | | | | 2.58 | | | | 4,618,298 | | | | 2.58 | | | | 4,618,298 | | | | 2.58 | | | | 4,618,298 | | | | 2.70 | |
Board of directors’ members | | | 7 | | | | — | | | | 7 | | | | — | | | | 7 | | | | — | | | | 7 | | | | — | |
| | | | | | | | | | | | | | | | | | | | | | | | | | | | | | | | |
Other | | | 4,618,305 | | | | 2.58 | | | | 4,618,305 | | | | 2.58 | | | | 4,618,305 | | | | 2.58 | | | | 4,618,305 | | | | 2.70 | |
| | | | | | | | | | | | | | | | | | | | | | | | | | | | | | | | |
Total | | | 178,692,925 | | | | 100.00 | | | | 178,692,925 | | | | 100.00 | | | | 178,692,925 | | | | 100.00 | | | | 170,877,378 | | | | 100.00 | |
| | | | | | | | | | | | | | | | | | | | | | | | | | | | | | | | |
The Company’s Articles of Incorporation sets forth that 5% of the annual net income will be used to set up legal reserve, which shall not exceed 20% of the Company’s capital.
From 2012 on, the Company no longer recognizes a legal reserve, in compliance with the provisions of Article 193, paragraph 1, of Law No. 6,404/76, since the sum-up of its capital reserve and legal reserve exceeded 30% of capital.
| | c) | Statutory reserve for working capital |
As provided for by the Company’s Articles of Incorporation, the remaining income for the year, after dividend distribution, will be allocated to a statutory reserve for working capital, except for an adverse resolution at the General Shareholders’ Meeting, as proposed by the Board of Directors. The total of the statutory reserve working capital amount should not exceed the amount of the subscribed capital.
In 2005, shareholders increased the Company’s capital through investments in its current subsidiaries. This capital increase was divided into paid-up capital and capital reserve – Goodwill at the amount exceeding the value attributed to capital.
G-90
Enel Brasil S.A.
Notes to the consolidated financial statements (Continued)
September 30, 2015 and 2014, December 31, 2014 and 2013 and January 1st, 2013
(In thousands of reais, unless otherwise stated)
| | e) | Other comprehensive income |
| | f.1) | Other comprehensive income – actuarial gains and losses |
Pursuant to the standard IAS 19 – Employee Benefits (“IAS 19”), remeasurement gains and losses are generated by adjustments and changes in actuarial assumptions of pension and retirement benefit plans and actuarial commitments referring to the health plan must be recognized under other comprehensive income. For the nine month periods ended September 30, 2015, the Company recognized the net balance of remeasurement losses, under other comprehensive income, in the amount of R$ 23,597 (nill in 2014).
| | f.2) | Other comprehensive income – cumulative translation adjustment |
Pursuant to IAS 21, which determines that the effects of exchange variation on foreign investments be recognized under other comprehensive income, for the nine month periods ended September 30, 2015 the Company recognized the loss amount of R$ 46,020 (gain of R$ 2,089, R$ 15,847 and R$ 1,824 in December 31, 2014, September 30, 2014 and December 31, 2013, respectively) from the conversion of financial statements of foreign subsidiaries, Compañia de Transmisión Del Mercosul S.A. – CTM and Transportadora de Energia S.A. – TESA.
| | f.3) | Other comprehensive income – gains and losses from cash flow hedge |
Pursuant to IAS 39, which determines that the effective portion of gains or losses from derivative financial instruments classified as cash flow hedge be directly recognized in equity under other comprehensive income, for the month periods ended September 30, 2015 the Company recognized the net amount of R$ 3,519 (R$ 1,953, R$ 1,668 and R$ 15,550 in December 31, 2014, September 30, 2014 and December 31, 2013) in other comprehensive income.
G-91
Enel Brasil S.A.
Notes to the consolidated financial statements (Continued)
September 30, 2015 and 2014, December 31, 2014 and 2013 and January 1st, 2013
(In thousands of reais, unless otherwise stated)
The Group’s main long-term-contract-related commitments are as follows:
COELCE
| | | | | | | | | | | | | | | | | | | | | | | | |
| | | Effective up to | | | 2015 | | | 2016 | | | 2017 | | | After 2017 | | | Total | |
01º LEE | | | 2014 | | | | — | | | | — | | | | — | | | | — | | | | | |
01º LEN | | | 2039 | | | | 64,826 | | | | 267,179 | | | | 281,104 | | | | 5,133,053 | | | | 5,746,162 | |
02º LEE | | | 2015 | | | | 10,535 | | | | — | | | | — | | | | — | | | | 10,535 | |
02º LEN | | | 2038 | | | | 2,766 | | | | 11,399 | | | | 11,993 | | | | 409,391 | | | | 435,549 | |
03º LEN | | | 2040 | | | | 19,242 | | | | 79,307 | | | | 83,441 | | | | 1,935,487 | | | | 2,117,477 | |
04º LEE | | | 2016 | | | | 5,217 | | | | 21,503 | | | | — | | | | — | | | | 26,720 | |
04º LEN | | | 2024 | | | | 3,560 | | | | 14,673 | | | | 15,438 | | | | 129,112 | | | | 162,783 | |
05º LEE | | | 2014 | | | | — | | | | — | | | | — | | | | — | | | | — | |
05º LEN | | | 2041 | | | | 32,920 | | | | 135,680 | | | | 134,938 | | | | 2,661,937 | | | | 2,965,475 | |
06º LEN | | | 2025 | | | | 829 | | | | 3,418 | | | | 3,597 | | | | 35,109 | | | | 42,953 | |
07º LEN | | | 2042 | | | | 6,036 | | | | 24,878 | | | | 6,448 | | | | 82,107 | | | | 119,469 | |
08º LEN | | | 2041 | | | | 2 | | | | 9 | | | | 10 | | | | 139 | | | | 160 | |
10º LEN | | | 2044 | | | | 5,269 | | | | 21,715 | | | | 22,847 | | | | 1,153,139 | | | | 1,202,970 | |
11º LEN | | | 2044 | | | | 10,069 | | | | 41,498 | | | | 43,661 | | | | 2,203,649 | | | | 2,298,877 | |
12º LEE | | | 2016 | | | | 13,740 | | | | 50,036 | | | | — | | | | — | | | | 63,776 | |
12º LEN | | | 2043 | | | | 53,407 | | | | 220,115 | | | | 231,587 | | | | 6,231,888 | | | | 6,736,997 | |
13º LEE | | | 2019 | | | | 52,976 | | | | 218,342 | | | | 229,722 | | | | 493,531 | | | | 994,571 | |
14º LEE | | | 2017 | | | | 14,437 | | | | 59,503 | | | | 62,604 | | | | — | | | | 136,544 | |
16º LEN | | | 2047 | | | | — | | | | — | | | | — | | | | 1,920,915 | | | | 1,920,915 | |
17º LEN | | | 2035 | | | | — | | | | 6,678 | | | | 7,026 | | | | 192,038 | | | | 205,742 | |
18º LEN | | | 2047 | | | | — | | | | — | | | | — | | | | 3,130,148 | | | | 3,130,148 | |
ANGRA | | | 2019 | | | | 16,202 | | | | 70,511 | | | | 74,389 | | | | 159,816 | | | | 320,918 | |
Belo Monte | | | 2044 | | | | 875 | | | | 60,024 | | | | 168,940 | | | | 8,882,955 | | | | 9,112,794 | |
Endesa Fortaleza | | | 2023 | | | | 168,890 | | | | 729,017 | | | | 769,113 | | | | 5,393,941 | | | | 7,060,961 | |
Cota | | | 2042 | | | | 25,988 | | | | 113,100 | | | | 119,320 | | | | 5,659,808 | | | | 5,918,216 | |
Jirau | | | 2042 | | | | 8,110 | | | | 33,427 | | | | 35,169 | | | | 1,567,850 | | | | 1,644,556 | |
PROINFA | | | 2025 | | | | 13,200 | | | | 57,446 | | | | 60,606 | | | | 591,212 | | | | 722,464 | |
Santo Antonio | | | 2041 | | | | 3,662 | | | | 15,095 | | | | 15,881 | | | | 664,021 | | | | 698,659 | |
Wobben | | | 2019 | | | | 454 | | | | 1,963 | | | | 2,066 | | | | 2,168 | | | | 6,651 | |
| | | | | | | | | | | | | | | | | | | | | | | | |
Total | | | | | | | 533,212 | | | | 2,256,516 | | | | 2,379,900 | | | | 48,633,414 | | | | 53,803,042 | |
| | | | | | | | | | | | | | | | | | | | | | | | |
EE – Leilão de Energia Existente.
LEN – Leilão de Energia Nova
G-92
Enel Brasil S.A.
Notes to the consolidated financial statements (Continued)
September 30, 2015 and 2014, December 31, 2014 and 2013 and January 1st, 2013
(In thousands of reais, unless otherwise stated)
| 31. | Commitments (Continued) |
Ampla Energia
| | | | | | | | | | | | | | | | | | | | | | | | | | |
| | | Effective up to | | 2015 | | | 2016 | | | 2017 | | | 2018 | | | After 2018 | | | Total | |
Angra | | 2032 | | | 16,452 | | | | 71,263 | | | | 75,474 | | | | 79,625 | | | | 1,564,152 | | | | 1,806,966 | |
Bilateral | | 2022 | | | 13,315 | | | | 57,674 | | | | 61,083 | | | | 64,442 | | | | 289,095 | | | | 485,609 | |
CCGF | | 2032 | | | 27,471 | | | | 132,359 | | | | 140,182 | | | | 147,892 | | | | 2,876,649 | | | | 3,324,553 | |
ITAIPU | | 2023 | | | 156,582 | | | | 669,551 | | | | 697,132 | | | | 753,345 | | | | 4,462,873 | | | | 6,739,483 | |
Proinfa | | 2030 | | | 16,967 | | | | 73,492 | | | | 77,835 | | | | 82,116 | | | | 1,310,311 | | | | 1,560,721 | |
CCEAR 2008 – Energia Existente | | 2015 | | | 14,014 | | | | — | | | | — | | | | — | | | | — | | | | 14,014 | |
CCEAR 2008 – Energia Nova | | 2037 | | | 596 | | | | 2,582 | | | | 2,735 | | | | 2,885 | | | | 64,513 | | | | 73,311 | |
CCEAR 2008 – Energia Nova | | 2022 | | | 6,275 | | | | 27,182 | | | | 28,788 | | | | 30,372 | | | | 136,252 | | | | 228,869 | |
CCEAR 2009 – Energia Existente | | 2016 | | | 12,840 | | | | 55,618 | | | | — | | | | — | | | | — | | | | 68,458 | |
CCEAR 2009 – Energia Nova | | 2038 | | | 7,478 | | | | 32,391 | | | | 34,305 | | | | 36,192 | | | | 1,150,053 | | | | 1,260,419 | |
CCEAR 2009 – Energia Nova (A-3) | | 2023 | | | 13,382 | | | | 57,963 | | | | 61,388 | | | | 64,764 | | | | 367,662 | | | | 565,159 | |
CCEAR 2010 – Energia Nova | | 2039 | | | 13,370 | | | | 57,914 | | | | 61,337 | | | | 64,710 | | | | 2,208,843 | | | | 2,406,174 | |
CCEAR 2010 – Energia Nova | | 2024 | | | 19,575 | | | | 84,791 | | | | 89,802 | | | | 94,741 | | | | 665,060 | | | | 953,969 | |
CCEAR 2011 – Energia Nova | | 2040 | | | 5,094 | | | | 22,066 | | | | 23,370 | | | | 24,655 | | | | 902,272 | | | | 977,457 | |
CCEAR 2011 – Energia Nova | | 2025 | | | 10,189 | | | | 44,133 | | | | 46,742 | | | | 49,312 | | | | 412,405 | | | | 562,781 | |
CCEAR 2012 – Energia Nova | | 2041 | | | 22,606 | | | | 100,311 | | | | 106,239 | | | | 112,082 | | | | 4,388,082 | | | | 4,729,320 | |
CCEAR 2012 – Energia Nova | | 2026 | | | 30,046 | | | | 130,145 | | | | 137,837 | | | | 145,418 | | | | 1,419,505 | | | | 1,862,951 | |
CCEAR 2013 – Energia Nova | | 2042 | | | 18,926 | | | | 106,968 | | | | 113,290 | | | | 119,521 | | | | 4,997,221 | | | | 5,355,926 | |
CCEAR 2013 – Energia Nova | | 2027 | | | 45,558 | | | | 197,337 | | | | 208,999 | | | | 220,494 | | | | 2,473,356 | | | | 3,145,744 | |
CCEAR 2014 – Energia Existente (18M) | | 2015 | | | 530 | | | | — | | | | — | | | | — | | | | — | | | | 530 | |
CCEAR 2014 – Energia Existente (36M) | | 2016 | | | 8,113 | | | | 35,141 | | | | — | | | | — | | | | — | | | | 43,254 | |
CCEAR 2014 – Energia Existente (13LEE) | | 2019 | | | 41,477 | | | | 179,657 | | | | 190,274 | | | | 200,739 | | | | 210,681 | | | | 822,828 | |
CCEAR 2015 – Energia Existente (14LEE) | | 2017 | | | 8,142 | | | | 35,265 | | | | 37,350 | | | | — | | | | — | | | | 80,757 | |
Leilão de Ajustes 2015 | | 2015 | | | 40,266 | | | | — | | | | — | | | | — | | | | — | | | | 40,266 | |
CCEAR 2016 – Energia Nova (A-5) | | 2045 | | | — | | | | 2,523 | | | | 2,672 | | | | 2,819 | | | | 127,775 | | | | 135,789 | |
CCEAR 2016 – Energia Nova (A-5) | | 2035 | | | — | | | | 33,832 | | | | 35,831 | | | | 37,802 | | | | 954,116 | | | | 1,061,581 | |
CCEAR 2016 – 3LFA | | 2035 | | | — | | | | 3,434 | | | | 3,637 | | | | 3,837 | | | | 96,837 | | | | 107,745 | |
CCEAR 2017 – Energia Nova (A-5) | | 2036 | | | — | | | | — | | | | 9,321 | | | | 9,833 | | | | 268,800 | | | | 287,954 | |
CCEAR 2017 – Energia Nova (A-3) | | 2046 | | | — | | | | — | | | | 20,961 | | | | 20,961 | | | | 586,900 | | | | 628,822 | |
CCEAR 2017 – 3LFA | | 2036 | | | — | | | | — | | | | 1,413 | | | | 1,490 | | | | 40,742 | | | | 43,645 | |
CCEAR 2018 – Energia Nova | | 2047 | | | — | | | | — | | | | — | | | | 44,213 | | | | 2,152,670 | | | | 2,196,883 | |
CCEAR 2018 – Energia Nova | | 2047 | | | — | | | | — | | | | — | | | | 75,639 | | | | 3,560,341 | | | | 3,635,980 | |
CCEAR 2019 – Energia Nova (A-5) | | 2048 | | | — | | | | — | | | | — | | | | — | | | | 7,085,926 | | | | 7,085,926 | |
CCEAR 2020 – Energia Nova (A-5) | | 2049 | | | — | | | | — | | | | — | | | | — | | | | 4,820,956 | | | | 4,820,956 | |
| | | | | | | | | | | | | | | | | | | | | | | | | | |
Total | | | | | 549,264 | | | | 2,213,592 | | | | 2,267,997 | | | | 2,489,899 | | | | 49,594,048 | | | | 57,114,800 | |
| | | | | | | | | | | | | | | | | | | | | | | | | | |
The amounts related to contracts for purchase of electricity represent the total amount contract by the current price at the end of 2015, approved by ANEEL.
The subsidiary CDSA maintains commitments of electricity supply entered into with free customers and distributors through Contracts of Purchase and Sale of Electricity under Regulated Environment (CCEAR).
| | | | | | | | | | | | | | | | | | | | | | | | |
| | | 2015 | | | 2016 | | | 2017 | | | 2018 | | | 2019 | | | After 2019 | |
Supplies energy | | | 529,291 | | | | 573,448 | | | | 548,335 | | | | 724,133 | | | | 725,097 | | | | 752,220 | |
G-93
Enel Brasil S.A.
Notes to the consolidated financial statements (Continued)
September 30, 2015 and 2014, December 31, 2014 and 2013 and January 1st, 2013
(In thousands of reais, unless otherwise stated)
| 31. | Commitments (Continued) |
Ampla Energia (Continued)
CGTF maintains commitments of electricity supply entered into with the related party COELCE, with which they have an exclusive long-term electricity supply contract.
| | | | | | | | | | | | | | | | | | | | | | | | |
| | | 2015 | | | 2016 | | | 2017 | | | 2018 | | | 2019 | | | After 2019 | |
Supplies energy | | | 905,417 | | | | 1,007,437 | | | | 1,044,283 | | | | 1,089,607 | | | | 1,115,588 | | | | 1,142,098 | |
Net Revenue | | | 665,828 | | | | 756,322 | | | | 834,734 | | | | 855,151 | | | | 872,394 | | | | 756,322 | |
| 32. | Post-employment benefits |
Subsidiary Ampla Energia
The subsidiary Ampla Energia sponsors a pension fund managed by Ampla Social Security Foundation (BRASILETROS), a non-profit closely-held entity of private Law for supplementary private pension plan. This Foundation manages two benefit plans: one is a defined benefit plan (Supplementary Retirement Plan – PCA), the main purpose of which is supplementing the benefits to which it is entitled, such as social security insured parties and the subsidiary’s employees; and a defined contribution plan (Variable Contribution Retirement Plan – PACV), the main purpose of which is granting benefits from accumulated reserves on behalf of the participants.
The retirement and pension benefit plans are actuarially evaluated in order to measure the sponsor’s commitments with benefit plans offered to its employees and former employees. The balance recorded at September 30, 2015, in the amount of R$ 473,069 (R$ 455,033, R$ 393,339 and 480,896 for December 31, 2014, 2013 and January 1st, 2013, respectively), corresponds to the total liabilities of the sponsor in relation to the plan of benefits.
The plans managed by subsidiary have the following key characteristics:
| | a) | Supplementary Retirement Plan – PCA (Defined Benefit) |
Contributes with 5.56% of the payroll, out of which 1.59% is destined to cover benefits and 3.97% to administrative expenses.
The contribution corresponds to cumulative percentages in accordance with salary range, and based on the social security maximum limit, ranging from 1.75% to 10% of the salary.
This contribution is set on an annual basis, based on the funding plan, which currently corresponds to the same cumulative percentages effective to the active participants.
At December 31, 2001, the subsidiary Ampla Energia recorded actuarial deficit amounting to R$ 118,221, presented in the Supplementary Retirement Plan (PCA), in accordance with CVM Rule No. 371 of December 13, 2000. This deficit was supported by the contract executed on January 1, 2002 with BRASILETROS, setting forth that the deficit would be amortized within 20 years with a grace period of 2 and a half years at a 6% interest rate per annum, plus INPC variations.
G-94
Enel Brasil S.A.
Notes to the consolidated financial statements (Continued)
September 30, 2015 and 2014, December 31, 2014 and 2013 and January 1st, 2013
(In thousands of reais, unless otherwise stated)
| 32. | Post-employment benefits (Continued) |
Subsidiary Ampla Energia (Continued)
| | b) | Variable Contribution Retirement Plan – PACV (Defined Contribution) |
It contributes with 4.16% of the active participants’ payroll, of which 0.19% is destined to cover benefits and 3.97% to administrative expenses.
PACV active participants shall make the contribution described in the Plan Rules, given that the average percentage calculated based on the PACV active population at the evaluation base date is equivalent to 5.08% of the PACV active participants’ payroll.
| | c) | Retiree’s health care plan (PAMA) |
Ampla Energia is obliged to grant health care benefits only to former employees who were dismissed up to December 31, 1997 and who evidenced their absence through the public pension system. These benefits are optional and covered by Ampla Energia and the users on a pre-paid basis.
The plan is managed by Unimed Leste Fluminense by way of agreements with a periodic contribution adjustment clause in view of the group’s loss ratio. The cost is calculated per capita according to a table broken down into 10 age ranges, in accordance with the criteria allowed by ANS.
The plan may be divided into 3 different groups, which share the same policy:
| | • | | Assets – the plan is granted to employees and dependents. The cost collected from employees is determined by Ampla Energia according to the table broken down into three age ranges, collected by family group or family members. Since the contribution is made by employees, it generates life benefits after 10 years of contribution, pursuant to Law No. 9,656. |
| | • | | Retirees Law No. 9,656 – the group that exercised the right to remain in the plan, provided that they make contributions at their own expenses, pursuant to Law No. 9,656. The cost is directly collected by Unimed, the plan’s manager, and contributions per capita are structured by age range. |
| | • | | Retirees PDI – the group of retirees and dependents who enjoy the benefit to remain in the plan, and the costs are determined according to the same rules applied to that of employees, that is, contribution tables with three age ranges, collected by family group or family member in the plan. |
| | d) | Benefit of payment of FGTS fine upon retirement |
Subsidiary Ampla Energia has a Retirement Program ensuring the payment of at least 40% of the FGTS balance plus the employee’s 30-day resignation notice, observing the employment agreement, solely to those who are resigning for retirement.
Only employees who achieved at least 70% of the length of service at Ampla Energia will be entitled to this benefit.
Retirement and pension benefit plans are actuarially assessed in order to measure sponsor’s commitments to benefit plans offered to its employees and former employees. The balance recorded at September 30, 2015 in subsidiary Ampla Energia, amounting to R$ 473,069 (R$ 445,033, R$ 393,339 and 480,896 for December 31, 2014, 2013 and January 1st, 2013, respectively), corresponds to total sponsor’s obligations for
G-95
Enel Brasil S.A.
Notes to the consolidated financial statements (Continued)
September 30, 2015 and 2014, December 31, 2014 and 2013 and January 1st, 2013
(In thousands of reais, unless otherwise stated)
| 32. | Post-employment benefits (Continued) |
Subsidiary Ampla Energia (Continued)
| | d) | Benefit of payment of FGTS fine upon retirement (Continued) |
benefit plans. Based on IFRIC 14 – The Limit on a Defined Benefit Asset, Minimum Funding Requirements and their Interaction, total liabilities include actuarial debt agreements that subsidiary Ampla Energia entered into with Brasiletros, in order to equate deficits of both PCA and PACV plans, since the sponsor assumes the responsibilities of these plans in accordance with current legislation.
Subsidiary COELCE
Subsidiary COELCE sponsors a pension fund managed by COELCE Social Security Foundation (FAELCE), a non-profit closely-held entity of private law for supplementary private pension plan. This Foundation manages two benefit plans: one is a defined benefit plan (BD Plan), the main purpose of which is supplementing the benefits to which it is entitled, such as social security insured parties and COELCE employees; and a defined contribution plan (CD Plan), the main purpose of which is granting benefits from accumulated reserves on behalf of the participants.
The plans managed by subsidiary COELCE have the following key characteristics:
| | a) | Defined Contribution Plan (CD) |
The subsidiary makes monthly contributions for CD Plan in the same amount as the participants’ contributions. The contribution amount varies according to the remunerations, given that its calculation is based on the rates of 2.5%, 4.0% and 9.0% applied on a “cascade” basis. Additionally, the plan offers risk benefits, such as disability and death, paid by Faelce under the cost-sharing regime. To meet IAS 19 (Revised), this portion is considered a defined benefit.
| | b) | Defined Benefit Plan (BD) |
The BD plan is under the capitalization financial regime for retirement, pension and aid benefits.
The benefit plan is covered by contributions from participants and the sponsor. COELCE makes monthly contributions to BD Plan at a 4.45% payroll rate of all its employees and participant managing officers to cover the ordinary cost and at a 2.84% rate on the ratio (not below the unit) between the number of FAELCE employees and participant managing officers at July 31, 1997, and the number of participant employees on the reporting month of amortizing supplementary contribution, being this supplementary contribution in effect for 22 years and 6 months as from July 1997. In addition to this percentage, the sponsor is responsible for paying the administrative expenses of said entity’s social security activities.
Plan benefits include:
| | • | | Supplement to disability retirement. |
| | • | | Supplement to retirement for contribution time. |
| | • | | Supplement to retirement by age. |
| | • | | Supplement to special retirement. |
| | • | | Supplement to reclusion support. |
G-96
Enel Brasil S.A.
Notes to the consolidated financial statements (Continued)
September 30, 2015 and 2014, December 31, 2014 and 2013 and January 1st, 2013
(In thousands of reais, unless otherwise stated)
| 32. | Post-employment benefits (Continued) |
Subsidiary COELCE (Continued)
| | b) | Defined Benefit Plan (BD) (Continued) |
| | • | | Supplement to pension for death. |
| | • | | Supplement to annual bonus. |
The mathematical calculation referring to supplementary retirement and pension benefits of BD plan adopts the projected unit credit.
The health care plan, managed by Unimed Fortaleza, is ruled by way of agreements with a periodic contribution adjustment clause in view of the group’s loss ratio. The costing is calculated per capita according to a table broken down into 10 age ranges, in accordance with the criteria allowed by ANS.
The plan may be divided into 3 different groups which share the same policy:
| | • | | Assets – the plan is granted to employees and dependents. The cost collected by the plan’s manager is partially covered by COELCE, subject to the contribution proportion determined based on the related salary range. Since the contribution is made by employees, it generates life benefits after 10 years of contribution, pursuant to Law No. 9,656. |
| | • | | Retirees Law No. 9,656 – the group that exercised the right to remain in the plan, provided that they make contributions at their own expenses, pursuant to Law No. 9,656. The cost is directly collected by Unimed, the plan’s manager, according to the plan rules. |
| | • | | Special retirees – a closed group of retirees and dependents, partially borne by COELCE (60%), as a result of negotiations ratified by way of a collective agreement. |
| | d) | Benefit of payment of FGTS fine upon retirement |
Pursuant to the collective agreement in force, for retirement cases in any categories, in the event of termination of the employee agreement, the employee will be entitled to receive the fine equal to 40% of the FGTS balance for termination purposes, as set forth in the Act of Temporary Constitutional Provisions (ADCT).
Currently, BD and CD plans of subsidiary COELCE have a total actuarial surplus of R$ 159,712 at September 30, 2015. Actuarial surplus is not accounted for since, in accordance with the rules of the Brazil’s National Supplementary Pension Board (CNPC) – CGPC Resolution No. 26/2008, as amended by CNPC Resolution No. 09/2012, any economic benefits for the sponsor may only be required if the contingency reserve is recognized at its maximum percentage, which is 25% of mathematical reserves, in order to ensure financial balance of the plan due to volatility of these obligations. Surplus may only be used by the sponsor as from such limit to cover future contributions or to be reimbursed thereto. For subsidiary COELCE, this was below 5% at September 30, 2015. For health care plans and FGTS for 2014, liabilities totaled R$ 82,841 (R$ 91,082, R$ 84,506 and 64,849 in December 31, 2014, 2013 and January 1st, 2013).
G-97
Enel Brasil S.A.
Notes to the consolidated financial statements (Continued)
September 30, 2015 and 2014, December 31, 2014 and 2013 and January 1st, 2013
(In thousands of reais, unless otherwise stated)
| 32. | Post-employment benefits (Continued) |
Reconciliation of opening and ending balances of the present value of the obligation
| | | | | | | | | | | | | | | | | | | | | | | | |
| | | Ampla Energia | | | COELCE | | | Consolidated | |
| | | 09/30/2015 | | | 12/31/2014 | | | 09/30/2015 | | | 12/31/2014 | | | 09/30/2015 | | | 12/31/2014 | |
Present value of actuarial obligations at the beginning of the year | | | 1,021,198 | | | | 933,485 | | | | 904,974 | | | | 817,861 | | | | 1,926,172 | | | | 1,751,346 | |
Cost of current services | | | 1,378 | | | | 1,231 | | | | 2,278 | | | | (424 | ) | | | 3,656 | | | | 807 | |
Cost of interest | | | 91,181 | | | | 109,714 | | | | 1,504 | | | | 97,120 | | | | 92,685 | | | | 206,834 | |
Participants’ contribution | | | 15 | | | | 29 | | | | 81,293 | | | | 2,089 | | | | 81,308 | | | | 2,118 | |
Benefits paid | | | (62,194 | ) | | | (88,353 | ) | | | (51,026 | ) | | | (60,038 | ) | | | (113,220 | ) | | | (148,391 | ) |
Actuarial gain/(loss) | | | (67,490 | ) | | | 65,092 | | | | (75,545 | ) | | | 48,366 | | | | (143,035 | ) | | | 113,458 | |
| | | | | | | | | | | | | | | | | | | | | | | | |
Total present value of actuarial obligation | | | 984,088 | | | | 1,021,198 | | | | 863,478 | | | | 904,974 | | | | 1,847,566 | | | | 1,926,172 | |
| | | | | | | | | | | | | | | | | | | | | | | | |
| | | | | | | | | | | | | | | | | | | | | | | | |
| | | Ampla Energia | | | COELCE | | | Consolidated | |
| | | 12/31/2013 | | | 01/01/2013 | | | 12/31/2013 | | | 01/01/2013 | | | 12/31/2013 | | | 01/01/2013 | |
Present value of actuarial obligations at the beginning of the year | | | (1,169,274 | ) | | | (1,064,274 | ) | | | (964,017 | ) | | | (716,283 | ) | | | (2,133,291 | ) | | | (1,780,557 | ) |
Cost of current services | | | (1,515 | ) | | | (85 | ) | | | (7,848 | ) | | | (5,718 | ) | | | (9,363 | ) | | | (5,803 | ) |
Cost of interest | | | (110,392 | ) | | | (107,623 | ) | | | (91,449 | ) | | | (72,631 | ) | | | (201,841 | ) | | | (180,254 | ) |
Participants’ contribution | | | (27 | ) | | | (29 | ) | | | — | | | | — | | | | (27 | ) | | | (29 | ) |
Benefits paid | | | 80,561 | | | | 76,773 | | | | 63,320 | | | | 49,709 | | | | 143,881 | | | | 126,482 | |
Actuarial gain/(loss) | | | 267,162 | | | | (74,037 | ) | | | 182,132 | | | | (219,094 | ) | | | 449,294 | | | | (293,131 | ) |
| | | | | | | | | | | | | | | | | | | | | | | | |
Total present value of actuarial obligation | | | (933,485 | ) | | | (1,169,275 | ) | | | (817,862 | ) | | | (964,017 | ) | | | (1,751,347 | ) | | | (2,133,292 | ) |
| | | | | | | | | | | | | | | | | | | | | | | | |
Reconciliation of opening and ending balances of the fair value of plan assets
| | | | | | | | | | | | | | | | | | | | | | | | |
| | | Ampla Energia | | | COELCE | | | Consolidated | |
| | | 09/30/2015 | | | 12/31/2014 | | | 09/30/2015 | | | 12/31/2014 | | | 09/30/2015 | | | 12/31/2014 | |
Fair value of plan assets at the beginning of the year | | | 646,407 | | | | 540,146 | | | | 961,150 | | | | 910,871 | | | | 1,607,557 | | | | 1,451,017 | |
Interest income on assets | | | 58,991 | | | | 63,192 | | | | 87,829 | | | | 110,589 | | | | 146,820 | | | | 173,781 | |
Participants’ contribution | | | 15 | | | | 29 | | | | 1,504 | | | | 2,089 | | | | 1,519 | | | | 2,118 | |
Sponsors’ contribution | | | 45,867 | | | | 48,820 | | | | 13,229 | | | | 25,395 | | | | 59,096 | | | | 74,215 | |
Benefits paid in the year | | | (62,195 | ) | | | (88,352 | ) | | | (51,026 | ) | | | (60,038 | ) | | | (113,221 | ) | | | (148,390 | ) |
Actuarial return | | | (120,153 | ) | | | 82,572 | | | | (72,337 | ) | | | (27,756 | ) | | | (192,490 | ) | | | 54,816 | |
| | | | | | | | | | | | | | | | | | | | | | | | |
Fair value of plan assets at the end of the year | | | 568,932 | | | | 646,407 | | | | 940,349 | | | | 961,150 | | | | 1,509,281 | | | | 1,607,557 | |
| | | | | | | | | | | | | | | | | | | | | | | | |
G-98
Enel Brasil S.A.
Notes to the consolidated financial statements (Continued)
September 30, 2015 and 2014, December 31, 2014 and 2013 and January 1st, 2013
(In thousands of reais, unless otherwise stated)
| 32. | Post-employment benefits (Continued) |
Reconciliation of opening and ending balances of the fair value of plan assets (Continued)
| | | | | | | | | | | | | | | | | | | | | | | | |
| | | Ampla Energia | | | COELCE | | | Consolidated | |
| | | 12/31/2013 | | | 01/01/2013 | | | 12/31/2013 | | | 01/01/2013 | | | 12/31/2013 | | | 01/01/2013 | |
Fair value of plan assets at the beginning of the year | | | 688,378 | | | | 539,810 | | | | 1,006,903 | | | | 740,786 | | | | 1,695,281 | | | | 1,280,596 | |
Interest income on assets | | | 65,192 | | | | 54,523 | | | | 96,993 | | | | 76,081 | | | | 162,184 | | | | 130,604 | |
Participants’ contribution | | | 28 | | | | 28 | | | | 4,956 | | | | 4,522 | | | | 4,983 | | | | 4,551 | |
Sponsors’ contribution | | | 40,962 | | | | 34,012 | | | | 21,715 | | | | 21,633 | | | | 62,678 | | | | 55,647 | |
Benefits paid in the year | | | (80,561 | ) | | | (76,774 | ) | | | (63,320 | ) | | | (49,708 | ) | | | (143,881 | ) | | | (126,482 | ) |
Actuarial return | | | (173,853 | ) | | | 136,778 | | | | (156,376 | ) | | | 213,590 | | | | (330,229 | ) | | | 350,368 | |
| | | | | | | | | | | | | | | | | | | | | | | | |
Fair value of plan assets at the end of the year | | | 540,146 | | | | 688,379 | | | | 910,871 | | | | 1,006,904 | | | | 1,451,017 | | | | 1,695,283 | |
| | | | | | | | | | | | | | | | | | | | | | | | |
Reconciliation of present value of the obligation and the plan assets value, with assets and liabilities recorded in the balance sheet
| | | | | | | | | | | | | | | | | | | | | | | | |
| | | Ampla Energia | | | COELCE | | | Consolidated | |
| | | 09/30/2015 | | | 12/31/2014 | | | 09/30/2015 | | | 12/31/2014 | | | 09/30/2015 | | | 12/31/2014 | |
Present value of actuarial obligations | | | (984,088 | ) | | | (1,021,198 | ) | | | (863,478 | ) | | | (904,974 | ) | | | (1,847,566 | ) | | | (1,926,172 | ) |
Fair value of assets | | | 568,932 | | | | 646,407 | | | | 940,349 | | | | 961,150 | | | | 1,509,281 | | | | 1,607,557 | |
| | | | | | | | | | | | | | | | | | | | | | | | |
Present value of obligations exceeding Fair value of assets | | | (415,156 | ) | | | (374,791 | ) | | | 76,871 | | | | 56,176 | | | | (338,285 | ) | | | (318,615 | ) |
Effect of limit for asset recognition | | | — | | | | — | | | | (159,712 | ) | | | (147,258 | ) | | | (159,712 | ) | | | (147,258 | ) |
| | | | | | | | | | | | | | | | | | | | | | | | |
Net actuarial assets/(liabilities) (*) | | | (415,156 | ) | | | (374,791 | ) | | | (82,841 | ) | | | (91,082 | ) | | | (497,997 | ) | | | (465,873 | ) |
Debt raised | | | (57,913 | ) | | | (70,242 | ) | | | — | | | | — | | | | (57,913 | ) | | | (70,242 | ) |
| | | | | | | | | | | | | | | | | | | | | | | | |
Net actuarial assets/(liabilities) calculated | | | (473,069 | ) | | | (445,033 | ) | | | (82,841 | ) | | | (91,082 | ) | | | (555,910 | ) | | | (536,115 | ) |
| | | | | | | | | | | | | | | | | | | | | | | | |
Current liabilities | | | | | | | | | | | | | | | | | | | (5,573 | ) | | | (770 | ) |
| | | | | | | | | | | | | | | | | | | | | | | | |
Non-current liabilities | | | | | | | | | | | | | | | | | | | (550,337 | ) | | | (535,345 | ) |
| | | | | | | | | | | | | | | | | | | | | | | | |
| (*) | The amount for the Ampla Energia comprises the balance of the contracted debt |
| | | | | | | | | | | | | | | | | | | | | | | | |
| | | Ampla Energia | | | COELCE | | | Consolidated | |
| | | 12/31/2013 | | | 01/01/2013 | | | 12/31/2013 | | | 01/01/2013 | | | 12/31/2013 | | | 01/01/2013 | |
Present value of actuarial obligations | | | (933,485 | ) | | | (1,169,275 | ) | | | (817,862 | ) | | | (964,017 | ) | | | (1,751,347 | ) | | | (2,133,292 | ) |
Fair value of assets | | | 540,146 | | | | 688,379 | | | | 910,871 | | | | 1,006,904 | | | | 1,451,017 | | | | 1,695,283 | |
| | | | | | | | | | | | | | | | | | | | | | | | |
Present value of obligations exceeding Fair value of assets | | | (393,339 | ) | | | (480,896 | ) | | | 93,009 | | | | 42,887 | | | | (300,330 | ) | | | (438,009 | ) |
Effect of limit for asset recognition | | | | | | | — | | | | (177,515 | ) | | | (107,736 | ) | | | (177,515 | ) | | | (107,736 | ) |
| | | | | | | | | | | | | | | | | | | | | | | | |
Net actuarial assets/(liabilities) (*) | | | (393,339 | ) | | | (480,896 | ) | | | (84,506 | ) | | | (64,849 | ) | | | (477,845 | ) | | | (545,745 | ) |
Debt raised | | | | | | | — | | | | (12,824 | ) | | | (18,147 | ) | | | (12,824 | ) | | | (18,147 | ) |
| | | | | | | | | | | | | | | | | | | | | | | | |
Net actuarial assets/(liabilities) calculated | | | (393,339 | ) | | | (480,896 | ) | | | (97,330 | ) | | | (82,996 | ) | | | (490,669 | ) | | | (563,892 | ) |
| | | | | | | | | | | | | | | | | | | | | | | | |
Current liabilities | | | | | | | | | | | | | | | | | | | (12,824 | ) | | | (12,098 | ) |
| | | | | | | | | | | | | | | | | | | | | | | | |
Non-current liabilities | | | | | | | | | | | | | | | | | | | (477,845 | ) | | | (551,794 | ) |
| | | | | | | | | | | | | | | | | | | | | | | | |
G-99
Enel Brasil S.A.
Notes to the consolidated financial statements (Continued)
September 30, 2015 and 2014, December 31, 2014 and 2013 and January 1st, 2013
(In thousands of reais, unless otherwise stated)
| 32. | Post-employment benefits (Continued) |
Expenses recorded in income statements
| | | | | | | | | | | | | | | | | | | | | | | | |
| | | Ampla Energia | | | COELCE | | | Consolidated | |
| | | 09/30/2015 | | | 12/31/2014 | | | 09/30/2015 | | | 12/31/2014 | | | 09/30/2015 | | | 12/31/2014 | |
Current service cost | | | 1,393 | | | | 1,260 | | | | 3,782 | | | | 1,665 | | | | 5,175 | | | | 2,925 | |
Participants’ contribution | | | (15 | ) | | | (29 | ) | | | (1,504 | ) | | | (2,089 | ) | | | (1,519 | ) | | | (2,118 | ) |
| | | | | | | | | | | | | | | | | | | | | | | | |
Service cost | | | 1,378 | | | | 1,231 | | | | 2,278 | | | | (424 | ) | | | 3,656 | | | | 807 | |
| | | | | | | | | | | | | | | | | | | | | | | | |
Net interest on the net defined benefit liability/(asset) | | | 32,190 | | | | 46,522 | | | | 7,291 | | | | 8,587 | | | | 39,481 | | | | 55,109 | |
| | | | | | | | | | | | | | | | | | | | | | | | |
Total expenses/ (revenues) | | | 33,568 | | | | 47,753 | | | | 9,569 | | | | 8,163 | | | | 43,137 | | | | 55,916 | |
| | | | | | | | | | | | | | | | | | | | | | | | |
| | | | | | | | | | | | | | | | | | | | | | | | |
| | | Ampla Energia | | | COELCE | | | Consolidated | |
| | | 12/31/2013 | | | 01/01/2013 | | | 12/31/2013 | | | 01/01/2013 | | | 12/31/2013 | | | 01/01/2013 | |
Current service cost | | | 1,542 | | | | 114 | | | | 7,848 | | | | 5,718 | | | | 9,390 | | | | 5,832 | |
Participants’ contribution | | | (27 | ) | | | (29 | ) | | | (4,956 | ) | | | (4,522 | ) | | | (4,983 | ) | | | (4,551 | ) |
| | | | | | | | | | | | | | | | | | | | | | | | |
Service cost | | | 1,515 | | | | 85 | | | | 2,892 | | | | 1,196 | | | | 4,407 | | | | 1,281 | |
| | | | | | | | | | | | | | | | | | | | | | | | |
Net interest on the net defined benefit liability/(asset) | | | 48,817 | | | | 49,984 | | | | 11,965 | | | | (7,798 | ) | | | 60,782 | | | | 42,186 | |
| | | | | | | | | | | | | | | | | | | | | | | | |
Total expenses/ (revenues) | | | 50,332 | | | | 50,069 | | | | 14,857 | | | | (6,602 | ) | | | 65,189 | | | | 43,467 | |
| | | | | | | | | | | | | | | | | | | | | | | | |
Amount that each main category of plan assets represents in relation to the total fair value of plan assets
| | | | | | | | | | | | | | | | | | | | | | | | |
| | | Ampla Energia | | | COELCE | | | Consolidated | |
| | | 09/30/2015 | | | 12/31/2014 | | | 09/30/2015 | | | 12/31/2014 | | | 09/30/2015 | | | 12/31/2014 | |
Debt securities | | | 360,974 | | | | 400,662 | | | | 766,344 | | | | 779,064 | | | | 1,127,318 | | | | 1,179,726 | |
Equity securities | | | 116,310 | | | | 134,592 | | | | 65,207 | | | | 70,244 | | | | 181,517 | | | | 204,836 | |
Real estate | | | 79,384 | | | | 92,341 | | | | 92,441 | | | | 90,071 | | | | 171,825 | | | | 182,412 | |
Others | | | 12,264 | | | | 18,811 | | | | 16,357 | | | | 21,771 | | | | 28,621 | | | | 40,582 | |
| | | | | | | | | | | | | | | | | | | | | | | | |
Fair value of plan assets | | | 568,932 | | | | 646,406 | | | | 940,349 | | | | 961,150 | | | | 1,509,281 | | | | 1,607,556 | |
| | | | | | | | | | | | | | | | | | | | | | | | |
| | | | | | | | | | | | | | | | | | | | | | | | |
| | | Ampla Energia | | | COELCE | | | Consolidated | |
| | | 12/31/2013 | | | 01/01/2013 | | | 12/31/2013 | | | 01/01/2013 | | | 12/31/2013 | | | 01/01/2013 | |
Debt securities | | | 356,306 | | | | 496,613 | | | | 690,238 | | | | 770,068 | | | | 1,046,544 | | | | 1,266,681 | |
Equity securities | | | 119,613 | | | | 108,321 | | | | 118,159 | | | | 117,769 | | | | 237,772 | | | | 226,090 | |
Real estate | | | 47,025 | | | | 53,367 | | | | 63,586 | | | | 73,455 | | | | 110,611 | | | | 126,822 | |
Others | | | 17,202 | | | | 30,078 | | | | 38,888 | | | | 45,612 | | | | 56,090 | | | | 75,689 | |
| | | | | | | | | | | | | | | | | | | | | | | | |
Fair value of plan assets | | | 540,146 | | | | 688,379 | | | | 910,871 | | | | 1,006,904 | | | | 1,451,017 | | | | 1,695,282 | |
| | | | | | | | | | | | | | | | | | | | | | | | |
G-100
Enel Brasil S.A.
Notes to the consolidated financial statements (Continued)
September 30, 2015 and 2014, December 31, 2014 and 2013 and January 1st, 2013
(In thousands of reais, unless otherwise stated)
| 32. | Post-employment benefits (Continued) |
Total amounts recorded in other comprehensive income
| | | | | | | | | | | | | | | | | | | | | | | | |
| | | Ampla Energia | | | COELCE | | | Consolidated | |
| | | 09/30/2015 | | | 12/31/2014 | | | 09/30/2015 | | | 12/31/2014 | | | 09/30/2015 | | | 12/31/2014 | |
Actuarial (gain)/loss | | | (67,490 | ) | | | 65,092 | | | | (75,545 | ) | | | 48,366 | | | | (143,035 | ) | | | 113,458 | |
Actuarial (gain)/loss | | | 120,153 | | | | (82,572 | ) | | | 72,337 | | | | 27,756 | | | | 192,490 | | | | (54,816 | ) |
Change in recognized restrictions of assets | | | — | | | | — | | | | (1,373 | ) | | | (52,313 | ) | | | (1,373 | ) | | | (52,313 | ) |
Change in adjustment for debt recognition | | | (12,328 | ) | | | 70,242 | | | | — | | | | (12,824 | ) | | | (12,328 | ) | | | 57,418 | |
Effect of adoption – IAS 19 (R1) | | | — | | | | — | | | | — | | | | — | | | | — | | | | — | |
| | | | | | | | | | | | | | | | | | | | | | | | |
Total other comprehensive income in the year | | | 40,335 | | | | 52,762 | | | | (4,581 | ) | | | 10,985 | | | | 35,754 | | | | 63,747 | |
| | | | | | | | | | | | | | | | | | | | | | | | |
| | | | | | | | | | | | | | | | | | | | | | | | |
| | | Ampla Energia | | | COELCE | | | Consolidated | |
| | | 12/31/2013 | | | 01/01/2013 | | | 12/31/2013 | | | 01/01/2013 | | | 12/31/2013 | | | 01/01/2013 | |
Actuarial gain/ (loss) | | | (267,162 | ) | | | 74,037 | | | | (182,132 | ) | | | 219,094 | | | | (449,294 | ) | | | 293,131 | |
Actuarial gain/(loss) | | | 173,853 | | | | (136,779 | ) | | | 156,376 | | | | (213,590 | ) | | | 330,229 | | | | (350,369 | ) |
Change in recognized restrictions of assets | | | — | | | | (5,261 | ) | | | 59,222 | | | | 80,333 | | | | 59,222 | | | | 75,072 | |
Change in adjustment for debt recognition | | | — | | | | — | | | | (5,323 | ) | | | (16,926 | ) | | | (5,323 | ) | | | (16,926 | ) |
Effect of adoption – IAS 19 (R1) | | | (3,617 | ) | | | 3,617 | | | | (6,951 | ) | | | 6,951 | | | | (10,568 | ) | | | 10,568 | |
| | | | | | | | | | | | | | | | | | | | | | | | |
Total other comprehensive income in the year | | | (96,926 | ) | | | (64,386 | ) | | | 21,192 | | | | 75,862 | | | | (75,734 | ) | | | 11,476 | |
| | | | | | | | | | | | | | | | | | | | | | | | |
Actual return on plan assets
| | | | | | | | | | | | | | | | | | | | | | | | |
| | | Ampla Energia | | | COELCE | | | Consolidated | |
| | | 09/30/2015 | | | 12/31/2014 | | | 09/30/2015 | | | 12/31/2014 | | | 09/30/2015 | | | 12/31/2014 | |
Interest income on plan assets | | | 58,991 | | | | 63,192 | | | | 87,829 | | | | 110,589 | | | | 146,820 | | | | 173,781 | |
Actuarial gain (loss) on plan assets | | | (120,153 | ) | | | 82,572 | | | | (72,337 | ) | | | (27,756 | ) | | | (192,490 | ) | | | 54,816 | |
| | | | | | | | | | | | | | | | | | | | | | | | |
Actual return on plan assets | | | (61,162 | ) | | | 145,764 | | | | 15,492 | | | | 82,833 | | | | (45,670 | ) | | | 228,597 | |
| | | | | | | | | | | | | | | | | | | | | | | | |
| | | | | | | | | | | | | | | | | | | | | | | | |
| | | Ampla Energia | | | COELCE | | | Consolidated | |
| | | 12/31/2013 | | | 01/01/2013 | | | 12/31/2013 | | | 01/01/2013 | | | 12/31/2013 | | | 01/01/2013 | |
Interest income on plan assets | | | 65,192 | | | | 54,522 | | | | 96,993 | | | | 76,081 | | | | 162,185 | | | | 130,603 | |
Actuarial gain (loss) on plan assets | | | (173,853 | ) | | | 136,778 | | | | (156,376 | ) | | | 213,590 | | | | (330,229 | ) | | | 350,368 | |
| | | | | | | | | | | | | | | | | | | | | | | | |
Actual return on plan assets | | | (108,661 | ) | | | 191,300 | | | | (59,383 | ) | | | 289,671 | | | | (168,044 | ) | | | 480,971 | |
| | | | | | | | | | | | | | | | | | | | | | | | |
Actuarial amounts for current and prior years
| | | | | | | | | | | | | | | | | | | | | | | | |
| | | Ampla Energia | | | COELCE | | | Consolidated | |
| | | 09/30/2015 | | | 12/31/2014 | | | 09/30/2015 | | | 12/31/2014 | | | 09/30/2015 | | | 12/31/2014 | |
Defined benefit obligation | | | (984,087 | ) | | | (1,021,198 | ) | | | (863,478 | ) | | | (904,974 | ) | | | (1,847,565 | ) | | | (1,926,172 | ) |
Plan assets | | | 568,932 | | | | 646,407 | | | | 940,349 | | | | 961,150 | | | | 1,509,281 | | | | 1,607,557 | |
| | | | | | | | | | | | | | | | | | | | | | | | |
Surplus (deficit) | | | (415,155 | ) | | | (374,791 | ) | | | 76,871 | | | | 56,176 | | | | (338,284 | ) | | | (318,615 | ) |
| | | | | | | | | | | | | | | | | | | | | | | | |
Adjustments of experiences on plan liabilities | | | 9,577 | | | | (65,092 | ) | | | 75,545 | | | | (48,366 | ) | | | 85,122 | | | | (113,458 | ) |
Adjustments of experiences on plan assets | | | (120,153 | ) | | | 82,572 | | | | 72,337 | | | | (27,756 | ) | | | (47,816 | ) | | | 54,816 | |
G-101
Enel Brasil S.A.
Notes to the consolidated financial statements (Continued)
September 30, 2015 and 2014, December 31, 2014 and 2013 and January 1st, 2013
(In thousands of reais, unless otherwise stated)
| 32. | Post-employment benefits (Continued) |
Actuarial amounts for current and prior years (Continued)
| | | | | | | | | | | | | | | | | | | | | | | | |
| | | Ampla Energia | | | COELCE | | | Consolidated | |
| | | 12/31/2013 | | | 01/01/2013 | | | 12/31/2013 | | | 01/01/2013 | | | 12/31/2013 | | | 01/01/2013 | |
Defined benefit obligation | | | (933,485 | ) | | | (1,169,275 | ) | | | (817,862 | ) | | | (964,017 | ) | | | (1,751,347 | ) | | | (2,133,292 | ) |
Plan assets | | | 540,146 | | | | 688,379 | | | | 910,871 | | | | 1,006,904 | | | | 1,451,017 | | | | 1,695,283 | |
| | | | | | | | | | | | | | | | | | | | | | | | |
Surplus (deficit) | | | (393,339 | ) | | | (480,896 | ) | | | 93,009 | | | | 42,887 | | | | (300,330 | ) | | | (438,009 | ) |
| | | | | | | | | | | | | | | | | | | | | | | | |
Adjustments of experiences on plan liabilities | | | 267,162 | | | | (74,037 | ) | | | 182,132 | | | | (219,094 | ) | | | 449,294 | | | | (293,131 | ) |
Adjustments of experiences on plan assets | | | (173,853 | ) | | | 136,778 | | | | (156,376 | ) | | | 213,590 | | | | (330,229 | ) | | | 350,368 | |
Reconciliation of opening and closing balances of defined benefit asset ceiling effect
| | | | | | | | | | | | | | | | |
| | | COELCE | | | Consolidated | |
| | | 09/30/2015 | | | 12/31/2014 | | | 09/30/2015 | | | 12/31/2014 | |
Unrecognized asset at the start of the year | | | 147,258 | | | | 177,515 | | | | 147,258 | | | | 177,515 | |
Interest on unrecognized asset recognized in P&L | | | 13,827 | | | | 22,056 | | | | 13,827 | | | | 22,056 | |
Other changes in unrecognized asset due to the asset ceiling | | | (1,373 | ) | | | (52,313 | ) | | | (1,373 | ) | | | (52,313 | ) |
| | | | | | | | | | | | | | | | |
Unrecognized asset at end of year | | | 159,712 | | | | 147,258 | | | | 159,712 | | | | 147,258 | |
| | | | | | | | | | | | | | | | |
| | | | | | | | | | | | | | | | | | | | | | | | |
| | | Ampla Energia | | | COELCE | | | Consolidated | |
| | | 12/31/2013 | | | 01/01/2013 | | | 12/31/2013 | | | 01/01/2013 | | | 12/31/2013 | | | 01/01/2013 | |
Unrecognized asset at the start of the year | | | — | | | | 4,761 | | | | 107,735 | | | | 24,798 | | | | 107,735 | | | | 29,559 | |
Interest on unrecognized asset recognized in P&L | | | — | | | | 500 | | | | 10,558 | | | | 2,604 | | | | 10,558 | | | | 3,104 | |
Other changes in unrecognized asset due to the asset ceiling | | | — | | | | (5,261 | ) | | | 59,222 | | | | 80,333 | | | | 59,222 | | | | 75,072 | |
| | | | | | | | | | | | | | | | | | | | | | | | |
Unrecognized asset at end of year | | | — | | | | — | | | | 177,515 | | | | 107,735 | | | | 177,515 | | | | 107,735 | |
| | | | | | | | | | | | | | | | | | | | | | | | |
The Group recognized expenses with the defined contributions plan in the amount of R$ 9,569 for the nine month period ended September 30, 2015 (R$ 7,442 in 2014).
Main assumptions adopted
The main assumptions adopted by the independent actuary for calculation were as follows, by its nominal amount:
| | | | | | | | | | | | | | | | | | | | | | | | | | | | | | | | |
Main actuarial
assumptions | | Ampla Energia | | | COELCE | |
| | PCA | | | PACV | | | PAMA | | | FGTS | | | BD | | | CD | | | Plano de saúde | | | FGTS | |
Discount rate | | | 14,51 | % | | | 14.51 | % | | | 14.53 | % | | | 14.62 | % | | | 14.48 | % | | | 14.62 | % | | | 14.41 | % | | | 14.69 | % |
Expected assets return rate | | | 14.51 | % | | | 14.51 | % | | | N/A | | | | N/A | | | | 14.48 | % | | | 14.62 | % | | | N/A | | | | N/A | |
Salary growth rate | | | 9.69 | % | | | 9.69 | % | | | N/A | | | | 9.69 | % | | | 9.69 | % | | | 9.69 | % | | | N/A | | | | 9.69 | % |
Expected inflation rate | | | 6.50 | % | | | 6.50 | % | | | 6.50 | % | | | 6.50 | % | | | 6.50 | % | | | 6.50 | % | | | 6.50 | % | | | 6.50 | % |
Adjustment of benefits granted | | | 6.50 | % | | | 6.50 | % | | | N/A | | | | N/A | | | | 6.50 | % | | | 6.50 | % | | | N/A | | | | N/A | |
Overall mortality table | | | AT-2000 | | | | AT-2000 | | | | AT-2000 | | | | AT-2000 | | | | AT-2000 | | | | AT-2000 | | | | AT-2000 | | | | AT-2000 | |
Entry disability table | | | Média | | | | Média | | | | Média | | | | Média | | | | Light-Média | | | | Light-Média | | | | Light-Média | | | | Light-Média | |
Disability mortality table | | | | | | | | | | | | | | | | | | | AT-49 + 6 years | | | | AT-49 + 6 years | | | | AT-49 + 6 years | | | | N/A | |
G-102
Enel Brasil S.A.
Notes to the consolidated financial statements (Continued)
September 30, 2015 and 2014, December 31, 2014 and 2013 and January 1st, 2013
(In thousands of reais, unless otherwise stated)
| 32. | Post-employment benefits (Continued) |
Main assumptions adopted (Continued)
For actuarial assessment for 2014, a medical cost growth assumption (medical inflation) of 9.69% p.a. (3% p.a. in real terms) was adopted.
Sensitivity Discount Rate
| | | | | | | | | | | | | | |
Description | | Coelce – BD | | | Ampla – PCA | | | Ampla – PACV | |
0,5% decrease | | Discount rate | | | 13.98 | | | | 14.01 | | | | 14.00 | |
| | Defined benefit obligation | | | 814,656 | | | | 719,346 | | | | 171,866 | |
| | Cost of one year | | | 2.652 | | | | 3 | | | | 341 | |
| | | | |
0,5% increase | | Discount rate | | | 14,98 | | | | 15,01 | | | | 15 | |
| | Defined benefit obligation | | | 748,741 | | | | 668,667 | | | | 158,983 | |
| | Cost of one year | | | 2,330 | | | | 3 | | | | 324 | |
Cash flow for next periods
| | | | | | | | | | | | |
Description | | Coelce – BD | | | Ampla – PCA | | | Ampla – PACV | |
Contributions of participants | | | 1,900 | | | | 25 | | | | — | |
Contribution Sponsor | | | 8,859 | | | | 56,301 | | | | 2,127 | |
Net benefit payment | | | 69,114 | | | | 71,856 | | | | 20,139 | |
Average duration of liabilities of the Plan | | | 10.2 | | | | 8.9 | | | | 9.5 | |
G-103
Enel Brasil S.A.
Notes to the consolidated financial statements (Continued)
September 30, 2015 and 2014, December 31, 2014 and 2013 and January 1st, 2013
(In thousands of reais, unless otherwise stated)
| 33. | Income tax and social contribution |
The reconciliation of provision for income and social contribution taxes, calculated at tax rate, with the amounts in the income statements, is as follows:
| | | | | | | | | | | | | | | | |
Description | | 09/30/2015 | | | 12/31/2014 | | | 09/30/2014 | | | 12/31/2013 | |
| | | | | | | | | (Unaudited) | | | | |
Income before income taxes | | | 870,143 | | | | 1,155,351 | | | | 440,063 | | | | 1,666,211 | |
Nominal rate (34%)* | | | 295,849 | | | | 392,819 | | | | 149,621 | | | | 566,512 | |
| | | | |
Permanent additions | | | | | | | | | | | | | | | | |
Profit sharing (Management) | | | 4,606 | | | | 6,090 | | | | 3,872 | | | | 5,260 | |
Goodwill amortization of investment using equity method | | | 5,934 | | | | 7,691 | | | | 5,769 | | | | 2,101 | |
Donations | | | 365 | | | | 906 | | | | 1,161 | | | | 1,266 | |
Nondeductible fines | | | — | | | | 1,824 | | | | 1,219 | | | | 1,682 | |
Losses | | | 7,697 | | | | 8,027 | | | | 19,712 | | | | 1,745 | |
Losses on investments | | | 15,463 | | | | 36,488 | | | | 30,087 | | | | 13,748 | |
No deductible depreciation expense | | | — | | | | (9,176 | ) | | | (1,756 | ) | | | 11,532 | |
Other additions | | | 33,436 | | | | 1,058 | | | | 387 | | | | 6,322 | |
| | | | | | | | | | | | | | | | |
| | | 67,501 | | | | 52,908 | | | | 60,451 | | | | 43,656 | |
Permanent exclusions | | | | | | | | | | | | | | | | |
Amortization of goodwill and reversal of provision | | | (3,984 | ) | | | (5,804 | ) | | | (4,353 | ) | | | 5,368 | |
Net effect of subsidiaries taxed by presumed profit (Income tax) | | | 3,088 | | | | (64,225 | ) | | | (62,855 | ) | | | (94,446 | ) |
| | | | | | | | | | | | | | | | |
| | | (896 | ) | | | (70,029 | ) | | | (67,208 | ) | | | (89,078 | ) |
| | | | |
Permanent deductions | | | | | | | | | | | | | | | | |
Operation profit | | | (61,283 | ) | | | (84,904 | ) | | | (85,113 | ) | | | (100,091 | ) |
PAT tax benefit | | | (883 | ) | | | (2,890 | ) | | | (1,988 | ) | | | (2,463 | ) |
Cultural tax incentive | | | — | | | | (4,750 | ) | | | (2,319 | ) | | | (3,989 | ) |
Sportive tax incentive | | | — | | | | (612 | ) | | | | | | | (569 | ) |
Additional IRPJ | | | (36 | ) | | | (768 | ) | | | (36 | ) | | | (336 | ) |
Prior periods adjustments | | | — | | | | — | | | | — | | | | (218 | ) |
| | | | | | | | | | | | | | | | |
| | | (62,202 | ) | | | (93,924 | ) | | | (89,456 | ) | | | (107,666 | ) |
| | | | |
Other | | | | | | | | | | | | | | | | |
Differences in foreign subsidiaries | | | 6,957 | | | | 4,426 | | | | 4,426 | | | | (5,405 | ) |
Other | | | 4,377 | | | | (3,491 | ) | | | (5,945 | ) | | | 4,551 | |
| | | | | | | | | | | | | | | | |
| | | 11,334 | | | | 935 | | | | (1,519 | ) | | | (854 | ) |
| | | | | | | | | | | | | | | | |
| | | 311,586 | | | | 282,709 | | | | 51,891 | | | | 412,570 | |
| | | | | | | | | | | | | | | | |
Current income and social contribution taxes | | | 322,811 | | | | 450,304 | | | | 407,055 | | | | 496,337 | |
Deferred income and social contribution taxes | | | 44,021 | | | | (91,484 | ) | | | (276,646 | ) | | | (32,856 | ) |
Tax incentives | | | (55,246 | ) | | | (76,111 | ) | | | (78,518 | ) | | | (50,911 | ) |
| | | | | | | | | | | | | | | | |
Total income tax and social contribution | | | 311,586 | | | | 282,709 | | | | 51,891 | | | | 412,570 | |
| | | | | | | | | | | | | | | | |
| * | Income tax was calculated at a 15% rate, plus 10% surtax and social contribution tax of 9%. |
G-104
Enel Brasil S.A.
Notes to the consolidated financial statements (Continued)
September 30, 2015 and 2014, December 31, 2014 and 2013 and January 1st, 2013
(In thousands of reais, unless otherwise stated)
| 33. | Income tax and social contribution (Continued) |
In September 30, 2014 the income and social contribution calculation bases of subsidiary CDSA were determined upon application of 8% and 12% rates, respectively, on gross income (“presumed profits method”), according to the determination rules under taxable profit as a percentage of gross sales, adopted by this subsidiary CDSA, according to liberality provided by Law No. 9,964 of April 10, 2000, for those taxpayers entering into the Tax Recovery Program (REFIS).
Electricity supply breakdown by class of consumers is as follows:
| | | | | | | | | | | | | | | | |
| | | 09/30/2015 | | | 12/31/2014 | | | 09/30/2014 | | | 12/31/2013 | |
| | | | | | | | | (Unaudited) | | | | |
Billed supply | | | 7,977,295 | | | | 8,260,953 | | | | 6,010,026 | | | | 7,411,584 | |
Unbilled supply | | | 90,316 | | | | 33,186 | | | | 2,292 | | | | (36,572 | ) |
| | | | | | | | | | | | | | | | |
Consumers, concessionaires and authorized parties | | | 8,067,611 | | | | 8,294,139 | | | | 6,012,318 | | | | 7,375,012 | |
| | | | | | | | | | | | | | | | |
Electricity supply | | | 540,236 | | | | 988,803 | | | | 776,631 | | | | 695,619 | |
Low-income | | | 186,630 | | | | 273,912 | | | | 201,354 | | | | 252,997 | |
Revenue from use of electricity grid – free consumers – resale | | | 74,453 | | | | 76,343 | | | | 56,303 | | | | 82,040 | |
CDE Subventions – Tariff discount | | | 267,448 | | | | 294,374 | | | | 222,119 | | | | 217,730 | |
Availability of the electricity network | | | 179,443 | | | | 164,663 | | | | 122,885 | | | | 182,657 | |
RAP | | | 246,326 | | | | 311,925 | | | | 225,686 | | | | 270,485 | |
Availability of the transmission network to related parties | | | 11,807 | | | | 12,768 | | | | 9,480 | | | | 15,794 | |
Revenue from construction | | | 793,189 | | | | 763,142 | | | | 565,342 | | | | 698,047 | |
Revenue from Portion A and other financial items | | | 1,307,638 | | | | 722,198 | | | | — | | | | — | |
Other revenue | | | 154,246 | | | | 235,523 | | | | 166,249 | | | | 208,597 | |
| | | | | | | | | | | | | | | | |
Gross operating revenue | | | 11,829,027 | | | | 12,137,790 | | | | 8,358,367 | | | | 9,998,978 | |
| | | | | | | | | | | | | | | | |
(-) Revenue deductions | | | | | | | | | | | | | | | | |
State VAT (ICMS) | | | (2,137,163 | ) | | | (2,049,512 | ) | | | (1,491,813 | ) | | | (1,827,592 | ) |
Contribution Tax on Gross Revenue for Social Integration Program (PIS) | | | (195,856 | ) | | | (84,413 | ) | | | (62,669 | ) | | | (84,168 | ) |
Contribution Tax on Gross Revenue for Social Security Financing (COFINS) | | | (902,166 | ) | | | (388,909 | ) | | | (288,735 | ) | | | (327,781 | ) |
Service tax (ISS) | | | (3,212 | ) | | | (3,713 | ) | | | (2,776 | ) | | | (3,996 | ) |
Quota for Global Reversion Reserve (RGR) | | | (11,635 | ) | | | (15,260 | ) | | | (11,135 | ) | | | 1,973 | |
CCC/CDE Subventions | | | (836,483 | ) | | | (50,554 | ) | | | (36,843 | ) | | | (39,480 | ) |
P&D and energy effectiveness | | | (64,479 | ) | | | (84,314 | ) | | | (64,012 | ) | | | (74,281 | ) |
Other taxes and contributions on revenue | | | (21,621 | ) | | | (24,993 | ) | | | (19,109 | ) | | | (22,783 | ) |
| | | | | | | | | | | | | | | | |
Total revenue deductions | | | (4,172,615 | ) | | | (2,701,668 | ) | | | (1,977,092 | ) | | | (2,378,108 | ) |
| | | | | | | | | | | | | | | | |
Total | | | 7,656,412 | | | | 9,436,122 | | | | 6,381,275 | | | | 7,620,870 | |
| | | | | | | | | | | | | | | | |
G-105
Enel Brasil S.A.
Notes to the consolidated financial statements (Continued)
September 30, 2015 and 2014, December 31, 2014 and 2013 and January 1st, 2013
(In thousands of reais, unless otherwise stated)
| 35. | Operating costs and expenses |
Operating expenses breakdown according to their nature is as follows:
| | | | | | | | | | | | | | | | | | | | | | | | | | | | | | | | |
| | | 09/30/2015 | | | 12/31/2014 | | | 09/30/2014 | | | 12/31/2013 | |
| | | | | | (Unaudited) | | | | |
| | | Cost of
services | | | Selling
expenses | | | General and
administrative
expenses | | | Others | | | Total | | | Total | | | Total | | | Total | |
Personnel (including private pension plan) | | | (183,693 | ) | | | (2,903 | ) | | | (141,919 | ) | | | — | | | | (328,515 | ) | | | (394,415 | ) | | | (277,239 | ) | | | (379,538 | ) |
Administrators | | | (1,449 | ) | | | (696 | ) | | | (3,154 | ) | | | — | | | | (5,299 | ) | | | (8,056 | ) | | | (5,884 | ) | | | — | |
Material | | | (46,395 | ) | | | — | | | | (2,945 | ) | | | — | | | | (49,340 | ) | | | (34,633 | ) | | | (22,405 | ) | | | (31,354 | ) |
Raw material and inputs for electricity production | | | (217,838 | ) | | | — | | | | — | | | | — | | | | (217,838 | ) | | | (248,512 | ) | | | (187,310 | ) | | | (233,648 | ) |
Third-party services | | | (412,289 | ) | | | (6,802 | ) | | | (103,742 | ) | | | — | | | | (522,833 | ) | | | (595,158 | ) | | | (432,434 | ) | | | (545,763 | ) |
Electricity purchased for resale | | | (3,652,145 | ) | | | — | | | | — | | | | — | | | | (3,652,145 | ) | | | (4,357,390 | ) | | | (2,925,858 | ) | | | (2,837,970 | ) |
Transmission system charges | | | (371,754 | ) | | | — | | | | — | | | | — | | | | (371,754 | ) | | | (376,392 | ) | | | (302,418 | ) | | | (321,758 | ) |
System service charges | | | (91,726 | ) | | | — | | | | — | | | | — | | | | (91,726 | ) | | | 582 | | | | (40,831 | ) | | | (25,858 | ) |
Asset retirement costs | | | (8,093 | ) | | | — | | | | — | | | | — | | | | (8,093 | ) | | | (41,008 | ) | | | (38,326 | ) | | | (94,087 | ) |
Provision for inventory losses | | | — | | | | — | | | | — | | | | — | | | | — | | | | 329 | | | | 4,346 | | | | (7,570 | ) |
Depreciation and amortization | | | (359,588 | ) | | | — | | | | (17,914 | ) | | | — | | | | (377,502 | ) | | | (544,974 | ) | | | (388,987 | ) | | | (517,941 | ) |
Financial offsetting or use of water resources | | | — | | | | — | | | | — | | | | — | | | | — | | | | (15,271 | ) | | | (11,135 | ) | | | (11,336 | ) |
Accrual for doubtful accounts | | | — | | | | (124,254 | ) | | | 87 | | | | — | | | | (124,167 | ) | | | (60,262 | ) | | | (52,303 | ) | | | (98,419 | ) |
Construction cost | | | (793,189 | ) | | | — | | | | — | | | | — | | | | (793,189 | ) | | | (763,142 | ) | | | (565,342 | ) | | | (698,047 | ) |
Provision for contingencies | | | — | | | | — | | | | (71,754 | ) | | | — | | | | (71,754 | ) | | | (63,557 | ) | | | (58,997 | ) | | | (75,517 | ) |
Amortization and reversal of incorporation goodwill | | | — | | | | — | | | | — | | | | (17,452 | ) | | | (17,452 | ) | | | (22,622 | ) | | | (16,967 | ) | | | (24,720 | ) |
DIC/FIC indemnification | | | (41,134 | ) | | | — | | | | — | | | | — | | | | (41,134 | ) | | | (46,206 | ) | | | (40,204 | ) | | | (33,875 | ) |
Other operating costs/expenses | | | (33,352 | ) | | | (32 | ) | | | (94,202 | ) | | | (4,345 | ) | | | (131,931 | ) | | | (115,346 | ) | | | (63,438 | ) | | | (95,380 | ) |
| | | | | | | | | | | | | | | | | | | | | | | | | | | | | | | | |
| | | (6,212,645 | ) | | | (134,687 | ) | | | (435,543 | ) | | | (21,797 | ) | | | (6,804,672 | ) | | | (7,686,033 | ) | | | (5,425,732 | ) | | | (6,032,781 | ) |
| | | | | | | | | | | | | | | | | | | | | | | | | | | | | | | | |
G-106
Enel Brasil S.A.
Notes to the consolidated financial statements (Continued)
September 30, 2015 and 2014, December 31, 2014 and 2013 and January 1st, 2013
(In thousands of reais, unless otherwise stated)
| 36. | Financial income (expenses) |
| | | | | | | | | | | | | | | | |
Description | | 09/30/2015 | | | 12/31/2014 | | | 09/30/2014 | | | 12/31/2013 | |
| | | | | | | | | (Unaudited) | | | | |
Financial income | | | | | | | | | | | | | | | | |
Income from financial ,investments | | | 74,985 | | | | 163,339 | | | | 118,191 | | | | 151,565 | |
Penalties and arrears surcharges | | | 100,991 | | | | 96,207 | | | | 70,127 | | | | 89,915 | |
Financial income – indemnification assets | | | 145,580 | | | | — | | | | — | | | | 205,165 | |
Credit updated for PIS and COFINS | | | — | | | | 269 | | | | — | | | | 100,671 | |
Employer’s contribution to INSS | | | — | | | | 12,681 | | | | 12,681 | | | | — | |
Monetary variation Parcel A and other financial items | | | 88,913 | | | | — | | | | — | | | | — | |
Other finance income | | | 53,533 | | | | 63,754 | | | | 49,285 | | | | 64,277 | |
| | | | | | | | | | | | | | | | |
Total financial income | | | 464,002 | | | | 336,250 | | | | 250,284 | | | | 611,593 | |
| | | | | | | | | | | | | | | | |
Financial expenses | | | | | | | | | | | | | | | | |
Monetary variation | | | (3,548 | ) | | | (781 | ) | | | (20,998 | ) | | | (16,043 | ) |
Debt charges | | | (176,000 | ) | | | (116,139 | ) | | | (110,175 | ) | | | (79,656 | ) |
Restatement of taxes and penalties | | | (3,810 | ) | | | (6,032 | ) | | | (4,361 | ) | | | (8,216 | ) |
Monetary restatement on provisions for tax, civil and labor risks | | | (93,908 | ) | | | (101,242 | ) | | | (60,166 | ) | | | (65,065 | ) |
Pension plan charges | | | (39,481 | ) | | | (55,109 | ) | | | (41,331 | ) | | | (50,214 | ) |
Interest expenses on debentures | | | (84,541 | ) | | | (117,542 | ) | | | (55,064 | ) | | | (107,148 | ) |
Monetary variation on debentures | | | (44,174 | ) | | | (57,801 | ) | | | (24,653 | ) | | | (59,380 | ) |
Energy Effectiveness Correction and P&D Program | | | (1,140 | ) | | | (1,747 | ) | | | (2,258 | ) | | | (1,609 | ) |
IOF and IOC | | | (8,228 | ) | | | (14,734 | ) | | | (6,747 | ) | | | (6,076 | ) |
Fines | | | (18,835 | ) | | | (36,024 | ) | | | (21,097 | ) | | | (42,859 | ) |
Indemnification assets expense | | | — | | | | (306,060 | ) | | | (318,798 | ) | | | — | |
Other financial expenses | | | (33,786 | ) | | | (99,127 | ) | | | (74,556 | ) | | | (79,445 | ) |
| | | | | | | | | | | | | | | | |
Total financial expenses | | | (507,451 | ) | | | (912,338 | ) | | | (740,204 | ) | | | (515,711 | ) |
| | | | | | | | | | | | | | | | |
Exchange variation – assets | | | 173,472 | | | | 110,797 | | | | 83,028 | | | | 105,620 | |
Exchange variation – liabilities | | | (111,620 | ) | | | (129,447 | ) | | | (108,588 | ) | | | (123,380 | ) |
| | | | | | | | | | | | | | | | |
Total exchange variation | | | 61,852 | | | | (18,650 | ) | | | (25,560 | ) | | | (17,760 | ) |
| | | | | | | | | | | | | | | | |
Total financial income (expenses) | | | 18,403 | | | | (594,738 | ) | | | (515,480 | ) | | | 78,122 | |
| | | | | | | | | | | | | | | | |
The Company’s subsidiaries main assets in service are covered by an operating risk policy of Enel Group, with amount in risk for material damages totaling R$ 4,767,288 with a limit coverage for loss of profit of R$ 1,226,750 and a general indemnification limit, per loss, of R$ 122,675 for distribution companies, and R$ 1,536,382 for other companies. The Group also takes out civil liability insurance included in Enel Corporate insurance program amounting to R$ 490,700 per loss or annual aggregate. Both programs are valid for the period from November 01, 2014 to October 31, 2015.
At September 30, 2015, Enel Brasil’s subsidiaries had the following insurance coverage:
G-107
Enel Brasil S.A.
Notes to the consolidated financial statements (Continued)
September 30, 2015 and 2014, December 31, 2014 and 2013 and January 1st, 2013
(In thousands of reais, unless otherwise stated)
| 37. | Insurance coverage (Continued) |
Operating risk
| | | | | | | | | | |
Subsidiaries | | Effective date | | Insured amount | | | Maximum
guarantee per loss | |
Ampla Energia | | 11/01/2014 to 10/31/2015 | | | 1,000,768 | | | | 122,675 | |
CDSA | | 11/01/2014 to 10/31/2015 | | | 1,305,442 | | | | 1,536,382 | |
CIEN | | 11/01/2014 to 10/31/2015 | | | 1,106,570 | | | | 1,536,382 | |
CGTF | | 11/01/2014 to 10/31/2015 | | | 679,538 | | | | 1,536,382 | |
COELCE | | 11/01/2014 to 10/31/2015 | | | 674,970 | | | | 122,675 | |
Civil liability
| | | | | | |
Subsidiaries | | Effective date | | Maximum
guarantee per loss | |
Ampla Energia | | 11/01/2014 to 10/31/2015 | | | 490,700 | |
CDSA | | 11/01/2014 to 10/31/2015 | | | 490,700 | |
CIEN | | 11/01/2014 to 10/31/2015 | | | 490,700 | |
CGTF | | 11/01/2014 to 10/31/2015 | | | 490,700 | |
COELCE | | 11/01/2014 to 10/31/2015 | | | 490,700 | |
G-108